Annual Report
September 30, 2022
CrossingBridge Low Duration High Yield Fund
Institutional Class
(CBLDX)
CrossingBridge Responsible Credit Fund
Institutional Class
(CBRDX)
CrossingBridge Ultra-Short Duration Fund
Institutional Class
(CBUDX)
CrossingBridge Pre-Merger SPAC ETF
(SPC)
Investment Adviser
CrossingBridge Advisors, LLC
427 Bedford Road
Suite 220
Pleasantville, New York 10570
Phone: 1-888-898-2780
Table of Contents
COMMENTARY | | | 3 |
| | | | |
MANAGEMENT’S DISCUSSION OF | | | |
FUND PERFORMANCE AND ANALYSIS | | | 9 |
| | | | |
EXPENSE EXAMPLE | | | 20 |
| | | | |
INVESTMENT HIGHLIGHTS | | | 22 |
| | | | |
SCHEDULES OF INVESTMENTS | | | 30 |
| | | | |
STATEMENTS OF ASSETS AND LIABILITIES | | | 60 |
| | | | |
STATEMENTS OF OPERATIONS | | | 62 |
| | | | |
STATEMENTS OF CHANGES IN NET ASSETS | | | 64 |
| | | | |
FINANCIAL HIGHLIGHTS | | | 68 |
| | | | |
NOTES TO FINANCIAL STATEMENTS | | | 73 |
| | | | |
REPORT OF INDEPENDENT REGISTERED | | | |
PUBLIC ACCOUNTING FIRM | | | 96 |
| | | | |
BASIS FOR TRUSTEES’ APPROVAL OF | | | |
INVESTMENT ADVISORY AGREEMENT | | | 98 |
| | | | |
REVIEW OF LIQUIDITY RISK MANAGEMENT PROGRAM | | | 103 |
| | | | |
ADDITIONAL INFORMATION | | | 104 |
Commentary
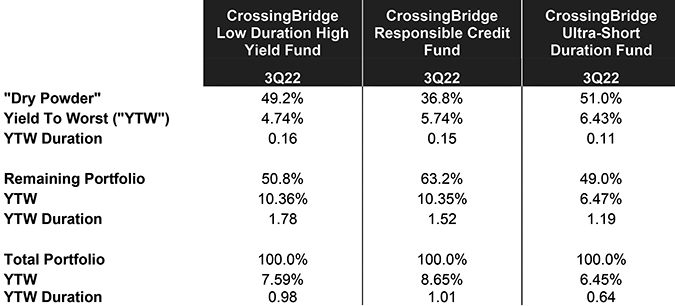
In 2022, stock and bond investors have been pummeled, losing money in both asset classes for three consecutive quarters, a first in at least 45 years.A In previous letters, we have discussed our defensive stance, holding “dry powder”B and remaining disciplined. Yet, as openings occur, we take our shots. We continue to find “money-good”1 bonds and leveraged loans that have attractive yields with potential for additional upside if anticipated events come to pass:
| | ✓long-term debt reclassifying to current liabilities |
| | ✓event-driven corporate actions |
| | | o | Mergers and acquisitions |
| | | o | De-leveraging initiatives |
| | | o | Relief from debt covenant constraints |
| | ✓potential future takeover targets |
Below, we discuss some of the indicators that we are watching closely and describe some of the opportunities we are seeing that should allow us to “punch above our weight.”
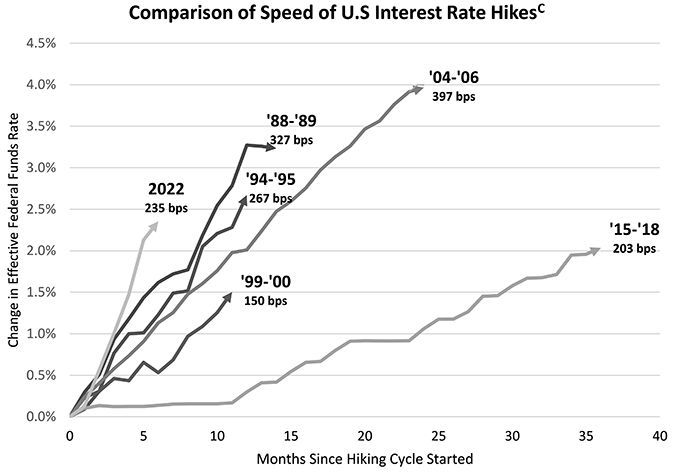
Rapid Rise in Interest Rates
As the Fed grapples with inflation, which is no longer “transitory,” the financial markets have sold off sharply in response to the most rapid interest rate hikes in recent history. In 2022, the Fed Funds rate rose by 235 basis points in six months with indications that this will continue. The financial markets fear, but may not have fully priced in, the possibility that, ultimately, the Fed’s actions or the geopolitical backdrop will cause something to break.2 With the dramatic rise in rates, we believe the economy will slow, corporate profit margins will shrink, working capital costs will increase and debt service will be more expensive. These factors are concerning, but, more importantly, also create opportunities that may be exploited if patience and diligence are exercised.
________________
1 | “Money good” is a term used by CrossingBridge to describe debt it believes will be paid off in full under current market conditions and on a strict priority basis. |
2 | These tensions were discussed in our 1Q22 letter, Locomotive Breath, and our 2Q22 letter, In Flanders Fields. |
High Yield Spreads versus Risk Free Rate
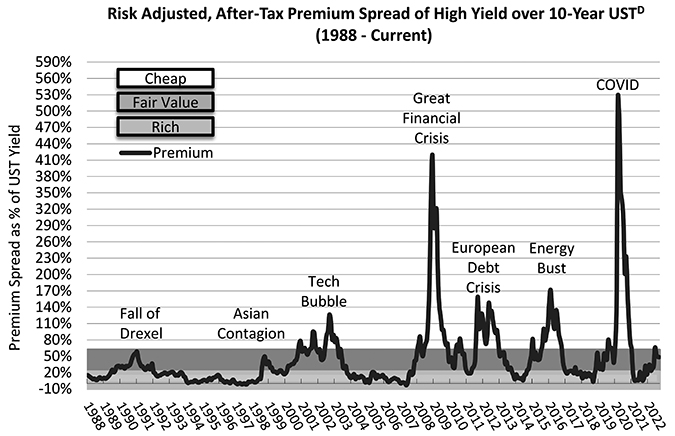
Credit spreads in the high yield market are almost “cheap” as they have widened by approximately 220 basis points to 550 basis pointsE since the end of 2021. This is slightly below the 25-year average of 552 basis points,3 leaving room to go wider if unforeseen economic or political events hit the market with a haymaker.4 However, as noted in our 2Q22 letter, a high yield investor who avoided the value destruction in telecom and utility bonds in 2002, a negative year for high yield overall, would have had a positive return for the year. Similarly, an investor avoiding the deterioration in energy credits in 2015-16 would have experienced far better performance. Looking forward, we are avoiding industries that continue to struggle due to the impact of COVID, such as cruise lines and movie theaters, and those that will be most impacted by rising costs or cyclical risks to demand, including building materials, chemicals and auto parts. The sharp rise in interest rates and the widely expected resultant recession may also be the “zombie killer”5 that finally forces a wave of restructurings among companies reliant on accommodative capital markets to provide cash infusions to cover interest expense. That said, as a result of the dislocation that has already occurred, there are a lot of quality companies with “money good” debt yielding 7.5-11.5% with maturities in the 1-3-year sweet spot.
________________
3 | The graph above uses the high yield spread calculated by subtracting the 10-year U.S. Treasury rate from the yield-to-worst of the ICE BofA U.S. High Yield Index. This differs from the index spread to worst, however, which is the index yield-to-worst less the corresponding U.S. Treasury rate which varies daily. Actual credit spread data for periods prior to the end of 1996 is limited. |
4 | In reference to the title of our 3Q22 letter, a haymaker is a punch thrown with full force and commitment that can be a knockout blow if landed. |
5 | See our 2Q19 investor letter, Rise of the Living Dead, for a discussion of “zombie companies”. |
Wall-of-Worry Not So Worrisome
The rise in rates should have a more muted impact on the high yield market than in previous rate-hike cycles as many borrowers took advantage of the low rates that prevailed in 2020 and 2021 to reduce their borrowing cost and extend maturities. As shown above, in 3Q20, a large portion of the corporate credit market was likely to be faced with the need to refinance debt obligations in the 2024-25 period (i.e. orange bars in T+4 and T+5). With the new-issuance market very active despite the pandemic, debt coming due in that period has now been reduced significantly (i.e. blue bars in T+2 and T+3) while the bulge in upcoming maturities has been pushed out to 2028 (i.e. blue bar in T+6). Thus, a large portion of high yield issuers completed financings giving them low locked-in borrowing costs for several years. Similarly, many homeowners have benefitted from low interest rate mortgages. Hence the long-awaited distress cycle may be put off a little longer.
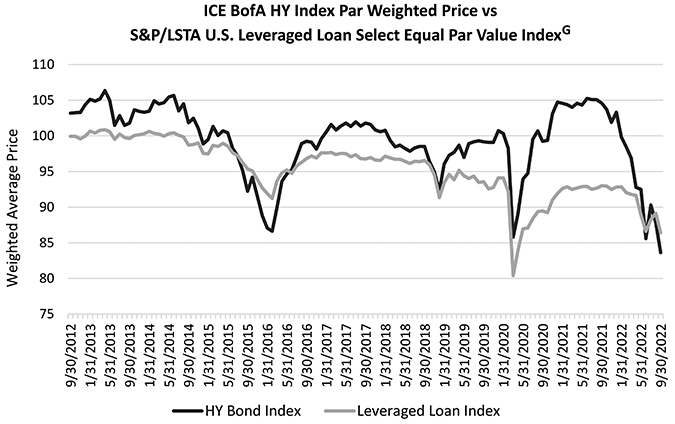
Bonds and Loans Trading at a Discount
When interest rates go up, bond prices go down. Consequently, corporate debt is now trading at a discount. The current year has been unusual in that the average bond in the ICE BofA U.S. High Yield Index has experienced a price decline of nearly 20 points since the end of 2021 as interest rates have moved up and credit spreads have widened. Such a sharp decline would not be unusual for distressed bonds but, in the absence of a sharp deterioration in credit quality, it is highly unusual. These discounts create the opportunity for an investor to achieve a return in excess of today’s yield to maturity should a corporate event cause a credit quality upgrade or repayment prior to maturity. Loans are also trading at a discount, but because their interest rates are floating, they have not experienced as much price deterioration as fixed rate bonds. Still, loans trading at a discount may also provide us with opportunities resulting from corporate events.
Where we are taking our shots
While we remain defensive, we are finding opportunities to throw a few “jabs” and “uppercuts” when we see openings. These investments fall into four categories, but in general are premised on events we expect to take place within a relatively short time frame.
Called Bonds and SPACs – Bonds that have been called and are expected to be repaid via refinancing or cash on hand at the end of the call period, typically 30-90 days out. Refinancing among high yield bonds has diminished as the cost of new financing has increased dramatically. However there continues to be a steady flow of investment grade calls and tenders as the “treasury make-whole” call protection,6 which historically resulted in prohibitively expensive call premiums for these bonds, has now fallen to zero. Thus, the market yield to exit for investment grade bonds has gravitated to about 4.00-5.00% for calls expected to be completed in 2-6 weeks. Meanwhile, the market for the few high yield bonds that are being called has risen to about 4.50-5.50%. This compares to the 2.00% yield to exit that was typical for called high yield bonds as recently as the end of 2021. Similarly, the effective yield on SPACs with liquidation dates up to 9 months has risen to 5.50-6.00%.
Long-term Debt Reclassifying to Current Liabilities – Bonds and loans with maturities 1-2 years out. Once the maturity of these obligations falls within one year, they must be shown on the issuer’s balance sheet as current liabilities, and their auditors must opine on their ability to pay them when they are due. Typically, borrowers prefer to repay or refinance their debt when there is at least one year to maturity to avoid this issue.
Event-Driven and Corporate Actions – Bonds and loans that are expected to be repaid as a result of mergers and acquisitions, efforts to de-leverage and/or the desire to remove constraining debt covenants.
Potential Takeover Targets – Bonds and loans issued by companies with relatively low leverage and high cash flow that, with the dramatic decline in equity valuations, may make them ripe to be acquired. In such an event, there is an increased likelihood of early repayment or improvement in credit quality.
________________
6 | The call premium based on “treasury make-whole” call protection is calculated by discounting all of the scheduled principal and interest payments of the bond by the Treasury rate (plus, typically, 50 or 75 basis points) that corresponds to the bond’s maturity. This premium may not be less than 0 so, if rates rise such that the premium would be negative, the call price is par. |
Picking our spots, rolling with the punches, and patiently awaiting the time to come out swinging,
David K. Sherman and the CrossingBridge Team
Endnotes
________________
A | All Star Charts, allstarcharts.com |
B | “Dry powder”, in the context of our mutual fund portfolios, is defined as cash and investments that are expected to be repaid within 90 days as a result of call, redemption or maturity as well as pre-merger special purpose acquisition corporations (SPACs). The table below reflects dry powder for each CrossingBridge mutual fund as of the end of 3Q22. |
C | FRED Economic Data, Federal Reserve Bank of St. Louis https://fred.stlouisfed.org/ |
D | ICE BofA U.S. High Yield Index, ICE BofA 10-Year U.S. Treasury Index. Calculated based on the high yield credit spread, less taxes at a rate of 34%, less 200 basis points of assumed credit losses, divided by the 10-year U.S. Treasury rate. |
E | ICE BofA U.S. High Yield Index |
F | Bank of America Global Research |
G | ICE BofA U.S. High Yield Index, S&P/LSTA U.S. Leveraged Loan Select Equal Par Value Index |
Definitions: Basis Point is one hundredth of 1 percentage point. ICE BofA U.S. High Yield Index tracks the performance of U.S. dollar denominated below investment grade rated corporate debt publicly issued in the U.S. domestic market. S&P/LSTA U.S. Leveraged Loan Select Equal Par Value Index is a daily tradable index for the U.S. market that seeks to mirror the market-weighted performance of the largest institutional leveraged loans, as determined by criteria. Yield to Worst is the yield on the portfolio if all bonds are held to the worst date; yield to worst date is the date of lowest possible yield outcome for each security without a default. Yield to Worst Duration is the weighted average duration calculated to the yield to worst date.
Opinions expressed are subject to change at any time, are not guaranteed and should not be considered investment advice.
Past performance does not guarantee future results. Diversification does not assure a profit nor protect against risk in a declining market.
Fund holdings and sector allocation are subject to change at any time and should not be considered a recommendation to buy or sell any security. Please see the Schedule of Investments for complete Fund holdings.
It is not possible to invest directly in an index.
Mutual fund investing involves risk. Principal loss is possible. Investments in debt securities typically decrease in value when interest rates rise. This risk is usually greater for longer-term debt securities. Investment in lower-rated and non-rated securities presents a greater risk of loss to principal and interest than higher-rated securities.
Must be preceded or accompanied by a prospectus.
Distributor: Quasar Distributors, LLC.
Management’s Discussion of Fund Performance and Analysis
CrossingBridge Low Duration High Yield Fund
(Unaudited)
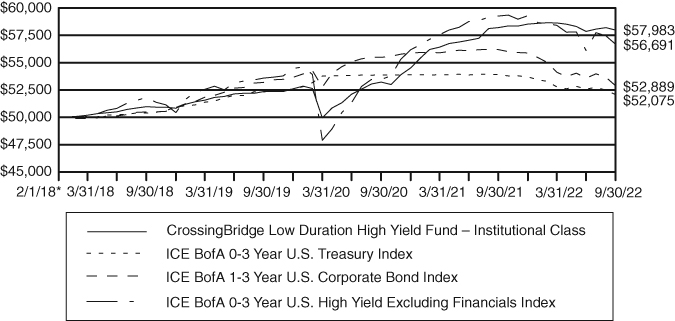
The 2022 fiscal year for the CrossingBridge Low Duration High Yield Fund (CBLDX; the “Fund”) covers the twelve-month period of October 1, 2021 through September 30, 2022. During this period, the Fund lost 0.39% on its Institutional Class shares while the ICE BofA 0-3 Year U.S. High Yield Excluding Financials Index lost 4.35%, the ICE BofA 1-3 Year U.S. Corporate Bond Index lost 5.89% and the ICE BofA 0-3 Year U.S. Treasury Index lost 3.39%.
Monthly investment results for the fiscal year ranged from -0.78% in June 2022 to 0.37% in July 2022. The Fund generated positive returns for six out of the twelve months during the fiscal year. The median monthly return for the period was 0.04% with an annualized standard deviation of 3.18%.
The Fund had positive contributions from interest income and had realized gains and unrealized losses during the period. 100% of the income was distributed for a 1-year dividend yield of 3.20%. The Fund’s subsidized 30 day SEC yield was 5.50% and unsubsidized 30 day SEC yield was 5.50%. The total return for the period was negative. Although the Fund’s NAV decreased from $10.36 on September 30, 2021 to $9.84 on September 30, 2022, this was offset by the Fund distributing $0.49 in income during the fiscal period.
In the first half of 2022, U.S. equities and fixed income portfolios suffered some of their largest losses in history1 as investors dealt with the effects of inflation and rising rates. During the fiscal year, the Fund was well-prepared for this market as we maintained our defensive positioning with a portfolio duration on the low-end of its targeted range, continued holding significant dry powder2, and remained disciplined. The Fund also typically has natural cash roll-off of 15-30% of the portfolio every month, which in a rising rate environment, provides the Fund with the opportunity to reinvest that cash at higher rates. As market conditions have continued to deteriorate and rates have continued to rise, we are starting to see the market become more bifurcated, creating what we believe to be very attractive opportunities that may be suitable for the Fund.
As of September 30, 2022, the Fund’s net assets were weighted by category as follows: 29.6% in Short Term Securities, 10.9% in Event Driven, 11.5% in Interest Rate Sensitive, 41.0% in Core Value, 1.2% in Credit Opportunities, with the remaining 5.8% in cash and cash equivalents.
Opinions expressed are subject to change at any time, are not guaranteed and should not be considered investment advice.
Past performance does not guarantee future results.
Diversification does not assure a profit nor protect against risk in a declining market.
________________
1 | In the first half of 2022, the S&P 500 Index declined -20.6%, its worst first half performance since 1970. Investment grade bonds, represented by the ICE BofA U.S. Corporate Bond Index, declined -13.93% in the first half of the year, their worst first half ever and the worst six-month period since 1Q80 (-16.35%). The ICE BofA U.S. High Yield Index, which declined -14.04% in the first half, had its worst first half ever and worst six-month period since 4Q08 (-25.43%) (Source: Bloomberg). |
2 | “Dry powder”, in the context of our portfolios, is defined as cash and investments that are expected to be repaid within 90 days as a result of call, redemption or maturity as well as pre-merger special purpose acquisition corporations (SPACs). |
Fund holdings and sector allocation are subject to change at any time and should not be considered a recommendation to buy or sell any security. Please see the Schedule of Investments for complete Fund holdings.
*Definitions: The ICE BofA 0-3 Year U.S. High Yield Excluding Financials Index (HSNF) tracks the performance of short maturity U.S. dollar-denominated below investment grade rating (based on an average of Moody’s, S&P, and Fitch), at least 18 months to final maturity at the time of issuance, at least one month but less than three years remaining term to final maturity as of the rebalancing date, a fixed coupon schedule and minimum amount outstanding of $250 million. The ICE BofA 1-3 Year U.S. Corporate Bond Index (C1A0) is a subset of the ICE BofA U.S. Corporate Bond Index including all securities with a remaining term to final maturity less than three years. The ICE BofA 0-3 Year U.S. Treasury Index (G1QA) tracks the performance of U.S. dollar-denominated sovereign debt publicly issued by the U.S. government in its domestic market with maturities less than three years. The S&P 500, or simply the S&P, is a stock market index that measures the stock performance of 500 large companies listed on stock exchanges in the United States. The ICE BofA U.S. Corporate Bond Index tracks the performance of U.S. dollar-denominated investment grade rated corporate debt publicly issues in the U.S. domestic market. The ICE BofA U.S. High Yield Index tracks the performance of U.S. dollar-denominated below investment grade corporate debt publicly issued in the U.S. domestic market.Standard Deviation is a statistical measure that is used to quantify the amount of variation or dispersion of a set of data values. Duration is the weighted average of the present value of the cash flows and is used as a measure of a bond price’s response to changes in yield. Rising interest rates mean falling bond prices, while declining interest rates mean rising bond prices. Dividend Yield expresses a percentage of a current share price. SEC yield is a standard yield calculation developed by the U.S. Securities and Exchange Commission (SEC) that allows for fairer comparisons of bond funds. It is based on the most recent 30-day period covered by the fund’s filings with the SEC. The yield figure reflects the dividends and interest earned during the period after the deduction of the fund’s expenses. It is also referred to as the “standardized yield”. Basis Point is one hundredth of one percent.
It is not possible to invest directly in an index.
Mutual fund investing involves risk. Principal loss is possible. Investments in foreign securities involve greater volatility and political, economic and currency risks and differences in accounting methods. Investments in debt securities typically decrease in value when interest rates rise. This risk is usually greater for longer-term debt securities. Investment in lower-rated and non-rated securities presents a greater risk of loss to principal and interest than higher-rated securities. The Fund may make short sales of securities, which involves the risk that losses may exceed the original amount invested. The Fund may invest in exchange-traded funds (“ETFs”) and exchange-traded notes (“ETNs”), which are subject to additional risks that do not apply to conventional mutual funds, including the risks that the market price of an ETF’s and ETN’s shares may trade at a discount to its net asset value (“NAV”), an active secondary trading market may not develop or be maintained, or trading may be halted by the exchange in which they trade, which may impact the Fund’s ability to sell the shares. The value of ETNs may be influenced by the level of supply and demand for the ETN, volatility and lack of liquidity. The Fund may invest in derivative securities, which derive their performance from the performance of an underlying asset, index, interest rate or currency exchange rate. Derivatives can be volatile and involve various types and degrees of risks, and, depending upon the characteristics of a particular derivative, suddenly can become illiquid. Investments in asset-backed, mortgage-backed, and collateralized mortgage-backed securities include additional risks that investors should be aware of such as credit risk, prepayment risk, possible illiquidity and default, as well as increased susceptibility to adverse economic developments. The Fund invests in equity securities and warrants of special purpose acquisition companies (“SPACs”) . Pre-combination SPACs have no operating history or ongoing business other than seeking a merger, share exchange, asset acquisition, share purchase negotiation or similar business combination (a “Combination”), and the value of their securities is particularly dependent on the ability of the entity’s management to identify and complete a profitable Combination. There is no guarantee that the SPACs in which the
Fund invests will complete a Combination or that any Combination that is completed will be profitable. Unless and until a Combination is completed, a SPAC generally invests its assets in U.S. government securities, money market securities, and cash. Public stockholders of SPACs may not be afforded a meaningful opportunity to vote on a proposed initial Combination because certain stockholders, including stockholders affiliated with the management of the SPAC, may have sufficient voting power, and a financial incentive, to approve such a transaction without support from public stockholders. As a result, a SPAC may complete a Combination even though a majority of its public stockholders do not support such a Combination. Some SPACs may pursue Combinations only within certain industries or regions, which may increase the volatility of their prices. The Fund may invest in SPACs domiciled or listed outside of the U.S., including, but not limited to, Canada, the Cayman Islands, Bermuda and the Virgin Islands. Investments in SPACs domiciled or listed outside of the U.S. may involve risks not generally associated with investments in the securities of U.S. SPACs, such as risks relating to political, social, and economic developments abroad and differences between U.S. and foreign regulatory requirements and market practices. Further, tax treatment may differ from U.S. SPACs and securities may be subject of foreign withholding taxes. Smaller capitalization SPACs will have a more limited pool of companies with which they can pursue a business combination relative to larger capitalization companies. That may make it more difficult for a small capitalization SPAC to consummate a business combination.
Must be preceded or accompanied by a prospectus.
Distributor: Quasar Distributors, LLC.
Management’s Discussion of Fund Performance and Analysis
CrossingBridge Responsible Credit Fund
(Unaudited)
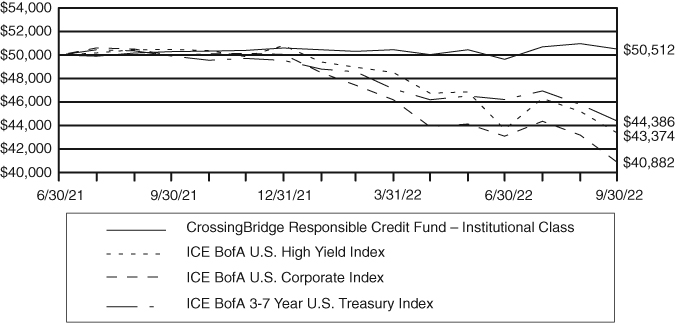
The 2022 fiscal year for the CrossingBridge Responsible Credit Fund (CBRDX; the “Fund”) covers the twelve-month period of October 1, 2021 through September 30, 2022. During this period, the Fund gained 0.45% on its Institutional Class shares while the ICE BofA U.S. High Yield Index lost 14.06%, the ICE BofA U.S. Corporate Index lost 18.19% and the ICE BofA 3-7 Year U.S. Treasury Index lost 11.08%.
Monthly investment results for the fiscal year ranged from -1.62% in June 2022 to 2.14% in July 2022. The Fund generated positive returns for seven out of the twelve months during the fiscal period. The median monthly return for the period was 0.11% with an annualized standard deviation of 2.98%.
The Fund had positive contributions from interest income and had realized capital gains and unrealized losses during the period. 100% of the income was distributed for a 1-year dividend yield of 3.87%. The Fund’s subsidized 30-day SEC yield was 6.35% and unsubsidized 30-day SEC yield was 5.64%. The total return for the period was positive. Although the Fund’s NAV decreased from $10.01 on September 30, 2021 to $9.65 on September 30, 2022, that decrease was more than offset as the Fund distributed $0.41 in income during the fiscal year.
In the first half of 2022, U.S. equities and fixed income portfolios suffered some of their largest losses in history1 as investors dealt with the effects of inflation and rising rates. During the fiscal year, the Fund was well-prepared for this market as we maintained our defensive positioning with a portfolio duration well below its targeted range, continued holding significant dry powder2, and remained disciplined. The Fund was designed to be CrossingBridge’s most flexible and opportunistic Fund, of which it maintains a non-diversified status, allowing the Fund to have higher concentration than diversified funds. As market conditions have continued to deteriorate and rates have continued to rise, we are starting to see the market become more bifurcated, creating what we believe to be very attractive opportunities that may be suitable for the Fund.
As of September 30, 2022, the Fund’s net assets were weighted by category as follows: 14.4% in Short Term Securities, 11.5% in Event Driven, 24.1% in Interest Rate Sensitive, 30.7% in Core Value, 17.8% in Credit Opportunities, with the remaining 1.5% in cash and cash equivalents.
Opinions expressed are subject to change at any time, are not guaranteed and should not be considered investment advice.
Past performance does not guarantee future results.
________________
1 | In the first half of 2022, the S&P 500 Index declined -20.6%, its worst first half performance since 1970. Investment grade bonds, represented by the ICE BofA U.S. Corporate Bond Index, declined -13.93% in the first half of the year, their worst first half ever and the worst six-month period since 1Q80 (-16.35%). The ICE BofA U.S. High Yield Index, which declined -14.04% in the first half, had its worst first half ever and worst six-month period since 4Q08 (-25.43%) (Source: Bloomberg). |
2 | “Dry powder”, in the context of our portfolios, is defined as cash and investments that are expected to be repaid within 90 days as a result of call, redemption or maturity as well as pre-merger special purpose acquisition corporations (SPACs). |
The Fund is non-diversified under the Investment Company Act of 1940, therefore allowing the Fund to be more concentrated than a diversified fund. Because the Fund is non-diversified it may invest a greater percentage of its assets in the securities of a single issuer or a smaller number of issuers than if it were a diversified fund. As a result, a decline in the value of an investment in a single issuer could cause the Fund’s overall value to decline to a greater degree than if the Fund held a more diversified portfolio. Current fund statistics may not be indicative of future positioning.
Fund holdings and sector allocation are subject to change at any time and should not be considered a recommendation to buy or sell any security. Please see the Schedule of Investments for complete Fund holdings.
Definitions: The ICE BofA U.S. High Yield Index (H0A0) tracks the performance of U.S. dollar-denominated below investment grade corporate debt publicly issued in the U.S. domestic market. The ICE BofA U.S. Corporate Index (C0A0) tracks the performance of U.S. dollar-denominated investment grade corporate debt publicly issued in the U.S. domestic market. The ICE BofA 3-7 Year U.S. Treasury Index (G30C) is a subset of ICE BofA U.S. Treasury Index including all securities with a remaining term to final maturity greater than or equal to 3 years and less than 7 years. The S&P 500, or simply the S&P, is a stock market index that measures the stock performance of 500 large companies listed on stock exchanges in the United States. The ICE BofA U.S. Corporate Bond Index tracks the performance of U.S. dollar-denominated investment grade rated corporate debt publicly issues in the U.S. domestic market. The ICE BofA U.S. High Yield Index tracks the performance of U.S. dollar-denominated below investment grade corporate debt publicly issued in the U.S. domestic market. Basis Point is one hundredth of one percent.
It is not possible to invest directly in an index.
Mutual fund investing involves risk. Principal loss is possible. Investments in foreign securities involve greater volatility and political, economic and currency risks and differences in accounting methods. Investments in debt securities typically decrease in value when interest rates rise. This risk is usually greater for longer-term debt securities. Investment in lower-rated and non-rated securities presents a greater risk of loss to principal and interest than higher-rated securities. The Fund may make short sales of securities, which involves the risk that losses may exceed the original amount invested. The Fund’s focus on sustainability considerations (ESG criteria) may limit the number of investment opportunities available to the Fund, and as a result, at times, the Fund may underperform funds that are not subject to similar investment considerations. The Fund invests in equity securities of special purpose acquisition companies (“SPACs”), which raise assets to seek potential business combination opportunities. Unless and until a business combination is completed, a SPAC generally invests its assets in U.S. government securities, money market securities, and cash. Because SPACs have no operating history or ongoing business other than seeking a business combination, the value of their securities is particularly dependent on the ability of the entity’s management to identify and complete a profitable business combination. There is no guarantee that the SPACs in which the Fund invests will complete a business combination or that any business combination that is completed will be profitable. The Fund is non-diversified meaning it may concentrate its assets in fewer individual holdings than a diversified fund. The Fund invests in equity securities and warrants of SPACs. Pre-combination SPACs have no operating history or ongoing business other than seeking a merger, share exchange, asset acquisition, share purchase negotiation or similar business combination (a “Combination”), and the value of their securities is particularly dependent on the ability of the entity’s management to identify and complete a profitable Combination. There is no guarantee that the SPACs in which the Fund invests will complete a Combination or that any Combination that is completed will be profitable. Unless and until a Combination is completed, a SPAC generally invests its assets in U.S. government securities, money market securities, and cash. Public stockholders of SPACs may not be afforded a meaningful opportunity to vote on a proposed initial Combination because certain stockholders, including stockholders affiliated with the management of the SPAC, may have sufficient voting power, and a financial incentive, to approve such a transaction without support from public stockholders. As a result, a SPAC
may complete a Combination even though a majority of its public stockholders do not support such a Combination. Some SPACs may pursue Combinations only within certain industries or regions, which may increase the volatility of their prices. The Fund may invest in SPACs domiciled or listed outside of the U.S., including, but not limited to, Canada, the Cayman Islands, Bermuda and the Virgin Islands. Investments in SPACs domiciled or listed outside of the U.S. may involve risks not generally associated with investments in the securities of U.S. SPACs, such as risks relating to political, social, and economic developments abroad and differences between U.S. and foreign regulatory requirements and market practices. Further, tax treatment may differ from U.S. SPACs and securities may be subject of foreign withholding taxes. Smaller capitalization SPACs will have a more limited pool of companies with which they can pursue a business combination relative to larger capitalization companies. That may make it more difficult for a small capitalization SPAC to consummate a business combination.
Must be preceded or accompanied by a prospectus.
Distributor: Quasar Distributors, LLC.
Management’s Discussion of Fund Performance and Analysis
CrossingBridge Ultra-Short Duration Fund
(Unaudited)
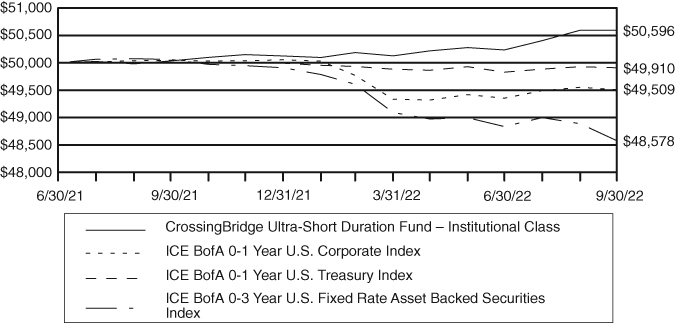
The 2022 fiscal year for the CrossingBridge Ultra-Short Duration Fund (CBUDX; the “Fund”) covers the twelve-month period of October 1, 2021 through September 30, 2022. During this period, the Fund gained 1.12% on its Institutional Class shares while the ICE BofA 0-1 Year U.S. Corporate Index lost 1.07%, the ICE BofA 0-1 Year U.S. Treasury Index lost 0.20% and the ICE BofA 0-3 Year U.S. Fixed Rate Asset Backed Securities Index lost 2.96%.
Monthly investment results for the fiscal year ranged from -0.12% in March 2022 to 0.38% in August 2022. The Fund generated positive returns for eight out of the twelve months during the fiscal year. The median monthly return for the period was 0.11% with an annualized standard deviation of 0.52%
The Fund had positive contributions from interest income and had realized gains and unrealized losses during the period. 100% of the income was distributed for a 1-year dividend yield of 1.43%. The Fund’s subsidized 30-day SEC yield was 4.00% and unsubsidized 30-day SEC yield was 3.77%. Although the Fund’s NAV decreased from $10.01 on September 30, 2021 to $9.97 on September 30, 2022, this was more than offset by the distribution of $0.15 of income during the period.
In the first half of 2022, U.S. equities and fixed income portfolios suffered some of their largest losses in history1 as investors dealt with the effects of inflation and rising rates. During the fiscal year, the Fund was well-prepared for this market as we maintained our defensive positioning with an ultra-short duration, continued holding significant dry powder2, and remained disciplined. Especially within an ultra-short duration portfolio, CrossingBridge stresses preservation of capital rather than chasing yield. Per the Fund’s prospectus, CrossingBridge manages interest rate risk by maintaining an average portfolio duration of 1 or less by investing in short-term, medium-term, and floating rate securities. As a result, the Fund was well insulated from the steep rise in rates. In addition, although the Fund has no restrictions as to credit quality, the intention is that the Fund will maintain a minimum of at least 65% of the portfolio in investment grade securities, further insulating the Fund in the difficult fixed income environment. As of September 30, 2022, the Fund had 70.85% of the portfolio in investment grade securities. As market conditions have continued to deteriorate and rates have continued to rise, we are starting to see the market become more bifurcated, creating what we believe to be very attractive opportunities that may be suitable for the Fund.
As of September 30, 2022, the Fund’s net assets were weighted by category as follows: 47.5% in Short Term Securities, 9.5% in Event Driven, 6.6% in Interest Rate Sensitive, 35.0% in Core Value, 0.0% in Credit Opportunities, with the remaining 1.4% in cash and cash equivalents.
________________
1 | In the first half of 2022, the S&P 500 Index declined -20.6%, its worst first half performance since 1970. Investment grade bonds, represented by the ICE BofA U.S. Corporate Bond Index, declined -13.93% in the first half of the year, their worst first half ever and the worst six-month period since 1Q80 (-16.35%). The ICE BofA U.S. High Yield Index, which declined -14.04% in the first half, had its worst first half ever and worst six-month period since 4Q08 (-25.43%) (Source: Bloomberg). |
2 | “Dry powder”, in the context of our portfolios, is defined as cash and investments that are expected to be repaid within 90 days as a result of call, redemption or maturity as well as pre-merger special purpose acquisition corporations (SPACs). |
Opinions expressed are subject to change at any time, are not guaranteed and should not be considered investment advice.
Past performance does not guarantee future results.
Diversification does not assure a profit nor protect against risk in a declining market.
Fund holdings and sector allocation are subject to change at any time and should not be considered a recommendation to buy or sell any security. Please see the Schedule of Investments for complete Fund holdings.
*Definitions: The ICE BofA 0-1 Year U.S. Corporate Index (H540) tracks the performance of short-maturity U.S. dollar-denominated investment grade corporate debt publicly issued in the U.S. domestic market. The ICE BofA 0-1 Year U.S. Treasury Index (G0QA) tracks the performance of U.S. dollar-denominated sovereign debt publicly issued by the U.S. government in its domestic market with maturities less than a year. The ICE BofA 0-3 Year U.S. Fixed Rate Asset Backed Securities Index (R1A0) is a subset of ICE BofA U.S. Fixed Rate Asset Backed Securities Index including all securities with an average life less than 3 years. The S&P 500, or simply the S&P, is a stock market index that measures the stock performance of 500 large companies listed on stock exchanges in the United States. The ICE BofA U.S. Corporate Bond Index tracks the performance of U.S. dollar-denominated investment grade rated corporate debt publicly issues in the U.S. domestic market. The ICE BofA U.S. High Yield Index tracks the performance of U.S. dollar-denominated below investment grade corporate debt publicly issued in the U.S. domestic market. Duration is the weighted average of the present value of the cash flows and is used as a measure of a bond price’s response to changes in yield. Rising interest rates mean falling bond prices, while declining interest rates mean rising bond prices. Standard Deviation is a statistical measure of portfolio risk used to measure variability of total return around an average, over a specified period of time. The greater the standard deviation over the period, the wider the variability or range of returns and hence, the greater the fund’s volatility. The standard deviation has been calculated since inception and is annualized.
It is not possible to invest directly in an index.
Mutual fund investing involves risk. Principal loss is possible. Investments in foreign securities involve greater volatility and political, economic and currency risks and differences in accounting methods. Investments in debt securities typically decrease in value when interest rates rise. This risk is usually greater for longer-term debt securities. Investment in lower-rated and non-rated securities presents a greater risk of loss to principal and interest than higher-rated securities. The fund may make short sales of securities, which involves the risk that losses may exceed the original amount invested. The Fund invests in equity securities and warrants of special purpose acquisition companies (“SPACs”). Pre-combination SPACs have no operating history or ongoing business other than seeking a merger, share exchange, asset acquisition, share purchase negotiation or similar business combination (a “Combination”), and the value of their securities is particularly dependent on the ability of the entity’s management to identify and complete a profitable Combination. There is no guarantee that the SPACs in which the Fund invests will complete a Combination or that any Combination that is completed will be profitable. Unless and until a Combination is completed, a SPAC generally invests its assets in U.S. government securities, money market securities, and cash. Public stockholders of SPACs may not be afforded a meaningful opportunity to vote on a proposed initial Combination because certain stockholders, including stockholders affiliated with the management of the SPAC, may have sufficient voting power, and a financial incentive, to approve such a transaction without support from public stockholders. As a result, a SPAC may complete a Combination even though a majority of its public stockholders do not support such a Combination. Some SPACs may pursue Combinations only within certain industries or regions, which may increase the volatility of their prices. The Fund may invest in SPACs domiciled or listed outside of the U.S., including, but not limited to, Canada, the Cayman Islands, Bermuda and the Virgin Islands. Investments in SPACs domiciled or listed outside of the U.S. may involve risks not generally associated with investments in the securities of U.S. SPACs, such as risks relating to political, social, and economic
developments abroad and differences between U.S. and foreign regulatory requirements and market practices. Further, tax treatment may differ from U.S. SPACs and securities may be subject of foreign withholding taxes. Smaller capitalization SPACs will have a more limited pool of companies with which they can pursue a business combination relative to larger capitalization companies. That may make it more difficult for a small capitalization SPAC to consummate a business combination.
Must be preceded or accompanied by a prospectus.
Distributor: Quasar Distributors, LLC.
Management’s Discussion of Fund Performance and Analysis
CrossingBridge Pre-Merger SPAC ETF
(Unaudited)
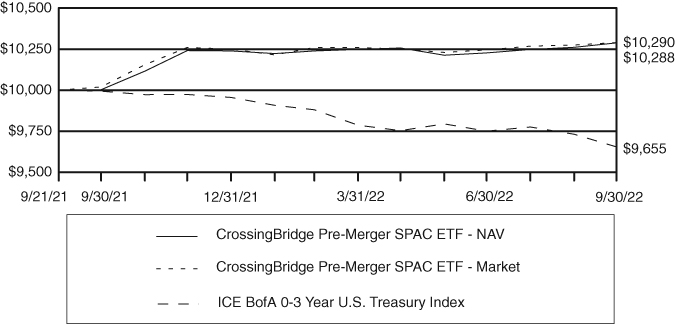
The 2022 fiscal year for the CrossingBridge Pre-Merger SPAC ETF (SPC; the “Fund”) covers the twelve-month period of October 1, 2021 through September 30, 2022. During this period, the Fund had a NAV return of 2.85% and a market return of 2.70%. The Fund’s market return of 2.70% compared favorably to the ICE BofA 0-3 Year U.S. Treasury Index’s loss of 3.39%. The Fund had realized and unrealized gains during the period. The total return for the period was higher as the share price increased from $20.04 on September 30, 2021 to $20.56 on September 30, 2022, while the NAV increased from $20.01 to $20.56 for the period.
Given that pre-merger Special Purpose Acquisition Companies (SPACs) behave like fixed income securities due to their IPO proceeds being placed in a trust account typically invested in ultra-short term U.S. government securities for the benefit of SPAC shareholders, as rates went up for Treasuries, so did the yields for pre-merger SPACs. On September 30, 2021, the weighted average yield of SPACs still seeking an acquisition target was 1.71%, and on September 30, 2022, that yield increased to 5.80% with a weighted average maturity of just less than 6 months. The current environment in the secondary market for pre-merger SPACs remains robust – as of September 30, 2022, there were 666 pre-merger SPACs totaling $161 billion in total trust value in the U.S.-listed SPAC market. Although the market will experience a large majority of liquidations within the first half of 2023, we believe the current opportunity for the Fund remains attractive.
Opinions expressed are subject to change at any time, are not guaranteed and should not be considered investment advice.
Past performance does not guarantee future results.
Diversification does not assure a profit nor protect against risk in a declining market.
Fund holdings and sector allocation are subject to change at any time and should not be considered a recommendation to buy or sell any security. Please see the Schedule of Investments for complete Fund holdings.
*Definitions: The ICE BofA 0-3 Year U.S. Treasury Index tracks the performance of U.S. dollar-denominated sovereign debt publicly issued by the U.S. government in its domestic market with maturities less than three years. Weighted Average Yield: similar to a bond’s Yield to Maturity, SPACs have a Yield to Liquidation/Redemption, which can be calculated using the Gross Spread and Time to Liquidation. Weighted Average Maturity: Similar to a bond’s maturity date, SPACs also have a maturity, which is the defined time period in which they have to complete a business combination. This is referred to as the Liquidation or Redemption Date.
It is not possible to invest directly in an index.
Investing involves risk; Principal loss is possible. The Fund invests in equity securities and warrants of SPACs. Pre-combination SPACs have no operating history or ongoing business other than seeking a merger, share exchange, asset acquisition, share purchase negotiation or similar business combination (a “Combination”), and the value of their securities is particularly dependent on the ability of the entity’s management to identify and complete a profitable Combination. There is no guarantee that the SPACs in which the Fund invests will complete a Combination or that any Combination that is completed will be profitable. Unless and until a Combination is completed, a SPAC generally invests its assets in U.S. government securities, money market securities, and cash. Public stockholders of SPACs may not be afforded a meaningful opportunity to vote on a proposed initial Combination because certain
stockholders, including stockholders affiliated with the management of the SPAC, may have sufficient voting power, and a financial incentive, to approve such a transaction without support from public stockholders. As a result, a SPAC may complete a Combination even though a majority of its public stockholders do not support such a Combination. Some SPACs may pursue Combinations only within certain industries or regions, which may increase the volatility of their prices. The Fund may invest in SPACs domiciled or listed outside of the U.S., including, but not limited to, Canada, the Cayman Islands, Bermuda and the Virgin Islands. Investments in SPACs domiciled or listed outside of the U.S. may involve risks not generally associated with investments in the securities of U.S. SPACs, such as risks relating to political, social, and economic developments abroad and differences between U.S. and foreign regulatory requirements and market practices. Further, tax treatment may differ from U.S. SPACs and securities may be subject of foreign withholding taxes. Smaller capitalization SPACs will have a more limited pool of companies with which they can pursue a business combination relative to larger capitalization companies. That may make it more difficult for a small capitalization SPAC to consummate a business combination. Because the Fund is non-diversified it may invest a greater percentage of its assets in the securities of a single issuer or a smaller number of issuers than if it were a diversified fund. As a result, a decline in the value of an investment in a single issuer could cause the Fund’s overall value to decline to a greater degree than if the Fund held a more diversified portfolio.
Must be preceded or accompanied by a prospectus.
Distributor: Foreside Fund Services, LLC.
CROSSINGBRIDGE FUNDS
Expense Example
(Unaudited)
As a shareholder of the CrossingBridge Low Duration High Yield Fund, CrossingBridge Responsible Credit Fund and CrossingBridge Ultra-Short Duration Fund, you incur two types of costs: (1) transaction costs and (2) ongoing costs, including management fees, shareholder servicing plan fees and other Fund expenses. As a shareholder of the CrossingBridge Pre-Merger SPAC ETF, you incur two types of costs: (1) transaction costs, including brokerage commissions paid on purchases and sales of the Fund’s shares, and (2) ongoing costs, including management fees of the Fund. The Example is intended to help you understand your ongoing costs (in dollars) of investing in the Funds and to compare these costs with the ongoing costs of investing in other funds. The Example is based on an investment of $1,000 invested at the beginning of the respective period disclosed in the following table and held for the entire respective period disclosed in the following table.
Actual Expenses
The first line under each Fund in the following table provides information about actual account values and actual expenses for each Fund. You may use the information in this line, together with the amount you invested, to estimate the expenses that you paid over the period. Simply divide your account value by $1,000 (for example, an $8,600 account value divided by $1,000 = 8.6), then multiply the result by the number in the first line under the heading entitled “Expenses Paid During Period” to estimate the expenses you paid on your account during this period.
Hypothetical Example for Comparison Purposes
The second line under each Fund in the following table provides information about hypothetical account values and hypothetical expenses based on each Fund’s actual expense ratio and an assumed rate of return of 5% per year before expenses, which is not the Fund’s actual return. The hypothetical account values and expenses may not be used to estimate the actual ending account balance or expenses you paid for the period. You may use this information to compare the ongoing costs of investing in the Funds and other funds. To do so, compare this 5% hypothetical example with the 5% hypothetical examples that appear in the shareholder reports of other funds. Please note that the expenses shown in the table are meant to highlight your ongoing costs only and do not reflect any transactional costs, such as sales charges (loads), redemption fees or exchange fees. Therefore, the second line of the table is useful in comparing ongoing costs only, and will not help you determine the relative total costs of owning different funds. In addition, if these transactional costs were included, your costs would have been higher.
CROSSINGBRIDGE FUNDS
Expense Example (Continued)
(Unaudited)
| | | Beginning | Ending | |
| | Annualized | Account Value | Account Value | Expenses |
| | Expense | April 1, | September 30, | Paid During |
| | Ratio | 2022 | 2022 | Period* |
| CrossingBridge Low | | | | |
| Duration High Yield Fund | | | | |
| Institutional Class | | | | |
Based on actual fund return | 0.87% | $1,000.00 | $ 988.90 | $4.34 |
| Based on hypothetical 5% return | 0.87% | 1,000.00 | 1,020.71 | 4.41 |
| | | | | |
| CrossingBridge | | | | |
| Responsible Credit Fund | | | | |
| Institutional Class | | | | |
Based on actual fund return | 0.88% | 1,000.00 | 1,001.20 | 4.41 |
| Based on hypothetical 5% return | 0.88% | 1,000.00 | 1,020.66 | 4.46 |
| | | | | |
| CrossingBridge | | | | |
| Ultra-Short Duration Fund | | | | |
| Institutional Class | | | | |
Based on actual fund return | 0.88% | 1,000.00 | 1,009.40 | 4.43 |
| Based on hypothetical 5% return | 0.88% | 1,000.00 | 1,020.66 | 4.46 |
| | | | | |
| CrossingBridge | | | | |
| Pre-Merger SPAC ETF | | | | |
Based on actual fund return | 0.80% | 1,000.00 | 1,003.90 | 4.02 |
| Based on hypothetical 5% return | 0.80% | 1,000.00 | 1,021.06 | 4.05 |
| * | Expenses are calculated using the Fund’s annualized expense ratio, multiplied by the average account value over the period, multiplied by the number of days in the period (183 days), divided by 365 days to reflect the six month period ended September 30, 2022. |
CROSSINGBRIDGE LOW DURATION HIGH YIELD FUND
Investment Highlights
(Unaudited)
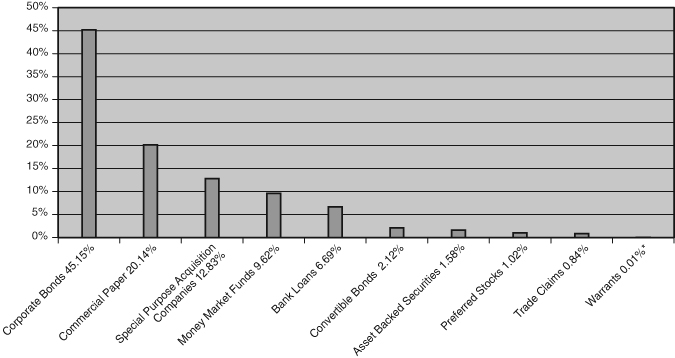
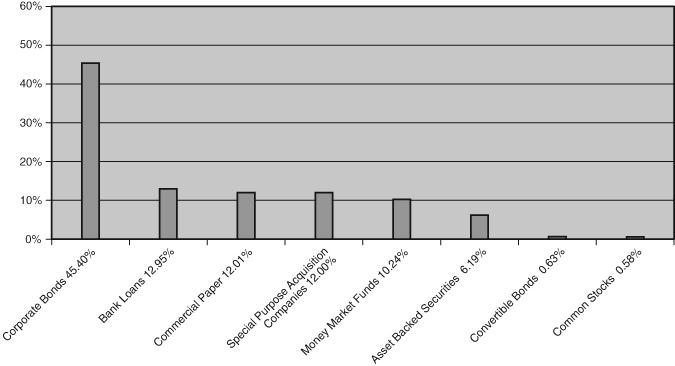
The Fund seeks high current income and capital appreciation consistent with the preservation of capital using a low duration mandate. The allocation of portfolio holdings as of September 30, 2022 is as follows:
Allocation of Portfolio Holdings
(% of Investments)
Average Annual Total Returns as of September 30, 2022
| | One | Three | Since |
| | Year | Years | February 1, 20181 |
| Institutional Class Shares | -0.39% | 3.46% | 3.23% |
| ICE BofA 0-3 Year U.S. High Yield | | | |
| Excluding Financials Index | -4.35% | 1.89% | 2.73% |
| ICE BofA 0-3 Year U.S. Treasury Index | -3.39% | -0.16% | 0.88% |
| ICE BofA 1-3 Year U.S. Corporate Bond Index | -5.89% | -0.19% | 1.21% |
1 | Commencement of investment operations. |
Performance data quoted represents past performance and does not guarantee future results. The investment return and principal value of an investment will fluctuate so that an investor’s shares, when redeemed, may be worth more or less than their original cost. Current performance of the Fund may be lower or higher than the performance quoted. Performance data current to the most recent month-end may be obtained by calling 1-888-898-2780.
Investment performance reflects fee waivers in effect. In the absence of such waivers, total returns would be reduced.
CROSSINGBRIDGE LOW DURATION HIGH YIELD FUND
Investment Highlights (Continued)
(Unaudited)
The returns shown assume reinvestment of Fund distributions and do not reflect the deduction of taxes that a shareholder would pay on Fund distributions or the redemption of Fund shares. The following graph illustrates performance of a hypothetical investment made in the Fund and the Fund’s primary benchmark index, the ICE BofA 0-3 Year U.S. High Yield Excluding Financials Index, as well as other broad-based securities indices on the Fund’s inception date. The graph does not reflect any future performance. ICE BofA 0-3 Year U.S. High Yield Excluding Financials Index is a subset of ICE BofA 0-3 Year U.S. High Yield Index excluding sector level 2 Financial issuers. ICE BofA 0-3 Year U.S. Treasury Index tracks the performance of U.S. dollar denominated sovereign debt publicly issued by the U.S. government in its domestic market with maturities less than three years. Qualifying securities must have at least 18 months to maturity at point of issuance, at least one month and less than three years remaining term to final maturity, a fixed coupon schedule and minimum amount outstanding of $1 billion. ICE BofA 1-3 Year U.S. Corporate Bond Index is a subset of ICE BofA U.S. Corporate Bond Index including all securities with a remaining term to final maturity less than 3 years. It is not possible to invest directly in an index.
Growth of $50,000 Investment
| * | Commencement of investment operations. |
CROSSINGBRIDGE RESPONSIBLE CREDIT FUND
Investment Highlights
(Unaudited)
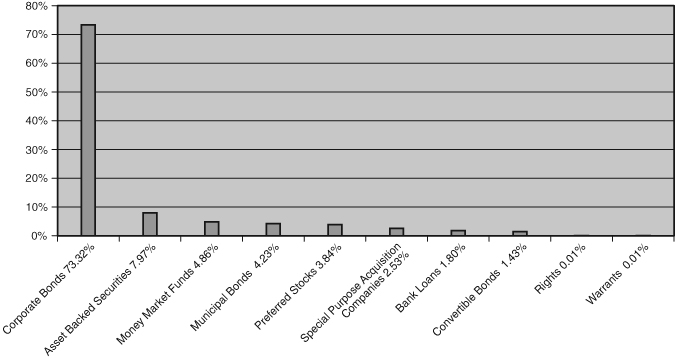
The Fund seeks high current income and capital appreciation consistent with the preservation of capital by investing in fixed income securities that meet the responsible investing criteria of the Fund’s investment adviser. The allocation of portfolio holdings as of September 30, 2022 is as follows:
Allocation of Portfolio Holdings
(% of Investments)
Average Annual Total Returns as of September 30, 2022
| | One | Since |
| | Year | June 30, 20211 |
| Institutional Class Shares | 0.45% | 0.82% |
| ICE BofA U.S. High Yield Index | -14.06% | -10.73% |
| ICE BofA 3-7 Year U.S. Treasury Index | -11.08% | -9.07% |
| ICE BofA U.S. Corporate Index | -18.19% | -14.85% |
1 | Commencement of investment operations. |
Performance data quoted represents past performance and does not guarantee future results. The investment return and principal value of an investment will fluctuate so that an investor’s shares, when redeemed, may be worth more or less than their original cost. Current performance of the Fund may be lower or higher than the performance quoted. Performance data current to the most recent month end may be obtained by calling 1-888-898-2780.
Investment performance reflects fee waivers in effect. In the absence of such waivers, total returns would be reduced.
CROSSINGBRIDGE RESPONSIBLE CREDIT FUND
Investment Highlights (Continued)
(Unaudited)
The returns shown assume reinvestment of Fund distributions and do not reflect the deduction of taxes that a shareholder would pay on Fund distributions or the redemption of Fund shares. The following graph illustrates performance of a hypothetical investment made in the Fund and the Fund’s primary benchmark index, the ICE BofA U.S. High Yield Index, as well as other broad-based securities indices on the Fund’s inception date. ICE BofA 3-7 Year U.S. Treasury Index measures the performance of public obligations of the U.S. Treasury that have a remaining maturity of greater than 3 years and less than or equal to 7 years. ICE BofA U.S. Corporate Index is an unmanaged index comprised of U.S. dollar denominated investment grade, fixed rate corporate debt securities publicly issued in the U.S. domestic market with at least one year remaining term to final maturity and at least $250 million outstanding. ICE BofA U.S. High Yield Index is an unmanaged index that tracks the performance of U.S. dollar denominated, below investment-grade rated corporate debt publicly issued in the U.S. domestic market. It is not possible to invest directly in an index.
Growth of $50,000 Investment
CROSSINGBRIDGE ULTRA-SHORT DURATION FUND
Investment Highlights
(Unaudited)
The Fund seeks to offer a higher yield than cash instruments while maintaining a low duration. The allocation of portfolio holdings as of September 30, 2022 is as follows:
Allocation of Portfolio Holdings
(% of Investments)
Average Annual Total Returns as of September 30, 2022
| | One | Since |
| | Year | June 30, 20211 |
| Institutional Class Shares | 1.12% | 0.95% |
| ICE BofA 0-1 Year U.S. Corporate Index | -1.07% | -0.79% |
| ICE BofA 0-1 Year U.S. Treasury Index | -0.20% | -0.14% |
| ICE BofA 0-3 Year U.S. Fixed Rate | | |
| Asset Backed Securities Index | -2.96% | -2.28% |
1 | Commencement of investment operations. |
Performance data quoted represents past performance and does not guarantee future results. The investment return and principal value of an investment will fluctuate so that an investor’s shares, when redeemed, may be worth more or less than their original cost. Current performance of the Fund may be lower or higher than the performance quoted. Performance data current to the most recent month end may be obtained by calling 1-888-898-2780.
Investment performance reflects fee waivers in effect. In the absence of such waivers, total returns would be reduced.
CROSSINGBRIDGE ULTRA-SHORT DURATION FUND
Investment Highlights (Continued)
(Unaudited)
The returns shown assume reinvestment of Fund distributions and do not reflect the deduction of taxes that a shareholder would pay on Fund distributions or the redemption of Fund shares. The following graph illustrates performance of a hypothetical investment made in the Fund and the Fund’s primary benchmark index, ICE BofA 0-1 Year U.S. Corporate Index, as well as other broad-based securities indices on the Fund’s inception date. ICE BofA 0-1 Year U.S. Corporate Index is a subset of ICE BofA U.S. Corporate Bond Index including all securities with a remaining term to final maturity less than 1 year. ICE BofA 0-1 Year U.S. Treasury Index tracks the performance of U.S. dollar denominated sovereign debt publicly issued by the U.S. government in its domestic market with maturities less than one year. ICE BofA 0-3 Year U.S. Fixed Rate Asset Backed Securities Index is a subset of ICE BofA U.S. Fixed Rate Asset Backed Securities Index including all securities with a remaining term to final maturity less than three years. It is not possible to invest directly in an index.
Growth of $50,000 Investment
CROSSINGBRIDGE PRE-MERGER SPAC ETF
Investment Highlights
(Unaudited)
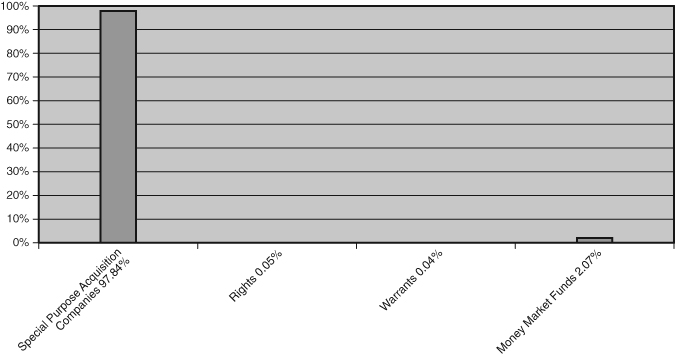
The Fund seeks to provide total returns consistent with the preservation of capital. The allocation of portfolio holdings as of September 30, 2022 is as follows:
Allocation of Portfolio Holdings
(% of Investments)
Average Annual Total Returns as of September 30, 2022
| | One | Since |
| | Year | September 20, 20211 |
Net Asset Value | 2.85% | 2.80% |
Market Value | 2.70% | 2.82% |
| ICE BofA 0-3 Year U.S. Treasury Index | -3.39% | -3.36% |
1 | Commencement of investment operations. |
Performance data quoted represents past performance and does not guarantee future results. The investment return and principal value of an investment will fluctuate so that an investor’s shares, when redeemed, may be worth more or less than their original cost. Current performance of the Fund may be lower or higher than the performance quoted. Performance data current to the most recent month end may be obtained by calling 1-888-898-2780.
The returns shown assume reinvestment of Fund distributions and do not reflect the deduction of taxes that a shareholder would pay on Fund distributions or the redemption of Fund shares. The following graph illustrates performance of a hypothetical investment made in the Fund and broad-based securities indices on the Fund’s inception date. The graph does not reflect any future performance. ICE BofA 0-3 Year U.S. Treasury Index tracks the performance of U.S. dollar denominated sovereign debt publicly issued by the
CROSSINGBRIDGE PRE-MERGER SPAC ETF
Investment Highlights (Continued)
(Unaudited)
U.S. government in its domestic market with maturities less than three years. Qualifying securities must have at least 18 months to maturity at point of issuance, at least one month and less than three years remaining term to final maturity, a fixed coupon schedule and minimum amount outstanding of $1 billion. It is not possible to invest directly in an index.
Growth of $10,000 Investment
CROSSINGBRIDGE LOW DURATION HIGH YIELD FUND
September 30, 2022
| | | Face | | | | |
| | | Amount† | | | Value | |
| ASSET BACKED SECURITIES – 1.63% | | | | | | |
| | | | | | | |
| Finance and Insurance – 0.18% | | | | | | |
HTS Fund I LLC | | | | | | |
2021-1, 1.410%, 08/25/2036 (a) | | | 1,000,000 | | | $ | 967,062 | |
| | | | | | | | | |
| Transportation and Warehousing – 1.45% | | | | | | | | |
Hawaiian Airlines 2013-1 Class A Pass Through Certificates | | | | | | | | |
2013-1, 3.900%, 01/15/2026 | | | 9,817,848 | | | | 7,899,273 | |
TOTAL ASSET BACKED SECURITIES (Cost $9,847,972) | | | | | | | 8,866,335 | |
| | | | | | | | | |
| | | | | | | | | |
| BANK LOANS – 6.89% | | | | | | | | |
| | | | | | | | | |
| Accommodation and Food Services – 0.35% | | | | | | | | |
Fogo De Chao, Inc. | | | | | | | | |
7.365% (1 Month LIBOR + 4.250%), 04/05/2025 (b) | | | 2,036,000 | | | | 1,922,748 | |
| | | | | | | | | |
| Administrative and Support and Waste | | | | | | | | |
| Management and Remediation Services – 0.63% | | | | | | | | |
Monitronics International, Inc. | | | | | | | | |
10.306% (Base Rate + 7.500%), 03/29/2024 (b) | | | 5,162,081 | | | | 3,453,747 | |
| | | | | | | | | |
| Construction – 0.20% | | | | | | | | |
Lealand Finance (McDermott) | | | | | | | | |
6.115% (1 Month Base Rate + 3.000%), 06/30/2024 (b) | | | 1,750,984 | | | | 1,116,252 | |
| | | | | | | | | |
| Finance and Insurance – 0.43% | | | | | | | | |
MoneyGram International, Inc. | | | | | | | | |
7.615% (3 Month LIBOR + 4.500%), 07/21/2026 (b) | | | 2,395,458 | | | | 2,346,247 | |
| | | | | | | | | |
| | | | | | | | | |
| Information – 2.64% | | | | | | | | |
Cengage Learning, Inc. | | | | �� | | | | |
7.814% (Base Rate + 4.750%), 07/14/2026 (b) | | | 4,059,963 | | | | 3,686,325 | |
Go Daddy Operating Co. LLC | | | | | | | | |
4.865% (1 Month LIBOR + 1.750%), 02/15/2024 (b) | | | 10,776,898 | | | | 10,687,988 | |
| | | | | | | | 14,374,313 | |
| | | | | | | | | |
| Manufacturing – 1.02% | | | | | | | | |
First Brands Group LLC | | | | | | | | |
8.368% (6 Month SOFR + 5.000%), 03/30/2027 (b) | | | 2,130,912 | | | | 2,055,797 | |
K&N Parent, Inc. | | | | | | | | |
7.000% (3 Month LIBOR + 4.750%), 10/20/2023 (b) | | | 4,366,418 | | | | 3,481,838 | |
| | | | | | | | 5,537,635 | |
The accompanying notes are an integral part of these financial statements.
CROSSINGBRIDGE LOW DURATION HIGH YIELD FUND
| Schedule of Investments (Continued) |
September 30, 2022
| | | Face | | | | |
| | | Amount† | | | Value | |
| | | | | | | |
| BANK LOANS – 6.89% (CONTINUED) | | | | | | |
| | | | | | | |
| Mining, Quarrying, and Oil and Gas Extraction – 0.81% | | | | | | |
Quarternorth Energy Holding, Inc. | | | | | | |
11.115% (1 Month LIBOR + 8.000%), 08/27/2026 (b) | | | 4,419,985 | | | $ | 4,412,626 | |
| | | | | | | | | |
| Professional, Scientific, and Technical Services – 0.81% | | | | | | | | |
Getty Images, Inc. | | | | | | | | |
7.625% (3 Month LIBOR + 4.500%), 02/19/2026 (b) | | | 4,423,000 | | | | 4,399,293 | |
TOTAL BANK LOANS (Cost $39,602,662) | | | | | | | 37,562,861 | |
| | | | | | | | | |
| | | | | | | | | |
| COMMERCIAL PAPER – 20.77% | | | | | | | | |
| | | | | | | | | |
| Information – 3.91% | | | | | | | | |
Crown Castle, Inc. | | | | | | | | |
3.513%, 10/19/2022 (c) | | | 11,261,000 | | | | 11,239,069 | |
Rogers Communications, Inc. | | | | | | | | |
4.030%, 11/04/2022 (c) | | | 5,371,000 | | | | 5,352,437 | |
Telus Corp. | | | | | | | | |
3.322%, 12/01/2022 (c) | | | 4,750,000 | | | | 4,719,102 | |
| | | | | | | | 21,310,608 | |
| | | | | | | | | |
| Manufacturing – 13.62% | | | | | | | | |
Constellation Brands, Inc. | | | | | | | | |
3.912%, 10/24/2022 (c) | | | 10,925,000 | | | | 10,897,534 | |
FMC Corp. | | | | | | | | |
3.067%, 10/03/2022 (c) | | | 8,750,000 | | | | 8,747,363 | |
Fortive Corp. | | | | | | | | |
3.057%, 10/14/2022 (c) | | | 7,750,000 | | | | 7,739,762 | |
Fortune Brands Home & Security, Inc. | | | | | | | | |
3.540%, 10/24/2022 (c) | | | 5,750,000 | | | | 5,736,545 | |
General Motors Financial Co, Inc. | | | | | | | | |
3.326%, 10/25/2022 (c) | | | 5,732,000 | | | | 5,717,272 | |
3.833%, 11/28/2022 (c) | | | 5,732,000 | | | | 5,694,377 | |
HP, Inc. | | | | | | | | |
3.536%, 10/17/2022 (c) | | | 11,464,000 | | | | 11,445,702 | |
Jabil, Inc. | | | | | | | | |
3.475%, 10/17/2022 (c) | | | 11,550,000 | | | | 11,528,838 | |
Parker-Hannifin Corp. | | | | | | | | |
3.216%, 11/28/2022 (c) | | | 6,750,000 | | | | 6,706,912 | |
| | | | | | | | 74,214,305 | |
The accompanying notes are an integral part of these financial statements.
CROSSINGBRIDGE LOW DURATION HIGH YIELD FUND
| Schedule of Investments (Continued) |
September 30, 2022
| | | Face | | | | |
| | | Amount† | | | Value | |
| | | | | | | |
| COMMERCIAL PAPER – 20.77% (CONTINUED) | | | | | | |
| | | | | | | |
| Mining, Quarrying, and Oil and Gas Extraction – 3.24% | | | | | | |
Glencore Funding LLC | | | | | | |
3.386%, 11/10/2022 (c) | | | 9,399,000 | | | $ | 9,361,128 | |
Targa Resources Corp. | | | | | | | | |
3.550%, 10/13/2022 (c) | | | 8,293,000 | | | | 8,283,746 | |
| | | | | | | | 17,644,874 | |
TOTAL COMMERCIAL PAPER (Cost $113,197,750) | | | | | | | 113,169,787 | |
| | | | | | | | | |
| | | | | | | | | |
| CONVERTIBLE BONDS – 2.18% | | | | | | | | |
| | | | | | | | | |
| Information – 2.18% | | | | | | | | |
BuzzFeed, Inc. | | | | | | | | |
8.500%, 12/03/2026 (a)(e) | | | 4,900,000 | | | | 3,724,000 | |
Leafly Holdings, Inc. | | | | | | | | |
8.000%, 01/31/2025 (d)(e) | | | 7,245,000 | | | | 6,737,850 | |
UpHealth, Inc. | | | | | | | | |
6.250%, 06/15/2026 (a) | | | 4,636,000 | | | | 1,442,955 | |
TOTAL CONVERTIBLE BONDS (Cost $16,659,724) | | | | | | | 11,904,805 | |
| | | | | | | | | |
| | | | | | | | | |
| CORPORATE BONDS – 46.56% | | | | | | | | |
| | | | | | | | | |
| Accommodation and Food Services – 0.24% | | | | | | | | |
Nathan’s Famous, Inc. | | | | | | | | |
6.625%, 11/01/2025 (a) | | | 1,321,000 | | | | 1,315,293 | |
| | | | | | | | | |
| Agriculture, Forestry, Fishing and Hunting – 0.29% | | | | | | | | |
Cooks Venture, Inc. | | | | | | | | |
2022-2, 5.500%, 01/15/2025 (a) | | | 1,595,000 | | | | 1,563,898 | |
| | | | | | | | | |
| Arts, Entertainment, and Recreation – 0.04% | | | | | | | | |
Gaming Innovation Group Plc | | | | | | | | |
9.979% (3 Month STIBOR + 8.500%), 06/11/2024 (a)(b)(f)(g) | | SEK 2,250,000 | | | | 205,787 | |
| | | | | | | | | |
| Construction – 0.36% | | | | | | | | |
Schletter International BV | | | | | | | | |
7.462% (3 Month EURIBOR + 6.750%), 09/12/2025 (b)(f)(h) | | EUR 1,990,000 | | | | 1,942,705 | |
| | | | | | | | | |
| Educational Services – 0.27% | | | | | | | | |
Hercules Achievement Inc / Varsity Brands Holding Co, Inc. | | | | | | | | |
11.674% (3 Month LIBOR + 8.000%), 12/22/2024 (a)(b) | | | 1,533,000 | | | | 1,456,350 | |
The accompanying notes are an integral part of these financial statements.
CROSSINGBRIDGE LOW DURATION HIGH YIELD FUND
| Schedule of Investments (Continued) |
September 30, 2022
| | | Face | | | | |
| | | Amount† | | | Value | |
| | | | | | | |
| CORPORATE BONDS – 46.56% (CONTINUED) | | | | | | |
| | | | | | | |
| Finance and Insurance – 3.10% | | | | | | |
HMH Holding BV | | | | | | |
9.912%, 02/10/2025 (f) | | | 4,001,000 | | | $ | 4,051,012 | |
Icahn Enterprises LP / Icahn Enterprises Finance Corp. | | | | | | | | |
4.750%, 09/15/2024 | | | 621,000 | | | | 581,587 | |
Nordic Capital II | | | | | | | | |
7.910%, 06/30/2024 (f)(i) | | NOK 10,200,000 | | | | 943,859 | |
StoneX Group, Inc. | | | | | | | | |
8.625%, 06/15/2025 (a) | | | 11,178,000 | | | | 11,313,198 | |
| | | | | | | | 16,889,656 | |
| | | | | | | | | |
| Health Care and Social Assistance – 0.27% | | | | | | | | |
ADDvise Group AB | | | | | | | | |
8.569% (3 Month STIBOR + 7.250%), 05/21/2024 (b)(f)(g) | | SEK 16,380,000 | | | | 1,472,298 | |
| | | | | | | | | |
| Information – 18.58% | | | | | | | | |
American Greetings Corp. | | | | | | | | |
8.750%, 04/15/2025 (a) | | | 2,712,000 | | | | 2,608,754 | |
Azerion Holding BV | | | | | | | | |
7.250%, 04/28/2024 (f)(h) | | EUR 3,199,000 | | | | 3,097,326 | |
CCO Holdings LLC / CCO Holdings Capital Corp. | | | | | | | | |
4.000%, 03/01/2023 (a) | | | 4,319,000 | | | | 4,299,564 | |
Cengage Learning, Inc. | | | | | | | | |
9.500%, 06/15/2024 (a) | | | 8,486,000 | | | | 7,976,840 | |
Clear Channel International BV | | | | | | | | |
6.625%, 08/01/2025 (a)(f) | | | 10,961,000 | | | | 10,197,991 | |
Connect Finco SARL / Connect US Finco LLC | | | | | | | | |
6.750%, 10/01/2026 (a)(f) | | | 7,949,000 | | | | 6,964,658 | |
Go North Group AB | | | | | | | | |
12.874% (3 Month STIBOR + 12.000%), 07/15/2025 (b)(f)(g) | | SEK 51,250,000 | | | | 4,715,537 | |
Impala BondCo Plc | | | | | | | | |
10.217% (3 Month STIBOR + 9.000%), 10/20/2024 (b)(f)(g) | | SEK 11,250,000 | | | | 981,710 | |
INNOVATE Corp. | | | | | | | | |
8.500%, 02/01/2026 (a) | | | 6,874,000 | | | | 5,052,390 | |
Linkem S.p.A. | | | | | | | | |
7.193% (3 Month EURIBOR + 6.000%), 11/09/2022 (a)(b)(f)(h) | | EUR 14,565,000 | | | | 14,238,688 | |
N0r5ke Viking I AS | | | | | | | | |
10.220% (3 Month NIBOR + 8.000%), 05/03/2024 (b)(f)(i) | | NOK 14,800,000 | | | | 1,345,640 | |
Nielsen Co. | | | | | | | | |
5.000%, 02/01/2025 (a)(f) | | | 11,665,000 | | | | 11,453,138 | |
Sprint Communications LLC | | | | | | | | |
6.000%, 11/15/2022 | | | 17,170,000 | | | | 17,187,170 | |
The accompanying notes are an integral part of these financial statements.
CROSSINGBRIDGE LOW DURATION HIGH YIELD FUND
| Schedule of Investments (Continued) |
September 30, 2022
| | | Face | | | | |
| | | Amount† | | | Value | |
| | | | | | | |
| CORPORATE BONDS – 46.56% (CONTINUED) | | | | | | |
| | | | | | | |
| Information – 18.58% (Continued) | | | | | | |
TEGNA, Inc. | | | | | | |
4.750%, 03/15/2026 (a) | | | 9,483,000 | | | $ | 9,165,319 | |
Tigo Energy, Inc. | | | | | | | | |
5.500%, 01/15/2025 (a) | | | 1,969,333 | | | | 1,945,292 | |
| | | | | | | | 101,230,017 | |
| | | | | | | | | |
| Manufacturing – 10.55% | | | | | | | | |
Blast Motion, Inc. | | | | | | | | |
5.500%, 02/15/2025 (a) | | | 2,000,000 | | | | 1,932,200 | |
Chobani LLC / Chobani Finance Corp, Inc. | | | | | | | | |
7.500%, 04/15/2025 (a) | | | 9,167,000 | | | | 8,422,960 | |
Columbia Care, Inc. | | | | | | | | |
9.500%, 02/03/2026 (f) | | | 17,087,000 | | | | 17,020,959 | |
Fiven ASA | | | | | | | | |
7.916% (3 Month EURIBOR + 6.850%), 06/21/2024 (b)(f)(h) | | EUR 7,992,000 | | | | 7,675,879 | |
Ford Motor Credit Co. LLC | | | | | | | | |
3.350%, 11/01/2022 | | | 6,693,000 | | | | 6,684,861 | |
FXI Holdings, Inc. | | | | | | | | |
12.250%, 11/15/2026 (a) | | | 5,213,000 | | | | 4,144,335 | |
Georg Jensen A/S | | | | | | | | |
6.321% (3 Month EURIBOR + 6.000%), 05/15/2023 (b)(f)(h) | | EUR 100,000 | | | | 95,555 | |
Graphic Packaging International LLC | | | | | | | | |
4.875%, 11/15/2022 | | | 3,902,000 | | | | 3,901,813 | |
Hillenbrand, Inc. | | | | | | | | |
5.750%, 06/15/2025 | | | 3,542,000 | | | | 3,458,019 | |
Jaguar Land Rover Automotive Plc | | | | | | | | |
5.625%, 02/01/2023 (a)(f) | | | 1,106,000 | | | | 1,082,788 | |
LR Global Holding GmbH | | | | | | | | |
7.832% (3 Month EURIBOR + 7.250%), 02/03/2025 (b)(f)(h) | | EUR 3,609,000 | | | | 3,050,651 | |
| | | | | | | | 57,470,020 | |
| | | | | | | | | |
| Mining, Quarrying, and Oil and Gas Extraction – 3.22% | | | | | | | | |
Copper Mountain Mining Corp. | | | | | | | | |
8.000%, 04/09/2026 (f) | | | 6,576,062 | | | | 5,885,576 | |
Greenfire Resources, Inc. | | | | | | | | |
12.000%, 08/15/2025 (a)(f) | | | 3,411,000 | | | | 3,629,816 | |
Tacora Resources, Inc. | | | | | | | | |
8.250%, 05/15/2026 (a)(f) | | | 7,781,000 | | | | 6,645,218 | |
W&T Offshore, Inc. | | | | | | | | |
9.750%, 11/01/2023 (a) | | | 1,421,000 | | | | 1,394,290 | |
| | | | | | | | 17,554,900 | |
The accompanying notes are an integral part of these financial statements.
CROSSINGBRIDGE LOW DURATION HIGH YIELD FUND
| Schedule of Investments (Continued) |
September 30, 2022
| | | Face | | | | |
| | | Amount† | | | Value | |
| | | | | | | |
| CORPORATE BONDS – 46.56% (CONTINUED) | | | | | | |
| | | | | | | |
| Professional, Scientific, and Technical Services – 2.06% | | | | | | |
Aker Horizons ASA | | | | | | |
5.530% (3 Month NIBOR + 3.250%), 08/15/2025 (b)(f)(i) | | NOK 5,000,000 | | | $ | 414,429 | |
Desenio Group AB | | | | | | | |
7.056% (3 Month STIBOR + 5.500%), 12/16/2024 (b)(f)(g) | | SEK 1,250,000 | | | | 59,134 | |
Getty Images, Inc. | | | | | | | |
9.750%, 03/01/2027 (a) | | | 7,949,000 | | | | 7,904,287 | |
Rebellion Operations AB | | | | | | | | |
9.319% (3 Month STIBOR + 8.000%), 05/20/2025 (b)(f)(g) | | SEK 32,500,000 | | | | 2,879,407 | |
| | | | | | | | 11,257,257 | |
| | | | | | | | | |
| Real Estate and Rental and Leasing – 0.79% | | | | | | | | |
Exterran Energy Solutions LP / EES Finance Corp. | | | | | | | | |
8.125%, 05/01/2025 | | | 2,815,000 | | | | 2,853,200 | |
REX – Real Estate Exchange, Inc. | | | | | | | | |
6.000%, 03/15/2025 (a) | | | 1,500,000 | | | | 1,476,000 | |
| | | | | | | | 4,329,200 | |
| | | | | | | | | |
| Retail Trade – 2.10% | | | | | | | | |
Albertsons Cos Inc / Safeway Inc / | | | | | | | | |
New Albertsons LP / Albertsons LLC | | | | | | | | |
3.500%, 02/15/2023 (a) | | | 6,798,000 | | | | 6,730,700 | |
Anagram International Inc / Anagram Holdings LLC | | | | | | | | |
15.000%, 08/15/2025 (a) | | | 4,616,344 | | | | 4,690,021 | |
| | | | | | | | 11,420,721 | |
| | | | | | | | | |
| Transportation and Warehousing – 3.23% | | | | | | | | |
Golar LNG Ltd. | | | | | | | | |
7.000%, 10/20/2025 (f) | | | 16,509,000 | | | | 15,662,914 | |
Seaspan Corp. | | | | | | | | |
6.500%, 02/05/2024 (f) | | | 1,700,000 | | | | 1,683,000 | |
XPO Logistics, Inc. | | | | | | | | |
6.250%, 05/01/2025 (a) | | | 271,000 | | | | 272,141 | |
| | | | | | | | 17,618,055 | |
| | | | | | | | | |
| Wholesale Trade – 1.46% | | | | | | | | |
Martin Midstream Partners LP / Martin Midstream Finance Corp. | | | | | | | | |
10.000%, 02/29/2024 (a) | | | 7,155,775 | | | | 7,194,738 | |
11.500%, 02/28/2025 (a) | | | 765,000 | | | | 747,868 | |
| | | | | | | | 7,942,606 | |
| TOTAL CORPORATE BONDS (Cost $269,443,872) | | | | | | | 253,668,763 | |
The accompanying notes are an integral part of these financial statements.
CROSSINGBRIDGE LOW DURATION HIGH YIELD FUND
| Schedule of Investments (Continued) |
September 30, 2022
| | | Face | | | | |
| | | Amount† | | | Value | |
| | | | | | | |
| PREFERRED STOCKS – 1.05% | | | | | | |
| | | | | | | |
| Finance and Insurance – 1.05% | | | | | | |
CoBank ACB | | | | | | |
6.250%, No stated maturity | | | 57,197 | | | $ | 5,719,700 | |
| TOTAL PREFERRED STOCKS (Cost $5,789,480) | | | | | | | 5,719,700 | |
| | | | | | | | | |
| | | Number | | | | | |
| | | of Shares | | | | | |
| SPECIAL PURPOSE ACQUISITION COMPANIES – 13.23% | | | | | | | | |
Accelerate Acquisition Corp. (l) | | | 267,020 | | | | 2,626,142 | |
Agile Growth Corp. (f)(l) | | | 128,420 | | | | 1,275,211 | |
Alpha Partners Technology | | | | | | | | |
Merger Corp. Founder Shares (d)(e)(l) | | | 9,341 | | | | 887 | |
AltEnergy Acquisition Corp. (l) | | | 139,779 | | | | 1,399,188 | |
Atlantic Avenue Acquisition Corp. (l) | | | 90,259 | | | | 905,569 | |
Authentic Equity Acquisition Corp. (f)(l) | | | 12,435 | | | | 123,728 | |
AxonPrime Infrastructure | | | | | | | | |
Acquisition Corp. Founder Shares (d)(e)(l) | | | 5,000 | | | | 736 | |
Berenson Acquisition Corp. Founder Shares (d)(e)(l) | | | 19,099 | | | | 969 | |
BGP Acquisition Corp. (f)(l) | | | 179,882 | | | | 1,770,039 | |
Bite Acquisition Corp. (l) | | | 127,263 | | | | 1,252,904 | |
Blockchain Moon Acquisition Corp. (l) | | | 90,668 | | | | 904,867 | |
Bullpen Parlay Acquisition Co. (f)(l) | | | 44,011 | | | | 443,631 | |
Carney Technology Acquisition Corp. II (l) | | | 235,993 | | | | 2,348,130 | |
Clarim Acquisition Corp. (l) | | | 130,261 | | | | 1,288,281 | |
Compute Health Acquisition Corp. (l) | | | 270,004 | | | | 2,664,939 | |
COVA Acquisition Corp. (f)(l) | | | 74,557 | | | | 741,097 | |
Crescera Capital Acquisition Corp. (f)(l) | | | 33,736 | | | | 338,709 | |
DHB Capital Corp. (l) | | | 4,520 | | | | 44,477 | |
DTRT Health Acquisition Corp. (l) | | | 56,825 | | | | 577,910 | |
Elliott Opportunity II Corp. (f)(l) | | | 41,338 | | | | 406,766 | |
Empowerment & Inclusion Capital I Corp. (l) | | | 180,657 | | | | 1,784,891 | |
Enterprise 4.0 Technology Acquisition Corp. (f)(l) | | | 19,880 | | | | 200,788 | |
Fat Projects Acquisition Corp. (f)(l) | | | 28,536 | | | | 284,361 | |
Financials Acquisition Corp. (f)(j)(l) | | | 190,901 | | | | 2,126,167 | |
FutureTech II Acquisition Corp. (l) | | | 20,556 | | | | 206,588 | |
G&P Acquisition Corp. (l) | | | 250,380 | | | | 2,501,296 | |
Global Partner Acquisition Corp. II (f)(l) | | | 139,288 | | | | 1,387,308 | |
Goal Acquisitions Corp. (l) | | | 377,573 | | | | 3,719,094 | |
Golden Falcon Acquisition Corp. (l) | | | 46,683 | | | | 464,496 | |
GP Bullhound Acquisition I SE (f)(k)(l) | | | 108,609 | | | | 1,058,032 | |
Hambro Perks Acquisition Co. Ltd. (f)(j)(l) | | | 217,802 | | | | 2,431,857 | |
Healthcare Services Acquisition Corp. (l) | | | 12,435 | | | | 123,604 | |
The accompanying notes are an integral part of these financial statements.
CROSSINGBRIDGE LOW DURATION HIGH YIELD FUND
| Schedule of Investments (Continued) |
September 30, 2022
| | | Number | | | | |
| | | of Shares | | | Value | |
| SPECIAL PURPOSE ACQUISITION | | | | | | |
| COMPANIES – 13.23% (CONTINUED) | | | | | | |
Hiro Metaverse Acquisitions I SA (f)(j)(l) | | | 135,163 | | | $ | 1,512,929 | |
Horizon Acquisition Corp. II (f)(l) | | | 218,757 | | | | 2,187,570 | |
Ibere Pharmaceuticals (f)(l) | | | 126,627 | | | | 1,254,874 | |
Iconic Sports Acquisition Corp. (f)(l) | | | 345,215 | | | | 3,505,658 | |
Ignyte Acquisition Corp. (l) | | | 12,435 | | | | 124,226 | |
Innovative International Acquisition Corp. (f)(l) | | | 204,013 | | | | 2,068,692 | |
Itiquira Acquisition Corp. (f)(l) | | | 12,435 | | | | 123,604 | |
JOFF Fintech Acquisition Corp. (l) | | | 146,589 | | | | 1,443,902 | |
LAVA Medtech Acquisition Corp. (l) | | | 43,085 | | | | 433,435 | |
Legato Merger Corp. II (l) | | | 32,606 | | | | 323,941 | |
Mason Industrial Technology, Inc. (l) | | | 206,515 | | | | 2,023,847 | |
Mercury Ecommerce Acquisition Corp. (l) | | | 350,000 | | | | 3,489,500 | |
NewHold Investment Corp. II (l) | | | 104,856 | | | | 1,033,356 | |
OmniLit Acquisition Corp. (l) | | | 12,822 | | | | 129,246 | |
One Equity Partners Open Water I Corp. (l) | | | 19,319 | | | | 190,678 | |
Oyster Enterprises Acquisition Corp. (l) | | | 89,245 | | | | 881,741 | |
Peridot Acquisition Corp. II (f)(l) | | | 102,230 | | | | 1,013,610 | |
Pivotal Investment Corp. III (l) | | | 186,823 | | | | 1,841,141 | |
Pontem Corp. (f)(l) | | | 165,045 | | | | 1,640,547 | |
Portage Fintech Acquisition Corp. (f)(l) | | | 55,240 | | | | 544,114 | |
PowerUp Acquisition Corp. (f)(l) | | | 25,212 | | | | 255,650 | |
PWP Forward Acquisition Corp. I (l) | | | 6,639 | | | | 65,294 | |
Pyrophyte Acquisition Corp. (f)(l) | | | 22,753 | | | | 231,004 | |
Relativity Acquisition Corp. (l) | | | 169,970 | | | | 1,709,048 | |
Revelstone Capital Acquisition Corp. Founder Shares (d)(e)(l) | | | 10,125 | | | | 1,013 | |
RMG Acquisition Corp. III (f)(l) | | | 31,887 | | | | 317,276 | |
ShoulderUp Technology Acquisition Corp. (l) | | | 6,440 | | | | 64,690 | |
Silver Spike III Acquisition Corp. (f)(l) | | | 278,920 | | | | 2,831,038 | |
Social Leverage Acquisition Corp. I (l) | | | 55,240 | | | | 543,009 | |
SportsMap Tech Acquisition Corp. (l) | | | 13,234 | | | | 132,472 | |
ST Energy Transition I Ltd. (f)(l) | | | 12,659 | | | | 126,970 | |
Tech and Energy Transition Corp. (l) | | | 13,307 | | | | 131,207 | |
Tekkorp Digital Acquisition Corp. (f)(l) | | | 59,086 | | | | 592,042 | |
Tio Tech A (f)(l) | | | 396,937 | | | | 3,927,692 | |
| TOTAL SPECIAL PURPOSE ACQUISITION COMPANIES | | | | | | | | |
| (Cost $72,508,769) | | | | | | | 72,097,678 | |
| | | | | | | | | |
| TRADE CLAIMS – 0.87% | | | | | | | | |
| | | | | | | | | |
| Utilities – 0.87% | | | | | | | | |
Brazos Electric Power Cooperative, Inc. (l) | | | 5,397,407 | | | | 4,738,924 | |
| TOTAL TRADE CLAIMS (Cost $4,891,400) | | | | | | | 4,738,924 | |
The accompanying notes are an integral part of these financial statements.
CROSSINGBRIDGE LOW DURATION HIGH YIELD FUND
| Schedule of Investments (Continued) |
September 30, 2022
| | | Number | | | | |
| | | of Shares | | | Value | |
| WARRANTS – 0.01% | | | | | | |
Brigade-M3 European Acquisition Corp. (f)(l) | | | | | | |
Expiration: 01/17/2027, Exercise Price: $11.50 | | | 110,310 | | | $ | 12,134 | |
DHB Capital Corp. (l) | | | | | | | | |
Expiration: 03/31/2028, Exercise Price: $11.50 | | | 1,506 | | | | 80 | |
Financials Acquisition Corp. (f)(j)(l) | | | | | | | | |
Expiration: 04/04/2027, Exercise Price: $11.50 | | | 95,450 | | | | 4,263 | |
GP Bullhound Acquisition I SE (f)(k)(l) | | | | | | | | |
Expiration: 03/11/2027, Exercise Price: $11.50 | | | 54,304 | | | | 13,305 | |
Hambro Perks Acquisition Corp. (f)(j)(l) | | | | | | | | |
Expiration: 01/07/2026, Exercise Price: $11.50 | | | 108,901 | | | | 12,767 | |
Hiro Metaverse Acquisitions I SA (f)(j)(l) | | | | | | | | |
Expiration: 12/21/2026, Exercise Price: $11.50 | | | 67,581 | | | | 11,696 | |
Leafly Holdings, Inc. (l) | | | | | | | | |
Expiration: 11/07/2026, Exercise Price: $11.50 | | | 36,943 | | | | 6,273 | |
OmniLit Acquisition Corp. (l) | | | | | | | | |
Expiration: 11/08/2026, Exercise Price: $11.50 | | | 3,260 | | | | 401 | |
| TOTAL WARRANTS (Cost $89,432) | | | | | | | 60,919 | |
| | | | | | | | | |
| MONEY MARKET FUNDS – 9.92% | | | | | | | | |
First American Government Obligations | | | | | | | | |
Fund – Class X, 2.773% (m) | | | 23,272,462 | | | | 23,272,462 | |
First American Treasury Obligations Fund – Class X, 2.875% (m) | | | 30,776,578 | | | | 30,776,578 | |
| TOTAL MONEY MARKET FUNDS (Cost $54,049,040) | | | | | | | 54,049,040 | |
Total Investments (Cost $586,080,101) – 103.11% | | | | | | | 561,838,812 | |
Liabilities in Excess of Other Assets – (3.11)% | | | | | | | (16,945,818 | ) |
| Total Net Assets – 100.00% | | | | | | $ | 544,892,994 | |
Percentages are stated as a percent of net assets.
| † | Face amount in U.S. Dollar unless otherwise indicated. |
| (a) | Securities issued pursuant to Rule 144A under the Securities Act of 1933 and Regulation S under the Securities Act of 1933. Aggregate value of these securities is $152,158,539 or 27.93% of Fund’s net assets. |
| (b) | Variable rate security. The rate shown represents the rate at September 30, 2022. |
| (c) | The rate shown is the effective yield. |
| (d) | Illiquid security. |
| (e) | Security valued using unobservable inputs. |
| (f) | Foreign issued security. |
| (g) | Principal amount denominated in Swedish Krona. |
| (h) | Principal amount denominated in Euros. |
| (i) | Principal amount denominated in Norwegian Krone. |
| (j) | Holding denominated in British Pound. |
| (k) | Holding denominated in Euros. |
The accompanying notes are an integral part of these financial statements.
CROSSINGBRIDGE LOW DURATION HIGH YIELD FUND
| Schedule of Investments (Continued) |
| (l) | Non-income producing security. |
| (m) | Seven day yield as of September 30, 2022. |
Definitions:
EURIBOR – Euro-Interbank Offer Rate is a reference rate expressing the average interest rate at which eurozone banks offer unsecured short-term lending on the interbank market.
LIBOR – London Interbank Offer Rate is a benchmark rate at which banks offer to lend funds to one another in the international interbank market for short-term loans.
NIBOR – Norwegian Interbank Offer Rate is a collective term for Norwegian money market rates at different maturities. It is intended to reflect the interest rate level a bank require for unsecured money market lending in Norwegian Krone to another bank.
SOFR – Secured Overnight Financing Rate is a benchmark interest rate for dollar-denominated derivatives and loans. SOFR is based on transactions in the Treasury repurchase market and is based on data from observable transactions rather than on estimated borrowing rates.
STIBOR – Stockholm Interbank Offer Rate is a reference rate that shows the average interest rate at which a number of active banks on the Swedish money market are willing to lend to one another, without collateral, at different maturities.
The accompanying notes are an integral part of these financial statements.
CROSSINGBRIDGE LOW DURATION HIGH YIELD FUND
| Schedule of Forward Currency Exchange Contracts |
Schedule of Investments (Continue
| | |
| | | Currency | | USD Value at | | Currency | | USD Value at | | | Unrealized | |
| Settlement | | Counter- | | to be | | September 30, | | to be | | September 30, | | | Appreciation/ | |
| Date | | party | | Delivered | | | 2022 | | Received | | | 2022 | | | (Depreciation) | |
| 10/14/22 | | U.S. Bank | | 32,240,415 EUR | | $ | 31,628,183 | | 32,529,567 USD | | $ | 32,529,567 | | | $ | 901,384 | |
| 10/14/22 | | U.S. Bank | | 5,448,000 GBP | | | 6,084,850 | | 6,376,067 USD | | | 6,376,067 | | | | 291,217 | |
| 10/14/22 | | U.S. Bank | | 30,112,000 NOK | | | 2,765,602 | | 3,056,621 USD | | | 3,056,621 | | | | 291,019 | |
| 10/14/22 | | U.S. Bank | | 124,994,000 SEK | | | 11,270,154 | | 11,936,248 USD | | | 11,936,248 | | | | 666,094 | |
| 10/14/22 | | U.S. Bank | | 649,045 USD | | | 649,045 | | 7,244,000 SEK | | | 653,159 | | | | 4,114 | |
| | | | | | | | $ | 52,397,834 | | | | $ | 54,551,662 | | | $ | 2,153,828 | |
EUR – Euro
GBP – British Pound
NOK – Norwegian Krone
SEK – Swedish Krona
USD – U.S. Dollars
The accompanying notes are an integral part of these financial statements.
CROSSINGBRIDGE RESPONSIBLE CREDIT FUND
September 30, 2022
| | | Face | | | | |
| | | Amount† | | | Value | |
| | | | | | | |
| ASSET BACKED SECURITIES – 6.41% | | | | | | |
| | | | | | | |
| Transportation and Warehousing – 6.41% | | | | | | |
Hawaiian Airlines 2013-1 Class A Pass Through Certificates | | | | | | |
2013-1, 3.900%, 01/15/2026 | | | 1,686,819 | | | $ | 1,357,186 | |
TOTAL ASSET BACKED SECURITIES (Cost $1,474,621) | | | | | | | 1,357,186 | |
| | | | | | | | | |
| | | | | | | | | |
| BANK LOANS – 13.42% | | | | | | | | |
| | | | | | | | | |
| Administrative and Support and Waste | | | | | | | | |
| Management and Remediation Services – 0.47% | | | | | | | | |
Monitronics International, Inc. | | | | | | | | |
10.306% (Base Rate + 7.500%), 03/29/2024 (a) | | | 149,615 | | | | 100,125 | |
| | | | | | | | | |
| Information – 4.08% | | | | | | | | |
Cengage Learning, Inc. | | | | | | | | |
7.814% (Base Rate + 4.750%), 07/14/2026 (a) | | | 500,000 | | | | 453,985 | |
Go Daddy Operating Co. LLC | | | | | | | | |
4.865% (1 Month LIBOR + 1.750%), 02/15/2024 (a) | | | 413,000 | | | | 409,593 | |
| | | | | | | | 863,578 | |
| | | | | | | | | |
| Manufacturing – 7.00% | | | | | | | | |
Real Alloy | | | | | | | | |
13.674% (3 Month LIBOR + 10.000%), 05/31/2023 (a)(b) | | | 1,480,934 | | | | 1,480,934 | |
| | | | | | | | | |
| Retail Trade – 1.87% | | | | | | | | |
West Marine, Inc. | | | | | | | | |
11.365% (Base Rate + 8.250%), 06/01/2029 (a) | | | 500,000 | | | | 395,000 | |
| TOTAL BANK LOANS (Cost $2,955,504) | | | | | | | 2,839,637 | |
| | | | | | | | | |
| | | | | | | | | |
| COMMERCIAL PAPER – 12.45% | | | | | | | | |
| | | | | | | | | |
| Information – 2.91% | | | | | | | | |
Crown Castle, Inc. | | | | | | | | |
3.513%, 10/19/2022 (c) | | | 367,000 | | | | 366,285 | |
Rogers Communications, Inc. | | | | | | | | |
4.030%, 11/04/2022 (c) | | | 250,000 | | | | 249,136 | |
| | | | | | | | 615,421 | |
| Manufacturing – 9.54% | | | | | | | | |
Arrow Electronics, Inc. | | | | | | | | |
3.370%, 10/05/2022 (c) | | | 356,000 | | | | 355,816 | |
Fortune Brands Home & Security, Inc. | | | | | | | | |
3.291%, 10/03/2022 (c) | | | 450,000 | | | | 449,869 | |
The accompanying notes are an integral part of these financial statements.
CROSSINGBRIDGE RESPONSIBLE CREDIT FUND
| Schedule of Investments (Continued) |
September 30, 2022
| | | Face | | | | |
| | | Amount† | | | Value | |
| | | | | | | |
| COMMERCIAL PAPER – 12.45% (CONTINUED) | | | | | | |
| | | | | | | |
| Manufacturing – 9.54% (Continued) | | | | | | |
General Motors Financial Co, Inc. | | | | | | |
3.566%, 11/15/2022 (c) | | | 450,000 | | | $ | 447,769 | |
Jabil, Inc. | | | | | | | | |
3.784%, 10/28/2022 (c) | | | 384,000 | | | | 382,825 | |
Nutrien Ltd. | | | | | | | | |
3.813%, 11/15/2022 (c) | | | 384,000 | | | | 382,226 | |
| | | | | | | | 2,018,505 | |
| TOTAL COMMERCIAL PAPER (Cost $2,634,257) | | | | | | | 2,633,926 | |
| | | | | | | | | |
| | | | | | | | | |
| COMMON STOCKS – 0.61% | | | | | | | | |
| | | | | | | | | |
| Health Care and Social Assistance – 0.61% | | | | | | | | |
Biote Corp. Founder Shares (i) | | | 30,000 | | | | 128,400 | |
| TOTAL COMMON STOCKS (Cost $0) | | | | | | | 128,400 | |
| | | | | | | | | |
| | | | | | | | | |
| CONVERTIBLE BONDS – 0.65% | | | | | | | | |
| | | | | | | | | |
| Manufacturing – 0.65% | | | | | | | | |
Danimer Scientific, Inc. | | | | | | | | |
3.250%, 12/15/2026 (d) | | | 260,000 | | | | 137,800 | |
| TOTAL CONVERTIBLE BONDS (Cost $258,960) | | | | | | | 137,800 | |
| | | | | | | | | |
| | | | | | | | | |
| CORPORATE BONDS – 47.05% | | | | | | | | |
| | | | | | | | | |
| Construction – 1.84% | | | | | | | | |
Schletter International BV | | | | | | | | |
7.462% (3 Month EURIBOR + 6.750%), 09/12/2025 (a)(e)(f) | | EUR 400,000 | | | | 390,494 | |
| | | | | | | | | |
| Finance and Insurance – 3.10% | | | | | | | | |
StoneX Group, Inc. | | | | | | | | |
8.625%, 06/15/2025 (d) | | | 648,000 | | | | 655,838 | |
| | | | | | | | | |
| Information – 16.21% | | | | | | | | |
American Greetings Corp. | | | | | | | | |
8.750%, 04/15/2025 (d) | | | 81,000 | | | | 77,916 | |
Calligo UK Ltd. | | | | | | | | |
9.728% (3 Month EURIBOR + 8.500%), 12/29/2024 (a)(e)(f) | | EUR 100,000 | | | | 95,310 | |
Cengage Learning, Inc. | | | | | | | | |
9.500%, 06/15/2024 (d) | | | 308,000 | | | | 289,520 | |
Clear Channel International BV | | | | | | | | |
6.625%, 08/01/2025 (d)(e) | | | 542,000 | | | | 504,271 | |
The accompanying notes are an integral part of these financial statements.
CROSSINGBRIDGE RESPONSIBLE CREDIT FUND
| Schedule of Investments (Continued) |
September 30, 2022
| | | Face | | | | |
| | | Amount† | | | Value | |
| | | | | | | |
| CORPORATE BONDS – 47.05% (CONTINUED) | | | | | | |
| | | | | | | |
| Information – 16.21% (Continued) | | | | | | |
Connect Finco SARL / Connect US Finco LLC | | | | | | |
6.750%, 10/01/2026 (d)(e) | | | 400,000 | | | $ | 350,467 | |
Go North Group AB | | | | | | | | |
12.874% (3 Month STIBOR + 12.000%), 07/15/2025 (a)(e)(g) | | SEK 5,000,000 | | | | 460,052 | |
INNOVATE Corp. | | | | | | | | |
8.500%, 02/01/2026 (d) | | | 460,000 | | | | 338,100 | |
Linkem S.p.A. | | | | | | | | |
7.193% (3 Month EURIBOR + 6.000%), 11/09/2022 (a)(d)(e)(f) | | EUR 1,250,000 | | | | 1,221,995 | |
Tigo Energy, Inc. | | | | | | | | |
5.500%, 01/15/2025 (d) | | | 93,333 | | | | 92,194 | |
| | | | | | | | 3,429,825 | |
| | | | | | | | | |
| Manufacturing – 14.39% | | | | | | | | |
Chobani LLC / Chobani Finance Corp, Inc. | | | | | | | | |
7.500%, 04/15/2025 (d) | | | 431,000 | | | | 396,018 | |
Fiven ASA | | | | | | | | |
7.916% (3 Month EURIBOR + 6.850%), 06/21/2024 (a)(e)(f) | | EUR 1,500,000 | | | | 1,440,668 | |
Ford Motor Credit Co. LLC | | | | | | | | |
3.350%, 11/01/2022 | | | 730,000 | | | | 729,112 | |
G-III Apparel Group Ltd. | | | | | | | | |
7.875%, 08/15/2025 (d) | | | 250,000 | | | | 227,199 | |
LR Global Holding GmbH | | | | | | | | |
7.832% (3 Month EURIBOR + 7.250%), 02/03/2025 (a)(e)(f) | | EUR 300,000 | | | | 253,587 | |
| | | | | | | | 3,046,584 | |
| | | | | | | | | |
| Mining, Quarrying, and Oil and Gas Extraction – 2.91% | | | | | | | | |
Aker ASA | | | | | | | | |
5.600% (3 Month NIBOR + 2.750%), 09/27/2027 (a)(e)(h) | | NOK 3,500,000 | | | | 317,422 | |
Copper Mountain Mining Corp. | | | | | | | | |
8.000%, 04/09/2026 (e) | | | 333,120 | | | | 298,142 | |
| | | | | | | | 615,564 | |
| | | | | | | | | |
| Professional, Scientific, and Technical Services – 2.82% | | | | | | | | |
Getty Images, Inc. | | | | | | | | |
9.750%, 03/01/2027 (d) | | | 600,000 | | | | 596,625 | |
| | | | | | | | | |
| Retail Trade – 1.20% | | | | | | | | |
Anagram International Inc / Anagram Holdings LLC | | | | | | | | |
15.000%, 08/15/2025 (d) | | | 250,000 | | | | 253,990 | |
The accompanying notes are an integral part of these financial statements.
CROSSINGBRIDGE RESPONSIBLE CREDIT FUND
| Schedule of Investments (Continued) |
September 30, 2022
| | | Face | | | | |
| | | Amount† | | | Value | |
| | | | | | | |
| CORPORATE BONDS – 47.05% (CONTINUED) | | | | | | |
| | | | | | | |
| Transportation and Warehousing – 3.54% | | | | | | |
Golar LNG Ltd. | | | | | | |
7.000%, 10/20/2025 (e) | | | 480,000 | | | $ | 455,400 | |
XPO CNW, Inc. | | | | | | | | |
6.700%, 05/01/2034 | | | 315,000 | | | | 293,156 | |
| | | | | | | | 748,556 | |
| | | | | | | | | |
| Wholesale Trade – 1.04% | | | | | | | | |
United Natural Foods, Inc. | | | | | | | | |
6.750%, 10/15/2028 (d) | | | 240,000 | | | | 220,326 | |
| TOTAL CORPORATE BONDS (Cost $10,745,802) | | | | | | | 9,957,802 | |
| | | | | | | | | |
| | | Number | | | | | |
| | | of Shares | | | | | |
| SPECIAL PURPOSE ACQUISITION COMPANIES – 12.43% | | | | | | | | |
AltEnergy Acquisition Corp. (i) | | | 30,000 | | | | 300,300 | |
Atlantic Avenue Acquisition Corp. (i) | | | 26,630 | | | | 267,179 | |
Authentic Equity Acquisition Corp. (e)(i) | | | 31,000 | | | | 308,450 | |
AxonPrime Infrastructure | | | | | | | | |
Acquisition Corp. Founder Shares (b)(i)(j) | | | 1,000 | | | | 147 | |
Carney Technology Acquisition Corp. II (i) | | | 11,082 | | | | 110,266 | |
Climate Real Impact Solutions II Acquisition Corp. (i) | | | 22,531 | | | | 222,381 | |
COVA Acquisition Corp. (e)(i) | | | 16,671 | | | | 165,710 | |
Empowerment & Inclusion Capital I Corp. (i) | | | 50,000 | | | | 494,000 | |
Enterprise 4.0 Technology Acquisition Corp. (e)(i) | | | 1,351 | | | | 13,645 | |
Global Technology Acquisition Corp. I (e)(i) | | | 242 | | | | 2,445 | |
Goldenstone Acquisition Ltd. (i) | | | 8,333 | | | | 83,038 | |
Healthcare Services Acquisition Corp. (i) | | | 31,000 | | | | 308,140 | |
Iconic Sports Acquisition Corp. (e)(i) | | | 7,573 | | | | 76,904 | |
Ignyte Acquisition Corp. (i) | | | 22,737 | | | | 227,143 | |
Legato Merger Corp. II (i) | | | 4,502 | | | | 44,727 | |
SportsMap Tech Acquisition Corp. (i) | | | 675 | | | | 6,757 | |
| TOTAL SPECIAL PURPOSE ACQUISITION COMPANIES | | | | | | | | |
| (Cost $2,587,709) | | | | | | | 2,631,232 | |
The accompanying notes are an integral part of these financial statements.
CROSSINGBRIDGE RESPONSIBLE CREDIT FUND
| Schedule of Investments (Continued) |
September 30, 2022
| | | Number | | | | |
| | | of Shares | | | Value | |
| MONEY MARKET FUNDS – 10.62% | | | | | | |
First American Government Obligations | | | | | | |
Fund – Class X, 2.773% (k) | | | 1,123,855 | | | $ | 1,123,855 | |
First American Treasury Obligations Fund – Class X, 2.875% (k) | | | 1,123,855 | | | | 1,123,855 | |
| TOTAL MONEY MARKET FUNDS (Cost $2,247,710) | | | | | | | 2,247,710 | |
Total Investments (Cost $22,904,563) – 103.64% | | | | | | | 21,933,693 | |
Liabilities in Excess of Other Assets – (3.64)% | | | | | | | (771,203 | ) |
| Total Net Assets – 100.00% | | | | | | $ | 21,162,490 | |
Percentages are stated as a percent of net assets.
| † | Face amount in U.S. Dollar unless otherwise indicated. |
| (a) | Variable rate security. The rate shown represents the rate at September 30, 2022. |
| (b) | Security valued using unobservable inputs. |
| (c) | The rate shown is the effective yield. |
| (d) | Securities issued pursuant to Rule 144A under the Securities Act of 1933 and Regulation S under the Securities Act of 1933. Aggregate value of these securities is $5,362,259 or 25.34% of Fund’s net assets. |
| (e) | Foreign issued security. |
| (f) | Principal amount denominated in Euros. |
| (g) | Principal amount denominated in Swedish Krona. |
| (h) | Principal amount denominated in Norwegian Krone. |
| (i) | Non-income producing security. |
| (j) | Illiquid security. |
| (k) | Seven day yield as of September 30, 2022. |
Definitions:
EURIBOR – Euro-Interbank Offer Rate is a reference rate expressing the average interest rate at which eurozone banks offer unsecured short-term lending on the interbank market.
LIBOR – London Interbank Offer Rate is a benchmark rate at which banks offer to lend funds to one another in the international interbank market for short-term loans.
NIBOR – Norwegian Interbank Offer Rate is a collective term for Norwegian money market rates at different maturities. It is intended to reflect the interest rate level a bank require for unsecured money market lending in Norwegian Krone to another bank.
STIBOR – Stockholm Interbank Offer Rate is a reference rate that shows the average interest rate at which a number of active banks on the Swedish money market are willing to lend to one another, without collateral, at different maturities.
The accompanying notes are an integral part of these financial statements.
CROSSINGBRIDGE RESPONSIBLE CREDIT FUND
| Schedule of Forward Currency Exchange Contracts |
September 30, 2022
| | |
| | Currency | | USD Value at | | Currency | | USD Value at | | | Unrealized | |
| Settlement | | Counter- | to be | | September 30, | | to be | | September 30, | | | Appreciation/ | |
| Date | | party | Delivered | | 2022 | | Received | | 2022 | | | (Depreciation) | |
| 10/14/22 | | U.S. Bank | 3,521,750 EUR | | $ | 3,454,874 | | 3,519,481 USD | | $ | 3,519,481 | | | $ | 64,607 | |
| 10/14/22 | | U.S. Bank | 3,500,000 NOK | | | 321,453 | | 333,333 USD | | | 333,333 | | | | 11,880 | |
| 10/14/22 | | U.S. Bank | 5,214,000 SEK | | | 470,123 | | 497,909 USD | | | 497,908 | | | | 27,785 | |
| | | | | | | $ | 4,246,450 | | | | $ | 4,350,722 | | | $ | 104,272 | |
EUR – Euro
NOK – Norwegian Krone
SEK – Swedish Krona
USD – U.S. Dollars
The accompanying notes are an integral part of these financial statements.
CROSSINGBRIDGE ULTRA-SHORT DURATION FUND
September 30, 2022
| | | Face | | | | |
| | | Amount† | | | Value | |
| | | | | | | |
| ASSET BACKED SECURITIES – 8.27% | | | | | | |
| | | | | | | |
| Agriculture, Forestry, Fishing and Hunting – 2.91% | | | | | | |
Arm Master Trust LLC Series | | | | | | |
2022-T1 Agricultural Loan Backed Notes | | | | | | |
2022-T1, 4.400%, 06/16/2025 (a)(c) | | | 2,000,000 | | | $ | 1,990,626 | |
| | | | | | | | | |
| Finance and Insurance – 2.31% | | | | | | | | |
LendingPoint 2021-A Asset Securitization Trust | | | | | | | | |
A, 1.000%, 12/15/2028 (a) | | | 5,037 | | | | 5,027 | |
LendingPoint 2021-B Asset Securitization Trust | | | | | | | | |
A, 1.110%, 02/15/2029 (a) | | | 203,974 | | | | 201,824 | |
LendingPoint 2022-A Asset Securitization Trust | | | | | | | | |
A, 1.680%, 06/15/2029 (a) | | | 951,242 | | | | 946,234 | |
LendingPoint 2022-B Asset Securitization Trust | | | | | | | | |
2022-B, 4.770%, 10/15/2029 (a) | | | 435,900 | | | | 427,502 | |
| | | | | | | | 1,580,587 | |
| | | | | | | | | |
| Information – 2.55% | | | | | | | | |
SBA Tower Trust | | | | | | | | |
2018-1, 3.448%, 03/15/2048 (a) | | | 1,755,000 | | | | 1,739,386 | |
| | | | | | | | | |
| Transportation and Warehousing – 0.50% | | | | | | | | |
Santander Consumer Auto Receivables Trust 2021-B | | | | | | | | |
B, 1.450%, 10/15/2028 (a) | | | 347,496 | | | | 339,322 | |
| TOTAL ASSET BACKED SECURITIES (Cost $5,693,352) | | | | | | | 5,649,921 | |
| | | | | | | | | |
| | | | | | | | | |
| BANK LOANS – 1.87% | | | | | | | | |
| | | | | | | | | |
| Information – 1.87% | | | | | | | | |
Go Daddy Operating Co. LLC | | | | | | | | |
4.865% (1 Month LIBOR + 1.750%), 02/15/2024 (b) | | | 1,289,621 | | | | 1,278,982 | |
| TOTAL BANK LOANS (Cost $1,282,648) | | | | | | | 1,278,982 | |
| | | | | | | | | |
| | | | | | | | | |
| CONVERTIBLE BONDS – 1.48% | | | | | | | | |
| | | | | | | | | |
| Information – 1.48% | | | | | | | | |
Leafly Holdings, Inc. | | | | | | | | |
8.000%, 01/31/2025 (c)(d) | | | 1,089,000 | | | | 1,012,770 | |
| TOTAL CONVERTIBLE BONDS (Cost $1,089,000) | | | | | | | 1,012,770 | |
The accompanying notes are an integral part of these financial statements.
CROSSINGBRIDGE ULTRA-SHORT DURATION FUND
| Schedule of Investments (Continued) |
September 30, 2022
| | | Face | | | | |
| | | Amount† | | | Value | |
| | | | | | | |
| CORPORATE BONDS – 76.03% | | | | | | |
| | | | | | | |
| Administrative and Support and Waste | | | | | | |
| Management and Remediation Services – 1.46% | | | | | | |
Republic Services, Inc. | | | | | | |
4.750%, 05/15/2023 | | | 1,000,000 | | | $ | 998,908 | |
| | | | | | | | | |
| Agriculture, Forestry, Fishing and Hunting – 0.86% | | | | | | | | |
Cooks Venture, Inc. | | | | | | | | |
2022-2, 5.500%, 01/15/2025 (a) | | | 600,000 | | | | 588,300 | |
| | | | | | | | | |
| Finance and Insurance – 7.28% | | | | | | | | |
Humana, Inc. | | | | | | | | |
2.900%, 12/15/2022 | | | 750,000 | | | | 747,765 | |
Main Street Capital Corp. | | | | | | | | |
4.500%, 12/01/2022 | | | 725,000 | | | | 724,856 | |
Nasdaq, Inc. | | | | | | | | |
0.445%, 12/21/2022 | | | 1,550,000 | | | | 1,534,830 | |
Navient Solutions LLC | | | | | | | | |
0.000%, 10/03/2022 | | | 1,970,000 | | | | 1,970,000 | |
| | | | | | | | 4,977,451 | |
| | | | | | | | | |
| Information – 12.59% | | | | | | | | |
AT&T, Inc. | | | | | | | | |
0.000%, 11/27/2022 | | | 2,000,000 | | | | 1,988,194 | |
Calligo UK Ltd. | | | | | | | | |
9.728% (3 Month EURIBOR + 8.500%), 12/29/2024 (b)(e)(f) | | EUR 400,000 | | | | 381,238 | |
Infor, Inc. | | | | | | | | |
1.450%, 07/15/2023 (a) | | | 2,050,000 | | | | 1,979,136 | |
Linkem S.p.A. | | | | | | | | |
7.193% (3 Month EURIBOR + 6.000%), 11/09/2022 (a)(b)(e)(f) | | EUR 1,721,000 | | | | 1,682,443 | |
Oracle Corp. | | | | | | | | |
2.500%, 10/15/2022 | | | 2,280,000 | | | | 2,278,680 | |
Tigo Energy, Inc. | | | | | | | | |
5.500%, 01/15/2025 (a) | | | 294,000 | | | | 290,411 | |
| | | | | | | | 8,600,102 | |
| | | | | | | | | |
| Manufacturing – 22.08% | | | | | | | | |
AbbVie, Inc. | | | | | | | | |
2.300%, 11/21/2022 | | | 2,235,000 | | | | 2,229,735 | |
Blast Motion, Inc. | | | | | | | | |
5.500%, 02/15/2025 (a) | | | 1,000,000 | | | | 966,100 | |
Broadcom Corp / Broadcom Cayman Finance Ltd. | | | | | | | | |
2.650%, 01/15/2023 | | | 1,000,000 | | | | 994,105 | |
Carlisle Companies, Inc. | | | | | | | | |
3.750%, 11/15/2022 | | | 1,830,000 | | | | 1,829,939 | |
The accompanying notes are an integral part of these financial statements.
CROSSINGBRIDGE ULTRA-SHORT DURATION FUND
| Schedule of Investments (Continued) |
September 30, 2022
| | | Face | | | | |
| | | Amount† | | | Value | |
| | | | | | | |
| CORPORATE BONDS – 76.03% (CONTINUED) | | | | | | |
| | | | | | | |
| Manufacturing – 22.08% (Continued) | | | | | | |
Columbia Care, Inc. | | | | | | |
13.000%, 05/14/2024 (e) | | | 1,026,000 | | | $ | 1,026,000 | |
9.500%, 02/03/2026 (e) | | | 2,016,000 | | | | 2,008,208 | |
General Electric Co. | | | | | | | | |
3.100%, 01/09/2023 | | | 856,000 | | | | 853,311 | |
Graphic Packaging International LLC | | | | | | | | |
4.875%, 11/15/2022 | | | 650,000 | | | | 649,969 | |
Hewlett Packard Enterprise Co. | | | | | | | | |
2.250%, 04/01/2023 | | | 1,250,000 | | | | 1,235,984 | |
HP, Inc. | | | | | | | | |
4.750%, 03/01/2029 (a) | | | 1,107,000 | | | | 1,114,231 | |
International Business Machines Corp. | | | | | | | | |
2.875%, 11/09/2022 | | | 688,000 | | | | 687,144 | |
Microchip Technology, Inc. | | | | | | | | |
4.333%, 06/01/2023 | | | 1,500,000 | | | | 1,493,280 | |
| | | | | | | | 15,088,006 | |
| | | | | | | | | |
| Mining, Quarrying, and Oil and Gas Extraction – 5.39% | | | | | | | | |
Glencore Funding LLC | | | | | | | | |
4.125%, 05/30/2023 (a) | | | 1,000,000 | | | | 995,040 | |
Mosaic Co. | | | | | | | | |
3.250%, 11/15/2022 | | | 2,260,000 | | | | 2,257,392 | |
Schlumberger Holdings Corp. | | | | | | | | |
3.625%, 12/21/2022 (a) | | | 427,000 | | | | 426,956 | |
| | | | | | | | 3,679,388 | |
| | | | | | | | | |
| Professional, Scientific, and Technical Services – 1.20% | | | | | | | | |
Getty Images, Inc. | | | | | | | | |
9.750%, 03/01/2027 (a) | | | 827,000 | | | | 822,348 | |
| | | | | | | | | |
| Real Estate and Rental and Leasing – 5.82% | | | | | | | | |
Exterran Energy Solutions LP / EES Finance Corp. | | | | | | | | |
8.125%, 05/01/2025 | | | 2,467,000 | | | | 2,500,477 | |
REX – Real Estate Exchange, Inc. | | | | | | | | |
6.000%, 03/15/2025 (a) | | | 1,500,000 | | | | 1,476,000 | |
| | | | | | | | 3,976,477 | |
| | | | | | | | | |
| Retail Trade – 6.77% | | | | | | | | |
AutoZone, Inc. | | | | | | | | |
2.875%, 01/15/2023 | | | 1,000,000 | | | | 995,134 | |
Dollar General Corp. | | | | | | | | |
3.250%, 04/15/2023 | | | 2,382,000 | | | | 2,379,658 | |
The accompanying notes are an integral part of these financial statements.
CROSSINGBRIDGE ULTRA-SHORT DURATION FUND
| Schedule of Investments (Continued) |
September 30, 2022
| | | Face | | | | |
| | | Amount† | | | Value | |
| | | | | | | |
| CORPORATE BONDS – 76.03% (CONTINUED) | | | | | | |
| | | | | | | |
| Retail Trade – 6.77% (Continued) | | | | | | |
eBay, Inc. | | | | | | |
3.676% (3 Month LIBOR + 0.870%), 01/30/2023 (b) | | | 1,250,000 | | | $ | 1,250,928 | |
| | | | | | | | 4,625,720 | |
| | | | | | | | | |
| Transportation and Warehousing – 9.29% | | | | | | | | |
DCP Midstream Operating LP | | | | | | | | |
3.875%, 03/15/2023 | | | 1,417,000 | | | | 1,400,974 | |
Golar LNG Ltd. | | | | | | | | |
7.000%, 10/20/2025 (e) | | | 1,856,000 | | | | 1,760,880 | |
PBF Logistics LP / PBF Logistics Finance Corp. | | | | | | | | |
6.875%, 05/15/2023 | | | 886,000 | | | | 885,167 | |
Royal Caribbean Cruises Ltd. | | | | | | | | |
10.875%, 06/01/2023 (a)(e) | | | 2,249,000 | | | | 2,301,008 | |
| | | | | | | | 6,348,029 | |
| | | | | | | | | |
| Wholesale Trade – 3.29% | | | | | | | | |
Martin Midstream Partners LP / Martin Midstream Finance Corp. | | | | | | | | |
10.000%, 02/29/2024 (a) | | | 1,262,000 | | | | 1,268,872 | |
McKesson Corp. | | | | | | | | |
2.700%, 12/15/2022 | | | 983,000 | | | | 980,895 | |
| | | | | | | | 2,249,767 | |
| TOTAL CORPORATE BONDS (Cost $52,637,016) | | | | | | | 51,954,496 | |
| | | | | | | | | |
| | | | | | | | | |
| MUNICIPAL BONDS – 4.38% | | | | | | | | |
| | | | | | | | | |
| Public Administration – 4.38% | | | | | | | | |
New Hampshire Business Finance Authority | | | | | | | | |
2.950%, 04/01/2024 | | | 3,000,000 | | | | 2,995,695 | |
| TOTAL MUNICIPAL BONDS (Cost $3,000,000) | | | | | | | 2,995,695 | |
| | | | | | | | | |
| | | | | | | | | |
| PREFERRED STOCKS – 3.98% | | | | | | | | |
| | | | | | | | | |
| Finance and Insurance – 3.98% | | | | | | | | |
CoBank ACB | | | | | | | | |
6.250%, No stated maturity | | | 23,000 | | | | 2,300,000 | |
Reinsurance Group of America, Inc. | | | | | | | | |
6.200%, 09/15/2042 | | | 16,577 | | | | 418,072 | |
| TOTAL PREFERRED STOCKS (Cost $2,744,493) | | | | | | | 2,718,072 | |
| | | | | | | | | |
| | | | | | | | | |
| RIGHTS – 0.01% | | | | | | | | |
Feutune Light Acquisition Corp. (g) | | | 103,600 | | | | 7,770 | |
| TOTAL RIGHTS (Cost $5,171) | | | | | | | 7,770 | |
The accompanying notes are an integral part of these financial statements.
CROSSINGBRIDGE ULTRA-SHORT DURATION FUND
| Schedule of Investments (Continued) |
September 30, 2022
| | | Number | | | | |
| | | of Shares | | | Value | |
| | | | | | | |
| SPECIAL PURPOSE ACQUISITION COMPANIES – 2.63% | | | | | | |
Berenson Acquisition Corp. Founder Shares (c)(d)(g) | | | 1,827 | | | $ | 93 | |
BGP Acquisition Corp. (e)(g) | | | 50,000 | | | | 492,000 | |
Carney Technology Acquisition Corp. II (g) | | | 27,045 | | | | 269,098 | |
Feutune Light Acquisition Corp. (g) | | | 103,600 | | | | 1,032,374 | |
| TOTAL SPECIAL PURPOSE ACQUISITION COMPANIES | | | | | | | | |
| (Cost $1,777,244) | | | | | | | 1,793,565 | |
| | | | | | | | | |
| | | | | | | | | |
| WARRANTS – 0.01% | | | | | | | | |
Feutune Light Acquisition Corp. (g) | | | | | | | | |
Expiration: 06/01/2029, Exercise Price: $11.50 | | | 103,600 | | | | 4,558 | |
Leafly Holdings, Inc. (g) | | | | | | | | |
Expiration: 11/07/2026, Exercise Price: $11.50 | | | 5,553 | | | | 943 | |
| TOTAL WARRANTS (Cost $1,634) | | | | | | | 5,501 | |
| | | | | | | | | |
| | | | | | | | | |
| MONEY MARKET FUNDS – 5.04% | | | | | | | | |
First American Treasury Obligations | | | | | | | | |
Fund – Class X, 2.875% (h) | | | 3,443,487 | | | | 3,443,487 | |
| TOTAL MONEY MARKET FUNDS (Cost $3,443,487) | | | | | | | 3,443,487 | |
Total Investments (Cost $71,674,045) – 103.70% | | | | | | | 70,860,259 | |
Liabilities in Excess of Other Assets – (3.70)% | | | | | | | (2,527,259 | ) |
| Total Net Assets – 100.00% | | | | | | $ | 68,333,000 | |
Percentages are stated as a percent of net assets.
| † | Face amount in U.S. Dollar unless otherwise indicated. |
| (a) | Securities issued pursuant to Rule 144A under the Securities Act of 1933 and Regulation S under the Securities Act of 1933. Aggregate value of these securities is $19,560,766 or 28.63% of Fund’s net assets. |
| (b) | Variable rate security. The rate shown represents the rate at September 30, 2022. |
| (c) | Security valued using unobservable inputs. |
| (d) | Illiquid security. |
| (e) | Foreign issued security. |
| (f) | Principal amount denominated in Euros. |
| (g) | Non-income producing security. |
| (h) | Seven day yield as of September 30, 2022. |
Definitions:
EURIBOR – Euro-Interbank Offer Rate is a reference rate expressing the average interest rate at which eurozone banks offer unsecured short-term lending on the interbank market.
LIBOR – London Interbank Offer Rate is a benchmark rate at which banks offer to lend funds to one another in the international interbank market for short-term loans.
The accompanying notes are an integral part of these financial statements.
CROSSINGBRIDGE ULTRA-SHORT DURATION FUND
| Schedule of Forward Currency Exchange Contracts |
September 30, 2022
| | | Currency | USD Value at | Currency | USD Value at | Unrealized |
| Settlement | Counter- | to be | September 30, | to be | September 30, | Appreciation/ |
Date | party | Delivered | 2022 | Received | 2022 | (Depreciation) |
| 10/14/22 | U.S. Bank | 2,136,000 EUR | $2,095,438 | 2,168,061 USD | $2,168,061 | $72,623 |
EUR – Euro
USD – U.S. Dollars
The accompanying notes are an integral part of these financial statements.
CROSSINGBRIDGE PRE-MERGER SPAC ETF
September 30, 2022
| | | Number of | | | | |
| | | Shares | | | Value | |
| SPECIAL PURPOSE ACQUISITION COMPANIES – 97.96% | | | | | | |
10X Capital Venture Acquisition Corp. II (a)(b) | | | 3,864 | | | $ | 38,659 | |
10X Capital Venture Acquisition Corp. III (a)(b) | | | 50,798 | | | | 513,060 | |
26 Capital Acquisition Corp. (b) | | | 1,758 | | | | 17,351 | |
A SPAC I Acquisition Corp. (a)(b) | | | 98,318 | | | | 986,130 | |
Accelerate Acquisition Corp. (b) | | | 19,786 | | | | 194,595 | |
Aequi Acquisition Corp. (b) | | | 122,197 | | | | 1,220,748 | |
African Gold Acquisition Corp. (a)(b) | | | 57,421 | | | | 568,468 | |
Agile Growth Corp. (a)(b) | | | 99,034 | | | | 983,408 | |
Ahren Acquisition Corp. (a)(b) | | | 4,655 | | | | 46,853 | |
AltEnergy Acquisition Corp. (b) | | | 29,630 | | | | 296,596 | |
Anthemis Digital Acquisitions I Corp. (a)(b) | | | 11,280 | | | | 113,928 | |
Anzu Special Acquisition Corp. I (b) | | | 1,527 | | | | 15,010 | |
AP Acquisition Corp. (a)(b) | | | 18,884 | | | | 191,673 | |
Apeiron Capital Investment Corp. (b) | | | 7,864 | | | | 79,151 | |
Apollo Strategic Growth Capital II (a)(b) | | | 98,318 | | | | 970,399 | |
Arbor Rapha Capital Bioholdings Corp. I (b) | | | 17,649 | | | | 178,608 | |
Arena Fortify Acquisition Corp. (b) | | | 7,773 | | | | 78,313 | |
Ares Acquisition Corp. (a)(b) | | | 29,709 | | | | 295,010 | |
Atlantic Avenue Acquisition Corp. (b) | | | 16,050 | | | | 161,030 | |
Atlantic Coastal Acquisition Corp. II (b) | | | 38,866 | | | | 389,437 | |
Atlas Crest Investment Corp. II (b) | | | 19,792 | | | | 195,050 | |
Ault Disruptive Technologies Corp. (b) | | | 23,318 | | | | 235,162 | |
Avalon Acquisition, Inc. (b) | | | 26,175 | | | | 262,012 | |
Banner Acquisition Corp. (b) | | | 49,108 | | | | 487,151 | |
Banyan Acquisition Corp. (b) | | | 73,738 | | | | 736,643 | |
Battery Future Acquisition Corp. (a)(b) | | | 10,279 | | | | 103,702 | |
Beard Energy Transition Acquisition Corp. (b) | | | 12,290 | | | | 123,514 | |
Berenson Acquisition Corp. Founder Shares (b)(c)(d) | | | 922 | | | | 47 | |
BGP Acquisition Corp. (a)(b) | | | 123,794 | | | | 1,218,133 | |
BioPlus Acquisition Corp. (a)(b) | | | 19,664 | | | | 197,328 | |
bleuacacia Ltd. (a)(b) | | | 98,318 | | | | 969,907 | |
Blockchain Moon Acquisition Corp. (b) | | | 25,413 | | | | 253,622 | |
Bridgetown Holdings Ltd. (a)(b) | | | 79,568 | | | | 798,067 | |
Brigade-M3 European Acquisition Corp. (a)(b) | | | 75,515 | | | | 736,271 | |
Bright Lights Acquisition Corp. (b) | | | 39,613 | | | | 392,565 | |
Broad Capital Acquisition Corp. (b) | | | 51,291 | | | | 512,910 | |
Bullpen Parlay Acquisition Co. (a)(b) | | | 35,713 | | | | 359,987 | |
C5 Acquisition Corp. (b) | | | 73,202 | | | | 734,216 | |
Cactus Acquisition Corp. 1 Ltd. (a)(b) | | | 1,209 | | | | 12,175 | |
Canna-Global Acquisition Corp. (b) | | | 14,984 | | | | 151,788 | |
Carney Technology Acquisition Corp. II (b) | | | 14,568 | | | | 144,952 | |
Cartesian Growth Corp. (a)(b) | | | 13,014 | | | | 128,969 | |
Cartica Acquisition Corp. (a)(b) | | | 49,158 | | | | 496,742 | |
The accompanying notes are an integral part of these financial statements.
CROSSINGBRIDGE PRE-MERGER SPAC ETF
| Schedule of Investments (Continued) |
September 30, 2022
| | | Number of | | | | |
| | | Shares | | | Value | |
| SPECIAL PURPOSE ACQUISITION | | | | | | |
| COMPANIES – 97.96% (CONTINUED) | | | | | | |
CC Neuberger Principal Holdings III (a)(b) | | | 65,189 | | | $ | 647,327 | |
Churchill Capital Corp. V (b) | | | 8,676 | | | | 85,892 | |
Churchill Capital Corp. VII (b) | | | 24,973 | | | | 245,485 | |
Clarim Acquisition Corp. (b) | | | 41,348 | | | | 408,932 | |
Colicity, Inc. (b) | | | 103,546 | | | | 1,018,893 | |
Compute Health Acquisition Corp. (b) | | | 19,762 | | | | 195,051 | |
Conx Corp. (b) | | | 29,496 | | | | 294,960 | |
Corner Growth Acquisition Corp. (a)(b) | | | 25,417 | | | | 253,407 | |
COVA Acquisition Corp. (a)(b) | | | 89,789 | | | | 892,503 | |
Crescera Capital Acquisition Corp. (a)(b) | | | 14,748 | | | | 148,070 | |
Crown PropTech Acquisitions (a)(b) | | | 148,551 | | | | 1,473,626 | |
Crypto 1 Acquisition Corp. (a)(b) | | | 12,962 | | | | 130,138 | |
DP Cap Acquisition Corp. I (a)(b) | | | 14,748 | | | | 148,807 | |
DTRT Health Acquisition Corp. (b) | | | 49,997 | | | | 508,469 | |
Edify Acquisition Corp. (b) | | | 34,410 | | | | 340,315 | |
Elliott Opportunity II Corp. (a)(b) | | | 52,506 | | | | 516,659 | |
Empowerment & Inclusion Capital I Corp. (b) | | | 29,670 | | | | 293,140 | |
Enphys Acquisition Corp. (a)(b) | | | 3,340 | | | | 32,582 | |
Enterprise 4.0 Technology Acquisition Corp. (a)(b) | | | 18,093 | | | | 182,739 | |
Epiphany Technology Acquisition Corp. (b) | | | 1,527 | | | | 15,087 | |
ESGEN Acquisition Corp. (a)(b) | | | 3,140 | | | | 31,871 | |
ESM Acquisition Corp. (a)(b) | | | 98,655 | | | | 978,658 | |
EVe Mobility Acquisition Corp. (a)(b) | | | 13,663 | | | | 137,860 | |
Everest Consolidator Acquisition Corp. (b) | | | 10,356 | | | | 104,078 | |
Financials Acquisition Corp. (a)(b)(e) | | | 17,382 | | | | 193,593 | |
Finnovate Acquisition Corp. (a)(b) | | | 17,649 | | | | 178,255 | |
Flame Acquisition Corp. (b) | | | 7,810 | | | | 76,772 | |
Focus Impact Acquisition Corp. (b) | | | 8,375 | | | | 83,917 | |
Forest Road Acquisition Corp. II (b) | | | 1,527 | | | | 15,010 | |
FTAC Hera Acquisition Corp. (a)(b) | | | 29,315 | | | | 290,951 | |
FutureTech II Acquisition Corp. (b) | | | 11,154 | | | | 112,098 | |
G Squared Ascend I, Inc. (a)(b) | | | 10,231 | | | | 101,543 | |
G&P Acquisition Corp. (b) | | | 12,579 | | | | 125,664 | |
Games & Esports Experience Acquisition Corp. (a)(b) | | | 14,748 | | | | 149,766 | |
Genesis Growth Tech Acquisition Corp. (a)(b) | | | 24,580 | | | | 248,750 | |
Glenfarne Merger Corp. (b) | | | 2,118 | | | | 20,778 | |
Global Technology Acquisition Corp. I (a)(b) | | | 12,733 | | | | 128,667 | |
Goal Acquisitions Corp. (b) | | | 19,780 | | | | 194,833 | |
GoGreen Investments Corp. (a)(b) | | | 3,062 | | | | 31,049 | |
GP Bullhound Acquisition I SE (a)(b)(f) | | | 74,277 | | | | 723,581 | |
Group Nine Acquisition Corp. (b) | | | 7,817 | | | | 77,310 | |
GSR II Meteora Acquisition Corp. (b) | | | 38,911 | | | | 386,192 | |
| | | | | | | | | |
The accompanying notes are an integral part of these financial statements.
CROSSINGBRIDGE PRE-MERGER SPAC ETF
| Schedule of Investments (Continued) |
September 30, 2022
| | | Number of | | | | |
| | | Shares | | | Value | |
| SPECIAL PURPOSE ACQUISITION | | | | | | |
| COMPANIES – 97.96% (CONTINUED) | | | | | | |
Hamilton Lane Alliance Holdings I, Inc. (b) | | | 58,826 | | | $ | 581,789 | |
HCM Acquisition Corp. (a)(b) | | | 44,242 | | | | 446,844 | |
Health Assurance Acquisition Corp. (b) | | | 5,197 | | | | 51,866 | |
Healthcare Services Acquisition Corp. (b) | | | 16,051 | | | | 159,547 | |
Heartland Media Acquisition Corp. (b) | | | 38,866 | | | | 388,271 | |
HH&L Acquisition Co. (a)(b) | | | 1,527 | | | | 15,178 | |
HIG Acquisition Corp. (a)(b) | | | 98,679 | | | | 989,750 | |
Highland Transcend Partners I Corp. (a)(b) | | | 29,943 | | | | 298,232 | |
Hiro Metaverse Acquisitions I SA (a)(b)(e) | | | 44,565 | | | | 498,832 | |
Hudson Executive Investment Corp. II (b) | | | 2,901 | | | | 28,633 | |
Hudson Executive Investment Corp. III (b) | | | 4,990 | | | | 49,127 | |
Hunt Companies Acquisition Corp. I (a)(b) | | | 8,826 | | | | 89,584 | |
Ibere Pharmaceuticals (a)(b) | | | 69,325 | | | | 687,011 | |
Iconic Sports Acquisition Corp. (a)(b) | | | 138,623 | | | | 1,407,717 | |
Ignyte Acquisition Corp. (b) | | | 8,676 | | | | 86,673 | |
Independence Holdings Corp. (a)(b) | | | 106,938 | | | | 1,060,825 | |
Infinite Acquisition Corp. (a)(b) | | | 27,531 | | | | 274,897 | |
InFinT Acquisition Corp. (a)(b) | | | 14,856 | | | | 150,640 | |
Innovative International Acquisition Corp. (a)(b) | | | 9,382 | | | | 95,133 | |
Integral Acquisition Corp. 1 (b) | | | 2,605 | | | | 25,842 | |
Investcorp Europe Acquisition Corp. I (a)(b) | | | 31,091 | | | | 315,263 | |
Iron Spark I, Inc. | | | 39,822 | | | | 394,238 | |
Itiquira Acquisition Corp. (a)(b) | | | 21,718 | | | | 215,877 | |
Jackson Acquisition Co. (b) | | | 29,496 | | | | 294,370 | |
Jaguar Global Growth Corp. I (a)(b) | | | 48,466 | | | | 483,691 | |
JOFF Fintech Acquisition Corp. (b) | | | 7,811 | | | | 76,938 | |
Kismet Acquisition Two Corp. (a)(b) | | | 57,579 | | | | 571,759 | |
KnightSwan Acquisition Corp. (b) | | | 13,368 | | | | 133,881 | |
LAVA Medtech Acquisition Corp. (b) | | | 8,430 | | | | 84,806 | |
Lazard Growth Acquisition Corp. I (a)(b) | | | 134,140 | | | | 1,330,669 | |
Lefteris Acquisition Corp. (b) | | | 7,817 | | | | 78,170 | |
Legato Merger Corp. II (b) | | | 26,025 | | | | 258,558 | |
Leo Holdings Corp. II (a)(b) | | | 4,916 | | | | 48,963 | |
LF Capital Acquisition Corp. II (b) | | | 5,187 | | | | 52,129 | |
Lionheart III Corp. (b) | | | 2,881 | | | | 29,069 | |
Live Oak Mobility Acquisition Corp. (b) | | | 1,527 | | | | 15,010 | |
M3-Brigade Acquisition II Corp. (b) | | | 3,955 | | | | 38,799 | |
M3-Brigade Acquisition III Corp. (b) | | | 13,177 | | | | 132,956 | |
Macondray Capital Acquisition Corp. I (a)(b) | | | 10,304 | | | | 103,349 | |
Mason Industrial Technology, Inc. (b) | | | 16,166 | | | | 158,427 | |
McLaren Technology Acquisition Corp. (b) | | | 3,842 | | | | 38,727 | |
MedTech Acquisition Corp. (b) | | | 69,269 | | | | 687,841 | |
The accompanying notes are an integral part of these financial statements.
CROSSINGBRIDGE PRE-MERGER SPAC ETF
| Schedule of Investments (Continued) |
September 30, 2022
| | | Number of | | | | |
| | | Shares | | | Value | |
| SPECIAL PURPOSE ACQUISITION | | | | | | |
| COMPANIES – 97.96% (CONTINUED) | | | | | | |
Mercato Partners Acquisition Corp. (b) | | | 14,146 | | | $ | 141,460 | |
Mercury Ecommerce Acquisition Corp. (b) | | | 48,948 | | | | 488,012 | |
Mission Advancement Corp. (b) | | | 1,264 | | | | 12,412 | |
New Vista Acquisition Corp. (a)(b) | | | 2,901 | | | | 28,836 | |
NewHold Investment Corp. II (b) | | | 122,896 | | | | 1,211,140 | |
NightDragon Acquisition Corp. (b) | | | 58,124 | | | | 570,778 | |
North Mountain Merger Corp. (b) | | | 1,490 | | | | 14,960 | |
Northern Star Investment Corp. III (b) | | | 2,901 | | | | 28,560 | |
OceanTech Acquisitions I Corp. (b) | | | 2,600 | | | | 26,520 | |
OmniLit Acquisition Corp. (b) | | | 10,056 | | | | 101,364 | |
One Equity Partners Open Water I Corp. (b) | | | 8,290 | | | | 81,822 | |
Onyx Acquisition Co. I (a)(b) | | | 41,832 | | | | 423,967 | |
Orion Acquisition Corp. (b) | | | 1,527 | | | | 15,026 | |
Oxus Acquisition Corp. (a)(b) | | | 7,817 | | | | 79,147 | |
Oyster Enterprises Acquisition Corp. (b) | | | 15,817 | | | | 156,272 | |
Papaya Growth Opportunity Corp. I (b) | | | 73,738 | | | | 739,592 | |
Parabellum Acquisition Corp. Founder Shares (b)(c)(d) | | | 2,299 | | | | 83 | |
Pathfinder Acquisition Corp. (a)(b) | | | 8,101 | | | | 80,524 | |
Pearl Holdings Acquisition Corp. (a)(b) | | | 15,203 | | | | 152,410 | |
PepperLime Health Acquisition Corp. (a)(b) | | | 2,605 | | | | 26,024 | |
Perception Capital Corp. II (a)(b) | | | 4,419 | | | | 44,941 | |
Peridot Acquisition Corp. II (a)(b) | | | 35,367 | | | | 350,664 | |
Pioneer Merger Corp. (a)(b) | | | 4,400 | | | | 43,824 | |
Pivotal Investment Corp. III (b) | | | 20,039 | | | | 197,484 | |
Plum Acquisition Corp. I (a)(b) | | | 3,345 | | | | 33,199 | |
Pontem Corp. (a)(b) | | | 20,119 | | | | 199,983 | |
Population Health Investment Co, Inc. (a)(b) | | | 9,838 | | | | 98,282 | |
PowerUp Acquisition Corp. (a)(b) | | | 11,950 | | | | 121,173 | |
Primavera Capital Acquisition Corp. (a)(b) | | | 6,790 | | | | 67,561 | |
Project Energy Reimagined Acquisition Corp. (a)(b) | | | 785 | | | | 7,732 | |
PROOF Acquisition Corp. I (b) | | | 9,709 | | | | 96,993 | |
Property Solutions Acquisition Corp. II (b) | | | 2,901 | | | | 28,531 | |
PropTech Investment Corp. II (b) | | | 52,596 | | | | 523,330 | |
Pyrophyte Acquisition Corp. (a)(b) | | | 10,845 | | | | 110,106 | |
RCF Acquisition Corp. (a)(b) | | | 5,187 | | | | 52,337 | |
Recharge Acquisition Corp. (b) | | | 2,585 | | | | 26,147 | |
Redwoods Acquisition Corp. (b) | | | 5,827 | | | | 57,862 | |
Relativity Acquisition Corp. (b) | | | 58,269 | | | | 585,895 | |
Revelstone Capital Acquisition Corp. (b) | | | 24,395 | | | | 241,998 | |
Revelstone Capital Acquisition Corp. Founder Shares (b)(c)(d) | | | 6,000 | | | | 601 | |
RMG Acquisition Corp. III (a)(b) | | | 11,910 | | | | 118,505 | |
Rose Hill Acquisition Corp. (a)(b) | | | 17,649 | | | | 179,314 | |
The accompanying notes are an integral part of these financial statements.
CROSSINGBRIDGE PRE-MERGER SPAC ETF
| Schedule of Investments (Continued) |
September 30, 2022
| | | Number of | | | | |
| | | Shares | | | Value | |
| SPECIAL PURPOSE ACQUISITION | | | | | | |
| COMPANIES – 97.96% (CONTINUED) | | | | | | |
Schultze Special Purpose Acquisition Corp. II (b) | | | 2,734 | | | $ | 27,176 | |
ScION Tech Growth I (a)(b) | | | 4,115 | | | | 41,047 | |
Seaport Global Acquisition II Corp. (b) | | | 24,580 | | | | 246,415 | |
Semper Paratus Acquisition Corp. (a)(b) | | | 8,228 | | | | 83,596 | |
Senior Connect Acquisition Corp. I (b) | | | 53,200 | | | | 529,340 | |
ShoulderUp Technology Acquisition Corp. (b) | | | 14,748 | | | | 148,144 | |
Silver Spike Acquisition Corp. II (a)(b) | | | 23,958 | | | | 237,663 | |
Silver Spike III Acquisition Corp. (a)(b) | | | 99,134 | | | | 1,006,210 | |
Sizzle Acquisition Corp. (b) | | | 9,302 | | | | 93,671 | |
Slam Corp. (a)(b) | | | 3,345 | | | | 33,149 | |
Social Leverage Acquisition Corp. I (b) | | | 47,894 | | | | 470,798 | |
Spindletop Health Acquisition Corp. (b) | | | 32,604 | | | | 328,322 | |
SportsMap Tech Acquisition Corp. (b) | | | 2,665 | | | | 26,677 | |
SportsTek Acquisition Corp. (b) | | | 4,916 | | | | 48,398 | |
Spree Acquisition Corp. 1 Ltd. (a)(b) | | | 49,158 | | | | 496,987 | |
ST Energy Transition I Ltd. (a)(b) | | | 10,356 | | | | 103,871 | |
Supernova Partners Acquisition Co III Ltd. (a)(b) | | | 99,517 | | | | 985,716 | |
Sustainable Development Acquisition I Corp. (b) | | | 2,605 | | | | 25,685 | |
SVF Investment Corp. (a)(b) | | | 31,849 | | | | 317,216 | |
Tailwind International Acquisition Corp. (a)(b) | | | 89,050 | | | | 883,376 | |
Talon 1 Acquisition Corp. (a)(b) | | | 17,649 | | | | 179,843 | |
Target Global Acquisition I Corp. (a)(b) | | | 24,580 | | | | 246,906 | |
Tastemaker Acquisition Corp. (b) | | | 2,536 | | | | 25,309 | |
TB SA Acquisition Corp. (a)(b) | | | 49,158 | | | | 486,664 | |
TCW Special Purpose Acquisition Corp. (b) | | | 24,973 | | | | 244,985 | |
Tech and Energy Transition Corp. (b) | | | 3,345 | | | | 32,982 | |
Thrive Acquisition Corp. (a)(b) | | | 12,733 | | | | 129,240 | |
Tishman Speyer Innovation Corp. II (b) | | | 105,113 | | | | 1,035,363 | |
TKB Critical Technologies 1 (a)(b) | | | 11,727 | | | | 118,912 | |
Trine II Acquisition Corp. (a)(b) | | | 18,093 | | | | 181,382 | |
two (a)(b) | | | 86,766 | | | | 858,281 | |
Vector Acquisition Corp. II (a)(b) | | | 141,013 | | | | 1,398,849 | |
VMG Consumer Acquisition Corp. (b) | | | 6,554 | | | | 65,737 | |
Warburg Pincus Capital Corp. I-A (a)(b) | | | 49,748 | | | | 493,500 | |
Western Acquisition Ventures Corp. (b) | | | 42,136 | | | | 420,517 | |
Williams Rowland Acquisition Corp. (b) | | | 39,434 | | | | 397,495 | |
Worldwide Webb Acquisition Corp. (a)(b) | | | 26,124 | | | | 261,240 | |
| TOTAL SPECIAL PURPOSE ACQUISITION COMPANIES | | | | | | | | |
| (Cost $61,527,569) | | | | | | | 62,018,532 | |
The accompanying notes are an integral part of these financial statements.
CROSSINGBRIDGE PRE-MERGER SPAC ETF
| Schedule of Investments (Continued) |
September 30, 2022
| | | Number of | | | | |
| | | Shares | | | Value | |
| | | | | | | |
| RIGHTS – 0.05% | | | | | | |
A SPAC I Acquisition Corp. (a)(b) | | | 100,000 | | | $ | 12,000 | |
Broad Capital Acquisition Corp. (b) | | | 100,000 | | | | 10,000 | |
Jaguar Global Growth Corp. I (a)(b) | | | 50,000 | | | | 7,200 | |
Redwoods Acquisition Corp. (b) | | | 11,250 | | | | 928 | |
ROC Energy Acquisition Corp. (b) | | | 5,514 | | | | 441 | |
| TOTAL RIGHTS (Cost $34,722) | | | | | | | 30,569 | |
| | | | | | | | | |
| | | | | | | | | |
| WARRANTS – 0.04% | | | | | | | | |
Brigade-M3 European Acquisition Corp. (a)(b) | | | | | | | | |
Expiration: 01/17/2027, Exercise Price: $11.50 | | | 38,125 | | | | 4,194 | |
Canna-Global Acquisition Corp. (b) | | | | | | | | |
Expiration: 11/30/2026, Exercise Price: $11.50 | | | 6,980 | | | | 175 | |
Financials Acquisition Corp. (a)(b)(e) | | | | | | | | |
Expiration: 04/04/2027, Exercise Price: $11.50 | | | 8,777 | | | | 392 | |
GP Bullhound Acquisition I SE (a)(b)(f) | | | | | | | | |
Expiration: 03/11/2027, Exercise Price: $11.50 | | | 37,500 | | | | 9,188 | |
Hambro Perks Acquisition Corp. (a)(b)(e) | | | | | | | | |
Expiration: 01/07/2026, Exercise Price: $11.50 | | | 37,500 | | | | 4,396 | |
Hiro Metaverse Acquisitions I SA (a)(b)(e) | | | | | | | | |
Expiration: 12/21/2026, Exercise Price: $11.50 | | | 22,500 | | | | 3,894 | |
OmniLit Acquisition Corp. (b) | | | | | | | | |
Expiration: 11/08/2026, Exercise Price: $11.50 | | | 3,714 | | | | 457 | |
Spindletop Health Acquisition Corp. (b) | | | | | | | | |
Expiration: 12/31/2028, Exercise Price: $11.50 | | | 16,354 | | | | 990 | |
| TOTAL WARRANTS (Cost $38,645) | | | | | | | 23,686 | |
| | | | | | | | | |
| | | | | | | | | |
| MONEY MARKET FUNDS – 2.07% | | | | | | | | |
First American Treasury Obligations | | | | | | | | |
Fund – Class X, 2.875% (g) | | | 1,313,033 | | | | 1,313,033 | |
| TOTAL MONEY MARKET FUNDS (Cost $1,313,033) | | | | | | | 1,313,033 | |
Total Investments (Cost $62,913,969) – 100.12% | | | | | | | 63,385,820 | |
Liabilities in Excess of Other Assets – (0.12)% | | | | | | | (74,289 | ) |
| Total Net Assets – 100.00% | | | | | | $ | 63,311,531 | |
Percentages are stated as a percent of net assets.
| (a) | Foreign issued security. |
| (b) | Non-income producing security. |
| (c) | Illiquid security. |
| (d) | Security valued using unobservable inputs. |
| (e) | Holding denominated in British Pounds. |
| (f) | Holding denominated in Euros. |
| (g) | Seven day yield as of September 30, 2022. |
The accompanying notes are an integral part of these financial statements.
CROSSINGBRIDGE PRE-MERGER SPAC ETF
| Schedule of Forward Currency Exchange Contracts |
September 30, 2022
| |
| | | | Currency | | USD Value at | | Currency | | USD Value at | | | Unrealized | |
| Settlement | | Counter- | | to be | | September 30, | | to be | | September 30, | | | Appreciation/ | |
| Date | | party | | Delivered | | 2022 | | Received | | 2022 | | | (Depreciation) | |
| 10/14/22 | | U.S. Bank | | 761,250 EUR | | $ | 746,794 | | 772,676 USD | | $ | 772,676 | | | $ | 25,882 | |
| 10/14/22 | | U.S. Bank | | 630,900 GBP | | | 704,650 | | 738,374 USD | | | 738,374 | | | | 33,724 | |
| | | | | |
| | $
| 1,451,444 | | | | $ | 1,511,050 | | | $ | 59,606 | |
EUR – Euro
GBP – British Pound
USD – U.S. Dollars
The accompanying notes are an integral part of these financial statements.
CROSSINGBRIDGE FUNDS
| Statements of Assets and Liabilities |
September 30, 2022
| | | CrossingBridge | | | CrossingBridge | |
| | | Low Duration High | | | Responsible | |
| | | Yield Fund | | | Credit Fund | |
| ASSETS | | | | | | |
| Investments, at value | | | | | | |
| (cost $586,080,101 and $22,904,563) | | $ | 561,838,812 | | | $ | 21,933,693 | |
| Cash | | | 244,427 | | | | 567,333 | |
| Cash held in foreign currency, at value | | | | | | | | |
| (cost $904,831 and $22,466) | | | 908,742 | | | | 22,478 | |
| Receivable for investment securities sold | | | 8,255,464 | | | | — | |
| Dividends and interest receivable | | | 6,008,651 | | | | 197,729 | |
| Unrealized appreciation of forward | | | | | | | | |
| currency exchange contracts | | | 2,153,828 | | | | 104,272 | |
| Receivable for Fund shares sold | | | 1,104,207 | | | | — | |
| Prepaid expenses and other assets | | | 29,616 | | | | 13,143 | |
| Receivable from Adviser | | | — | | | | 718 | |
| TOTAL ASSETS | | | 580,543,747 | | | | 22,839,366 | |
| LIABILITIES | | | | | | | | |
| Payable for investments purchased | | | 34,772,294 | | | | 1,628,787 | |
| Payable for Fund shares redeemed | | | 338,083 | | | | — | |
| Payable to Adviser | | | 298,759 | | | | — | |
| Shareholder servicing fees payable | | | 102,674 | | | | 2,337 | |
| Payable to affiliates | | | 72,670 | | | | 19,734 | |
| Accrued expenses and other liabilities | | | 66,273 | | | | 26,018 | |
| TOTAL LIABILITIES | | | 35,650,753 | | | | 1,676,876 | |
| NET ASSETS | | $ | 544,892,994 | | | $ | 21,162,490 | |
| | | | | | | | | |
| Net assets consist of: | | | | | | | | |
| Paid-in capital | | $ | 564,092,597 | | | $ | 21,796,740 | |
| Total accumulated loss | | | (19,199,603 | ) | | | (634,250 | ) |
| NET ASSETS | | $ | 544,892,994 | | | $ | 21,162,490 | |
| | | | | | | | | |
| INSTITUTIONAL CLASS | | | | | | | | |
| Shares of beneficial interest outstanding (unlimited | | | | | | | | |
| number of shares authorized, $0.001 par value) | | | 55,381,119 | | | | 2,194,082 | |
| Net asset value, offering, and | | | | | | | | |
| redemption price per share | | $ | 9.84 | | | $ | 9.65 | |
The accompanying notes are an integral part of these financial statements.
CROSSINGBRIDGE FUNDS
| Statements of Assets and Liabilities (Continued) |
September 30, 2022
| | | CrossingBridge | | | CrossingBridge | |
| | | Ultra-Short | | | Pre-Merger | |
| | | Duration Fund | | | SPAC ETF | |
| ASSETS | | | | | | |
| Investments, at value | | | | | | |
| (cost $71,674,045 and $62,913,969) | | $ | 70,860,259 | | | $ | 63,385,820 | |
| Cash held in foreign currency, at value | | | | | | | | |
| (cost $36,480 and $—) | | | 36,533 | | | | — | |
| Receivable for investment securities sold | | | 1,331,606 | | | | — | |
| Receivable for Fund shares sold | | | 855,860 | | | | — | |
| Dividends and interest receivable | | | 725,216 | | | | 3,131 | |
| Unrealized appreciation of forward | | | | | | | | |
| currency exchange contracts | | | 72,623 | | | | 59,606 | |
| Prepaid expenses and other assets | | | 14,660 | | | | — | |
| TOTAL ASSETS | | | 73,896,757 | | | | 63,448,557 | |
| LIABILITIES | | | | | | | | |
| Payable for investments purchased | | | 5,444,840 | | | | — | |
| Payable for Fund shares redeemed | | | 34,213 | | | | 33,495 | |
| Payable to Adviser | | | 23,233 | | | | 41,107 | |
| Payable for distributions to shareholders | | | — | | | | 62,424 | |
| Accrued expenses and other liabilities | | | 27,961 | | | | — | |
| Payable to affiliates | | | 21,673 | | | | — | |
| Shareholder servicing fees payable | | | 11,837 | | | | — | |
| TOTAL LIABILITIES | | | 5,563,757 | | | | 137,026 | |
| NET ASSETS | | $ | 68,333,000 | | | $ | 63,311,531 | |
| | | | | | | | | |
| Net assets consist of: | | | | | | | | |
| Paid-in capital | | $ | 68,594,063 | | | $ | 62,787,304 | |
| Total distributable earnings/(accumulated loss) | | | (261,063 | ) | | | 524,227 | |
| NET ASSETS | | $ | 68,333,000 | | | $ | 63,311,531 | |
| | | | | | | | | |
| INSTITUTIONAL CLASS | | | | | | | | |
| Shares of beneficial interest outstanding (unlimited | | | | | | | | |
| number of shares authorized, $0.001 par value) | | | 6,856,667 | | | | | |
| Net asset value, offering, and | | | | | | | | |
| redemption price per share | | $ | 9.97 | | | | | |
| | | | | | | | | |
| NAV | | | | | | | | |
| Shares of beneficial interest outstanding (unlimited | | | | | | | | |
| number of shares authorized, $0.001 par value) | | | | | | | 3,080,000 | |
| Net asset value, offering, and | | | | | | | | |
| redemption price per share | | | | | | $ | 20.56 | |
The accompanying notes are an integral part of these financial statements.
CROSSINGBRIDGE FUNDS
For the Year Ended September 30, 2022
| | | CrossingBridge | | | CrossingBridge | |
| | | Low Duration High | | | Responsible | |
| | | Yield Fund | | | Credit Fund | |
| INVESTMENT INCOME | | | | | | |
Interest income (net of $51,943 and $5,184 | | | | | | |
foreign withholding tax, respectively) | | $ | 20,655,711 | | | $ | 798,850 | |
Dividend income (net of $2,054 and $— | | | | | | | | |
foreign withholding tax, respectively) | | | 84,057 | | | | — | |
| TOTAL INVESTMENT INCOME | | | 20,739,768 | | | | 798,850 | |
| EXPENSES | | | | | | | | |
Management fees (Note 4) | | | 3,225,454 | | | | 110,091 | |
Shareholder servicing fees – Institutional Class (Note 5) | | | 402,194 | | | | 15,353 | |
Administration and accounting fees (Note 6) | | | 241,823 | | | | 69,399 | |
Expense recoupment by Adviser (Note 4) | | | 154,588 | | | | — | |
Federal and state registration fees | | | 89,109 | | | | 35,154 | |
Transfer agent fees and expenses (Note 6) | | | 78,753 | | | | 19,493 | |
Custody fees (Note 6) | | | 52,143 | | | | 12,425 | |
Legal fees | | | 32,543 | | | | 12,399 | |
Audit and tax fees | | | 28,595 | | | | 21,260 | |
Reports to shareholders | | | 19,587 | | | | — | |
Trustees’ fees | | | 18,407 | | | | 18,407 | |
Pricing fees (Note 6) | | | 17,341 | | | | 3,387 | |
Chief Compliance Officer fees | | | 11,684 | | | | 11,684 | |
Other expenses | | | 6,409 | | | | 2,311 | |
Insurance fees | | | 4,471 | | | | 2,555 | |
| TOTAL EXPENSES | | | 4,383,101 | | | | 333,918 | |
| Less waivers and reimbursement by Adviser (Note 4) | | | (1,776 | ) | | | (182,884 | ) |
| NET EXPENSES | | | 4,381,325 | | | | 151,034 | |
| NET INVESTMENT INCOME | | | 16,358,443 | | | | 647,816 | |
| REALIZED AND UNREALIZED | | | | | | | | |
| GAIN (LOSS) ON INVESTMENTS | | | | | | | | |
Net realized gain (loss) on: | | | | | | | | |
| Investments | | | (4,506,665 | ) | | | 36,007 | |
| Foreign currency exchange contracts | | | 7,120,130 | | | | 284,549 | |
| Foreign currency transactions | | | (95,309 | ) | | | 3,442 | |
| | | | 2,518,156 | | | | 323,998 | |
Net change in unrealized appreciation/depreciation on: | | | | | | | | |
| Investments | | | (24,276,638 | ) | | | (978,706 | ) |
| Foreign currency exchange contracts | | | 1,695,109 | | | | 59,536 | |
| Foreign currency translation | | | (15,252 | ) | | | (654 | ) |
| | | | (22,596,781 | ) | | | (919,824 | ) |
| NET REALIZED AND UNREALIZED | | | | | | | | |
| LOSS ON INVESTMENTS | | | (20,078,625 | ) | | | (595,826 | ) |
| NET INCREASE (DECREASE) IN NET | | | | | | | | |
| ASSETS FROM OPERATIONS | | $ | (3,720,182 | ) | | $ | 51,990 | |
The accompanying notes are an integral part of these financial statements.
CROSSINGBRIDGE FUNDS
| Statements of Operations (Continued) |
For the Period Ended September 30, 2022
| | | CrossingBridge | | | CrossingBridge | |
| | | Ultra-Short | | | Pre-Merger | |
| | | Duration Fund | | | SPAC ETF | |
| INVESTMENT INCOME | | | | | | |
Interest income | | $ | 1,420,201 | | | $ | 13,368 | |
Dividend income | | | 35,937 | | | | 4,306 | |
| TOTAL INVESTMENT INCOME | | | 1,456,138 | | | | 17,674 | |
| EXPENSES | | | | | | | | |
Management fees (Note 4) | | | 374,292 | | | | 372,203 | |
Administration and accounting fees (Note 6) | | | 70,313 | | | | — | |
Shareholder servicing fees – Institutional Class (Note 5) | | | 52,098 | | | | — | |
Federal and state registration fees | | | 41,556 | | | | — | |
Transfer agent fees and expenses (Note 6) | | | 23,369 | | | | — | |
Audit and tax fees | | | 21,546 | | | | — | |
Trustees’ fees | | | 18,407 | | | | — | |
Custody fees (Note 6) | | | 12,707 | | | | — | |
Legal fees | | | 12,205 | | | | — | |
Chief Compliance Officer fees | | | 11,684 | | | | — | |
Pricing fees (Note 6) | | | 7,748 | | | | — | |
Other expenses | | | 3,134 | | | | — | |
Excise tax | | | — | | | | 2,754 | |
Insurance fees | | | 2,739 | | | | — | |
| TOTAL EXPENSES | | | 651,798 | | | | 374,957 | |
| Less waivers and reimbursement by Adviser (Note 4) | | | (138,941 | ) | | | — | |
| NET EXPENSES | | | 512,857 | | | | 374,957 | |
| NET INVESTMENT INCOME (LOSS) | | | 943,281 | | | | (357,283 | ) |
| REALIZED AND UNREALIZED | | | | | | | | |
| GAIN (LOSS) ON INVESTMENTS | | | | | | | | |
Net realized gain (loss) on: | | | | | | | | |
| Investments | | | 197,246 | | | | 237,954 | |
| In-kind redemptions | | | — | | | | 68,213 | |
| Foreign currency exchange contracts | | | 304,365 | | | | 151,988 | |
| Foreign currency transactions | | | (12,845 | ) | | | (3,669 | ) |
| | | | 488,766 | | | | 454,486 | |
Net change in unrealized appreciation/depreciation on: | | | | | | | | |
| Investments | | | (841,576 | ) | | | 473,644 | |
| Foreign currency exchange contracts | | | 72,623 | | | | 59,606 | |
| | | | (768,953 | ) | | | 533,250 | |
| NET REALIZED AND UNREALIZED | | | | | | | | |
| GAIN (LOSS) ON INVESTMENTS | | | (280,187 | ) | | | 987,736 | |
| NET INCREASE IN NET | | | | | | | | |
| ASSETS FROM OPERATIONS | | $ | 663,094 | | | $ | 630,453 | |
The accompanying notes are an integral part of these financial statements.
CROSSINGBRIDGE LOW DURATION HIGH YIELD FUND
| Statements of Changes in Net Assets |
| | | Year Ended | | | Year Ended | |
| | | September 30, 2022 | | | September 30, 2021 | |
| FROM OPERATIONS | | | | | | |
| Net investment income | | $ | 16,358,443 | | | $ | 6,561,556 | |
| Net realized gain (loss) on: | | | | | | | | |
| Investments | | | (4,506,665 | ) | | | 7,132,312 | |
| Forward currency exchange contracts | | | 7,120,130 | | | | 274,815 | |
| Written option contracts | | | — | | | | 57,400 | |
| Foreign currency transactions | | | (95,309 | ) | | | 12,907 | |
| Net change in unrealized | | | | | | | | |
| appreciation/depreciation on: | | | | | | | | |
| Investments | | | (24,276,638 | ) | | | 2,551,056 | |
| Forward currency exchange contracts | | | 1,695,109 | | | | 307,539 | |
| Foreign currency translation | | | (15,252 | ) | | | (1,282 | ) |
| Net increase (decrease) in | | | | | | | | |
| net assets from operations | | | (3,720,182 | ) | | | 16,896,303 | |
| | | | | | | | | |
| FROM DISTRIBUTIONS | | | | | | | | |
| Distributions to shareholders | | | (22,048,408 | ) | | | (7,308,862 | ) |
| Net decrease in net assets | | | | | | | | |
| resulting from distributions paid | | | (22,048,408 | ) | | | (7,308,862 | ) |
| | | | | | | | | |
| FROM CAPITAL SHARE TRANSACTIONS | | | | | | | | |
| Proceeds from sales of shares – | | | | | | | | |
| Institutional Class | | | 491,767,133 | | | | 257,858,317 | |
| Net asset value of shares issued to shareholders | | | | | | | | |
| in payment of distributions declared – | | | | | | | | |
| Institutional Class | | | 16,583,903 | | | | 5,795,404 | |
| Payments for shares redeemed – | | | | | | | | |
| Institutional Class | | | (264,173,086 | ) | | | (90,881,724 | ) |
| Net increase in net assets | | | | | | | | |
| from capital share transactions | | | 244,177,950 | | | | 172,771,997 | |
| TOTAL INCREASE IN NET ASSETS | | | 218,409,360 | | | | 182,359,438 | |
| | | | | | | | | |
| NET ASSETS: | | | | | | | | |
| Beginning of Year | | | 326,483,634 | | | | 144,124,196 | |
| End of Year | | $ | 544,892,994 | | | $ | 326,483,634 | |
| | | | | | | | | |
The accompanying notes are an integral part of these financial statements.
CROSSINGBRIDGE RESPONSIBLE CREDIT FUND
| Statements of Changes in Net Assets (Continued) |
| | | | | | Period from | |
| | | | | | June 30, 2021(1) | |
| | | Year Ended | | | through | |
| | | September 30, 2022 | | | September 30, 2021 | |
| FROM OPERATIONS | | | | | | |
| Net investment income | | $ | 647,816 | | | $ | 73,835 | |
| Net realized gain (loss) on: | | | | | | | | |
| Investments | | | 36,007 | | | | 1,480 | |
| Forward currency exchange contracts | | | 284,549 | | | | (8,861 | ) |
| Foreign currency transactions | | | 3,442 | | | | 3,209 | |
| Net change in unrealized | | | | | | | | |
| appreciation/depreciation on: | | | | | | | | |
| Investments | | | (978,706 | ) | | | 7,861 | |
| Forward currency exchange contracts | | | 59,536 | | | | 44,736 | |
| Foreign currency translation | | | (654 | ) | | | (53 | ) |
| Net increase in net assets from operations | | | 51,990 | | | | 122,207 | |
| | | | | | | | | |
| FROM DISTRIBUTIONS | | | | | | | | |
| Distributions to shareholders | | | (736,927 | ) | | | (71,520 | ) |
| Net decrease in net assets | | | | | | | | |
| resulting from distributions paid | | | (736,927 | ) | | | (71,520 | ) |
| | | | | | | | | |
| FROM CAPITAL SHARE TRANSACTIONS | | | | | | | | |
| Proceeds from sales of shares – | | | | | | | | |
| Institutional Class | | | 8,248,399 | | | | 17,033,340 | |
| Net asset value of shares issued to shareholders | | | | | | | | |
| in payment of distributions declared – | | | | | | | | |
| Institutional Class | | | 699,429 | | | | 71,520 | |
| Payments for shares redeemed – | | | | | | | | |
| Institutional Class | | | (3,989,824 | ) | | | (266,124 | ) |
| Net increase in net assets | | | | | | | | |
| from capital share transactions | | | 4,958,004 | | | | 16,838,736 | |
| TOTAL INCREASE IN NET ASSETS | | | 4,273,067 | | | | 16,889,423 | |
| | | | | | | | | |
| NET ASSETS: | | | | | | | | |
| Beginning of Year/Period | | | 16,889,423 | | | | — | |
| End of Year/Period | | $ | 21,162,490 | | | $ | 16,889,423 | |
(1) | Commencement of operations. |
The accompanying notes are an integral part of these financial statements.
CROSSINGBRIDGE ULTRA-SHORT DURATION FUND
| Statements of Changes in Net Assets (Continued) |
| | | | | | Period from | |
| | | | | | June 30, 2021(1) | |
| | | Year Ended | | | through | |
| | | September 30, 2022 | | | September 30, 2021 | |
| FROM OPERATIONS | | | | | | |
| Net investment income (loss) | | $ | 943,281 | | | $ | (9,365 | ) |
| Net realized gain (loss) on: | | | | | | | | |
| Investments | | | 197,246 | | | | 5,227 | |
| Forward currency exchange contracts | | | 304,365 | | | | — | |
| Foreign currency transactions | | | (12,845 | ) | | | 7,242 | |
| Net change in unrealized | | | | | | | | |
| appreciation/depreciation on: | | | | | | | | |
| Investments | | | (841,576 | ) | | | 27,843 | |
| Forward currency exchange contracts | | | 72,623 | | | | — | |
| Net increase in net assets from operations | | | 663,094 | | | | 30,947 | |
| | | | | | | | | |
| FROM DISTRIBUTIONS | | | | | | | | |
| Distributions to shareholders | | | (955,104 | ) | | | — | |
| Net decrease in net assets | | | | | | | | |
| resulting from distributions paid | | | (955,104 | ) | | | — | |
| | | | | | | | | |
| FROM CAPITAL SHARE TRANSACTIONS | | | | | | | | |
| Proceeds from sales of shares – | | | | | | | | |
| Institutional Class | | | 45,183,829 | | | | 37,029,820 | |
| Net asset value of shares issued to shareholders | | | | | | | | |
| in payment of distributions declared – | | | | | | | | |
| Institutional Class | | | 58,106 | | | | — | |
| Payments for shares redeemed – | | | | | | | | |
| Institutional Class | | | (13,677,662 | ) | | | (30 | ) |
| Net increase in net assets | | | | | | | | |
| from capital share transactions | | | 31,564,273 | | | | 37,029,790 | |
| TOTAL INCREASE IN NET ASSETS | | | 31,272,263 | | | | 37,060,737 | |
| | | | | | | | | |
| NET ASSETS: | | | | | | | | |
| Beginning of Year/Period | | | 37,060,737 | | | | — | |
| End of Year/Period | | $ | 68,333,000 | | | $ | 37,060,737 | |
(1) | Commencement of operations. |
The accompanying notes are an integral part of these financial statements.
CROSSINGBRIDGE PRE-MERGER SPAC ETF
| Statements of Changes in Net Assets (Continued) |
| | | | | | Period from | |
| | | | | | September 20, 2021(1) | |
| | | Year Ended | | | through | |
| | | September 30, 2022 | | | September 30, 2021 | |
| FROM OPERATIONS | | | | | | |
| Net investment loss | | $ | (357,283 | ) | | $ | (907 | ) |
| Net realized gain (loss) on: | | | | | | | | |
| Investments | | | 306,167 | | | | 691 | |
| Forward currency exchange contracts | | | 151,988 | | | | — | |
| Foreign currency transactions | | | (3,669 | ) | | | — | |
| Net change in unrealized | | | | | | | | |
| appreciation/depreciation on: | | | | | | | | |
| Investments | | | 473,644 | | | | (1,793 | ) |
| Forward currency exchange contracts | | | 59,606 | | | | — | |
| Net increase (decrease) in | | | | | | | | |
| net assets from operations | | | 630,453 | | | | (2,009 | ) |
| | | | | | | | | |
| FROM DISTRIBUTIONS | | | | | | | | |
| Distributions to shareholders | | | (62,424 | ) | | | — | |
| Net decrease in net assets | | | | | | | | |
| resulting from distributions paid | | | (62,424 | ) | | | — | |
| | | | | | | | | |
| FROM CAPITAL SHARE TRANSACTIONS | | | | | | | | |
| Proceeds from sales of shares – NAV | | | 66,766,005 | | | | 5,803,792 | |
| Net asset value of shares issued to shareholders | | | | | | | | |
| in payment of distributions declared – NAV | | | — | | | | — | |
| Payments for shares redeemed – NAV | | | (9,824,286 | ) | | | — | |
| Net increase in net assets | | | | | | | | |
| from capital share transactions | | | 56,941,719 | | | | 5,803,792 | |
| TOTAL INCREASE IN NET ASSETS | | | 57,509,748 | | | | 5,801,783 | |
| | | | | | | | | |
| NET ASSETS: | | | | | | | | |
| Beginning of Year/Period | | | 5,801,783 | | | | — | |
| End of Year/Period | | $ | 63,311,531 | | | $ | 5,801,783 | |
(1) | Commencement of operations. |
The accompanying notes are an integral part of these financial statements.
CROSSINGBRIDGE LOW DURATION HIGH YIELD FUND
Institutional Class
| | | Year Ended | |
| | | September 30, 2022 |
| Net Asset Value, Beginning of Year/Period | | $ | 10.36 | |
| | | | | |
| Income from investment operations: | | | | |
Net investment income(2) | | | 0.33 | |
Net realized and unrealized gain (loss) on investments(3) | | | (0.36 | ) |
Total from investment operations | | | (0.03 | ) |
| | | | | |
| Less distributions paid: | | | | |
| From net investment income | | | (0.33 | ) |
| From net realized gains | | | (0.16 | ) |
Total distributions paid | | | (0.49 | ) |
| | | | | |
| Net Asset Value, End of Year/Period | | $ | 9.84 | |
Total Return(5) | | | -0.39 | % |
| | | | | |
| Supplemental Data and Ratios: | | | | |
Net assets, end of year/period (000’s) | | $ | 544,893 | |
| | | | | |
Ratio of expenses to average net assets: | | | | |
Before waivers and reimbursements of expenses(6) | | | 0.88 | %(7) |
After waivers and reimbursements of expenses(6) | | | 0.88 | %(7) |
Ratio of net investment income to average net assets: | | | | |
Before waivers and reimbursements of expenses(6) | | | 3.30 | % |
After waivers and reimbursements of expenses(6) | | | 3.30 | % |
Portfolio turnover rate(9) | | | 136.70 | % |
(1) | Commencement of investment operations. |
(2) | Per share net investment income was calculated using average shares outstanding method. |
(3) | Net realized and unrealized gain (loss) per share in the caption are balancing amounts necessary to reconcile the change in net asset value per share for the period and may not reconcile with the aggregate gains and losses in the Statements of Operations. |
(4) | Less than $0.005 per share. |
(5) | Total return represents the rate that investor would have earned or lost on an investment in the Fund, assuming reinvestment of dividends. Total return for a period of less than one year is not annualized. |
(6) | Annualized for periods less than one year. |
(7) | This ratio includes previous expense reimbursements recouped by the Adviser. If this recoupment was excluded, this ratio would be 0.85%. |
(8) | This ratio includes previous expense reimbursements recouped by the Adviser. If this recoupment was excluded, this ratio would be unchanged. |
(9) | Portfolio turnover not annualized for periods less than one year. Short-term securities with maturities less than or equal to 365 days are excluded from the portfolio turnover calculation. |
The accompanying notes are an integral part of these financial statements.
CROSSINGBRIDGE LOW DURATION HIGH YIELD FUND
| Financial Highlights (Continued) |
Per Share Data for a Share Outstanding Throughout Each Year/Period
| | | | | | | | | | Period from | |
| | | | | | | | | | February 1, 2018(1) | |
| Year Ended | | | Year Ended | | | Year Ended | | | through | |
| September 30, 2021 | | | September 30, 2020 | | | September 30, 2019 | | | September 30, 2018 | |
$ | 9.86 | | | $ | 10.04 | | | $ | 10.06 | | | $ | 10.00 | |
| | | | | | | | | | | | | | | |
| | | | | | | | | | | | | | | |
| | 0.34 | | | | 0.35 | | | | 0.29 | | | | 0.17 | |
| | 0.54 | | | | (0.18 | ) | | | (0.02 | ) | | | 0.02 | |
| | 0.88 | | | | 0.17 | | | | 0.27 | | | | 0.19 | |
| | | | | | | | | | | | | | | |
| | | | | | | | | | | | | | | |
| | (0.38 | ) | | | (0.35 | ) | | | (0.29 | ) | | | (0.13 | ) |
| | — | | | | — | | | | (0.00 | )(4) | | | — | |
| | (0.38 | ) | | | (0.35 | ) | | | (0.29 | ) | | | (0.13 | ) |
| | | | | | | | | | | | | | | |
$ | 10.36 | | | $ | 9.86 | | | $ | 10.04 | | | $ | 10.06 | |
| | 9.13 | % | | | 1.80 | % | | | 2.71 | % | | | 1.95 | % |
| | | | | | | | | | | | | | | |
| | | | | | | | | | | | | | | |
$ | 326,484 | | | $ | 144,124 | | | $ | 129,019 | | | $ | 45,827 | |
| | | | | | | | | | | | | | | |
| | | | | | | | | | | | | | | |
| | 0.91 | %(8) | | | 0.96 | % | | | 1.08 | % | | | 1.90 | % |
| | 0.88 | %(8) | | | 0.90 | % | | | 0.96 | % | | | 1.00 | % |
| | | | | | | | | | | | | | | |
| | 3.34 | % | | | 3.35 | % | | | 2.83 | % | | | 1.64 | % |
| | 3.37 | % | | | 3.41 | % | | | 2.95 | % | | | 2.54 | % |
| | 169.73 | % | | | 224.86 | % | | | 198.63 | % | | | 76.70 | % |
The accompanying notes are an integral part of these financial statements.
CROSSINGBRIDGE RESPONSIBLE CREDIT FUND
Per Share Data for a Share Outstanding Throughout Each Year/Period
| Institutional Class | | | | | | |
| | | | | | Period from | |
| | | | | | June 30, 2021(1) | |
| | | Year Ended | | | through | |
| | | September 30, | | | September 30, | |
| | | 2022 | | | 2021 | |
| Net Asset Value, Beginning of Year/Period | | $ | 10.01 | | | $ | 10.00 | |
| | | | | | | | | |
| Income from investment operations: | | | | | | | | |
Net investment income(2) | | | 0.38 | | | | 0.06 | |
Net realized and unrealized loss on investments(3) | | | (0.33 | ) | | | (0.01 | ) |
Total from investment operations | | | 0.05 | | | | 0.05 | |
| | | | | | | | | |
| Less distributions paid: | | | | | | | | |
| From net investment income | | | (0.39 | ) | | | (0.04 | ) |
| From net realized gains | | | (0.02 | ) | | | — | |
Total distributions paid | | | (0.41 | ) | | | (0.04 | ) |
| | | | | | | | | |
| Net Asset Value, End of Year/Period | | $ | 9.65 | | | $ | 10.01 | |
Total Return(4) | | | 0.45 | % | | | 0.57 | % |
| | | | | | | | | |
| Supplemental Data and Ratios: | | | | | | | | |
Net assets, end of year/period (000’s) | | $ | 21,162 | | | $ | 16,889 | |
| | | | | | | | | |
Ratio of expenses to average net assets: | | | | | | | | |
Before waivers and reimbursements of expenses(5)(6) | | | 1.97 | % | | | 2.77 | % |
After waivers and reimbursements of expenses(5) | | | 0.89 | % | | | 0.91 | %(6) |
Ratio of net investment income to average net assets: | | | | | | | | |
Before waivers and reimbursements of expenses(5) | | | 2.75 | % | | | 0.50 | % |
After waivers and reimbursements of expenses(5) | | | 3.83 | % | | | 2.36 | % |
Portfolio turnover rate(7) | | | 173.58 | % | | | 39.47 | % |
(1) | Commencement of investment operations. |
(2) | Per share net investment income was calculated using average shares outstanding method. |
(3) | Net realized and unrealized loss per share in the caption are balancing amounts necessary to reconcile the change in net asset value per share for the period and may not reconcile with the aggregate gains and losses in the Statements of Operations. |
(4) | Total return represents the rate that investor would have earned or lost on an investment in the Fund, assuming reinvestment of dividends. Total return for a period of less than one year is not annualized. |
(5) | Annualized for periods less than one year. |
(6) | The ratio of expenses to average net assets after waivers and reimbursement of expenses includes bank loan service charges. Excluding these charges, the ratio was 0.90%. |
(7) | Portfolio turnover not annualized for periods less than one year. Short-term securities with maturities less than or equal to 365 days are excluded from the portfolio turnover calculation. |
The accompanying notes are an integral part of these financial statements.
CROSSINGBRIDGE ULTRA-SHORT DURATION FUND
Per Share Data for a Share Outstanding Throughout Each Year/Period
Institutional Class
| | | | | | Period from | |
| | | | | | June 30, 2021(1) | |
| | | Year Ended | | | through | |
| | | September 30, | | | September 30, | |
| | | 2022 | | | 2021 | |
| Net Asset Value, Beginning of Year/Period | | $ | 10.01 | | | $ | 10.00 | |
| | | | | | | | | |
| Income from investment operations: | | | | | | | | |
Net investment income (loss)(2) | | | 0.16 | | | | (0.01 | ) |
| Net realized and unrealized | | | | | | | | |
gain (loss) on investments(3) | | | (0.05 | ) | | | 0.02 | |
Total from investment operations | | | 0.11 | | | | 0.01 | |
| | | | | | | | | |
| Less distributions paid: | | | | | | | | |
| From net investment income | | | (0.14 | ) | | | — | |
| From net realized gains | | | (0.01 | ) | | | — | |
Total distributions paid | | | (0.15 | ) | | | — | |
| | | | | | | | | |
| Net Asset Value, End of Year/Period | | $ | 9.97 | | | $ | 10.01 | |
Total Return(4) | | | 1.12 | % | | | 0.07 | % |
| | | | | | | | | |
| Supplemental Data and Ratios: | | | | | | | | |
Net assets, end of year/period (000’s) | | $ | 68,333 | | | $ | 37,061 | |
| | | | | | | | | |
Ratio of expenses to average net assets: | | | | | | | | |
Before waivers and reimbursements of expenses(5) | | | 1.13 | % | | | 2.68 | % |
After waivers and reimbursements of expenses(5) | | | 0.89 | % | | | 0.90 | %(6) |
Ratio of net investment income (loss) | | | | | | | | |
to average net assets: | | | | | | | | |
Before waivers and reimbursements of expenses(5) | | | 1.40 | % | | | (2.06 | %) |
After waivers and reimbursements of expenses(5) | | | 1.64 | % | | | (0.28 | %) |
Portfolio turnover rate(6) | | | 155.17 | % | | | 41.74 | % |
(1) | Commencement of investment operations. |
(2) | Per share net investment income (loss) was calculated using average shares outstanding method. |
(3) | Net realized and unrealized gain (loss) per share in the caption are balancing amounts necessary to reconcile the change in net asset value per share for the period and may not reconcile with the aggregate gains and losses in the Statements of Operations. |
(4) | Total return represents the rate that investor would have earned or lost on an investment in the Fund, assuming reinvestment of dividends. Total return for a period of less than one year is not annualized. |
(5) | Annualized for periods less than one year. |
(6) | Portfolio turnover not annualized for periods less than one year. Short-term securities with maturities less than or equal to 365 days are excluded from the portfolio turnover calculation. |
The accompanying notes are an integral part of these financial statements.
CROSSINGBRIDGE PRE-MERGER SPAC ETF
Per Share Data for a Share Outstanding Throughout Each Year/Period
NAV
| | | | | | Period from | |
| | | | | | September 20, 2021(1) | |
| | | Year Ended | | | through | |
| | | September 30, | | | September 30, | |
| | | 2022 | | | 2021 | |
| Net Asset Value, Beginning of Year/Period | | $ | 20.01 | | | $ | 20.00 | |
| | | | | | | | | |
| Income from investment operations: | | | | | | | | |
Net investment loss(2) | | | (0.16 | ) | | | (0.00 | )(3) |
Net realized and unrealized gain on investments(4) | | | 0.73 | | | | 0.01 | |
Total from investment operations | | | 0.57 | | | | 0.01 | |
| | | | | | | | | |
| Less distributions paid: | | | | | | | | |
| From net investment income | | | (0.02 | ) | | | — | |
| From net realized gains | | | — | | | | — | |
Total distributions paid | | | (0.02 | ) | | | — | |
| | | | | | | | | |
| Net Asset Value, End of Year/Period | | $ | 20.56 | | | $ | 20.01 | |
Total Return(5) | | | 2.85 | % | | | 0.03 | % |
| | | | | | | | | |
| Supplemental Data and Ratios: | | | | | | | | |
Net assets, end of year/period (000’s) | | $ | 63,312 | | | $ | 5,802 | |
| | | | | | | | | |
Ratio of expenses to average net assets(6) | | | 0.81 | % | | | 0.80 | % |
Ratio of net investment loss to average net assets(6) | | | (0.77 | %) | | | (0.80 | %) |
Portfolio turnover rate(7)(8) | | | 172.39 | % | | | 4.29 | % |
(1) | Commencement of investment operations. |
(2) | Per share net investment loss was calculated using average shares outstanding method. |
(3) | Amount between $(0.005) and $0.00 per share. |
(4) | Net realized and unrealized gain per share in the caption are balancing amounts necessary to reconcile the change in net asset value per share for the period and may not reconcile with the aggregate gains and losses in the Statements of Operations. |
(5) | Total return represents the rate that investor would have earned or lost on an investment in the Fund, assuming reinvestment of dividends. Total return for a period of less than one year is not annualized. Total return presented is total return of Net Asset Value. Total return of the Market Value is 2.70%. |
(6) | Annualized for periods less than one year. |
(7) | Portfolio turnover not annualized for periods less than one year. Short-term securities with maturities less than or equal to 365 days are excluded from the portfolio turnover calculation. |
(8) | Excludes in-kind transactions associated with creations and redemptions of the Fund. |
The accompanying notes are an integral part of these financial statements.
CROSSINGBRIDGE FUNDS
Notes to Financial Statements
September 30, 2022
| (1) | Organization |
| | Trust for Professional Managers (the “Trust”) was organized as a Delaware statutory trust under a Declaration of Trust dated May 29, 2001. The Trust is registered under the Investment Company Act of 1940, as amended (the “1940 Act”), as an open-end management investment company. The CrossingBridge Funds (the “Funds”) are comprised of the CrossingBridge Low Duration High Yield Fund, the CrossingBridge Responsible Credit Fund, the CrossingBridge Ultra-Short Duration Fund (collectively, the “Mutual Funds”) and the CrossingBridge Pre-Merger SPAC ETF (the “ETF”), each representing a distinct diversified series with its own investment objective and policies within the Trust. |
| | |
| | The investment objective of the CrossingBridge Low Duration High Yield Fund is to seek high current income and capital appreciation consistent with the preservation of capital. The investment objective of the CrossingBridge Responsible Credit Fund is to seek high current income and capital appreciation consistent with the preservation of capital. The investment objective of the CrossingBridge Ultra-Short Duration Fund is to offer a higher yield than cash instruments while maintaining a low duration. |
| | |
| | The CrossingBridge Low Duration High Yield Fund commenced investment operations on February 1, 2018. The Fund has registered both an Investor Class and Institutional Class of shares. During the fiscal year ended September 30, 2022, only the Institutional Class was operational. Both the CrossingBridge Responsible Credit Fund and CrossingBridge Ultra-Short Duration Fund commenced investment operations on June 30, 2021. Both Funds registered only an Institutional Class of shares. |
| | |
| | The investment objective of the CrossingBridge Pre-Merger SPAC ETF is to provide total returns consistent with the preservation of capital. The ETF commenced investment operations on September 20, 2021. |
| | |
| | Costs incurred by the Funds in connection with the organization, registration and the initial public offering of shares were paid by CrossingBridge Advisors, LLC (“the Adviser”), the Funds’ investment adviser. The Trust may issue an unlimited number of shares of beneficial interest at $0.001 par value. The Funds are investment companies and accordingly follow the investment company accounting and reporting guidance of the Financial Accounting Standards Board (“FASB”) Accounting Standards Codification Topic 946 “Financial Services – Investment Companies.” |
| | |
| (2) | Significant Accounting Policies |
| | |
| | The following is a summary of significant accounting policies consistently followed by the Funds in the preparation of the financial statements. These policies are in conformity with generally accepted accounting principles in the United States of America (“GAAP”). |
| | |
| | (a) Investment Valuation |
| | |
| | Each security owned by a Fund that is listed on a securities exchange, including Special Purpose Acquisition Companies (“SPACs”), is valued at its last sale price on that exchange on the date as of which assets are valued. Bank loans are valued at prices supplied by an approved independent pricing service (“Pricing Service”), if available, and otherwise will be valued at the most recent bid quotations or evaluated prices, as applicable, based on quotations or prices obtained from one or more broker-dealers known to follow the issue. |
CROSSINGBRIDGE FUNDS
Notes to Financial Statements (Continued)
September 30, 2022
| | If the security is listed on more than one exchange, a Fund will use the price of the exchange that the Fund generally considers to be the principal exchange on which the security is traded. Portfolio securities listed on NASDAQ will be valued at the NASDAQ Official Closing Price, which may not necessarily represent the last sale price. If there has been no sale on such exchange or on NASDAQ on such day, the security is valued at the mean between the most recent bid and asked prices on such day or the security shall be valued at the latest sales price on the “composite market” for the day such security is being valued. The composite market is defined as a consolidation of the trade information provided by national securities and foreign exchanges and over-the-counter markets as published by a Pricing Service. |
| | |
| | Foreign securities will be priced in their local currencies as of the close of their primary exchange or market or as of the time a Fund calculates its NAV, whichever is earlier. Foreign securities, currencies and other assets denominated in foreign currencies are then translated into U.S. dollars at the exchange rate of such currencies against the U.S. dollar, as provided by an approved Pricing Service or reporting agency. All assets denominated in foreign currencies will be converted into U.S. dollars using the applicable currency exchange rates as of the close of the New York Stock Exchange (“NYSE”), generally 4:00 p.m. Eastern Time. |
| | |
| | Debt securities, including corporate bonds, bank loans, commercial paper, and short-term debt instruments having a maturity of 60 days or less, are valued at the mean in accordance with prices supplied by an approved Pricing Service. Pricing Services may use various valuation methodologies such as the mean between the bid and the asked prices, matrix pricing and other analytical pricing models as well as market transactions and dealer quotations. If a price is not available from a Pricing Service, the most recent quotation obtained from one or more broker-dealers known to follow the issue will be obtained. Quotations will be valued at the mean between the bid and the offer. Any discount or premium is accreted or amortized using the constant yield method until maturity. |
| | |
| | Money market funds are valued at cost. If cost does not represent current market value, the securities will be priced at fair value. |
| | |
| | SPAC Founders Shares, received as part of the initial public offering process, will be valued initially in line with the publicly traded warrants, which typically have no value prior to the warrants being separated from the SPAC common shares. Upon a de-SPAC transaction, the valuation of the Founders Shares may be updated to reflect more current circumstances and inputs, including the value of the publicly traded warrants or the value of the publicly traded common shares, and may include a discount to reflect any restrictions associated with the Founders Shares. |
| | |
| | Redeemable securities issued by open-end, registered investment companies are valued at the NAVs of such companies for purchase and/or redemption orders placed on that day. All exchange-traded funds are valued at the last reported sale price on the exchange on which the security is principally traded. |
CROSSINGBRIDGE FUNDS
Notes to Financial Statements (Continued)
September 30, 2022
| | If market quotations are not readily available, a security or other asset will be valued at its fair value in accordance with Rule 2a-5 of the 1940 Act as determined under the Adviser’s fair value pricing procedures, subject to oversight by the Board of Trustees. These fair value pricing procedures will also be used to price a security when corporate events, events in the securities market and/or world events cause the Adviser to believe that a security’s last sale price may not reflect its actual fair market value. The intended effect of using fair value pricing procedures is to ensure that a Fund is accurately priced. The Board of Trustees will regularly evaluate whether the Funds’ fair value pricing procedures continue to be appropriate in light of the specific circumstances of the Funds and the quality of prices obtained through the application of such procedures by the Adviser. |
| | |
| | FASB Accounting Standards Codification, “Fair Value Measurements and Disclosures” Topic 820 (“ASC 820”), establishes an authoritative definition of fair value and sets out a hierarchy for measuring fair value. ASC 820 requires an entity to evaluate certain factors to determine whether there has been a significant decrease in volume and level of activity for the security such that recent transactions and quoted prices may not be determinative of fair value and further analysis and adjustment may be necessary to estimate fair value. ASC 820 also requires enhanced disclosure regarding the inputs and valuation techniques used to measure fair value in those instances as well as expanded disclosure of valuation levels for major security types. These inputs are summarized in the three broad levels listed below: |
| | | Level 1 – | Unadjusted quoted prices in active markets for identical securities. |
| | | | |
| | | Level 2 – | Other significant observable inputs (including quoted prices for similar securities, interest rates, prepayment speeds, credit risk, etc.). |
| | | | |
| | | Level 3 – | Significant unobservable inputs (including the Funds’ own assumptions in determining the fair value of investments). |
CROSSINGBRIDGE FUNDS
Notes to Financial Statements (Continued)
September 30, 2022
| | The inputs or methodology used for valuing securities are not necessarily an indication of the risk associated with investing in those securities. The following is a summary of the inputs used to value the Funds’ investments carried at fair value as of September 30, 2022: |
| | |
| | CrossingBridge Low Duration High Yield Fund |
| | | | Level 1 | | | Level 2 | | | Level 3 | | | Total | |
| | Assets(1): | | | | | | | | | | | | |
| | Asset Backed Securities | | $ | — | | | $ | 8,866,335 | | | $ | — | | | $ | 8,866,335 | |
| | Bank Loans | | | — | | | | 37,562,861 | | | | — | | | | 37,562,861 | |
| | Commercial Paper | | | — | | | | 113,169,787 | | | | — | | | | 113,169,787 | |
| | Convertible Bonds | | | — | | | | 1,442,955 | | | | 10,461,850 | | | | 11,904,805 | |
| | Corporate Bonds | | | — | | | | 253,668,763 | | | | — | | | | 253,668,763 | |
| | Preferred Stocks | | | — | | | | 5,719,700 | | | | — | | | | 5,719,700 | |
| | Special Purpose | | | | | | | | | | | | | | | | |
| | Acquisition Companies | | | 49,589,537 | | | | 22,504,536 | | | | 3,605 | | | | 72,097,678 | |
| | Trade Claims | | | — | | | | 4,738,924 | | | | — | | | | 4,738,924 | |
| | Warrants | | | 60,518 | | | | 401 | | | | — | | | | 60,919 | |
| | Money Market Funds | | | 54,049,040 | | | | — | | | | — | | | | 54,049,040 | |
| | Total Assets | | $ | 103,699,095 | | | $ | 447,674,262 | | | $ | 10,465,455 | | | $ | 561,838,812 | |
| | Other Financial Instruments(2) | | | | | | | | | | | | | | | | |
| | Forward Currency | | | | | | | | | | | | | | | | |
| | Exchange Contracts | | $ | — | | | $ | 2,153,828 | | | $ | — | | | $ | 2,153,828 | |
| | Total Other | | | | | | | | | | | | | | | | |
| | Financial Instruments | | $ | — | | | $ | 2,153,828 | | | $ | — | | | $ | 2,153,828 | |
| | (1) | See the Schedule of Investments for industry classifications. |
| | (2) | Other financial instruments are forward currency exchange contracts not included in the Schedule of Investments, which are reflected at the net unrealized appreciation (depreciation) on the instrument. |
CROSSINGBRIDGE FUNDS
Notes to Financial Statements (Continued)
September 30, 2022
| | CrossingBridge Responsible Credit Fund | | | | | | | | | | | | |
| | | | Level 1 | | | Level 2 | | | Level 3 | | | Total | |
| | Assets(1): | | | | | | | | | | | | |
| | Asset Backed Securities | | $ | — | | | $ | 1,357,186 | | | $ | — | | | $ | 1,357,186 | |
| | Bank Loans | | | — | | | | 1,358,703 | | | | 1,480,934 | | | | 2,839,637 | |
| | Commercial Paper | | | — | | | | 2,633,926 | | | | — | | | | 2,633,926 | |
| | Common Stocks | | | — | | | | 128,400 | | | | — | | | | 128,400 | |
| | Convertible Bonds | | | — | | | | 137,800 | | | | — | | | | 137,800 | |
| | Corporate Bonds | | | — | | | | 9,957,802 | | | | — | | | | 9,957,802 | |
| | Special Purpose | | | | | | | | | | | | | | | | |
| | Acquisition Companies | | | 1,627,353 | | | | 1,003,732 | | | | 147 | | | | 2,631,232 | |
| | Money Market Funds | | | 2,247,710 | | | | — | | | | — | | | | 2,247,710 | |
| | Total Assets | | $ | 3,875,063 | | | $ | 16,577,549 | | | $ | 1,481,081 | | | $ | 21,933,693 | |
| | Other Financial Instruments(2) | | | | | | | | | | | | | | | | |
| | Forward Currency | | | | | | | | | | | | | | | | |
| | Exchange Contracts | | $ | — | | | $ | 104,272 | | | $ | — | | | $ | 104,272 | |
| | Total Other | | | | | | | | | | | | | | | | |
| | Financial Instruments | | $ | — | | | $ | 104,272 | | | $ | — | | | $ | 104,272 | |
| | (1) | See the Schedule of Investments for industry classifications. |
| | (2) | Other financial instruments are forward currency exchange contracts not included in the Schedule of Investments, which are reflected at the net unrealized appreciation (depreciation) on the instrument. |
| | CrossingBridge Ultra-Short Duration Fund | | | | | | | | | | | | |
| | | | Level 1 | | | Level 2 | | | Level 3 | | | Total | |
| | Assets(1): | | | | | | | | | | | | |
| | Asset Backed Securities | | $ | — | | | $ | 3,659,295 | | | $ | 1,990,626 | | | $ | 5,649,921 | |
| | Bank Loans | | | — | | | | 1,278,982 | | | | — | | | | 1,278,982 | |
| | Convertible Bonds | | | — | | | | — | | | | 1,012,770 | | | | 1,012,770 | |
| | Corporate Bonds | | | — | | | | 51,954,496 | | | | — | | | | 51,954,496 | |
| | Municipal Bonds | | | — | | | | 2,995,695 | | | | — | | | | 2,995,695 | |
| | Preferred Stocks | | | 418,072 | | | | 2,300,000 | | | | — | | | | 2,718,072 | |
| | Rights | | | — | | | | 7,770 | | | | — | | | | 7,770 | |
| | Special Purpose | | | | | | | | | | | | | | | | |
| | Acquisition Companies | | | 269,098 | | | | 1,524,374 | | | | 93 | | | | 1,793,565 | |
| | Warrants | | | 943 | | | | 4,558 | | | | — | | | | 5,501 | |
| | Money Market Funds | | | 3,443,487 | | | | — | | | | — | | | | 3,443,487 | |
| | Total Assets | | $ | 4,131,600 | | | $ | 63,725,170 | | | $ | 3,003,489 | | | $ | 70,860,259 | |
| | Other Financial Instruments(2) | | | | | | | | | | | | | | | | |
| | Forward Currency | | | | | | | | | | | | | | | | |
| | Exchange Contracts | | $ | — | | | $ | 72,623 | | | $ | — | | | $ | 72,623 | |
| | Total Other | | | | | | | | | | | | | | | | |
| | Financial Instruments | | $ | — | | | $ | 72,623 | | | $ | — | | | $ | 72,623 | |
| | (1) | See the Schedule of Investments for industry classifications. |
| | (2) | Other financial instruments are forward currency exchange contracts not included in the Schedule of Investments, which are reflected at the net unrealized appreciation (depreciation) on the instrument. |
CROSSINGBRIDGE FUNDS
Notes to Financial Statements (Continued)
September 30, 2022
| | CrossingBridge Pre-Merger SPAC ETF | | | | | | | | | | | | |
| | | | Level 1 | | | Level 2 | | | Level 3 | | | Total | |
| | Assets(1): | | | | | | | | | | | | |
| | Special Purpose | | | | | | | | | | | | |
| | Acquisition Companies | | $ | 45,117,639 | | | $ | 16,900,162 | | | $ | 731 | | | $ | 62,018,532 | |
| | Rights | | | 7,200 | | | | 23,369 | | | | — | | | | 30,569 | |
| | Warrants | | | 22,240 | | | | 1,446 | | | | — | | | | 23,686 | |
| | Money Market Funds | | | 1,313,033 | | | | — | | | | — | | | | 1,313,033 | |
| | Total Assets | | $ | 46,460,112 | | | $ | 16,924,977 | | | $ | 731 | | | $ | 63,385,820 | |
| | Other Financial Instruments(2) | | | | | | | | | | | | | | | | |
| | Forward Currency | | | | | | | | | | | | | | | | |
| | Exchange Contracts | | $ | — | | | $ | 59,606 | | | $ | — | | | $ | 59,606 | |
| | Total Other | | | | | | | | | | | | | | | | |
| | Financial Instruments | | $ | — | | | $ | 59,606 | | | $ | — | | | $ | 59,606 | |
| | (1) | See the Schedule of Investments for industry classifications. |
| | (2) | Other financial instruments are forward currency exchange contracts not included in the Schedule of Investments, which are reflected at the net unrealized appreciation (depreciation) on the instrument. |
| | |
| | The following is a reconciliation of Level 3 assets in the Funds for which significant unobservable inputs were used to determine fair value: |
| | CrossingBridge Low Duration High Yield Fund | |
| | | | | | | | | | | |
| | | | | | | | | | Special Purpose | |
| |
| | Bank Loans | | | Bonds | | | Acquisition Companies | |
| | Beginning Balance – October 1, 2021 | | $ | 4,293,369 | | | $ | — | | | $ | — | |
| | Purchases | | | — | | | | 7,245,000 | | | | 68 | |
| | Sales | | | (4,293,369 | ) | | | — | | | | — | |
| | Realized gains | | | — | | | | — | | | | — | |
| | Realized losses | | | — | | | | — | | | | — | |
| | Change in unrealized | | | | | | | | | | | | |
| | appreciation (depreciation) | | | — | | | | (507,150 | ) | | | 3,537 | |
| | Transfer in/(out) of Level 3 | | | — | | | | 3,724,000 | | | | — | |
| | Ending Balance – September 30, 2022 | | $ | — | | | $ | 10,461,850 | | | $ | 3,605 | |
| | The total change in unrealized appreciation (depreciation) included in the Statement of Operations attributable to Level 3 investments still held at September 30, 2022, includes the following: |
| | Convertible | Special Purpose | |
| | Bonds | Acquisition Companies | |
| | ($507,150) | $3,537 | |
CROSSINGBRIDGE FUNDS
Notes to Financial Statements (Continued)
September 30, 2022
| | CrossingBridge Responsible Credit Fund | | | | | | |
| | | | | | | Special Purpose | |
| | | | Bank Loans | | | Acquisition Companies | |
| | Beginning Balance – October 1, 2021 | | $ | — | | | $ | — | |
| | Purchases | | | 1,480,934 | | | | — | |
| | Sales | | | — | | | | — | |
| | Realized gains | | | — | | | | — | |
| | Realized losses | | | — | | | | — | |
| | Change in unrealized | | | | | | | | |
| | appreciation (depreciation) | | | — | | | | 147 | |
| | Transfer in/(out) of Level 3 | | | — | | | | — | |
| | Ending Balance – September 30, 2022 | | $ | 1,480,934 | | | $ | 147 | |
| | The total change in unrealized appreciation (depreciation) included in the Statement of Operations attributable to Level 3 investments still held at September 30, 2022, includes the following: |
| | Special Purpose | |
| | Acquisition Companies | |
| | $147 | |
| | CrossingBridge Ultra-Short Duration Fund | | | | | | | | | |
| | | | Asset Backed | | | Convertible | | | Special Purpose | |
| | | | Securities | | | Bonds | | | Acquisition Companies | |
| | Beginning Balance – October 1, 2021 | | $ | — | | | $ | — | | | $ | — | |
| | Purchases | | | 1,990,897 | | | | 1,089,000 | | | | — | |
| | Sales | | | — | | | | — | | | | — | |
| | Realized gains | | | — | | | | — | | | | — | |
| | Realized losses | | | — | | | | — | | | | — | |
| | Change in unrealized | | | | | | | | | | | | |
| | appreciation (depreciation) | | | (271 | ) | | | (76,230 | ) | | | 93 | |
| | Transfer in/(out) of Level 3 | | | — | | | | — | | | | — | |
| | Ending Balance – September 30, 2022 | | $ | 1,990,626 | | | $ | 1,012,770 | | | $ | 93 | |
| | The total change in unrealized appreciation (depreciation) included in the Statement of Operations attributable to Level 3 investments still held at September 30, 2022, includes the following: |
| | Asset Backed | Convertible | Special Purpose | |
| | Securities | Bonds | Acquisition Companies | |
| | ($271) | ($76,230) | $93 | |
CROSSINGBRIDGE FUNDS
Notes to Financial Statements (Continued)
September 30, 2022
| | CrossingBridge Pre-Merger SPAC ETF | |
| | | | Special Purpose | |
| | | | Acquisition Companies | |
| | Beginning Balance – October 1, 2021 | | $ | — | |
| | Purchases | | | 44 | |
| | Sales | | | — | |
| | Realized gains | | | — | |
| | Realized losses | | | — | |
| | Change in unrealized appreciation (depreciation) | | | 687 | |
| | Transfer in/(out) of Level 3 | | | — | |
| | Ending Balance – September 30, 2022 | | $ | 731 | |
| | The total change in unrealized appreciation (depreciation) included in the Statement of Operations attributable to Level 3 investments still held at September 30, 2022, includes the following: |
| | Special Purpose | |
| | Acquisition Companies | |
| | $687 | |
| | The following table represents additional information about valuation methodologies and inputs used for investments that are measured at fair value and categorized within Level 3 as of September 30, 2022: |
| | |
| | CrossingBridge Low Duration High Yield Fund |
| | | | | | | | | Range/Weighted | |
| | | | Fair Value | | | | | Average | |
| | | | September 30, | | Valuation | Unobservable | | Unobservable | |
| | Description | | | 2022 | | Methodologies | Input | | Input | |
| | Convertible Bonds | | $ | 6,737,850 | | Company-specific | Market | | $93 – $100 | |
| | | | | | | information | discount | | | | |
| | | | $ | 3,724,000 | | Vendor pricing | Broker quotes | | $76 – $100 | |
| | Special Purpose | | $ | 3,605 | | Company-specific | Market | | $0 – $1 | |
| | Acquisition Companies* | | | | | information | assessment | | | | |
| | * | Table presents information for four securities, which have been valued between $0.00 and $1.32 throughout the period. |
CROSSINGBRIDGE FUNDS
Notes to Financial Statements (Continued)
September 30, 2022
| | CrossingBridge Responsible Credit Fund | |
| | | | | | | | | | | |
| | | | | | | | | | Range/Weighted | |
| | | | Fair Value | | | | | | Average | |
| | | | September 30, | | Valuation | | Unobservable | | Unobservable | |
| | Description | | 2022 | | Methodologies | | Input | | Input | |
| | Bank Loans* | | $ | 1,480,934 | | Vendor pricing | | Broker quotes | | $100 | |
| | Special Purpose | | $ | 147 | | Company-specific | | Market | | $0 – $1 | |
| | Acquisition Companies** | | | | | information | | assessment | | | | |
| | * | Table presents information for one security, which has been valued at $100.00 throughout the period. |
| | ** | Table presents information for one security, which has been valued between $0.00 and $0.69 throughout the period. |
| | CrossingBridge Ultra-Short Duration Fund |
| | | | | | | | | | Range/Weighted | |
| | | | Fair Value | | | | | | Average | |
| | | | September 30, | | Valuation | | Unobservable | | Unobservable | |
| | Description | | 2022 | | Methodologies | | Input | | Input | |
| | Asset Backed | | $ | 1,990,626 | | Vendor pricing | | Broker quotes | | $99 – $100 | |
| | Securities* | | | | | | | | | | | |
| | Convertible Bonds** | | $ | 1,012,770 | | Company-specific | | Market | | $93 – $100 | |
| | | | | | | information | | discount | | | | |
| | Special Purpose | | $ | 93 | | Company-specific | | Market | | $0 – $1 | |
| | Acquisition Companies*** | | | | | information | | assessment | | | | |
| | * | Table presents information for one security, which has been valued between $99.17 and $99.61 throughout the period. |
| | ** | Table presents information for one security, which has been valued between $93.00 and $100.00 throughout the period. |
| | *** | Table presents information for one security, which has been valued between $0.00 and $0.51 throughout the period. |
| | CrossingBridge Pre-Merger SPAC ETF | | | | | | | | | |
| | | | | | | | | | | |
| | | | | | | | | | Range/Weighted | |
| | | | Fair Value | | | | | | Average | |
| | | | September 30, | | Valuation | | Unobservable | | Unobservable | |
| | Description | | 2022 | | Methodologies | | Input | | Input | |
| | Special Purpose | | $ | 731 | | Company-specific | | Market | | $0 – $1 | |
| | Acquisition Companies* | | | | | information | | assessment | | | | |
| | * | Table presents information for three securities, which have been valued between $0.00 and $1.32 throughout the period. |
| | (b) Foreign Securities and Currency Transactions |
| | |
| | Investment securities and other assets and liabilities denominated in foreign currencies are translated into U.S. dollar amounts at the date of valuation. Purchases and sales of investment securities and income and expense items denominated in foreign currencies are translated into U.S. dollar amounts on the respective dates of such transactions. |
CROSSINGBRIDGE FUNDS
Notes to Financial Statements (Continued)
September 30, 2022
| | The Funds do not isolate the portion of the results of operations from changes in foreign exchange rates on investments from the fluctuations arising from changes in market prices of securities held. Realized foreign exchange gains or losses arising from sales of portfolio securities and sales and maturities of short-term securities are reported within realized gain (loss) on investments. Net unrealized foreign exchange gains and losses arising from changes in the values of investments in securities from fluctuations in exchange rates are reported within unrealized gain (loss) on investments. |
| | |
| | Investments in foreign securities entail certain risks. There may be a possibility of nationalization or expropriation of assets, confiscatory taxation, political or financial instability, and diplomatic developments that could affect the value of a Fund’s investments in certain foreign countries. Since foreign securities normally are denominated and traded in foreign currencies, the value of a Fund’s assets may be affected favorably or unfavorably by currency exchange rates, currency exchange control regulations, foreign withholding taxes, and restrictions or prohibitions on the repatriation of foreign currencies. There may be less information publicly available about a foreign issuer than about a U.S. issuer, and foreign issuers are not generally subject to accounting, auditing, and financial reporting standards and practices comparable to those in the United States. The securities of some foreign issuers are less liquid and at times more volatile than securities of comparable U.S. issuers. |
| | |
| | (c) Federal Income Taxes |
| | |
| | The Funds intend to comply with the requirements of Subchapter M of the Internal Revenue Code of 1986, as amended, necessary to qualify as a regulated investment company and to make the requisite distributions of income and capital gains to its shareholders sufficient to relieve it from all or substantially all federal income taxes. Therefore, no federal income tax provision has been provided. |
| | |
| | As of and during the fiscal year ended September 30, 2022, the Funds did not have liabilities for any unrecognized tax benefits. The Funds recognize interest and penalties, if any, related to unrecognized tax benefits as income tax expense in the Statements of Operations. During the fiscal year ended September 30, 2022, the Funds did not incur any interest or penalties. The Funds are subject to examination by U.S. taxing authorities for the tax periods since the commencement of operations. |
| | |
| | (d) Distributions to Shareholders |
| | |
| | In general, the Mutual Funds will distribute any net investment income monthly and any net realized capital gains at least annually. The ETF will distribute any net investment income annually and any net realized capital gains at least annually. The Funds may make additional distributions if deemed to be desirable during the year. Distributions from net realized gains for book purposes may include short-term capital gains. All short-term capital gains are included in ordinary income for tax purposes. Distributions to shareholders are recorded on the ex-dividend date. The Funds may also pay a special distribution at the end of the calendar year to comply with federal tax requirements. |
CROSSINGBRIDGE FUNDS
Notes to Financial Statements (Continued)
September 30, 2022
| | Treatment of income and capital gain distributions for federal income tax purposes may differ from GAAP, primarily due to timing differences in the recognition of income and gains and losses by the Funds. To the extent that these differences are attributable to permanent book and tax accounting differences, they are reclassified in the components of net assets. |
| | |
| | (e) Use of Estimates |
| | |
| | The preparation of financial statements in conformity with GAAP requires management to make estimates and assumptions that affect the reported amounts of assets and liabilities and disclosure of contingent assets and liabilities at the date of the financial statements and the reported amounts of revenues and expenses during the reporting period. Actual results could differ from those estimates. |
| | |
| | (f) Share Valuation |
| | |
| | The NAV per share of a Fund is calculated by dividing the sum of the value of the securities held by the Fund, plus cash or other assets, minus all liabilities (including estimated accrued expenses) by the total number of shares outstanding for the Fund, rounded to the nearest cent. The Funds’ shares will not be priced on the days on which the NYSE is closed for trading. |
| | |
| | (g) Allocation of Income, Expenses and Gains/Losses |
| | |
| | Income, expenses (other than those deemed attributable to a specific share class), and gains and losses of a Fund are allocated daily to each class of shares based upon the ratio of net assets represented by each class as a percentage of the net assets of the Fund. Expenses deemed directly attributable to a class of shares are recorded by the specific class. Most Fund expenses are allocated by class based on relative net assets. Shareholder servicing fees are currently expensed up to 0.10% of average daily net assets of each Mutual Fund’s Institutional Class shares. Expenses associated with a specific fund in the Trust are charged to that fund. Common Trust expenses are typically allocated evenly between the Mutual Funds of the Trust, or by other equitable means. |
| | |
| | (h) Other |
| | |
| | Investment transactions are recorded on the trade date. The Funds determine the gain or loss from investment transactions using the specific identification method for the best tax relief order by comparing the original cost of the security lot sold with the net sale proceeds. Interest income is recognized on an accrual basis. Withholding taxes on foreign interest, net of any reclaims, have been provided for in accordance with the Funds’ understanding of the applicable country’s tax rules and rates. Any discount or premium on securities purchased are accreted or amortized over the expected life of the respective securities using the constant yield method. |
| | |
| | (i) Loan Participation |
| | |
| | When purchasing participation interests in a loan, a Fund generally has no right to enforce compliance with the terms of the loan agreement with the borrower. As a result, a Fund may be subject to the credit risk of both the borrower and the lender that is selling the loan agreement. A Fund may enter into unfunded loan |
CROSSINGBRIDGE FUNDS
Notes to Financial Statements (Continued)
September 30, 2022
| | commitments, which are contractual obligations for future funding. Unfunded loan commitments represent a future obligation in full, even though a percentage of the notional loan amounts may not be utilized by the borrower. When investing in a loan participation agreement, a Fund has the right to receive payments of principal, interest and any fees to which it is entitled only from the lender selling the loan agreement and only upon receipt of payments by the lender from the borrower. A Fund may receive a commitment fee based on the undrawn portion of the underlying line of credit portion of a floating rate loan. In certain circumstances, a Fund may receive a penalty fee upon the prepayment of a floating rate loan by a borrower. Fees earned are recorded as a component of interest income or interest expense, respectively, on the Statements of Operations. |
| | |
| | (j) Derivatives |
| | |
| | The Funds may utilize derivative instruments such as options, swaps, futures, forward contracts and other instruments with similar characteristics to the extent that they are consistent with the Funds’ investment objectives and limitations. The use of derivatives may involve additional investment risks, including counterparty credit risk, i.e., the risk that a Fund may experience delay in obtaining financial recovery in the event a counterparty experiences financial difficulty. To mitigate this risk, the Adviser will seek to effect derivative transactions with only counterparties that they believe are creditworthy. |
| | |
| | The Funds have adopted authoritative standards regarding disclosure about derivatives and hedging activities and how they affect the Funds’ Statements of Assets and Liabilities and Statements of Operations. For the fiscal year ended September 30, 2022, the monthly average quantity and notional value of derivatives are described below: |
| | CrossingBridge Low Duration High Yield Fund | |
| | | | Monthly Average | | | Monthly Average | |
| | | | Contracts | | | Notional Value | |
| | Forward Currency Exchange Contracts | | | 4 | | | $ | 38,263,512 | |
| | Warrants | | | 588,685 | | | | 351,713 | |
| | | |
| | CrossingBridge Responsible Credit Fund | |
| | | | Monthly Average | | | Monthly Average | |
| | | | Contracts | | | Notional Value | |
| | Forward Currency Exchange Contracts | | | 2 | | | $ | 2,156,038 | |
| | Warrants | | | 7,619 | | | | 1,190 | |
| | | |
| | CrossingBridge Ultra-Short Duration Fund | |
| | | | Monthly Average | | | Monthly Average | |
| | | | Contracts | | | Notional Value | |
| | Forward Currency Exchange Contracts | | | 1 | | | $ | 1,466,944 | |
| | Warrants | | | 29,005 | | | | 4,104 | |
CROSSINGBRIDGE FUNDS
Notes to Financial Statements (Continued)
September 30, 2022
| | CrossingBridge Pre-Merger SPAC ETF | |
| | | | Monthly Average | | | Monthly Average | |
| | | | Contracts | | | Notional Value | |
| | Forward Currency Exchange Contracts | | | 1 | | | $ | 891,797 | |
| | Warrants | | | 315,467 | | | | 88,183 | |
| | | | | | | | | | |
| | Statement of Assets and Liabilities | | | | | | | | |
| | | |
| | Fair value of derivative instruments as of September 30, 2022 are described below: | |
| | | |
| | CrossingBridge Low Duration High Yield Fund | |
| | | | Asset Derivatives | |
| | | | Statement of Assets | | | | | |
| | | | and Liabilities Location | | | Fair Value | |
| | Forward Currency Exchange Contracts | | Unrealized appreciation | | | $ | 2,153,828 | |
| | | | of forward currency | | | | | |
| | | | exchange contracts | | | | | |
| | Warrants | | Investments, at value | | | | 60,919 | |
| | | |
| | CrossingBridge Responsible Credit Fund | |
| | | | Asset Derivatives | |
| | | | Statement of Assets | | | | | |
| | | | and Liabilities Location | | | Fair Value | |
| | Forward Currency Exchange Contracts | | Unrealized appreciation | | | $ | 104,272 | |
| | | | of forward currency | | | | | |
| | | | exchange contracts | | | | | |
| | Warrants | | Investments, at value | | | | — | |
| | | |
| | CrossingBridge Ultra-Short Duration Fund | |
| | | | Asset Derivatives | |
| | | | Statement of Assets | | | | | |
| | | | and Liabilities Location | | | Fair Value | |
| | Forward Currency Exchange Contracts | | Unrealized appreciation | | | $ | 72,623 | |
| | | | of forward currency | | | | | |
| | | | exchange contracts | | | | | |
| | Warrants | | Investments, at value | | | | 5,501 | |
| | | |
| | CrossingBridge Pre-Merger SPAC ETF | |
| | | | Asset Derivatives | |
| | | | Statement of Assets | | | | | |
| | | | and Liabilities Location | | | Fair Value | |
| | Forward Currency Exchange Contracts | | Unrealized appreciation | | | $ | 59,606 | |
| | | | of forward currency | | | | | |
| | | | exchange contracts | | | | | |
| | Warrants | | Investments, at value | | | | 23,686 | |
CROSSINGBRIDGE FUNDS
Notes to Financial Statements (Continued)
September 30, 2022
| | Statement of Operations |
| | |
| | The effect of derivative instruments on the Statement of Operations for the year ended September 30, 2022 are described below: |
| | CrossingBridge Low Duration High Yield Fund |
| | | Amount of Realized |
| | | Gain (Loss) on Derivatives |
| | Forward Currency Exchange Contracts | $7,120,130 |
| | Warrants | (669,587) |
| | | |
| | | Change in Unrealized Appreciation |
| | | (Depreciation) on Derivatives |
| | Forward Currency Exchange Contracts | $1,695,109 |
| | Warrants | (28,492) |
| | |
| | CrossingBridge Responsible Credit Fund |
| | | Amount of Realized |
| | | Gain (Loss) on Derivatives |
| | Forward Currency Exchange Contracts | $284,549 |
| | Warrants | (2,215) |
| | | |
| | | Change in Unrealized Appreciation |
| | | (Depreciation) on Derivatives |
| | Forward Currency Exchange Contracts | $59,536 |
| | Warrants | — |
| | |
| | CrossingBridge Ultra-Short Duration Fund |
| | | Amount of Realized |
| | | Gain (Loss) on Derivatives |
| | Forward Currency Exchange Contracts | $304,365 |
| | Warrants | (1,751) |
| | | |
| | | Change in Unrealized Appreciation |
| | | (Depreciation) on Derivatives |
| | Forward Currency Exchange Contracts | $72,623 |
| | Warrants | 3,867 |
| | |
| | CrossingBridge Pre-Merger SPAC ETF |
| | | Amount of Realized |
| | | Gain (Loss) on Derivatives |
| | Forward Currency Exchange Contracts | $151,988 |
| | Warrants | (209,239) |
| | | |
| | | Change in Unrealized Appreciation |
| | | (Depreciation) on Derivatives |
| | Forward Currency Exchange Contracts | $59,606 |
| | Warrants | (14,959) |
CROSSINGBRIDGE FUNDS
Notes to Financial Statements (Continued)
September 30, 2022
| | (k) LIBOR |
| | |
| | The London Interbank Offered Rate (“LIBOR”) is an interest rate average calculated from estimates submitted by the leading banks in London. Most maturities and currencies of LIBOR were phased out at the end of 2021, with the remaining ones to be phased out on June 30, 2023. There remains uncertainty regarding the nature of any replacement rate and the impact of the transition from LIBOR on the Funds and the financial markets generally. The Secured Overnight Funding Rate (“SOFR”) has been selected by a committee established by the Board of Governors of the Federal Reserve System and the Federal Reserve Bank of New York to replace LIBOR as a reference rate in the United States. Other countries have undertaken similar initiatives to identify replacement reference rates in their respective markets. The transition from LIBOR could have a significant impact on the financial markets, including increased volatility and illiquidity in markets for instruments that currently rely on LIBOR to determine interest rates and a reduction in the values of some LIBOR-based investments. The transition to an alternative interest rate may not be orderly, may occur over various time periods or may have unintended consequences. |
| | |
| (3) | Federal Tax Matters |
| | |
| | The tax character of distributions paid during the fiscal years or periods ended September 30, 2022 and September 30, 2021 were as follows: |
| | CrossingBridge Low Duration High Yield Fund | |
| | | | Year Ended | | | Year Ended | |
| | | | September 30, 2022 | | | September 30, 2021 | |
| | Ordinary Income | | $ | 22,048,408 | | | $ | 7,308,862 | |
| | Long Term Capital Gain | | | — | | | | — | |
| | CrossingBridge Responsible Credit Fund | |
| | | | Year Ended | | | Period Ended | |
| | | | September 30, 2022 | | | September 30, 2021(1) | |
| | Ordinary Income | | $ | 715,402 | | | $ | 71,520 | |
| | Long Term Capital Gain | | | 21,525 | | | | — | |
| | CrossingBridge Ultra-Short Duration Fund | |
| | | | Year Ended | | | Period Ended | |
| | | | September 30, 2022 | | | September 30, 2021(1) | |
| | Ordinary Income | | $ | 955,104 | | | $ | — | |
| | Long Term Capital Gain | | | — | | | | — | |
| | CrossingBridge Pre-Merger SPAC ETF | |
| | | | Year Ended | | | Period Ended | |
| | | | September 30, 2022 | | | September 30, 2021(2) | |
| | Ordinary Income | | $ | 62,424 | | | $ | — | |
| | Long Term Capital Gain | | | — | | | | — | |
| | (1) | Fund commenced investment operations on June 30, 2021. |
| | (2) | Fund commenced investment operations on September 20, 2021. |
CROSSINGBRIDGE FUNDS
Notes to Financial Statements (Continued)
September 30, 2022
| | The CrossingBridge Ultra-Short Duration Fund and CrossingBridge Pre-Merger SPAC ETF did not make any distributions to shareholders during the fiscal period ended September 30, 2021. |
| | |
| | The Funds designated as long-term capital gain dividend, pursuant to Internal Revenue Code Section 852(b)(3), the amount necessary to reduce the earnings and profits of the Fund related to net capital gain to zero for the tax year ended September 30, 2022. |
| | |
| | As of September 30, 2022, the components of accumulated earnings on a tax basis were as follows: |
| | | | CrossingBridge | | | CrossingBridge | |
| | | | Low Duration | | | Responsible | |
| | | | High Yield Fund | | | Credit Fund | |
| | Cost basis of investments for | | | | | | |
| | federal income tax purposes | | $ | 587,395,528 | | | $ | 22,942,363 | |
| | | | | | | | | | |
| | Gross tax unrealized appreciation | | | 1,090,181 | | | | 172,302 | |
| | Gross tax unrealized depreciation | | | (25,754,945 | ) | | | (1,159,188 | ) |
| | Total net tax unrealized appreciation | | | | | | | | |
| | (depreciation) on investments | | $ | (24,664,764 | ) | | $ | (986,886 | ) |
| | | | | | | | | | |
| | Undistributed ordinary income | | | 700,076 | | | | 168,245 | |
| | Undistributed long-term capital gain | | | 4,765,085 | | | | 184,392 | |
| | Total distributable earnings | | $ | 5,465,161 | | | $ | 352,637 | |
| | Other accumulated earnings (losses) | | | — | | | | (1 | ) |
| | Total accumulated earnings (losses) | | $ | (19,199,603 | ) | | $ | (634,250 | ) |
| | | | | | | | | | |
| | | | CrossingBridge | | | CrossingBridge | |
| | | | Ultra-Short | | | Pre-Merger | |
| | | | Duration Fund | | | SPAC ETF | |
| | Cost basis of investments for | | | | | | | | |
| | federal income tax purposes | | $ | 71,719,525 | | | $ | 63,365,174 | |
| | | | | | | | | | |
| | Gross tax unrealized appreciation | | | 30,905 | | | | 778,805 | |
| | Gross tax unrealized depreciation | | | (853,638 | ) | | | (758,159 | ) |
| | Total net tax unrealized appreciation | | | | | | | | |
| | (depreciation) on investments | | $ | (822,733 | ) | | $ | 20,646 | |
| | | | | | | | | | |
| | Undistributed ordinary income | | | 338,164 | | | | 503,581 | |
| | Undistributed long-term capital gain | | | 223,506 | | | | — | |
| | Total distributable earnings | | $ | 561,670 | | | $ | 503,581 | |
| | Other accumulated earnings (losses) | | | — | | | | — | |
| | Total accumulated earnings (losses) | | $ | (261,063 | ) | | $ | 524,227 | |
| | The difference between book-basis and tax-basis unrealized appreciation (depreciation) is attributable primarily to the tax deferral of losses on wash sale adjustments and tax treatment of Passive Foreign Investment Companies. |
| | |
| | At September 30, 2022, the Funds had no capital loss carryovers to be carried forward to offset future realized capital gains. |
CROSSINGBRIDGE FUNDS
Notes to Financial Statements (Continued)
September 30, 2022
| | GAAP requires that certain components of net assets relating to permanent differences be reclassified between financial and tax reporting. These reclassifications have no effect on net assets or net asset value per share. For the year ended September 30, 2022, the CrossingBridge Pre-Merger SPAC ETF made a reclassification on the Statement of Asset and Liabilities to increase Paid-in Capital by $41,793 and decrease Total Distributable Earnings by $41,793 due to permanent tax differences. No reclassifications were made for any other Fund for permanent tax differences. |
| | |
| (4) | Investment Adviser |
| | |
| | The Trust has an investment advisory agreement with the Adviser to furnish investment advisory services to the Mutual Funds. Under the terms of this agreement, the Trust, on behalf of the Mutual Funds, compensates the Adviser for its investment advisory services at the annual rate of 0.65% of each Mutual Fund’s respective average daily net assets. |
| | |
| | In addition, pursuant to a separate investment advisory agreement between the Trust, on behalf of the ETF, and the Adviser, the Adviser is responsible for managing the ETF in accordance with its investment objectives. For the services it provides the ETF, the ETF pays the Adviser a unified management fee, which is calculated daily and paid monthly, at an annual rate of 0.80% of the ETF’s average daily net assets. Under this agreement, the Adviser has agreed to pay all expenses of the ETF except interest charges on any borrowings, dividends, and other expenses on securities sold short, taxes, brokerage commissions and other expenses incurred in placing orders for the purchase and sale of securities and other investment instruments, acquired fund fees and expenses, accrued deferred tax liability, extraordinary expenses, distribution fees and expenses paid by the ETF under any distribution plan adopted pursuant to Rule 12b-1 under the 1940 Act, and the unified management fee payable to the Adviser. |
| | |
| | With respect to the Mutual Funds, the Adviser has contractually agreed to waive its management fee and/or reimburse a Fund’s other expenses at least through January 31, 2024 to the extent necessary to ensure that a Fund’s total operating expenses (exclusive of front-end or contingent deferred sales loads, distribution (12b-1) fees, shareholder servicing plan fees, taxes, leverage (i.e., any expense incurred in connection with borrowings made by a Fund), interest, brokerage commissions, expenses incurred in connection with any merger or reorganization, dividends or interest expenses on short positions, acquired fund fees and expenses and extraordinary items) (the “Expense Limitation Cap”) does not exceed 0.80% of each Mutual Fund’s respective average daily net assets. |
| | |
| | Any such waiver or reimbursement is subject to later adjustment to allow the Adviser to recoup amounts waived or reimbursed within three years from the date such amount was waived or reimbursed, subject to the operating expense limitation agreement, if such reimbursement will not cause a Mutual Fund’s expense ratio, after recoupment has been taken into account, to exceed the lesser of: (1) the Expense Limitation Cap in place at the time of the waiver and/or expense payment; or (2) the Expense Limitation Cap in place at the time of the recoupment. During the fiscal year ended September 30, 2022, the Adviser recouped $154,588 of previously waived |
CROSSINGBRIDGE FUNDS
Notes to Financial Statements (Continued)
September 30, 2022
| | expenses in the CrossingBridge Low Duration High Yield Fund. The following table shows the remaining waiver or reimbursed expenses for the Mutual Funds subject to potential recovery expiring: |
| | | | Expiring: | |
| | | | 9/30/23 | | | 9/30/24 | | | 9/30/25 | |
| | CrossingBridge Low Duration High Yield Fund | | $ | 15,477 | | | $ | 75,455 | | | $ | 1,776 | |
| | CrossingBridge Responsible Credit Fund | | | — | | | | 58,237 | | | | 182,884 | |
| | CrossingBridge Ultra-Short Duration Fund | | | — | | | | 58,690 | | | | 138,941 | |
| (5) | Distribution and Shareholder Servicing Plans |
| | |
| | The Trust has adopted a plan pursuant to Rule 12b-1 under the 1940 Act (the “12b-1 Plan”), on behalf of the CrossingBridge Low Duration High Yield Fund, which authorizes the Fund to pay Quasar Distributors, LLC (the “Distributor”) a distribution fee of 0.25% of the Fund’s average daily net assets of the Fund’s Investor Class shares for services to prospective Fund shareholders and distribution of Fund shares. The Fund incurred no fees pursuant to the 12b-1 Plan during the year ended September 30, 2022 as the Investor Class was not operational during the year. |
| | |
| | The Mutual Funds have adopted a Shareholder Servicing Plan to pay for shareholder support services from the applicable Fund’s assets pursuant to a Shareholder Servicing Agreement in an amount not to exceed 0.15% of the applicable Fund’s average daily net assets. Currently, the shareholder servicing fee authorized for each Mutual Fund is up to 0.10%; however, the fee may be increased up to 0.15% of a Fund’s daily net assets, at any time. Each Mutual Fund is responsible for paying a portion of shareholder servicing fees to each of the shareholder servicing agents who have written shareholder servicing agreements with the Fund, and perform shareholder servicing functions and maintenance of shareholder accounts on behalf of shareholders. The following table details the fees incurred for Institutional Class shares for the Mutual Funds pursuant to the Shareholder Servicing Plan during the year ended September 30, 2022, as well as the fees owed as of September 30, 2022. |
| | | | Fees incurred | | | Fees owed | |
| | CrossingBridge Low Duration High Yield Fund | | $ | 402,194 | | | $ | 102,674 | |
| | CrossingBridge Responsible Credit Fund | | | 15,353 | | | | 2,337 | |
| | CrossingBridge Ultra-Short Duration Fund | | | 52,098 | | | | 11,837 | |
| (6) | Related Party Transactions |
| | |
| | U.S. Bancorp Fund Services, LLC, doing business as U.S. Bank Global Fund Services (“Fund Services” or “Administrator”), acts as the Funds’ Administrator under an Administration Agreement. The Administrator prepares various federal and state regulatory filings, reports and returns for the Funds; prepares reports and materials to be supplied to the Trustees; monitors the activities of the Funds’ custodian, transfer agent and accountants; coordinates the preparation and payment of the Funds’ expenses and reviews the Funds’ expense accruals. Fund Services also serves as the transfer agent to the Funds and provides pricing services to the Funds. U.S. Bank, N.A. (“U.S. Bank”), an affiliate of Fund Services, serves as the Funds’ |
CROSSINGBRIDGE FUNDS
Notes to Financial Statements (Continued)
September 30, 2022
| | custodian. Fees incurred for the fiscal year ended September 30, 2022, and owed as of September 30, 2022, are as follows: |
| | Fund Administration, Accounting and Pricing | | Fees incurred | | | Fees owed | |
| | CrossingBridge Low Duration High Yield Fund | | $ | 259,164 | | | $ | 47,320 | |
| | CrossingBridge Responsible Credit Fund | | | 72,786 | | | | 12,518 | |
| | CrossingBridge Ultra-Short Duration Fund | | | 78,061 | | | | 12,772 | |
| | | | | | | | | | |
| | Transfer Agency | | Fees incurred | | | Fees owed | |
| | CrossingBridge Low Duration High Yield Fund | | $ | 78,753 | | | $ | 13,041 | |
| | CrossingBridge Responsible Credit Fund | | | 19,493 | | | | 3,633 | |
| | CrossingBridge Ultra-Short Duration Fund | | | 23,369 | | | | 4,621 | |
| | | | | | | | | | |
| | Custody | | Fees incurred | | | Fees owed | |
| | CrossingBridge Low Duration High Yield Fund | | $ | 52,143 | | | $ | 10,428 | |
| | CrossingBridge Responsible Credit Fund | | | 12,425 | | | | 1,702 | |
| | CrossingBridge Ultra-Short Duration Fund | | | 12,707 | | | | 2,399 | |
| | Under the terms of a Fund Servicing Agreement, the Adviser pays the Fund Administration and Accounting, Transfer Agency and Custody fees for the ETF. |
| | |
| | Certain officers of the Funds are also employees of Fund Services. A Trustee of the Trust is affiliated with Fund Services and U.S. Bank. |
| | |
| | The Trust’s Chief Compliance Officer is also an employee of Fund Services. The Mutual Funds’ allocation of the Trust’s Chief Compliance Officer fees incurred for the fiscal year ended September 30, 2022, and owed as of September 30, 2022, is as follows: |
| | | | Fees incurred | | | Fees owed | |
| | CrossingBridge Low Duration High Yield Fund | | $ | 11,684 | | | $ | 1,881 | |
| | CrossingBridge Responsible Credit Fund | | | 11,684 | | | | 1,881 | |
| | CrossingBridge Ultra-Short Duration Fund | | | 11,684 | | | | 1,881 | |
| | Under the terms of a Fund Servicing Agreement, the Adviser pays the Chief Compliance Officer fees for the ETF. |
| | |
| | The CrossingBridge Low Duration High Yield Fund also has a line of credit with U.S. Bank (See Note 11). |
| | |
| (7) | Capital Share Transactions |
| | Transactions in shares of the Funds were as follows: |
| | CrossingBridge Low Duration High Yield Fund | |
| | | | Year ended | | | Year ended | |
| | | | September 30, 2022 | | | September 30, 2021 | |
| | Shares sold | | | 48,487,891 | | | | 25,189,279 | |
| | Shares reinvested | | | 1,647,659 | | | | 571,682 | |
| | Shares redeemed | | | (26,255,920 | ) | | | (8,883,494 | ) |
| | Net increase | | | 23,879,630 | | | | 16,877,467 | |
CROSSINGBRIDGE FUNDS
Notes to Financial Statements (Continued)
September 30, 2022
| | CrossingBridge Responsible Credit Fund | | | | | | |
| | | | | | | Period from | |
| | | | | | | June 30, 2021(1) | |
| | | | Year ended | | | through | |
| | | | September 30, 2022 | | | September 30, 2021 | |
| | Shares sold | | | 839,077 | | | | 1,706,239 | |
| | Shares reinvested | | | 71,289 | | | | 7,151 | |
| | Shares redeemed | | | (403,090 | ) | | | (26,584 | ) |
| | Net increase | | | 507,276 | | | | 1,686,806 | |
| | | | | | | | | | |
| | CrossingBridge Ultra-Short Duration Fund | | | | | | | | |
| | | | | | | | Period from | |
| | | | | | | | June 30, 2021(1) | |
| | | | Year ended | | | through | |
| | | | September 30, 2022 | | | September 30, 2021 | |
| | Shares sold | | | 4,515,784 | | | | 3,703,466 | |
| | Shares reinvested | | | 5,815 | | | | — | |
| | Shares redeemed | | | (1,368,395 | ) | | | (3 | ) |
| | Net increase | | | 3,153,204 | | | | 3,703,463 | |
| | | | | | | | | | |
| | CrossingBridge Pre-Merger SPAC ETF | | | | | | | | |
| | | | | | | | Period from | |
| | | | | | | | September 20, 2021(1) | |
| | | | Year ended | | | through | |
| | | | September 30, 2022 | | | September 30, 2021 | |
| | Shares sold | | | 3,270,000 | | | | 290,000 | |
| | Shares reinvested | | | — | | | | — | |
| | Shares redeemed | | | (480,000 | ) | | | — | |
| | Net increase | | | 2,790,000 | | | | 290,000 | |
| | (1) | Commencement of operations. |
| (8) | Creation and Redemption Transactions |
| | |
| | Shares of the CrossingBridge Pre-Merger SPAC ETF are listed and traded on the NASDAQ Stock Market, LLC (the “Exchange”). The ETF issues and redeems shares on a continuous basis at NAV only in large blocks of shares called “Creation Units.” Creation Units are to be issued and redeemed principally in kind for a basket of securities and a balancing cash amount. Shares generally will trade in the secondary market in amounts less than a Creation Unit at market prices that change throughout the day. Market prices for the shares may be different from their NAV. The NAV is determined as of the close of trading (generally, 4:00 p.m. Eastern Time) on each day the NYSE is open for trading. The NAV of the shares of the Fund will be equal to the ETF’s total assets minus the ETF’s total liabilities divided by the total number of shares outstanding. The NAV that is published will be rounded to the nearest cent; however, for purposes of determining the price of Creation Units, the NAV will be calculated to five decimal places. |
CROSSINGBRIDGE FUNDS
Notes to Financial Statements (Continued)
September 30, 2022
| | Only “Authorized Participants” may purchase or redeem shares directly from the ETF. An Authorized Participant is either (i) a broker-dealer or other participant in the clearing process through the Continuous Net Settlement System of National Securities Clearing Corporation or (ii) a DTC participant and, in each case, must have executed a Participant Agreement with the Distributor. Most retail investors will not qualify as Authorized Participants or have the resources to buy and sell whole Creation Units. Therefore, they will be unable to purchase or redeem the shares directly from the ETF. Rather, most retail investors will purchase shares in the secondary market with the assistance of a broker and will be subject to customary brokerage commissions or fees. Securities received or delivered in connection with in-kind creates and redeems are valued as of the close of business on the effective date of the creation or redemption. |
| | |
| | Creation Unit Transaction Fee |
| | |
| | Authorized Participants will be required to pay to the Custodian a fixed transaction fee (the “Creation Transaction Fee”) in connection with the issuance of Creation Units. The standard Creation Transaction Fee will be the same regardless of the number of Creation Units purchased by an investor on the applicable Business Day. The Creation Transaction Fee for the ETF is $250. |
| | |
| | An additional variable fee of up to a maximum of 2% of the value of the Creation Units subject to the transaction may be imposed for cash purchases, nonstandard orders, or partial purchase of Creation Units. For orders comprised entirely of cash, a variable fee of 0.03% of the value of the order will be charged by the ETF. The variable charge is primarily designed to cover additional costs (e.g., brokerage, taxes) involved with buying the securities with cash. The ETF may determine to not charge a variable fee on certain orders when the Adviser has determined that doing so is in the best interests of ETF shareholders. |
| | |
| | A creation unit will generally not be issued until the transfer of good title of the deposit securities to the ETF and the payment of any cash amounts have been completed. To the extent contemplated by the applicable participant agreement, Creation Units of the ETF will be issued to such authorized participant notwithstanding the fact that the ETF’s deposits have not been received in part or in whole, in reliance on the undertaking of the authorized participant to deliver the missing deposit securities as soon as possible. If the ETF or its agents do not receive all of the deposit securities, or the required cash amounts, by such time, then the order may be deemed rejected and the authorized participant shall be liable to the ETF for losses, if any. |
| | |
| (9) | Investment Transactions |
| | |
| | The aggregate purchases and sales of securities, excluding short-term investments, for the fiscal year or period ended September 30, 2022 are summarized below: |
| | | | Purchases | | | Sales | |
| | CrossingBridge Low Duration High Yield Fund | | $ | 589,020,312 | | | $ | 445,557,710 | |
| | CrossingBridge Responsible Credit Fund | | | 28,259,717 | | | | 25,010,348 | |
| | CrossingBridge Ultra-Short Duration Fund | | | 62,445,908 | | | | 40,098,290 | |
| | CrossingBridge Pre-Merger SPAC ETF | | | 128,297,852 | | | | 74,919,083 | |
CROSSINGBRIDGE FUNDS
Notes to Financial Statements (Continued)
September 30, 2022
| | The above purchases and sales exclude any in-kind transactions associated with creations and redemptions. During the year ended September 30, 2022, the CrossingBridge Pre-Merger SPAC had $10,838,940 of creations in-kind and $7,901,299 of redemptions in-kind. |
| | |
| | There were no purchases or sales of U.S. government securities in the Funds. |
| | |
| (10) | Beneficial Ownership |
| | |
| | The beneficial ownership, either directly or indirectly, of more than 25% of the voting securities of a fund creates a presumption of control of the fund, under Section 2(a)(9) of the 1940 Act. At September 30, 2022, Charles Schwab & Co., Inc. held 48.64% of the CrossingBridge Low Duration High Yield Fund, 64.73% of the CrossingBridge Responsible Credit Fund and 30.16% of the CrossingBridge Pre-Merger SPAC ETF, respectively. National Financial Services LLC held 94.37% of the CrossingBridge Ultra-Short Duration Fund at September 30, 2022 and TD Ameritrade, Inc. held 35.97% of the CrossingBridge Pre-Merger SPAC ETF at September 30, 2022. |
| | |
| (11) | Line of Credit |
| | |
| | The CrossingBridge Low Duration High Yield Fund had a line of credit in the amount of the lesser of $50,000,000 or 33 1/3% of the fair value of unencumbered assets of the Fund, as defined, which matured on August 6, 2022. The unsecured line of credit was intended to provide short-term financing, if necessary, subject to certain restrictions, in connection with shareholder redemptions. The credit facility was with the Fund’s custodian, U.S. Bank, N.A. During the fiscal year ended September 30, 2022, the Fund did not utilize the line of credit. |
| | |
| (12) | Subsequent Events |
| | |
| | In preparing these financial statements, the Funds have evaluated events and transactions for potential recognition or disclosure through the date the financial statements were issued. |
| | |
| | On October 6, 2022, the CrossingBridge Low Duration High Yield Fund, CrossingBridge Responsible Credit Fund and CrossingBridge Ultra-Short Duration Fund (“Borrowing Funds”) and U.S. Bank, N.A. entered into an umbrella line of credit agreement in the amount of up to $60,000,000, which matures on August 5, 2023. The line of credit agreement is intended to provide short-term financing, if necessary, subject to certain restrictions, in connection with shareholder redemptions from the Borrowing Funds. Interest on amounts borrowed under the line of credit will be accrued at the prime rate. |
| | |
| | On October 28, 2022, the CrossingBridge Low Duration High Yield Fund, CrossingBridge Responsible Credit Fund and CrossingBridge Ultra-Short Duration Fund declared and paid an income distribution of $2,185,961, $110,589 and $227,844, respectively, to their Institutional Class shareholders of record on October 27, 2022. |
| | |
| | On November 29, 2022, the CrossingBridge Low Duration High Yield Fund, CrossingBridge Responsible Credit Fund and CrossingBridge Ultra-Short Duration Fund declared and paid an income distribution of $3,144,286, $51,893 and $255,538, respectively, to their Institutional Class shareholders of record on November 28, 2022. |
CROSSINGBRIDGE FUNDS
Notes to Financial Statements (Continued)
September 30, 2022
| (13) | Recent Market Events |
| | |
| | U.S. and international markets have experienced volatility in recent months and years due to a number of economic, political and global macro factors including the impact of the coronavirus (COVID-19) as a global pandemic, uncertainties regarding interest rates, rising inflation, trade tensions, and the threat of tariffs imposed by the U.S. and other countries. The recovery from COVID-19 is proceeding at slower than expected rates and may last for a prolonged period of time. As a result of continuing political tensions and armed conflicts, including the war between Ukraine and Russia, the U.S. and the European Union imposed sanctions on certain Russian individuals and companies, including certain financial institutions, and have limited certain exports and imports to and from Russia. The war has contributed to recent market volatility and may continue to do so. Continuing market volatility as a result of recent market conditions or other events may have an adverse effect on the performance of the Funds. |
CROSSINGBRIDGE FUNDS
Report of Independent Registered Public Accounting Firm
To the Shareholders of CrossingBridge Funds and
Board of Trustees of Trust for Professional Managers
Opinion on the Financial Statements
We have audited the accompanying statements of assets and liabilities, including the schedules of investments and forward currency exchange contracts, of CrossingBridge Funds comprising the funds listed below (the “Funds”), each a series of Trust for Professional Managers, as of September 30, 2022, the related statements of operations, the statements of changes in net assets, the related notes, and the financial highlights for each of the periods indicated below (collectively referred to as the “financial statements”). In our opinion, the financial statements present fairly, in all material respects, the financial position of each of the Funds as of September 30, 2022, the results of their operations, the changes in net assets, and the financial highlights for each of the periods indicated below in conformity with accounting principles generally accepted in the United States of America.
| | | Statements of | |
| | Statements of | Changes in | Financial |
| Fund Name | Operations | Net Assets | Highlights |
CrossingBridge Low | For the year ended | For the years ended | For the years ended |
Duration High Yield Fund | September 30, 2022 | September 30, 2022 | September 30, 2022, |
| | | and 2021 | 2021, 2020, and 2019, |
| | | | and for the period |
| | | | from February 1, 2018 |
| | | | (commencement of |
| | | | operations) through |
| | | | September 30, 2018 |
CrossingBridge Responsible | For the year ended | For the year ended September 30, 2022 | |
Credit Fund | September 30, 2022 | and for the period from June 30, 2021 | |
| | | (commencement of operations) through | |
| | | September 30, 2021 | |
CrossingBridge Ultra-Short | For the year ended | For the year ended September 30, 2022 | |
Duration Fund | September 30, 2022 | and for the period from June 30, 2021 | |
| | | (commencement of operations) through | |
| | | September 30, 2021 | |
CrossingBridge | For the year ended | For the year ended September 30, 2022 | |
Pre-Merger SPAC ETF | September 30, 2022 | and for the period from September 20, 2021 | |
| | | (commencement of operations) through | |
| | | September 30, 2021 | |
Basis for Opinion
These financial statements are the responsibility of the Funds’ management. Our responsibility is to express an opinion on the Funds’ financial statements based on our audits. We are a public accounting firm registered with the Public Company Accounting Oversight Board (United States) (“PCAOB”) and are required to be independent with respect to the Funds in accordance with the U.S. federal securities laws and the applicable rules and regulations of the Securities and Exchange Commission and the PCAOB.
CROSSINGBRIDGE FUNDS
Report of Independent Registered Public Accounting Firm
(Continued)
We conducted our audits in accordance with the standards of the PCAOB. Those standards require that we plan and perform the audit to obtain reasonable assurance about whether the financial statements are free of material misstatement whether due to error or fraud.
Our audits included performing procedures to assess the risks of material misstatement of the financial statements, whether due to error or fraud, and performing procedures that respond to those risks. Such procedures included examining, on a test basis, evidence regarding the amounts and disclosures in the financial statements. Our procedures included confirmation of securities owned as of September 30, 2022, by correspondence with the custodian, agent banks, and brokers; when replies were not received from brokers or agent banks, we performed other auditing procedures. Our audits also included evaluating the accounting principles used and significant estimates made by management, as well as evaluating the overall presentation of the financial statements. We believe that our audits provide a reasonable basis for our opinion.
We have served as the auditor of one or more Funds advised by CrossingBridge Advisors, LLC since 2015.

COHEN & COMPANY, LTD.
Milwaukee, Wisconsin
November 29, 2022
CROSSINGBRIDGE FUNDS
Basis for Trustees’ Approval of Investment Advisory Agreement
(Unaudited)
The Board of Trustees (the “Trustees”) of Trust for Professional Managers (the “Trust”) met on August 26, 2022 to consider the renewal of the Investment Advisory Agreement (the “Agreement”) between the Trust, on behalf of the CrossingBridge Low Duration High Yield Fund, the CrossingBridge Ultra-Short Duration Fund, and the CrossingBridge Responsible Credit Fund (each, a “Fund,” and together, the “Funds”), each a series of the Trust, and CrossingBridge Advisors, LLC (“CrossingBridge”), the Funds’ investment adviser. The Trustees also met at a prior meeting held on June 13, 2022 (the “June 13, 2022 Meeting”) to review materials related to the renewal of the Agreement. Prior to these meetings, the Trustees requested and received materials to assist them in considering the renewal of the Agreement. The materials provided contained information with respect to the factors enumerated below, including a copy of the Agreement, a memorandum prepared by the Trust’s outside legal counsel discussing in detail the Trustees’ fiduciary obligations and the factors they should assess in considering the renewal of the Agreement, detailed comparative information relating to the Funds’ performance, as well as the management fees and other expenses of the Funds, due diligence materials relating to the Adviser (including a due diligence questionnaire completed on behalf of the Funds by the Adviser, the Adviser’s Form ADV, select financial statements of the Adviser, bibliographic information of the Adviser’s key management and compliance personnel, comparative fee information for the Funds and the Adviser’s other separately-managed accounts and a summary detailing key provisions of the Adviser’s written compliance program, including its code of ethics) and other pertinent information. The Trustees also received information periodically throughout the year that was relevant to the Agreement renewal process, including performance, management fee and other expense information. Based on their evaluation of the information provided by the Adviser, in conjunction with the Funds’ other service providers, the Trustees, by a unanimous vote (including a separate vote of the Trustees who are not “interested persons,” as that term is defined in the Investment Company Act of 1940, as amended (the “Independent Trustees”)), approved the continuation of the Agreement for an additional one-year term ending August 31, 2023.
DISCUSSION OF FACTORS CONSIDERED
In considering the renewal of the Agreement and reaching their conclusions, the Trustees reviewed and analyzed various factors that they determined were relevant, including the factors enumerated below.
| 1. | NATURE, EXTENT AND QUALITY OF SERVICES PROVIDED TO THE FUNDS |
| | |
| | The Trustees considered the nature, extent and quality of services provided by the Adviser to the Funds and the amount of time devoted to the Funds’ operation by the Adviser’s staff. The Trustees considered the Adviser’s specific responsibilities in all aspects of day-to-day management of the Funds, including the investment strategies implemented by the Adviser, as well as the qualifications, experience and responsibilities of David K. Sherman, Lead Portfolio Manager for each of the Funds, and T. Kirk Whitney, Assistant Portfolio Manager for each of the Funds, and other key personnel at the Adviser involved in the day-to-day activities of the Funds. The Trustees reviewed information provided by the Adviser in a due diligence questionnaire, including the structure of the Adviser’s compliance program and its |
CROSSINGBRIDGE FUNDS
Basis for Trustees’ Approval of Investment Advisory Agreement
(Unaudited) (Continued)
| | continuing commitment to the Funds. The Trustees noted that during the course of the prior year the Adviser had participated in a Trust board meeting to discuss the Funds’ performance and outlook, along with the compliance efforts made by the Adviser. The Trustees also noted any services that extended beyond portfolio management, and they considered the brokerage practices of the Adviser. The Trustees discussed the Adviser’s handling of compliance matters, including the reports of the Trust’s chief compliance officer to the Trustees on the effectiveness of the Adviser’s compliance program. The Trustees also considered the Adviser’s overall financial condition, as well as the implementation and operational effectiveness of the Adviser’s business continuity plan in response to the COVID-19 pandemic. The Trustees concluded that the Adviser had sufficient quality and depth of personnel, resources, investment methods and compliance policies and procedures essential to performing its duties under the Advisory Agreement and that the nature, overall quality and extent of the management services provided to the Funds, as well as the Adviser’s compliance program, were satisfactory and reliable. |
| | |
| 2. | INVESTMENT PERFORMANCE OF THE FUNDS AND THE ADVISER |
| | |
| | The Trustees discussed the performance of the Institutional Class shares of each of the Funds for the quarter, one-year, three-year and since inception periods ended March 31, 2022, as applicable. In assessing the quality of the portfolio management services delivered by the Adviser, the Trustees also compared the short-term and longer-term performance of the Institutional Class shares of the Funds on both an absolute basis and in comparison to each Fund’s primary benchmark index (the ICE BofA 0-3 Year U.S. High Yield Excluding Financials Index for the CrossingBridge Low Duration High Yield Fund, the ICE BofA 0-1 Year U.S. Corporate Index for the CrossingBridge Ultra-Short Duration Fund, and the ICE BofA U.S. High Yield Index for the CrossingBridge Responsible Credit Fund) and in comparison to a peer group of funds as constructed using publicly-available data provided by Morningstar, Inc. and presented by Barrington Financial Group, LLC d/b/a Barrington Partners, an independent third-party benchmarking firm, through its cohort selection process (a peer group of U.S. open-end ultrashort bond, short-term bond and multisector bond funds for the CrossingBridge Low Duration High Yield Fund, a peer group of U.S. open-end short-term bond, high yield bond and ultrashort bond funds for the CrossingBridge Ultra-Short Duration Fund, and a peer group of U.S. open-end ultrashort bond, short-term bond, high yield bond and multisector bond funds for the CrossingBridge Responsible Credit Fund) (each, a “Barrington Cohort”). The Trustees noted that the Adviser sub-advises a mutual fund and manages its segment of the mutual fund’s portfolio with an investment strategy substantially similar to that of the CrossingBridge Low Duration High Yield Fund. The Trustees also noted that the Adviser did not manage any other accounts with the same or similar investment strategies as either of the CrossingBridge Ultra-Short Duration Fund or the CrossingBridge Responsible Credit Fund. |
| | |
| | The Trustees noted the CrossingBridge Low Duration High Yield Fund’s performance for Institutional Class shares for the one-year and three-year periods ended |
CROSSINGBRIDGE FUNDS
Basis for Trustees’ Approval of Investment Advisory Agreement
(Unaudited) (Continued)
| | March 31, 2022 was above the Barrington Cohort average. The Trustees noted that for each of the quarter, one-year, three-year, and since inception periods ended March 31, 2022, the Institutional Class shares of the CrossingBridge Low Duration High Yield Fund had outperformed the ICE BofA 0-3 Year U.S. High Yield Excluding Financials Index. The Trustees also noted that the performance of the CrossingBridge Low Duration High Yield Fund was in-line with the performance of the segment of the separate comparable mutual fund sub-advised by the Adviser taking into account cash flows and slight differences in investment guidelines. |
| | |
| | The Trustees noted the CrossingBridge Ultra-Short Duration Fund did not yet have a full year of performance as of March 31, 2022, and therefore a comparison of the performance of the Fund to the Barrington Cohort was not available. The Trustees noted that for the quarter and since inception periods ended March 31, 2022, the CrossingBridge Ultra-Short Duration Fund had outperformed the ICE BofA 0-1 Year U.S. Corporate Index. |
| | |
| | The Trustees noted the CrossingBridge Responsible Credit Fund did not yet have a full year of performance as of March 31, 2022, and therefore a comparison of the performance of the Fund to the Barrington Cohort was not available. The Trustees noted that for the quarter and since inception periods ended March 31, 2022, the CrossingBridge Responsible Credit Fund had outperformed the ICE BofA U.S. High Yield Index. |
| | |
| | After considering all of the information, the Trustees concluded that the performance obtained by the Adviser for each Fund was satisfactory under current market conditions. Although past performance is not a guarantee or indication of future results, the Trustees determined that each Fund and its shareholders were likely to benefit from the Adviser’s continued management. |
| | |
| 3. | COSTS OF SERVICES PROVIDED AND PROFITS REALIZED BY THE ADVISER |
| | |
| | The Trustees considered the cost of services and the structure of the Adviser’s fees, including a review of the expense analyses and other pertinent material with respect to the Funds. The Trustees reviewed the related statistical information and other materials provided, including the comparative expenses and Barrington Cohort comparisons. The Trustees considered the cost structure of each Fund relative to the Barrington Cohort, as well as any fee waivers and expense reimbursements of the Adviser. |
| | |
| | The Trustees also considered the overall profitability of the Adviser and reviewed the Adviser’s financial information, noting that the Adviser had provided substantial subsidies for each Fund’s operations since its inception and has not yet recouped those subsidies. The Trustees also examined the level of profits that could be expected to accrue to the Adviser from the fees payable under the Advisory Agreement and the expense subsidization undertaken by the Adviser with respect to each Fund, as well as each Funds’ brokerage practices and use of soft dollars by the Adviser. These considerations were based on materials requested by the Trustees and the Funds’ administrator specifically for the June 13, 2022 meeting and the |
CROSSINGBRIDGE FUNDS
Basis for Trustees’ Approval of Investment Advisory Agreement
(Unaudited) (Continued)
| | August 26, 2022 meeting at which the Advisory Agreement was formally considered, as well as the reports prepared by the Adviser over the course of the year. |
| | |
| | The Trustees noted that the CrossingBridge Low Duration High Yield Fund’s contractual management fee of 0.65% was above the Barrington Cohort average of 0.38%. The Trustees noted that the CrossingBridge Low Duration High Yield Fund was operating above its expense cap of 0.80% for Institutional Class shares. The Trustees observed that the CrossingBridge Low Duration High Yield Fund’s total expense ratio (net of fee waivers and expense reimbursements and including shareholder servicing plan fees) of 0.88% for Institutional Class shares was above the Barrington Cohort average of 0.49%. The Trustees also compared the fees paid by the CrossingBridge Low Duration High Yield Fund to the sub-advisory fees paid to the Adviser by the sub-advised mutual fund with a substantially similar investment strategy. |
| | |
| | The Trustees noted that the CrossingBridge Ultra-Short Duration Fund’s contractual management fee of 0.65% was above the Barrington Cohort average of 0.56%. The Trustees noted that the CrossingBridge Ultra-Short Duration Fund was operating above its expense cap of 0.80% for Institutional Class shares. The Trustees observed that the CrossingBridge Ultra-Short Duration Fund’s total expense ratio (net of fee waivers and expense reimbursements and including shareholder servicing plan fees) of 0.90% for Institutional Class shares was above the Barrington Cohort average of 0.65%. |
| | |
| | The Trustees noted that the CrossingBridge Responsible Credit Fund’s contractual management fee of 0.65% was above the Barrington Cohort average of 0.45%. The Trustees noted that the CrossingBridge Responsible Credit Fund was operating above its expense cap of 0.80% for Institutional Class shares. The Trustees observed that the CrossingBridge Responsible Credit Fund’s total expense ratio (net of fee waivers and expense reimbursements and including shareholder servicing plan fees) of 0.91% for Institutional Class shares was above the Barrington Cohort average of 0.58%. |
| | |
| | The Trustees concluded that the Funds’ expenses and the management fees paid to the Adviser were fair and reasonable in light of the comparative performance, expense and management fee information. The Trustees noted, based on a profitability analysis prepared by the Adviser, that the Adviser’s profits from sponsoring each of the CrossingBridge Low Duration High Yield Fund and CrossingBridge Ultra-Short Duration Fund were not excessive and while the CrossingBridge Responsible Credit Fund was not yet profitable to the Adviser, the Adviser maintained adequate profit levels to support the services to the Funds from the revenues of its overall investment advisory business, despite its subsidies to support the operations of the CrossingBridge Responsible Credit Fund. |
| | |
| 4. | EXTENT OF ECONOMIES OF SCALE AS THE FUNDS GROW |
| | |
| | The Trustees compared each Fund’s expenses relative to its peer group and discussed realized and potential economies of scale. The Trustees also reviewed the |
CROSSINGBRIDGE FUNDS
Basis for Trustees’ Approval of Investment Advisory Agreement
(Unaudited) (Continued)
| | structure of each Fund’s management fee and whether each Fund was large enough to generate economies of scale for shareholders or whether economies of scale would be expected to be realized as Fund assets grow (and if so, how those economies of scale were being or would be shared with shareholders). The Trustees reviewed all fee waivers, expense reimbursements and potential recoupments by the Adviser with respect to the Funds. The Trustees noted that the Funds’ management fee structures did not contain any breakpoint reductions as each Fund’s assets grow in size, but that the feasibility of incorporating breakpoints would continue to be reviewed on a regular basis. With respect to the Adviser’s fee structures, the Trustees concluded that the current fee structures were reasonable and reflected a sharing of economies of scale between the Adviser and each Fund at the Fund’s current asset level. |
| | |
| 5. | BENEFITS DERIVED FROM THE RELATIONSHIP WITH THE FUNDS |
| | |
| | The Trustees considered the direct and indirect benefits that could be received by the Adviser from its association with the Funds. The Trustees examined the brokerage practices of the Adviser with respect to the Funds. The Trustees concluded that the benefits the Adviser may receive, such as greater name recognition and increased ability to obtain research or brokerage services or attract additional investor assets, appear to be reasonable, and in many cases may benefit the Funds. |
CONCLUSIONS
The Trustees considered all of the foregoing factors. In considering the renewal of the Advisory Agreement, the Trustees did not identify any one factor as all-important, but rather considered these factors collectively in light of each Fund’s surrounding circumstances. Based on this review, the Trustees, including a majority of the Independent Trustees, approved the continuation of the Advisory Agreement for an additional term ending August 31, 2023 as being in the best interests of each Fund and its shareholders.
CROSSINGBRIDGE FUNDS
Review of Liquidity Risk Management Program
(Unaudited)
In accordance with Rule 22e-4 under the Investment Company Act of 1940, as amended, Trust for Professional Managers (the “Trust”) has adopted and implemented a liquidity risk management program (the “Trust Program”). As required under the Trust Program, CrossingBridge Advisors, LLC (“CrossingBridge”), the investment adviser to the CrossingBridge Low Duration High Yield Fund, CrossingBridge Responsible Credit Fund, CrossingBridge Ultra-Short Duration Fund and CrossingBridge Pre-Merger SPAC ETF (the "Funds"), each a separate series of the Trust, adopted and implemented a liquidity risk management program tailored specifically to the Funds (the “Adviser Program”). The Adviser Program seeks to promote effective liquidity risk management for the Funds and to protect the Funds’ shareholders from dilution of their interests. The Board of Trustees (the “Board”) of the Trust has approved CrossingBridge as the administrator for the Adviser Program (the “Program Administrator”). The Program Administrator has further delegated administration of the Adviser Program to its Liquidity Risk Management Committee. The Program Administrator is required to provide a written annual report to the Board and the Trust’s chief compliance officer regarding the adequacy and effectiveness of the Adviser Program, including the operation of each Fund’s highly liquid investment minimum, if applicable, and any material changes to the Adviser Program.
On April 13, 2022, the Board reviewed the Program Administrator’s written annual report for the period January 1, 2021 through December 31, 2021 (the “Report”). The Report provided an assessment of each Fund’s liquidity risk: the risk that each Fund could not meet requests to redeem shares issued by the respective Fund without significant dilution of the remaining investors’ interests in the Fund. The Adviser Program assesses liquidity risk under both normal and reasonably foreseeable stressed market conditions. The Program Administrator has retained ICE Data Services, Inc., a third party vendor, to provide portfolio investment classification services, and the Report noted that the Funds primarily held investments that were classified as highly liquid during the review period. The Report noted that each Fund’s portfolio is expected to continue to primarily hold highly liquid investments and the determination that each of the CrossingBridge Low Duration High Yield Fund, CrossingBridge Responsible Credit Fund and CrossingBridge Ultra-Short Duration Fund be designated as a “primarily highly liquid fund” (as defined in Rule 22e-4) and that the CrossingBridge Pre-Merger SPAC ETF be designated as an “in-kind ETF” (as defined in Rule 22e-4) remains appropriate and the Funds can therefore continue to rely on the exclusion in Rule 22e-4 from the requirements to determine and review a highly liquid investment minimum for each Fund and to adopt policies and procedures for responding to a highly liquid investment minimum shortfall. The Report noted that there were no breaches of the Funds’ restrictions on holding illiquid investments exceeding 15% of its net assets during the review period. The Report confirmed that each Fund’s investment strategy was appropriate for an open-end management investment company. The Report also indicated that no material changes had been made to the Adviser Program during the review period.
The Program Administrator determined that the Funds are reasonably likely to be able to meet redemption requests without adversely affecting non-redeeming Fund shareholders through significant dilution. The Program Administrator concluded that the Adviser Program was adequately designed and effectively implemented during the review period.
CROSSINGBRIDGE FUNDS
Additional Information
(Unaudited)
Tax Information
The Percentage of taxable ordinary income distributions that are designated as short-term capital gain distributions under Internal Revenue Section 871(k)(2)(C) for each Fund were as follows:
| | CrossingBridge Low Duration High Yield Fund | 25.23% | |
| | CrossingBridge Responsible Credit Fund | 2.56% | |
| | CrossingBridge Ultra-Short Duration Fund | 4.73% | |
| | CrossingBridge Pre-Merger SPAC ETF | 0.00% | |
For the fiscal year or period ended September 30, 2022, certain dividends paid by the Funds may be subject to a maximum tax rate of 20%, as provided for by the Jobs and Growth Tax Relief Reconciliation Act of 2003. The percentage of dividends declared from ordinary income designated as qualified dividend income were as follows:
| | CrossingBridge Low Duration High Yield Fund | 0.51% | |
| | CrossingBridge Responsible Credit Fund | 0.00% | |
| | CrossingBridge Ultra-Short Duration Fund | 2.76% | |
| | CrossingBridge Pre-Merger SPAC ETF | 0.73% | |
For corporate shareholders, the percent of ordinary income distributions qualifying for the corporate dividends received deduction for the fiscal year were as follows:
| | CrossingBridge Low Duration High Yield Fund | 0.51% | |
| | CrossingBridge Responsible Credit Fund | 0.00% | |
| | CrossingBridge Ultra-Short Duration Fund | 2.76% | |
| | CrossingBridge Pre-Merger SPAC ETF | 0.73% | |
Indemnifications
Under the Trust’s organizational documents, its Officers and Trustees are indemnified against certain liabilities arising out of the performance of their duties to the Funds. In addition, in the normal course of business, the Funds enter into contracts that provide general indemnifications to other parties. A Fund’s maximum exposure under these arrangements is unknown as this would involve future claims that may be made against the Funds that have not yet occurred. However, the Funds have not had prior claims or losses pursuant to these contracts and expects the risk of loss to be remote.
CROSSINGBRIDGE FUNDS
Additional Information (Continued)
(Unaudited)
Information about Trustees
The business and affairs of the Trust are managed under the direction of the Board of Trustees. Information pertaining to the Trustees of the Trust is set forth below. The Statement of Additional Information includes additional information about the Trustees and is available, without charge, upon request by calling 1-888-898-2780.
| | | | | | Other |
| | | | | | Directorships |
| | | | Number of | | Held by |
| | | Term of | Portfolios | Principal | Trustee |
| Name, | Position(s) | Office and | in Trust | Occupation(s) | During |
| Address and | Held with | Length of | Overseen | During the Past | the Past |
Year of Birth | the Trust | Time Served | by Trustee | Five Years | Five Years |
| | | | | | |
| Independent Trustees | | | | | |
| | | | | | |
Michael D. | Trustee | Indefinite | 26 | Professor | Independent |
Akers, Ph.D. | | Term; Since | | Emeritus, | Trustee, USA |
615 E. Michigan St. | | August 22, | | Department of | MUTUALS |
Milwaukee, WI 53202 | | 2001 | | Accounting | (an open-end |
Year of Birth: 1955 | | | | (June 2019– | investment |
| | | | | Present), | company) |
| | | | | Professor, | (2001–2021). |
| | | | | Department of | |
| | | | | Accounting | |
| | | | | (2004–2019), | |
| | | | | Chair, | |
| | | | | Department | |
| | | | | of Accounting | |
| | | | | (2004–2017), | |
| | | | | Marquette | |
| | | | | University. | |
| | | | | | |
Gary A. Drska | Trustee | Indefinite | 26 | Retired; | Independent |
615 E. Michigan St. | | Term; Since | | Former Pilot, | Trustee, USA |
Milwaukee, WI 53202 | | August 22, | | Frontier/Midwest | MUTUALS |
Year of Birth: 1956 | | 2001 | | Airlines, Inc. | (an open-end |
| | | | | (airline company) | investment |
| | | | | (1986–2021). | company) |
| | | | | | (2001–2021). |
CROSSINGBRIDGE FUNDS
Additional Information (Continued)
(Unaudited)
| | | | | | Other |
| | | | | | Directorships |
| | | | Number of |
| Held by |
| | | Term of | Portfolios | | Trustee |
| Name, | Position(s) | | in Trust | Occupation(s) | During |
| Address and | Held with | | Overseen | During the Past | the Past |
Year of Birth | | Time Served | by Trustee | Five Years | Five Years |
| | | | | | |
Vincent P. Lyles | Trustee | Indefinite | 26 | System Vice | Independent |
615 E. Michigan St. | | Term; Since | | President of | Director, BMO |
Milwaukee, WI 53202 | | April 6, | | Community | Funds, Inc. |
Year of Birth: 1961 | | 2022 | | Relations, | (an open-end |
| | | | | Advocate | investment |
| | | | | Aurora Health | company) |
| | | | | Care (health | (2017–2022). |
| | | | | care provider) |
|
| | | | | (2019–present); |
|
| | | | | President and |
|
| | | | | Chief Executive |
|
| | | | | Officer, Boys & |
|
| | | | | Girls Club of |
|
| | | | | Greater |
|
| | | | | Milwaukee |
|
| | | | | (2012–2018). |
|
| | | | | | |
Erik K. Olstein | Trustee | Indefinite | 26 | Retired; | Trustee, The |
615 E. Michigan St. | | Term; Since | | President and | Olstein Funds |
Milwaukee, WI 53202 | | April 6, | | Chief Operating | (an open-end |
Year of Birth: 1967 | | 2022 | | Officer (2000– | investment |
| | | | | 2020), Vice | company) |
| | | | | President of | |
| | | | | Sales and Chief |
|
| | | | | Operating Officer |
|
| | | | | (1995–2000), |
|
| | | | | Olstein Capital |
|
| | | | | Management, |
|
| | | | | L.P. (asset |
|
| | | | | management |
|
| | | | | firm); Secretary |
|
| | | | | and Assistant |
|
| | | | | Treasurer, The |
|
| | | | | Olstein Funds |
|
| | | | | (1995–2018). |
|
CROSSINGBRIDGE FUNDS
Additional Information (Continued)
(Unaudited)
| | | | | | Other |
| | | | | | Directorships |
| | | | Number of | | Held by |
| | | Term of | Portfolios | Principal | Trustee |
| Name, | Position(s) | Office and | in Trust | Occupation(s) | During |
| Address and | Held with | Length of | Overseen | During the Past | |
Year of Birth | | Time Served | | Five Years | Five Years |
| | | | | | |
Lisa Zúñiga Ramírez | Trustee | Indefinite | 26 | Retired; | N/A |
615 E. Michigan St. | | Term; Since | | Principal and | |
Milwaukee, WI 53202 | | April 6, | | Senior Portfolio | |
Year of Birth: 1969 | | 2022 | | Manager, Segall, | |
| | | | | Bryant & Hamill, |
|
| | | | | LLC (asset |
|
| | | | | management |
|
| | | | | firm) (2018– |
|
| | | | | 2020); Partner |
|
| | | | | and Senior |
|
| | | | | Portfolio |
|
| | | | | Manager, Denver |
|
| | | | | Investments |
|
| | | | | LLC (asset |
|
| | | | | management |
|
| | | | | firm) (2009–2018). |
|
| | | | | | |
Gregory M. Wesley | Trustee | Indefinite | 26 | Senior Vice | N/A |
615 E. Michigan St. | | Term; Since | | President of | |
Milwaukee, WI 53202 | | April 6, | | Strategic | |
Year of Birth: 1969 | | 2022 | | Alliances and | |
| | | | | Business |
|
| | | | | Development, |
|
| | | | | Medical College |
|
| | | | | of Wisconsin |
|
| | | | | (2016–present). |
|
| Interested Trustee and Officers | | | | | |
Joseph C. Neuberger* | Chairperson | Indefinite | 26 | President | Trustee, |
615 E. Michigan St. | and Trustee | Term; Since | | (2017–present), | Buffalo Funds |
Milwaukee, WI 53202 | | August 22, | | Chief Operating | (an open-end |
Year of Birth: 1962 | | 2001 | | Officer | investment |
| | | | | (2016–2020), | company) |
| | | | | Executive Vice | |
| | | | | President | Trustee, USA |
| | | | | (1994–2017), | MUTUALS |
| | | | | U.S. Bancorp | |
| | | | | Fund Services, | investment |
| | | | | LLC. | company) |
| | | | | | (2001–2018). |
* | Mr. Neuberger is deemed to be an “interested person” of the Trust as defined by the 1940 Act due to his position and material business relationship with the Trust. |
CROSSINGBRIDGE FUNDS
Additional Information (Continued)
(Unaudited)
| | | | | | Other |
| | | | | | Directorships |
| | | | Number of |
| Held by |
| | | Term of | Portfolios | | Trustee |
| Name, | Position(s) | | | | During |
| Address and | | | | During the Past | the Past |
Year of Birth | the Trust | | | | |
| | | | | | |
John P. Buckel | President | Indefinite | N/A | Vice President, | N/A |
615 E. Michigan St. | and | Term; Since | | U.S. Bancorp | |
Milwaukee, WI 53202 | Principal | January 24, | | Fund Services, | |
Year of Birth: 1957 | Executive | 2013 | | LLC (2004– | |
| | | Officer | | present). |
|
| | | | | | |
Jennifer A. Lima | Vice | Indefinite | N/A | Vice President, | N/A |
615 E. Michigan St. | President, | Term; Since | | U.S. Bancorp | |
Milwaukee, WI 53202 | Treasurer | January 24, | | Fund Services, | |
Year of Birth: 1974 | and | 2013 | | LLC (2002– | |
| | Principal |
| | present). |
|
| | Financial
|
| | | |
| | and
|
| | | |
| | Accounting
|
| | | |
| | Officer
|
| | | |
| | | | | | |
Deanna B. Marotz | Chief | Indefinite | N/A | Senior Vice | N/A |
615 E. Michigan St. | Compliance | Term; Since | | President, U.S. | |
Milwaukee, WI 53202 | Officer, | October 21, | | Bancorp Fund | |
Year of Birth: 1965 | Senior Vice | 2021 | | Services, LLC | |
| | President |
| | (2021–present); |
|
| | and
|
| | Chief Compliance |
|
| | Anti-Money
|
| | Officer, Keeley-Teton |
|
| | Laundering
|
| | Advisors, LLC and |
|
| | Officer
|
| | Teton Advisors, |
|
| | | | | Inc (2017–2021); |
|
| | | | | Chief Compliance |
|
| | | | | Officer, Keeley |
|
| | | | | Asset Management |
|
| | | | | Corp. (2015–2017). |
|
| | | | | | |
Jay S. Fitton | Secretary | Indefinite | N/A | Assistant Vice | N/A |
615 E. Michigan St. | | Term; Since | | President, U.S. | |
Milwaukee, WI 53202 | | July 22, | | Bancorp Fund | |
Year of Birth: 1970 | | 2019 | | Services, LLC | |
| | | | | (2019–present); |
|
| | | | | Partner, Practus, |
|
| | | | | LLP (2018–2019); |
|
| | | | | Counsel, Drinker |
|
| | | | | Biddle & Reath, |
|
| | | | | LLP (2016–2018). |
|
CROSSINGBRIDGE FUNDS
Additional Information (Continued)
(Unaudited)
| | | | | | Other |
| | | | | | Directorships |
| | | | Number of |
| Held by |
| | | Term of | Portfolios | | Trustee |
| Name, | Position(s) | Office and | | Occupation(s) | During |
| Address and | | Length of | Overseen | During the Past | the Past |
Year of Birth | | Time Served | by Trustee | Five Years | Five Years |
| | | | | | |
Kelly A. Strauss | Assistant | Indefinite | N/A | Assistant Vice | N/A |
615 E. Michigan St. | Treasurer | Term; Since | | President, U.S. | |
Milwaukee, WI 53202 | | April 23, | | Bancorp Fund | |
Year of Birth: 1987 | | 2015 | | Services, LLC | |
| | | | | (2011–present). |
|
| | | | | | |
Laura A. Carroll | Assistant | Indefinite | N/A | Assistant Vice | N/A |
615 E. Michigan St. | Treasurer | Term; Since | | President, U.S. | |
Milwaukee, WI 53202 | | August 20, | | Bancorp Fund | |
Year of Birth: 1985 | | 2018 | | Services, LLC | |
| | | | | (2007–present). |
|
(This Page Intentionally Left Blank.)
A NOTE ON FORWARD LOOKING STATEMENTS (Unaudited)
Except for historical information contained in this report for the Funds, the matters discussed in this report may constitute forward-looking statements made pursuant to the safe-harbor provisions of the Private Securities Litigation Reform Act of 1995. These include any adviser or portfolio manager predictions, assessments, analyses or outlooks for individual securities, industries, market sectors and/or markets. These statements involve risks and uncertainties. In addition to the general risks described for the Funds in the current Prospectus, other factors bearing on this report include the accuracy of the adviser’s or portfolio managers’ forecasts and predictions, and the appropriateness of the investment programs designed by the adviser or portfolio managers to implement their strategies efficiently and effectively. Any one or more of these factors, as well as other risks affecting the securities markets and investment instruments generally, could cause the actual results of a Fund to differ materially as compared to benchmarks associated with the Fund.
ADDITIONAL INFORMATION (Unaudited)
The Funds have adopted proxy voting policies and procedures that delegate to the Adviser the authority to vote proxies. A description of the Funds’ proxy voting policies and procedures is available without charge, upon request, by calling the Funds’ toll free at 1-888-898-2780. A description of these policies and procedures is also included in a Fund’s Statement of Additional Information, which is available on the SEC’s website at http://www.sec.gov.
A Fund’s proxy voting record for the most recent 12-month period ended June 30 (as applicable) is available without charge, upon request, by calling, toll free, 1-888-898-2780, or by accessing the SEC’s website at http://www.sec.gov.
The Funds file their complete schedules of portfolio holdings with the SEC for the first and third quarters of each fiscal year on Part F of Form N-PORT. Shareholders may view a Fund’s filings (as applicable) on the SEC’s website at www.sec.gov.
HOUSEHOLDING (Unaudited)
In an effort to decrease costs, the Funds intend to reduce the number of duplicate prospectuses and certain other shareholder documents you receive by sending only one copy of each to those addresses shared by two or more accounts and to shareholders the Funds reasonably believes are from the same family or household. Once implemented, if you would like to discontinue householding for your accounts, please call toll-free at 1-888-898-2780 to request individual copies of these documents. Once a Fund receives notice to stop householding, the Fund will begin sending individual copies 30 days after receiving your request. This policy does not apply to account statements.
FREQUENCY DISTRIBUTION OF PREMIUMS AND DISCOUNTS (Unaudited)
Information regarding how often shares of the CrossingBridge Pre-Merger SPAC ETF trade on an exchange at a price above (i.e., at a premium) or below (i.e., at a discount) the NAV of the ETF is available without charge, on the ETF’s website at www.crossingbridgefunds.com.
CROSSINGBRIDGE FUNDS
| Investment Adviser | CrossingBridge Advisors, LLC |
| | 427 Bedford Road, Suite 220 |
| | Pleasantville, New York 10570 |
| | |
| Legal Counsel | Godfrey & Kahn, S.C. |
| | 833 East Michigan Street, Suite 1800 |
| | Milwaukee, Wisconsin 53202 |
| | |
| Independent Registered Public | Cohen & Company, Ltd. |
| Accounting Firm | 342 North Water Street, Suite 830 |
| | Milwaukee, Wisconsin 53202 |
| | |
| Transfer Agent, Fund Accountant and | U.S. Bancorp Fund Services, LLC |
| Fund Administrator | 615 East Michigan Street |
| | Milwaukee, Wisconsin 53202 |
| | |
| Custodian | U.S. Bank, N.A. |
| | Custody Operations |
| | 1555 North River Center Drive |
| | Milwaukee, Wisconsin 53212 |
| | |
| Distributors | Quasar Distributors, LLC |
| | 111 East Kilbourn Avenue, Suite 1250 |
| | Milwaukee, Wisconsin 53202 |
| | |
| | Foreside Fund Services, LLC |
| | Three Canal Plaza, Suite 100 |
| | Portland, Maine 04101 |
This report is intended for shareholders of the Funds and may not be used as sales literature unless preceded or accompanied by a current prospectus.
(b) Not applicable.
Item 2. Code of Ethics.
The registrant has adopted a code of ethics that applies to the registrant’s principal executive officer and principal financial officer. The registrant has not made any amendments to its code of ethics during the period covered by this report. The registrant has not granted any waivers from any provisions of the code of ethics during the period covered by this report. A copy of the registrant’s Code of Ethics is incorporated by reference to the Registrant’s Form N-CSR filed on December 10, 2018.
Item 3. Audit Committee Financial Expert.
The registrant’s board of trustees has determined that there is at least one audit committee financial expert serving on its audit committee. Dr. Michael Akers is the “audit committee financial expert” and is considered to be “independent” as each term is defined in Item 3 of Form N‑CSR. Dr. Akers holds a Ph.D. in accountancy and is a professor Emeritus of accounting at Marquette University in Milwaukee, Wisconsin.
Item 4. Principal Accountant Fees and Services.
The registrant has engaged its principal accountant to perform audit services, audit-related services, tax services and other services during the past two fiscal years. “Audit services” refer to performing an audit of the registrant's annual financial statements or services that are normally provided by the accountant in connection with statutory and regulatory filings or engagements for those fiscal years. “Audit-related services” refer to the assurance and related services by the principal accountant that are reasonably related to the performance of the audit. “Tax services” refer to professional services rendered by the principal accountant for tax compliance, tax advice, and tax planning. The following table details the aggregate fees billed or expected to be billed for each of the last two fiscal years for audit fees, audit-related fees, tax fees and other fees by the principal accountant.
| | FYE 9/30/2022 | FYE 9/30/2021 |
(a) Audit Fees | $75,500 | $54,500 |
(b) Audit-Related Fees | 0 | 0 |
(c) Tax Fees | 14,000 | 11,500 |
(d) All Other Fees | 0 | 0 |
(e)(1) The audit committee has adopted pre-approval policies and procedures that require the audit committee to pre‑approve all audit and non‑audit services of the registrant, including services provided to any entity affiliated with the registrant.
(e)(2) The percentage of fees billed by Cohen & Company, Ltd. applicable to non-audit services pursuant to waiver of pre-approval requirement were as follows:
| | FYE 9/30/2022 | FYE 9/30/2021 |
Audit-Related Fees | 0% | 0% |
Tax Fees | 0% | 0% |
All Other Fees | 0% | 0% |
(f) All of the principal accountant’s hours spent on auditing the registrant’s financial statements were attributed to work performed by full‑time permanent employees of the principal accountant.
(g) The following table indicates the non-audit fees billed or expected to be billed by the registrant’s accountant for services to the registrant and to the registrant’s investment adviser (and any other controlling entity, etc.—not sub-adviser) for the last two years.
Non-Audit Related Fees | FYE 9/30/2022 | FYE 9/30/2021 |
Registrant | $0 | $0 |
Registrant’s Investment Adviser | $0 | $0 |
(h) The audit committee of the board of trustees has considered whether the provision of non-audit services that were rendered to the registrant's investment adviser is compatible with maintaining the principal accountant's independence and has concluded that the provision of such non-audit services by the accountant has not compromised the accountant’s independence.
(i) Not applicable.
(j) Not applicable.
Item 5. Audit Committee of Listed Registrants.
Not applicable to registrants who are not listed issuers (as defined in Rule 10A-3 under the Securities Exchange Act of 1934).
Item 6. Investments.
| (a) | Schedule of Investments is included as part of the report to shareholders filed under Item 1 of this Form. |
Item 7. Disclosure of Proxy Voting Policies and Procedures for Closed-End Management Investment Companies.
Not applicable to open-end investment companies.
Item 8. Portfolio Managers of Closed-End Management Investment Companies.
Not applicable to open-end investment companies.
Item 9. Purchases of Equity Securities by Closed‑End Management Investment Company and Affiliated Purchasers.
Not applicable to open-end investment companies.
Item 10. Submission of Matters to a Vote of Security Holders.
There have been no material changes to the procedures by which shareholders may recommend nominees to the registrant’s board of trustees.
Item 11. Controls and Procedures.
| (a) | The Registrant’s President and Treasurer have reviewed the Registrant's disclosure controls and procedures (as defined in Rule 30a-3(c) under the Investment Company Act of 1940 (the “Act”)) as of a date within 90 days of the filing of this report, as required by Rule 30a-3(b) under the Act and Rules 13a-15(b) or 15d‑15(b) under the Securities Exchange Act of 1934. Based on their review, such officers have concluded that the disclosure controls and procedures are effective in ensuring that information required to be disclosed in this report is appropriately recorded, processed, summarized and reported and made known to them by others within the Registrant and by the Registrant’s service provider. |
| (b) | There were no changes in the Registrant's internal control over financial reporting (as defined in Rule 30a-3(d) under the Act) that occurred during the period covered by this report that has materially affected, or is reasonably likely to materially affect, the Registrant's internal control over financial reporting. |
Item 12. Disclosure of Securities Lending Activities for Closed-End Management Investment Companies
Not applicable to open-end investment companies.
Item 13. Exhibits.
(3) Any written solicitation to purchase securities under Rule 23c‑1 under the Act sent or given during the period covered by the report by or on behalf of the registrant to 10 or more persons. Not applicable to open-end investment companies.
(4) Change in the registrant’s independent public accountant. There was no change in the registrant’s independent public accountant for the period covered by this report.
SIGNATURES
Pursuant to the requirements of the Securities Exchange Act of 1934 and the Investment Company Act of 1940, the registrant has duly caused this report to be signed on its behalf by the undersigned, thereunto duly authorized.
(Registrant) Trust for Professional Managers
By (Signature and Title)* /s/ John Buckel
John Buckel, President
Date: 12/1/2022
Pursuant to the requirements of the Securities Exchange Act of 1934 and the Investment Company Act of 1940, this report has been signed below by the following persons on behalf of the registrant and in the capacities and on the dates indicated.
By (Signature and Title)* /s/ John Buckel
John Buckel, President
Date: 12/1/2022
By (Signature and Title)* /s/ Jennifer Lima
Jennifer Lima, Treasurer
Date: 12/1/2022
* Print the name and title of each signing officer under his or her signature.