UNITED STATES
SECURITIES AND EXCHANGE COMMISSION
Washington, D.C. 20549
FORM N-CSR
CERTIFIED SHAREHOLDER REPORT OF REGISTERED
MANAGEMENT INVESTMENT COMPANIES
Investment Company Act file number: 811-10401
Trust for Professional Managers
(Exact name of registrant as specified in charter)
615 East Michigan Street
Milwaukee, WI 53202
(Address of principal executive offices) (Zip code)
Jay S. Fitton
U.S. Bancorp Fund Services, LLC
615 East Michigan Street
Milwaukee, WI 53202
(Name and address of agent for service)
(513) 629-8104
Registrant's telephone number, including area code
Date of fiscal year end: November 30, 2022
Date of reporting period: May 31, 2022
Item 1. Reports to Stockholders.
Semi-Annual Report
Convergence Long/Short Equity ETF
May 31, 2022
Investment Adviser
Convergence Investment Partners, LLC
3801 PGA Boulevard
Suite 1001
Palm Beach Gardens, Florida 33410
Phone: 877-677-9414
Table of Contents
LETTER TO SHAREHOLDERS | | | 3 |
| | | | |
EXPENSE EXAMPLES | | | 6 |
| | | | |
INVESTMENT HIGHLIGHTS | | | 7 |
| | | | |
SCHEDULE OF INVESTMENTS | | | 10 |
| | | | |
SCHEDULE OF SECURITIES SOLD SHORT | | | 16 |
| | | | |
STATEMENT OF ASSETS AND LIABILITIES | | | 24 |
| | | | |
STATEMENT OF OPERATIONS | | | 25 |
| | | | |
STATEMENTS OF CHANGES IN NET ASSETS | | | 26 |
| | | | |
STATEMENT OF CASH FLOWS | | | 27 |
| | | | |
FINANCIAL HIGHLIGHTS | | | 28 |
| | | | |
NOTES TO FINANCIAL STATEMENTS | | | 30 |
| | | | |
BASIS FOR TRUSTEES’ APPROVAL | | | |
OF INVESTMENT ADVISORY AGREEMENT | | | 41 |
| | | | |
STATEMENT REGARDING LIQUIDITY RISK MANAGEMENT PROGRAM | | | 45 |
| | | | |
NOTICE OF PRIVACY POLICY & PRACTICES | | | 46 |
| | | | |
ADDITIONAL INFORMATION | | | 47 |
Convergence Investment Partners
2022 Semi-Annual Shareholder Report
Convergence Long/Short Equity ETF (CLSE)
Shareholder Letter (Unaudited)
Dear Shareholder:
We are pleased to provide to you the semiannual report of the Convergence Long/Short Equity ETF (the “ETF” or “Fund”) for the six-month period ended May 31, 2022. Our Long/Short Equity ETF employs the Convergence systematic long/short investment approach which seeks to benefit from fundamentally strong companies outperforming their weak fundamental counterparts. Over the long term, our ETF strives for strong total returns with the potential for downside risk mitigation through an active short. We manage our ETF with the philosophy that over the long term, strong “fundamentals” outperform weak “fundamentals.” Moreover, our ETF utilizes the Convergence proprietary stock ranking process which analyzes the domestic investment universe and helps to identify, quantify, and rank strong and weak fundamentals.
Our long-term investors know that we utilize numerous factors grouped into factor composites like Valuation and Sales Growth. We monitor the performance of these composites to learn what the market is rewarding or punishing. Over the six months ended May 31, 2022, we see that much of the positive spread, or differentiation, in stocks has been a combination of attractive absolute and relative valuations paired with lower overall risk, in terms of volatility and analyst coverage. Conversely, there was negative contribution from our factor composites based on price reversal (a short-term technical factor), sales momentum and future expected growth. The fact that not all fundamental tilts contributed positively demonstrates the benefit of the fundamental factor diversification that we employ at Convergence. While it is unlikely for all fundamental tilts to generate a positive spread in short time periods, we believe these fundamental spreads, based on sound economic principles, can help produce real wealth for investors over time as they provide complementary attributes. We remain steadfast to our philosophy that strong fundamentals win in the long run.
Digging a bit deeper into the performance of the past six months, our ETF outperformed its benchmark. Our long positions outperformed the Russell 3000 Total Return Index and the short positions trailed, thereby generating a positive long-short spread for the year. It is important to remember that our ETF maintained a net long exposure of approximately 78.9% for the six months ended May 31, 2022, with 36.0% of capital invested in short positions, while our long-only benchmark maintains 0% in short positions. Our holdings in the Energy, Healthcare Equipment, and Pharmaceuticals industry groups contributed the most to the ETF’s total returns for the six months ended May 31, 2022. The largest detracting industry groups for the same period were Media, Automobiles, and Diversified Financials.
At Convergence, we understand that our long (short) positions will not outperform (underperform) in every consecutive month, quarter, or year. We do, however, firmly believe that investment decisions based on a sound and logical philosophy, paired with a long-term approach, can deliver superior results. Buying reasonably valued stocks with strong earnings and sales growth, while shorting unprofitable stocks with unreasonable valuations, is our recipe for success at Convergence.
Convergence Long/Short Equity ETF Performance:
The objective of the Convergence Long/Short Equity ETF is to achieve long-term capital growth. The ETF seeks to realize its investment objective by establishing long and short positions in equity securities of larger cap domestic companies with medium and large market capitalizations. The ETF will hold long (purchase) securities that Convergence believes will outperform the market, and it will sell short securities expected to underperform the market. Convergence constructs the portfolio as an actively managed equity strategy that adapts to ever changing market dynamics through a market cycle. The ETF intends to maintain a net long exposure (the market value of long positions minus the market value of short positions) of approximately 50 to 100% of the ETF’s total assets. Under normal market conditions, the ETF’s long positions may range from 90% to 150% of the ETF’s total assets, and its short positions may range from 20% to 70% of the ETF’s total assets. In making investment decisions for the ETF, Convergence utilizes a fundamental approach that focuses on market preferences and factors including valuations, growth, momentum and quality.
In the six months ended May 31, 2022, the Convergence Long/Short Equity ETF returned 4.20% (NAV), versus the Russell 3000® Total Return Index at -10.50%.
Average Annual Total Returns (net of fees)
| | | | | | | | Since |
| Through | One | | | One | Three | Five | Inception |
May 31, 2022 | Month | Quarter | YTD | Year | Year | Year | Annualized |
Convergence | | | | | | | |
Long/Short Equity | | | | | | | |
(CLSE-NAV) | 1.49% | 2.06% | -1.52% | 7.62% | 11.20% | 9.62% | 11.78% |
Convergence | | | | | | | |
Long/Short Equity | | | | | | | |
(CLSE-Market) | 1.57% | 1.96% | -1.58% | 7.56% | 11.18% | 9.60% | 11.78% |
Russell 3000® | | | | | | | |
Total Return Index | -0.13% | -6.15% | -13.89% | -3.68% | 15.60% | 12.75% | 12.99% |
Strategy inception = 12/29/2009
Mutual Fund Inception = 12/29/2009
Mutual Fund to ETF conversion = 02/22/2022
Performance data quoted represents past performance and does not guarantee future results. The investment return and principal value of an investment will fluctuate so that an investor’s shares, when redeemed, may be worth more or less than their original cost. Current performance of the ETF may be lower or higher than the performance quoted. Performance data current to the most recent month-end may be obtained by calling 1-877-677-9414. Shares are bought and sold at market price not net asset value (NAV). Market price returns are based upon the closing composite market price and do not represent the returns you would receive if you traded shares at other times.
Total Expense Ratio on the ETF applicable to investors is 1.56%, comprised of the Management Fee of 0.95%, and dividends and interest on short positions of 0.61%.
The Convergence fundamental stock picking methodology is geared toward long holdings with strong cash flow, earnings, profits and other desirable financial characteristics. We
strive to achieve these favorable portfolio statistics while never overpaying in terms of valuation. Our research has shown that, over time, companies with these characteristics have rewarded investors, as the portfolio statistics are signs of healthy and growing companies with competitively strong business models. The Convergence process separately seeks to identify companies with weak or declining fundamentals, and our research has shown this to be effective in sourcing alpha from shorting.
In closing, as we always say, stay fundamental.
Thank you for your support.
| David J. Abitz, CFA | Justin Neuberg, CFA |
| President & Chief Investment Officer | Co-Portfolio Manager |
| Convergence Investment Partners, LLC | Convergence Investment Partners, LLC |
Disclosures
Past performance is not indicative of future results.
This commentary is for informational purposes only and should not be viewed as a recommendation to buy or sell any security. Investors should seek financial advice regarding the appropriateness of investing in any securities or investment strategies discussed in this documentation and should understand that statements regarding future prospects may not be realized. Investors should note that income from such securities may fluctuate and that each security’s price or value may rise or fall. Accordingly, investors may receive back less than originally invested. There is no guarantee that the views expressed will come to pass.
Investing involves risk. Principal loss is possible. Investments in small, micro and midcap companies involve additional risks such as limited liquidity and greater volatility than larger capitalization companies. The ETF may (but does not typically) invest in foreign securities which involve greater volatility and political, economic and currency risks and differences in accounting methods. The ETF regularly makes short sales of securities, which involves unlimited risk including the possibility that losses may exceed the original amount invested. However, an ETF investor’s risk is limited to one’s amount of investment in an ETF.
Must be preceded or accompanied by a prospectus.
Diversification does not assure a profit nor protect against loss in a declining market.
Quasar Distributors, LLC, distributor.
Alpha – The excess return of an investment relative to the return of a benchmark index is the investment’s alpha.
The Russell 3000 Total Return Index measures the performance of the largest 3000 Total Return U.S. companies representing approximately 98% of the investable U.S. equity market. You cannot invest directly in an index. The volatility of an index may be materially different from that of the strategy due to varying degrees of diversification and other factors. Index returns do not reflect the deduction of any fees.
CONVERGENCE LONG/SHORT EQUITY ETF
Expense Examples
(Unaudited)
As a shareholder of the Fund, you incur two types of costs: (1) transaction costs, including brokerage commissions on purchases and sales of Fund shares, and (2) ongoing costs, such as investment management fees and dividends and interest on short positions. This Example is intended to help you understand your ongoing costs (in dollars) of investing in the Fund, and to compare these costs with the ongoing costs of investing in other ETFs. The Example is based on an investment of $1,000 invested at the beginning of the period and held for the entire period (12/1/21 – 5/31/22).
Actual Expenses
The first line of the following table provides information about actual account values and actual expenses. You may use the information in this line, together with the amount you invested, to estimate the expenses that you paid over the period. Simply divide your account value by $1,000 (for example, an $8,600 account value divided by $1,000 = 8.6), then multiply the result by the number in the first line under the heading titled “Expenses Paid During Period” to estimate the expenses you paid on your account during this period.
Hypothetical Example for Comparison Purposes
The second line of the following table provides information about hypothetical account values and hypothetical expenses based on the Fund’s actual expense ratios and an assumed rate of return of 5% per year before expenses, which is not the Fund’s actual return. The hypothetical account values and expenses may not be used to estimate the actual ending account balance or expenses you paid for the period. You may use this information to compare the ongoing costs of investing in the Fund and other funds. To do so, compare this 5% hypothetical example with the 5% hypothetical examples that appear in the shareholder reports of other funds. Please note that the expenses shown in the table are meant to highlight your ongoing costs only and do not reflect any transactional costs, such as redemption fees. Therefore, the second line of the table is useful in comparing ongoing costs only, and will not help you determine the relative total costs of owning different funds. In addition, if these transactional costs were included, your costs would have been higher.
| | Beginning | Ending | Expenses Paid |
| | Account Value | Account Value | During Period |
| | 12/1/21 | 5/31/22 | 12/1/21 – 5/31/22* |
| Actual | $1,000.00 | $1,042.00 | $8.35 |
| Hypothetical (5% return | | | |
| before expenses) | $1,000.00 | $1,016.75 | $8.25 |
| * | Expenses are equal to the Fund’s annualized expense ratio of 1.64%, multiplied by the average account value over the period, multiplied by 182/365 (to reflect the one-half year period). Excluding dividends on short positions, interest and broker expenses, the Fund’s annualized expense ratio would be 1.21%. |
CONVERGENCE LONG/SHORT EQUITY ETF
Investment Highlights
(Unaudited)
The investment objective of the Fund is to seek long-term capital growth. The Fund seeks to achieve its investment objective by investing, under normal market conditions, at least 80% of its net assets (plus any borrowings for investment purposes) in long and short positions in equity securities of domestic companies. The Fund focuses primarily on companies with medium and large market capitalizations, although the Fund may establish long and short positions in companies of any market capitalization. The Fund generally considers companies with medium and large market capitalizations to be those companies that comprise the upper half of the Russell 3000® Total Return Index. As of December 31, 2021, the market capitalization range of the upper half of the Russell 3000® Total Return Index was between $2.02 billion and $2,737.82 billion. The Fund will hold long (purchase) securities that the Adviser believes will outperform the market, and will sell short securities expected to underperform the market.
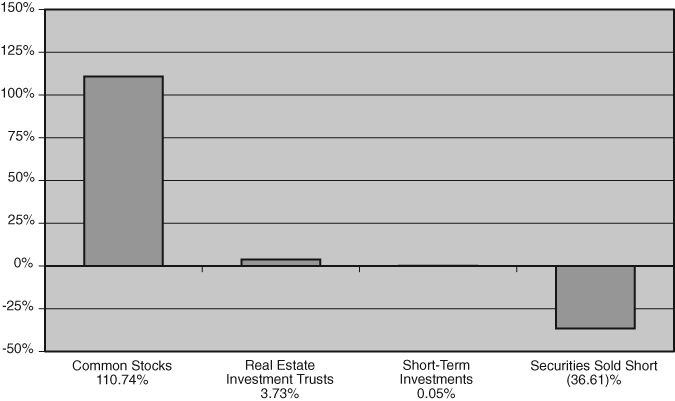
Allocation of Portfolio Holdings
(as a percentage of net assets)
Continued
CONVERGENCE LONG/SHORT EQUITY ETF
Investment Highlights (Continued)
(Unaudited)
Average Annual Total Returns as of May 31, 2022
| | Six | One | Five | Ten |
| | Months | Year | Years | Years |
| Convergence Long/Short Equity ETF — NAV | 4.20% | 7.62% | 9.62% | 11.50% |
| Convergence Long/Short Equity ETF — Market | 4.14% | 7.56% | 9.60% | 11.50% |
Russell 3000® Total Return Index | -10.50% | -3.68% | 12.75% | 14.00% |
The Fund converted from a mutual fund to an ETF pursuant to an Agreement and Plan of Reorganization on February 22, 2022. Performance data includes the Fund’s prior performance history as a mutual fund. The Market Price returns shown prior to February 22, 2022, reflect the mutual fund’s NAV.
The performance data quoted represents past performance and does not guarantee future results. The investment return and principal value of an investment will fluctuate so that an investor’s shares, when redeemed, may be worth more or less than their original cost. Current performance of the Fund may be lower or higher than the performance quoted. Performance data current to the most recent month-end may be obtained by calling 877-677-9414.
Investment performance reflects fee waivers in effect for the Fund prior to February 22, 2022. In the absence of such waivers, total returns would be reduced for the periods prior to February 22, 2022.
The returns shown assume reinvestment of Fund distributions and do not reflect the deduction of taxes that a shareholder would pay on Fund distributions or the redemption of Fund shares. The following graph illustrates performance of a hypothetical investment made in the Fund and a broad-based securities index over the last 10 year time period. The graph does not imply any future performance.
Shares are bought and sold at market price (closing price), not net asset value (“NAV”), and are not individually redeemed from the Fund. Market performance is determined using the bid/ask midpoint at 4:00 p.m. Eastern time when the NAV is typically calculated. Brokerage commissions will reduce returns. Returns shown include the reinvestment of all dividends and distribution. Returns shown do not reflect the deduction of taxes that a shareholder would pay on fund distributions or the redemption of fund shares.
The Russell 3000® Total Return Index measures the performance of the largest 3,000 U.S. companies representing approximately 98% of the investable U.S. equity market. One cannot invest directly in an index.
Continued
CONVERGENCE LONG/SHORT EQUITY ETF
Investment Highlights (Continued)
(Unaudited)
Growth of $10,000 Investment
CONVERGENCE LONG/SHORT EQUITY ETF
May 31, 2022 (Unaudited)
| | | Shares | | | Value | |
| COMMON STOCKS* – 110.74% | | | | | | |
| | | | | | | |
| Accommodation – 1.03% | | | | | | |
| Hyatt Hotels Corp. – Class A (a)(b) | | | 1,361 | | | $ | 120,299 | |
| Red Rock Resorts, Inc. – Class A (b) | | | 3,770 | | | | 146,012 | |
| | | | | | | | 266,311 | |
| | | | | | | | | |
| Administrative and Support Services – 2.92% | | | | | | | | |
| ABM Industries, Inc. (b) | | | 2,058 | | | | 99,504 | |
| MasterCard, Inc. – Class A (b) | | | 793 | | | | 283,791 | |
| WEX, Inc. (a)(b) | | | 2,171 | | | | 369,678 | |
| | | | | | | | 752,973 | |
| | | | | | | | | |
| Apparel Manufacturing – 0.27% | | | | | | | | |
| PVH Corp. (b) | | | 974 | | | | 69,027 | |
| | | | | | | | | |
| Beverage and Tobacco Product Manufacturing – 0.56% | | | | | | | | |
| Coca-Cola Consolidated, Inc. (b) | | | 256 | | | | 144,632 | |
| | | | | | | | | |
| Broadcasting (except Internet) – 0.50% | | | | | | | | |
| Comcast Corp. – Class A | | | 2,925 | | | | 129,519 | |
| | | | | | | | | |
| Building Material and Garden Equipment | | | | | | | | |
| and Supplies Dealers – 1.59% | | | | | | | | |
| Home Depot, Inc. (b) | | | 1,349 | | | | 408,410 | |
| | | | | | | | | |
| Chemical Manufacturing – 12.00% | | | | | | | | |
| AbbVie, Inc. (b) | | | 2,779 | | | | 409,541 | |
| Bristol-Myers Squibb Co. (b) | | | 4,375 | | | | 330,094 | |
| CF Industries Holdings, Inc. (b) | | | 2,828 | | | | 279,322 | |
| Lantheus Holdings, Inc. (a)(b) | | | 3,767 | | | | 258,115 | |
| Merck & Co, Inc. (b) | | | 2,410 | | | | 221,792 | |
| Mosaic Co. (b) | | | 2,571 | | | | 161,073 | |
| Pfizer, Inc. (b) | | | 7,995 | | | | 424,054 | |
| Procter & Gamble Co. (b) | | | 1,711 | | | | 253,023 | |
| Regeneron Pharmaceuticals, Inc. (a)(b) | | | 518 | | | | 344,335 | |
| Vertex Pharmaceuticals, Inc. (a)(b) | | | 912 | | | | 245,009 | |
| Westlake Corp. (b) | | | 1,233 | | | | 162,892 | |
| | | | | | | | 3,089,250 | |
| | | | | | | | | |
| Clothing and Clothing Accessories Stores – 0.88% | | | | | | | | |
| Academy Sports & Outdoors, Inc. (b) | | | 4,327 | | | | 144,997 | |
| Dillard’s, Inc. – Class A | | | 272 | | | | 82,003 | |
| | | | | | | | 227,000 | |
| | | | | | | | | |
| Commercial & Professional Services – 0.26% | | | | | | | | |
| Republic Services, Inc. (b) | | | 495 | | | | 66,251 | |
The accompanying notes are an integral part of these financial statements.
CONVERGENCE LONG/SHORT EQUITY ETF
| Schedule of Investments (Continued) |
May 31, 2022 (Unaudited)
| | | Shares | | | Value | |
| | | | | | | |
| Computer and Electronic Product Manufacturing – 21.70% | | | | | | |
| Alphabet, Inc. – Class A (a)(b) | | | 228 | | | $ | 518,755 | |
| Alphabet, Inc. – Class C (a)(b) | | | 311 | | | | 709,322 | |
| Amkor Technology, Inc. (b) | | | 20,402 | | | | 417,017 | |
| Apple, Inc. (b) | | | 5,259 | | | | 782,750 | |
| Broadcom, Inc. (b) | | | 780 | | | | 452,501 | |
| Hologic, Inc. (a) | | | 2,589 | | | | 194,874 | |
| HP, Inc. (b) | | | 15,538 | | | | 603,496 | |
| Jabil, Inc. (b) | | | 10,000 | | | | 615,200 | |
| Microchip Technology, Inc. | | | 2,873 | | | | 208,723 | |
| Moog, Inc. – Class A (b) | | | 1,811 | | | | 147,397 | |
| ON Semiconductor Corp. (a)(b) | | | 7,841 | | | | 475,792 | |
| Sonos, Inc. (a)(b) | | | 4,200 | | | | 92,946 | |
| Teradata Corp. (a)(b) | | | 9,527 | | | | 366,123 | |
| | | | | | | | 5,584,896 | |
| | | | | | | | | |
| Construction of Buildings – 1.63% | | | | | | | | |
| Avantor, Inc. (a)(b) | | | 10,560 | | | | 338,343 | |
| Taylor Morrison Home Corp. – Class A (a)(b) | | | 2,754 | | | | 79,783 | |
| | | | | | | | 418,126 | |
| | | | | | | | | |
| | | | | | | | | |
| Credit Intermediation and Related Activities – 6.78% | | | | | | | | |
| Banner Corp. (b) | | | 2,747 | | | | 159,628 | |
| Citigroup, Inc. (b) | | | 3,612 | | | | 192,918 | |
| Discover Financial Services (b) | | | 2,591 | | | | 294,053 | |
| Hilltop Holdings, Inc. (b) | | | 4,843 | | | | 145,338 | |
| KeyCorp (b) | | | 8,152 | | | | 162,714 | |
| Mr. Cooper Group, Inc. (a) | | | 3,830 | | | | 166,069 | |
| Synchrony Financial (b) | | | 7,780 | | | | 288,171 | |
| Wells Fargo & Co. (b) | | | 4,203 | | | | 192,371 | |
| Wintrust Financial Corp. (b) | | | 1,655 | | | | 144,630 | |
| | | | | | | | 1,745,892 | |
| | | | | | | | | |
| Fabricated Metal Product Manufacturing – 1.22% | | | | | | | | |
| Atkore, Inc. (a) | | | 1,433 | | | | 156,082 | |
| Nucor Corp. (b) | | | 1,182 | | | | 156,568 | |
| | | | | | | | 312,650 | |
| | | | | | | | | |
| Food Manufacturing – 3.26% | | | | | | | | |
| Archer-Daniels-Midland Co. (b) | | | 4,191 | | | | 380,627 | |
| Bunge Ltd. – ADR (b) | | | 2,576 | | | | 304,792 | |
| Hostess Brands, Inc. – Class A (a)(b) | | | 7,225 | | | | 153,531 | |
| | | | | | | | 838,950 | |
The accompanying notes are an integral part of these financial statements.
CONVERGENCE LONG/SHORT EQUITY ETF
| Schedule of Investments (Continued) |
May 31, 2022 (Unaudited)
| | | Shares | | | Value | |
| | | | | | | |
| General Merchandise Stores – 0.92% | | | | | | |
| Wal-Mart, Inc. (b) | | | 1,847 | | | $ | 237,580 | |
| | | | | | | | | |
| Health and Personal Care Stores – 1.37% | | | | | | | | |
| Albertsons Cos, Inc. (b) | | | 5,039 | | | | 153,941 | |
| CVS Health Corp. | | | 2,057 | | | | 199,015 | |
| | | | | | | | 352,956 | |
| | | | | | | | | |
| Heavy and Civil Engineering Construction – 0.61% | | | | | | | | |
| Dycom Industries, Inc. (a)(b) | | | 1,691 | | | | 157,449 | |
| | | | | | | | | |
| Insurance Carriers and Related Activities – 5.13% | | | | | | | | |
| American International Group, Inc. | | | 2,603 | | | | 152,744 | |
| Axis Capital Holdings – ADR (b) | | | 3,086 | | | | 180,747 | |
| Centene Corp. (a) | | | 2,413 | | | | 196,514 | |
| Marsh & McLennan Companies, Inc. (b) | | | 565 | | | | 90,372 | |
| Radian Group, Inc. (b) | | | 7,749 | | | | 166,681 | |
| Unum Group (b) | | | 3,100 | | | | 112,995 | |
| Voya Financial, Inc. (b) | | | 3,973 | | | | 272,587 | |
| W. R. Berkley Corp. (b) | | | 2,081 | | | | 148,022 | |
| | | | | | | | 1,320,662 | |
| | | | | | | | | |
| Management of Companies and Enterprises – 0.50% | | | | | | | | |
| Cushman & Wakefield PLC – ADR (a)(b) | | | 6,891 | | | | 128,655 | |
| | | | | | | | | |
| Merchant Wholesalers, Durable Goods – 3.22% | | | | | | | | |
| Allison Transmission Holdings, Inc. (b) | | | 3,564 | | | | 142,596 | |
| Avnet, Inc. (b) | | | 7,419 | | | | 359,450 | |
| InterDigital, Inc. (b) | | | 5,011 | | | | 327,168 | |
| | | | | | | | 829,214 | |
| Merchant Wholesalers, Nondurable Goods – 4.38% | | | | | | | | |
| AmerisourceBergen Corp. (b) | | | 1,805 | | | | 279,396 | |
| Cardinal Health, Inc. (b) | | | 3,784 | | | | 213,115 | |
| McKesson Corp. (b) | | | 833 | | | | 273,799 | |
| Univar Solutions, Inc. (a)(b) | | | 6,647 | | | | 204,196 | |
| Veritiv Corp. (a)(b) | | | 1,086 | | | | 157,850 | |
| | | | | | | | 1,128,356 | |
| | | | | | | | | |
| Motor Vehicle and Parts Dealers – 3.48% | | | | | | | | |
| AutoNation, Inc. (a)(b) | | | 3,495 | | | | 417,862 | |
| Group 1 Automotive, Inc. (b) | | | 1,025 | | | | 184,080 | |
| Penske Automotive Group, Inc. | | | 2,549 | | | | 293,492 | |
| | | | | | | | 895,434 | |
The accompanying notes are an integral part of these financial statements.
CONVERGENCE LONG/SHORT EQUITY ETF
| Schedule of Investments (Continued) |
May 31, 2022 (Unaudited)
| | | Shares | | | Value | |
| | | | | | | |
| Nonstore Retailers – 1.25% | | | | | | |
| Box, Inc. – Class A (a)(b) | | | 12,366 | | | $ | 322,876 | |
| | | | | | | | | |
| Oil and Gas Extraction – 2.39% | | | | | | | | |
| APA Corp. (b) | | | 8,171 | | | | 384,119 | |
| Ovintiv, Inc. (b) | | | 4,108 | | | | 230,007 | |
| | | | | | | | 614,126 | |
| | | | | | | | | |
| Other Information Services – 1.37% | | | | | | | | |
| Meta Platforms, Inc. (a)(b) | | | 1,817 | | | | 351,844 | |
| | | | | | | | | |
| Paper Manufacturing – 1.22% | | | | | | | | |
| Boise Cascade Co. (b) | | | 2,592 | | | | 200,414 | |
| Sylvamo Corp. (a)(b) | | | 2,253 | | | | 114,317 | |
| | | | | | | | 314,731 | |
| | | | | | | | | |
| Personal and Laundry Services – 0.56% | | | | | | | | |
| Service Corp International (b) | | | 2,070 | | | | 144,962 | |
| | | | | | | | | |
| Petroleum and Coal Products Manufacturing – 5.03% | | | | | | | | |
| CVR Energy, Inc. (b) | | | 6,656 | | | | 229,166 | |
| Delek U.S. Holdings, Inc. (a)(b) | | | 7,882 | | | | 229,839 | |
| Exxon Mobil Corp. (b) | | | 3,619 | | | | 347,424 | |
| Marathon Petroleum Corp. (b) | | | 2,271 | | | | 231,165 | |
| PBF Energy, Inc. – Class A (a) (b) | | | 7,773 | | | | 258,064 | |
| | | | | | | | 1,295,658 | |
| | | | | | | | | |
| Primary Metal Manufacturing – 1.08% | | | | | | | | |
| Encore Wire Corp. (b) | | | 1,275 | | | | 159,401 | |
| Steel Dynamics, Inc. (b) | | | 1,393 | | | | 118,934 | |
| | | | | | | | 278,335 | |
| | | | | | | | | |
| Professional, Scientific, and Technical Services – 4.37% | | | | | | | | |
| Fluor Corp. (a)(b) | | | 5,077 | | | | 143,324 | |
| Gartner, Inc. (a)(b) | | | 1,674 | | | | 439,257 | |
| H&R Block, Inc. (b) | | | 3,887 | | | | 136,978 | |
| Henry Jack & Associates, Inc. (b) | | | 1,726 | | | | 324,695 | |
| Insperity, Inc. (b) | | | 824 | | | | 82,458 | |
| | | | | | | | 1,126,712 | |
| | | | | | | | | |
| Publishing Industries (except Internet) – 6.27% | | | | | | | | |
| Cadence Design Systems, Inc. (a)(b) | | | 2,336 | | | | 359,113 | |
| Dropbox, Inc. (a)(b) | | | 13,441 | | | | 280,110 | |
The accompanying notes are an integral part of these financial statements.
CONVERGENCE LONG/SHORT EQUITY ETF
| Schedule of Investments (Continued) |
May 31, 2022 (Unaudited)
| | | Shares | | | Value | |
| | | | | | | |
| Publishing Industries (except Internet) – 6.27% (Continued) | | | | | | |
| Evolent Health, Inc. – Class A (a) | | | 6,825 | | | $ | 191,987 | |
| Microsoft Corp. (b) | | | 2,884 | | | | 784,074 | |
| | | | | | | | 1,615,284 | |
| | | | | | | | | |
| Rental and Leasing Services – 0.49% | | | | | | | | |
| Avis Budget Group, Inc. (a)(b) | | | 657 | | | | 125,014 | |
| | | | | | | | | |
| Securities, Commodity Contracts, and Other Financial | | | | | | | | |
| Investments and Related Activities – 2.00% | | | | | | | | |
| Evercore, Inc. – Class A (b) | | | 2,247 | | | | 256,607 | |
| SEI Investments Co. (b) | | | 4,395 | | | | 256,800 | |
| | | | | | | | 513,407 | |
| | | | | | | | | |
| Support Activities for Transportation – 0.88% | | | | | | | | |
| CH Robinson Worldwide, Inc. (b) | | | 755 | | | | 81,925 | |
| Matson, Inc. (b) | | | 1,625 | | | | 146,055 | |
| | | | | | | | 227,980 | |
| | | | | | | | | |
| Telecommunications – 1.44% | | | | | | | | |
| AT&T, Inc. (b) | | | 17,430 | | | | 371,085 | |
| | | | | | | | | |
| Transportation Equipment Manufacturing – 3.61% | | | | | | | | |
| Ford Motor Co. (b) | | | 9,034 | | | | 123,585 | |
| General Dynamics Corp. (b) | | | 913 | | | | 205,343 | |
| Lockheed Martin Corp. (b) | | | 318 | | | | 139,955 | |
| Tesla, Inc. (a)(b) | | | 609 | | | | 461,780 | |
| | | | | | | | 930,663 | |
| | | | | | | | | |
| Utilities – 3.11% | | | | | | | | |
| DTE Energy Co. (b) | | | 946 | | | | 125,544 | |
| NRG Energy, Inc. (b) | | | 4,610 | | | | 212,244 | |
| Portland General Electric Co. (b) | | | 2,367 | | | | 116,575 | |
| UGI Corp. (b) | | | 4,700 | | | | 200,878 | |
| Vistra Corp. (b) | | | 5,519 | | | | 145,536 | |
| | | | | | | | 800,777 | |
| | | | | | | | | |
| Warehousing and Storage – 0.87% | | | | | | | | |
| Landstar System, Inc. (b) | | | 1,471 | | | | 222,754 | |
| | | | | | | | | |
| Waste Management and Remediation Services – 0.29% | | | | | | | | |
| Clean Harbors, Inc. (a)(b) | | | 791 | | | | 73,879 | |
The accompanying notes are an integral part of these financial statements.
CONVERGENCE LONG/SHORT EQUITY ETF
| Schedule of Investments (Continued) |
May 31, 2022 (Unaudited)
| | | Shares | | | Value | |
| | | | | | | |
| Wood Product Manufacturing – 0.30% | | | | | | |
| Skyline Champion Corp. (a)(b) | | | 1,468 | | | $ | 77,995 | |
| TOTAL COMMON STOCKS (Cost $26,497,898) | | | | | | | 28,512,275 | |
| | | | | | | | | |
| REAL ESTATE INVESTMENT TRUSTS – 3.73% | | | | | | | | |
| | | | | | | | | |
| Professional, Scientific, and Technical Services – 0.51% | | | | | | | | |
| Extra Space Storage, Inc. (b) | | | 731 | | | | 130,264 | |
| | | | | | | | | |
| Real Estate – 2.13% | | | | | | | | |
| Apartment Income REIT Corp. (b) | | | 2,244 | | | | 100,666 | |
| Essex Property Trust, Inc. (b) | | | 337 | | | | 95,657 | |
| First Industrial Realty Trust, Inc. (b) | | | 2,395 | | | | 127,295 | |
| New Residential Investment Corp. (b) | | | 6,832 | | | | 77,202 | |
| PotlatchDeltic Corp. (b) | | | 2,836 | | | | 148,777 | |
| | | | | | | | 448,931 | |
| | | | | | | | | |
| Telecommunications – 0.41% | | | | | | | | |
| Uniti Group, Inc. (b) | | | 9,422 | | | | 106,845 | |
| | | | | | | | | |
| Wood Product Manufacturing – 0.68% | | | | | | | | |
| Weyerhaeuser Co. (b) | | | 4,427 | | | | 174,955 | |
| TOTAL REAL ESTATE INVESTMENT TRUSTS (Cost $928,968) | | | | | | | 961,661 | |
| | | | | | | | | |
| SHORT-TERM INVESTMENTS – 0.05% | | | | | | | | |
| First American Government Obligations Fund, 0.657% (b)(c) | | | 13,391 | | | | 13,391 | |
| TOTAL SHORT-TERM INVESTMENTS (Cost $13,391) | | | | | | | 13,391 | |
| Total Investments (Cost $27,440,257) – 114.52% | | | | | | | 29,487,327 | |
| Liabilities in Excess of Other Assets – (14.52)% | | | | | | | (3,738,140 | ) |
| TOTAL NET ASSETS – 100.00% | | | | | | $ | 25,749,187 | |
Percentages are stated as a percent of net assets.
| * | Unless otherwise noted, all or a portion of these securities, totaling $26,170,521, are pledged as collateral for securities sold short. |
| (a) | Non-income producing security. |
| (b) | All of a portion of this security is not pledged as collateral for securities sold short. |
| (c) | Seven day yield as of May 31, 2022. |
| | |
Abbreviations:
| ADR | American Depositary Receipt |
| PLC | Public Limited Company |
The accompanying notes are an integral part of these financial statements.
CONVERGENCE LONG/SHORT EQUITY ETF
| Schedule of Securities Sold Short |
May 31, 2022 (Unaudited)
| | | Shares | | | Value | |
| SECURITIES SOLD SHORT (36.61)% | | | | | | |
| | | | | | | |
| COMMON STOCKS (35.49)% | | | | | | |
| | | | | | | |
| Accommodation – (0.23)% | | | | | | |
| Caesars Entertainment, Inc. | | | (614 | ) | | $ | (30,804 | ) |
| Las Vegas Sands Corp. | | | (792 | ) | | | (28,084 | ) |
| | | | | | | | (58,888 | ) |
| | | | | | | | | |
| Administrative and Support Services – (1.23)% | | | | | | | | |
| Cardlytics, Inc. | | | (1,333 | ) | | | (34,538 | ) |
| Cloudflare, Inc. | | | (1,464 | ) | | | (81,984 | ) |
| nCino, Inc. | | | (2,717 | ) | | | (88,764 | ) |
| Scotts Miracle-Gro Co. – Class A | | | (390 | ) | | | (36,902 | ) |
| TripAdvisor, Inc. | | | (3,043 | ) | | | (75,588 | ) |
| | | | | | | | (317,776 | ) |
| | | | | | | | | |
| Air Transportation – (0.18)% | | | | | | | | |
| United Continental Holdings, Inc. | | | (951 | ) | | | (45,296 | ) |
| | | | | | | | | |
| Ambulatory Health Care Services – (1.36)% | | | | | | | | |
| 1Life Healthcare, Inc. | | | (3,941 | ) | | | (33,380 | ) |
| Accolade, Inc. | | | (1,891 | ) | | | (12,140 | ) |
| Guardant Health, Inc. | | | (1,535 | ) | | | (62,905 | ) |
| Natera, Inc. | | | (1,603 | ) | | | (58,814 | ) |
| Novocure Ltd. | | | (734 | ) | | | (58,999 | ) |
| Oak Street Health, Inc. | | | (3,246 | ) | | | (61,284 | ) |
| Teladoc Health, Inc. | | | (1,776 | ) | | | (60,544 | ) |
| | | | | | | | (348,066 | ) |
| | | | | | | | | |
| Beverage and Tobacco Product Manufacturing – (0.49)% | | | | | | | | |
| Boston Beer Company, Inc. – Class A | | | (165 | ) | | | (58,625 | ) |
| Celsius Holdings, Inc. | | | (1,019 | ) | | | (68,364 | ) |
| | | | | | | | (126,989 | ) |
| | | | | | | | | |
| Broadcasting (except Internet) – (1.16)% | | | | | | | | |
| Cable One, Inc. | | | (57 | ) | | | (74,277 | ) |
| Liberty Broadband Corp. – Class A | | | (608 | ) | | | (74,182 | ) |
| Liberty Broadband Corp. – Class C | | | (596 | ) | | | (74,601 | ) |
| Madison Square Garden Co. – Class A | | | (466 | ) | | | (76,359 | ) |
| | | | | | | | (299,419 | ) |
The accompanying notes are an integral part of these financial statements.
CONVERGENCE LONG/SHORT EQUITY ETF
| Schedule of Securities Sold Short (Continued) |
May 31, 2022 (Unaudited)
| | | Shares | | | Value | |
| | | | | | | |
| Building Material and Garden Equipment | | | | | | |
| and Supplies Dealers – (0.11)% | | | | | | |
| GrowGeneration Corp. | | | (5,552 | ) | | $ | (28,593 | ) |
| | | | | | | | | |
| Chemical Manufacturing – (2.43)% | | | | | | | | |
| Apellis Pharmaceuticals, Inc. | | | (1,102 | ) | | | (45,678 | ) |
| Bridgebio Pharma, Inc. | | | (2,173 | ) | | | (14,842 | ) |
| Denali Therapeutics, Inc. | | | (2,393 | ) | | | (58,126 | ) |
| Diversey Holdings Ltd. | | | (3,283 | ) | | | (32,173 | ) |
| Fate Therapeutics, Inc. | | | (2,240 | ) | | | (51,744 | ) |
| Intellia Therapeutics, Inc. | | | (1,192 | ) | | | (54,999 | ) |
| Inter Parfums, Inc. | | | (687 | ) | | | (50,701 | ) |
| Intra-Cellular Therapies, Inc. | | | (906 | ) | | | (52,004 | ) |
| Mirati Therapeutics, Inc. | | | (1,408 | ) | | | (55,137 | ) |
| Moderna, Inc. | | | (438 | ) | | | (63,656 | ) |
| Seagen, Inc. | | | (453 | ) | | | (61,463 | ) |
| SpringWorks Therapeutics, Inc. | | | (1,424 | ) | | | (26,971 | ) |
| TG Therapeutics, Inc. | | | (1,239 | ) | | | (5,476 | ) |
| Ultragenyx Pharmaceutical, Inc. | | | (1,106 | ) | | | (51,871 | ) |
| | | | | | | | (624,841 | ) |
| | | | | | | | | |
| Clothing and Clothing Accessories Stores – (0.29)% | | | | | | | | |
| KKR & Co, Inc. | | | (1,360 | ) | | | (74,542 | ) |
| | | | | | | | | |
| Computer and Electronic Product Manufacturing – (3.21)% | | | | | | | | |
| Bloom Energy Corp. | | | (2,091 | ) | | | (36,634 | ) |
| Calix, Inc. | | | (2,037 | ) | | | (75,247 | ) |
| Enphase Energy, Inc. | | | (511 | ) | | | (95,143 | ) |
| Itron, Inc. | | | (1,691 | ) | | | (87,273 | ) |
| Marvell Technology, Inc. | | | (1,666 | ) | | | (98,543 | ) |
| Mercury Systems, Inc. | | | (671 | ) | | | (40,133 | ) |
| Universal Display Corp. | | | (741 | ) | | | (93,596 | ) |
| Vertiv Holdings Co. | | | (2,838 | ) | | | (31,190 | ) |
| ViaSat, Inc. | | | (3,408 | ) | | | (134,582 | ) |
| Vicor Corp. | | | (511 | ) | | | (34,390 | ) |
| Wolfspeed, Inc. | | | (1,307 | ) | | | (98,326 | ) |
| | | | | | | | (825,057 | ) |
| | | | | | | | | |
| Credit Intermediation and Related Activities – (1.76)% | | | | | | | | |
| First Citizens BancShares, Inc. – Class A | | | (62 | ) | | | (43,425 | ) |
| Flywire Corp. | | | (4,409 | ) | | | (85,138 | ) |
| Independent Bank Corp. | | | (517 | ) | | | (43,066 | ) |
| Old National Bancorp. | | | (2,899 | ) | | | (46,094 | ) |
| Signature Bank | | | (224 | ) | | | (48,444 | ) |
The accompanying notes are an integral part of these financial statements.
CONVERGENCE LONG/SHORT EQUITY ETF
| Schedule of Securities Sold Short (Continued) |
May 31, 2022 (Unaudited)
| | | Shares | | | Value | |
| | | | | | | |
| Credit Intermediation and Related Activities – (1.76)% (Continued) | | | | | | |
| Towne Bank | | | (1,600 | ) | | $ | (47,168 | ) |
| UMB Financial Corp. | | | (511 | ) | | | (47,191 | ) |
| Webster Financial Corp. | | | (892 | ) | | | (43,788 | ) |
| Western Alliance Bancorp | | | (591 | ) | | | (48,090 | ) |
| | | | | | | | (452,404 | ) |
| | | | | | | | | |
| Data Processing, Hosting and Related Services – (0.17)% | | | | | | | | |
| Legalzoom.com, Inc. | | | (1,690 | ) | | | (22,139 | ) |
| Upwork, Inc. | | | (1,144 | ) | | | (20,878 | ) |
| | | | | | | | (43,017 | ) |
| | | | | | | | | |
| Electrical Equipment, Appliance, and | | | | | | | | |
| Component Manufacturing – (0.72)% | | | | | | | | |
| Generac Holdings, Inc. | | | (135 | ) | | | (33,356 | ) |
| IPG Photonics Corp. | | | (718 | ) | | | (75,742 | ) |
| Plug Power, Inc. | | | (1,965 | ) | | | (36,313 | ) |
| Regal Rexnord Corp. | | | (301 | ) | | | (37,610 | ) |
| | | | | | | | (183,021 | ) |
| | | | | | | | | |
| Fabricated Metal Product Manufacturing – (0.40)% | | | | | | | | |
| Axon Enterprise, Inc. | | | (331 | ) | | | (33,550 | ) |
| Chart Industries, Inc. | | | (208 | ) | | | (36,583 | ) |
| Stanley Black & Decker, Inc. | | | (280 | ) | | | (33,233 | ) |
| | | | | | | | (103,366 | ) |
| | | | | | | | | |
| Food and Beverage Stores – (0.49)% | | | | | | | | |
| Duckhorn Portfolio Inc. | | | (3,122 | ) | | | (61,347 | ) |
| Grocery Outlet Holding Corp. | | | (1,697 | ) | | | (64,910 | ) |
| | | | | | | | (126,257 | ) |
| | | | | | | | | |
| Food Manufacturing – (0.46)% | | | | | | | | |
| Freshpet, Inc. | | | (803 | ) | | | (57,792 | ) |
| Lamb Weston Holdings, Inc. | | | (921 | ) | | | (62,241 | ) |
| | | | | | | | (120,033 | ) |
| | | | | | | | | |
| Food Services and Drinking Places – (0.36)% | | | | | | | | |
| Casey’s General Stores, Inc. | | | (310 | ) | | | (64,957 | ) |
| Shake Shack, Inc. – Class A | | | (550 | ) | | | (26,758 | ) |
| | | | | | | | (91,715 | ) |
The accompanying notes are an integral part of these financial statements.
CONVERGENCE LONG/SHORT EQUITY ETF
| Schedule of Securities Sold Short (Continued) |
May 31, 2022 (Unaudited)
| | | Shares | | | Value | |
| | | | | | | |
| Furniture and Home Furnishings Stores – (0.33)% | | | | | | |
| Floor & Decor Holdings, Inc. – Class A | | | (841 | ) | | $ | (63,445 | ) |
| MillerKnoll, Inc. | | | (708 | ) | | | (21,382 | ) |
| | | | | | | | (84,827 | ) |
| | | | | | | | | |
| Furniture and Related Product Manufacturing – (0.04)% | | | | | | | | |
| Purple Innovation, Inc. | | | (2,102 | ) | | | (10,888 | ) |
| | | | | | | | | |
| General Merchandise Stores – (0.59)% | | | | | | | | |
| Five Below, Inc. | | | (532 | ) | | | (69,474 | ) |
| Ollie’s Bargain Outlet Holdings, Inc. | | | (1,745 | ) | | | (81,962 | ) |
| | | | | | | | (151,436 | ) |
| | | | | | | | | |
| Insurance Carriers and Related Activities – (0.79)% | | | | | | | | |
| Equitable Holdings, Inc. | | | (2,431 | ) | | | (73,927 | ) |
| Goosehead Insurance, Inc. | | | (664 | ) | | | (34,382 | ) |
| Kemper Corp. | | | (873 | ) | | | (46,121 | ) |
| White Mountains Insurance Group Ltd. | | | (40 | ) | | | (49,794 | ) |
| | | | | | | | (204,224 | ) |
| | | | | | | | | |
| Leather and Allied Product Manufacturing – (0.20)% | | | | | | | | |
| Crocs, Inc. | | | (462 | ) | | | (25,761 | ) |
| Deckers Outdoor Corp. | | | (96 | ) | | | (25,782 | ) |
| | | | | | | | (51,543 | ) |
| | | | | | | | | |
| Machinery Manufacturing – (0.78)% | | | | | | | | |
| Azenta, Inc. | | | (940 | ) | | | (72,042 | ) |
| II-VI, Inc. | | | (2,062 | ) | | | (128,875 | ) |
| | | | | | | | (200,917 | ) |
| | | | | | | | | |
| Management of Companies and Enterprises – (0.92)% | | | | | | | | |
| Azek Company, Inc. | | | (1,642 | ) | | | (34,597 | ) |
| Cannae Holdings, Inc. | | | (3,060 | ) | | | (62,026 | ) |
| First Interstate BancSystem, Inc. | | | (1,215 | ) | | | (46,255 | ) |
| Norwegian Cruise Line Holdings Ltd. | | | (1,687 | ) | | | (27,009 | ) |
| StoneCo Ltd. | | | (6,751 | ) | | | (67,780 | ) |
| | | | | | | | (237,667 | ) |
| | | | | | | | | |
| Merchant Wholesalers, Durable Goods – (0.50)% | | | | | | | | |
| RBC Bearings, Inc. | | | (191 | ) | | | (35,600 | ) |
| TD SYNNEX Corp. | | | (895 | ) | | | (92,946 | ) |
| | | | | | | | (128,546 | ) |
The accompanying notes are an integral part of these financial statements.
CONVERGENCE LONG/SHORT EQUITY ETF
| Schedule of Securities Sold Short (Continued) |
May 31, 2022 (Unaudited)
| | | Shares | | | Value | |
| | | | | | | |
| Mining (except Oil and Gas) – (0.38)% | | | | | | |
| Martin Marietta Materials, Inc. | | | (108 | ) | | $ | (36,653 | ) |
| Novagold Resources, Inc. | | | (5,260 | ) | | | (29,403 | ) |
| Royal Gold, Inc. | | | (291 | ) | | | (32,907 | ) |
| | | | | | | | (98,963 | ) |
| | | | | | | | | |
| Miscellaneous Manufacturing – (1.19)% | | | | | | | | |
| Align Technology, Inc. | | | (204 | ) | | | (56,639 | ) |
| DexCom, Inc. | | | (145 | ) | | | (43,201 | ) |
| Inari Medical, Inc. | | | (973 | ) | | | (64,023 | ) |
| Insulet Corp. | | | (255 | ) | | | (54,437 | ) |
| Nevro Corp. | | | (927 | ) | | | (40,399 | ) |
| Peloton Interactive, Inc. | | | (1,731 | ) | | | (24,165 | ) |
| YETI Holdings, Inc. | | | (541 | ) | | | (24,751 | ) |
| | | | | | | | (307,615 | ) |
| | | | | | | | | |
| Motion Picture and Sound Recording Industries – (0.06)% | | | | | | | | |
| fuboTV, Inc. | | | (4,661 | ) | | | (15,335 | ) |
| | | | | | | | | |
| Motor Vehicle and Parts Dealers – (0.39)% | | | | | | | | |
| CarMax, Inc. | | | (777 | ) | | | (77,133 | ) |
| Carvana Co. | | | (830 | ) | | | (24,435 | ) |
| | | | | | | | (101,568 | ) |
| | | | | | | | | |
| Nonstore Retailers – (0.61)% | | | | | | | | |
| DoorDash, Inc. | | | (955 | ) | | | (73,449 | ) |
| Etsy, Inc. | | | (614 | ) | | | (49,808 | ) |
| Wayfair, Inc. – Class A | | | (564 | ) | | | (33,496 | ) |
| | | | | | | | (156,753 | ) |
| | | | | | | | | |
| Oil and Gas Extraction – (0.51)% | | | | | | | | |
| Equitrans Midstream Corp. | | | (7,963 | ) | | | (62,669 | ) |
| Tellurian, Inc. | | | (14,420 | ) | | | (68,783 | ) |
| | | | | | | | (131,452 | ) |
| | | | | | | | | |
| Other Information Services – (0.24)% | | | | | | | | |
| Sabre Corp. | | | (8,377 | ) | | | (62,911 | ) |
| | | | | | | | | |
| Performing Arts, Spectator Sports, and Related Industries – (0.24)% | | | | | | | | |
| Madison Square Garden Entertainment Corp. | | | (903 | ) | | | (61,215 | ) |
| | | | | | | | | |
| Personal and Laundry Services – (0.28)% | | | | | | | | |
| IAC/InterActiveCorp | | | (835 | ) | | | (71,225 | ) |
The accompanying notes are an integral part of these financial statements.
CONVERGENCE LONG/SHORT EQUITY ETF
| Schedule of Securities Sold Short (Continued) |
May 31, 2022 (Unaudited)
| | | Shares | | | Value | |
| | | | | | | |
| Petroleum and Coal Products Manufacturing – (0.34)% | | | | | | |
| Quaker Chemical Corp. | | | (221 | ) | | $ | (34,564 | ) |
| WD-40 Co. | | | (276 | ) | | | (52,106 | ) |
| | | | | | | | (86,670 | ) |
| | | | | | | | | |
| Plastics and Rubber Products Manufacturing – (0.12)% | | | | | | | | |
| AptarGroup, Inc. | | | (288 | ) | | | (30,842 | ) |
| | | | | | | | | |
| Professional, Scientific, and Technical Services – (2.49)% | | | | | | | | |
| Adaptive Biotechnologies Corp. | | | (1,708 | ) | | | (13,357 | ) |
| Allogene Therapeutics, Inc. | | | (2,075 | ) | | | (16,455 | ) |
| Ameresco, Inc. | | | (506 | ) | | | (29,712 | ) |
| Coursera, Inc. | | | (1,603 | ) | | | (27,107 | ) |
| Cytokinetics, Inc. | | | (1,433 | ) | | | (57,176 | ) |
| Digital Turbine, Inc. | | | (3,235 | ) | | | (82,266 | ) |
| DigitalOcean Holdings, Inc. | | | (995 | ) | | | (48,606 | ) |
| Invitae Corp. | | | (2,833 | ) | | | (10,397 | ) |
| JFrog Ltd. | | | (4,239 | ) | | | (79,057 | ) |
| Kodiak Sciences, Inc. | | | (637 | ) | | | (4,612 | ) |
| Magnite, Inc. | | | (4,608 | ) | | | (50,642 | ) |
| Teledyne Technologies, Inc. | | | (283 | ) | | | (114,658 | ) |
| Vimeo, Inc. | | | (4,152 | ) | | | (36,081 | ) |
| Wix.com Ltd. | | | (1,137 | ) | | | (71,642 | ) |
| | | | | | | | (641,768 | ) |
| | | | | | | | | |
| Publishing Industries (except Internet) – (1.20)% | | | | | | | | |
| Bentley Systems, Inc. | | | (2,323 | ) | | | (79,865 | ) |
| BigCommerce Holdings, Inc. | | | (2,728 | ) | | | (50,550 | ) |
| Bill.com Holdings, Inc. | | | (437 | ) | | | (51,671 | ) |
| Fastly, Inc. | | | (3,306 | ) | | | (43,143 | ) |
| Okta, Inc. – Class A | | | (1,002 | ) | | | (83,216 | ) |
| | | | | | | | (308,445 | ) |
| | | | | | | | | |
| Real Estate – (0.56)% | | | | | | | | |
| MP Materials Corp. | | | (632 | ) | | | (24,920 | ) |
| Opendoor Technologies, Inc. | | | (4,900 | ) | | | (35,427 | ) |
| Redfin Corp. | | | (1,531 | ) | | | (15,004 | ) |
| Zillow Group, Inc. – Class A | | | (846 | ) | | | (33,806 | ) |
| Zillow Group, Inc. – Class C | | | (847 | ) | | | (33,795 | ) |
| | | | | | | | (142,952 | ) |
| | | | | | | | | |
| Rental and Leasing Services – (0.30)% | | | | | | | | |
| AMERCO | | | (86 | ) | | | (42,138 | ) |
| Triton International Ltd. – Class A | | | (550 | ) | | | (35,074 | ) |
| | | | | | | | (77,212 | ) |
The accompanying notes are an integral part of these financial statements.
CONVERGENCE LONG/SHORT EQUITY ETF
| Schedule of Securities Sold Short (Continued) |
May 31, 2022 (Unaudited)
| | | Shares | | | Value | |
| | | | | | | |
| Repair and Maintenance – (0.08)% | | | | | | |
| Driven Brands Holdings, Inc. | | | (739 | ) | | $ | (21,387 | ) |
| | | | | | | | | |
| Securities, Commodity Contracts, and Other Financial | | | | | | | | |
| Investments and Related Activities – (1.91)% | | | | | | | | |
| Apollo Global Management, Inc. | | | (1,280 | ) | | | (73,779 | ) |
| Blackstone, Inc. | | | (620 | ) | | | (73,030 | ) |
| Brighthouse Financial, Inc. | | | (909 | ) | | | (44,650 | ) |
| Clarivate PLC | | | (1,458 | ) | | | (21,535 | ) |
| DraftKings, Inc. | | | (2,375 | ) | | | (32,181 | ) |
| E2open Parent Holdings, Inc. | | | (11,240 | ) | | | (90,820 | ) |
| S&P Global, Inc. | | | (215 | ) | | | (75,138 | ) |
| The Beauty Health Company | | | (2,624 | ) | | | (37,444 | ) |
| Trupanion, Inc. | | | (663 | ) | | | (44,341 | ) |
| | | | | | | | (492,918 | ) |
| | | | | | | | | |
| Specialty Trade Contractors – (0.34)% | | | | | | | | |
| QuantumScape Corp. | | | (4,102 | ) | | | (52,465 | ) |
| Sunrun, Inc. | | | (1,342 | ) | | | (35,053 | ) |
| | | | | | | | (87,518 | ) |
| | | | | | | | | |
| Support Activities for Mining – (0.83)% | | | | | | | | |
| Civitas Resources, Inc. | | | (1,057 | ) | | | (80,702 | ) |
| Liberty Oilfield Services, Inc. – Class A | | | (3,307 | ) | | | (53,805 | ) |
| Northern Oil and Gas, Inc. | | | (2,387 | ) | | | (78,031 | ) |
| | | | | | | | (212,538 | ) |
| | | | | | | | | |
| Telecommunications – (1.13)% | | | | | | | | |
| Bandwidth, Inc. | | | (1,443 | ) | | | (30,361 | ) |
| T-Mobile US, Inc. | | | (590 | ) | | | (78,641 | ) |
| Twilio, Inc. – Class A | | | (810 | ) | | | (85,187 | ) |
| Zoom Video Communications, Inc. | | | (907 | ) | | | (97,457 | ) |
| | | | | | | | (291,646 | ) |
| | | | | | | | | |
| Transit and Ground Passenger Transportation – (0.17)% | | | | | | | | |
| Lyft, Inc. | | | (2,524 | ) | | | (44,624 | ) |
| | | | | | | | | |
| Transportation Equipment Manufacturing – (0.70)% | | | | | | | | |
| Boeing Co. | | | (256 | ) | | | (33,638 | ) |
| Dana, Inc. | | | (4,645 | ) | | | (76,921 | ) |
| Fox Factory Holding Corp. | | | (852 | ) | | | (69,881 | ) |
| | | | | | | | (180,440 | ) |
The accompanying notes are an integral part of these financial statements.
CONVERGENCE LONG/SHORT EQUITY ETF
| Schedule of Securities Sold Short (Continued) |
May 31, 2022 (Unaudited)
| | | Shares | | | Value | |
| | | | | | | |
| Utilities – (1.77)% | | | | | | |
| Atmos Energy Corp. | | | (406 | ) | | $ | (47,222 | ) |
| Brookfield Renewable Corp. | | | (1,275 | ) | | | (46,130 | ) |
| First Solar, Inc. | | | (1,574 | ) | | | (111,139 | ) |
| New Fortress Energy, Inc. | | | (1,323 | ) | | | (61,638 | ) |
| NextEra Energy, Inc. | | | (626 | ) | | | (47,382 | ) |
| OGE Energy Corp. | | | (1,032 | ) | | | (42,622 | ) |
| Public Service Enterprise Group, Inc. | | | (692 | ) | | | (47,430 | ) |
| Sunnova Energy International, Inc. | | | (2,547 | ) | | | (50,940 | ) |
| | | | | | | | (454,503 | ) |
| | | | | | | | | |
| Water Transportation – (0.45)% | | | | | | | | |
| Frontline Ltd. | | | (5,129 | ) | | | (49,649 | ) |
| Kirby Corp. | | | (618 | ) | | | (41,734 | ) |
| Royal Caribbean Cruises Ltd. | | | (432 | ) | | | (25,086 | ) |
| | | | | | | | (116,469 | ) |
| TOTAL COMMON STOCKS (Proceeds $13,178,636) | | | | | | | (9,136,297 | ) |
| | | | | | | | | |
| REAL ESTATE INVESTMENT TRUSTS (1.12)% | | | | | | | | |
| Arbor Realty Trust, Inc. | | | (4,105 | ) | | | (67,404 | ) |
| DigitalBridge Group, Inc. | | | (4,736 | ) | | | (28,511 | ) |
| Equity Commonwealth | | | (1,196 | ) | | | (32,591 | ) |
| Independence Realty Trust, Inc. | | | (1,170 | ) | | | (27,507 | ) |
| Kite Realty Group Trust | | | (1,625 | ) | | | (34,060 | ) |
| Pebblebrook Hotel Trust | | | (1,428 | ) | | | (32,144 | ) |
| Safehold, Inc. | | | (755 | ) | | | (33,862 | ) |
| Washington Real Estate Investment Trust | | | (1,384 | ) | | | (33,617 | ) |
| TOTAL REAL ESTATE INVESTMENT TRUSTS (Proceeds $311,813) | | | | | | | (289,696 | ) |
| Total Securities Sold Short (Proceeds $13,490,446) | | | | | | $ | (9,425,993 | ) |
The accompanying notes are an integral part of these financial statements.
CONVERGENCE LONG/SHORT EQUITY ETF
| Statement of Assets and Liabilities |
May 31, 2022 (Unaudited)
| Assets | | | |
Investments, at value (cost $27,440,257) | | $ | 29,487,327 | |
Receivable for investments sold | | | 3,299,878 | |
Deposit for short sales at broker | | | 5,243,464 | |
Dividends and interest receivable | | | 34,071 | |
Cash | | | 432 | |
Other assets | | | 2,954 | |
| Total Assets | | | 38,068,126 | |
| | | | | |
| Liabilities | | | | |
Securities sold short, at value (proceeds $13,490,446) | | | 9,425,993 | |
Payable for investments purchased | | | 2,881,514 | |
Dividends payable on short positions | | | 3,331 | |
Payable to broker for interest expense | | | 146 | |
Payable to Adviser | | | 7,527 | |
Accrued expenses and other liabilities | | | 428 | |
| Total Liabilities | | | 12,318,939 | |
| Net Assets | | $ | 25,749,187 | |
| | | | | |
| Net Assets Consist Of: | | | | |
Paid-in capital | | | 16,343,832 | |
Total Distributable Earnings | | | 9,405,355 | |
| Net Assets | | $ | 25,749,187 | |
| | | | | |
Net Assets | | $ | 25,749,187 | |
Shares of beneficial interest outstanding (unlimited | | | | |
number of shares authorized, $0.001 par value) | | | 1,637,329 | |
Net asset value, redemption price and offering price per share | | $ | 15.73 | |
The accompanying notes are an integral part of these financial statements.
CONVERGENCE LONG/SHORT EQUITY ETF
For the Six Months Ended May 31, 2022(a) (Unaudited)
| Investment Income | | | |
Dividend income | | $ | 235,472 | |
Interest income | | | 63 | |
| Total Investment Income | | | 235,535 | |
| | | | | |
| Expenses | | | | |
Management fees | | | 128,739 | |
Administration and accounting fees | | | 29,768 | |
Dividends on short positions | | | 29,415 | |
Interest and broker expenses | | | 27,365 | |
Federal and state registration fees | | | 20,837 | |
Legal fees | | | 6,425 | |
Trustees’ fees | | | 6,217 | |
Chief Compliance Officer fees | | | 3,998 | |
Transfer agent fees and expenses | | | 3,495 | |
Insurance fees | | | 2,752 | |
Reports to shareholders | | | 1,710 | |
Pricing fees | | | 1,501 | |
Custody fees | | | 940 | |
Other expenses | | | 685 | |
| Total Expenses | | | 263,847 | |
| Expense reimbursement due from Adviser (Note 4) | | | (47,517 | ) |
| Net Expenses | | | 216,330 | |
| Net Investment Income | | | 19,205 | |
| | | | | |
| Realized and Unrealized Gain (Loss) on Investments | | | | |
Net realized gain from: | | | | |
| Investments | | | 2,691,431 | |
| Short transactions | | | 693,916 | |
Change in net unrealized appreciation (depreciation) on: | | | | |
| Investments | | | (4,566,472 | ) |
| Short transactions | | | 2,349,555 | |
| Realized and Unrealized Gain on Investments | | | 1,168,430 | |
| Net Increase in Net Assets from Operations | | $ | 1,187,635 | |
(a) | The Fund converted from a mutual fund to an ETF pursuant to an Agreement and Plan of Reorganization on February 22, 2022. See Note 1 in the Notes to Financial Statements for additional information about the Reorganization. |
The accompanying notes are an integral part of these financial statements.
CONVERGENCE LONG/SHORT EQUITY ETF
| Statements of Changes in Net Assets |
| | | Six Months Ended | | | Year Ended | |
| | | May 31, 2022(a) | | | November 30, | |
| | | (Unaudited) | | | 2021 | |
| From Operations | | | | | | |
| Net investment income (loss) | | $ | 19,205 | | | $ | (50,567 | ) |
| Net realized gain (loss) from: | | | | | | | | |
| Investments | | | 2,691,431 | | | | 9,853,452 | |
| Short transactions | | | 693,916 | | | | (3,340,029 | ) |
| Change in net unrealized | | | | | | | | |
| appreciation (depreciation) on: | | | | | | | | |
| Investments | | | (4,566,472 | ) | | | (1,146,890 | ) |
| Short transactions | | | 2,349,555 | | | | 1,511,174 | |
Net increase in net assets from operations | | | 1,187,635 | | | | 6,827,140 | |
| | | | | | | | | |
| From Distributions | | | | | | | | |
| Net dividend and distributions | | | (4,719,158 | ) | | | (62,000 | ) |
Net decrease in net assets | | | | | | | | |
resulting from distributions paid | | | (4,719,158 | ) | | | (62,000 | ) |
| | | | | | | | | |
| From Capital Share Transactions | | | | | | | | |
| Proceeds from shares sold | | | 39,661,829 | | | | 12,942,673 | |
| Net asset value of shares issued in | | | | | | | | |
| reinvestment of distributions to shareholders | | | 4,325,163 | | | | 28,272 | |
| Payments for shares redeemed | | | (44,019,634 | ) | | | (12,959,595 | ) |
Net increase (decrease) in net assets from | | | | | | | | |
capital share transactions | | | (32,642 | ) | | | 11,350 | |
| | | | | | | | | |
| Total Increase (Decrease) In Net Assets | | | (3,564,165 | ) | | | 6,776,490 | |
| | | | | | | | | |
| Net Assets | | | | | | | | |
| Beginning of period | | | 29,313,352 | | | | 22,536,862 | |
| End of period | | $ | 25,749,187 | | | $ | 29,313,352 | |
(a) | The Fund converted from a mutual fund to an ETF pursuant to an Agreement and Plan of Reorganization on February 22, 2022. See Note 1 in the Notes to Financial Statements for additional information about the Reorganization. |
The accompanying notes are an integral part of these financial statements.
CONVERGENCE LONG/SHORT EQUITY ETF
For the Six Months Ended May 31, 2022(a) (Unaudited)
| CASH FLOWS FROM OPERATING ACTIVITIES: | | | |
| Net increase (decrease) in net assets resulting from operations | | $ | 1,187,635 | |
| Adjustments to reconcile net increase in net assets from | | | | |
| operations to net cash used in operating activities: | | | | |
| Purchases of investments | | | (47,691,705 | ) |
| Purchases of short-term investments, net | | | 57,658 | |
| Proceeds from sales of long-term investments | | | 49,738,832 | |
| Return of capital distributions received from underlying investments | | | 19,970 | |
| Decrease in dividends and interest receivable | | | 12,047 | |
| Increase in receivable for investment securities sold | | | (912,183 | ) |
| Decrease in other assets | | | 12,107 | |
| Proceeds from securities sold short | | | 12,607,799 | |
| Purchases to cover securities sold short | | | (9,949,372 | ) |
| Increase in payable for investment securities purchased | | | 331,129 | |
| Decrease in payable for fund shares redeemed | | | (6,824 | ) |
| Decrease in dividends payable on short positions | | | (136 | ) |
| Decrease in payable to broker for interest expense | | | (1,783 | ) |
| Decrease in payable to Adviser | | | (9,588 | ) |
| Decrease in accrued expenses and other liabilities | | | (85,982 | ) |
| Unrealized appreciation on investments | | | 4,566,472 | |
| Unrealized depreciation on short transactions | | | (2,349,555 | ) |
| Net realized loss on investments | | | (2,691,431 | ) |
| Net realized loss on short transactions | | | (693,916 | ) |
| Net cash provided in operating activities | | | 4,141,174 | |
| CASH FLOWS FROM FINANCING ACTIVITIES: | | | | |
| Proceeds from shares sold | | | 39,681,829 | |
| Payment on shares redeemed | | | (44,019,634 | ) |
| Cash distributions paid to shareholders | | | (393,995 | ) |
| Net cash used by financing activities | | | (4,731,800 | ) |
Net change in cash | | $ | (590,626 | ) |
| CASH: | | | | |
| Beginning Balance | | | 5,834,522 | |
| Ending Balance | | $ | 5,243,896 | |
| SUPPLEMENTAL DISCLOSURES: | | | | |
| Cash paid for interest | | | 29,148 | |
| Non-cash financing activities – distributions reinvested | | | 4,325,163 | |
| Non-cash financing activities – (increase)/decrease in | | | | |
| receivable for Fund shares sold | | | (20,000 | ) |
| Non-cash financing activities – decrease in payable for Fund shares redeemed | | | 6,824 | |
| RECONCILIATION OF RESTRICTED AND UNRESTRICTED CASH AT THE | | | | |
| BEGINNING OF PERIOD TO THE STATEMENT OF ASSETS AND LIABILITIES | | | | |
| Cash | | | — | |
| Deposit with brokers short sale proceeds | | | 5,834,522 | |
| RECONCILIATION OF RESTRICTED AND UNRESTRICTED CASH AT THE | | | | |
| END OF PERIOD TO THE STATEMENT OF ASSETS AND LIABILITIES | | | | |
| Cash | | | 432 | |
| Deposit with brokers short sale proceeds | | | 5,243,464 | |
(a) | The Fund converted from a mutual fund to an ETF pursuant to an Agreement and Plan of Reorganization on February 22, 2022. See Note 1 in the Notes to Financial Statements for additional information about the Reorganization. |
The accompanying notes are an integral part of these financial statements.
CONVERGENCE LONG/SHORT EQUITY ETF
| | | Six Months Ended | |
| | | May 31, 2022(8) | |
| | | (Unaudited) | |
| Net Asset Value, Beginning of Year | | $ | 17.94 | |
| | | | | |
| Income from investment operations: | | | | |
Net investment income(1) | | | 0.01 | |
| Net realized and unrealized gain on investments | | | 0.65 | |
Total from Investment Operations | | | 0.66 | |
| | | | | |
| Less distributions paid: | | | | |
| From net investment income | | | — | |
| From net realized gains | | | (2.87 | ) |
Total distributions paid | | | (2.87 | ) |
| | | | | |
| Net Asset Value, End of Period | | $ | 15.73 | |
| Market Price, End of Period | | $ | 15.72 | |
| | | | | |
Total Return on NAV(2)(4) | | | 4.20 | % |
Total Return on Market Price(4)(6) | | | 4.14 | % |
| | | | | |
| Supplemental Data and Ratios: | | | | |
Net assets at end of period (000’s) | | $ | 29,313 | |
Ratio of expenses to average net assets: | | | | |
Before waiver, expense reimbursement and recoupments(3)(5) | | | 2.00 | % |
After waiver, expense reimbursement and recoupments(3)(5) | | | 1.64 | % |
Ratio of net investment income to average net assets: | | | | |
Before waiver, expense reimbursement and recoupments(5) | | | (0.21 | )% |
After waiver, expense reimbursement and recoupments(5) | | | 0.15 | % |
Portfolio turnover rate | | | 121.53 | %(7) |
(1) | Per share net investment income was calculated using the daily average shares outstanding method. |
(2) | Total return on net asset value (NAV) represents the rate that the investor would have earned or lost on an investment in the Fund, assuming reinvestment of dividends. |
(3) | The ratio of expenses to average net assets includes dividends on short positions, interest and broker expenses. The annualized before waiver, expense reimbursement and recoupments and after waiver, expense reimbursement and recoupments ratios excluding dividends on short positions, interest and broker expenses were 1.57% and 1.21%, 1.95% and 1.50%, 1.69% and 1.50%, 1.32% and 1.32%, 1.27% and 1.27%, 1.28% and 1.28% for the periods ended May 31, 2022, November 30, 2021, November 30, 2020, November 30, 2019, November 30, 2018, November 30, 2017, respectively. |
(4) | Not annualized for periods less than a full year. |
(5) | Annualized for periods less than a full year. |
(6) | Total return on market price is calculated assuming an initial investment made at the market price on the first day of the period, reinvestment of dividends and distributions at market price during the period and redemption at market price on the last day of the period. |
(7) | Excludes the impact of in-kind transactions. |
(8) | The Fund converted from a mutual fund to an ETF pursuant to an Agreement and Plan of Reorganization on February 22, 2022. See Note 1 in the Notes to Financial Statements for additional information about the Reorganization. |
The accompanying notes are an integral part of these financial statements.
Per Share Data for a Share Outstanding Throughout Each Period
Year Ended November 30,
| 2021 | | | 2020 | | | 2019 | | | 2018 | | | 2017 | |
$ | 14.03 | | | $ | 19.76 | | | $ | 19.83 | | | $ | 21.03 | | | $ | 18.47 | |
| | | | | | | | | | | | | | | | | | | |
| | | | | | | | | | | | | | | | | | | |
| | (0.03 | ) | | | 0.00 | (2) | | | 0.14 | | | | 0.01 | | | | 0.04 | |
| | 3.98 | | | | (1.10 | ) | | | 0.65 | | | | 1.47 | | | | 3.32 | |
| | 3.95 | | | | (1.10 | ) | | | 0.79 | | | | 1.48 | | | | 3.36 | |
| | | | | | | | | | | | | | | | | | | |
| | | | | | | | | | | | | | | | | | | |
| | (0.04 | ) | | | (0.13 | ) | | | (0.07 | ) | | | (0.04 | ) | | | (0.18 | ) |
| | — | | | | (4.50 | ) | | | (0.79 | ) | | | (2.64 | ) | | | (0.62 | ) |
| | (0.04 | ) | | | (4.63 | ) | | | (0.86 | ) | | | (2.68 | ) | | | (0.80 | ) |
| | | | | | | | | | | | | | | | | | | |
$ | 17.94 | | | $ | 14.03 | | | $ | 19.76 | | | $ | 19.83 | | | $ | 21.03 | |
$ | — | | | $ | — | | | $ | — | | | $ | — | | | $ | — | |
| | | | | | | | | | | | | | | | | | | |
| | 28.26 | % | | | -7.68 | % | | | 4.72 | % | | | 7.69 | % | | | 18.81 | % |
| | — | % | | | — | % | | | — | % | | | — | % | | | — | % |
| | | | | | | | | | | | | | | | | | | |
| | | | | | | | | | | | | | | | | | | |
$ | 29,313 | | | $ | 22,537 | | | $ | 67,741 | | | $ | 112,861 | | | $ | 128,565 | |
| | | | | | | | | | | | | | | | | | | |
| | 2.56 | % | | | 2.58 | % | | | 2.18 | % | | | 2.20 | % | | | 2.11 | % |
| | 2.11 | % | | | 2.39 | % | | | 2.18 | % | | | 2.20 | % | | | 2.11 | % |
| | | | | | | | | | | | | | | | | | | |
| | (0.63 | )% | | | (0.13 | )% | | | 0.76 | % | | | 0.03 | % | | | 0.20 | % |
| | (0.18 | )% | | | 0.06 | % | | | 0.76 | % | | | 0.03 | % | | | 0.20 | % |
| | 303.76 | % | | | 251.72 | % | | | 239.08 | % | | | 193.55 | % | | | 214.61 | % |
The accompanying notes are an integral part of these financial statements.
CONVERGENCE LONG/SHORT EQUITY ETF
Notes to Financial Statements
May 31, 2022 (Unaudited)
| (1) | Organization |
| | |
| | Trust for Professional Managers (the “Trust”) was organized as a Delaware statutory trust under a Declaration of Trust dated May 29, 2001. The Trust is registered under the Investment Company Act of 1940, as amended (the “1940 Act”), as an open-end management investment company. The Convergence Long/Short Equity ETF (the “Fund”) represents a distinct diversified series with its own investment objectives and policies within the Trust. The investment objective of the Fund is to seek long-term capital growth. The Fund is an actively managed exchange-traded fund (“ETF”). The Trust may issue an unlimited number of shares of beneficial interest at $0.001 par value. The Fund became effective on February 22, 2022 and commenced operations on February 22, 2022. Costs incurred by the Fund in connection with the organization, registration and the initial public offering of shares were paid by Convergence Investment Partners, LLC (the “Adviser”), the Fund’s investment adviser. |
| | |
| | The Fund is an investment company and accordingly follows the investment company accounting and reporting guidance of the Financial Accounting Standards Board (“FASB”) Accounting Standard Codification Topic 946 “Financial Services–Investment Companies.” |
| | |
| | The Fund is the accounting and performance survivor of the Convergence Long/Short Equity Fund (the “Target Fund”). The Fund became a series of the Trust on February 22, 2022 following a reorganization (“Reorganization”), pursuant to an Agreement and Plan of Reorganization, which resulted in the conversion of the Target Fund organized as a mutual fund to an ETF. The Fund was established as a “shell” fund organized solely in connection with the Reorganization for the purpose of acquiring the assets and liabilities of the Target Fund and continuing the operations of the Target Fund as an ETF. The Fund had no performance history prior to the Reorganization. |
| | |
| | The Reorganization was accomplished by a tax-free exchange of shares (with an exception for fractional mutual fund shares) of the Acquiring Fund for shares of the Target Fund of equivalent aggregate net asset value. Fees and expenses incurred to affect the Reorganization were borne by the Adviser. The management fee of the Fund is lower than the management fee of the Target Fund therefore, the Fund is expected to experience lower overall expenses as compared to the Target Fund. The Reorganization did not result in a material change to the Target Fund’s investment portfolio as compared to the Fund. There are no material differences in accounting policies of the Target Fund as compared to the Fund. The Fund did not purchase or sell securities following the Reorganization for purposes of realigning its investment portfolio. Accordingly, the acquisition of the Target Fund did not affect the Fund’s portfolio turnover ratios for the period ended May 31, 2022. |
| | |
| (2) | Significant Accounting Policies |
| | |
| | The following is a summary of significant accounting policies consistently followed by the Fund in the preparation of the financial statements. These policies are in conformity with generally accepted accounting principles in the United States of America (“GAAP”). |
CONVERGENCE LONG/SHORT EQUITY ETF
Notes to Financial Statements (Continued)
May 31, 2022 (Unaudited)
| | Each security owned by the Fund, including long and short positions of common stock and real estate investment trusts, that is listed on a securities exchange, except those listed on the NASDAQ Stock Market LLC (“NASDAQ”), is valued at its last sale price on that exchange on the date as of which assets are valued. When the security is listed on more than one exchange, the Fund will use the price of the exchange that the Fund generally consider to be the principal exchange on which the stock is traded. |
| | |
| | Fund securities listed on NASDAQ will be valued at the NASDAQ Official Closing Price, which may not necessarily represent the last sale price. If there has been no sale on such exchange or on NASDAQ on such day, the security shall be valued at, (i) the mean between the most recent quoted bid and asked prices at the close of the exchange on such day or (ii) the last sales price on the Composite Market for the day such security is being valued. “Composite Market” means a consolidation of the trade information provided by national securities and foreign exchanges and over-the-counter markets, as published by an approved independent pricing service (“Pricing Service”). |
| | |
| | Debt securities, including short-term debt instruments having a maturity of 60 days or less, are valued at the mean in accordance with prices supplied by a Pricing Service. Pricing Services may use various valuation methodologies such as the mean between the bid and the asked prices, matrix pricing and other analytical pricing models as well as market transactions and dealer quotations. If a price is not available from a Pricing Service, the most recent quotation obtained from one or more broker-dealers known to follow the issue will be obtained. Quotations will be valued at the mean between the bid and the offer. In the absence of available quotations, the securities will be priced at fair value, as described below. Any discount or premium is accreted or amortized using the constant yield method until maturity. |
| | |
| | Redeemable securities issued by open-end, registered investment companies are valued at the net asset value (“NAV”) of such companies for purchase and/or redemption orders placed on that day. If, on a particular day, a share of an investment company is not listed on NASDAQ, such security’s fair value will be determined as described below. Money market mutual funds are valued at cost. If cost does not represent current market value the securities will be priced at fair value. |
| | |
| | When market quotations are not readily available, any security or other asset is valued at its fair value as determined under procedures approved by the Trust’s Board of Trustees. These fair value procedures will also be used to price a security when corporate events, events in the securities market or world events cause the Adviser to believe that a security’s last sale price may not reflect its actual fair market value. The intended effect of using fair value pricing procedures is to ensure that the Fund is accurately priced. |
| | |
| | FASB Accounting Standards Codification, “Fair Value Measurements and Disclosures” Topic 820 (“ASC 820”), establishes an authoritative definition of fair value and sets out a hierarchy for measuring fair value. ASC 820 requires an entity to evaluate certain factors to determine whether there has been a significant decrease in volume and level of activity for the security such that recent transactions and quoted |
CONVERGENCE LONG/SHORT EQUITY ETF
Notes to Financial Statements (Continued)
May 31, 2022 (Unaudited)
| | prices may not be determinative of fair value and further analysis and adjustment may be necessary to estimate fair value. ASC 820 also requires enhanced disclosures regarding the inputs and valuation techniques used to measure fair value in those instances as well as expanded disclosure of valuation levels for each class of investments. These inputs are summarized in the three broad levels listed below: |
| | Level 1— | Quoted prices in active markets for identical securities. |
| | | |
| | Level 2— | Other significant observable inputs (including quoted prices for similar securities, interest rates, prepayment speeds, credit risk, etc.). |
| | | |
| | Level 3— | Significant unobservable inputs (including a Fund’s own assumptions in determining the fair value of investments). |
| | The inputs or methodology used for valuing securities are not necessarily an indication of the risk associated with investing in those securities. The following is a summary of the inputs used to value the Fund’s investments carried at fair value as of May 31, 2022: |
| | | | Level 1 | | | Level 2 | | | Level 3 | | | Total | |
| | Assets(1): | | | | | | | | | | | | |
| | Common Stock | | $ | 28,512,275 | | | $ | — | | | $ | — | | | $ | 28,512,275 | |
| | Real Estate Investment Trusts | | | 961,661 | | | | — | | | | — | | | | 961,661 | |
| | Short-Term Investments | | | 13,391 | | | | — | | | | — | | | | 13,391 | |
| | Total Investments | | | 29,487,327 | | | | — | | | | — | | | | 29,487,327 | |
| | Total Assets | | $ | 29,487,327 | | | $ | — | | | $ | — | | | $ | 29,487,327 | |
| | Liabilities: | | | | | | | | | | | | | | | | |
| | Securities Sold Short | | | | | | | | | | | | | | | | |
| | Common Stocks | | $ | (9,136,297 | ) | | $ | — | | | $ | — | | | $ | (9,136,297 | ) |
| | Real Estate Investment Trusts | | | (289,696 | ) | | | — | | | | — | | | | (289,696 | ) |
| | Total Securities Sold Short | | | (9,425,993 | ) | | | — | | | | — | | | | (9,425,993 | ) |
| | Total Liabilities | | $ | (9,425,993 | ) | | $ | — | | | $ | — | | | $ | (9,425,993 | ) |
| | (1) | See the Schedule of Investments for industry classifications. |
| | The Fund did not hold any Level 3 securities during the six months ended May 31, 2022. |
| | |
| | Except for securities sold short, the Fund did not engage in any derivative securities or engage in hedging activities during the six months ended May 31, 2022. |
| | The Fund may sell a security it does not own in anticipation of a decline in the fair value of that security. When the Fund sells a security short, it must borrow the security sold short and deliver it to the broker-dealer through which it made the short sale. A gain, limited to the price at which the Fund sold the security short, or a loss, unlimited in size, will be recognized upon the termination of a short sale. For financial statement purposes, an amount equal to the settlement amount is included in the Statement of Assets and Liabilities as a liability. The amount of the liability is subsequently marked-to-market to reflect the current value of the short positions. Subsequent fluctuations in |
CONVERGENCE LONG/SHORT EQUITY ETF
Notes to Financial Statements (Continued)
May 31, 2022 (Unaudited)
| | the market prices of the securities sold, but not yet purchased, may require purchasing the securities at prices which could differ from the amount reflected in the Statement of Assets and Liabilities. The Fund is liable for any dividends or interest payable on securities while those securities are in a short position. Such amounts are recorded on the ex-dividend date as a dividend expense, and interest expense is accrued daily. As collateral for its short positions, the Fund is required under the 1940 Act to maintain segregated assets consisting of cash, cash equivalents or liquid securities. The segregated assets are valued consistent with Note 2a above. The amount of segregated assets is required to be adjusted daily to the extent additional collateral is required based on the change in fair value of the securities sold short. The Fund’s securities sold short and deposits for short sales are held with one major securities broker-dealer. The Fund does not require this broker-dealer to maintain collateral in support of the receivable for proceeds on securities sold short. |
| | The Fund complies with the requirements of Subchapter M of the Internal Revenue Code, as amended, necessary to qualify as a regulated investment company and makes the requisite distributions of income and capital gains to their shareholders sufficient to relieve them from all or substantially all federal income taxes. Therefore, no federal income tax provision has been provided. |
| | |
| | As of and during the year ended November 30, 2021, the Fund did not have a liability for any unrecognized tax benefits. The Fund recognizes interest and penalties, if any, related to unrecognized tax benefits as income tax expense in the Statement of Operations. During the year ended November 30, 2021, the Fund did not incur any interest or penalties. The Fund is not subject to examination by U.S. taxing authorities for the tax periods prior to the year ended November 30, 2018. |
| | (d) | Distributions to Shareholders |
| | The Fund will distribute any net investment income and any net capital gains at least annually. Distributions from net realized gains for book purposes may include short-term capital gains. All short-term capital gains are included in ordinary income for tax purposes. Distributions to shareholders are recorded on the ex-dividend date. The Fund may also pay a special distribution at the end of the calendar year to comply with federal tax requirements. |
| | The preparation of financial statements in conformity with GAAP requires management to make estimates and assumptions that affect the reported amounts of assets and liabilities and disclosure of contingent assets and liabilities at the date of the financial statements and the reported amounts of revenues and expenses during the reporting period. Actual results could differ from those estimates. |
| | The NAV per share of the Fund is calculated by dividing the sum of the fair value of the securities held by the Fund, plus cash or other assets, minus all liabilities |
CONVERGENCE LONG/SHORT EQUITY ETF
Notes to Financial Statements (Continued)
May 31, 2022 (Unaudited)
| | (including estimated accrued expenses) by the total number of shares outstanding for the Fund, rounded to the nearest cent. The Fund’s shares will not be priced on the days on which the New York Stock Exchange is closed for trading. The Fund does not charge a redemption fee, and therefore the offering and redemption price per share are equal to the Fund’s NAV per share. |
| | (g) | Allocation of Income, Expenses and Gains/Losses |
| | Expenses associated with a specific fund in the Trust are charged to that Fund. Common Trust expenses are typically allocated evenly between the funds of the Trust, or by other equitable means. |
| | Investment transactions are recorded on the trade date. The Fund determines the gain or loss from investment transactions on the identified cost basis by comparing original cost of the security lot sold with the net sale proceeds. Dividend income and expense is recognized on the ex-dividend date and interest income and expense is recognized on an accrual basis. Dividend income from real estate investment trusts (“REITs”) is recognized on the ex-date and included in dividend income. The calendar year-end classification of distributions received from REITs during the fiscal year are reported subsequent to year end; accordingly, the Fund estimates the character of REIT distributions based on the most recent information available and adjusts for actual classifications in the calendar year the information is reported. |
| | |
| | Withholding taxes on foreign dividends, net of any reclaims, have been provided for in accordance with the Fund’s understanding of the applicable country’s tax rules and rates. |
| | The tax character of distributions paid by the Fund during the fiscal years ended November 30, 2021 and November 30, 2020 was as follows: |
| | | | November 30, 2021 | | | November 30, 2020 | |
| | Ordinary Income | | $ | 62,000 | | | $ | 8,367,012 | |
| | Long-Term Capital Gain | | $ | — | | | $ | 7,113,297 | |
| | The Fund designated as long-term capital gain dividend, pursuant to Internal Revenue Code Section 852(b)(3), the amount necessary to reduce the earnings and profits of the Fund related to net capital gain to zero for the tax year ended November 30, 2021. The Fund utilized earnings and profits distributed to shareholders on redemption of shares as part of the dividend paid deduction. The amounts designated as gain for the fiscal years ended November 30, 2021 and 2020 were as follows: |
| | | | November 30, 2021 | | | November 30, 2020 | |
| | Long-term | | $ | 1,489,805 | | | $ | 1,075,752 | |
CONVERGENCE LONG/SHORT EQUITY ETF
Notes to Financial Statements (Continued)
May 31, 2022 (Unaudited)
| | As of November 30, 2021, the components of distributable earnings on a tax basis were as follows: |
| | Cost basis of investments for federal income tax purposes(1) | | $ | 15,458,348 | |
| | Gross tax unrealized appreciation | | $ | 8,880,412 | |
| | Gross tax unrealized depreciation | | | (662,674 | ) |
| | Net tax unrealized appreciation | | | 8,217,738 | |
| | Undistributed ordinary income | | | 2,017,130 | |
| | Undistributed long-term capital gain | | | 2,702,010 | |
| | Total distributable earnings | | | 4,719,140 | |
| | Other accumulated losses | | | — | |
| | Total distributable earnings | | $ | 12,936,878 | |
| | (1) | Includes securities sold short. |
| | The tax basis of distributable earnings for tax and financial reporting purposes differs principally due to the deferral of losses on wash sales. |
| | |
| | Income and capital gains distributions may differ from GAAP, primarily due to timing differences in the recognition of income, gains and losses, and equalization by the Fund. To the extent that these differences are attributable to permanent book and tax accounting differences, the components of net assets have been adjusted. Additionally, GAAP requires that certain components of net assets relating to permanent differences be reclassified between financial and tax reporting. These reclassifications are due to equalization and have no effect on net assets or NAV per share. For the year ended November 30, 2021, the following table shows the reclassifications made: |
| | Paid-in capital | | $ | 1,497,557 | |
| | Total distributable earnings | | $ | (1,497,557 | ) |
| (4) | Investment Adviser |
| | |
| | The Trust has an Investment Advisory Agreement (the “Agreement”) with the Adviser to furnish investment advisory services to the Fund. For the six months ended May 31, 2022, under the terms of the Agreement, the Fund compensated the Adviser for its management services at the annual rate of 0.97% of the Fund’s average daily net assets. This represents a blended rate of 1.00% pre-Reorganization and 0.95% post-Reorganization. |
| | |
| | Prior to the Reorganization, the Adviser contractually agreed to waive its management fee and/or reimburse the Fund’s other expenses at least through the expiration date listed below, at the discretion of the Adviser and the Board of Trustees, to the extent necessary to ensure that the Fund’s operating expenses (exclusive of front-end or contingent deferred loads, Rule 12b-1 plan fees, shareholder servicing plan fees, taxes, leverage (i.e., any expenses incurred in connection with borrowings made by the Fund), interest (including interest incurred in connection with bank and custody overdrafts), brokerage commissions and other transactional expenses, expenses incurred in connection with any merger or reorganization, dividends or interest on short |
CONVERGENCE LONG/SHORT EQUITY ETF
Notes to Financial Statements (Continued)
May 31, 2022 (Unaudited)
| | positions, acquired fund fees and expenses or extraordinary expenses such as litigation) did not exceed 1.50% of the Fund’s average daily net assets (the “Expense Limitation Cap”). |
| | |
| | Pursuant to the Reorganization, any previously waived expenses are no longer subject to recoupment and have expired. |
| | |
| | After the Reorganization, under the terms of the Agreement, the Adviser has agreed to pay all expenses of the Fund except interest charges on any borrowings, dividends, and other expenses on securities sold short, taxes, brokerage commissions and other expenses incurred in placing orders for the purchase and sale of securities and other investments, acquired fund fees and expenses, accrued deferred tax liability, extraordinary expenses, distribution fees and expenses paid by the Fund under any distribution plan adopted pursuant to Rule 12b-1 under the 1940 Act, and the unitary management fee payable to the Adviser. |
| | |
| (5) | Related Party Transactions |
| | |
| | U.S. Bancorp Fund Services, LLC, doing business as U.S. Bank Global Fund Services (“Fund Services” or the “Administrator”), acts as the Fund’s administrator under an Administration Agreement. The Administrator prepares various federal and state regulatory filings, reports and returns for the Fund; prepares reports and materials to be supplied to the Trustees; monitors the activities of the Fund’s custodian, transfer agent and accountants; coordinates the preparation and payment of the Fund’s expenses and reviews the Fund’s expense accruals. Fund Services also serves as the fund accountant and transfer agent to the Fund. U.S. Bank National Association (“U.S. Bank”), an affiliate of Fund Services, serves as the Fund’s custodian. The Trust’s Chief Compliance Officer is also an employee of Fund Services. Fees incurred for the period ended May 31, 2022, and owed as of May 31, 2022 were as follows: |
| | | | Incurred | | | Owed | |
| | Fund Administration and Accounting | | $ | 29,768 | | | $ | — | |
| | Pricing | | $ | 1,501 | | | $ | — | |
| | Transfer Agency | | $ | 3,495 | | | $ | — | |
| | Custody | | $ | 940 | | | $ | — | |
| | Chief Compliance Officer | | $ | 3,998 | | | $ | — | |
| | The Adviser paid the above referenced expenses for any periods following the Reorganization due to the unitary fee structure adopted by the Fund in connection with the Reorganization. |
| | |
| | The Fund had a line of credit with U.S. Bank through February 18, 2022 (see Note 9). |
| | |
| | Quasar Distributors, LLC (“Quasar”), a wholly owned broker-dealer subsidiary of Foreside Financial Group, LLC, acts as the Fund’s principal underwriter in a continuous public offering of Fund shares. |
| | |
| | Certain officers of the Fund are also employees of Fund Services. A Trustee of the Trust is affiliated with Fund Services and U.S. Bank. |
CONVERGENCE LONG/SHORT EQUITY ETF
Notes to Financial Statements (Continued)
May 31, 2022 (Unaudited)
| (6) | Capital Share Transactions |
| | |
| | Transactions in the Fund were as follows: |
| | | | Six Months Ended | | | Year Ended | |
| | | | May 31, 2022 | | | November 30, 2021 | |
| | Shares sold | | | 2,552,535 | | | | 836,583 | |
| | Shares reinvested | | | 283,803 | | | | 1,964 | |
| | Shares redeemed | | | (2,832,685 | ) | | | (811,170 | ) |
| | Net increase | | | 3,653 | | | | 27,377 | |
| (7) | Investment Transactions |
| | |
| | The aggregate purchases and sales of securities (excluding short-term investments and securities sold short), creations in-kind and redemptions in-kind for the Fund for the six months ended May 31, 2022 is summarized below. There were no purchases or sales of U.S. government securities for the Fund. |
Purchases | Sales | Creations In-Kind | Redemptions In-Kind |
| $37,068,891 | $38,622,877 | $10,622,814 | $11,115,955 |
| (8) | Creation and Redemption Transactions |
| | |
| | Shares of the Fund are listed and traded on the Cboe BZX Exchange, Inc. (the “Exchange”). The Fund issues and redeems shares on a continuous basis at NAV only in large blocks of shares called “Creation Units.” A Creation Unit generally consists of 10,000 shares. Creation Units are to be issued and redeemed principally in kind for a basket of securities and a balancing cash amount. Shares generally will trade in the secondary market in amounts less than a Creation Unit at market prices that change throughout the day. Market prices for the shares may be different from their NAV. The NAV is determined as of the close of trading (generally, 4:00 p.m. Eastern Time) on each day the NYSE is open for trading. The NAV of the shares of each Fund will be equal to a Fund’s total assets minus a Fund’s total liabilities divided by the total number of shares outstanding. The NAV that is published will be rounded to the nearest cent; however, for purposes of determining the price of Creation Units, the NAV will be calculated to five decimal places. |
| | |
| | Only “Authorized Participants” may purchase or redeem shares directly from the Fund. An Authorized Participant is either (i) a broker-dealer or other participant in the clearing process through the Continuous Net Settlement System of National Securities Clearing Corporation or (ii) a DTC participant and, in each case, must have executed a Participant Agreement with the Distributor. Most retail investors will not qualify as Authorized Participants or have the resources to buy and sell whole Creation Units. Therefore, they will be unable to purchase or redeem the shares directly from the Fund. Rather, most retail investors will purchase shares in the secondary market with the assistance of a broker and will be subject to customary brokerage commissions or fees. Securities received or delivered in connection with in-kind creates and redeems are valued as of the close of business on the effective date of the creation or redemption. |
CONVERGENCE LONG/SHORT EQUITY ETF
Notes to Financial Statements (Continued)
May 31, 2022 (Unaudited)
| | Creation Unit Transaction Fee |
| | |
| | Authorized Participants will be required to pay to the Custodian a fixed transaction fee (the “Creation Transaction Fee”) in connection with the issuance of Creation Units. The standard Creation Transaction Fee will be the same regardless of the number of Creation Units purchased by an investor on the applicable Business Day. The Creation Transaction Fee for the Fund is $300. |
| | |
| | An additional variable fee of up to a maximum of 2% of the value of the Creation Units subject to the transaction may be imposed for cash purchases, non-standard orders, or partial purchase of Creation Units. The variable charge is primarily designed to cover additional costs (e.g., brokerage, taxes) involved with buying the securities with cash. The Fund may determine to not charge a variable fee on certain orders when the Adviser has determined that doing so is in the best interests of Fund shareholders. |
| | |
| | A creation unit will generally not be issued until the transfer of good title of the deposit securities to the Funds and the payment of any cash amounts have been completed. To the extent contemplated by the applicable participant agreement, Creation Units of the Fund will be issued to such authorized participant notwithstanding the fact that the Fund’s deposits have not been received in part or in whole, in reliance on the undertaking of the authorized participant to deliver the missing deposit securities as soon as possible. If the Fund or its agents do not receive all of the deposit securities, or the required cash amounts, by such time, then the order may be deemed rejected and the authorized participant shall be liable to the Fund for losses, if any. |
| | |
| (9) | Line of Credit |
| | |
| | The Fund had a line of credit in the amount of the lesser of 33.33% of the fair value of unencumbered assets of the Fund or $4,000,000 through February 18, 2022. The unsecured line of credit was intended to provide short-term financing, if necessary, subject to certain restrictions, in connection with shareholder redemptions. The credit facility was with the Fund’s custodian, U.S. Bank. Interest was accrued at the prime rate of 3.25%. There were no loans outstanding for the Fund as of May 31, 2022. The following table provides information regarding usage of the line of credit for the six months ended May 31, 2022. |
| | Average | | Maximum | Maximum |
| Days | Amount of | Interest | Amount of | Borrowing |
Utilized | Borrowing | Expense* | Borrowing | Dates |
| 3 | $37,333 | $10 | $44,000 | 1/27/2022 |
| | * Interest expense is included within Interest and broker expenses on the Statement of Operations. |
| (10) | Recent Market Events |
| | |
| | U.S. and international markets have experienced significant periods of volatility in recent years and months due to a number of economic, political and global macro factors including the impact of COVID-19 as a global pandemic and related public health crisis, growth concerns in the U.S. and overseas, uncertainties regarding interest rates, rising inflation, trade tensions, and the threat of tariffs imposed by the |
CONVERGENCE LONG/SHORT EQUITY ETF
Notes to Financial Statements (Continued)
May 31, 2022 (Unaudited)
| | U.S. and other countries. In particular, the global spread of COVID-19 has resulted in disruptions to business operations and supply chains, stress on the global healthcare system, growth concerns in the U.S. and overseas, staffing shortages and the inability to meet consumer demand, and widespread concern and uncertainty. The global recovery from COVID-19 is proceeding at slower than expected rates due to the emergence of variant strains and may last for an extended period of time. Health crises and related political, social and economic disruptions caused by the spread of COVID-19 may also exacerbate other pre-existing political, social and economic risks in certain countries. As a result of continuing political tensions and armed conflicts, including the war between Ukraine and Russia, the U.S. and the European Union imposed sanctions on certain Russian individuals and companies, including certain financial institutions, and have limited certain exports and imports to and from Russia. The war has contributed to recent market volatility and may continue to do so. These developments, as well as other events, could result in further market volatility and negatively affect financial asset prices, the liquidity of certain securities and the normal operations of securities exchanges and other markets, despite government efforts to address market disruptions. Continuing market volatility as a result of recent market conditions or other events may have adverse effects on your account. |
| | |
| (11) | Results of Shareholder Meeting |
| | |
| | A Special Joint Meeting of Shareholders (the “Meeting”) took place on April 6, 2022. The Meeting was held for all series in the Trust. All Trust shareholders of record, in the aggregate across all series of the Trust, were entitled to attend or submit proxies. As of the record date, February 7, 2022, the Trust had 534,673,511 shares outstanding. The results of the voting for the proposals were as follows: |
| | Proposal 1: To approve the election of four Trustees to the Board of Trustees of the Trust to serve until his or her successor is elected and qualified. |
| | | For Votes | Votes Withheld | Broker Non-Vote |
| | Vincent P. Lyles | 465,453,094 | 2,962,687 | 15,025,189 |
| | Erik K. Olstein | 465,703,874 | 2,711,906 | 15,025,189 |
| | Lisa Zúñiga Ramírez | 465,728,682 | 2,662,552 | 15,025,189 |
| | Gregory M. Wesley | 465,394,219 | 2,984,741 | 15,025,189 |
| | Accordingly, effective April 6, 2022, the Board of Trustees of Trust for Professional Managers consists of the following individuals, each of whom have been elected by shareholders: |
| | Michael D. Akers, Independent Trustee |
| | Gary A. Drska, Independent Trustee |
| | Vincent P. Lyles, Independent Trustee |
| | Erik K. Olstein, Independent Trustee |
| | Lisa Zúñiga Ramírez, Independent Trustee |
| | Gregory M. Wesley, Independent Trustee |
| | Joseph C. Neuberger, Interested Trustee |
CONVERGENCE LONG/SHORT EQUITY ETF
Notes to Financial Statements (Continued)
May 31, 2022 (Unaudited)
| | Proposal 2: To approve one or more adjournments of the Special Meeting to a later date to solicit additional proxies. |
For Votes | Votes Against | Broker Votes Abstained |
| 476,848,750 | 2,932,139 | 3,647,484 |
| (12) | Subsequent Events |
| | |
| | Management has evaluated the Fund’s related events and transactions that occurred subsequent to May 31, 2022, through the date of issuance of the Fund’s financial statements. Management has determined that there were no subsequent events requiring recognition or disclosure in the financial statements. |
CONVERGENCE LONG/SHORT EQUITY ETF
Basis for Trustees’ Approval of Investment Advisory Agreement
(Unaudited)
The Board of Trustees (the “Trustees”) of Trust for Professional Managers (the “Trust”) met on October 20, 2021 to consider the initial approval of the Investment Advisory Agreement (the “Agreement”) between the Trust, on behalf of the Convergence Long/Short Equity ETF (the “Fund”), a series of the Trust, and Convergence Investment Partners, LLC, the Fund’s investment adviser (the “Adviser”). In advance of the meeting, the Trustees requested and received materials to assist them in considering the approval of the Agreement, including a memorandum provided by the Fund’s legal counsel, which outlined the Trustees’ responsibilities in considering the Agreement. The materials provided contained information with respect to the factors enumerated below, including a copy of the Agreement, detailed comparative information relating to the Fund’s performance, as well as the management fees and other expenses of the Fund, due diligence materials relating to the Adviser (including a due diligence questionnaire completed on behalf of the Fund by the Adviser, the Adviser’s Form ADV, select financial statements of the Adviser, bibliographic information of the Adviser’s key management and compliance personnel, comparative fee information for the Fund and the Adviser’s other separately-managed accounts and a summary detailing key provisions of the Adviser’s written compliance program, including its code of ethics) and other pertinent information. In considering approval of the Agreement, the Trustees also reviewed the Trust’s post effective amendment to its Form N-1A registration statement, including the prospectus and statement of additional information included therein, relating to the initial registration of the Fund.
Based on their evaluation of information provided by the Adviser, in conjunction with the Fund’s other service providers, the Trustees, by a unanimous vote (including a separate vote of the Trustees who are not “interested persons,” as that term is defined in the Investment Company Act of 1940, as amended (the “Independent Trustees”)), approved the Agreement for an initial term ending two years following the Fund’s commencement of operations pursuant to an effective registration statement.
| 1. | NATURE, EXTENT AND QUALITY OF SERVICES TO BE PROVIDED TO THE FUND |
The Trustees considered the nature, extent and quality of services that would be provided by the Adviser to the Fund and the amount of time devoted by the Adviser’s staff to the Fund’s operations. The Trustees considered the Adviser’s specific responsibilities in all aspects of day-to-day management of the Fund, as well as the qualifications, experience and responsibilities of David J. Abitz and Justin Neuberg, who will serve as the Fund’s portfolio managers, and other key personnel at the Adviser involved in the day-to-day activities of the Fund. The Trustees noted that the Adviser does not manage any other accounts that utilize strategies similar to those employed by the Fund. The Trustees noted that the Fund is an ETF that will be the successor to the Convergence Long/Short Equity Fund, a predecessor mutual fund managed by the Adviser (the “Predecessor Fund”). The Trustees reviewed information provided by the Adviser in a due diligence questionnaire, including the structure of the Adviser’s compliance program and discussed the Adviser’s marketing activities and its continuing commitment to the Fund. The Trustees also noted any services that extended beyond portfolio management, and they considered the brokerage practices of the Adviser. The Trustees discussed the Adviser’s handling of compliance matters, including the reports of the Trust’s chief compliance officer to the
CONVERGENCE LONG/SHORT EQUITY ETF
Basis for Trustees’ Approval of Investment Advisory Agreement
(Unaudited) (Continued)
Trustees on the effectiveness of the Adviser’s compliance program. The Trustees also considered the Adviser’s overall financial condition, as well as the implementation and operational effectiveness of the Adviser’s business continuity plan in response to the novel coronavirus (COVID-19) pandemic and challenges to day-to-day operations. The Trustees concluded that the Adviser had sufficient quality and depth of personnel, resources, investment methods and compliance policies and procedures essential to performing its duties under the Agreement and that the nature, overall quality and extent of the management services provided to the Fund, as well as the Adviser’s compliance program, were satisfactory and reliable.
| 2. | INVESTMENT PERFORMANCE OF THE FUND AND THE ADVISER |
In considering the portfolio management services to be provided by the Adviser, the Trustees considered the investment management experience of Messrs. Abitz and Neuberg, who will serve as the Fund’s portfolio managers. Because the Fund had not yet commenced operations and did not have its own performance history, the Trustees considered the historical performance of the Predecessor Fund, which is managed by Messrs. Abitz and Neuberg in identical respects as they will manage the Fund. The Trustees noted that the Fund will not commence operations until after the closing of the reorganization of the Predecessor Fund with and into the Fund, at which time the Fund will adopt the performance history of the Predecessor Fund. The Trustees discussed the performance of the Predecessor Fund for the year-to-date, one-year, three-year, five-year, ten-year and since inception periods ended August 31, 2021. In assessing the quality of the portfolio management services to be provided by the Adviser, the Trustees compared the short-term and longer-term performance of the Predecessor Fund on both an absolute basis and in comparison to a benchmark index (the Russell 3000 Total Return Index) and the performance of funds in the Predecessor Fund’s current Morningstar Category (the Morningstar Long/Short Equity Category). The Trustees noted that for the year-to-date period ended August 31, 2021, the Predecessor Fund outperformed the Russell 3000 Total Return Index and the Morningstar Long/Short Equity Category. The Trustees noted the Predecessor Fund outperformed the Morningstar Long/Short Equity Category for the one-year, five-year, ten-year and since inception periods ended August 31, 2021. The Trustees noted that the Predecessor Fund underperformed the Morningstar Long/Short Equity Category for the three-year period ended August 31, 2021 and underperformed the Russell 3000 Total Return Index for the one-year, three-year, five-year, ten-year and since inception periods ended August 31, 2021.
After considering all of the information and noting that past performance is not a guarantee or indication of future results, the Trustees determined that the Fund and its shareholders were likely to benefit from the Adviser’s management.
| 3. | COSTS OF SERVICES PROVIDED AND PROFITS TO BE REALIZED BY THE ADVISER |
The Trustees considered the cost of services and the structure of the Adviser’s proposed management fee, including a review of the expense analyses and other pertinent material with respect to the Fund. The Trustees took into consideration that the management fee
CONVERGENCE LONG/SHORT EQUITY ETF
Basis for Trustees’ Approval of Investment Advisory Agreement
(Unaudited) (Continued)
was a “unitary management fee” whereby the Adviser agrees to pay all expenses incurred by the Fund, except the unitary management fee payable to the Adviser and certain other costs of the Fund, specifically interest charges on any borrowings, dividends and other expenses on securities sold short, taxes, brokerage commissions and other expenses incurred in placing orders for the purchase and sale of securities and other investment instruments, acquired fund fees and expenses, accrued deferred tax liability, extraordinary expenses, and any distribution fees and expenses paid by the Fund under any distribution plan adopted pursuant to Rule 12b-1 under the 1940 Act. The Trustees reviewed the related statistical information and other materials provided, including the comparative expenses, expense components and peer group selection. The Trustees also considered the cost structure of the Fund relative to a peer group of U.S. open-end long/short equity exchange-traded funds in the Fund’s proposed Morningstar category as constructed by data presented by Morningstar Direct (the “Morningstar Peer Group”).
The Trustees noted that the Fund’s proposed contractual management fee of 0.95% was higher than the Morningstar Peer Group average of 0.81%. The Trustees further noted that the Fund’s total annual fund operating expenses ratio of 1.84% of the Fund’s average annual assets (which includes dividends and other expenses on securities sold short) was above the Morningstar Peer Group average of 1.06%.
The Trustees also considered the overall profitability that may result from the Adviser’s management of the Fund and reviewed the Adviser’s financial information. The Trustees also examined the level of profits that could be realized by the Adviser from the fees payable under the Agreement.
The Trustees concluded that the Fund’s estimated expenses and the proposed management fees to be paid to the Adviser were fair and reasonable in light of the comparative expense and management fee information and the investment management services to be provided to the Fund by the Adviser. The Trustees further concluded, based on a pro forma profitability analysis prepared by the Adviser, that the Adviser maintained adequate profit levels to support its services to the Fund.
| 4. | EXTENT OF ECONOMIES OF SCALE AS THE FUND GROWS |
The Trustees compared the Fund’s expenses relative to its Morningstar Peer Group and discussed economies of scale. The Trustees noted that the Fund’s proposed management fee structure did not contain any breakpoint reductions as the Fund’s assets grow in size, but that the feasibility of incorporating breakpoints would be reviewed on a regular basis. With respect to the Adviser’s fee structure, the Trustees concluded that the potential economies of scale with respect to the Fund were acceptable.
| 5. | BENEFITS TO BE DERIVED FROM THE RELATIONSHIP WITH THE FUND |
The Trustees considered the direct and indirect benefits that could be realized by the Adviser from its association with the Fund. The Trustees concluded that the benefits the Adviser may receive, such as greater name recognition or the ability to attract additional investor assets, appear to be reasonable, and in many cases may benefit the Fund.
CONVERGENCE LONG/SHORT EQUITY ETF
Basis for Trustees’ Approval of Investment Advisory Agreement
(Unaudited) (Continued)
CONCLUSIONS
The Trustees considered all of the foregoing factors. In considering the approval of the Agreement, the Trustees did not identify any one factor as all-important, but rather considered these factors collectively in light of the Fund’s surrounding circumstances. Based on this review, the Trustees, including a majority of the Independent Trustees, approved the proposed Agreement for an initial two-year term as being in the best interests of the Fund and its shareholders.
CONVERGENCE LONG/SHORT EQUITY ETF
Statement Regarding Liquidity Risk Management Program
(Unaudited)
In accordance with Rule 22e-4 under the Investment Company Act of 1940, as amended, Trust for Professional Managers (the “Trust”) has adopted and implemented a liquidity risk management program (the “Trust Program”). As required under the Trust Program, Convergence Investment Partners, LLC (“Convergence”), the investment adviser to the Convergence Long/Short Equity Fund (the “Predecessor Fund”), the predecessor fund to the Convergence Long/Short Equity ETF (the “Fund”), a series of the Trust, has adopted and implemented a liquidity risk management program tailored specifically to the Fund, and prior to the reorganization, the Predecessor Fund (the “Adviser Program”). The Predecessor Fund converted from a mutual fund to the Fund on February 22, 2022 pursuant to an Agreement and Plan of Reorganization. The Adviser Program seeks to promote effective liquidity risk management for the Fund and to protect Fund shareholders from dilution of their interests. The Board of Trustees (the “Board”) of the Trust has approved Convergence as the administrator for the Adviser Program (the “Program Administrator”). The Program Administrator has further delegated administration of the Adviser Program to its Liquidity Risk Management Committee, as may be constituted from time to time and which will be comprised of at least one Portfolio Manager, the Director of Operations and the Chief Compliance Officer. The Program Administrator is required to provide a written annual report to the Board and the Trust’s chief compliance officer regarding the adequacy and effectiveness of the Adviser Program, including the operation of the Fund’s highly liquid investment minimum, if applicable, and any material changes to the Adviser Program.
On April 13, 2022, the Board reviewed the Program Administrator’s written annual report for the period January 1, 2021 through December 31, 2021 (the “Report”). The Report provided an assessment of the Predecessor Fund’s liquidity risk: the risk that the Predecessor Fund could not meet requests to redeem shares issued by the Predecessor Fund without significant dilution of the remaining investors’ interests in the Predecessor Fund. The Adviser Program assesses liquidity risk under both normal and reasonably foreseeable stressed market conditions. The Program Administrator provides portfolio investment classification services, and the Report noted that the Predecessor Fund primarily held investments that were classified as highly liquid during the review period. The Report noted that the Predecessor Fund’s portfolios was expected to continue to primarily hold highly liquid investments and the determination that the Predecessor Fund be designated as a “primarily highly liquid fund” (as defined in Rule 22e-4) remains appropriate and the Predecessor Fund could therefore continue to rely on the exclusion in Rule 22e-4 from the requirements to determine and review a highly liquid investment minimum for the Fund and to adopt policies and procedures for responding to a highly liquid investment minimum shortfall. The Report noted that there were no breaches of the Predecessor Fund’s restriction on holding illiquid investments exceeding 15% of its net assets during the review period. The Report confirmed that the Predecessor Fund’s investment strategy was appropriate for an open-end management investment company. The Report also indicated that no material changes had been made to the Adviser Program during the review period.
The Program Administrator determined that the Predecessor Fund was reasonably likely to be able to meet redemption requests without adversely affecting non-redeeming Predecessor Fund shareholders through significant dilution. The Program Administrator concluded that the Adviser Program was adequately designed and effectively implemented during the review period.
CONVERGENCE LONG/SHORT EQUITY ETF
Notice of Privacy Policy & Practices
(Unaudited)
We collect non-public personal information about you from the following sources:
| • | information we receive about you on applications or other forms; |
| | |
| • | information you give us orally; and |
| | |
| • | information about your transactions with us or others. |
We do not disclose any non-public personal information about our shareholders or former shareholders without the shareholder’s authorization, except as permitted by law or in response to inquiries from governmental authorities. We may share information with affiliated parties and unaffiliated third parties with whom we have contracts for servicing the Fund. We will provide unaffiliated third parties with only the information necessary to carry out their assigned responsibility. All shareholder records will be disposed of in accordance with applicable law. We maintain physical, electronic and procedural safeguards to protect your non-public personal information and require third parties to treat your non-public personal information with the same high degree of confidentiality.
In the event that you hold shares of the Fund through a financial intermediary, including, but not limited to, a broker-dealer, bank or trust company, the privacy policy of your financial intermediary would govern how your non-public personal information would be shared with unaffiliated third parties.
CONVERGENCE LONG/SHORT EQUITY ETF
Additional Information
(Unaudited)
Tax Information
For the year ended November 30, 2021, the Fund designated 44.68% of its ordinary income distribution as qualified dividend income under the Jobs and Growth Tax Relief Reconciliation Act of 2003.
For the year ended November 30, 2021, 45.09% of dividends paid from net ordinary income for the Fund qualified for the dividends received deduction available to corporate shareholders.
For the fiscal year ended November 30, 2021, the Fund designated 72.45% of its taxable ordinary income distributions as short-term capital gain distributions under Internal Revenue Code Section 871(k)(2)(c).
Indemnifications
Under the Trust’s organizational documents, its officers and Trustees are indemnified against certain liabilities arising out of the performance of their duties to the Fund. In addition, in the normal course of business, the Fund enters into contracts that provide general indemnifications to other parties. The Fund’s maximum exposure under these arrangements is unknown as this would involve future claims that may be made against the Fund that have not yet occurred. However, the Fund has not had prior claims or losses pursuant to these contracts and expect the risk of loss to be remote.
CONVERGENCE LONG/SHORT EQUITY ETF
Additional Information (Continued)
(Unaudited)
Information about Trustees
The business and affairs of the Trust are managed under the direction of the Board of Trustees. Information pertaining to the Trustees of the Trust is set forth below. The Statement of Additional Information includes additional information about the Trustees and is available, without charge, upon request by calling 877-677-9414.
| | | | | | Other |
| | | | | | Directorships |
| | | Term of | Number of | Principal | Held by |
| | | Office and | Portfolios | Occupation(s) | Trustee |
| | Position(s) | Length | in Trust | During the | During the |
| Name, Address | Held with | of Time | Overseen | Past Five | Past Five |
and Year of Birth | the Trust | Served | by Trustee | Years | Years |
| | | | | | |
| Independent Trustees | | | | | |
| | | | | | |
Michael D. Akers, Ph.D. | Trustee | Indefinite | 26 | Professor Emeritus, | Independent |
615 E. Michigan St. | | Term; Since | | Department | Trustee, USA |
Milwaukee, WI 53202 | | August 22, | | of Accounting, | MUTUALS |
Year of Birth: 1955 | | 2001 | | (June 2019– | (an open-end |
| | | | | present), Professor, | investment |
| | | | | Department | company) |
| | | | | of Accounting, | (2001–2021). |
| | | | | (2004–May 2019), | |
| | | | | Chair, Department | |
| | | | | of Accounting | |
| | | | | (2004–2017), | |
| | | | | Marquette University. | |
| | | | | | |
Gary A. Drska | Trustee | Indefinite | 26 | Retired; | Independent |
615 E. Michigan St. | | Term; Since | | Former Pilot, | Trustee, USA |
Milwaukee, WI 53202 | | August 22, | | Frontier/Midwest | MUTUALS |
Year of Birth: 1956 | | 2001 | | Airlines, Inc. | (an open-end |
| | | | | (airline company) | investment |
| | | | | (1986–2021). | company) |
| | | | |
| (2001–2021). |
| | | | | | |
Vincent P. Lyles | Trustee | Indefinite | 26 | System Vice | Independent |
615 E. Michigan St. | | Term; Since | | President of | Director, BMO |
Milwaukee, WI 53202 | | April 6, | | Community | Funds, Inc. (an |
Year of Birth: 1961 | | 2022 | | Relations, Advocate | open-end |
| | | | | Aurora Health | investment |
| | | | | Care (health care | company) |
| | | | | provider) (2019– | (2017–2022). |
| | | | | present); President | |
| | | | | and Chief Executive | |
| | | | | Officer, Boys & Girls | |
| | | | | Club of Greater | |
| | | | | Milwaukee | |
| | | | | (2012–2018). | |
CONVERGENCE LONG/SHORT EQUITY ETF
Additional Information (Continued)
(Unaudited)
| | | | | | Other |
| | | | | | Directorships |
| | | Term of | Number of | Principal | Held by |
| | | Office and | Portfolios | Occupation(s) | Trustee |
| | Position(s) | Length | in Trust | During the | During the |
| Name, Address | Held with | of Time | Overseen | Past Five | Past Five |
and Year of Birth | the Trust | Served | by Trustee | Years | Years |
Erik K. Olstein | Trustee | Indefinite | 26 | Retired; President | Trustee, The |
615 E. Michigan St. | | Term; Since | | and Chief Operating | Olstein Funds |
Milwaukee, WI 53202 | | April 6, | | Officer (2000– | (an open-end |
Year of Birth: 1967 | | 2022 | | 2020), Vice | investment |
| | | | | President of Sales | company) |
| | | | | and Chief Operating | (1995–2018). |
| | | | | Officer (1995–2000), | |
| | | | | Olstein Capital | |
| | | | | Management, L.P. | |
| | | | | (asset management | |
| | | | | firm); Secretary and | |
| | | | | Assistant Treasurer, | |
| | | | | The Olstein Funds | |
| | | | | (1995–2018). | |
| | | | | | |
Lisa Zúñiga Ramírez | Trustee | Indefinite | 26 | Retired; Principal | N/A |
615 E. Michigan St. | | Term; Since | | and Senior Portfolio | |
Milwaukee, WI 53202 | | April 6, | | Manager, Segall, | |
Year of Birth: 1969 | | 2022 | | Bryant & Hamill, LLC | |
| | | | | (asset management | |
| | | | | firm) (2018–2020); | |
| | | | | Partner and Senior | |
| | | | | Portfolio Manager, | |
| | | | | Denver Investments | |
| | | | | LLC (asset | |
| | | | | management firm) | |
| | | | | (2009–2018). | |
| | | | | | |
Gregory M. Wesley | Trustee | Indefinite | 26 | Senior Vice | N/A |
615 E. Michigan St. | | Term; Since | | President of | |
Milwaukee, WI 53202 | | April 6, | | Strategic Alliances | |
Year of Birth: 1969 | | 2022 | | and Business | |
| | | | | Development, Medical | |
| | | | | College of Wisconsin | |
| | | | | (2016–present). | |
CONVERGENCE LONG/SHORT EQUITY ETF
Additional Information (Continued)
(Unaudited)
| | | | | | Other |
| | | | | | Directorships |
| | | Term of | Number of | Principal | Held by |
| | | Office and | Portfolios | Occupation(s) | Trustee |
| | Position(s) | Length | in Trust | During the | During the |
| Name, Address | Held with | of Time | Overseen | Past Five | Past Five |
and Year of Birth | the Trust | Served | by Trustee | Years | Years |
| | | | | | |
| Interested Trustee and Officers | | | | | |
| | | | | | |
Joseph C. Neuberger* | Chairperson | Indefinite | 26 | President | Trustee, Buffalo |
615 E. Michigan St. | and | Term; Since | | (2017–present), | Funds (an |
Milwaukee, WI 53202 | Trustee | August 22, | | Chief Operating | open-end |
Year of Birth: 1962 | | 2001 | | Officer (2016– | investment |
| | | | | 2020), Executive | company) |
| | | | | Vice President | (2003–2017); |
| | | | | (1994–2017), U.S. | Trustee, USA |
| | | | | Bancorp Fund | MUTUALS |
| | | | | Services, LLC. | (an open-end |
| | | | | | investment |
| | | | | | company) |
| | | | | | (2001–2018). |
| | | | | | |
John P. Buckel | President | Indefinite | N/A | Vice President, | N/A |
615 E. Michigan St. | and | Term; Since | | U.S. Bancorp Fund | |
Milwaukee, WI 53202 | Principal | January 24, | | Services, LLC | |
Year of Birth: 1957 | Executive | 2013 | | (2004–present). | |
| | Officer | | | | |
| | �� | | | | |
Jennifer A. Lima | Vice | Indefinite | N/A | Vice President, | N/A |
615 E. Michigan St. | President, | Term; Since | | U.S. Bancorp Fund | |
Milwaukee, WI 53202 | Treasurer | January 24, | | Services, LLC | |
Year of Birth: 1974 | and | 2013 | | (2002–present). | |
| | Principal | | | | |
| | Financial | | | | |
| | and | | | | |
| | Accounting | | | | |
| | Officer | | | | |
| * | Mr. Neuberger is deemed to be an “interested person” of the Trust as defined by the 1940 Act due to his position and material business relationship with the Trust. |
CONVERGENCE LONG/SHORT EQUITY ETF
Additional Information (Continued)
(Unaudited)
| | | | | | Other |
| | | | | | Directorships |
| | | Term of | Number of | Principal | Held by |
| | | Office and | Portfolios | Occupation(s) | Trustee |
| | Position(s) | Length | in Trust | During the | During the |
| Name, Address | Held with | of Time | Overseen | Past Five | Past Five |
and Year of Birth | the Trust | Served | by Trustee | Years | Years |
Deanna B. Marotz | Chief | Indefinite | N/A | Senior Vice President | N/A |
615 E. Michigan St. | Compliance | Term; Since | | US Bancorp Fund | |
Milwaukee, WI 53202 | Officer, | October 21, | | Services, LLC | |
Year of Birth: 1965 | Vice | 2021 | | (2021–present); | |
| | President | | | Chief Compliance | |
| | and Anti- | | | Officer of Keeley-Teton | |
| | Money | | | Advisors, LLC and | |
| | Laundering | | | Teton Advisors, Inc | |
| | Officer | | | (since 2017); Chief | |
| | | | | Compliance Officer | |
| | | | | of Keeley Asset | |
| | | | | Management Corp. | |
| | | | | (2015–2017). | |
| | | | | | |
Jay S. Fitton | Secretary | Indefinite | N/A | Assistant Vice | N/A |
615 E. Michigan St. | | Term; Since | | President, U.S. | |
Milwaukee, WI 53202 | | July 22, 2019 | | Bancorp Fund | |
Year of Birth: 1970 | | | | Services, LLC | |
| | | | | (2019–present); | |
| | | | | Partner, Practus, LLP | |
| | | | | (2018–2019); | |
| | | | | Counsel, Drinker | |
| | | | | Biddle & Reath, LLP | |
| | | | | (2016–2018). | |
| | | | | | |
Kelly A. Strauss | Assistant | Indefinite | N/A | Assistant Vice | N/A |
615 E. Michigan St. | Treasurer | Term; Since | | President, U.S. | |
Milwaukee, WI 53202 | | April 23, | | Bancorp Fund | |
Year of Birth: 1987 | | 2015 | | Services, LLC | |
| | | | | (2011–present). | |
| | | | | | |
Melissa Aguinaga | Assistant | Indefinite | N/A | Assistant Vice | N/A |
615 E. Michigan St. | Treasurer | Term; Since | | President, U.S. | |
Milwaukee, WI 53202 | | July 1, | | Bancorp Fund | |
Year of Birth: 1987 | | 2015 | | Services, LLC | |
| | | | | (2010–present). | |
| | | | | | |
Laura A. Carroll | Assistant | Indefinite | N/A | Assistant Vice | N/A |
615 E. Michigan St. | Treasurer | Term; Since | | President, U.S. | |
Milwaukee, WI 53202 | | August 20, | | Bancorp Fund | |
Year of Birth: 1985 | | 2018 | | Services, LLC | |
| | | | | (2007–present). | |
A NOTE ON FORWARD LOOKING STATEMENTS (Unaudited)
Except for historical information contained in this report for the Fund, the matters discussed in this report may constitute forward-looking statements made pursuant to the safe-harbor provisions of the Private Securities Litigation Reform Act of 1995. These include any adviser or portfolio manager predictions, assessments, analyses or outlooks for individual securities, industries, market sectors and/or markets. These statements involve risks and uncertainties. In addition to the general risks described for the Fund in the current Prospectus, other factors bearing on this report include the accuracy of the Adviser’s or portfolio managers’ forecasts and predictions, and the appropriateness of the investment programs designed by the Adviser or portfolio managers to implement their strategies efficiently and effectively. Any one or more of these factors, as well as other risks affecting the securities markets and investment instruments generally, could cause the actual results of the Fund to differ materially as compared to benchmarks associated with the Fund.
ADDITIONAL INFORMATION (Unaudited)
The Fund has adopted proxy voting policies and procedures that delegate to the Adviser the authority to vote proxies. A description of the Fund’s proxy voting policies and procedures is available without charge, upon request, by calling the Fund toll free at 1-877-677-9414. A description of these policies and procedures is also included in the Fund’s Statement of Additional Information, which is available on the SEC’s website at http://www.sec.gov.
The Fund’s proxy voting record for the most recent 12-month period ended June 30 is available without charge, upon request, by calling, toll free, 1-877-677-9414, or by accessing the SEC’s website at http://www.sec.gov.
The Fund files its complete schedules of portfolio holdings with the SEC for the first and third quarters of each fiscal year on Part F of Form N-PORT. Shareholders may view the Fund’s Form N-PORT reports on the SEC’s website at www.sec.gov.
HOUSEHOLDING (Unaudited)
In an effort to decrease costs, the Fund intends to reduce the number of duplicate prospectuses, supplements and certain other shareholder documents you receive by sending only one copy of each to those addresses shared by two or more accounts and to shareholders the Fund reasonably believes are from the same family or household. Once implemented, if you would like to discontinue householding for your accounts, please call the Fund toll-free at 1-877-677-9414 to request individual copies of these documents. Once the Fund receives notice to stop householding, the Fund will begin sending individual copies 30 days after receiving your request. This policy does not apply to account statements.
(This Page Intentionally Left Blank.)
CONVERGENCE LONG/SHORT EQUITY ETF
| Investment Adviser | Convergence Investment Partners, LLC |
| | 3801 PGA Boulevard |
| | Suite 1001 |
| | Palm Beach Gardens, Florida 33410 |
| | |
| Legal Counsel | Godfrey & Kahn, S.C. |
| | 833 East Michigan Street |
| | Suite 1800 |
| | Milwaukee, Wisconsin 53202 |
| | |
| Independent Registered Public | Cohen & Company, Ltd. |
| Accounting Firm | 342 North Water Street |
| | Suite 830 |
| | Milwaukee, Wisconsin 53202 |
| | |
| Transfer Agent, Fund Accountant and | U.S. Bancorp Fund Services, LLC |
| Fund Administrator | 615 East Michigan Street |
| | Milwaukee, Wisconsin 53202 |
| | |
| Custodian | U.S. Bank National Association |
| | Custody Operations |
| | 1555 North River Center Drive |
| | Milwaukee, Wisconsin 53212 |
| | |
| Distributor | Quasar Distributors, LLC |
| | 111 East Kilbourn Avenue |
| | Suite 2200 |
| | Milwaukee, Wisconsin 53202 |
| | |
This report is intended for shareholders of the Fund and may not be used as sales literature unless preceded or accompanied by a current prospectus.
MN-SEMI
Item 2. Code of Ethics.
Not applicable for semi-annual reports.
Item 3. Audit Committee Financial Expert.
Not applicable for semi-annual reports.
Item 4. Principal Accountant Fees and Services.
Not applicable for semi-annual reports.
Item 5. Audit Committee of Listed Registrants.
Not applicable to registrants who are not listed issuers (as defined in Rule 10A-3 under the Securities Exchange Act of 1934).
Item 6. Investments.
| (a) | Schedule of Investments is included as part of the report to shareholders filed under Item 1 of this Form. |
Item 7. Disclosure of Proxy Voting Policies and Procedures for Closed-End Management Investment Companies.
Not applicable to open-end investment companies.
Item 8. Portfolio Managers of Closed-End Management Investment Companies.
Not applicable to open-end investment companies.
Item 9. Purchases of Equity Securities by Closed‑End Management Investment Company and Affiliated Purchasers.
Not applicable to open-end investment companies.
Item 10. Submission of Matters to a Vote of Security Holders.
There have been no material changes to the procedures by which shareholders may recommend nominees to the registrant’s board of trustees.
Item 11. Controls and Procedures.
| (a) | The Registrant’s President and Treasurer have reviewed the Registrant's disclosure controls and procedures (as defined in Rule 30a-3(c) under the Investment Company Act of 1940 (the “Act”)) as of a date within 90 days of the filing of this report, as required by Rule 30a-3(b) under the Act and Rules 13a-15(b) or 15d‑15(b) under the Securities Exchange Act of 1934. Based on their review, such officers have concluded that the disclosure controls and procedures are effective in ensuring that information required to be disclosed in this report is appropriately recorded, processed, summarized and reported and made known to them by others within the Registrant and by the Registrant’s service provider. |
| (b) | There were no changes in the Registrant's internal control over financial reporting (as defined in Rule 30a-3(d) under the Act) that occurred during the period covered by this report that have materially affected, or are reasonably likely to materially affect, the Registrant's internal control over financial reporting. |
Item 12. Disclosure of Securities Lending Activities for Closed-End Management Investment Companies
Not applicable to open-end investment companies.
Item 13. Exhibits.
| (a) | (1) Any code of ethics or amendment thereto, that is the subject of the disclosure required by Item 2, to the extent that the registrant intends to satisfy Item 2 requirements through filing an exhibit. Not Applicable. |
(3) Any written solicitation to purchase securities under Rule 23c‑1 under the Act sent or given during the period covered by the report by or on behalf of the registrant to 10 or more persons. Not applicable to open-end investment companies.
(4) Change in the registrant’s independent public accountant. There was no change in the registrant’s independent public accountant for the period covered by this report.
SIGNATURES
Pursuant to the requirements of the Securities Exchange Act of 1934 and the Investment Company Act of 1940, the registrant has duly caused this report to be signed on its behalf by the undersigned, thereunto duly authorized.
(Registrant) Trust for Professional Managers
By (Signature and Title)* /s/John Buckel
John Buckel, President
Date December 7, 2022
Pursuant to the requirements of the Securities Exchange Act of 1934 and the Investment Company Act of 1940, this report has been signed below by the following persons on behalf of the registrant and in the capacities and on the dates indicated.
By (Signature and Title)* /s/John Buckel
John Buckel, President
Date: December 7, 2022
By (Signature and Title)* /s/Jennifer Lima
Jennifer Lima, Treasurer
Date December 7, 2022
* Print the name and title of each signing officer under his or her signature.