UNITED STATES
SECURITIES AND EXCHANGE COMMISSION
Washington, D.C. 20549
FORM N-CSR
CERTIFIED SHAREHOLDER REPORT OF REGISTERED
MANAGEMENT INVESTMENT COMPANIES
Investment Company Act file number 811-10401
Trust for Professional Managers
(Exact name of registrant as specified in charter)
615 East Michigan Street
Milwaukee, WI 53202
(Address of principal executive offices) (Zip code)
Jay S. Fitton
U.S. Bancorp Fund Services, LLC
615 East Michigan Street
Milwaukee, WI 53202
(Name and address of agent for service)
(513) 629-8104
Registrant’s telephone number, including area code
Date of fiscal year end: May 31, 2023
Date of reporting period: November 30, 2022
Item 1. Reports to Stockholders.
(a)

| | | | |
| | | | |
| | SEMI-ANNUAL
REPORT | | Jensen Quality
Value Fund Jensen Global
Quality Growth Fund |
| | 11/30/2022 | |
| | | | | | | |
| | | | | | | |
| | | | | Class I Shares | Class J Shares | Class Y Shares |
| | | | | | | |

Letter from the Investment Adviser
Dear Fellow Shareholders,
The Jensen Quality Value Fund (the “Fund”)—Class Y Shares—posted a return of 4.31% for the six-month period ended November 30, 2022, compared to a return of 0.33% for the Russell Midcap Total Return Index and a return of 0.40% for the Russell 2500 Total Return Index. Please see pages 12 through 14 of this report for complete standardized performance information for the Fund.
Market Perspective
After a difficult start to calendar year 2022, when investors reacted negatively to the substantial headwinds impacting global economies, the domestic stock markets struggled to find direction for the six months ended November 30, 2022 While the challenges facing companies and their investors remained constant, be they persistently high inflationary pressures, steadily rising interest rates, a less accommodative policy from the U.S. Federal Reserve, ongoing geopolitical risk, or the run-up to the mid-term elections in the United States, the impact on the stock markets was, overall, negative.
Over the same six-month period, the Energy sector saw a substantial slowdown in returns after a remarkably strong start to the year. All of these factors contributed to a meaningful decline in corporate earnings over the course of the calendar year. As investors, we seek companies that produce a level of earnings growth stability that we believe that can help to dampen volatility in stock returns in challenging periods. We view the Fund’s outperformance over the last six months as a reflection of reasonably solid business performance from the companies in which we invest, in spite of the challenges facing global economies.
The Effect at Jensen
For the six months ended November 30, 2022, the Fund’s performance relative to the Russell Midcap Total Return Index was supported by overweight positions in the Industrials and Consumer Discretionary sectors, underweights in the Real Estate, Communication Services, Energy, and Utilities sectors, and specific companies in the Information Technology, Industrials, Financials, and Consumer Staples sectors.
Performance was negatively impacted by the Fund’s relative overweight to the Consumer Staples sector, underweight in the Financials sector, and specific companies in the Consumer Discretionary and Materials sectors.
Relative to the Russell 2500 Total Return Index, the Fund’s performance during the period was aided by overweight positions in the Consumer Staples and Industrials sectors, underweights in the Real Estate, Communication Services, and Energy sectors, and specific companies in the Information Technology, Industrials, and Financials sectors. Performance was hindered by the Fund’s relative underweight to the Financials and Health Care sectors, its overweight to the Information Technology sector, and specific companies in the Materials, Consumer Discretionary, and Consumer Staples sectors.
| | | |
| Semi-Annual Report | Jensen Quality Value Fund | 1 |
During the period, the Fund continued its high allocation to quality companies, as defined by the S&P Earnings and Dividend Quality Rankings. The Fund’s allocation to the highest-quality companies, those rated A+, A, and A-, averaged 49% of portfolio assets compared to 21% of the Russell Midcap Total Return Index and 12% of the Russell 2500 Total Return Index. This significant overweight to quality added to the Fund’s relative returns during the period, which we believe were driven by the market volatility caused by the Russian invasion of Ukraine, the ongoing coronavirus pandemic and related lockdowns, rising inflation, and interest rate increases in most countries. While low-quality businesses can outperform in some periods, we believe that over the full market cycle, investors in higher-quality businesses have the potential to be rewarded with better returns and lower volatility.
The top contributor to Fund performance for the six-month period was Genuine Parts Co (GPC), a distributor of automotive and industrial parts. During the period, Genuine Parts Co reported solid revenue and earnings growth that exceeded the expectations of many investors. Genuine Parts Co was selected for the Jensen Quality Value Fund because of its compelling valuation at the time of purchase and its positive fundamental attributes, including a strong market position, well-known brands, best-in- class operating efficiency, and royalty income from franchised stores.
Other notable companies that contributed positively to portfolio performance were Copart (CPRT), an operator of salvage automobile auctions; FactSet (FDS), a financial software company; the Toro Company (TTC), a manufacturer and marketer of lawn care and gardening tools; and General Mills (GIS), a packaged foods company.
The largest negative contributor to Fund performance during the period was Hasbro (HAS), a toy, game, and entertainment company. During the period, Hasbro reported relatively weak results due to slowing consumer spending. Hasbro was originally selected for the Jensen Quality Value Fund due to its attractive valuation at the time of purchase and its compelling fundamental attributes, which include its large scale, strong internal brands, and barriers to entry, which are driven by long-term licensing arrangements with brand owners.
Other notable holdings that weighed on relative performance included Crown Holdings Inc (CCK), a producer of aluminum cans, other packaging, and packaging equipment; Levi Strauss & Co (LEVI), a casual apparel company; Church & Dwight Co Inc (CHD), a consumer packaged goods company; and Pool Corp (POOL), a provider of swimming pool maintenance supplies and equipment.
| | | |
| 2 | Jensen Quality Value Fund | Semi-Annual Report |
Fund Additions and Eliminations
During the six months ended November 30, 2022, the investment team continued to purchase the shares of companies we considered undervalued and sell the shares of companies we believed to be overvalued. The team added Charles River Laboratories (CRL) to the portfolio. Charles River Laboratories is a provider of non-clinical contract research services for the pharmaceutical industry, including drug discovery, safety testing, and manufacturing solutions. We believe the company benefits from high barriers to entry due to the complexity of scientific research, as well as high customer switching costs as it provides essential research services that are tailored to specific customer needs.
During the period, the investment team sold Scotts Miracle-Gro Co (SMG), a manufacturer and marketer of gardening products, and MillerKnoll (MLKN), a home and office furnishings company, in order to upgrade the fundamental quality of the businesses in the portfolio. As of November 30, 2022, the Jensen Quality Value Fund held 38 companies.
The Jensen Outlook
As we reflect on the market pullback in 2022 and look forward to 2023, we maintain a more cautious outlook for market returns in the coming year. We recognize that several factors make any forecast challenging. They include, but are not limited to, higher inflation, the specter of higher interest rates than seen for some time, the likelihood that rates will stay high for the foreseeable future, and ongoing cost pressures from the labor markets and supply chains.
In addition to these factors, we note that the business performance of companies and recent market return patterns could influence the outlook for the coming year. We acknowledge that the comparisons to 2022 are easier, but an earnings rebound may prove to be overly optimistic given the Fed’s goal of maintaining its tightening posture in an effort to reduce inflation meaningfully.
At the same time, there are increasing concerns about a recession in the coming year and the bond market is signaling that it expects one in 2023. In particular, the U.S. treasury yield curve—the yield difference between 10-year and 2-year U.S. treasury bonds—has been inverted since early July 2022. Yield curve inversions occur when the yields on short-term bonds are higher than those on long-term bonds. Such occurrences are relatively rare and have accurately predicted the 10 most recent economic recessions. Indeed, recent debate seems to be more about the depth and length of recession rather than whether one will occur.
Consequently, the path forward may continue to be uneven and thus potentially unnerving for investors, despite lofty expectations and the hope for a quick rebound in the stock markets.
However, we believe uncertainty can provide opportunities for higher-quality, more resilient businesses to garner favor from investors looking for lower volatility in the face of the issues discussed here. We continue to have confidence in the high-quality businesses owned in the Fund because of our deep research into characteristics of strength, including strong and resilient business models, durable competitive advantages, pricing power, steady operating margins, and strong free cash flow generation that is consistently reinvested into future growth opportunities.
| | | |
| Semi-Annual Report | Jensen Quality Value Fund | 3 |
While the economic uncertainty and the pullback in equity market prices in 2022 has tested the resolve of some investors, the Jensen investment team remains convinced that the strategy and process guiding our management of the Fund is sound. Our goal remains the ownership of a portfolio of companies positioned to grow and accrue business value. We seek to participate in this value creation as investors via the long-term ownership of fairly priced, high-quality stocks. We believe the attributes noted above allow quality companies to generate business returns consistently above their cost of capital, ultimately resulting in shareholder value creation.
Finally, we remain steadfast in our belief that paying attention to company fundamentals can help investors manage risk. This should offer a measure of capital protection in more volatile or generally lower market return environments and provide the opportunity for long-term capital appreciation.
We are tremendously grateful for the ongoing support of our firm and investment strategies from our partners and fellow shareholders. Thank you.
We invite you to seek additional information about the Jensen Quality Value Fund at www.jenseninvestment.com, where additional content, including updated holdings and performance information, is available. We take our investment responsibilities seriously and appreciate the trust you have placed in us. As always, we welcome your feedback.
Sincerely,
The Jensen Quality Value Investment Team
| | | |
| 4 | Jensen Quality Value Fund | Semi-Annual Report |
This discussion and analysis of the Fund is as of November 30, 2022, and is subject to change; any forecasts made cannot be guaranteed and should not be considered investment advice.
Past performance is no guarantee of future results. Fund holdings and sector weightings are subject to change and are not recommendations to buy or sell any security. For more complete information regarding performance and holdings, please refer to the financial statements and schedule of investments headings of this report.
Mutual fund investing involves risk, and principal loss is possible. The Fund invests in mid- and smaller-capitalization companies, which involve additional risks such as limited liquidity and greater volatility. Value stocks have a lower expected growth rate in earnings and sales than growth stocks.
The Russell Midcap Total Return Index is an unmanaged index, which measures the performance of the 800 smallest companies in the Russell 1000 Index.
The Russell 2500 Total Return Index is a market cap weighted index that includes the smallest 2,500 companies covered in the Russell 3000 universe of United States-based listed equities. The index is unmanaged, and you cannot invest directly in an index.
S&P Quality Rankings: S&P ranks index constituents from A+ through C based on trailing earnings and dividend consistency. We consider stocks rated A- and above as high quality and those rated B+ and below as low quality.
Free Cash Flow: Is equal to the after-tax net income of a company plus depreciation and amortization less capital expenditures.
Earnings Growth: The annual rate of growth of earnings typically measured as Earnings Per Share Growth.
Must be preceded or accompanied by a prospectus for the Jensen Quality Value Fund. The Jensen Quality Value Fund is distributed by Quasar Distributors, LLC.
| | | |
| Semi-Annual Report | Jensen Quality Value Fund | 5 |
Letter from The Investment Adviser
Dear Fellow Shareholders,
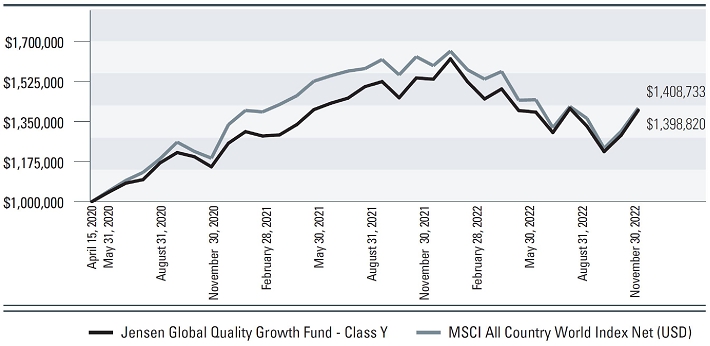
The Jensen Global Quality Growth Fund—Class Y Shares—returned 0.56% for the six-month period ended November 30, 2022, compared to -2.51% for the MSCI All Country World Index over this period. Please see pages 16 through 18 of this report for complete standardized performance information for the Fund.
Market Perspective
After a difficult start to calendar year 2022 when investors reacted negatively to the substantial headwinds impacting global economies, global stock markets struggled to find direction for the six-month period ended November 30, 2022. While the challenges facing companies and their investors remained constant, be they persistently high inflationary pressures, steadily rising interest rates, less accommodative policies from central banks in developed economies, or ongoing geopolitical risk, the impact on the stock markets was, overall, negative.
Over the same six-month period, the Energy sector saw a substantial slowdown in returns after a remarkably strong start to the year. That slowdown, along with the other factors noted above, contributed to a decline in corporate earnings over the course of the calendar year. As investors, we seek companies that produce a level of earnings growth stability that we believe can help to dampen the volatility of stock returns during challenging periods. We view the Fund’s outperformance over the last six months as a reflection of reasonably solid business performance from the companies in which we invest, despite the challenges facing global economies.
The Jensen Global Quality Growth Fund also benefitted from its focus on higher-quality stocks during the period, as investment performance from higher-quality stocks (A+, A, and A-, as measured by the S&P Earnings and Dividend Quality Rankings) was stronger than that of lower-quality stocks (B+ and lower, as measured by the S&P Earnings and Dividend Quality Rankings).
The Effect at Jensen
Amidst this market volatility, the Fund’s focus on high-quality stocks mitigated a portion of the headwind to investment performance during the period. One indication of resilience from consistent, quality businesses can be found by reviewing market returns as measured by the S&P Earnings and Dividend Quality Rankings. Companies with more consistent earnings and dividend payments are ranked higher by S&P than those companies that are typically more volatile. Given the nature of the rankings, companies rated A- and above are considered higher quality businesses. Attribution analysis indicates that over the last six months, the Fund’s selection of stocks in the A- and above categories boosted the Fund’s returns relative to the benchmark.
From a sector perspective, stock selection contributed positively to the Fund’s relative performance in the Consumer Discretionary and Information Technology sectors, while detracting from returns in the Health Care sector. A relative overweight allocation to the Health Care and a relative underweight allocation to the Communication Services sectors contributed positively to the Fund’s relative performance, as did a lack of exposure to the Real Estate sector, while underweight
| | | |
| 6 | Jensen Global Quality Growth Fund | Semi-Annual Report |
allocations detracted from relative returns in the Energy and Financials sectors. Typically, very few companies in the Real Estate, Energy, and Financials sectors qualify for investment in the Fund due to our strict requirement for high and prolonged profitability, as measured by return on equity (ROE), and consequently, our lack of exposure to sectors that do not deliver consistently high business returns will periodically add or detract from the Fund’s relative performance.
Leading contributors to performance during the period were Starbucks (SBUX) and Automatic Data Processing (ADP). Starbucks is a global restaurant company and roaster, marketer, and retailer of specialty coffee. During the period, the company’s stock price reacted favorably to resilient financial results, a better-than-expected long-term financial outlook, and the resolution of senior leadership uncertainty. Our Starbucks ownership thesis remains predicated on its strong, globally recognized brand, favorable scale economics, and history of product innovation.
Automatic Data Processing is a leading human capital management software and cloud company focused on enterprise payroll processing and employee outsourcing. During the past quarter, the company reported robust revenue and earnings growth due to a strong domestic employment environment, rising interest rates, and operating leverage benefits. Automatic Data Processing is a core Fund holding due to the strength of its brand, high customer retention, and consistent business results.
Significant detractors from the Fund’s performance for the period included Taiwan Semiconductor (TSMC) and Alphabet Inc (GOOGL). TSMC is the global market leading chip manufacturer. TSMC has experienced improving business performance and demand for its chips over the last few quarters in part due to the economic shifts that took place during the pandemic. The company expects revenue growth to outpace industry growth due to strong demand for its products in its automotive, 5G, and the Internet of Things (IoT) end markets. More recently, and mindful of Russia’s invasion of Ukraine, investors reacted negatively to ongoing geopolitical concerns regarding the relationship between China and Taiwan. We also believe that the combination of current market conditions and solid performance of TSMC’s stock earlier in the year resulted in profit taking, putting additional pressure on the company’s shares.
Alphabet Inc is a leading technology services and hardware company with well-known products including Google Search, Android, and YouTube. Weakness in the company’s shares has been influenced by a broad pullback among technology-centric businesses following positive multi-year stock performance for the group. We are also monitoring the potential for decelerating financial results due to advertising spending uncertainty and difficult year-over-year comparisons. Fundamentally, we consider the company to be sound, with a robust network effect for its core search and YouTube offerings, strong innovation, and an ascendant enterprise cloud business.
We are constantly evaluating all the businesses owned by the Fund as well as other investment candidates to determine whether better opportunities exist in our investable universe. Such determinations ultimately reflect a combination of fundamental considerations, valuation opportunities and overall risk profiles of our companies.
| | | |
| Semi-Annual Report | Jensen Global Quality Growth Fund | 7 |
Fund Additions and Eliminations
During the period, the Jensen Investment Team enacted the purchase of three additional holdings and sold three holdings. We initiated new positions in Dassault Systèmes (DSY), UnitedHealth Group (UNH), and Aon (AON) due to solid business fundamentals and attractive valuations for those companies. We sold our positions in 3M (MMM), Tencent (700), and GlaxoSmithKline (GSK) as part of ongoing efforts to upgrade the overall quality of the Fund. A brief synopsis of the changes follows.
France-based Dassault Systèmes develops software and cloud services for 3D product design and life management, simulation, manufacturing, and other 3D-related products. The company enjoys strong and formidable competitive advantages including innovation, switching costs, economies of scale, and barriers to entry. The company was an early mover in the 3D design market and established market-leading positions in the automotive and aerospace industries. Subsequently, the company has expanded design leadership in many other industries, such as industrial, marine, consumer goods, fashion, medical devices, pharmaceuticals, and biotech.
We believe design and innovation are an important driver of the company’s future success. As such, the design process is often delinked from business cycles because design cycles are long in duration, particularly in the automotive and aerospace industries. This also holds true for shorter-duration design cycle industries, such as medical devices, consumer goods, and fashion. As a result, Dassault Systèmes monetizes these relationships with an annual fee model via the cloud or maintenance revenue, which creates a consistent topline that has grown approximately 10% annually for the last five- and ten-year periods. The company is also highly profitable, with operating margins that have improved by over 200 basis points over the last five years, which has delivered annualized earnings per share growth of almost 14% over the same period.
We have been impressed with Dassault Systèmes’ business fundamentals for some time; however, the company’s stock price was too expensive for consideration. Recently, the company’s stock sold off as part of what we consider an indiscriminate technology stock downdraft in the market. With fundamentals intact, we took the opportunity to add the company to the Fund at a compelling valuation.
UnitedHealth Group is a leading managed care provider in the United States and was added to the Fund in September 2022. The company operates four distinct but interconnected businesses including traditional health insurance, healthcare delivery, healthcare consulting, and pharmacy benefit management. Competitive advantages for the company are derived from the size, scale, and integration of these services. UnitedHealth Group also benefits from a diverse revenue stream consisting of governmental agencies, commercial organizations, and individuals. We expect the company will grow by expanding its care provider network, membership growth, and pricing power. We added UnitedHealth Group shares to the Fund due to attractive valuation and an improved growth outlook.
Aon, a leading professional services firm in areas of risk, health, and wealth, was added to the Jensen Global Quality Growth Strategy in October 2022. Headquartered in Ireland, Aon is one of only two insurance brokers operating on a global scale with 50,000 employees advising clients across over 120 countries. The company is one of the largest global reinsurance brokers, and offers clients consulting and advisory services across health, human capital, and wealth solutions verticals. Competitive advantages for the company include high switching costs gained through
| | | |
| 8 | Jensen Global Quality Growth Fund | Semi-Annual Report |
in-depth knowledge of unique and complex client risks, global scale required to serve multinational clients, and high barriers to entry due to long-standing client relationships and robust data and analytics capabilities. We believe that the company is uniquely positioned to benefit from rising inflation and interest rates via increasing insured values and fiduciary interest income, respectively. We expect Aon to continue to grow organically as it is well-positioned to help clients navigate complex and growing global risks such as cybersecurity, climate change, and workforce solutions.
3M is a diversified industrial conglomerate that manufactures products based on core material science, process technologies, and manufacturing expertise. The company’s products have applications in safety/industrial, transportation, healthcare, and consumer products. The sale of 3M reflects our concern over deteriorating business fundamentals. We are also concerned about the negative cash flow implications stemming from mounting product liability and environmental claims. Further, we have questions about the viability of 3M’s historical competitive advantages – scale, innovation, and brand strength – due to an ongoing trend of growth below our expectations.
Tencent is a Chinese multinational conglomerate with leading products in gaming, financial services, and communications. We continue to believe Tencent’s financial prospects are sound due to the company’s embedded position in the Chinese economy, and we believe it remains a highly advantaged business levered to the attractive growth areas of global gaming, social media, fintech, and cloud services. In recent months the stock has been under increasing pressure as the Chinese government and its regulatory bodies cracked down on dominant Chinese technology companies, including Tencent, to curb potential antitrust concerns, limit youth gaming activity, and address growing inequality within Chinese society. Given the fundamental uncertainty created by the capricious actions of the Chinese authorities we decided to exit the position.
GlaxoSmithKline, a London-based biopharmaceutical company, was sold from the Fund in September 2022 due to perceived better opportunities. GlaxoSmithKline benefits from a stable growth outlook led by its leading HIV franchise and the Shingrix shingles vaccine. However, we expect growth will remain muted due to a less robust drug pipeline and potential competitive threats to key products. It was the lowest Fund holding at the time of sale.
There were no other wholesale changes to the Fund, but the Investment Team remained active in adding to or trimming from existing positions to reflect Jensen’s convictions in the businesses and relative valuation opportunities within the context of the ongoing economic volatility.
The Jensen Outlook
As we reflect on the market pullback in 2022 and look forward to 2023, we maintain a more cautious outlook for market returns in the coming year. We recognize that several factors make any forecast challenging. They include but are not limited to higher inflation, the specter of higher interest rates than have been seen for some time, the likelihood that rates will stay high for the foreseeable future, and ongoing cost pressures from the labor markets and supply chains.
In addition to these factors, we are cognizant that the business performance of companies and recent market return patterns could influence the outlook for the coming year. Of note, is that global corporate earnings are currently expected to increase in 2023 after a lackluster performance in 2022
| | | |
| Semi-Annual Report | Jensen Global Quality Growth Fund | 9 |
and amidst signs of slowing in many economies. We acknowledge that the comparisons to 2022 are easier, but a significant rebound in earnings, and the resulting investor expectations, may prove to be overly optimistic given the difficult economic environments facing companies globally.
At the same time, there are increasing concerns about a recession in the coming year. Of note, we believe the U.S. fixed income market is signaling a looming economic recession. The U.S. treasury yield curve—the yield difference between 10-year and 2-year U.S. treasury bonds—has been inverted since early July. Yield curve inversions occur when the yields on short-term bonds are higher than those on long-term bonds. Such occurrences are relatively rare and have accurately predicted the 10 most recent economic recessions. Indeed, recent debate seems to be more focused on the depth and length of a recession rather than whether one will occur, and similar circumstances appear to be in play elsewhere around the world.
Consequently, the path forward may continue to be uneven and thus potentially unnerving for investors, despite lofty expectations and the hope for a quick rebound in the stock markets. However, we believe uncertainty can provide opportunities for higher-quality, more resilient businesses to garner favor from investors looking for lower volatility in the face of the issues discussed here. We continue to have confidence in the high-quality businesses owned in the Fund because of our deep research that favors such characteristics as strong and resilient business models, durable competitive advantages, pricing power, steady operating margins, and strong free cash flow generation that is consistently reinvested into future growth opportunities.
While the economic uncertainty and the pullback in equity market prices in 2022 has tested the resolve of some investors, the Jensen Investment Team remains convinced that the strategy and process guiding our management of the Fund is sound. Our goal remains to be the ownership of a portfolio of companies positioned to grow and accrue business value. We seek to participate in this value creation as investors via the long-term ownership of fairly-priced, high-quality stocks. We believe the attributes noted above allow quality companies to generate business returns consistently above their cost of capital, ultimately resulting in shareholder value creation.
Finally, we remain steadfast in our belief that paying attention to company fundamentals can help investors manage risk. This should offer a measure of capital protection in more volatile or generally lower market return environments and provide the opportunity for long-term capital appreciation.
We are tremendously grateful for the ongoing support of our firm and investment strategies from our shareholders, partners, and clients. Thank you.
We invite you to seek additional information about the Jensen Global Quality Growth Fund at www.jenseninvestment.com where additional content, including updated holdings and performance information, is available. We take our investment responsibilities seriously and appreciate the trust you have placed in us. As always, we welcome your feedback.
Sincerely,
The Jensen Global Quality Growth Investment Team
| | | |
| 10 | Jensen Global Quality Growth Fund | Semi-Annual Report |
This discussion and analysis of the Fund is as of November 30, 2022 and is subject to change, and any forecasts made cannot be guaranteed.
Past performance is no guarantee of future results. Fund holdings and sector weightings are subject to change and are not recommendations to buy or sell any security.
MSCI All Country World Index (ACWI) is a stock index designed to track broad global equity-market performance. Maintained by Morgan Stanley Capital International (MSCI), the index comprises the stocks of nearly 3,000 companies from 23 developed countries and 25 emerging markets.
For more complete information regarding performance and holdings, please refer to the financial statements and schedule of investments headings of this report. Current and future portfolio holdings are subject to risk.
The Fund is non-diversified, meaning that it may concentrate its assets in fewer individual holdings than a diversified fund and is therefore more exposed to individual stock volatility than a diversified fund.
S&P Quality Rankings: S&P ranks index constituents from A+ through C based on trailing earnings and dividend consistency. We consider stocks rated A- and above as high quality and those rated B+ and below as low quality.
Return on Equity: Is equal to a company’s after-tax earnings (excluding non-recurring items) divided by its average stockholder equity for the year.
Free Cash Flow: Is equal to the after-tax net income of a company plus depreciation and amortization less capital expenditures.
For use only when preceded or accompanied by a current prospectus for the Fund. The Jensen Global Quality Growth Fund is distributed by Quasar Distributors, LLC.
| | | |
| Semi-Annual Report | Jensen Quality Value Fund | 11 |
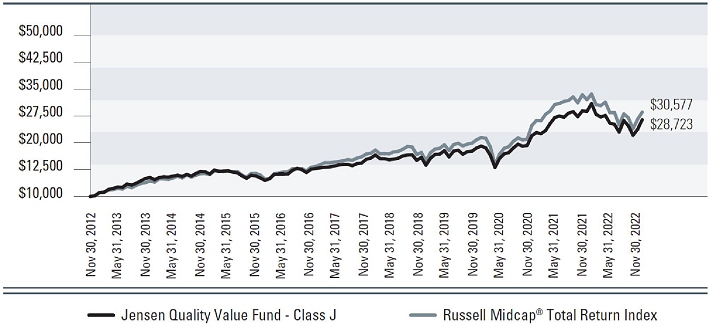
Jensen Quality Value Fund - Class J (Unaudited)
Total Returns vs. Russell Midcap® Total Return Index
Average Annual Total Returns –
For periods ended November 30, 2022 (Unaudited) | 1 year | 3 years | 5 years | 10 years | Since Inception
(3/31/2010) |
| Jensen Quality Value Fund - Class J | -6.68% | 9.58% | 8.57% | 11.13% | 9.62% |
| Russell Midcap® Total Return Index | -9.02% | 8.68% | 8.50% | 11.83% | 11.54% |
The Russell Midcap® Total Return Index is an unmanaged index, which measures the performance of the 800 smallest companies in the Russell 1000® Index.
The chart at the top of the page assumes an initial gross investment of $10,000 made on November 30, 2012. Returns shown include the reinvestment of all Fund distributions. Returns shown do not reflect the deduction of taxes that a shareholder would pay on Fund distributions or the redemption of Fund shares.
Investment performance reflects fee waivers in effect. In the absence of such waivers, total returns would be reduced.
Performance data shown represents past performance. Past performance does not guarantee future results. The investment return and principal value of an investment will fluctuate so that an investor’s shares, when redeemed, may be worth more or less than their original cost. Current performance of the Fund may be lower or higher than the performance shown. Performance data current to the most recent month-end may be obtained by calling 800-992-4144 or by visiting www.jenseninvestment.com.
| | | |
| 12 | Jensen Quality Value Fund | Semi-Annual Report |
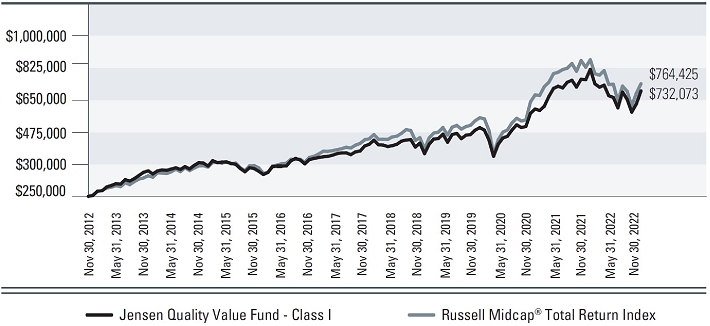
Jensen Quality Value Fund - Class I (Unaudited)
Total Returns vs. Russell Midcap® Total Return Index
Average Annual Total Returns –
For periods ended November 30, 2022 (Unaudited) | 1 year | 3 years | 5 years | 10 years | Since Inception
(3/31/2010) |
| Jensen Quality Value Fund - Class I | -6.52% | 9.82% | 8.81% | 11.34% | 9.83% |
| Russell Midcap® Total Return Index | -9.02% | 8.68% | 8.50% | 11.83% | 11.54% |
The Russell Midcap® Total Return Index is an unmanaged index, which measures the performance of the 800 smallest companies in the Russell 1000® Index.
The chart at the top of the page assumes an initial gross investment of $250,000 made on November 30, 2012. Returns shown include the reinvestment of all Fund distributions. Returns shown do not reflect the deduction of taxes that a shareholder would pay on Fund distributions or the redemption of Fund shares.
Investment performance reflects fee waivers in effect. In the absence of such waivers, total returns would be reduced.
Performance data shown represents past performance. Past performance does not guarantee future results. The investment return and principal value of an investment will fluctuate so that an investor’s shares, when redeemed, may be worth more or less than their original cost. Current performance of the Fund may be lower or higher than the performance shown. Performance data current to the most recent month-end may be obtained by calling 800-992-4144 or by visiting www.jenseninvestment.com.
| | | |
| Semi-Annual Report | Jensen Quality Value Fund | 13 |
Jensen Quality Value Fund - Class Y (Unaudited)
Total Returns vs. Russell Midcap® Total Return Index

Average Annual Total Returns –
For periods ended November 30, 2022 (Unaudited) | 1 year | Since Inception
(01/15/2020) |
| Jensen Quality Value Fund - Class Y | -6.46% | 9.16% |
| Russell Midcap® Total Return Index | -9.02% | 7.62% |
The Russell Midcap® Total Return Index is an unmanaged index, which measures the performance of the 800 smallest companies in the Russell 1000® Index.
The chart at the top of the page assumes an initial gross investment of $1,000,000 made on January 15, 2020, the inception date for Class Y shares. Returns shown include the reinvestment of all Fund distributions. Returns shown do not reflect the deduction of taxes that a shareholder would pay on Fund distributions or the redemption of Fund shares.
Investment performance reflects fee waivers in effect. In the absence of such waivers, total returns would be reduced.
Performance data shown represents past performance. Past performance does not guarantee future results. The investment return and principal value of an investment will fluctuate so that an investor’s shares, when redeemed, may be worth more or less than their original cost. Current performance of the Fund may be lower or higher than the performance shown. Performance data current to the most recent month-end may be obtained by calling 800-992-4144 or by visiting www.jenseninvestment.com.
| | | |
| 14 | Jensen Quality Value Fund | Semi-Annual Report |
Jensen Quality Value Fund
Investments by Sector as of November 30, 2022
(As a Percentage of Total Investments) (Unaudited)
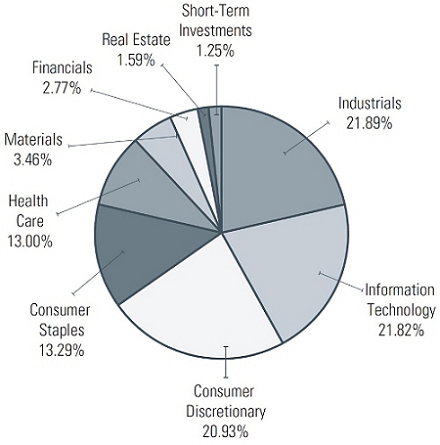
The Global Industry Classification Standard (GICS®) was developed by and/or is the exclusive property of MSCI, Inc. and Standard & Poor’s Financial Services LLC (“S&P”). GICS is a service mark of MSCI and S&P and has been licensed for use by U.S. Bancorp Fund Services, LLC, doing business as U.S. Bank Global Fund Services.
| | | |
| Semi-Annual Report | Jensen Quality Value Fund | 15 |
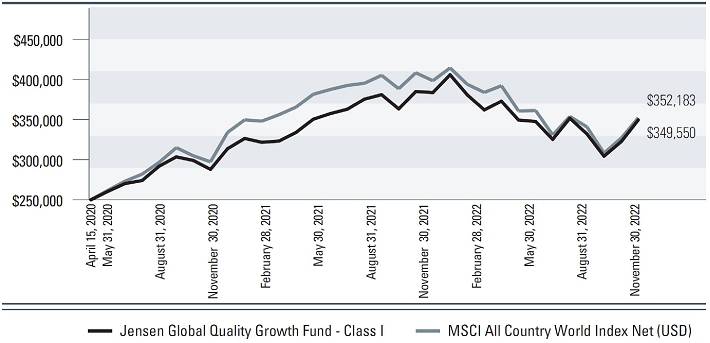
Jensen Global Quality Growth Fund - Class J (Unaudited)
Total Returns vs. MSCI All Country World Index Net (USD)

Average Annual Total Returns –
For periods ended November 30, 2022 (Unaudited) | 1 year | Since Inception
(4/15/2020) |
| Jensen Global Quality Growth Fund - Class J | -9.07% | 13.35% |
| MSCI All Country World Index Net (USD) | -11.62% | 13.93% |
The MSCI All Country World Index Net (USD) (“MSCI ACWI”) is a free float-adjusted market capitalization weighted index that measures the equity performance of global developed and emerging markets. The MSCI ACWI total return indices reinvest dividends after the deduction of withholding taxes, using (for international indices) a tax rate applicable to non-resident institutional investors who do not benefit from double taxation treaties.
The chart at the top of the page assumes an initial gross investment of $10,000 made on April 15, 2020, the inception date for Class J shares. Returns shown include the reinvestment of all Fund distributions. Returns shown do not reflect the deduction of taxes that a shareholder would pay on Fund distributions or the redemption of Fund shares.
Investment performance reflects fee waivers in effect. In the absence of such waivers, total returns would be reduced.
Performance data shown represents past performance. Past performance does not guarantee future results. The investment return and principal value of an investment will fluctuate so that an investor’s shares, when redeemed, may be worth more or less than their original cost. Current performance of the Fund may be lower or higher than the performance shown. Performance data current to the most recent month-end may be obtained by calling 800-992-4144 or by visiting www.jenseninvestment.com.
| | | |
| 16 | Jensen Global Quality Growth Fund | Semi-Annual Report |
Jensen Global Quality Growth Fund - Class I (Unaudited)
Total Returns vs. MSCI All Country World Index Net (USD)
Average Annual Total Returns –
For periods ended November 30, 2022 (Unaudited) | 1 year | Since Inception
(4/15/2020) |
| Jensen Global Quality Growth Fund - Class I | -8.91% | 13.61% |
| MSCI All Country World Index Net (USD) | -11.62% | 13.93% |
The MSCI All Country World Index Net (USD) (“MSCI ACWI”) is a free float-adjusted market capitalization weighted index that measures the equity performance of global developed and emerging markets. The MSCI ACWI total return indices reinvest dividends after the deduction of withholding taxes, using (for international indices) a tax rate applicable to non-resident institutional investors who do not benefit from double taxation treaties.
The chart at the top of the page assumes an initial gross investment of $250,000 made on April 15, 2020, the inception date for Class I shares. Returns shown include the reinvestment of all Fund distributions. Returns shown do not reflect the deduction of taxes that a shareholder would pay on Fund distributions or the redemption of Fund shares.
Investment performance reflects fee waivers in effect. In the absence of such waivers, total returns would be reduced.
Performance data shown represents past performance. Past performance does not guarantee future results. The investment return and principal value of an investment will fluctuate so that an investor’s shares, when redeemed, may be worth more or less than their original cost. Current performance of the Fund may be lower or higher than the performance shown. Performance data current to the most recent month-end may be obtained by calling 800-992-4144 or by visiting www.jenseninvestment.com.
| | | |
| Semi-Annual Report | Jensen Global Quality Growth Fund | 17 |
Jensen Global Quality Growth Fund - Class Y (Unaudited)
Total Returns vs. MSCI All Country World Index Net (USD)
Average Annual Total Returns –
For periods ended November 30, 2022 (Unaudited) | 1 year | Since Inception
(4/15/2020) |
| Jensen Global Quality Growth Fund - Class Y | -8.89% | 13.63% |
| MSCI All Country World Index Net (USD) | -11.62% | 13.93% |
The MSCI All Country World Index Net (USD) (“MSCI ACWI”) is a free float-adjusted market capitalization weighted index that measures the equity performance of global developed and emerging markets. The MSCI ACWI total return indices reinvest dividends after the deduction of withholding taxes, using (for international indices) a tax rate applicable to non-resident institutional investors who do not benefit from double taxation treaties.
The chart at the top of the page assumes an initial gross investment of $1,000,000 made on April 15, 2020, the inception date for Class Y shares. Returns shown include the reinvestment of all Fund distributions. Returns shown do not reflect the deduction of taxes that a shareholder would pay on Fund distributions or the redemption of Fund shares.
Investment performance reflects fee waivers in effect. In the absence of such waivers, total returns would be reduced.
Performance data shown represents past performance. Past performance does not guarantee future results. The investment return and principal value of an investment will fluctuate so that an investor’s shares, when redeemed, may be worth more or less than their original cost. Current performance of the Fund may be lower or higher than the performance shown. Performance data current to the most recent month-end may be obtained by calling 800-992-4144 or by visiting www.jenseninvestment.com.
| | | |
| 18 | Jensen Global Quality Growth Fund | Semi-Annual Report |
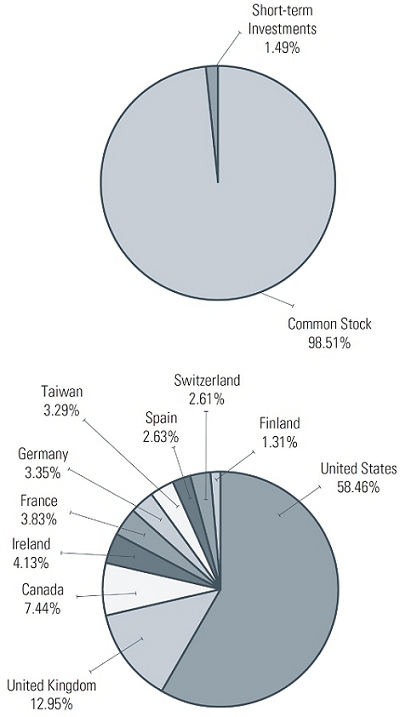
Jensen Global Quality Growth Fund
Allocation of Portfolio Holdings as of November 30, 2022
(As a Percentage of Total Investments) (Unaudited)
| | | |
| Semi-Annual Report | Jensen Global Quality Growth Fund | 19 |
Statements of Assets & Liabilities
November 30, 2022 (Unaudited)
| Assets: | Jensen
Quality
Value Fund | Jensen
Global Quality
Growth Fund |
| Investments, at value (cost $178,477,375 and $39,931,861) | $191,038,393 | $43,696,815 |
| Income receivable | 259,592 | 56,273 |
| Receivable for capital stock issued | 210,172 | 503,491 |
| Other Assets | 17,713 | 12,308 |
| Total Assets | 191,525,870 | 44,268,887 |
| | | |
| Liabilities: | | |
| Payable for capital stock redeemed | 396,692 | 414,754 |
| Payable for 12b-1 fees - Class J | 8,413 | 1,631 |
| Payable to adviser | 85,495 | 12,344 |
| Payable to affiliates | 30,206 | 18,008 |
| Accrued expenses and other liabilities | 18,342 | 10,937 |
| Total Liabilities | 539,148 | 457,674 |
| NET ASSETS | $190,986,722 | $43,811,213 |
| | | |
| NET ASSETS CONSIST OF: | | |
| Capital stock | $176,419,706 | $40,732,388 |
| Total distributable earnings | 14,567,016 | 3,078,825 |
| Total Net Assets | $190,986,722 | $43,811,213 |
| | | |
| NET ASSETS CONSIST OF: | | |
| Class J Shares: | | |
| Net Assets | $31,624,543 | $2,426,097 |
| Shares of beneficial interest outstanding | 1,918,013 | 176,215 |
Net Asset Value, Offering Price and Redemption Price Per Share
(unlimited number of shares authorized, $.001 par value) | $16.49 | $13.77 |
| Class I Shares: | | |
| Net Assets | $102,946,883 | $5,117,531 |
| Shares of beneficial interest outstanding | 6,256,359 | 371,377 |
Net Asset Value, Offering Price and Redemption Price Per Share
(unlimited number of shares authorized, $.001 par value) | $16.45 | $13.78 |
| Class Y Shares: | | |
| Net Assets | $56,415,296 | $36,267,585 |
| Shares of beneficial interest outstanding | 3,436,028 | 2,631,748 |
Net Asset Value, Offering Price and Redemption Price Per Share
(unlimited number of shares authorized, $.001 par value) | $16.42 | $13.78 |
The accompanying notes are an integral part of these financial statements.
| | | |
| 20 | Jensen Quality Value Fund | Semi-Annual Report |
Jensen Quality Value Fund
Schedule of Investments
November 30, 2022 (Unaudited)
Common Stocks - 98.78%
| shares | Air Freight & Logistics - 3.29% | | | value |
| 54,200 | Expeditors International of Washington, Inc. | | $6,290,452 |
| | | | | |
| shares | Auto Components - 2.96% | | | value |
| 195,910 | Gentex Corp. | | $5,661,799 |
| | | | | |
| shares | Building Products - 2.30% | | | value |
| 16,850 | Lennox International, Inc. | | $4,388,246 |
| | | | | |
| shares | Capital Markets - 2.77% | | | value |
| 11,480 | FactSet Research Systems, Inc. | | $5,295,609 |
| | | | | |
| shares | Commercial Services & Supplies - 4.08% | | | value |
| 117,110 | Copart, Inc. (a) | | $7,794,842 |
| | | | | |
| shares | Communications Equipment - 2.53% | | | value |
| 31,300 | F5, Inc. (a) | | $4,839,293 |
| | | | | |
| shares | Containers & Packaging - 3.46% | | | value |
| 80,300 | Crown Holdings, Inc. | | $6,601,463 |
| | | | | |
| shares | Distributors - 5.26% | | | value |
| 38,960 | Genuine Parts Co. | | $7,142,537 |
| 8,790 | Pool Corp. | | $2,895,514 |
| | | | $10,038,051 |
| | | | | |
| shares | Electronic Equipment, Instruments & Components - 2.27% | | | value |
| 53,930 | Amphenol Corp. - Class A | | $4,337,590 |
| | | | | |
| shares | Food & Staples Retailing - 3.35% | | | value |
| 130,080 | Kroger Co. | | $6,398,635 |
The accompanying notes are an integral part of these financial statements.
| | | |
| Semi-Annual Report | Jensen Quality Value Fund | 21 |
Jensen Quality Value Fund
Schedule of Investments continued
November 30, 2022 (Unaudited)
| shares | Food Products - 6.63% | | | value |
| 67,350 | Campbell Soup Co. | | $3,614,675 |
| 50,590 | General Mills, Inc. | | $4,315,327 |
| 64,760 | Kellogg Co. | | $4,724,241 |
| | | | $12,654,243 |
| | | | | |
| shares | Health Care Equipment & Supplies - 2.11% | | | value |
| 17,470 | ResMed, Inc. | | $4,021,594 |
| | | | | |
| shares | Health Care Providers & Services - 8.14% | | | value |
| 129,750 | Encompass Health Corp. | | $7,587,780 |
| 33,040 | Laboratory Corp. of America Holdings | | $7,952,727 |
| | | | $15,540,507 |
| | | | | |
| shares | Household Products - 3.31% | | | value |
| 77,290 | Church & Dwight Co., Inc. | | $6,327,732 |
| | | | | |
| shares | IT Services - 7.64% | | | value |
| 34,239 | Broadridge Financial Solutions, Inc. | | $5,105,377 |
| 106,380 | Genpact Ltd. | | $4,905,182 |
| 65,160 | Maximus, Inc. | | $4,580,748 |
| | | | $14,591,307 |
| | | | | |
| shares | Leisure Products - 2.63% | | | value |
| 79,870 | Hasbro, Inc. | | $5,017,433 |
| | | | | |
| shares | Life Sciences Tools & Services - 2.76% | | | value |
| 23,080 | Charles River Laboratories International, Inc. (a) | | $5,275,396 |
| | | | | |
| shares | Machinery - 3.44% | | | value |
| 44,880 | Donaldson Co., Inc. | | $2,734,090 |
| 34,570 | Toro Co. | | $3,836,924 |
| | | | $6,571,014 |
The accompanying notes are an integral part of these financial statements.
| | | |
| 22 | Jensen Quality Value Fund | Semi-Annual Report |
Jensen Quality Value Fund
Schedule of Investments continued
November 30, 2022 (Unaudited)
| shares | Professional Services - 5.08% | | | value |
| 38,350 | Equifax, Inc. | | $7,569,140 |
| 11,610 | Verisk Analytics, Inc. | | $2,132,873 |
| | | | $9,702,013 |
| | | | | |
| shares | Real Estate Management & Development - 1.59% | | | value |
| 38,180 | CBRE Group, Inc. - Class A (a) | | $3,039,128 |
| | | | | |
| shares | Road & Rail - 1.52% | | | value |
| 16,760 | Landstar System, Inc. | | $2,899,145 |
| | | | | |
| shares | Semiconductors & Semiconductor Equipment - 3.80% | | | value |
| 91,600 | Microchip Technology, Inc. | | $7,253,804 |
| | | | | |
| shares | Software - 5.58% | | | value |
| 29,670 | Cadence Design Systems, Inc. (a) | | $5,104,427 |
| 44,130 | Manhattan Associates, Inc. (a) | | $5,557,732 |
| | | | $10,662,159 |
| | | | | |
| shares | Specialty Retail - 5.59% | | | value |
| 88,690 | Best Buy Co., Inc. | | $7,565,257 |
| 5,770 | Tractor Supply Co. | | $1,305,809 |
| 15,360 | Williams-Sonoma, Inc. | | $1,795,584 |
| | | | $10,666,650 |
| | | | | |
| shares | Textiles, Apparel & Luxury Goods - 4.50% | | | value |
| 35,140 | Carter’s, Inc. | | $2,566,626 |
| 365,150 | Levi Strauss & Co. - Class A | | $6,035,929 |
| | | | $8,602,555 |
| | | | | |
| shares | Trading Companies & Distributors - 2.19% | | | value |
| 11,840 | United Rentals, Inc. (a) | | $4,179,875 |
| | | | | |
| Total Common Stocks | | | value |
| (Cost $176,089,517) | | $188,650,535 |
The accompanying notes are an integral part of these financial statements.
| | | |
| Semi-Annual Report | Jensen Quality Value Fund | 23 |
Jensen Quality Value Fund
Schedule of Investments continued
November 30, 2022 (Unaudited)
Money Market Funds - 1.25%
| shares | | | | value |
| 2,387,858 | First American Treasury Obligations Fund - X Class, 3.746% (b) | | $2,387,858 |
| | | | | |
| Total Money Market Funds | | | value |
| (Cost $2,387,858) | | $2,387,858 |
| | | | | |
| Total Investments - 100.03% | | | value |
| (Cost $178,477,375) | | $191,038,393 |
| Liabilities in Excess of Other Assets - (0.03)% | | $(51,671) |
| TOTAL NET ASSETS - 100.00% | | $190,986,722 |
Percentages are stated as a percent of net assets.
(a) Non-income producing security.
(b) The rate shown represents the seven-day yield as of November 30, 2022.
The Global Industry Classification Standard (GICS®) was developed by and/or is the exclusive property of MSCI, Inc. (“MSCI”) and Standard & Poor’s Financial Services LLC (“S&P”). GICS is a service mark of MSCI and S&P and has been licensed for use by U.S. Bancorp Fund Services, LLC.
The accompanying notes are an integral part of these financial statements.
| | | |
| 24 | Jensen Quality Value Fund | Semi-Annual Report |
Jensen Global Quality Growth Fund
Schedule of Investments
November 30, 2022 (Unaudited)
Common Stocks - 98.26%
| shares | Canada - 7.42% | | | value |
| 31,950 | Alimentation Couche-Tard, Inc. | | $1,455,522 |
| 14,000 | Canadian National Railway Co. | | $1,797,316 |
| | | | $3,252,838 |
| | | | | |
| shares | Finland - 1.30% | | | value |
| 11,410 | Kone Oyj - Class B | | $570,622 |
| | | | | |
| shares | France - 3.82% | | | value |
| 23,528 | Dassault Systemes SE | | $877,299 |
| 490 | Hermes International | | $796,390 |
| | | | $1,673,689 |
| | | | | |
| shares | Germany - 3.35% | | | value |
| 13,190 | SAP SE | | $1,463,525 |
| | | | | |
| shares | Ireland - 4.12% | | | value |
| 6,000 | Accenture PLC - Class A | | $1,805,580 |
| | | | | |
| shares | Spain - 2.62% | | | value |
| 21,240 | Amadeus IT Group SA (a) | | $1,148,399 |
| | | | | |
| shares | Switzerland - 2.60% | | | value |
| 9,570 | Nestle SA | | $1,139,056 |
| | | | | |
| shares | Taiwan, Province Of China - 3.29% | | | value |
| 17,350 | Taiwan Semiconductor Manufacturing Co. Ltd.-ADR | | $1,439,703 |
| | | | | |
| shares | United Kingdom - 12.91% | | | value |
| 17,030 | AstraZeneca PLC | | $2,304,861 |
| 71,130 | Compass Group PLC | | $1,621,624 |
| 37,500 | Diageo PLC | | $1,731,832 |
| | | | $5,658,317 |
The accompanying notes are an integral part of these financial statements.
| | | |
| Semi-Annual Report | Jensen Global Quality Growth Fund | 25 |
Jensen Global Quality Growth Fund
Schedule of Investments continued
November 30, 2022 (Unaudited)
| shares | United States - 56.83% | | | value |
| 15,310 | Alphabet, Inc. (a) | | $1,546,157 |
| 2,920 | Aon PLC | | $900,178 |
| 10,130 | Apple, Inc. - Class A | | $1,499,544 |
| 6,830 | Automatic Data Processing, Inc. | | $1,804,075 |
| 5,070 | Becton Dickinson and Co. | | $1,264,154 |
| 4,080 | Broadridge Financial Solutions, Inc. | | $608,369 |
| 5,310 | Equifax, Inc. | | $1,048,035 |
| 3,060 | Home Depot, Inc. | | $991,409 |
| 2,440 | Intuit, Inc. | | $994,520 |
| 7,210 | Johnson & Johnson | | $1,283,380 |
| 2,510 | Mastercard, Inc. - Class A | | $894,564 |
| 6,490 | Microsoft Corp. | | $1,655,858 |
| 10,160 | NIKE, Inc. - Class B | | $1,114,450 |
| 11,410 | PepsiCo, Inc. | | $2,116,669 |
| 31,620 | Pfizer, Inc. | | $1,585,111 |
| 14,010 | Starbucks Corp. | | $1,431,822 |
| 5,900 | Stryker Corp. | | $1,379,951 |
| 5,340 | Texas Instruments, Inc. | | $963,656 |
| 1,960 | UnitedHealth Group, Inc. | | $1,073,610 |
| 4,030 | Verisk Analytics, Inc. | | $740,351 |
| | | | $24,895,863 |
| | | | | |
| Total Common Stocks | | | value |
| (Cost $39,282,638) | | $43,047,592 |
The accompanying notes are an integral part of these financial statements.
| | | |
| 26 | Jensen Global Quality Growth Fund | Semi-Annual Report |
Jensen Global Quality Growth Fund
Schedule of Investments continued
November 30, 2022 (Unaudited)
Money Market Funds - 1.48%
| shares | | | | value |
| 649,223 | First American Treasury Obligations Fund - X Class, 3.746% (b) | | $649,223 |
| | | | | |
| Total Money Market Funds | | | value |
| (Cost $649,223) | | $649,223 |
| | | | | |
| Total Investments | | | value |
| (Cost $39,931,861) - 99.74% | | $43,696,815 |
| Other Assets in Excess of Liabilities - 0.26% | | $114,398 |
| TOTAL NET ASSETS - 100.00% | | $43,811,213 |
Percentages are stated as a percent of net assets.
(a) Non-income producing security.
(b) The rate shown represents the seven-day yield as of November 30, 2022.
Abbreviations:
| ADR | American Depositary Receipt |
| PLC | Public Limited Company |
| SA | An abbreviation used by many countries to signify a stock company whereby shareholders have limited liability. |
| SE | Societas Europaea is a term for a European Public Liability Company. |
The accompanying notes are an integral part of these financial statements.
| | | |
| Semi-Annual Report | Jensen Global Quality Growth Fund | 27 |
Statements of Operations
For the Six Months Ended November 30, 2020 (Unaudited)
| Investment Income: | | Jensen
Quality
Value Fund | | | Jensen
Global Quality
Growth Fund |
| Dividend income | | | $1,447,970 | | | | | $268,019 | (1) |
| Interest income | | | 26,190 | | | | | 6,582 | |
| Total Investment Income | | | 1,474,160 | | | | | 274,601 | |
| | | | | | | | | | |
| Expenses: | | | | | | | | | |
| Investment management fees | | | 609,076 | | | | | 145,015 | |
| Federal and state registration fees | | | 43,878 | | | | | 34,883 | |
| 12b-1 fees - Class J | | | 41,072 | | | | | 2,770 | |
| Administration fees | | | 24,335 | | | | | 10,657 | |
| Reports to shareholders | | | 24,170 | | | | | 2,830 | |
| Transfer agent fees | | | 23,908 | | | | | 22,764 | |
| Fund accounting fees | | | 21,686 | | | | | 12,679 | |
| Legal fees | | | 14,098 | | | | | 8,686 | |
| Trustees’ fees | | | 11,456 | | | | | 11,456 | |
| Shareholder servicing fees - Class I | | | 10,000 | | | | | 281 | |
| Audit and tax fees | | | 9,274 | | | | | 9,444 | |
| Transfer agent expenses | | | 9,177 | | | | | 536 | |
| Chief Compliance Officer fees | | | 6,222 | | | | | 6,222 | |
| Custody fees | | | 3,755 | | | | | 6,334 | |
| Insurance expense | | | 1,241 | | | | | 1,202 | |
| Other | | | 4,405 | | | | | 4,961 | |
| Total expenses | | | 857,753 | | | | | 280,720 | |
| Less waivers and reimbursements by Adviser (Note 4) | | | (57,049 | ) | | | | (84,315 | ) |
| Net expenses | | | 800,704 | | | | | 196,405 | |
| | | | | | | | | | |
| Net Investment Income | | | 673,456 | | | | | 78,196 | |
| | | | | | | | | | |
| Realized and Unrealized Gain (Loss) on Investments: | | | | | | | | | |
| Net realized loss on: | | | | | | | | | |
| Investments | | | (538,180 | ) | | | | (582,420 | ) |
| Foreign currency translations | | | – | | | | | (6,080 | ) |
| Change in unrealized appreciation (depreciation) on: | | | | | | | | | |
| Investments | | | 7,188,717 | | | | | 1,219,999 | |
| Foreign currency translations | | | – | | | | | (287 | ) |
| Net realized and unrealized gain on investments | | | 6,650,537 | | | | | 631,212 | |
| | | | | | | | | | |
| Net Increase in Net Assets Resulting from Operations | | | $7,323,993 | | | | | $709,408 | |
| (1) | Net of $6,759 in dividend withholding tax. |
The accompanying notes are an integral part of these financial statements.
| | | |
| 28 | Jensen Quality Value Fund | Semi-Annual Report |
Statements of Changes in Net Assets
| | | Jensen Quality Value Fund |
| Operations: | |
Six Months
Ended
November 30,
2022 (Unaudited) | | | Year Ended
May 31, 2022 |
| Net investment income | | $673,456 | | | $895,893 |
| Net realized gain (loss) on investment transactions | | (538,180) | | | 5,205,397 |
| Change in unrealized appreciation (depreciation) on investments | | 7,188,717 | | | (23,605,682) |
| Net increase (decrease) in net assets resulting from operations | | 7,323,993 | | | (17,504,392) |
| | | | | | |
| Capital Share Transactions: | | | | | |
| Shares Sold - Class J | | 2,017,094 | | | 19,783,062 |
| Shares Sold - Class I | | 10,285,503 | | | 94,301,843 |
| Shares Sold - Class Y | | 776,866 | | | 13,950,545 |
| Shares issued to holders in reinvestment of dividends - Class J | | 56,588 | | | 1,134,694 |
| Shares issued to holders in reinvestment of dividends - Class I | | 226,114 | | | 2,254,291 |
| Shares issued to holders in reinvestment of dividends - Class Y | | 125,463 | | | 1,542,803 |
| Shares redeemed - Class J | | (10,569,499) | | | (14,530,353) |
| Shares redeemed - Class I | | (16,164,187) | | | (23,677,279) |
| Shares redeemed - Class Y | | (3,687,869) | | | (3,230,055) |
| Net increase (decrease) in net assets from capital share transactions | | (16,933,927) | | | 91,529,551 |
| | | | | | |
| Dividends and Distributions to Shareholders: | | | | | |
| Net dividends and distributions to shareholders - Class J | | (56,587) | | | (1,134,768) |
| Net dividends and distributions to shareholders - Class I | | (226,201) | | | (2,254,466) |
| Net dividends and distributions to shareholders - Class Y | | (125,463) | | | (1,542,803) |
| Total dividends and distributions | | (408,251) | | | (4,932,037) |
| Increase (Decrease) In Net Assets | | (10,018,185) | | | 69,093,122 |
| | | | | | |
| Net Assets: | | | | | |
| Beginning of period | | $201,004,907 | | | $131,911,785 |
| End of period | | $190,986,722 | | | $201,004,907 |
The accompanying notes are an integral part of these financial statements.
| | | |
| Semi-Annual Report | Jensen Quality Value Fund | 29 |
Statements of Changes in Net Assets
| | | Jensen Global Quality Growth Fund |
| Operations: | | Six Months
Ended
November 30,
2022 (Unaudited) | | | Year Ended
May 31, 2022 |
| Net investment income | | $78,196 | | | $197,529 |
| Net realized loss on: | | | | | |
| Investments | | (582,420) | | | (60,402) |
| Foreign currency translations | | (6,080) | | | (11,251) |
| Change in unrealized appreciation (depreciation) on: | | | | | |
| Investments | | 1,219,999 | | | (1,656,668) |
| Foreign currency translations | | (287) | | | (818) |
| Net increase (decrease) in net assets resulting from operations | | 709,408 | | | (1,531,610) |
| | | | | | |
| Capital Share Transactions: | | | | | |
| Shares Sold - Class J | | 325,542 | | | 1,091,009 |
| Shares Sold - Class I | | 2,635,694 | | | 583,676 |
| Shares Sold - Class Y | | 3,128,940 | | | 11,485,530 |
| Shares issued to holders in reinvestment of dividends - Class J | | 4,124 | | | 6,851 |
| Shares issued to holders in reinvestment of dividends - Class I | | 6,906 | | | 10,018 |
| Shares issued to holders in reinvestment of dividends - Class Y | | 109,988 | | | 153,229 |
| Shares redeemed - Class J | | (67,606) | | | (537,957) |
| Shares redeemed - Class I | | (257,544) | | | – |
| Shares redeemed - Class Y | | (518,855) | | | (332,366) |
| Net increase in net assets from capital share transactions | | 5,367,189 | | | 12,459,990 |
| | | | | | |
| Dividends and Distributions to Shareholders: | | | | | |
| Net dividends and distributions to shareholders - Class J | | (4,124) | | | (6,851) |
| Net dividends and distributions to shareholders - Class I | | (6,906) | | | (10,019) |
| Net dividends and distributions to shareholders - Class Y | | (109,988) | | | (153,229) |
| Total dividends and distributions | | (121,018) | | | (170,099) |
| Increase in Net Assets | | 5,955,579 | | | 10,758,281 |
| | | | | | |
| NET ASSETS: | | | | | |
| Beginning of period | | $37,855,634 | | | $27,097,353 |
| End of period | | $43,811,213 | | | $37,855,634 |
The accompanying notes are an integral part of these financial statements.
| | | |
| 30 | Jensen Global Quality Growth Fund | Semi-Annual Report |
Financial Highlights
Jensen Quality Value Fund - Class J
| Per Share Data: | | | six months
ended
November
30, 2022
(unaudited) | | | year
ended
May 31,
2022 | | | year
ended
May 31,
2021 | | | year
ended
May 31,
2020 | | | year
ended
May 31,
2019 | | | year
ended
May 31,
2018 | |
| Net asset value, beginning of period | | | $15.85 | | | $17.47 | | | $12.17 | | | $12.24 | | | $12.59 | | | $12.14 | |
| Income (loss) from investment operations: | | | | | | | | | | | | | | | | | | | |
| Net investment income(1) | | | 0.04 | | | 0.05 | | | 0.06 | | | 0.08 | | | 0.10 | | | 0.11 | |
| Net realized and unrealized gain (loss) on investments | | | 0.62 | | | (1.21) | | | 5.43 | | | 0.41 | | | 0.22 | | | 0.86 | |
| Total from investment operations | | | 0.66 | | | (1.16) | | | 5.49 | | | 0.49 | | | 0.32 | | | 0.97 | |
| Less distributions: | | | | | | | | | | | | | | | | | | | |
| Dividends from net investment income | | | (0.02) | | | (0.04) | | | (0.06) | | | (0.08) | | | (0.10) | | | (0.08) | |
| Distributions from net realized gain on investments | | | – | | | (0.42) | | | (0.13) | | | (0.48) | | | (0.57) | | | (0.44) | |
| Total distributions | | | (0.02) | | | (0.46) | | | (0.19) | | | (0.56) | | | (0.67) | | | (0.52) | |
| Net asset value, end of period | | | $16.49 | | | $15.85 | | | $17.47 | | | $12.17 | | | $12.24 | | | $12.59 | |
| Total return(2) | | | 4.21% | | | -6.98% | | | 45.37% | | | 3.72% | | | 2.89% | | | 7.98% | |
| Supplemental data and ratios: | | | | | | | | | | | | | | | | | | | |
| Net assets, end of period (000’s) | | | $31,625 | | | $38,942 | | | $37,105 | | | $6,569 | | | $2,444 | | | $2,482 | |
Ratio of expenses to average net assets
Before waivers and reimbursements of expenses(3) | | | 1.11% | | | 1.11% | | | 1.25% | | | 1.57% | | | 1.50% | | | 1.51% | |
| After waivers and reimbursements of expenses(3) | | | 1.05% | | | 1.05% | | | 1.05% | | | 1.05% | | | 1.05% | | | 1.11%(4) | |
Ratio of net investment income to average net assets
Before waivers and reimbursements of expenses(3) | | | 0.46% | | | 0.25% | | | 0.18% | | | 0.16% | | | 0.39% | | | 0.50% | |
| After waivers and reimbursements of expenses(3) | | | 0.52% | | | 0.31% | | | 0.38% | | | 0.68% | | | 0.84% | | | 0.90%(4) | |
| Portfolio turnover rate(2) | | | 6.11% | | | 17.78% | | | 18.15% | | | 36.19% | | | 42.51% | | | 44.29% | |
| (1) | Per share amounts are calculated using the average shares outstanding method. |
| (2) | Not annualized for periods less than one year. |
| (3) | Annualized for periods less than one year. |
| (4) | Effective September 30, 2017, the expense cap for Class J shares was decreased from 1.00% to 0.80% excluding Rule 12b-1 fees of 0.25% |
The accompanying notes are an integral part of these financial statements.
| | | |
| Semi-Annual Report | Jensen Quality Value Fund | 31 |
Financial Highlights
Jensen Quality Value Fund - Class I
| Per Share Data: | | | six months
ended
November
30, 2022
(unaudited) | | | year
ended
May 31,
2022 | | | year
ended
May 31,
2021 | | | year
ended
May 31,
2020 | | | year
ended
May 31,
2019 | | | year
ended
May 31,
2018 | |
| Net asset value, beginning of period | | | $15.81 | | | $17.43 | | | $12.13 | | | $12.18 | | | $12.52 | | | $12.08 | |
| Income (loss) from investment operations: | �� | | | | | | | | | | | | | | | | | | |
| Net investment income(1) | | | 0.05 | | | 0.09 | | | 0.09 | | | 0.12 | | | 0.13 | | | 0.14 | |
| Net realized and unrealized gain (loss) on investments | | | 0.62 | | | (1.21) | | | 5.42 | | | 0.39 | | | 0.23 | | | 0.85 | |
| Total from investment operations | | | 0.67 | | | (1.12) | | | 5.51 | | | 0.51 | | | 0.36 | | | 0.99 | |
| Less distributions: | | | | | | | | | | | | | | | | | | | |
| Dividends from net investment income | | | (0.03) | | | (0.08) | | | (0.08) | | | (0.08) | | | (0.13) | | | (0.11) | |
| Distributions from net realized gain on investments | | | – | | | (0.42) | | | (0.13) | | | (0.48) | | | (0.57) | | | (0.44) | |
| Total distributions | | | (0.03) | | | (0.50) | | | (0.21) | | | (0.56) | | | (0.70) | | | (0.55) | |
| Net asset value, end of period | | | $16.45 | | | $15.81 | | | $17.43 | | | $12.13 | | | $12.18 | | | $12.52 | |
| Total return(2) | | | 4.30% | | | -6.79% | | | 45.80% | | | 3.88% | | | 3.25% | | | 8.15% | |
| Supplemental data and ratios: | | | | | | | | | | | | | | | | | | | |
| Net assets, end of period (000’s) | | | $102,947 | | | $104,867 | | | $44,113 | | | $2,491 | | | $33,470 | | | $32,555 | |
Ratio of expenses to average net assets
Before waivers and reimbursements of expenses(3) | | | 0.88% | | | 0.88% | | | 1.00% | | | 1.23% | | | 1.27% | | | 1.28% | |
| After waivers and reimbursements of expenses(3) | | | 0.82% | | | 0.82% | | | 0.82% | | | 0.82% | | | 0.82% | | | 0.91%(4) | |
Ratio of net investment income to average net assets
Before waivers and reimbursements of expenses(3) | | | 0.69% | | | 0.50% | | | 0.42% | | | 0.51% | | | 0.62% | | | 0.73% | |
| After waivers and reimbursements of expenses(3) | | | 0.75% | | | 0.56% | | | 0.60% | | | 0.92% | | | 1.07% | | | 1.10%(4) | |
| Portfolio turnover rate(2) | | | 6.11% | | | 17.78% | | | 18.15% | | | 36.19% | | | 42.51% | | | 44.29% | |
| (1) | Per share amounts are calculated using the average shares outstanding method. |
| (2) | Not annualized for periods less than one year. |
| (3) | Annualized for periods less than one year. |
| (4) | Effective September 30, 2017, the expense cap for Class I shares was decreased from 1.00% to 0.80% excluding shareholder servicing fees of up to 0.10%. |
The accompanying notes are an integral part of these financial statements.
| | | |
| 32 | Jensen Quality Value Fund | Semi-Annual Report |
Financial Highlights
Jensen Quality Value Fund - Class Y
| Per Share Data: | | | six months
ended
November
30, 2022
(unaudited) | | | year ended
May 31, 2022 | | | year ended
May 31, 2021 | | | period ended
May 31, 2020(1) | |
| Net asset value, beginning of period | | | $15.78 | | | $17.39 | | | $12.11 | | | $13.38 | |
| Income from investment operations: | | | | | | | | | | | | | |
| Net investment income(2) | | | 0.06 | | | 0.09 | | | 0.10 | | | 0.04 | |
| Net realized and unrealized gain (loss) on investments | | | 0.61 | | | (1.20) | | | 5.40 | | | (1.28) | |
| Total from investment operations | | | 0.67 | | | (1.11) | | | 5.50 | | | (1.24) | |
| Less distributions: | | | | | | | | | | | | | |
| Dividends from net investment income | | | (0.03) | | | (0.08) | | | (0.09) | | | (0.03) | |
| Distributions from net realized gain on investments | | | – | | | (0.42) | | | (0.13) | | | – | |
| Total distributions | | | (0.03) | | | (0.50) | | | (0.22) | | | (0.03) | |
| Net asset value, end of period | | | $16.42 | | | $15.78 | | | $17.39 | | | $12.11 | |
| Total return(3) | | | 4.31% | | | -6.73% | | | 45.72% | | | -9.24% | |
| Supplemental data and ratios: | | | | | | | | | | | | | |
| Net assets, end of period (000’s) | | | $56,415 | | | $57,196 | | | $50,693 | | | $35,326 | |
Ratio of expenses to average net assets
Before waivers and reimbursements of expenses(4) | | | 0.86% | | | 0.86% | | | 1.05% | | | 1.52% | |
| After waivers and reimbursements of expenses(4) | | | 0.80% | | | 0.80% | | | 0.80% | | | 0.80% | |
Ratio of net investment income to average net assets
Before waivers and reimbursements of expenses(4) | | | 0.72% | | | 0.50% | | | 0.40% | | | 0.23% | |
| After waivers and reimbursements of expenses(4) | | | 0.78% | | | 0.56% | | | 0.65% | | | 0.95% | |
| Portfolio turnover rate(3) | | | 6.11% | | | 17.78% | | | 18.15% | | | 36.19% | |
| (1) | Class Y shares commenced operations on January 15, 2020. |
| (2) | Per share amounts are calculated using the average shares outstanding method. |
| (3) | Not annualized for periods less than one year. |
| (4) | Annualized for periods less than one year. |
The accompanying notes are an integral part of these financial statements.
| | | |
| Semi-Annual Report | Jensen Quality Value Fund | 33 |
Financial Highlights
Jensen Global Quality Growth Fund - Class J
| Per Share Data: | | | six months
ended
November
30, 2022
(unaudited) | | | year ended
May 31, 2022 | | | year ended
May 31, 2021 | | | period ended
May 31, 2020(1) | |
| Net asset value, beginning of period | | | $13.73 | | | $14.20 | | | $10.81 | | | $10.00 | |
| Income (loss) from investment operations: | | | | | | | | | | | | | |
| Net investment income(2) | | | 0.01 | | | 0.05 | | | 0.06 | | | 0.02 | |
| Net realized and unrealized gain (loss) on investments | | | 0.05 | | | (0.48) | | | 3.38 | | | 0.79 | |
| Total from investment operations | | | 0.06 | | | (0.43) | | | 3.44 | | | 0.81 | |
| Less distributions: | | | | | | | | | | | | | |
| Dividends from net investment income | | | (0.02) | | | (0.04) | | | (0.05) | | | – | |
| Total distributions | | | (0.02) | | | (0.04) | | | (0.05) | | | – | |
| Net asset value, end of period | | | $13.77 | | | $13.73 | | | $14.20 | | | $10.81 | |
| Total return(4) | | | 0.49% | | | -3.02% | | | 31.94% | | | 8.10% | |
| Supplemental data and ratios: | | | | | | | | | | | | | |
| Net assets, end of period (000’s) | | | $2,426 | | | $2,145 | | | $1,700 | | | $454 | |
Ratio of expenses to average net assets
Before waivers and reimbursements of expenses(4) | | | 1.69% | | | 1.64% | | | 2.68% | | | 33.40% | |
| After waivers and reimbursements of expenses(4) | | | 1.25% | | | 1.25% | | | 1.25% | | | 1.25% | |
Ratio of net investment income to average net assets
Before waivers and reimbursements of expenses(4) | | | (0.26)% | | | (0.06)% | | | (0.92)% | | | (30.52)% | |
| After waivers and reimbursements of expenses(4) | | | 0.18% | | | 0.33% | | | 0.51% | | | 1.63% | |
| Portfolio turnover rate(3) | | | 4.20% | | | 3.04% | | | 4.05% | | | 0.00% | |
| (1) | The Fund commenced operations on April 15, 2020. |
| (2) | Per share amounts are calculated using the average shares outstanding method. |
| (3) | Not annualized for periods less than one year. |
| (4) | Annualized for periods less than one year. |
The accompanying notes are an integral part of these financial statements.
| | | |
| 34 | Jensen Global Quality Growth Fund | Semi-Annual Report |
Financial Highlights
Jensen Global Quality Growth Fund - Class I
| Per Share Data: | | | six months
ended
November
30, 2022
(unaudited) | | | year ended
May 31, 2022 | | | year ended
May 31, 2021 | | | period ended
May 31, 2020(1) | |
| Net asset value, beginning of period | | | $13.75 | | | $14.21 | | | $10.81 | | | $10.00 | |
| Income from investment operations: | | | | | | | | | | | | | |
| Net investment income(2) | | | 0.02 | | | 0.09 | | | 0.11 | | | 0.02 | |
| Net realized and unrealized gain (loss) on investments | | | 0.05 | | | (0.48) | | | 3.37 | | | 0.79 | |
| Total from investment operations | | | 0.07 | | | (0.39) | | | 3.48 | | | 0.81 | |
| Less distributions: | | | | | | | | | | | | | |
| Dividends from net investment income | | | (0.04) | | | (0.07) | | | (0.08) | | | – | |
| Total distributions | | | (0.04) | | | (0.07) | | | (0.08) | | | – | |
| Net asset value, end of period | | | $13.78 | | | $13.75 | | | $14.21 | | | $10.81 | |
| Total return(3) | | | 0.55% | | | -2.74% | | | 32.27% | | | 8.10% | |
| Supplemental data and ratios: | | | | | | | | | | | | | |
| Net assets, end of period (000’s) | | | $5,118 | | | $2,350 | | | $1,842 | | | $227 | |
Ratio of expenses to average net assets
Before waivers and reimbursements of expenses(4) | | | 1.43% | | | 1.42% | | | 2.11% | | | 33.49% | |
| After waivers and reimbursements of expenses(4) | | | 1.02% | | | 1.02% | | | 1.02% | | | 1.02% | |
Ratio of net investment income to average net assets
Before waivers and reimbursements of expenses(4) | | | (0.08)% | | | 0.17% | | | (0.28)% | | | (30.60)% | |
| After waivers and reimbursements of expenses(4) | | | 0.33% | | | 0.57% | | | 0.81% | | | 1.87% | |
| Portfolio turnover rate(3) | | | 4.20% | | | 3.04% | | | 4.05% | | | 0.00% | |
| (1) | The Fund commenced operations on April 15, 2020. |
| (2) | Per share amounts are calculated using the average shares outstanding method. |
| (3) | Not annualized for periods less than one year. |
| (4) | Annualized for periods less than one year. |
The accompanying notes are an integral part of these financial statements.
| | | |
| Semi-Annual Report | Jensen Global Quality Growth Fund | 35 |
Financial Highlights
Jensen Global Quality Growth Fund - Class Y
| Per Share Data: | | | six months
ended
November
30, 2022
(unaudited) | | | year ended
May 31, 2022 | | | year ended
May 31, 2021 | | | period ended
May 31, 2020(1) | |
| Net asset value, beginning of period | | | $13.75 | | | $14.21 | | | $10.81 | | | $10.00 | |
| Income from investment operations: | | | | | | | | | | | | | |
| Net investment income(2) | | | 0.02 | | | 0.09 | | | 0.11 | | | 0.03 | |
| Net realized and unrealized gain (loss) on investments | | | 0.05 | | | (0.48) | | | 3.37 | | | 0.78 | |
| Total from investment operations | | | 0.07 | | | (0.39) | | | 3.48 | | | 0.81 | |
| Less distributions: | | | | | | | | | | | | | |
| Dividends from net investment income | | | (0.04) | | | (0.07) | | | (0.08) | | | – | |
| Total distributions | | | (0.04) | | | (0.07) | | | (0.08) | | | – | |
| Net asset value, end of period | | | $13.78 | | | $13.75 | | | $14.21 | | | $10.81 | |
| Total return(3) | | | 0.56% | | | -2.72% | | | 32.29% | | | 8.10% | |
| Supplemental data and ratios: | | | | | | | | | | | | | |
| Net assets, end of period (000’s) | | | $36,268 | | | $33,361 | | | $23,555 | | | $1,206 | |
Ratio of expenses to average net assets
Before waivers and reimbursements of expenses(4) | | | 1.44% | | | 1.40% | | | 2.15% | | | 32.29% | |
| After waivers and reimbursements of expenses(4) | | | 1.00% | | | 1.00% | | | 1.00% | | | 1.00% | |
Ratio of net investment income to average net assets
Before waivers and reimbursements of expenses(4) | | | (0.01)% | | | 0.18% | | | (0.32)% | | | (29.29)% | |
| After waivers and reimbursements of expenses(4) | | | 0.43% | | | 0.58% | | | 0.82% | | | 2.00% | |
| Portfolio turnover rate(3) | | | 4.20% | | | 3.04% | | | 4.05% | | | 0.00% | |
| (1) | The Fund commenced operations on April 15, 2020. |
| (2) | Per share amounts are calculated using the average shares outstanding method. |
| (3) | Not annualized for periods less than one year. |
| (4) | Annualized for periods less than one year. |
The accompanying notes are an integral part of these financial statements.
| | | |
| 36 | Jensen Global Quality Growth Fund | Semi-Annual Report |
Notes to Financial Statements
November 30, 2022 (Unaudited)
1. Organization
Trust for Professional Managers (the “Trust”) was organized as a Delaware statutory trust under a Declaration of Trust dated May 29, 2001. The Trust is registered under the Investment Company Act of 1940, as amended (the “1940 Act”), as an open-end management investment company. The Jensen Quality Value Fund, formerly known as the Jensen Value Fund, and the Jensen Global Quality Growth Fund (each, a “Fund,” and together, the “Funds”), each represent a distinct series with its own investment objective and policies within the Trust. The investment objective of each of the Jensen Quality Value Fund and the Jensen Global Quality Growth Fund is long-term capital appreciation. The Trust may issue an unlimited number of shares of beneficial interest at $0.001 par value. The assets of the Funds are segregated, and a shareholder’s interest is limited to the Fund in which shares are held. The Class J and Class I shares of the Jensen Quality Value Fund became effective and commenced operations on March 31, 2010. The Class Y shares of the Jensen Quality Value Fund became effective and commenced operations on January 15, 2020. The Jensen Global Quality Growth Fund commenced investment operations on April 15, 2020 for Class J, Class I, and Class Y shares. For both Funds, Class J shares are subject to a 0.25% distribution (Rule 12b-1) and shareholder servicing fee and Class I shares are subject to a shareholder servicing fee of up to 0.10%. Each class of shares has identical rights and privileges except with respect to the distribution (Rule 12b-1) and shareholder servicing fees, and voting rights on matters affecting a single share class. Costs incurred by the Funds in connection with the organization, registration and the initial public offering of shares were paid by Jensen Investment Management, Inc. (the “Adviser”), the Funds’ investment adviser.
The Funds are investment companies and accordingly follow the investment company accounting and reporting guidance of the Financial Accounting Standards Board (“FASB”) Accounting Standards Codification Topic 946, Financial Services–Investment Companies.
2. Significant Accounting Policies
The following is a summary of significant accounting policies consistently followed by the Funds in the preparation of the financial statements. These policies are in conformity with generally accepted accounting principles in the United States of America (“GAAP”).
(a) Investment Valuation – Each equity security owned by the Funds that is listed on a securities exchange, except those listed on the NASDAQ Stock Market LLC (“NASDAQ”), is valued at its last sale price on that exchange on the date as of which assets are valued. If a security is listed on more than one exchange, the Funds will use the price of the exchange that the Funds generally consider to be the principal exchange on which the stock is traded.
Fund securities listed on NASDAQ will be valued at the NASDAQ Official Closing Price, which may not necessarily represent the last sale price. If there has been no sale on such exchange or on NASDAQ on such day, the security is valued at (i) the mean between the most recent quoted bid and asked prices at the close of the exchange or (ii) the latest sales price on the Composite Market
| | | |
| Semi-Annual Report | Jensen Quality Value Fund, Jensen Global Quality Growth Fund | 37 |
for the day such security is being valued. “Composite Market” means a consolidation of the trade information provided by national securities and foreign exchanges and over-the-counter markets, as published by an approved independent pricing service (“Pricing Service”).
Foreign securities will be priced in their local currencies as of the close of their primary exchange or market or as of the time a Fund calculates its net asset value (“NAV”), whichever is earlier. Foreign securities, currencies and other assets denominated in foreign currencies are then translated into U.S. dollars at the exchange rate of such currencies against the U.S. dollar, as provided by a Pricing Service or reporting agency. All assets denominated in foreign currencies will be converted into U.S. dollars using the applicable currency exchange rates as of the close of the New York Stock Exchange (“NYSE”), generally 4:00 p.m. Eastern Time.
Foreign securities are traded on foreign exchanges which typically close before the close of business on each day on which the NYSE is open. Each security trading on these exchanges may be valued utilizing a systematic fair valuation model provided by a Pricing Service. The valuation of each security that meets certain criteria in relation to the valuation model is systematically adjusted to reflect the impact of movement in the U.S. market after the foreign markets close and are classified as Level 2 securities. Securities that do not meet the criteria, or that are principally traded in other foreign markets, are valued as of the last reported sale price at the time the respective Fund determines its NAV, or when reliable market prices or quotations are not readily available, at the mean between the most recent bid and asked quotations as of the close of the appropriate exchange or other designated time.
Debt securities, including short-term debt instruments having a maturity of 60 days or less, are valued at the mean in accordance with prices supplied by a Pricing Service. Pricing Services may use various valuation methodologies such as the mean between the bid and the asked prices, matrix pricing and other analytical pricing models as well as market transactions and dealer quotations. If a price is not available from a Pricing Service, the most recent quotation obtained from one or more broker-dealers known to follow the issue will be obtained. Quotations will be valued at the mean between the bid and the offer. In the absence of available quotations, the securities will be priced at fair value, as described below. Any discount or premium is accreted or amortized using the constant yield method until maturity.
Redeemable securities issued by open-end, registered investment companies, including money market mutual funds, are valued at the NAV of such companies for purchase and/or redemption orders placed on that day. If, on a particular day, a share of an investment company is not listed on NASDAQ, such security’s fair value will be determined.
When market quotations are not readily available, any security or other financial instrument is valued at its fair value in accordance with Rule 2a-5 of the 1940 Act as determined under the Adviser’s procedures, subject to oversight by the Trust’s Board of Trustees. These fair value procedures will also be used to price a security when corporate events, events in the securities market or world events cause the Adviser to believe that a security’s last sale price may not reflect its actual fair value. The intended effect of using fair value pricing procedures is to ensure that the Funds are accurately priced.
| | | |
| 38 | Jensen Quality Value Fund, Jensen Global Quality Growth Fund | Semi-Annual Report |
FASB Accounting Standards Codification, Fair Value Measurements and Disclosures (“ASC 820”) Topic 820, establishes an authoritative definition of fair value and sets out a hierarchy for measuring fair value. ASC 820 requires an entity to evaluate certain factors to determine whether there has been a significant decrease in volume and level of activity for the security such that recent transactions and quoted prices may not be determinative of fair value and further analysis and adjustment may be necessary to estimate fair value. ASC 820 also requires enhanced disclosure regarding the inputs and valuation techniques used to measure fair value in those instances as well as expanded disclosure of valuation levels for each class of investments. These inputs are summarized in the three broad levels listed below:
| | ● | Level 1 – | Quoted prices in active markets for identical securities. |
| | | | |
| | ● | Level 2 – | Other significant observable inputs (including quoted prices for similar securities, interest rates, prepayment speeds, credit risk, etc.). |
| | | | |
| | ● | Level 3 – | Significant unobservable inputs (including a Fund’s own assumptions in determining the fair value of investments). |
The inputs or methodology used for valuing securities are not necessarily an indication of the risk associated with investing in those securities. The following is a summary of the inputs used to value each Fund’s investments carried at fair value as of November 30, 2022:
| Jensen Quality Value Fund | | Level 1 | | | Level 2 | Level 3 | Total | |
| Common Stock(1) | | $ | 188,650,535 | | | | $— | | | $ | — | | | $ | 188,650,535 | |
| Short-Term Investments | | | 2,387,858 | | | | — | | | | — | | | | 2,387,858 | |
| Total Investments | | $ | 191,038,393 | | | | $— | | | $ | — | | | $ | 191,038,393 | |
| | | | | | | | | | | | | | | | | |
| Jensen Global Quality Growth Fund | | Level 1 | | | Level 2 | Level 3 | Total | |
| Common Stock(1) | | | $31,393,984 | | | $ | 11,653,608 | | | $ | — | | | | $43,047,592 | |
| Short-Term Investments | | | 649,223 | | | | — | | | | — | | | | 649,223 | |
| Total Investments | | | $32,043,207 | | | $ | 11,653,608 | | | $ | — | | | | $43,696,815 | |
| (1) | For further information regarding security characteristics, please see the Schedules of Investments. |
The Funds did not hold any investments during the six months ended November 30, 2022, with significant unobservable inputs which would be classified as Level 3. The Funds did not hold financial derivative instruments during the six months ended November 30, 2022.
(b) Foreign Securities and Currency – Investment securities and other assets and liabilities denominated in foreign currencies are translated into U.S. dollar amounts on the date of valuation. Purchases and sales of investment securities and income and expense items denominated in foreign currencies are translated into U.S. dollar amounts on the respective dates of such transactions.
| | | |
| Semi-Annual Report | Jensen Quality Value Fund, Jensen Global Quality Growth Fund | 39 |
The Funds do not isolate the portion of the results of operations from changes in foreign exchange rates on investments from those resulting from the changes in market prices of securities held. Reported net realized foreign exchange gains or losses arise from sales of portfolio securities, sales and maturities of short-term securities, sales of foreign currencies, currency gains or losses realized between trade and settlement dates on securities transactions, and the difference between the amounts of dividends, interest and foreign withholding taxes recorded on the Funds’ books, and the U.S. dollar equivalent of the amounts actually received or paid. Net unrealized foreign exchange gains and losses arise from changes in the values of assets and liabilities, including investments in securities at fiscal period end, resulting from changes in the exchange rate.
Investments in foreign securities entail certain risks. Individual foreign economies of certain countries may differ favorably or unfavorably from the U.S. economy in such respects as growth of gross national product, rate of inflation, capital reinvestment, resource self-sufficiency, diversification and balance of payments position. The internal politics of certain foreign countries may not be as stable as those of the United States. Since foreign securities normally are denominated and traded in foreign currencies, the value of a Fund’s assets may be affected favorably or unfavorably by currency exchange rates, currency exchange control regulations, foreign withholding taxes, and restrictions or prohibitions on the repatriation of foreign currencies. There may be less information publicly available about a foreign issuer than about a U.S. issuer, and foreign issuers are not generally subject to accounting, auditing, and financial reporting standards and practices comparable to those in the United States. The securities of some foreign issuers are less liquid and at times more volatile than securities of comparable U.S. issuers.
(c) Federal Income Taxes – The Funds intend to comply with the requirements of Subchapter M of the Internal Revenue Code necessary to qualify as regulated investment companies and to make the requisite distributions of income and capital gains to their shareholders sufficient to relieve them from all or substantially all federal income taxes. Therefore, no federal income tax provision has been provided.
As of and during the six months ended November 30, 2022, the Funds did not have a liability for any unrecognized tax benefits. The Funds recognize interest and penalties, if any, related to uncertain tax benefits as income tax expense in the Statements of Operations. During the six months ended November 30, 2022, the Funds did not incur any interest or penalties. The Funds have no examinations in progress. The Funds are also not aware of any tax provisions for which it is reasonably possible that the total amounts of unrecognized tax benefits will significantly change in the next twelve months.
(d) Distributions to Shareholders – The Funds will declare and distribute any net investment income quarterly. The Funds will distribute any net realized long- or short-term capital gains at least annually. Distributions from net realized gains for book purposes may include short-term capital gains. All short-term capital gains are included in ordinary income for tax purposes. Distributions to shareholders are recorded on the ex-dividend date. The Funds may also pay a special distribution at the end of the calendar year to comply with federal tax requirements. The Funds may utilize earnings and profits distributed to shareholders on redemption of shares as part of the dividend paid deduction.
| | | |
| 40 | Jensen Quality Value Fund, Jensen Global Quality Growth Fund | Semi-Annual Report |
(e) Use of Estimates – The preparation of financial statements in conformity with GAAP requires management to make estimates and assumptions that affect the reported amounts of assets and liabilities and disclosure of contingent assets and liabilities at the date of the financial statements and the reported amounts of revenues and expenses during the reporting period. Actual results could differ from those estimates.
(f) Share Valuation – The NAV per share of each Fund is calculated by dividing the sum of the value of the securities held by each Fund, plus cash or other assets, minus all liabilities (including estimated accrued expenses) by the total number of shares outstanding for each Fund, rounded to the nearest cent. The Funds’ shares will not be priced on the days on which the NYSE is closed for trading.
(g) Allocation of Income, Expenses and Gains/Losses – Income, expenses (other than those deemed attributable to a specific share class), and gains and losses of each Fund are allocated daily to each class of shares based upon the ratio of net assets represented by each class as a percentage of the net assets of the Fund. Expenses deemed directly attributable to a class of shares are recorded by the specific class. Most Fund expenses are allocated by class based on relative net assets. Distribution (12b-1) and shareholder servicing fees are expensed at 0.25% of average daily net assets of Class J shares. Shareholder servicing fees are expensed at up to 0.10% of the average daily net assets of Class I shares. Expenses associated with a specific fund in the Trust are charged to that fund. Common Trust expenses are typically allocated evenly between the funds of the Trust, or by other equitable means.
(h) Other – Investment transactions are recorded on the trade date. The Funds determine the gain or loss from investment transactions using the specific identification method by comparing the original cost of the security lot sold with the net sale proceeds. Dividend income is recognized on the ex-dividend date and interest income is recognized on an accrual basis.
Withholding taxes on foreign dividends, net of any reclaims, have been provided for in accordance with the Funds’ understanding of the applicable country’s tax rules and rates.
3. Federal Tax Matters
The tax character of distributions paid during the fiscal years ended May 31, 2022 and May 31, 2021 was as follows:
| Jensen Quality Value Fund | | May 31, 2022 | | | May 31, 2021 |
| Ordinary Income | | | $2,416,784 | | | | | $944,570 | |
| Long-Term Capital Gain | | | $2,515,253 | | | | | $167,266 | |
| | | | | | | | | | |
| Jensen Global Quality Growth Fund | | May 31, 2022 | | | May 31, 2021 |
| Ordinary Income | | | $170,099 | | | | | $101,471 | |
| Long-Term Capital Gain | | | $— | | | | | $— | |
| | | |
| Semi-Annual Report | Jensen Quality Value Fund, Jensen Global Quality Growth Fund | 41 |
The components of distributable earnings on a tax basis as of May 31, 2022 were as follows:
| | | Jensen Quality
Value Fund | | | Jensen Global
Quality Growth Fund |
| Cost basis of investments for federal income tax purposes | | | $195,644,527 | | | | | $35,255,415 | |
| Gross tax unrealized appreciation | | | $19,839,523 | | | | | $4,593,660 | |
| Gross tax unrealized depreciation | | | (14,489,886 | ) | | | | (2,051,604 | ) |
| Net tax unrealized appreciation | | | 5,349,637 | | | | | 2,542,056 | |
| Undistributed ordinary income | | | — | | | | | 43,457 | |
| Undistributed long-term capital gain | | | 4,354,266 | | | | | — | |
| Distributable earnings | | | 4,354,266 | | | | | 43,457 | |
| Other accumulated losses | | | (2,052,629 | ) | | | | (95,078 | ) |
| Total distributable earnings | | | $7,651,274 | | | | | $2,490,435 | |
The difference between book basis and tax basis of investments is primarily attributable to the deferral of losses on wash sales.
At May 31, 2022, the Jensen Quality Value Fund deferred, on a tax basis, post-October losses of $2,052,629.
At May 31, 2022, the Jensen Global Quality Growth Fund had short-term capital loss carryovers of $(95,078).
Additionally, GAAP requires that certain components of net assets relating to permanent differences be reclassified between financial and tax reporting. These reclassifications have no effect on net assets or NAV per share. The permanent difference relates to tax equalization.
On the Statements of Assets and Liabilities, the following adjustments were made for permanent tax adjustments:
| | | Jensen Quality
Value Fund | | | Jensen Global
Quality Growth Fund |
| Total Distributable Earnings | | | $(831,582 | ) | | | | $— | |
| Paid-in Capital | | | $831,582 | | | | | $— | |
4. Investment Adviser
The Trust has an Investment Advisory Agreement (the “Agreement”) with the Adviser to furnish investment advisory services to the Funds. Under the terms of the Agreement, the Funds compensate the Adviser for its management services at the annual rate of 0.65% and 0.75% of each Fund’s average daily net assets for the Jensen Quality Value Fund and Jensen Global Quality Growth Fund, respectively.
The Adviser has contractually agreed to waive its management fee and/or reimburse a Fund’s other expenses at least through the expiration dates listed below to the extent necessary to ensure that the Fund’s Total Annual Operating Expenses (exclusive of front-end or contingent deferred sales loads,
| | | |
| 42 | Jensen Quality Value Fund, Jensen Global Quality Growth Fund | Semi-Annual Report |
Rule 12b-1 plan fees, shareholder servicing plan fees, taxes, leverage (i.e., any expenses incurred in connection with borrowings made by the Fund), interest (including interest incurred in connection with bank and custody overdrafts), brokerage commissions and other transactional expenses, expenses incurred in connection with any merger or reorganization, dividends or interest expenses on short positions, acquired fund fees and expenses and extraordinary expenses such as litigation) do not exceed the expense limitation caps listed below of each Fund’s average daily net assets (the “Expense Limitation Cap”).
| | | Expiration Date | | | Expense Limitation Cap |
| Jensen Quality Value Fund | | September 30, 2023 | | | 0.80% |
| Jensen Global Quality Growth Fund | | September 30, 2023 | | | 1.00% |
For the six months ended November 30, 2022, expenses of $10,118, $30,369 and $16,562 were waived or reimbursed by the Adviser for Class J, Class I and Class Y shares, respectively, for the Jensen Quality Value Fund. For the six months ended November 30, 2022, expenses of $4,834, $5,841 and $73,640 were waived or reimbursed by the Adviser for Class J, Class I and Class Y shares, respectively, for the Jensen Global Quality Growth Fund. Any such waiver or reimbursement is subject to later adjustment to allow the Adviser to recoup amounts waived or reimbursed to the extent actual fees and expenses for a fiscal period do not exceed the lesser of: (1) the Expense Limitation Cap in place at the time of waiver or reimbursement or (2) the Expense Limitation Cap in place at the time of the recoupment; provided, however, that the Adviser shall only be entitled to recoup such amounts over the following three-year period from the date of the waiver or reimbursement. During the six months ended November 30, 2022, $81,604 of previously waived expenses subject to recovery for the Jensen Quality Value Fund expired.
The following table shows the remaining waived or reimbursed expenses subject to potential recovery expiring during the fiscal period ending:
| | | Jensen Quality
Value Fund | | | Jensen Global
Quality Growth Fund |
| May 31, 2023 | | | $117,665 | | | | | $58,882 | |
| May 31, 2024 | | | $179,053 | | | | | $192,244 | |
| May 31, 2025 | | | $110,284 | | | | | $138,503 | |
| November 30, 2025 | | | $57,049 | | | | | $84,315 | |
5. Distribution and Shareholder Servicing Plan
The Trust adopted a distribution and shareholder servicing plan pursuant to Rule 12b-1 (the “12b-1 Plan”), on behalf of the Funds, which authorizes Class J shares to pay Quasar Distributors, LLC (the “Distributor” or “Quasar”), the Funds’ distributor and principal underwriter, a distribution fee of 0.25% of a Fund’s average daily net assets attributable to Class J shares for services to Class J shareholders and distribution of Class J shares. The Trust adopted a shareholder servicing plan (the “Shareholder Servicing Plan”), on behalf of the Funds, which authorizes Class I shares to pay up to 0.10% of a Fund’s average daily net assets attributable to Class I shares to other financial institutions for shareholder servicing and maintenance of Class I shareholder accounts.
| | | |
| Semi-Annual Report | Jensen Quality Value Fund, Jensen Global Quality Growth Fund | 43 |
The Distributor acts as the Funds’ principal underwriter in a continuous public offering of the Funds’ shares. Fees incurred for the six months ended November 30, 2022, and owed as of November 30, 2022 are summarized below. The fees owed to the Distributor are included within accrued expenses and other liabilities on the Statements of Assets and Liabilities.
| 12b-1 Plan | | Incurred | | | Owed |
| Jensen Quality Value Fund | | | $41,072 | | | | | $8,413 | |
| Jensen Global Quality Growth Fund | | | $2,770 | | | | | $1,631 | |
| | | | | | | | | | |
| Shareholder Servicing | | Incurred | | | Owed |
| Jensen Quality Value Fund | | | $10,000 | | | | | $460 | |
| Jensen Global Quality Growth Fund | | | $281 | | | | | $54 | |
6. Related Party Transactions
U.S. Bancorp Fund Services, LLC, doing business as U.S. Bank Global Fund Services (“Fund Services” or the “Administrator”), acts as the Funds’ Administrator under an Administration Agreement. The Administrator prepares various federal and state regulatory filings, reports and returns for the Funds; prepares reports and materials to be supplied to the Trustees; monitors the activities of the Funds’ custodian, transfer agent and fund accountant; coordinates the preparation and payment of the Funds’ expenses and reviews the Funds’ expense accruals. Fees incurred for the six months ended November 30, 2022, and owed as of November 30, 2022 are as follows:
| Administration | | Incurred | | | Owed |
| Jensen Quality Value Fund | | | $24,335 | | | | | $6,609 | |
| Jensen Global Quality Growth Fund | | | $10,657 | | | | | $2,139 | |
Fund Services also serves as the fund accountant and transfer agent to the Funds. U.S. Bank National Association (“US Bank”), an affiliate of Fund Services, serves as the Funds’ custodian. Fees incurred for the six months ended November 30, 2022 and owed as of November 30, 2022 for fund accounting, transfer agency, and custody fees are as follows:
| Fund Accounting | | Incurred | | | Owed |
| Jensen Quality Value Fund | | | $21,686 | | | | | $7,570 | |
| Jensen Global Quality Growth Fund | | | $12,679 | | | | | $3,713 | |
| | | | | | | | | | |
| Transfer Agency | | Incurred | | | Owed |
| Jensen Quality Value Fund | | | $33,085 | | | | | $12,293 | |
| Jensen Global Quality Growth Fund | | | $23,300 | | | | | $7,980 | |
| | | | | | | | | | |
| Custody | | Incurred | | | Owed |
| Jensen Quality Value Fund | | | $3,755 | | | | | $1,673 | |
| Jensen Global Quality Growth Fund | | | $6,334 | | | | | $2,115 | |
| | | |
| 44 | Jensen Quality Value Fund, Jensen Global Quality Growth Fund | Semi-Annual Report |
The Jensen Quality Value Fund and Jensen Global Quality Growth Fund have lines of credit with US Bank (see Note 10).
Certain officers of the Trust are also employees of Fund Services. A Trustee of the Trust is affiliated with Fund Services and US Bank.
The Trust’s Chief Compliance Officer is also an employee of Fund Services. Each Fund’s allocation of the Trust’s Chief Compliance Officer fees incurred for the six months ended November 30, 2022, and owed as of November 30, 2022 were as follows:
| | | Incurred | | | Owed |
| Jensen Quality Value Fund | | | $6,222 | | | | | $2,061 | |
| Jensen Global Quality Growth Fund | | | $6,222 | | | | | $2,061 | |
7. Capital Share Transactions
Transactions in shares of the Funds were as follows:
Jensen Quality Value Fund
| Class J | | six months ended
November 30, 2022
(unaudited) | | | year ended
May 31, 2022 |
| Shares sold | | | 131,325 | | | | | 1,116,933 | |
| Shares issued in reinvestment of dividends | | | 4,002 | | | | | 61,680 | |
| Shares redeemed | | | (673,872 | ) | | | | (845,964 | ) |
| Net increase (decrease) | | | (538,545 | ) | | | | 332,649 | |
| | | | | | | | | | |
| Class I | | six months ended
November 30, 2022
(unaudited) | | | year ended
May 31, 2022 |
| Shares sold | | | 666,372 | | | | | 5,371,787 | |
| Shares issued in reinvestment of dividends | | | 16,036 | | | | | 123,464 | |
| Shares redeemed | | | (1,057,477 | ) | | | | (1,395,061 | ) |
| Net increase (decrease) | | | (375,069 | ) | | | | 4,100,190 | |
| | | | | | | | | | |
| Class Y | | six months ended
November 30, 2022
(unaudited) | | | year ended
May 31, 2022 |
| Shares sold | | | 50,030 | | | | | 810,922 | |
| Shares issued in reinvestment of dividends | | | 8,923 | | | | | 84,614 | |
| Shares redeemed | | | (247,777 | ) | | | | (185,958 | ) |
| Net increase (decrease) | | | (188,824 | ) | | | | 709,578 | |
| | | |
| Semi-Annual Report | Jensen Quality Value Fund, Jensen Global Quality Growth Fund | 45 |
Jensen Global Quality Growth Fund
| Class J | | six months ended
November 30, 2022
(unaudited) | | | year ended
May 31, 2022 |
| Shares sold | | | 24,609 | | | | | 74,666 | |
| Shares issued in reinvestment of dividends | | | 325 | | | | | 485 | |
| Shares redeemed | | | (4,921 | ) | | | | (38,692 | ) |
| Net increase | | | 20,013 | | | | | 36,459 | |
| | | | | | | | | | |
| Class I | | six months ended
November 30, 2022
(unaudited) | | | year ended
May 31, 2022 |
| Shares sold | | | 220,120 | | | | | 40,584 | |
| Shares issued in reinvestment of dividends | | | 544 | | | | | 706 | |
| Shares redeemed | | | (20,236 | ) | | | | 0 | |
| Net increase | | | 200,428 | | | | | 41,290 | |
| | | | | | | | | | |
| Class Y | | six months ended
November 30, 2022
(unaudited) | | | year ended
May 31, 2022 |
| Shares sold | | | 233,906 | | | | | 780,548 | |
| Shares issued in reinvestment of dividends | | | 8,662 | | | | | 10,808 | |
| Shares redeemed | | | (37,900 | ) | | | | (22,060 | ) |
| Net increase | | | 204,668 | | | | | 769,296 | |
8. Investment Transactions
The aggregate purchases and sales of securities, excluding short-term investments, for the Funds for the six months ended November 30, 2022 are summarized below. For the six months ended November 30, 2022, there were no purchases or sales of U.S. government securities for the Funds.
| | | Purchases | | | Sales |
| Jensen Quality Value Fund | | $ | 11,307,315 | | | | $ | 27,425,799 | |
| Jensen Global Quality Growth Fund | | $ | 7,118,602 | | | | $ | 1,604,867 | |
| | | |
| 46 | Jensen Quality Value Fund, Jensen Global Quality Growth Fund | Semi-Annual Report |
9. Beneficial Ownership
The beneficial ownership, either directly or indirectly, of more than 25% of the voting securities of a fund creates a presumption of control of the fund under Section 2(a)(9) of the 1940 Act. At November 30, 2022, the following shareholders held over 25% of a Fund’s shares outstanding:
| Jensen Quality Value Fund | | |
| | | |
| Class J | | |
| Charles Schwab & Co. Inc. | | 42.72% |
| National Financial Services LLC | | 29.04% |
| | | |
| Class I | | |
| Raymond James | | 54.96% |
| | | |
| Class Y | | |
| Pershing, LLC. | | 79.58% |
| | | |
| Jensen Global Quality Growth Fund | | |
| | | |
| Class J | | |
| Wells Fargo Clearing Services LLC | | 58.26% |
| Charles Schwab & Co. Inc. | | 27.64% |
| | | |
| Class I | | |
| National Financial Services LLC | | 58.09% |
| Charles Schwab & Co. Inc. | | 36.45% |
| | | |
| Class Y | | |
| Pershing, LLC. | | 93.57% |
10. Line of Credit
At November 30, 2022, the Jensen Quality Value Fund and Jensen Global Quality Growth Fund had lines of credit in the amount of the lesser of $10,000,000 and $2,000,000, respectively, or 33.33% and 20%, respectively, of the fair value of unencumbered assets of each Fund, which mature on August 5, 2023. These secured lines of credit are intended to provide short-term financing, if necessary, subject to certain restrictions, in connection with shareholder redemptions. The interest rate on outstanding principal amounts is equal to the prime rate (7.00% as of November 30, 2022). The credit facility is with the Funds’ custodian, US Bank. During the six months ended November 30, 2022, the Jensen Quality Value Fund and Jensen Global Quality Growth Fund did not utilize their lines of credit.
| | | |
| Semi-Annual Report | Jensen Quality Value Fund, Jensen Global Quality Growth Fund | 47 |
11. Recent Market Events
U.S. and international markets have experienced and may continue to experience significant periods of volatility in recent years and months due to a number of economic, political and global macro factors including rising inflation, uncertainty regarding central banks’ interest rate increases, the possibility of a national or global recession, trade tensions, political events, the war between Russia and Ukraine and the impact of the coronavirus (COVID-19) global pandemic. The global recovery from COVID-19 may last for an extended period of time. As a result of continuing political tensions and armed conflicts, including the war between Ukraine and Russia, the U.S. and the European Union imposed sanctions on certain Russian individuals and companies, including certain financial institutions, and have limited certain exports and imports to and from Russia. The war has contributed to recent market volatility and may continue to do so. These developments, as well as other events, could result in further market volatility and negatively affect financial asset prices, the liquidity of certain securities and the normal operations of securities exchanges and other markets, despite government efforts to address market disruptions. Continuing market volatility as a result of recent market conditions or other events may have adverse effects on your account.
12. Subsequent Events
On December 15, 2022, the following distributions were declared and paid from ordinary income and capital gains to shareholders of record as of December 14, 2022:
| Ordinary Income | | | |
| | | | |
| | Class J | Class I | Class Y |
| Jensen Global Quality Growth Fund | — | 2,009 | 16,037 |
| | | | |
| Long-Term Capital Gains | | | |
| | | | |
| | Class J | Class I | Class Y |
| Jensen Quality Value Fund | 721,073 | 2,342,875 | 1,290,394 |
| | | |
| 48 | Jensen Quality Value Fund, Jensen Global Quality Growth Fund | Semi-Annual Report |
Expense Example – November 30, 2022 (Unaudited)
As a shareholder of the Funds, you incur ongoing costs, including investment management fees, distribution (12b-1) fees (Class J only) and shareholder servicing fees (Class I only), and other Fund expenses, which are indirectly paid by shareholders. These examples are intended to help you understand your ongoing costs (in dollars) of investing in the Funds and to compare these costs with the ongoing costs of investing in other mutual funds.
The Examples are based on an investment of $1,000 invested at the beginning of the period and held for the entire period referenced in each table.
Actual Expenses
The first lines of the tables below for each share class of the Funds provide information about actual account values and actual expenses. However, the table does not include shareholder specific fees, such as the $15.00 fee charged to IRA accounts, or the $15.00 fee charged for wire redemptions. The table also does not include portfolio trading commissions and related trading costs. You may use the information in these lines, together with the amount you invested, to estimate the expenses that you paid over the period. Simply divide your account value by $1,000 (for example, an $8,600 account value divided by $1,000 = 8.6), then multiply the result by the number in the first line under the heading titled “Expenses Paid During Period” to estimate the expenses you paid on your account during this period.
Hypothetical Example for Comparison Purposes
The second lines of the tables below for each share class of the Funds provide information about hypothetical account values and hypothetical expenses based on the actual expense ratios for each share class of the Funds and an assumed rate of return of 5% per year before expenses, which is not the Funds’ actual returns. The hypothetical account values and expenses may not be used to estimate the actual ending account balance or expenses you paid for the period. You may use this information to compare the ongoing costs of investing in the Funds and other funds. To do so, compare this 5% hypothetical example with the 5% hypothetical examples that appear in the shareholder reports of the other funds.
Please note that the expenses shown in the table are meant to highlight your ongoing costs only and do not reflect any transactional costs, such as sales charges (loads), redemption fees, or exchange fees which, although not charged by the Funds, may be charged by other funds. Therefore, the second lines of the tables are useful in comparing ongoing costs only and will not help you determine the relative total costs of owning different funds.
| | | |
| Semi-Annual Report | Jensen Quality Value Fund, Jensen Global Quality Growth Fund | 49 |
Expense Example Tables (Unaudited)
| Jensen Quality Value Fund – Class J | | | Beginning
Account Value
June 1, 2022 | | | Ending
Account Value
November 30,
2022 | | | Expenses Paid
During Period*
June 1, 2022 –
November 30, 2022 |
| Actual | | | | $1,000.00 | | | | | $1,042.10 | | | | | $5.38 | |
| Hypothetical (5% return before expenses) | | | | 1,000.00 | | | | | 1,019.80 | | | | | 5.32 | |
| | | | | | | | | | |
| * | Expenses are equal to Class J’s annualized expense ratio of 1.05%, multiplied by the average account value over the period, multiplied by 183/365 to reflect the one-half year period. |
| Jensen Quality Value Fund – Class I | | | Beginning
Account Value
June 1, 2022 | | | Ending
Account Value
November 30,
2022 | | | Expenses Paid
During Period*
June 1, 2022 –
November 30, 2022 |
| Actual | | | | $1,000.00 | | | | | $1,043.00 | | | | | $4.20 | |
| Hypothetical (5% return before expenses) | | | | 1,000.00 | | | | | 1,020.96 | | | | | 4.15 | |
| | |
| * | Expenses are equal to Class I’s annualized expense ratio of 0.82%, multiplied by the average account value over the period, multiplied by 183/365 to reflect the one-half year period. |
| | |
| Jensen Quality Value Fund – Class Y | | | Beginning
Account Value
June 1, 2022 | | | Ending
Account Value
November 30,
2022 | | | Expenses Paid
During Period*
June 1, 2022 –
November 30, 2022 |
| Actual | | | | $1,000.00 | | | | | $1,043.10 | | | | | $4.10 | |
| Hypothetical (5% return before expenses) | | | | 1,000.00 | | | | | 1,021.06 | | | | | 4.05 | |
| | | | | | | | | | |
| * | Expenses are equal to Class Y’s annualized expense ratio of 0.80%, multiplied by the average account value over the period, multiplied by 183/365 to reflect the one-half year period. |
| | |
| Jensen Global Quality Growth Fund – Class J | | | Beginning
Account Value
June 1, 2022 | | | Ending
Account Value
November 30,
2022 | | | Expenses Paid
During Period*
June 1, 2022 –
November 30, 2022 |
| Actual | | | | $1,000.00 | | | | | $1,004.90 | | | | | $6.28 | |
| Hypothetical (5% return before expenses) | | | | 1,000.00 | | | | | 1,018.80 | | | | | 6.33 | |
| | | | | | | | | | |
| * | Expenses are equal to Class J’s annualized expense ratio of 1.25%, multiplied by the average account value over the period, multiplied by 183/365 to reflect the one-half year period. |
| | |
| | | |
| 50 | Jensen Quality Value Fund, Jensen Global Quality Growth Fund | Semi-Annual Report |
| Jensen Global Quality Growth Fund – Class I | | | Beginning
Account Value
June 1, 2022 | | | Ending
Account Value
November 30,
2022 | | | Expenses Paid
During Period*
June 1, 2022 –
November 30, 2022 |
| Actual | | | | $1,000.00 | | | | | $1,005.50 | | | | | $5.13 | |
| Hypothetical (5% return before expenses) | | | | 1,000.00 | | | | | 1,019.95 | | | | | 5.16 | |
| | |
| * | Expenses are equal to Class I’s annualized expense ratio of 1.02%, multiplied by the average account value over the period, multiplied by 183/365 to reflect the one-half year period. |
| | |
| Jensen Global Quality Growth Fund – Class Y | | | Beginning
Account Value
June 1, 2022 | | | Ending
Account Value
November 30,
2022 | | | Expenses Paid
During Period*
June 1, 2022 –
November 30, 2022 |
| Actual | | | | $1,000.00 | | | | | $1,005.60 | | | | | $5.03 | |
| Hypothetical (5% return before expenses) | | | | 1,000.00 | | | | | 1,020.05 | | | | | 5.06 | |
| | |
| * | Expenses are equal to Class Y’s annualized expense ratio of 1.00%, multiplied by the average account value over the period, multiplied by 183/365 to reflect the one-half year period. |
| | |
| | | |
| Semi-Annual Report | Jensen Quality Value Fund, Jensen Global Quality Growth Fund | 51 |
Additional Information (Unaudited)
1. Shareholder Notification of Federal Tax Status
The Jensen Quality Value Fund and Jensen Global Quality Growth Fund designated 99.00% and 100.00%, respectively, of dividends declared during the fiscal year ended May 31, 2022 as dividends qualifying for the dividends received deduction available to corporate shareholders.
The Jensen Quality Value Fund and Jensen Global Quality Growth Fund designated 99.00% and 100.00%, respectively, of dividends declared from net investment income during the fiscal year ended May 31, 2022 as qualified dividend income under the Jobs and Growth Tax Relief Reconciliation Act of 2003.
The Jensen Quality Value Fund and Jensen Global Quality Growth Fund designated 70.63% and 0.00%, respectively, of taxable ordinary income distributions as short-term capital gain distributions under Internal Revenue Code Section 871(k)(2)(c) for the year ended May 31, 2022.
Additional Information Applicable to Foreign Shareholders Only:
The Jensen Quality Value Fund and Jensen Global Quality Growth Fund each designated 0.00% of ordinary income distributions as interest-related dividends under Internal Revenue Code Section 871(k)(1)(c).
2. Availability of Proxy Voting Information
The Funds have adopted proxy voting policies and procedures that delegate to the Adviser the authority to vote proxies. A description of the Funds’ proxy voting policies and procedures is available without charge, upon request, by calling the Funds toll free at 800-992-4144. A description of these policies and procedures is also included in the Funds’ Statement of Additional Information, which is available on the SEC’s website at http://www.sec.gov.
The Funds’ proxy voting records for the most recent 12-month period ended June 30 is available without charge, upon request, by calling toll free, 800-992-4144, or by accessing the SEC’s website at http://www.sec.gov.
3. Portfolio Holdings
The Funds file complete schedules of portfolio holdings with the SEC for the first and third quarters of each fiscal year on Part F of Form N-PORT. Shareholders may view the Funds’ Form N-PORT reports on the SEC’s website at http://www.sec.gov.
| | | |
| 52 | Jensen Quality Value Fund, Jensen Global Quality Growth Fund | Semi-Annual Report |
4. Householding
In an effort to decrease costs, the Funds intend to reduce the number of duplicate prospectuses, supplements and certain other shareholder documents you receive by sending only one copy of each to those addresses shared by two or more accounts and to shareholders the Funds reasonably believe are from the same family or household. Once implemented, if you would like to discontinue householding for your accounts, please call the Funds toll-free at 800-992-4144 to request individual copies of these documents. Once the Funds receive notice to stop householding, the Funds will begin sending individual copies 30 days after receiving your request. This policy does not apply to account statements.
| | | |
| Semi-Annual Report | Jensen Quality Value Fund, Jensen Global Quality Growth Fund | 53 |
Basis for Trustees’ Approval of Investment Advisory Agreement
The Board of Trustees (the “Trustees”) of Trust for Professional Managers (the “Trust”) met on August 26, 2022 to consider the renewal of the Investment Advisory Agreement (the “Agreement”) between the Trust, on behalf of the Jensen Quality Value Fund and the Jensen Global Quality Growth Fund (each, a “Fund,” and together, the “Funds”), each a series of the Trust, and Jensen Investment Management, Inc., the Funds’ investment adviser (the “Adviser”). The Trustees also met at a prior meeting held on June 13, 2022 (the “June 13, 2022 Meeting”) to review materials related to the renewal of the Agreement. Prior to these meetings, the Trustees requested and received materials to assist them in considering the renewal of the Agreement. The materials provided contained information with respect to the factors enumerated below, including a copy of the Agreement, a memorandum prepared by the Trust’s outside legal counsel discussing in detail the Trustees’ fiduciary obligations and the factors they should assess in considering the renewal of the Agreement, detailed comparative information relating to the Funds’ performance, as well as the management fees and other expenses of the Funds, due diligence materials relating to the Adviser (including a due diligence questionnaire completed on behalf of the Funds by the Adviser, the Adviser’s Form ADV, select financial statements of the Adviser, biographical information of the Adviser’s key management and compliance personnel, comparative fee information for the Funds and a summary detailing key provisions of the Adviser’s written compliance program, including its code of ethics) and other pertinent information. The Trustees also received information periodically throughout the year that was relevant to the Agreement renewal process, including performance, management fee and other expense information. Based on their evaluation of the information provided by the Adviser, in conjunction with the Funds’ other service providers, the Trustees, by a unanimous vote (including a separate vote of the Trustees who are not “interested persons,” as that term is defined in the Investment Company Act of 1940, as amended (the “Independent Trustees”)), approved the continuation of the Agreement for an additional one-year term ending August 31, 2023.
Discussion of Factors Considered
In considering the renewal of the Agreement and reaching their conclusions, the Trustees reviewed and analyzed various factors that they determined were relevant, including the factors enumerated below.
1. Nature, Extent and Quality of Services Provided to the Funds
The Trustees considered the nature, extent and quality of services provided by the Adviser to the Funds and the amount of time devoted to the Funds’ operations by the Adviser’s staff. The Trustees considered the Adviser’s specific responsibilities in all aspects of day-to-day management of the Funds, including the investment strategies implemented by the Adviser, as well as the qualifications, experience and responsibilities of Eric H. Schoenstein, Robert D. McIver, Allen T. Bond, and Kevin J. Walkush, the Jensen Global Quality Growth Fund’s portfolio managers, and Eric H. Schoenstein, Kurt M. Havnaer, Adam D. Calamar, and Tyra S. Pratt, the Jensen Quality Value Fund’s portfolio managers, and other key personnel at the Adviser involved in the day-to-day activities of the Funds. The Trustees reviewed information provided by the Adviser in a due diligence questionnaire, including
| | | |
| 54 | Jensen Quality Value Fund, Jensen Global Quality Growth Fund | Semi-Annual Report |
the structure of the Adviser’s compliance program and its continuing commitment to the Funds. The Trustees noted that during the course of the prior year the Adviser had participated in a Trust board meeting to discuss the Funds’ performance and outlook, along with the compliance efforts made by the Adviser. The Trustees also noted any services that extended beyond portfolio management, and they considered the brokerage practices of the Adviser. The Trustees discussed the Adviser’s handling of compliance matters, including the reports of the Trust’s chief compliance officer to the Trustees on the effectiveness of the Adviser’s compliance program. The Trustees also considered the Adviser’s overall financial condition, as well as the implementation and operational effectiveness of the Adviser’s business continuity plan in response to the COVID-19 pandemic. The Trustees concluded that the Adviser had sufficient quality and depth of personnel, resources, investment methods and compliance policies and procedures essential to performing its duties under the Advisory Agreement and that the nature, overall quality and extent of the management services provided to the Funds, as well as the Adviser’s compliance program, were satisfactory and reliable.
2. Investment Performance of the Funds and the Adviser
The Trustees discussed the performance of the Class I shares of the Jensen Global Quality Growth Fund and Jensen Quality Value Fund for the quarter, one-year, three-year, five year, ten-year and since inception periods ended March 31, 2022, as applicable. In assessing the quality of the portfolio management services delivered by the Adviser, the Trustees also compared the short-term and longer-term performance of the Class I shares of each Fund on both an absolute basis and in comparison to each Fund’s primary benchmark index (the MSCI All Country World Index for the Jensen Global Quality Growth Fund and the Russell Midcap Total Return Index for the Jensen Quality Value Fund) and in comparison to a peer group of funds as constructed using publicly-available data provided by Morningstar, Inc. and presented by Barrington Financial Group, LLC d/b/a Barrington Partners, an independent third-party benchmarking firm, through its cohort selection process (a peer group of U.S. open-end global large-cap blend and foreign large-cap blend funds for the Jensen Global Quality Growth Fund and a peer group of U.S. open-end mid-cap blend and mid-cap value funds for the Jensen Quality Value Fund) (each, a “Barrington Cohort”). The Trustees noted that the Adviser did not manage any other accounts with the same or similar investment strategies as either Fund.
The Trustees noted the Jensen Global Quality Growth Fund’s performance for Class I shares for the one-year period ended March 31, 2022 was above the Barrington Cohort average. The Trustees noted that for the one-year period ended March 31, 2022, the Class I shares of the Jensen Global Quality Growth Fund had outperformed the MSCI All Country World Index. The Trustees noted that for quarter and since inception periods ended March 31, 2022, the Class I shares of the Jensen Global Quality Growth Fund had underperformed the MSCI All Country World Index.
The Trustees noted the Jensen Quality Value Fund’s performance for Class I shares for the ten-year period ended March 31, 2022 was in-line with the Barrington Cohort average. The Trustees also noted that the Jensen Quality Value Fund’s performance for Class I shares for each of the one-year, three-year, and five-year periods ended March 31, 2022 was above the Barrington Cohort average. The Trustees noted that for the one-year period ended March 31, 2022, the Class I shares
| | | |
| Semi-Annual Report | Jensen Quality Value Fund, Jensen Global Quality Growth Fund | 55 |
of the Jensen Quality Value Fund had outperformed the Russell Midcap Total Return Index. The Trustees noted that for the quarter, three-year, five-year, ten-year and since inception periods ended March 31, 2022, the Class I shares of the Jensen Quality Value Fund had underperformed the Russell Midcap Total Return Index.
After considering all of the information, the Trustees concluded that the performance obtained by the Adviser for each Fund was satisfactory under current market conditions. Although past performance is not a guarantee or indication of future results, the Trustees determined that each Fund and its shareholders were likely to benefit from the Adviser’s continued management.
3. Costs of Services Provided and Profits Realized by the Adviser
The Trustees considered the cost of services and the structure of the Adviser’s fees, including a review of the expense analyses and other pertinent material with respect to the Funds. The Trustees reviewed the related statistical information and other materials provided, including the comparative expenses and Barrington Cohort comparisons. The Trustees considered the cost structure of each Fund relative to its Barrington Cohort, as well as any fee waivers and expense reimbursements of the Adviser.
The Trustees also considered the overall profitability of the Adviser and reviewed the Adviser’s financial information and noted that the Adviser had subsidized each Fund’s operations since inception, and had not yet recouped those subsidies. The Trustees also examined the level of profits that could be expected to accrue to the Adviser from the fees payable under the Advisory Agreement, as well as the Funds’ brokerage practices, noting that the Adviser makes no effort to seek soft dollar arrangements. These considerations were based on materials requested by the Trustees and the Funds’ administrator specifically for the June 13, 2022 meeting and the August 26, 2022 meeting at which the Advisory Agreement was formally considered, as well as the reports prepared by the Adviser over the course of the year.
The Trustees noted that the Jensen Global Quality Growth Fund’s contractual management fee of 0.75% was above the Barrington Cohort average of 0.69%. The Trustees noted that the Jensen Global Quality Growth Fund was operating above its expense cap of 1.00% for Class I shares. The Trustees observed that the Jensen Global Quality Growth Fund’s total expense ratio (net of fee waivers and expense reimbursements and including shareholder servicing fees) of 1.02% for Class I shares was above the Barrington Cohort average of 0.78%.
The Trustees noted that the Jensen Quality Value Fund’s contractual management fee of 0.65% was below the Barrington Cohort average of 0.72%. The Trustees noted that the Jensen Quality Value Fund was operating above its expense cap of 0.80% for Class I shares. The Trustees observed that the Jensen Quality Value Fund’s total expense ratio (net of fee waivers and expense reimbursements and including shareholder servicing fees) of 0.82% for Class I shares was below the Barrington Cohort average of 0.94%.
| | | |
| 56 | Jensen Quality Value Fund, Jensen Global Quality Growth Fund | Semi-Annual Report |
The Trustees concluded that the Funds’ expenses and the management fees paid to the Adviser were fair and reasonable in light of the comparative performance, expense and management fee information. The Trustees further concluded, based on a profitability analysis prepared by the Adviser, that neither Fund was profitable to the Adviser after reflecting marketing and distribution expenses, but the Adviser maintained adequate profit levels to support the services to the Funds from the revenues of its overall investment advisory business, despite its subsidies to support each Fund’s operations.
4. Extent of Economies of Scale as the Funds Grow
The Trustees compared each Fund’s expenses relative to its peer group and discussed realized and potential economies of scale. The Trustees also reviewed the structure of each Fund’s management fee and whether each Fund was large enough to generate economies of scale for shareholders or whether economies of scale would be expected to be realized as Fund assets grow (and if so, how those economies of scale were being or would be shared with shareholders). The Trustees reviewed all fee waivers, expense reimbursements and potential recoupments by the Adviser with respect to each Fund. The Trustees noted that each Fund’s management fee structure did not contain any breakpoint reductions as the Fund’s assets grow in size, but that the feasibility of incorporating breakpoints would continue to be reviewed on a regular basis. With respect to the Adviser’s fee structures, the Trustees concluded that the current fee structures were reasonable and reflected a sharing of economies of scale between the Adviser and each Fund at the Fund’s current asset level.
5. Benefits Derived from the Relationship with the Funds
The Trustees considered the direct and indirect benefits that could be received by the Adviser from its association with the Funds. The Trustees examined the brokerage practices of the Adviser with respect to the Funds. The Trustees concluded that the benefits the Adviser may receive, such as greater name recognition and increased ability to attract additional investor assets, appear to be reasonable, and in many cases may benefit the Funds.
Conclusions
The Trustees considered all of the foregoing factors. In considering the renewal of the Advisory Agreement, the Trustees did not identify any one factor as all-important, but rather considered these factors collectively in light of each Fund’s surrounding circumstances. Based on this review, the Trustees, including a majority of the Independent Trustees, approved the continuation of the Advisory Agreement for an additional one-year term ending August 31, 2023 as being in the best interests of each Fund and its shareholders.
| | | |
| Semi-Annual Report | Jensen Quality Value Fund, Jensen Global Quality Growth Fund | 57 |
Notice of Privacy Policy & Practices (Unaudited)
We collect non-public personal information about you from the following sources:
| | ● | information we receive about you on applications or other forms; |
| | ● | information you give us orally; and |
| | ● | information about your transactions with us or others. |
The types of non-public personal information we collect and share can include:
| | ● | social security numbers; |
| | ● | account balances; |
| | ● | account transactions; |
| | ● | transaction history; |
| | ● | wire transfer instructions; and |
| | ● | checking account information. |
What Information We Disclose
We do not disclose any non-public personal information about our shareholders or former shareholders without the shareholder’s authorization, except as permitted by law or in response to inquiries from governmental authorities. We may share information with affiliated parties and unaffiliated third parties with whom we have contracts for servicing the Funds. We will provide unaffiliated third parties with only the information necessary to carry out their assigned responsibility.
How We Protect Your Information
All shareholder records will be disposed of in accordance with applicable law. We maintain physical, electronic and procedural safeguards to protect your non-public personal information and require third parties to treat your non-public personal information with the same high degree of confidentiality.
In the event that you hold shares of the Funds through a financial intermediary, including, but not limited to, a broker-dealer, bank or trust company, the privacy policy of your financial intermediary would govern how your non-public personal information would be shared with unaffiliated third parties.
Indemnifications
Under the Trust’s organizational documents, its officers and Trustees are indemnified against certain liabilities arising out of the performance of their duties to the Funds. In addition, in the normal course of business, the Funds enter into contracts that provide general indemnifications to other parties. The Funds’ maximum exposure under these arrangements is unknown as this would involve future claims that may be made against the Funds that have not yet occurred. However, the Funds have not had prior claims or losses pursuant to these contracts and expects the risk of loss to be remote.
| | | |
| 58 | Jensen Quality Value Fund, Jensen Global Quality Growth Fund | Semi-Annual Report |
Information About Trustees
The business and affairs of the Trust are managed under the direction of the Trust’s Board of Trustees. Information pertaining to the Trustees of the Trust is set forth below. The Statement of Additional Information includes additional information about the Trustees and is available, without charge, upon request by calling 800-992-4144.
| | | |
| Semi-Annual Report | Jensen Quality Value Fund, Jensen Global Quality Growth Fund | 59 |
Independent Trustees (Unaudited)
Name, Address and
Year of Birth | Position(s)
Held with
the Trust | Term of Office
and Length of
Time Served | Number of
Portfolios
in Trust
Overseen
by Trustee | Principal Occupation(s)
During the Past Five Years | Other Directorships
Held by Trustee
During the Past Five
Years |
Michael D. Akers,
Ph.D.
615 E. Michigan St.
Milwaukee, WI 53202
Year of Birth: 1955 | Trustee | Indefinite Term; Since August 22, 2001 | 22 | Professor Emeritus, Department of Accounting (June 2019-present), Professor, Department of Accounting (2004-2019). | Independent Trustee, USA MUTUALS (an open-end investment company) (2001- 2021). |
Gary A. Drska
615 E. Michigan St.
Milwaukee, WI 53202
Year of Birth: 1956 | Trustee | Indefinite Term; Since August 22, 2001 | 22 | Retired; Former Pilot, Frontier/ Midwest Airlines, Inc. (airline company) (1986-2021). | Independent Trustee, USA MUTUALS (an open-end investment company) (2001-2021). |
Vincent P. Lyles
615 E. Michigan St.
Milwaukee, WI 53202
Year of Birth: 1961 | Trustee | Indefinite Term; Since April 6, 2022 | 22 | System Vice President of Community Relations, Advocate Aurora Health Care (health care provider) (2019-present); President and Chief Executive Officer, Boys & Girls Club of Greater Milwaukee (2012-2018). | Independent Director, BMO Funds, Inc. (an open-end investment company) (2017–2022). |
Erik K. Olstein
615 E. Michigan St.
Milwaukee, WI 53202
Year of Birth: 1967 | Trustee | Indefinite Term; Since April 6, 2022 | 22 | Retired; President and Chief Operating Officer (2000-2020), Vice President of Sales and Chief Operating Officer (1995-2000), Olstein Capital Management, L.P. (asset management firm); Secretary and Assistant Treasurer, The Olstein Funds (1995-2018). | Trustee, The Olstein Funds (an open-end investment company) (1995–2018). |
Lisa Zúñiga Ramírez
615 E. Michigan St.
Milwaukee, WI 53202
Year of Birth: 1969 | Trustee | Indefinite Term; Since April 6, 2022 | 22 | Retired; Principal and Senior Portfolio Manager, Segall, Bryant & Hamill, LLC (asset management firm) (2018-2020); Partner and Senior Portfolio Manager, Denver Investments LLC (asset management firm) (2009-2018). | N/A |
Gregory M. Wesley
615 E. Michigan St.
Milwaukee, WI 53202
Year of Birth: 1969 | Trustee | Indefinite Term; Since April 6, 2022 | 22 | Senior Vice President of Strategic Alliances and Business Development, Medical College of Wisconsin (2016-present). | N/A |
| | | | | | |
| | | |
| 60 | Jensen Quality Value Fund, Jensen Global Quality Growth Fund | Semi-Annual Report |
Interested Trustee and Officers (Unaudited)
Name, Address and
Year of Birth | Position(s)
Held with
the Trust | Term of Office
and Length of
Time Served | Number of
Portfolios
in Trust
Overseen
by Trustee | Principal Occupation(s)
During the Past Five Years | Other Directorships
Held by Trustee
During the Past Five Years |
John P. Buckel
615 E. Michigan St.
Milwaukee, WI 53202
Year of Birth: 1957 | President and Principal Executive Officer | Indefinite Term; Since January 24, 2013 | N/A | Vice President, U.S. Bancorp Fund Services, LLC (2004-present). | N/A |
Jennifer A. Lima
615 E. Michigan St.
Milwaukee, WI 53202
Year of Birth: 1974 | Vice President, Treasurer and Principal Financial and Accounting Officer | Indefinite Term; Since January 24, 2013 | N/A | Vice President, U.S. Bancorp Fund Services, LLC (2002-present). | N/A |
Deanna B. Marotz
615 E. Michigan St.
Milwaukee, WI 53202
Year of Birth: 1965 | Chief Compliance Officer, Vice President and Anti- Money Laundering Officer | Indefinite Term; Since October 21, 2021 | N/A | Senior Vice President, U.S. Bancorp Fund Services, LLC (2021-present); Chief Compliance Officer of Keeley-Teton Advisors, LLC and Teton Advisors, Inc. (2017-2021). | N/A |
Jay S. Fitton
615 E. Michigan St.
Milwaukee, WI 53202
Year of Birth: 1970 | Secretary | Indefinite Term; Since July 22, 2019 | N/A | Assistant Vice President, U.S. Bancorp Fund Services, LLC (2019-present); Partner, Practus, LLP (2018- 2019); Counsel, Drinker Biddle & Reath LLP (2016-2018). | N/A |
Kelly A. Strauss
615 E. Michigan St.
Milwaukee, WI 53202
Year of Birth: 1987 | Assistant Treasurer | Indefinite Term; Since April 23, 2015 | N/A | Assistant Vice President, U.S. Bancorp Fund Services, LLC (2011-present). | N/A |
Shannon Coyle
615 E. Michigan St.
Milwaukee, WI 53202
Year of Birth: 1990 | Assistant Treasurer | Indefinite Term; Since August 26, 2022 | N/A | Officer, U.S. Bancorp Fund Services, LLC (2015-present). | N/A |
Laura A. Carroll
615 E. Michigan St.
Milwaukee, WI 53202
Year of Birth: 1985 | Assistant Treasurer | Indefinite Term; Since August 20, 2018 | N/A | Assistant Vice President, U.S. Bancorp Fund Services, LLC (2007-present). | N/A |
| | | |
| Semi-Annual Report | Jensen Quality Value Fund, Jensen Global Quality Growth Fund | 61 |
| | |
| | |
| | Jensen Quality Value Fund
Jensen Global Quality Growth Fund |
| | Class I Shares | Class J Shares | Class Y Shares | |
| | | | | |
| | Investment Adviser
Jensen Investment Management, Inc.
5500 Meadows Road, Suite 200
Lake Oswego, OR 97035
800.992.4144 Fund Administrator, Transfer Agent and Fund Accountant
U.S. Bancorp Fund Services, LLC doing business as
U.S. Bank Global Fund Services
615 East Michigan Street
Milwaukee, WI 53202 Custodian
U.S. Bank, N.A.
Custody Operations
1555 N. RiverCenter Drive, Suite 302
Milwaukee, WI 53212 Legal Counsel
Godfrey & Kahn, S.C.
833 East Michigan Street, Suite 1800
Milwaukee, WI 53202 Independent Registered Public Accounting Firm
Cohen & Company, Ltd.
342 North Water Street, Suite 830
Milwaukee, WI 53202 Distributor
Quasar Distributors, LLC
111 East Kilborn Avenue, Suite 2200
Milwaukee, WI 53202 This report has been prepared for shareholders and may be distributed to others only if preceded or accompanied by a current prospectus. |
| | |
| | jenseninvestment.com |  |
| | | |
(b) Not applicable.
Item 2. Code of Ethics.
Not applicable for semi-annual reports.
Item 3. Audit Committee Financial Expert.
Not applicable for semi-annual reports.
Item 4. Principal Accountant Fees and Services.
Not applicable for semi-annual reports.
Item 5. Audit Committee of Listed Registrants.
Not applicable to registrants who are not listed issuers (as defined in Rule 10A-3 under the Securities Exchange Act of 1934).
Item 6. Investments.
| (a) | Schedule of Investments is included as part of the report to shareholders filed under Item 1 of this Form. |
| | |
| (b) | Not Applicable. |
Item 7. Disclosure of Proxy Voting Policies and Procedures for Closed-End Management Investment Companies.
Not applicable to open-end investment companies.
Item 8. Portfolio Managers of Closed-End Management Investment Companies.
Not applicable to open-end investment companies.
Item 9. Purchases of Equity Securities by Closed-End Management Investment Company and Affiliated Purchasers.
Not applicable to open-end investment companies.
Item 10. Submission of Matters to a Vote of Security Holders.
There have been no material changes to the procedures by which shareholders may recommend nominees to the registrant’s board of trustees.
1
Item 11. Controls and Procedures.
| (a) | The Registrant’s President and Treasurer have reviewed the Registrant’s disclosure controls and procedures (as defined in Rule 30a-3(c) under the Investment Company Act of 1940 (the “Act”)) as of a date within 90 days of the filing of this report, as required by Rule 30a-3(b) under the Act and Rules 13a-15(b) or 15d-15(b) under the Securities Exchange Act of 1934. Based on their review, such officers have concluded that the disclosure controls and procedures are effective in ensuring that information required to be disclosed in this report is appropriately recorded, processed, summarized and reported and made known to them by others within the Registrant and by the Registrant’s service provider. |
| | |
| (b) | There were no changes in the Registrant’s internal control over financial reporting (as defined in Rule 30a-3(d) under the Act) that occurred during the period covered by this report that has materially affected, or is reasonably likely to materially affect, the Registrant’s internal control over financial reporting. |
Item 12. Disclosure of Securities Lending Activities for Closed-End Management Investment Companies.
Not applicable to open-end investment companies.
Item 13. Exhibits.
| (a) | (1) Any code of ethics or amendment thereto, that is the subject of the disclosure required by Item 2, to the extent that the registrant intends to satisfy Item 2 requirements through filing an exhibit. Incorporated by reference to previous Form N-CSR filed August 6, 2020. |
(2) A separate certification for each principal executive officer and principal financial officer pursuant to Section 302 of the Sarbanes-Oxley Act of 2002. Filed herewith.
(3) Any written solicitation to purchase securities under Rule 23c-1 under the Act sent or given during the period covered by the report by or on behalf of the registrant to 10 or more persons. Not applicable to open-end investment companies.
| (4) | Change in the registrant’s independent public accountant. There was no change in the registrant’s independent public accountant for the period covered by this report. |
| | | |
2
SIGNATURES
Pursuant to the requirements of the Securities Exchange Act of 1934 and the Investment Company Act of 1940, the registrant has duly caused this report to be signed on its behalf by the undersigned, thereunto duly authorized.
| | (Registrant) | | Trust for Professional Managers | |
| | | | | |
| | By (Signature and Title)* | /s/ John Buckel | |
| | | John Buckel, President | |
| | | | |
| | Date 1/26/2023 | | |
Pursuant to the requirements of the Securities Exchange Act of 1934 and the Investment Company Act of 1940, this report has been signed below by the following persons on behalf of the registrant and in the capacities and on the dates indicated.
| | By (Signature and Title)* | /s/ John Buckel | |
| | | John Buckel, President | |
| | | | |
| | Date 1/26/2023 | | |
| | | | |
| | By (Signature and Title)* | /s/ Jennifer Lima | |
| | | Jennifer Lima, Treasurer | |
| | | | |
| | Date 1/26/2023 | | |
* Print the name and title of each signing officer under his or her signature.
3