Semi-Annual Report
August 31, 2023
Bright Rock Mid Cap Growth Fund
Institutional Class Shares (BQMGX)
Bright Rock Quality Large Cap Fund
Institutional Class Shares (BQLCX)
Investment Adviser
Bright Rock Capital Management, LLC
2036 Washington Street
Hanover, Massachusetts 02339
Phone: 1-866-273-7223
TABLE OF CONTENTS
| LETTER TO SHAREHOLDERS | | 3 |
| ALLOCATION OF PORTFOLIO HOLDINGS | | 5 |
| EXPENSE EXAMPLES | | 6 |
| INVESTMENT HIGHLIGHTS | | 8 |
| SCHEDULES OF INVESTMENTS | | 10 |
| STATEMENTS OF ASSETS AND LIABILITIES | | 16 |
| STATEMENTS OF OPERATIONS | | 17 |
| STATEMENTS OF CHANGES IN NET ASSETS | | 18 |
| FINANCIAL HIGHLIGHTS | | 20 |
| NOTES TO FINANCIAL STATEMENTS | | 22 |
| BASIS FOR TRUSTEES’ APPROVAL OF | | |
| INVESTMENT ADVISORY AGREEMENT | | 31 |
| STATEMENT REGARDING LIQUIDITY RISK MANAGEMENT | | 36 |
| NOTICE OF PRIVACY POLICY & PRACTICES | | 37 |
| ADDITIONAL INFORMATION | | 38 |
Dear Shareholder:
U.S. Economic and Equity Market Overview
The period from March 1, 2023 to August 31, 2023 saw the U.S. equity market continue to go up, extending the gains that began earlier this year. The Standard and Poor’s 500 (S&P 500) Index recovered strongly in the first half of 2023 as the inflation pressure continued to ease and people expected that the U.S. Federal Reserve (Fed) is at the end of this rate-hike cycle. While the GDP (Gross Domestic Product) growth for most large nations was not particularly strong, it was better than people feared in late 2022, when people were almost certain that a recession in the U.S. would occur in 2023. The unemployment rate rose slightly at the end of August 2023 to 3.8%, though the labor force grew and the rate is almost back to pre-pandemic levels. Q2 2023 real GDP growth increased by 2.4% following a Q1 2023 increase of 2.0%; and annualized CPI (Consumer Price Index) dropped to 3.7% in August 2023 from the pandemic-era peak of 9.1%. These economic data points all encouraged the Federal Reserve to decelerate the rate hikes as inflation has eased and there is still some concern about whether a recession will hit the U.S. later this year. Projections released in the Fed’s dot plot showed the likelihood of one more increase this year, then two cuts in 2024. That would put the Fed funds rate around 5.1%. Equity markets embraced the likelihood of the end of the rate hikes and possible rate cuts in 2024, which will lower the discount rate and drive the valuations higher.
Bright Rock Fund Overviews
Quality Large Cap Fund:
For the six-month period ended August 31, 2023, the Fund returned 13.86%, underperforming the 14.50% return of the S&P 500 Index over the same six-month period. The Fund’s sector allocation coupled with the significant gains of some technology stocks that the Fund’s portfolio was underweight explains the majority of the relative underperformance between the Fund and the S&P 500 Index returns.
The underperformance between the Fund and the S&P 500 Index returns was mostly driven by the underweight of the Information Technology sector and the underweight of several stocks that had huge gains of more than 30%. All sectors in the S&P 500 Index produced positive returns over the past six months, with the exception of Utilities (-1.65%). Information Technology (+33.11%) led the outperforming sectors. In terms of specific stocks held within the Fund, notable outperformers were Meta (+69.14%), Alphabet (+51.20%), and Intuit (+33.53%), while notable underperformers included Nike (-13.87%), Toro (-6.72%), and Verizon Communications (-8.28%).
Mid Cap Growth Fund:
For the six-month period ended August 31, 2023, the Fund returned 1.67%, underperforming the 7.30% return of the Russell Mid Cap Growth Total Return Index (the “Russell Index”) over the same six-month period. Stock selection was the biggest cause of the underperformance between the Fund and the Russell Index returns coupled with the Fund’s portfolio bias toward more equal sector weighting.
The Fund’s underweight to Healthcare was the biggest sector contributor to performance over the six-month period. From a stock selection standpoint, we picked stocks well in the Financial Services sector, but struggled in the Information Technology sector. Notable outperformers were Arista Network (+40.76%) and Copart (+27.25%), while notable underperformers included Dollar General (-35.57%) and Enphase Energy (-39.90%).
Sincerely,
 |  |
| David B. Smith, CFA | Doug Butler |
| Chief Investment Officer | Director of Research |
| Bright Rock Capital Management | Bright Rock Capital Management |
Past performance is not a guarantee of future results.
CPI, the Consumer Price Index, is an inflation metric that measures prices across a basket of consumer goods and services purchased by households.
BPs, or Basis Points, is a common unit of measure for interest rates and other percentages in finance. It is equivalent to one hundredth of one percent (1/100).
GDP, or Gross Domestic Product, is the total monetary or market value of all the finished goods and services produced within a country’s borders in a specific time period.
The S&P 500® Index is a cap weighted index of large-cap U.S. equities. The index includes 500 leading companies and captures approximately 80% coverage of available market capitalization.
Russell Midcap Growth Total Return Index is an unmanaged index that measures the performance of those Russell Midcap companies with higher price-to-book ratios and higher forecasted growth values.
One cannot invest directly in an index.
Opinions expressed are those of Bright Rock Capital Management, LLC and are subject to change, are not guaranteed and should not be considered investment advice.
Mutual fund investing involves risk. Principal loss is possible. Investments in mid cap companies can involve additional risks such as limited liquidity and greater volatility. Investments in foreign securities can exhibit greater volatility. Additional risks include political, economic, and currency risks as well as differences in accounting methods. These risks can be greater for investments in emerging markets. Shareholders will pay higher expenses than would be the case if a Fund makes a direct investment in underlying mutual funds or exchange-traded funds (“ETFs”). Because the Funds may invest in ETFs, they may be subject to additional risks that do not apply to conventional mutual funds, including the risks that the market price of an ETF’s shares may trade at a discount to its net asset value (“NAV”), an active secondary trading market may not develop or be maintained, or trading may be halted by the exchange on which they trade, which may impact a Fund’s ability to sell its shares. The prices of growth stocks may be more sensitive to changes in current or expected earnings than the prices of other stocks. Value stocks may perform differently from the market as a whole and may continue to be undervalued by the market for long periods of time.
Fund holdings and sector allocations are subject to change and should not be considered a recommendation to buy or sell any security. For a complete list of Fund holdings, please refer to the Schedule of Investments included in this report.
Must be preceded or accompanied by a prospectus.
The Bright Rock Funds are distributed by Quasar Distributors, LLC.
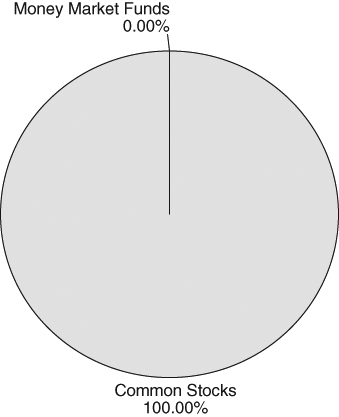
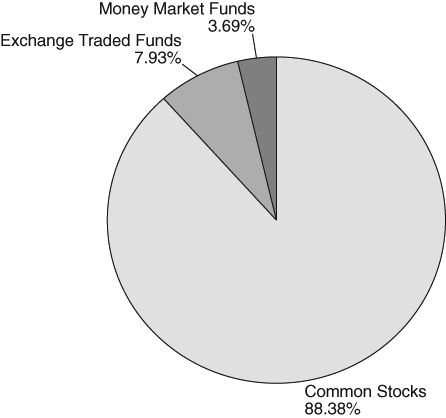
Bright Rock Funds
Allocation of Portfolio Holdings as of August 31, 2023
Bright Rock Mid Cap Growth Fund
(% of Investments)
Bright Rock Quality Large Cap Fund
(% of Investments)
Bright Rock Funds
Expense Examples (Unaudited)
As a shareholder of the Funds, you incur two types of costs: (1) transaction costs and (2) ongoing costs, including management fees and other Fund expenses. These Examples are intended to help you understand your ongoing costs (in dollars) of investing in the Funds, and to compare these costs with the ongoing costs of investing in other mutual funds. The Examples are based on an investment of $1,000 invested at the beginning of the period and held for the entire period (March 1, 2023 – August 31, 2023).
Actual Expenses
The first line of each of the following tables below provides information about actual account values and actual expenses. Although the Funds charge no sales load, you will be assessed fees for outgoing wire transfers, returned checks and stop payment orders at prevailing rates charged by U.S. Bancorp Fund Services, LLC, the Funds’ transfer agent. If you request that a redemption be made by wire transfer, currently a $15.00 fee is charged by the Funds’ transfer agent. IRA accounts will be charged a $15.00 annual maintenance fee. To the extent the Funds invest in shares of ETFs or other investment companies as part of their investment strategies, you will indirectly bear your proportionate share of any fees and expenses charged by the underlying funds in which the Funds invest in addition to the expenses of the Funds. Actual expenses of the underlying funds are expected to vary among the various underlying funds. These expenses are not included in the Examples. The Examples include, but are not limited to, management fees, fund administration and accounting, custody and transfer agent fees. You may use the information in the first line, together with the amount you invested, to estimate the expenses that you paid over the period. Simply divide your account value by $1,000 (for example, an $8,600 account value divided by $1,000 = 8.6), then multiply the result by the number in the first line under the heading entitled “Expenses Paid During Period” to estimate the expenses you paid on your account during this period.
Hypothetical Example for Comparison Purposes
The second line of each of the following tables below provides information about hypothetical account values and hypothetical expenses based on the Funds’ actual expense ratios and an assumed rate of return of 5% per year before expenses, which are not the Funds’ actual returns. The hypothetical account values and expenses may not be used to estimate the actual ending account balance or expenses you paid for the period. You may use this information to compare the ongoing costs of investing in the Funds and other funds. To do so, compare this 5% hypothetical example with the 5% hypothetical examples that appear in the shareholder reports of other funds. Please note that the expenses shown in the tables are meant to highlight your ongoing costs only and do not reflect any transactional costs, such as sales charges (loads), redemption fees or exchange fees. Therefore, the second line of the table is useful in comparing ongoing costs only,
Bright Rock Funds
Expense Examples (Unaudited) (Continued)
and will not help you determine the relative total costs of owning different funds. In addition, if these transactional costs were included, your costs would have been higher.
| | Mid Cap Growth Fund – Institutional Class |
| | | | Expenses Paid |
| | Beginning | Ending | During Period |
| | Account Value | Account Value | March 1, 2023 – |
| | March 1, 2023 | August 31, 2023 | August 31, 2023* |
| Actual | $1,000.00 | $1,016.70 | $5.78 |
| Hypothetical (5% return | | | |
| before expenses) | $1,000.00 | $1,019.41 | $5.79 |
| * | Expenses are equal to the Institutional Class’ annualized expense ratio of 1.14%, multiplied by the average account value over the period, multiplied by 184/366 to reflect the one-half year period. |
| | Quality Large Cap Fund – Institutional Class |
| | | | Expenses Paid |
| | Beginning | Ending | During Period |
| | Account Value | Account Value | March 1, 2023 – |
| | March 1, 2023 | August 31, 2023 | August 31, 2023* |
| Actual | $1,000.00 | $1,138.60 | $4.73 |
| Hypothetical (5% return | | | |
| before expenses) | $1,000.00 | $1,020.71 | $4.47 |
| * | Expenses are equal to the Institutional Class’ annualized expense ratio of 0.88%, multiplied by the average account value over the period, multiplied by 184/366 to reflect the one-half year period. |
Bright Rock Mid Cap Growth Fund
Investment Highlights (Unaudited)
Average Annual Returns – For Periods Ended August 31, 2023
| | One | Three | Five | Ten |
| | Year | Years | Years | Years |
| Bright Rock Mid Cap Growth Fund | | | | |
| Institutional Class | 7.34% | 6.62% | 8.14% | 10.35% |
Russell Midcap® Growth Total Return Index | 13.00% | 3.84% | 7.95% | 11.03% |
Performance data quoted represents past performance and does not guarantee future results. The investment return and principal value of an investment will fluctuate so that an investor’s shares, when redeemed, may be worth more or less than their original cost. Current performance of the Fund may be lower or higher than the performance quoted. Performance data current to the most recent month end may be obtained by calling 1-866-273-7223.
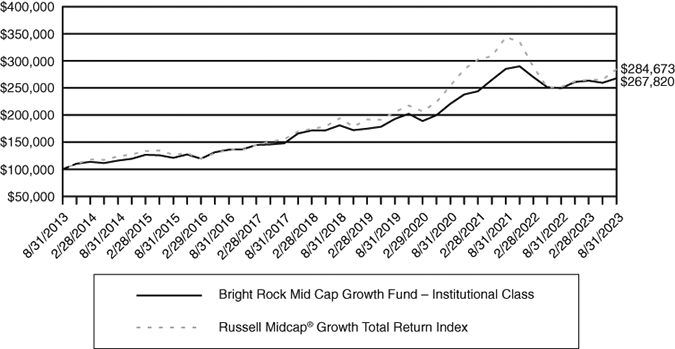
Per the Prospectus dated June 28, 2023, the Fund’s expense ratio is 1.13% for Institutional Class shares. Please see the Financial Highlights in this report for the most recent expense ratio. The returns shown in the table and graph assume reinvestment of Fund distributions and do not reflect the deduction of taxes that a shareholder would pay on Fund distributions or the redemption of Fund shares. The graph illustrates performance of a hypothetical investment made in the Fund and a broad-based securities index ten years ago. The graph does not reflect any future performance.
The Russell Midcap® Growth Total Return Index measures the performance of the mid-cap growth segment of the U.S. equity universe. One cannot invest directly in an index.
Bright Rock Mid Cap Growth Fund – Institutional Class
Growth of $100,000 Investment
Bright Rock Quality Large Cap Fund
Investment Highlights (Unaudited)
Average Annual Returns – For Periods Ended August 31, 2023
| | One | Three | Five | Ten |
| | Year | Years | Years | Years |
| Bright Rock Quality Large Cap Fund | | | | |
| Institutional Class | 17.80% | 12.81% | 11.24% | 10.79% |
S&P 500® Total Return Index | 15.94% | 10.52% | 11.12% | 12.81% |
Performance data quoted represents past performance and does not guarantee future results. The investment return and principal value of an investment will fluctuate so that an investor’s shares, when redeemed, may be worth more or less than their original cost. Current performance of the Fund may be lower or higher than the performance quoted. Performance data current to the most recent month end may be obtained by calling 1-866-273-7223.
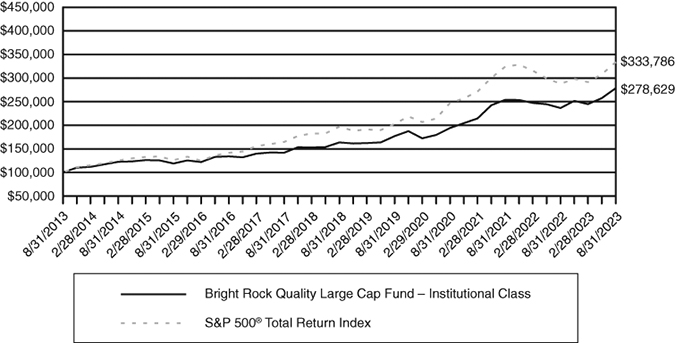
Per the Prospectus dated June 28, 2023, the Fund’s expense ratio is 0.91% for Institutional Class shares. Please see the Financial Highlights in this report for the most recent expense ratio. The returns shown in the table and graph assume reinvestment of Fund distributions and do not reflect the deduction of taxes that a shareholder would pay on Fund distributions or the redemption of Fund shares. The graph illustrates performance of a hypothetical investment made in the Fund and a broad-based securities index ten years ago. The graph does not reflect any future performance.
The S&P 500® Total Return Index is a broad-based unmanaged index of 500 stocks, which is widely recognized as representative of the equity market in general. One cannot invest directly in an index.
Bright Rock Quality Large Cap Fund – Institutional Class
Growth of $100,000 Investment
Bright Rock Mid Cap Growth Fund
Schedule of Investments
August 31, 2023 (Unaudited)
| | | Shares | | | Value | |
| COMMON STOCKS – 100.11% | | | | | | |
| | | | | | | |
| Automobile Components – 2.30% | | | | | | |
| Gentex Corp. | | | 60,000 | | | $ | 1,959,600 | |
| | | | | | | | | |
| Beverages – 5.87% | | | | | | | | |
| Brown-Forman Corp. – Class B | | | 29,500 | | | | 1,950,835 | |
| Monster Beverage Corp. (a) | | | 53,000 | | | | 3,042,730 | |
| | | | | | | | 4,993,565 | |
| Capital Markets – 7.83% | | | | | | | | |
| FactSet Research Systems, Inc. | | | 6,000 | | | | 2,618,460 | |
| Morningstar, Inc. | | | 10,000 | | | | 2,326,700 | |
| SEI Investments Co. | | | 27,600 | | | | 1,712,856 | |
| | | | | | | | 6,658,016 | |
| Chemicals – 5.66% | | | | | | | | |
| Eastman Chemical Co. | | | 20,000 | | | | 1,700,200 | |
| Scotts Miracle-Gro Co. | | | 55,000 | | | | 3,116,300 | |
| | | | | | | | 4,816,500 | |
| Commercial Services & Supplies – 9.72% | | | | | | | | |
| Copart, Inc. (a) | | | 140,000 | | | | 6,276,200 | |
| Rollins, Inc. | | | 50,250 | | | | 1,988,392 | |
| | | | | | | | 8,264,592 | |
| Communications Equipment – 3.44% | | | | | | | | |
| Arista Networks, Inc. (a) | | | 15,000 | | | | 2,928,450 | |
| | | | | | | | | |
| Consumer Staples Distribution & Retail – 0.82% | | | | | | | | |
| Dollar General Corp. | | | 5,000 | | | | 692,500 | |
| | | | | | | | | |
| Containers & Packaging – 3.51% | | | | | | | | |
| AptarGroup, Inc. | | | 22,500 | | | | 2,982,600 | |
| | | | | | | | | |
| Electrical Equipment – 3.75% | | | | | | | | |
| AMETEK, Inc. | | | 20,000 | | | | 3,190,200 | |
| | | | | | | | | |
| Electronic Equipment, Instruments & Components – 3.53% | | | | | | | | |
| Amphenol Corp. – Class A | | | 34,000 | | | | 3,004,920 | |
| | | | | | | | | |
| Financial Services – 3.61% | | | | | | | | |
| Jack Henry & Associates, Inc. | | | 19,600 | | | | 3,072,888 | |
The accompanying notes are an integral part of these financial statements.
Bright Rock Mid Cap Growth Fund
Schedule of Investments (Continued)
August 31, 2023 (Unaudited)
| | | Shares | | | Value | |
| Food Products – 5.05% | | | | | | |
| Hershey Co. | | | 20,000 | | | $ | 4,297,200 | |
| | | | | | | | | |
| Ground Transportation – 2.32% | | | | | | | | |
| JB Hunt Transport Services, Inc. | | | 10,500 | | | | 1,972,740 | |
| | | | | | | | | |
| Health Care Equipment & Supplies – 9.37% | | | | | | | | |
| Edwards Lifesciences Corp. (a) | | | 25,000 | | | | 1,911,750 | |
| IDEXX Laboratories, Inc. (a) | | | 7,000 | | | | 3,579,870 | |
| ResMed, Inc. | | | 15,500 | | | | 2,473,645 | |
| | | | | | | | 7,965,265 | |
| Hotels, Restaurants & Leisure – 1.36% | | | | | | | | |
| Chipotle Mexican Grill, Inc. (a) | | | 600 | | | | 1,155,984 | |
| | | | | | | | | |
| Household Products – 2.30% | | | | | | | | |
| Clorox Co. | | | 12,500 | | | | 1,955,625 | |
| | | | | | | | | |
| Insurance – 2.03% | | | | | | | | |
| Arthur J Gallagher & Co. | | | 7,500 | | | | 1,728,600 | |
| | | | | | | | | |
| Life Sciences Tools & Services – 4.23% | | | | | | | | |
| Repligen Corp. (a) | | | 9,000 | | | | 1,565,190 | |
| West Pharmaceutical Services, Inc. | | | 5,000 | | | | 2,034,500 | |
| | | | | | | | 3,599,690 | |
| Oil, Gas & Consumable Fuels – 6.25% | | | | | | | | |
| Coterra Energy, Inc. | | | 50,000 | | | | 1,409,500 | |
| ONEOK, Inc. | | | 59,850 | | | | 3,902,220 | |
| | | | | | | | 5,311,720 | |
| Semiconductors & Semiconductor Equipment – 4.49% | | | | | | | | |
| Analog Devices, Inc. | | | 15,800 | | | | 2,872,124 | |
| Enphase Energy, Inc. (a) | | | 7,500 | | | | 948,975 | |
| | | | | | | | 3,821,099 | |
| Software – 2.93% | | | | | | | | |
| Tyler Technologies, Inc. (a) | | | 6,250 | | | | 2,490,188 | |
| | | | | | | | | |
| Specialty Retail – 6.30% | | | | | | | | |
| Floor & Decor Holdings, Inc. – Class A (a) | | | 11,000 | | | | 1,096,700 | |
| Tractor Supply Co. | | | 19,500 | | | | 4,260,750 | |
| | | | | | | | 5,357,450 | |
The accompanying notes are an integral part of these financial statements.
Bright Rock Mid Cap Growth Fund
Schedule of Investments (Continued)
August 31, 2023 (Unaudited)
| | | Shares | | | Value | |
| Trading Companies & Distributors – 3.44% | | | | | | |
| Fastenal Co. | | | 50,800 | | | $ | 2,925,064 | |
| TOTAL COMMON STOCKS (Cost $40,648,706) | | | | | | | 85,144,456 | |
| | | | | | | | | |
| MONEY MARKET FUNDS – 0.00% | | | | | | | | |
| Morgan Stanley Institutional Liquidity Funds – | | | | | | | | |
| Government Portfolio, Institutional Class, 5.247% (b) | | | 129 | | | | 129 | |
| TOTAL MONEY MARKET FUNDS (Cost $129) | | | | | | | 129 | |
| | | | | | | | | |
| Total Investments (Cost $40,648,835) – 100.11% | | | | | | | 85,144,585 | |
| Liabilities in Excess of Other Assets – (0.11)% | | | | | | | (97,693 | ) |
| TOTAL NET ASSETS – 100.00% | | | | | | $ | 85,046,892 | |
Percentages are stated as a percent of net assets.
| (a) | Non-income producing security. |
| (b) | The rate shown represents the seven-day yield as of August 31, 2023. |
The Global Industry Classification Standard (GICS®) was developed by and/or is the exclusive property of MSCI, Inc. (“MSCI”) and Standard & Poor’s Financial Services LLC (“S&P”). GICS is a service mark of MSCI and S&P and has been licensed for use by U.S. Bancorp Fund Services, LLC.
The accompanying notes are an integral part of these financial statements.
Bright Rock Quality Large Cap Fund
Schedule of Investments
August 31, 2023 (Unaudited)
| | | Shares | | | Value | |
| COMMON STOCKS – 88.32% | | | | | | |
| | | | | | | |
| Banks – 3.51% | | | | | | |
| JPMorgan Chase & Co. | | | 85,000 | | | $ | 12,438,050 | |
| | | | | | | | | |
| Beverages – 2.26% | | | | | | | | |
| PepsiCo, Inc. | | | 45,000 | | | | 8,006,400 | |
| | | | | | | | | |
| Capital Markets – 2.02% | | | | | | | | |
| BlackRock, Inc. | | | 5,500 | | | | 3,852,970 | |
| S&P Global, Inc. | | | 8,500 | | | | 3,322,310 | |
| | | | | | | | 7,175,280 | |
| Chemicals – 3.24% | | | | | | | | |
| Ecolab, Inc. | | | 20,500 | | | | 3,768,105 | |
| Linde PLC | | | 20,000 | | | | 7,740,800 | |
| | | | | | | | 11,508,905 | |
| Commercial Services & Supplies – 1.42% | | | | | | | | |
| Copart, Inc. (a) | | | 112,000 | | | | 5,020,960 | |
| | | | | | | | | |
| Consumer Staples Distribution & Retail – 2.43% | | | | | | | | |
| Walmart, Inc. | | | 53,000 | | | | 8,618,330 | |
| | | | | | | | | |
| Diversified Telecommunication Services – 1.68% | | | | | | | | |
| Verizon Communications, Inc. | | | 170,000 | | | | 5,946,600 | |
| | | | | | | | | |
| Electric Utilities – 0.75% | | | | | | | | |
| NextEra Energy, Inc. | | | 40,000 | | | | 2,672,000 | |
| | | | | | | | | |
| Financial Services – 9.64% | | | | | | | | |
| Berkshire Hathaway, Inc. (a) | | | 40,000 | | | | 14,408,000 | |
| Mastercard, Inc. | | | 45,000 | | | | 18,568,800 | |
| Visa, Inc. – Class A | | | 5,000 | | | | 1,228,400 | |
| | | | | | | | 34,205,200 | |
| Ground Transportation – 2.08% | | | | | | | | |
| Union Pacific Corp. | | | 33,500 | | | | 7,389,095 | |
| | | | | | | | | |
| Health Care Providers & Services – 3.36% | | | | | | | | |
| UnitedHealth Group, Inc. | | | 25,000 | | | | 11,914,500 | |
| | | | | | | | | |
| Health Care Technology – 1.59% | | | | | | | | |
| Veeva Systems, Inc. – Class A (a) | | | 27,000 | | | | 5,634,900 | |
The accompanying notes are an integral part of these financial statements.
Bright Rock Quality Large Cap Fund
Schedule of Investments (Continued)
August 31, 2023 (Unaudited)
| | | Shares | | | Value | |
| Household Products – 2.57% | | | | | | |
| Colgate-Palmolive Co. | | | 124,000 | | | $ | 9,110,280 | |
| | | | | | | | | |
| Insurance – 3.11% | | | | | | | | |
| Chubb Ltd. | | | 55,000 | | | | 11,047,850 | |
| | | | | | | | | |
| Interactive Media & Services – 8.81% | | | | | | | | |
| Alphabet, Inc. – Class A (a) | | | 160,000 | | | | 21,787,200 | |
| Meta Platforms, Inc. – Class A (a) | | | 32,000 | | | | 9,468,480 | |
| | | | | | | | 31,255,680 | |
| IT Services – 2.56% | | | | | | | | |
| Accenture PLC – Class A | | | 28,000 | | | | 9,065,560 | |
| | | | | | | | | |
| Life Sciences Tools & Services – 5.89% | | | | | | | | |
| Danaher Corp. | | | 42,000 | | | | 11,130,000 | |
| Thermo Fisher Scientific, Inc. | | | 9,500 | | | | 5,292,450 | |
| West Pharmaceutical Services, Inc. | | | 11,000 | | | | 4,475,900 | |
| | | | | | | | 20,898,350 | |
| Machinery – 1.87% | | | | | | | | |
| Toro Co. | | | 65,000 | | | | 6,650,800 | |
| | | | | | | | | |
| Multi-Utilities – 1.46% | | | | | | | | |
| Sempra Energy | | | 74,000 | | | | 5,196,280 | |
| | | | | | | | | |
| Oil, Gas & Consumable Fuels – 1.60% | | | | | | | | |
| EOG Resources, Inc. | | | 20,000 | | | | 2,572,400 | |
| Exxon Mobil Corp. | | | 28,000 | | | | 3,113,320 | |
| | | | | | | | 5,685,720 | |
| Pharmaceuticals – 3.44% | | | | | | | | |
| Merck & Co., Inc. | | | 112,000 | | | | 12,205,760 | |
| | | | | | | | | |
| Professional Services – 2.37% | | | | | | | | |
| Automatic Data Processing, Inc. | | | 33,000 | | | | 8,402,130 | |
| | | | | | | | | |
| Semiconductors & Semiconductor Equipment – 1.90% | | | | | | | | |
| Texas Instruments, Inc. | | | 40,000 | | | | 6,722,400 | |
| | | | | | | | | |
| Software – 9.58% | | | | | | | | |
| Intuit, Inc. | | | 15,000 | | | | 8,127,150 | |
| Microsoft Corp. | | | 66,000 | | | | 21,632,160 | |
The accompanying notes are an integral part of these financial statements.
Bright Rock Quality Large Cap Fund
Schedule of Investments (Continued)
August 31, 2023 (Unaudited)
| | | Shares | | | Value | |
| Software – 9.58% (Continued) | | | | | | |
| Roper Technologies, Inc. | | | 8,500 | | | $ | 4,242,010 | |
| | | | | | | | 34,001,320 | |
| Specialty Retail – 5.30% | | | | | | | | |
| Home Depot, Inc. | | | 33,000 | | | | 10,899,900 | |
| TJX Cos., Inc. | | | 85,547 | | | | 7,911,386 | |
| | | | | | | | 18,811,286 | |
| Technology Hardware, Storage & Peripherals – 2.65% | | | | | | | | |
| Apple, Inc. | | | 50,000 | | | | 9,393,500 | |
| | | | | | | | | |
| Textiles, Apparel & Luxury Goods – 1.23% | | | | | | | | |
| NIKE, Inc. – Class B | | | 43,000 | | | | 4,373,530 | |
| TOTAL COMMON STOCKS (Cost $209,071,687) | | | | | | | 313,350,666 | |
| | | | | | | | | |
| EXCHANGE TRADED FUNDS – 7.92% | | | | | | | | |
| iShares U.S. Energy ETF | | | 300,000 | | | | 14,055,000 | |
| Technology Select Sector SPDR Fund | | | 80,000 | | | | 14,052,800 | |
| TOTAL EXCHANGE TRADED FUNDS (Cost $11,836,093) | | | | | | | 28,107,800 | |
| | | | | | | | | |
| MONEY MARKET FUNDS – 3.69% | | | | | | | | |
| Morgan Stanley Institutional Liquidity Funds – | | | | | | | | |
| Government Portfolio, Institutional Class, 5.247% (b) | | | 13,083,735 | | | | 13,083,735 | |
| TOTAL MONEY MARKET FUNDS (Cost $13,083,735) | | | | | | | 13,083,735 | |
| | | | | | | | | |
| Total Investments (Cost $233,991,515) – 99.93% | | | | | | | 354,542,201 | |
| Other Assets in Excess of Liabilities – 0.07% | | | | | | | 261,368 | |
| TOTAL NET ASSETS – 100.00% | | | | | | $ | 354,803,569 | |
Percentages are stated as a percent of net assets.
| PLC | Public Limited Company |
| SPDR | Standard & Poor’s Depositary Receipt |
| (a) | Non-income producing security. |
| (b) | The rate shown represents the seven-day yield as of August 31, 2023. |
The Global Industry Classification Standard (GICS®) was developed by and/or is the exclusive property of MSCI, Inc. (“MSCI”) and Standard & Poor’s Financial Services LLC (“S&P”). GICS is a service mark of MSCI and S&P and has been licensed for use by U.S. Bancorp Fund Services, LLC.
The accompanying notes are an integral part of these financial statements.
Bright Rock Funds
Statements of Assets and Liabilities
August 31, 2023 (Unaudited)
| | | Mid Cap | | | Quality Large | |
| | | Growth Fund | | | Cap Fund | |
| ASSETS | | | | | | |
| Investments, at value: | | | | | | |
| (Cost $40,648,835 and $233,991,515) | | $ | 85,144,585 | | | $ | 354,542,201 | |
| Receivable for Fund shares sold | | | 12,839 | | | | 206,549 | |
| Dividends and interest receivable | | | 109,083 | | | | 347,620 | |
| Other assets | | | 24,199 | | | | 13,741 | |
| TOTAL ASSETS | | | 85,290,706 | | | | 355,110,111 | |
| | | | | | | | | |
| LIABILITIES | | | | | | | | |
| Payable for Fund shares redeemed | | | 13,798 | | | | 40,497 | |
| Payable to affiliates | | | 15,244 | | | | 45,625 | |
| Payable to Adviser | | | 54,051 | | | | 185,729 | |
| Payable to auditor | | | 18,202 | | | | 18,211 | |
| Payable to line of credit | | | 125,000 | | | | — | |
| Accrued expenses and other liabilities | | | 17,519 | | | | 16,480 | |
| TOTAL LIABILITIES | | | 243,814 | | | | 306,542 | |
| NET ASSETS | | $ | 85,046,892 | | | $ | 354,803,569 | |
| | | | | | | | | |
| Net assets consist of: | | | | | | | | |
| Paid-in capital | | $ | 40,490,881 | | | $ | 222,355,592 | |
| Total distributable earnings | | | 44,556,011 | | | | 132,447,977 | |
| NET ASSETS | | $ | 85,046,892 | | | $ | 354,803,569 | |
| | | | | | | | | |
| INSTITUTIONAL CLASS SHARES | | | | | | | | |
| Net assets | | $ | 85,046,892 | | | $ | 354,803,569 | |
| Shares of beneficial interest outstanding (unlimited | | | | | | | | |
| number of shares authorized, $0.001 par value) | | | 3,880,680 | | | | 17,335,091 | |
| Net asset value, redemption price | | | | | | | | |
| and offering price per share | | $ | 21.92 | | | $ | 20.47 | |
The accompanying notes are an integral part of these financial statements.
Bright Rock Funds
Statements of Operations
For the Six Months Ended August 31, 2023 (Unaudited)
| | | Mid Cap | | | Quality Large | |
| | | Growth Fund | | | Cap Fund | |
| INVESTMENT INCOME | | | | | | |
| Dividend income | | $ | 587,998 | | | $ | 2,679,220 | |
| Interest income | | | 38,885 | | | | 99,780 | |
| TOTAL INVESTMENT INCOME | | | 626,883 | | | | 2,779,000 | |
| | | | | | | | | |
| EXPENSES | | | | | | | | |
| Management fees | | | 356,099 | | | | 1,065,847 | |
| Administration fees | | | 52,074 | | | | 143,594 | |
| Fund accounting fees | | | 22,153 | | | | 58,844 | |
| Transfer agent fees and expenses | | | 19,083 | | | | 70,457 | |
| Federal and state registration fees | | | 18,973 | | | | 21,049 | |
| Audit and tax fees | | | 18,540 | | | | 18,540 | |
| Trustees’ fees | | | 11,830 | | | | 12,835 | |
| Legal fees | | | 8,796 | | | | 13,922 | |
| Reports to shareholders | | | 6,623 | | | | 5,173 | |
| Chief Compliance Officer fees | | | 6,256 | | | | 6,256 | |
| Custody fees | | | 5,161 | | | | 16,991 | |
| Insurance expense | | | 1,787 | | | | 3,342 | |
| Interest expense | | | 43 | | | | — | |
| Other expenses | | | 13,635 | | | | 4,922 | |
| TOTAL EXPENSES | | | 541,053 | | | | 1,441,772 | |
| NET INVESTMENT INCOME | | | 85,830 | | | | 1,337,228 | |
| | | | | | | | | |
| REALIZED AND UNREALIZED | | | | | | | | |
| GAIN (LOSS) ON INVESTMENTS | | | | | | | | |
| Net realized gain on investments | | | 6,716 | | | | 7,237,830 | |
| Net change in unrealized appreciation | | | | | | | | |
| (depreciation) on investments | | | 1,678,838 | | | | 33,338,069 | |
| NET REALIZED AND UNREALIZED | | | | | | | | |
| GAIN ON INVESTMENTS | | | 1,685,554 | | | | 40,575,899 | |
| NET INCREASE IN NET ASSETS | | | | | | | | |
| FROM OPERATIONS | | $ | 1,771,384 | | | $ | 41,913,127 | |
The accompanying notes are an integral part of these financial statements.
Bright Rock Mid Cap Growth Fund
Statements of Changes in Net Assets
| | | Six Months Ended | | | | |
| | | August 31, 2023 | | | Year Ended | |
| | | (Unaudited) | | | February 28, 2023 | |
| FROM OPERATIONS | | | | | | |
| Net income (loss) | | $ | 85,830 | | | $ | (38,461 | ) |
| Net realized gain (loss) on investments | | | 6,716 | | | | (17,995 | ) |
| Net change in unrealized appreciation | | | | | | | | |
| (depreciation) on investments | | | 1,678,838 | | | | (1,627,457 | ) |
| Net increase (decrease) in | | | | | | | | |
| net assets from operations | | | 1,771,384 | | | | (1,683,913 | ) |
| | | | | | | | | |
| FROM DISTRIBUTIONS | | | | | | | | |
| Net dividends and distributions – | | | | | | | | |
| Institutional Class | | | — | | | | (4,842,743 | ) |
| Net decrease in net assets | | | | | | | | |
| resulting from distributions paid | | | — | | | | (4,842,743 | ) |
| | | | | | | | | |
| FROM CAPITAL SHARE TRANSACTIONS | | | | | | | | |
| Proceeds from shares sold – | | | | | | | | |
| Institutional Class | | | 4,454,777 | | | | 17,356,736 | |
| Payments for shares redeemed – | | | | | | | | |
| Institutional Class | | | (16,056,539 | ) | | | (11,193,100 | ) |
| Net asset value of shares issued in | | | | | | | | |
| reinvestment of distributions to | | | | | | | | |
| shareholders – Institutional Class | | | — | | | | 4,835,469 | |
| Net increase (decrease) in net assets | | | | | | | | |
| from capital share transactions | | | (11,601,762 | ) | | | 10,999,105 | |
| TOTAL INCREASE | | | | | | | | |
| (DECREASE) IN NET ASSETS | | | (9,830,378 | ) | | | 4,472,449 | |
| NET ASSETS | | | | | | | | |
| Beginning of Period | | | 94,877,270 | | | | 90,404,821 | |
| End of Period | | $ | 85,046,892 | | | $ | 94,877,270 | |
The accompanying notes are an integral part of these financial statements.
Bright Rock Quality Large Cap Fund
Statements of Changes in Net Assets
| | | Six Months Ended | | | | |
| | | August 31, 2023 | | | Year Ended | |
| | | (Unaudited) | | | February 28, 2023 | |
| FROM OPERATIONS | | | | | | |
| Net investment income | | $ | 1,337,228 | | | $ | 2,428,872 | |
| Net realized gain on investments | | | 7,237,830 | | | | 26,800,092 | |
| Net change in unrealized appreciation | | | | | | | | |
| (depreciation) on investments | | | 33,338,069 | | | | (32,345,557 | ) |
| Net increase (decrease) in | | | | | | | | |
| net assets from operations | | | 41,913,127 | | | | (3,116,593 | ) |
| | | | | | | | | |
| FROM DISTRIBUTIONS | | | | | | | | |
| Net dividends and distributions – | | | | | | | | |
| Institutional Class | | | (1,082,626 | ) | | | (41,593,869 | ) |
| Net decrease in net assets | | | | | | | | |
| resulting from distributions paid | | | (1,082,626 | ) | | | (41,593,869 | ) |
| | | | | | | | | |
| FROM CAPITAL SHARE TRANSACTIONS | | | | | | | | |
| Proceeds from shares sold – | | | | | | | | |
| Institutional Class | | | 27,134,747 | | | | 41,359,069 | |
| Payments for shares redeemed – | | | | | | | | |
| Institutional Class | | | (20,586,920 | ) | | | (49,676,596 | ) |
| Net asset value of shares issued in | | | | | | | | |
| reinvestment of distributions to | | | | | | | | |
| shareholders – Institutional Class | | | 360,563 | | | | 39,601,942 | |
| Net increase in net assets | | | | | | | | |
| from capital share transactions | | | 6,908,390 | | | | 31,284,415 | |
| TOTAL INCREASE | | | | | | | | |
| (DECREASE) IN NET ASSETS | | | 47,738,891 | | | | (13,426,047 | ) |
| NET ASSETS | | | | | | | | |
| Beginning of Period | | | 307,064,678 | | | | 320,490,725 | |
| End of Period | | $ | 354,803,569 | | | $ | 307,064,678 | |
The accompanying notes are an integral part of these financial statements.
Bright Rock Mid Cap Growth Fund – Institutional Class
Financial Highlights
Per Share Data for a Share Outstanding Throughout Each Period
| | | For the | | | | | | | | | | | | | | | | |
| | | Six Months | | | | | | | | | | | | Year | | | Year | |
| | | Ended | | | Year Ended February 28, | | | Ended | | | Ended | |
| | | August 31, | | | | | February | | | February | |
| | | 2023 | | | | | 29, | | | 28, | |
| | | (Unaudited) | | | 2023 | | | 2022 | | | 2021 | | | 2020 | | | 2019 | |
| Net Asset Value, | | | | | | | | | | | | | | | | | | | | |
| Beginning of Period | | $ | 21.56 | | | $ | 23.35 | | | $ | 22.90 | | | $ | 18.67 | | | $ | 17.89 | | | $ | 17.56 | |
| | | | | | | | | | | | | | | | | | | | | | | | | |
| Income (loss) from | | | | | | | | | | | | | | | | | | | | | | | | |
| investment operations: | | | | | | | | | | | | | | | | | | | | | | | | |
Net investment income (loss)(1) | | | 0.02 | | | | (0.01 | ) | | | (0.07 | ) | | | (0.06 | ) | | | (0.07 | ) | | | 0.02 | |
| Net realized and unrealized | | | | | | | | | | | | | | | | | | | | | | | | |
| gain (loss) on investments | | | 0.34 | | | | (0.59 | ) | | | 2.65 | | | | 5.52 | | | | 1.56 | | | | 0.31 | |
| Total from investment operations | | | 0.36 | | | | (0.60 | ) | | | 2.58 | | | | 5.46 | | | | 1.49 | | | | 0.33 | |
| | | | | | | | | | | | | | | | | | | | | | | | | |
| Less distributions paid: | | | | | | | | | | | | | | | | | | | | | | | | |
| From investment income | | | — | | | | — | | | | — | | | | — | | | | (0.02 | ) | | | — | |
| From net realized | | | | | | | | | | | | | | | | | | | | | | | | |
| gain on investments | | | — | | | | (1.19 | ) | | | (2.13 | ) | | | (1.23 | ) | | | (0.69 | ) | | | — | |
| Total distributions paid | | | — | | | | (1.19 | ) | | | (2.13 | ) | | | (1.23 | ) | | | (0.71 | ) | | | — | |
| Net Asset Value, End of Period | | $ | 21.92 | | | $ | 21.56 | | | $ | 23.35 | | | $ | 22.90 | | | $ | 18.67 | | | $ | 17.89 | |
Total Return(2) | | | 1.67 | % | | | -2.29 | % | | | 10.52 | % | | | 29.12 | % | | | 8.07 | % | | | 1.88 | % |
| | | | | | | | | | | | | | | | | | | | | | | | | |
| Supplemental Data and Ratios: | | | | | | | | | | | | | | | | | | | | | | | | |
| Net assets at end of period | | | | | | | | | | | | | | | | | | | | | | | | |
| (000’s omitted) | | $ | 85,047 | | | $ | 94,877 | | | $ | 90,405 | | | $ | 82,862 | | | $ | 67,142 | | | $ | 63,918 | |
| Ratio of expenses to | | | | | | | | | | | | | | | | | | | | | | | | |
average net assets(3) | | | 1.14 | % | | | 1.13 | % | | | 1.07 | % | | | 1.11 | % | | | 1.14 | % | | | 1.18 | % |
| Ratio of net investment income | | | | | | | | | | | | | | | | | | | | | | | | |
(loss) to average net assets(3) | | | 0.18 | % | | | (0.04 | )% | | | (0.28 | )% | | | (0.31 | )% | | | (0.34 | )% | | | 0.14 | % |
Portfolio turnover rate(2) | | | 2.0 | % | | | 17.5 | % | | | 20.1 | % | | | 14.1 | % | | | 29.1 | % | | | 10.6 | % |
| (1) | Per share net investment income (loss) was calculated using average shares outstanding. |
| (2) | Not annualized for periods less than one year. |
| (3) | Annualized for periods less than one year. |
The accompanying notes are an integral part of these financial statements.
Bright Rock Quality Large Cap Fund – Institutional Class
Financial Highlights
Per Share Data for a Share Outstanding Throughout Each Period
| | | For the | | | | | | | | | | | | | | | | |
| | | Six Months | | | | | | | | | | | | Year | | | Year | |
| | | Ended | | | Year Ended February 28, | | | Ended | | | Ended | |
| | | August 31, | | | | | February | | | February | |
| | | 2023 | | | | | 29, | | | 28, | |
| | | (Unaudited) | | | 2023 | | | 2022 | | | 2021 | | | 2020 | | | 2019 | |
| Net Asset Value, | | | | | | | | | | | | | | | | | | | | |
| Beginning of Period | | $ | 18.04 | | | $ | 21.08 | | | $ | 19.87 | | | $ | 16.58 | | | $ | 16.42 | | | $ | 16.26 | |
| | | | | | | | | | | | | | | | | | | | | | | | | |
| Income (loss) from | | | | | | | | | | | | | | | | | | | | | | | | |
| investment operations: | | | | | | | | | | | | | | | | | | | | | | | | |
Net investment income(1) | | | 0.08 | | | | 0.16 | | | | 0.20 | | | | 0.22 | | | | 0.23 | | | | 0.25 | |
| Net realized and unrealized | | | | | | | | | | | | | | | | | | | | | | | | |
| gain (loss) on investments | | | 2.41 | | | | (0.41 | ) | | | 2.94 | | | | 3.75 | | | | 0.87 | | | | 0.67 | |
| Total from investment operations | | | 2.49 | | | | (0.25 | ) | | | 3.14 | | | | 3.97 | | | | 1.10 | | | | 0.92 | |
| | | | | | | | | | | | | | | | | | | | | | | | | |
| Less distributions paid: | | | | | | | | | | | | | | | | | | | | | | | | |
| From investment income | | | (0.06 | ) | | | (0.16 | ) | | | (0.23 | ) | | | (0.23 | ) | | | (0.23 | ) | | | (0.25 | ) |
| From net realized | | | | | | | | | | | | | | | | | | | | | | | | |
| gain on investments | | | — | | | | (2.63 | ) | | | (1.70 | ) | | | (0.45 | ) | | | (0.71 | ) | | | (0.51 | ) |
| Total distributions paid | | | (0.06 | ) | | | (2.79 | ) | | | (1.93 | ) | | | (0.68 | ) | | | (0.94 | ) | | | (0.76 | ) |
| Net Asset Value, End of Period | | $ | 20.47 | | | $ | 18.04 | | | $ | 21.08 | | | $ | 19.87 | | | $ | 16.58 | | | $ | 16.42 | |
Total Return(2) | | | 13.86 | % | | | -1.01 | % | | | 15.35 | % | | | 24.40 | % | | | 6.24 | % | | | 5.92 | % |
| | | | | | | | | | | | | | | | | | | | | | | | | |
| Supplemental Data and Ratios: | | | | | | | | | | | | | | | | | | | | | | | | |
| Net assets at end of period | | | | | | | | | | | | | | | | | | | | | | | | |
| (000’s omitted) | | $ | 354,804 | | | $ | 307,065 | | | $ | 320,491 | | | $ | 290,793 | | | $ | 237,734 | | | $ | 231,862 | |
| Ratio of expenses to | | | | | | | | | | | | | | | | | | | | | | | | |
average net assets(3) | | | 0.88 | % | | | 0.88 | % | | | 0.83 | % | | | 0.86 | % | | | 0.87 | % | | | 0.88 | % |
| Ratio of net investment income | | | | | | | | | | | | | | | | | | | | | | | | |
(loss) to average net assets(3) | | | 0.82 | % | | | 0.79 | % | | | 0.87 | % | | | 1.27 | % | | | 1.28 | % | | | 1.53 | % |
Portfolio turnover rate(2) | | | 14.2 | % | | | 39.6 | % | | | 30.4 | % | | | 30.7 | % | | | 28.3 | % | | | 42.6 | % |
| (1) | Per share net investment income was calculated using average shares outstanding. |
| (2) | Not annualized for periods less than one year. |
| (3) | Annualized for periods less than one year. |
The accompanying notes are an integral part of these financial statements.
Bright Rock Funds
Notes to Financial Statements
August 31, 2023 (Unaudited)
| (1) | Organization |
| | |
| | Trust for Professional Managers (the “Trust”) was organized as a Delaware statutory trust under a Declaration of Trust dated May 29, 2001. The Trust is registered under the Investment Company Act of 1940, as amended (the “1940 Act”), as an open-end management investment company. The Bright Rock Funds (the “Funds”) are comprised of the Bright Rock Mid Cap Growth Fund (“Mid Cap Growth Fund”) and the Bright Rock Quality Large Cap Fund (“Quality Large Cap Fund”), each representing a distinct series with its own investment objective and policies within the Trust. The investment objective of both Funds is long-term capital appreciation. The Trust may issue an unlimited number of shares of beneficial interest at $0.001 par value. The assets of the Funds are segregated, and a shareholder’s interest is limited to the Fund in which shares are held. Each Fund is a series of an investment company and accordingly follows the investment company accounting and reporting guidance of the Financial Accounting Standards Board (FASB) Accounting Standard Codification Topic 946 “Financial Services—Investment Companies”. Each Fund currently offers Institutional Class shares. The Institutional Class shares of each Fund commenced operations on May 26, 2010. Bright Rock Capital Management, LLC (the “Adviser”) serves as the Funds’ investment adviser. |
| | |
| (2) | Significant Accounting Policies |
| | |
| | The following is a summary of significant accounting policies consistently followed by the Funds in the preparation of the financial statements. These policies are in conformity with accounting principles generally accepted in the United States of America (“GAAP”). |
| | (a) | Investment Valuation |
| | | |
| | | Each equity security owned by a Fund that is listed on a securities exchange, except for securities listed on the NASDAQ Stock Market, LLC (“NASDAQ”), is valued at its last sale price on that exchange on the date as of which assets are valued. Forward currency contracts are valued at the mean between the bid and asked prices by an approved independent pricing service (“Pricing Service”). Commodities futures contracts and options thereon traded on a commodities exchange or board of trade are valued at the last sale price at the close of trading. Rights and warrants are valued at the last sale price at the close of the exchange on which the security is primarily traded. |
| | | |
| | | If the security is listed on more than one exchange, a Fund will use the price of the exchange that the Fund generally considers to be the principal exchange on which the security is traded. Portfolio securities listed on NASDAQ will be valued at the NASDAQ Official Closing Price, which may not necessarily represent the last sale price. If there has been no sale on such exchange or on |
Bright Rock Funds
Notes to Financial Statements (Continued)
August 31, 2023 (Unaudited)
| | | NASDAQ on such day, the security is valued at the mean between the most recent quoted bid and asked prices at the close of the exchange on such day or the security shall be valued at the latest sales price on the “composite market” for the day such security is being valued. The composite market is defined as a consolidation of the trade information provided by national securities and foreign exchanges and over-the-counter markets as published by a Pricing Service. |
| | | |
| | | Money market funds, demand notes and repurchase agreements are valued at cost. If cost does not represent current market value the securities will be priced at fair value. |
| | | |
| | | Redeemable securities issued by open-end, registered investment companies are valued at the NAVs of such companies for purchase and/or redemption orders placed on that day. If, on a particular day, a share of an investment company is not listed on NASDAQ, such security’s fair value will be determined. All exchange-traded funds are valued at the last reported sale price on the exchange on which the security is principally traded. In the event market quotations are not readily available, such security will be valued at its fair value. |
| | | |
| | | If market quotations are not readily available, a security or other asset will be valued at its fair value in accordance with Rule 2a-5 of the 1940 Act as determined under the Adviser’s fair value pricing procedures, subject to oversight by the Board of Trustees. These fair value pricing procedures will also be used to price a security when corporate events, events in the securities market and/or world events cause the Adviser to believe that a security’s last sale price may not reflect its actual fair market value. The intended effect of using fair value pricing procedures is to ensure that the Funds are accurately priced. The Adviser will regularly evaluate whether the Funds’ fair value pricing procedures continue to be appropriate in light of the specific circumstances of the Funds and the quality of prices obtained through the application of such procedures. |
| | | |
| | | FASB Accounting Standards Codification, “Fair Value Measurement” Topic 820 (“ASC 820”), establishes an authoritative definition of fair value and sets out a hierarchy for measuring fair value. ASC 820 requires an entity to evaluate certain factors to determine whether there has been a significant decrease in volume and level of activity for the security such that recent transactions and quoted prices may not be determinative of fair value and further analysis and adjustment may be necessary to estimate fair value. ASC 820 also requires enhanced disclosure regarding the inputs and valuation techniques used to measure fair value in those instances as well as expanded disclosure of valuation levels for major security types. These inputs are summarized in the three broad levels listed below: |
| | | Level 1— | Quoted prices in active markets for identical securities. |
Bright Rock Funds
Notes to Financial Statements (Continued)
August 31, 2023 (Unaudited)
| | | Level 2— | Other significant observable inputs (including quoted prices for similar securities, interest rates, prepayment speeds, credit risk, etc.). |
| | | | |
| | | Level 3— | Significant unobservable inputs (including the Funds’ own assumptions in determining the fair value of investments). |
| | | The inputs or methodology used for valuing securities are not necessarily an indication of the risk associated with investing in those securities. The following is a summary of the inputs used to value the Funds’ investments carried at fair value as of August 31, 2023: |
| | Mid Cap Growth Fund | | | | | | | | | | | | |
| | | | Level 1 | | | Level 2 | | | Level 3(2) | | | Total | |
| | Equity | | | | | | | | | | | | |
| | Common Stocks(1) | | $ | 85,144,456 | | | $ | — | | | $ | — | | | $ | 85,144,456 | |
| | Money Market Funds | | | 129 | | | | — | | | | — | | | | 129 | |
| | Total Investments | | | | | | | | | | | | | | | | |
| | in Securities | | $ | 85,144,585 | | | $ | — | | | $ | — | | | $ | 85,144,585 | |
| | | | | | | | | | | | | | | | | | |
| | Quality Large Cap Fund | | | | | | | | | | | | | | | | |
| | | | Level 1 | | | Level 2 | | | Level 3(2) | | | Total | |
| | Equity | | | | | | | | | | | | | | | | |
| | Common Stocks(1) | | $ | 313,350,666 | | | $ | — | | | $ | — | | | $ | 313,350,666 | |
| | Exchange Traded Funds | | | 28,107,800 | | | | — | | | | — | | | | 28,107,800 | |
| | Money Market Funds | | | 13,083,735 | | | | — | | | | — | | | | 13,083,735 | |
| | Total Investments | | | | | | | | | | | | | | | | |
| | in Securities | | $ | 354,542,201 | | | $ | — | | | $ | — | | | $ | 354,542,201 | |
| | (1) | See the Schedule of Investments for industry classifications. |
| | (2) | The Funds measure Level 3 activity as of the end of each financial reporting period. For the six months ended August 31, 2023, the Funds did not have unobservable inputs (Level 3 securities) used in determining fair value. Therefore, a reconciliation of assets and liabilities in which significant unobservable inputs (Level 3 securities) were used in determining fair value is not applicable. |
| | | The Funds did not hold financial derivative instruments during the period presented. |
| | | |
| | (b) | Federal Income Taxes |
| | | |
| | | Each Fund complies with the requirements of Subchapter M of the Internal Revenue Code necessary to qualify as a regulated investment company and make the requisite distributions of income and capital gains to its shareholders sufficient to relieve each Fund from all or substantially all federal income taxes. Therefore, no federal income tax provision has been provided. |
Bright Rock Funds
Notes to Financial Statements (Continued)
August 31, 2023 (Unaudited)
| | (c) | Distributions to Shareholders |
| | | |
| | | The Mid Cap Growth Fund will make distributions of net investment income and net capital gain, if any, at least annually. The Quality Large Cap Fund will make distributions of net investment income, if any, at least quarterly, and net capital gain, if any, at least annually. Distributions from net realized gains for book purposes may include short-term capital gains. All short-term capital gains are included in ordinary income for tax purposes. Distributions to shareholders are recorded on the ex-dividend date. The Funds may also pay a special distribution at the end of the calendar year to comply with federal tax requirements. |
| | | |
| | | The amount of the dividends from net investment income and distributions from net realized gains are determined in accordance with federal income tax regulations, which may differ from GAAP. These differences are either temporary or permanent in nature. To the extent these differences are permanent in nature, such amounts are reclassified within the composition of net assets based on their federal tax-basis treatment. |
| | | |
| | (d) | Use of Estimates |
| | | |
| | | The preparation of financial statements in conformity with GAAP requires management to make estimates and assumptions that affect the reported amounts of assets and liabilities and disclosure of contingent assets and liabilities at the date of the financial statements and the reported amounts of revenues and expenses during the reporting period. Actual results could differ from those estimates. |
| | | |
| | (e) | Share Valuation |
| | | |
| | | The NAV per share of each Fund is calculated by dividing the sum of the value of the securities held by each Fund, plus cash or other assets, minus all liabilities (including estimated accrued expenses) by the total number of shares outstanding for each Fund, rounded to the nearest cent. The Funds’ shares will not be priced on the days on which the NYSE is closed for trading. The offering and redemption price per share for each Fund is equal to the Fund’s NAV per share. |
| | | |
| | (f) | Allocation of Income, Expenses and Gains/Losses |
| | | |
| | | Income, expenses (other than those deemed attributable to a specific share class), and gains and losses of the Funds are allocated daily to each class of shares based upon the ratio of net assets represented by each class as a percentage of the net assets of each Fund. Expenses deemed directly attributable to a class of shares are recorded by the specific class. Most Fund expenses are allocated by class based on relative net assets. Expenses associated with a specific fund in the Trust are charged to that fund. Common Trust expenses are typically allocated evenly between the funds of the Trust, or by other equitable means. |
Bright Rock Funds
Notes to Financial Statements (Continued)
August 31, 2023 (Unaudited)
| | (g) | Other |
| | | |
| | | Investment transactions are recorded on the trade date. The Funds determine the gain or loss from investment transactions using the best tax relief order. Dividend income is recognized on the ex-dividend date and interest income is recognized on an accrual basis. |
| (3) | Federal Tax Matters |
| | |
| | The tax character of distributions paid to shareholders for the years ended February 28, 2022 and February 28, 2023 was as follows: |
| | | | Ordinary | | | Long-Term | |
| | | | Income | | | Capital Gain | |
| | Mid Cap Growth Fund | | | | | | |
| | Year ended February 28, 2022 | | $ | — | | | $ | 7,470,363 | |
| | Year ended February 28, 2023 | | $ | — | | | $ | 4,842,743 | |
| | | | | | | | |
| | | | Ordinary | | | Long-Term | |
| | | | Income | | | Capital Gain | |
| | Quality Large Cap Fund | | | | | | | | |
| | Year ended February 28, 2022 | | $ | 3,227,833 | | | $ | 23,899,433 | |
| | Year ended February 28, 2023 | | $ | 2,452,603 | | | $ | 39,141,266 | |
| | As of February 28, 2023, the components of accumulated earnings (losses) on a tax basis were as follows: |
| | | | Mid Cap | | | Quality Large | |
| | | | Growth Fund | | | Cap Fund | |
| | Cost basis of investments for | | | | | | |
| | federal income tax purposes | | $ | 52,157,561 | | | $ | 219,629,005 | |
| | Gross tax unrealized appreciation | | $ | 43,865,591 | | | $ | 92,738,053 | |
| | Gross tax unrealized depreciation | | | (1,062,969 | ) | | | (5,525,435 | ) |
| | Net tax unrealized appreciation | | $ | 42,802,622 | | | $ | 87,212,618 | |
| | Undistributed ordinary income | | $ | — | | | $ | 113,125 | |
| | Undistributed long-term capital gain | | | — | | | | 4,291,733 | |
| | Total accumulated earnings | | $ | — | | | $ | 4,404,858 | |
| | Other accumulated loss | | | (17,995 | ) | | | — | |
| | Total distributable earnings | | $ | 42,784,627 | | | $ | 91,617,476 | |
| | The difference between book-basis and tax-basis cost of investments is attributable to the tax deferral of wash sale losses. |
| | |
| | At February 28, 2023, the Mid Cap Growth Fund had short-term capital loss carryforwards of $17,995 which have an unlimited carryover period. |
Bright Rock Funds
Notes to Financial Statements (Continued)
August 31, 2023 (Unaudited)
| | GAAP requires that certain components of net assets relating to permanent differences be reclassified between financial and tax reporting. These reclassifications have no effect on net assets or net asset value per share. For the fiscal year ended February 28, 2023, the following reclassifications were made for permanent tax differences on the Statements of Assets and Liabilities: |
| | | Total Distributable Earnings | Paid-in Capital |
| | Mid Cap Growth Fund | $54,796 | $(54,796) |
| | Quality Large Cap Fund | — | — |
| | The Funds had no material uncertain tax positions and had not recorded a liability for unrecognized tax benefits as of February 28, 2023. Also, the Funds recognized no interest and penalties related to uncertain tax benefits in fiscal year 2023. At February 28, 2023, the fiscal years 2020 through 2023 remained open to examination in the Funds’ major tax jurisdictions. |
| | |
| (4) | Investment Adviser |
| | |
| | The Trust has entered into an Investment Advisory Agreement (the “Agreement”) with the Adviser to furnish investment advisory services to the Funds. Under the terms of the Agreement, the Trust, on behalf of the Mid Cap Growth Fund and the Quality Large Cap Fund, compensates the Adviser for its management services at the annual rates of 0.75% and 0.65%, respectively, of each Fund’s average daily net assets. |
| | |
| | The Adviser has contractually agreed to waive its management fee and/or reimburse each Fund’s other expenses at least through June 28, 2025, at the discretion of the Adviser and the Board of Trustees, to the extent necessary to ensure that each Fund’s total operating expenses (exclusive of front-end or contingent deferred sales loads, Rule 12b-1 fees, shareholder servicing plan fees, taxes, leverage expenses, interest, brokerage commissions, expenses incurred in connection with any merger or reorganization, dividends or interest on short positions, acquired fund fees and expenses and extraordinary expenses such as litigation) do not exceed 1.25% of each Fund’s average daily net assets. Any such waiver or reimbursement is subject to later adjustment to allow the Adviser to recoup amounts waived or reimbursed within three years from the date such amount was waived or reimbursed, subject to the operating expense limitation agreement, if such reimbursements will not cause a Fund to exceed the lesser of: (1) the expense limitation in place at the time of the waiver and/or expense payment; or (2) the expense limitation in place at the time of the recoupment. The Funds did not have any previously waived expenses subject to potential recoupment at the period end. |
Bright Rock Funds
Notes to Financial Statements (Continued)
August 31, 2023 (Unaudited)
| (5) | Related Party Transactions |
| | |
| | U.S. Bancorp Fund Services, LLC (doing business as U.S. Bank Global Fund Services) (“Fund Services”) acts as the Funds’ administrator under an Administration Agreement. Fund Services prepares various federal and state regulatory filings, reports and returns for the Funds; prepares reports and materials to be supplied to the Trustees; monitors the activities of the Funds’ custodian, transfer agent and accountants; and coordinates the preparation and payment of the Funds’ expenses and reviews the Funds’ expense accruals. Fund Services also serves as the fund accountant and transfer agent to the Funds. U.S. Bank, N.A. (“U.S. Bank”), an affiliate of Fund Services, serves as each Fund’s custodian. Fees and expenses incurred for the six months ended August 31, 2023, and owed as of August 31, 2023 are as follows: |
| | Administration | | Incurred | | | Owed | |
| | Bright Rock Mid Cap Growth Fund | | $ | 52,074 | | | $ | 6,538 | |
| | Bright Rock Quality Large Cap Fund | | $ | 143,594 | | | $ | 24,798 | |
| | | | | | | | | | |
| | Fund Accounting | | Incurred | | | Owed | |
| | Bright Rock Mid Cap Growth Fund | | $ | 22,153 | | | $ | 2,927 | |
| | Bright Rock Quality Large Cap Fund | | $ | 58,844 | | | $ | 9,696 | |
| | | | | | | | | | |
| | Transfer Agency | | Incurred* | | | Owed | |
| | Bright Rock Mid Cap Growth Fund | | $ | 13,322 | | | $ | 3,185 | |
| | Bright Rock Quality Large Cap Fund | | $ | 19,569 | | | $ | 4,521 | |
| | | | | | | | | | |
| | Custody | | Incurred | | | Owed | |
| | Bright Rock Mid Cap Growth Fund | | $ | 5,161 | | | $ | 1,548 | |
| | Bright Rock Quality Large Cap Fund | | $ | 16,991 | | | $ | 5,562 | |
| | * | These amounts do not include sub-transfer agency fees, and therefore may not agree to the Statements of Operations. |
| | The Funds each have a line of credit with U.S. Bank (see Note 8). |
| | |
| | Certain officers of the Funds are also employees of Fund Services. A Trustee of the Trust is affiliated with Fund Services and U.S. Bank. |
| | |
| | The Trust’s Chief Compliance Officer (“CCO”) is also an employee of Fund Services. Each Fund’s allocation of the Trust’s Chief Compliance Officer fee incurred for the six months ended August 31, 2023, and owed as of August 31, 2023, is as follows: |
| | CCO | | Incurred | | | Owed | |
| | Bright Rock Mid Cap Growth Fund | | $ | 6,256 | | | $ | 1,046 | |
| | Bright Rock Quality Large Cap Fund | | $ | 6,256 | | | $ | 1,048 | |
Bright Rock Funds
Notes to Financial Statements (Continued)
August 31, 2023 (Unaudited)
| (6) | Capital Share Transactions |
| | | | Six Months Ended | | | Year Ended | |
| | Mid Cap Growth Fund – Institutional Class | | August 31, 2023 | | | February 28, 2023 | |
| | Shares Sold | | | 205,272 | | | | 805,288 | |
| | Shares Issued to Holders in | | | | | | | | |
| | Reinvestment of Distributions | | | — | | | | 237,149 | |
| | Shares Redeemed | | | (725,494 | ) | | | (512,746 | ) |
| | Net Increase (decrease) | | | (520,222 | ) | | | 529,691 | |
| | | | | | | | | | |
| | | | Six Months Ended | | | Year Ended | |
| | Quality Large Cap Fund – Institutional Class | | August 31, 2023 | | | February 28, 2023 | |
| | Shares Sold | | | 1,373,570 | | | | 2,083,465 | |
| | Shares Issued to Holders in | | | | | | | | |
| | Reinvestment of Distributions | | | 19,102 | | | | 2,217,028 | |
| | Shares Redeemed | | | (1,074,512 | ) | | | (2,484,999 | ) |
| | Net Increase | | | 318,160 | | | | 1,815,494 | |
| (7) | Investment Transactions |
| | |
| | The aggregate purchases and sales of securities, excluding short-term investments, for the Funds for the six months ended August 31, 2023 are summarized below. There were no purchases or sales of U.S. government securities for the Funds. |
| | | Mid Cap Growth Fund | | Quality Large Cap Fund |
| | Purchases | | $ | 1,876,194 | | | | $ | 46,131,140 | |
| | Sales | | $ | 12,588,373 | | | | $ | 49,608,582 | |
| (8) | Line of Credit |
| | |
| | The Funds each have lines of credit, maturing August 5, 2024, of the lesser of 33.33% of the fair value of unencumbered net assets of a Fund or the amount of $3,500,000 and $25,000,000 for the Mid Cap Growth Fund and Quality Large Cap Fund, respectively. These unsecured lines of credit are intended to provide short-term financing, if necessary, and subject to certain restrictions, in connection with shareholder redemptions. The credit facility is with the Funds’ custodian, U.S. Bank. Interest was accrued at the prime rate of 7.75% from March 1, 2023 through March 22, 2023, 8.00% from March 23, 2023 through May 3, 2023, 8.25% from May 4, 2023 |
Bright Rock Funds
Notes to Financial Statements (Continued)
August 31, 2023 (Unaudited)
| | through July 26, 2023, and 8.50% from July 27, 2023 through August 31, 2023. The following table provides information regarding usage of the line of credit for the Mid Cap Growth Fund for the period ended August 31, 2023. |
| | | | Average | | Maximum | Date of |
| | | Days | Amount of | Interest | Amount of | Maximum |
| | | Utilized | Borrowing | Expense* | Borrowing | Borrowing |
| | Mid Cap Growth Fund | 2 | $92,000 | $43 | $125,000 | 8/31/2023 |
| | | | | | | |
| | * Interest expense is reported on the Statements of Operations. | | | | | |
| (9) | Subsequent Event |
| | |
| | On September 15, 2023, the Quality Large Cap Fund declared and paid a distribution of $565,155 to the shareholders of record on September 14, 2023. |
| | |
| | The Funds have evaluated events and transactions that have occurred subsequent to August 31, 2023 and determined there were no other subsequent events that would require recognition or disclosure in financial statements. |
| | |
| (10) | Recent Market Events |
| | |
| | U.S. and international markets have experienced significant periods of volatility in recent years and months due to a number of economic, political and global macro factors including rising inflation, uncertainty regarding central banks' interest rate increases, the possibility of a national or global recession, trade tensions, political events, the war between Russia and Ukraine and the impact of the coronavirus (COVID-19) global pandemic. The global recovery from COVID-19 may last for an extended period of time. As a result of continuing political tensions and armed conflicts, including the war between Ukraine and Russia, the U.S. and the European Union imposed sanctions on certain Russian individuals and companies, including certain financial institutions, and have limited certain exports and imports to and from Russia. The war has contributed to recent market volatility and may continue to do so. These developments, as well as other events, could result in further market volatility and negatively affect financial asset prices, the liquidity of certain securities and the normal operations of securities exchanges and other markets, despite government efforts to address market disruptions. Continuing market volatility as a result of recent market conditions or other events may have adverse effects on your account. |
Bright Rock Funds
Basis for Trustees’ Approval of Investment Advisory Agreement
(Unaudited)
The Board of Trustees (the “Trustees”) of Trust for Professional Managers (the “Trust”) met on August 17, 2023 to consider the renewal of the Investment Advisory Agreement (the “Agreement”) between the Trust, on behalf of the Bright Rock Mid Cap Growth Fund and the Bright Rock Quality Large Cap Fund (each, a “Fund,” and together, the “Funds”), each a series of the Trust, and Bright Rock Capital Management, LLC the Funds’ investment adviser (the “Adviser”). The Trustees also met at a prior meeting held on June 22, 2023 (the “June 22, 2023 meeting”) to review materials related to the renewal of the Agreement. Prior to these meetings, the Trustees requested and received materials to assist them in considering the renewal of the Agreement. The materials provided contained information with respect to the factors enumerated below, including a copy of the Agreement, a memorandum prepared by the Trust’s outside legal counsel discussing in detail the Trustees’ fiduciary obligations and the factors they should assess in considering the renewal of the Agreement, detailed comparative information relating to the Funds’ performance, as well as the management fees and other expenses of the Funds, due diligence materials relating to the Adviser (including a due diligence questionnaire completed on behalf of the Funds by the Adviser, the Adviser’s Form ADV, select financial statements of the Adviser, biographical information of the Adviser’s key management and compliance personnel, comparative fee information for the Funds and the Adviser’s other separately-managed accounts and a summary detailing key provisions of the Adviser’s written compliance program, including its code of ethics) and other pertinent information. The Trustees also received information periodically throughout the year that was relevant to the Agreement renewal process, including performance, management fee and other expense information. Based on their evaluation of the information provided by the Adviser, in conjunction with the Funds’ other service providers, the Trustees, by a unanimous vote (including a separate vote of the Trustees who are not “interested persons,” as that term is defined in the Investment Company Act of 1940, as amended (the “Independent Trustees”)), approved the continuation of the Agreement for an additional one-year term ending August 31, 2024.
DISCUSSION OF FACTORS CONSIDERED
In considering the renewal of the Agreement and reaching their conclusions, the Trustees reviewed and analyzed various factors that they determined were relevant, including the factors enumerated below.
1. NATURE, EXTENT AND QUALITY OF SERVICES PROVIDED TO THE FUNDS
The Trustees considered the nature, extent and quality of services provided by the Adviser to the Funds and the amount of time devoted to the Funds’ operation by the Adviser’s staff. The Trustees considered the Adviser’s specific responsibilities in all aspects of day-to-day management of the Funds, including the investment strategies
Bright Rock Funds
Basis for Trustees’ Approval of Investment Advisory Agreement (Continued)
(Unaudited)
implemented by the Adviser, as well as the qualifications, experience and responsibilities of Douglas S. Butler and David B. Smith, the Funds’ portfolio managers, and other key personnel at the Adviser involved in the day-to-day activities of the Funds. The Trustees reviewed information provided by the Adviser in a due diligence questionnaire, including the structure of the Adviser’s compliance program and its continuing commitment to the Funds. The Trustees noted that during the course of the prior year the Adviser had participated in a Trust board meeting to discuss the Funds’ performance and outlook, along with the compliance efforts made by the Adviser, including reports provided by the Adviser in its role as the Funds’ valuation designee. The Trustees also noted any services that extended beyond portfolio management, and they considered the brokerage practices of the Adviser. The Trustees discussed the Adviser’s handling of compliance matters, including the reports of the Trust’s chief compliance officer to the Trustees on the effectiveness of the Adviser’s compliance program. The Trustees also considered the Adviser’s overall financial condition, as well as the implementation and operational effectiveness of the Adviser’s business continuity plan. The Trustees concluded that the Adviser had sufficient quality and depth of personnel, resources, investment methods and compliance policies and procedures essential to performing its duties under the Advisory Agreement and that the nature, overall quality and extent of the management services provided to the Funds, as well as the Adviser’s compliance program, were satisfactory and reliable.
2. INVESTMENT PERFORMANCE OF THE FUNDS AND THE ADVISER
The Trustees discussed the performance of the Institutional Class shares of the Bright Rock Mid Cap Growth Fund and the Bright Rock Quality Large Cap Fund for the quarter, one-year, three-year, five-year, ten-year and since inception periods ended March 31, 2023. In assessing the quality of the portfolio management services delivered by the Adviser, the Trustees also compared the short-term and longer-term performance of the Institutional Class shares of the Funds on both an absolute basis and in comparison to a benchmark index (the Russell Midcap Growth Total Return Index for the Bright Rock Mid Cap Growth Fund and the S&P 500 Total Return Index for the Bright Rock Quality Large Cap Fund) and in comparison to a peer group of funds as constructed using publicly-available data provided by Morningstar, Inc. and presented by Barrington Financial Group, LLC d/b/a Barrington Partners, an independent third-party benchmarking firm, through its cohort selection process (a peer group of U.S. open-end mid-cap growth and real estate funds for the Bright Rock Mid Cap Growth Fund and a peer group of U.S. open-end large-cap blend funds for the Bright Rock Quality Large Cap Fund) (each, a “Barrington Cohort”). The Trustees noted that the Adviser did not manage any other accounts with the same or similar investment strategies as either Fund.
Bright Rock Funds
Basis for Trustees’ Approval of Investment Advisory Agreement (Continued)
(Unaudited)
The Trustees noted the Bright Rock Mid Cap Growth Fund’s performance for Institutional Class shares for each of the one-year, three-year, five-year and ten-year periods ended March 31, 2023 was above the Barrington Cohort average. The Trustees further noted that for the quarter, ten-year and since inception periods ended March 31, 2023, the Bright Rock Mid Cap Growth Fund’s performance for Institutional Class shares had underperformed the Russell Midcap Growth Total Return USD Index. The Trustees noted that for the one-year, three-year, and five-year periods ended March 31, 2023, the Institutional Class shares of the Bright Rock Mid Cap Growth Fund had outperformed the Russell Midcap Growth Total Return USD Index.
The Trustees noted the Bright Rock Quality Large Cap Fund’s performance for Institutional Class shares for each of the one-year, three-year and five-year periods ended March 31, 2023 was above the Barrington Cohort average. The Trustees also noted that the Bright Rock Quality Large Cap Fund’s performance for Institutional Class shares for the ten-year period ended March 31, 2023 was below the Barrington Cohort average. The Trustees noted that for the quarter, five-year, ten-year and since inception periods ended March 31, 2023, the Bright Rock Quality Large Cap Fund’s performance for Institutional Class shares had underperformed the S&P 500 Total Return Index. The Trustees noted that for the one-year and three-year periods ended March 31, 2023, the Institutional Class shares of the Bright Rock Quality Large Cap Fund had outperformed the S&P 500 Total Return Index.
After considering all of the information, the Trustees concluded that the performance obtained by the Adviser for each Fund was satisfactory under current market conditions. Although past performance is not a guarantee or indication of future results, the Trustees determined that each Fund and its shareholders were likely to benefit from the Adviser’s continued management.
3. COSTS OF SERVICES PROVIDED AND PROFITS REALIZED BY THE ADVISER
The Trustees considered the cost of services and the structure of the Adviser’s fees, including a review of the expense analyses and other pertinent material with respect to the Funds. The Trustees reviewed the related statistical information and other materials provided, including the comparative expenses and Barrington Cohort comparisons. The Trustees considered the cost structure of each Fund relative to its Barrington Cohort and the separately-managed accounts of the Adviser’s parent company.
The Trustees also considered the overall profitability of the Adviser and reviewed the Adviser’s financial information. The Trustees also examined the level of profits that could be expected to accrue to the Adviser from the fees payable under the Advisory Agreement, as well as the Funds’ brokerage practices and use of soft dollars by the
Bright Rock Funds
Basis for Trustees’ Approval of Investment Advisory Agreement (Continued)
(Unaudited)
Adviser. These considerations were based on materials requested by the Trustees and the Funds’ administrator specifically for the June 22, 2023 meeting and the August 17, 2023 meeting at which the Advisory Agreement was formally considered, as well as the reports prepared by the Adviser over the course of the year.
The Trustees noted that the Bright Rock Mid Cap Growth Fund’s contractual management fee of 0.75% was slightly above the Barrington Cohort average of 0.72%. The Trustees noted that the Bright Rock Mid Cap Growth Fund was operating below its expense cap of 1.25% for Institutional Class shares. The Trustees observed that the Bright Rock Mid Cap Growth Fund’s total expense ratio of 1.13% for Institutional Class shares was above the Barrington Cohort average of 0.91%. The Trustees also compared the fees paid by the Bright Rock Mid Cap Growth Fund to the fees paid by separately-managed accounts of the Adviser’s parent company that are managed by the same portfolio management team as the Fund.
The Trustees noted that the Bright Rock Quality Large Cap Fund’s contractual management fee of 0.65% was below the Barrington Cohort average of 0.67%. The Trustees noted that the Bright Rock Quality Large Cap Fund was operating below its expense cap of 1.25% for Institutional Class shares. The Trustees observed that the Bright Rock Quality Large Cap Fund’s total expense ratio of 0.88% for Institutional Class shares was above the Barrington Cohort average of 0.74%. The Trustees also compared the fees paid by the Bright Rock Quality Large Cap Fund to the fees paid by separately-managed accounts of the Adviser’s parent company that are managed by the same portfolio management team as the Fund.
The Trustees concluded that each Fund’s expenses and the management fees paid to the Adviser were fair and reasonable in light of the comparative performance, expense and management fee information. The Trustees noted, based on a profitability analysis prepared by the Adviser, that the Adviser was not realizing profits in connection with its management of each Fund, after rebating fees to its parent company and reflecting marketing and distribution expenses, and the Trustees further concluded that the Adviser’s parent company maintained adequate profit levels to support the services to each Fund from the revenues of its overall investment advisory business.
4. EXTENT OF ECONOMIES OF SCALE AS THE FUNDS GROW
The Trustees compared each Fund’s expenses relative to its peer group and discussed realized and potential economies of scale. The Trustees also reviewed the structure of each Fund’s management fee and whether each Fund was large enough to generate economies of scale for shareholders or whether economies of scale would be expected to be realized as Fund assets grow (and if so, how those economies of scale were being or
Bright Rock Funds
Basis for Trustees’ Approval of Investment Advisory Agreement (Continued)
(Unaudited)
would be shared with shareholders). The Trustees noted that the Funds’ management fee structures did not contain any breakpoint reductions as each Fund’s assets grow in size, but that the feasibility of incorporating breakpoints would continue to be reviewed on a regular basis. With respect to the Adviser’s fee structures, the Trustees concluded that the current fee structures were reasonable and reflected a sharing of economies of scale between the Adviser and each Fund at the Fund’s current asset level.
5. BENEFITS DERIVED FROM THE RELATIONSHIP WITH THE FUNDS
The Trustees considered the direct and indirect benefits that could be received by the Adviser from its association with the Funds. The Trustees examined the brokerage practices of the Adviser with respect to the Funds. The Trustees concluded that the benefits the Adviser may receive, such as greater name recognition and increased ability to obtain research or brokerage services or attract additional investor assets, appear to be reasonable, and in many cases may benefit the Funds.
CONCLUSIONS
The Trustees considered all of the foregoing factors. In considering the renewal of the Advisory Agreement, the Trustees did not identify any one factor as all-important, but rather considered these factors collectively in light of each Fund’s surrounding circumstances. Based on this review, the Trustees, including a majority of the Independent Trustees, approved the continuation of the Advisory Agreement for an additional one-year term ending August 31, 2024 as being in the best interests of each Fund and its shareholders.
Bright Rock Funds
Statement Regarding Liquidity Risk Management
In accordance with Rule 22e-4 under the Investment Company Act of 1940, as amended, Trust for Professional Managers (the “Trust”) has adopted and implemented a liquidity risk management program (the “Trust Program”). As required under the Trust Program, Bright Rock Capital Management, LLC (“Bright Rock”), the investment adviser to the Bright Rock Mid Cap Growth Fund and the Bright Rock Quality Large Cap Fund (the “Funds”), each a series of the Trust, has adopted and implemented a liquidity risk management program tailored specifically to each Fund (the “Adviser Program”). The Adviser Program seeks to promote effective liquidity risk management for each Fund and to protect Fund shareholders from dilution of their interests. The Board of Trustees (the “Board”) of the Trust has approved Bright Rock as the administrator for the Adviser Program (the “Program Administrator”). The Program Administrator has further delegated administration of the Adviser Program to Bright Rock’s Trading and Oversight Committee (as may be constituted from time to time). The Program Administrator is required to provide a written annual report to the Board and the Trust’s chief compliance officer regarding the adequacy and effectiveness of the Adviser Program, including the operation of each Fund’s highly liquid investment minimum, if applicable, and any material changes to the Adviser Program.
On April 20, 2023, the Board reviewed the Program Administrator’s written annual report for the review period January 1, 2022 through December 31, 2022 (the “Report”). The Report provided an assessment of each Fund’s liquidity risk: the risk that a Fund could not meet requests to redeem shares issued by a Fund without significant dilution of the remaining investors’ interests in the Fund. The Adviser Program assessed liquidity risk under both normal and reasonably foreseeable stressed market conditions. The Program Administrator has retained ICE Data Services, Inc., a third party vendor, to provide portfolio investment classification services, and the Report noted that the Funds primarily held investments that were classified as highly liquid during the review period. The Report noted that the Funds’ portfolios are expected to continue to primarily hold highly liquid investments and the determination that each Fund be designated as a “primarily highly liquid fund” (as defined in Rule 22e-4) remains appropriate. The Funds can therefore continue to rely on the exclusion in Rule 22e-4 from the requirements to determine and review a highly liquid investment minimum for the Funds and to adopt policies and procedures for responding to a highly liquid investment minimum shortfall. The Report noted that there were no breaches of the Funds’ restriction on holding illiquid investments exceeding 15% of net assets during the review period. The Report confirmed that each Fund’s investment strategy was appropriate for an open-end management investment company. The Report also indicated that no material changes had been made to the Adviser Program during the review period.
The Program Administrator determined that the Funds are reasonably likely to be able to meet redemption requests without adversely affecting non-redeeming Fund shareholders through significant dilution. The Program Administrator concluded that the Adviser Program was adequately designed and effectively implemented during the review period.
Bright Rock Funds
Notice of Privacy Policy & Practices
(Unaudited)
We collect non-public personal information about you from the following sources:
• information we receive about you on applications or other forms;
• information you give us orally; and
• information about your transactions with us or others.
The types of non-public personal information we collect and share can include:
• social security numbers;
• account balances;
• account transactions;
• transaction history;
• wire transfer instructions; and
• checking account information.
What Information We Disclose
We do not disclose any non-public personal information about our shareholders or former shareholders without the shareholder’s authorization, except as permitted by law or in response to inquiries from governmental authorities. We may share information with affiliated parties and unaffiliated third parties with whom we have contracts for servicing the Fund. We will provide unaffiliated third parties with only the information necessary to carry out their assigned responsibility.
How We Protect Your Information
All shareholder records will be disposed of in accordance with applicable law. We maintain physical, electronic and procedural safeguards to protect your non-public person information and require third parties to treat your non-public personal information with the same high degree of confidentiality.
In the event that you hold shares of the Fund through a financial intermediary, including, but not limited to, a broker-dealer, bank or trust company, the privacy policy of your financial intermediary would govern how your non-public personal information would be shared with unaffiliated third parties.
Bright Rock Funds
Additional Information
(Unaudited)
Tax Information
For the fiscal year ended February 28, 2023, certain dividends paid by the Funds may be subject to a maximum tax rate of 20%, as provided for by the Jobs and Growth Tax Relief Reconciliation Act of 2003. The percentage of dividends declared from ordinary income designated as qualified dividend income was as follows:
| | Quality Large Cap | 100.00% | |
| | Mid Cap Growth | 0.00% | |
For corporate shareholders, the percent of ordinary income distributions qualifying for the corporate dividends received deduction for the fiscal year ended February 28, 2023, was as follows:
| | Quality Large Cap | 100.00% | |
| | Mid Cap Growth | 0.00% | |
Indemnification
Under the Trust’s organizational documents, its officers and Trustees are indemnified against certain liabilities arising out of the performance of their duties to the Funds. In addition, in the normal course of business, the Funds enter into contracts that provide general indemnifications to other parties. The Funds’ maximum exposure under these arrangements is unknown, as this would involve future claims that may be made against the Funds that have not yet occurred. However, the Funds have not had prior claims or losses pursuant to these contracts and expect the risk of loss to be remote.
Information about Trustees
The business and affairs of the Trust are managed under the direction of the Trust’s Board of Trustees. Information pertaining to the Trustees of the Trust is set forth below. The Funds’ Statement of Additional Information includes additional information about the Trustees and is available, without charge, upon request by calling 1-866-273-7223.
Bright Rock Funds
Additional Information (Continued)
(Unaudited)
Independent Trustees
| | | | Number of | | Other |
| | | Term of | Portfolios | Principal | Directorships |
| Name, | Position(s) | Office and | in the Trust | Occupation(s) | Held by Trustee |
| Address and | Held with | Length of | Overseen | During the | During the |
Year of Birth | the Trust | Time Served | by Trustee | Past Five Years | Past Five Years |
| | | | | | |
| Michael D. Akers, Ph.D. | Trustee | Indefinite | 28 | Professor Emeritus, | Independent |
| 615 E. Michigan St. | | Term; Since | | Department of | Trustee, USA |
| Milwaukee, WI 53202 | | August 22, | | Accounting (June | MUTUALS |
| Year of Birth: 1955 | | 2001 | | 2019–present); | (an open-end |
| | | | | Professor, | investment |
| | | | | Department of | company) |
| | | | | Accounting | (2001–2021). |
| | | | | (2004–2019); | |
| | | | | Marquette University. | |
| | | | | | |
| Gary A. Drska | Trustee | Indefinite | 28 | Retired; Pilot, | Independent |
| 615 E. Michigan St. | | Term; Since | | Frontier/Midwest | Trustee, USA |
| Milwaukee, WI 53202 | | August 22, | | Airlines, Inc. | MUTUALS |
| Year of Birth: 1956 | | 2001 | | (airline company) | (an open-end |
| | | | | (1986–2021). | investment |
| | | | | | company) |
| | | | | | (2001–2021). |
| | | | | | |
| Vincent P. Lyles | Trustee | Indefinite | 28 | Executive Director, | Independent |
| 615 E. Michigan St. | | Term; Since | | Milwaukee Succeeds | Director, BMO |
| Milwaukee, WI 53202 | | April 6, | | (education advocacy | Funds, Inc. |
| Year of Birth: 1961 | | 2022 | | organization) (2023- | (an open-end |
| | | | | present); System | investment |
| | | | | Vice President of | company) |
| | | | | Community | (2017–2022). |
| | | | | Relations, Advocate | |
| | | | | Aurora Health Care | |
| | | | | (health care provider) | |
| | | | | (2019–2022); | |
| | | | | President and Chief | |
| | | | | Executive Officer, | |
| | | | | Boys & Girls Club of | |
| | | | | Greater Milwaukee | |
| | | | | (2012–2018). | |
Bright Rock Funds
Additional Information (Continued)
(Unaudited)
| | | | Number of | | Other |
| | | Term of | Portfolios | Principal | Directorships |
| Name, | Position(s) | Office and | in the Trust | Occupation(s) | Held by Trustee |
| Address and | Held with | Length of | Overseen | During the | During the |
Year of Birth | the Trust | Time Served | by Trustee | Past Five Years | Past Five Years |
| Erik K. Olstein | Trustee | Indefinite | 28 | Retired; President | Trustee, The |
| 615 E. Michigan St. | | Term; Since | | and Chief Operating | Olstein Funds |
| Milwaukee, WI 53202 | | April 6, | | Officer (2000–2020), | (an open-end |
| Year of Birth: 1967 | | 2022 | | Vice President | investment |
| | | | | of Sales and Chief | company) |
| | | | | Operating Officer | (1995–2018). |
| | | | | (1995–2000), Olstein | |
| | | | | Capital Management, | |
| | | | | L.P. (asset management | |
| | | | | firm); Secretary and | |
| | | | | Assistant Treasurer, | |
| | | | | The Olstein Funds | |
| | | | | (1995–2018). | |
| | | | | | |
| Lisa Zúñiga Ramírez | Trustee | Indefinite | 28 | Retired; Principal | Director, Peoples |
| 615 E. Michigan St. | | Term; Since | | and Senior Portfolio | Financial |
| Milwaukee, WI 53202 | | April 6, | | Manager, Segall, | Services Corp. |
| Year of Birth: 1969 | | 2022 | | Bryant & Hamill, LLC | (a publicly |
| | | | | (asset management | traded bank |
| | | | | firm) (2018-2020); | holding |
| | | | | Partner and Senior | company |
| | | | | Portfolio Manager, | (2022–present). |
| | | | | Denver Investments | |
| | | | | LLC (asset management | |
| | | | | firm) (2009-2018). | |
| | | | | | |
| Gregory M. Wesley | Trustee | Indefinite | 28 | Senior Vice President | N/A |
| 615 E. Michigan St. | | Term; Since | | of Strategic Alliances | |
| Milwaukee, WI 53202 | | April 6, | | and Business | |
| Year of Birth: 1969 | | 2022 | | Development, Medical | |
| | | | | College of Wisconsin | |
| | | | | (2016-present). | |
| | | | | |
| Interested Trustee and Officers | | | | |
| | | | | | |
| John P. Buckel* | Chairperson, | Indefinite Term | 28 | Vice President, | N/A |
| 615 E. Michigan St. | Trustee, | Chairperson | | U.S. Bancorp Fund | |
| Milwaukee, WI 53202 | President | and Trustee | | Services, LLC | |
| Year of Birth: 1957 | and | (since | | (2004–present). | |
| | Principal | January 19, | | | |
| | Executive | 2023); | | | |
| | Officer | President and | | | |
| | | Principal | | | |
| | | Executive | | | |
| | | Officer (since | | | |
| | | January 24, | | | |
| | | 2013) | | | |
Bright Rock Funds
Additional Information (Continued)
(Unaudited)
| | | | Number of | | Other |
| | | Term of | Portfolios | Principal | Directorships |
| Name, | Position(s) | Office and | in the Trust | Occupation(s) | Held by Trustee |
| Address and | Held with | Length of | Overseen | During the | During the |
Year of Birth | the Trust | Time Served | by Trustee | Past Five Years | Past Five Years |
| Jennifer A. Lima | Vice | Indefinite | N/A | Vice President, | N/A |
| 615 E. Michigan St. | President, | Term; Since | | U.S. Bancorp Fund | |
| Milwaukee, WI 53202 | Treasurer | January 24, | | Services, LLC | |
| Year of Birth: 1974 | and | 2013 | | (2002–present). | |
| | Principal | | | | |
| | Financial and | | | | |
| | Accounting | | | | |
| | Officer | | | | |
| | | | | | |
| Deanna B. Marotz | Chief | Indefinite | N/A | Senior Vice President, | N/A |
| 615 E. Michigan St. | Compliance | Term; Since | | U.S. Bancorp Fund | |
| Milwaukee, WI 53202 | Officer, | October 21, | | Services, LLC | |
| Year of Birth: 1965 | Vice | 2021 | | (2021–present); Chief | |
| | President | | | Compliance Officer, | |
| | and | | | Keeley-Teton Advisors, | |
| | Anti-Money | | | LLC and Teton Advisors, | |
| | Laundering | | | Inc (2017–2021). | |
| | Officer | | | | |
| | | | | | |
| Jay S. Fitton | Secretary | Indefinite | N/A | Assistant Vice President, | N/A |
| 615 E. Michigan St. | | Term; Since | | U.S. Bancorp Fund | |
| Milwaukee, WI 53202 | | July 22, | | Services, LLC | |
| Year of Birth: 1970 | | 2019 | | (2019–present); Partner, | |
| | | | | Practus, LLP (2018– | |
| | | | | 2019); Counsel, | |
| | | | | Drinker Biddle & | |
| | | | | Reath, LLP (2016–2018). | |
| | | | | | |
| Kelly A. Strauss | Assistant | Indefinite | N/A | Assistant Vice President, | N/A |
| 615 E. Michigan St. | Treasurer | Term; Since | | U.S. Bancorp Fund | |
| Milwaukee, WI 53202 | | April 23, | | Services, LLC | |
| Year of Birth: 1987 | | 2015 | | (2011–present). | |
| | | | | | |
| Laura A. Carroll | Assistant | Indefinite | N/A | Assistant Vice President, | N/A |
| 615 E. Michigan St. | Treasurer | Term; Since | | U.S. Bancorp Fund | |
| Milwaukee, WI 53202 | | August 20, | | Services, LLC | |
| Year of Birth: 1985 | | 2018 | | (2007–present). | |
| | | | | | |
| Shannon Coyle | Assistant | Indefinite | N/A | Officer, | N/A |
| 615 E. Michigan St. | Treasurer | Term; Since | | U.S. Bancorp Fund | |
| Milwaukee, WI 53202 | | August 26, | | Services, LLC | |
| Year of Birth: 1990 | | 2022 | | (2015–present). | |
| * | Mr. Buckel is an “interested person” of the Trust as defined by the 1940 Act due to his position and material business relationship with the Trust. |
(This Page Intentionally Left Blank.)
A NOTE ON FORWARD LOOKING STATEMENTS (Unaudited)
The matters discussed in this report may constitute forward-looking statements made pursuant to the safe-harbor provisions of the Securities Litigation Reform Act of 1995. These include any Adviser or portfolio manager predictions, assessments, analyses or outlooks for individual securities, industries, market sectors and/or markets. These statements involve risks and uncertainties. In addition to the general risks described for the Funds in the current Prospectus, other factors bearing on this report include the accuracy of the Adviser’s or portfolio managers’ forecasts and predictions, and the appropriateness of the investment programs designed by the Adviser or portfolio managers to implement their strategies efficiently and effectively. Any one or more of these factors, as well as other risks affecting the securities markets and investment instruments generally, could cause the actual results of the Funds to differ materially as compared to benchmarks associated with the Funds.
PROXY VOTING POLICIES AND PROCEDURES (Unaudited)
The Funds have adopted proxy voting policies and procedures that delegate to the Adviser the authority to vote proxies. A description of the Funds’ proxy voting policies and procedures is available without charge, upon request, by calling the Funds toll free at 1-866-273-7223. A description of these policies and procedures is also included in the Funds’ Statement of Additional Information, which is available on the SEC’s website at http://www.sec.gov.
The Funds’ proxy voting records for the most recent 12-month period ended June 30 is available without charge, upon request, by calling 1-866-273-7223, or by accessing the SEC’s website at http://www.sec.gov.
PORTFOLIO HOLDINGS (Unaudited)
The Funds file their complete schedule of portfolio holdings with the SEC for the first and third quarters of each fiscal year on Part F of Form N-PORT. Shareholders may view the Funds’ filings on the SEC’s website at www.sec.gov.
HOUSEHOLDING (Unaudited)
In an effort to decrease costs, the Funds intend to reduce the number of duplicate prospectuses and certain other shareholder documents you receive by sending only one copy of each to those addresses shared by two or more accounts and to shareholders we reasonably believe are from the same family or household. If you would like to discontinue householding for your accounts, please call toll-free at 1-866-273-7223 to request individual copies of these documents. Once the Funds receive notice to stop householding, we will begin sending individual copies 30 days after receiving your request. This policy does not apply to account statements.
Bright Rock Funds
Investment Adviser
Bright Rock Capital Management, LLC
2036 Washington Street
Hanover, Massachusetts 02339
Legal Counsel
Godfrey & Kahn, S.C.
833 East Michigan Street, Suite 1800
Milwaukee, Wisconsin 53202
Independent Registered Public Accounting Firm
Deloitte & Touche LLP
111 South Wacker Drive
Chicago, Illinois 60606-4301
Transfer Agent, Fund Accountant and Fund Administrator
U.S. Bancorp Fund Services, LLC
615 East Michigan Street
Milwaukee, Wisconsin 53202
Custodian
U.S. Bank, N.A.
Custody Operations
1555 North River Center Drive, Suite 302
Milwaukee, Wisconsin 53212
Distributor
Quasar Distributors, LLC
111 East Kilbourn Avenue, Suite 2200
Milwaukee, Wisconsin 53202
This report is intended for shareholders of the Funds and may not be used as sales literature unless preceded or accompanied by a current prospectus.
BB-SEMI
Item 2. Code of Ethics.
Not applicable for semi-annual reports.
Item 3. Audit Committee Financial Expert.
Not applicable for semi-annual reports.
Item 4. Principal Accountant Fees and Services.
Not applicable for semi-annual reports.
Item 5. Audit Committee of Listed Registrants.
Not applicable to registrants who are not listed issuers (as defined in Rule 10A-3 under the Securities Exchange Act of 1934).
Item 6. Investments.
| (a) | Schedule of Investments is included as part of the report to shareholders filed under Item 1 of this Form. |
Item 7. Disclosure of Proxy Voting Policies and Procedures for Closed-End Management Investment Companies.
Not applicable to open-end investment companies.
Item 8. Portfolio Managers of Closed-End Management Investment Companies.
Not applicable to open-end investment companies.
Item 9. Purchases of Equity Securities by Closed‑End Management Investment Company and Affiliated Purchasers.
Not applicable to open-end investment companies.
Item 10. Submission of Matters to a Vote of Security Holders.
There have been no material changes to the procedures by which shareholders may recommend nominees to the registrant’s board of trustees.
Item 11. Controls and Procedures.
| (a) | The Registrant’s President and Treasurer have reviewed the Registrant's disclosure controls and procedures (as defined in Rule 30a-3(c) under the Investment Company Act of 1940 (the “Act”)) as of a date within 90 days of the filing of this report, as required by Rule 30a-3(b) under the Act and Rules 13a-15(b) or 15d‑15(b) under the Securities Exchange Act of 1934. Based on their review, such officers have concluded that the disclosure controls and procedures are effective in ensuring that information required to be disclosed in this report is appropriately recorded, processed, summarized and reported and made known to them by others within the Registrant and by the Registrant’s service provider. |
| (b) | There were no changes in the Registrant's internal control over financial reporting (as defined in Rule 30a-3(d) under the Act) that occurred during the period covered by this report that has materially affected, or is reasonably likely to materially affect, the Registrant's internal control over financial reporting. |
Item 12. Disclosure of Securities Lending Activities for Closed-End Management Investment Companies
Not applicable to open-end investment companies.
Item 13. Exhibits.
| (a) | (1) Any code of ethics or amendment thereto, that is the subject of the disclosure required by Item 2, to the extent that the registrant intends to satisfy Item 2 requirements through filing an exhibit. Incorporated by reference to the Registrants Form N-CSR filed May 9, 2011. |
(3) Any written solicitation to purchase securities under Rule 23c‑1 under the Act sent or given during the period covered by the report by or on behalf of the registrant to 10 or more persons. Not applicable to open-end investment companies.
(4) Change in the registrant’s independent public accountant. There was no change in the registrant’s independent public accountant for the period covered by this report.
SIGNATURES
Pursuant to the requirements of the Securities Exchange Act of 1934 and the Investment Company Act of 1940, the registrant has duly caused this report to be signed on its behalf by the undersigned, thereunto duly authorized.
(Registrant) Trust for Professional Managers
By (Signature and Title)* /s/John Buckel
John Buckel, President
Date 10/26/2023
Pursuant to the requirements of the Securities Exchange Act of 1934 and the Investment Company Act of 1940, this report has been signed below by the following persons on behalf of the registrant and in the capacities and on the dates indicated.
By (Signature and Title)* /s/John Buckel
John Buckel, President
Date 10/26/2023
By (Signature and Title)* /s/Jennifer Lima
Jennifer Lima, Treasurer
Date 10/26/2023
* Print the name and title of each signing officer under his or her signature.