UNITED STATES
SECURITIES AND EXCHANGE COMMISSION
Washington, D.C. 20549
FORM N-CSR
CERTIFIED SHAREHOLDER REPORT OF REGISTERED
MANAGEMENT INVESTMENT COMPANIES
Investment Company Act file number 811-10401
Trust for Professional Managers
(Exact name of registrant as specified in charter)
615 East Michigan Street
Milwaukee, WI 53202
(Address of principal executive offices) (Zip code)
Jay S. Fitton
U.S. Bancorp Fund Services, LLC
615 East Michigan Street
Milwaukee, WI 53202
(Name and address of agent for service)
(513) 629-8104
Registrant's telephone number, including area code
Date of fiscal year end: December 31, 2023
Date of reporting period: June 30, 2023
Item 1. Reports to Stockholders.

SEMI-ANNUAL REPORT
JUNE 30, 2023
- GROWTH FUND (MPGFX)
est. 1958
- BALANCED FUND (MAPOX)
est. 1961
- SMALL CAP FUND (MSCFX)
est. 2011
- MINNESOTA MUNICIPAL BOND ETF (MINN)
est. 2021
MAIRS & POWER FUNDS MARKET COMMENTARY (unaudited)
June 30, 2023
Market Overview | Second Quarter 2023
After a period in bear territory, the S&P 500 Total Return (TR) has risen 24% from its low last fall. Improvement on the inflation front and better than expected economic news have boosted investor confidence. In the second quarter, the S&P 500 TR gained 8.74% and the S&P SmallCap 600 Total Return (TR) was up 3.38%, while the Bloomberg U.S. Government/Credit Bond Index dropped 0.93%. For the year, the S&P 500 TR is up 16.89%, the S&P 600 TR is at 6.03%, and the Bloomberg U.S. Government/Credit Bond Index returned 2.21%.
But the overall performance so far this year masks the fact that most of the market has actually been flat or down. In fact, the top six stocks in the S&P 500 have accounted for virtually all of the market's return this year. Of the remaining stocks in the index, the net return was essentially zero, even though some were up, and some were down. Much of this increase was from the Technology sector which has been driven by investor excitement over artificial intelligence (AI), and most of the performance has been led by five or six big Technology names, such as Alphabet (GOOGL), Amazon (AMZN), Microsoft (MSFT), and Nvidia (NVDA). Strip out those AI-connected powerhouses from the data, and the performance numbers are notably lower.
Additionally, the next 12 months (NTM) price-to-earnings ratio for the S&P 500 continued to expand into overvalued territory at 19.1 times earnings, above the 10-year average of 17.4 times earnings, driven by those same large technology stocks. Valuations outside of tech are more reasonable and sit closer to the long-term average.
That imbalance has also been reflected in uneven earnings numbers, a key to market performance. While results for the first quarter were better than expected, estimates of earnings growth are being reduced, and those estimates vary substantially across sectors of the market.
In 2022, despite the bear market, earnings grew 9%. However, this was well below expectations at the beginning of the year. That trend has continued in 2023. While the consensus estimates call for 2% earnings growth for this year, that number has been reduced over the past several months as well.
All this to say, there's an unusual amount of uncertainty about where we're headed.
The price-to-earnings ratio is a stock valuation metric that compares a company's share price to its earnings per share (EPS). Earnings per share is a company's net profit divided by the number of common shares it has outstanding.
Future Outlook
While some economic indicators remain positive, others suggest unsettled conditions on the horizon. These mixed signals have given rise to a divergent range of forecasts for the rest of the year. Some observers predict a significant recession. Others think that the landing will be a soft one. Still others believe there will be no recession at all, and that the market will continue to post gains.
On the negative side, industry surveys indicate that banks are becoming significantly less willing to lend. In addition, retail spending has slowed to a crawl, particularly for higher priced discretionary goods. The Institute of Supply Management (ISM) index shows a weakening manufacturing sector, with data levels suggesting that recession is likely. And while GDP grew 1.1% in the first quarter, this was a marked slowdown from the 2.6% growth rate in the fourth quarter of 2022.
On the other hand, the ISM services index still indicates growth, and has even improved recently. Additionally, the labor market remains remarkably strong. Despite some major layoffs, U.S. employers have added more than 1.5 million jobs this year through June, unemployment remains near historic lows, and average hourly earnings have been rising at a healthy clip. Also, consumer confidence has improved, helped by the slowing pace of inflation.
1
MAIRS & POWER FUNDS MARKET COMMENTARY (unaudited) (continued)
The housing sector, meanwhile, has been sending mixed messages of its own. In June, the Case-Shiller National Home Price Index fell 1.7% year over year. With mortgage rates at 6.8%, the sales of existing homes have fallen 36% from the peak in early 2021, when interest rates were significantly lower. However, housing turnover has slightly improved recently as buyers adjust to the higher rates. Homeowners with low interest rate mortgages are reluctant to move, so the inventory of homes for sale remains low, keeping prices high.
All this continues to challenge the Federal Reserve (Fed) in its battle against inflation. The headline inflation rate slowed to an annual rate of 3.0% in June, though core inflation, which excludes food and energy, was 4.8% and has shown only moderate improvement this year. At the beginning of the year, there were hopes that the central bank would cut rates in 2023. While the Fed did forgo a rate hike in June, Chairman Jerome Powell has recently signaled at least two more increases are likely as the Fed pursues its goal of getting inflation down to 2%.
As always, we keep a long-term view of the market. We continue to have a favorable long-term view on Technology given the growth in artificial intelligence, automation, and cloud computing but are cautious near-term as valuations appear to be over-extended. While AI has received much of the media coverage of late, we also see value in traditional companies with the ability to utilize a new wave of technological advancement.
Overall, we are witnessing valuations going up due to a narrow market, earnings expectations coming down, and a host of mixed economic signals. However, our outlook for the market remains positive, even if there may be some turbulence in the near term.
Must be preceded or accompanied by a prospectus.
All holdings in the portfolio are subject to change without notice and may or may not represent current or future portfolio composition. The mention of specific securities is not intended as a recommendation or an offer of a particular security, nor is it intended to be a solicitation for the purchase or sale of any security. See the schedule of investments for a complete list of holdings.
S&P 500 Total Return (TR) Index is an unmanaged index of 500 common stocks that is generally considered representative of the U.S. stock market. It is not possible to invest directly in an index.
S&P Small Cap 600 Total Return (TR) Index is an index of small-company managed by Standard & Poor's that covers a broad range of small cap stocks in the U.S. The index is weighted according to market capitalization and covers 3-4% of the total market for equities in the U.S. It tracks both the capital gains of a group of stocks over time and assumes that any cash distributions, such as dividends, are reinvested back in the index. It is not possible to invest directly in an index.
Bloomberg U.S. Government/Credit Bond Index is a broad-based flagship benchmark that measures the non-securitized component of the U.S. Aggregate Index. It includes investment-grade, U.S. dollar-denominated, fixed-rate Treasuries, government-related and corporate securities. It is not possible to invest directly in an index.
GDP is the total monetary or market value of all the finished goods and services produced within a country's borders in a specific time period.
Past performance is not a guarantee of future results.
Foreside Fund Services Distributor.
2
MAIRS & POWER GROWTH FUND (unaudited)
To Our Shareholders: June 30, 2023
The Mairs and Power Growth Fund has had a positive start to the year, up 18.82%. This compares favorably with the S&P 500 TR Index, which was up 16.89% and the peer group as measured by the Morningstar U.S. Large Blend category, which was up 13.39%.
While sector weights relative to the index were a slight drag on relative performance, the real driver of relative outperformance in the first half was stock selection. An underweight of the outperforming Consumer Discretionary sector and overweight of the underperforming Healthcare and Industrial sectors hindered performance, while holding no Energy stocks in that underperforming sector helped relative performance.
Regarding stock selection in the first half, Nvidia (NVDA) was a massive outperformer, up 189.54%. Amazon and Microsoft were also positive contributors, up 55.19% and 42.66%, respectively. All three stocks benefited from a renewed interest in growth stocks by investors in the first half of the year. Nvidia is the leading provider of processors used for artificial intelligence (AI) computation for both learning and inferencing, and its stock rallied significantly on a massive earnings report in the first quarter as cloud data center companies invested heavily in AI.
Amazon (AMZN) had an impressive first half of the year as well with growth out of its retail segment but slightly slower growth in its cloud business. Customers optimized workloads for existing capacity they were already paying for rather than adding incremental capacity in the current environment. We remain very excited about the opportunity for the company to reduce the labor needs of its retail segment through the use of technology and automation in the future.
Microsoft (MSFT) was another positive contributor to performance in the first half. The company continued to take share in cloud computing. Its strong relationships with customers, as well as knowledge of their businesses, differentiates its offering, which is also helped by leading investments in AI. We expect the company will continue to integrate AI tools into most of its productivity suite of software in the not-too-distant future. This should help with employee productivity and the labor constraints of most of its customers.
Notable detractors to performance in the first half were US Bank (USB), Charles Schwab (SCHW), and UnitedHealth Group (UNH), which were down 22.09%, 31.65%, and 8.65%, respectively. US Bank, based in Minnesota, was caught up in the recent mini crisis in the banking industry. The company recently acquired Union Bank for $8 billion, which hit its capital reserve levels, and the timing was unfortunate given the selloff in the industry following that acquisition. However, we believe US Bank should be able to rebuild its capital reserve over the coming quarters, putting it in a better position to withstand future negative events in the industry.
Charles Schwab was also caught up in the banking selloff in March. The company's earnings will likely be pressured in the near term from lower deposit balances and higher cost funding, but we believe these headwinds will eventually abate. In the meantime, the company continues to take share from its competitors thanks to its low-cost position.
Another detractor from relative performance was UnitedHealth Group, which was down 8.65%. However, we have a positive long-term view of the company, headquartered in Minnesota, and especially its potential when it comes to harnessing its vast amounts of patient data via AI. Additionally, its Optum unit, which provides technology and data-driven care delivery, has AI-enabled tools that can help healthcare providers drive more efficient and accurate care to patients.
Much like the inception of the internet, we believe the recent advancements in artificial intelligence can pave the way for large-scale improvements in productivity in the future. While it won't happen overnight, we are excited to see the companies that can provide or enable the new technology, and the advantages they can harness into the future.
Most of this year's market outperformance has been led by just a handful of stocks primarily in the Technology sector. Many other sectors of the economy have not performed nearly as well, and we are finding particularly
3
MAIRS & POWER GROWTH FUND (unaudited) (continued)
attractive valuations in so-called old economy industries such as: healthcare, financials, and utilities. As long-term investors, we are currently taking advantage of these companies' short-term weakness and adding to our positions in names such as: US Bank, JPMorgan (JPM), and Alliant Energy (LNT).
In summary, stock selection was the primary driver of relative outperformance in the first half. While the Fund has historically been underweight the Technology sector, we took advantage of a selloff in that sector last year to build up the Fund's Technology position to nearly a market weight. That addition has allowed the Fund to perform well during a massive rally in the Technology sector in the first half. We are pleased that this positioning has allowed our positive stock selection to shine through in the first half of the year. In addition, the uncertain market conditions have allowed us to take advantage of opportunities to invest in companies with durable competitive advantages at reasonable valuations, and we believe will lead to positive performance over the long term.
Andy Adams
Lead Manager | | Pete Johnson
Co-Manager | |
MAIRS & POWER GROWTH FUND YTD CONTRIBUTORS
as of 6/30/2023
Largest Contributors To
Relative Performance | | Largest Detractors To
Relative Performance | |
NVIDIA Corporation | | | 189.54 | % | | Charles Schwab Corp | | | -31.65 | % | |
Amazon.com, Inc. | | | 55.19 | % | | U.S. Bancorp | | | -22.09 | % | |
Microsoft Corporation | | | 42.66 | % | | Hormel Foods Corporation | | | -10.55 | % | |
Alphabet Inc. Class C | | | 36.33 | % | | Toro Company | | | -9.59 | % | |
Graco Inc. | | | 29.24 | % | | UnitedHealth Group Incorporated | | | -8.65 | % | |
Largest relative contributors and detractors are securities that were selected based on their contribution to the portfolio as of June 30, 2023. The performance number shown is total return of the security for the period and includes only securities held for the entire period. Total return is the amount of value an investor earns from a security over a specific period and when distributions are reinvested.
All holdings in the portfolio are subject to change without notice and may or may not represent current or future portfolio composition. The mention of specific securities is not intended as a recommendation or an offer of a particular security, nor is it intended to be a solicitation for the purchase or sale of any security.
All investments have risks. The Growth Fund is designed for long-term investors. Equity investments are subject to market fluctuations and the Fund's share price can fall because of weakness in the broad market, a particular industry or specific holdings. Investments in small and midcap companies generally are more volatile. International investing risks include among others political, social or economic instability, difficulty in predicting international trade patterns, taxation and foreign trading practices and greater fluctuations in price than U.S. corporations.
This commentary includes forward-looking statements such as economic predictions and portfolio manager opinions. The statements are subject to change at any time based on market and other conditions. No predictions, forecasts, outlooks, expectations or beliefs are guaranteed.
S&P 500 Total Return (TR) Index is an unmanaged index of 500 common stocks that is generally considered representative of the U.S. stock market. It is not possible to invest directly in an index.
Morningstar U.S. Fund Large-Blend portfolios are fairly representative of the overall U.S. stock marketing in size, growth rates, and price. Stocks in the to 70% of the capitalization of the U.S equity market are defined as large-cap. The blend style is assigned to portfolios where neither growth nor value characteristics predominate. These portfolios tend to invest across the spectrum of U.S. industries, and owing to their broad exposure, the portfolios' returns are often similar to those of the S&P 500 Index.
4
Mairs & Power Growth Fund
PERFORMANCE INFORMATION (unaudited) June 30, 2023
Ten years of investment performance (through June 30, 2023)
This chart illustrates the performance of a hypothetical $10,000 investment made in the Fund 10 years ago.

Average annual total returns for periods ended June 30, 2023
| | | 1 year | | 5 years | | 10 years | | 20 years | |
Mairs & Power Growth Fund(1) | | | 19.75 | % | | | 12.19 | % | | | 11.29 | % | | | 10.08 | % | |
S&P 500 Total Return Index(2) | | | 19.59 | % | | | 12.31 | % | | | 12.86 | % | | | 10.04 | % | |
Performance data quoted represents past performance and does not guarantee future results. All performance information shown includes the reinvestment of dividend and capital gain distributions, but does not reflect the deduction of taxes that a shareholder would pay on Fund distributions or the redemption of Fund shares. The investment return and principal value of an investment will fluctuate so that an investor's shares, when redeemed, may be worth more or less than their original cost. Current performance of the Fund may be lower or higher than the performance quoted. For the most recent month-end performance figures, visit the Fund's website at www.mairsandpower.com or call Shareholder Services at (800) 304-7404. Per the Prospectus dated April 30, 2023, the expense ratio for the Fund is 0.63%. See the Financial Highlights in this report for the most recent expense ratio.
(1) Performance figures reflect the historical performance of the Mairs & Power Growth Fund (the "Predecessor Growth Fund"), a series of Mairs & Power Funds Trust, for periods prior to April 29, 2022.
(2) The S&P 500 Total Return Index is an unmanaged index of 500 common stocks that is generally considered representative of the U.S. stock market. It tracks both the capital gains of a group of stocks over time and assumes that any cash distributions, such as dividends, are reinvested back into the index. It is not possible to invest directly in an index.
5
Mairs & Power Growth Fund
FUND INFORMATION (unaudited) June 30, 2023
Portfolio Managers
Andrew R. Adams, CFA, lead manager of the Mairs & Power Growth Fund and Predecessor Growth Fund since April 1, 2019, co-manager from January 1, 2015 through April 1, 2019, University of Wisconsin-Madison, MS Finance 1997
Peter J. Johnson, CFA, co-manager of the Mairs & Power Growth Fund and Predecessor Growth Fund since April 1, 2019, University of Wisconsin-Madison, MBA Applied Security Analysis 2010
General Information
Fund Symbol | | | MPGFX | | |
Net Asset Value (NAV) Per Share | | $ | 139.65 | | |
Expense Ratio | | | 0.63 | % | |
Portfolio Turnover Rate | | | 7.38 | % | |
Sales Charge | | | None1 | | |
Fund Inception Year | | | 1958 | | |
Portfolio Composition
Top Ten Portfolio Holdings
(Percent of Total Net Assets)2
Microsoft Corp | | | 9.8 | % | |
Amazon.com Inc | | | 5.5 | | |
UnitedHealth Group Inc | | | 5.1 | | |
Nvidia Corp | | | 5.0 | | |
Alphabet Inc | | | 4.2 | | |
Graco Inc | | | 4.1 | | |
JP Morgan Chase & Co | | | 3.6 | | |
Toro Co/The | | | 3.3 | | |
Ecolab Inc | | | 3.1 | | |
Littelfuse Inc | | | 3.0 | | |
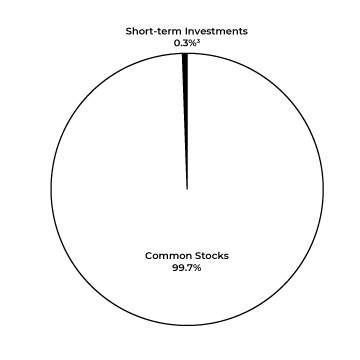
Portfolio Diversification
(Percent of Total Net Assets)
Common Stocks 99.7% | |
Information Technology | | | 25.5 | % | |
Industrials | | | 18.4 | | |
Health Care | | | 17.7 | | |
Financials | | | 14.1 | | |
Materials | | | 7.2 | | |
Consumer Discretionary | | | 6.2 | | |
Communication Services | | | 4.3 | | |
Consumer Staples | | | 3.9 | | |
Utilities | | | 2.4 | | |
Short-term Investments 0.3%3 | | | 0.3 | | |
| | | | 100.0 | % | |
1 Although the Fund is no-load, investment management fees and other expenses still apply.
2 All holdings in the portfolio are subject to change without notice and may or may not represent current or future portfolio composition. The mention of specific securities is not intended as a recommendation or offer for a particular security, nor is it intended to be a solicitation for the purchase or sale of any security.
3 Represents short-term investments and other assets and liabilities (net).
The Schedule of Investments and portfolio diversification utilize the Global Industry Classification Standard (GICS®) which was developed by and/or is the exclusive property of MSCI, Inc. and Standard & Poor's Financial Services LLC ("S&P"). GICS is a service mark of MSCI, Inc. and S&P and has been licensed for use by Mairs & Power, Inc. (the "Adviser").
6
Mairs & Power Growth Fund
SCHEDULE OF INVESTMENTS (unaudited) June 30, 2023
Shares | | Security Description | | Value | |
| | | COMMON STOCKS 99.7% | |
| | | COMMUNICATION SERVICES 4.3% | |
| | 1,706,556 | | | Alphabet Inc (a) | | $ | 206,442,079 | | |
| | | CONSUMER DISCRETIONARY 6.2% | |
| | 2,055,000 | | | Amazon.com Inc (a) | | | 267,889,800 | | |
| | 157,999 | | | Gentherm Inc (a) | | | 8,928,524 | | |
| | 218,000 | | | Polaris Inc | | | 26,362,740 | | |
| | | | 303,181,064 | | |
| | | CONSUMER STAPLES 4.0% | |
| | 3,041,592 | | | Hormel Foods Corp | | | 122,332,830 | | |
| | 802,000 | | | Sysco Corp | | | 59,508,400 | | |
| | 75,870 | | | Target Corp | | | 10,007,253 | | |
| | | | 191,848,483 | | |
| | | FINANCIALS 14.1% | |
| | 924,000 | | | Charles Schwab Corp/The | | | 52,372,320 | | |
| | 989,000 | | | Fiserv Inc (a) | | | 124,762,350 | | |
| | 1,197,000 | | | JPMorgan Chase & Co | | | 174,091,680 | | |
| | 191,000 | | | Northern Trust Corp | | | 14,160,740 | | |
| | 608,194 | | | Principal Financial Group Inc | | | 46,125,433 | | |
| | 4,209,000 | | | US Bancorp/MN | | | 139,065,360 | | |
| | 290,000 | | | Visa Inc | | | 68,869,200 | | |
| | 1,550,000 | | | Wells Fargo & Co | | | 66,154,000 | | |
| | | | 685,601,083 | | |
| | | HEALTH CARE 17.7% | |
| | 411,304 | | | Abbott Laboratories | | | 44,840,362 | | |
| | 1,620,800 | | | Bio-Techne Corp | | | 132,305,904 | | |
| | 447,000 | | | Catalent Inc (a) | | | 19,381,920 | | |
| | 162,000 | | | Eli Lilly & Co | | | 75,974,760 | | |
| | 672,166 | | | Johnson & Johnson | | | 111,256,917 | | |
| | 1,624,000 | | | Medtronic PLC (b) | | | 143,074,400 | | |
| | 2,292,000 | | | Roche Holding AG (c) | | | 87,554,400 | | |
| | 515,000 | | | UnitedHealth Group Inc | | | 247,529,600 | | |
| | | | 861,918,263 | | |
| | | INDUSTRIALS 18.4% | |
| | 222,000 | | | CH Robinson Worldwide Inc | | | 20,945,700 | | |
| | 1,154,159 | | | Donaldson Co Inc | | | 72,146,479 | | |
| | 1,907,000 | | | Fastenal Co | | | 112,493,930 | | |
| | 81,000 | | | Generac Holdings Inc (a) | | | 12,079,530 | | |
| | 2,295,000 | | | Graco Inc | | | 198,173,250 | | |
| | 225,000 | | | Honeywell International Inc | | | 46,687,500 | | |
| | 2,009,659 | | | nVent Electric PLC (b) | | | 103,839,081 | | |
7
Mairs & Power Growth Fund
SCHEDULE OF INVESTMENTS (unaudited) (continued) June 30, 2023
Shares | | Security Description | | Value | |
| | | COMMON STOCKS (continued) | |
| | | INDUSTRIALS (continued) | |
| | 295,000 | | | Rockwell Automation Inc | | $ | 97,187,750 | | |
| | 847,966 | | | Tennant Co (f) | | | 68,778,522 | | |
| | 1,573,523 | | | Toro Co/The | | | 159,948,613 | | |
| | | | 892,280,355 | | |
| | | INFORMATION TECHNOLOGY 25.5% (e) | |
| | 476,097 | | | Digi International Inc (a) | | | 18,753,461 | | |
| | 693,000 | | | Entegris Inc | | | 76,798,260 | | |
| | 425,442 | | | Jamf Holding Corp (a) | | | 8,304,628 | | |
| | 500,000 | | | Littelfuse Inc | | | 145,655,000 | | |
| | 1,395,000 | | | Microsoft Corp | | | 475,053,300 | | |
| | 310,500 | | | Motorola Solutions Inc | | | 91,063,440 | | |
| | 572,797 | | | NVIDIA Corp | | | 242,304,587 | | |
| | 859,000 | | | QUALCOMM Inc | | | 102,255,360 | | |
| | 114,000 | | | salesforce.com Inc (a) | | | 24,083,640 | | |
| | 512,857 | | | Workiva Inc (a) | | | 52,137,042 | | |
| | | | 1,236,408,718 | | |
| | | MATERIALS 7.2% | |
| | 807,314 | | | Ecolab Inc | | | 150,717,451 | | |
| | 1,258,921 | | | HB Fuller Co | | | 90,025,441 | | |
| | 403,953 | | | Sherwin-Williams Co/The | | | 107,257,600 | | |
| | | | 348,000,492 | | |
| | | UTILITIES 2.4% | |
| | 2,235,000 | | | Alliant Energy Corp | | | 117,292,800 | | |
| | | | | TOTAL COMMON STOCKS
(cost $2,391,077,941) | | $ | 4,842,973,337
| | |
| | | SHORT-TERM INVESTMENTS 0.1% | |
| 6,274,424 | | | First American Government Obligations Fund, Class X, 0.0508% (d)
(cost $6,274,424) | | $ | 6,274,424 | | |
| | | | TOTAL INVESTMENTS 99.8%
(cost $2,397,352,365) | | $ | 4,849,247,761 | | |
| | | | | OTHER ASSETS AND LIABILITIES (NET) 0.2% | | | 9,834,789 | | |
| | | | | TOTAL NET ASSETS 100.0% | | $ | 4,859,082,550 | | |
8
Mairs & Power Growth Fund
SCHEDULE OF INVESTMENTS (unaudited) (continued) June 30, 2023
(a) Non-income producing.
(b) Issuer headquartered overseas but considered domestic. The Adviser defines foreign issuers as those whose operational leadership or headquarters is located in a foreign country; provided, however, if an issuer is believed by the Adviser to be headquartered in a jurisdiction primarily for tax purposes, the Adviser will consider the following additional factors: 1) the location of the primary exchange trading its securities; 2) where it derives the majority of its revenues; and/or 3) where it earns the majority of its profits.
(c) American Depositary Receipt
(d) The rate quoted is the annualized seven-day effective yield as of June 30, 2023.
(e) The Fund is significantly invested in the information technology sector and therefore is subject to additional risks. Companies in the information technology sector and companies that rely heavily on technology are particularly vulnerable to rapid changes in technology product cycles, rapid product obsolescence, government regulation and competition.
(f) Previously deemed an affiliated company (Note 5).
The Global Industry Classification Standard (GICS®) was developed by and/or is the exclusive property of MSCI, Inc. and Standard & Poor's Financial Services LLC ("S&P"). GICS is a service mark of MSCI, Inc. and S&P and has been licensed for use by the Adviser.
See accompanying Notes to Financial Statements.
9
MAIRS & POWER BALANCED FUND (unaudited)
To Our Shareholders: June 30, 2023
The Mairs and Power Balanced Fund finished the first half of 2023 up 7.33%. The Fund underperformed the benchmark composite index (60% S&P 500 Total Return Index and 40% Bloomberg US Government/Credit Bond Index), which was up 10.86%, while the Morningstar US Moderate Allocation peer group rose 7.33%.
The Fund's asset allocation positively impacted performance as the Fund remains overweight stocks in a period where stocks outperformed bonds. Both asset classes delivered positive returns, however, equities underperformed the respective index while the fixed income portion slightly outperformed its index.
Last year's interest rate increases led the equity markets to prefer value stocks as investors preferred current earnings more than growth and future earnings. As investors anticipated the end of rising interest rates, markets reversed this preference in the first half of 2023. More specifically, a handful of mega cap stocks comprised market leadership during the first half of the year, where the Fund did not have exposure to these names. In the second quarter, a flurry of optimism around artificial intelligence (AI) led to a buying frenzy in any company related to AI, but the Fund's investments did not benefit accordingly.
The Fund's underweight to Technology, which had a positive impact in 2022, negatively affected relative performance during the first half of 2023. The majority of the underperformance was attributable to the absence of Apple (AAPL) and NVIDIA (NVDA) from the Fund's holdings. Microsoft (MSFT), the Fund's largest holding overall, was up over 40%. Microsoft is the leader in enterprise technology (cloud and software) and its leadership in AI helped propel it to new all-time highs during the quarter. Entegris (ENTG) and Salesforce (CRM) aided relative performance with Entegris benefitting from an improving outlook for semiconductor capital spend and Salesforce seeing significant improvement in expected profitability. A Technology name we took the opportunity to increase our exposure to was Texas Instruments (TXN). They are in the midst of a significant investment in manufacturing capacity which we believe will enable its continued long-term growth.
Consumer Discretionary contributed to underperformance after outperforming last year. The majority of the underperformance was attributable to the absence of Amazon (AMZN) and Tesla (TSLA) from the Fund's holdings. The Fund only holds one company in this sector, the Home Depot (HD), which underperformed during the first half of 2023 as higher interest rates have slowed home improvement activity.
Communication Services underperformed due to the lack of Fund holdings in Meta (META), which owns Facebook and Instagram. Our overweight to Alphabet (GOOG), which owns Google and YouTube, allowed us to participate in some of the sector's positive performance. Our lack of Energy holdings helped relative performance during the first half of 2023 in what has proven to be a volatile sector. Likewise, our lack of Real Estate holdings helped relative performance as real estate continues to suffer from lower occupancy and higher interest rates. In the Materials sector, Ecolab (ECL) saw sales and margin improvement which aided sector outperformance.
The underweight to Utilities aided relative performance with our only holding being Xcel Energy (XEL). During the first half of the year, Xcel had a lower-than-expected return on equity (ROE) ruling for the state of Minnesota, which caused it underperform its peers. Return on equity is a key measure of profitability. Still, Xcel has one of the best track records for any management team in the utility industry, and we anticipate they will manage through this well. Accordingly, we took the opportunity to add to the portfolio's position.
The Fund's fixed income portfolio slightly outperformed its respective benchmark during the first half of 2023. The Fund has been generally overweight to corporate bonds and typically has a shorter duration to maturity than the benchmark. The anticipated slowing of the economy impacted certain areas of corporate credit to which the Fund had a greater exposure. Unfortunately, the fixed income portfolio had a small holding of Silicon Valley Bank, which we exited after the failure of the bank in an effort to capture as much value as possible. Although this was a small position held within a diversified portfolio, it still negatively impacted relative returns. Other regional bank exposures also negatively impacted relative returns. After thorough analysis, we have confidence that the Fund's other regional bank holdings are well positioned to not experience a similar event
10
MAIRS & POWER BALANCED FUND (unaudited) (continued)
to that of Silicon Valley Bank. Our focus has been and will continue to be to selectively underwrite companies to achieve long-term outperformance. Interest rates were roughly unchanged on the 10-year bond from 3.88% to start the year to 3.84% at mid-year, making rate changes less impactful on portfolio performance.
Kevin Earley
Lead Manager | | Robert Thompson
Co-Manager | |
MAIRS & POWER BALANCED FUND YTD CONTRIBUTORS
as of 6/30/2023
Largest Contributors To
Relative Performance | | Largest Detractors To
Relative Performance | |
Alphabet Inc. Class C | | | 36.33 | % | | U.S. Bancorp | | | -22.09 | % | |
Graco Inc. | | | 29.24 | % | | Northern Trust Corporation | | | -14.64 | % | |
Ecolab Inc. | | | 29.07 | % | | Hormel Foods Corporation | | | -10.55 | % | |
Eli Lilly & Company | | | 28.94 | % | | Toro Company | | | -9.59 | % | |
Fiserv, Inc. | | | 24.81 | % | | UnitedHealth Group Incorporated | | | -8.65 | % | |
Largest relative contributors and detractors are securities that were selected based on their contribution to the portfolio as of June 30, 2023. The performance number shown is total return of the security for the period and includes only securities held for the entire period. Total return is the amount of value an investor earns from a security over a specific period and when distributions are reinvested. Past performance does not guarantee future results.
Duration is a measure of the sensitivity of the price of a bond or other debt instrument to a change in interest rates.
All holdings in the portfolio are subject to change without notice and may or may not represent current or future portfolio composition. The mention of specific securities is not intended as a recommendation or an offer of a particular security, nor is it intended to be a solicitation for the purchase or sale of any security.
All investments have risks. The Balanced Fund is designed for long-term investors. The Fund's share price can fall because of weakness in the broad market, a particular industry or specific holdings. Investments in small and midcap companies generally are more volatile. International investing risks include among others political, social or economic instability, difficulty in predicting international trade patterns, taxation and foreign trading practices and greater fluctuations in price than U.S. corporations. The Balanced Fund is subject to yield and share price variances with changes in interest rates and market conditions. Investors should note that if interest rates rise significantly from current levels, bond total returns will decline and may even turn negative in the short-term. There is also a chance that some of the Balanced Fund's holdings may have their credit rating downgraded or may default.
Investments in debt securities typically decrease in value when interest rates rise. This risk is usually greater for longer-term debt securities. Investments in lower rated and non-rated securities present a greater risk of loss to principal and interest than higher rated securities.
This commentary includes forward-looking statements such as economic predictions and portfolio manager opinions. The statements are subject to change at any time based on market and other conditions. No predictions, forecasts, outlooks, expectations or beliefs are guaranteed.
Composite Index reflects an unmanaged portfolio of 60% of the S&P 500 TR Index and 40% of the Bloomberg Barclays U.S. Government/Credit Bond Index. It is not possible to invest directly in an index.
Morningstar US Moderate Allocation is designed to benchmark target-date and target-risk investment products. Index is based on well-established asset allocation methodology from Ibbotson Associates, a Morningstar company. Index has 60% global equity exposure and 40% global bond exposure.
11
MAIRS & POWER BALANCED FUND (unaudited) (continued)
S&P 500 Total Return (TR) Index is an unmanaged index of 500 common stocks that is generally considered representative of the U.S. stock market. It is not possible to invest directly in an index.
Bloomberg U.S. Government/Credit Bond Index is a broad-based flagship benchmark that measures the non-securitized component of the U.S. Aggregate Index. It includes investment-grade, U.S. dollar-denominated, fixed-rate Treasuries, government-related and corporate securities. It is not possible to invest directly in an index.
12
Mairs & Power Balanced Fund
PERFORMANCE INFORMATION (unaudited) June 30, 2023
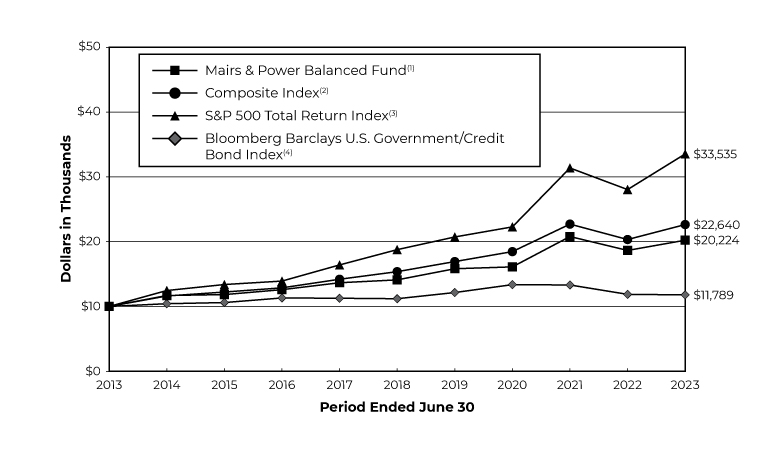
Ten years of investment performance (through June 30, 2023)
This chart illustrates the performance of a hypothetical $10,000 investment made in the Fund 10 years ago.
Average annual total returns for periods ended June 30, 2023
| | | 1 year | | 5 years | | 10 years | | 20 years | |
Mairs & Power Balanced Fund(1) | | | 8.45 | % | | | 7.47 | % | | | 7.30 | % | | | 7.64 | % | |
Composite Index(2) | | | 11.36 | % | | | 8.05 | % | | | 8.51 | % | | | 7.47 | % | |
S&P 500 Total Return Index(3) | | | 19.59 | % | | | 12.31 | % | | | 12.86 | % | | | 10.04 | % | |
Bloomberg U.S. Government/
Credit Bond Index(4) | | | -0.70 | % | | | 1.03 | % | | | 1.66 | % | | | 3.03 | % | |
Performance data quoted represents past performance and does not guarantee future results. All performance information shown includes the reinvestment of dividend and capital gain distributions, but does not reflect the deduction of taxes that a shareholder would pay on Fund distributions or the redemption of Fund shares. The investment return and principal value of an investment will fluctuate so that an investor's shares, when redeemed, may be worth more or less than their original cost. Current performance of the Fund may be lower or higher than the performance quoted. For the most recent month-end performance figures, visit the Fund's website at www.mairsandpower.com or call Shareholder Services at (800) 304-7404. Per the Prospectus dated April 30, 2023, the expense ratio for the Fund is 0.69%. See the Financial Highlights in this report for the most recent expense ratio.
(1) Performance figures reflect the historical performance of the Mairs & Power Balanced Fund (the "Predecessor Balanced Fund"), a series of Mairs & Power Funds Trust, for periods prior to April 29, 2022.
(2) The Composite Index reflects an unmanaged portfolio comprised of 60% of the S&P 500 Total Return Index and 40% of the Bloomberg Barclays U.S. Government/Credit Bond Index. It is not possible to invest directly in an index.
(3) The S&P 500 Total Return Index is an unmanaged index of 500 common stocks that is generally considered representative of the U.S. stock market. It tracks both the capital gains of a group of stocks over time and assumes that any cash distributions, such as dividends, are reinvested back into the index. It is not possible to invest directly in an index.
(4) The Bloomberg U.S. Government/Credit Bond Index is a broad-based flagship benchmark that measures the non-securitized component of the U.S. Aggregate Index. It includes investment-grade, U.S. dollar-denominated, fixed-rate Treasuries, government-related and corporate securities. It is not possible to invest directly in an index.
13
Mairs & Power Balanced Fund
FUND INFORMATION (unaudited) June 30, 2023
Portfolio Managers
Kevin V. Earley, CFA, lead manager of the Mairs & Power Balanced Fund and Predecessor Balanced Fund since April 1, 2018, co-manager from January 1, 2015 through April 1, 2018, University of Minnesota, MBA Finance 1990
Robert W. Thompson, CFA, co-manager of the Mairs & Power Balanced Fund and Predecessor Balanced Fund since April 1, 2018, University of Minnesota, MBA Finance 1995
General Information
Fund Symbol | | | MAPOX | | |
Net Asset Value (NAV) Per Share | | $ | 98.85 | | |
Expense Ratio | | | 0.70 | % | |
Portfolio Turnover Rate | | | 5.20 | % | |
Sales Charge | | | None1 | | |
Fund Inception Year | | | 1961 | | |
Portfolio Composition
Top Ten Common Stock Holdings
(Percent of Total Net Assets)2
Microsoft Corp | | | 4.0 | % | |
Alphabet Inc | | | 3.7 | | |
Fiserv Inc | | | 2.7 | | |
JP Morgan Chase & Co | | | 2.6 | | |
Abbott Laboratories | | | 2.4 | | |
Eli Lilly & Co | | | 2.3 | | |
Toro Co/The | | | 2.3 | | |
UnitedHealth Group Inc | | | 2.3 | | |
Ecolab Inc | | | 2.0 | | |
Graco Inc | | | 2.0 | | |
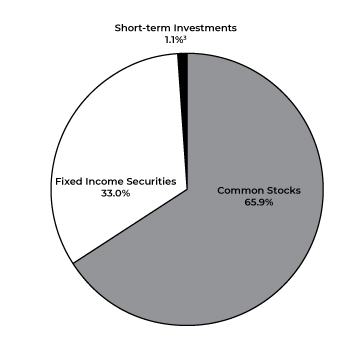
Portfolio Diversification
(Percent of Total Net Assets)
Fixed Income Securities 33.0% | |
Corporate Bonds | | | 28.3 | % | |
U.S. Government Obligations | | | 2.2 | | |
Asset Backed Securities | | | 1.4 | | |
Municipal Bonds | | | 1.1 | | |
Common Stocks 65.9% | |
Health Care | | | 14.6 | % | |
Financials | | | 12.1 | | |
Information Technology | | | 11.9 | | |
Industrials | | | 11.0 | | |
Consumer Staples | | | 5.1 | | |
Communications Services | | | 4.4 | | |
Materials | | | 4.4 | | |
Consumer Discretionary | | | 1.2 | | |
Utilities | | | 1.2 | | |
Short-term Investments 1.1%3 | | | 1.1 | | |
| | | | 100.0 | % | |
1 Although the Fund is no-load, investment management fees and other expenses still apply.
2 All holdings in the portfolio are subject to change without notice and may or may not represent current or future portfolio composition. The mention of specific securities is not intended as a recommendation or offer for a particular security, nor is it intended to be a solicitation for the purchase or sale of any security.
3 Represents short-term investments and other assets and liabilities (net).
The Schedule of Investments and portfolio diversification utilize the Global Industry Classification Standard (GICS®) which was developed by and/or is the exclusive property of MSCI, Inc. and Standard & Poor's Financial Services LLC ("S&P"). GICS is a service mark of MSCI, Inc. and S&P and has been licensed for use by Mairs & Power, Inc. (the "Adviser").
14
Mairs and Power Balanced Fund
SCHEDULE OF INVESTMENTS (unaudited) June 30, 2023
Par Value | | Security Description | | Value | |
| | | FIXED INCOME SECURITIES 33.0% | |
| | | CORPORATE BONDS 28.3% | |
| | | COMMUNICATION SERVICES 1.3% | |
$ | 1,688,000 | | | Netflix Inc | | | 5.875 | % | | 11/15/28 | | $ | 1,745,633 | | |
| | 1,000,000 | | | Warnermedia Holdings, Inc. | | | 4.279 | % | | 03/15/32 | | | 887,482 | | |
| | 2,000,000 | | | Comcast Corp | | | 4.250 | % | | 01/15/33 | | | 1,900,228 | | |
| | 1,000,000 | | | Verizon Communications Inc | | | 4.400 | % | | 11/01/34 | | | 922,989 | | |
| | 1,880,000 | | | Cox Communications Inc (b) | | | 4.800 | % | | 02/01/35 | | | 1,693,220 | | |
| | 3,000,000 | | | AT&T Inc | | | 4.500 | % | | 05/15/35 | | | 2,758,203 | | |
| | | | 9,907,755 | | |
| | | CONSUMER DISCRETIONARY 3.1% | |
| | 1,000,000 | | | General Motors Financial Co Inc | | | 3.950 | % | | 04/13/24 | | | 984,600 | | |
| | 250,000 | | | General Motors Co | | | 4.000 | % | | 04/01/25 | | | 242,952 | | |
| | 1,064,000 | | | Block Financial LLC | | | 5.250 | % | | 10/01/25 | | | 1,041,256 | | |
| | 2,245,000 | | | Lear Corp | | | 3.800 | % | | 09/15/27 | | | 2,085,306 | | |
| | 1,000,000 | | | General Motors Co | | | 4.200 | % | | 10/01/27 | | | 947,755 | | |
| | 1,000,000 | | | AutoNation Inc | | | 3.800 | % | | 11/15/27 | | | 916,281 | | |
| | 2,000,000 | | | Hasbro Inc | | | 3.900 | % | | 11/19/29 | | | 1,808,229 | | |
| | 2,000,000 | | | Advance Auto Parts Inc | | | 3.900 | % | | 04/15/30 | | | 1,704,810 | | |
| | 2,000,000 | | | Mohawk Industries Inc | | | 3.625 | % | | 05/15/30 | | | 1,806,281 | | |
| | 2,000,000 | | | Block Financial LLC | | | 3.875 | % | | 08/15/30 | | | 1,765,930 | | |
| | 1,000,000 | | | Kohl's Corp (a) | | | 3.625 | % | | 05/01/31 | | | 691,220 | | |
| | 1,750,000 | | | Ford Motor Credit Co LLC | | | 3.625 | % | | 06/17/31 | | | 1,436,273 | | |
| | 1,000,000 | | | Starbucks Corp | | | 3.000 | % | | 02/14/32 | | | 868,304 | | |
| | 500,000 | | | Tapestry Inc | | | 3.050 | % | | 03/15/32 | | | 399,473 | | |
| | 500,000 | | | Ford Motor Co | | | 6.100 | % | | 08/19/32 | | | 483,682 | | |
| | 2,000,000 | | | eBay, Inc | | | 6.300 | % | | 11/22/32 | | | 2,101,204 | | |
| | 500,000 | | | Kohl's Corp | | | 6.875 | % | | 12/15/37 | | | 333,060 | | |
| | 1,000,000 | | | General Motors Co | | | 5.150 | % | | 04/01/38 | | | 890,395 | | |
| | 1,000,000 | | | Ford Motor Co | | | 4.750 | % | | 01/15/43 | | | 769,996 | | |
| | 1,100,000 | | | Whirlpool Corp | | | 5.150 | % | | 03/01/43 | | | 978,795 | | |
| | 750,000 | | | Hasbro Inc | | | 5.100 | % | | 05/15/44 | | | 662,284 | | |
| | 1,073,000 | | | Kohl's Corp | | | 5.550 | % | | 07/17/45 | | | 639,894 | | |
| | 1,000,000 | | | Wildlife Conservation Society | | | 3.414 | % | | 08/01/50 | | | 714,939 | | |
| | | | 24,272,919 | | |
| | | CONSUMER STAPLES 1.2% | |
| | 2,500,000 | | | Land O' Lakes Inc (b) (c) | | | 7.250 | % | | 07/14/27 | | | 2,025,000 | | |
| | 1,949,000 | | | Land O' Lakes Capital Trust I (b) | | | 7.450 | % | | 03/15/28 | | | 1,851,550 | | |
| | 2,500,000 | | | Land O' Lakes Inc (b) (c) | | | 7.000 | % | | 12/18/28 | | | 2,055,675 | | |
| | 250,000 | | | Smithfield Foods Inc (b) | | | 3.000 | % | | 10/15/30 | | | 196,138 | | |
| | 1,000,000 | | | Walgreens Boots Alliance Inc | | | 4.500 | % | | 11/18/34 | | | 888,308 | | |
| | 1,000,000 | | | Anheuser-Busch Cos LLC / Anheuser-Busch InBev
Worldwide Inc | | | 4.700 | % | | 02/01/36 | | | 972,919 | | |
15
Mairs and Power Balanced Fund
SCHEDULE OF INVESTMENTS (unaudited) (continued) June 30, 2023
Par Value | | Security Description | | Value | |
| | | FIXED INCOME SECURITIES (continued) | |
| | | CORPORATE BONDS (continued) | |
| | | CONSUMER STAPLES (continued) | |
$ | 1,000,000 | | | Walgreens Boots Alliance Inc | | | 4.800 | % | | 11/18/44 | | $ | 821,702 | | |
| | 1,000,000 | | | Molson Coors Brewing Co | | | 4.200 | % | | 07/15/46 | | | 828,053 | | |
| | | | 9,639,345 | | |
| | | ENERGY 0.3% | |
| | 1,000,000 | | | Boardwalk Pipelines LP | | | 4.950 | % | | 12/15/24 | | | 984,236 | | |
| | 1,200,000 | | | Kinder Morgan Inc | | | 5.300 | % | | 12/01/34 | | | 1,155,730 | | |
| | 500,000 | | | Murphy Oil Corp (a) | | | 6.125 | % | | 12/01/42 | | | 416,303 | | |
| | | | 2,556,269 | | |
| | | FINANCIALS 10.8% | |
| 500,000
| | | BAC Capital Trust XIV (c) (i)
| | | 5.952% (3 Month
LIBOR USD +
0.400%) | | |
04/17/23 | | | 385,496 | | |
| | 84,000 | | | Assurant Inc | | | 4.200 | % | | 09/27/23 | | | 83,430 | | |
| | 500,000 | | | Pacific Life Insurance Co (b) | | | 7.900 | % | | 12/30/23 | | | 503,213 | | |
| | 1,000,000 | | | HSBC Holdings PLC (d) | | | 4.250 | % | | 03/14/24 | | | 987,459 | | |
| | 540,000 | | | Wintrust Financial Corp | | | 5.000 | % | | 06/13/24 | | | 527,825 | | |
| | 824,000 | | | Assured Guaranty US Holdings Inc | | | 5.000 | % | | 07/01/24 | | | 809,481 | | |
| | 3,088,000 | | | Legg Mason Inc | | | 3.950 | % | | 07/15/24 | | | 3,015,808 | | |
| | 1,500,000 | | | Symetra Financial Corp | | | 4.250 | % | | 07/15/24 | | | 1,459,008 | | |
| | 1,000,000 | | | Citigroup Inc | | | 4.000 | % | | 08/05/24 | | | 979,729 | | |
| | 3,000,000 | | | Synchrony Financial | | | 4.250 | % | | 08/15/24 | | | 2,893,292 | | |
| | 2,000,000 | | | Old Republic International Corp | | | 4.875 | % | | 10/01/24 | | | 1,961,694 | | |
| | 1,627,000 | | | Associated Banc-Corp | | | 4.250 | % | | 01/15/25 | | | 1,520,841 | | |
| | 4,000,000 | | | Kemper Corp | | | 4.350 | % | | 02/15/25 | | | 3,851,035 | | |
| | 1,050,000 | | | TCF National Bank | | | 4.600 | % | | 02/27/25 | | | 989,634 | | |
| | 1,000,000 | | | BBVA USA | | | 3.875 | % | | 04/10/25 | | | 955,089 | | |
| | 250,000 | | | Liberty Mutual Insurance Co (b) | | | 8.500 | % | | 05/15/25 | | | 255,760 | | |
| | 1,000,000 | | | Prudential Insurance Co of America/The (b) | | | 8.300 | % | | 07/01/25 | | | 1,036,505 | | |
| | 1,000,000 | | | Synchrony Financial | | | 4.500 | % | | 07/23/25 | | | 943,016 | | |
| | 2,000,000 | | | Janus Capital Group Inc | | | 4.875 | % | | 08/01/25 | | | 1,968,172 | | |
| | 2,000,000 | | | HSBC Holdings PLC (d) | | | 4.250 | % | | 08/18/25 | | | 1,921,460 | | |
| | 20,000 | | | Wells Fargo & Co (c) | | | 4.700 | % | | 12/15/25 | | | 368,800 | | |
| | 1,520,000 | | | Legg Mason Inc | | | 4.750 | % | | 03/15/26 | | | 1,501,119 | | |
| | 1,000,000 | | | Wells Fargo & Co | | | 4.100 | % | | 06/03/26 | | | 959,551 | | |
| | 3,290,000 | | | Old Republic International Corp | | | 3.875 | % | | 08/26/26 | | | 3,096,901 | | |
| | 500,000 | | | Morgan Stanley | | | 4.350 | % | | 09/08/26 | | | 483,045 | | |
| | 1,000,000 | | | JPMorgan Chase & Co | | | 4.125 | % | | 12/15/26 | | | 963,062 | | |
| 4,000,000
| | | PNC Financial Services Group Inc/The (c) (i)
| | | 3.400% (5 Year
CMT Rate +
2.595%) | | |
12/15/26 | | | 2,960,000 | | |
| | 4,000,000 | | | Mercury General Corp | | | 4.400 | % | | 03/15/27 | | | 3,787,050 | | |
16
Mairs and Power Balanced Fund
SCHEDULE OF INVESTMENTS (unaudited) (continued) June 30, 2023
Par Value | | Security Description | | Value | |
| | | FIXED INCOME SECURITIES (continued) | |
| | | CORPORATE BONDS (continued) | |
| | | FINANCIALS (continued) | |
$ | 450,000 | | | Athene Holding Ltd (d) | | | 4.125 | % | | 01/12/28 | | $ | 410,878 | | |
| 500,000
| | | Citigroup Inc (i)
| | | 3.070% (SOFR +
1.280%) | | |
02/24/28 | | | 459,990 | | |
| | 250,000 | | | Provident Cos Inc | | | 7.250 | % | | 03/15/28 | | | 260,750 | | |
| | 2,000,000 | | | E*TRADE Financial Corp | | | 4.500 | % | | 06/20/28 | | | 1,927,833 | | |
| | 500,000 | | | Farmers Exchange Capital (b) | | | 7.050 | % | | 07/15/28 | | | 504,207 | | |
| | 1,000,000 | | | Fiserv Inc | | | 4.200 | % | | 10/01/28 | | | 958,005 | | |
| | 1,000,000 | | | Lazard Group LLC | | | 4.375 | % | | 03/11/29 | | | 928,712 | | |
| | 3,500,000 | | | Wintrust Financial Corp | | | 4.850 | % | | 06/06/29 | | | 3,116,312 | | |
| | 2,300,000 | | | Assurant Inc | | | 3.700 | % | | 02/22/30 | | | 1,979,330 | | |
| 4,000,000
| | | Capital One Financial Corp. (i)
| | | 5.247% (SOFR +
2.600%) | | |
07/26/30 | | | 3,773,137 | | |
| 500,000
| | | Park National Corp (i)
| | | 4.500% (TSFR3M +
4.390%) | | |
09/01/30 | | | 439,801 | | |
| | 500,000 | | | Goldman Sachs Group Inc/The | | | 4.250 | % | | 11/15/30 | | | 465,000 | | |
| | 500,000 | | | Goldman Sachs Group Inc/The | | | 4.000 | % | | 02/15/31 | | | 454,367 | | |
| | 2,000,000 | | | Synchrony Financial | | | 2.875 | % | | 10/28/31 | | | 1,453,942 | | |
| | 1,000,000 | | | Blackstone Holdings Finance Co LLC (b) | | | 2.550 | % | | 03/30/32 | | | 780,335 | | |
| 2,000,000
| | | Goldman Sachs Group Inc/The (i)
| | | 2.650% (SOFR +
1.264%) | | |
10/21/32 | | | 1,631,386 | | |
| | 500,000 | | | Goldman Sachs Group Inc/The | | | 4.300 | % | | 12/15/32 | | | 452,993 | | |
| 1,700,000
| | | Morgan Stanley (i)
| | | 2.943% (SOFR +
1.290%) | | |
01/21/33 | | | 1,413,258 | | |
| | 1,000,000 | | | Allstate Corp/The | | | 5.250 | % | | 03/30/33 | | | 997,361 | | |
| | 1,495,000 | | | nVent Finance Sarl (d) | | | 5.650 | % | | 05/15/33 | | | 1,470,732 | | |
| 500,000
| | | American Express Co (i)
| | | 4.989% (SOFR +
2.255%) | | |
05/26/33 | | | 479,178 | | |
| | 2,000,000 | | | CNA Financial Corp. | | | 5.500 | % | | 06/15/33 | | | 1,951,159 | | |
| 1,000,000
| | | Bank of America Corp. (i)
| | | 5.015% (SOFR +
2.160%) | | |
07/22/33 | | | 978,573 | | |
| 2,000,000
| | | US Bancorp (i)
| | | 5.850% (SOFR +
2.090%) | | |
10/21/33 | | | 2,002,124 | | |
| | 538,000 | | | Bank of America Corp | | | 4.000 | % | | 08/15/34 | | | 472,248 | | |
| 3,000,000
| | | Fulton Financial Corp (i)
| | | 3.750% (TSFR3M +
2.700%) | | |
03/15/35 | | | 2,124,006 | | |
| 2,150,000
| | | Bank of Montreal (d) (i)
| | | 3.088% (5 Year
CMT Rate +
1.400%) | | |
01/10/37 | | | 1,690,606 | | |
| | 500,000 | | | Principal Financial Group Inc | | | 4.350 | % | | 05/15/43 | | | 406,411 | | |
| 3,000,000
| | | JPMorgan Chase & Co (c) (i)
| | | 3.650% (5 Year
CMT Rate +
2.850%) | | |
12/01/69 | | | 2,647,950 | | |
17
Mairs and Power Balanced Fund
SCHEDULE OF INVESTMENTS (unaudited) (continued) June 30, 2023
Par Value | | Security Description | | Value | |
| | | FIXED INCOME SECURITIES (continued) | |
| | | CORPORATE BONDS (continued) | |
| | | FINANCIALS (continued) | |
$ | 2,000,000
| | | Bank of New York Mellon Corp/The (c) (i)
| | | 3.750% (5 Year
CMT Rate +
2.630%) | | |
06/20/70 | | $ | 1,647,500 | | |
| 2,500,000
| | | M&T Bank Corp (c) (i)
| | | 5.125% (3 Month
LIBOR USD +
3.520%) | | |
05/01/71 | | | 1,982,768 | | |
| 6,000,000
| | | Charles Schwab Corp (c) (i)
| | | 4.000% (10 Year
CMT Rate +
3.079%) | | |
03/01/31 | | | 4,386,000 | | |
| | | | 85,814,327 | | |
| | | HEALTH CARE 0.5% | |
| | 500,000 | | | Wyeth LLC | | | 6.450 | % | | 02/01/24 | | | 502,578 | | |
| | 2,000,000 | | | AbbVie Inc | | | 3.800 | % | | 03/15/25 | | | 1,945,264 | | |
| | 43,000 | | | Bristol-Myers Squibb Co | | | 3.875 | % | | 08/15/25 | | | 41,444 | | |
| | 700,000 | | | Zimmer Biomet Holdings Inc | | | 4.250 | % | | 08/15/35 | | | 605,977 | | |
| | 1,400,000 | | | CVS Health Corp | | | 4.780 | % | | 03/25/38 | | | 1,291,096 | | |
| | | | 4,386,359 | | |
| | | INDUSTRIALS 2.9% | |
| | 1,500,000 | | | Hillenbrand Inc | | | 5.000 | % | | 09/15/26 | | | 1,465,275 | | |
| | 500,000 | | | Toro Co/The | | | 7.800 | % | | 06/15/27 | | | 526,159 | | |
| | 500,000 | | | Penske Truck Leasing Co Lp / PTL Finance Corp. (b) | | | 5.700 | % | | 02/01/28 | | | 493,137 | | |
| | 2,000,000 | | | Kennametal Inc | | | 4.625 | % | | 06/15/28 | | | 1,903,564 | | |
| | 3,000,000 | | | Steelcase Inc | | | 5.125 | % | | 01/18/29 | | | 2,666,473 | | |
| | 1,000,000 | | | Oshkosh Corp | | | 3.100 | % | | 03/01/30 | | | 873,011 | | |
| | 1,000,000 | | | Flowserve Corp | | | 3.500 | % | | 10/01/30 | | | 853,913 | | |
| | 3,000,000 | | | Hillenbrand Inc | | | 3.750 | % | | 03/01/31 | | | 2,522,700 | | |
| | 4,000,000 | | | United Rentals North America Inc | | | 3.750 | % | | 01/15/32 | | | 3,392,812 | | |
| | 2,000,000 | | | Eaton Corp | | | 4.000 | % | | 11/02/32 | | | 1,881,916 | | |
| | 1,000,000 | | | GATX Corp | | | 4.900 | % | | 03/15/33 | | | 948,205 | | |
| | 1,000,000 | | | GATX Corp. | | | 5.450 | % | | 09/15/33 | | | 983,560 | | |
| | 1,000,000 | | | Alcoa Inc | | | 5.950 | % | | 02/01/37 | | | 1,010,557 | | |
| | 1,000,000 | | | Equifax, Inc. | | | 7.000 | % | | 07/01/37 | | | 1,063,473 | | |
| | 1,400,000 | | | Leidos Holdings Inc | | | 5.950 | % | | 12/01/40 | | | 1,306,080 | | |
| | 1,000,000 | | | FedEx Corp | | | 4.100 | % | | 04/15/43 | | | 813,373 | | |
| | | | 22,704,208 | | |
| | | INFORMATION TECHNOLOGY 4.5% | |
| | 1,031,000 | | | Arrow Electronics Inc | | | 4.000 | % | | 04/01/25 | | | 990,720 | | |
| | 2,000,000 | | | Hewlett Packard Enterprise Co | | | 4.900 | % | | 10/15/25 | | | 1,974,743 | | |
| | 1,000,000 | | | Dell International LLC / EMC Corp | | | 6.020 | % | | 06/15/26 | | | 1,016,579 | | |
| | 2,500,000 | | | Motorola Solutions Inc | | | 4.600 | % | | 02/23/28 | | | 2,425,315 | | |
| | 1,500,000 | | | Trimble Inc | | | 4.900 | % | | 06/15/28 | | | 1,464,724 | | |
18
Mairs and Power Balanced Fund
SCHEDULE OF INVESTMENTS (unaudited) (continued) June 30, 2023
Par Value | | Security Description | | Value | |
| | | FIXED INCOME SECURITIES (continued) | |
| | | CORPORATE BONDS (continued) | |
| | | INFORMATION TECHNOLOGY (continued) | |
$ | 3,000,000 | | | Entegris Escrow Corp (b) | | | 4.750 | % | | 04/15/29 | | $ | 2,778,932 | | |
| | 1,000,000 | | | Juniper Networks Inc | | | 3.750 | % | | 08/15/29 | | | 899,397 | | |
| | 1,000,000 | | | Dell International LLC / EMC Corp | | | 5.300 | % | | 10/01/29 | | | 993,876 | | |
| | 2,000,000 | | | Avnet Inc | | | 3.000 | % | | 05/15/31 | | | 1,596,217 | | |
| | 1,000,000 | | | HP Inc | | | 2.650 | % | | 06/17/31 | | | 805,641 | | |
| | 1,000,000 | | | Autodesk Inc | | | 2.400 | % | | 12/15/31 | | | 818,553 | | |
| | 1,000,000 | | | Avnet Inc | | | 5.500 | % | | 06/01/32 | | | 949,852 | | |
| | 2,000,000 | | | Broadcom Inc | | | 4.300 | % | | 11/15/32 | | | 1,834,712 | | |
| | 2,000,000 | | | HP Inc | | | 5.500 | % | | 01/15/33 | | | 1,964,178 | | |
| | 1,000,000 | | | Micron Technology, Inc. | | | 5.875 | % | | 02/09/33 | | | 996,688 | | |
| | 3,850,000 | | | Leidos Inc | | | 5.500 | % | | 07/01/33 | | | 3,626,301 | | |
| | 1,000,000 | | | Broadcom Inc (b) | | | 3.469 | % | | 04/15/34 | | | 820,231 | | |
| | 1,500,000 | | | Western Union Co/The | | | 6.200 | % | | 11/17/36 | | | 1,500,432 | | |
| | 1,500,000 | | | Broadcom Inc (b) | | | 4.926 | % | | 05/15/37 | | | 1,358,033 | | |
| | 3,000,000 | | | Oracle Corp | | | 3.600 | % | | 04/01/40 | | | 2,318,665 | | |
| | 1,000,000 | | | Dell Inc | | | 5.400 | % | | 09/10/40 | | | 929,521 | | |
| | 1,000,000 | | | Analog Devices Inc | | | 2.800 | % | | 10/01/41 | | | 742,024 | | |
| | 570,000 | | | Discovery Communications LLC | | | 4.950 | % | | 05/15/42 | | | 451,034 | | |
| | 2,000,000 | | | Motorola Solutions Inc | | | 5.500 | % | | 09/01/44 | | | 1,898,709 | | |
| | | | 35,155,077 | | |
| | | MATERIALS 2.5% | |
| | 756,000 | | | Eastman Chemical Co | | | 3.800 | % | | 03/15/25 | | | 734,245 | | |
| | 865,000 | | | Union Carbide Corp | | | 7.500 | % | | 06/01/25 | | | 883,184 | | |
| | 200,000 | | | Worthington Industries Inc | | | 4.550 | % | | 04/15/26 | | | 189,115 | | |
| | 1,500,000 | | | Cabot Corp | | | 3.400 | % | | 09/15/26 | | | 1,369,223 | | |
| | 782,000 | | | HB Fuller Co | | | 4.000 | % | | 02/15/27 | | | 733,712 | | |
| | 3,200,000 | | | HB Fuller Co | | | 4.250 | % | | 10/15/28 | | | 2,852,064 | | |
| | 4,000,000 | | | Cabot Corp | | | 4.000 | % | | 07/01/29 | | | 3,689,413 | | |
| | 1,175,000 | | | Albemarle Wodgina Property Ltd (d) | | | 3.450 | % | | 11/15/29 | | | 1,010,685 | | |
| | 3,000,000 | | | Freeport McMoRan Inc | | | 4.250 | % | | 03/01/30 | | | 2,766,660 | | |
| | 1,200,000 | | | International Flavors & Fragrances, Inc. (b) | | | 2.300 | % | | 11/01/30 | | | 951,527 | | |
| | 2,000,000 | | | Mosaic Co/The | | | 5.450 | % | | 11/15/33 | | | 1,948,682 | | |
| | 1,250,000 | | | Dow Chemical Co/The | | | 4.250 | % | | 10/01/34 | | | 1,136,087 | | |
| | 1,000,000 | | | Newmont Mining Corp | | | 4.875 | % | | 03/15/42 | | | 927,261 | | |
| | 325,000 | | | Albemarle Corp | | | 5.450 | % | | 12/01/44 | | | 306,510 | | |
| | 250,000 | | | Steel Dynamics Inc | | | 3.250 | % | | 10/15/50 | | | 164,994 | | |
| | | | 19,663,362 | | |
| | | UTILITIES 1.2% | |
| | 2,000,000 | | | National Fuel Gas Co | | | 3.950 | % | | 09/15/27 | | | 1,839,019 | | |
| | 416,000 | | | Toledo Edison Co (b) | | | 2.650 | % | | 05/01/28 | | | 367,997 | | |
19
Mairs and Power Balanced Fund
SCHEDULE OF INVESTMENTS (unaudited) (continued) June 30, 2023
Par Value | | Security Description | | Value | |
| | | FIXED INCOME SECURITIES (continued) | |
| | | CORPORATE BONDS (continued) | |
| | | UTILITIES (continued) | |
$ | 1,000,000 | | | National Fuel Gas Co | | | 4.750 | % | | 09/01/28 | | $ | 948,294 | | |
| | 2,000,000 | | | Alliant Energy Finance LLC (b) | | | 3.600 | % | | 03/01/32 | | | 1,741,494 | | |
| | 1,000,000 | | | Wisconsin Power and Light Co. | | | 4.950 | % | | 04/01/33 | | | 989,553 | | |
| | 1,000,000 | | | Black Hills Corp. | | | 4.350 | % | | 05/01/33 | | | 891,230 | | |
| | 1,165,000 | | | Duke Energy Progress LLC | | | 5.700 | % | | 04/01/35 | | | 1,157,721 | | |
| | 1,080,000 | | | Southwestern Public Service Co | | | 6.000 | % | | 10/01/36 | | | 1,095,854 | | |
| | 1,021,000 | | | Northern Natural Gas Co (b) | | | 4.100 | % | | 09/15/42 | | | 783,939 | | |
| | | | 9,815,101 | | |
| | | TOTAL CORPORATE BONDS | | | 223,914,722 | | |
| | | US GOVERNMENT NOTES/BONDS 2.2% | |
| | 1,000,000 | | | United States Treasury Note/Bond | | | 0.875 | % | | 01/31/24 | | | 974,246 | | |
| | 1,000,000 | | | United States Treasury Note/Bond | | | 0.250 | % | | 03/15/24 | | | 964,681 | | |
| | 3,000,000 | | | United States Treasury Note/Bond | | | 0.750 | % | | 03/31/26 | | | 2,711,484 | | |
| | 1,000,000 | | | United States Treasury Note/Bond | | | 0.750 | % | | 04/30/26 | | | 900,469 | | |
| | 1,000,000 | | | United States Treasury Note/Bond | | | 1.125 | % | | 10/31/26 | | | 899,082 | | |
| | 1,000,000 | | | United States Treasury Note/Bond | | | 1.250 | % | | 06/30/28 | | | 870,351 | | |
| | 1,000,000 | | | United States Treasury Note/Bond | | | 1.000 | % | | 07/31/28 | | | 857,500 | | |
| | 7,000,000 | | | United States Treasury Note/Bond | | | 2.625 | % | | 02/15/29 | | | 6,485,254 | | |
| | 1,000,000 | | | United States Treasury Note/Bond | | | 3.250 | % | | 05/15/42 | | | 891,348 | | |
| | 2,000,000 | | | United States Treasury Note/Bond | | | 3.000 | % | | 02/15/49 | | | 1,689,180 | | |
| | | | 17,243,595 | | |
| | | ASSET BACKED SECURITIES 1.4% | |
| | 747,239 | | | Delta Air Lines 2015-1 Class B Pass Through Trust | | | 4.250 | % | | 01/30/25 | | | 747,013 | | |
| | 457,388 | | | American Airlines 2015-2 Class B Pass Through Trust | | | 4.400 | % | | 03/22/25 | | | 455,101 | | |
| | 147,489 | | | US Airways 2011-1 Class A Pass Through Trust | | | 7.125 | % | | 04/22/25 | | | 148,782 | | |
| | 1,820,867 | | | American Airlines 2016-1 Class B Pass Through Trust | | | 5.250 | % | | 07/15/25 | | | 1,802,659 | | |
| | 529,897 | | | Spirit Airlines Pass Through Trust 2015-1B | | | 4.450 | % | | 10/01/25 | | | 518,152 | | |
| | 1,384,537 | | | Hawaiian Airlines 2013-1 Class A Pass Through Certificates | | | 3.900 | % | | 01/15/26 | | | 1,243,199 | | |
| | 980,387 | | | Continental Airlines 2012-2 Class A Pass Through Trust | | | 4.000 | % | | 04/29/26 | | | 953,655 | | |
| | 569,003 | | | American Airlines 2017-1 Class B Pass Through Trust | | | 4.950 | % | | 08/15/26 | | | 543,397 | | |
| | 607,089 | | | United Airlines 2013-1 Class A Pass Through Trust | | | 4.300 | % | | 02/15/27 | | | 587,550 | | |
| | 513,891 | | | American Airlines 2016-3 Class B Pass Through Trust | | | 3.750 | % | | 04/15/27 | | | 472,779 | | |
| | 411,018 | | | US Airways 2013-1 Class A Pass Through Trust | | | 3.950 | % | | 05/15/27 | | | 388,506 | | |
| | 480,909 | | | United Airlines 2014-1 Class A Pass Through Trust | | | 4.000 | % | | 10/11/27 | | | 456,137 | | |
| | 403,510 | | | United Airlines 2014-2 Class A Pass Through Trust | | | 3.750 | % | | 03/03/28 | | | 381,628 | | |
| | 1,073,023 | | | American Airlines 2014-1 Class A Pass Through Trust | | | 3.700 | % | | 04/01/28 | | | 964,199 | | |
20
Mairs and Power Balanced Fund
SCHEDULE OF INVESTMENTS (unaudited) (continued) June 30, 2023
Par Value/Shares | | Security Description | | Value | |
| | | FIXED INCOME SECURITIES (continued) | |
| | | ASSET BACKED SECURITIES (continued) | |
$ | 279,230 | | | American Airlines 2015-1 Class A Pass Through Trust | | | 3.375 | % | | 11/01/28 | | $ | 247,119 | | |
| | 418,421 | | | American Airlines 2015-2 Class A Pass Through Trust | | | 4.000 | % | | 03/22/29 | | | 376,643 | | |
| | 128,333 | | | American Airlines 2015-2 Class AA Pass Through Trust | | | 3.600 | % | | 03/22/29 | | | 120,072 | | |
| | 79,296 | | | Spirit Airlines Pass Through Trust 2015-1A | | | 4.100 | % | | 10/01/29 | | | 71,816 | | |
| | 684,812 | | | British Airways 2018-1 Class A Pass Through Trust (b) (d) | | | 4.125 | % | | 03/20/33 | | | 609,483 | | |
| | | | 11,087,890 | | |
| | | MUNICIPAL BONDS 1.1% | |
| | 650,000 | | | Glendale Community College District/CA | | | 2.113 | % | | 08/01/31 | | | 536,489 | | |
| | 500,000 | | | Socorro Independent School District | | | 2.125 | % | | 08/15/31 | | | 418,453 | | |
| | 920,000 | | | Pierre School District No 32-2 | | | 2.040 | % | | 08/01/33 | | | 733,355 | | |
| | 500,000 | | | Redondo Beach Unified School District | | | 2.040 | % | | 08/01/34 | | | 377,072 | | |
| | 500,000 | | | DeKalb Kane & LaSalle Counties Etc Community College
District No 523 Kishwaukee | | | 3.017 | % | | 02/01/36 | | | 405,754 | | |
| | 1,000,000 | | | Crowley Independent School District | | | 3.010 | % | | 08/01/38 | | | 825,034 | | |
| | 500,000 | | | Idaho Bond Bank Authority | | | 2.354 | % | | 09/15/38 | | | 371,285 | | |
| | 850,000 | | | Worthington Independent School District No 518 | | | 3.300 | % | | 02/01/39 | | | 717,177 | | |
| | 885,000 | | | Massachusetts Development Finance Agency | | | 2.550 | % | | 05/01/40 | | | 644,411 | | |
| | 750,000 | | | Woodbury County Law Enforcement Center Authority | | | 3.090 | % | | 06/01/40 | | | 576,224 | | |
| | 505,000 | | | Village of Ashwaubenon WI | | | 2.970 | % | | 06/01/40 | | | 395,094 | | |
| | 300,000 | | | Desert Community College District | | | 2.457 | % | | 08/01/40 | | | 215,307 | | |
| | 800,000 | | | Utah Transit Authority | | | 3.443 | % | | 12/15/42 | | | 645,774 | | |
| | 1,000,000 | | | Borough of Naugatuck CT | | | 3.090 | % | | 09/15/46 | | | 712,600 | | |
| | 1,000,000 | | | Michigan State University | | | 4.496 | % | | 08/15/48 | | | 906,395 | | |
| | | | 8,480,424 | | |
| | TOTAL FIXED INCOME SECURITIES
(cost $292,809,913) | | $ | 260,726,631 | | |
| | | COMMON STOCKS 65.9% | |
| | | COMMUNICATION SERVICES 4.3% | |
| | 240,000 | | | Alphabet Inc (e) | | | | | | | | | | $ | 29,032,800 | | |
| | 58,000 | | | Walt Disney Co/The (e) | | | | | | | | | | | 5,178,240 | | |
| | | | 34,211,040 | | |
| | | CONSUMER DISCRETIONARY 1.2% | |
| | 31,038 | | | Home Depot Inc/The | | | | | | | | | | | 9,641,644 | | |
| | | CONSUMER STAPLES 5.1% | |
| | 43,630 | | | Hershey Co/The | | | | | | | | | | | 10,894,411 | | |
| | 364,510 | | | Hormel Foods Corp | | | | | | | | | | | 14,660,592 | | |
21
Mairs and Power Balanced Fund
SCHEDULE OF INVESTMENTS (unaudited) (continued) June 30, 2023
Shares | | Security Description | | Value | |
| | | COMMON STOCKS (continued) | |
| | | CONSUMER STAPLES (continued) | |
| | 132,000 | | | Sysco Corp | | $ | 9,794,400 | | |
| | 36,000 | | | Target Corp | | | 4,748,400 | | |
| | | | 40,097,803 | | |
| | | FINANCIALS 12.1% | |
| | 31,324 | | | American Express Co | | | 5,456,641 | | |
| | 166,000 | | | Fiserv Inc (e) | | | 20,940,900 | | |
| | 138,633 | | | JPMorgan Chase & Co | | | 20,162,784 | | |
| | 86,000 | | | Northern Trust Corp | | | 6,376,040 | | |
| | 59,000 | | | Principal Financial Group Inc | | | 4,474,560 | | |
| | 425,017 | | | US Bancorp/MN | | | 14,042,562 | | |
| | 58,000 | | | Visa Inc | | | 13,773,840 | | |
| | 233,808 | | | Wells Fargo & Co | | | 9,978,925 | | |
| | | | 95,206,252 | | |
| | | HEALTH CARE 14.6% | |
| | 172,060 | | | Abbott Laboratories | | | 18,757,981 | | |
| | 25,930 | | | Baxter International Inc | | | 1,181,371 | | |
| | 173,000 | | | Bio-Techne Corp | | | 14,121,990 | | |
| | 70,000 | | | Elanco Animal Health Inc (e) | | | 704,200 | | |
| | 38,700 | | | Eli Lilly & Co | | | 18,149,526 | | |
| | 86,000 | | | Johnson & Johnson | | | 14,234,720 | | |
| | 179,000 | | | Medtronic PLC (f) | | | 15,769,900 | | |
| | 20,000 | | | Neogen Corp (e) | | | 435,000 | | |
| | 62,200 | | | Pfizer Inc | | | 2,281,496 | | |
| | 302,000 | | | Roche Holding AG (g) | | | 11,536,400 | | |
| | 37,013 | | | UnitedHealth Group Inc | | | 17,789,928 | | |
| | | | 114,962,512 | | |
| | | INDUSTRIALS 11.0% | |
| | 6,527 | | | 3M Co | | | 653,287 | | |
| | 31,000 | | | Automatic Data Processing Inc | | | 6,813,490 | | |
| | 40,000 | | | CH Robinson Worldwide Inc | | | 3,774,000 | | |
| | 78,000 | | | Donaldson Co Inc | | | 4,875,780 | | |
| | 135,000 | | | Fastenal Co | | | 7,963,650 | | |
| | 184,170 | | | Graco Inc | | | 15,903,080 | | |
| | 19,000 | | | Honeywell International Inc | | | 3,942,500 | | |
| | 110,200 | | | nVent Electric PLC (f) | | | 5,694,034 | | |
| | 19,000 | | | Rockwell Automation Inc | | | 6,259,550 | | |
| | 78,000 | | | Tennant Co | | | 6,326,580 | | |
| | 176,573 | | | Toro Co/The | | | 17,948,645 | | |
| | 35,000 | | | United Parcel Service Inc, Class B | | | 6,273,750 | | |
| | | | 86,428,346 | | |
22
Mairs and Power Balanced Fund
SCHEDULE OF INVESTMENTS (unaudited) (continued) June 30, 2023
Shares | | Security Description | | Value | |
| | | COMMON STOCKS (continued) | |
| | | INFORMATION TECHNOLOGY 11.9% | |
| | 54,000 | | | Entegris Inc | | $ | 5,984,280 | | |
| | 44,000 | | | Littelfuse Inc | | | 12,817,640 | | |
| | 92,700 | | | Microsoft Corp | | | 31,568,058 | | |
| | 35,000 | | | Motorola Solutions Inc | | | 10,264,800 | | |
| | 110,000 | | | QUALCOMM Inc | | | 13,094,400 | | |
| | 37,000 | | | salesforce.com Inc (e) | | | 7,816,620 | | |
| | 67,000 | | | Texas Instruments Inc | | | 12,061,340 | | |
| | | | 93,607,138 | | |
| | | MATERIALS 4.4% | |
| | 86,000 | | | Ecolab Inc | | | 16,055,340 | | |
| | 84,570 | | | HB Fuller Co | | | 6,047,601 | | |
| | 48,000 | | | Sherwin-Williams Co/The | | | 12,744,960 | | |
| | | | 34,847,901 | | |
| | | UTILITIES 1.3% | |
| | 158,000 | | | Xcel Energy Inc | | | 9,822,860 | | |
| | | | TOTAL COMMON STOCKS
(cost $284,715,393) | | $ | 518,825,496 | | |
| | | SHORT-TERM INVESTMENTS 0.6% | |
| 4,514,881 | | | First American Government Obligations Fund, Class X, 0.0508% (h)
(cost $4,514,881) | | $ | 4,514,881 | | |
| | | | TOTAL INVESTMENTS 99.5%
(cost $582,040,187) | | $ | 784,067,008 | | |
| | | | | OTHER ASSETS AND LIABILITIES (NET) 0.5% | | | 3,845,665 | | |
| | | | | TOTAL NET ASSETS 100.0% | | $ | 787,912,673 | | |
(a) Step Bonds – Securities for which the coupon rate of interest will adjust on specified future dates(s). The rate disclosed represents the coupon rate in effect as of June 30, 2023.
(b) Securities exempt from registration under Rule 144A of the Securities Act of 1933. These securities may be resold in transactions exempt from registration, normally to qualified institutional buyers. These securities have been determined to be liquid under guidelines established by the Fund's Board of Trustees. As of June 30, 2023, these securities represented $24,135,176 or 3.1% of total net assets.
(c) Perpetual maturity, date shown, if applicable, represents next contractual call date.
(d) Foreign security denominated in U.S. dollars. As of June 30, 2023, these securities represented $8,101,303 or 1.0% of total net assets.
(e) Non-income producing.
23
Mairs and Power Balanced Fund
SCHEDULE OF INVESTMENTS (unaudited) (continued) June 30, 2023
(f) Issuer headquartered overseas but considered domestic. The Adviser defines foreign issuers as those whose operational leadership or headquarters is located in a foreign country; provided, however, if an issuer is believed by the Adviser to be headquartered in a jurisdiction primarily for tax purposes, the Adviser will consider the following additional factors: 1) the location of the primary exchange trading its securities; 2) where it derives the majority of its revenues; and/or 3) where it earns the majority of its profits.
(g) American Depositary Receipt
(h) The rate quoted is the annualized seven-day effective yield as of June 30, 2023.
(i) Variable rate security; the rate shown represents the rate at June 30, 2023.
The Global Industry Classification Standard (GICS®) was developed by and/or is the exclusive property of MSCI, Inc. and Standard & Poor's Financial Services LLC ("S&P"). GICS is a service mark of MSCI, Inc. and S&P and has been licensed for use by the Adviser.
See accompanying Notes to Financial Statements.
24
MAIRS & POWER SMALL CAP FUND (unaudited)
To Our Shareholders: June 30, 2023
For year-to-date 2023, the Mairs & Power Small Cap Fund was up 6.43%, while its S&P Small Cap 600 TR benchmark was up 6.03%, and the Morningstar U.S. Fund Small Blend was up by 7.42%.
Year-to-date relative outperformance versus the benchmark was driven by the Industrials, Healthcare, and Real Estate sectors, as well as the absence of Energy stocks in the Fund. This was partially offset by relative underperformance in the Financials, Consumer Discretionary, Materials, and Utilities sectors.
As discussed last quarter, year-to-date relative performance was meaningfully impacted by weak performance from bank stock holdings. The Financials sector overall showed some stabilization during the quarter, but still underperformed. Rising market interest rates on bonds continue to compete for bank deposits, forcing banks to raise their rates, which pressures margins. Those interest rates have risen modestly during and after the June quarter, which may again pressure bank assets and the cost of deposits, albeit to a lesser degree than in the previous three quarters. During the last six months, we have selectively added to two of the banks held in the portfolio based on what we believe are positive core fundamentals and track record, and compelling valuations.
So far this year, the sector of the portfolio with the largest net purchases was indeed Financial Services, where stocks were trading at cycle-low valuations, and a discount to our long-term view. This is consistent with both our long-term approach and valuation discipline. Similarly, the sector with the largest net sales during the period was Industrials, which had the strongest performance as supply chains improved, and inflation pressures began to ease, and stock valuations were elevated relative to the market.
Looking at individual stocks, year-to-date relative outperformance came from Altair Engineering (ALTR) in Technology, a provider of software used in design, simulation, and data analysis that is showing growth and margin expansion as their software helps companies accelerate product development while reducing labor and materials costs. Also outperforming in Technology was Entegris (ENTG), a provider of advanced filtration, specialty chemicals, and materials handling products to semiconductor makers and other high-tech manufacturers, which are requiring increased purity in their fabrication processes. Finally, two companies benefiting from electrification in many end markets and performing well year-to-date are Littelfuse (LFUS) and nVent (NVT). Littelfuse, in Technology, is an Illinois-based provider of circuit protection and switching products, while nVent, in Industrials, is a manufacturer of electrical enclosures, fasteners, and thermal management products.
Relative underperformance outside of the banking sector was driven by Clearfield (CLFD) in Technology, a Minnesota-based supplier of fiber optic access and management products used in broadband infrastructure installations that is working through a buildup in inventory, and some new uncertainty pertaining to the timing of a multi-year Federal broadband stimulus spending initiative. Three other names that underperformed are worth noting: Toro (TTC), a Minnesota-based manufacturer of landscape and turf equipment, which had traded at higher valuations and needed to consolidate; Jamf (JAMF), a Minnesota-based provider of enterprise software for managing and securing Apple devices, whose end market growth has slowed post pandemic; Gentherm (THRM) in the Consumer Discretionary sector, a manufacturer of thermal management products, with significant exposure to the automotive sector, and that industry's ongoing supply chain adjustments.
During the second quarter, we sold out of our position in Envestnet (ENV), a Pennsylvania-based technology and data provider to the Financials Services sector, which we believe faced increased competitive pressures from other providers with more modern platforms. Based out of our Upper Midwest (MN, SD, ND, IA, WI, IL) region, Envestnet also lacked the ease of access to facilities and teams that we value in most of our portfolio companies.
From our fieldwork during the quarter, our conversations with large and small companies lead us to believe that the supply shocks of 2022 continue to ease, with prices and inventory levels normalizing, which is helping the inflation statistics monitored by the Federal Reserve (Fed). The stubborn exception to this trend is the cost of labor, which remains elevated. As these conditions normalize, businesses have more confidence in their
25
MAIRS & POWER SMALL CAP FUND (unaudited) (continued)
long-term planning, which would be welcome after a long spell of low visibility. As long-term investors, and leveraging our experience through many prior cycles, we believe these challenges are temporary, and view the related market volatility as an opportunity to invest in great companies trading at significantly lower valuations.
As of June 30, the S&P Small Cap 600 group traded at 13.53 times forward earnings, a 29% discount to the S&P 500 index and a 21% discount to its 10-year average. These discounts are often present during turbulent parts of an economic cycle, when abnormal conditions are normalizing, and in the case of this cycle, inflation pressures are beginning to wane, albeit unevenly. Having watched these valuation patterns in other cycles, we believe this phase too shall pass, and companies with durable competitive advantages, as well as the growth, profitability, and cash flows to reinvest in new products and initiatives will outgrow and outearn their peers, driving robust returns for long-term investors. We remain confident that our long-term approach to investing is particularly well suited for current conditions, where many high-quality companies' shares are trading at a discount.
One final note: Michael (Mike) C. Marzolf transitioned into the role of lead manager for the Mairs & Power Small Cap Fund (MSCFX), effective at the close of business on June 30, 2023. Andrew (Andy) R. Adams will shift into a co-manager role on the Fund and Christopher (Chris) D. Strom will continue in his role of co-manager for the Fund.
"Mike is a seasoned investment professional who in his time here has fully embraced the Mairs & Power investment process. I look forward to continuing working alongside of him as he takes the reins of the Small Cap Fund," said Adams, Mairs & Power's Chief Investment Officer. "Mike has a deep understanding of the Upper Midwest region, years of portfolio management experience, and a diverse sector expertise that will be invaluable in maintaining the Fund's success into the future."
Mr. Adams established the Small Cap Fund back in 2011 and has served as lead manager or co-manager since its inception. In addition to his role as co-manager for the Small Cap Fund, Andy will continue to serve as CIO for the firm and lead manager for the Mairs & Power Growth Fund (MPGFX). Strom assumed a co-manager role for the Fund back in January 2021, building out the depth of the small cap team. Adding Strom and Marzolf allowed the small cap team to increase equity research capacity, to better navigate the small cap market, and to identify attractive investment opportunities among emerging companies in Minnesota and the Upper Midwest (Wisconsin, Illinois, Iowa, South Dakota, and North Dakota).
Mike Marzolf
Lead Manager | | Andy Adams
Co-Manager | | Chris Strom
Co-Manager | |
MAIRS & POWER SMALL CAP FUND YTD CONTRIBUTORS
as of 6/30/2023
Largest Contributors To
Relative Performance | | Largest Detractors To
Relative Performance | |
Entegris, Inc. | | | 69.39 | % | | Clearfield, Inc. | | | -49.70 | % | |
Altair Engineering Inc. | | | 66.79 | % | | Glacier Bancorp, Inc. | | | -36.41 | % | |
AZEK Co., Inc. Class A | | | 49.06 | % | | First Interstate BancSystem, Inc. | | | -36.30 | % | |
nVent Electric PLC | | | 35.46 | % | | Associated Banc-Corp. | | | -28.07 | % | |
Littelfuse, Inc. | | | 32.91 | % | | Cullen/Frost Bankers, Inc. | | | -18.37 | % | |
Largest relative contributors and detractors are securities that were selected based on their contribution to the portfolio as of June 30, 22023. The performance number shown is total return of the security for the period and includes only securities held for the entire period. Total return is the amount of value an investor earns from a security over a specific period and when distributions are reinvested. Past performance does not guarantee future results.
26
MAIRS & POWER SMALL CAP FUND (unaudited) (continued)
All holdings in the portfolio are subject to change without notice and may or may not represent current or future portfolio composition. The mention of specific securities is not intended as a recommendation or an offer of a particular security, nor is it intended to be a solicitation for the purchase or sale of any security.
All investments have risks. The Small Cap Fund is designed for long-term investors. Equity investments are subject to market fluctuations and the Fund's share price can fall because of weakness in the broad market, a particular industry or specific holdings. Investments in small and midcap companies generally are more volatile. International investing risks include among others political, social or economic instability, difficulty in predicting international trade patterns, taxation and foreign trading practices, and greater fluctuations in price than U.S. corporations. The Fund may invest in initial public offerings by small cap companies, which can involve greater risk than investments in companies that are already publicly traded.
This commentary includes forward-looking statements such as economic predictions and portfolio manager opinions. The statements are subject to change at any time based on market and other conditions. No predictions, forecasts, outlooks, expectations or beliefs are guaranteed.
S&P Small Cap 600 Total Return (S&P 600) is an index of small company stocks managed by Standard & Poor's Financial Services LLC that covers a broad range of small cap stocks in the U.S. The index is weighted according to market capitalization and covers about 3-4% of the total market for equities in the U.S. It tracks both the capital gains of a group of stocks over time and assumes that any cash distributions, such as dividends, are reinvested back into the index. It is not possible to invest directly in an index.
Morningstar U.S. Small Blend Category, as defined by Morningstar are stocks in the bottom 10% of the capitalization of the U.S. equity market are defined as small cap. The blend style is assigned to portfolios where neither growth nor value characteristics predominate. It is not possible to invest directly in an index.
27
Mairs & Power Small Cap Fund
PERFORMANCE INFORMATION (unaudited) June 30, 2023
Investment performance since commencement of operations (through June 30, 2023)
This chart illustrates the performance of a hypothetical $10,000 investment made in the Fund since commencement of operations.
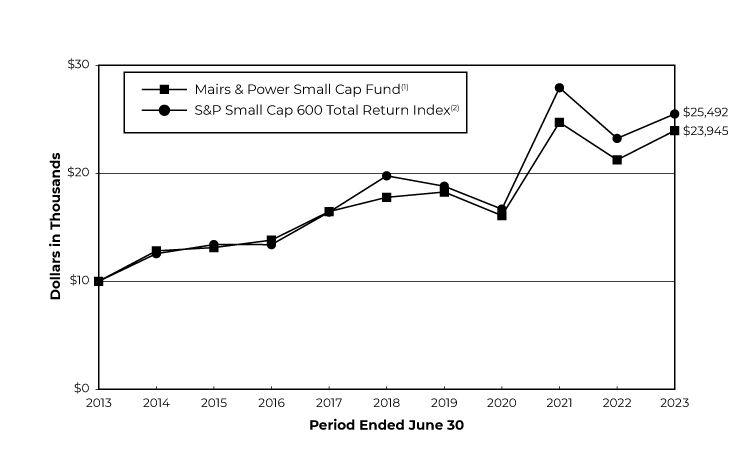
Average annual total returns for periods ended June 30, 2023
| | | 1 Year | | 3 Year | | 5 Year | | 10 Year | | Since Inception(3) | |
Mairs & Power Small Cap Fund(1) | | | 12.75 | % | | | 14.19 | % | | | 6.14 | % | | | 9.12 | % | | | 12.39 | % | |
S&P Small Cap 600 Total Return Index(2) | | | 9.75 | % | | | 15.19 | % | | | 5.22 | % | | | 9.81 | % | | | 11.86 | % | |
Performance data quoted represents past performance and does not guarantee future results. All performance information shown includes the reinvestment of dividend and capital gain distributions, but does not reflect the deduction of taxes that a shareholder would pay on Fund distributions or the redemption of Fund shares. The investment return and principal value of an investment will fluctuate so that an investor's shares, when redeemed, may be worth more or less than their original cost. Current performance of the Fund may be lower or higher than the performance quoted. For the most recent month-end performance figures, visit the Fund's website at www.mairsandpower.com or call Shareholder Services at (800) 304-7404. Per the Prospectus dated April 30, 2023, the expense ratio for the Fund is 0.92%. See the Financial Highlights in this report for the most recent expense ratio.
(1) Performance figures reflect the historical performance of the Mairs & Power Small Cap Fund (the "Predecessor Small Cap Fund"), a series of Mairs & Power Funds Trust, for periods prior to April 29, 2022.
(2) The S&P Small Cap 600 Total Return Index is an index of small-company stocks managed by Standard & Poor's Financial Services LLC that covers a broad range of small cap stocks in the U.S. The index is weighted according to market capitalization and covers about 3-4% of the total market for equities in the U.S. It tracks both the capital gains of a group of stocks over time and assumes that any cash distributions, such as dividends, are reinvested back into the index. It is not possible to invest directly in an index.
(3) Since inception performance is as of August 11, 2011, which is the offering date of the Small Cap Fund.
28
Mairs & Power Small Cap Fund
FUND INFORMATION (unaudited) June 30, 2023
Portfolio Managers
Michael C. Marzolf, CFA, lead manager of the Mairs & Power Small Cap Fund and Predecessor Small Cap Fund since July 1, 2023, co-manager from January 1, 2022 to July 1, 2023, University of St. Thomas, BS Accounting 1993
Andrew R. Adams, CFA, co-manager of the Mairs & Power Small Cap Fund and Predecessor Small Cap Fund since July 1, 2023, lead manager from August 20, 2021 to July 1, 2023, co-manager from April 1, 2019 to August 20, 2021, lead manager from 2011 to April 1, 2019, University of Wisconsin-Madison, MS Finance 1997
Christopher D. Strom, CFA, co-manager of the Mairs & Power Small Cap Fund and Predecessor Small Cap Fund since January 1, 2021, University of Wisconsin-Madison, MBA Applied Security Analysis 2010
General Information
Fund Symbol | | | MSCFX | | |
Net Asset Value (NAV) Per Share | | $ | 28.13 | | |
Expense Ratio | | | 0.93 | % | |
Portfolio Turnover Rate | | | 9.76 | % | |
Sales Charge | | | None1 | | |
Fund Inception Year | | | 2011 | | |
Portfolio Composition

Top Ten Portfolio Holdings
(Percent of Total Net Assets)2
Wintrust Financial Corp | | | 4.2 | % | |
Inspire Medical Systems Inc | | | 4.1 | | |
Littelfuse Inc | | | 4.1 | | |
AAR Corp | | | 4.0 | | |
Workiva Inc | | | 3.9 | | |
Casey's General Stores Inc | | | 3.8 | | |
nVent Electric PLC | | | 3.8 | | |
HB Fuller Co | | | 3.5 | | |
Azek Co Inc | | | 3.5 | | |
Altair Engineering Inc | | | 3.4 | | |
Portfolio Diversification
(Percent of Total Net Assets)
Common Stocks 100.1% | |
Industrials | | | 26.8 | % | |
Information Technology | | | 24.0 | | |
Financials | | | 15.1 | | |
Health Care | | | 12.9 | | |
Consumer Staples | | | 6.1 | | |
Consumer Discretionary | | | 4.6 | | |
Utilities | | | 3.9 | | |
Materials | | | 3.5 | | |
Communication Services | | | 1.6 | | |
Real Estate | | | 1.6 | | |
Short-term Investments (0.1)%3 | | | (0.1 | ) | |
| | | | 100.0 | % | |
1 Although the Fund is no-load, investment management fees and other expenses still apply.
2 All holdings in the portfolio are subject to change without notice and may or may not represent current or future portfolio composition. The mention of specific securities is not intended as a recommendation or offer for a particular security, nor is it intended to be a solicitation for the purchase or sale of any security.
3 Represents short-term investments and other assets and liabilities (net).
The Schedule of Investments and portfolio diversification utilize the Global Industry Classification Standard (GICS®) which was developed by and/or is the exclusive property of MSCI, Inc. and Standard & Poor's Financial Services LLC ("S&P"). GICS is a service mark of MSCI, Inc. and S&P and has been licensed for use by Mairs & Power, Inc. (the "Adviser").
29
Mairs and Power Small Cap Fund
SCHEDULE OF INVESTMENTS (unaudited) June 30, 2023
Shares | | Security Description | | Value | |
| | | COMMON STOCKS 100.1% | |
| | | COMMUNICATION SERVICES 1.6% | |
| | 370,623 | | | Marcus Corp/The | | $ | 5,496,339 | | |
| | | CONSUMER DISCRETIONARY 4.6% | |
| | 122,980 | | | Gentherm Inc (a) | | | 6,949,600 | | |
| | 42,000 | | | Polaris Inc | | | 5,079,060 | | |
| | 136,445 | | | Sleep Number Corp (a) | | | 3,722,220 | | |
| | | | 15,750,880 | | |
| | | CONSUMER STAPLES 6.1% | |
| | 54,385 | | | Casey's General Stores Inc | | | 13,263,414 | | |
| | 72,910 | | | MGP Ingredients Inc | | | 7,748,875 | | |
| | | | 21,012,289 | | |
| | | FINANCIALS 15.1% | |
| | 139,441 | | | Alerus Financial Corp | | | 2,507,149 | | |
| | 309,261 | | | Associated Banc-Corp | | | 5,019,306 | | |
| | 99,800 | | | Cullen/Frost Bankers Inc | | | 10,731,494 | | |
| | 105,756 | | | First Interstate BancSystem, Inc | | | 2,521,223 | | |
| | 226,420 | | | Glacier Bancorp Inc | | | 7,057,512 | | |
| | 25,100 | | | Piper Jaffray Companies | | | 3,244,426 | | |
| | 155,378 | | | QCR Holdings Inc | | | 6,375,159 | | |
| | 201,200 | | | Wintrust Financial Corp | | | 14,611,144 | | |
| | | | 52,067,413 | | |
| | | HEALTH CARE 12.9% | |
| | 99,600 | | | Bio-Techne Corp | | | 8,130,348 | | |
| | 128,000 | | | Catalent Inc (a) | | | 5,550,080 | | |
| | 164,445 | | | CVRx Inc (a) | | | 2,539,031 | | |
| | 23,500 | | | Exact Sciences Corp. (a) | | | 2,206,650 | | |
| | 43,080 | | | Inspire Medical Systems Inc (a) | | | 13,985,491 | | |
| | 36,600 | | | Medpace Holdings Inc (a) | | | 8,790,222 | | |
| | 151,100 | | | Neogen Corp (a) | | | 3,286,425 | | |
| | | | 44,488,247 | | |
| | | INDUSTRIALS 26.8% (b) | |
| | 236,258 | | | AAR Corp (a) | | | 13,646,262 | | |
| | 398,500 | | | AZEK Co Inc/The (a) | | | 12,070,565 | | |
| | 26,295 | | | Donaldson Co Inc | | | 1,643,700 | | |
| | 33,672 | | | Generac Holdings Inc (a) | | | 5,021,505 | | |
| | 54,700 | | | Graco Inc | | | 4,723,345 | | |
| | 104,500 | | | Hub Group Inc, Class A (a) | | | 8,393,440 | | |
| | 88,700 | | | John Bean Technologies Corp | | | 10,759,310 | | |
| | 256,680 | | | nVent Electric PLC (c) | | | 13,262,656 | | |
| | 58,700 | | | Oshkosh Corp | | | 5,082,833 | | |
30
Mairs and Power Small Cap Fund
SCHEDULE OF INVESTMENTS (unaudited) (continued) June 30, 2023
Shares | | Security Description | | Value | |
| | | COMMON STOCKS (continued) | |
| | | INDUSTRIALS (continued) | |
| | 110,751 | | | Tennant Co | | $ | 8,983,014 | | |
| | 88,200 | | | Toro Co/The | | | 8,965,530 | | |
| | | | 92,552,160 | | |
| | | INFORMATION TECHNOLOGY 24.0% | |
| | 155,500 | | | Altair Engineering Inc (a) | | | 11,793,120 | | |
| | 173,900 | | | Clearfield, Inc. (a) | | | 8,234,165 | | |
| | 100,224 | | | Digi International Inc (a) | | | 3,947,823 | | |
| | 74,507 | | | Entegris Inc | | | 8,256,865 | | |
| | 565,167 | | | Jamf Holding Corp (a) | | | 11,032,060 | | |
| | 48,000 | | | Littelfuse Inc | | | 13,982,880 | | |
| | 100,320 | | | Plexus Corp (a) | | | 9,855,437 | | |
| | 221,790 | | | SkyWater Technology Inc (a) | | | 2,089,262 | | |
| | 131,980 | | | Workiva Inc (a) | | | 13,417,087 | | |
| | | | 82,608,699 | | |
| | | MATERIALS 3.5% | |
| | 169,200 | | | HB Fuller Co | | | 12,099,492 | | |
| | | REAL ESTATE 1.6% | |
| | 393,000 | | | Physicians Realty Trust | | | 5,498,070 | | |
| | | UTILITIES 3.9% | |
| | 118,400 | | | Black Hills Corp | | | 7,134,784 | | |
| | 113,300 | | | NorthWestern Corp | | | 6,430,908 | | |
| | | | 13,565,692 | | |
| | | | TOTAL COMMON STOCKS
(cost $253,001,484) | | $ | 345,139,281 | | |
| | | SHORT-TERM INVESTMENTS 0.1% | |
| 248,012 | | | First American Government Obligations Fund, Class X, 0.0508% (d)
(cost $248,012) | | $ | 248,012 | | |
| | | | TOTAL INVESTMENTS 100.2%
(cost $253,249,496) | | $ | 345,387,293 | | |
| | | | | OTHER ASSETS AND LIABILITIES (NET) (0.2)% | | | (784,519 | ) | |
| | | | | TOTAL NET ASSETS 100.0% | | $ | 344,602,774 | | |
31
Mairs and Power Small Cap Fund
SCHEDULE OF INVESTMENTS (unaudited) (continued) June 30, 2023
(a) Non-income producing.
(b) The Fund is significantly invested in the industrials sector and therefore is subject to additional risks. The industrials sector may be significantly affected by general economic trends, including such factors as import controls, commodity prices and worldwide competition.
(c) Issuer headquartered overseas but considered domestic. The Adviser defines foreign issuers as those whose operational leadership or headquarters is located in a foreign country; provided, however, if an issuer is believed by the Adviser to be headquartered in a jurisdiction primarily for tax purposes, the Adviser will consider the following additional factors: 1) the location of the primary exchange trading its securities; 2) where it derives the majority of its revenues; and/or 3) where it earns the majority of its profits.
(d) The rate quoted is the annualized seven-day effective yield as of June 30, 2023.
The Global Industry Classification Standard (GICS®) was developed by and/or is the exclusive property of MSCI, Inc. and Standard & Poor's Financial Services LLC ("S&P"). GICS is a service mark of MSCI, Inc. and S&P and has been licensed for use by the Adviser.
See accompanying Notes to Financial Statements.
32
MAIRS & POWER MINNESOTA MUNICIPAL BOND ETF (unaudited)
To Our Shareholders: June 30, 2023
The Mairs & Power Minnesota Municipal Bond ETF (the "Fund") delivered a total return of 1.34% (NAV) and 1.35% (Market Price) during the first half of 2023. During the same period, the Bloomberg Minnesota Municipal Total Return (TR) Index, the Fund's benchmark, rose 1.63%.
During the first half of the year, the municipal market was relatively slow as issuers reassessed in light of higher yields, causing municipal issuance to decline 12% for the first half of the year compared to 2022 and 21% compared to 2021. The lower supply was mainly matched by slower demand as bank demand for municipals has decreased dramatically while Fund flows have seemingly not been strong enough to offset these effects. Although rates have been somewhat volatile, there has not been a very clear sense of direction, with short rates up, intermediate rates lower, and mixed direction on the long end. This is indicative of demand likely coming primarily from separate accounts, where individuals are indeed the largest holders of municipal bonds, in general, market wide.
The Fund started the year only 0.4 years long to the index although the average coupon rate was also lower than the index due to the historical nature of when most bonds were purchased in 2021. While the lower coupon rate was a drag in 2022, in the first quarter this was not an issue, although the market preference for higher coupons continues and dragged more on performance in the second quarter. This was exacerbated by the sale of some high-profile bond portfolios from failed banks. Quality, where the Fund has a higher weighting in high quality bonds than peers, has had limited effect. We will continue to be highly selective in the lower than A-rated space, where we only have five exposures currently. The exposure to this space will not likely exceed 15%, while the vast majority of the Fund will continue to focus on high quality.
Notably, we focused on and will continue to focus on unlimited tax general obligation bonds, which comprise about half of the portfolio given the solid credit structure of these securities. The second largest sector, leases, is a mix of essential purpose lease projects, including school additions, special education centers, and a county courthouse, among others. We are careful in credit selection and anticipate our preference for essential projects will continue to prevail as we will not sacrifice quality for the sake of additional yield. A major issuer, Fairview Health Services, was downgraded to the high BBB bucket during the first half of the year, and while the Fund has exposure, it is limited to only 1.3% of the portfolio as of 6/30/2023.
We are increasingly convinced that credit quality is going to matter more for municipal credits over the next decade than it did over the previous decade due to a shift in potential issues facing municipal credits.
Credit still starts at the state level for most Minnesota credits, at least for any that are political subdivisions of the state. The state's economy is still looking very good as unemployment at 2.9% is below the national average and the number of employed people is very near to topping the record pre-2020 levels. Business applications continue strong to start the year, exceeding levels in any years from the 2008-2009 financial crisis to 2021. March and May posted two of the top 10 monthly high-propensity business application numbers (those likely to turn into businesses with a payroll) in the last 20 years. This continues to portend economic growth, and Minnesota last year outperformed the country's GDP growth, which had been lagging the country in the few years prior. In our opinion, Minnesota's future economy looks bright.
From a financial picture, the state is in reasonably good shape although the spending outlook makes its continued strength less certain if there is a recession. From a credit perspective, the state had an opportunity to set itself up for the future by setting more money aside in a rainy-day fund but the legislature opted to spend more than one would have hoped with a 2024-25 budget increase that is 40% higher than the current biennium, setting a new record increase. There are many investments across the state that will relieve the burden on municipalities, included in the budget classified as one-time spending, which will ultimately improve the underlying financial outlook for cities, school districts, counties, etc.
One trend we think will continue to impact municipal credits is the lack of available employees and the continued resulting wage inflation. As inflationary effects eat away at public and nonprofit employees' real purchasing power, much like in the private sector, it seems probable wage growth will need to accelerate. It is
33
MAIRS & POWER MINNESOTA MUNICIPAL BOND ETF (unaudited) (continued)
apparent to us that we are potentially entering a time, we don't know how long, of potentially larger wage increases than we have seen in the years past. Each municipality and nonprofit have varying degrees of revenue flexibility, so this will have a disparate impact across portfolios. This requires a keener attention to credit quality than the previously benign inflation environment.
Brent Miller
Lead Manager | | Bob Thompson
Co-Manager | |
Past performance is not a guarantee of future results.
Bloomberg Minnesota Municipal (TR) Index is a market capitalization-weighted index of Minnesota investment-grade bonds with maturities of one year or more. It is not possible to invest directly in an index.
The coupon rate is the rate of interest paid by bond issuers on the bond's face value.
Investing in the Fund is subject to investment risks, including, but not limited to, possible loss of the principal amount invested.
Must be preceded or accompanied by a prospectus.
Shares of any ETF are bought and sold at market price (not NAV), may trade at a discount or premium to NAV and are not individually redeemed from the funds. Brokerage commissions will reduce returns. The Fund is non-diversified, meaning it may concentrate more of its assets in a smaller number of issuers than diversified funds.
Investments in debt securities typically decrease in value when interest rates rise. This risk is usually greater for longer-term debt securities. Investment by the Fund in lower-rated and non-rated securities presents a greater risk of loss to principal and interest than higher-rated securities. Because the Fund invests substantially in Minnesota municipal instruments, it is more exposed to the impact of negative political, economic and legislative factors within Minnesota than a fund that invests more widely. Because the Fund is "non-diversified," it may invest a greater percentage of its assets in the securities of a single issuer or a smaller number of issuers than if it were a diversified fund. The Fund is also subject to risks associated with investments in the municipal bond market, municipal mortgage-backed securities, and other investment companies. The Fund is a recently organized management investment company with no operating history. As a result, prospective investors have a limited track record on which to base their investment decision. There is also a risk that the Fund will not grow to or maintain an economically viable size, in which case it could ultimately liquidate without shareholder approval.
Mairs & Power uses the lower of the S&P or Moody's ratings and chooses to display credit ratings using S&P's convention, although the rating itself might be sourced from another Nationally Recognized Statistical Rating Agency. The ratings apply to the credit worthiness of the issuers of the underlying securities and not to the Fund itself. Ratings are expressed as letters ranging from 'AAA', which is the highest grade, to 'D', which is the lowest grade. In limited situations when the rating agency has not issued a formal rating, the rating agency will classify the security as unrated.
Foreside Fund Services, LLC is the Distributor for the Mairs & Power Funds. Foreside is not related to Mairs & Power.
34
Mairs & Power Minnesota Municipal Bond ETF
PERFORMANCE INFORMATION (unaudited) June 30, 2023
Investment performance since commencement of operations (through June 30, 2023)
This chart illustrates the performance of a hypothetical $10,000 investment made in the Fund since commencement of operations.
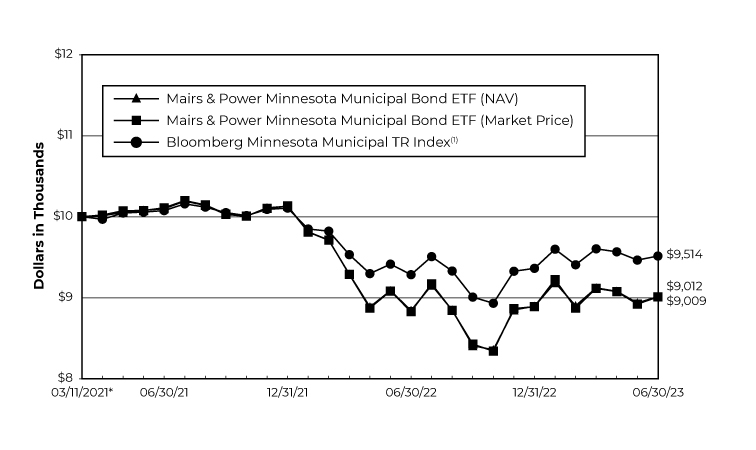
Average Annual total returns for periods ended June 30, 2023
| | | 1 Year | | Since
Commencement
of Operations(2) | |
Mairs & Power Minnesota Municipal Bond ETF (NAV) | | | 1.93 | % | | | -4.41 | % | |
Mairs & Power Minnesota Municipal Bond ETF (Market Price) | | | 2.06 | % | | | -4.43 | % | |
Bloomberg Minnesota Municipal TR Index (1) | | | 2.48 | % | | | -2.14 | % | |
Performance data quoted represents past performance and does not guarantee future results. All performance information shown includes the reinvestment of dividend and capital gain distributions, but does not reflect the deduction of taxes that a shareholder would pay on Fund distributions or the redemption of Fund shares. The investment return and principal value of an investment will fluctuate so that an investor's shares, when redeemed, may be worth more or less than their original cost. Current performance of the Fund may be lower or higher than the performance quoted. For the most recent month-end performance figures, visit the Fund's website at www.mairsandpower.com or call Shareholder Services at (855) 839-2800. Per the Prospectus dated April 30, 2023, the expense ratio for the Fund is 0.39%. See the Financial Highlights in this report for the most recent expense ratio.
(1) Bloomberg Minnesota Municipal TR Index is a market capitalization – weighted index of Minnesota investment-grade bonds with maturities of one year or more.
(2) Since commencement of operations performance is as of March 11, 2021, which is the offering date of the Minnesota Municipal Bond ETF.
35
Mairs & Power Minnesota Municipal Bond ETF
FUND INFORMATION (unaudited)�� June 30, 2023
Portfolio Managers
Brent S. Miller, CFA, lead manager since March 11, 2021, Northwestern University, MBA Management & Strategy 2016
Robert W. Thompson, CFA, co-manager since March 11, 2021, University of Minnesota, MBA Finance 1995
General Information
Fund Symbol | | | MINN | | |
Net Asset Value (NAV) Per Share | | $ | 21.92 | | |
Expense Ratio | | | 0.39 | % | |
Portfolio Turnover Rate | | | 9.76 | % | |
Sales Charge | | | None1 | | |
Fund Inception Year | | | 2021 | | |
Portfolio Composition
Top Ten Portfolio Holdings
(Percent of Total Net Assets)2
State of Minnesota | | | 3.4 | % | |
State of Minnesota | | | 3.0 | | |
Minneapolis Special School
District No 1 | | | 2.9 | | |
Anoka-Hennepin Independent
School District No 11 | | | 2.4 | | |
City of Elk River MN Electric Revenue | | | 2.0 | | |
North St Paul-Maplewood-Oakdale
Independent School District No 622 | | | 1.9 | | |
State of Minnesota | | | 1.8 | | |
Alden-Conger Independent School
District No 242 | | | 1.8 | | |
Minnesota Higher Education
Facilities Authority | | | 1.8 | | |
State of Minnesota | | | 1.8 | | |
Portfolio Diversification
(Percent of Total Net Assets)
Fixed Income Securities 98.2% | |
Municipal Bonds | | | 98.2 | % | |
Short-term Investments 1.8%3 | | | 1.8 | | |
| | | | 100.0 | % | |
1 Although the Fund is no-load, investment management fees and other expenses still apply.
2 All holdings in the portfolio are subject to change without notice and may or may not represent current or future portfolio composition. The mention of specific securities is not intended as a recommendation or offer for a particular security, nor is it intended to be a solicitation for the purchase or sale of any security.
3 Represents short-term investments and other assets and liabilities (net).
36
Mairs and Power Minnesota Municipal Bond ETF
SCHEDULE OF INVESTMENTS (unaudited) June 30, 2023
Par Value | | Security Description | | Value | |
| | | FIXED INCOME SECURITIES 98.2% | |
| | | MUNICIPAL BONDS 98.2% (a) | |
$ | 315,000 | | | State of Minnesota | | | 5.000 | % | | 08/01/23 | | $ | 315,407 | | |
| | 100,000 | | | Minnesota Municipal Power Agency | | | 5.000 | % | | 10/01/23 | | | 100,437 | | |
| | 100,000 | | | City of St Paul MN Sales & Use Tax Revenue | | | 5.000 | % | | 11/01/23 | | | 100,538 | | |
| | 275,000 | | | County of Hennepin MN | | | 5.000 | % | | 12/15/23 | | | 277,263 | | |
| | 125,000 | | | Pierz Independent School District No 484 | | | 4.000 | % | | 02/01/24 | | | 125,572 | | |
| | 250,000 | | | Richfield Independent School District No 280 | | | 5.000 | % | | 02/01/24 | | | 252,607 | | |
| | 100,000 | | | Minnesota Higher Education Facilities Authority | | | 5.000 | % | | 12/01/24 | | | 102,524 | | |
| | 230,000 | | | Northfield Independent School District No 659 | | | 5.000 | % | | 02/01/25 | | | 236,874 | | |
| | 115,000 | | | Spring Lake Park Independent School District No 16 | | | 4.000 | % | | 02/01/25 | | | 116,685 | | |
| | 150,000 | | | Minneapolis Special School District No 1 | | | 5.000 | % | | 02/01/25 | | | 154,553 | | |
| | 250,000 | | | Rosemount-Apple Valley-Eagan Independent School
District No 196 | | | 5.000 | % | | 04/01/25 | | | 257,297 | | |
| | 115,000 | | | City of Chaska MN Electric Revenue | | | 5.000 | % | | 10/01/25 | | | 119,848 | | |
| | 205,000 | | | Spring Lake Park Independent School District No 16 | | | 4.000 | % | | 02/01/26 | | | 206,043 | | |
| | 200,000 | | | Southern Plains Education Cooperative No 915 | | | 3.000 | % | | 02/01/26 | | | 196,692 | | |
| | 125,000 | | | Housing & Redevelopment Authority of The City of
St Paul Minnesota | | | 3.500 | % | | 09/01/26 | | | 119,372 | | |
| | 200,000 | | | City of Willmar MN | | | 5.000 | % | | 02/01/27 | | | 213,410 | | |
| | 330,000 | | | Alden-Conger Independent School District No 242 | | | 3.000 | % | | 02/01/27 | | | 321,976 | | |
| | 100,000 | | | City of Richfield MN | | | 4.000 | % | | 02/01/27 | | | 103,720 | | |
| | 305,000 | | | State of Minnesota | | | 5.000 | % | | 08/01/27 | | | 323,966 | | |
| | 135,000 | | | City of Center City MN | | | 4.000 | % | | 11/01/27 | | | 134,782 | | |
| | 100,000 | | | City of Wayzata MN | | | 3.000 | % | | 12/01/27 | | | 100,004 | | |
| | 175,000 | | | City of Fridley MN | | | 4.000 | % | | 02/01/28 | | | 179,595 | | |
| | 100,000 | | | Waconia Independent School District No 110 | | | 3.000 | % | | 02/01/28 | | | 100,144 | | |
| | 200,000 | | | North Branch Independent School District No 138 | | | 5.000 | % | | 02/01/28 | | | 216,023 | | |
| | 210,000 | | | City of New Ulm MN | | | 4.000 | % | | 12/01/28 | | | 223,247 | | |
| | 125,000 | | | City of Faribault MN | | | 4.000 | % | | 12/15/28 | | | 132,629 | | |
| | 95,000 | | | City of Apple Valley MN | | | 3.000 | % | | 12/15/28 | | | 96,511 | | |
| | 145,000 | | | Minneapolis-St Paul Metropolitan Airports Commission | | | 5.000 | % | | 01/01/29 | | | 154,879 | | |
| | 200,000 | | | Minneapolis-St Paul Metropolitan Airports Commission | | | 5.000 | % | | 01/01/30 | | | 222,424 | | |
| | 185,000 | | | City of Hopkins MN | | | 2.000 | % | | 02/01/30 | | | 168,995 | | |
| | 110,000 | | | Rocori Area Schools Independent School District No 750 | | | 4.000 | % | | 02/01/30 | | | 114,940 | | |
| | 105,000 | | | Metropolitan Council | | | 4.000 | % | | 03/01/30 | | | 110,011 | | |
| | 150,000 | | | Rosemount-Apple Valley-Eagan Independent School
District No 196 | | | 1.300 | % | | 04/01/30 | | | 129,038 | | |
| | 200,000 | | | City of Minneapolis MN | | | 2.000 | % | | 12/01/30 | | | 179,915 | | |
| | 150,000 | | | County of Hennepin MN | | | 5.000 | % | | 12/15/30 | | | 172,245 | | |
| | 275,000 | | | Springfield Independent School District No 85 | | | 3.000 | % | | 02/01/31 | | | 277,337 | | |
| | 200,000 | | | Duluth Independent School District No 709 | | | 0.000 | % (b) | | 02/01/31 | | | 150,689 | | |
| | 200,000 | | | North St Paul-Maplewood-Oakdale Independent School
District No 622 | | | 2.000 | % | | 02/01/31 | | | 178,511 | | |
| | 130,000 | | | St Cloud Housing & Redevelopment Authority | | | 2.000 | % | | 02/01/31 | | | 117,484 | | |
37
Mairs and Power Minnesota Municipal Bond ETF
SCHEDULE OF INVESTMENTS (unaudited) (continued) June 30, 2023
Par Value | | Security Description | | Value | |
| | | FIXED INCOME SECURITIES (continued) | |
| | | MUNICIPAL BONDS (continued) | |
$ | 50,000 | | | Pelican Rapids Independent School District No 548 | | | 2.150 | % | | 02/01/31 | | $ | 47,455 | | |
| | 100,000 | | | Princeton Public Utilities Commission | | | 5.000 | % | | 04/01/31 | | | 112,096 | | |
| | 65,000 | | | Dakota County Community Development Agency | | | 2.000 | % | | 01/01/32 | | | 57,021 | | |
| | 175,000 | | | Minneapolis-St Paul Metropolitan Airports Commission | | | 5.000 | % | | 01/01/32 | | | 186,269 | | |
| | 195,000 | | | City of Carver MN | | | 3.000 | % | | 02/01/32 | | | 192,429 | | |
| | 200,000 | | | Pine City Independent School District No 578 | | | 2.000 | % | | 04/01/32 | | | 176,311 | | |
| | 365,000 | | | City of Elk River MN Electric Revenue | | | 3.000 | % | | 08/01/32 | | | 359,687 | | |
| | 75,000 | | | Housing & Redevelopment Authority of The City of
St Paul Minnesota | | | 4.000 | % | | 10/01/32 | | | 76,951 | | |
| | 110,000 | | | Housing & Redevelopment Authority of The City of
St Paul Minnesota | | | 3.125 | % | | 11/15/32 | | | 102,717 | | |
| | 200,000 | | | City of Carver MN | | | 3.000 | % | | 02/01/33 | | | 195,524 | | |
| | 160,000 | | | St Cloud Housing & Redevelopment Authority | | | 2.000 | % | | 02/01/33 | | | 139,467 | | |
| | 200,000 | | | St Paul Independent School District No 625 | | | 3.000 | % | | 02/01/33 | | | 196,904 | | |
| | 115,000 | | | City of Madelia MN | | | 2.000 | % | | 02/01/33 | | | 100,242 | | |
| | 300,000 | | | Hibbing Independent School District No 701 | | | 3.000 | % | | 03/01/33 | | | 295,009 | | |
| | 300,000 | | | City of St Paul MN | | | 2.000 | % | | 05/01/33 | | | 256,679 | | |
| | 120,000 | | | City of Minneapolis MN | | | 5.000 | % | | 11/15/33 | | | 127,858 | | |
| | 180,000 | | | County of Hennepin MN | | | 5.000 | % | | 12/15/33 | | | 205,623 | | |
| | 125,000 | | | Zumbro Education District | | | 4.000 | % | | 02/01/34 | | | 124,216 | | |
| | 110,000 | | | Shakopee Independent School District No 720 | | | 3.500 | % | | 02/01/34 | | | 110,052 | | |
| | 200,000 | | | City of St Cloud MN | | | 2.000 | % | | 02/01/34 | | | 168,469 | | |
| | 300,000 | | | City of Hutchinson MN | | | 2.000 | % | | 02/01/34 | | | 252,703 | | |
| | 275,000 | | | State of Minnesota | | | 5.000 | % | | 08/01/34 | | | 309,644 | | |
| | 100,000 | | | City of Center City MN | | | 4.500 | % | | 11/01/34 | | | 100,083 | | |
| | 120,000 | | | Minneapolis-St Paul Metropolitan Airports Commission | | | 5.000 | % | | 01/01/35 | | | 132,124 | | |
| | 350,000 | | | North St Paul-Maplewood-Oakdale Independent School
District No 622 | | | 3.000 | % | | 02/01/35 | | | 333,111 | | |
| | 100,000 | | | St Paul Independent School District No 625 | | | 2.250 | % | | 02/01/35 | | | 83,258 | | |
| | 100,000 | | | County of Pennington MN | | | 2.375 | % | | 02/01/35 | | | 87,280 | | |
| | 350,000 | | | County of St Louis MN | | | 2.000 | % | | 12/01/35 | | | 276,233 | | |
| | 500,000 | | | Minneapolis Special School District No 1 | | | 4.000 | % | | 02/01/36 | | | 519,498 | | |
| | 100,000 | | | City of Coon Rapids MN | | | 2.500 | % | | 02/01/36 | | | 85,175 | | |
| | 100,000 | | | University of Minnesota | | | 5.000 | % | | 04/01/36 | | | 104,210 | | |
| | 150,000 | | | Minnetonka Independent School District No 276 | | | 3.000 | % | | 07/01/36 | | | 141,583 | | |
| | 200,000 | | | Minnesota Higher Education Facilities Authority | | | 3.000 | % | | 10/01/36 | | | 172,196 | | |
| | 100,000 | | | City of Hanover MN | | | 3.300 | % | | 02/01/37 | | | 93,626 | | |
| | 225,000 | | | Fergus Falls Independent School District No 544 | | | 3.000 | % | | 02/01/37 | | | 191,130 | | |
| | 130,000 | | | Minnesota Higher Education Facilities Authority | | | 4.000 | % | | 03/01/37 | | | 134,017 | | |
| | 250,000 | | | Housing & Redevelopment Authority of The City of
St Paul Minnesota | | | 4.000 | % | | 10/01/37 | | | 250,951 | | |
| | 250,000 | | | City of Delano MN | | | 5.000 | % | | 02/01/38 | | | 279,597 | | |
| | 275,000 | | | Zumbro Education District | | | 4.000 | % | | 02/01/38 | | | 259,394 | | |
38
Mairs and Power Minnesota Municipal Bond ETF
SCHEDULE OF INVESTMENTS (unaudited) (continued) June 30, 2023
Par Value | | Security Description | | Value | |
| | | FIXED INCOME SECURITIES (continued) | |
| | | MUNICIPAL BONDS (continued) | |
$ | 295,000 | | | County of Wright MN | | | 3.000 | % | | 12/01/38 | | $ | 256,485 | | |
| | 250,000 | | | Rochester Independent School District No 535 | | | 2.500 | % | | 02/01/39 | | | 197,803 | | |
| | 490,000 | | | State of Minnesota | | | 5.000 | % | | 08/01/39 | | | 544,229 | | |
| | 250,000 | | | County of Wright MN | | | 3.000 | % | | 12/01/39 | | | 216,298 | | |
| | 150,000 | | | City of Rochester MN | | | 5.000 | % | | 02/01/40 | | | 171,213 | | |
| | 150,000 | | | University of Minnesota | | | 5.000 | % | | 04/01/40 | | | 162,595 | | |
| | 545,000 | | | State of Minnesota | | | 5.000 | % | | 08/01/40 | | | 603,100 | | |
| | 175,000 | | | City of Minneapolis MN | | | 4.000 | % | | 11/15/40 | | | 169,507 | | |
| | 290,000 | | | City of Apple Valley MN | | | 4.000 | % | | 09/01/41 | | | 241,894 | | |
| | 400,000 | | | Minnesota Higher Education Facilities Authority | | | 3.000 | % | | 10/01/41 | | | 320,572 | | |
| | 500,000 | | | Anoka-Hennepin Independent School District No 11 | | | 3.000 | % | | 02/01/43 | | | 431,833 | | |
| | 125,000 | | | Minnesota Higher Education Facilities Authority | | | 3.000 | % | | 03/01/43 | | | 103,827 | | |
| | 200,000 | | | County of Itasca MN | | | 4.000 | % | | 02/01/44 | | | 202,601 | | |
| | 85,000 | | | Minnesota Municipal Power Agency | | | 5.000 | % | | 10/01/47 | | | 87,765 | | |
| | 100,000 | | | Western Minnesota Municipal Power Agency | | | 5.000 | % | | 01/01/49 | | | 105,283 | | |
| | | | 17,655,984 | | |
| | TOTAL FIXED INCOME SECURITIES
(cost $19,529,472) | | | | | | | | | | $ | 17,655,984 | | |
| | | SHORT-TERM INVESTMENTS 1.2% | |
| 214,695 | | | First American Government Obligations Fund, Class X, 0.0508% (c)
(cost $214,695) | | | | | | | | | | $ | 214,695 | | |
| | | | TOTAL INVESTMENTS 99.4%
(cost $19,744,167) | | | | | | | | | | $ | 17,870,679 | | |
| | | | | OTHER ASSETS AND LIABILITIES (NET) 0.6% | | | | | | | | | | | 106,726 | | |
| | | | | TOTAL NET ASSETS 100.0% | | | | | | | | | | $ | 17,977,405 | | |
(a) The date shown represents the earliest of the next put date or final maturity date.
(b) Zero coupon bond.
(c) The rate quoted is the annualized seven-day effective yield as of June 30, 2023.
See accompanying Notes to Financial Statements.
39
STATEMENTS OF ASSETS AND LIABILITIES (unaudited) June 30, 2023
| | | Mairs & Power
Growth Fund | | Mairs & Power
Balanced Fund | | Mairs & Power
Small Cap Fund | | Mairs & Power
Minnesota
Municipal
Bond ETF | |
ASSETS | |
| Investments, at fair value (Note 1) *: | |
Unaffiliated securities * | | $ | 4,780,469,239 | | | $ | 784,067,008 | | | $ | 345,387,293 | | | $ | 17,870,679 | | |
| Affiliated securities (Note 5) * | | | 68,778,522 | | | | - | | | | - | | | | - | | |
| | | | 4,849,247,761 | | | | 784,067,008 | | | | 345,387,293 | | | | 17,870,679 | | |
Receivable for Fund shares sold | | | 695,989 | | | | 585,871 | | | | 85,354 | | | | - | | |
Receivable for securities sold | | | 19,819,271 | | | | 1,145,542 | | | | - | | | | - | | |
Dividends and interest receivable | | | 5,836,736 | | | | 4,127,547 | | | | 66,660 | | | | 219,289 | | |
Prepaid expenses and other assets | | | 103,047 | | | | 46,648 | | | | 34,743 | | | | - | | |
| | | | 4,875,702,804 | | | | 789,972,616 | | | | 345,574,050 | | | | 18,089,968 | | |
LIABILITIES | |
Payable for Fund shares redeemed | | | 14,052,474 | | | | 96,045 | | | | 706,753 | | | | - | | |
Payable for securities purchased | | | - | | | | 1,059,314 | | | | - | | | | 112,190 | | |
Payable to custodian | | | - | | | | 433,128 | | | | - | | | | - | | |
| Payable to Affiliates (Note 7) | | | 410,293 | | | | 82,227 | | | | 35,206 | | | | - | | |
Accrued investment management
fees (Note 4) | | | 2,126,543 | | | | 366,384 | | | | 212,628 | | | | 373 | | |
Accrued audit and tax fees | | | 7,920 | | | | 8,589 | | | | 8,277 | | | | - | | |
Other accrued fees | | | 23,024 | | | | 14,256 | | | | 8,412 | | | | - | | |
| | | | 16,620,254 | | | | 2,059,943 | | | | 971,276 | | | | 112,563 | | |
NET ASSETS | | $ | 4,859,082,550 | | | $ | 787,912,673 | | | $ | 344,602,774 | | | $ | 17,977,405 | | |
NET ASSETS CONSIST OF | |
Paid-in capital | | $ | 2,174,412,253 | | | $ | 543,593,415 | | | $ | 243,236,620 | | | $ | 820 | | |
Additional Paid-in capital | | | - | | | | - | | | | - | | | | 20,332,609 | | |
Total distributable earnings | | | 2,684,670,297 | | | | 244,319,258 | | | | 101,366,154 | | | | (2,356,024 | ) | |
TOTAL NET ASSETS | | $ | 4,859,082,550 | | | $ | 787,912,673 | | | $ | 344,602,774 | | | $ | 17,977,405 | | |
Fund shares, par value | | $ | 0.01 | | | $ | 0.01 | | | $ | 0.01 | | | $ | 0.001 | | |
Authorized | | | unlimited | | | | unlimited | | | | unlimited | | | | unlimited | | |
Fund shares issued and outstanding | | | 34,794,189 | | | | 7,970,528 | | | | 12,251,505 | | | | 820,000 | | |
Net asset value per share | | $ | 139.65 | | | $ | 98.85 | | | $ | 28.13 | | | $ | 21.92 | | |
* Cost of investments | | | | | | | |
Cost of unaffiliated securities | | $ | 2,340,791,278 | | | $ | 582,040,187 | | | $ | 253,249,496 | | | $ | 19,744,167 | | |
| Cost of affiliated securities (Note 5) | | | 56,561,087 | | | | - | | | | - | | | | - | | |
| | | $ | 2,397,352,365 | | | $ | 582,040,187 | | | $ | 253,249,496 | | | $ | 19,744,167 | | |
See accompanying Notes to Financial Statements.
40
STATEMENT OF OPERATIONS (unaudited) June 30, 2023
| | | Mairs & Power
Growth Fund | | Mairs & Power
Balanced Fund | | Mairs & Power
Small Cap Fund | | Mairs & Power
Minnesota
Municipal
Bond ETF | |
INVESTMENT INCOME | |
Income: | |
Dividends from unaffiliated securities * | | $ | 33,666,658 | | | $ | 4,743,250 | | | $ | 1,908,667 | | | $ | - | | |
Dividends from affiliated securities
(Note 5) | | | 462,672 | | | | - | | | | - | | | | - | | |
Interest income | | | 256,515 | | | | 6,070,986 | | | | 10,004 | | | | 184,384 | | |
TOTAL INCOME | | | 34,385,845 | | | | 10,814,236 | | | | 1,918,671 | | | | 184,384 | | |
Expenses: | |
| Investment management fees (Note 4) | | | 12,588,857 | | | | 2,331,960 | | | | 1,337,439 | | | | 35,628 | | |
| Transfer agent fees (Note 7) | | | 750,655 | | | | 139,771 | | | | 80,370 | | | | - | | |
| Fund administration fees (Note 7) | | | 329,336 | | | | 66,643 | | | | 32,286 | | | | - | | |
| Fund accounting fees (Note 7) | | | 222,760 | | | | 57,006 | | | | 18,287 | | | | - | | |
| ReFlow fees (Note 11) | | | 167,532 | | | | 32,752 | | | | 1,472 | | | | - | | |
| Custodian fees (Note 7) | | | 113,285 | | | | 20,990 | | | | 9,691 | | | | - | | |
Printing and mailing fees | | | 59,021 | | | | 16,020 | | | | 11,317 | | | | - | | |
Legal and audit fees | | | 24,488 | | | | 17,284 | | | | 15,471 | | | | - | | |
Trustees' fees | | | 11,872 | | | | 11,872 | | | | 11,872 | | | | - | | |
| Chief Compliance Officer fees (Note 7) | | | 5,611 | | | | 5,611 | | | | 5,611 | | | | - | | |
Other fees | | | 71,810 | | | | 27,005 | | | | 23,456 | | | | - | | |
TOTAL EXPENSES | | | 14,345,227 | | | | 2,726,914 | | | | 1,547,272 | | | | 35,628 | | |
NET INVESTMENT INCOME | | | 20,040,618 | | | | 8,087,322 | | | | 371,399 | | | | 148,756 | | |
| REALIZED AND UNREALIZED GAIN (LOSS) (Note 3) | |
Net realized gain (loss) on investments | |
Unaffiliated issuers | | | 86,383,855 | | | | 7,403,060 | | | | 1,894,373 | | | | (121,788 | ) | |
| Affiliated issuers (Note 5) | | | (502,555 | ) | | | - | | | | - | | | | - | | |
| Redemptions in-kind (Note 9, 11) | | | 118,904,535 | | | | 28,712,772 | | | | 6,337,208 | | | | - | | |
| | | | 204,785,835 | | | | 36,115,832 | | | | 8,231,581 | | | | (121,788 | ) | |
Change in net unrealized appreciation/
depreciation on investments | |
Unaffiliated issuers | | | 552,794,072 | | | | 11,141,165 | | | | 12,341,968 | | | | 215,004 | | |
| Affiliated issuers (Note 5) | | | 17,902,967 | | | | - | | | | - | | | | - | | |
| | | | 570,697,039 | | | | 11,141,165 | | | | 12,341,968 | | | | 215,004 | | |
NET GAIN ON INVESTMENTS | | | 775,482,874 | | | | 47,256,997 | | | | 20,573,549 | | | | 93,216 | | |
NET INCREASE IN NET ASSETS
FROM OPERATIONS | | $ | 795,523,492 | | | $ | 55,344,319 | | | $ | 20,944,948 | | | $ | 241,972 | | |
* Net of foreign taxes and fees withheld of: | | $ | 750,757 | | | $ | 104,289 | | | $ | - | | | $ | - | | |
See accompanying Notes to Financial Statements.
41
Mairs & Power Growth Fund
STATEMENTS OF CHANGES IN NET ASSETS
| | | Six Months Ended
June 30, 2023
(Unaudited) | | Year Ended
December 31,
2022 | |
OPERATIONS | |
Net investment income | | $ | 20,040,618 | | | $ | 36,410,710 | | |
Net realized gain on investments sold | | | 204,785,835 | | | | 291,993,858 | | |
Net change in unrealized appreciation/depreciation of investments | | | 570,697,039 | | | | (1,564,049,561 | ) | |
NET INCREASE (DECREASE) IN NET ASSETS FROM OPERATIONS | | | 795,523,492 | | | | (1,235,644,993 | ) | |
DISTRIBUTIONS TO SHAREHOLDERS | | | (19,159,551 | ) | | | (359,003,743 | ) | |
CAPITAL TRANSACTIONS | |
Proceeds from shares sold | | | 228,171,741 | | | | 213,375,112 | | |
Reinvestment of distributions | | | 17,491,274 | | | | 335,444,125 | | |
Cost of shares redeemed (1) | | | (499,430,070 | ) | | | (567,846,097 | ) | |
DECREASE IN NET ASSETS FROM CAPITAL TRANSACTIONS | | | (253,767,055 | ) | | | (19,026,860 | ) | |
TOTAL INCREASE (DECREASE) IN NET ASSETS: | | | 522,596,886 | | | | (1,613,675,596 | ) | |
NET ASSETS | |
Beginning of period/year | | | 4,336,485,664 | | | | 5,950,161,260 | | |
End of period/year | | $ | 4,859,082,550 | | | $ | 4,336,485,664 | | |
FUND SHARE TRANSACTIONS | |
Shares sold | | | 1,782,055 | | | | 1,594,383 | | |
Shares issued for reinvested distributions | | | 126,988 | | | | 2,797,786 | | |
Shares redeemed | | | (3,865,848 | ) | | | (4,246,139 | ) | |
NET INCREASE (DECREASE) IN FUND SHARES | | | (1,956,805 | ) | | | 146,030 | | |
(1) Includes redemption in-kind transactions. See additional information contained in Note II.
See accompanying Notes to Financial Statements.
42
Mairs & Power Balanced Fund
STATEMENTS OF CHANGES IN NET ASSETS
| | | Six Months Ended
June 30, 2023
(Unaudited) | | Year Ended
December 31,
2022 | |
OPERATIONS | |
Net investment income | | $ | 8,087,322 | | | $ | 15,750,973 | | |
Net realized gain on investments sold | | | 36,115,832 | | | | 41,462,416 | | |
Net change in unrealized appreciation/depreciation of investments | | | 11,141,165 | | | | (207,886,965 | ) | |
NET INCREASE (DECREASE) IN NET ASSETS FROM OPERATIONS | | | 55,344,319 | | | | (150,673,576 | ) | |
DISTRIBUTIONS TO SHAREHOLDERS | | | (8,055,510 | ) | | | (53,002,212 | ) | |
CAPITAL TRANSACTIONS | |
Proceeds from shares sold | | | 48,232,763 | | | | 41,813,579 | | |
Reinvestment of distributions | | | 7,748,284 | | | | 51,362,388 | | |
Cost of shares redeemed (1) | | | (96,204,266 | ) | | | (131,604,263 | ) | |
DECREASE IN NET ASSETS FROM CAPITAL TRANSACTIONS | | | (40,223,219 | ) | | | (38,428,296 | ) | |
TOTAL INCREASE (DECREASE) IN NET ASSETS: | | | 7,065,590 | | | | (242,104,084 | ) | |
NET ASSETS | |
Beginning of period/year | | | 780,847,083 | | | | 1,022,951,167 | | |
End of period/year | | $ | 787,912,673 | | | $ | 780,847,083 | | |
FUND SHARE TRANSACTIONS | |
Shares sold | | | 503,305 | | | | 406,105 | | |
Shares issued for reinvested distributions | | | 80,766 | | | | 539,062 | | |
Shares redeemed | | | (1,004,120 | ) | | | (1,305,931 | ) | |
NET DECREASE IN FUND SHARES | | | (420,049 | ) | | | (360,764 | ) | |
(1) Includes redemption in-kind transactions. See additional information contained in Note II.
See accompanying Notes to Financial Statements.
43
Mairs & Power Small Cap Fund
STATEMENTS OF CHANGES IN NET ASSETS
| | | Six Months Ended
June 30, 2023
(Unaudited) | | Year Ended
December 31,
2022 | |
OPERATIONS | |
Net investment income | | $ | 371,399 | | | $ | 664,698 | | |
Net realized gain on investments sold | | | 8,231,581 | | | | 20,066,088 | | |
Net change in unrealized appreciation/depreciation of investments | | | 12,341,968 | | | | (79,413,681 | ) | |
NET INCREASE (DECREASE) IN NET ASSETS FROM OPERATIONS | | | 20,944,948 | | | | (58,682,895 | ) | |
DISTRIBUTIONS TO SHAREHOLDERS | | | - | | | | (20,863,780 | ) | |
CAPITAL TRANSACTIONS | |
Proceeds from shares sold | | | 17,979,259 | | | | 48,415,834 | | |
Reinvestment of distributions from net investment income and net | | | - | | | | 20,228,875 | | |
Cost of shares redeemed (1)(2) | | | (31,522,864 | ) | | | (79,153,217 | ) | |
DECREASE IN NET ASSETS FROM CAPITAL TRANSACTIONS | | | (13,543,605 | ) | | | (10,508,508 | ) | |
TOTAL INCREASE (DECREASE) IN NET ASSETS: | | | 7,401,343 | | | | (90,055,183 | ) | |
NET ASSETS | |
Beginning of period/year | | | 337,201,431 | | | | 427,256,614 | | |
End of period/year | | $ | 344,602,774 | | | $ | 337,201,431 | | |
FUND SHARE TRANSACTIONS | |
Shares sold | | | 672,758 | | | | 1,684,901 | | |
Shares issued for reinvested distributions | | | - | | | | 762,491 | | |
Shares redeemed | | | (1,180,551 | ) | | | (2,757,980 | ) | |
NET DECREASE IN FUND SHARES | | | (507,793 | ) | | | (310,588 | ) | |
| (1) Net of redemption fees of: | | $ | 2,537 | | | $ | 12,163 | | |
(2) Includes redemption in-kind transactions. See additional information contained in Note II.
See accompanying Notes to Financial Statements.
44
Mairs & Power Minnesota Municipal Bond ETF
STATEMENTS OF CHANGES IN NET ASSETS
| | | Six Months Ended
June 30, 2023
(Unaudited) | | Year Ended
December 31,
2022 | |
OPERATIONS | |
Net investment income | | $ | 148,756 | | | $ | 232,735 | | |
Net realized loss on investments sold | | | (121,788 | ) | | | (370,658 | ) | |
Net change in unrealized appreciation/depreciation of investments | | | 215,004 | | | | (2,159,038 | ) | |
NET INCREASE (DECREASE) IN NET ASSETS FROM OPERATIONS | | | 241,972 | | | | (2,296,961 | ) | |
DISTRIBUTIONS TO SHAREHOLDERS | | | (140,050 | ) | | | (231,169 | ) | |
CAPITAL TRANSACTIONS | |
Proceeds from shares sold | | | 881,401 | | | | 5,601,935 | | |
Cost of shares redeemed | | | (443,918 | ) | | | (4,268,958 | ) | |
| Transaction fees (Note 8) | | | (1,472 | ) | | | 15,199 | | |
INCREASE IN NET ASSETS FROM CAPITAL TRANSACTIONS | | | 436,011 | | | | 1,348,176 | | |
TOTAL INCREASE (DECREASE) IN NET ASSETS: | | | 537,933 | | | | (1,179,954 | ) | |
NET ASSETS | |
Beginning of period/year | | | 17,439,472 | | | | 18,619,426 | | |
End of period/year | | $ | 17,977,405 | | | $ | 17,439,472 | | |
FUND SHARE TRANSACTIONS | |
Shares sold | | | 40,000 | | | | 250,000 | | |
Shares redeemed | | | (20,000 | ) | | | (190,000 | ) | |
NET INCREASE IN FUND SHARES | | | 20,000 | | | | 60,000 | | |
See accompanying Notes to Financial Statements.
45
NOTES TO THE FINANCIAL STATEMENTS (unaudited) June 30, 2023
Trust for Professional Managers (the "Trust") was organized as a Delaware statutory trust under a Declaration of Trust dated May 29, 2001. The Trust is registered under the Investment Company Act of 1940, as amended (the "1940 Act"), as an open-end, management investment company. The Mairs & Power Funds (the "Funds") are comprised of the Mairs & Power Growth Fund (the "Growth Fund"), Mairs & Power Balanced Fund (the "Balanced Fund"), Mairs & Power Small Cap Fund (the "Small Cap Fund") (collectively, the "Mutual Funds") and the Mairs & Power Minnesota Municipal Bond ETF (the "Minnesota ETF"), each representing a distinct series with its own investment objective and policies within the Trust.
The investment objective of the Growth Fund is to provide shareholders with a diversified portfolio of common stocks, which have the potential for above-average, long- term appreciation. The investment objective of the Balanced Fund is to provide capital growth, current income and preservation of capital. The investment objective of the Small Cap Fund is to seek above-average, long-term appreciation.
Pursuant to three tax-free reorganizations that took place after the close of business on April 29, 2022 (each such transaction, a "Reorganization," and collectively, the "Reorganizations"), the Growth Fund, the Balanced Fund and the Small Cap Fund are the successors to the Mairs & Power Growth Fund (the "Predecessor Growth Fund"), the Mairs & Power Balanced Fund (the "Predecessor Balanced Fund") and the Mairs & Power Small Cap Fund (the "Predecessor Small Cap Fund," and together with the Predecessor Growth Fund and the Predecessor Balanced Fund, the "Predecessor Funds"), respectively, each a series of Mairs & Power Funds Trust. Each Predecessor Fund was deemed to be the accounting survivor of its Reorganization for financial reporting purposes and as a result, the financial statements of each Mutual Fund reflect the operations of the corresponding Predecessor Fund for the period prior to April 29, 2022. Two-thirds of the Reorganization costs were paid by the Mutual Funds' investment adviser and the Mutual Funds paid the remaining one-third of the costs.
The following table illustrates the specifics of the Reorganization:
| | | Predecessor
Fund
Net Assets* | | Shares Issued to
Shareholders of
Predecessor
Funds | | Mutual Fund
Net Assets | | Combined
Net Assets | |
Growth Fund(1) | | $ | 4,925,878,421 | | | | 35,901,368 | | | $ | - | | | $ | 4,925,878,421 | | |
Balanced Fund(2) | | | 890,697,396 | | | | 8,627,959 | | | | - | | | | 890,697,396 | | |
Small Cap Fund(3) | | | 357,977,711 | | | | 12,779,782 | | | | - | | | | 357,977,711 | | |
(1) Includes accumulated net investment income, accumulated realized gains and unrealized appreciation in the amounts of $17,951,171, $285,674,754 and $2,369,969,445, respectively.
(2) Includes accumulated net investment income, accumulated realized gains and unrealized appreciation in the amounts of $1,711,962, $29,195,158 and $263,238,231, respectively.
(3) Includes accumulated net investment income, accumulated realized gains and unrealized appreciation in the amounts of $2,882,205, $27,509,087 and $83,577,770, respectively.
The Predecessor Growth Fund commenced operations on November 7, 1958. The Predecessor Balanced Fund commenced operations on January 10, 1961. The Predecessor Small Cap Fund commenced operations on August 11, 2011.
The Minnesota ETF is an actively-managed exchange-traded fund. The investment objective of the Minnesota ETF is to seek current income that is exempt from federal and Minnesota state income tax consistent with the preservation of capital. The Minnesota ETF commenced operations on March 11, 2021.
Costs incurred by the Funds in connection with the organization and the initial public offering of shares were paid by Mairs & Power, Inc. (the "Adviser"), the Funds' investment adviser. The Trust may issue an unlimited number of shares of beneficial interest at par value of $0.01 and $0.001 for the Mutual Funds and Minnesota ETF, respectively. The assets of the Funds' are segregated, and a shareholder's interest is limited to the fund in which shares are held.
46
NOTES TO THE FINANCIAL STATEMENTS (unaudited) (continued) June 30, 2023
Note 1 – Organization (continued)
The Funds are investment companies and accordingly follows the investment company accounting and reporting guidance of the Financial Accounting Standards Board ("FASB") Accounting Standards Codification ("ASC") Topic 946 "Financial Services – Investment Companies".
Note 2 – Significant Accounting Policies
The following is a summary of significant accounting policies consistently followed by the Funds in the preparation of the financial statements. These policies are in conformity with generally accepted accounting principles in the United States of America ("GAAP").
Investment Valuation
Each equity security owned by a Fund that is listed on a securities exchange, except for securities listed on the NASDAQ Stock Market LLC ("NASDAQ"), is valued at its last sale price on the exchange on the date as of which assets are valued. When the security is listed on more than one exchange, the Fund will use the price of the exchange that the Fund generally considers to be the principal exchange on which the stock is traded. Fund securities listed on NASDAQ will be valued at the NASDAQ Official Closing Price ("NOCP"), which may not necessarily represent the last sale price. If the NOCP is not available, such securities shall be valued at the last sale price on the day of valuation. If there has been no sale on such exchange or on NASDAQ on such day, the security is valued at (i) the mean between the most recent quoted bid and asked prices at the close of the exchange on such day or (ii) the latest sales price on the Composite Market for the day such security is being valued. "Composite Market" means a consolidation of the trade information provided by national securities and foreign exchanges and over-the- counter markets as published by an approved independent pricing service (a "Pricing Service").
Debt securities, such as U.S. government securities, corporate securities, municipal securities and asset-backed and mortgage-backed securities, including short-term debt instruments having a maturity of 60 days or less, are valued at the mean in accordance with prices supplied by a Pricing Service. Pricing Services may use various valuation methodologies such as the mean between the bid and the asked prices, matrix pricing and other analytical pricing models as well as market transactions and dealer quotations. If a price is not available from a Pricing Service, the most recent quotation obtained from one or more broker-dealers known to follow the issue will be obtained. Quotations will be valued at the mean between the bid and the offer. In the absence of available quotations, the securities will be priced at fair value. Any discount or premium is accreted or amortized over the expected life of the respective security using the constant yield to maturity method. Pricing Services generally value debt securities assuming orderly transactions of an institutional round lot size, but such securities may be held or transactions may be conducted in such securities in smaller, odd lot sizes. Odd lots often trade at lower prices than institutional round lots.
Demand notes and repurchase agreements are valued at cost. If cost does not represent current market value the securities will be priced at fair value.
Redeemable securities issued by open-end, registered investment companies are valued at the net asset values ("NAVs") of such companies for purchase and/or redemption orders placed on that day. If, on a particular day, a share of an investment company is not listed on NASDAQ, such security's fair value will be determined.
When market quotations are not readily available, any security or other asset is valued at its fair value in accordance with Rule 2a-5 of the 1940 Act as determined under the Adviser's fair value pricing procedures, subject to oversight by the Trust's Board of Trustees (the "Board"). These fair value procedures will also be used to price a security when corporate events, events in the securities market or world events cause the Adviser to believe that a security's last sale price may not reflect its actual fair market value. The intended effect of using fair value pricing procedures is to ensure that each Fund is accurately priced.
47
NOTES TO THE FINANCIAL STATEMENTS (unaudited) (continued) June 30, 2023
Note 2 – Significant Accounting Policies (continued)
Investment Valuation (continued)
FASB ASC Topic 820, "Fair Value Measurements and Disclosures" ("ASC 820"), establishes an authoritative definition of fair value and sets out a hierarchy for measuring fair value. ASC 820 requires an entity to evaluate certain factors to determine whether there has been a significant decrease in volume and level of activity for the security such that recent transactions and quoted prices may not be determinative of fair value and further analysis and adjustment may be necessary to estimate fair value. ASC 820 also requires enhanced disclosure regarding the inputs and valuation techniques used to measure fair value in those instances as well as expanded disclosure of valuation levels for each class of investments. These inputs are summarized in the three broad levels listed below:
• Level 1 – Quoted prices in active markets for identical securities.
• Level 2 – Other significant observable inputs (including quoted prices for similar securities, interest rates, prepayment speeds, credit risk, etc.).
• Level 3 – Significant unobservable inputs (including the Fund's own assumptions in determining the fair value of investments).
The inputs or methodology used for valuing securities are not necessarily an indication of the risk associated with investing in those securities. The following is a summary of the inputs used to value the Funds' investments carried at fair value as of June 30, 2023:
| | | Growth Fund | | Balanced Fund | | Small Cap Fund | | Minnesota ETF | |
Level 1* | | $ | 4,849,247,761 | | | $ | 523,709,177 | | | $ | 345,387,293 | | | $ | 214,695 | | |
Level 2** | | | - | | | | 260,357,831 | | | | - | | | | 17,655,984 | | |
Level 3 | | | - | | | | - | | | | - | | | | - | | |
Total | | $ | 4,849,247,761 | | | $ | 784,067,008 | | | $ | 345,387,293 | | | $ | 17,870,679 | | |
* All Level 1 investments are equity securities (common stocks and preferred stocks) and short-term investments.
** All Level 2 investments are fixed income securities.
For detail of securities by major sector classification for the Funds, please refer to the Schedules of Investments.
The Funds did not hold any Level 3 investments during the six months ended June 30, 2023.
The Funds did not hold any financial derivative instruments during the six months ended June 30, 2023.
Federal Income Taxes
The Funds intend to comply with the requirements of Subchapter M of the Internal Revenue Code of 1986 (the "Code"), as amended, necessary to qualify as a regulated investment company and to make the requisite distributions of income and capital gains to its shareholders sufficient to relieve it from all or substantially all federal income taxes. Therefore, no federal income tax provision has been provided.
The Funds' federal income tax returns are subject to examination by the Internal Revenue Service (the "IRS") for a period of three fiscal years after they are filed. State and local tax returns may be subject to examination for an additional fiscal year depending on the jurisdiction. As of and during the period ended December 31, 2022, the Funds did not have a liability for any unrecognized tax benefits.
The Funds recognize interest and penalties, if any, related to uncertain tax benefits as income tax expense in the Statements of Operations. During the year, the Funds did not incur any interest or penalties.
Distributions to Shareholders
In general, the Growth Fund will distribute any net investment income semiannually. The Balanced Fund will distribute any net investment income quarterly. The Small Cap Fund will distribute any net investment income at least annually. The Minnesota ETF will distribute any net investment income monthly. The Funds will
48
NOTES TO THE FINANCIAL STATEMENTS (unaudited) (continued) June 30, 2023
Note 2 – Significant Accounting Policies (continued)
Distributions to Shareholders (continued)
distribute any net realized long- or short-term capital gains, if any, at least annually. Distributions from net realized gains for book purposes may include short-term capital gains. All short-term capital gains are included in ordinary income for tax purposes.
Distributions to shareholders are recorded on the ex-dividend date. The Funds may also pay a special distribution at the end of the calendar year to comply with federal tax requirements. Income and capital gain distributions may differ from GAAP, primarily due to timing differences in the recognition of income, gains and losses by the Funds. To the extent that these differences are attributable to permanent book and tax accounting differences, the components of net assets have been adjusted.
The Minnesota ETF intends to make distributions that are exempt from federal and Minnesota state income tax, in the form of exempt-interest dividends. However, some of the Minnesota ETF's distributions other than exempt-interest dividends may be taxed as ordinary income or capital gains (or a combination). The Minnesota ETF may invest a portion of its assets in securities that generate income that is not exempt from federal income tax or Minnesota state income tax. Income exempt from federal income tax may be subject to state and local income tax. The federal income tax status of all distributions made by the Minnesota ETF for the preceding year will be reported annually to shareholders.
Use of Estimates
The preparation of financial statements in conformity with GAAP requires management to make estimates and assumptions that affect the reported amounts of assets and liabilities and disclosure of contingent assets and liabilities at the date of the financial statements and the reported amounts of revenues and expenses during the reporting period. Actual results could differ from those estimates.
Share Transactions
The NAV per share of a Fund is calculated by dividing the sum of the value of the securities held by the Fund, plus cash or other assets, minus all liabilities (including estimated accrued expenses) divided by the total number of shares outstanding for the Fund, rounded to the nearest cent. The Funds' shares will not be priced on the days on which the New York Stock Exchange ("NYSE") is closed for trading.
Expenses
Expenses associated with a specific fund in the Trust are charged to that fund. Common expenses are typically allocated evenly between the series of the Trust, or by other equitable means.
Other
Investment transactions are recorded on the trade date. The Funds determine the gain or loss from investment transactions on the identified cost basis by comparing the cost of the security lot sold with the net sales proceeds. Any discount or premium on securities purchased are accreted or amortized over the expected life of the respective securities using the constant yield method. Dividend income, less foreign withholding tax, is recognized on the ex-dividend date and interest income is recognized on an accrual basis. Withholding taxes on foreign dividends and interest, net of any reclaims, have been provided for in accordance with the Funds' understanding of the applicable country's tax rules and rates.
49
NOTES TO THE FINANCIAL STATEMENTS (unaudited) (continued) June 30, 2023
Note 3 – Federal Tax Matters
At December 31, 2022, the Mutual Funds' components of accumulated earnings (losses) on a tax basis were as follows:
| | | Growth Fund | | Balanced Fund | | Small Cap Fund | |
Cost of investments | | $ | 2,446,939,504 | | | $ | 586,104,983 | | | $ | 256,403,202 | | |
Gross unrealized appreciation | | $ | 2,181,322,380 | | | $ | 240,239,191 | | | $ | 110,261,270 | | |
Gross unrealized depreciation | | | (300,124,023 | ) | | | (49,354,541 | ) | | | (31,162,212 | ) | |
Net unrealized appreciation | | | 1,881,198,357 | | | | 190,884,650 | | | | 79,099,058 | | |
Undistributed ordinary income | | | 976,123 | | | | 290,512 | | | | 99,363 | | |
Undistributed long-term capital gains | | | 26,131,876 | | | | 5,936,287 | | | | 1,222,785 | | |
Distributable earnings | | | 27,107,999 | | | | 6,145,799 | | | | 1,322,148 | | |
Other accumulated earnings | | | - | | | | - | | | | - | | |
Total distributable earnings | | $ | 1,908,306,356 | | | $ | 197,030,449 | | | $ | 80,421,206 | | |
The Mutual Funds' tax character of distributions paid during the years ended December 31, 2022 and December 31, 2021 were as follows:
Year ended December 31, 2022 | |
Distributions paid from: | | Growth Fund | | Balanced Fund | | Small Cap Fund | |
Ordinary income | | $ | 35,434,587 | | | $ | 15,541,461 | | | $ | 565,335 | | |
Long-term capital gains | | | 323,569,156 | | | | 37,460,751 | | | | 20,298,445 | | |
Total distributions paid | | $ | 359,003,743 | | | $ | 53,002,212 | | | $ | 20,863,780 | | |
Year ended December 31, 2021 | |
Distributions paid from: | | Growth Fund | | Balanced Fund | | Small Cap Fund | |
Ordinary income | | $ | 30,356,013 | | | $ | 14,165,258 | | | $ | 1,311,178 | | |
Long-term capital gains | | | 423,281,193 | | | | 48,404,152 | | | | 32,260,684 | | |
Total distributions paid | | $ | 453,637,206 | | | $ | 62,569,410 | | | $ | 33,571,862 | | |
As of December 31, 2022, none of the Mutual Funds had capital loss carryforwards.
In addition, GAAP requires that certain components of net assets relating to permanent difference be reclassified between financial and tax reporting. The permanent differences primarily relate to utilization of earnings and profits distributed to shareholders on redemption of shares and distribution reclasses and securities redeemed in-kind. These reclassifications have no effect on net assets or net asset value per share. On the Statements of Assets and Liabilities, the following reclassifications were made for the year end ended December 31, 2022:
| | | Total Distributable
Earnings | | Paid in Capital | |
Growth Fund | | $ | (69,405,728 | ) | | $ | 69,405,728 | | |
Balanced Fund | | | (9,443,244 | ) | | | 9,443,244 | | |
Small Cap Fund | | | (7,188,736 | ) | | | 7,188,736 | | |
Minnesota ETF
As of December 31, 2022, the Minnesota ETF's cost and unrealized on investments on a tax basis were as follows:
Cost of investments for tax purposes | | $ | 19,324,701 | | |
Gross tax unrealized appreciation | | $ | 2,842 | | |
Gross tax unrealized depreciation | | | (2,091,334 | ) | |
Net tax unrealized appreciation | | $ | (2,088,492 | ) | |
50
NOTES TO THE FINANCIAL STATEMENTS (unaudited) (continued) June 30, 2023
Note 3 – Federal Tax Matters (continued)
Minnesota ETF (continued)
As of November 30, 2022, the Minnesota ETF's tax year end, the tax basis of distributable earnings/(accumulated losses) were as follows:
Undistributed ordinary income | | $ | 8,962 | | |
Other accumulated losses | | | (371,020 | ) | |
Unrealized depreciation on investments | | | (2,152,252 | ) | |
Total distributable earnings | | $ | (2,514,310 | ) | |
At November 30, 2022, the Minnesota ETF had short-term and long-term capital losses of $241,995 and $129,025, respectively, which will be carried forward indefinitely to offset future realized capital gains. To the extent the Minnesota ETF realizes future net capital gains, taxable distributions to its shareholders will be first offset by any unused capital loss carryovers from the period ended November 30, 2022.
The Minnesota ETF's tax character of distributions paid during the years ended November 30, 2022 and November 30, 2021 were as follows:
Period ended November 30, 2022 | |
Distributions paid from: | |
Ordinary income | | $ | 2,453 | | |
Tax-exempt income | | | 223,112 | | |
Long-term capital gains | | | - | | |
Total distributions paid | | $ | 225,565 | | |
Period ended November 30, 2021 | |
Distributions paid from: | |
Ordinary income | | $ | 268 | | |
Tax-exempt income | | | 71,382 | | |
Long-term capital gains | | | - | | |
Total distributions paid | | $ | 71,650 | | |
For the year ended December 31, 2022, the Minnesota ETF had no required reclassifications to certain components of net assets related financial and tax reporting.
Note 4 – Investment Adviser
The Trust has an investment advisory agreement (the "Mutual Funds Agreement") with the Adviser to furnish investment advisory services to the Mutual Funds. Under the terms of the Mutual Funds Agreement between the Trust, on behalf of each Mutual Fund, and the Adviser, the Adviser is paid a monthly fee on average daily net assets at the following annual rates for the Mutual Funds:
| | | Growth Fund | | Balanced Fund | | Small Cap Fund | |
Up to $2.5 Billion | | | 0.60 | % | | | 0.60 | % | | | 0.80 | % | |
Over $2.5 Billion | | | 0.50 | % | | | 0.60 | % | | | 0.80 | % | |
Under the investment advisory agreement, the Adviser has agreed to reimburse the Growth Fund or Balanced Fund in the event that the total expenses incurred by either Fund in any fiscal year, excluding interest, taxes, brokerage commissions and extraordinary litigation costs, but including payments to the Adviser, shall exceed 1.50% of the first $30 million dollars and 1.00% of the balance of the average value of the net assets of the Fund during such fiscal year, based upon computations of such value made as of the close of business on the last valuation day of each month during such fiscal year. Any amounts waived or reimbursed by the Adviser pursuant to the investment advisory agreement may not be recouped.
The Adviser has also agreed to waive its management fees and/or reimburse expenses of the Growth Fund, Balanced Fund or Small Cap Fund for a period of two years following the closing of the Reorganizations, to the
51
NOTES TO THE FINANCIAL STATEMENTS (unaudited) (continued) June 30, 2023
Note 4 – Investment Adviser (continued)
extent that Covered Expenses (defined below) accrued for the twelve months ending on the first anniversary of the closing of the Reorganizations and the twelve months ending on the second anniversary of the Reorganizations exceed $137,000, $72,000 and $62,500, respectively. Covered Expenses shall be limited to outside legal expenses, audit and tax expenses, trustees' fees, insurance expenses, ICI membership fees, and chief compliance officer fees (Covered Expenses).
In addition, the Trust, on behalf of the Minnesota ETF, has entered into an investment advisory agreement (the "ETF Agreement") with the Adviser to furnish investment advisory services to the Minnesota ETF. Pursuant to the ETF Agreement, the Minnesota ETF pays a unitary management fee to the Adviser, which is calculated daily and paid monthly, at an annual rate of 0.39% of the Minnesota ETF's average daily net assets. The Adviser has agreed to pay all expenses of the Minnesota ETF except the unitary management fee paid to the Adviser under the ETF Agreement, interest charges on any borrowings, dividends and other expenses on securities sold short, taxes, brokerage commissions and other expenses incurred in placing orders for the purchase and sale of securities and other investment instruments, acquired fund fees and expenses, accrued deferred tax liability, extraordinary expenses, distribution fees and expenses paid by the Minnesota ETF under any distribution plan adopted pursuant to Rule 12b-1 under the 1940 Act.
Note 5 – Transactions With Affiliated Companies
The Growth Fund owned 5% or more of the voting securities of the company noted in the table below during the six months ended June 30, 2023. As a result, this company was deemed an affiliate of the Growth Fund as defined by the 1940 Act during the six months ended June 30, 2023. Transactions during the period in this security were as follows:
Growth Fund
Security
Name | | Share
Balance
06/30/23 | | Fair
Value at
12/31/22 | | Purchases | | Sales | | Realized
Gain
(Loss) | | Change in
Unrealized
Appreciation | | Fair
Value at
06/30/23 | | Dividend
Income | |
Tennant Co(1) | | | 847,966 | | | $ | 57,750,566 | | | $ | - | | | $ | 6,372,455 | | | $ | (502,555 | ) | | $ | 17,902,967 | | | $ | 68,778,522 | | | $ | 462,672 | | |
(1) As of June 30, 2023, this security was no longer deemed an affiliate.
Note 6 – Distribution Agreement
Foreside Fund Services, LLC (the "Distributor") serves as the Mutual Funds' distributor pursuant to a Distribution Agreement and the Minnesota ETF's distributor pursuant to an ETF Distributor Agreement. The Distributor receives compensation for the statutory underwriting services it provides to the Funds. The Distributor enters into agreements with certain broker-dealers and others that will allow those parties to be "Authorized Participants" and to subscribe for and redeem shares of the Minnesota ETF. With respect to the Minnesota ETF, the Distributor will not distribute shares in less than whole Creation Units and does not maintain a secondary market in shares.
Note 7 – Related Party Transactions
U.S. Bancorp Fund Services, LLC, doing business as U.S. Bank Global Fund Services ("Fund Services" or the "Administrator"), acts as the Funds' administrator under a Fund Servicing Agreement. The Administrator prepares various federal and state regulatory filings, reports and returns for the Funds; prepares reports and materials to be supplied to the Trustees; monitors the activities of the Funds' custodian, transfer agent and fund accountant; coordinates the preparation and payment of the Funds' expenses; and reviews the Funds' expense accruals. Fund Services also serves as the fund accountant and transfer agent to the Funds. U.S. Bank N.A. (the "Custodian"), an affiliate of Fund Services, serves as the Funds' custodian pursuant to a Custody Agreement. The Trust's Chief Compliance Officer is also an employee of Fund Services. Under the terms of the ETF Agreement, the Adviser pays the Minnesota ETF's administrative, custody, transfer agency,
52
NOTES TO THE FINANCIAL STATEMENTS (unaudited) (continued) June 30, 2023
Note 7 – Related Party Transactions (continued)
accounting and Chief Compliance Officer fees; Expenses incurred by the Mutual Funds for the six months ended June 30, 2023, and owed as of June 30, 2023 are as follows:
Administration | | Incurred | | Owed | |
Mairs & Power Growth Fund | | $ | 329,336 | | | $ | 113,462 | | |
Mairs & Power Balanced Fund | | | 66,643 | | | | 24,141 | | |
Mairs & Power Small Cap Fund | | | 32,286 | | | | 10,737 | | |
Accounting | | Incurred | | Owed | |
Mairs & Power Growth Fund | | $ | 222,760 | | | $ | 68,788 | | |
Mairs & Power Balanced Fund | | | 57,006 | | | | 19,059 | | |
Mairs & Power Small Cap Fund | | | 18,287 | | | | 5,502 | | |
Transfer Agent | | Incurred(1) | | Owed | |
Mairs & Power Growth Fund | | $ | 415,954 | | | $ | 190,778 | | |
Mairs & Power Balanced Fund | | | 64,775 | | | | 29,764 | | |
Mairs & Power Small Cap Fund | | | 31,346 | | | | 14,196 | | |
(1) These amounts do not include sub-transfer agency fees, therefore they do not agree to the amounts referenced on the Statement of Operations.
Custody | | Incurred | | Owed | |
Mairs & Power Growth Fund | | $ | 113,285 | | | $ | 35,403 | | |
Mairs & Power Balanced Fund | | | 20,990 | | | | 7,401 | | |
Mairs & Power Small Cap Fund | | | 9,691 | | | | 2,911 | | |
Chief Compliance Officer | | Incurred | | Owed | |
Mairs & Power Growth Fund | | $ | 5,611 | | | $ | 1,862 | | |
Mairs & Power Balanced Fund | | | 5,611 | | | | 1,862 | | |
Mairs & Power Small Cap Fund | | | 5,611 | | | | 1,860 | | |
Certain officers of the Funds are also employees of Fund Services.
The Trust's Chief Compliance Officer is also an employee of Fund Services.
Note 8 – Creation and Redemption Transactions
Shares of the Minnesota ETF are listed and traded on the Cboe BZX Exchange, Inc. (the "Exchange"). The Minnesota ETF issues and redeems shares on a continuous basis at NAV only in large blocks of shares called "Creation Units." A Creation Unit generally consists of 10,000 shares though this may change from time to time. Creation Units are to be issued and redeemed principally in kind for a basket of securities and a balancing cash amount. Shares generally will trade in the secondary market in amounts less than a Creation Unit at market prices that change throughout the day. Market prices for the shares may be different from their NAV. The NAV is determined as of the close of trading (generally, 4:00 p.m. Eastern Time) on each day the NYSE is open for trading. The NAV of the shares of the Minnesota ETF will be equal to a Fund's total assets minus a Fund's total liabilities divided by the total number of shares outstanding. The NAV that is published will be rounded to the nearest cent; however, for purposes of determining the price of Creation Units, the NAV will be calculated to five decimal places.
Only "Authorized Participants" may purchase or redeem shares directly from the Minnesota ETF. An Authorized Participant is either (i) a broker-dealer or other participant in the clearing process through the Continuous Net Settlement System of National Securities Clearing Corporation or (ii) a DTC participant and, in each case, must have executed a Participant Agreement with the Distributor. Most retail investors will not qualify as Authorized Participants or have the resources to buy and sell whole Creation Units. Therefore, they will be unable to purchase or redeem the shares directly from the Minnesota ETF. Rather, most retail investors will purchase shares in the secondary market with the assistance of a broker and will be subject to customary brokerage commissions or fees. Securities received or delivered in connection with in-kind creates and redeems are valued as of the close of business on the effective date of the creation or redemption.
53
NOTES TO THE FINANCIAL STATEMENTS (unaudited) (continued) June 30, 2023
Note 8 – Creation and Redemption Transactions (continued)
Creation Unit Transaction Fee
Authorized Participants will be required to pay to the Custodian a fixed transaction fee (the "Creation Transaction Fee") in connection with the issuance of Creation Units. The standard Creation Transaction Fee will be the same regardless of the number of Creation Units purchased by an investor on the applicable Business Day. The Creation Transaction Fee for the Minnesota ETF is $250.
An additional variable fee of up to a maximum of 2% of the value of the Creation Units subject to the transaction may be imposed for cash purchases, non-standard orders, or partial purchase of Creation Units. For orders comprised entirely of cash, a variable fee of 0.03% of the value of the order will be charged by the Minnesota ETF. The variable charge is primarily designed to cover additional costs (e.g., brokerage, taxes) involved with buying the securities with cash. The Minnesota ETF may determine to not charge a variable fee on certain orders when the Adviser has determined that doing so is in the best interests of Fund shareholders.
A creation unit will generally not be issued until the transfer of good title of the deposit securities to the Minnesota ETF and the payment of any cash amounts have been completed. To the extent contemplated by the applicable participant agreement, Creation Units of the Minnesota ETF will be issued to such authorized participant notwithstanding the fact that the Minnesota ETF's deposits have not been received in part or in whole, in reliance on the undertaking of the authorized participant to deliver the missing deposit securities as soon as possible. If the MinnesotaETF or its agents do not receive all of the deposit securities, or the required cash amounts, by such time, then the order may be deemed rejected and the authorized participant shall be liable to the Minnesota ETF for losses, if any.
Note 9 – Investment Transactions
Purchases and sales of investment securities, excluding government securities, short-term securities and temporary cash investments, during the six months ended June 30, 2023 were as follows:
| | | Purchases | | Sales | |
Growth Fund | | $ | 337,131,823 | | | $ | 453,441,994 | (a) | |
Balanced Fund | | | 40,308,226 | | | | 47,270,202 | (a) | |
Small Cap Fund | | | 32,953,683 | | | | 34,040,502 | (a) | |
Minnesota ETF | | | 1,973,940 | | | | 1,321,564 | | |
The funds did not have any purchases or sales of government securities during the six months ended June 30, 2023.
(a) Sales exclude redemptions in-kind of $139,619,959, $33,997,882, and $8,555,030 for the Growth Fund, Balanced Fund and Small Cap Fund, respectively. See Note 11.
Note 10 – Principal Risks of the Funds
As with all investment companies, shareholders of the Funds are subject to the risk that their investment could lose money. Each Fund is subject to its principal risks, any of which may adversely affect a Fund's NAV, trading price, yield, total return and ability to meet its investment objective as applicable. A description of the principal risks of each Fund is included in the applicable prospectus under the heading "Principal Risks''.
Note 11 – ReFlow Transactions
The Mutual Funds may participate in the ReFlow Fund, LLC ("ReFlow") liquidity program, which is designed to provide an alternative liquidity source for mutual funds experiencing net redemptions of their shares. Pursuant
54
NOTES TO THE FINANCIAL STATEMENTS (unaudited) (continued) June 30, 2023
Note 11 – ReFlow Transactions (continued)
to the program, ReFlow provides participating mutual funds (including each Mutual Fund) with a source of cash to meet net shareholder redemptions by standing ready each business day to purchase Fund shares up to the value of the net shares redeemed by other shareholders that are to settle the next business day. Following purchases of a Fund's shares, ReFlow then generally redeems those shares when the Fund experiences net sales, at the end of a maximum holding period determined by ReFlow (currently 14 days) or at other times at ReFlow's or the Adviser's discretion. While ReFlow holds a Fund's shares, it will have the same rights and privileges with respect to those shares as any other shareholder. For use of the ReFlow service, a Fund pays a fee to ReFlow each time it purchases Fund shares, calculated by applying to the purchase amount a fee rate determined through an automated daily auction among participating mutual funds. The current minimum fee rate is 0.20% of the value of the Fund shares purchased by ReFlow, although a Fund may submit a bid at a higher fee rate if it determines that doing so is in the best interest of Fund shareholders. ReFlow's purchases of a Fund's shares through the liquidity program are made on an investment-blind basis without regard to a Fund's objective, policies or anticipated performance. In accordance with federal securities laws, ReFlow is prohibited from acquiring more than 3% of the outstanding voting securities of a Fund. ReFlow will not be subject to the Funds' investment minimums, the Small Cap Fund's redemption fee, or the limitations noted in the "Frequent Purchases and Redemptions of Fund Shares" section within the Funds' prospectus. ReFlow will periodically redeem its entire share position in a Fund and request that such redemption be met in-kind in accordance with the Funds' redemption in-kind policies. The Board has approved the Funds' use of the ReFlow program. The Adviser believes that the program may assist in stabilizing each Fund's net assets, to the benefit of the Fund and its shareholders, although there is no guarantee that the program will do so. To the extent that the Funds' assets do not decline, the Adviser may also benefit. ReFlow fees that were incurred by the Funds during the six months ended June 30, 2023 are recorded within the Statement of Operations, if applicable.
During the six months ended June 30, 2023 the Mutual Funds satisfied redemption in-kind requests made by Reflow. The transfers were effected in accordance with policies and procedures approved by the Board. Consideration paid and shares sold were as follows:
Fund | | Date Range | | Value of Cash
and Securities Sold | | Shares Sold | |
Growth Fund | | January 2023-June 2023 | | $ | 139,619,959 | | | | 1,131,387 | | |
Balanced Fund | | January 2023-June 2023 | | | 33,997,882 | | | | 364,760 | | |
Small Cap Fund | | January 2023-June 2023 | | | 8,555,030 | | | | 361,352 | | |
Note 12 – Recent Market Events
U.S. and international markets have experienced significant periods of volatility in recent years and months due to a number of economic, political and global macro factors including rising inflation, uncertainty regarding central banks' interest rate increases, the possibility of a national or global recession, trade tensions, political events, the war between Russia and Ukraine and the impact of the coronavirus (COVID-19) global pandemic. The global recovery from COVID-19 may last for an extended period of time. As a result of continuing political tensions and armed conflicts, including the war between Ukraine and Russia, the U.S. and the European Union imposed sanctions on certain Russian individuals and companies, including certain financial institutions, and have limited certain exports and imports to and from Russia. The war has contributed to recent market volatility and may continue to do so. These developments, as well as other events, could result in further market volatility and negatively affect financial asset prices, the liquidity of certain securities and the normal operations of securities exchanges and other markets, despite government efforts to address market disruptions. Continuing market volatility as a result of recent market conditions or other events may have adverse effects on your account.
55
NOTES TO THE FINANCIAL STATEMENTS (unaudited) (continued) June 30, 2023
Note 13 – Subsequent Events
The Minnesota ETF paid distributions to shareholders as follows:
| Record Date | | Ex-Date | | Reinvestment
Date/Payable
Date | | Ordinary
Income Rate | | Ordinary Income
Distribution Paid | |
| 7/24/2023 | | 7/21/2023 | | 7/31/2023 | | $ | 0.03103289 | | | $ | 25,447 | | |
| 8/24/2023 | | 8/23/2023 | | 8/31/2023 | | $ | 0.03443770 | | | $ | 28,239 | | |
At a meeting of the Board held on August 17, 2023 the Board approved a contractual reduction of the unitary management fee payable to the Adviser by the Minnesota ETF such that effective September 1, 2023 the management fee payable to the Adviser will be 0.25% of the Minnesota ETF's average daily net assets.
Other than as disclosed, there were no other subsequent events requiring recognition or disclosure through the date the financial statements were issued.
56
Mairs & Power Growth Fund
FINANCIAL HIGHLIGHTS
SELECTED DATA AND RATIOS
(for a share outstanding throughout each year/period)
| | | Six Months
Ended | | Year Ended December 31, | |
| | | June 30, 2023 (2) | | 2022 | | 2021 | | 2020 | | 2019 | | 2018 | |
| | | (unaudited) | | | | | | | | | | | |
Per Share | |
Net asset value, beginning of
year/period | | $ | 118.00 | | | $ | 162.55 | | | $ | 136.08 | | | $ | 127.22 | | | $ | 106.45 | | | $ | 121.12 | | |
Income from investment operations: | |
Net investment income | | | 0.56 | (3) | | | 1.02 | (3) | | | 0.87 | | | | 1.48 | | | | 1.59 | | | | 1.61 | | |
Net realized and unrealized
gain (loss) | | | 21.64 | | | | (35.15 | ) | | | 38.82 | | | | 19.37 | | | | 28.59 | | | | (6.96 | ) | |
Total from investment operations | | | 22.20 | | | | (34.13 | ) | | | 39.69 | | | | 20.85 | | | | 30.18 | | | | (5.35 | ) | |
Distributions to shareholders from: | |
Net investment income | | | (0.55 | ) | | | (1.01 | ) | | | (0.91 | ) | | | (1.45 | ) | | | (1.58 | ) | | | (1.59 | ) | |
Net realized gains on investments
sold | | | - | | | | (9.41 | ) | | | (12.31 | ) | | | (10.54 | ) | | | (7.83 | ) | | | (7.73 | ) | |
Total distributions | | | (0.55 | ) | | | (10.42 | ) | | | (13.22 | ) | | | (11.99 | ) | | | (9.41 | ) | | | (9.32 | ) | |
Net asset value, end of year/period | | $ | 139.65 | | | $ | 118.00 | | | $ | 162.55 | | | $ | 136.08 | | | $ | 127.22 | | | $ | 106.45 | | |
Total investment return (loss) | | | 18.82 | % | | | (21.07 | )% | | | 29.27 | % | | | 16.67 | % | | | 28.39 | % | | | (4.34 | )% | |
Net assets, end of year/period,
in thousands | | $ | 4,859,083 | | | $ | 4,336,486 | | | $ | 5,950,161 | | | $ | 4,858,189 | | | $ | 4,633,937 | | | $ | 3,938,943 | | |
Ratios/supplemental data: | |
Ratio of expenses to average
net assets | | | 0.63 | % | | | 0.63 | % | | | 0.61 | % | | | 0.64 | % | | | 0.65 | % | | | 0.64 | % | |
Ratio of net investment income
to average net assets | | | 0.88 | | | | 0.75 | | | | 0.55 | | | | 1.12 | (1) | | | 1.28 | | | | 1.27 | | |
Portfolio turnover rate | | | 7.38 | (4) | | | 11.04 | (4) | | | 13.17 | | | | 14.52 | | | | 10.77 | | | | 9.25 | | |
(1) Ratio revised subsequent to the completion of the annual report dated December 31, 2020 to include immaterial reclass adjustments related to the Fund's holding of real estate investment trusts.
(2) For the six months ended June 30, 2023, all ratios have been annualized except total investment return and portfolio turnover.
(3) Per share net investment income was calculated using average shares outstanding.
(4) Excludes in-kind transactions associated with redemptions of the Fund.
See accompanying Notes to Financial Statements.
57
Mairs & Power Balanced Fund
FINANCIAL HIGHLIGHTS
SELECTED DATA AND RATIOS
(for a share outstanding throughout each year/period)
| | | Six Months
Ended | | Year Ended December 31, | |
| | | June 30, 2023 (2) | | 2022 | | 2021 | | 2020 | | 2019 | | 2018 | |
| | (unaudited) | | | | | | | | | | | |
Per Share | |
Net asset value, beginning of
year/period | | $ | 93.06 | | | $ | 116.89 | | | $ | 105.23 | | | $ | 99.74 | | | $ | 86.79 | | | $ | 94.01 | | |
Income from investment operations: | |
Net investment income | | | 0.99 | (3) | | | 1.86 | (3) | | | 1.68 | | | | 1.98 | | | | 2.13 | | | | 2.09 | | |
Net realized and unrealized
gain (loss) | | | 5.80 | | | | (19.21 | ) | | | 17.42 | | | | 8.10 | | | | 15.39 | | | | (4.71 | ) | |
Total from investment operations | | | 6.79 | | | | (17.35 | ) | | | 19.10 | | | | 10.08 | | | | 17.52 | | | | (2.62 | ) | |
Distributions to shareholders from: | |
Net investment income | | | (1.00 | ) | | | (1.86 | ) | | | (1.68 | ) | | | (1.99 | ) | | | (2.12 | ) | | | (2.09 | ) | |
Net realized gains on investments
sold | | | - | | | | (4.62 | ) | | | (5.76 | ) | | | (2.60 | ) | | | (2.45 | ) | | | (2.51 | ) | |
Total distributions | | | (1.00 | ) | | | (6.48 | ) | | | (7.44 | ) | | | (4.59 | ) | | | (4.57 | ) | | | (4.60 | ) | |
Net asset value, end of year/period | | $ | 98.85 | | | $ | 93.06 | | | $ | 116.89 | | | $ | 105.23 | | | $ | 99.74 | | | $ | 86.79 | | |
Total investment return (loss) | | | 7.33 | % | | | (14.91 | )% | | | 18.30 | % | | | 10.44 | % | | | 20.32 | % | | | (2.80 | )% | |
Net assets, end of year/period,
in thousands | | $ | 787,913 | | | $ | 780,847 | | | $ | 1,022,951 | | | $ | 895,253 | | | $ | 928,828 | | | $ | 807,455 | | |
Ratios/supplemental data: | |
Ratio of expenses to average
net assets | | | 0.70 | % | | | 0.69 | % | | | 0.69 | % | | | 0.71 | % | | | 0.71 | % | | | 0.72 | % | |
Ratio of net investment income
to average net assets | | | 2.08 | | | | 1.81 | | | | 1.45 | | | | 2.01 | (1) | | | 2.22 | | | | 2.20 | | |
Portfolio turnover rate | | | 5.20 | (4) | | | 9.68 | (4) | | | 13.00 | | | | 15.96 | | | | 13.60 | | | | 9.01 | | |
(1) Ratio revised subsequent to the completion of the annual report dated December 31, 2020 to include immaterial reclass adjustments related to the Fund's holding of real estate investment trusts.
(2) For the six months ended June 30, 2023, all ratios have been annualized except total investment return and portfolio turnover.
(3) Per share net investment income was calculated using average shares outstanding.
(4) Excludes in-kind transactions associated with redemptions of the Fund.
See accompanying Notes to Financial Statements.
58
Mairs & Power Small Cap Fund
FINANCIAL HIGHLIGHTS
SELECTED DATA AND RATIOS
(for a share outstanding throughout each year/period)
| | | Six Months
Ended | | Year Ended December 31, | |
| | | June 30, 2023 (4) | | 2022 | | 2021 | | 2020 | | 2019 | | 2018 | |
| | (unaudited) | | | | | | | | | | | |
Per Share | |
Net asset value, beginning of
year/period | | $ | 26.43 | | | $ | 32.69 | | | $ | 28.15 | | | $ | 26.41 | | | $ | 22.48 | | | $ | 25.32 | | |
Income from investment operations: | |
Net investment income | | | 0.03 | (5) | | | 0.05 | (5) | | | 0.01 | | | | 0.19 | | | | 0.13 | | | | 0.15 | | |
Net realized and unrealized
gain (loss) | | | 1.67 | | | | (4.59 | ) | | | 7.25 | | | | 2.13 | | | | 4.62 | | | | (1.92 | ) | |
Total from investment operations | | | 1.70 | | | | (4.54 | ) | | | 7.26 | | | | 2.32 | | | | 4.75 | | | | (1.77 | ) | |
Distributions to shareholders from: | |
Net investment income | | | - | | | | (0.05 | ) | | | (0.01 | ) | | | (0.17 | ) | | | (0.11 | ) | | | (0.15 | ) | |
Net realized gains on investments
sold | | | - | | | | (1.67 | ) | | | (2.71 | ) | | | (0.41 | ) | | | (0.71 | ) | | | (0.92 | ) | |
Redemption fees (1)(2) | | | 0.00 | | | | 0.00 | | | | 0.00 | | | | 0.00 | | | | 0.00 | | | | 0.00 | | |
Total distributions | | | - | | | | (1.72 | ) | | | (2.72 | ) | | | (0.58 | ) | | | (0.82 | ) | | | (1.07 | ) | |
Net asset value, end of year/period | | $ | 28.13 | | | $ | 26.43 | | | $ | 32.69 | | | $ | 28.15 | | | $ | 26.41 | | | $ | 22.48 | | |
Total investment return (loss) | | | 6.43 | % | | | (13.93 | )% | | | 26.00 | % | | | 8.78 | % | | | 21.13 | % | | | (6.91 | )% | |
Net assets, end of year/period,
in thousands | | $ | 344,603 | | | $ | 337,201 | | | $ | 427,257 | | | $ | 361,594 | | | $ | 437,300 | | | $ | 367,477 | | |
Ratios/supplemental data: | |
Ratio of expenses to average
net assets | | | 0.93 | % | | | 0.92 | % | | | 0.95 | % | | | 1.04 | % | | | 1.05 | % | | | 1.04 | % | |
Ratio of net investment income
to average net assets | | | 0.22 | | | | 0.18 | | | | 0.02 | | | | 0.58 | (3) | | | 0.48 | | | | 0.54 | | |
Portfolio turnover rate | | | 9.76 | (6) | | | 19.81 | (6) | | | 21.45 | | | | 16.39 | | | | 15.07 | | | | 20.40 | | |
(1) The Fund charges a 1.00% redemption fee on shares held 180 days or less.
(2) Amount per share is less than $0.005.
(3) Ratio revised subsequent to the completion of the annual report dated December 31, 2020 to include immaterial reclass adjustments related to the Fund's holding of real estate investment trusts.
(4) For the six months ended June 30, 2023, all ratios have been annualized except total investment return and portfolio turnover.
(5) Per share net investment income was calculated using average shares outstanding.
(6) Excludes in-kind transactions associated with redemptions of the Fund.
See accompanying Notes to Financial Statements.
59
Mairs & Power Minnesota Municipal Bond ETF
FINANCIAL HIGHLIGHTS
SELECTED DATA AND RATIOS
(for a share outstanding throughout each year/period)
| | | Six Months Ended
June 30, 2023 | | Year Ended
December 31, 2022 | | Period Ended
December 31, 2021 (1) | |
| | (unaudited) | | | | | |
Per Share | |
Net asset value, beginning of year/period | | $ | 21.80 | | | $ | 25.16 | | | $ | 25.00 | | |
Income from investment operations: | |
Net investment income (2) | | | 0.18 | | | | 0.29 | | | | 0.18 | | |
Net realized and unrealized gain (loss) | | | 0.11 | | | | (3.36 | ) | | | 0.14 | | |
Total from investment operations | | | 0.29 | | | | (3.07 | ) | | | 0.32 | | |
Distributions to shareholders from: | |
Net investment income | | | (0.17 | ) | | | (0.29 | ) | | | (0.16 | ) | |
Total distributions | | | (0.17 | ) | | | (0.29 | ) | | | (0.16 | ) | |
Net asset value, end of year/period | | $ | 21.92 | | | $ | 21.80 | | | $ | 25.16 | | |
Total investment return, at NAV (3)(4) | | | 1.34 | % | | | (12.20 | )% | | | 1.29 | % | |
Total investment return, at Market (3)(4) | | | 1.35 | % | | | (12.27 | )% | | | 1.32 | % | |
Net assets, end of year/period, in thousands | | $ | 17,977 | | | $ | 17,439 | | | $ | 18,619 | | |
Ratios/supplemental data: | |
Ratio of expenses to average net assets (5) | | | 0.39 | % | | | 0.39 | % | | | 0.39 | % | |
Ratio of net investment income to average net assets (5) | | | 1.63 | | | | 1.33 | | | | 0.88 | | |
Portfolio turnover rate (4)(6) | | | 7.54 | | | | 17.81 | | | | 2.54 | | |
(1) The Fund commenced investment operations on March 11, 2021.
(2) Per share net investment income was calculated using average shares outstanding.
(3) Total return in the table represents the rate that the investor would have earned or lost on an investment in the Fund, assuming reinvestment of dividends.
(4) Not annualized for periods less than one year.
(5) Annualized for periods less than one year.
(6) Excludes in-kind transations associated with creations and redemptions of the Fund.
See accompanying Notes to Financial Statements.
60
FUND EXPENSES (unaudited)
As a shareholder of the Mutual Funds, you incur two types of costs: (1) transaction costs, including redemption fees for shareholders of the Small Cap Fund, and (2) ongoing expenses for the operation of the Funds (e.g., asset-based charges, such as investment management fees). The Mutual Funds are "no-load" mutual funds. As a result, shareholders pay no commissions, fees, or expenses associated with sales representatives or sales charges. As a shareholder of the Minnesota ETF, you incur two types of costs: (1) transaction costs, including brokerage commissions paid on purchases and sales of the Fund's shares, and (2) ongoing costs, including management fees of the Fund.
This example is intended to help you understand your ongoing costs (in dollars) of investing in the Funds and to compare these costs with the ongoing costs of investing in other mutual funds. The table below reports the Funds' expenses during the period December 1, 2022 through June 30, 2023 and includes the costs associated with a $1,000 investment.
Actual Expenses
The first line in the tables below provides information about the actual account values and actual expenses. You may use this information in this line, together with the amount you invested to estimate the expenses you paid over the reporting period. You can do this by dividing your account value by $1,000 and multiplying the result by the expense shown in the table below. For example, if your account value is $8,600, divided by $1,000 = $8.60. Multiply the result by the number in the first line under the heading entitled "Expenses Paid During Period." By doing this you can estimate the expenses you paid on your account during this period.
Hypothetical Example
The second line of the tables below provides information about hypothetical account values and hypothetical expenses based on the Funds' actual expenses and assumed returns of 5% per year before expenses, which are not the Funds' actual returns. The results may be used to provide you with a basis for comparing the ongoing costs of investing in the Funds with the ongoing costs of investing in other funds. To do so, compare these 5% hypothetical examples with the 5% hypothetical examples that appear in the shareholder reports of other funds. Please note that these hypothetical examples highlight ongoing costs only and do not reflect any transactional fees, such as redemption fees. In addition, if these transactional fees were included, your costs would have been higher. These hypothetical expense examples may not be used to estimate the actual ending account balances or expenses you paid during the period and will not help you determine the relative total costs of owning different funds.
Mairs & Power Growth Fund
| | | Beginning Account
Value 12/01/2022 | | Ending Account
Value 06/30/2023 | | Expenses Paid
During Period * | |
Actual return | | $ | 1,000.00 | | | $ | 1,188.20 | | | $ | 3.42 | | |
Hypothetical assumed 5% return | | $ | 1,000.00 | | | $ | 1,021.67 | | | $ | 3.16 | | |
* The Fund's expenses are equal to the Fund's annualized expense ratio for the most recent six-month period of 0.63%, multiplied by the average account value over the Fund's first fiscal half-year, multiplied by the number of days in the Fund's first fiscal half-year (181 days), divided by 365 days.
Mairs & Power Balanced Fund
| | | Beginning Account
Value 12/01/2022 | | Ending Account
Value 06/30/2023 | | Expenses Paid
During Period * | |
Actual return | | $ | 1,000.00 | | | $ | 1,073.30 | | | $ | 3.60 | | |
Hypothetical assumed 5% return | | $ | 1,000.00 | | | $ | 1,021.32 | | | $ | 3.51 | | |
* The Fund's expenses are equal to the Fund's annualized expense ratio for the most recent six-month period of 0.70%, multiplied by the average account value over the Fund's first fiscal half-year, multiplied by the number of days in the Fund's first fiscal half-year (181 days), divided by 365 days.
61
FUND EXPENSES (unaudited) (continued)
Mairs & Power Small Cap Fund
| | | Beginning Account
Value 12/01/2022 | | Ending Account
Value 06/30/2023 | | Expenses Paid
During Period * | |
Actual return | | $ | 1,000.00 | | | $ | 1,064.30 | | | $ | 4.76 | | |
Hypothetical assumed 5% return | | $ | 1,000.00 | | | $ | 1,020.18 | | | $ | 4.66 | | |
* The Fund's expenses are equal to the Fund's annualized expense ratio for the most recent six-month period of 0.93%, multiplied by the average account value over the Fund's first fiscal half-year, multiplied by the number of days in the Fund's first fiscal half-year (181 days), divided by 365 days.
Mairs & Power Minnesota Municipal Bond ETF
| | | Beginning Account
Value 12/01/2022 | | Ending Account
Value 06/30/2023 | | Expenses Paid
During Period * | |
Actual return | | $ | 1,000.00 | | | $ | 1,019.30 | | | $ | 1.95 | | |
Hypothetical assumed 5% return | | $ | 1,000.00 | | | $ | 1,022.86 | | | $ | 1.96 | | |
* The Fund's expenses are equal to the Fund's annualized expense ratio for the period of 0.39%, multiplied by the average account value over the period, multiplied by the number of days in the period (181 days), divided by 365 days.
62
STATEMENT REGARDING LIQUIDITY RISK MANAGEMENT PROGRAM
In accordance with Rule 22e-4 under the Investment Company Act of 1940, as amended, Trust for Professional Managers (the "Trust") has adopted and implemented a liquidity risk management program (the "Trust Program"). As required under the Trust Program, Mairs & Power, Inc. ("Mairs & Power"), the investment adviser to the Mairs & Power Growth Fund, Mairs & Power Balanced Fund, Mairs & Power Small Cap Fund and Mairs & Power Minnesota Municipal Bond ETF (the "Funds"), each a series of the Trust, has adopted and implemented a liquidity risk management program tailored specifically to the Funds (the "Adviser Program"). The Adviser Program seeks to promote effective liquidity risk management for the Funds and to protect Fund shareholders from dilution of their interests. The Board of Trustees (the "Board") of the Trust has approved Mairs & Power as the administrator for the Adviser Program (the "Program Administrator"). The Program Administrator has further delegated administration of the Adviser Program to its senior leadership team. The Program Administrator is required to provide a written annual report to the Board and the Trust's chief compliance officer regarding the adequacy and effectiveness of the Adviser Program, including the operation of each Fund's highly liquid investment minimum, if applicable, and any material changes to the Adviser Program.
On April 20, 2023, the Board reviewed the Program Administrator's written annual report for the period January 1, 2022 through December 31, 2022 (the "Report"). The Report provided an assessment of each Fund's liquidity risk: the risk that a Fund could not meet requests to redeem shares issued by a Fund without significant dilution of the remaining investors' interests in a Fund. The Adviser Program assesses liquidity risk under both normal and reasonably foreseeable stressed market conditions. The Program Administrator has retained ICE Data Services, Inc., a third party vendor, to provide portfolio investment classification services, and the Report noted that the Funds primarily held investments that were classified as highly liquid during the review period. The Report noted that each Fund's portfolio is expected to continue to primarily hold highly liquid investments and the determination that each Fund be designated as a "primarily highly liquid fund" (as defined in Rule 22e-4) remains appropriate and each Fund can therefore continue to rely on the exclusion in Rule 22e-4 from the requirements to determine and review a highly liquid investment minimum for each Fund and to adopt policies and procedures for responding to a highly liquid investment minimum shortfall. The Report noted that there were no breaches of each Funds' restriction on holding illiquid investments exceeding 15% of its net assets during the review period. The Report confirmed that each Fund's investment strategy was appropriate for an open-end management investment company. The Report also indicated that no material changes had been made to the Adviser Program during the review period.
The Program Administrator determined that each Fund is reasonably likely to be able to meet redemption requests without adversely affecting non-redeeming Fund shareholders through significant dilution. The Program Administrator concluded that the Adviser Program was adequately designed and effectively implemented during the review period.
63
NOTICE OF PRIVACY POLICY & PRACTICES (unaudited)
We collect non-public personal information about you from the following sources:
• information we receive about you on applications or other forms;
• information you give us orally; and
• information about your transactions with us or others.
The types of non-public personal information we collect and share can include:
• social security numbers;
• account balances;
• account transactions;
• transaction history;
• wire transfer instructions; and
• checking account information.
What Information We Disclose
We do not disclose any non-public personal information about our shareholders or former shareholders without the shareholder's authorization, except as permitted by law or in response to inquiries from governmental authorities. We may share information with affiliated parties and unaffiliated third parties with whom we have contracts for servicing the Fund. We will provide unaffiliated third parties with only the information necessary to carry out their assigned responsibility.
How We Protect Your Information
All shareholder records will be disposed of in accordance with applicable law. We maintain physical, electronic and procedural safeguards to protect your non-public personal information and require third parties to treat your non-public personal information with the same high degree of confidentiality.
In the event that you hold shares of the Fund through a financial intermediary, including, but not limited to, a broker-dealer, bank or trust company, the privacy policy of your financial intermediary would govern how your non-public personal information would be shared with unaffiliated third parties.
64
Proxy Voting Policies and Procedures that the Trust uses to determine how to vote proxies relating to portfolio securities are available (i) without charge, upon request, by calling (855)-839-2800 for the Minnesota ETF or (800) 304-7404 for the Mutual Funds and requesting a copy of the applicable Statement of Additional Information (SAI) and (ii) on the Securities and Exchange Commission's (SEC's) website at www.sec.gov (access Form N-1A).
Information on how the Funds voted proxies relating to portfolio securities during the most recent 12-month period ended June 30 is available at www.mairsandpower.com and on the SEC's website at www.sec.gov on Form N-PX.
DISCLOSURE OF PORTFOLIO HOLDINGS (unaudited)
A description of the Funds' policies and procedures with respect to the disclosure of portfolio holdings is available in the SAI and on the Funds' website. A complete list of each Fund's holdings is available on or about 15 days after each quarter-end at www.mairsandpower.com. This list remains available on the website until it is replaced with the following quarter-end list. The portfolio holdings list is also filed in the Funds' annual and semi-annual reports to shareholders filed with the SEC on Form N-CSR and as an exhibit to Form N-PORT following the end of each quarter. Form N-CSR and the public portion of Form N-PORT, when available, may be viewed on the SEC's website at www.sec.gov.
HOUSEHOLDING (unaudited)
In an effort to decrease costs, the Trust intends to reduce the number of duplicate prospectuses, supplements and certain other shareholder documents you receive by sending only one copy of each to those addresses shared by two or more accounts and to shareholders reasonably believed to be from the same family or household. Once implemented, if you would like to discontinue householding for your accounts, please call the Minnesota ETF at (855)-839-2800 or the Mutual Funds at (800) 304-7404 to request individual copies of these documents. Once notification to stop householding is received, the Trust will begin sending individual copies thirty days after receiving your request. This policy does not apply to account statements.
eDelivery is available to all direct shareholders. eDelivery provides your tax statements, account statements, trade confirmation statements and certain other shareholder documents online rather than by regular mail. In addition to reducing paper waste, eDelivery may reduce your Fund fees by lowering printing and mailing costs over time. To receive materials electronically, please contact the Minnesota ETF at (855)-839-2800 or the Mutual Funds at (800) 304-7404 or visit www.mairsandpower.com to sign up for eDelivery. If you hold your Fund shares through a Financial Intermediary, please contact your Financial Intermediary regarding electronic delivery options.
FREQUENCY DISTRIBUTION OF PREMIUMS AND DISCOUNTS (unaudited)
Information regarding how often shares of the Minnesota ETF trade on an exchange at a price above (i.e., at a premium) or below (i.e., at a discount) the NAV of the Minnesota ETF is available without charge, on the Minnesota ETF's website at www.mairsandpower.com.
65
TAX INFORMATION (unaudited)
For the year ended December 31, 2022, certain dividends paid by the Funds may be subject to a maximum tax rate of 23.8%, as provided for by the Jobs and Growth Tax Relief Reconciliation Act of 2003. The percentage of dividends declared from ordinary income designated as qualified dividend income was as follows:
Mairs & Power Growth Fund | | | 100.00 | % | |
Mairs & Power Balanced Fund | | | 62.37 | % | |
Mairs & Power Small Cap Fund | | | 100.00 | % | |
For corporate shareholders, the percent of ordinary income distributions qualifying for the corporate dividends received deduction for the fiscal year ended December 31, 2022, was as follows:
Mairs & Power Growth Fund | | | 100.00 | % | |
Mairs & Power Balanced Fund | | | 55.93 | % | |
Mairs & Power Small Cap Fund | | | 100.00 | % | |
66
INFORMATION ABOUT TRUSTEES (unaudited)
The business and affairs of the Trust are managed under the direction of the Board of Trustees. Information pertaining to the Trustees of the Trust is set forth below. The Statement of Additional Information includes additional information about the Trustees and is available, without charge, upon request by calling 1-855-839-2800.
Name,
Address and
Year of Birth | | Position(s)
Held with
the Trust | | Term of
Office and
Length of
Time Served | | Number of
Portfolios
in Trust
Overseen
by Trustee | | Principal Occupation(s)
During the Past Five Years | | Other
Directorships
Held by Trustee
During the Past
Five Years | |
INDEPENDENT TRUSTEES | |
Michael D. Akers, Ph.D.
615 E. Michigan St. Milwaukee, WI 53202 Year of Birth: 1955 | | Trustee | | Indefinite Term; Since August 22, 2001 | | | 27 | | | • Professor Emeritus, Department of Accounting (June 2019-present), Professor, Department of Accounting (2004-May 2019) | | Independent Trustee, USA MUTUALS
(an open-end investment company) (2001-2021). | |
Gary A. Drska
615 E. Michigan St. Milwaukee, WI 53202 Year of Birth: 1956 | | Trustee | | Indefinite Term; Since August 22, 2001 | | | 27 | | | • Retired; Pilot, Frontier/Midwest Airlines, Inc. (airline company) (1986-2021). | | Independent Trustee, USA MUTUALS
(an open-end investment company) (2001-2021). | |
Vincent P. Lyles
615 E. Michigan St. Milwaukee, WI 53202 Year of Birth: 1961 | | Trustee | | Indefinite Term; Since April 6, 2022 | | | 27 | | | • Executive Director, Milwaukee Succeeds (education advocacy organization) (2023-present); System Vice President of Community Relations, Advocate Aurora Health Care (health care provider) (2019-2022); President and Chief Executive Officer, Boys & Girls Club of Greater Milwaukee (2012-2018). | | Independent Director, BMO Funds, Inc. (an open-end investment company) (2017-2022). | |
Erik K. Olstein
615 E. Michigan St. Milwaukee, WI 53202 Year of Birth: 1967 | | Trustee | | Indefinite Term; Since April 6, 2022 | | | 27 | | | • Retired; President and Chief Operating Officer (2000-2020), Vice President of Sales and Chief Operating Officer (1995-2000), Olstein Capital Management, L.P. (asset management firm); Secretary and Assistant Treasurer, The Olstein Funds (1995-2018). | | Trustee, The Olstein Funds (an open-end investment company) (1995-2018). | |
Lisa Zúñiga Ramírez
615 E. Michigan St. Milwaukee, WI 53202 Year of Birth: 1969 | | Trustee | | Indefinite Term; Since April 6, 2022 | | | 27 | | | • Retired; Principal and Senior Portfolio Manager, Segall, Bryant & Hamill, LLC (asset management firm) (2018-2020); Partner and Senior Portfolio Manager, Denver Investments LLC (asset management firm) (2009-2018). | | N/A | |
67
INFORMATION ABOUT TRUSTEES (unaudited) (continued)
Name,
Address and
Year of Birth | | Position(s)
Held with
the Trust | | Term of
Office and
Length of
Time Served | | Number of
Portfolios
in Trust
Overseen
by Trustee | | Principal Occupation(s)
During the Past Five Years | | Other
Directorships
Held by Trustee
During the Past
Five Years | |
INDEPENDENT TRUSTEES (continued) | |
Gregory M. Wesley 615 E. Michigan St. Milwaukee, WI 53202 Year of Birth: 1969 | | Trustee | | Indefinite Term; Since April 6, 2022 | | | 27 | | | • Senior Vice President of Strategic Alliances and Business Development, Medical College of Wisconsin (2016-present). | | N/A | |
INTERESTED TRUSTEE AND OFFICERS | |
John P. Buckel*
615 E. Michigan St. Milwaukee, WI 53202 Year of Birth: 1957 | | Chairperson, Trustee, President and Principal Executive Officer | | Indefinite Term Chairperson and Trustee (since January 19, 2023); Indefinite Term; Since January 24, 2013 | | | 27 | | | • Vice President, U.S. Bancorp Fund Services, LLC (2004-present). | | N/A | |
Jennifer A. Lima
615 E. Michigan St. Milwaukee, WI 53202 Year of Birth: 1974 | | Vice President, Treasurer and Principal Financial and Accounting Officer | | Indefinite Term; Since January 24, 2013 | | | N/A | | | • Vice President, U.S. Bancorp Fund Services, LLC (2002-present). | | N/A | |
Deanna B. Marotz
615 E. Michigan St. Milwaukee, WI 53202 Year of Birth: 1965 | | Chief Compliance Officer, Vice President and Anti-Money Laundering Officer | | Indefinite Term; Since October 21, 2021 | | | N/A | | | • Senior Vice President, U.S. Bancorp Fund Services, LLC (2021-present); Chief Compliance Officer, Keeley-Teton Advisors, LLC and Teton Advisors, Inc (2017-2021); Chief Compliance Officer, Keeley Asset Management Corp. (2015-2017). | | N/A | |
Jay S. Fitton
615 E. Michigan St. Milwaukee, WI 53202 Year of Birth: 1970 | | Secretary | | Indefinite Term; Since July 22, 2019 | | | N/A | | | • Vice President, U.S. Bancorp Fund Services, LLC (2019-present); Partner, Practus, LLP (2018-2019); Counsel, Drinker Biddle & Reath LLP (2016-2018). | | N/A | |
Kelly A. Strauss
615 E. Michigan St. Milwaukee, WI 53202 Year of Birth: 1987 | | Assistant Treasurer | | Indefinite Term; Since April 23, 2015 | | | N/A | | | • Assistant Vice President, U.S. Bancorp Fund Services, LLC (2011-present). | | N/A | |
* Mr. Buckel is an "interested person" of the Trust as defined by the 1940 Act due to his position and material business relationship with the Trust.
68
INFORMATION ABOUT TRUSTEES (unaudited) (continued)
Name,
Address and
Year of Birth | | Position(s)
Held with
the Trust | | Term of
Office and
Length of
Time Served | | Number of
Portfolios
in Trust
Overseen
by Trustee | | Principal Occupation(s)
During the Past Five Years | | Other
Directorships
Held by Trustee
During the Past
Five Years | |
INTERESTED TRUSTEE AND OFFICERS (continued) | |
Shannon Coyle
615 E. Michigan St. Milwaukee, WI 53202 Year of Birth: 1990 | | Assistant Treasurer | | Indefinite Term; Since August 26, 2022 | | | N/A | | | • Officer, U.S. Bancorp Fund Services, LLC (2015-present). | | N/A | |
Laura A. Caroll
615 E. Michigan St. Milwaukee, WI 53202 Year of Birth: 1985 | | Assistant Treasurer | | Indefinite Term; Since August 20, 2018 | | | N/A | | | • Assistant Vice President, U.S. Bancorp Fund Services, LLC (2007-present). | | N/A | |
69
Mairs & Power Growth Fund, established 1958
Mairs & Power Balanced Fund, established 1961
Mairs & Power Small Cap Fund, established 2011
Mairs & Power Minnesota Municipal Bond ETF (MINN), established 2021
To Contact the Funds
Call 1-855-839-2800
for the Minnesota ETF
or 1-800-304-7404
for the Mutual Funds
Or write to:
(via Regular Mail)
c/o U.S. Bancorp Fund Services, LLC
615 East Michigan Street
P. O. Box 701
Milwaukee, WI 53201-0701 | | (via Overnight or Express Mail)
c/o U.S. Bancorp Fund Services, LLC
3rd Floor
615 East Michigan Street
Milwaukee, WI 53202-0701 | |
For Fund literature and information, visit the Fund's website at:
www.mairsandpower.com
Investment Manager
Mairs & Power, Inc.
30 East 7th Street
Suite 2500
Saint Paul, MN 55101
Custodian
U.S. Bank, N.A.
Custody Operations
1555 North River Center Drive, Suite 302
Milwaukee, WI 53212
Distributor
Foreside Fund Services, LLC
Three Canal Plaza, Suite 100
Portland, ME 04101
Independent Registered Public Accounting Firm
Cohen & Company, Ltd.
342 North Water Street, Suite 830
Milwaukee, WI 53202
This report is intended for shareholders of the Funds and may not be used as sales literature unless preceded or accompanied by a current prospectus.
Mairs & Power, Inc.
c/o U.S. Bancorp Fund Services, LLC
3rd Floor
615 East Michigan Street
Milwaukee, WI 53202-0701
Item 2. Code of Ethics.
Not applicable for semi-annual reports.
Item 3. Audit Committee Financial Expert.
Not applicable for semi-annual reports.
Item 4. Principal Accountant Fees and Services.
Not applicable for semi-annual reports.
Item 5. Audit Committee of Listed Registrants.
| (a) | Not applicable for semi-annual reports. |
Item 6. Investments.
| (a) | Schedule of Investments is included as part of the report to shareholders filed under Item 1 of this Form. |
Item 7. Disclosure of Proxy Voting Policies and Procedures for Closed-End Management Investment Companies.
Not applicable to open-end investment companies.
Item 8. Portfolio Managers of Closed-End Management Investment Companies.
Not applicable to open-end investment companies.
Item 9. Purchases of Equity Securities by Closed-End Management Investment Company and Affiliated Purchasers.
Not applicable to open-end investment companies.
Item 10. Submission of Matters to a Vote of Security Holders.
There have been no material changes to the procedures by which shareholders may recommend nominees to the registrant’s board of trustees.
Item 11. Controls and Procedures.
| (a) | The Registrant’s President and Treasurer have reviewed the Registrant's disclosure controls and procedures (as defined in Rule 30a-3(c) under the Investment Company Act of 1940 (the “Act”)) as of a date within 90 days of the filing of this report, as required by Rule 30a-3(b) under the Act and Rules 13a-15(b) or 15d-15(b) under the Securities Exchange Act of 1934. Based on their review, such officers have concluded that the disclosure controls and procedures are effective in ensuring that information required to be disclosed in this report is appropriately recorded, processed, summarized and reported and made known to them by others within the Registrant and by the Registrant’s service provider. |
| (b) | There were no changes in the Registrant's internal control over financial reporting (as defined in Rule 30a-3(d) under the Act) that occurred during the period covered by this report that has materially affected, or is reasonably likely to materially affect, the Registrant's internal control over financial reporting. |
Item 12. Disclosure of Securities Lending Activities for Closed-End Management Investment Companies
Not applicable to open-end investment companies.
Item 13. Exhibits.
(2) A separate certification for each principal executive and principal financial officer pursuant to Section 302 of the Sarbanes-Oxley Act of 2002. Filed herewith.
(3) Any written solicitation to purchase securities under Rule 23c-1 under the Act sent or given during the period covered by the report by or on behalf of the registrant to 10 or more persons. Not applicable to open-end investment companies.
(4) Change in the registrant’s independent public accountant. There was no change in the registrant’s independent public accountant for the period covered by this report.
SIGNATURES
Pursuant to the requirements of the Securities Exchange Act of 1934 and the Investment Company Act of 1940, the registrant has duly caused this report to be signed on its behalf by the undersigned, thereunto duly authorized.
| (Registrant) | Trust for Professional Managers | |
| By (Signature and Title)* |  | |
| | John Buckel, President | |
Date 9/5/2023
Pursuant to the requirements of the Securities Exchange Act of 1934 and the Investment Company Act of 1940, this report has been signed below by the following persons on behalf of the registrant and in the capacities and on the dates indicated.
| By (Signature and Title)* |  | |
| | John Buckel, President | |
Date 9/5/2023
| By (Signature and Title)* |  | |
| | Jennifer Lima, Treasurer | |
Date 9/5/2023
* Print the name and title of each signing officer under his or her signature.