Annual Report
September 30, 2023
CrossingBridge Low Duration High Yield Fund
Institutional Class
(CBLDX)
CrossingBridge Responsible Credit Fund
Institutional Class
(CBRDX)
CrossingBridge Ultra-Short Duration Fund
Institutional Class
(CBUDX)
CrossingBridge Pre-Merger SPAC ETF
(SPC)
RiverPark Strategic Income Fund
Institutional Class
(RSIIX)
Retail Class
(RSIVX)
Investment Adviser
CrossingBridge Advisors, LLC
427 Bedford Road
Suite 220
Pleasantville, New York 10570
Phone: 1-888-898-2780
Table of Contents
| COMMENTARY | 3 |
| MANAGEMENT’S DISCUSSION OF | |
| FUND PERFORMANCE AND ANALYSIS | 17 |
| EXPENSE EXAMPLE | 32 |
| INVESTMENT HIGHLIGHTS | 34 |
| SCHEDULES OF INVESTMENTS | 44 |
| STATEMENTS OF ASSETS AND LIABILITIES | 85 |
| STATEMENTS OF OPERATIONS | 88 |
| STATEMENTS OF CHANGES IN NET ASSETS | 91 |
| FINANCIAL HIGHLIGHTS | 96 |
| NOTES TO FINANCIAL STATEMENTS | 102 |
| REPORT OF INDEPENDENT REGISTERED | |
| PUBLIC ACCOUNTING FIRM | 129 |
| BASIS FOR TRUSTEES’ APPROVAL OF | |
| INVESTMENT ADVISORY AGREEMENTS | 131 |
| REVIEW OF LIQUIDITY RISK MANAGEMENT PROGRAM | 140 |
| ADDITIONAL INFORMATION | 141 |
Commentary
Rooting for my hometown Philadelphia Phillies in the playoffs, I am reminded that “fat pitches” are rarely presented to batters. To avoid striking out, they are often forced to swing at “skinny pitches” just inside the strike zone. Unlike baseball players, investors looking for the fat pitch are not forced to swing and can safely hold cash until the right opportunity comes along. Unfortunately, investors are often overeager to spot and embrace a “fat pitch” when, in truth, there is often less than meets the eye. In our view, the key to investment success is avoiding strike outs and successfully hitting “singles” and “doubles”. Of course, who doesn’t like a fat pitch?
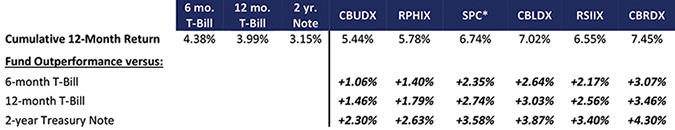
CrossingBridge & Affiliate Managed Funds vs Short-Term Treasury SecuritiesA,1
*The return for SPC (ETF) is reflected by the Market Price.
A year ago, many investors took the view that short-dated U.S. Treasuries were a “fat pitch”. On September 30, 2022, the 2-year Treasury bond was yielding 4.28% – “pretty good,” they thought, in comparison to the miniscule yields over the prior 15 years and “risk free”, backed by the U.S. Government. Although this perspective had some merit, it was not the fat pitch investors believed it to be. Rather, because rates had risen, it was simply a higher yielding place to hold cash while waiting for the fat pitch. It also had risks that investors did not consider. For example, as rates continued to rise, these securities experienced mark-to-market losses and investors were cut off from the ability to reinvest at higher yields during the holding period. Further, it ignored the risk posed by the disfunction of the U.S. Congress, crystalized when Fitch downgraded the U.S. sovereign credit rating2 and exemplified by the recent, unprecedented ouster of the Speaker of the House. In addition, an investor in Treasuries missed the opportunity to capture the risk premium in corporate securities. As shown above, our Funds outperformed short-term Treasuries over the last twelve months, benefitting from active management and spread premium in the underlying investments.
________________
1 | CBUDX is the symbol for the CrossingBridge Ultra Short Duration Fund. RPHIX is the symbol for the RiverPark Short Term High Yield Fund. SPC is the symbol for the CrossingBridge Pre-Merger SPAC ETF. CBLDX is the symbol for the CrossingBridge Low Duration High Yield Fund. RSIIX is the symbol for the RiverPark Strategic Income Fund. CBRDX is the symbol for the CrossingBridge Responsible Credit Fund. For further reference on the specific funds, please see www.crossingbridgefunds.com and www.riverparkfunds.com/funds. |
2 | On August 1, 2023, Fitch downgraded the U.S. sovereign credit rating from AAA to AA+, warning that “risks have risen that the debt limit will not be raised or suspended before the x-date and consequently that the government could begin to miss payments on some of its obligations.” Standard & Poors effected a downgrade to the same level on August 5, 2011 following a previous debt ceiling crisis that took the country to the brink of default. |
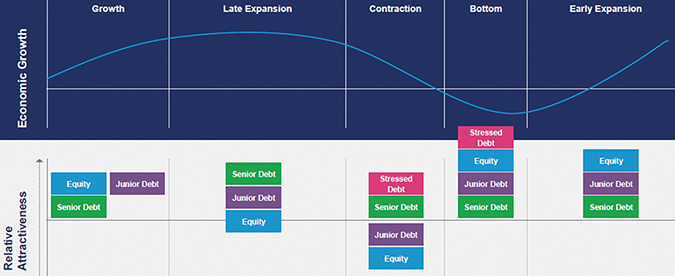
Attractiveness of Asset Classes Across the Economic CycleB
The diagram above, prepared by Mercer,3 reflects their view that different asset classes are more or less attractive depending on the stage of the economic cycle. An investor looking for “fat pitches” should keep this in mind.
Currently, a fat pitch being discussed is the upcoming opportunity for distressed investing. We have our doubts.4 Years ago, good companies with bad balance sheets presented fruitful opportunities. Today, most distressed candidates are more likely to be either venture-like businesses, running out of capital, or mature zombies, both of which have been described in previous letters. Although it may be tempting to allocate to the distressed market when the economy is bottoming out, the dramatic growth in funds raised that are dedicated to this asset class, combined with limited availability of high-quality opportunities has led distressed funds to practice “creditor-on-creditor warfare,” to compensate for sub-optimal returns.5 That said, we have the skill set to participate in a distressed fat pitch should we come across one.
In the spirit of hitting singles and doubles, senior debt appears to be the only asset class that consistently remains attractive throughout the economic cycle. This is where we live.
________________
3 | Mercer is an employee benefits and investment consultant. |
4 | Note that most vehicles through which one may invest in distressed securities are private funds that charge high management and incentive fees, reducing returns to the investor. In addition, these funds will often have “lockup” periods, limiting liquidity. |
5 | For a primer on “creditor-on-creditor warfare”, read The Caesars Palace Coup by Sujeet Indap and Max Frumes. |
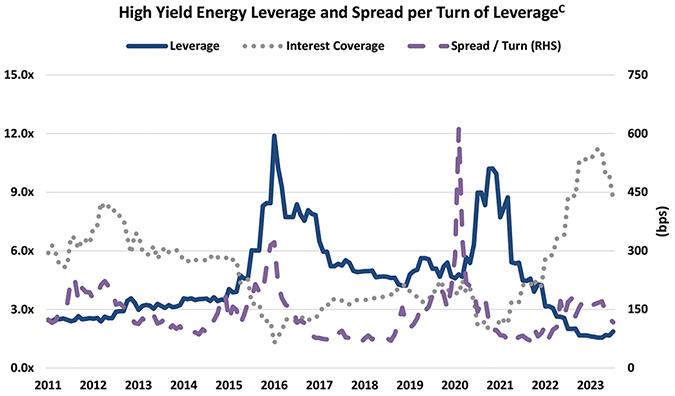
Energy Sector: Exploration & Production Companies and Midstream Service Providers
In June, I participated in a panel at a high yield conference sponsored by the CFA Society of New York. One of the speakers made the case that high yield exploration & production (“E&P”) credit was a “fat pitch” that should be overweighted. She argued that many of the companies had de-levered and that yields were attractive relative to other sectors in the high yield indices. Indeed, as shown above, leverage among high yield energy credits has declined from the peak in 2020-22 and interest coverage has dramatically improved due to lower interest expense and higher cash flow. However, as of August 31, 2023, the average option adjusted spread per turn of leverage, a measure of return relative to risk, was 117 basis points, below the long-term average of 140 basis points.D
Moreover, we have several concerns related to exploration and production credits as the energy sector may repeat a well-established cycle:
| | 1. | Merger and acquisition activity is robust with capital chasing production and consolidation opportunities in response to rising energy prices. Risk is already rising. For example, in the Permian basin this year,6 nearly 44%E of acquired reserves have consisted of more speculative proven, undeveloped (“PUD”) reserves, to which we, in our analysis, attribute little value. Furthermore, several recent transactions are being priced at modest premiums to proven developed reserves (“PDP”), leaving little or no safety margin. |
| | | |
| | 2. | As valuations rise, companies pursue the cheapest form of capital. Recently, debt financing has become more prevalent as a primary source of capital. In fact, the energy sector is the highest dollar value issuer of junk bonds in 2023. With the futures curve for oil prices in “backwardation”7 the present value of reserves is likely inflated, suggesting that collateral support for debt may be lower than perceived. |
________________
6 | Located in western Texas and southeastern New Mexico, the Permian Basin is the highest producing oil field in the U.S. |
7 | Commodity price curves are “normal” or in “contango” when prices are lowest in the near term and are expected to rise as time passes. Curves in “backwardation” are the opposite with prices high at present (“spot”) and expected to decline over time. |
| | 3. | Eventually, commodity prices drop and/or operating execution disappoints, potentially leading to over-levered companies with depleting assets. |
| | | |
| | 4. | Companies are forced to rationalize their balance sheets and focus on cash flow to survive – some don’t make it. |
| | | |
| | 5. | Wash – rinse – repeat. |
Although we have been a net seller of exploration & production (E&P) credits in 2023 and presently have low exposure to the sector,F there have been instances in which we find attractive investments in E&P. Often, the opportunities we find interesting are companies that are emerging from distress with low leverage and cleansed of value-impairing liabilities. These investments must meet high hurdles in terms of asset coverage, expected return and covenant protection. Today, most of our new debt investments in the E&P sector are event-driven, premised on a corporate event such as an asset sale or refinancing.
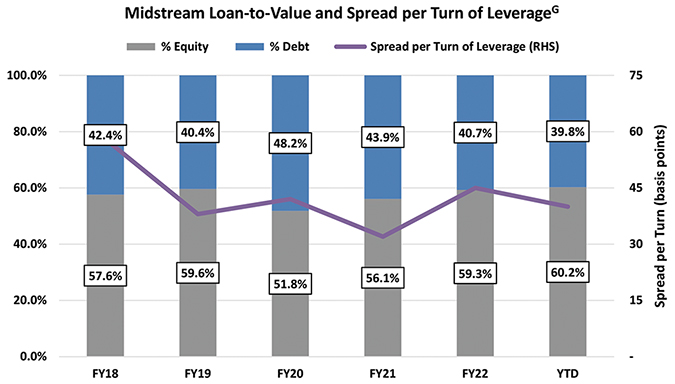
Another part of the energy sector, midstream service providers (“MSPs”) is also garnering attention from the wealth advisory community because, having learned the lessons of the past, these companies have been reducing leverage, increasing dividends, and repurchasing shares. MSPs, typically oil & gas pipelines, are often lumped together with energy producers yet have their own specific characteristics when it comes to credit. MSP assets may provide the only energy transport infrastructure available to an energy producer in a region, allowing good visibility of cash flow via long term contracts and minimum volume commitments. However, as these companies are often structured as master limited partnerships, they are required to distribute a large portion of net income to their equity holders, limiting their ability to pay down debt or reinvest for growth. Loan-to-value, a measure of credit risk, has improved modestly over the last five years but does not make the sector that much more attractive. Meanwhile, compensation for credit risk, as reflected in the credit spread per turn of leverage, is currently about average – thus, no great bargain. Moreover, these companies are increasing dividends and share buybacks enhancing shareholder value to the detriment of lenders.
We have invested in debt of MSPs selectively. For example, NGL Energy, which we will discuss below, has been prohibited from paying dividends since April 2019 when it issued its 7.50% secured bonds, due 2026. As a result, the company has been paying down debt
since leverage peaked in 2021 and has vocally stated its intention to refinance all of its bonds in the near term, potentially creating an attractive event-driven opportunity.
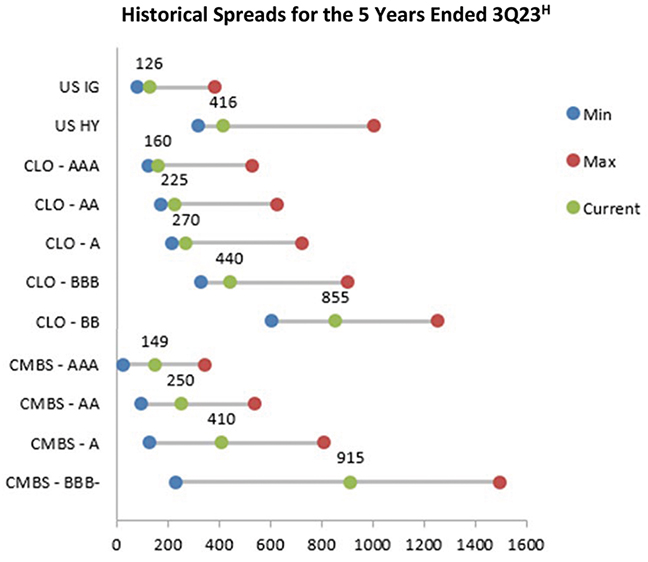
Securitizations
Following the scare brought on by the failure of Silicon Valley Bank and the near-death experience of First Republic Bank, spreads of asset-backed securities widened to attractive levels. As time has passed, spreads have narrowed. Still, BBB and below collateralized loan obligation (CLO) securities and AA and below commercial mortgage-backed securities (CMBS) appear cheap on a relative basis.
We continue to focus primarily on single-A CMBS securities that are not exposed to central business district properties. As we discussed in prior letters, we expect the commercial real estate market to take several years to heal and we hope, ultimately, to find a fat pitch or two in the future – but buyer beware.
Investors are also pointing to the lower tranches of CLOs that are providing high yields. This may be the case, but we do not invest in that market unless we see a fat pitch such as in 2009, when the economy was emerging from the Great Financial Crisis (“GFC”). Moreover, we typically do not invest in CLOs for the same reason that we shy away from financial institutions: they take underwriting risk, they take spread risk, they take counterparty risk, and they are dependent on the capital markets remaining fluid. These risks are similar to the risks we face every day. Therefore, we choose not to increase our exposure unnecessarily, particularly as these financial issuers also employ leverage. Investors attracted to the wide spreads for BBB tranches of CLOs should be aware that, typically, this tranche begins to experience principal losses when aggregate portfolio losses reach 16%. This is comparable to a real estate loan or a leveraged buyout (LBO) that has been financed at an 84% loan-to-value – risky propositions in our estimation. “Live by the sword, die by the sword.”
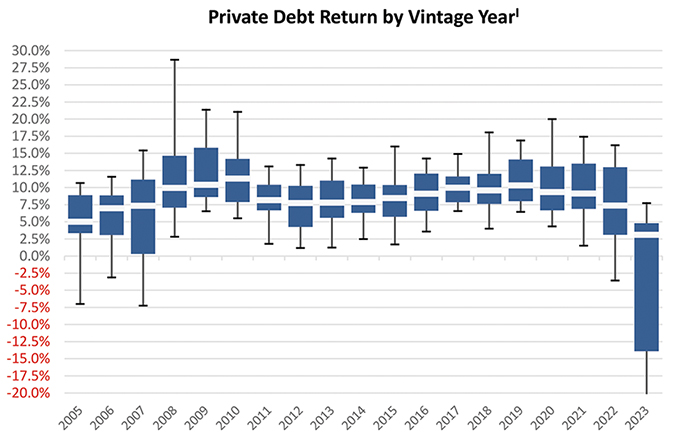
Private Credit
The graph above shows the performance of private debt issued by cohort year. It appears that private debt is not the “fat pitch” being widely touted. The median return for originations in each year since 2005 has been 8.8% with a wide range of performance. Clearly, manager selection is paramount.
The growth in “private credit” over the last few years has come about as private lenders have replaced banks, providing floating rate debt that affords borrowers the flexibility to repay early with little or no prepayment penalty and providing investors with interest rate protection. Thus, “private credit” is supposedly the hot new thing providing higher returns with lower volatility, yet our head of research began his career in the 1980s in the private placement group of a large life insurer and sees nothing new. As was the case 30 years ago, private credit is typically:
| | • | Provided by institutions other than banks. |
| | • | Issued by privately-owned borrowers who prefer a private transaction or, more likely, have no access to the public bond or bank loan markets due to their smaller size or complex credit story. |
| | • | Tailored to the borrower’s specific needs in terms of size, repayment schedule, covenants, etc. |
| | • | Backed by senior claims on issuers’ cash flow and/or assets. |
These factors contribute to the belief that private credit provides higher returns. However, as with most investments, higher return comes with higher risks (selectively, but not all-inclusive):
A lower default rate does not mean there is less distress. Defaults are lower because, when faced with a potential default, it is easier to get a small group of lenders to agree to waive a covenant than to get 20-100 bondholders or a large syndicate of lenders to agree to a waiver. While there may be fewer “defaults”, the aggregate level of distress may be comparable to the leveraged loan market.
Volatility is low because there is no credible mark-to-market. Proponents of private credit often point to lower volatility relative to high yield and syndicated leveraged loans. However, this does not reflect greater safety in the private credit market; it is a direct result of the fact that these loans do not trade so there is no price discovery, potentially imparting a false sense of stability.
Minimal market liquidity means lenders must live with their mistakes. Given that each private debt issue may be held by one lender or a small group of lenders, it is much more difficult to sell a distressed private loan than a troubled bond or syndicated loan for which there are many holders and a well-established market for distressed debt. Thus, private lenders have limited ability to sell a loan to avoid anticipated losses. Moreover, in the absence of an ability to sell troubled credits, a private lender will need to develop an in-house workout capability to manage the distressed situations that are inevitable in any credit portfolio.
The private credit market has not experienced a default cycle. The private credit market has seen its greatest growth in the aftermath of the GFC when it began to fill the void left by banks that dramatically reduced their loan exposure in the face of new capital rules. The rise in defaults in 2014-16 was primarily concentrated in the energy industry and weakness in credit in 2020-21 resulting from the COVID-19 crisis was largely offset by government-funded stimulus. Thus, there has not yet been a broad default cycle since the GFC to test the safety and security attributed to the private credit market.
We continue to emphasize idiosyncratic investments with the discipline to re-evaluate and potentially sell (even if it means taking a loss) when, in our view, risk versus return goes askew – see FXI below. As mentioned earlier in this letter, we discuss a MSP investment – see NGL Energy below. Lastly, we provide a recent portfolio holding which was intended, in baseball parlance, to be a “single”, but turned out to be a “double” – see Georg Jensen.
FXI Holdings (FXIHLD) 12.25% Secured Notes due 11/15/26J – The company, formerly known as Foamex, is a leading North American producer of foam solutions selling bedding, furniture and automotive foam via retail and wholesale channels. The company was acquired by private equity firm One Rock Partners, LLC in 2017. We have owned several of the company’s bonds at various times since 2018 and initially purchased the 12.25% Secured Notes, due 2026, in October 2019 when the bond was issued. We were attracted to the solid management, the benefits of rapid growth in the bedding industry, reasonable leverage below 5.0x EBITDA and free cash flow enabled by low capital expenditures. With the ability to pass through supply chain-related cost increases and benefitting from a rise in household formation during COVID which led to increased mattress sales, the company performed very well in 2021. However, they experienced a contraction in 2022 as demand for new bedding waned and new car production was constrained due to supply chain issues. In March 2023, ahead of its 2024 unsecured bond going current in November 2023, the company exchanged the majority of its 7.875% unsecured bonds for new 12.25% secured bonds due 2026. This exchange increased annual cash interest expense by approximately $20 million, pressuring cash flow, and increasing the amount of debt that is pari passu with the bond we held prior to the exchange, weakening its position. Thus, given the declining trajectory of the business, rising leverage, weaker structural protection and the challenging $1.24 billion maturity wall that looms in late 2026, we concluded that the 16% yield to maturity was not enough compensation for the growing risk and sold the remainder of our position in 3Q23.
NGL Energy Partners LP (NGL) 6.125% Unsecured Notes due 3/1/25, 7.50% Senior Secured Notes due 2/1/26, Series B Preferred StockK –– NGL Energy is a diversified midstream master limited partnership (MLP) that provides transportation, storage, marketing and other logistics services for crude oil, liquid hydrocarbons, and water
generated as part of energy production. Experiencing a sharp decline in EBITDA during 2020, NGL repaid its asset-backed loan facility and bridge loan in January 2021 by issuing a 7.50% senior secured note due 2/1/26. Given elevated pro forma net leverage, bond purchasers required a covenant preventing the company from paying dividends until total leverage was reduced below 4.75x EBITDA. Thus, since that bond was issued in January 2021, the company has keenly focused on de-leveraging. “Walking the talk,” the company partially repurchased its 7.50% unsecured notes, due 11/1/23, during 1Q23, ultimately calling the remaining bonds, of which we were holders, at par on 3/31/23. Concurrent with our initial purchases of the unsecured bonds in January 2023, we began to purchase the 7.50% senior secured notes due 2/1/26. With conservative secured leverage and expectations for continued de-leveraging, we were comfortable purchasing these bonds at a weighted average price of 95.8, providing a yield to maturity averaging of 9.14% and the opportunity for a higher rate of return if the company followed through on its stated intention to repay this bond before it became a current liability on 2/1/25.8 To that end, management expressed its intention to repay the 6.125% unsecured bonds, due 3/1/25, no later than the end of March 2024. Still able to purchase the bonds at a discount, we added to the position in the 6.125% bonds in late August, and, in addition, have been actively trading the NGL Series B Preferred Stock. The preferred shares have been accruing their dividend at a rate that resets each quarter, currently 12.783%, and, as of quarter-end, are trading at nearly a 20% discount to their liquidation value which continues to increase with each dividend deferral. As the company is prohibited from making distributions to MLP unit holders until it has paid the preferred dividends that are in arrears and resumed the cash dividend to the preferred shareholders, we anticipate significant catch-up payments as early as late 2024 if the company succeeds in refinancing its capital structure. NGL is a good example of a series of attractive, well-grounded investments, that “advance the runner” without ��swinging for the fences.”
Georg Jensen A/S (GEORGJ) Secured Floating Rate Note due 5/14/25L – Georg Jensen is a globally recognized Danish design house, with a history spanning over 119 years. The company designs, manufactures, and distributes an extensive range of gold, silver, and diamond jewelry, watches, home décor, tableware, and hollowware. In February 2023, we participated in the issuance of the company’s secured floating rate notes due 5/14/25, purchasing the notes at par to yield 9.55% with proceeds used to repay the company’s secured floating rate note due 5/15/23, which we previously held. We sold a portion of the bonds in the 100.50-101.50 range to book small gains in the months following issuance. However, the bonds jumped to the 104.00-104.50 range following the 9/14/23 announcement that the company was being sold to Fiskars Group, the owner of several global home goods brands including Fiskars, Gerber, Iittala, Royal Copenhagen, Moomin Arabia, Waterford, and Wedgwood. With some uncertainty as to the timing to complete the sale and the specific disposition of the bonds as a result of this transaction, we took advantage of the sharply higher price to sell most of our remaining bonds within days of the sale announcement. The bonds will be redeemed at a price closer to 106 on October 26, but given the opportunity to realize a quick gain rather than risk the bonds falling back if the deal fell through, we were quite content to sell and look for another opportunity.
________________
8 | We made multiple purchases over several days at varying prices. Assuming a weighted average purchase date of 2/6/23 and a weighted average purchase price of 95.8, the rate of return to a 2/1/25 repayment would be approximately 9.88%. |
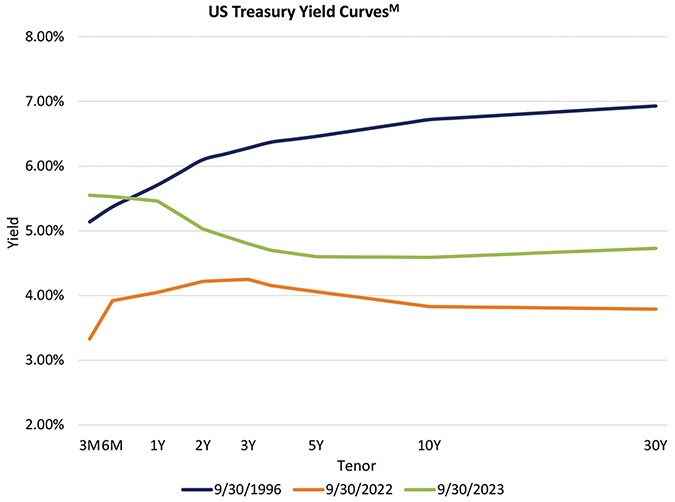
When I left Leucadia National in 1996 to “put out my own shingle” as an investment manager, short term interest rates were not that different from today’s levels. However, as shown above, the yield curve was “normal”, sloping upward, as opposed to the inverted curve we have today. Rates have risen dramatically over the last year, especially in the short end of the curve. Today’s inverted yield curve reflects an expectation by some that the economy will slow down and force the Federal Reserve’s hand to lower rates. Others are challenging this conventional wisdom with the belief that, structurally, the curve will normalize with medium and long-term rates going up; so far, they are right. Both sides, advocating getting long or shorting long duration bonds, believe that the setup is a fat pitch. Rather, we believe this is nothing more than interest rate speculation and, instead, will take a more agnostic approach. We prefer to accept risk in the form of corporate credit, taking advantage of high short-term rates and acceptable spreads to capture our returns.
The subject of the book and the movie, Moneyball,N Billy Beane is former professional baseball player who was named general manager of the Oakland A’s in 1997. He is best known for crafting the team into a winner despite one of the lowest payrolls in the league by analyzing key statistical elements of overlooked, undervalued players rather than paying high salaries for stars. This approach is exemplified by a few lines from the movie9 in which Billy Beane is discussing a player prospect with John Poloni, an “old school” scout focused on players who can hit the fat pitch, and Peter Brand, the analyst who developed the mathematical tools employed by Beane:
________________
9 | This iconic scene can be revisited at the following: https://www.youtube.com/watch?v=3MjxoaynCmk&ab_channel=SceneCity |
(the scouts look at the report)
The Scouts: He gets on base.
Billy Beane: He gets on base!
John Poloni: So he walks a lot.
Billy Beane: He gets on base a lot. Do I care if it’s a walk or a hit?
(looks over at Peter)
Peter Brand: You do not.
Billy Beane: I do not.
Beane recognized that, in his system, the objective is to get on base regardless of whether it is by getting a hit or being walked. We think we are similar. We don’t think anything in our markets is easy or obvious. We expect to be successful by analyzing individual credit opportunities in a methodical, disciplined manner to determine whether they provide a respectable level of return that is commensurate with a responsible level of risk. Grinding out returns, this is the approach that permitted our portfolios to outperform Treasuries (and a lot of other portfolios) over the last year and, we believe, will serve our long-term investors well going forward.
Playing “small ball,”10
David K. Sherman and the CrossingBridge team
________________
10 | “Small ball” is an offensive strategy in baseball that emphasizes getting runners on base and advancing them to scoring position, 2nd or 3rd base, via singles, bases on balls, stolen bases, bunts, sacrifice flies, etc. The strategy de-emphasizes extra base hits, swinging for home runs, etc. |
Endnotes
________________
A | The return for the 6-month T-Bill is the compounded return of a generic on-the-run 6-month T-Bill purchased on 9/30/22 with proceeds from the 3/31/23 maturity reinvested in another 6-month T-Bill that matures on 9/30/23. The return on the 12-month T-Bill is the yield of a generic one-year T-Bill as if purchased on 9/30/22. The return on the 2-year Treasury Note reflects the compounded monthly return of a 2-year Treasury Note as if purchased on 9/30/22 and sold on 9/30/23. The returns on the funds managed by CrossingBridge and affiliates reflect the compound monthly returns of each fund for the twelve months ended 9/30/23. Standardized performance for the Funds can be found here: CrossingBridge Ultra-Short Duration Fund: http://www.crossingbridgefunds.com/ultra-short-duration-fund. RiverPark Short Term High Yield Fund: http://www.riverparkfunds.com/short-term-high-yield-fund. CrossingBridge Pre-Merger SPAC ETF: https://www.crossingbridgefunds.com/spac-etf. CrossingBridge Low Duration High Yield Fund: http://www.crossingbridgefunds.com/low-duration-high-yield-fund. RiverPark Strategic Income Fund: http://www.crossingbridgefunds.com/riverpark-strategic-income-fund. CrossingBridge Responsible Credit Fund: https://www.crossingbridgefunds.com/responsible-credit-fund. Standardized performance for the Treasuries can be found here: https://info.crossingbridgefunds.com/hubfs/Standardized%20Performance%20for%20Treasuries%20as%20of%209-30-23.pdf. Performance data quoted represents past performance; past performance does not guarantee future results. The investment return and principal value of an investment will fluctuate so that an investor’s shares, when redeemed, may be worth more or less than their original cost. Current performance of a Fund may be lower or higher than the performance quoted. |
B | Private versus Liquid Credit, Mercer LLC, September 2023 (with permission) |
C | Bank of America; data from February 28, 2011 through August 31, 2023 |
D | Bank of America; data from February 28, 2011 through August 31, 2023 |
E | Company filings and internal research |
F | As of 9/30/23, exposure to the Exploration and Production sector was 1.68% in the CrossingBridge Low Duration High Yield Fund, 0.00% in the CrossingBridge Responsible Credit Fund, 3.61% in the CrossingBridge Ultra-Short Duration Fund, 4.37% in RiverPark Short Term High Yield Fund and 1.34% in the RiverPark Strategic Income Fund. |
G | E&P and Midstream Relative Value Update, Barclays, September 19, 2023, and Midstream Monthly Outlook: October 2023, Wells Fargo, October 5, 2023 |
H | Bank of America – Reflects the range of credit spreads for each asset class over the five-year period ended September 29, 2023. Investment grade spreads reflect the credit spread for the ICE BofA US Corporate Index. High yield spreads reflect the credit spread for the ICE BofA US High Yield Corporate Index. CLO spreads reflect the market spread over the US Secured Overnight Financing Rate (SOFR) for 5-year floating rate tranches. CMBS spreads reflect the market spread over the Treasury rate for on-the-run fixed rate conduit structures (multi-asset, multi-sector) with a 3-year maturity for AAA tranches and a 10-year maturity for all other tranches |
I | Pitchbook vintage year data |
J | As of 6/30/23, our position in FXI Holdings 12.25% Secured Notes due 11/15/26 represented 0.71% of the CrossingBridge Low Duration High Yield Fund and 0.69% of the RiverPark Strategic Income Fund. As of 9/30/23, our position in these bonds represented 0.00% of the CrossingBridge Low Duration High Yield Fund and the RiverPark Strategic Income Fund. |
K | As of 6/30/23, our position in the NGL Energy 6.125% Senior Notes represented 0.00% of the CrossingBridge Ultra-Short Duration Fund and 0.00% of the RiverPark Short Term High Yield Fund. As of 9/30/23, our position in the NGL Energy 6.125% Senior Notes represented 2.44% of the CrossingBridge Ultra-Short Duration Fund and 2.57% of the RiverPark Short Term High Yield Fund. As of 6/30/23, our position in the NGL Energy 7.50% Senior Secured Notes represented 1.48% of the CrossingBridge Low Duration High Yield Fund and 1.58% of the RiverPark Strategic Income Fund. As of 9/30/23, our position in the NGL Energy 7.50% Senior Secured Notes represented 1.39% of the CrossingBridge Low Duration High Yield Fund and 1.14% of the RiverPark Strategic Income Fund. As of 6/30/23, our position in the NGL Energy Series B Preferred Stock represented 0.47% of the CrossingBridge Responsible Credit Fund and 0.46% of the RiverPark Strategic Income Fund. As of 9/30/23, our position in the NGL Energy Series B Preferred represented 0.44% of the CrossingBridge Responsible Credit Fund and 0.33% of the RiverPark Strategic Income Fund. |
L | As of 6/30/23, our position in the Georg Jensen Secured Floating Rate Notes represented 1.13% of the CrossingBridge Low Duration High Yield Fund, 2.62% of the CrossingBridge Responsible Credit Fund and 1.10% of the CrossingBridge Ultra-Short Duration Fund. As of 9/30/23, our position in the Georg Jensen Secured Floating Rate Notes represented 0.11% of the CrossingBridge Low Duration High Yield Fund and 0.00% of the CrossingBridge Responsible Credit Fund and the CrossingBridge Ultra-Short Duration Fund. |
M | Bloomberg |
N | Moneyball: The Art of Winning an Unfair Game, Michael Lewis, 2003 |
Disclosures
Must be preceded or accompanied by a prospectus. The prospectus for the CrossingBridge Ultra-Short Duration Fund, CrossingBridge Low Duration High Yield Fund, and the CrossingBridge Responsible Credit Fund can be found here: www.crossingbridgefunds.com/assets/fund/CrossingBridge_Prospectus.pdf. The prospectus for the RiverPark Strategic Income Fund can be found here: info.crossingbridgefunds.com/hubfs/Regulatory/RSIIX_Prospectus.pdf. To obtain a hardcopy of the prospectus, call 855-552-5863. Please read and consider the prospectus carefully before investing. Per rule 30e-3, the fiscal Q1 holdings can be found here: info.crossingbridgefunds.com/hubfs/FY%20Q1%20Holdings.pdf. The fiscal Q3 holdings can be found here: info.crossingbridgefunds.com/hubfs/FY%20Q3%20Holdings.pdf.
The prospectus for the CrossingBridge Pre-Merger SPAC ETF can be found here: https://www.crossingbridgefunds.com/assets/spac-etf/crossingbridge-spac-etf-prospectus.pdf. The
Statement of Additional Information (SAI) can be found here: https://www.crossingbridgefunds.com/assets/spac-etf/crossingbridge-spac-etf-sai.pdf. To obtain a hardcopy of the prospectus, call 855-552-5863. Please read and consider the prospectus carefully before investing.
The Funds are offered only to United States residents, and information on this site is intended only for such persons. Nothing on this website should be considered a solicitation to buy or an offer to sell shares of the fund in any jurisdiction where the offer or solicitation would be unlawful under the securities laws of such jurisdiction.
CrossingBridge mutual funds’ disclosure: mutual fund investing involves risk. Principal loss is possible. Investments in foreign securities involve greater volatility and political, economic and currency risks and differences in accounting methods. Investments in debt securities typically decrease in value when interest rates rise. This risk is usually greater for longer-term debt securities. Investment in lower-rated and non-rated securities presents a greater risk of loss to principal and interest than higher-rated securities. Because the fund may invest in exchange-traded funds (“ETFs”) and exchange-traded notes (“ETNs”), they are subject to additional risks that do not apply to conventional mutual fund, including the risks that the market price of an ETF’s and ETN’s shares may trade at a discount to its net asset value (“NAV”), an active secondary trading market may not develop or be maintained, or trading may be halted by the exchange in which they trade, which may impact a fund’s ability to sell its shares. The value of ETN’s may be influenced by the level of supply and demand for the ETN, volatility and lack of liquidity. A Fund may invest in derivative securities, which derive their performance from the performance of an underlying asset, index, interest rate or currency exchange rate. Derivatives can be volatile and involve various types and degrees of risks, and, depending upon the characteristics of a particular derivative, suddenly can become illiquid. Investments in asset backed, mortgage backed, and collateralized mortgage backed securities include additional risks that investors should be aware of such as credit risk, prepayment risk, possible illiquidity and default, as well as increased susceptibility to adverse economic developments. Investing in commodities may subject the fund to greater risks and volatility as commodity prices may be influenced by a variety of factors including unfavorable weather, environmental factors, and changes in government regulations. Shares of closed-end fund frequently trade at a price per share that is less than the nav per share. There can be no assurance that the market discount on shares of any closed-end fund purchased by the Fund will ever decrease or that when the Fund seeks to sell shares of a closed-end fund it can receive the nav of those shares. There are greater risks involved in investing in securities with limited market liquidity.
CrossingBridge Pre-Merger SPAC ETF disclosure: investing involves risk; principal loss is possible. The Fund invests in equity securities and warrants of SPACs. Pre-combination SPACs have no operating history or ongoing business other than seeking combinations, and the value of their securities is particularly dependent on the ability of the entity’s management to identify and complete a profitable combination. There is no guarantee that the SPACs in which the fund invests will complete a combination or that any combination that is completed will be profitable. Unless and until a combination is completed, a SPAC generally invests its assets in U.S. Government securities, money market securities, and cash. Public stockholders of SPACs may not be afforded a meaningful opportunity to vote on a proposed initial combination because certain stockholders, including stockholders affiliated with the management of the SPAC, may have sufficient voting power, and a financial incentive, to approve such a transaction without support from public stockholders. As a result, a SPAC may complete a combination even though a majority of its public stockholders do not support such a combination. Some SPACs may pursue combinations only within certain industries or regions, which may increase the volatility of their prices. The Fund may invest in SPACs domiciled or listed outside of the U.S., including, but not limited to, Canada, the Cayman Islands, Bermuda and the Virgin Islands. Investments in SPACs domiciled or listed outside of the U.S. May involve risks not generally associated with investments in the securities of U.S. SPACs, such as risks relating to political, social, and economic developments abroad and differences between U.S. And foreign regulatory requirements and market practices. Further,
tax treatment may differ from U.S. SPACs and securities may be subject to foreign withholding taxes. Smaller capitalization SPACs will have a more limited pool of companies with which they can pursue a business combination relative to larger capitalization companies. That may make it more difficult for a small capitalization SPAC to consummate a business combination. Because the Fund is non-diversified it may invest a greater percentage of its assets in the securities of a single issuer or a smaller number of issuers than if it were a diversified fund. As a result, a decline in the value of an investment in a single issuer could cause the Fund’s overall value to decline to a greater degree than if the Fund held a more diversified portfolio.
Definitions: The S&P 500, or simply the S&P, is a stock market index that measures the stock performance of 500 large companies listed on stock exchanges in the united states. The ICE BOFA Investment Grade Index tracks the performance of us dollar denominated investment grade rated corporate debt publicly issued in the us domestic market. The ICE BOFA High Yield Index tracks the performance of us dollar denominated below investment grade rated corporate debt publicly issued in the us domestic market. EBITDA is a company’s earnings before interest, taxes, depreciation, and amortization is an accounting measure calculated using a company’s earnings, before interest expenses, taxes, depreciation, and amortization are subtracted, as a proxy for a company’s current operating profitability. A Basis Point (BP) is 1/100 of one percent. Pari-Passu is a Latin term that means ‘on equal footing’ or ‘ranking equally’. It is an important clause for creditors of a company in financial difficulty which might become insolvent. If the company’s debts are Pari-Passu, they are all ranked equally, so the company pays each creditor the same amount in insolvency. LIBOR is the average interbank interest rate at which a selection of banks on the London money market are prepared to lend to one another. Yield to Maturity (YTM) is the total return anticipated on a bond (on an annualized basis) if the bond is held until it matures. Free Cash Flow (FCF) is the cash a company produces through its operations, less the cost of expenditures on assets. In other words, Free Cash Flow is the cash left over after a company pays for its operating expenses and capital expenditures. Duration is a measure of the sensitivity of the price of a bond or other debt instrument to a change in interest rates. Debtor-in-Possession (DIP) financing is a special kind of financing meant for companies that are in bankruptcy. Only companies that have filed for bankruptcy protection under chapter 11 are allowed to access dip financing, which usually happens at the start of a filing. Dip financing is used to facilitate the reorganization of a Debtor-in-Possession (the status of a company that has filed for bankruptcy) by allowing it to raise capital to fund its operations as its bankruptcy case runs its course. Yield to Call (YTC) refers to the return a bondholder receives if the bond is held until the call date, which occurs sometime before it reaches maturity. The SEC Yield is a standard yield calculation developed by the U.S. Securities and Exchange Commission (SEC) that allows for fairer comparisons of bond funds. It is based on the most recent 30-day period covered by the fund’s filings with the SEC. The yield figure reflects the dividends and interest earned during the period after the deduction of the fund’s expenses. It is also referred to as the “standardized yield.” Yield to Worst is the yield on the portfolio if all bonds are held to the worst date; Yield to Worst date is the date of lowest possible yield outcome for each security without a default.
ETF definitions: the ICE BOFA 0-3 Year U.S. Treasury Index tracks the performance of U.S. dollar denominated sovereign debt publicly issued by the U.S. government in its domestic market with maturities less than three years. Gross Spread is the amount by which a SPAC is trading at a discount or premium to its pro rata share of the collateral trust value. For example, if a SPAC is trading at $9.70 and shareholders’ pro rata share of the trust account is $10.00/share, the SPAC has a gross spread of 3% (trading at a 3% discount). Yield to Liquidation: similar to a bond’s yield to maturity, SPACs have a yield to liquidation/redemption, which can be calculated using the gross spread and time to liquidation. Maturity: similar to a bond’s maturity date, SPAC also have a maturity, which is the defined time period in which they have to complete a business combination. This is referred to as the Liquidation or Redemption Date. Price refers to the price at which the ETF is currently trading. The sec yield is a standard yield calculation developed by the U.S. Securities and Exchange Commission (SEC) that allows for fairer comparisons of bond funds. It is based on the most recent 30-day period covered by the fund’s filings with the SEC. The yield figure reflects the
dividends and interest earned during the period after the deduction of the fund’s expenses. It is also referred to as the “standardized yield.” Weighted Average Life refers to the weighted average time until a portfolio of SPACs’ Liquidation or Redemption Dates.
All performance data greater than 1 year is annualized.
Diversification does not assure a profit nor protect against loss in a declining market.
A stock is a type of security that signifies ownership in a corporation and represents a claim on part of the corporation’s assets and earnings. A bond is a debt investment in which an investor loans money to an entity that borrows the fund for a defined period of time at a fixed interest rate. A stock may trade with more or less liquidity than a bond depending on the number of shares and bonds outstanding, the size of the company, and the demand for the securities. The Securities and Exchange Commission (SEC) does not approve, endorse, nor indemnify any security. Duration is a measure of the sensitivity of the price of a bond or other debt instrument to a change in interest rates.
Tax features may vary based on personal circumstances. Consult a tax professional for additional information.
The CrossingBridge Ultra-Short Duration Fund, CrossingBridge Low Duration High Yield Fund, CrossingBridge Responsible Credit Fund, and the RiverPark Strategic Income Fund are distributed by Quasar Distributors, LLC.
The CrossingBridge Pre-Merger SPAC ETF is distributed by Foreside Fund Services, LLC.
Management’s Discussion of Fund Performance and Analysis
CrossingBridge Low Duration High Yield Fund
(Unaudited)
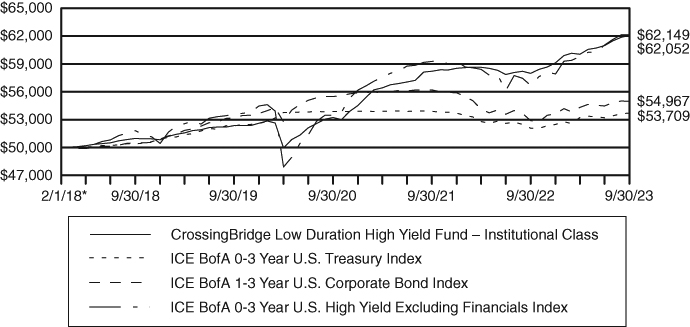
The 2023 fiscal year for the CrossingBridge Low Duration High Yield Fund (CBLDX; the “Fund”) covers the twelve-month period of October 1, 2022 through September 30, 2023. During the fiscal year, the Fund gained 7.02% on its Institutional Class shares while the ICE BofA 0-3 Year U.S. High Yield Excluding Financials Index gained 9.63%, the ICE BofA 1-3 Year U.S. Corporate Bond Index gained 3.93% and the ICE BofA 0-3 Year U.S. Treasury Index gained 3.14%.
Monthly investment results for the fiscal year ranged from -0.17% in March 2023 to 1.31% in January 2023. The Fund generated positive returns for eleven out of the twelve months during the fiscal year. The median monthly return for the fiscal year was 0.53% with an annualized standard deviation of 1.31%.
The Fund had positive contributions from interest income and had realized losses and unrealized gains during the fiscal year. 100% of the income was distributed for a 1-year dividend yield of 8.74%. The Fund’s subsidized 30-day SEC yield was 8.10% and unsubsidized 30-day SEC yield was 8.11%. The total return for the fiscal year was positive. Although the Fund’s NAV decreased from $9.84 on September 30, 2022 to $9.66 on September 30, 2023, this was offset by the Fund distributing $0.84 in income during the fiscal year.
Over the past year and a half, the Federal Reserve (the “Fed”) has been fully committed to quell out inflation and wring out excess liquidity. While the general market consensus was that the Fed was going to ‘pivot’ and begin cutting rates in mid-2023, we believed that not only would the Fed not pivot, but rather that inflation would be sticky and that we would be in a ‘higher for longer’ environment.
In our 2022 year-end quarterly commentary “Qué Será, Será – The Future’s Not Ours to See”, we discussed that we remained opportunistic and outlined our key themes and opportunities for 2023:
| | • | Although the market is not necessarily cheap, it is also not expensive. Opportunities will arise from uncertainty, volatility, flow of funds and a “day of reckoning” among borrowers. |
| | | |
| | • | Inflation is expected to decline but will remain. The Fed will continue rate increases. Although it may ultimately pause, the Fed won’t pivot unless systematic risk emerges. |
| | | |
| | • | Corporations are in pretty good shape, but the differences between the “haves” and the “have nots” are likely to widen. Regardless, profit margins will narrow. Inflation in the cost of raw materials and labor, as well as the Fed’s efforts to reduce demand, will pressure profit margins. |
| | | |
| | • | Higher interest rates have increased the cost of debt and reduced asset valuations. |
| | | |
| | • | The leveraged loan market will present opportunistic investments. Overall credit quality in the loan market has improved significantly since mid-2020, which should provide us with the opportunity to invest in leveraged loans that provide both better credit quality and higher yields, given the rise in rates. |
| | | |
| | • | Bond spreads are “middle of the road” – not cheap, not expensive – but provide improved return versus risk. |
With this as the backdrop as we entered 2023, we remained defensively positioned, maintaining attractive yields while keeping duration relatively low and holding significant
“dry powder”1 to take advantage of opportunities as they arise. As fixed core fixed income allocations continued to struggle throughout the year as rates continued to rise, our focus on selective bottom up credit selection and maintaining a low duration helped maintain steady and consistent returns for our investors. Our core philosophy as a firm is that “Return of Capital is more important that Return on Capital.” We are not absent of making mistakes, but in an environment where yields in short term credits are yielding in excess of 8-9%, we believe that by avoiding the potholes and being conservative and selective in credit selection, we can rely on fundamentals instead of making ‘bets’ on rates to try and deliver attractive risk-adjusted returns for our shareholders.
As of September 30, 2023, the Fund’s net assets were weighted by category as follows: 28.1% in Short Term Securities, 8.0% in Event Driven, 25.7% in Interest Rate Sensitive, 29.0% in Core Value, 6.7% in Credit Opportunities, with the remaining 2.6% in cash and cash equivalents.
1 | “Dry powder”, in the context of our portfolios, is defined as cash and investments that are expected to be repaid within 90 days as a result of call, redemption or maturity as well as pre-merger special purpose acquisition companies (SPACs). |
Opinions expressed are subject to change at any time, are not guaranteed and should not be considered investment advice.
Past performance does not guarantee future results.
Diversification does not assure a profit nor protect against risk in a declining market.
Fund holdings and sector allocation are subject to change at any time and should not be considered a recommendation to buy or sell any security. Please see the Schedule of Investments for complete Fund holdings.
*Definitions: The ICE BofA 0-3 Year U.S. High Yield Excluding Financials Index (HSNF) tracks the performance of short maturity U.S. dollar-denominated below investment grade rating (based on an average of Moody’s, S&P, and Fitch), at least 18 months to final maturity at the time of issuance, at least one month but less than three years remaining term to final maturity as of the rebalancing date, a fixed coupon schedule and minimum amount outstanding of $250 million. The ICE BofA 1-3 Year U.S. Corporate Bond Index (C1A0) is a subset of the ICE BofA U.S. Corporate Bond Index including all securities with a remaining term to final maturity less than three years. The ICE BofA 0-3 Year U.S. Treasury Index (G1QA) tracks the performance of U.S. dollar-denominated sovereign debt publicly issued by the U.S. government in its domestic market with maturities less than three years. The S&P 500, or simply the S&P, is a stock market index that measures the stock performance of 500 large companies listed on stock exchanges in the United States. The ICE BofA U.S. Corporate Bond Index tracks the performance of U.S. dollar-denominated investment grade rated corporate debt publicly issues in the U.S. domestic market. Standard Deviation is a statistical measure that is used to quantify the amount of variation or dispersion of a set of data values. Duration is the weighted average of the present value of the cash flows and is used as a measure of a bond price’s response to changes in yield. Rising interest rates mean falling bond prices, while declining interest rates mean rising bond prices. Dividend Yield expresses a percentage of a current share price. SEC yield is a standard yield calculation developed by the U.S. Securities and Exchange Commission (SEC) that allows for fairer comparisons of bond funds. It is based on the most recent 30-day period covered by the fund’s filings with the SEC. The yield figure reflects the dividends and interest earned during the period after the deduction of the fund’s expenses. It is also referred to as the “standardized yield.” Basis Point is one hundredth of one percent.
It is not possible to invest directly in an index.
Mutual fund investing involves risk. Principal loss is possible. Investments in foreign securities involve greater volatility and political, economic and currency risks and differences in accounting methods. Investments in debt securities typically decrease in value when interest rates rise. This risk is usually greater for longer-term debt securities. Investment in lower-rated and non-rated securities presents a greater risk of loss to principal and interest than higher-rated securities. The Fund may make short sales of securities, which involves the risk that losses may exceed the original amount invested. The Fund may invest in exchange-traded funds (“ETFs”) and exchange-traded notes (“ETNs”), which are subject to additional risks that do not apply to conventional mutual funds, including the risks that the market price of an ETF’s and ETN’s shares may trade at a discount to its net asset value (“NAV”), an active secondary trading market may not develop or be maintained, or trading may be halted by the exchange in which they trade, which may impact the Fund’s ability to sell the shares. The value of ETNs may be influenced by the level of supply and demand for the ETN, volatility and lack of liquidity. The Fund may invest in derivative securities, which derive their performance from the performance of an underlying asset, index, interest rate or currency exchange rate. Derivatives can be volatile and involve various types and degrees of risks, and, depending upon the characteristics of a particular derivative, suddenly can become illiquid. Investments in asset-backed, mortgage-backed, and collateralized mortgage-backed securities include additional risks that investors should be aware of such as credit risk, prepayment risk, possible illiquidity and default, as well as increased susceptibility to adverse economic developments. The Fund invests in equity securities and warrants of special purpose acquisition companies (“SPACs”) . Pre-combination SPACs have no operating history or ongoing business other than seeking a merger, share exchange, asset acquisition, share purchase negotiation or similar business combination (a “Combination”), and the value of their securities is particularly dependent on the ability of the entity’s management to identify and complete a profitable Combination. There is no guarantee that the SPACs in which the Fund invests will complete a Combination or that any Combination that is completed will be profitable. Unless and until a Combination is completed, a SPAC generally invests its assets in U.S. government securities, money market securities, and cash. Public stockholders of SPACs may not be afforded a meaningful opportunity to vote on a proposed initial Combination because certain stockholders, including stockholders affiliated with the management of the SPAC, may have sufficient voting power, and a financial incentive, to approve such a transaction without support from public stockholders. As a result, a SPAC may complete a Combination even though a majority of its public stockholders do not support such a Combination. Some SPACs may pursue Combinations only within certain industries or regions, which may increase the volatility of their prices. The Fund may invest in SPACs domiciled or listed outside of the U.S., including, but not limited to, Canada, the Cayman Islands, Bermuda and the Virgin Islands. Investments in SPACs domiciled or listed outside of the U.S. may involve risks not generally associated with investments in the securities of U.S. SPACs, such as risks relating to political, social, and economic developments abroad and differences between U.S. and foreign regulatory requirements and market practices. Further, tax treatment may differ from U.S. SPACs and securities may be subject of foreign withholding taxes. Smaller capitalization SPACs will have a more limited pool of companies with which they can pursue a business combination relative to larger capitalization companies. That may make it more difficult for a small capitalization SPAC to consummate a business combination.
Must be preceded or accompanied by a prospectus.
Distributor: Quasar Distributors, LLC.
Management’s Discussion of Fund Performance and Analysis
CrossingBridge Responsible Credit Fund
(Unaudited)
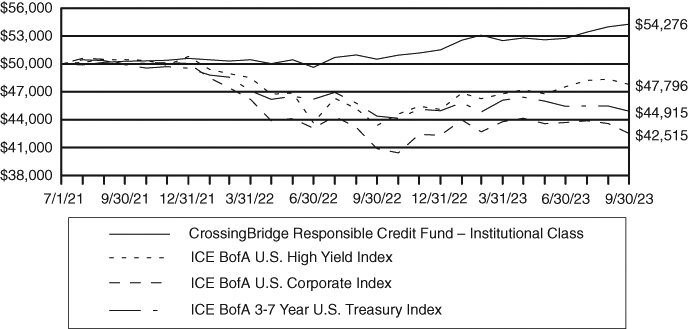
The 2023 fiscal year for the CrossingBridge Responsible Credit Fund (CBRDX; the “Fund”) covers the twelve-month period of October 1, 2022 through September 30, 2023. During the fiscal year, the Fund gained 7.45% on its Institutional Class shares while the ICE BofA U.S. High Yield Index gained 10.19%, the ICE BofA U.S. Corporate Index gained 3.99% and the ICE BofA 3-7 Year U.S. Treasury Index gained 1.19%.
Monthly investment results for the fiscal year ranged from -1.11% in March 2023 to 2.02% in January 2023. The Fund generated positive returns for ten out of the twelve months during the fiscal year. The median monthly return for the fiscal year was 0.61% with an annualized standard deviation of 2.75%.
The Fund had positive contributions from interest income and had realized capital losses and unrealized gains during the fiscal year. 100% of the income was distributed for a 1-year dividend yield of 10.31%. The Fund’s subsidized 30-day SEC yield was 7.82% and unsubsidized 30-day SEC yield was 7.07%. The total return for the fiscal year was positive. Although the Fund’s NAV decreased from $9.65 on September 30, 2022 to $9.36 on September 30, 2023, that decrease was more than offset as the Fund distributed $0.97 in income during the fiscal year.
Over the past year and a half, the Federal Reserve (the “Fed”) has been fully committed to quell out inflation and wring out excess liquidity. While the general market consensus was that the Fed was going to ‘pivot’ and begin cutting rates in mid-2023, we believed that not only would the Fed not pivot, but rather that inflation would be sticky and that we would be in a ‘higher for longer’ environment.
In our 2022 year-end quarterly commentary “Qué Será, Será – The Future’s Not Ours to See”, we discussed that we remained opportunistic and outlined our key themes and opportunities for 2023:
| | • | Although the market is not necessarily cheap, it is also not expensive. Opportunities will arise from uncertainty, volatility, flow of funds and a “day of reckoning” among borrowers. |
| | | |
| | • | Inflation is expected to decline but will remain. The Fed will continue rate increases. Although it may ultimately pause, the Fed won’t pivot unless systematic risk emerges. |
| | | |
| | • | Corporations are in pretty good shape, but the differences between the “haves” and the “have nots” are likely to widen. Regardless, profit margins will narrow. Inflation in the cost of raw materials and labor, as well as the Fed’s efforts to reduce demand, will pressure profit margins. |
| | | |
| | • | Higher interest rates have increased the cost of debt and reduced asset valuations. |
| | | |
| | • | The leveraged loan market will present opportunistic investments. Overall credit quality in the loan market has improved significantly since mid-2020, which should provide us with the opportunity to invest in leveraged loans that provide both better credit quality and higher yields, given the rise in rates. |
| | | |
| | • | Bond spreads are “middle of the road” – not cheap, not expensive – but provide improved return versus risk. |
With this as the backdrop as we entered 2023, we remained defensively positioned, maintaining attractive yields while keeping duration relatively low and holding significant
“dry powder”1 to take advantage of opportunities as they arise. As fixed core fixed income allocations continued to struggle throughout the year as rates continued to rise, our focus on selective bottom-up credit selection and maintaining a low duration helped maintain steady and consistent returns for our investors. Our core philosophy as a firm is that “Return of Capital is more important that Return on Capital.” We are not absent of making mistakes, but in an environment where yields in short term credits are yielding in excess of 8-9%, we believe that by avoiding the potholes and being conservative and selective in credit selection, we can rely on fundamentals instead of making ‘bets’ on rates to try and deliver attractive risk-adjusted returns for our shareholders.
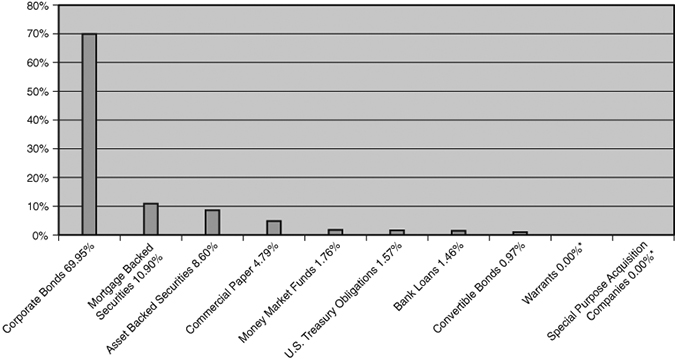
As of September 30, 2023, the Fund’s net assets were weighted by category as follows: 20.6% in Short Term Securities, 6.5% in Event Driven, 35.9% in Interest Rate Sensitive, 27.6% in Core Value, 7.9% in Credit Opportunities, with the remaining 1.5% in cash and cash equivalents.
1 | “Dry powder”, in the context of our portfolios, is defined as cash and investments that are expected to be repaid within 90 days as a result of call, redemption or maturity as well as pre-merger special purpose acquisition companies (SPACs). |
Opinions expressed are subject to change at any time, are not guaranteed and should not be considered investment advice.
Past performance does not guarantee future results.
The Fund is non-diversified under the Investment Company Act of 1940 Act, therefore allowing the Fund to be more concentrated than a diversified fund. Because the Fund is non-diversified it may invest a greater percentage of its assets in the securities of a single issuer or a smaller number of issuers than if it were a diversified fund. As a result, a decline in the value of an investment in a single issuer could cause the Fund’s overall value to decline to a greater degree than if the Fund held a more diversified portfolio. Current fund statistics may not be indicative of future positioning.
Fund holdings and sector allocation are subject to change at any time and should not be considered a recommendation to buy or sell any security. Please see the Schedule of Investments for complete Fund holdings.
Definitions: The ICE BofA U.S. High Yield Index (H0A0) tracks the performance of U.S. dollar-denominated below investment grade corporate debt publicly issued in the U.S. domestic market. The ICE BofA U.S. Corporate Index (C0A0) tracks the performance of U.S. dollar-denominated investment grade corporate debt publicly issued in the U.S. domestic market. The ICE BofA 3-7 Year U.S. Treasury Index (G30C) is a subset of ICE BofA U.S. Treasury Index including all securities with a remaining term to final maturity greater than or equal to 3 years and less than 7 years. Basis Point is one hundredth of one percent. Standard Deviation is a statistical measure of portfolio risk used to measure variability of total return around an average, over a specified period of time. The greater the standard deviation over the period, the wider the variability or range of returns and hence, the greater the fund’s volatility. The standard deviation has been calculated since inception and is annualized. Duration is the weighted average of the present value of the cash flows and is used as a measure of a bond price’s response to changes in yield. Rising interest rates mean falling bond prices, while declining interest rates mean rising bond prices. Dividend Yield expresses a percentage of a current share price. SEC yield is a standard yield calculation developed by the U.S. Securities and Exchange Commission (SEC) that allows for fairer comparisons of bond funds. It is based on the most recent 30-day period covered by the fund’s filings with the SEC. The yield figure reflects the dividends and interest earned during the period after the deduction of the fund’s expenses.
It is not possible to invest directly in an index.
Mutual fund investing involves risk. Principal loss is possible. Investments in foreign securities involve greater volatility and political, economic and currency risks and differences in accounting methods. Investments in debt securities typically decrease in value when interest rates rise. This risk is usually greater for longer-term debt securities. Investment in lower-rated and non-rated securities presents a greater risk of loss to principal and interest than higher-rated securities. The Fund may make short sales of securities, which involves the risk that losses may exceed the original amount invested. The Fund’s focus on sustainability considerations (ESG criteria) may limit the number of investment opportunities available to the Fund, and as a result, at times, the Fund may underperform funds that are not subject to similar investment considerations. The Fund invests in equity securities of special purpose acquisition companies (“SPACs”), which raise assets to seek potential business combination opportunities. Unless and until a business combination is completed, a SPAC generally invests its assets in U.S. government securities, money market securities, and cash. Because SPACs have no operating history or ongoing business other than seeking a business combination, the value of their securities is particularly dependent on the ability of the entity’s management to identify and complete a profitable business combination. There is no guarantee that the SPACs in which the Fund invests will complete a business combination or that any business combination that is completed will be profitable. The Fund is non-diversified meaning it may concentrate its assets in fewer individual holdings than a diversified fund. The Fund invests in equity securities and warrants of SPACs. Pre-combination SPACs have no operating history or ongoing business other than seeking a merger, share exchange, asset acquisition, share purchase negotiation or similar business combination (a “Combination”), and the value of their securities is particularly dependent on the ability of the entity’s management to identify and complete a profitable Combination. There is no guarantee that the SPACs in which the Fund invests will complete a Combination or that any Combination that is completed will be profitable. Unless and until a Combination is completed, a SPAC generally invests its assets in U.S. government securities, money market securities, and cash. Public stockholders of SPACs may not be afforded a meaningful opportunity to vote on a proposed initial Combination because certain stockholders, including stockholders affiliated with the management of the SPAC, may have sufficient voting power, and a financial incentive, to approve such a transaction without support from public stockholders. As a result, a SPAC may complete a Combination even though a majority of its public stockholders do not support such a Combination. Some SPACs may pursue Combinations only within certain industries or regions, which may increase the volatility of their prices. The Fund may invest in SPACs domiciled or listed outside of the U.S., including, but not limited to, Canada, the Cayman Islands, Bermuda and the Virgin Islands. Investments in SPACs domiciled or listed outside of the U.S. may involve risks not generally associated with investments in the securities of U.S. SPACs, such as risks relating to political, social, and economic developments abroad and differences between U.S. and foreign regulatory requirements and market practices. Further, tax treatment may differ from U.S. SPACs and securities may be subject of foreign withholding taxes. Smaller capitalization SPACs will have a more limited pool of companies with which they can pursue a business combination relative to larger capitalization companies. That may make it more difficult for a small capitalization SPAC to consummate a business combination.
Must be preceded or accompanied by a prospectus.
Distributor: Quasar Distributors, LLC.
Management’s Discussion of Fund Performance and Analysis
CrossingBridge Ultra-Short Duration Fund
(Unaudited)
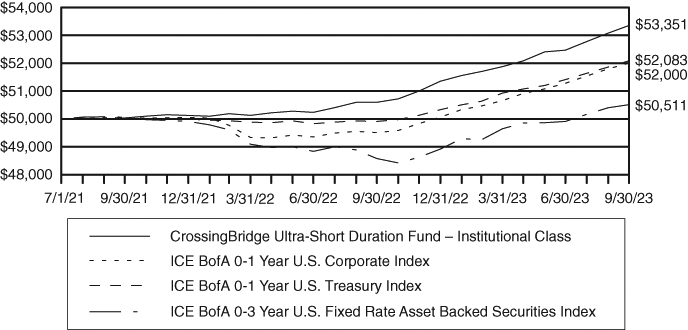
The 2023 fiscal year for the CrossingBridge Ultra-Short Duration Fund (CBUDX; the “Fund”) covers the twelve-month period of October 1, 2022 through September 30, 2023. During the fiscal year, the Fund gained 5.44% on its Institutional Class shares while the ICE BofA 0-1 Year U.S. Corporate Index gained 5.03%, the ICE BofA 0-1 Year U.S. Treasury Index gained 4.35% and the ICE BofA 0-3 Year U.S. Fixed Rate Asset Backed Securities Index gained 3.98%.
Monthly investment results for the fiscal year ranged from 0.12% in June 2023 to 0.70% in December 2022. The Fund generated positive returns for all twelve months during the fiscal year. The median monthly return for the fiscal year was 0.46% with an annualized standard deviation of 0.61%
The Fund had positive contributions from interest income and had realized losses and unrealized gains during the fiscal year. 100% of the income was distributed for a 1-year dividend yield of 5.95%. The Fund’s subsidized 30-day SEC yield was 6.57% and unsubsidized 30-day SEC yield was 6.41%. The total return for the fiscal year was positive. Although the Fund’s NAV decreased from $9.97 on September 30, 2022 to $9.91 on September 30, 2023, this was more than offset by the distribution of $0.59 of income during the fiscal year.
Over the past year and a half, the Federal Reserve (the “Fed”) has been fully committed to quell out inflation and wring out excess liquidity. While the general market consensus was that the Fed was going to ‘pivot’ and begin cutting rates in mid-2023, we believed that not only would the Fed not pivot, but rather that inflation would be sticky and that we would be in a ‘higher for longer’ environment.
In our 2022 year-end quarterly commentary “Qué Será, Será – The Future’s Not Ours to See”, we discussed that we remained opportunistic and outlined our key themes and opportunities for 2023:
| | • | Although the market is not necessarily cheap, it is also not expensive. Opportunities will arise from uncertainty, volatility, flow of funds and a “day of reckoning” among borrowers. |
| | | |
| | • | Inflation is expected to decline but will remain. The Fed will continue rate increases. Although it may ultimately pause, the Fed won’t pivot unless systematic risk emerges. |
| | | |
| | • | Corporations are in pretty good shape, but the differences between the “haves” and the “have nots” are likely to widen. Regardless, profit margins will narrow. Inflation in the cost of raw materials and labor, as well as the Fed’s efforts to reduce demand, will pressure profit margins. |
| | | |
| | • | Higher interest rates have increased the cost of debt and reduced asset valuations. |
| | | |
| | • | The leveraged loan market will present opportunistic investments. Overall credit quality in the loan market has improved significantly since mid-2020, which should provide us with the opportunity to invest in leveraged loans that provide both better credit quality and higher yields, given the rise in rates. |
| | | |
| | • | Bond spreads are “middle of the road” – not cheap, not expensive – but provide improved return versus risk. |
With this as the backdrop as we entered 2023, we remained defensively positioned, maintaining attractive yields while keeping duration relatively low and holding significant
“dry powder”1 to take advantage of opportunities as they arise. As fixed core fixed income allocations continued to struggle throughout the year as rates continued to rise, our focus on selective bottom up credit selection and maintaining a low duration helped maintain steady and consistent returns for our investors. Our core philosophy as a firm is that “Return of Capital is more important that Return on Capital.” We are not absent of making mistakes, but in an environment where yields in short term credits are yielding in excess of 8-9%, we believe that by avoiding the potholes and being conservative and selective in credit selection, we can rely on fundamentals instead of making ‘bets’ on rates to try and deliver attractive risk-adjusted returns for our shareholders.
Especially within an ultra-short duration portfolio, CrossingBridge stresses preservation of capital rather than chasing yield. Per the Fund’s prospectus, CrossingBridge manages interest rate risk by maintaining an average portfolio duration of 1 or less by investing in short-term, medium-term, and floating rate securities. As a result, the Fund was well insulated from the steep rise in rates. In addition, although the Fund has no restrictions as to credit quality, the intention is that the Fund will maintain a minimum of at least 65% of the portfolio in investment grade securities, further insulating the Fund in the difficult fixed income environment. As of September 30, 2023, the Fund had 70.85% of the portfolio in investment grade securities. As rates have continued to rise and the market has become more bifurcated, we believe the opportunity set for the Fund remains.
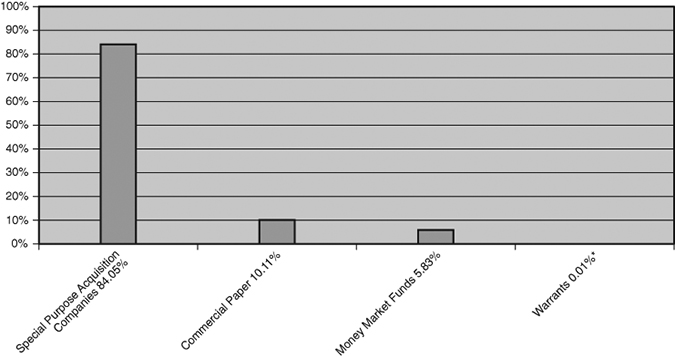
As of September 30, 2023, the Fund’s net assets were weighted by category as follows: 33.2% in Short Term Securities, 5.3% in Event Driven, 18.1% in Interest Rate Sensitive, 42.9% in Core Value, 0.0% in Credit Opportunities, with the remaining 0.5% in cash and cash equivalents.
1 | “Dry powder”, in the context of our portfolios, is defined as cash and investments that are expected to be repaid within 90 days as a result of call, redemption or maturity as well as pre-merger special purpose acquisition companies (SPACs). |
Opinions expressed are subject to change at any time, are not guaranteed and should not be considered investment advice.
Past performance does not guarantee future results.
Diversification does not assure a profit nor protect against risk in a declining market.
Fund holdings and sector allocation are subject to change at any time and should not be considered a recommendation to buy or sell any security. Please see the Schedule of Investments for complete Fund holdings.
*Definitions: The ICE BofA 0-1 Year U.S. Corporate Index (H540) tracks the performance of short-maturity U.S. dollar- denominated investment grade corporate debt publicly issued in the U.S. domestic market. The ICE BofA 0-1 Year U.S. Treasury Index (G0QA) tracks the performance of U.S. dollar-denominated sovereign debt publicly issued by the U.S. government in its domestic market with maturities less than a year. The ICE BofA 0-3 Year U.S. Fixed Rate Asset Backed Securities Index (R1A0) is a subset of ICE BofA U.S. Fixed Rate Asset Backed Securities Index including all securities with an average life less than 3 years. Duration is the weighted average of the present value of the cash flows and is used as a measure of a bond price’s response to changes in yield. Rising interest rates mean falling bond prices, while declining interest rates mean rising bond prices. Standard Deviation is a statistical measure of portfolio risk used to measure variability of total return around an average, over a specified period of time. The greater the standard deviation over the period, the wider the variability or range of returns and hence, the greater the fund’s volatility. The standard deviation has been calculated since inception and is annualized. Dividend Yield expresses
a percentage of a current share price. SEC yield is a standard yield calculation developed by the U.S. Securities and Exchange Commission (SEC) that allows for fairer comparisons of bond funds. It is based on the most recent 30-day period covered by the fund’s filings with the SEC. The yield figure reflects the dividends and interest earned during the period after the deduction of the fund’s expenses.
It is not possible to invest directly in an index.
Mutual fund investing involves risk. Principal loss is possible. Investments in foreign securities involve greater volatility and political, economic and currency risks and differences in accounting methods. Investments in debt securities typically decrease in value when interest rates rise. This risk is usually greater for longer-term debt securities. Investment in lower-rated and non-rated securities presents a greater risk of loss to principal and interest than higher-rated securities. The fund may make short sales of securities, which involves the risk that losses may exceed the original amount invested. The Fund invests in equity securities and warrants of special purpose acquisition companies (“SPACs”). Pre-combination SPACs have no operating history or ongoing business other than seeking a merger, share exchange, asset acquisition, share purchase negotiation or similar business combination (a “Combination”), and the value of their securities is particularly dependent on the ability of the entity’s management to identify and complete a profitable Combination. There is no guarantee that the SPACs in which the Fund invests will complete a Combination or that any Combination that is completed will be profitable. Unless and until a Combination is completed, a SPAC generally invests its assets in U.S. government securities, money market securities, and cash. Public stockholders of SPACs may not be afforded a meaningful opportunity to vote on a proposed initial Combination because certain stockholders, including stockholders affiliated with the management of the SPAC, may have sufficient voting power, and a financial incentive, to approve such a transaction without support from public stockholders. As a result, a SPAC may complete a Combination even though a majority of its public stockholders do not support such a Combination. Some SPACs may pursue Combinations only within certain industries or regions, which may increase the volatility of their prices. The Fund may invest in SPACs domiciled or listed outside of the U.S., including, but not limited to, Canada, the Cayman Islands, Bermuda and the Virgin Islands. Investments in SPACs domiciled or listed outside of the U.S. may involve risks not generally associated with investments in the securities of U.S. SPACs, such as risks relating to political, social, and economic developments abroad and differences between U.S. and foreign regulatory requirements and market practices. Further, tax treatment may differ from U.S. SPACs and securities may be subject of foreign withholding taxes. Smaller capitalization SPACs will have a more limited pool of companies with which they can pursue a business combination relative to larger capitalization companies. That may make it more difficult for a small capitalization SPAC to consummate a business combination.
Must be preceded or accompanied by a prospectus.
Distributor: Quasar Distributors, LLC.
Management’s Discussion of Fund Performance and Analysis
CrossingBridge Pre-Merger SPAC ETF
(Unaudited)
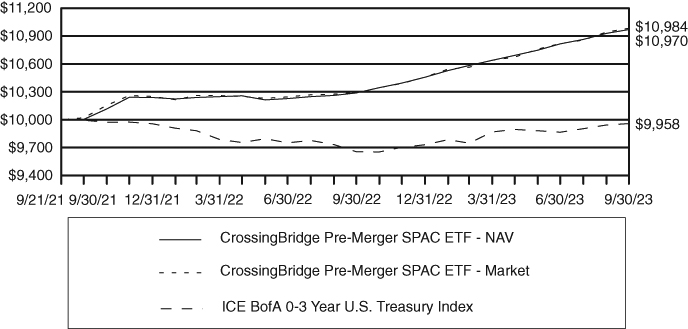
The 2023 fiscal year for the CrossingBridge Pre-Merger SPAC ETF (SPC; the “Fund”) covers the twelve-month period of October 1, 2022 through September 30, 2023. During the fiscal year, the Fund had a NAV return of 6.63% and a market return of 6.74%. The Fund’s market return of 6.74% compared favorably to the ICE BofA 0-3 Year U.S. Treasury Index’s gain of 3.14%. The Fund had realized and unrealized gains during the fiscal year. The total return for the period was higher as the market price increased from $20.56 on September 30, 2022 to $21.72 on September 30, 2023, while the NAV increased from $20.56 to $21.69 for the fiscal year.
Special Purpose Acquisition Companies (SPACs) behave like floating rate fixed income securities due to their IPO proceeds being placed in a trust account typically invested in ultra-short term U.S. government securities for the benefit of SPAC shareholders. As rates went up for U.S. Treasuries, so did the accrual on funds held in SPAC trust accounts. Active management, now more than ever, plays a key role in the strategy’s success as many SPACs trade at a negative spread to U.S. Treasuries after considering fees and any taxes on interest earned that we model. Over the last 12 months we have seen a net decrease in the size of the SPAC market as we have entered a more normalized period where ‘SPAC-mania’ has subsided. That being said, we still see an ample and attractive set of opportunities within the space that we believe will allow the strategy to continue to serve as an attractive enhanced cash alternative product. We believe the greatest opportunities in the space lie around: new issues where terms have attractive effective yields, extensions where SPAC sponsors will pay up for more time to complete a deal, as well as trading opportunities.
Opinions expressed are subject to change at any time, are not guaranteed and should not be considered investment advice.
Past performance does not guarantee future results.
Diversification does not assure a profit nor protect against risk in a declining market.
Fund holdings and sector allocation are subject to change at any time and should not be considered a recommendation to buy or sell any security. Please see the Schedule of Investments for complete Fund holdings.
*Definitions: The ICE BofA 0-3 Year U.S. Treasury Index tracks the performance of U.S. dollar-denominated sovereign debt publicly issued by the U.S. government in its domestic market with maturities less than three years. Weighted Average Yield: similar to a bond’s Yield to Maturity, SPACs have a Yield to Liquidation/Redemption, which can be calculated using the Gross Spread and Time to Liquidation. Weighted Average Maturity: Similar to a bond’s maturity date, SPACs also have a maturity, which is the defined time period in which they have to complete a business combination. This is referred to as the Liquidation or Redemption Date.
It is not possible to invest directly in an index.
Investing involves risk; Principal loss is possible. The Fund invests in equity securities and warrants of SPACs. Pre-combination SPACs have no operating history or ongoing business other than seeking a merger, share exchange, asset acquisition, share purchase negotiation or similar business combination (a “Combination”), and the value of their securities is particularly dependent on the ability of the entity’s management to identify and complete a profitable Combination. There is no guarantee that the SPACs in which the Fund invests will complete a Combination or that any Combination that is completed will be profitable. Unless and until a Combination is completed, a SPAC generally invests
its assets in U.S. government securities, money market securities, and cash. Public stockholders of SPACs may not be afforded a meaningful opportunity to vote on a proposed initial Combination because certain stockholders, including stockholders affiliated with the management of the SPAC, may have sufficient voting power, and a financial incentive, to approve such a transaction without support from public stockholders. As a result, a SPAC may complete a Combination even though a majority of its public stockholders do not support such a Combination. Some SPACs may pursue Combinations only within certain industries or regions, which may increase the volatility of their prices. The Fund may invest in SPACs domiciled or listed outside of the U.S., including, but not limited to, Canada, the Cayman Islands, Bermuda and the Virgin Islands. Investments in SPACs domiciled or listed outside of the U.S. may involve risks not generally associated with investments in the securities of U.S. SPACs, such as risks relating to political, social, and economic developments abroad and differences between U.S. and foreign regulatory requirements and market practices. Further, tax treatment may differ from U.S. SPACs and securities may be subject of foreign withholding taxes. Smaller capitalization SPACs will have a more limited pool of companies with which they can pursue a business combination relative to larger capitalization companies. That may make it more difficult for a small capitalization SPAC to consummate a business combination. Because the Fund is non-diversified it may invest a greater percentage of its assets in the securities of a single issuer or a smaller number of issuers than if it were a diversified fund. As a result, a decline in the value of an investment in a single issuer could cause the Fund’s overall value to decline to a greater degree than if the Fund held a more diversified portfolio.
Must be preceded or accompanied by a prospectus.
Distributor: Foreside Fund Services, LLC.
Management’s Discussion of Fund Performance and Analysis
RiverPark Strategic Income Fund
(Unaudited)
Effective on May 12, 2023, the RiverPark Strategic Income Fund, a series of RiverPark Funds Trust (the “Predecessor Fund”), reorganized into the RiverPark Strategic Income Fund, a series of Trust for Professional Managers (RSIIX/RSIVX; the “Fund”). RiverPark Advisors, LLC served as the investment adviser to the Predecessor Fund and Cohanzick Management, LLC (“Cohanzick”) served as the investment sub-adviser to the Predecessor Fund. Following the reorganization, CrossingBridge Advisors, LLC, an affiliate of Cohanzick, assumed the role of investment adviser to the Fund. The Fund has adopted accounting and performance history of the Predecessor Fund.
The 2023 fiscal year for the Fund covers the twelve-month period of October 1, 2022 through September 30, 2023. During the fiscal year, the Fund gained 6.55% on its Institutional Class shares and 6.30% on its Retail Class shares while the ICE BofA U.S. High Yield Index gained 10.19%, the ICE BofA U.S. Corporate Index gained 3.99% and the ICE BofA 3-7 Year U.S. Treasury Index gained 1.19%.
Monthly investment results for the fiscal year for the Institutional Class shares ranged from -0.47% in March 2023 to 1.72% in January 2023. Monthly investment results for the fiscal year for the Retail Class shares ranged from -0.49% in March 2023 to 1.69% in January 2023. The Institutional Class shares generated positive returns for ten out of the twelve months during the fiscal year while the Retail Class shares generated positive returns for nine of the twelve months during the fiscal year. For the Institutional Class shares, the median monthly return for the fiscal year was 0.55% with an annualized standard deviation of 3.18%. For the Retail Class shares, the median monthly return for the fiscal year was 0.54% with an annualized standard deviation of 2.12%.
The Fund had positive contributions from interest income and had realized losses and unrealized gains during the fiscal year. 100% of the income was distributed for a 1-year dividend yield of 8.34% for the Institutional Class shares, and 8.04% for Retail Class shares. For the Institutional Class shares, the subsidized 30-day SEC yield was 8.25% and unsubsidized 30-day SEC yield was 8.25%. For the Retail Class shares, the subsidized 30-day SEC yield was 7.99% and unsubsidized 30-day SEC yield was 7.99%. For both share classes, the total return for the fiscal year was positive. The Institutional Class shares NAV decreased from $8.71 on September 30, 2022 to $8.54 on September 30, 2022, but was offset by the Fund distributing $0.71 in income during the fiscal year. The Retail Class shares NAV decreased from $8.72 on September 30, 2022 to $8.56 on September 30, 2023, but was offset by the Fund distributing $0.69 in income during the fiscal year.
Over the past year and a half, the Federal Reserve (the “Fed”) has been fully committed to quell out inflation and wring out excess liquidity. While the general market consensus was that the Fed was going to ‘pivot’ and begin cutting rates in mid-2023, we believed that not only would the Fed not pivot, but rather that inflation would be sticky and that we would be in a ‘higher for longer’ environment.
In our 2022 year-end quarterly commentary “Qué Será, Será – The Future’s Not Ours to See”, we discussed that we remained opportunistic and outlined our key themes and opportunities for 2023:
| | • | Although the market is not necessarily cheap, it is also not expensive. Opportunities will arise from uncertainty, volatility, flow of funds and a “day of reckoning” among borrowers. |
| | • | Inflation is expected to decline but will remain. The Fed will continue rate increases. Although it may ultimately pause, the Fed won’t pivot unless systematic risk emerges. |
| | | |
| | • | Corporations are in pretty good shape, but the differences between the “haves” and the “have nots” are likely to widen. Regardless, profit margins will narrow. Inflation in the cost of raw materials and labor, as well as the Fed’s efforts to reduce demand, will pressure profit margins. |
| | | |
| | • | Higher interest rates have increased the cost of debt and reduced asset valuations. |
| | | |
| | • | The leveraged loan market will present opportunistic investments. Overall credit quality in the loan market has improved significantly since mid-2020, which should provide us with the opportunity to invest in leveraged loans that provide both better credit quality and higher yields, given the rise in rates. |
| | | |
| | • | Bond spreads are “middle of the road” – not cheap, not expensive – but provide improved return versus risk. |
With this as the backdrop as we entered 2023, we remained defensively positioned, maintaining attractive yields while keeping duration relatively low and holding significant “dry powder”1 to take advantage of opportunities as they arise. As fixed core fixed income allocations continued to struggle throughout the year as rates continued to rise, our focus on selective bottom-up credit selection and maintaining a low duration helped maintain steady and consistent returns for our investors. Our core philosophy as a firm is that “Return of Capital is more important that Return on Capital.” We are not absent of making mistakes, but in an environment where yields in short term credits are yielding in excess of 8-9%, we believe that by avoiding the potholes and being conservative and selective in credit selection, we can rely on fundamentals instead of making ‘bets’ on rates to try and deliver attractive risk-adjusted returns for our shareholders.
As of September 30, 2023, the Fund’s net assets were weighted by category as follows: 26.2% in Short Term Securities, 8.7% in Buy & Hold “Money Good”, 7.2% in Priority Based (“Above the Fray”), 7.4% in Off the Beaten Path, 22.3% in Interest Rate Resets (Floating Rate Debt, Cushion Bonds), 7.7% in Asset Backed Securities (ABS), 0.9% in Stressed, 1.0% in Distressed, 2.0% in Equity, -1.5% in Hedges, with the remaining 6.5% in cash and cash equivalents.
| 1 | “Dry powder”, in the context of our portfolios, is defined as cash and investments that are expected to be repaid within 90 days as a result of call, redemption or maturity as well as pre-merger special purpose acquisition companies (SPACs). |
Opinions expressed are subject to change at any time, are not guaranteed and should not be considered investment advice.
Past performance does not guarantee future results.
Diversification does not assure a profit nor protect against risk in a declining market.
Fund holdings and sector allocation are subject to change at any time and should not be considered a recommendation to buy or sell any security. Please see the Schedule of Investments for complete Fund holdings.
Definitions: The ICE BofA U.S. High Yield Index (H0A0) tracks the performance of U.S. dollar-denominated below investment grade corporate debt publicly issued in the U.S. domestic market. The ICE BofA U.S. Corporate Index (C0A0) tracks the performance of U.S. dollar-denominated
investment grade corporate debt publicly issued in the U.S. domestic market. The ICE BofA 3-7 Year U.S. Treasury Index (G30C) is a subset of ICE BofA U.S. Treasury Index including all securities with a remaining term to final maturity greater than or equal to 3 years and less than 7 years. Basis Point is one hundredth of one percent. Standard Deviation is a statistical measure of portfolio risk used to measure variability of total return around an average, over a specified period of time. The greater the standard deviation over the period, the wider the variability or range of returns and hence, the greater the fund’s volatility. The standard deviation has been calculated since inception and is annualized. Duration is the weighted average of the present value of the cash flows and is used as a measure of a bond price’s response to changes in yield. Rising interest rates mean falling bond prices, while declining interest rates mean rising bond prices. Dividend Yield expresses a percentage of a current share price. SEC yield is a standard yield calculation developed by the U.S. Securities and Exchange Commission (SEC) that allows for fairer comparisons of bond funds. It is based on the most recent 30-day period covered by the fund’s filings with the SEC. The yield figure reflects the dividends and interest earned during the period after the deduction of the fund’s expenses.
Please note, terms used such as Buy & Hold “Money Good”, Off the Beaten Path and Priority Based (“Above the Fray”) are internal terms used by the Adviser to categorize certain investments.
It is not possible to invest directly in an index.
Mutual fund investing involves risk. Principal loss is possible. Investments in foreign securities involve greater volatility and political, economic and currency risks and differences in accounting methods. Investments in debt securities typically decrease in value when interest rates rise. This risk is usually greater for longer-term debt securities. Investment in lower-rated and non-rated securities presents a greater risk of loss to principal and interest than higher-rated securities. The Fund may make short sales of securities, which involves the risk that losses may exceed the original amount invested. The Fund may invest in exchange-traded funds (“ETFs”) and exchange-traded notes (“ETNs”), which are subject to additional risks that do not apply to conventional mutual funds, including the risks that the market price of an ETF’s and ETN’s shares may trade at a discount to its net asset value (“NAV”), an active secondary trading market may not develop or be maintained, or trading may be halted by the exchange in which they trade, which may impact the Fund’s ability to sell the shares. The value of ETNs may be influenced by the level of supply and demand for the ETN, volatility and lack of liquidity. The Fund may invest in derivative securities, which derive their performance from the performance of an underlying asset, index, interest rate or currency exchange rate. Derivatives can be volatile and involve various types and degrees of risks, and, depending upon the characteristics of a particular derivative, suddenly can become illiquid. Investments in asset-backed, mortgage-backed, and collateralized mortgage-backed securities include additional risks that investors should be aware of such as credit risk, prepayment risk, possible illiquidity and default, as well as increased susceptibility to adverse economic developments. The Fund invests in equity securities and warrants of special purpose acquisition companies (“SPACs”) . Pre-combination SPACs have no operating history or ongoing business other than seeking a merger, share exchange, asset acquisition, share purchase negotiation or similar business combination (a “Combination”), and the value of their securities is particularly dependent on the ability of the entity’s management to identify and complete a profitable Combination. There is no guarantee that the SPACs in which the Fund invests will complete a Combination or that any Combination that is completed will be profitable. Unless and until a Combination is completed, a SPAC generally invests its assets in U.S. government securities, money market securities, and cash. Public stockholders of SPACs may not be afforded a meaningful opportunity to vote on a proposed initial Combination because certain stockholders, including stockholders affiliated with the management of the SPAC, may have sufficient voting power, and a financial incentive, to approve such a transaction without support from public stockholders. As a result, a SPAC may complete a Combination even though a majority of its public stockholders do not support such a Combination. Some SPACs may pursue Combinations only within certain industries or regions, which may increase the volatility of their prices. The Fund may invest in SPACs
domiciled or listed outside of the U.S., including, but not limited to, Canada, the Cayman Islands, Bermuda and the Virgin Islands. Investments in SPACs domiciled or listed outside of the U.S. may involve risks not generally associated with investments in the securities of U.S. SPACs, such as risks relating to political, social, and economic developments abroad and differences between U.S. and foreign regulatory requirements and market practices. Further, tax treatment may differ from U.S. SPACs and securities may be subject of foreign withholding taxes. Smaller capitalization SPACs will have a more limited pool of companies with which they can pursue a business combination relative to larger capitalization companies. That may make it more difficult for a small capitalization SPAC to consummate a business combination.
Must be preceded or accompanied by a prospectus.
Distributor: Quasar Distributors, LLC.
CROSSINGBRIDGE FUNDS
Expense Example
(Unaudited)
As a shareholder of the CrossingBridge Low Duration High Yield Fund, CrossingBridge Responsible Credit Fund, CrossingBridge Ultra-Short Duration Fund and RiverPark Strategic Income Fund, you incur two types of costs: (1) transaction costs and (2) ongoing costs, including management fees, distribution (12b-1) fees (Retail Class Shares only), shareholder servicing plan fees and other Fund expenses. As a shareholder of the CrossingBridge Pre-Merger SPAC ETF, you incur two types of costs: (1) transaction costs, including brokerage commissions paid on purchases and sales of the Fund’s shares, and (2) ongoing costs, including management fees of the Fund. The Example is intended to help you understand your ongoing costs (in dollars) of investing in the Funds and to compare these costs with the ongoing costs of investing in other funds. The Example is based on an investment of $1,000 invested at the beginning of the respective period disclosed in the following table and held for the entire respective period disclosed in the following table.
Actual Expenses
The first line under each Fund in the following table provides information about actual account values and actual expenses for each Fund. You may use the information in this line, together with the amount you invested, to estimate the expenses that you paid over the period. Simply divide your account value by $1,000 (for example, an $8,600 account value divided by $1,000 = 8.6), then multiply the result by the number in the first line under the heading entitled “Expenses Paid During Period” to estimate the expenses you paid on your account during this period.
Hypothetical Example for Comparison Purposes
The second line under each Fund in the following table provides information about hypothetical account values and hypothetical expenses based on each Fund’s actual expense ratio and an assumed rate of return of 5% per year before expenses, which is not the Fund’s actual return. The hypothetical account values and expenses may not be used to estimate the actual ending account balance or expenses you paid for the period. You may use this information to compare the ongoing costs of investing in the Funds and other funds. To do so, compare this 5% hypothetical example with the 5% hypothetical examples that appear in the shareholder reports of other funds. Please note that the expenses shown in the table are meant to highlight your ongoing costs only and do not reflect any transactional costs, such as sales charges (loads), redemption fees or exchange fees. Therefore, the second line of the table is useful in comparing ongoing costs only, and will not help you determine the relative total costs of owning different funds. In addition, if these transactional costs were included, your costs would have been higher.
CROSSINGBRIDGE FUNDS
Expense Example (Continued)
(Unaudited)
| | | Beginning | Ending | |
| | Annualized | Account Value | Account Value | Expenses |
| | Expense | April 1, | September 30, | Paid During |
| | Ratio | 2023 | 2023 | Period* |
| CrossingBridge | | | | |
| Low Duration High Yield Fund | | | | |
| Institutional Class | | | | |
| Based on actual fund return | 0.90% | $1,000.00
| $1,033.50
| $4.59
|
| Based on hypothetical 5% return | 0.90% | 1,000.00 | 1,020.56 | 4.56 |
| | | | | |
| CrossingBridge | | | | |
| Responsible Credit Fund | | | | |
| Institutional Class | | | | |
| Based on actual fund return | 0.90% | 1,000.00 | 1,033.70 | 4.59 |
| Based on hypothetical 5% return | 0.90% | 1,000.00 | 1,020.56 | 4.56 |
| | | | | |
| CrossingBridge | | | | |
| Ultra-Short Duration Fund | | | | |
| Institutional Class | | | | |
| Based on actual fund return | 0.90% | 1,000.00 | 1,028.40 | 4.58 |
| Based on hypothetical 5% return | 0.90% | 1,000.00 | 1,020.56 | 4.56 |
| | | | | |
| CrossingBridge | | | | |
| Pre-Merger SPAC ETF | | | | |
| Based on actual fund return | 0.80% | 1,000.00 | 1,031.10 | 4.07 |
| Based on hypothetical 5% return | 0.80% | 1,000.00 | 1,021.06 | 4.05 |
| | | | | |
| RiverPark | | | | |
| Strategic Income Fund | | | | |
| Institutional Class | | | | |
| Based on actual fund return | 0.93% | 1,000.00 | 1,041.60 | 4.76 |
| Based on hypothetical 5% return | 0.93% | 1,000.00 | 1,020.41 | 4.71 |
| | | | | |
| RiverPark | | | | |
| Strategic Income Fund | | | | |
| Retail Class | | | | |
| Based on actual fund return | 1.19% | 1,000.00 | 1,040.50 | 6.09 |
| Based on hypothetical 5% return | 1.19% | 1,000.00 | 1,019.10 | 6.02 |
| * | Expenses are calculated using the Fund’s annualized expense ratio, multiplied by the average account value over the period, multiplied by the number of days in the period (183 days), divided by 365 days to reflect the six month period ended September 30, 2023. |
CROSSINGBRIDGE LOW DURATION HIGH YIELD FUND
Investment Highlights
(Unaudited)
The Fund seeks high current income and capital appreciation consistent with the preservation of capital using a low duration mandate. The allocation of portfolio holdings as of September 30, 2023 is as follows:
Allocation of Portfolio Holdings
(% of Investments)
* Less than 0.05%.
Average Annual Total Returns as of September 30, 2023
| | One | Three | Five | Since |
| | Year | Years | Years | February 1, 20181 |
| Institutional Class Shares | 7.02% | 5.25% | 4.01% | 3.89% |
| ICE BofA 0-3 Year U.S. High Yield | | | | |
| Excluding Financials Index | 9.63% | 5.14% | 3.70% | 3.91% |
| ICE BofA 0-3 Year | | | | |
| U.S. Treasury Index | 3.14% | -0.10% | 1.29% | 1.27% |
| ICE BofA 1-3 Year | | | | |
| U.S. Corporate Bond Index | 3.93% | -0.31% | 1.71% | 1.69% |
1 Commencement of investment operations.
Performance data quoted represents past performance and does not guarantee future results. The investment return and principal value of an investment will fluctuate so that an investor’s shares, when redeemed, may be worth more or less than their original cost. Current performance of the Fund may be lower or higher than the performance quoted. Performance data current to the most recent month-end may be obtained by calling 1-888-898-2780.
Investment performance reflects fee waivers in effect. In the absence of such waivers, total returns would be reduced.
CROSSINGBRIDGE LOW DURATION HIGH YIELD FUND
Investment Highlights (Continued)
(Unaudited)
The returns shown assume reinvestment of Fund distributions and do not reflect the deduction of taxes that a shareholder would pay on Fund distributions or the redemption of Fund shares. The following graph illustrates performance of a hypothetical investment made in the Fund and the Fund’s primary benchmark index, the ICE BofA 0-3 Year U.S. High Yield Excluding Financials Index, as well as other broad-based securities indices on the Fund’s inception date. The graph does not reflect any future performance. ICE BofA 0-3 Year U.S. High Yield Excluding Financials Index is a subset of ICE BofA 0-3 Year U.S. High Yield Index excluding sector level 2 Financial issuers. ICE BofA 0-3 Year U.S. Treasury Index tracks the performance of U.S. dollar denominated sovereign debt publicly issued by the U.S. government in its domestic market with maturities less than three years. Qualifying securities must have at least 18 months to maturity at point of issuance, at least one month and less than three years remaining term to final maturity, a fixed coupon schedule and minimum amount outstanding of $1 billion. ICE BofA 1-3 Year U.S. Corporate Bond Index is a subset of ICE BofA U.S. Corporate Bond Index including all securities with a remaining term to final maturity less than 3 years. It is not possible to invest directly in an index.
Growth of $50,000 Investment
* Commencement of investment operations.
CROSSINGBRIDGE RESPONSIBLE CREDIT FUND
Investment Highlights
(Unaudited)
The Fund seeks high current income and capital appreciation consistent with the preservation of capital by investing in fixed income securities that meet the responsible investing criteria of the Fund’s investment adviser. The allocation of portfolio holdings as of September 30, 2023 is as follows:
Allocation of Portfolio Holdings
(% of Investments)
Average Annual Total Returns as of September 30, 2023
| | One | Since |
| | Year | June 30, 20211 |
| Institutional Class Shares | 7.45% | 3.71% |
| ICE BofA U.S. High Yield Index | 10.19% | -1.98% |
| ICE BofA 3-7 Year U.S. Treasury Index | 1.19% | -4.65% |
| ICE BofA U.S. Corporate Index | 3.99% | -6.95% |
1 Commencement of investment operations.
Performance data quoted represents past performance and does not guarantee future results. The investment return and principal value of an investment will fluctuate so that an investor’s shares, when redeemed, may be worth more or less than their original cost. Current performance of the Fund may be lower or higher than the performance quoted. Performance data current to the most recent month end may be obtained by calling 1-888-898-2780.
Investment performance reflects fee waivers in effect. In the absence of such waivers, total returns would be reduced.
CROSSINGBRIDGE RESPONSIBLE CREDIT FUND
Investment Highlights (Continued)
(Unaudited)
The returns shown assume reinvestment of Fund distributions and do not reflect the deduction of taxes that a shareholder would pay on Fund distributions or the redemption of Fund shares. The following graph illustrates performance of a hypothetical investment made in the Fund and the Fund’s primary benchmark index, the ICE BofA U.S. High Yield Index, as well as other broad-based securities indices on the Fund’s inception date. ICE BofA 3-7 Year U.S. Treasury Index measures the performance of public obligations of the U.S. Treasury that have a remaining maturity of greater than 3 years and less than or equal to 7 years. ICE BofA U.S. Corporate Index is an unmanaged index comprised of U.S. dollar denominated investment grade, fixed rate corporate debt securities publicly issued in the U.S. domestic market with at least one year remaining term to final maturity and at least $250 million outstanding. ICE BofA U.S. High Yield Index is an unmanaged index that tracks the performance of U.S. dollar denominated, below investment-grade rated corporate debt publicly issued in the U.S. domestic market. It is not possible to invest directly in an index.
Growth of $50,000 Investment
CROSSINGBRIDGE ULTRA-SHORT DURATION FUND
Investment Highlights
(Unaudited)
The Fund seeks to offer a higher yield than cash instruments while maintaining a low duration. The allocation of portfolio holdings as of September 30, 2023 is as follows:
Allocation of Portfolio Holdings
(% of Investments)
* Less than 0.05%.
Average Annual Total Returns as of September 30, 2023
| | One | Since |
| | Year | June 30, 20211 |
| Institutional Class Shares | 5.44% | 2.92% |
| ICE BofA 0-1 Year U.S. Corporate Index | 5.03% | 1.76% |
| ICE BofA 0-1 Year U.S. Treasury Index | 4.35% | 1.83% |
| ICE BofA 0-3 Year U.S. Fixed Rate | | |
| Asset Backed Securities Index | 3.98% | 0.45% |
1 Commencement of investment operations.
Performance data quoted represents past performance and does not guarantee future results. The investment return and principal value of an investment will fluctuate so that an investor’s shares, when redeemed, may be worth more or less than their original cost. Current performance of the Fund may be lower or higher than the performance quoted. Performance data current to the most recent month end may be obtained by calling 1-888-898-2780.
Investment performance reflects fee waivers in effect. In the absence of such waivers, total returns would be reduced.
CROSSINGBRIDGE ULTRA-SHORT DURATION FUND
Investment Highlights (Continued)
(Unaudited)
The returns shown assume reinvestment of Fund distributions and do not reflect the deduction of taxes that a shareholder would pay on Fund distributions or the redemption of Fund shares. The following graph illustrates performance of a hypothetical investment made in the Fund and the Fund’s primary benchmark index, ICE BofA 0-1 Year U.S. Corporate Index, as well as other broad-based securities indices on the Fund’s inception date. ICE BofA 0-1 Year U.S. Corporate Index is a subset of ICE BofA U.S. Corporate Bond Index including all securities with a remaining term to final maturity less than 1 year. ICE BofA 0-1 Year U.S. Treasury Index tracks the performance of U.S. dollar denominated sovereign debt publicly issued by the U.S. government in its domestic market with maturities less than one year. ICE BofA 0-3 Year U.S. Fixed Rate Asset Backed Securities Index is a subset of ICE BofA U.S. Fixed Rate Asset Backed Securities Index including all securities with a remaining term to final maturity less than three years. It is not possible to invest directly in an index.
Growth of $50,000 Investment
CROSSINGBRIDGE PRE-MERGER SPAC ETF
Investment Highlights
(Unaudited)
The Fund seeks to provide total returns consistent with the preservation of capital. The allocation of portfolio holdings as of September 30, 2023 is as follows:
Allocation of Portfolio Holdings
(% of Investments)
* Less than 0.05%.
Average Annual Total Returns as of September 30, 2023
| | One | Since |
| | Year | September 20, 20211 |
| Net Asset Value | 6.63% | 4.67% |
| Market Value | 6.74% | 4.74% |
| ICE BofA 0-3 Year U.S. Treasury Index | 3.14% | -0.21% |
1 Commencement of investment operations.
Performance data quoted represents past performance and does not guarantee future results. The investment return and principal value of an investment will fluctuate so that an investor’s shares, when redeemed, may be worth more or less than their original cost. Current performance of the Fund may be lower or higher than the performance quoted. Performance data current to the most recent month end may be obtained by calling 1-888-898-2780.
The returns shown assume reinvestment of Fund distributions and do not reflect the deduction of taxes that a shareholder would pay on Fund distributions or the redemption of Fund shares. The following graph illustrates performance of a hypothetical investment made in the Fund and broad-based securities indices on the Fund’s inception date. The graph does not reflect any future performance. ICE BofA 0-3 Year U.S. Treasury Index tracks the performance of U.S. dollar denominated sovereign debt publicly issued by the
CROSSINGBRIDGE PRE-MERGER SPAC ETF
Investment Highlights (Continued)
(Unaudited)
U.S. government in its domestic market with maturities less than three years. Qualifying securities must have at least 18 months to maturity at point of issuance, at least one month and less than three years remaining term to final maturity, a fixed coupon schedule and minimum amount outstanding of $1 billion. It is not possible to invest directly in an index.
Growth of $10,000 Investment
RIVERPARK STRATEGIC INCOME FUND
Investment Highlights
(Unaudited)
The Fund seeks high current income and capital appreciation consistent with the preservation of capital. The allocation of portfolio holdings as of September 30, 2023 is as follows:
Allocation of Portfolio Holdings
(% of Investments)
* Less than 0.05%.
Average Annual Total Returns as of September 30, 2023
| | One | Three | Five | Ten |
| | Year | Years | Years | Years |
| Institutional Class Shares | 6.55% | 6.11% | 3.85% | 3.97% |
| Retail Class Shares | 6.30% | 5.94% | 3.66% | 3.73% |
Bloomberg U.S. Aggregate Bond Index1 | 0.64% | -5.21% | 0.10% | 1.13% |
ICE BofA U.S. High Yield Index1 | 10.19% | 1.82% | 2.80% | 4.16% |
| ICE BofA 3-7 Year U.S. Treasury Index | 1.19% | -4.02% | 0.57% | 0.84% |
| ICE BofA U.S. Corporate Index | 3.99% | -4.67% | 1.07% | 2.31% |
1 | The Fund has changed its primary broad-based index from the Bloomberg U.S. Aggregate Bond Index to the ICE BofA U.S. High Yield Index because the Adviser believes the ICE BofA U.S. High Yield Index is more representative of the investment approach used to manage the Fund. |
Performance data quoted represents past performance and does not guarantee future results. The investment return and principal value of an investment will fluctuate so that an investor’s shares, when redeemed, may be worth more or less than their original cost. Current performance of the Fund may be lower or higher than the performance quoted. Performance data current to the most recent month end may be obtained by calling 1-888-898-2780.
RIVERPARK STRATEGIC INCOME FUND
Investment Highlights (Continued)
(Unaudited)
Investment performance reflects fee waivers in effect. In the absence of such waivers, total returns would be reduced.
The returns shown assume reinvestment of Fund distributions and do not reflect the deduction of taxes that a shareholder would pay on Fund distributions or the redemption of Fund shares. The following graph illustrates performance of a hypothetical investment made in the Fund and the Fund’s primary benchmark index, the ICE BofA U.S. High Yield Index, as well as other broad-based securities indices on the Fund’s inception date. ICE BofA 3-7 Year U.S. Treasury Index measures the performance of public obligations of the U.S. Treasury that have a remaining maturity of greater than 3 years and less than or equal to 7 years. ICE BofA U.S. Corporate Index is an unmanaged index comprised of U.S. dollar denominated investment grade, fixed rate corporate debt securities publicly issued in the U.S. domestic market with at least one year remaining term to final maturity and at least $250 million outstanding. ICE BofA U.S. High Yield Index is an unmanaged index that tracks the performance of U.S. dollar denominated, below investment-grade rated corporate debt publicly issued in the U.S. domestic market. Bloomberg U.S. Aggregate Bond Index is a broad-based flagship benchmark that measures the investment grade, US dollar-denominated, fixed-rate taxable bond market. It is not possible to invest directly in an index.
Growth of $50,000 Investment
1 | The Fund has changed its primary broad-based index from the Bloomberg U.S. Aggregate Bond Index to the ICE BofA U.S. High Yield Index because the Adviser believes the ICE BofA U.S. High Yield Index is more representative of the investment approach used to manage the Fund. |
CROSSINGBRIDGE LOW DURATION HIGH YIELD FUND
September 30, 2023
| | | Face | | | | |
| | | Amount† | | | Value | |
| ASSET BACKED SECURITIES – 3.26% | | | | | | |
| | | | | | | |
| Finance and Insurance – 0.94% | | | | | | |
| HTS Fund I LLC | | | | | | |
| 2021-1, 1.410%, 08/25/2036 (a) | | | 5,772,657 | | | $ | 4,911,118 | |
| MMAF Equipment Finance LLC | | | | | | | | |
| 2022-B, 5.570%, 09/09/2025 (a) | | | 822,169 | | | | 820,037 | |
| | | | | | | | 5,731,155 | |
| Transportation and Warehousing – 2.32% | | | | | | | | |
| Hawaiian Airlines 2013-1 Class A Pass Through Certificates | | | | | | | | |
| 2013-1, 3.900%, 01/15/2026 | | | 15,791,400 | | | | 14,048,598 | |
| TOTAL ASSET BACKED SECURITIES (Cost $20,440,059) | | | | | | | 19,779,753 | |
| | | | | | | | | |
| BANK LOANS – 12.09% | | | | | | | | |
| | | | | | | | | |
| Construction – 0.21% | | | | | | | | |
| Lealand Finance | | | | | | | | |
| 8.431% (1 Month SOFR + 3.000%), 06/30/2024 (b) | | | 1,750,984 | | | | 1,269,463 | |
| | | | | | | | | |
| Information – 3.46% | | | | | | | | |
| Cengage Learning, Inc. | | | | | | | | |
| 10.323% (3 Month SOFR + 4.750%), 07/14/2026 (b) | | | 14,593,803 | | | | 14,548,197 | |
| Lions Gate Capital Holdings LLC | | | | | | | | |
| 7.666% (1 Month SOFR + 2.250%), 03/24/2025 (b) | | | 6,436,265 | | | | 6,460,375 | |
| | | | | | | | 21,008,572 | |
| Manufacturing – 6.21% | | | | | | | | |
| Chobani LLC | | | | | | | | |
| 8.931% (1 Month LIBOR + 3.500%), 10/23/2027 (b) | | | 2,480,818 | | | | 2,485,470 | |
| Diebold Nixdorf, Inc. | | | | | | | | |
| 12.891% (3 Month SOFR + 7.500%), 08/11/2028 (b) | | | 5,563,760 | | | | 5,589,269 | |
| Elevate Textiles, Inc. | | | | | | | | |
| 13.892% (3 Month LIBOR + 8.500%), 09/30/2027 (b) | | | 8,783,985 | | | | 8,773,005 | |
| First Brands Group LLC | | | | | | | | |
| 14.381% (6 Month SOFR + 8.500%), 03/24/2027 (b) | | | 1,829,566 | | | | 1,805,098 | |
| 10.881% (6 Month SOFR + 5.000%), 03/30/2027 (b) | | | 9,512,425 | | | | 9,388,198 | |
| K&N Parent, Inc. | | | | | | | | |
| 13.431% (3 Month LIBOR + 8.000%), 02/14/2027 (b) | | | 8,053,577 | | | | 8,193,861 | |
| 10.681% (3 Month LIBOR + 5.250%), 08/14/2027 (b) | | | 1,814,983 | | | | 1,406,612 | |
| | | | | | | | 37,641,513 | |
| Mining, Quarrying, and Oil and Gas Extraction – 0.92% | | | | | | | | |
| Quarternorth Energy Holding, Inc. | | | | | | | | |
| 13.431% (1 Month LIBOR + 8.000%), 08/27/2026 (b) | | | 5,568,985 | | | | 5,557,374 | |
The accompanying notes are an integral part of these financial statements.
CROSSINGBRIDGE LOW DURATION HIGH YIELD FUND
| Schedule of Investments (Continued) |
September 30, 2023
| | | Face | | | | |
| | | Amount† | | | Value | |
| BANK LOANS – 12.09% (CONTINUED) | | | | | | |
| | | | | | | |
| Professional, Scientific, and Technical Services – 0.55% | | | | | | |
| Getty Images, Inc. | | | | | | |
| 9.990% (3 Month LIBOR + 4.500%), 02/19/2026 (b) | | | 3,324,805 | | | $ | 3,338,104 | |
| | | | | | | | | |
| Retail Trade – 0.74% | | | | | | | | |
| The Container Store, Inc. | | | | | | | | |
| 10.402% (3 Month LIBOR + 4.750%), 01/31/2026 (b) | | | 4,930,128 | | | | 4,500,836 | |
| TOTAL BANK LOANS (Cost $74,987,977) | | | | | | | 73,315,862 | |
| | | | | | | | | |
| COMMERCIAL PAPER – 17.27% | | | | | | | | |
| | | | | | | | | |
| Information – 1.88% | | | | | | | | |
| Crown Castle International Corp. | | | | | | | | |
| 5.346%, 11/02/2023 (c) | | | 11,472,000 | | | | 11,408,769 | |
| | | | | | | | | |
| Manufacturing – 9.26% | | | | | | | | |
| Bacardi-Martini B.V. | | | | | | | | |
| 5.881%, 10/24/2023 (c) | | | 10,398,000 | | | | 10,358,148 | |
| Campbell Soup Co. | | | | | | | | |
| 5.719%, 10/05/2023 (c) | | | 5,930,000 | | | | 5,924,639 | |
| General Motors Financial Co., Inc. | | | | | | | | |
| 5.801%, 10/11/2023 (c) | | | 15,250,000 | | | | 15,221,757 | |
| International Flavors & Fragrances, Inc. | | | | | | | | |
| 5.502%, 10/26/2023 (c) | | | 10,221,000 | | | | 10,178,616 | |
| Jabil, Inc. | | | | | | | | |
| 5.884%, 10/06/2023 (c) | | | 14,488,000 | | | | 14,470,689 | |
| | | | | | | | 56,153,849 | |
| Mining, Quarrying, and Oil and Gas Extraction – 4.23% | | | | | | | | |
| Energy Transfer LP | | | | | | | | |
| 5.806%, 10/04/2023 (c) | | | 8,751,000 | | | | 8,744,038 | |
| Glencore Funding LLC | | | | | | | | |
| 5.972%, 10/17/2023 (c) | | | 9,578,000 | | | | 9,551,234 | |
| Targa Resources Corp. | | | | | | | | |
| 5.808%, 10/23/2023 (c) | | | 7,351,000 | | | | 7,325,424 | |
| | | | | | | | 25,620,696 | |
| Retail Trade – 1.90% | | | | | | | | |
| Walgreens Boots Alliance, Inc. | | | | | | | | |
| 5.437%, 10/13/2023 (c) | | | 11,556,000 | | | | 11,529,117 | |
| TOTAL COMMERCIAL PAPER (Cost $104,733,360) | | | | | | | 104,712,431 | |
The accompanying notes are an integral part of these financial statements.
CROSSINGBRIDGE LOW DURATION HIGH YIELD FUND
| Schedule of Investments (Continued) |
September 30, 2023
| | | Face | | | | |
| | | Amount† | | | Value | |
| COMMON STOCKS – 0.04% | | | | | | |
| | | | | | | |
| Manufacturing – 0.04% | | | | | | |
| K&N Parent, Inc. (d)(k) | | | 152,899 | | | $ | 229,349 | |
| TOTAL COMMON STOCKS (Cost $152,899) | | | | | | | 229,349 | |
| | | | | | | | | |
| CONVERTIBLE BONDS – 2.01% | | | | | | | | |
| | | | | | | | | |
| Information – 2.01% | | | | | | | | |
| BuzzFeed, Inc. | | | | | | | | |
| 8.500%, 12/03/2026 (a) | | | 7,900,000 | | | | 5,080,024 | |
| Leafly Holdings, Inc. | | | | | | | | |
| 8.000%, 01/31/2025 (d)(e) | | | 7,245,000 | | | | 6,158,250 | |
| UpHealth, Inc. | | | | | | | | |
| 6.250%, 06/15/2026 (a)(l) | | | 3,173,000 | | | | 936,035 | |
| TOTAL CONVERTIBLE BONDS (Cost $17,634,053) | | | | | | | 12,174,309 | |
| | | | | | | | | |
| CORPORATE BONDS – 55.04% | | | | | | | | |
| | | | | | | | | |
| Accommodation and Food Services – 5.38% | | | | | | | | |
| Aramark Services, Inc. | | | | | | | | |
| 6.375%, 05/01/2025 (a) | | | 17,439,000 | | | | 17,716,978 | |
| Nathan’s Famous, Inc. | | | | | | | | |
| 6.625%, 11/01/2025 (a) | | | 5,496,000 | | | | 5,483,606 | |
| Yum! Brands, Inc. | | | | | | | | |
| 3.875%, 11/01/2023 | | | 9,417,000 | | | | 9,392,191 | |
| | | | | | | | 32,592,775 | |
| Arts, Entertainment, and Recreation – 0.80% | | | | | | | | |
| DEAG Deutsche Entertainment AG | | | | | | | | |
| 8.000%, 07/12/2026 (f)(g) | | EUR 4,486,000 | | | | 4,836,076 | |
| | | | | | | | | |
| Construction – 0.56% | | | | | | | | |
| Five Point Operating Co LP / Five Point Capital Corp. | | | | | | | | |
| 7.875%, 11/15/2025 (a) | | | 2,434,000 | | | | 2,299,369 | |
| K Hovnanian Enterprises, Inc. | | | | | | | | |
| 10.000%, 11/15/2025 (a) | | | 1,066,000 | | | | 1,071,417 | |
| | | | | | | | 3,370,786 | |
| Educational Services – 0.07% | | | | | | | | |
| Hercules Achievement Inc / Varsity Brands Holding Co, Inc. | | | | | | | | |
| 13.503% (3 Month SOFR + 8.262%), 12/22/2024 (a)(b) | | | 437,000 | | | | 435,918 | |
The accompanying notes are an integral part of these financial statements.
CROSSINGBRIDGE LOW DURATION HIGH YIELD FUND
| Schedule of Investments (Continued) |
September 30, 2023
| | | Face | | | | |
| | | Amount† | | | Value | |
| CORPORATE BONDS – 55.04% (CONTINUED) | | | | | | |
| | | | | | | |
| Finance and Insurance – 7.69% | | | | | | |
| Freedom Mortgage Corp. | | | | | | |
| 8.250%, 04/15/2025 (a) | | | 13,293,000 | | | $ | 13,308,194 | |
| Icahn Enterprises LP / Icahn Enterprises Finance Corp. | | | | | | | | |
| 4.750%, 09/15/2024 | | | 3,306,000 | | | | 3,187,094 | |
| 6.375%, 12/15/2025 | | | 7,861,000 | | | | 7,487,845 | |
| Nordic Capital II | | | | | | | | |
| 10.970% (3 Month NIBOR + 6.250%), 06/30/2024 (b)(f)(h) | | NOK 18,400,000 | | | | 1,720,165 | |
| Novedo Holding AB | | | | | | | | |
| 10.564% (3 Month STIBOR + 6.500%), 11/26/2024 (b)(f)(i) | | SEK 38,750,000 | | | | 3,449,197 | |
| Stockwik Forvaltning AB | | | | | | | | |
| 12.106% (3 Month STIBOR + 8.000%), 03/20/2026 (b)(f)(i) | | SEK 45,000,000 | | | | 3,902,549 | |
| StoneX Group, Inc. | | | | | | | | |
| 8.625%, 06/15/2025 (a) | | | 13,460,000 | | | | 13,585,111 | |
| | | | | | | | 46,640,155 | |
| Information – 13.16% | | | | | | | | |
| American Greetings Corp. | | | | | | | | |
| 8.750%, 04/15/2025 (a) | | | 4,008,000 | | | | 3,971,708 | |
| Azerion Group N.V. | | | | | | | | |
| 10.628% (3 Month EURIBOR + 6.750%), 10/02/2026 (b)(f)(g) | | EUR 6,209,000 | | | | 6,433,177 | |
| Azerion Holding BV | | | | | | | | |
| 7.250%, 04/28/2024 (f)(g) | | EUR 2,603,000 | | | | 2,758,847 | |
| Cengage Learning, Inc. | | | | | | | | |
| 9.500%, 06/15/2024 (a) | | | 1,038,000 | | | | 1,045,065 | |
| Charter Communications Operating LLC / | | | | | | | | |
| Charter Communications Operating Capital | | | | | | | | |
| 4.500%, 02/01/2024 | | | 9,889,000 | | | | 9,836,420 | |
| 7.284% (3 Month SOFR + 1.912%), 02/01/2024 (b) | | | 2,043,000 | | | | 2,050,062 | |
| Clear Channel International BV | | | | | | | | |
| 6.625%, 08/01/2025 (a)(f) | | | 8,632,000 | | | | 8,543,998 | |
| Connect Finco SARL / Connect US Finco LLC | | | | | | | | |
| 6.750%, 10/01/2026 (a)(f) | | | 6,937,000 | | | | 6,478,515 | |
| Go North Group AB | | | | | | | | |
| 14.974%, 02/09/2026 (f) | | | 11,087,061 | | | | 11,142,496 | |
| 14.974% (3 Month STIBOR + 11.000%), 02/09/2026 (b)(f)(i) | | SEK 12,500,000 | | | | 1,158,409 | |
| Impala BondCo Plc | | | | | | | | |
| 12.868% (3 Month STIBOR + 9.000%), 10/20/2024 (b)(f)(i) | | SEK 11,250,000 | | | | 901,401 | |
| INNOVATE Corp. | | | | | | | | |
| 8.500%, 02/01/2026 (a) | | | 7,309,000 | | | | 5,618,574 | |
| OpNet S.p.A. | | | | | | | | |
| 10.972% (3 Month EURIBOR + 7.000%), 02/09/2026 (a)(b)(f)(g) | | EUR 12,701,000 | | | | 13,512,059 | |
| TEGNA, Inc. | | | | | | | | |
| 4.750%, 03/15/2026 (a) | | | 6,694,000 | | | | 6,350,163 | |
| | | | | | | | 79,800,894 | |
The accompanying notes are an integral part of these financial statements.
CROSSINGBRIDGE LOW DURATION HIGH YIELD FUND
| Schedule of Investments (Continued) |
September 30, 2023
| | | Face | | | | |
| | | Amount† | | | Value | |
| CORPORATE BONDS – 55.04% (CONTINUED) | | | | | | |
| | | | | | | |
| Manufacturing – 20.05% | | | | | | |
| Ball Corp. | | | | | | |
| 4.000%, 11/15/2023 | | | 18,594,000 | | | $ | 18,542,645 | |
| Cannabist Co. Holdings, Inc. | | | | | | | | |
| 9.500%, 02/03/2026 (f) | | | 17,087,000 | | | | 14,780,255 | |
| Chobani LLC / Chobani Finance Corp, Inc. | | | | | | | | |
| 7.500%, 04/15/2025 (a) | | | 6,160,000 | | | | 6,107,886 | |
| Coty, Inc. | | | | | | | | |
| 5.000%, 04/15/2026 (a) | | | 1,961,000 | | | | 1,887,266 | |
| Fiven ASA | | | | | | | | |
| 10.784% (3 Month EURIBOR + 6.850%), 06/21/2024 (b)(f)(g) | | EUR 11,310,000 | | | | 12,136,861 | |
| Georg Jensen A/S | | | | | | | | |
| 10.788% (3 Month EURIBOR + 7.000%), 05/14/2025 (b)(f)(g) | | EUR 600,000 | | | | 660,893 | |
| Hillenbrand, Inc. | | | | | | | | |
| 5.750%, 06/15/2025 | | | 3,542,000 | | | | 3,493,953 | |
| Horizon Therapeutics USA, Inc. | | | | | | | | |
| 5.500%, 08/01/2027 (a) | | | 16,780,000 | | | | 17,241,450 | |
| InfraBuild Australia Pty Ltd. | | | | | | | | |
| 12.000%, 10/01/2024 (a)(f) | | | 20,431,000 | | | | 19,951,604 | |
| LR Global Holding GmbH | | | | | | | | |
| 11.033% (3 Month EURIBOR + 7.250%), 02/03/2025 (b)(f)(g) | | EUR 5,034,000 | | | | 5,189,142 | |
| ProSomnus, Inc. | | | | | | | | |
| 9.000%, 12/06/2025 (d)(e) | | | 7,387,240 | | | | 6,533,600 | |
| Secop Group Holding GmbH | | | | | | | | |
| 12.372% (3 Month EURIBOR + 8.400%), 12/29/2026 (b)(f)(g) | | EUR 2,859,000 | | | | 3,052,905 | |
| Valvoline, Inc. | | | | | | | | |
| 4.250%, 02/15/2030 (a) | | | 12,242,000 | | | | 12,034,792 | |
| | | | | | | | 121,613,252 | |
| Mining, Quarrying, and Oil and Gas Extraction – 2.56% | | | | | | | | |
| Mime Petroleum AS | | | | | | | | |
| 9.750%, 09/17/2026 (a)(f) | | | 3,281,729 | | | | 3,084,825 | |
| NGL Energy Operating LLC / NGL Energy Finance Corp. | | | | | | | | |
| 7.500%, 02/01/2026 (a) | | | 8,524,000 | | | | 8,436,945 | |
| Tacora Resources, Inc. | | | | | | | | |
| 13.000%, 10/08/2023 (a)(e)(f) | | | 2,520,292 | | | | 2,520,292 | |
| Waldorf Energy Finance Plc | | | | | | | | |
| 12.000%, 03/02/2026 (f) | | | 1,800,000 | | | | 1,505,711 | |
| | | | | | | | 15,547,773 | |
The accompanying notes are an integral part of these financial statements.
CROSSINGBRIDGE LOW DURATION HIGH YIELD FUND
| Schedule of Investments (Continued) |
September 30, 2023
| | | Face | | | | |
| | | Amount† | | | Value | |
| CORPORATE BONDS – 55.04% (CONTINUED) | | | | | | |
| | | | | | | |
| Professional, Scientific, and Technical Services – 1.58% | | | | | | |
| Aker Horizons ASA | | | | | | |
| 7.930% (3 Month NIBOR + 3.250%), 08/15/2025 (b)(f)(h) | | NOK 5,000,000 | | | $ | 453,413 | |
| Getty Images, Inc. | | | | | | | |
| 9.750%, 03/01/2027 (a) | | | 6,301,000 | | | | 6,301,086 | |
| Rebellion Operations AB | | | | | | | | |
| 12.034% (3 Month STIBOR + 8.000%), 05/20/2025 (b)(f)(i) | | SEK 32,500,000 | | | | 2,818,653 | |
| | | | | | | | 9,573,152 | |
| Real Estate and Rental and Leasing – 0.18% | | | | | | | | |
| REX – Real Estate Exchange, Inc. | | | | | | | | |
| 6.000%, 03/15/2025 (a) | | | 1,125,000 | | | | 1,102,950 | |
| | | | | | | | | |
| Retail Trade – 0.99% | | | | | | | | |
| Advance Auto Parts, Inc. | | | | | | | | |
| 5.900%, 03/09/2026 | | | 1,500,000 | | | | 1,449,465 | |
| Anagram International Inc / Anagram Holdings LLC | | | | | | | | |
| 15.000%, 08/15/2025 (a)(l) | | | 4,755,410 | | | | 4,543,580 | |
| | | | | | | | 5,993,045 | |
| Transportation and Warehousing – 0.85% | | | | | | | | |
| Floatel International Ltd. | | | | | | | | |
| 11.250%, 03/23/2026 (a)(f) | | | 1,443,000 | | | | 1,478,757 | |
| Uber Technologies, Inc. | | | | | | | | |
| 7.500%, 05/15/2025 (a) | | | 3,647,000 | | | | 3,673,897 | |
| | | | | | | | 5,152,654 | |
| Utilities – 1.17% | | | | | | | | |
| IEA Energy Services LLC | | | | | | | | |
| 6.625%, 08/15/2029 (a) | | | 7,385,000 | | | | 7,098,831 | |
| TOTAL CORPORATE BONDS (Cost $341,106,300) | | | | | | | 333,758,261 | |
| | | | | | | | | |
| MORTGAGE BACKED SECURITIES – 3.62% | | | | | | | | |
| | | | | | | | | |
| Finance and Insurance – 3.62% | | | | | | | | |
| BX Commercial Mortgage Trust 2021-VOLT | | | | | | | | |
| 2021-VOLT, 6.547% (1 Month SOFR + 1.214%), | | | | | | | | |
| 09/15/2036 (a)(b) | | | 6,354,000 | | | | 6,115,761 | |
| CAMB Commercial Mortgage Trust 2019-LIFE | | | | | | | | |
| 2019-LIFE, 7.130% (1 Month SOFR + 1.797%), | | | | | | | | |
| 12/15/2037 (a)(b) | | | 5,434,000 | | | | 5,375,842 | |
| Credit Suisse Mortgage Capital Certificates 2019-ICE4 | | | | | | | | |
| 2019-ICE4, 6.980% (1 Month SOFR + 1.647%), | | | | | | | | |
| 05/15/2036 (a)(b) | | | 1,437,424 | | | | 1,428,451 | |
The accompanying notes are an integral part of these financial statements.
CROSSINGBRIDGE LOW DURATION HIGH YIELD FUND
| Schedule of Investments (Continued) |
September 30, 2023
| | | Face | | | | |
| | | Amount† | | | Value | |
| MORTGAGE BACKED SECURITIES – 3.62% (CONTINUED) | | | | | | |
| | | | | | | |
| Finance and Insurance – 3.62% (Continued) | | | | | | |
| Life 2022-BMR Mortgage Trust | | | | | | |
| A-1, 6.627% (1 Month SOFR + 1.295%), 05/15/2039 (a)(b) | | | 7,145,000 | | | $ | 7,026,232 | |
| SMRT 2022-MINI | | | | | | | | |
| 2022-MINI, 6.683% (1 Month SOFR + 1.350%), | | | | | | | | |
| 01/15/2039 (a)(b) | | | 2,056,000 | | | | 2,001,930 | |
| TOTAL MORTGAGE BACKED SECURITIES | | | | | | | | |
| (Cost $21,887,344) | | | | | | | 21,948,216 | |
| | | | | | | | | |
| PREFERRED STOCKS – 1.68% | | | | | | | | |
| Health Care and Social Assistance – 1.68% | | | | | | | | |
| SWK Holdings Corp. | | | | | | | | |
| 9.000%, 01/31/2027 | | | 407,944 | | | | 10,198,600 | |
| TOTAL PREFERRED STOCKS (Cost $10,198,600) | | | | | | | 10,198,600 | |
| | | | | | | | | |
| REAL ESTATE INVESTMENT TRUSTS – 0.37% | | | | | | | | |
| | | | | | | | | |
| Real Estate and Rental and Leasing – 0.37% | | | | | | | | |
| Gladstone Land Corp. | | | 95,462 | | | | 2,267,223 | |
| TOTAL REAL ESTATE INVESTMENT TRUSTS | | | | | | | | |
| (Cost $2,267,188) | | | | | | | 2,267,223 | |
| | | | | | | | | |
| | | Number | | | | | |
| | | of Shares | | | | | |
| SPECIAL PURPOSE ACQUISITION COMPANIES – 0.54% | | | | | | | | |
| Alpha Partners Technology | | | | | | | | |
| Merger Corp. Founder Shares (d)(e)(f)(k) | | | 9,341 | | | | 750 | |
| Berenson Acquisition Corp. Founder Shares (d)(e)(k) | | | 19,099 | | | | — | |
| Haymaker Acquisition Corp. 4 (f) | | | 325,000 | | | | 3,305,250 | |
| Revelstone Capital Acquisition Corp. Founder Shares (d)(e)(k) | | | 10,125 | | | | 655 | |
| TOTAL SPECIAL PURPOSE ACQUISITION COMPANIES | | | | | | | | |
| (Cost $3,207,588) | | | | | | | 3,306,655 | |
| | | | | | | | | |
| WARRANTS – 0.01% | | | | | | | | |
| Financials Acquisition Corp. (f)(j)(k) | | | | | | | | |
| Expiration: 04/04/2027, Exercise Price: $11.50 | | | 95,450 | | | | 3,494 | |
| Hambro Perks Acquisition Corp. (d)(e)(f)(j)(k) | | | | | | | | |
| Expiration: 01/07/2026, Exercise Price: $11.50 | | | 108,901 | | | | — | |
| Haymaker Acquisition Corp. 4 (f)(k) | | | | | | | | |
| Expiration: 05/31/2028, Exercise Price: $11.50 | | | 162,500 | | | | 40,625 | |
The accompanying notes are an integral part of these financial statements.
CROSSINGBRIDGE LOW DURATION HIGH YIELD FUND
| Schedule of Investments (Continued) |
September 30, 2023
| | | Number | | | | |
| | | of Shares | | | Value | |
| WARRANTS – 0.01% (CONTINUED) | | | | | | |
| Hiro Metaverse Acquisitions I SA (d)(f)(j)(k) | | | | | | |
| Expiration: 12/21/2026, Exercise Price: $11.50 | | | 67,581 | | | $ | 12,781 | |
| Leafly Holdings, Inc. (k) | | | | | | | | |
| Expiration: 11/07/2026, Exercise Price: $11.50 | | | 36,943 | | | | 1,293 | |
| ProSomnus, Inc. (k) | | | | | | | | |
| Expiration: 04/20/2028, Exercise Price: $11.50 | | | 73,872 | | | | 4,801 | |
| Tacora Resources, Inc. (d)(e)(k) | | | | | | | | |
| Expiration: 05/11/2025, Exercise Price: $0.01 | | | 37,828,768 | | | | — | |
| TOTAL WARRANTS (Cost $95,477) | | | | | | | 62,994 | |
| | | | | | | | | |
| MONEY MARKET FUNDS – 7.06% | | | | | | | | |
| First American Government Obligations | | | | | | | | |
| Fund – Class X, 5.265% (m) | | | 11,458,612 | | | | 11,458,612 | |
| First American Treasury Obligations | | | | | | | | |
| Fund – Class X, 5.267% (m) | | | 31,341,238 | | | | 31,341,238 | |
| TOTAL MONEY MARKET FUNDS (Cost $42,799,850) | | | | | | | 42,799,850 | |
Total Investments (Cost $639,510,695) – 102.99% | | | | | | | 624,553,503 | |
| Liabilities in Excess of Other Assets – (2.99)% | | | | | | | (18,123,473 | ) |
| Total Net Assets – 100.00% | | | | | | $ | 606,430,030 | |
Percentages are stated as a percent of net assets.
| † | Face amount in U.S. Dollar unless otherwise indicated. |
| (a) | Securities issued pursuant to Rule 144A under the Securities Act of 1933 and Regulation S under the Securities Act of 1933. Aggregate value of these securities is $228,580,266 or 37.69% of Fund’s net assets. |
| (b) | Variable rate security. The rate shown represents the rate at September 30, 2023. |
| (c) | The rate shown is the effective yield. |
| (d) | Illiquid security. |
| (e) | Security valued using unobservable inputs. |
| (f) | Foreign issued security. |
| (g) | Principal amount denominated in Euros. |
| (h) | Principal amount denominated in Norwegian Krone. |
| (i) | Principal amount denominated in Swedish Krona. |
| (j) | Holding denominated in British Pound. |
| (k) | Non-income producing security. |
| (l) | Security in default. |
| (m) | Seven day yield as of September 30, 2023. |
The accompanying notes are an integral part of these financial statements.
CROSSINGBRIDGE LOW DURATION HIGH YIELD FUND
| Schedule of Investments (Continued) |
Definitions:
EURIBOR – Euro-Interbank Offer Rate is a reference rate expressing the average interest rate at which eurozone banks offer unsecured short-term lending on the interbank market.
LIBOR – London Interbank Offer Rate is a benchmark rate at which banks offer to lend funds to one another in the international interbank market for short-term loans.
NIBOR – Norwegian Interbank Offer Rate is a collective term for Norwegian money market rates at different maturities. It is intended to reflect the interest rate level a bank require for unsecured money market lending in Norwegian Krone to another bank.
SOFR – Secured Overnight Financing Rate is a benchmark interest rate for dollar-denominated derivatives and loans. SOFR is based on transactions in the Treasury repurchase market and is based on data from observable transactions rather than on estimated borrowing rates.
STIBOR – Stockholm Interbank Offer Rate is a reference rate that shows the average interest rate at which a number of active banks on the Swedish money market are willing to lend to one another, without collateral, at different maturities.
The accompanying notes are an integral part of these financial statements.
CROSSINGBRIDGE LOW DURATION HIGH YIELD FUND
| Schedule of Forward Currency Exchange Contracts |
September 30, 2023
| | | | | Currency | | USD Value at | | | Currency | | USD Value at | | | Unrealized | |
| Settlement | | Counter- | | to be | | September 30, | | | to be | | September 30, | | | Appreciation/ | |
| Date | | party | | Delivered | | 2023 | | | Received | | 2023 | | | (Depreciation) | |
| 10/13/23 | | U.S. Bank | | 50,538,000 | | EUR | | $ | 53,462,565 | | | 54,224,124 | | USD | | $ | 54,224,124 | | | $ | 761,559 | |
| 10/13/23 | | U.S. Bank | | 23,320,000 | | NOK | | | 2,180,997 | | | 2,178,279 | | USD | | | 2,178,279 | | | | (2,718 | ) |
| 10/13/23 | | U.S. Bank | | 138,795,000 | | SEK | | | 12,710,938 | | | 12,519,114 | | USD | | | 12,519,114 | | | | (191,824 | ) |
| 10/13/23 | | U.S. Bank | | 4,835,583 | | USD | | | 4,835,583 | | | 4,532,000 | | EUR | | | 4,794,261 | | | | (41,322 | ) |
| 10/13/23 | | U.S. Bank | | 382,673 | | USD | | | 382,673 | | | 4,285,000 | | SEK | | | 392,423 | | | | 9,750 | |
| | | | | | | | | $ | 73,572,756 | | | | | | | $ | 74,108,201 | | | $ | 535,445 | |
EUR – Euro
NOK – Norwegian Krone
SEK – Swedish Krona
USD – U.S. Dollars
The accompanying notes are an integral part of these financial statements.
CROSSINGBRIDGE RESPONSIBLE CREDIT FUND
September 30, 2023
| | | Face | | | | |
| | | Amount† | | | Value | |
| ASSET BACKED SECURITIES – 4.85% | | | | | | |
| | | | | | | |
| Transportation and Warehousing – 4.85% | | | | | | |
| Hawaiian Airlines 2013-1 Class A Pass Through Certificates | | | | | | |
| 2013-1, 3.900%, 01/15/2026 | | | 1,489,240 | | | $ | 1,324,881 | |
| TOTAL ASSET BACKED SECURITIES (Cost $1,353,682) | | | | | | | 1,324,881 | |
| | | | | | | | | |
| BANK LOANS – 17.87% | | | | | | | | |
| | | | | | | | | |
| Information – 4.65% | | | | | | | | |
| Cengage Learning, Inc. | | | | | | | | |
| 10.323% (3 Month SOFR + 4.750%), 07/14/2026 (b) | | | 993,693 | | | | 988,098 | |
| Lions Gate Capital Holdings LLC | | | | | | | | |
| 7.666% (1 Month SOFR + 2.250%), 03/24/2025 (b) | | | 281,937 | | | | 281,936 | |
| | | | | | | | 1,270,034 | |
| Manufacturing – 9.32% | | | | | | | | |
| Chobani LLC | | | | | | | | |
| 8.931% (1 Month LIBOR + 3.500%), 10/23/2027 (b) | | | 497,442 | | | | 497,104 | |
| Crocs, Inc. | | | | | | | | |
| 8.540% (3 Month LIBOR + 3.500%), 02/19/2029 (b) | | | 141,568 | | | | 136,104 | |
| Diebold Nixdorf, Inc. | | | | | | | | |
| 12.891% (3 Month SOFR + 7.500%), 08/11/2028 (b) | | | 623,682 | | | | 626,541 | |
| Elevate Textiles, Inc. | | | | | | | | |
| 13.892% (3 Month LIBOR + 8.500%), 09/30/2027 (b) | | | 777,000 | | | | 776,029 | |
| First Brands Group LLC | | | | | | | | |
| 10.881% (6 Month SOFR + 5.000%), 03/30/2027 (b) | | | 515,750 | | | | 509,015 | |
| | | | | | | | 2,544,793 | |
| Retail Trade – 3.90% | | | | | | | | |
| Mountaineer Merger Corp. | | | | | | | | |
| 12.634% (3 Month LIBOR + 7.000%), 10/22/2028 (b) | | | 487,013 | | | | 387,989 | |
| The Container Store, Inc. | | | | | | | | |
| 10.402% (3 Month LIBOR + 4.750%), 01/31/2026 (b) | | | 745,482 | | | | 676,218 | |
| | | | | | | | 1,064,207 | |
| TOTAL BANK LOANS (Cost $4,874,643) | | | | | | | 4,879,034 | |
| | | | | | | | | |
| COMMERCIAL PAPER – 13.57% | | | | | | | | |
| | | | | | | | | |
| Information – 1.93% | | | | | | | | |
| Crown Castle International Corp. | | | | | | | | |
| 5.346%, 11/02/2023 (c) | | | 528,000 | | | | 525,090 | |
The accompanying notes are an integral part of these financial statements.
CROSSINGBRIDGE RESPONSIBLE CREDIT FUND
| Schedule of Investments (Continued) |
September 30, 2023
| | | Face | | | | |
| | | Amount† | | | Value | |
| COMMERCIAL PAPER – 13.57% (CONTINUED) | | | | | | |
| | | | | | | |
| Manufacturing – 9.08% | | | | | | |
| Campbell Soup Co. | | | | | | |
| 5.719%, 10/05/2023 (c) | | | 273,000 | | | $ | 272,753 | |
| General Motors Financial Co, Inc. | | | | | | | | |
| 5.880%, 11/20/2023 (c) | | | 578,000 | | | | 573,214 | |
| International Flavors & Fragrances, Inc. | | | | | | | | |
| 5.502%, 10/26/2023 (c) | | | 462,000 | | | | 460,084 | |
| Jabil, Inc. | | | | | | | | |
| 5.810%, 10/06/2023 (c) | | | 667,000 | | | | 666,203 | |
| Parker Hannifin Corp. | | | | | | | | |
| 5.643%, 10/17/2023 (c) | | | 508,000 | | | | 506,609 | |
| | | | | | | | 2,478,863 | |
| Wholesale Trade – 2.56% | | | | | | | | |
| Arrow Electronics, Inc. | | | | | | | | |
| 5.087%, 10/12/2023 (c) | | | 700,000 | | | | 698,536 | |
| TOTAL COMMERCIAL PAPER (Cost $3,703,536) | | | | | | | 3,702,489 | |
| | | | | | | | | |
| COMMON STOCKS – 0.65% | | | | | | | | |
| | | | | | | | | |
| Manufacturing – 0.65% | | | | | | | | |
| RA PARENT, Inc. (d)(e)(j) | | | 3 | | | | 177,600 | |
| TOTAL COMMON STOCKS (Cost $177,000) | | | | | | | 177,600 | |
| | | | | | | | | |
| CONVERTIBLE BONDS – 0.73% | | | | | | | | |
| | | | | | | | | |
| Information – 0.73% | | | | | | | | |
| UpHealth, Inc. | | | | | | | | |
| 14.320% (SOFR + 9.000%), 12/15/2025 (a)(b)(k) | | | 250,000 | | | | 198,750 | |
| TOTAL CONVERTIBLE BONDS (Cost $187,500) | | | | | | | 198,750 | |
| | | | | | | | | |
| CORPORATE BONDS – 55.38% | | | | | | | | |
| | | | | | | | | |
| Accommodation and Food Services – 2.99% | | | | | | | | |
| Aramark Services, Inc. | | | | | | | | |
| 6.375%, 05/01/2025 (a) | | | 803,000 | | | | 815,800 | |
| | | | | | | | | |
| Arts, Entertainment, and Recreation – 0.92% | | | | | | | | |
| DEAG Deutsche Entertainment AG | | | | | | | | |
| 8.000%, 07/12/2026 (f)(g) | | EUR 232,000 | | | | 250,105 | |
The accompanying notes are an integral part of these financial statements.
CROSSINGBRIDGE RESPONSIBLE CREDIT FUND
| Schedule of Investments (Continued) |
September 30, 2023
| | | Face | | | | |
| | | Amount† | | | Value | |
| CORPORATE BONDS – 55.38% (CONTINUED) | | | | | | |
| | | | | | | |
| Construction – 0.90% | | | | | | |
| Five Point Operating Co LP / Five Point Capital Corp. | | | | | | |
| 7.875%, 11/15/2025 (a) | | | 209,000 | | | $ | 197,440 | |
| K Hovnanian Enterprises, Inc. | | | | | | | | |
| 10.000%, 11/15/2025 (a) | | | 49,000 | | | | 49,249 | |
| | | | | | | | 246,689 | |
| Finance and Insurance – 10.38% | | | | | | | | |
| Esmaeilzadeh Holding AB | | | | | | | | |
| 11.435% (3 Month STIBOR + 7.500%), 01/26/2025 (b)(f)(i) | | SEK 2,500,000 | | | | 217,202 | |
| Freedom Mortgage Corp. | | | | | | | | |
| 8.250%, 04/15/2025 (a) | | | 222,000 | | | | 222,254 | |
| Icahn Enterprises LP / Icahn Enterprises Finance Corp. | | | | | | | | |
| 4.750%, 09/15/2024 | | | 110,000 | | | | 106,044 | |
| 6.375%, 12/15/2025 | | | 361,000 | | | | 343,863 | |
| Novedo Holding AB | | | | | | | | |
| 10.564% (3 Month STIBOR + 6.500%), 11/26/2024 (b)(f)(i) | | SEK 1,250,000 | | | | 111,264 | |
| Stockwik Forvaltning AB | | | | | | | | |
| 12.106% (3 Month STIBOR + 8.000%), 03/20/2026 (b)(f)(i) | | SEK 8,750,000 | | | | 758,829 | |
| StoneX Group, Inc. | | | | | | | | |
| 8.625%, 06/15/2025 (a) | | | 1,063,000 | | | | 1,072,881 | |
| | | | | | | | 2,832,337 | |
| Information – 10.77% | | | | | | | | |
| American Greetings Corp. | | | | | | | | |
| 8.750%, 04/15/2025 (a) | | | 180,000 | | | | 178,370 | |
| Calligo UK Ltd. | | | | | | | | |
| 12.472% (3 Month EURIBOR + 8.500%), 12/29/2024 (b)(f)(g) | | EUR 100,000 | | | | 97,796 | |
| Cengage Learning, Inc. | | | | | | | | |
| 9.500%, 06/15/2024 (a) | | | 61,000 | | | | 61,415 | |
| Clear Channel International BV | | | | | | | | |
| 6.625%, 08/01/2025 (a)(f) | | | 542,000 | | | | 536,474 | |
| Connect Finco SARL / Connect US Finco LLC | | | | | | | | |
| 6.750%, 10/01/2026 (a)(f) | | | 400,000 | | | | 373,563 | |
| Go North Group AB | | | | | | | | |
| 14.974%, 02/09/2026 (f) | | | 532,250 | | | | 534,911 | |
| INNOVATE Corp. | | | | | | | | |
| 8.500%, 02/01/2026 (a) | | | 460,000 | | | | 353,611 | |
| OpNet S.p.A. | | | | | | | | |
| 10.972% (3 Month EURIBOR + 7.000%), 02/09/2026 (a)(b)(f)(g) | | EUR 553,000 | | | | 588,314 | |
| Ziff Davis, Inc. | | | | | | | | |
| 4.625%, 10/15/2030 (a) | | | 254,000 | | | | 215,250 | |
| | | | | | | | 2,939,704 | |
The accompanying notes are an integral part of these financial statements.
CROSSINGBRIDGE RESPONSIBLE CREDIT FUND
| Schedule of Investments (Continued) |
September 30, 2023
| | | Face | | | | |
| | | Amount† | | | Value | |
| CORPORATE BONDS – 55.38% (CONTINUED) | | | | | | |
| | | | | | | |
| Manufacturing – 16.17% | | | | | | |
| Elkem ASA | | | | | | |
| 6.290% (3 Month NIBOR + 1.550%), 08/31/2028 (b)(f)(h) | | NOK 8,000,000 | | | $ | 757,778 | |
| Fiven ASA | | | | | | | |
| 10.784% (3 Month EURIBOR + 6.850%), 06/21/2024 (b)(f)(g) | | EUR 1,409,000 | | | | 1,512,010 | |
| Horizon Therapeutics USA, Inc. | | | | | | | |
| 5.500%, 08/01/2027 (a) | | | 773,000 | | | | 794,258 | |
| InfraBuild Australia Pty Ltd. | | | | | | | | |
| 12.000%, 10/01/2024 (a)(f) | | | 900,000 | | | | 878,882 | |
| LR Global Holding GmbH | | | | | | | | |
| 11.033% (3 Month EURIBOR + 7.250%), 02/03/2025 (b)(f)(g) | | EUR 300,000 | | | | 309,246 | |
| Secop Group Holding GmbH | | | | | | | | |
| 12.372% (3 Month EURIBOR + 8.400%), 12/29/2026 (b)(f)(g) | | EUR 150,000 | | | | 160,173 | |
| | | | | | | | 4,412,347 | |
| Mining, Quarrying, and Oil and Gas Extraction – 2.77% | | | | | | | | |
| Tacora Resources, Inc. | | | | | | | | |
| 13.000%, 10/08/2023 (a)(e)(f) | | | 755,008 | | | | 755,008 | |
| | | | | | | | | |
| Professional, Scientific, and Technical Services – 1.06% | | | | | | | | |
| Getty Images, Inc. | | | | | | | | |
| 9.750%, 03/01/2027 (a) | | | 290,000 | | | | 290,004 | |
| | | | | | | | | |
| Real Estate and Rental and Leasing – 0.98% | | | | | | | | |
| PHM Group Holding Oyj | | | | | | | | |
| 11.378% (3 Month EURIBOR + 7.500%), 06/19/2026 (a)(b)(f)(g) | | EUR 250,000 | | | | 267,616 | |
| | | | | | | | | |
| Retail Trade – 0.90% | | | | | | | | |
| Anagram International Inc / Anagram Holdings LLC | | | | | | | | |
| 15.000%, 08/15/2025 (a)(k) | | | 257,531 | | | | 246,059 | |
| | | | | | | | | |
| Transportation and Warehousing – 4.51% | | | | | | | | |
| Skill BidCo ApS | | | | | | | | |
| 10.545% (3 Month EURIBOR + 6.750%), 03/02/2028 (b)(f)(g) | | EUR 250,000 | | | | 264,646 | |
| Uber Technologies, Inc. | | | | | | | | |
| 8.000%, 11/01/2026 (a) | | | 463,000 | | | | 468,910 | |
| XPO, Inc. | | | | | | | | |
| 6.250%, 06/01/2028 (a) | | | 512,000 | | | | 496,353 | |
| | | | | | | | 1,229,909 | |
| Utilities – 3.03% | | | | | | | | |
| IEA Energy Services LLC | | | | | | | | |
| 6.625%, 08/15/2029 (a) | | | 862,000 | | | | 828,598 | |
| TOTAL CORPORATE BONDS (Cost $15,168,872) | | | | | | | 15,114,176 | |
The accompanying notes are an integral part of these financial statements.
CROSSINGBRIDGE RESPONSIBLE CREDIT FUND
| Schedule of Investments (Continued) |
September 30, 2023
| | | Face | | | | |
| | | Amount† | | | Value | |
| MORTGAGE BACKED SECURITIES – 2.39% | | | | | | |
| | | | | | | |
| Finance and Insurance – 2.39% | | | | | | |
| BX Commercial Mortgage Trust 2021-VOLT | | | | | | |
| 2021-VOLT, 6.547% (1 Month SOFR + 1.214%), | | | | | | |
| 09/15/2036 (a)(b) | | | 679,000 | | | $ | 653,541 | |
| TOTAL MORTGAGE BACKED SECURITIES (Cost $649,898) | | | | | | | 653,541 | |
| | | | | | | | | |
| | | Number | | | | | |
| | | of Shares | | | | | |
| PREFERRED STOCKS – 0.44% | | | | | | | | |
| | | | | | | | | |
| Mining, Quarrying, and Oil and Gas Extraction – 0.44% | | | | | | | | |
| NGL Energy Partners LP | | | | | | | | |
| 9.000%, No stated maturity | | | 4,719 | | | | 118,919 | |
| TOTAL PREFERRED STOCKS (Cost $82,774) | | | | | | | 118,919 | |
| | | | | | | | | |
| REAL ESTATE INVESTMENT TRUSTS – 1.19% | | | | | | | | |
| | | | | | | | | |
| Real Estate and Rental and Leasing – 1.19% | | | | | | | | |
| CTO Realty Growth, Inc. | | | 20,000 | | | | 324,200 | |
| TOTAL REAL ESTATE INVESTMENT TRUSTS | | | | | | | | |
| (Cost $344,341) | | | | | | | 324,200 | |
| | | | | | | | | |
| MONEY MARKET FUNDS – 5.76% | | | | | | | | |
| First American Government Obligations | | | | | | | | |
| Fund – Class X, 5.265% (l) | | | 259,482 | | | | 259,482 | |
| First American Treasury Obligations | | | | | | | | |
| Fund – Class X, 5.267% (l) | | | 1,311,401 | | | | 1,311,401 | |
| TOTAL MONEY MARKET FUNDS (Cost $1,570,883) | | | | | | | 1,570,883 | |
Total Investments (Cost $28,113,129) – 102.83% | | | | | | | 28,064,473 | |
| Liabilities in Excess of Other Assets – (2.83)% | | | | | | | (771,902 | ) |
| Total Net Assets – 100.00% | | | | | | $ | 27,292,571 | |
Percentages are stated as a percent of net assets.
| † | Face amount in U.S. Dollar unless otherwise indicated. |
| (a) | Securities issued pursuant to Rule 144A under the Securities Act of 1933 and Regulation S under the Securities Act of 1933. Aggregate value of these securities is $10,542,600 or 38.63% of Fund’s net assets. |
| (b) | Variable rate security. The rate shown represents the rate at September 30, 2023. |
| (c) | The rate shown is the effective yield. |
| (d) | Illiquid security. |
| (e) | Security valued using unobservable inputs. |
The accompanying notes are an integral part of these financial statements.
CROSSINGBRIDGE RESPONSIBLE CREDIT FUND
| Schedule of Investments (Continued) |
| (f) | Foreign issued security. |
| (g) | Principal amount denominated in Euros. |
| (h) | Principal amount denominated in Norwegian Krone. |
| (i) | Principal amount denominated in Swedish Krona. |
| (j) | Non-income producing security. |
| (k) | Security in default. |
| (l) | Seven day yield as of September 30, 2023. |
Definitions:
EURIBOR – Euro-Interbank Offer Rate is a reference rate expressing the average interest rate at which eurozone banks offer unsecured short-term lending on the interbank market.
LIBOR – London Interbank Offer Rate is a benchmark rate at which banks offer to lend funds to one another in the international interbank market for short-term loans.
NIBOR – Norwegian Interbank Offer Rate is a collective term for Norwegian money market rates at different maturities. It is intended to reflect the interest rate level a bank require for unsecured money market lending in Norwegian Krone to another bank.
SOFR – Secured Overnight Financing Rate is a benchmark interest rate for dollar-denominated derivatives and loans. SOFR is based on transactions in the Treasury repurchase market and is based on data from observable transactions rather than on estimated borrowing rates.
STIBOR – Stockholm Interbank Offer Rate is a reference rate that shows the average interest rate at which a number of active banks on the Swedish money market are willing to lend to one another, without collateral, at different maturities.
The accompanying notes are an integral part of these financial statements.
CROSSINGBRIDGE RESPONSIBLE CREDIT FUND
| Schedule of Forward Currency Exchange Contracts |
September 30, 2023
| | | | | Currency | | USD Value at | | | Currency | | USD Value at | | | Unrealized | |
| Settlement | | Counter- | | to be | | September 30, | | | to be | | September 30, | | | Appreciation/ | |
| Date | | party | | Delivered | | 2023 | | | Received | | 2023 | | | (Depreciation) | |
| 10/13/23 | | U.S. Bank | | 3,219,000 | | EUR | | $ | 3,405,279 | | | 3,460,006 | | USD | | $ | 3,460,006 | | | $ | 54,727 | |
| 10/13/23 | | U.S. Bank | | 8,030,000 | | NOK | | | 751,004 | | | 750,068 | | USD | | | 750,068 | | | | (936 | ) |
| 10/13/23 | | U.S. Bank | | 11,995,000 | | SEK | | | 1,098,510 | | | 1,090,250 | | USD | | | 1,090,250 | | | | (8,260 | ) |
| 10/13/23 | | U.S. Bank | | 224,339 | | USD | | | 224,339 | | | 210,000 | | EUR | | | 222,153 | | | | (2,186 | ) |
| | | | | | | | | $ | 5,479,132 | | | | | | | $ | 5,522,477 | | | $ | 43,345 | |
EUR – Euro
NOK – Norwegian Krone
SEK – Swedish Krona
USD – U.S. Dollars
The accompanying notes are an integral part of these financial statements.
CROSSINGBRIDGE ULTRA-SHORT DURATION FUND
September 30, 2023
| | | Face | | | | |
| | | Amount† | | | Value | |
| ASSET BACKED SECURITIES – 8.65% | | | | | | |
| | | | | | | |
| Agriculture, Forestry, Fishing and Hunting – 0.53% | | | | | | |
| ARM Master Trust LLC | | | | | | |
| 2023-T1, 6.562%, 02/17/2025 (a) | | | 500,000 | | | $ | 499,310 | |
| | | | | | | | | |
| Finance and Insurance – 4.22% | | | | | | | | |
| HTS Fund I LLC | | | | | | | | |
| 2021-1, 1.410%, 08/25/2036 (a) | | | 1,929,270 | | | | 1,641,337 | |
| Lendingpoint 2022-B Asset Securitization Trust | | | | | | | | |
| 2022-B, 4.770%, 10/15/2029 (a) | | | 168,895 | | | | 167,017 | |
| MMAF Equipment Finance LLC | | | | | | | | |
| 2022-B, 5.570%, 09/09/2025 (a) | | | 2,184,296 | | | | 2,178,632 | |
| | | | | | | | 3,986,986 | |
| Manufacturing – 0.42% | | | | | | | | |
| Daimler Trucks Retail Trust 2022-1 | | | | | | | | |
| 2022-1, 5.070%, 09/16/2024 | | | 397,743 | | | | 398,021 | |
| | | | | | | | | |
| Transportation and Warehousing – 3.48% | | | | | | | | |
| LAD Auto Receivables Trust 2023-1 | | | | | | | | |
| A-2, 5.680%, 10/15/2026 (a) | | | 593,217 | | | | 591,855 | |
| LAD Auto Receivables Trust 2023-3 | | | | | | | | |
| A-2, 6.090%, 06/15/2026 (a) | | | 2,597,000 | | | | 2,599,820 | |
| Santander Consumer Auto Receivables Trust 2021-B | | | | | | | | |
| B, 1.450%, 10/16/2028 (a) | | | 100,845 | | | | 99,653 | |
| | | | | | | | 3,291,328 | |
| TOTAL ASSET BACKED SECURITIES (Cost $8,255,841) | | | | | | | 8,175,645 | |
| | | | | | | | | |
| BANK LOANS – 1.47% | | | | | | | | |
| | | | | | | | | |
| Arts, Entertainment, and Recreation – 1.47% | | | | | | | | |
| Live Nation Entertainment, Inc. | | | | | | | | |
| 7.681% (1 Month LIBOR + 2.250%), 10/17/2024 (b) | | | 1,397,250 | | | | 1,390,264 | |
| TOTAL BANK LOANS (Cost $1,395,503) | | | | | | | 1,390,264 | |
| | | | | | | | | |
| COMMERCIAL PAPER – 4.82% | | | | | | | | |
| | | | | | | | | |
| Information – 1.85% | | | | | | | | |
| Crown Castle, Inc. | | | | | | | | |
| 6.143%, 10/19/2023 (c) | | | 1,750,000 | | | | 1,744,365 | |
The accompanying notes are an integral part of these financial statements.
CROSSINGBRIDGE ULTRA-SHORT DURATION FUND
| Schedule of Investments (Continued) |
September 30, 2023
| | | Face | | | | |
| | | Amount† | | | Value | |
| COMMERCIAL PAPER – 4.82% (CONTINUED) | | | | | | |
| | | | | | | |
| Manufacturing – 2.97% | | | | | | |
| Jabil, Inc. | | | | | | |
| 5.884%, 10/06/2023 (c) | | | 2,216,000 | | | $ | 2,213,352 | |
| Parker Hannifin Corp. | | | | | | | | |
| 5.643%, 10/17/2023 (c) | | | 601,000 | | | | 599,354 | |
| | | | | | | | 2,812,706 | |
| TOTAL COMMERCIAL PAPER (Cost $4,558,389) | | | | | | | 4,557,071 | |
| | | | | | | | | |
| CONVERTIBLE BONDS – 0.98% | | | | | | | | |
| | | | | | | | | |
| Information – 0.98% | | | | | | | | |
| Leafly Holdings, Inc. | | | | | | | | |
| 8.000%, 01/31/2025 (d)(e) | | | 1,089,000 | | | | 925,650 | |
| TOTAL CONVERTIBLE BONDS (Cost $1,089,000) | | | | | | | 925,650 | |
| | | | | | | | | |
| CORPORATE BONDS – 70.35% | | | | | | | | |
| | | | | | | | | |
| Accommodation and Food Services – 2.87% | | | | | | | | |
| Aramark Services, Inc. | | | | | | | | |
| 6.375%, 05/01/2025 (a) | | | 2,668,000 | | | | 2,710,528 | |
| | | | | | | | | |
| Construction – 0.17% | | | | | | | | |
| K Hovnanian Enterprises, Inc. | | | | | | | | |
| 10.000%, 11/15/2025 (a) | | | 163,000 | | | | 163,828 | |
| | | | | | | | | |
| Finance and Insurance – 4.72% | | | | | | | | |
| Brookfield Finance, Inc. | | | | | | | | |
| 4.000%, 04/01/2024 | | | 106,000 | | | | 104,849 | |
| Enceladus Development Venture III LLC | | | | | | | | |
| 10.000%, 11/15/2023 (a) | | | 1,000,000 | | | | 1,000,000 | |
| Fidelity National Information Services, Inc. | | | | | | | | |
| 0.600%, 03/01/2024 | | | 1,393,000 | | | | 1,361,895 | |
| Icahn Enterprises LP / Icahn Enterprises Finance Corp. | | | | | | | | |
| 4.750%, 09/15/2024 | | | 1,723,000 | | | | 1,661,029 | |
| Novedo Holding AB | | | | | | | | |
| 10.564% (3 Month STIBOR + 6.500%), 11/26/2024 (b)(f)(i) | | SEK 3,750,000 | | | | 333,793 | |
| | | | | | | | 4,461,566 | |
| Health Care and Social Assistance – 2.93% | | | | | | | | |
| Laboratory Corp of America Holdings | | | | | | | | |
| 4.000%, 11/01/2023 | | | 2,775,000 | | | | 2,770,310 | |
The accompanying notes are an integral part of these financial statements.
CROSSINGBRIDGE ULTRA-SHORT DURATION FUND
| Schedule of Investments (Continued) |
September 30, 2023
| | | Face | | | | |
| | | Amount† | | | Value | |
| CORPORATE BONDS – 70.35% (CONTINUED) | | | | | | |
| | | | | | | |
| Information – 5.38% | | | | | | |
| Calligo UK Ltd. | | | | | | |
| 12.472% (3 Month EURIBOR + 8.500%), 12/29/2024 (b)(f)(g) | | EUR 400,000 | | | $ | 391,183 | |
| Cengage Learning, Inc. | | | | | | | |
| 9.500%, 06/15/2024 (a) | | | 222,000 | | | | 223,511 | |
| Fox Corp. | | | | | | | | |
| 4.030%, 01/25/2024 | | | 2,250,000 | | | | 2,234,136 | |
| OpNet S.p.A. | | | | | | | | |
| 10.972% (3 Month EURIBOR + 7.000%), 02/09/2026 (a)(b)(f)(g) | | EUR 2,108,000 | | | | 2,242,612 | |
| | | | | | | | 5,091,442 | |
| Manufacturing – 35.44% | | | | | | | | |
| Ball Corp. | | | | | | | | |
| 4.000%, 11/15/2023 | | | 2,875,000 | | | | 2,867,059 | |
| Bayer US Finance II LLC | | | | | | | | |
| 3.875%, 12/15/2023 (a) | | | 750,000 | | | | 746,901 | |
| 6.681% (3 Month LIBOR + 1.272%), 12/15/2023 (a)(b) | | | 1,075,000 | | | | 1,075,575 | |
| Broadcom, Inc. | | | | | | | | |
| 2.250%, 11/15/2023 | | | 3,725,000 | | | | 3,708,438 | |
| Cannabist Co. Holdings, Inc. | | | | | | | | |
| 13.000%, 05/14/2024 (f) | | | 1,026,000 | | | | 1,027,191 | |
| 9.500%, 02/03/2026 (f) | | | 2,016,000 | | | | 1,743,840 | |
| Chobani LLC / Chobani Finance Corp, Inc. | | | | | | | | |
| 7.500%, 04/15/2025 (a) | | | 333,000 | | | | 330,183 | |
| CNH Industrial Capital LLC | | | | | | | | |
| 4.200%, 01/15/2024 | | | 2,233,000 | | | | 2,220,671 | |
| Eastman Chemical Co. | | | | | | | | |
| 7.250%, 01/15/2024 | | | 2,200,000 | | | | 2,205,889 | |
| Elkem ASA | | | | | | | | |
| 6.290% (3 Month NIBOR + 1.550%), 08/31/2028 (b)(f)(h) | | NOK 25,000,000 | | | | 2,368,056 | |
| General Mills, Inc. | | | | | | | | |
| 6.580% (3 Month SOFR + 1.272%), 10/17/2023 (b) | | | 1,440,000 | | | | 1,440,389 | |
| Graphic Packaging International LLC | | | | | | | | |
| 0.821%, 04/15/2024 (a) | | | 1,300,000 | | | | 1,259,942 | |
| Hewlett Packard Enterprise Co. | | | | | | | | |
| 4.450%, 10/02/2023 | | | 2,550,000 | | | | 2,550,000 | |
| HF Sinclair Corp. | | | | | | | | |
| 2.625%, 10/01/2023 | | | 1,558,000 | | | | 1,558,000 | |
| Horizon Therapeutics USA, Inc. | | | | | | | | |
| 5.500%, 08/01/2027 (a) | | | 2,567,000 | | | | 2,637,593 | |
| Microchip Technology, Inc. | | | | | | | | |
| 0.972%, 02/15/2024 | | | 1,000,000 | | | | 981,714 | |
The accompanying notes are an integral part of these financial statements.
CROSSINGBRIDGE ULTRA-SHORT DURATION FUND
| Schedule of Investments (Continued) |
September 30, 2023
| | | Face | | | | |
| | | Amount† | | | Value | |
| CORPORATE BONDS – 70.35% (CONTINUED) | | | | | | |
| | | | | | | |
| Manufacturing – 35.44% (Continued) | | | | | | |
| Qorvo, Inc. | | | | | | |
| 1.750%, 12/15/2024 (a) | | | 1,400,000 | | | $ | 1,317,180 | |
| Stryker Corp. | | | | | | | | |
| 0.600%, 12/01/2023 | | | 1,573,000 | | | | 1,559,034 | |
| Trulieve Cannabis Corp. | | | | | | | | |
| 9.750%, 06/18/2024 (f) | | | 1,950,000 | | | | 1,913,437 | |
| | | | | | | | 33,511,092 | |
| Mining, Quarrying, and Oil and Gas Extraction – 7.83% | | | | | | | | |
| Glencore Funding LLC | | | | | | | | |
| 4.625%, 04/29/2024 (a) | | | 1,750,000 | | | | 1,733,211 | |
| Mime Petroleum AS | | | | | | | | |
| 9.750%, 09/17/2026 (a)(f) | | | 702,526 | | | | 660,374 | |
| NGL Energy Partners LP / NGL Energy Finance Corp. | | | | | | | | |
| 6.125%, 03/01/2025 | | | 2,350,000 | | | | 2,309,445 | |
| PDC Energy, Inc. | | | | | | | | |
| 5.750%, 05/15/2026 | | | 2,702,000 | | | | 2,696,934 | |
| | | | | | | | 7,399,964 | |
| Professional, Scientific, and Technical Services – 4.63% | | | | | | | | |
| Getty Images, Inc. | | | | | | | | |
| 9.750%, 03/01/2027 (a) | | | 827,000 | | | | 827,011 | |
| Interpublic Group of Companies, Inc. | | | | | | | | |
| 4.200%, 04/15/2024 | | | 2,361,000 | | | | 2,334,628 | |
| Teledyne Technologies, Inc. | | | | | | | | |
| 0.950%, 04/01/2024 | | | 1,250,000 | | | | 1,217,023 | |
| | | | | | | | 4,378,662 | |
| Real Estate and Rental and Leasing – 4.02% | | | | | | | | |
| American Tower Corp. | | | | | | | | |
| 5.000%, 02/15/2024 | | | 1,574,000 | | | | 1,567,862 | |
| REX – Real Estate Exchange, Inc. | | | | | | | | |
| 6.000%, 03/15/2025 (a) | | | 1,125,000 | | | | 1,102,950 | |
| Triton Container International Ltd. | | | | | | | | |
| 1.150%, 06/07/2024 (a)(f) | | | 1,172,000 | | | | 1,128,075 | |
| | | | | | | | 3,798,887 | |
| Transportation and Warehousing – 0.72% | | | | | | | | |
| Norfolk Southern Corp. | | | | | | | | |
| 3.850%, 01/15/2024 | | | 497,000 | | | | 494,059 | |
| Uber Technologies, Inc. | | | | | | | | |
| 7.500%, 05/15/2025 (a) | | | 183,000 | | | | 184,350 | |
| | | | | | | | 678,409 | |
The accompanying notes are an integral part of these financial statements.
CROSSINGBRIDGE ULTRA-SHORT DURATION FUND
| Schedule of Investments (Continued) |
September 30, 2023
| | | Face | | | | |
| | | Amount† | | | Value | |
| CORPORATE BONDS – 70.35% (CONTINUED) | | | | | | |
| | | | | | | |
| Utilities – 1.64% | | | | | | |
| Monongahela Power Co. | | | | | | |
| 4.100%, 04/15/2024 (a) | | | 1,567,000 | | | $ | 1,552,253 | |
| TOTAL CORPORATE BONDS (Cost $67,026,097) | | | | | | | 66,516,941 | |
| | | | | | | | | |
| MORTGAGE BACKED SECURITIES – 10.97% | | | | | | | | |
| | | | | | | | | |
| Finance and Insurance – 10.97% | | | | | | | | |
| BX Commercial Mortgage Trust 2019-XL | | | | | | | | |
| 2019-XL, 6.367% (1 Month SOFR + 1.034%), 10/15/2036 (a)(b) | | | 913,331 | | | | 911,026 | |
| BX Commercial Mortgage Trust 2021-SOAR | | | | | | | | |
| 2021-SOAR, 6.317% (1 Month SOFR + 0.984%), | | | | | | | | |
| 06/15/2038 (a)(b) | | | 1,219,924 | | | | 1,190,743 | |
| BX Commercial Mortgage Trust 2021-VOLT | | | | | | | | |
| 2021-VOLT, 6.547% (1 Month SOFR + 1.214%), | | | | | | | | |
| 09/15/2036 (a)(b) | | | 2,424,000 | | | | 2,333,114 | |
| CAMB Commercial Mortgage Trust 2019-LIFE | | | | | | | | |
| 2019-LIFE, 6.830% (1 Month SOFR + 1.497%), | | | | | | | | |
| 12/15/2037 (a)(b) | | | 930,000 | | | | 921,065 | |
| Cold Storage Trust 2020-ICE5 | | | | | | | | |
| 2020-ICE5, 7.547% (1 Month SOFR + 2.214%), | | | | | | | | |
| 11/15/2037 (a)(b) | | | 1,058,681 | | | | 1,052,278 | |
| Credit Suisse Mortgage Capital Certificates 2019-ICE4 | | | | | | | | |
| 2019-ICE4, 6.980% (1 Month SOFR + 1.647%), | | | | | | | | |
| 05/15/2036 (a)(b) | | | 2,796,044 | | | | 2,778,590 | |
| Life 2022-BMR Mortgage Trust | | | | | | | | |
| A-1, 6.627% (1 Month SOFR + 1.295%), 05/15/2039 (a)(b) | | | 1,092,000 | | | | 1,073,848 | |
| SMRT 2022-MINI | | | | | | | | |
| 2022-MINI, 6.683% (1 Month SOFR + 1.350%), | | | | | | | | |
| 01/15/2039 (a)(b) | | | 114,000 | | | | 111,002 | |
| TOTAL MORTGAGE BACKED SECURITIES | | | | | | | | |
| (Cost $10,342,814) | | | | | | | 10,371,666 | |
| | | | | | | | | |
| SPECIAL PURPOSE ACQUISITION COMPANIES – 0.00% | | | | | | | | |
| Berenson Acquisition Corp. Founder Shares (d)(e)(j) | | | 1,827 | | | | — | |
| TOTAL SPECIAL PURPOSE ACQUISITION COMPANIES | | | | | | | | |
| (Cost $7) | | | | | | | — | |
| | | | | | | | | |
| U.S. TREASURY OBLIGATIONS – 1.57% | | | | | | | | |
| United States Treasury Bill | | | | | | | | |
| 5.209%, 11/16/2023 (c) | | | 1,500,000 | | | | 1,490,081 | |
| TOTAL U.S. TREASURY OBLIGATIONS (Cost $1,490,417) | | | | | | | 1,490,081 | |
The accompanying notes are an integral part of these financial statements.
CROSSINGBRIDGE ULTRA-SHORT DURATION FUND
| Schedule of Investments (Continued) |
September 30, 2023
| | | Number | | | | |
| | | of Shares | | | Value | |
| WARRANTS – 0.00% | | | | | | |
| Leafly Holdings, Inc. (j) | | | | | | |
| Expiration: 11/07/2026, Exercise Price: $11.50 | | | 5,553 | | | $ | 194 | |
| TOTAL WARRANTS (Cost $0) | | | | | | | 194 | |
| | | | | | | | | |
| MONEY MARKET FUNDS – 1.77% | | | | | | | | |
| First American Treasury Obligations | | | | | | | | |
| Fund – Class X, 5.267% (k) | | | 1,670,493 | | | | 1,670,493 | |
| TOTAL MONEY MARKET FUNDS (Cost $1,670,493) | | | | | | | 1,670,493 | |
Total Investments (Cost $95,828,561) – 100.58% | | | | | | | 95,098,005 | |
| Liabilities in Excess of Other Assets – (0.58)% | | | | | | | (552,523 | ) |
| Total Net Assets – 100.00% | | | | | | $ | 94,545,482 | |
Percentages are stated as a percent of net assets.
| † | Face amount in U.S. Dollar unless otherwise indicated. |
| (a) | Securities issued pursuant to Rule 144A under the Securities Act of 1933 and Regulation S under the Securities Act of 1933. Aggregate value of these securities is $39,045,367 or 41.30% of Fund’s net assets. |
| (b) | Variable rate security. The rate shown represents the rate at September 30, 2023. |
| (c) | The rate shown is the effective yield. |
| (d) | Illiquid security. |
| (e) | Security valued using unobservable inputs. |
| (f) | Foreign issued security. |
| (g) | Principal amount denominated in Euros. |
| (h) | Principal amount denominated in Norwegian Krone. |
| (i) | Principal amount denominated in Swedish Krona. |
| (j) | Non-income producing security. |
| (k) | Seven day yield as of September 30, 2023. |
Definitions:
EURIBOR – Euro-Interbank Offer Rate is a reference rate expressing the average interest rate at which eurozone banks offer unsecured short-term lending on the interbank market.
LIBOR – London Interbank Offer Rate is a benchmark rate at which banks offer to lend funds to one another in the international interbank market for short-term loans.
NIBOR – Norwegian Interbank Offer Rate is a collective term for Norwegian money market rates at different maturities. It is intended to reflect the interest rate level a bank require for unsecured money market lending in Norwegian Krone to another bank.
SOFR – Secured Overnight Financing Rate is a benchmark interest rate for dollar-denominated derivatives and loans. SOFR is based on transactions in the Treasury repurchase market and is based on data from observable transactions rather than on estimated borrowing rates.
STIBOR – Stockholm Interbank Offer Rate is a reference rate that shows the average interest rate at which a number of active banks on the Swedish money market are willing to lend to one another, without collateral, at different maturities.
The accompanying notes are an integral part of these financial statements.
CROSSINGBRIDGE ULTRA-SHORT DURATION FUND
| Schedule of Forward Currency Exchange Contracts |
September 30, 2023
| | | | | Currency | | USD Value at | | | Currency | | USD Value at | | | Unrealized | |
| Settlement | | Counter- | | to be | | September 30, | | | to be | | September 30, | | | Appreciation/ | |
| Date | | party | | Delivered | | 2023 | | | Received | | 2023 | | | (Depreciation) | |
| 10/13/23 | | U.S. Bank | | 3,335,000 | | EUR | | $ | 3,527,992 | | | 3,584,691 | | USD | | $ | 3,584,691 | | | $ | 56,699 | |
| 10/13/23 | | U.S. Bank | | 25,100,000 | | NOK | | | 2,347,470 | | | 2,344,545 | | USD | | | 2,344,545 | | | | (2,925 | ) |
| 10/13/23 | | U.S. Bank | | 3,638,500 | | SEK | | | 333,216 | | | 328,155 | | USD | | | 328,155 | | | | (5,061 | ) |
| 10/13/23 | | U.S. Bank | | 862,102 | | USD | | | 862,102 | | | 807,000 | | EUR | | | 853,700 | | | | (8,402 | ) |
| | | | | | | | | $ | 7,070,780 | | | | | | | $ | 7,111,091 | | | $ | 40,311 | |
EUR – Euro
NOK – Norwegian Krone
SEK – Swedish Krona
USD – U.S. Dollars
The accompanying notes are an integral part of these financial statements.
CROSSINGBRIDGE PRE-MERGER SPAC ETF
September 30, 2023
| | | Face | | | | |
| | | Amount† | | | Value | |
| COMMERCIAL PAPER – 10.12% | | | | | | |
| | | | | | | |
| Information – 1.44% | | | | | | |
| Crown Castle International Corp. | | | | | | |
| 5.346%, 11/02/2023 (a) | | | 1,000,000 | | | $ | 994,488 | |
| | | | | | | | | |
| Manufacturing – 2.89% | | | | | | | | |
| General Motors Financial Co., Inc. | | | | | | | | |
| 5.801%, 10/11/2023 (a) | | | 1,000,000 | | | | 998,148 | |
| Nutrien Ltd. | | | | | | | | |
| 5.750%, 10/23/2023 (a) | | | 1,000,000 | | | | 996,311 | |
| | | | | | | | 1,994,459 | |
| Mining, Quarrying, and Oil and Gas Extraction – 4.34% | | | | | | | | |
| Energy Transfer LP | | | | | | | | |
| 5.806%, 10/04/2023 (a) | | | 1,000,000 | | | | 999,204 | |
| Glencore Funding LLC | | | | | | | | |
| 5.972%, 10/17/2023 (a) | | | 1,000,000 | | | | 997,205 | |
| Targa Resources Corp. | | | | | | | | |
| 5.808%, 10/23/2023 (a) | | | 1,000,000 | | | | 996,521 | |
| | | | | | | | 2,992,930 | |
| Retail Trade – 1.45% | | | | | | | | |
| Walgreens Boots Alliance, Inc. | | | | | | | | |
| 5.418%, 10/13/2023 (a) | | | 1,000,000 | | | | 997,674 | |
| TOTAL COMMERCIAL PAPER (Cost $6,980,862) | | | | | | | 6,979,551 | |
| | | | | | | | | |
| | | Number of | | | | | |
| | | Shares | | | | | |
| SPECIAL PURPOSE ACQUISITION COMPANIES – 84.08% | | | | | | | | |
| 99 Acquisition Group, Inc. (f) | | | 37,250 | | | | 386,282 | |
| Alchemy Investments Acquisition Corp. 1 (d)(f) | | | 236,120 | | | | 2,436,758 | |
| Ares Acquisition Corp. II (d)(f) | | | 131,200 | | | | 1,347,424 | |
| AP Acquisition Corp. (d)(f) | | | 15,775 | | | | 173,288 | |
| Berenson Acquisition Corp. Founder Shares (b)(c)(f) | | | 922 | | | | — | |
| Bowen Acquisition Corp. (d)(f) | | | 280,680 | | | | 2,862,936 | |
| Bukit Jalil Global Acquisition 1 Ltd. (d)(f) | | | 250,000 | | | | 2,582,500 | |
| Cartesian Growth Corp. II (d)(f) | | | 281,873 | | | | 3,044,228 | |
| Distoken Acquisition Corp. (d)(f) | | | 99,604 | | | | 1,049,826 | |
| Enphys Acquisition Corp. (d)(f) | | | 298,257 | | | | 3,131,699 | |
| ESH Acquisition Corp. (f) | | | 150,000 | | | | 1,518,000 | |
| Four Leaf Acquisition Corp. (f) | | | 250,000 | | | | 2,620,000 | |
| Golden Star Acquisition Corp. (d)(f) | | | 100,000 | | | | 1,030,000 | |
| Haymaker Acquisition Corp. 4 (d)(f) | | | 250,000 | | | | 2,542,500 | |
The accompanying notes are an integral part of these financial statements.
CROSSINGBRIDGE PRE-MERGER SPAC ETF
| Schedule of Investments (Continued) |
September 30, 2023
| | | Number of | | | | |
| | | Shares | | | Value | |
| SPECIAL PURPOSE ACQUISITION | | | | | | |
| COMPANIES – 84.08% (CONTINUED) | | | | | | |
| Infinite Acquisition Corp. (d)(f) | | | 173,680 | | | $ | 1,876,612 | |
| Inflection Point Acquisition Corp. II (d)(f) | | | 250,460 | | | | 2,557,197 | |
| Innovative International Acquisition Corp. (d)(f) | | | 8,966 | | | | 99,792 | |
| Israel Acquisitions Corp. (d)(f) | | | 273,375 | | | | 2,884,106 | |
| Keen Vision Acquisition Corp. (d)(f) | | | 312,367 | | | | 3,179,896 | |
| Mars Acquisition Corp. (d)(f) | | | 259,107 | | | | 2,723,215 | |
| Nabors Energy Transition Corp. II (d)(f) | | | 20,000 | | | | 203,600 | |
| Oak Woods Acquisition Corp. (d)(f) | | | 255,000 | | | | 2,666,025 | |
| Pearl Holdings Acquisition Corp. (d)(f) | | | 298,622 | | | | 3,201,228 | |
| Pono Capital Three, Inc. (d)(f) | | | 219,270 | | | | 2,314,395 | |
| Revelstone Capital Acquisition Corp. Founder Shares (b)(c)(f) | | | 6,000 | | | | 388 | |
| Screaming Eagle Acquisition Corp. (d)(f) | | | 305,436 | | | | 3,194,861 | |
| SDCL EDGE Acquisition Corp. (d)(f) | | | 113,680 | | | | 1,205,008 | |
| TMT Acquisition Corp. (d)(f) | | | 151,544 | | | | 1,580,604 | |
| TortoiseEcofin Acquisition Corp. III (d)(f) | | | 287,007 | | | | 3,007,833 | |
| Trailblazer Merger Corp. I (f) | | | 250,000 | | | | 2,582,500 | |
| TOTAL SPECIAL PURPOSE ACQUISITION COMPANIES | | | | | | | | |
| (Cost $56,082,955) | | | | | | | 58,002,701 | |
| | | | | | | | | |
| WARRANTS – 0.01% | | | | | | | | |
| Financials Acquisition Corp. (d)(e)(f) | | | | | | | | |
| Expiration: 04/04/2027, Exercise Price: $11.50 | | | 8,777 | | | | 322 | |
| Hambro Perks Acquisition Corp. (c)(d)(e)(f) | | | | | | | | |
| Expiration: 01/07/2026, Exercise Price: $11.50 | | | 37,500 | | | | 0 | |
| Hiro Metaverse Acquisitions I SA (d)(e)(f) | | | | | | | | |
| Expiration: 12/21/2026, Exercise Price: $11.50 | | | 22,500 | | | | 4,255 | |
| SMX Security Matters Plc (d)(f) | | | | | | | | |
| Expiration: 03/07/2028, Exercise Price: $11.50 | | | 425 | | | | 6 | |
| TOTAL WARRANTS (Cost $17,596) | | | | | | | 4,583 | |
| | | | | | | | | |
| MONEY MARKET FUNDS – 5.83% | | | | | | | | |
| First American Treasury Obligations | | | | | | | | |
| Fund – Class X, 5.267% (g) | | | 4,024,078 | | | | 4,024,078 | |
| TOTAL MONEY MARKET FUNDS (Cost $4,024,078) | | | | | | | 4,024,078 | |
Total Investments (Cost $67,105,491) – 100.04% | | | | | | | 69,010,913 | |
| Liabilities in Excess of Other Assets – (0.04)% | | | | | | | (29,203 | ) |
| Total Net Assets – 100.00% | | | | | | $ | 68,981,710 | |
Percentages are stated as a percent of net assets.
| † | Face amount in U.S. Dollar unless otherwise indicated. |
The accompanying notes are an integral part of these financial statements.
CROSSINGBRIDGE PRE-MERGER SPAC ETF
| Schedule of Investments (Continued) |
| (a) | The rate shown is the effective yield. |
| (b) | Illiquid security. |
| (c) | Security valued using unobservable inputs. |
| (d) | Foreign issued security. |
| (e) | Holding denominated in British Pound. |
| (f) | Non-income producing security. |
| (g) | Seven day yield as of September 30, 2023. |
The accompanying notes are an integral part of these financial statements.
RIVERPARK STRATEGIC INCOME FUND
September 30, 2023
| | | Face | | | | |
| | | Amount† | | | Value | |
| ASSET BACKED SECURITIES – 1.36% | | | | | | |
| | | | | | | |
| Transportation and Warehousing – 1.36% | | | | | | |
| Hawaiian Airlines 2013-1 Class A Pass Through Certificates | | | | | | |
| 2013-1, 3.900%, 01/15/2026 | | | 5,668,542 | | | $ | 5,042,939 | |
| TOTAL ASSET BACKED SECURITIES (Cost $5,218,014) | | | | | | | 5,042,939 | |
| | | | | | | | | |
| BANK LOANS – 14.30% | | | | | | | | |
| | | | | | | | | |
| Accommodation and Food Services – 1.82% | | | | | | | | |
| Carrols Restaurant Group, Inc. | | | | | | | | |
| 8.666% (1 Month LIBOR + 3.250%), 04/30/2026 (b) | | | 7,000,000 | | | | 6,784,412 | |
| | | | | | | | | |
| Information – 2.51% | | | | | | | | |
| American Greetings Corp. | | | | | | | | |
| 11.316% (1 Month LIBOR + 6.000%), 04/06/2028 (b) | | | 2,707,395 | | | | 2,715,856 | |
| Cengage Learning, Inc. | | | | | | | | |
| 10.323% (3 Month SOFR + 4.750%), 07/14/2026 (b) | | | 6,666,619 | | | | 6,629,086 | |
| | | | | | | | 9,344,944 | |
| Manufacturing – 5.37% | | | | | | | | |
| Chobani LLC | | | | | | | | |
| 8.931% (1 Month LIBOR + 3.500%), 10/23/2027 (b) | | | 4,638,153 | | | | 4,634,941 | |
| Cook & Boardman Group, LLC | | | | | | | | |
| 11.165% (1 Month SOFR + 5.750%), 10/18/2025 (b) | | | 635,593 | | | | 619,703 | |
| Crocs, Inc. | | | | | | | | |
| 8.540% (3 Month LIBOR + 3.500%), 02/19/2029 (b) | | | 2,039,173 | | | | 1,960,354 | |
| Diebold Nixdorf, Inc. | | | | | | | | |
| 12.891% (3 Month SOFR + 7.500%), 08/11/2028 (b) | | | 1,252,156 | | | | 1,257,897 | |
| Elevate Textiles, Inc. | | | | | | | | |
| 13.892% (3 Month LIBOR + 8.500%), 09/30/2027 (b) | | | 194,360 | | | | 194,595 | |
| Energy Acquisition Co, Inc. | | | | | | | | |
| 7.500%, 06/26/2025 | | | 1,807,300 | | | | 1,735,008 | |
| 7.500%, 06/26/2025 | | | 4,309,168 | | | | 4,276,849 | |
| First Brands Group LLC | | | | | | | | |
| 10.881% (6 Month SOFR + 5.000%), 03/30/2027 (b) | | | 2,076,665 | | | | 2,054,611 | |
| 14.381% (6 Month SOFR + 8.500%), 03/24/2028 (b) | | | 3,393,361 | | | | 3,198,827 | |
| | | | | | | | 19,932,785 | |
| Mining, Quarrying, and Oil and Gas Extraction – 0.80% | | | | | | | | |
| Quarternorth Energy Holding, Inc. | | | | | | | | |
| 13.431% (1 Month LIBOR + 8.000%), 08/27/2026 (b) | | | 2,980,117 | | | | 2,973,904 | |
The accompanying notes are an integral part of these financial statements.
RIVERPARK STRATEGIC INCOME FUND
| Schedule of Investments (Continued) |
September 30, 2023
| | | Face | | | | |
| | | Amount† | | | Value | |
| BANK LOANS – 14.30% (CONTINUED) | | | | | | |
| | | | | | | |
| Professional, Scientific, and Technical Services – 1.83% | | | | | | |
| Getty Images, Inc. | | | | | | |
| 9.990% (3 Month LIBOR + 4.500%), 02/19/2026 (b) | | | 2,216,986 | | | $ | 2,216,888 | |
| Inotiv, Inc. | | | | | | | | |
| 12.477% (6 Month LIBOR + 6.750%), 09/22/2026 (b) | | | 4,749,995 | | | | 4,583,745 | |
| | | | | | | | 6,800,633 | |
| Retail Trade – 1.84% | | | | | | | | |
| Mountaineer Merger Corp. | | | | | | | | |
| 12.634% (3 Month LIBOR + 7.000%), 10/22/2028 (b) | | | 5,837,404 | | | | 4,650,484 | |
| The Container Store, Inc. | | | | | | | | |
| 10.402% (3 Month LIBOR + 4.750%), 01/31/2026 (b) | | | 2,416,970 | | | | 2,199,443 | |
| | | | | | | | 6,849,927 | |
| Wholesale Trade – 0.13% | | | | | | | | |
| Dairyland USA Corp. | | | | | | | | |
| 10.166% (1 Month SOFR + 4.750%), 08/17/2029 (b) | | | 502,025 | | | | 504,849 | |
| TOTAL BANK LOANS (Cost $53,482,006) | | | | | | | 53,191,454 | |
| | | | | | | | | |
| COMMERCIAL PAPER – 17.63% | | | | | | | | |
| | | | | | | | | |
| Information – 1.86% | | | | | | | | |
| Crown Castle, Inc. | | | | | | | | |
| 6.143%, 10/19/2023 (c) | | | 6,950,000 | | | | 6,927,621 | |
| | | | | | | | | |
| Manufacturing – 10.10% | | | | | | | | |
| Bacardi-Martini B.V. | | | | | | | | |
| 5.881%, 10/24/2023 (c) | | | 6,364,000 | | | | 6,339,609 | |
| Campbell Soup Co. | | | | | | | | |
| 5.719%, 10/05/2023 (c) | | | 3,602,000 | | | | 3,598,744 | |
| General Motors Financial Co, Inc. | | | | | | | | |
| 5.880%, 11/20/2023 (c) | | | 7,422,000 | | | | 7,360,549 | |
| International Flavors & Fragrances, Inc. | | | | | | | | |
| 5.502%, 10/26/2023 (c) | | | 6,255,000 | | | | 6,229,062 | |
| Jabil, Inc. | | | | | | | | |
| 5.884%, 10/06/2023 (c) | | | 8,801,000 | | | | 8,790,484 | |
| Parker Hannifin Corp. | | | | | | | | |
| 5.643%, 10/17/2023 (c) | | | 5,238,000 | | | | 5,223,653 | |
| | | | | | | | 37,542,101 | |
The accompanying notes are an integral part of these financial statements.
RIVERPARK STRATEGIC INCOME FUND
| Schedule of Investments (Continued) |
September 30, 2023
| | | Face | | | | |
| | | Amount† | | | Value | |
| COMMERCIAL PAPER – 17.63% (CONTINUED) | | | | | | |
| | | | | | | |
| Mining, Quarrying, and Oil and Gas Extraction – 3.83% | | | | | | |
| Energy Transfer LP | | | | | | |
| 5.806%, 10/04/2023 (c) | | | 5,316,000 | | | $ | 5,311,771 | |
| Glencore Funding LLC | | | | | | | | |
| 5.972%, 10/17/2023 (c) | | | 4,494,000 | | | | 4,481,441 | |
| Targa Resources Corp. | | | | | | | | |
| 5.808%, 10/23/2023 (c) | | | 4,465,000 | | | | 4,449,465 | |
| | | | | | | | 14,242,677 | |
| Retail Trade – 1.84% | | | | | | | | |
| Walgreens Boots Alliance, Inc. | | | | | | | | |
| 5.437%, 10/13/2023 (c) | | | 6,867,000 | | | | 6,851,025 | |
| TOTAL COMMERCIAL PAPER (Cost $65,577,964) | | | | | | | 65,563,424 | |
| | | | | | | | | |
| COMMON STOCKS – 1.37% | | | | | | | | |
| | | | | | | | | |
| Construction – 0.02% | | | | | | | | |
| Southland Holdings, Inc. (k) | | | 15,374 | | | | 93,320 | |
| | | | | | | | | |
| Finance and Insurance – 0.12% | | | | | | | | |
| Bitcoin Depot, Inc. (k) | | | 161,950 | | | | 425,928 | |
| KORE Group Holdings, Inc. (k) | | | 20,218 | | | | 12,232 | |
| | | | | | | | 438,160 | |
| Information – 0.38% | | | | | | | | |
| Verizon Communications, Inc. | | | 43,100 | | | | 1,396,871 | |
| | | | | | | | | |
| Manufacturing – 0.70% | | | | | | | | |
| Elevate Textiles, Inc. (k) | | | 16,903 | | | | 59,161 | |
| RA PARENT, Inc. (d)(e) | | | 43 | | | | 2,553,888 | |
| | | | | | | | 2,613,049 | |
| Mining, Quarrying, and Oil and Gas Extraction – 0.15% | | | | | | | | |
| Quarternorth Energy Holding, Inc. | | | 4,187 | | | | 548,497 | |
| | | | | | | | | |
| Professional, Scientific, and Technical Services – 0.00% | | | | | | | | |
| GemmaCert Ltd. (d)(e)(k) | | | 21,135 | | | | — | |
| TOTAL COMMON STOCKS (Cost $5,553,046) | | | | | | | 5,089,897 | |
The accompanying notes are an integral part of these financial statements.
RIVERPARK STRATEGIC INCOME FUND
| Schedule of Investments (Continued) |
September 30, 2023
| | | Face | | | | |
| | | Amount† | | | Value | |
| CONVERTIBLE BONDS – 2.38% | | | | | | |
| | | | | | | |
| Information – 2.38% | | | | | | |
| BuzzFeed, Inc. | | | | | | |
| 8.500%, 12/03/2026 (a) | | | 5,400,000 | | | $ | 3,472,421 | |
| Leafly Holdings, Inc. | | | | | | | | |
| 8.000%, 01/31/2025 (d)(e) | | | 4,163,000 | | | | 3,538,550 | |
| UpHealth, Inc. | | | | | | | | |
| 6.250%, 06/15/2026 (a)(l) | | | 3,906,000 | | | | 1,152,270 | |
| 14.320% (SOFR + 9.000%), 12/15/2025 (a)(b)(l) | | | 850,000 | | | | 675,750 | |
| TOTAL CONVERTIBLE BONDS (Cost $14,079,283) | | | | | | | 8,838,991 | |
| | | | | | | | | |
| CORPORATE BONDS – 47.51% | | | | | | | | |
| | | | | | | | | |
| Accommodation and Food Services – 2.89% | | | | | | | | |
| Aramark Services, Inc. | | | | | | | | |
| 6.375%, 05/01/2025 (a) | | | 10,593,000 | | | | 10,761,852 | |
| | | | | | | | | |
| Agriculture, Forestry, Fishing and Hunting – 0.52% | | | | | | | | |
| Austevoll Seafood ASA | | | | | | | | |
| 6.710% (3 Month NIBOR + 2.000%), 06/21/2028 (b)(f)(h) | | NOK 20,500,000 | | | | 1,926,070 | |
| | | | | | | | | |
| Arts, Entertainment, and Recreation – 0.63% | | | | | | | | |
| DEAG Deutsche Entertainment AG | | | | | | | | |
| 8.000%, 07/12/2026 (f)(g) | | EUR 2,161,000 | | | | 2,329,639 | |
| | | | | | | | | |
| Construction – 0.72% | | | | | | | | |
| Five Point Operating Co LP / Five Point Capital Corp. | | | | | | | | |
| 7.875%, 11/15/2025 (a) | | | 2,152,000 | | | | 2,032,967 | |
| K Hovnanian Enterprises, Inc. | | | | | | | | |
| 10.000%, 11/15/2025 (a) | | | 648,000 | | | | 651,293 | |
| | | | | | | | 2,684,260 | |
| Educational Services – 0.04% | | | | | | | | |
| Hercules Achievement Inc / Varsity Brands Holding Co, Inc. | | | | | | | | |
| 13.503% (3 Month SOFR + 8.262%), 12/22/2024 (a)(b) | | | 160,000 | | | | 159,604 | |
| | | | | | | | | |
| Finance and Insurance – 8.21% | | | | | | | | |
| Esmaeilzadeh Holding AB | | | | | | | | |
| 11.435% (3 Month STIBOR + 7.500%), 01/26/2025 (b)(f)(i) | | SEK 20,000,000 | | | | 1,737,614 | |
| Freedom Mortgage Corp. | | | | | | | | |
| 8.250%, 04/15/2025 (a) | | | 8,074,000 | | | | 8,083,229 | |
| Icahn Enterprises LP / Icahn Enterprises Finance Corp. | | | | | | | | |
| 4.750%, 09/15/2024 | | | 2,095,000 | | | | 2,019,650 | |
| 6.375%, 12/15/2025 | | | 4,747,000 | | | | 4,521,664 | |
The accompanying notes are an integral part of these financial statements.
RIVERPARK STRATEGIC INCOME FUND
| Schedule of Investments (Continued) |
September 30, 2023
| | | Face | | | | |
| | | Amount† | | | Value | |
| CORPORATE BONDS – 47.51% (CONTINUED) | | | | | | |
| | | | | | | |
| Finance and Insurance – 8.21% (Continued) | | | | | | |
| Novedo Holding AB | | | | | | |
| 10.560% (3 Month STIBOR + 6.500%), 11/26/2024 (b)(f)(i) | | SEK 15,000,000 | | | $ | 1,335,173 | |
| Puffin Finance SARL | | | | | | | |
| 15.000%, 09/11/2025 (f) | | | 4,411,000 | | | | 4,704,475 | |
| Stockwik Forvaltning AB | | | | | | | | |
| 12.106% (3 Month STIBOR + 8.000%), 03/20/2026 (b)(f)(i) | | SEK 27,500,000 | | | | 2,384,891 | |
| StoneX Group, Inc. | | | | | | | | |
| 8.625%, 06/15/2025 (a) | | | 5,685,000 | | | | 5,737,842 | |
| | | | | | | | 30,524,538 | |
| Information – 10.51% | | | | | | | | |
| American Greetings Corp. | | | | | | | | |
| 8.750%, 04/15/2025 (a) | | | 1,397,000 | | | | 1,384,350 | |
| Azerion Group N.V. | | | | | | | | |
| 10.628% (3 Month EURIBOR + 6.750%), 10/02/2026 (b)(f)(g) | | EUR 3,772,000 | | | | 3,908,188 | |
| Azerion Holding BV | | | | | | | | |
| 7.250%, 04/28/2024 (f)(g) | | EUR 850,000 | | | | 900,891 | |
| Bulk Infrastructure Holding AS | | | | | | | | |
| 8.990% (3 Month NIBOR + 4.500%), 10/15/2024 (b)(f)(h) | | NOK 33,000,000 | | | | 3,112,073 | |
| Cengage Learning, Inc. | | | | | | | | |
| 9.500%, 06/15/2024 (a) | | | 476,000 | | | | 479,240 | |
| Clear Channel International BV | | | | | | | | |
| 6.625%, 08/01/2025 (a)(f) | | | 4,186,000 | | | | 4,143,324 | |
| Connect Finco SARL / Connect US Finco LLC | | | | | | | | |
| 6.750%, 10/01/2026 (a)(f) | | | 3,222,000 | | | | 3,009,050 | |
| Duett Software Group AS | | | | | | | | |
| 9.450% (3 Month NIBOR + 5.000%), 04/12/2026 (b)(f)(h) | | NOK 4,589,000 | | | | 418,288 | |
| Go North Group AB | | | | | | | | |
| 14.974%, 02/09/2026 (f) | | | 5,763,870 | | | | 5,792,689 | |
| Impala BondCo Plc | | | | | | | | |
| 12.868% (3 Month STIBOR + 9.000%), 10/20/2024 (b)(f)(i) | | SEK 7,500,000 | | | | 600,934 | |
| INNOVATE Corp. | | | | | | | | |
| 8.500%, 02/01/2026 (a) | | | 7,002,000 | | | | 5,382,578 | |
| OpNet S.p.A. | | | | | | | | |
| 10.972% (3 Month EURIBOR + 7.000%), 02/09/2026 (a)(b)(f)(g) | | EUR 5,699,000 | | | | 6,062,926 | |
| WarnerMedia Holdings, Inc. | | | | | | | | |
| 5.050%, 03/15/2042 | | | 2,156,000 | | | | 1,670,392 | |
| Ziff Davis, Inc. | | | | | | | | |
| 4.625%, 10/15/2030 (a) | | | 2,617,000 | | | | 2,217,756 | |
| | | | | | | | 39,082,679 | |
The accompanying notes are an integral part of these financial statements.
RIVERPARK STRATEGIC INCOME FUND
| Schedule of Investments (Continued) |
September 30, 2023
| | | Face | | | | |
| | | Amount† | | | Value | |
| CORPORATE BONDS – 47.51% (CONTINUED) | | | | | | |
| | | | | | | |
| Manufacturing – 11.48% | | | | | | |
| Cannabist Co. Holdings, Inc. | | | | | | |
| 9.500%, 02/03/2026 (f) | | | 5,068,000 | | | $ | 4,383,820 | |
| Carbon Revolution Ltd. | | | | | | | | |
| 8.500%, 05/15/2027 (a)(f) | | | 1,250,000 | | | | 1,250,000 | |
| CNH Industrial Capital LLC | | | | | | | | |
| 4.200%, 01/15/2024 | | | 2,395,000 | | | | 2,381,777 | |
| Horizon Therapeutics USA, Inc. | | | | | | | | |
| 5.500%, 08/01/2027 (a) | | | 10,192,000 | | | | 10,472,280 | |
| InfraBuild Australia Pty Ltd. | | | | | | | | |
| 12.000%, 10/01/2024 (a)(f) | | | 9,281,000 | | | | 9,063,229 | |
| LINK Mobility Group Holding ASA | | | | | | | | |
| 3.375%, 12/15/2025 (f)(g) | | EUR 800,000 | | | | 773,907 | |
| LR Global Holding GmbH | | | | | | | | |
| 11.033% (3 Month EURIBOR + 7.250%), 02/03/2025 (b)(f)(g) | | EUR 2,694,000 | | | | 2,777,026 | |
| ProSomnus, Inc. | | | | | | | | |
| 14.250%, 04/06/2026 (d)(e) | | | 1,661,583 | | | | 1,428,038 | |
| Secop Group Holding GmbH | | | | | | | | |
| 12.372% (3 Month EURIBOR + 8.400%), 12/29/2026 (b)(f)(g) | | EUR 1,443,000 | | | | 1,540,868 | |
| Trulieve Cannabis Corp. | | | | | | | | |
| 9.750%, 06/18/2024 (f) | | | 1,250,000 | | | | 1,226,562 | |
| Valvoline, Inc. | | | | | | | | |
| 4.250%, 02/15/2030 (a) | | | 7,550,000 | | | | 7,422,209 | |
| | | | | | | | 42,719,716 | |
| Mining, Quarrying, and Oil and Gas Extraction – 2.06% | | | | | | | | |
| Energy Transfer LP | | | | | | | | |
| 8.651% (3 Month SOFR + 3.279%), 11/01/2066 (b) | | | 1,000,000 | | | | 828,600 | |
| Mime Petroleum AS | | | | | | | | |
| 9.750%, 09/17/2026 (a)(f) | | | 1,487,286 | | | | 1,398,049 | |
| 13.500%, 03/21/2083 (f) | | | 109,999 | | | | 33,000 | |
| NGL Energy Operating LLC / NGL Energy Finance Corp. | | | | | | | | |
| 7.500%, 02/01/2026 (a) | | | 4,258,000 | | | | 4,214,513 | |
| Tacora Resources, Inc. | | | | | | | | |
| 13.000%, 10/08/2023 (a)(e)(f) | | | 1,182,908 | | | | 1,182,908 | |
| | | | | | | | 7,657,070 | |
| Professional, Scientific, and Technical Services – 1.27% | | | | | | | | |
| Aker Horizons ASA | | | | | | | | |
| 7.930% (3 Month NIBOR + 3.250%), 08/15/2025 (b)(f)(h) | | NOK 8,500,000 | | | | 770,803 | |
| GemmaCert Ltd. | | | | | | | | |
| 9.000%, 05/19/2024 (d)(e) | | | 479,392 | | | | 201,000 | |
The accompanying notes are an integral part of these financial statements.
RIVERPARK STRATEGIC INCOME FUND
| Schedule of Investments (Continued) |
September 30, 2023
| | | Face | | | | |
| | | Amount† | | | Value | |
| CORPORATE BONDS – 47.51% (CONTINUED) | | | | | | |
| | | | | | | |
| Professional, Scientific, and | | | | | | |
| Technical Services – 1.27% (Continued) | | | | | | |
| Getty Images, Inc. | | | | | | |
| 9.750%, 03/01/2027 (a) | | | 2,568,000 | | | $ | 2,568,035 | |
| LifeFit Group MidCo GmbH | | | | | | | | |
| 13.112% (3 Month EURIBOR + 7.500%), 01/26/2025 (b)(f)(g) | | EUR 1,172,866 | | | | 1,213,662 | |
| | | | | | | | 4,753,500 | |
| Real Estate and Rental and Leasing – 0.47% | | | | | | | | |
| PHM Group Holding Oyj | | | | | | | | |
| 11.378% (3 Month EURIBOR + 7.500%), 06/19/2026 (a)(b)(f)(g) | | EUR 1,625,000 | | | | 1,739,507 | |
| | | | | | | | | |
| Retail Trade – 2.77% | | | | | | | | |
| 99 Escrow Issuer, Inc. | | | | | | | | |
| 7.500%, 01/15/2026 (a) | | | 4,193,000 | | | | 1,621,382 | |
| Advance Auto Parts, Inc. | | | | | | | | |
| 1.750%, 10/01/2027 | | | 4,375,000 | | | | 3,551,309 | |
| Anagram International Inc / Anagram Holdings LLC | | | | | | | | |
| 15.000%, 08/15/2025 (a) | | | 1,640,012 | | | | 1,566,958 | |
| The Gap, Inc. | | | | | | | | |
| 3.875%, 10/01/2031 (a) | | | 5,049,000 | | | | 3,553,313 | |
| | | | | | | | 10,292,962 | |
| Transportation and Warehousing – 3.24% | | | | | | | | |
| Floatel International Ltd. | | | | | | | | |
| 11.250%, 03/23/2026 (f) | | | 877,000 | | | | 898,925 | |
| Kistefos AS | | | | | | | | |
| 9.720% (3 Month NIBOR + 5.000%), 09/13/2028 (b)(f)(h) | | NOK 4,100,000 | | | | 380,902 | |
| Skill Bidco ApS | | | | | | | | |
| 10.545% (3 Month EURIBOR + 6.750%), 03/02/2028 (b)(f)(g) | | EUR 2,181,000 | | | | 2,308,768 | |
| Summit Midstream Holdings LLC / Summit Midstream Finance Corp. | | | | | | | | |
| 9.000%, 10/15/2026 (a) | | | 2,372,000 | | | | 2,280,735 | |
| Uber Technologies, Inc. | | | | | | | | |
| 8.000%, 11/01/2026 (a) | | | 2,717,000 | | | | 2,751,682 | |
| XPO, Inc. | | | | | | | | |
| 6.250%, 06/01/2028 (a) | | | 3,542,000 | | | | 3,433,756 | |
| | | | | | | | 12,054,768 | |
| Utilities – 2.48% | | | | | | | | |
| Hawaii Electric Light Company | | | | | | | | |
| 3.280%, 12/30/2040 (d)(e) | | | 1,500,000 | | | | 855,000 | |
| IEA Energy Services LLC | | | | | | | | |
| 6.625%, 08/15/2029 (a) | | | 8,723,000 | | | | 8,384,984 | |
| | | | | | | | 9,239,984 | |
The accompanying notes are an integral part of these financial statements.
RIVERPARK STRATEGIC INCOME FUND
| Schedule of Investments (Continued) |
September 30, 2023
| | | Face | | | | |
| | | Amount† | | | Value | |
| CORPORATE BONDS – 47.51% (CONTINUED) | | | | | | |
| | | | | | | |
| Wholesale Trade – 0.22% | | | | | | |
| United Natural Foods, Inc. | | | | | | |
| 6.750%, 10/15/2028 (a) | | | 1,025,000 | | | $ | 782,741 | |
| TOTAL CORPORATE BONDS (Cost $183,947,045) | | | | | | | 176,708,890 | |
| | | | | | | | | |
| MORTGAGE BACKED SECURITIES – 6.90% | | | | | | | | |
| | | | | | | | | |
| Finance and Insurance – 6.90% | | | | | | | | |
| BX 2021-MFM1 | | | | | | | | |
| 2021-MFM1, 6.946% (1 Month SOFR + 1.614%), | | | | | | | | |
| 01/15/2034 (a)(b) | | | 1,364,506 | | | | 1,333,789 | |
| BX Commercial Mortgage Trust 2019-XL | | | | | | | | |
| 2019-XL, 6.367% (1 Month SOFR + 1.034%), | | | | | | | | |
| 10/15/2036 (a)(b) | | | 3,613,586 | | | | 3,604,469 | |
| BX Commercial Mortgage Trust 2020-VKNG | | | | | | | | |
| 2020-VKNG, 6.847% (1 Month SOFR + 1.514%), | | | | | | | | |
| 10/15/2037 (a)(b) | | | 1,309,000 | | | | 1,288,206 | |
| BX Commercial Mortgage Trust 2021-SOAR | | | | | | | | |
| 2021-SOAR, 6.547% (1 Month SOFR + 1.214%), | | | | | | | | |
| 06/15/2038 (a)(b) | | | 1,084,377 | | | | 1,056,574 | |
| BX Commercial Mortgage Trust 2021-VINO | | | | | | | | |
| 2021-VINO, 6.549% (1 Month SOFR + 1.217%), | | | | | | | | |
| 05/15/2038 (a)(b) | | | 157,968 | | | | 154,060 | |
| BX Commercial Mortgage Trust 2021-VOLT | | | | | | | | |
| 2021-VOLT, 6.547% (1 Month SOFR + 1.214%), | | | | | | | | |
| 09/15/2036 (a)(b) | | | 2,982,000 | | | | 2,870,192 | |
| BX Commercial Mortgage Trust 2021-XL2 | | | | | | | | |
| C, 6.644% (1 Month SOFR + 1.312%), 10/15/2038 (a)(b) | | | 978,977 | | | | 952,228 | |
| BX Trust 2022-IND | | | | | | | | |
| 2022-IND, 7.272% (1 Month SOFR + 1.940%), | | | | | | | | |
| 04/15/2037 (a)(b) | | | 669,784 | | | | 660,094 | |
| CAMB Commercial Mortgage Trust 2019-LIFE | | | | | | | | |
| 2019-LIFE, 7.130% (1 Month SOFR + 1.797%), | | | | | | | | |
| 12/15/2037 (a)(b) | | | 2,550,000 | | | | 2,522,708 | |
| Cold Storage Trust 2020-ICE5 | | | | | | | | |
| 2020-ICE5, 7.547% (1 Month SOFR + 2.214%), | | | | | | | | |
| 11/15/2037 (a)(b) | | | 3,258,614 | | | | 3,238,905 | |
| Credit Suisse Mortgage Capital Certificates 2019-ICE4 | | | | | | | | |
| 2019-ICE4, 6.980% (1 Month SOFR + 1.647%), | | | | | | | | |
| 05/15/2036 (a)(b) | | | 624,447 | | | | 620,548 | |
| JP Morgan Chase Commercial Mortgage Securities Trust 2021-MHC | | | | | | | | |
| B, 6.496% (1 Month SOFR + 1.164%), 04/15/2038 (a)(b) | | | 970,000 | | | | 956,455 | |
The accompanying notes are an integral part of these financial statements.
RIVERPARK STRATEGIC INCOME FUND
| Schedule of Investments (Continued) |
September 30, 2023
| | | Face | | | | |
| | | Amount† | | | Value | |
| MORTGAGE BACKED SECURITIES – 6.90% (CONTINUED) | | | | | | |
| | | | | | | |
| Finance and Insurance – 6.90% (Continued) | | | | | | |
| Life 2022-BMR Mortgage Trust | | | | | | |
| A-1, 6.627% (1 Month SOFR + 1.295%), 05/15/2039 (a)(b) | | | 4,340,000 | | | $ | 4,267,858 | |
| MSCG Trust 2018-SELF | | | | | | | | |
| 2018-SELF, 7.030% (1 Month SOFR + 1.697%), | | | | | | | | |
| 10/15/2037 (a)(b) | | | 810,604 | | | | 801,490 | |
| SMRT 2022-MINI | | | | | | | | |
| 2022-MINI, 6.683% (1 Month SOFR + 1.350%), | | | | | | | | |
| 01/15/2039 (a)(b) | | | 1,375,000 | | | | 1,338,840 | |
| TOTAL MORTGAGE BACKED SECURITIES | | | | | | | | |
| (Cost $25,577,597) | | | | | | | 25,666,416 | |
| | | | | | | | | |
| PREFERRED STOCKS – 1.18% | | | | | | | | |
| | | | | | | | | |
| Finance and Insurance – 0.25% | | | | | | | | |
| Saratoga Investment Corp. | | | | | | | | |
| 6.000%, 04/30/2027 | | | 40,765 | | | | 942,487 | |
| | | | | | | | | |
| Manufacturing – 0.58% | | | | | | | | |
| Fossil Group, Inc. | | | | | | | | |
| 7.000%, 11/30/2026 | | | 130,336 | | | | 2,158,364 | |
| | | | | | | | | |
| Mining, Quarrying, and Oil and Gas Extraction – 0.33% | | | | | | | | |
| NGL Energy Partners LP | | | | | | | | |
| 9.000%, No stated maturity | | | 48,669 | | | | 1,226,459 | |
| | | | | | | | | |
| Professional, Scientific, and Technical Services – 0.02% | | | | | | | | |
| Argo Blockchain Plc (f) | | | | | | | | |
| 8.750%, 11/30/2026 | | | 8,481 | | | | 58,349 | |
| TOTAL PREFERRED STOCKS (Cost $5,291,936) | | | | | | | 4,385,659 | |
| | | Face | | | Notional | | | | |
| | | Amount† | | | Amount | | | | |
| PURCHASED OPTIONS – 0.03% | | | | | | | | | |
| | | | | | | | | | |
| Put Options – 0.03% | | | | | | | | | |
| iShares iBoxx High Yield Corporate Bond ETF (k) | | | | | | | | | |
| Expiration: 12/15/2023 Exercise Price: $73.00 | | | 1,010 | | | $ | 7,445,720 | | | | 117,160 | |
| TOTAL PURCHASED OPTIONS (Cost $76,285) | | | | | | | | | | | 117,160 | |
The accompanying notes are an integral part of these financial statements.
RIVERPARK STRATEGIC INCOME FUND
| Schedule of Investments (Continued) |
September 30, 2023
| | | Face | | | | |
| | | Amount† | | | Value | |
| REAL ESTATE INVESTMENT TRUSTS – 0.57% | | | | | | |
| | | | | | | |
| Real Estate and Rental and Leasing – 0.57% | | | | | | |
| CTO Realty Growth, Inc. | | | 131,933 | | | $ | 2,138,634 | |
| TOTAL REAL ESTATE INVESTMENT TRUSTS | | | | | | | | |
| (Cost $2,270,415) | | | | | | | 2,138,634 | |
| | | | | | | | | |
| | | Number of | | | | | |
| | | Shares | | | | | |
| SPECIAL PURPOSE ACQUISITION COMPANIES – 0.51% | | | | | | | | |
| Alpha Partners Technology | | | | | | | | |
| Merger Corp. Founder Shares (d)(e)(f)(k) | | | 8,594 | | | | 690 | |
| Berenson Acquisition Corp. Founder Shares (d)(e)(k) | | | 12,570 | | | | — | |
| Revelstone Capital Acquisition Corp. Founder Shares (d)(e)(k) | | | 5,925 | | | | 383 | |
| Screaming Eagle Acquisition Corp. (f)(k) | | | 182,532 | | | | 1,909,285 | |
| TOTAL SPECIAL PURPOSE ACQUISITION COMPANIES | | | | | | | | |
| (Cost $1,816,105) | | | | | | | 1,910,358 | |
| | | | | | | | | |
| WARRANTS – 0.00% | | | | | | | | |
| Financials Acquisition Corp. (f)(j)(k) | | | | | | | | |
| Expiration: 04/04/2027, Exercise Price: $11.50 | | | 33,086 | | | | 1,211 | |
| Leafly Holdings, Inc. (k) | | | | | | | | |
| Expiration: 11/07/2026, Exercise Price: $11.50 | | | 21,228 | | | | 743 | |
| McDermott International Ltd. (d)(e)(f)(k) | | | | | | | | |
| Expiration: 06/30/2027, Exercise Price: $12.33 | | | 258,269 | | | | — | |
| McDermott International Ltd. (d)(e)(f)(k) | | | | | | | | |
| Expiration: 06/30/2027, Exercise Price: $15.98 | | | 286,965 | | | | — | |
| ProSomnus, Inc. (k) | | | | | | | | |
| Expiration: 04/20/2028, Exercise Price: $11.50 | | | 151,260 | | | | 9,832 | |
| Tacora Resources, Inc. (d)(e)(k) | | | | | | | | |
| Expiration: 05/11/2025, Exercise Price: $0.01 | | | 20,243,861 | | | | — | |
| TOTAL WARRANTS (Cost $154,191) | | | | | | | 11,786 | |
The accompanying notes are an integral part of these financial statements.
RIVERPARK STRATEGIC INCOME FUND
| Schedule of Investments (Continued) |
September 30, 2023
| | | Number of | | | | |
| | | Shares | | | Value | |
| MONEY MARKET FUNDS – 8.62% | | | | | | |
| First American Government Obligations | | | | | | |
| Fund – Class X, 5.265% (m) | | | 14,527,025 | | | $ | 14,527,025 | |
| First American Treasury Obligations | | | | | | | | |
| Fund – Class X, 5.267% (m) | | | 17,544,964 | | | | 17,544,964 | |
| TOTAL MONEY MARKET FUNDS (Cost $32,071,989) | | | | | | | 32,071,989 | |
Total Investments (Cost $395,115,876) – 102.36% | | | | | | | 380,737,597 | |
| Liabilities in Excess of Other Assets – (2.36)% | | | | | | | (8,777,077 | ) |
| Total Net Assets – 100.00% | | | | | | $ | 371,960,520 | |
Percentages are stated as a percent of net assets.
| † | Face amount in U.S. Dollar unless otherwise indicated. |
| (a) | Securities issued pursuant to Rule 144A under the Securities Act of 1933 and Regulation S under the Securities Act of 1933. Aggregate value of these securities is $141,060,236 or 37.92% of Fund’s net assets. |
| (b) | Variable rate security. The rate shown represents the rate at September 30, 2023. |
| (c) | The rate shown is the effective yield. |
| (d) | Illiquid security. |
| (e) | Security valued using unobservable inputs. |
| (f) | Foreign issued security. |
| (g) | Principal amount denominated in Euros. |
| (h) | Principal amount denominated in Norwegian Krone. |
| (i) | Principal amount denominated in Swedish Krona. |
| (j) | Holding denominated in British Pound. |
| (k) | Non-income producing security. |
| (l) | Security in default. |
| (m) | Seven day yield as of September 30, 2023. |
Definitions:
EURIBOR – Euro-Interbank Offer Rate is a reference rate expressing the average interest rate at which eurozone banks offer unsecured short-term lending on the interbank market.
LIBOR – London Interbank Offer Rate is a benchmark rate at which banks offer to lend funds to one another in the international interbank market for short-term loans.
NIBOR – Norwegian Interbank Offer Rate is a collective term for Norwegian money market rates at different maturities. It is intended to reflect the interest rate level a bank require for unsecured money market lending in Norwegian Krone to another bank.
SOFR – Secured Overnight Financing Rate is a benchmark interest rate for dollar-denominated derivatives and loans. SOFR is based on transactions in the Treasury repurchase market and is based on data from observable transactions rather than on estimated borrowing rates.
STIBOR – Stockholm Interbank Offer Rate is a reference rate that shows the average interest rate at which a number of active banks on the Swedish money market are willing to lend to one another, without collateral, at different maturities.
The accompanying notes are an integral part of these financial statements.
RIVERPARK STRATEGIC INCOME FUND
| Schedule of Forward Currency Exchange Contracts |
September 30, 2023
| | | | | Currency | | USD Value at | | | Currency | | USD Value at | | | Unrealized | |
| Settlement | | Counter- | | to be | | September 30, | | | to be | | September 30, | | | Appreciation/ | |
| Date | | party | | Delivered | | 2023 | | | Received | | 2023 | | | (Depreciation) | |
| 10/13/23 | | U.S. Bank | | 17,065,000 | | EUR | | $ | 18,052,528 | | | 18,342,656 | | USD | | $ | 18,342,656 | | | $ | 290,128 | |
| 10/13/23 | | U.S. Bank | | 71,705,000 | | NOK | | | 6,706,190 | | | 6,697,834 | | USD | | | 6,697,834 | | | | (8,356 | ) |
| 10/13/23 | | U.S. Bank | | 67,150,000 | | SEK | | | 6,149,642 | | | 6,055,635 | | USD | | | 6,055,635 | | | | (94,007 | ) |
| 10/13/23 | | U.S. Bank | | 352,131 | | USD | | | 352,131 | | | 3,943,000 | | SEK | | | 361,103 | | | | 8,972 | |
| | | | | | | | | $ | 31,260,491 | | | | | | | $ | 31,457,228 | | | $ | 196,737 | |
EUR – Euro
NOK – Norwegian Krone
SEK – Swedish Krona
USD – U.S. Dollars
The accompanying notes are an integral part of these financial statements.
RIVERPARK STRATEGIC INCOME FUND
| Schedule of Written Options Contracts |
September 30, 2023
| | | Contracts | | | | | | | |
| | | (100 shares | | | Notional | | | | |
| | | per contract) | | | Amount | | | Value | |
| Call Options | | | | | | | | | |
| MasTec, Inc. | | | | | | | | | |
| Expiration: 12/15/2023 Exercise Price: $115.00 | | | 113 | | | $ | 813,261 | | | $ | 4,803 | |
| NCR Corp. | | | | | | | | | | | | |
| Expiration: 01/19/2024 Exercise Price: $30.00 | | | 108 | | | | 291,276 | | | | 10,584 | |
| Verizon Communications, Inc. | | | | | | | | | | | | |
| Expiration: 10/20/2023 Exercise Price: $35.00 | | | 216 | | | | 700,056 | | | | 864 | |
| TOTAL CALL OPTIONS | | | | | | | 1,804,593 | | | | 16,251 | |
| | | | | | | | | | | | | |
| Put Options | | | | | | | | | | | | |
| iShares iBoxx $High Yield Corporate Bond ETF | | | | | | | | | | | | |
| Expiration: 12/15/2023 Exercise Price: $70.00 | | | 1,010 | | | | 7,445,720 | | | | 40,400 | |
| NCR Corp. | | | | | | | | | | | | |
| Expiration: 01/19/2024 Exercise Price: $24.00 | | | 108 | | | | 291,276 | | | | 7,992 | |
| Warner Bros. Discovery | | | | | | | | | | | | |
| Expiration: 11/17/2023 Exercise Price: $12.50 | | | 126 | | | | 136,836 | | | | 22,932 | |
| TOTAL PUT OPTIONS | | | | | | | 7,873,832 | | | | 71,324 | |
| Total Written Options | | | | | | | | | | | | |
| (Premiums Received $111,780) | | | | | | $ | 9,678,425 | | | $ | 87,575 | |
The accompanying notes are an integral part of these financial statements.
RIVERPARK STRATEGIC INCOME FUND
| Schedule of Securities Sold Short |
September 30, 2023
| | | Face | | | | |
| | | Amount | | | Value | |
| CORPORATE BONDS – (1.51)% | | | | | | |
| | | | | | | |
| Finance and Insurance – (0.54)% | | | | | | |
| Brightstar Escrow Corp. | | | | | | |
| 9.750%, 10/15/2025 (a) | | | (2,019,000 | ) | | $ | (2,001,508 | ) |
| | | | | | | | | |
| Information – (0.46)% | | | | | | | | |
| CCO Holdings LLC / CCO Holdings Capital Corp. | | | | | | | | |
| 4.750%, 03/01/2030 (a) | | | (2,019,000 | ) | | | (1,697,405 | ) |
| | | | | | | | | |
| Manufacturing – (0.51)% | | | | | | | | |
| Conagra Brands, Inc. | | | | | | | | |
| 7.125%, 10/01/2026 | | | (1,000,000 | ) | | | (1,033,546 | ) |
| Johnson & Johnson | | | | | | | | |
| 4.950%, 05/15/2033 | | | (862,000 | ) | | | (868,741 | ) |
| | | | | | | | (1,902,287 | ) |
| TOTAL CORPORATE BONDS (Cost $5,814,712) | | | | | | | (5,601,200 | ) |
Total Securities Sold Short (Proceeds $5,814,712) | | | | | | $ | (5,601,200 | ) |
The accompanying notes are an integral part of these financial statements.
CROSSINGBRIDGE FUNDS
| Statements of Assets and Liabilities |
September 30, 2023
| | | CrossingBridge | | | CrossingBridge | |
| | Low Duration High | | Responsible | |
| | | Yield Fund | | | Credit Fund | |
| ASSETS | | | | | | |
| Investments, at value | | | | | | |
| (cost $639,510,695 and $28,113,129) | | $ | 624,553,503 | | | $ | 28,064,473 | |
| Cash | | | 119,101 | | | | 21,646 | |
| Cash held in foreign currency, at value | | | | | | | | |
| (cost $1,929,395 and $243,657) | | | 1,921,790 | | | | 242,168 | |
| Receivable for investment securities sold | | | 3,459,996 | | | | 414,442 | |
| Receivable to Adviser | | | — | | | | 1,917 | |
| Dividends and interest receivable | | | 8,799,062 | | | | 402,227 | |
| Unrealized appreciation of forward | | | | | | | | |
| currency exchange contracts | | | 771,309 | | | | 54,727 | |
| Receivable for Fund shares sold | | | 3,304,813 | | | | 47,607 | |
| Prepaid expenses and other assets | | | 28,103 | | | | 13,717 | |
| TOTAL ASSETS | | | 642,957,677 | | | | 29,262,924 | |
| LIABILITIES | | | | | | | | |
| Payable for investments purchased | | | 34,854,145 | | | | 1,894,258 | |
| Payable for Fund shares redeemed | | | 736,688 | | | | 6,200 | |
| Payable to Adviser | | | 324,863 | | | | — | |
| Payable for distributions to shareholders | | | 2,107 | | | | — | |
| Unrealized depreciation of forward | | | | | | | | |
| currency exchange contracts | | | 235,864 | | | | 11,382 | |
| Shareholder servicing fees payable | | | 227,824 | | | | 7,596 | |
| Payable to affiliates | | | 90,658 | | | | 20,466 | |
| Accrued expenses and other liabilities | | | 55,498 | | | | 30,451 | |
| TOTAL LIABILITIES | | | 36,527,647 | | | | 1,970,353 | |
| NET ASSETS | | $ | 606,430,030 | | | $ | 27,292,571 | |
| Net assets consist of: | | | | | | | | |
| Paid-in capital | | $ | 635,237,993 | | | $ | 28,636,616 | |
| Total accumulated loss | | | (28,807,963 | ) | | | (1,344,045 | ) |
| NET ASSETS | | $ | 606,430,030 | | | $ | 27,292,571 | |
| | | | | | | | | |
| INSTITUTIONAL CLASS | | | | | | | | |
| Shares of beneficial interest outstanding (unlimited | | | | | | | | |
| number of shares authorized, $0.001 par value) | | | 62,788,397 | | | | 2,914,367 | |
| Net asset value, offering, and | | | | | | | | |
| redemption price per share | | $ | 9.66 | | | $ | 9.36 | |
The accompanying notes are an integral part of these financial statements.
CROSSINGBRIDGE FUNDS
| Statements of Assets and Liabilities (Continued) |
September 30, 2023
| | | CrossingBridge | | | CrossingBridge | |
| | | Ultra-Short | | | Pre-Merger | |
| | | Duration Fund | | | SPAC ETF | |
| ASSETS | | | | | | |
| Investments, at value | | | | | | |
| (cost $95,828,561 and $67,105,491) | | $ | 95,098,005 | | | $ | 69,010,913 | |
| Receivable for investment securities sold | | | — | | | | 16,025 | |
| Receivable for foreign currency sold | | | 55,519 | | | | — | |
| Receivable for Fund shares sold | | | 325,000 | | | | — | |
| Dividends and interest receivable | | | 949,781 | | | | — | |
| Unrealized appreciation of forward | | | | | | | | |
| currency exchange contracts | | | 56,699 | | | | — | |
| Prepaid expenses and other assets | | | 15,052 | | | | — | |
| TOTAL ASSETS | | | 96,500,056 | | | | 69,026,938 | |
| LIABILITIES | | | | | | | | |
| Foreign currency, due to Custodian, at value | | | | | | | | |
| (cost $88 and $—) | | | 6 | | | | — | |
| Payable for investments purchased | | | 1,395,503 | | | | — | |
| Payable for Fund shares redeemed | | | 433,971 | | | | — | |
| Payable to Adviser | | | 37,805 | | | | 45,228 | |
| Unrealized depreciation of forward | | | | | | | | |
| currency exchange contracts | | | 16,388 | | | | — | |
| Accrued expenses and other liabilities | | | 32,723 | | | | — | |
| Payable to affiliates | | | 23,761 | | | | — | |
| Shareholder servicing fees payable | | | 14,417 | | | | — | |
| TOTAL LIABILITIES | | | 1,954,574 | | | | 45,228 | |
| NET ASSETS | | $ | 94,545,482 | | | $ | 68,981,710 | |
| Net assets consist of: | | | | | | | | |
| Paid-in capital | | $ | 95,394,742 | | | $ | 64,948,768 | |
| Total distributable earnings/(accumulated loss) | | | (849,260 | ) | | | 4,032,942 | |
| NET ASSETS | | $ | 94,545,482 | | | $ | 68,981,710 | |
| | | | | | | | | |
| INSTITUTIONAL CLASS | | | | | | | | |
| Shares of beneficial interest outstanding (unlimited | | | | | | | | |
| number of shares authorized, $0.001 par value) | | | 9,544,116 | | | | | |
| Net asset value, offering, and | | | | | | | | |
| redemption price per share | | $ | 9.91 | | | | | |
| | | | | | | | | |
| NAV | | | | | | | | |
| Shares of beneficial interest outstanding (unlimited | | | | | | | | |
| number of shares authorized, $0.001 par value) | | | | | | | 3,180,000 | |
| Net asset value, offering, and | | | | | | | | |
| redemption price per share | | | | | | $ | 21.69 | |
The accompanying notes are an integral part of these financial statements.
CROSSINGBRIDGE FUNDS
| Statements of Assets and Liabilities (Continued) |
September 30, 2023
| | | RiverPark | |
| | | Strategic | |
| | | Income Fund | |
| ASSETS | | | |
| Investments, at value (cost $395,115,876) | | $ | 380,737,597 | |
| Cash held in foreign currency, at value (cost $1,006,543) | | | 1,006,728 | |
| Receivable for investment securities sold | | | 3,944,451 | |
| Receivable for Fund shares sold | | | 1,302,891 | |
| Unrealized appreciation of forward currency exchange contracts | | | 299,100 | |
| Deposit at broker for securities sold short | | | 8,692,711 | |
| Dividends and interest receivable | | | 4,917,289 | |
| Prepaid expenses and other assets | | | 94,328 | |
| TOTAL ASSETS | | | 400,995,095 | |
| LIABILITIES | | | | |
| Securities sold short, at value (proceeds $5,814,712) | | | 5,601,200 | |
| Written options, at value (premiums received $111,780) | | | 87,575 | |
| Payable for investments purchased | | | 22,526,003 | |
| Payable for Fund shares redeemed | | | 208,838 | |
| Unrealized depreciation of forward currency exchange contracts | | | 102,363 | |
| Payable to Adviser | | | 196,311 | |
| Payable for distributions to shareholders | | | 80 | |
| Interest payable | | | 150,507 | |
| Payable to affiliates | | | 46,084 | |
| Shareholder servicing fees payable | | | 27,581 | |
| Accrued distribution expense | | | 5,960 | |
| Accrued expenses and other liabilities | | | 82,073 | |
| TOTAL LIABILITIES | | | 29,034,575 | |
| NET ASSETS | | $ | 371,960,520 | |
| Net assets consist of: | | | | |
| Paid-in capital | | $ | 459,507,116 | |
| Total distributable earnings/(accumulated loss) | | | (87,546,596 | ) |
| NET ASSETS | | $ | 371,960,520 | |
| | | | | |
| INSTITUTIONAL CLASS | | | | |
| Net assets | | | 352,179,597 | |
| Shares of beneficial interest outstanding | | | | |
| (unlimited number of shares authorized, $0.001 par value) | | | 41,233,701 | |
| Net asset value, offering, and redemption price per share | | $ | 8.54 | |
| | | | | |
| RETAIL CLASS | | | | |
| Net assets | | | 19,780,923 | |
| Shares of beneficial interest outstanding | | | | |
| (unlimited number of shares authorized, $0.001 par value) | | | 2,311,882 | |
| Net asset value, offering, and redemption price per share | | $ | 8.56 | |
The accompanying notes are an integral part of these financial statements.
CROSSINGBRIDGE FUNDS
For the Year Ended September 30, 2023
| | | CrossingBridge | | | CrossingBridge | |
| | Low Duration High | | Responsible | |
| | | Yield Fund | | | Credit Fund | |
| INVESTMENT INCOME | | | | | | |
| Interest income | | $ | 44,007,226 | | | $ | 2,229,561 | |
| Dividend income | | | 16,872 | | | | 34,681 | |
| TOTAL INVESTMENT INCOME | | | 44,024,098 | | | | 2,264,242 | |
| EXPENSES | | | | | | | | |
| Management fees (Note 4) | | | 3,474,832 | | | | 156,533 | |
| Shareholder servicing fees – Institutional Class (Note 5) | | | 534,590 | | | | 24,082 | |
| Administration and accounting fees (Note 6) | | | 295,018 | | | | 71,972 | |
| Transfer agent fees and expenses (Note 6) | | | 150,185 | | | | 21,355 | |
| Legal fees | | | 58,100 | | | | 16,244 | |
| Custody fees (Note 6) | | | 56,485 | | | | 15,445 | |
| Expense recoupment by Adviser (Note 4) | | | 55,951 | | | | — | |
| Reports to shareholders | | | 45,041 | | | | 3,186 | |
| Federal and state registration fees | | | 42,835 | | | | 17,982 | |
| Audit and tax fees | | | 32,032 | | | | 25,009 | |
| Trustees’ fees | | | 22,091 | | | | 22,091 | |
| Other expenses | | | 17,532 | | | | 9,681 | |
| Pricing fees (Note 6) | | | 16,419 | | | | 7,760 | |
| Chief Compliance Officer fees | | | 12,870 | | | | 12,870 | |
| Insurance fees | | | 7,757 | | | | 4,380 | |
| TOTAL EXPENSES | | | 4,821,738 | | | | 408,590 | |
| Less waivers and reimbursement by Adviser (Note 4) | | | (845 | ) | | | (191,487 | ) |
| NET EXPENSES | | | 4,820,893 | | | | 217,103 | |
| NET INVESTMENT INCOME | | | 39,203,205 | | | | 2,047,139 | |
| REALIZED AND UNREALIZED | | | | | | | | |
| GAIN (LOSS) ON INVESTMENTS | | | | | | | | |
| Net realized gain (loss) on: | | | | | | | | |
| Investments | | | (8,640,591 | ) | | | (918,656 | ) |
| Foreign currency exchange contracts | | | (2,799,126 | ) | | | (295,000 | ) |
| Foreign currency transactions | | | (51,451 | ) | | | 41,180 | |
| Contribution by Affiliate (Note 6) | | | — | | | | 12 | |
| | | | (11,491,168 | ) | | | (1,172,464 | ) |
| Net change in unrealized appreciation (depreciation) on: | | | | | | | | |
| Investments | | | 9,284,097 | | | | 922,214 | |
| Foreign currency exchange contracts | | | (1,618,383 | ) | | | (60,927 | ) |
| Foreign currency translation | | | 52,734 | | | | 2,892 | |
| | | | 7,718,448 | | | | 864,179 | |
| NET REALIZED AND UNREALIZED | | | | | | | | |
| LOSS ON INVESTMENTS | | | (3,772,720 | ) | | | (308,285 | ) |
| NET INCREASE (DECREASE) IN NET | | | | | | | | |
| ASSETS FROM OPERATIONS | | $ | 35,430,485 | | | $ | 1,738,854 | |
The accompanying notes are an integral part of these financial statements.
CROSSINGBRIDGE FUNDS
| Statements of Operations (Continued) |
For the Year Ended September 30, 2023
| | | CrossingBridge | | | CrossingBridge | |
| | | Ultra-Short | | | Pre-Merger | |
| | | Duration Fund | | | SPAC ETF | |
| INVESTMENT INCOME | | | | | | |
| Interest income | | $ | 5,169,504 | | | $ | 429,448 | |
| Dividend income | | | 120,744 | | | | — | |
| TOTAL INVESTMENT INCOME | | | 5,290,248 | | | | 429,448 | |
| EXPENSES | | | | | | | | |
| Management fees (Note 4) | | | 551,761 | | | | 521,078 | |
| Shareholder servicing fees – Institutional Class (Note 5) | | | 84,886 | | | | — | |
| Administration and accounting fees (Note 6) | | | 77,000 | | | | — | |
| Transfer agent fees and expenses (Note 6) | | | 29,419 | | | | — | |
| Audit and tax fees | | | 24,915 | | | | — | |
| Federal and state registration fees | | | 23,259 | | | | — | |
| Trustees’ fees | | | 22,091 | | | | — | |
| Legal fees | | | 20,827 | | | | — | |
| Custody fees (Note 6) | | | 15,624 | | | | — | |
| Chief Compliance Officer fees | | | 12,870 | | | | — | |
| Other expenses | | | 9,861 | | | | — | |
| Pricing fees (Note 6) | | | 8,862 | | | | — | |
| Insurance fees | | | 4,561 | | | | — | |
| Reports to shareholders | | | 3,818 | | | | — | |
| Interest expense | | | 20 | | | | — | |
| Excise tax | | | — | | | | 72 | |
| TOTAL EXPENSES | | | 889,774 | | | | 521,150 | |
| Less waivers and reimbursement by Adviser (Note 4) | | | (125,503 | ) | | | — | |
| NET EXPENSES | | | 764,271 | | | | 521,150 | |
| NET INVESTMENT INCOME (LOSS) | | | 4,525,977 | | | | (91,702 | ) |
| REALIZED AND UNREALIZED | | | | | | | | |
| GAIN (LOSS) ON INVESTMENTS | | | | | | | | |
| Net realized gain (loss) on: | | | | | | | | |
| Investments | | | 88,769 | | | | 2,801,576 | |
| In-kind redemptions | | | — | | | | 249,785 | |
| Foreign currency exchange contracts | | | (181,601 | ) | | | (169,334 | ) |
| Foreign currency transactions | | | 43,799 | | | | 6,745 | |
| | | | (49,033 | ) | | | 2,888,772 | |
| Net change in unrealized appreciation (depreciation) on: | | | | | | | | |
| Investments | | | 83,230 | | | | 1,433,571 | |
| Foreign currency exchange contracts | | | (32,312 | ) | | | (59,606 | ) |
| Foreign currency translation | | | (282 | ) | | | — | |
| | | | 50,636 | | | | 1,373,965 | |
| NET REALIZED AND UNREALIZED | | | | | | | | |
| GAIN (LOSS) ON INVESTMENTS | | | 1,603 | | | | 4,262,737 | |
| NET INCREASE IN NET | | | | | | | | |
| ASSETS FROM OPERATIONS | | $ | 4,527,580 | | | $ | 4,171,035 | |
The accompanying notes are an integral part of these financial statements.
CROSSINGBRIDGE FUNDS
| Statements of Operations (Continued) |
For the Year Ended September 30, 2023
| | | RiverPark | |
| | | Strategic | |
| | | Income Fund | |
| INVESTMENT INCOME | | | |
| Interest income | | $ | 21,068,953 | |
| Dividend income | | | 1,519,417 | |
| TOTAL INVESTMENT INCOME | | | 22,588,370 | |
| EXPENSES | | | | |
| Management fees (Note 4) | | | 1,649,989 | |
| Administration and accounting fees (Note 6) | | | 318,510 | |
| Shareholder servicing fees – Institutional Class (Note 5) | | | 116,074 | |
| Interest expense | | | 91,067 | |
| Transfer agent fees and expenses (Note 6) | | | 74,568 | |
| Shareholder servicing fees – Retail Class (Note 5) | | | 37,863 | |
| Federal and state registration fees | | | 37,302 | |
| Audit and tax fees | | | 34,671 | |
| Custody fees (Note 6) | | | 21,612 | |
| Trustees’ fees | | | 20,807 | |
| Reports to shareholders | | | 19,927 | |
| Pricing fees (Note 6) | | | 18,649 | |
| Distribution (12b-1) expense (Note 5) | | | 18,508 | |
| Other expenses | | | 17,435 | |
| Dividend expense | | | 15,386 | |
| Legal fees | | | 9,134 | |
| Chief Compliance Officer fees | | | 4,832 | |
| Insurance fees | | | 24,013 | |
| TOTAL EXPENSES | | | 2,530,347 | |
| Less waivers and reimbursement by Adviser (Note 4) | | | — | |
| NET EXPENSES | | | 2,530,347 | |
| NET INVESTMENT INCOME (LOSS) | | | 20,058,023 | |
| REALIZED AND UNREALIZED GAIN (LOSS) ON INVESTMENTS | | | | |
| Net realized gain (loss) on: | | | | |
| Investments | | | (7,024,574 | ) |
| Written options | | | 598,009 | |
| Foreign currency exchange contracts | | | (305,867 | ) |
| Foreign currency transactions | | | (86,217 | ) |
| | | | (6,818,649 | ) |
| Net change in unrealized appreciation (depreciation) on: | | | | |
| Investments | | | 3,158,485 | |
| Foreign currency exchange contracts | | | (198,353 | ) |
| Foreign currency translation | | | 52,936 | |
| | | | 3,013,068 | |
| NET REALIZED AND UNREALIZED GAIN (LOSS) ON INVESTMENTS | | | (3,805,581 | ) |
| NET INCREASE IN NET ASSETS FROM OPERATIONS | | $ | 16,252,442 | |
The accompanying notes are an integral part of these financial statements.
CROSSINGBRIDGE LOW DURATION HIGH YIELD FUND
| Statements of Changes in Net Assets |
| | | Year Ended | | | Year Ended | |
| | | September 30, 2023 | | | September 30, 2022 | |
| FROM OPERATIONS | | | | | | |
| Net investment income | | $ | 39,203,205 | | | $ | 16,358,443 | |
| Net realized gain (loss) on: | | | | | | | | |
| Investments | | | (8,640,591 | ) | | | (4,506,665 | ) |
| Forward currency exchange contracts | | | (2,799,126 | ) | | | 7,120,130 | |
| Foreign currency transactions | | | (51,451 | ) | | | (95,309 | ) |
| Net change in unrealized | | | | | | | | |
| appreciation (depreciation) on: | | | | | | | | |
| Investments | | | 9,284,097 | | | | (24,276,638 | ) |
| Forward currency exchange contracts | | | (1,618,383 | ) | | | 1,695,109 | |
| Foreign currency translation | | | 52,734 | | | | (15,252 | ) |
| Net increase (decrease) in | | | | | | | | |
| net assets from operations | | | 35,430,485 | | | | (3,720,182 | ) |
| | | | | | | | | |
| FROM DISTRIBUTIONS | | | | | | | | |
| Distributions to shareholders | | | (45,038,845 | ) | | | (22,048,408 | ) |
| Decrease in net assets | | | | | | | | |
| resulting from distributions paid | | | (45,038,845 | ) | | | (22,048,408 | ) |
| | | | | | | | | |
| FROM CAPITAL SHARE TRANSACTIONS | | | | | | | | |
| Proceeds from sales of shares – | | | | | | | | |
| Institutional Class | | | 314,420,834 | | | | 491,767,133 | |
| Net asset value of shares issued to shareholders | | | | | | | | |
| in payment of distributions declared – | | | | | | | | |
| Institutional Class | | | 36,263,479 | | | | 16,583,903 | |
| Payments for shares redeemed – | | | | | | | | |
| Institutional Class | | | (279,538,917 | ) | | | (264,173,086 | ) |
| Net increase in net assets | | | | | | | | |
| from capital share transactions | | | 71,145,396 | | | | 244,177,950 | |
| TOTAL INCREASE IN NET ASSETS | | | 61,537,036 | | | | 218,409,360 | |
| | | | | | | | | |
| NET ASSETS: | | | | | | | | |
| Beginning of Year | | | 544,892,994 | | | | 326,483,634 | |
| End of Year | | $ | 606,430,030 | | | $ | 544,892,994 | |
The accompanying notes are an integral part of these financial statements.
CROSSINGBRIDGE RESPONSIBLE CREDIT FUND
| Statements of Changes in Net Assets (Continued) |
| | | Year Ended | | | Year Ended | |
| | | September 30, 2023 | | | September 30, 2022 | |
| FROM OPERATIONS | | | | | | |
| Net investment income | | $ | 2,047,139 | | | $ | 647,816 | |
| Net realized gain (loss) on: | | | | | | | | |
| Investments | | | (918,656 | ) | | | 36,007 | |
| Forward currency exchange contracts | | | (295,000 | ) | | | 284,549 | |
| Foreign currency transactions | | | 41,180 | | | | 3,442 | |
| Contribution by Affiliate (Note 6) | | | 12 | | | | — | |
| Net change in unrealized | | | | | | | | |
| appreciation (depreciation) on: | | | | | | | | |
| Investments | | | 922,214 | | | | (978,706 | ) |
| Forward currency exchange contracts | | | (60,927 | ) | | | 59,536 | |
| Foreign currency translation | | | 2,892 | | | | (654 | ) |
| Net increase in net assets from operations | | | 1,738,854 | | | | 51,990 | |
| | | | | | | | | |
| FROM DISTRIBUTIONS | | | | | | | | |
| Distributions to shareholders | | | (2,448,649 | ) | | | (736,927 | ) |
| Decrease in net assets | | | | | | | | |
| resulting from distributions paid | | | (2,448,649 | ) | | | (736,927 | ) |
| | | | | | | | | |
| FROM CAPITAL SHARE TRANSACTIONS | | | | | | | | |
| Proceeds from sales of shares – | | | | | | | | |
| Institutional Class | | | 9,198,001 | | | | 8,248,399 | |
| Net asset value of shares issued to shareholders | | | | | | | | |
| in payment of distributions declared – | | | | | | | | |
| Institutional Class | | | 2,005,227 | | | | 699,429 | |
| Payments for shares redeemed – | | | | | | | | |
| Institutional Class | | | (4,363,352 | ) | | | (3,989,824 | ) |
| Net increase in net assets | | | | | | | | |
| from capital share transactions | | | 6,839,876 | | | | 4,958,004 | |
| TOTAL INCREASE IN NET ASSETS | | | 6,130,081 | | | | 4,273,067 | |
| | | | | | | | | |
| NET ASSETS: | | | | | | | | |
| Beginning of Year | | | 21,162,490 | | | | 16,889,423 | |
| End of Year | | $ | 27,292,571 | | | $ | 21,162,490 | |
The accompanying notes are an integral part of these financial statements.
CROSSINGBRIDGE ULTRA-SHORT DURATION FUND
| Statements of Changes in Net Assets (Continued) |
| | | Year Ended | | | Year Ended | |
| | | September 30, 2023 | | | September 30, 2022 | |
| FROM OPERATIONS | | | | | | |
| Net investment income (loss) | | $ | 4,525,977 | | | $ | 943,281 | |
| Net realized gain (loss) on: | | | | | | | | |
| Investments | | | 88,769 | | | | 197,246 | |
| Forward currency exchange contracts | | | (181,601 | ) | | | 304,365 | |
| Foreign currency transactions | | | 43,799 | | | | (12,845 | ) |
| Net change in unrealized | | | | | | | | |
| appreciation (depreciation) on: | | | | | | | | |
| Investments | | | 83,230 | | | | (841,576 | ) |
| Forward currency exchange contracts | | | (32,312 | ) | | | 72,623 | |
| Foreign currency translation | | | (282 | ) | | | — | |
| Net increase in net assets from operations | | | 4,527,580 | | | | 663,094 | |
| | | | | | | | | |
| FROM DISTRIBUTIONS | | | | | | | | |
| Distributions to shareholders | | | (5,115,777 | ) | | | (955,104 | ) |
| Decrease in net assets | | | | | | | | |
| resulting from distributions paid | | | (5,115,777 | ) | | | (955,104 | ) |
| | | | | | | | | |
| FROM CAPITAL SHARE TRANSACTIONS | | | | | | | | |
| Proceeds from sales of shares – | | | | | | | | |
| Institutional Class | | | 50,611,714 | | | | 45,183,829 | |
| Net asset value of shares issued to shareholders | | | | | | | | |
| in payment of distributions declared – | | | | | | | | |
| Institutional Class | | | 570,230 | | | | 58,106 | |
| Payments for shares redeemed – | | | | | | | | |
| Institutional Class | | | (24,381,265 | ) | | | (13,677,662 | ) |
| Net increase in net assets | | | | | | | | |
| from capital share transactions | | | 26,800,679 | | | | 31,564,273 | |
| TOTAL INCREASE IN NET ASSETS | | | 26,212,482 | | | | 31,272,263 | |
| | | | | | | | | |
| NET ASSETS: | | | | | | | | |
| Beginning of Year | | | 68,333,000 | | | | 37,060,737 | |
| End of Year | | $ | 94,545,482 | | | $ | 68,333,000 | |
The accompanying notes are an integral part of these financial statements.
CROSSINGBRIDGE PRE-MERGER SPAC ETF
| Statements of Changes in Net Assets (Continued) |
| | | Year Ended | | | Year Ended | |
| | | September 30, 2023 | | | September 30, 2022 | |
| FROM OPERATIONS | | | | | | |
| Net investment loss | | $ | (91,702 | ) | | $ | (357,283 | ) |
| Net realized gain (loss) on: | | | | | | | | |
| Investments | | | 3,051,361 | | | | 306,167 | |
| Forward currency exchange contracts | | | (169,334 | ) | | | 151,988 | |
| Foreign currency transactions | | | 6,745 | | | | (3,669 | ) |
| Net change in unrealized | | | | | | | | |
| appreciation (depreciation) on: | | | | | | | | |
| Investments | | | 1,433,571 | | | | 473,644 | |
| Forward currency exchange contracts | | | (59,606 | ) | | | 59,606 | |
| Net increase (decrease) in | | | | | | | | |
| net assets from operations | | | 4,171,035 | | | | 630,453 | |
| | | | | | | | | |
| FROM DISTRIBUTIONS | | | | | | | | |
| Distributions to shareholders | | | (636,389 | ) | | | (62,424 | ) |
| Decrease in net assets | | | | | | | | |
| resulting from distributions paid | | | (636,389 | ) | | | (62,424 | ) |
| | | | | | | | | |
| FROM CAPITAL SHARE TRANSACTIONS | | | | | | | | |
| Proceeds from sales of shares | | | 14,550,494 | | | | 66,766,005 | |
| Net asset value of shares issued to shareholders | | | | | | | | |
| in payment of distributions declared | | | — | | | | — | |
| Payments for shares redeemed | | | (12,414,961 | ) | | | (9,824,286 | ) |
| Net increase in net assets | | | | | | | | |
| from capital share transactions | | | 2,135,533 | | | | 56,941,719 | |
| TOTAL INCREASE IN NET ASSETS | | | 5,670,179 | | | | 57,509,748 | |
| | | | | | | | | |
| NET ASSETS: | | | | | | | | |
| Beginning of Year | | | 63,311,531 | | | | 5,801,783 | |
| End of Year | | $ | 68,981,710 | | | $ | 63,311,531 | |
The accompanying notes are an integral part of these financial statements.
RIVERPARK STRATEGIC INCOME FUND
| Statements of Changes in Net Assets (Continued) |
| | | Year Ended | | | Year Ended | |
| | | September 30, 2023 | | | September 30, 2022 | |
| FROM OPERATIONS | | | | | | |
| Net investment income | | $ | 20,058,023 | | | $ | 10,069,000 | |
| Net realized gain (loss) on: | | | | | | | | |
| Investments | | | (7,024,574 | ) | | | (1,145,000 | ) |
| Written options | | | 598,009 | | | | — | |
| Forward currency exchange contracts | | | (305,867 | ) | | | — | |
| Foreign currency transactions | | | (86,217 | ) | | | — | |
| Net change in unrealized | | | | | | | | |
| appreciation (depreciation) on: | | | | | | | | |
| Investments | | | 3,158,485 | | | | (11,181,000 | ) |
| Forward currency exchange contracts | | | (198,353 | ) | | | — | |
| Foreign currency translation | | | 52,936 | | | | — | |
| Net increase (decrease) in | | | | | | | | |
| net assets from operations | | | 16,252,442 | | | | (2,257,000 | ) |
| | | | | | | | | |
| FROM DISTRIBUTIONS | | | | | | | | |
| Distributions to shareholders: | | | | | | | | |
| Institutional Class Shares | | | (19,952,177 | ) | | | (10,697,000 | ) |
| Retail Class Shares | | | (1,538,019 | ) | | | (844,000 | ) |
| Decrease in net assets | | | | | | | | |
| resulting from distributions paid | | | (21,490,196 | ) | | | (11,541,000 | ) |
| | | | | | | | | |
| FROM CAPITAL SHARE TRANSACTIONS | | | | | | | | |
| Institutional Class Shares | | | | | | | | |
| Proceeds from sales of shares | | | 262,636,965 | | | | 79,975,000 | |
| Net asset value of shares issued to shareholders | | | | | | | | |
| in payment of distributions declared | | | 19,751,686 | | | | 10,234,000 | |
| Payments for shares redeemed | | | (94,214,531 | ) | | | (104,775,000 | ) |
| Net increase (decrease) in net assets | | | | | | | | |
| from Institutional Class Shares | | | | | | | | |
| capital share transactions | | | 188,174,120 | | | | (14,566,000 | ) |
| Retail Class Shares | | | | | | | | |
| Proceeds from sales of shares | | | 11,334,312 | | | | 24,203,000 | |
| Net asset value of shares issued to shareholders | | | | | | | | |
| in payment of distributions declared | | | 1,487,966 | | | | 817,000 | |
| Payments for shares redeemed | | | (12,264,124 | ) | | | (17,257,000 | ) |
| Net increase in net assets from Retail Class | | | | | | | | |
| Shares capital share transactions | | | 558,154 | | | | 7,763,000 | |
| Net increase (decrease) in net assets | | | | | | | | |
| from capital share transactions | | | 188,732,274 | | | | (6,803,000 | ) |
| TOTAL INCREASE (DECREASE) | | | | | | | | |
| IN NET ASSETS | | | 183,494,520 | | | | (20,601,000 | ) |
| | | | | | | | | |
| NET ASSETS: | | | | | | | | |
| Beginning of Year | | | 188,466,000 | | | | 209,067,000 | |
| End of Year | | $ | 371,960,520 | | | $ | 188,466,000 | |
The accompanying notes are an integral part of these financial statements.
CROSSINGBRIDGE LOW DURATION HIGH YIELD FUND
Per Share Data for a Share Outstanding Throughout Each Year
Institutional Class
| | | Year Ended September 30, | |
| | | 2023 | | | 2022 | | | 2021 | | | 2020 | | | 2019 | |
| Net Asset Value, Beginning of Year | | $ | 9.84 | | | $ | 10.36 | | | $ | 9.86 | | | $ | 10.04 | | | $ | 10.06 | |
| | | | | | | | | | | | | | | | | | | | | |
| Income from investment operations: | | | | | | | | | | | | | | | | | | | | |
Net investment income(1) | | | 0.72 | | | | 0.33 | | | | 0.34 | | | | 0.35 | | | | 0.29 | |
| Net realized and unrealized | | | | | | | | | | | | | | | | | | | | |
gain (loss) on investments(2) | | | (0.06 | ) | | | (0.36 | ) | | | 0.54 | | | | (0.18 | ) | | | (0.02 | ) |
| Total from investment operations | | | 0.66 | | | | (0.03 | ) | | | 0.88 | | | | 0.17 | | | | 0.27 | |
| | | | | | | | | | | | | | | | | | | | | |
| Less distributions paid: | | | | | | | | | | | | | | | | | | | | |
| From net investment income | | | (0.73 | ) | | | (0.33 | ) | | | (0.38 | ) | | | (0.35 | ) | | | (0.29 | ) |
| From net realized gains | | | (0.11 | ) | | | (0.16 | ) | | | — | | | | — | | | | (0.00 | )(3) |
| Total distributions paid | | | (0.84 | ) | | | (0.49 | ) | | | (0.38 | ) | | | (0.35 | ) | | | (0.29 | ) |
| Net Asset Value, End of Year | | $ | 9.66 | | | $ | 9.84 | | | $ | 10.36 | | | $ | 9.86 | | | $ | 10.04 | |
Total Return(4) | | | 7.02 | % | | | (0.39 | %) | | | 9.13 | % | | | 1.80 | % | | | 2.71 | % |
| | | | | | | | | | | | | | | | | | | | | |
| Supplemental Data and Ratios: | | | | | | | | | | | | | | | | | | | | |
| Net assets, end of year (000’s) | | $ | 606,430 | | | $ | 544,893 | | | $ | 326,484 | | | $ | 144,124 | | | $ | 129,019 | |
| Ratio of expenses to average net assets: | | | | | | | | | | | | | | | | | | | | |
| Before waivers and | | | | | | | | | | | | | | | | | | | | |
| reimbursements of expenses | | | 0.90 | %(5) | | | 0.88 | %(6) | | | 0.91 | %(7) | | | 0.96 | % | | | 1.08 | % |
| After waivers and | | | | | | | | | | | | | | | | | | | | |
| reimbursements of expenses | | | 0.90 | %(5) | | | 0.88 | %(6) | | | 0.88 | %(7) | | | 0.90 | % | | | 0.96 | % |
| Ratio of net investment income to | | | | | | | | | | | | | | | | | | | | |
| average net assets: | | | | | | | | | | | | | | | | | | | | |
| Before waivers and | | | | | | | | | | | | | | | | | | | | |
| reimbursements of expenses | | | 7.33 | % | | | 3.30 | % | | | 3.34 | % | | | 3.35 | % | | | 2.83 | % |
| After waivers and | | | | | | | | | | | | | | | | | | | | |
| reimbursements of expenses | | | 7.33 | % | | | 3.30 | % | | | 3.37 | % | | | 3.41 | % | | | 2.95 | % |
Portfolio turnover rate(8) | | | 130.57 | % | | | 136.70 | % | | | 169.73 | % | | | 224.86 | % | | | 198.63 | % |
(1) | Per share net investment income was calculated using average shares outstanding method. |
(2) | Net realized and unrealized gain (loss) per share in the caption are balancing amounts necessary to reconcile the change in net asset value per share for the period and may not reconcile with the aggregate gains and losses in the Statements of Operations. |
(3) | Less than $0.005 per share. |
(4) | Total return represents the rate that investor would have earned or lost on an investment in the Fund, assuming reinvestment of dividends. |
(5) | This ratio includes previous expense reimbursements recouped by the Adviser. If this recoupment was excluded, this ratio would be 0.89%. |
(6) | This ratio includes previous expense reimbursements recouped by the Adviser. If this recoupment was excluded, this ratio would be 0.85%. |
(7) | This ratio includes previous expense reimbursements recouped by the Adviser. If this recoupment was excluded, this ratio would be unchanged. |
(8) | Short-term securities with maturities less than or equal to 365 days are excluded from the portfolio turnover calculation. |
The accompanying notes are an integral part of these financial statements.
CROSSINGBRIDGE RESPONSIBLE CREDIT FUND
Per Share Data for a Share Outstanding Throughout Each Year/Period
Institutional Class
| | | | | | | | | Period from | |
| | | | | | | | | June 30, 2021(1) | |
| | | Year Ended | | | Year Ended | | | through | |
| | | September 30, | | | September 30, | | | September 30, | |
| | | 2023 | | | 2022 | | | 2021 | |
| Net Asset Value, | | | | | | | | | |
| Beginning of Year/Period | | $ | 9.65 | | | $ | 10.01 | | | $ | 10.00 | |
| | | | | | | | | | | | | |
| Income from investment operations: | | | | | | | | | | | | |
Net investment income(2) | | | 0.81 | | | | 0.38 | | | | 0.06 | |
| Net realized and unrealized | | | | | | | | | | | | |
loss on investments(3) | | | (0.13 | ) | | | (0.33 | ) | | | (0.01 | ) |
| Total from investment operations | | | 0.68 | | | | 0.05 | | | | 0.05 | |
| | | | | | | | | | | | | |
| Less distributions paid: | | | | | | | | | | | | |
| From net investment income | | | (0.83 | ) | | | (0.39 | ) | | | (0.04 | ) |
| From net realized gains | | | (0.14 | ) | | | (0.02 | ) | | | — | |
| Total distributions paid | | | (0.97 | ) | | | (0.41 | ) | | | (0.04 | ) |
| Net Asset Value, End of Year/Period | | $ | 9.36 | | | $ | 9.65 | | | $ | 10.01 | |
Total Return(4) | | | 7.45 | % | | | 0.45 | % | | | 0.57 | % |
| | | | | | | | | | | | | |
| Supplemental Data and Ratios: | | | | | | | | | | | | |
| Net assets, end of year/period (000’s) | | $ | 27,293 | | | $ | 21,162 | | | $ | 16,889 | |
| Ratio of expenses to average net assets: | | | | | | | | | | | | |
| Before waivers and | | | | | | | | | | | | |
reimbursements of expenses(5) | | | 1.70 | % | | | 1.97 | % | | | 2.77 | % |
| After waivers and | | | | | | | | | | | | |
reimbursements of expenses(5) | | | 0.90 | % | | | 0.89 | % | | | 0.91 | %(6) |
| Ratio of net investment income | | | | | | | | | | | | |
| to average net assets: | | | | | | | | | | | | |
| Before waivers and | | | | | | | | | | | | |
reimbursements of expenses(5) | | | 7.70 | % | | | 2.75 | % | | | 0.50 | % |
| After waivers and | | | | | | | | | | | | |
reimbursements of expenses(5) | | | 8.50 | % | | | 3.83 | % | | | 2.36 | % |
Portfolio turnover rate(7) | | | 129.55 | % | | | 173.58 | % | | | 39.47 | % |
(1) | Commencement of investment operations. |
(2) | Per share net investment income was calculated using average shares outstanding method. |
(3) | Net realized and unrealized loss per share in the caption are balancing amounts necessary to reconcile the change in net asset value per share for the period and may not reconcile with the aggregate gains and losses in the Statements of Operations. |
(4) | Total return represents the rate that investor would have earned or lost on an investment in the Fund, assuming reinvestment of dividends. Total return for a period of less than one year is not annualized. |
(5) | Annualized for periods less than one year. |
(6) | The ratio of expenses to average net assets after waivers and reimbursement of expenses includes bank loan service charges. Excluding these charges, the ratio was 0.90%. |
(7) | Portfolio turnover not annualized for periods less than one year. Short-term securities with maturities less than or equal to 365 days are excluded from the portfolio turnover calculation. |
The accompanying notes are an integral part of these financial statements.
CROSSINGBRIDGE ULTRA-SHORT DURATION FUND
Per Share Data for a Share Outstanding Throughout Each Year/Period
Institutional Class
| | | | | | | | | Period from | |
| | | | | | | | | June 30, 2021(1) | |
| | | Year Ended | | | Year Ended | | | through | |
| | | September 30, | | | September 30, | | | September 30, | |
| | | 2023 | | | 2022 | | | 2021 | |
| Net Asset Value, | | | | | | | | | |
| Beginning of Year/Period | | $ | 9.97 | | | $ | 10.01 | | | $ | 10.00 | |
| | | | | | | | | | | | | |
| Income from investment operations: | | | | | | | | | | | | |
Net investment income (loss)(2) | | | 0.53 | | | | 0.16 | | | | (0.01 | ) |
| Net realized and unrealized | | | | | | | | | | | | |
gain (loss) on investments(3) | | | 0.00 | (4) | | | (0.05 | ) | | | 0.02 | |
| Total from investment operations | | | 0.53 | | | | 0.11 | | | | 0.01 | |
| | | | | | | | | | | | | |
| Less distributions paid: | | | | | | | | | | | | |
| From net investment income | | | (0.53 | ) | | | (0.14 | ) | | | — | |
| From net realized gains | | | (0.06 | ) | | | (0.01 | ) | | | — | |
| Total distributions paid | | | (0.59 | ) | | | (0.15 | ) | | | — | |
| Net Asset Value, End of Year/Period | | $ | 9.91 | | | $ | 9.97 | | | $ | 10.01 | |
Total Return(5) | | | 5.44 | % | | | 1.12 | % | | | 0.07 | % |
| | | | | | | | | | | | | |
| Supplemental Data and Ratios: | | | | | | | | | | | | |
| Net assets, end of year/period (000’s) | | $ | 94,545 | | | $ | 68,333 | | | $ | 37,061 | |
| Ratio of expenses to average net assets: | | | | | | | | | | | | |
| Before waivers and | | | | | | | | | | | | |
reimbursements of expenses(6) | | | 1.05 | % | | | 1.13 | % | | | 2.68 | % |
| After waivers and | | | | | | | | | | | | |
reimbursements of expenses(6) | | | 0.90 | % | | | 0.89 | % | | | 0.90 | % |
| Ratio of net investment income (loss) | | | | | | | | | | | | |
| to average net assets: | | | | | | | | | | | | |
| Before waivers and | | | | | | | | | | | | |
reimbursements of expenses(6) | | | 5.18 | % | | | 1.40 | % | | | (2.06 | %) |
| After waivers and | | | | | | | | | | | | |
reimbursements of expenses(6) | | | 5.33 | % | | | 1.64 | % | | | (0.28 | %) |
Portfolio turnover rate(7) | | | 217.47 | % | | | 155.17 | % | | | 41.74 | % |
(1) | Commencement of investment operations. |
(2) | Per share net investment income (loss) was calculated using average shares outstanding method. |
(3) | Net realized and unrealized gain (loss) per share in the caption are balancing amounts necessary to reconcile the change in net asset value per share for the period and may not reconcile with the aggregate gains and losses in the Statements of Operations. |
(4) | Amount between $0.00 and $0.005 per share. |
(5) | Total return represents the rate that investor would have earned or lost on an investment in the Fund, assuming reinvestment of dividends. Total return for a period of less than one year is not annualized. |
(6) | Annualized for periods less than one year. |
(7) | Portfolio turnover not annualized for periods less than one year. Short-term securities with maturities less than or equal to 365 days are excluded from the portfolio turnover calculation. |
The accompanying notes are an integral part of these financial statements.
CROSSINGBRIDGE PRE-MERGER SPAC ETF
Per Share Data for a Share Outstanding Throughout Each Year/Period
NAV
| | | | | | | | | Period from | |
| | | | | | | | | September 20, | |
| | | Year Ended | | | Year Ended | | | 2021(1) through | |
| | | September 30, | | | September 30, | | | September 30, | |
| | | 2023 | | | 2022 | | | 2021 | |
| Net Asset Value, | | | | | | | | | |
| Beginning of Year/Period | | $ | 20.56 | | | $ | 20.01 | | | $ | 20.00 | |
| | | | | | | | | | | | | |
| Income from investment operations: | | | | | | | | | | | | |
Net investment loss(2) | | | (0.03 | ) | | | (0.16 | ) | | | (0.00 | )(3) |
| Net realized and unrealized | | | | | | | | | | | | |
gain on investments(4) | | | 1.38 | | | | 0.73 | | | | 0.01 | |
| Total from investment operations | | | 1.35 | | | | 0.57 | | | | 0.01 | |
| | | | | | | | | | | | | |
| Less distributions paid: | | | | | | | | | | | | |
| From net investment income | | | (0.19 | ) | | | (0.02 | ) | | | — | |
| From net realized gains | | | (0.03 | ) | | | — | | | | — | |
| Total distributions paid | | | (0.22 | ) | | | (0.02 | ) | | | — | |
| Net Asset Value, End of Year/Period | | $ | 21.69 | | | $ | 20.56 | | | $ | 20.01 | |
Total Return(5) | | | 6.63 | % | | | 2.85 | % | | | 0.03 | % |
| | | | | | | | | | | | | |
| Supplemental Data and Ratios: | | | | | | | | | | | | |
| Net assets, end of year/period (000’s) | | $ | 68,982 | | | $ | 63,312 | | | $ | 5,802 | |
| Ratio of expenses to | | | | | | | | | | | | |
average net assets(6) | | | 0.80 | % | | | 0.81 | % | | | 0.80 | % |
| Ratio of net investment | | | | | | | | | | | | |
loss to average net assets(6) | | | (0.14 | %) | | | (0.77 | %) | | | (0.80 | %) |
Portfolio turnover rate(7)(8) | | | 146.32 | % | | | 190.57 | % | | | 4.29 | % |
(1) | Commencement of investment operations. |
(2) | Per share net investment loss was calculated using average shares outstanding method. |
(3) | Amount between $(0.005) and $0.00 per share. |
(4) | Net realized and unrealized gain per share in the caption are balancing amounts necessary to reconcile the change in net asset value per share for the period and may not reconcile with the aggregate gains and losses in the Statements of Operations. |
(5) | Total return represents the rate that investor would have earned or lost on an investment in the Fund, assuming reinvestment of dividends. Total return for a period of less than one year is not annualized. Total return presented is total return of Net Asset Value. Total return of the Market Value is 6.74%. |
(6) | Annualized for periods less than one year. |
(7) | Portfolio turnover not annualized for periods less than one year. Short-term securities with maturities less than or equal to 365 days are excluded from the portfolio turnover calculation. |
(8) | Excludes in-kind transactions associated with creations and redemptions of the Fund. |
The accompanying notes are an integral part of these financial statements.
RIVERPARK STRATEGIC INCOME FUND
Per Share Data for a Share Outstanding Throughout Each Year
Institutional Class
| | | Year Ended September 30, | |
| | | 2023 | | | 2022 | | | 2021 | | | 2020 | | | 2019 | |
| Net Asset Value, Beginning of Year | | $ | 8.71 | | | $ | 9.33 | | | $ | 8.60 | | | $ | 9.10 | | | $ | 9.42 | |
| | | | | | | | | | | | | | | | | | | | | |
| Income from investment operations: | | | | | | | | | | | | | | | | | | | | |
Net investment income(1) | | | 0.68 | | | | 0.45 | | | | 0.45 | | | | 0.49 | | | | 0.41 | |
| Net realized and unrealized | | | | | | | | | | | | | | | | | | | | |
gain (loss) on investments(2) | | | (0.14 | ) | | | (0.55 | ) | | | 0.70 | | | | (0.51 | ) | | | (0.30 | ) |
| Total from investment operations | | | 0.54 | | | | (0.10 | ) | | | 1.15 | | | | (0.02 | ) | | | 0.11 | |
| | | | | | | | | | | | | | | | | | | | | |
| Less distributions paid: | | | | | | | | | | | | | | | | | | | | |
| From net investment income | | | (0.71 | ) | | | (0.52 | ) | | | (0.42 | ) | | | (0.48 | ) | | | (0.43 | ) |
| From net realized gains | | | — | | | | — | | | | — | | | | — | | | | — | |
| Total distributions paid | | | (0.71 | ) | | | (0.52 | ) | | | (0.42 | ) | | | (0.48 | ) | | | (0.43 | ) |
| Net Asset Value, End of Year | | $ | 8.54 | | | $ | 8.71 | | | $ | 9.33 | | | $ | 8.60 | | | $ | 9.10 | |
Total Return(3) | | | 6.55 | % | | | (1.27 | %) | | | 13.59 | % | | | (0.10 | %) | | | 1.17 | % |
| | | | | | | | | | | | | | | | | | | | | |
| Supplemental Data and Ratios: | | | | | | | | | | | | | | | | | | | | |
| Net assets, end of year (000’s) | | $ | 352,180 | | | $ | 168,885 | | | $ | 195,997 | | | $ | 177,850 | | | $ | 281,043 | |
| Ratio of expenses to average net assets: | | | | | | | | | | | | | | | | | | | | |
| Before waivers and | | | | | | | | | | | | | | | | | | | | |
| reimbursements of expenses | | | 0.98 | %(4) | | | 1.10 | %(4) | | | 1.18 | %(5) | | | 1.05 | %(6) | | | 1.12 | %(7) |
| After waivers and | | | | | | | | | | | | | | | | | | | | |
| reimbursements of expenses | | | 0.98 | %(4) | | | 1.10 | %(4) | | | 1.18 | %(5) | | | 1.05 | %(6) | | | 1.12 | %(7) |
| Ratio of net investment income | | | | | | | | | | | | | | | | | | | | |
| to average net assets: | | | | | | | | | | | | | | | | | | | | |
| Before waivers and | | | | | | | | | | | | | | | | | | | | |
| reimbursements of expenses | | | 7.92 | % | | | 4.93 | % | | | 4.94 | % | | | 5.58 | % | | | 4.41 | % |
| After waivers and | | | | | | | | | | | | | | | | | | | | |
| reimbursements of expenses | | | 7.92 | % | | | 4.93 | % | | | 4.94 | % | | | 5.58 | % | | | 4.41 | % |
Portfolio turnover rate(8) | | | 104.44 | % | | | 72.00 | % | | | 89.00 | % | | | 109.00 | % | | | 39.00 | % |
(1) | Per share net investment income was calculated using average shares outstanding method. |
(2) | Net realized and unrealized gain (loss) per share in the caption are balancing amounts necessary to reconcile the change in net asset value per share for the period and may not reconcile with the aggregate gains and losses in the Statements of Operations. |
(3) | Total return represents the rate that investor would have earned or lost on an investment in the Fund, assuming reinvestment of dividends. |
(4) | This ratio includes dividend expense and interest expense. If these expenses were excluded, this ratio would have been 0.94%. |
(5) | This ratio includes dividend expense and interest expense. If these expenses were excluded, this ratio would have been 0.92%. |
(6) | This ratio includes dividend expense and interest expense. If these expenses were excluded, this ratio would have been 0.91%. |
(7) | This ratio includes dividend expense and interest expense. If these expenses were excluded, this ratio would have been 0.90%. |
(8) | Short-term securities with maturities less than or equal to 365 days are excluded from the portfolio turnover calculation. |
The accompanying notes are an integral part of these financial statements.
RIVERPARK STRATEGIC INCOME FUND
| Financial Highlights (Continued) |
Per Share Data for a Share Outstanding Throughout Each Year
Retail Class
| | | Year Ended September 30, | |
| | | 2023 | | | 2022 | | | 2021 | | | 2020 | | | 2019 | |
| Net Asset Value, Beginning of Year | | $ | 8.72 | | | $ | 9.33 | | | $ | 8.60 | | | $ | 9.09 | | | $ | 9.40 | |
| Income from investment operations: | | | | | | | | | | | | | | | | | | | | |
Net investment income(1) | | | 0.66 | | | | 0.44 | | | | 0.44 | | | | 0.47 | | | | 0.39 | |
| Net realized and unrealized | | | | | | | | | | | | | | | | | | | | |
gain (loss) on investments(2) | | | (0.13 | ) | | | (0.56 | ) | | | 0.68 | | | | (0.50 | ) | | | (0.30 | ) |
| Total from investment operations | | | 0.53 | | | | (0.12 | ) | | | 1.12 | | | | (0.03 | ) | | | 0.09 | |
| Less distributions paid: | | | | | | | | | | | | | | | | | | | | |
| From net investment income | | | (0.69 | ) | | | (0.49 | ) | | | (0.39 | ) | | | (0.46 | ) | | | (0.40 | ) |
| From net realized gains | | | — | | | | — | | | | — | | | | — | | | | — | |
| Total distributions paid | | | (0.69 | ) | | | (0.49 | ) | | | (0.39 | ) | | | (0.46 | ) | | | (0.40 | ) |
| Net Asset Value, End of Year | | $ | 8.56 | | | $ | 8.72 | | | $ | 9.33 | | | $ | 8.60 | | | $ | 9.09 | |
Total Return(3) | | | 6.30 | % | | | (1.41 | %) | | | 13.44 | % | | | (0.36 | %) | | | 1.02 | % |
| Supplemental Data and Ratios: | | | | | | | | | | | | | | | | | | | | |
| Net assets, end of year (000’s) | | $ | 19,781 | | | $ | 19,581 | | | $ | 13,070 | | | $ | 10,479 | | | $ | 18,367 | |
| Ratio of expenses to average net assets: | | | | | | | | | | | | | | | | | | | | |
| Before waivers and | | | | | | | | | | | | | | | | | | | | |
| reimbursements of expenses | | | 1.23 | %(4) | | | 1.27 | %(5) | | | 1.33 | %(6) | | | 1.22 | %(7) | | | 1.33 | %(8) |
| After waivers and | | | | | | | | | | | | | | | | | | | | |
| reimbursements of expenses | | | 1.23 | %(4) | | | 1.27 | %(5) | | | 1.33 | %(6) | | | 1.22 | %(7) | | | 1.33 | %(8) |
| Ratio of net investment income | | | | | | | | | | | | | | | | | | | | |
| to average net assets: | | | | | | | | | | | | | | | | | | | | |
| Before waivers and | | | | | | | | | | | | | | | | | | | | |
| reimbursements of expenses | | | 7.65 | % | | | 4.84 | % | | | 4.80 | % | | | 5.40 | % | | | 4.20 | % |
| After waivers and | | | | | | | | | | | | | | | | | | | | |
| reimbursements of expenses | | | 7.65 | % | | | 4.84 | % | | | 4.80 | % | | | 5.40 | % | | | 4.20 | % |
Portfolio turnover rate(9) | | | 104.44 | % | | | 72.00 | % | | | 89.00 | % | | | 109.00 | % | | | 39.00 | % |
(1) | Per share net investment income was calculated using average shares outstanding method. |
(2) | Net realized and unrealized gain (loss) per share in the caption are balancing amounts necessary to reconcile the change in net asset value per share for the period and may not reconcile with the aggregate gains and losses in the Statements of Operations. |
(3) | Total return represents the rate that investor would have earned or lost on an investment in the Fund, assuming reinvestment of dividends. |
(4) | This ratio includes dividend expense and interest expense. If these expenses were excluded, this ratio would have been 1.19%. |
(5) | This ratio includes dividend expense and interest expense. If these expenses were excluded, this ratio would have been 1.11%. |
(6) | This ratio includes dividend expense and interest expense. If these expenses were excluded, this ratio would have been 1.07%. |
(7) | This ratio includes dividend expense and interest expense. If these expenses were excluded, this ratio would have been 1.08%. |
(8) | This ratio includes dividend expense and interest expense. If these expenses were excluded, this ratio would have been 1.11%. |
(9) | Short-term securities with maturities less than or equal to 365 days are excluded from the portfolio turnover calculation. |
The accompanying notes are an integral part of these financial statements.
CROSSINGBRIDGE FUNDS
Notes to Financial Statements
September 30, 2023
| (1) | Organization |
| | |
| | Trust for Professional Managers (the “Trust”) was organized as a Delaware statutory trust under a Declaration of Trust dated May 29, 2001. The Trust is registered under the Investment Company Act of 1940, as amended (the “1940 Act”), as an open-end management investment company. The CrossingBridge Funds (the “Funds”) are comprised of the CrossingBridge Low Duration High Yield Fund, the CrossingBridge Responsible Credit Fund, the CrossingBridge Ultra-Short Duration Fund and RiverPark Strategic Income Fund (collectively, the “Mutual Funds”) and the CrossingBridge Pre-Merger SPAC ETF (the “ETF”), each representing a distinct diversified series with its own investment objective and policies within the Trust. |
| | |
| | The investment objective of the CrossingBridge Low Duration High Yield Fund is to seek high current income and capital appreciation consistent with the preservation of capital. The investment objective of the CrossingBridge Responsible Credit Fund is to seek high current income and capital appreciation consistent with the preservation of capital. The investment objective of the CrossingBridge Ultra-Short Duration Fund is to offer a higher yield than cash instruments while maintaining a low duration. The RiverPark Strategic Income Fund seeks high current income and capital appreciation consistent with the preservation of capital. |
| | |
| | The CrossingBridge Low Duration High Yield Fund commenced investment operations on February 1, 2018. The Fund has registered both Retail Class Shares and Institutional Class Shares. During the fiscal year ended September 30, 2023, only the Institutional Class Shares were operational. Both the CrossingBridge Responsible Credit Fund and CrossingBridge Ultra-Short Duration Fund commenced investment operations on June 30, 2021. Both Funds registered only an Institutional Class of shares. |
| | |
| | The RiverPark Strategic Income Fund was formerly a series of the RiverPark Funds Trust and commenced operations on September 30, 2013 (the “Predecessor Fund”). After the close of business May 12, 2023, the assets of the Predecessor Fund were transferred to the RiverPark Strategic Income Fund, a series of the Trust, in a tax-free reorganization, which was approved by shareholders of the Predecessor Fund (the “Reorganization”). The Predecessor Fund commenced operations on September 30, 2013. The Predecessor Fund was deemed the accounting survivor for financial statement purposes and, as a result, the financial statements for the RiverPark Strategic Income Fund reflect the operations of the Predecessor Fund for the period prior to May 12, 2023. RiverPark Advisors, LLC previously served as the investment adviser to the Predecessor Fund and Cohanzick Management, LLC served as sub-adviser. After the Reorganization, CrossingBridge Advisors, LLC, an affiliate of Cohanzick Management, LLC, serves as the RiverPark Strategic Income Fund’s investment adviser (the “Adviser”). The Reorganization costs were paid by the Adviser. The Predecessor Fund was deemed to be the accounting survivor of the Reorganization for financial reporting purposes and, as a result, the financial statements reflect the operations of the Predecessor Fund for the period through May 12, 2023. The following summarizes additional information of the Reorganization: |
CROSSINGBRIDGE FUNDS
Notes to Financial Statements (Continued)
September 30, 2023
| | Predecessor Fund as of May 12, 2023: | | | |
| | | | | |
| | Net Assets | $231,717,441 | | Institutional Class |
| | | 19,260,684 | | Retail Class |
| | | | | |
| | Shares Outstanding | 27,170,034 | | Institutional Class |
| | | 2,255,728 | | Retail Class |
| | Investments, at value | Investments, at cost | Unrealized depreciation |
| | $256,317,000 | $272,210,525 | $(15,893,525) |
| | Securities sold short, | Securities sold short, | |
| | at value | proceeds | Unrealized appreciation |
| | $(2,292,274) | $(2,493,706) | $201,432 |
| | Written options, | Written options, | |
| | at value | premiums received | Unrealized appreciation |
| | $(41,966) | $(89,299) | $47,333 |
| | The RiverPark Strategic Income Fund offers both Institutional and Retail Class of shares. |
| | |
| | The investment objective of the CrossingBridge Pre-Merger SPAC ETF is to provide total returns consistent with the preservation of capital. The ETF commenced investment operations on September 20, 2021. |
| | |
| | Costs incurred by the Funds in connection with the organization, registration and the initial public offering of shares were paid by the Adviser. The Trust may issue an unlimited number of shares of beneficial interest at $0.001 par value. The Funds are investment companies and accordingly follow the investment company accounting and reporting guidance of the Financial Accounting Standards Board (“FASB”) Accounting Standards Codification Topic 946 “Financial Services – Investment Companies.” |
| | |
| (2) | Significant Accounting Policies |
| | |
| | The following is a summary of significant accounting policies consistently followed by the Funds in the preparation of the financial statements. These policies are in conformity with generally accepted accounting principles in the United States of America (“GAAP”). |
| | |
| | (a) Investment Valuation |
| | |
| | Each security owned by a Fund that is listed on a securities exchange, including Special Purpose Acquisition Companies (“SPACs”), is valued at its last sale price on that exchange on the date as of which assets are valued. Bank loans are valued at prices supplied by an approved independent pricing service (“Pricing Service”), if available, and otherwise will be valued at the most recent bid quotations or evaluated prices, as applicable, based on quotations or prices obtained from one or more broker-dealers known to follow the issue. |
| | |
| | If the security is listed on more than one exchange, a Fund will use the price of the exchange that the Fund generally considers to be the principal exchange on which the security is traded. Portfolio securities listed on NASDAQ will be valued at the NASDAQ Official Closing Price, which may not necessarily represent the last sale price. If there has been no sale on such exchange or on NASDAQ on such day, the |
CROSSINGBRIDGE FUNDS
Notes to Financial Statements (Continued)
September 30, 2023
| | security is valued at the mean between the most recent bid and asked prices on such day or the security shall be valued at the latest sales price on the “composite market” for the day such security is being valued. The composite market is defined as a consolidation of the trade information provided by national securities and foreign exchanges and over-the-counter markets as published by a Pricing Service. |
| | |
| | Foreign securities will be priced in their local currencies as of the close of their primary exchange or market or as of the time a Fund calculates its NAV, whichever is earlier. Foreign securities, currencies and other assets denominated in foreign currencies are then translated into U.S. dollars at the exchange rate of such currencies against the U.S. dollar, as provided by an approved Pricing Service or reporting agency. All assets denominated in foreign currencies will be converted into U.S. dollars using the applicable currency exchange rates as of the close of the New York Stock Exchange (“NYSE”), generally 4:00 p.m. Eastern Time. |
| | |
| | Debt securities, including corporate bonds, bank loans, commercial paper, and short-term debt instruments having a maturity of 60 days or less, are valued at the mean in accordance with prices supplied by an approved Pricing Service. Pricing Services may use various valuation methodologies such as the mean between the bid and the asked prices, matrix pricing and other analytical pricing models as well as market transactions and dealer quotations. If a price is not available from a Pricing Service, the most recent quotation obtained from one or more broker-dealers known to follow the issue will be obtained. Quotations will be valued at the mean between the bid and the offer. Any discount or premium is accreted or amortized using the constant yield method until maturity. |
| | |
| | Options that are traded on a national securities exchange are valued at the last reported sale price on the exchange on which the security is principally traded. |
| | |
| | Except for contracts maturing in two or fewer days, which are valued at the spot rate, forward currency contracts are valued at the midpoint prices calculated using an interpolation methodology that incorporates foreign-exchange prices obtained from an approved Independent Pricing Service for standard forward-settlement periods, such as one month, three months, six months, and one year. |
| | |
| | SPAC Founders Shares, received as part of the initial public offering process, will be valued initially in line with the publicly traded warrants, which typically have no value prior to the warrants being separated from the SPAC common shares. Upon a de-SPAC transaction, the valuation of the Founders Shares may be updated to reflect more current circumstances and inputs, including the value of the publicly traded warrants or the value of the publicly traded common shares, and may include a discount to reflect any restrictions associated with the Founders Shares. |
| | |
| | Redeemable securities issued by open-end, registered investment companies, including money market funds, are valued at the NAVs of such companies for purchase and/or redemption orders placed on that day. All exchange-traded funds are valued at the last reported sale price on the exchange on which the security is principally traded. |
CROSSINGBRIDGE FUNDS
Notes to Financial Statements (Continued)
September 30, 2023
| | Investments are held at fair value. If market quotations are not readily available, a security or other asset will be valued at its fair value in accordance with Rule 2a-5 of the 1940 Act as determined under the Adviser’s fair value pricing procedures, subject to oversight by the Board of Trustees. These fair value pricing procedures will also be used to price a security when corporate events, events in the securities market and/or world events cause the Adviser to believe that a security’s last sale price may not reflect its actual fair market value. The intended effect of using fair value pricing procedures is to ensure that a Fund is accurately priced. The Board of Trustees will regularly evaluate whether the Funds’ fair value pricing procedures continue to be appropriate in light of the specific circumstances of the Funds and the quality of prices obtained through the application of such procedures by the Adviser. The Board of Trustees has approved the Adviser as the Valuation Designee in accordance with Rule 2a-5 of the 1940 Act. |
| | |
| | FASB Accounting Standards Codification, “Fair Value Measurements and Disclosures” Topic 820 (“ASC 820”), establishes an authoritative definition of fair value and sets out a hierarchy for measuring fair value. ASC 820 requires an entity to evaluate certain factors to determine whether there has been a significant decrease in volume and level of activity for the security such that recent transactions and quoted prices may not be determinative of fair value and further analysis and adjustment may be necessary to estimate fair value. ASC 820 also requires enhanced disclosure regarding the inputs and valuation techniques used to measure fair value in those instances as well as expanded disclosure of valuation levels for major security types. These inputs are summarized in the three broad levels listed below: |
| | Level 1 – | Unadjusted quoted prices in active markets for identical securities. |
| | | |
| | Level 2 – | Other significant observable inputs (including quoted prices for similar securities, interest rates, prepayment speeds, credit risk, etc.). |
| | | |
| | Level 3 – | Significant unobservable inputs (including the Funds’ own assumptions in determining the fair value of investments). |
| | The inputs or methodology used for valuing securities are not necessarily an indication of the risk associated with investing in those securities. The following is a summary of the inputs used to value the Funds’ investments carried at fair value as of September 30, 2023: |
CROSSINGBRIDGE FUNDS
Notes to Financial Statements (Continued)
September 30, 2023
| | CrossingBridge Low Duration High Yield Fund | | | | | | | | | | | | |
| | | | Level 1 | | | Level 2 | | | Level 3 | | | Total | |
| | Assets(1): | | | | | | | | | | | | |
| | Asset Backed Securities | | $ | — | | | $ | 19,779,753 | | | $ | — | | | $ | 19,779,753 | |
| | Bank Loans | | | — | | | | 73,315,862 | | | | — | | | | 73,315,862 | |
| | Commercial Paper | | | — | | | | 104,712,431 | | | | — | | | | 104,712,431 | |
| | Common Stocks | | | — | | | | 229,349 | | | | — | | | | 229,349 | |
| | Convertible Bonds | | | — | | | | 6,016,059 | | | | 6,158,250 | | | | 12,174,309 | |
| | Corporate Bonds | | | — | | | | 324,704,369 | | | | 9,053,892 | | | | 333,758,261 | |
| | Mortgage Backed Securities | | | — | | | | 21,948,216 | | | | — | | | | 21,948,216 | |
| | Preferred Stocks | | | — | | | | 10,198,600 | | | | — | | | | 10,198,600 | |
| | Real Estate Investment Trusts | | | 2,267,223 | | | | — | | | | — | | | | 2,267,223 | |
| | Special Purpose | | | | | | | | | | | | | | | | |
| | Acquisition Companies | | | 3,305,250 | | | | — | | | | 1,405 | | | | 3,306,655 | |
| | Warrants | | | 21,076 | | | | 41,918 | | | | — | | | | 62,994 | |
| | Money Market Funds | | | 42,799,850 | | | | — | | | | — | | | | 42,799,850 | |
| | Total Assets | | $ | 48,393,399 | | | $ | 560,946,557 | | | $ | 15,213,547 | | | $ | 624,553,503 | |
| | Other Financial Instruments: | | | | | | | | | | | | | | | | |
| | Forward Currency | | | | | | | | | | | | | | | | |
| | Exchange Contracts(2) | | $ | — | | | $ | 535,445 | | | $ | — | | | $ | 535,445 | |
| | Total Other | | | | | | | | | | | | | | | | |
| | Financial Instruments | | $ | — | | | $ | 535,445 | | | $ | — | | | $ | 535,445 | |
| | (1) | See the Schedule of Investments for industry classifications. |
| | (2) | Forward currency exchange contracts are included on the Schedule of Forward Currency Exchange Contracts and are reflected at the net unrealized appreciation (depreciation) on the instrument. |
| | CrossingBridge Responsible Credit Fund | | | | | | | | | | | | |
| | | | Level 1 | | | Level 2 | | | Level 3 | | | Total | |
| | Assets(1): | | | | | | | | | | | | |
| | Asset Backed Securities | | $ | — | | | $ | 1,324,881 | | | $ | — | | | $ | 1,324,881 | |
| | Bank Loans | | | — | | | | 4,879,034 | | | | — | | | | 4,879,034 | |
| | Commercial Paper | | | — | | | | 3,702,489 | | | | — | | | | 3,702,489 | |
| | Common Stocks | | | — | | | | — | | | | 177,600 | | | | 177,600 | |
| | Convertible Bonds | | | — | | | | 198,750 | | | | — | | | | 198,750 | |
| | Corporate Bonds | | | — | | | | 14,359,168 | | | | 755,008 | | | | 15,114,176 | |
| | Mortgage Backed Securities | | | — | | | | 653,541 | | | | — | | | | 653,541 | |
| | Preferred Stocks | | | 118,919 | | | | — | | | | — | | | | 118,919 | |
| | Real Estate Investment Trusts | | | 324,200 | | | | — | | | | — | | | | 324,200 | |
| | Money Market Funds | | | 1,570,883 | | | | — | | | | — | | | | 1,570,883 | |
| | Total Assets | | $ | 2,014,002 | | | $ | 25,117,863 | | | $ | 932,608 | | | $ | 28,064,473 | |
| | Other Financial Instruments: | | | | | | | | | | | | | | | | |
| | Forward Currency | | | | | | | | | | | | | | | | |
| | Exchange Contracts(2) | | $ | — | | | $ | 43,345 | | | $ | — | | | $ | 43,345 | |
| | Total Other | | | | | | | | | | | | | | | | |
| | Financial Instruments | | $ | — | | | $ | 43,345 | | | $ | — | | | $ | 43,345 | |
| | (1) | See the Schedule of Investments for industry classifications. |
| | (2) | Forward currency exchange contracts are included on the Schedule of Forward Currency Exchange Contracts and are reflected at the net unrealized appreciation (depreciation) on the instrument. |
CROSSINGBRIDGE FUNDS
Notes to Financial Statements (Continued)
September 30, 2023
| | CrossingBridge Ultra-Short Duration Fund | | | | | | | | | | | | |
| | | | Level 1 | | | Level 2 | | | Level 3 | | | Total | |
| | Assets(1): | | | | | | | | | | | | |
| | Asset Backed Securities | | $ | — | | | $ | 8,175,645 | | | $ | — | | | $ | 8,175,645 | |
| | Bank Loans | | | — | | | | 1,390,264 | | | | — | | | | 1,390,264 | |
| | Commercial Paper | | | — | | | | 4,557,071 | | | | — | | | | 4,557,071 | |
| | Convertible Bonds | | | — | | | | — | | | | 925,650 | | | | 925,650 | |
| | Corporate Bonds | | | — | | | | 66,516,941 | | | | — | | | | 66,516,941 | |
| | Mortgage Backed Securities | | | — | | | | 10,371,666 | | | | — | | | | 10,371,666 | |
| | Special Purpose | | | | | | | | | | | | | | | | |
| | Acquisition Companies | | | — | | | | — | | | | — | | | | — | |
| | U.S. Treasury Obligations | | | — | | | | 1,490,081 | | | | — | | | | 1,490,081 | |
| | Warrants | | | — | | | | 194 | | | | — | | | | 194 | |
| | Money Market Funds | | | 1,670,493 | | | | — | | | | — | | | | 1,670,493 | |
| | Total Assets | | $ | 1,670,493 | | | $ | 92,501,862 | | | $ | 925,650 | | | $ | 95,098,005 | |
| | Other Financial Instruments: | | | | | | | | | | | | | | | | |
| | Forward Currency | | | | | | | | | | | | | | | | |
| | Exchange Contracts(2) | | $ | — | | | $ | 40,311 | | | $ | — | | | $ | 40,311 | |
| | Total Other | | | | | | | | | | | | | | | | |
| | Financial Instruments | | $ | — | | | $ | 40,311 | | | $ | — | | | $ | 40,311 | |
| | (1) | See the Schedule of Investments for industry classifications. |
| | (2) | Forward currency exchange contracts are included on the Schedule of Forward Currency Exchange Contracts and are reflected at the net unrealized appreciation (depreciation) on the instrument. |
| | CrossingBridge Pre-Merger SPAC ETF | | �� | | | | | | | | | | |
| | | | Level 1 | | | Level 2 | | | Level 3 | | | Total | |
| | Assets(1): | | | | | | | | | | | | |
| | Commercial Paper | | $ | — | | | $ | 6,979,551 | | | $ | — | | | $ | 6,979,551 | |
| | Special Purpose | | | | | | | | | | | | | | | | |
| | Acquisition Companies | | | 45,223,165 | | | | 12,779,148 | | | | 388 | | | | 58,002,701 | |
| | Warrants | | | 4,577 | | | | 6 | | | | — | | | | 4,583 | |
| | Money Market Funds | | | 4,024,078 | | | | — | | | | — | | | | 4,024,078 | |
| | Total Assets | | $ | 49,251,820 | | | $ | 19,758,705 | | | $ | 388 | | | $ | 69,010,913 | |
| | (1) | See the Schedule of Investments for industry classifications. |
CROSSINGBRIDGE FUNDS
Notes to Financial Statements (Continued)
September 30, 2023
| | RiverPark Strategic Income Fund | | | | | | | | | | | | |
| | | | Level 1 | | | Level 2 | | | Level 3 | | | Total | |
| | Assets(1): | | | | | | | | | | | | |
| | Asset Backed Securities | | $ | — | | | $ | 5,042,939 | | | $ | — | | | $ | 5,042,939 | |
| | Bank Loans | | | — | | | | 53,191,454 | | | | — | | | | 53,191,454 | |
| | Commercial Paper | | | — | | | | 65,563,424 | | | | — | | | | 65,563,424 | |
| | Common Stocks | | | 1,928,351 | | | | 607,658 | | | | 2,553,888 | | | | 5,089,897 | |
| | Convertible Bonds | | | — | | | | 5,300,441 | | | | 3,538,550 | | | | 8,838,991 | |
| | Corporate Bonds | | | — | | | | 173,041,944 | | | | 3,666,946 | | | | 176,708,890 | |
| | Mortgage Backed Securities | | | — | | | | 25,666,416 | | | | — | | | | 25,666,416 | |
| | Preferred Stocks | | | 4,327,310 | | | | 58,349 | | | | — | | | | 4,385,659 | |
| | Purchased Options | | | 117,160 | | | | — | | | | — | | | | 117,160 | |
| | Real Estate Investment Trusts | | | 2,138,634 | | | | — | | | | — | | | | 2,138,634 | |
| | Special Purpose | | | | | | | | | | | | | | | | |
| | Acquisition Companies | | | 1,909,285 | | | | — | | | | 1,073 | | | | 1,910,358 | |
| | Warrants | | | 11,043 | | | | 743 | | | | — | | | | 11,786 | |
| | Money Market Funds | | | 32,071,989 | | | | — | | | | — | | | | 32,071,989 | |
| | Total Assets | | $ | 42,503,772 | | | $ | 328,473,368 | | | $ | 9,760,457 | | | $ | 380,737,597 | |
| | Liabilities(1): | | | | | | | | | | | | | | | | |
| | Corporate Bonds | | $ | — | | | $ | 5,601,200 | | | $ | — | | | $ | 5,601,200 | |
| | Total Liabilities | | $ | — | | | $ | 5,601,200 | | | $ | — | | | $ | 5,601,200 | |
| | Other Financial Instruments: | | | | | | | | | | | | | | | | |
| | Forward Currency | | | | | | | | | | | | | | | | |
| | Exchange Contracts(2) | | $ | — | | | $ | 196,737 | | | $ | — | | | $ | 196,737 | |
| | Written Options Contracts(3) | | | (64,196 | ) | | | (23,379 | ) | | | — | | | | (87,575 | ) |
| | Total Other | | | | | | | | | | | | | | | | |
| | Financial Instruments | | $ | (64,196 | ) | | $ | 173,358 | | | $ | — | | | $ | 109,162 | |
| | (1) | See the Schedule of Investments for industry classifications. |
| | (2) | Forward currency exchange contracts are included on the Schedule of Forward Currency Exchange Contracts and are reflected at the net unrealized appreciation (depreciation) on the instrument. |
| | (3) | Written option contracts are included on the Schedule of Written Options Contracts and are reflected at the value of the instrument. |
| | The following is a reconciliation of Level 3 assets in the Funds for which significant unobservable inputs were used to determine fair value: |
| | |
| | CrossingBridge Low Duration High Yield Fund |
| | | | Convertible | | | Corporate | | | Special Purpose | |
| | | | Bonds | | | Bonds | | Acquisition Companies |
| | Beginning Balance – October 1, 2022 | | $ | 10,461,850 | | | $ | — | | | $ | 3,605 | |
| | Purchases | | | — | | | | 8,835,892 | | | | — | |
| | Sales | | | — | | | | — | | | | — | |
| | Realized gains | | | — | | | | — | | | | — | |
| | Realized losses | | | — | | | | — | | | | — | |
| | Accretion of discount | | | — | | | | 422,635 | | | | — | |
| | Change in unrealized | | | | | | | | | | | | |
| | appreciation (depreciation) | | | (579,600 | ) | | | (204,635 | ) | | | (2,200 | ) |
| | Transfer in/(out) of Level 3 | | | (3,724,000 | ) | | | — | | | | — | |
| | Ending Balance – September 30, 2023 | | $ | 6,158,250 | | | $ | 9,053,892 | | | $ | 1,405 | |
CROSSINGBRIDGE FUNDS
Notes to Financial Statements (Continued)
September 30, 2023
| | The total change in unrealized appreciation (depreciation) included in the Statement of Operations attributable to Level 3 investments still held at September 30, 2023, includes the following: |
| | Convertible | Corporate | Special Purpose | |
| | Bonds | Bonds | Acquisition Companies | |
| | $(579,600) | $(204,635) | $(1,464) | |
| | CrossingBridge Responsible Credit Fund |
| | | | | | | | | | | | | Special Purpose | |
| | | | Bank | | | Common | | | Corporate | | | Acquisition | |
| | | | Loans | | | Stocks | | | Bonds | | | Companies | |
| | Beginning Balance – | | | | | | | | | | | | |
| | October 1, 2022 | | $ | 1,480,934 | | | $ | — | | | $ | — | | | $ | 147 | |
| | Purchases | | | — | | | | 177,000 | | | | 755,088 | | | | — | |
| | Sales | | | (1,480,934 | ) | | | — | | | | — | | | | — | |
| | Realized gains | | | — | | | | — | | | | — | | | | — | |
| | Realized losses | | | — | | | | — | | | | — | | | | — | |
| | Change in unrealized | | | | | | | | | | | | | | | | |
| | appreciation (depreciation) | | | — | | | | 600 | | | | — | | | | (147 | ) |
| | Transfer in/(out) of Level 3 | | | — | | | | — | | | | — | | | | — | |
| | Ending Balance – | | | | | | | | | | | | | | | | |
| | September 30, 2023 | | $ | — | | | $ | 177,600 | | | $ | 755,008 | | | $ | — | |
| | The total change in unrealized appreciation (depreciation) included in the Statement of Operations attributable to Level 3 investments still held at September 30, 2023, includes the following: |
| | CrossingBridge Ultra-Short Duration Fund |
| | | | Asset Backed | | | Convertible | | | Special Purpose | |
| | | | Securities | | | Bonds | | Acquisition Companies |
| | Beginning Balance – October 1, 2022 | | $ | 1,990,626 | | | $ | 1,012,770 | | | $ | 93 | |
| | Purchases | | | — | | | | — | | | | — | |
| | Sales | | | (2,000,000 | ) | | | — | | | | — | |
| | Realized gains | | | 9,103 | | | | — | | | | — | |
| | Realized losses | | | — | | | | — | | | | — | |
| | Change in unrealized | | | | | | | | | | | | |
| | appreciation (depreciation) | | | 271 | | | | (87,120 | ) | | | (93 | ) |
| | Transfer in/(out) of Level 3 | | | — | | | | — | | | | — | |
| | Ending Balance – September 30, 2023 | | $ | — | | | $ | 925,650 | | | $ | — | |
| | The total change in unrealized appreciation (depreciation) included in the Statement of Operations attributable to Level 3 investments still held at September 30, 2023, includes the following: |
| | Convertible | Special Purpose | |
| | Bonds | Acquisition Companies | |
| | $(87,120) | $(93) | |
CROSSINGBRIDGE FUNDS
Notes to Financial Statements (Continued)
September 30, 2023
| | CrossingBridge Pre-Merger SPAC ETF | | | |
| | | | Special Purpose | |
| | | Acquisition Companies |
| | Beginning Balance – October 1, 2022 | | $ | 731 | |
| | Purchases | | | — | |
| | Sales | | | — | |
| | Realized gains | | | — | |
| | Realized losses | | | (23 | ) |
| | Change in unrealized appreciation (depreciation) | | | (320 | ) |
| | Transfer in/(out) of Level 3 | | | — | |
| | Ending Balance – September 30, 2023 | | $ | 388 | |
| | The total change in unrealized appreciation (depreciation) included in the Statement of Operations attributable to Level 3 investments still held at September 30, 2023, includes the following: |
| | Special Purpose | |
| | Acquisition Companies | |
| | $(320) | |
| | RiverPark Strategic Income Fund |
| | | | | | | | | | | | | | | | Special Purpose | |
| | | | Bank | | | Common | | | Convertible | | | Corporate | | | Acquisition | |
| | | | Loans | | | Stocks | | | Bonds | | | Bonds | | | Companies | |
| | Beginning Balance – | | | | | | | | | | | | | | | |
| | October 1, 2022 | | $ | 1,098,205 | | | $ | 2,130,700 | | | $ | 7,975,590 | | | $ | 341,700 | | | $ | 3,344 | |
| | Purchases | | | — | | | | 611,240 | | | | — | | | | 3,330,296 | | | | — | |
| | Sales | | | (1,098,205 | ) | | | — | | | | — | | | | — | | | | — | |
| | Realized gains | | | — | | | | — | | | | — | | | | — | | | | — | |
| | Realized losses | | | — | | | | — | | | | — | | | | — | | | | (197 | ) |
| | Accretion of discount | | | — | | | | — | | | | — | | | | 130,010 | | | | — | |
| | Change in unrealized | | | | | | | | | | | | | | | | | | | | |
| | appreciation | | | | | | | | | | | | | | | | | | | | |
| | (depreciation) | | | — | | | | (188,052 | ) | | | (333,040 | ) | | | (135,060 | ) | | | (2,074 | ) |
| | Transfer in/(out) | | | | | | | | | | | | | | | | | | | | |
| | of Level 3 | | | — | | | | — | | | | (4,104,000 | ) | | | — | | | | — | |
| | Ending Balance – | | | | | | | | | | | | | | | | | | | | |
| | September 30, | | | | | | | | | | | | | | | | | | | | |
| | 2023 | | $ | — | | | $ | 2,553,888 | | | $ | 3,538,550 | | | $ | 3,666,946 | | | $ | 1,073 | |
| | The total change in unrealized appreciation (depreciation) included in the Statement of Operations attributable to Level 3 investments still held at September 30, 2023, includes the following: |
| | Common | Convertible | Corporate | Special Purpose | |
| | Stocks | Bonds | Bonds | Acquisition Companies | |
| | $(188,052) | $(333,040) | $(135,060) | $(974) | |
CROSSINGBRIDGE FUNDS
Notes to Financial Statements (Continued)
September 30, 2023
| | To the extent the significant inputs are unobservable, the values generally would be categorized as Level 3 and “fair value” will be applied. Specifically, the matrix below provides a summary of the approach taken: |
| | Type of Security | Examples of Inputs |
| | Convertible Securities | Primarily based on financial analysis employing quantitative |
| | | and qualitative inputs such as but may not be limited to: |
| | | discounted cashflow, sum-of-the parts, competitive |
| | | comparable valuations, and liquidation analysis |
| | | |
| | Special Purpose Acquisition | Upon separation, value based on public warrant pricing. |
| | Companies (SPACs); | Prior to separation, valued at $0 |
| | SPAC founders shares | |
| | | |
| | Common Stock (Legended shares) | The firm applies a 25% discount to current market price |
| | | for common stock with a legend attached to it. |
| | The following table represents additional information about valuation methodologies and inputs used for investments that are measured at fair value and categorized within Level 3 as of September 30, 2023: |
| | |
| | CrossingBridge Low Duration High Yield Fund |
| | | | Fair Value | | | | | | Range/Weighted | |
| | | | September 30, | | Valuation | | Unobservable | | Average | |
| | Description | | 2023 | | Methodologies | | Input | | Unobservable Input | |
| | Convertible Bonds | | $ | 6,158,250 | | Liquidation | | Yield to | | | 21.60% |
|
| | | | | | | analysis | | maturity | | | | |
| | Corporate Bonds | | $ | 6,533,600 | | Liquidation | | Transaction | | | N/A | |
| | | | | | | analysis | | price | | | | |
| | Corporate Bonds | | $ | 2,520,292 | | Liquidation | | Transaction | | | N/A | |
| | | | | | | analysis | | price | | | | |
| | Special Purpose | | $ | 1,405 | | Market | | Market price of | |
| $0 – $1 | |
| | Acquisition | | | | | comparable | | similar asset | | | | |
| | Companies* | | | | | | | | | | | |
| | * | Table presents information for three securities, which have been valued between $0.00 and $0.42 throughout the period. |
| | CrossingBridge Responsible Credit Fund |
| | | | Fair Value | | | | | | Range/Weighted | |
| | | | September 30, | | Valuation | | Unobservable | | Average | |
| | Description | | 2023 | | Methodologies | | Input | | Unobservable Input | |
| | Common Stocks | | $ | 177,600 | | Market | | Transaction | | | N/A | |
| | | | | | | comparable | | price | | | | |
| | Corporate Bonds | | $ | 755,008 | | Liquidation | | Transaction | | | N/A | |
| | | | | | | analysis | | price | | | | |
| | CrossingBridge Ultra-Short Duration Fund |
| | | | Fair Value | | | | | | Range/Weighted | |
| | | | September 30, | | Valuation | | Unobservable | | Average | |
| | Description | | 2023 | | Methodologies | | Input | | Unobservable Input | |
| | Convertible Bonds | | $ | 925,650 | | Liquidation | | Yield to | | | 21.60% |
|
| | | | | | | analysis | | maturity | | | | |
| | Special Purpose | | $ | — | | Market | | Market price of | |
| $0 – $1 | |
| | Acquisition | | | | | comparable | | similar asset | | | | |
| | Companies* | | | | | | | | | | | |
| | * | Table presents information for one security, which has been valued between $0.00 and $0.15 throughout the period. |
CROSSINGBRIDGE FUNDS
Notes to Financial Statements (Continued)
September 30, 2023
| | CrossingBridge Pre-Merger SPAC ETF |
| | | | Fair Value | | | | | | Range/Weighted | |
| | | | September 30, | | Valuation | | Unobservable | | Average | |
| | Description | | 2023 | | Methodologies | | Input | | Unobservable Input | |
| | Special Purpose | | $ | 388 | | Market | | Market price of | |
| $0 – $1 | |
| | Acquisition | | | | | comparable | | similar asset | | | | |
| | Companies* | | | | | | | | | | | |
| | * | Table presents information for two securities, which have been valued between $0.00 and $0.21 throughout the period. |
| | RiverPark Strategic Income Fund |
| | | | Fair Value | | | | | | Range/Weighted | |
| | | | September 30, | | Valuation | | Unobservable | | Average | |
| | Description | | 2023 | | Methodologies | | Input | | Unobservable Input | |
| | Common Stocks | | $ | 2,553,888 | | Market | | Transaction | | | N/A | |
| | | | | | | comparable | | price | | | | |
| | Common Stocks | | $ | — | | Market | | No current | |
| $0 | |
| | | | | | | comparable | | market | | | | |
| | Convertible Bonds | | $ | 3,538,550 | | Liquidation | | Yield to | | | 21.60% |
|
| | | | | | | analysis | | maturity | | | | |
| | Corporate Bonds | | $ | 1,428,038 | | Market | | Transaction | | | N/A | |
| | | | | | | comparable | | price | | | | |
| | Corporate Bonds | | $ | 1,182,908 | | Liquidation | | Transaction | | | N/A | |
| | | | | | | analysis | | price | | | | |
| | Corporate Bonds | | $ | 201,000 | | Discounted | | Market | | | 50-59% |
|
| | | | | | | cash flow | | discount | | | | |
| | Corporate Bonds | | $ | 855,000 | | Market | | Transaction | | | N/A | |
| | | | | | | comparable | | price | | | | |
| | Special Purpose | | $ | 1,073 | | Market | | Market price of | |
| $0 – $1 | |
| | Acquisition | | | | | comparable | | similar asset | | | | |
| | Companies* | | | | | | | | | | | |
| | Warrants** | | $ | — | | Liquidation | | Market | |
| $0 | |
| | | | | | | analysis | | assessment | | | | |
| | * | | Table presents information for three securities, which have been valued between $0.00 and $0.42 throughout the period. |
| | ** | | Table presents information for two securities, which have been valued between $0.00 and $0.01 throughout the period. |
| | (b) Foreign Securities and Currency Transactions |
| | |
| | Investment securities and other assets and liabilities denominated in foreign currencies are translated into U.S. dollar amounts at the date of valuation. Purchases and sales of investment securities and income and expense items denominated in foreign currencies are translated into U.S. dollar amounts on the respective dates of such transactions. |
| | |
| | The Funds do not isolate the portion of the results of operations from changes in foreign exchange rates on investments from the fluctuations arising from changes in market prices of securities held. Realized foreign exchange gains or losses arising from sales of |
CROSSINGBRIDGE FUNDS
Notes to Financial Statements (Continued)
September 30, 2023
| | portfolio securities and sales and maturities of short-term securities are reported within realized gain (loss) on investments. Net unrealized foreign exchange gains and losses arising from changes in the values of investments in securities from fluctuations in exchange rates are reported within unrealized gain (loss) on investments. |
| | |
| | Investments in foreign securities entail certain risks. There may be a possibility of nationalization or expropriation of assets, confiscatory taxation, political or financial instability, and diplomatic developments that could affect the value of a Fund’s investments in certain foreign countries. Since foreign securities normally are denominated and traded in foreign currencies, the value of a Fund’s assets may be affected favorably or unfavorably by currency exchange rates, currency exchange control regulations, foreign withholding taxes, and restrictions or prohibitions on the repatriation of foreign currencies. There may be less information publicly available about a foreign issuer than about a U.S. issuer, and foreign issuers are not generally subject to accounting, auditing, and financial reporting standards and practices comparable to those in the United States. The securities of some foreign issuers are less liquid and at times more volatile than securities of comparable U.S. issuers. |
| | |
| | (c) Federal Income Taxes |
| | |
| | The Funds intend to continue to comply with the requirements of Subchapter M of the Internal Revenue Code of 1986, as amended, necessary to qualify as a regulated investment company and to make the requisite distributions of income and capital gains to its shareholders sufficient to relieve it from all or substantially all federal income taxes. Therefore, no federal income tax provision has been provided. |
| | |
| | As of and during the fiscal year ended September 30, 2023, the Funds did not have liabilities for any unrecognized tax benefits. The Funds recognize interest and penalties, if any, related to unrecognized tax benefits as income tax expense in the Statements of Operations. During the fiscal year ended September 30, 2023, the Funds did not incur any interest or penalties. The Funds are subject to examination by U.S. taxing authorities for the tax periods since the commencement of operations. |
| | |
| | (d) Distributions to Shareholders |
| | |
| | In general, the Mutual Funds will distribute any net investment income monthly and any net realized capital gains at least annually. The ETF will distribute any net investment income annually and any net realized capital gains at least annually. The Funds may make additional distributions if deemed to be desirable during the year. Distributions from net realized gains for book purposes may include short-term capital gains. All short-term capital gains are included in ordinary income for tax purposes. Distributions to shareholders are recorded on the ex-dividend date. The Funds may also pay a special distribution at the end of the calendar year to comply with federal tax requirements. |
| | |
| | Treatment of income and capital gain distributions for federal income tax purposes may differ from GAAP, primarily due to timing differences in the recognition of income and gains and losses by the Funds. To the extent that these differences are attributable to permanent book and tax accounting differences, they are reclassified in the components of net assets. |
CROSSINGBRIDGE FUNDS
Notes to Financial Statements (Continued)
September 30, 2023
| | (e) Use of Estimates |
| | |
| | The preparation of financial statements in conformity with GAAP requires management to make estimates and assumptions that affect the reported amounts of assets and liabilities and disclosure of contingent assets and liabilities at the date of the financial statements and the reported amounts of income and expenses during the reporting period. Actual results could differ from those estimates. |
| | |
| | (f) Share Valuation |
| | |
| | The NAV per share of a Fund is calculated by dividing the sum of the value of the securities held by the Fund, plus cash or other assets, minus all liabilities (including estimated accrued expenses) by the total number of shares outstanding for the Fund, rounded to the nearest cent. The Funds’ shares will not be priced on the days on which the NYSE is closed for trading. |
| | |
| | (g) Allocation of Income, Expenses and Gains/Losses |
| | |
| | Income, expenses (other than those deemed attributable to a specific share class), and gains and losses of a Fund are allocated daily to each class of shares based upon the ratio of net assets represented by each class as a percentage of the net assets of the Fund. Expenses deemed directly attributable to a class of shares are recorded by the specific class. Most Fund expenses are allocated by class based on relative net assets. Shareholder servicing fees are currently expensed up to 0.10% of average daily net assets of each Mutual Fund’s Institutional Class shares. Expenses associated with a specific fund in the Trust are charged to that fund. Common Trust expenses are typically allocated evenly between the Mutual Funds of the Trust, or by other equitable means. |
| | |
| | (h) Other |
| | |
| | Investment transactions are recorded on the trade date. The Funds determine the gain or loss from investment transactions using the specific identification method for the best tax relief order by comparing the original cost of the security lot sold with the net sale proceeds. Interest income is recognized on an accrual basis. Withholding taxes on foreign interest, net of any reclaims, have been provided for in accordance with the Funds’ understanding of the applicable country’s tax rules and rates. Any discount or premium on securities purchased are accreted or amortized over the expected life of the respective securities using the constant yield method. |
| | |
| | (i) Loan Participation |
| | |
| | When purchasing participation interests in a loan, a Fund generally has no right to enforce compliance with the terms of the loan agreement with the borrower. As a result, a Fund may be subject to the credit risk of both the borrower and the lender that is selling the loan agreement. A Fund may enter into unfunded loan commitments, which are contractual obligations for future funding. Unfunded loan commitments represent a future obligation in full, even though a percentage of the notional loan amounts may not be utilized by the borrower. When investing in a loan participation agreement, a Fund has the right to receive payments of principal, interest and any fees to which it is entitled only from the lender selling the loan agreement and only upon receipt of payments by the lender from the borrower. A |
CROSSINGBRIDGE FUNDS
Notes to Financial Statements (Continued)
September 30, 2023
| | Fund may receive a commitment fee based on the undrawn portion of the underlying line of credit portion of a floating rate loan. In certain circumstances, a Fund may receive a penalty fee upon the prepayment of a floating rate loan by a borrower. Fees earned are recorded as a component of interest income or interest expense, respectively, on the Statements of Operations. |
| | |
| | (j) Derivatives |
| | |
| | The Funds may utilize derivative instruments such as options, swaps, futures, forward contracts and other instruments with similar characteristics to the extent that they are consistent with the Funds’ investment objectives and limitations. The use of derivatives may involve additional investment risks, including counterparty credit risk, i.e., the risk that a Fund may experience delay in obtaining financial recovery in the event a counterparty experiences financial difficulty. To mitigate this risk, the Adviser will seek to effect derivative transactions with only counterparties that they believe are creditworthy. |
| | |
| | The Funds have adopted authoritative standards regarding disclosure about derivatives and hedging activities and how they affect the Funds’ Statements of Assets and Liabilities and Statements of Operations. For the fiscal year ended September 30, 2023, the monthly average quantity and notional value of derivatives are described below: |
| | CrossingBridge Low Duration High Yield Fund | | | | | | |
| | | | Monthly Average | | | Monthly Average | |
| | | | Contracts | | | Notional Value | |
| | Forward Currency Exchange Contracts | | | 5 | | | $ | 61,930,973 | |
| | Warrants | | | 15,039,492 | | | | 80,686 | |
| | | | | | | | | | |
| | CrossingBridge Responsible Credit Fund | | | | | | | | |
| | | | Monthly Average | | | Monthly Average | |
| | | | Contracts | | | Notional Value | |
| | Forward Currency Exchange Contracts | | | 3 | | | $ | 4,480,953 | |
| | | | | | | | | | |
| | CrossingBridge Ultra-Short Duration Fund | | | | | | | | |
| | | | Monthly Average | | | Monthly Average | |
| | | | Contracts | | | Notional Value | |
| | Forward Currency Exchange Contracts | | | 2 | | | $ | 4,168,866 | |
| | Warrants | | | 53,368 | | | | 754 | |
| | | | | | | | | | |
| | CrossingBridge Pre-Merger SPAC ETF | | | | | | | | |
| | | | Monthly Average | | | Monthly Average | |
| | | | Contracts | | | Notional Value | |
| | Forward Currency Exchange Contracts | | | 2 | | | $ | 1,129,623 | |
| | Warrants | | | 145,159 | | | | 29,776 | |
CROSSINGBRIDGE FUNDS
Notes to Financial Statements (Continued)
September 30, 2023
| | RiverPark Strategic Income Fund | | | | | | |
| | | | Monthly Average | | | Monthly Average | |
| | | | Contracts | | | Notional Value | |
| | Forward Currency Exchange Contracts | | | 4 | | | $ | 19,865,631 | |
| | Options Contracts | | | 1,405 | | | | 142,016 | |
| | Warrants | | | 8,124,969 | | | | 60,303 | |
| | Statement of Assets and Liabilities |
| | |
| | Fair value of derivative instruments as of September 30, 2023 are described below: |
| | |
| | CrossingBridge Low Duration High Yield Fund |
| | | | Asset Derivatives | |
| | | | Statement of Assets | | | |
| | | | and Liabilities Location | | Fair Value | |
| | Forward Currency Exchange Contracts | | Unrealized appreciation | | $ | 771,309 | |
| | | | of forward currency | | | | |
| | | | exchange contracts | | | | |
| | Warrants | | Investments, at value | | | 62,994 | |
| | | | | | | | |
| | | | Liability Derivatives | |
| | | | Statement of Assets | | | | |
| | | | and Liabilities Location | | Fair Value | |
| | Forward Currency Exchange Contracts | | Unrealized depreciation | | $ | 235,864 | |
| | | | of forward currency | | | | |
| | | | exchange contracts | | | | |
| | | | | | | | |
| | CrossingBridge Responsible Credit Fund | | | | | | |
| | | | Asset Derivatives | |
| | | | Statement of Assets | | | | |
| | | | and Liabilities Location | | Fair Value | |
| | Forward Currency Exchange Contracts | | Unrealized appreciation | | $ | 54,727 | |
| | | | of forward currency | | | | |
| | | | exchange contracts | | | | |
| | | | | | | | |
| | | | Liability Derivatives | |
| | | | Statement of Assets | | | | |
| | | | and Liabilities Location | | Fair Value | |
| | Forward Currency Exchange Contracts | | Unrealized depreciation | | $ | 11,382 | |
| | | | of forward currency | | | | |
| | | | exchange contracts | | | | |
| | | | | | | | |
| | CrossingBridge Ultra-Short Duration Fund | | | | | | |
| | | | Asset Derivatives | |
| | | | Statement of Assets | | | | |
| | | | and Liabilities Location | | Fair Value | |
| | Forward Currency Exchange Contracts | | Unrealized appreciation | | $ | 56,699 | |
| | | | of forward currency | | | | |
| | | | exchange contracts | | | | |
| | Warrants | | Investments, at value | | | 194 | |
CROSSINGBRIDGE FUNDS
Notes to Financial Statements (Continued)
September 30, 2023
| | | | Liability Derivatives | |
| | | | Statement of Assets | | | |
| | | | and Liabilities Location | | Fair Value | |
| | Forward Currency Exchange Contracts | | Unrealized depreciation | | $ | 16,388 | |
| | | | of forward currency | | | | |
| | | | exchange contracts | | | | |
| | | | | | | | |
| | CrossingBridge Pre-Merger SPAC ETF | | | | | | |
| | | | Asset Derivatives | |
| | | | Statement of Assets | | | | |
| | | | and Liabilities Location | | Fair Value | |
| | Warrants | | Investments, at value | | $ | 4,583 | |
| | | | | | | | |
| | RiverPark Strategic Income Fund | | | | | | |
| | | | Asset Derivatives | |
| | | | Statement of Assets | | | | |
| | | | and Liabilities Location | | Fair Value | |
| | Forward Currency Exchange Contracts | | Unrealized appreciation | | $ | 299,100 | |
| | | | of forward currency | | | | |
| | | | exchange contracts | | | | |
| | Options Contracts | | Investments, at value | | | 117,160 | |
| | Warrants | | Investments, at value | | | 11,786 | |
| | | | | | | | |
| | | | Liability Derivatives | |
| | | | Statement of Assets | | | | |
| | | | and Liabilities Location | | Fair Value | |
| | Forward Currency Exchange Contracts | | Unrealized depreciation | | $ | 102,363 | |
| | | | of forward currency | | | | |
| | | | exchange contracts | | | | |
| | Options Contracts | | Written options, at value | | | 87,575 | |
| | Statement of Operations |
| | |
| | The effect of derivative instruments on the Statements of Operations for the year ended September 30, 2023 are described below: |
| | CrossingBridge Low Duration High Yield Fund | | | |
| | | Amount of Realized |
| | | Gain (Loss) on Derivatives |
| | Forward Currency Exchange Contracts | | $ | (2,799,126 | ) |
| | Warrants* | | | (36,363 | ) |
| | | |
| | | Change in Unrealized Appreciation |
| | | (Depreciation) on Derivatives |
| | Forward Currency Exchange Contracts | | $ | (1,618,383 | ) |
| | Warrants* | | | (3,970 | ) |
CROSSINGBRIDGE FUNDS
Notes to Financial Statements (Continued)
September 30, 2023
| | CrossingBridge Responsible Credit Fund | | | |
| | | Amount of Realized |
| | | Gain (Loss) on Derivatives |
| | Forward Currency Exchange Contracts | | $ | (295,000 | ) |
| | | |
| | | Change in Unrealized Appreciation |
| | | (Depreciation) on Derivatives |
| | Forward Currency Exchange Contracts | | $ | (60,927 | ) |
| | | | | | |
| | CrossingBridge Ultra-Short Duration Fund | | | | |
| | | Amount of Realized |
| | | Gain (Loss) on Derivatives |
| | Forward Currency Exchange Contracts | | $ | (181,601 | ) |
| | Warrants* | | | 3,028 | |
| | | |
| | | Change in Unrealized Appreciation |
| | | (Depreciation) on Derivatives |
| | Forward Currency Exchange Contracts | | $ | (32,312 | ) |
| | Warrants* | | | (3,673 | ) |
| | | | | | |
| | CrossingBridge Pre-Merger SPAC ETF | | | | |
| | | Amount of Realized |
| | | Gain (Loss) on Derivatives |
| | Forward Currency Exchange Contracts | | $ | (169,334 | ) |
| | Warrants* | | | (47,815 | ) |
| | | |
| | | Change in Unrealized Appreciation |
| | | (Depreciation) on Derivatives |
| | Forward Currency Exchange Contracts | | $ | (59,606 | ) |
| | Warrants* | | | 1,946 | |
| | | | | | |
| | RiverPark Strategic Income Fund | | | | |
| | | Amount of Realized |
| | | Gain (Loss) on Derivatives |
| | Forward Currency Exchange Contracts | | $ | (305,867 | ) |
| | Purchased Options Contracts* | | | 37,570 | |
| | Warrants* | | | (1,970 | ) |
| | Written Options Contracts | | | 598,009 | |
| | | |
| | | Change in Unrealized Appreciation |
| | | (Depreciation) on Derivatives |
| | Forward Currency Exchange Contracts | | $ | (198,353 | ) |
| | Purchased Options Contracts* | | | 36,023 | |
| | Warrants* | | | 2,539 | |
| | Written Options Contracts | | | 59,440 | |
| | * | Warrants and purchased options are included in the realized gain (loss) on investments and change in unrealized appreciation (depreciation) on investments, as applicable. |
CROSSINGBRIDGE FUNDS
Notes to Financial Statements (Continued)
September 30, 2023
| | (k) LIBOR |
| | |
| | The London Interbank Offered Rate (“LIBOR”) is an interest rate average calculated from estimates submitted by the leading banks in London. As of June 30, 2023, the ICE Benchmark Administration (“IBA”), as LIBOR administrator, ceased publication of U.S. dollar (“USD”) LIBOR for the most common tenors (overnight and one, three, six and twelve months), and as of December 31, 2021, the IBA had ceased publication of USD LIBOR for the less commonly used tenors of one week and two months as well as all tenors of non-USD LIBOR. Until September 30, 2024, the IBA will continue to publish the one-month, three-month and six-month USD LIBOR tenors using a synthetic methodology that is permanently unrepresentative of the underlying markets such tenors previously sought to measure. Use of the synthetic LIBOR tenors is permitted only for legacy contracts; all new use of synthetic USD LIBOR is prohibited. There remains uncertainty regarding the nature of any replacement rate and the impact of the transition from LIBOR on the Funds and the financial markets generally. The Secured Overnight Funding Rate (“SOFR”) has been selected by a committee established by the Board of Governors of the Federal Reserve System and the Federal Reserve Bank of New York to replace LIBOR as a reference rate in the United States. Other countries have undertaken similar initiatives to identify replacement reference rates in their respective markets. The transition from LIBOR could have a significant impact on the financial markets, including increased volatility and illiquidity in markets for instruments that currently rely on LIBOR to determine interest rates and a reduction in the values of some LIBOR-based investments. The transition to an alternative interest rate may not be orderly, may occur over various time periods or may have unintended consequences. |
| | |
| | (l) Indemnifications |
| | |
| | Under the Trust’s organizational documents, its Officers and Trustees are indemnified against certain liabilities arising out of the performance of their duties to the Funds. In addition, in the normal course of business, the Funds enter into contracts that provide general indemnifications to other parties. A Fund’s maximum exposure under these arrangements is unknown as this would involve future claims that may be made against the Funds that have not yet occurred. However, the Funds have not had prior claims or losses pursuant to these contracts and expects the risk of loss to be remote. |
| | |
| (3) | Federal Tax Matters |
| | |
| | The tax character of distributions paid during the fiscal years ended September 30, 2023 and September 30, 2022 were as follows: |
| | |
| | CrossingBridge Low Duration High Yield Fund |
| | | | Year Ended | | | Year Ended | |
| | | | September 30, 2023 | | | September 30, 2022 | |
| | Ordinary Income | | $ | 40,273,760 | | | $ | 22,048,408 | |
| | Long Term Capital Gain | | | 4,765,085 | | | | — | |
CROSSINGBRIDGE FUNDS
Notes to Financial Statements (Continued)
September 30, 2023
| | CrossingBridge Responsible Credit Fund | | | | | | |
| | | | Year Ended | | | Year Ended | |
| | | | September 30, 2023 | | | September 30, 2022 | |
| | Ordinary Income | | $ | 2,264,257 | | | $ | 715,402 | |
| | Long Term Capital Gain | | | 184,392 | | | | 21,525 | |
| | | | | | | | | | |
| | CrossingBridge Ultra-Short Duration Fund | | | | | | | | |
| | | | Year Ended | | | Year Ended | |
| | | | September 30, 2023 | | | September 30, 2022 | |
| | Ordinary Income | | $ | 4,892,271 | | | $ | 955,104 | |
| | Long Term Capital Gain | | | 223,506 | | | | — | |
| | | | | | | | | | |
| | CrossingBridge Pre-Merger SPAC ETF | | | | | | | | |
| | | | Year Ended | | | Year Ended | |
| | | | September 30, 2023 | | | September 30, 2022 | |
| | Ordinary Income | | $ | 636,389 | | | $ | 62,424 | |
| | Long Term Capital Gain | | | — | | | | — | |
| | | | | | | | | | |
| | RiverPark Strategic Income Fund | | | | | | | | |
| | | | Year Ended | | | Year Ended | |
| | | | September 30, 2023 | | | September 30, 2022 | |
| | Ordinary Income | | $ | 21,490,196 | | | $ | 11,541,000 | |
| | Long Term Capital Gain | | | — | | | | — | |
| | The Funds designated as long-term capital gain dividend, pursuant to Internal Revenue Code Section 852(b)(3), the amount necessary to reduce the earnings and profits of the Fund related to net capital gain to zero for the tax year ended September 30, 2023. |
| | As of September 30, 2023, the components of accumulated earnings on a tax basis were as follows: |
| | | | CrossingBridge | | | CrossingBridge | | | CrossingBridge | |
| | | | Low Duration | | | Responsible | | | Ultra-Short | |
| | | | High Yield Fund | | | Credit Fund | | | Duration Fund | |
| | Cost basis of investments for | | | | | | | | | |
| | federal income tax purposes | | $ | 647,663,089 | | | $ | 28,883,038 | | | $ | 95,828,473 | |
| | Gross tax unrealized appreciation | | $ | 3,935,172 | | | $ | 387,152 | | | $ | 164,416 | |
| | Gross tax unrealized depreciation | | | (18,981,099 | ) | | | (434,248 | ) | | | (895,201 | ) |
| | Total net tax unrealized appreciation | | | | | | | | | | | | |
| | (depreciation) on investments | | | (15,045,927 | ) | | | (47,096 | ) | | | (730,785 | ) |
| | Undistributed ordinary income | | | 1,377,736 | | | | 45,177 | | | | 73,422 | |
| | Undistributed long-term capital gain | | | — | | | | — | | | | — | |
| | Total distributable earnings | | | 1,377,736 | | | | 45,177 | | | | 73,422 | |
| | Other accumulated earnings (losses) | | | (15,139,772 | ) | | | (1,342,126 | ) | | | (191,897 | ) |
| | Total accumulated earnings (losses) | | $ | (28,807,963 | ) | | $ | (1,344,045 | ) | | $ | (849,260 | ) |
CROSSINGBRIDGE FUNDS
Notes to Financial Statements (Continued)
September 30, 2023
| | | | CrossingBridge | | | RiverPark | |
| | | | Pre-Merger | | | Strategic | |
| | | | SPAC ETF | | | Income Fund | |
| | Cost basis of investments for | | | | | | |
| | federal income tax purposes | | $ | 68,792,405 | | | $ | 390,633,616 | |
| | Gross tax unrealized appreciation | | $ | 1,924,383 | | | $ | 3,626,388 | |
| | Gross tax unrealized depreciation | | | (1,705,875 | ) | | | (18,340,199 | ) |
| | Total net tax unrealized appreciation | | | | | | | | |
| | (depreciation) on investments | | | 218,508 | | | | (14,711,811 | ) |
| | Undistributed ordinary income | | | 3,792,288 | | | | 476,899 | |
| | Undistributed long-term capital gain | | | 22,146 | | | | — | |
| | Total distributable earnings | | | 3,814,434 | | | | 476,899 | |
| | Other accumulated earnings (losses) | | | — | | | | (73,311,684 | ) |
| | Total accumulated earnings (losses) | | $ | 4,032,942 | | | $ | (87,546,596 | ) |
| | Investments for federal income tax purposes in the above table include foreign currencies and derivatives. The difference between book-basis and tax-basis unrealized appreciation (depreciation) is attributable primarily to the tax deferral of losses on wash sale adjustments and tax treatment of Passive Foreign Investment Companies. |
| | |
| | At September 30, 2023, the Funds had the following capital loss carryovers which will be carried forward indefinitely to offset future realized capital gains: |
| | | | Short-Term | | | Long-Term | |
| | CrossingBridge Low Duration High Yield Fund | | $ | (8,374,729 | ) | | $ | (6,762,935 | ) |
| | CrossingBridge Responsible Credit Fund | | | (741,351 | ) | | | (600,776 | ) |
| | CrossingBridge Ultra-Short Duration Fund | | | (69,669 | ) | | | (122,228 | ) |
| | CrossingBridge Pre-Merger SPAC ETF | | | — | | | | — | |
| | RiverPark Strategic Income Fund | | | (10,336,254 | ) | | | (62,981,108 | ) |
| | GAAP requires that certain components of net assets relating to permanent differences be reclassified between financial and tax reporting. These reclassifications have no effect on net assets or net asset value per share. For the year ended September 30, 2023, the following reclassifications were made on the Statements of Asset and Liabilities due to permanent tax differences: |
| | | | | | | Total | |
| | | | Paid-in | | | distributable | |
| | | | capital | | | earnings | |
| | CrossingBridge Low Duration High Yield Fund | | $ | — | | | $ | — | |
| | CrossingBridge Responsible Credit Fund | | | — | | | | — | |
| | CrossingBridge Ultra-Short Duration Fund | | | — | | | | — | |
| | CrossingBridge Pre-Merger SPAC ETF | | | 25,931 | | | | (25,931 | ) |
| | RiverPark Strategic Income Fund | | | 25,113 | | | | (25,113 | ) |
| (4) | Investment Adviser |
| | |
| | The Trust has an investment advisory agreement with the Adviser to furnish investment advisory services to the Mutual Funds. Under the terms of this agreement, the Trust, on behalf of the Mutual Funds, compensates the Adviser for its investment |
CROSSINGBRIDGE FUNDS
Notes to Financial Statements (Continued)
September 30, 2023
| | advisory services at the annual rate of 0.65% of each Mutual Fund’s respective average daily net assets. Prior to May 13, 2023, RiverPark Advisors, LLC served as investment adviser to the Predecessor Fund and was compensated for its services at the annual rate of 0.65% of the Predecessor Fund’s average daily net assets. |
| | |
| | In addition, pursuant to a separate investment advisory agreement between the Trust, on behalf of the ETF, and the Adviser, the Adviser is responsible for managing the ETF in accordance with its investment objectives. For the services it provides the ETF, the ETF pays the Adviser a unitary management fee, which is calculated daily and paid monthly, at an annual rate of 0.80% of the ETF’s average daily net assets. Under this agreement, the Adviser has agreed to pay all expenses of the ETF except interest charges on any borrowings, dividends, and other expenses on securities sold short, taxes, brokerage commissions and other expenses incurred in placing orders for the purchase and sale of securities and other investment instruments, acquired fund fees and expenses, accrued deferred tax liability, extraordinary expenses, distribution fees and expenses paid by the ETF under any distribution plan adopted pursuant to Rule 12b-1 under the 1940 Act, and the unitary management fee payable to the Adviser. |
| | |
| | With respect to the Mutual Funds, the Adviser has contractually agreed to waive its management fee and/or reimburse a Fund’s other expenses at least through January 31, 2024 for the CrossingBridge Low Duration High Yield Fund, CrossingBridge Ultra-Short Duration Fund and CrossingBridge Responsible Credit Fund, and May 12, 2025 for the RiverPark Strategic Income Fund, to the extent necessary to ensure that a Fund’s total operating expenses (exclusive of front-end or contingent deferred sales loads, distribution (12b-1) fees, shareholder servicing plan fees, taxes, leverage (i.e., any expense incurred in connection with borrowings made by a Fund), interest, brokerage commissions, expenses incurred in connection with any merger or reorganization, dividends or interest expenses on short positions, acquired fund fees and expenses and extraordinary items) (the “Expense Limitation Cap”) does not exceed 0.80% of the respective average daily net assets of the CrossingBridge Low Duration High Yield Fund, CrossingBridge Ultra-Short Duration Fund and CrossingBridge Responsible Credit Fund, or 0.82% of the average daily net assets of the RiverPark Strategic Income Fund. Prior to May 13, 2023, RiverPark Advisors, LLC served as investment adviser to the Predecessor Fund and contractually agreed to waive its fees and absorb expenses of the Predecessor Fund to the extent expenses did not exceed 1.00% of the Predecessor Fund’s average daily net assets for Institutional Class Shares and 1.25% of the Predecessor Fund’s average daily net assets for Retail Class Shares. |
| | |
| | Any such waiver or reimbursement is subject to later adjustment to allow the Adviser to recoup amounts waived or reimbursed within three years from the date such amount was waived or reimbursed, subject to the operating expense limitation agreement, if such reimbursement will not cause a Mutual Fund’s expense ratio, after recoupment has been taken into account, to exceed the lesser of: (1) the Expense Limitation Cap in place at the time of the waiver and/or expense payment; or (2) the Expense Limitation Cap in place at the time of the recoupment. During the fiscal year ended September 30, 2023, the Adviser recouped $55,951 of previously waived expenses in the CrossingBridge Low |
CROSSINGBRIDGE FUNDS
Notes to Financial Statements (Continued)
September 30, 2023
| | Duration High Yield Fund. The following table shows the remaining waiver or reimbursed expenses for the Mutual Funds subject to potential recovery expiring: |
| | | | Expiring: | |
| | | | 9/30/24 | | | 9/30/25 | | | 9/30/26 | |
| | CrossingBridge Low Duration High Yield Fund | | $ | 34,981 | | | $ | 1,776 | | | $ | 845 | |
| | CrossingBridge Responsible Credit Fund | | | 58,237 | | | | 182,884 | | | | 191,487 | |
| | CrossingBridge Ultra-Short Duration Fund | | | 58,690 | | | | 138,941 | | | | 125,503 | |
| | RiverPark Strategic Income Fund | | | — | | | | — | | | | — | |
| (5) | Distribution and Shareholder Servicing Plans |
| | |
| | The Trust has adopted a plan pursuant to Rule 12b-1 under the 1940 Act (the “12b-1 Plan”), on behalf of the CrossingBridge Low Duration High Yield Fund, which authorizes the Fund to pay Quasar Distributors, LLC (the “Distributor”) a distribution fee of 0.25% of the Fund’s average daily net assets of the Fund’s Retail Class Shares for services to prospective Fund shareholders and distribution of Fund shares. The Fund incurred no fees pursuant to the 12b-1 Plan during the year ended September 30, 2023 as the Investor Class was not operational during the year. |
| | |
| | The Trust has adopted a 12b-1 Plan on behalf of the RiverPark Strategic Income Fund, which authorizes the Fund to pay the Distributor a distribution fee of 0.25% of the Fund’s average daily net assets of the Fund’s Retail Class Shares for services to prospective Fund shareholders and distribution of Fund shares. The RiverPark Strategic Income Fund Retail Class Shares incurred $18,508 of fees pursuant to the 12b-1 Plan during the year ended September 30, 2023 and owes $5,960 of fees related to the 12b-1 Plan as September 30, 2023. The Mutual Funds have adopted a Shareholder Servicing Plan to pay for shareholder support services from the applicable Fund’s assets pursuant to a Shareholder Servicing Agreement in an amount not to exceed 0.15% of the applicable Fund’s average daily net assets. Currently, the shareholder servicing fee authorized for the CrossingBridge Low Duration Fund, CrossingBridge Responsible Credit Fund and CrossingBridge Ultra-Short Duration Fund is up to 0.10% and RiverPark Strategic Income Fund up to 0.11%; however, the fee may be increased up to 0.15% of a Fund’s daily net assets, at any time. Each Mutual Fund is responsible for paying a portion of shareholder servicing fees to each of the shareholder servicing agents who have written shareholder servicing agreements with the Fund, and perform shareholder servicing functions and maintenance of shareholder accounts on behalf of shareholders. The following table details the fees incurred for the Mutual Funds pursuant to the Shareholder Servicing Plan during the year ended September 30, 2023, as well as the fees owed as of September 30, 2023. |
| | | | Fees incurred | | | Fees owed | |
| | CrossingBridge Low Duration High Yield Fund | | $ | 534,590 | | | $ | 227,824 | |
| | CrossingBridge Responsible Credit Fund | | | 24,082 | | | | 7,596 | |
| | CrossingBridge Ultra-Short Duration Fund | | | 84,886 | | | | 14,417 | |
| | RiverPark Strategic Income Fund | | | 153,937 | | | | 27,581 | |
| (6) | Related Party Transactions |
| | |
| | U.S. Bancorp Fund Services, LLC, doing business as U.S. Bank Global Fund Services (“Fund Services” or “Administrator”), acts as the Funds’ Administrator under |
CROSSINGBRIDGE FUNDS
Notes to Financial Statements (Continued)
September 30, 2023
| | an Administration Agreement. The Administrator prepares various federal and state regulatory filings, reports and returns for the Funds; prepares reports and materials to be supplied to the Trustees; monitors the activities of the Funds’ custodian, transfer agent and accountants; coordinates the preparation and payment of the Funds’ expenses and reviews the Funds’ expense accruals. Fund Services also serves as the transfer agent to the Funds and provides pricing services to the Funds. U.S. Bank, N.A. (“U.S. Bank”), an affiliate of Fund Services, serves as the Funds’ custodian. Fees incurred for the fiscal year ended September 30, 2023, and owed as of September 30, 2023, are as follows: |
| | Fund Administration, Accounting and Pricing | | Fees incurred | | | Fees owed | |
| | CrossingBridge Low Duration High Yield Fund | | $ | 311,437 | | | $ | 54,547 | |
| | CrossingBridge Responsible Credit Fund | | | 79,732 | | | | 13,179 | |
| | CrossingBridge Ultra-Short Duration Fund | | | 85,862 | | | | 14,417 | |
| | RiverPark Strategic Income Fund(1) | | | 78,614 | | | | 33,096 | |
| | | | | | | | |
| | Transfer Agency | | Fees incurred | | | Fees owed | |
| | CrossingBridge Low Duration High Yield Fund | | $ | 150,185 | | | $ | 24,591 | |
| | CrossingBridge Responsible Credit Fund | | | 21,355 | | | | 2,862 | |
| | CrossingBridge Ultra-Short Duration Fund | | | 29,419 | | | | 4,729 | |
| | RiverPark Strategic Income Fund(1) | | | 27,246 | | | | 4,233 | |
| | | | | | | | |
| | Custody | | Fees incurred | | | Fees owed | |
| | CrossingBridge Low Duration High Yield Fund | | $ | 56,485 | | | $ | 9,342 | |
| | CrossingBridge Responsible Credit Fund | | | 15,445 | | | | 2,247 | |
| | CrossingBridge Ultra-Short Duration Fund | | | 15,624 | | | | 2,437 | |
| | RiverPark Strategic Income Fund(1) | | | 8,366 | | | | 6,626 | |
| | (1) | Represents the fees incurred to Fund Services for the period May 13, 2023 to September 30, 2023. Prior to May 13, 2023, SEI Investments Global Funds Services served as Fund Administrator and the Fund incurred $81,466 of fees. DST Systems, Inc. and Brown Brothers Harriman & Co. served as Transfer Agent and Custodian, respectively. |
| | Under the terms of a Fund Servicing Agreement, the Adviser pays the Fund Administration and Accounting, Transfer Agency and Custody fees for the ETF. |
| | |
| | Certain officers of the Funds are also employees of Fund Services. A Trustee of the Trust is affiliated with Fund Services and U.S. Bank. |
| | |
| | The Trust’s Chief Compliance Officer is also an employee of Fund Services. The Mutual Funds’ allocation of the Trust’s Chief Compliance Officer fees incurred for the fiscal year ended September 30, 2023, and owed as of September 30, 2023, is as follows: |
| | | | Fees incurred | | | Fees owed | |
| | CrossingBridge Low Duration High Yield Fund | | $ | 12,870 | | | $ | 2,178 | |
| | CrossingBridge Responsible Credit Fund | | | 12,870 | | | | 2,178 | |
| | CrossingBridge Ultra-Short Duration Fund | | | 12,870 | | | | 2,178 | |
| | RiverPark Strategic Income Fund(1) | | | 4,832 | | | | 2,129 | |
| | (1) | Represents the fees incurred to Trust's Chief Compliance Officer for the period May 13, 2023 to September 30, 2023. Prior to May 13, 2023, the Chief Compliance Officer of the RiverPark Funds Trust served as the Fund’s Chief Compliance Officer, the Fund incurred $5,744 of fees. |
CROSSINGBRIDGE FUNDS
Notes to Financial Statements (Continued)
September 30, 2023
| | Under the terms of a Fund Servicing Agreement, the Adviser pays the Chief Compliance Officer fees for the ETF. |
| | |
| | The CrossingBridge Low Duration High Yield Fund, CrossingBridge Responsible Credit Fund and CrossingBridge Ultra-Short Duration Fund also have a line of credit with U.S. Bank (See Note 11). |
| | |
| (7) | Capital Share Transactions |
| | |
| | Transactions in shares of the Funds were as follows: |
| | |
| | CrossingBridge Low Duration High Yield Fund |
| | | | Year ended | | | Year ended | |
| | | | September 30, 2023 | | | September 30, 2022 | |
| | Shares sold | | | 32,117,123 | | | | 48,487,891 | |
| | Shares reinvested | | | 3,725,506 | | | | 1,647,659 | |
| | Shares redeemed | | | (28,435,351 | ) | | | (26,255,920 | ) |
| | Net increase | | | 7,407,278 | | | | 23,879,630 | |
| | | | | | | | | | |
| | CrossingBridge Responsible Credit Fund | | | | | | | | |
| | | | Year ended | | | Year ended | |
| | | | September 30, 2023 | | | September 30, 2022 | |
| | Shares sold | | | 965,416 | | | | 839,077 | |
| | Shares reinvested | | | 212,032 | | | | 71,289 | |
| | Shares redeemed | | | (457,163 | ) | | | (403,090 | ) |
| | Net increase | | | 720,285 | | | | 507,276 | |
| | | | | | | | | | |
| | CrossingBridge Ultra-Short Duration Fund | | | | | | | | |
| | | | Year ended | | | Year ended | |
| | | | September 30, 2023 | | | September 30, 2022 | |
| | Shares sold | | | 5,078,593 | | | | 4,515,784 | |
| | Shares reinvested | | | 57,503 | | | | 5,815 | |
| | Shares redeemed | | | (2,448,647 | ) | | | (1,368,395 | ) |
| | Net increase | | | 2,687,449 | | | | 3,153,204 | |
| | | | | | | | | | |
| | CrossingBridge Pre-Merger SPAC ETF | | | | | | | | |
| | | | Year ended | | | Year ended | |
| | | | September 30, 2023 | | | September 30, 2022 | |
| | Shares sold | | | 690,000 | | | | 3,270,000 | |
| | Shares reinvested | | | — | | | | — | |
| | Shares redeemed | | | (590,000 | ) | | | (480,000 | ) |
| | Net increase | | | 100,000 | | | | 2,790,000 | |
| | | | | | | | | | |
| | RiverPark Strategic Income Fund – Institutional Class | | | | | | | | |
| | | | Year ended | | | Year ended | |
| | | | September 30, 2023 | | | September 30, 2022 | |
| | Shares sold | | | 30,507,810 | | | | 8,663,000 | |
| | Shares reinvested | | | 2,311,864 | | | | 1,113,000 | |
| | Shares redeemed | | | (10,979,792 | ) | | | (11,386,000 | ) |
| | Net increase (decrease) | | | 21,839,882 | | | | (1,610,000 | ) |
CROSSINGBRIDGE FUNDS
Notes to Financial Statements (Continued)
September 30, 2023
| | RiverPark Strategic Income Fund – Retail Class | | | | | | |
| | | | | | | | |
| | | | Year ended | | | Year ended | |
| | | | September 30, 2023 | | | September 30, 2022 | |
| | Shares sold | | | 1,317,171 | | | | 2,631,000 | |
| | Shares reinvested | | | 173,909 | | | | 89,000 | |
| | Shares redeemed | | | (1,424,814 | ) | | | (1,874,000 | ) |
| | Net increase | | | 66,266 | | | | 846,000 | |
| (8) | Creation and Redemption Transactions |
| | |
| | Shares of the CrossingBridge Pre-Merger SPAC ETF are listed and traded on the NASDAQ Stock Market, LLC (the “Exchange”). The ETF issues and redeems shares on a continuous basis at NAV only in large blocks of shares called “Creation Units.” Creation Units are to be issued and redeemed principally in kind for a basket of securities and a balancing cash amount. Shares generally will trade in the secondary market in amounts less than a Creation Unit at market prices that change throughout the day. Market prices for the shares may be different from their NAV. The NAV is determined as of the close of trading (generally, 4:00 p.m. Eastern Time) on each day the NYSE is open for trading. The NAV of the shares of the Fund will be equal to the ETF’s total assets minus the ETF’s total liabilities divided by the total number of shares outstanding. The NAV that is published will be rounded to the nearest cent; however, for purposes of determining the price of Creation Units, the NAV will be calculated to five decimal places. |
| | |
| | Only “Authorized Participants” may purchase or redeem shares directly from the ETF. An Authorized Participant is either (i) a broker-dealer or other participant in the clearing process through the Continuous Net Settlement System of National Securities Clearing Corporation or (ii) a DTC participant and, in each case, must have executed a Participant Agreement with the Distributor. Most retail investors will not qualify as Authorized Participants or have the resources to buy and sell whole Creation Units. Therefore, they will be unable to purchase or redeem the shares directly from the ETF. Rather, most retail investors will purchase shares in the secondary market with the assistance of a broker and will be subject to customary brokerage commissions or fees. Securities received or delivered in connection with in-kind creates and redeems are valued as of the close of business on the effective date of the creation or redemption. |
| | |
| | Creation Unit Transaction Fee |
| | Authorized Participants will be required to pay to the Custodian a fixed transaction fee (the “Creation Transaction Fee”) in connection with the issuance of Creation Units. The standard Creation Transaction Fee will be the same regardless of the number of Creation Units purchased by an investor on the applicable Business Day. The Creation Transaction Fee for the ETF is $250. |
| | |
| | An additional variable fee of up to a maximum of 2% of the value of the Creation Units subject to the transaction may be imposed for cash purchases, nonstandard orders, or partial purchase of Creation Units. For orders comprised entirely of cash, a variable fee of 0.03% of the value of the order will be charged by the ETF. The variable charge |
CROSSINGBRIDGE FUNDS
Notes to Financial Statements (Continued)
September 30, 2023
| | is primarily designed to cover additional costs (e.g., brokerage, taxes) involved with buying the securities with cash. The ETF may determine to not charge a variable fee on certain orders when the Adviser has determined that doing so is in the best interests of ETF shareholders. |
| | |
| | A creation unit will generally not be issued until the transfer of good title of the deposit securities to the ETF and the payment of any cash amounts have been completed. To the extent contemplated by the applicable participant agreement, Creation Units of the ETF will be issued to such authorized participant notwithstanding the fact that the ETF’s deposits have not been received in part or in whole, in reliance on the undertaking of the authorized participant to deliver the missing deposit securities as soon as possible. If the ETF or its agents do not receive all of the deposit securities, or the required cash amounts, by such time, then the order may be deemed rejected and the authorized participant shall be liable to the ETF for losses, if any. |
| | |
| (9) | Investment Transactions |
| | |
| | The aggregate purchases and sales of securities, excluding short-term investments, for the fiscal year or period ended September 30, 2023 are summarized below: |
| | | | Purchases | | | Sales | |
| | CrossingBridge Low Duration High Yield Fund | | $ | 578,537,760 | | | $ | 503,473,409 | |
| | CrossingBridge Responsible Credit Fund | | | 31,000,185 | | | | 25,747,724 | |
| | CrossingBridge Ultra-Short Duration Fund | | | 95,371,907 | | | | 84,684,129 | |
| | CrossingBridge Pre-Merger SPAC ETF | | | 83,565,591 | | | | 84,863,932 | |
| | RiverPark Strategic Income Fund | | | 294,878,125 | | | | 198,407,022 | |
| | The above purchases and sales exclude any in-kind transactions associated with creations and redemptions. During the year ended September 30, 2023, the CrossingBridge Pre-Merger SPAC had $43,533 of creations in-kind and $7,171,927 of redemptions in-kind. |
| | |
| | There were no purchases or sales of U.S. government securities in the Funds. |
| | |
| (10) | Beneficial Ownership |
| | |
| | The beneficial ownership, either directly or indirectly, of more than 25% of the voting securities of a fund creates a presumption of control of the fund, under Section 2(a)(9) of the 1940 Act. At September 30, 2023, Charles Schwab & Co., Inc. held 59.10% of the CrossingBridge Low Duration High Yield Fund, 63.19% of the CrossingBridge Responsible Credit Fund, 65.20% of the CrossingBridge Pre-Merger SPAC ETF, and 51.93% of the RiverPark Strategic Income Fund, respectively. National Financial Services LLC held 87.82% of the CrossingBridge Ultra-Short Duration Fund and 38.76% of the RiverPark Strategic Income Fund at September 30, 2023. |
| | |
| (11) | Line of Credit |
| | |
| | The CrossingBridge Low Duration High Yield Fund, CrossingBridge Responsible Credit Fund, CrossingBridge Ultra-Short Duration Fund and RiverPark Strategic Income Fund (“Borrowing Funds”) and U.S. Bank, N.A. have entered into an umbrella line of credit agreement in the amount of up to $75,000,000, which matures on |
CROSSINGBRIDGE FUNDS
Notes to Financial Statements (Continued)
September 30, 2023
| | August 3, 2024. This unsecured line of credit agreement is intended to provide short-term financing, if necessary, subject to certain restrictions, in connection with shareholder redemptions from the Borrowing Funds. The maximum borrowing can not exceed 20% of the gross market value or 33.33% of the net market value of a Borrowing Fund’s unencumbered assets. Interest on amounts borrowed under the line of credit will be accrued at the prime rate. On March 14, 2023, the CrossingBridge Ultra-Short Duration Fund made a draw on the line of credit of $95,000. Interest was charged at the prime rate of 7.75% totaling $20, which is presented on the Statement of Operations as Interest Expense. No other Fund in the complex drew on the line of credit during the fiscal year ended September 30, 2023. |
| | |
| (12) | Subsequent Events |
| | |
| | In preparing these financial statements, the Funds have evaluated events and transactions for potential recognition or disclosure through the date the financial statements were issued. |
| | |
| | On October 30, 2023, the CrossingBridge Low Duration High Yield Fund, CrossingBridge Responsible Credit Fund, CrossingBridge Ultra-Short Duration Fund and RiverPark Strategic Income Fund declared and paid an income distribution of $3,326,471, $150,440, $438,285 and $2,035,658, respectively, to their Institutional Class shareholders of record on October 27, 2023. The RiverPark Strategic Income Fund also made a distribution to its Retail Class shareholders on these same dates for $107,181. |
| | |
| (13) | Recent Market Events |
| | |
| | U.S. and international markets have experienced significant periods of volatility in recent years and months due to a number of economic, political and global macro factors including rising inflation, uncertainty regarding central banks’ interest rate increases, the possibility of a national or global recession, trade tensions, political events, the war between Russia and Ukraine and the impact of the coronavirus (COVID-19) global pandemic. The global recovery from COVID-19 may last for an extended period of time. As a result of continuing political tensions and armed conflicts, including the war between Ukraine and Russia, the U.S. and the European Union imposed sanctions on certain Russian individuals and companies, including certain financial institutions, and have limited certain exports and imports to and from Russia. The war has contributed to recent market volatility and may continue to do so. These developments, as well as other events, could result in further market volatility and negatively affect financial asset prices, the liquidity of certain securities and the normal operations of securities exchanges and other markets, despite government efforts to address market disruptions. Continuing market volatility as a result of recent market conditions or other events may have an adverse effect on the performance of the Funds. |
CROSSINGBRIDGE FUNDS
Report of Independent Registered Public Accounting Firm
To the Shareholders of CrossingBridge Funds and
Board of Trustees of Trust for Professional Managers
Opinion on the Financial Statements
We have audited the accompanying statements of assets and liabilities, including the schedules of investments, written options, securities sold short, and forward currency exchange contracts, of CrossingBridge Funds comprising the funds listed below (the “Funds”), each a series of Trust for Professional Managers, as of September 30, 2023, the related statements of operations, the statements of changes in net assets, the related notes, and the financial highlights for each of the periods indicated below (collectively referred to as the “financial statements”). In our opinion, the financial statements present fairly, in all material respects, the financial position of each of the Funds as of September 30, 2023, the results of their operations, the changes in net assets, and the financial highlights for each of the periods indicated below in conformity with accounting principles generally accepted in the United States of America.
| | | Statements of | |
| | Statements of | Changes in | Financial |
| Fund Name | Operations | Net Assets | Highlights |
| CrossingBridge Low | For the year ended | For the years ended | For the years ended |
| Duration High Yield Fund and | September 30, 2023 | September 30, 2023, | September 30, 2023, |
| RiverPark Strategic | | and 2022 | 2022, 2021, 2020, |
| Income Fund | | | and 2019 |
| CrossingBridge Responsible | For the year ended | For the years ended | For the years ended |
| Credit Fund and CrossingBridge | September 30, 2023 | September 30, 2023, | September 30, 2023, |
| Ultra-Short Duration Fund | | and 2022 | and 2022, and for |
| | | | the period from |
| | | | June 30, 2021 |
| | | | (commencement of |
| | | | operations) through |
| | | | September 30, 2021 |
| CrossingBridge | For the year ended | For the years ended | For the years ended |
| Pre-Merger SPAC ETF | September 30, 2023 | September 30, 2023, | September 30, 2023, |
| | | and 2022 | and 2022, and for |
| | | | the period from |
| | | | September 20, 2021 |
| | | | (commencement of |
| | | | operations) through |
| | | | September 30, 2021 |
Basis for Opinion
These financial statements are the responsibility of the Funds’ management. Our responsibility is to express an opinion on the Funds’ financial statements based on our audits. We are a public accounting firm registered with the Public Company Accounting Oversight Board (United States) (“PCAOB”) and are required to be independent with respect to the Funds in accordance with the U.S. federal securities laws and the applicable rules and regulations of the Securities and Exchange Commission and the PCAOB.
CROSSINGBRIDGE FUNDS
Report of Independent Registered Public Accounting Firm
(Continued)
We conducted our audits in accordance with the standards of the PCAOB. Those standards require that we plan and perform the audit to obtain reasonable assurance about whether the financial statements are free of material misstatement whether due to error or fraud.
Our audits included performing procedures to assess the risks of material misstatement of the financial statements, whether due to error or fraud, and performing procedures that respond to those risks. Such procedures included examining, on a test basis, evidence regarding the amounts and disclosures in the financial statements. Our procedures included confirmation of securities owned as of September 30, 2023, by correspondence with the custodians, agent banks, and brokers; when replies were not received from brokers or agent banks, we performed other auditing procedures. Our audits also included evaluating the accounting principles used and significant estimates made by management, as well as evaluating the overall presentation of the financial statements. We believe that our audits provide a reasonable basis for our opinion.
We have served as the auditor of one or more Funds advised by CrossingBridge Advisors, LLC since 2015.
COHEN & COMPANY, LTD.
Milwaukee, Wisconsin
November 29, 2023
CROSSINGBRIDGE FUNDS
Basis for Trustees’ Approval of Investment Advisory Agreement
(Unaudited)
The Board of Trustees (the “Trustees”) of Trust for Professional Managers (the “Trust”) met on August 17, 2023 to consider the renewal of the Investment Advisory Agreement (the “Agreement”) between the Trust, on behalf of the CrossingBridge Low Duration High Yield Fund, the CrossingBridge Ultra-Short Duration Fund, and the CrossingBridge Responsible Credit Fund and the CrossingBridge Pre-Merger SPAC ETF (each, a “Fund,” and together, the “Funds”), each a series of the Trust, and CrossingBridge Advisors, LLC (“CrossingBridge”), the Fund’s investment adviser (the “Adviser”). The Trustees also met at a prior meeting held on June 22, 2023 (the “June 22, 2023 meeting”) to review materials related to the renewal of the Agreement. Prior to these meetings, the Trustees requested and received materials to assist them in considering the renewal of the Agreement. The materials provided contained information with respect to the factors enumerated below, including a copy of the Agreement, a memorandum prepared by the Trust’s outside legal counsel discussing in detail the Trustees’ fiduciary obligations and the factors they should assess in considering the renewal of the Agreement, detailed comparative information relating to the Funds’ performance, as well as the management fees and other expenses of the Funds, due diligence materials relating to the Adviser (including a due diligence questionnaire completed on behalf of the Funds by the Adviser, the Adviser’s Form ADV, select financial statements of the Adviser, biographical information of the Adviser’s key management and compliance personnel, comparative fee information for the Funds and the Adviser’s other separately-managed accounts and a summary detailing key provisions of the Adviser’s written compliance program, including its code of ethics) and other pertinent information. The Trustees also received information periodically throughout the year that was relevant to the Agreement renewal process, including performance, management fee and other expense information. Based on their evaluation of the information provided by the Adviser, in conjunction with the Funds’ other service providers, the Trustees, by a unanimous vote (including a separate vote of the Trustees who are not “interested persons,” as that term is defined in the Investment Company Act of 1940, as amended (the “Independent Trustees”)), approved the continuation of the Agreement for an additional one-year term ending August 31, 2024.
DISCUSSION OF FACTORS CONSIDERED
In considering the renewal of the Agreement and reaching their conclusions, the Trustees reviewed and analyzed various factors that they determined were relevant, including the factors enumerated below.
| 1. | NATURE, EXTENT AND QUALITY OF SERVICES PROVIDED TO THE FUNDS |
| | |
| | The Trustees considered the nature, extent and quality of services provided by the Adviser to the Funds and the amount of time devoted to the Funds’ operation by the Adviser’s staff. The Trustees considered the Adviser’s specific responsibilities in all aspects of day-to-day management of the Funds, including the investment strategies implemented by the Adviser, as well as the qualifications, experience and responsibilities of David K. Sherman, Lead Portfolio Manager for each of the Funds, and T. Kirk Whitney, Assistant Portfolio Manager for each of the Funds, and other key personnel at the Adviser involved in the day-to-day activities of the Funds. The Trustees reviewed information provided by the Adviser in a due diligence questionnaire, including the structure of the Adviser’s compliance program and its continuing commitment to the Funds. The Trustees noted that during the course of |
CROSSINGBRIDGE FUNDS
Basis for Trustees’ Approval of Investment Advisory Agreement
(Unaudited) (Continued)
| | the prior year the Adviser had participated in a Trust board meeting to discuss the Funds’ performance and outlook, along with the compliance efforts made by the Adviser, including reports provided by the Adviser in its role as the Funds’ valuation designee. The Trustees also noted any services that extended beyond portfolio management, and they considered the brokerage practices of the Adviser. The Trustees discussed the Adviser’s handling of compliance matters, including the reports of the Trust’s chief compliance officer to the Trustees on the effectiveness of the Adviser’s compliance program. The Trustees also considered the Adviser’s overall financial condition, as well as the implementation and operational effectiveness of the Adviser’s business continuity plan. The Trustees concluded that the Adviser had sufficient quality and depth of personnel, resources, investment methods and compliance policies and procedures essential to performing its duties under each applicable Advisory Agreement and that the nature, overall quality and extent of the management services provided to the Funds, as well as the Adviser’s compliance program, were satisfactory and reliable. |
| | |
| 2. | INVESTMENT PERFORMANCE OF THE FUNDS AND THE ADVISER |
| | |
| | The Trustees discussed the performance of the Institutional Class shares of each of the CrossingBridge Low Duration High Yield Fund, CrossingBridge Ultra-Short Duration Fund, and CrossingBridge Responsible Credit Fund and the performance of the CrossingBridge Pre-Merger SPAC ETF (net asset value price returns) for the quarter, one-year, three-year, five-year and since inception periods ended March 31, 2023, as applicable. In assessing the quality of the portfolio management services delivered by the Adviser, the Trustees also compared the short-term and longer-term performance of the Funds on both an absolute basis and in comparison to each Fund’s primary benchmark index (the ICE BofA 0-3 Year U.S. High Yield Excluding Financials Index for the CrossingBridge Low Duration High Yield Fund, the ICE BofA 0-1 Year U.S. Corporate Index for the CrossingBridge Ultra-Short Duration Fund, the ICE BofA U.S. High Yield Index for the CrossingBridge Responsible Credit Fund, and the ICE BofA 0-3 Year U.S. Treasury Index for the CrossingBridge Pre-Merger SPAC ETF) and in comparison to a peer group of funds as constructed using publicly-available data provided by Morningstar, Inc. and presented by Barrington Financial Group, LLC d/b/a Barrington Partners, an independent third-party benchmarking firm, through its cohort selection process (a peer group of U.S. open-end global allocation, high yield bond, nontraditional bond, multistrategy and tactical allocation funds for the CrossingBridge Low Duration High Yield Fund, a peer group of U.S. open-end short-term bond, high yield bond and ultrashort bond funds for the CrossingBridge Ultra-Short Duration Fund, a peer group of U.S. open-end ultrashort bond, short-term bond and high yield bond funds for the CrossingBridge Responsible Credit Fund, and a peer group of U.S. financial and event-driven exchange-traded funds for the CrossingBridge Pre-Merger SPAC ETF) (each, a “Barrington Cohort”). The Trustees noted that the Adviser sub-advises a mutual fund and manages its segment of the mutual fund’s portfolio with an investment strategy substantially similar to that of the CrossingBridge Low Duration High Yield Fund. The Trustees also noted that the Adviser did not manage any other accounts with the same or similar investment strategies as any of the CrossingBridge Ultra-Short Duration Fund, CrossingBridge Responsible Credit Fund, or CrossingBridge Pre-Merger SPAC ETF. |
CROSSINGBRIDGE FUNDS
Basis for Trustees’ Approval of Investment Advisory Agreement
(Unaudited) (Continued)
| | The Trustees noted the CrossingBridge Low Duration High Yield Fund’s performance for Institutional Class shares for the one-year and five-year periods ended March 31, 2023 was above the Barrington Cohort average. The Trustees noted the CrossingBridge Low Duration High Yield Fund’s performance for Institutional Class shares for the three-year period ended March 31, 2023 was slightly below the Barrington Cohort average. The Trustees noted that for the quarter, three-year and five-year periods ended March 31, 2023, the Institutional Class shares of the CrossingBridge Low Duration High Yield Fund had underperformed the ICE BofA 0-3 Year U.S. High Yield Excluding Financials Index. The Trustees noted that for the one-year and since inception periods ended March 31, 2023, the Institutional Class shares of the CrossingBridge Low Duration High Yield Fund had outperformed the ICE BofA 0-3 Year U.S. High Yield Excluding Financials Index. |
| | |
| | The Trustees noted the CrossingBridge Ultra Short Duration Fund’s performance for Institutional Class shares for the one-year period ended March 31, 2023 was above the Barrington Cohort average. The Trustees noted that for the quarter ended March 31, 2023, the Institutional Class shares of the CrossingBridge Ultra Short Duration Fund had underperformed the ICE BofA 0-1 Year U.S. Corporate Index. The Trustees noted that for the one-year and since inception periods ended March 31, 2023, the Institutional Class shares of the CrossingBridge Ultra Short Duration Fund had outperformed the ICE BofA 0-1 Year U.S. Corporate Index. |
| | |
| | The Trustees noted the CrossingBridge Responsible Credit Fund’s performance for Institutional Class shares for the one-year period ended March 31, 2023 was significantly above the Barrington Cohort average. The Trustees noted that for the quarter ended March 31, 2023, the Institutional Class shares of the CrossingBridge Responsible Credit Fund had underperformed the ICE BofA U.S. High Yield Index. The Trustees noted that for the one-year and since inception periods ended March 31, 2023, the Institutional Class shares of the CrossingBridge Responsible Credit Fund had outperformed the ICE BofA U.S. High Yield Index. |
| | |
| | The Trustees noted the CrossingBridge Pre-Merger SPAC ETF’s performance for the one-year period ended March 31, 2023 was significantly above the Barrington Cohort average. The Trustees noted that for quarter, one-year and since inception periods ended March 31, 2023, the CrossingBridge Pre-Merger SPAC ETF had outperformed the ICE BofA 0-3 Year U.S. Treasury Index. |
| | |
| | After considering all of the information, the Trustees concluded that the performance obtained by the Adviser for each Fund was satisfactory under current market conditions. Although past performance is not a guarantee or indication of future results, the Trustees determined that each Fund and its shareholders were likely to benefit from the Adviser’s continued management. |
| | |
| 3. | COSTS OF SERVICES PROVIDED AND PROFITS REALIZED BY THE ADVISER |
| | |
| | The Trustees considered the cost of services and the structure of the Adviser’s fees, including a review of the expense analyses and other pertinent material with respect to the Funds. The Trustees took into consideration that the management fee for the CrossingBridge Pre-Merger SPAC ETF was a “unitary management fee” whereby the Adviser agrees to pay all expenses incurred by the Fund, except the unitary |
CROSSINGBRIDGE FUNDS
Basis for Trustees’ Approval of Investment Advisory Agreement
(Unaudited) (Continued)
| | management fee payable to the Adviser and certain excluded expenses. The Trustees reviewed the related statistical information and other materials provided, including the comparative expenses and Barrington Cohort comparisons. The Trustees considered the cost structure of each Fund relative to the Barrington Cohort, as well as any fee waivers and expense reimbursements of the Adviser. |
| | |
| | The Trustees also considered the overall profitability of the Adviser and reviewed the Adviser’s financial information, noting that the Adviser had provided substantial subsidies for each of the CrossingBridge Low Duration High Yield Fund’s, CrossingBridge Ultra-Short Duration Fund’s, and CrossingBridge Responsible Credit Fund’s operations since inception and has not yet fully recouped those subsidies. The Trustees also examined the level of profits that could be expected to accrue to the Adviser from the fees payable under each applicable Advisory Agreement and the expense subsidization undertaken by the Adviser with respect to each applicable Fund, as well as each Funds’ brokerage practices and use of soft dollars by the Adviser. These considerations were based on materials requested by the Trustees and the Funds’ administrator specifically for the June 22, 2023 meeting and the August 17, 2023 meeting at which each applicable Advisory Agreement was formally considered, as well as the reports prepared by the Adviser over the course of the year. |
| | |
| | The Trustees noted that the CrossingBridge Low Duration High Yield Fund’s contractual management fee of 0.65% was below the Barrington Cohort average of 0.95%. The Trustees noted that the CrossingBridge Low Duration High Yield Fund was operating below its expense cap of 0.90% (including shareholder servicing plan fees) for Institutional Class shares. The Trustees observed that the CrossingBridge Low Duration High Yield Fund’s total expense ratio (including shareholder servicing plan fees) of 0.88% for Institutional Class shares was below the Barrington Cohort average of 1.27%. The Trustees also compared the fees paid by the CrossingBridge Low Duration High Yield Fund to the sub-advisory fees paid to the Adviser by the sub-advised mutual fund with a substantially similar investment strategy. |
| | |
| | The Trustees noted that the CrossingBridge Ultra-Short Duration Fund’s contractual management fee of 0.65% was above the Barrington Cohort average of 0.41%. The Trustees noted that the CrossingBridge Ultra-Short Duration Fund was operating above its expense cap of 0.90% (including shareholder servicing plan fees) for Institutional Class shares. The Trustees observed that the CrossingBridge Ultra-Short Duration Fund’s total expense ratio (net of fee waivers and expense reimbursements and including shareholder servicing plan fees) of 0.89% for Institutional Class shares was above the Barrington Cohort average of 0.53%. |
| | |
| | The Trustees noted that the CrossingBridge Responsible Credit Fund’s contractual management fee of 0.65% was above the Barrington Cohort average of 0.47%. The Trustees noted that the CrossingBridge Responsible Credit Fund was operating above its expense cap of 0.90% (including shareholder servicing plan fees) for Institutional Class shares. The Trustees observed that the CrossingBridge Responsible Credit Fund’s total expense ratio (net of fee waivers and expense reimbursements and including shareholder servicing plan fees) of 0.89% for Institutional Class shares was above the Barrington Cohort average of 0.64%. |
CROSSINGBRIDGE FUNDS
Basis for Trustees’ Approval of Investment Advisory Agreement
(Unaudited) (Continued)
| | The Trustees noted that the CrossingBridge Pre-Merger SPAC ETF’s contractual management fee of 0.80% was below the Barrington Cohort average of 0.86%. The Trustees observed that the CrossingBridge Pre-Merger SPAC ETF’s unitary fee structure limits the Fund’s total expense ratio to 0.80% and such expense ratio was below the Barrington Cohort average of 0.83%. |
| | |
| | The Trustees concluded that the Funds’ expenses and the management fees paid to the Adviser were fair and reasonable in light of the comparative performance, expense and management fee information. The Trustees noted, based on a profitability analysis prepared by the Adviser, that the Adviser’s profits from sponsoring each of the CrossingBridge Low Duration High Yield Fund, CrossingBridge Ultra-Short Duration Fund and CrossingBridge Pre-Merger SPAC ETF were not excessive, and while the CrossingBridge Responsible Credit Fund was not yet profitable to the Adviser, the Adviser maintained adequate profit levels to support the services to each Fund from the revenues of its overall investment advisory business, despite subsidizing the operations of the CrossingBridge Responsible Credit Fund. |
| | |
| 4. | EXTENT OF ECONOMIES OF SCALE AS THE FUNDS GROW |
| | |
| | The Trustees compared each Fund’s expenses relative to its peer group and discussed realized and potential economies of scale. The Trustees also reviewed the structure of each Fund’s management fee and whether each Fund was large enough to generate economies of scale for shareholders or whether economies of scale would be expected to be realized as Fund assets grow (and if so, how those economies of scale were being or would be shared with shareholders). The Trustees reviewed all fee waivers, expense reimbursements and actual or potential recoupments by the Adviser with respect to the Funds. The Trustees noted that the Funds’ management fee structures did not contain any breakpoint reductions as each Fund’s assets grow in size, but that the feasibility of incorporating breakpoints would continue to be reviewed on a regular basis. With respect to the Adviser’s fee structures, the Trustees concluded that the current fee structures were reasonable and reflected a sharing of economies of scale between the Adviser and each Fund at the Fund’s current asset level. |
| | |
| 5. | BENEFITS DERIVED FROM THE RELATIONSHIP WITH THE FUNDS |
| | |
| | The Trustees considered the direct and indirect benefits that could be received by the Adviser from its association with the Funds. The Trustees examined the brokerage practices of the Adviser with respect to the Funds. The Trustees concluded that the benefits the Adviser may receive, such as greater name recognition and increased ability to obtain research or brokerage services or attract additional investor assets, appear to be reasonable, and in many cases may benefit the Funds. |
CONCLUSIONS
The Trustees considered all of the foregoing factors. In considering the renewal of the Advisory Agreement, the Trustees did not identify any one factor as all-important, but rather considered these factors collectively in light of each Fund’s surrounding circumstances. Based on this review, the Trustees, including a majority of the Independent Trustees, approved the continuation of each applicable Advisory Agreement for an additional one-year term ending August 31, 2024 as being in the best interests of each Fund and its shareholders.
RIVERPARK STRATEGIC INCOME FUND
Basis for Trustees’ Approval of Investment Advisory Agreement
(Unaudited)
The Board of Trustees (the “Trustees”) of Trust for Professional Managers (the “Trust”) met on April 20, 2023 to consider the initial approval of the Investment Advisory Agreement (the “Agreement”) between the Trust, on behalf of the RiverPark Strategic Income Fund (the “Fund”), a series of the Trust, and CrossingBridge Advisors, LLC, the Fund’s investment adviser (the “Adviser”). In advance of the meeting, the Trustees requested and received materials to assist them in considering the approval of the Agreement, including a memorandum provided by the Fund’s legal counsel, which outlined the Trustees’ responsibilities in considering the Agreement. The materials provided contained information with respect to the factors enumerated below, including a copy of the Agreement, detailed comparative information relating to the Fund’s performance, as well as the management fees and other expenses of the Fund, due diligence materials relating to the Adviser (including a due diligence questionnaire completed on behalf of the Fund by the Adviser, the Adviser’s Form ADV, select financial statements of the Adviser, biographical information of the Adviser’s key management and compliance personnel, comparative fee information for the Fund and the Adviser’s other separately-managed accounts and a summary detailing key provisions of the Adviser’s written compliance program, including its code of ethics) and other pertinent information. In considering approval of the Agreement, the Trustees also reviewed the Trust’s post effective amendment to its Form N-1A registration statement, including the prospectus and statement of additional information included therein, relating to the initial registration of the Fund.
In reviewing the Advisory Agreement, the Board considered certain matters, including, but not limited to, the following: (1) the nature, extent and quality of services that would be provided to the Fund by the Adviser; (2) the cost of services provided and profits realized by the Adviser from its management of the Fund; (3) the extent to which economies of scale would be realized as the Fund grows and whether the proposed management fees for the Fund reflect these economies of scale for the Fund’s benefit; and (4) other financial benefits to the Adviser resulting from services rendered to the Fund. Based on their evaluation of the information provided by the Adviser, in conjunction with the Fund’s other service providers, the Trustees, by a unanimous vote (including a separate vote of the Trustees who are not “interested persons,” as that term is defined in the Investment Company Act of 1940, as amended (the “Independent Trustees”)), approved the Agreement for an initial term ending two years following the Fund’s commencement of operations pursuant to an effective registration statement.
| 1. | NATURE, EXTENT AND QUALITY OF SERVICES TO BE PROVIDED TO THE FUND |
| | |
| | The Trustees considered the nature, extent and quality of services that would be provided by the Adviser to the Fund and the amount of time devoted by the Adviser’s staff to the Fund’s operations. The Trustees considered the Adviser’s specific responsibilities in all aspects of day-to-day management of the Fund, as well as the qualifications, experience and responsibilities of David K. Sherman, Portfolio Manager, who will serve as portfolio manager for the Fund, and other key personnel at the Adviser involved in the day-to-day activities of the Fund. The Trustees noted that the Fund will be the successor to the corresponding series of RiverPark Funds Trust (the “Predecessor Fund”) sub-advised by an affiliate of the Adviser and which will be reorganized with and into the Fund. The Trustees reviewed information |
RIVERPARK STRATEGIC INCOME FUND
Basis for Trustees’ Approval of Investment Advisory Agreement
(Unaudited) (Continued)
| | provided by the Adviser in a due diligence questionnaire, including the structure of the Adviser’s compliance program and discussed the Adviser’s marketing activities and its commitment to the Fund. The Trustees also noted any services that extended beyond portfolio management, and they considered the brokerage practices of the Adviser. The Trustees discussed the Adviser’s handling of compliance matters, including the reports of the Trust’s chief compliance officer to the Trustees on the effectiveness of the Adviser’s compliance program. The Trustees also considered the Adviser’s overall financial condition, as well as the implementation and operational effectiveness of the Adviser’s business continuity plan. The Trustees concluded that the Adviser had sufficient quality and depth of personnel, resources, investment methods and compliance policies and procedures essential to performing its duties under the Advisory Agreement and that the nature, overall quality and extent of the management services provided to the Fund, as well as the Adviser’s compliance program, were satisfactory and reliable. |
| | |
| 2. | INVESTMENT PERFORMANCE OF THE FUND AND THE ADVISER |
| | |
| | In considering the portfolio management services to be provided by the Adviser, the Trustees considered the investment management experience of Mr. Sherman. Because the Fund had not yet commenced operations and did not have its own performance history, the Trustees considered the historical performance of the Predecessor Fund, which is managed by Mr. Sherman in identical respects as he will manage the Fund. The Trustees noted that the Fund will not commence operations until after the closing of the reorganization of the Predecessor Fund with and into the Fund, at which time the Fund will adopt the performance history of the Predecessor Fund. The Trustees discussed the performance of the Institutional Class shares of the Predecessor Fund for the one-year, three-year, five-year, and since inception periods ended December 31, 2022. In assessing the quality of the portfolio management services to be provided by the Adviser, the Trustees compared the short-term and longer-term performance of the Predecessor Fund on both an absolute basis and in comparison to its primary benchmark index (the Bloomberg U.S. Aggregate Bond Index), as well as two additional secondary benchmark indices. The Trustees also noted that the Adviser sub-advises a mutual fund and manages its segment of the mutual fund’s portfolio with an investment strategy substantially similar to that of the Fund. |
| | |
| | The Trustees noted that the Institutional Class shares of the Predecessor Fund outperformed the Bloomberg U.S. Aggregate Bond Index for the one-year, three-year, five-year, and since inception periods ended December 31, 2022. The Trustees also noted that the performance of the Institutional Class shares of the Predecessor Fund was in-line with the performance of the segment of the separate comparable mutual fund sub-advised by the Adviser, taking into account cash flows and slight differences in the investment guidelines for the respective funds. |
| | |
| | After considering all of the information and noting that past performance is not a guarantee or indication of future results, the Trustees determined that the Fund and its shareholders were likely to benefit from the Adviser’s management. |
RIVERPARK STRATEGIC INCOME FUND
Basis for Trustees’ Approval of Investment Advisory Agreement
(Unaudited) (Continued)
| 3. | COSTS OF SERVICES PROVIDED AND PROFITS TO BE REALIZED BY THE ADVISER |
| | |
| | The Trustees considered the cost of services and the structure of the Adviser’s proposed management fee, including a review of the expense analyses and other pertinent material with respect to the Fund. The Trustees reviewed the related statistical information and other materials provided, including the comparative expenses, expense components and peer group selection. The Trustees considered the cost structure of the Fund relative to a peer group of funds as constructed using publicly-available data provided by Morningstar, Inc. and presented by Barrington Financial Group, LLC d/b/a Barrington Partners, an independent third-party benchmarking firm, through its cohort selection process (a peer group of U.S. multisector bond funds (the “Barrington Cohort”)). The Trustees also compared the fees to be paid by the Fund to the sub-advisory fees paid to the Adviser by the sub-advised mutual fund with a substantially similar investment strategy. |
| | |
| | The Trustees noted that the Fund’s proposed contractual management fee of 0.65% was higher than the Barrington Cohort average of 0.60%. The Trustees further noted that the Fund’s total expense ratio (which includes estimated shareholder servicing plan fees and dividends and interest on short positions) of 1.09% was above the Barrington Cohort average of 0.68%. |
| | |
| | The Trustees noted that the Adviser has agreed to waive its management fees and/or reimburse expenses of the Fund for a period of two years following the closing of the reorganization to ensure that the total amount of the Fund’s operating expenses (exclusive of front-end or contingent deferred loads, Rule 12b-1 plan fees, shareholder servicing plan fees, leverage (i.e., any expenses incurred in connection with borrowings made by the Fund) interest (including interest incurred in connection with bank and custody overdrafts), brokerage commissions and other transactional expenses, expenses incurred in connection with any merger or reorganization, dividends or interest on short positions, acquired fund fees and expenses or extraordinary expenses such as litigation) does not exceed 0.82% of the average net assets of the Fund. |
| | |
| | The Trustees also considered the overall profitability that may result from the Adviser’s management of the Fund and reviewed the Adviser’s financial information. The Trustees also examined the level of profits that could be realized by the Adviser from the fees payable under the Agreement based on a pro forma profitability analysis provided by the Adviser. |
| | |
| | The Trustees concluded that the Fund’s estimated expenses and the proposed management fee to be paid to the Adviser were fair and reasonable in light of the comparative expense and management fee information and the investment management services to be provided to the Fund by the Adviser. The Trustees further concluded, based on a pro forma profitability analysis prepared by the Adviser, that the Adviser’s anticipated profit from sponsoring the Fund would not be excessive and that the Adviser maintained adequate profit levels to support its services to the Fund. |
RIVERPARK STRATEGIC INCOME FUND
Basis for Trustees’ Approval of Investment Advisory Agreement
(Unaudited) (Continued)
| 4. | EXTENT OF ECONOMIES OF SCALE AS THE FUND GROWS |
| | |
| | The Trustees compared the Fund’s estimated expenses relative to its Barrington Cohort and discussed economies of scale. With respect to the Fund, the Trustees noted that the Fund’s proposed management fee structure did not contain any breakpoint reductions as the Fund’s assets grow in size, but that the feasibility of incorporating breakpoints would be reviewed on a regular basis. With respect to the Adviser’s fee structure, the Trustees concluded that the potential economies of scale with respect to the Fund was acceptable. |
| | |
| 5. | BENEFITS TO BE DERIVED FROM THE RELATIONSHIP WITH THE FUND |
| | |
| | The Trustees considered the direct and indirect benefits that could be realized by the Adviser from its association with the Fund. The Trustees concluded that the benefits the Adviser may receive, such as greater name recognition, an increased ability to obtain research or brokerage services, or the ability to attract additional investor assets, appear to be reasonable, and in many cases may benefit the Fund. |
CONCLUSIONS
The Trustees considered all of the foregoing factors. In considering the approval of the Advisory Agreement, the Trustees did not identify any one factor as all-important, but rather considered these factors collectively in light of the Fund’s surrounding circumstances. Based on this review, the Trustees, including a majority of the Independent Trustees, approved the proposed Advisory Agreement for an initial two-year term as being in the best interests of the Fund and its shareholders.
CROSSINGBRIDGE FUNDS
Review of Liquidity Risk Management Program
(Unaudited)
In accordance with Rule 22e-4 under the Investment Company Act of 1940, as amended, Trust for Professional Managers (the “Trust”) has adopted and implemented a liquidity risk management program (the “Trust Program”). As required under the Trust Program, CrossingBridge Advisors, LLC (“CrossingBridge”), the investment adviser to the CrossingBridge Low Duration High Yield Fund, CrossingBridge Responsible Credit Fund, CrossingBridge Ultra-Short Duration Fund and CrossingBridge Pre-Merger SPAC ETF (the "Funds"), each a separate series of the Trust, adopted and implemented a liquidity risk management program tailored specifically to the Funds (the “Adviser Program”). The Adviser Program seeks to promote effective liquidity risk management for the Funds and to protect the Funds’ shareholders from dilution of their interests. The Board of Trustees (the “Board”) of the Trust has approved CrossingBridge as the administrator for the Adviser Program (the “Program Administrator”). The Program Administrator has further delegated administration of the Adviser Program to its Liquidity Risk Management Committee. The Program Administrator is required to provide a written annual report to the Board and the Trust’s chief compliance officer regarding the adequacy and effectiveness of the Adviser Program, including the operation of each Fund’s highly liquid investment minimum, if applicable, and any material changes to the Adviser Program.
On April 20, 2023, the Board reviewed the Program Administrator’s written annual report for the period January 1, 2022 through December 31, 2022 (the “Report”). The Report provided an assessment of each Fund’s liquidity risk: the risk that each Fund could not meet requests to redeem shares issued by the respective Fund without significant dilution of the remaining investors’ interests in the Fund. The Adviser Program assesses liquidity risk under both normal and reasonably foreseeable stressed market conditions. The Program Administrator has retained ICE Data Services, Inc., a third party vendor, to provide portfolio investment classification services, and the Report noted that the Funds primarily held investments that were classified as highly liquid during the review period. The Report noted that each Fund’s portfolio is expected to continue to primarily hold highly liquid investments and the determination that each of the CrossingBridge Low Duration High Yield Fund, CrossingBridge Responsible Credit Fund and CrossingBridge Ultra-Short Duration Fund be designated as a “primarily highly liquid fund” (as defined in Rule 22e-4) and that the CrossingBridge Pre-Merger SPAC ETF be designated as an “in-kind ETF” (as defined in Rule 22e-4) remains appropriate and the Funds can therefore continue to rely on the exclusion in Rule 22e-4 from the requirements to determine and review a highly liquid investment minimum for each Fund and to adopt policies and procedures for responding to a highly liquid investment minimum shortfall. The Report noted that there were no breaches of the Funds’ restrictions on holding illiquid investments exceeding 15% of its net assets during the review period. The Report confirmed that each Fund’s investment strategy was appropriate for an open-end management investment company. The Report also indicated that no material changes had been made to the Adviser Program during the review period.
The Program Administrator determined that the Funds are reasonably likely to be able to meet redemption requests without adversely affecting non-redeeming Fund shareholders through significant dilution. The Program Administrator concluded that the Adviser Program was adequately designed and effectively implemented during the review period.
CROSSINGBRIDGE FUNDS
Additional Information
(Unaudited)
Tax Information
The Percentage of taxable ordinary income distributions that are designated as short-term capital gain distributions under Internal Revenue Section 871(k)(2)(C) for each Fund were as follows:
| | CrossingBridge Low Duration High Yield Fund | 0.58% | |
| | CrossingBridge Responsible Credit Fund | 6.25% | |
| | CrossingBridge Ultra-Short Duration Fund | 5.84% | |
| | CrossingBridge Pre-Merger SPAC ETF | 13.46% | |
| | RiverPark Strategic Income Fund | 0.00% | |
For the fiscal year or period ended September 30, 2023, certain dividends paid by the Funds may be subject to a maximum tax rate of 20%, as provided for by the Jobs and Growth Tax Relief Reconciliation Act of 2003. The percentage of dividends declared from ordinary income designated as qualified dividend income were as follows:
| | CrossingBridge Low Duration High Yield Fund | 0.05% | |
| | CrossingBridge Responsible Credit Fund | 0.00% | |
| | CrossingBridge Ultra-Short Duration Fund | 0.20% | |
| | CrossingBridge Pre-Merger SPAC ETF | 0.61% | |
| | RiverPark Strategic Income Fund | 0.67% | |
For corporate shareholders, the percent of ordinary income distributions qualifying for the corporate dividends received deduction for the fiscal year were as follows:
| | CrossingBridge Low Duration High Yield Fund | 0.05% | |
| | CrossingBridge Responsible Credit Fund | 0.00% | |
| | CrossingBridge Ultra-Short Duration Fund | 0.20% | |
| | CrossingBridge Pre-Merger SPAC ETF | 0.61% | |
| | RiverPark Strategic Income Fund | 0.52% | |
CROSSINGBRIDGE FUNDS
Additional Information (Continued)
(Unaudited)
Information about Trustees
The business and affairs of the Trust are managed under the direction of the Board of Trustees. Information pertaining to the Trustees of the Trust is set forth below. The Statement of Additional Information includes additional information about the Trustees and is available, without charge, upon request by calling 1-888-898-2780.
| | | | | | Other |
| | | | Number of | | Directorships |
| | | Term of | Portfolios | Principal | Held by |
| Name, | Position(s) | Office and | in the Trust | Occupation(s) | Trustee During |
| Address, and | Held with | Length of | Overseen by | During the Past | the Past |
Year of Birth | the Trust | Time Served | the Trustee | Five Years | Five Years |
| Independent Trustees | | | | | |
| | | | | | |
| Michael D. | Trustee | Indefinite | 28 | Professor | Independent |
| Akers, Ph.D. | | Term; Since | | Emeritus, | Trustee, USA |
| 615 E. Michigan St. | | August 22, | | Department of | MUTUALS |
| Milwaukee, WI 53202 | | 2001 | | Accounting | (an open-end |
| Year of Birth: 1955 | | | | (June 2019- | investment |
| | | | | present), | company) |
| | | | | Professor, | (2001-2021). |
| | | | | Department of | |
| | | | | Accounting | |
| | | | | (2004-2019), | |
| | | | | Marquette | |
| | | | | University. | |
| | | | | | |
| Gary A. Drska | Trustee | Indefinite | 28 | Retired; | Independent |
| 615 E. Michigan St. | | Term; Since | | Former Pilot, | Trustee, USA |
| Milwaukee, WI 53202 | | August 22, | | Frontier/Midwest | MUTUALS |
| Year of Birth: 1956 | | 2001 | | Airlines, Inc. | (an open-end |
| | | | | (airline company) | investment |
| | | | | (1986-2021) | company) |
| | | | | | (2001-2021). |
CROSSINGBRIDGE FUNDS
Additional Information (Continued)
(Unaudited)
| | | | | | Other |
| | | | Number of | | Directorships |
| | | Term of | Portfolios | Principal | Held by |
| Name, | Position(s) | Office and | in the Trust | Occupation(s) | Trustee During |
| Address, and | Held with | Length of | Overseen by | During the Past | the Past |
Year of Birth | the Trust | Time Served | the Trustee | Five Years | Five Years |
| Vincent P. Lyles | Trustee | Indefinite | 28 | Executive | Independent |
| 615 E. Michigan St. | | Term; Since | | Director, | Director, BMO |
| Milwaukee, WI 53202 | | April 6, | | Milwaukee | Funds, Inc. |
| Year of Birth: 1961 | | 2022 | | Succeeds | (an open-end |
| | | | | (education | investment |
| | | | | advocacy | company) |
| | | | | organization) | (2017-2022). |
| | | | | (2023-present); | |
| | | | | System Vice | |
| | | | | President of | |
| | | | | Community | |
| | | | | Relations, | |
| | | | | Advocate | |
| | | | | Aurora Health | |
| | | | | Care (health | |
| | | | | care provider) | |
| | | | | (2019-2022); | |
| | | | | President and | |
| | | | | Chief Executive | |
| | | | | Officer, Boys & | |
| | | | | Girls Club of | |
| | | | | Greater | |
| | | | | Milwaukee | |
| | | | | (2012-2018). | |
| | | | | | |
| Erik K. Olstein | Trustee | Indefinite | 28 | Retired; | Trustee, The |
| 615 E. Michigan St. | | Term; Since | | President and | Olstein Funds |
| Milwaukee, WI 53202 | | April 6, | | Chief Operation | (an open-end |
| Year of Birth: 1967 | | 2022 | | Officer (2000- | investment |
| | | | | 2020), Vice | company) |
| | | | | President of | (1995-2018). |
| | | | | Sales and Chief | |
| | | | | Operating Officer | |
| | | | | (1995-2000), | |
| | | | | Olstein Capital | |
| | | | | Management, | |
| | | | | L.P. (asset | |
| | | | | management | |
| | | | | firm); Secretary | |
| | | | | and Assistant | |
| | | | | Treasurer, The | |
| | | | | Olstein Funds | |
| | | | | (1995-2018). | |
CROSSINGBRIDGE FUNDS
Additional Information (Continued)
(Unaudited)
| | | | | | Other |
| | | | Number of | | Directorships |
| | | Term of | Portfolios | Principal | Held by |
| Name, | Position(s) | Office and | in the Trust | Occupation(s) | Trustee During |
| Address, and | Held with | Length of | Overseen by | During the Past | the Past |
Year of Birth | the Trust | Time Served | the Trustee | Five Years | Five Years |
| Lisa Zúñiga Ramírez | Trustee | Indefinite | 28 | Retired; | Director, |
| 615 E. Michigan St. | | Term; Since | | Principal and | Peoples |
| Milwaukee, WI 53202 | | April 6, | | Senior Portfolio | Financial |
| Year of Birth: 1969 | | 2022 | | Manager, Segall, | Services |
| | | | | Bryant & Hamill, | Corp. (a |
| | | | | LLC (asset | publicly- |
| | | | | management | traded bank |
| | | | | firm) (2018- | holding |
| | | | | 2020); Partner | company) |
| | | | | and Senior | (2022-present). |
| | | | | Portfolio | |
| | | | | Manager, Denver | |
| | | | | Investments | |
| | | | | LLC (asset | |
| | | | | management | |
| | | | | firm) (2009-2018). | |
| | | | | | |
| Gregory M. Wesley | Trustee | Indefinite Term; | 28 | Senior Vice | N/A |
| 615 E. Michigan St. | | Since April 6, | | President of | |
| Milwaukee, WI 53202 | | 2022 | | Strategic | |
| Year of Birth: 1969 | | | | Alliances and | |
| | | | | Business | |
| | | | | Development, | |
| | | | | Medical College | |
| | | | | of Wisconsin | |
| | | | | (2016-present). | |
| | | | | | |
| Interested Trustee and Officers | | | | | |
| | | | | | |
| John P. Buckel* | Chairperson, | Indefinite | 28 | Vice President, | N/A |
| 615 E. Michigan St. | Trustee, | Term; | | U.S. Bancorp | |
| Milwaukee, WI 53202 | President | Chairperson | | Fund Services, LLC | |
| Year of Birth: 1957 | and | and Trustee | | (2004-present). | |
| | Principal | (Since | | | |
| | Executive | January 19, | | | |
| | Officer | 2023); | | | |
| | | President | | | |
| | | and Principal | | | |
| | | Executive | | | |
| | | Officer (Since | | | |
| | | January 24, | | | |
| | | 2013) | | | |
| * | Mr. Buckel is an “interested person” of the Trust as defined by the 1940 Act due to his position and material business relationship with the Trust. |
CROSSINGBRIDGE FUNDS
Additional Information (Continued)
(Unaudited)
| | | | | | Other |
| | | | Number of | | Directorships |
| | | Term of | Portfolios | Principal | Held by |
| Name, | Position(s) | Office and | in the Trust | Occupation(s) | Trustee During |
| Address, and | Held with | Length of | Overseen by | During the Past | the Past |
Year of Birth | the Trust | Time Served | the Trustee | Five Years | Five Years |
| Jennifer A. Lima | Vice | Indefinite | N/A | Vice President, | N/A |
| 615 E. Michigan St. | President, | Term; Since | | U.S. Bancorp | |
| Milwaukee, WI 53202 | Treasurer | January 24, | | Fund Services, | |
| Year of Birth: 1974 | and | 2013 | | LLC (2002- | |
| | Principal | | | present). | |
| | Financial | | | | |
| | and | | | | |
| | Accounting | | | | |
| | Officer | | | | |
| | | | | | |
| Deanna B. Marotz | Chief | Indefinite | N/A | Senior Vice | N/A |
| 615 E. Michigan St. | Compliance | Term; Since | | President, U.S. | |
| Milwaukee, WI 53202 | Officer, | October 21, | | Bancorp Fund | |
| Year of Birth: 1965 | Vice | 2021 | | Services, LLC | |
| | President | | | (2021-present); | |
| | and | | | Chief Compliance | |
| | Anti-Money | | | Officer of Keeley- | |
| | Laundering | | | Teton Advisors, | |
| | Officer | | | LLC and Teton | |
| | | | | Advisors, Inc. | |
| | | | | (2017-2021). | |
| | | | | | |
| Jay S. Fitton | Secretary | Indefinite | N/A | Assistant Vice | N/A |
| 615 E. Michigan St. | | Term; Since | | President, U.S. | |
| Milwaukee, WI 53202 | | July 22, | | Bancorp Fund | |
| Year of Birth: 1970 | | 2019 | | Services, LLC | |
| | | | | (2019-present); | |
| | | | | Partner, Practus, | |
| | | | | LLP (2018-2019); | |
| | | | | Counsel, Drinker | |
| | | | | Biddle & Reath | |
| | | | | (2016-2018). | |
CROSSINGBRIDGE FUNDS
Additional Information (Continued)
(Unaudited)
| | | | | | Other |
| | | | Number of | | Directorships |
| | | Term of | Portfolios | Principal | Held by |
| Name, | Position(s) | Office and | in the Trust | Occupation(s) | Trustee During |
| Address, and | Held with | Length of | Overseen by | During the Past | the Past |
Year of Birth | the Trust | Time Served | the Trustee | Five Years | Five Years |
| Officers | | | | | |
| | | | | | |
| Kelly A. Strauss | Assistant | Indefinite | N/A | Assistant Vice | N/A |
| 615 E. Michigan St. | Treasurer | Term; Since | | President, U.S. | |
| Milwaukee, WI 53202 | | April 23, | | Bancorp Fund | |
| Year of Birth: 1987 | | 2015 | | Services, LLC | |
| | | | | (2011-present). | |
| | | | | | |
| Shannon Coyle | Assistant | Indefinite | N/A | Officer, U.S. | N/A |
| 615 E. Michigan St. | Treasurer | Term; Since | | Bancorp Fund | |
| Milwaukee, WI 53202 | | August 26, | | Services, LLC | |
| Year of Birth: 1990 | | 2022 | | (2015-present). | |
| | | | | | |
| Laura A. Carroll | Assistant | Indefinite | N/A | Assistant Vice | N/A |
| 615 E. Michigan St. | Treasurer | Term; Since | | President, U.S. | |
| Milwaukee, WI 53202 | | August 20, | | Bancorp Fund | |
| Year of Birth: 1985 | | 2018 | | Services, LLC | |
| | | | | (2007-present). | |
A NOTE ON FORWARD LOOKING STATEMENTS (Unaudited)
Except for historical information contained in this report for the Funds, the matters discussed in this report may constitute forward-looking statements made pursuant to the safe-harbor provisions of the Private Securities Litigation Reform Act of 1995. These include any adviser or portfolio manager predictions, assessments, analyses or outlooks for individual securities, industries, market sectors and/or markets. These statements involve risks and uncertainties. In addition to the general risks described for the Funds in the current Prospectus, other factors bearing on this report include the accuracy of the adviser’s or portfolio managers’ forecasts and predictions, and the appropriateness of the investment programs designed by the adviser or portfolio managers to implement their strategies efficiently and effectively. Any one or more of these factors, as well as other risks affecting the securities markets and investment instruments generally, could cause the actual results of a Fund to differ materially as compared to benchmarks associated with the Fund.
ADDITIONAL INFORMATION (Unaudited)
The Funds have adopted proxy voting policies and procedures that delegate to the Adviser the authority to vote proxies. A description of the Funds’ proxy voting policies and procedures is available without charge, upon request, by calling the Funds’ toll-free at 1-888-898-2780. A description of these policies and procedures is also included in a Fund’s Statement of Additional Information, which is available on the SEC’s website at http://www.sec.gov.
A Fund’s proxy voting record for the most recent 12-month period ended June 30 (as applicable) is available without charge, upon request, by calling, toll-free, 1-888-898-2780, or by accessing the SEC’s website at http://www.sec.gov.
The Funds file their complete schedules of portfolio holdings with the SEC for the first and third quarters of each fiscal year on Part F of Form N-PORT. Shareholders may view a Fund’s filings (as applicable) on the SEC’s website at www.sec.gov.
HOUSEHOLDING (Unaudited)
In an effort to decrease costs, the Funds intend to reduce the number of duplicate prospectuses and certain other shareholder documents you receive by sending only one copy of each to those addresses shared by two or more accounts and to shareholders the Funds reasonably believes are from the same family or household. Once implemented, if you would like to discontinue householding for your accounts, please call toll-free at 1-888-898-2780 to request individual copies of these documents. Once a Fund receives notice to stop householding, the Fund will begin sending individual copies 30 days after receiving your request. This policy does not apply to account statements.
FREQUENCY DISTRIBUTION OF PREMIUMS AND DISCOUNTS (Unaudited)
Information regarding how often shares of the CrossingBridge Pre-Merger SPAC ETF trade on an exchange at a price above (i.e., at a premium) or below (i.e., at a discount) the NAV of the ETF is available without charge, on the ETF’s website at www.crossingbridgefunds.com.
CROSSINGBRIDGE FUNDS
| Investment Adviser | CrossingBridge Advisors, LLC |
| | 427 Bedford Road, Suite 220 |
| | Pleasantville, New York 10570 |
| | |
| Legal Counsel | Godfrey & Kahn, S.C. |
| | 833 East Michigan Street, Suite 1800 |
| | Milwaukee, Wisconsin 53202 |
| | |
| Independent Registered Public | Cohen & Company, Ltd. |
| Accounting Firm | 342 North Water Street, Suite 830 |
| | Milwaukee, Wisconsin 53202 |
| | |
| Transfer Agent, Fund Accountant and | U.S. Bancorp Fund Services, LLC |
| Fund Administrator | 615 East Michigan Street |
| | Milwaukee, Wisconsin 53202 |
| | |
| Custodian | U.S. Bank, N.A. |
| | Custody Operations |
| | 1555 North River Center Drive |
| | Milwaukee, Wisconsin 53212 |
| | |
| Distributors | Quasar Distributors, LLC |
| | 111 East Kilbourn Avenue, Suite 1250 |
| | Milwaukee, Wisconsin 53202 |
| | |
| | Foreside Fund Services, LLC |
| | Three Canal Plaza, Suite 100 |
| | Portland, Maine 04101 |
This report is intended for shareholders of the Funds and may not be used as sales literature unless preceded or accompanied by a current prospectus.
(b) Not applicable.
Item 2. Code of Ethics.
The registrant has adopted a code of ethics that applies to the registrant’s principal executive officer and principal financial officer. The registrant has not made any amendments to its code of ethics during the period covered by this report. The registrant has not granted any waivers from any provisions of the code of ethics during the period covered by this report. A copy of the registrant’s Code of Ethics is incorporated by reference to the Registrant’s Form N-CSR filed on December 10, 2018.
Item 3. Audit Committee Financial Expert.
The registrant’s board of trustees has determined that there is at least one audit committee financial expert serving on its audit committee. Dr. Michael Akers is the “audit committee financial expert” and is considered to be “independent” as each term is defined in Item 3 of Form N‑CSR. Dr. Akers holds a Ph.D. in accountancy and is a professor Emeritus of accounting at Marquette University in Milwaukee, Wisconsin.
Item 4. Principal Accountant Fees and Services.
The registrant has engaged its principal accountant to perform audit services, audit-related services, tax services and other services during the past two fiscal years. “Audit services” refer to performing an audit of the registrant's annual financial statements or services that are normally provided by the accountant in connection with statutory and regulatory filings or engagements for those fiscal years. “Audit-related services” refer to the assurance and related services by the principal accountant that are reasonably related to the performance of the audit. “Tax services” refer to professional services rendered by the principal accountant for tax compliance, tax advice, and tax planning. The following table details the aggregate fees billed or expected to be billed for each of the last two fiscal years for audit fees, audit-related fees, tax fees and other fees by the principal accountant.
| | FYE 9/30/2023 | FYE 9/30/2022 |
(a) Audit Fees | $121,000 | $75,500 |
(b) Audit-Related Fees | 0 | 0 |
(c) Tax Fees | 17,500 | 14,000 |
(d) All Other Fees | 0 | 0 |
(e)(1) The audit committee has adopted pre-approval policies and procedures that require the audit committee to pre‑approve all audit and non‑audit services of the registrant, including services provided to any entity affiliated with the registrant.
(e)(2) The percentage of fees billed by Cohen & Company, Ltd. applicable to non-audit services pursuant to waiver of pre-approval requirement were as follows:
| | FYE 9/30/2023 | FYE 9/30/2022 |
Audit-Related Fees | 0% | 0% |
Tax Fees | 0% | 0% |
All Other Fees | 0% | 0% |
(f) All of the principal accountant’s hours spent on auditing the registrant’s financial statements were attributed to work performed by full‑time permanent employees of the principal accountant.
(g) The following table indicates the non-audit fees billed or expected to be billed by the registrant’s accountant for services to the registrant and to the registrant’s investment adviser (and any other controlling entity, etc.—not sub-adviser) for the last two years.
Non-Audit Related Fees | FYE 9/30/2023 | FYE 9/30/2022 |
Registrant | $0 | $0 |
Registrant’s Investment Adviser | $0 | $0 |
(h) The audit committee of the board of trustees has considered whether the provision of non-audit services that were rendered to the registrant's investment adviser is compatible with maintaining the principal accountant's independence and has concluded that the provision of such non-audit services by the accountant has not compromised the accountant’s independence.
(i) Not applicable.
(j) Not applicable.
Item 5. Audit Committee of Listed Registrants.
Not applicable to registrants who are not listed issuers (as defined in Rule 10A-3 under the Securities Exchange Act of 1934).
Item 6. Investments.
| (a) | Schedule of Investments is included as part of the report to shareholders filed under Item 1 of this Form. |
Item 7. Disclosure of Proxy Voting Policies and Procedures for Closed-End Management Investment Companies.
Not applicable to open-end investment companies.
Item 8. Portfolio Managers of Closed-End Management Investment Companies.
Not applicable to open-end investment companies.
Item 9. Purchases of Equity Securities by Closed‑End Management Investment Company and Affiliated Purchasers.
Not applicable to open-end investment companies.
Item 10. Submission of Matters to a Vote of Security Holders.
There have been no material changes to the procedures by which shareholders may recommend nominees to the registrant’s board of trustees.
Item 11. Controls and Procedures.
| (a) | The Registrant’s President and Treasurer have reviewed the Registrant's disclosure controls and procedures (as defined in Rule 30a-3(c) under the Investment Company Act of 1940 (the “Act”)) as of a date within 90 days of the filing of this report, as required by Rule 30a-3(b) under the Act and Rules 13a-15(b) or 15d‑15(b) under the Securities Exchange Act of 1934. Based on their review, such officers have concluded that the disclosure controls and procedures are effective in ensuring that information required to be disclosed in this report is appropriately recorded, processed, summarized and reported and made known to them by others within the Registrant and by the Registrant’s service provider. |
| (b) | There were no changes in the Registrant's internal control over financial reporting (as defined in Rule 30a-3(d) under the Act) that occurred during the last fiscal half-year of the period covered by this report that has materially affected, or is reasonably likely to materially affect, the Registrant's internal control over financial reporting. |
Item 12. Disclosure of Securities Lending Activities for Closed-End Management Investment Companies
Not applicable to open-end investment companies.
Item 13. Exhibits.
(3) Any written solicitation to purchase securities under Rule 23c‑1 under the Act sent or given during the period covered by the report by or on behalf of the registrant to 10 or more persons. Not applicable to open-end investment companies.
(4) Change in the registrant’s independent public accountant. There was no change in the registrant’s independent public accountant for the period covered by this report.
SIGNATURES
Pursuant to the requirements of the Securities Exchange Act of 1934 and the Investment Company Act of 1940, the registrant has duly caused this report to be signed on its behalf by the undersigned, thereunto duly authorized.
(Registrant) Trust for Professional Managers
By (Signature and Title)* /s/John Buckel
John Buckel, President
Date: December 4, 2023
Pursuant to the requirements of the Securities Exchange Act of 1934 and the Investment Company Act of 1940, this report has been signed below by the following persons on behalf of the registrant and in the capacities and on the dates indicated.
By (Signature and Title)* /s/John Buckel
John Buckel, President
Date: December 4, 2023
By (Signature and Title)* /s/Jennifer Lima
Jennifer Lima, Treasurer
Date: December 4, 2023
* Print the name and title of each signing officer under his or her signature.