UNITED STATES
SECURITIES AND EXCHANGE COMMISSION
Washington, D.C. 20549
FORM N-CSR
CERTIFIED SHAREHOLDER REPORT OF REGISTERED
MANAGEMENT INVESTMENT COMPANIES
Investment Company Act file number 811-10401
Trust for Professional Managers
(Exact name of registrant as specified in charter)
615 East Michigan Street
Milwaukee, WI 53202
(Address of principal executive offices) (Zip code)
Jay S. Fitton
U.S. Bancorp Fund Services, LLC
615 East Michigan Street
Milwaukee, WI 53202
(Name and address of agent for service)
(513)-520-5925
Registrant’s telephone number, including area code
Date of fiscal year end: August 31, 2023
Date of reporting period: August 31, 2023
Item 1. Reports to Stockholders.
(a)

PMC Funds
PMC Core Fixed Income Fund
Advisor Class Shares: (PMFIX)
Institutional Class Shares: (PMFQX)
PMC Diversified Equity Fund
Advisor Class Shares: (PMDEX)
Institutional Class Shares: (PMDQX)
ActivePassive ETFs
ActivePassive Core Bond ETF (APCB)
ActivePassive Intermediate Municipal Bond ETF (APMU)
ActivePassive International Equity ETF (APIE)
ActivePassive U.S. Equity ETF (APUE)
Annual Report
August 31, 2023
Table of Contents
PMC Funds
Letter to Shareholders
(Unaudited)
To our Shareholders:
We are pleased to present you with the Annual Report for the PMC Funds mutual fund family. This report covers both the fiscal quarter and one-year period ended August 31, 2023.
The table below presents the standardized performance of the PMC Funds relative to their respective benchmarks. The past twelve month period ended August 31, 2023 has been one in which the global economy has continued to struggle due to the ongoing effects of high inflation. The U.S. consumer has held up the domestic economy in 2023, but warning signs have begun to appear. Consumer confidence declined in August, and job openings were lower in July. In addition, real gross domestic product (GDP)1 for the second quarter 2023 was revised lower to an annual rate of 2.1%, and corporate profits declined. Consumer confidence is notoriously fragile, and if consumers believe their jobs are in jeopardy they will rein in spending. Historically, if consumer confidence declines for several months, this has often presaged an economic downturn. Consumers may be feeling pressure on several fronts, including the potential for a government shutdown at the beginning of the fiscal year in October, the end to the moratorium on student loan repayments, rising mortgage rates that now exceed 7%, the United Auto Workers strike, and the jump in oil prices. Oil prices have risen sharply in recent weeks, and are up 25% from levels earlier in the year. Saudi Arabia has been able to inject additional supply when oil prices get so high that demand is crimped, but it is more difficult for them to manage the price of oil given the sanctions on Russia and the increasing demand coming from China. Economists warn that if oil prices exceed $100 for more than a few weeks consumers will further scale back spending and the economy will have difficulty avoiding recession. Economies in Europe and China also bear close watching. Europe has experienced choppy economic data in 2023, and leading indicators such as the Purchasing Managers Index have recently flashed warning signs. China is also in the throes of an economic slowdown led by another property crisis. Property prices are declining, economic growth is slowing, and the country’s policymakers have stopped reporting weak economic data. Economists question whether China has the levers to pull to reinvigorate growth.
The Federal Open Market Committee (FOMC) has been actively striving to corral inflation and bring the U.S. economy to a soft landing in the hopes of averting a recession. The FOMC has aggressively raised the federal funds target rate since its low 18 months ago. Over the past year the committee has hiked the rate seven times, from a range of 2.25%-2.50% on August 31, 2022 to its current range of 5.25%-5.50%. Over the past 18 months, the FOMC has raised the fed funds rate a total of 11 times. The consensus among economists is that the recent reduction in inflation means that this cycle of interest rate increases has likely ended unless inflation accelerates once again.
Despite the concerns about the economy stock prices have remained resilient throughout this period. After suffering an 18.1% decline in 2022–its steepest drop since 2008–the S&P 500 Index has posted an 18.7% gain so far in 2023. The gains have been decidedly top-heavy, with some of the largest technology companies driving the performance of the index, while the broader market has not generated returns nearly as impressive.
The Bureau of Economic Analysis released the second estimate of the second quarter 2023 real GDP, a seasonally adjusted annualized rise of 2.1%, lower than the prior estimate, and in line with the increase in the prior quarter. The employment situation has been lukewarm over the past year. The August employment report showed that employers added 187,000 jobs in the month, and that the unemployment rate was slightly higher at 3.8%. As mentioned above, the FOMC, in its continuing effort to tame inflation, raised its federal funds rate target range by 0.25% in the quarter, to 5.00% to 5.25%, from a range of 4.75% to 5.00%. The yield on the 10-year U.S. Treasury climbed from 3.2% to 4.1% over the twelve months ended August 31, 2023.
| 1 | | Gross Domestic Product (“GDP”) is the total monetary value of all the finished goods and services produced within a country’s borders in a specific period. |
3
Total Returns as of August 31, 2023*
*Periods of Less than 1-Year Are Unannualized
| | | | | | | | | | | | | | | | | | | | | | | | | | | | | | | | |
Fund
| | Three
Months
| | | Six
Months
| | | One
Year
| | | Five
Year
| | | Ten
Year
| | | Since
Inception
| | | Inception
Date
| | | Gross
Expense
Ratio
| |
PMC Diversified Equity Fund – Adv. Class | | | 7.16 | % | | | 7.04 | % | | | 13.94 | % | | | 5.44 | % | | | 7.32 | % | | | 8.66 | % | | | 8-26-09 | | | | 0.93 | %** |
PMC Diversified Equity Fund – Inst. Class | | | 7.19 | % | | | 7.15 | % | | | 14.19 | % | | | NA | | | | NA | | | | 7.33 | % | | | 7-1-19 | | | | 0.68 | %** |
MSCI World Index Net Return | | | 6.99 | % | | | 11.11 | % | | | 15.60 | % | | | 8.33 | % | | | 9.28 | % | | | 9.54 | % | | | | | | | | |
| | | | | | | | |
PMC Core Fixed Income Fund – Adv. Class | | | -0.68 | % | | | 1.10 | % | | | -0.89 | % | | | 0.74 | % | | | 1.41 | % | | | 3.21 | % | | | 9-28-07 | | | | 1.13 | %** |
PMC Core Fixed Income Fund – Inst. Class | | | -0.61 | % | | | 1.25 | % | | | -0.67 | % | | | NA | | | | NA | | | | -0.43 | % | | | 7-1-19 | | | | 0.88 | %** |
Bloomberg U.S. Aggregate Bond Index | | | -1.06 | % | | | 0.95 | % | | | -1.19 | % | | | 0.49 | % | | | 1.48 | % | | | 2.78 | % | | | | | | | | |
| * | | Periods of Less than 1-Year Are Unannualized |
| ** | | Gross expense ratio as disclosed in the prospectus dated December 29, 2022. Please see the Financial Highlights in this report for the most recent expense ratio. |
The S&P 500 Index represents a broad cross-section of the U.S. equity market, including common stocks traded on U.S. exchanges. The MSCI World Index captures large and mid-cap representation across 23 Developed Markets countries. The Bloomberg U.S. Aggregate Bond Index is a broad-based flagship benchmark that measures the investment grade, U.S. dollar-denominated, fixed-rate taxable bond market. An investor cannot invest directly in an index.
Past performance is no guarantee of future returns. Current performance may be higher or lower than the performance data shown. Investment return and principal value will fluctuate so that an investor’s shares, when redeemed, may be worth more or less than original cost. For the most recent month-end performance, please visit the Funds’ website at www.investpmc.com or by calling 888-762-7338.
PMC Diversified Equity Fund
The PMC Diversified Equity Fund was launched on August 26, 2009, and provides broad equity asset class exposure, diversified globally. The Fund’s investment objective is long-term capital appreciation.
One of the primary drivers of the Fund’s performance is its exposure to the well-known value, momentum and quality asset pricing factors. Over the past year ended August 31, 2023, asset pricing factors have generally performed poorly. The one exception is the quality factor, which is the tendency for stocks of more highly profitable and financially strong companies within an index to outperform those exhibiting less financial strength. The poor factor performance translated into Fund performance that, while strong in absolute terms, lagged that of the benchmark over the twelve-month period ended August 31, 2023. For the most recent three-month period, the Advisor Class of the Fund generated a return of 7.16%, outperforming the 6.99% return of the Fund’s benchmark index, MSCI World Index Net Return. For the twelve months ended August 31, 2023, the Fund generated a total return of 13.94%, underperforming the 15.60% return of the benchmark. The primary driver of the Fund’s performance during the year was the aggregate performance of the asset pricing factors toward which the portfolio is tilted. The Fund has maintained positive tilts to the size, value, momentum and quality factors. The Fund’s orientation toward value stocks was a key detractor from the performance relative to the benchmark, and its exposure to the momentum and quality factors was modestly additive to relative performance. However, performance was negatively impacted by having a lower weighted average market capitalization than the benchmark, as stocks of smaller companies significantly underperformed stocks of larger companies. Relative performance was also disadvantaged during both the most recent three- and six-month periods from a slight underweight to domestic equities relative to European equities. Among the positive contributors to performance during the year were limited underweights to the information technology and communications services sectors. Security selection in the health care, utilities, and real estate sectors also contributed positively to performance during the year. Among the detractors from performance was security selection in the information technology and communications services sectors. As is typically the case, the strategy’s factor orientation resulted in over- or underweights to specific stocks that have a meaningful impact on performance. Over the past twelve months underweights to well-known companies such as NVIDIA Corp. (NVDA), Apple, Inc. (AAPL), and Microsoft Corp. (MSFT) resulted in underperformance. However, overweights to PulteGroup, Inc. (PHM), Broadcom, Inc. (AVGO) and D.R. Horton, Inc. (DHI) benefited performance.
4
In addition to the risk that the investment strategy employed in the Fund will underperform the benchmark index generally, the primary risks continue to primarily involve systematic risk. Because the Fund’s investment adviser controls the risk of the Fund’s portfolio relative to the benchmark, the overall portfolio should track the Fund’s benchmark fairly closely on a relative basis. However, in general market declines the Fund’s fully invested strategy would incur a setback commensurate with the decline in the benchmark.
PMC Core Fixed Income Fund
The PMC Core Fixed Income Fund provides broad exposure to the core segments of the domestic fixed income market. The Fund’s investment objective is to provide current income consistent with low volatility of principal, and in addition to the Fund’s investment adviser, one sub-adviser manages a portion of the Fund’s assets: Neuberger Berman Investment Advisers LLC.
Over the past 12 months ended August 31, 2023, the environment for fixed income securities has once again been marked by significantly rising yields resulting from the FOMC’s decision to aggressively raise short-term interest rates in an effort to combat decades-high inflation. The FOMC recently raised the fed funds rate to a range of 5.25%-5.50%, up a full three percentage points over the level on August 31, 2022. The FOMC’s actions seem to have had a positive impact, as inflation is moderating from the acceleration of a year ago. As a result, many economists believe the FOMC has completed its rate increases for this cycle. Against this backdrop, the Fund generated negative returns for the three-month and one-year periods ended August 31, 2023. For the most recent three-month period, the Advisor Class of the Fund generated a return of -0.68%, slightly outperforming the benchmark Bloomberg U.S. Aggregate Bond Index return of -1.06%. For the twelve months ended August 31, 2023, the Advisor Class of the Fund posted a return of -0.89%, outperforming the benchmark return of -1.19%. The primary factors positively impacting performance over the past 12-month period were an underweight to U.S. Treasury securities and security selection in the corporate bond segment. The primary detractors from performance included the Fund’s aggregate underweight to securitized bonds, and security selection in the U.S. Treasury and government-related securities areas.
The primary risks to the strategies employed by the Fund’s investment adviser and sub-advisers remain in place and exist at both the macro level and in individual security selection. Due to the Fund’s aggregate overweight exposure to credit securities, the Fund remains likely to underperform the benchmark somewhat if the Federal Reserve makes a policy misstep, and U.S. Treasury securities consequently rise relative to credits. In addition, if the general level of interest rates continues to rise rapidly, the Fund will not be immune to further losses. Similarly, if certain of the individual credits currently owned by the Fund are adversely affected by economic events, the Fund itself will also be affected.
Remarks
The U.S. economy is muddling along, with economists having mixed opinions as to whether the FOMC will be able to create conditions that allows the economy to glide to a soft landing or enter a recession. It appears the FOMC has been able to arrest the rise in inflation, with the consensus among economists being that the committee’s rate increase regime has ended. U.S. consumers have been resilient, but confidence is beginning to erode, and is at risk as a result of several factors, including a significant rise in mortgage rates and a surge in oil prices. There are a number of potential downside risks outlined by economists, including a government shutdown at the beginning of the fiscal year in October if Congress cannot come to agreement in the coming weeks; property market weakness in China, which has the potential to impact the global economy; and a continuation in the recent surge in oil prices.
As always, we appreciate your continued trust and confidence in the PMC Funds. We will continue to do all we can to ensure that such trust and confidence are well placed and will manage the PMC Funds with that goal clearly in mind.

Brandon R. Thomas
Co-Founder and Co-Chief Investment Officer
Envestnet Asset Management
5
Envestnet Asset Management
The views in this report were those of the Funds’ investment adviser and the PMC Core Fixed Income Fund’s sub-adviser as of the date of this report and may not reflect their views on the date the report is first published or anytime thereafter. These views are intended to assist the shareholders of the Funds in understanding their investments in the Funds and do not constitute investment advice.
Diversification neither assures a profit nor guarantees against loss in a declining market.
Holdings are subject to change and are not a recommendation to buy or sell any security. Please see the schedule of holdings for a full list of fund holdings.
Investments in smaller companies carry greater risk than is customarily associated with larger companies for various reasons such as volatility of earnings and prospects, higher failure rates, and limited markets, product lines or financial resources. Investing overseas involves special risks, including the volatility of currency exchange rates and, in some cases, limited geographic focus, political and economic instability, and relatively illiquid markets. Income (bond) funds are subject to interest rate risk, which is the risk that debt securities in a fund’s portfolio will decline in value because of increases in market interest rates.
Please see the prospectus
(https://www.investpmc.com/sites/default/files/documents/PMC%20Statutory%20Prospectus%2012.29.2022.pdf) for a complete description of the risks associated with investing in the PMC Funds.
PMC Funds are distributed by Foreside Fund Services, LLC. Foreside Fund Services, LLC is not an affiliate of Envestnet Asset Management, Inc./Envestnet PMC.
6
ActivePassive ETFs
Letter to Shareholders
(Unaudited)
To our Shareholders:
We are pleased to present you with the Annual Report for the ActivePassive ETF fund family. This report covers both the fiscal quarter and since inception period ended August 31, 2023.
The table below presents the standardized performance of the ActivePassive ETFs relative to their respective benchmarks. The ActivePassive ETFs opened on May 2 of this year, launching into a economic period full of complexity. The global economy has continued to struggle due to the ongoing effects of high inflation. The U.S. consumer has held up the domestic economy in 2023, but warning signs have begun to appear. Consumer confidence declined in August, and job openings were lower in July. In addition, real gross domestic product (GDP)1 for the second quarter 2023 was revised lower to an annual rate of 2.1%, and corporate profits declined. Consumer confidence is notoriously fragile, and if consumers believe their jobs are in jeopardy they will rein in spending. Historically, if consumer confidence declines for several months, this has often presaged an economic downturn. Consumers may be feeling pressure on several fronts, including the potential for a government shutdown at the beginning of the fiscal year in October, the end to the moratorium on student loan repayments, rising mortgage rates that now exceed 7%, the United Auto Workers strike, and the jump in oil prices. Oil prices have risen sharply in recent weeks, and are up 25% from levels earlier in the year. Saudi Arabia has been able to inject additional supply when oil prices get so high that demand is crimped, but it is more difficult for them to manage the price of oil given the sanctions on Russia and the increasing demand coming from China. Economists warn that if oil prices exceed $100 for more than a few weeks consumers will further scale back spending and the economy will have difficulty avoiding recession. Economies in Europe and China also bear close watching. Europe has experienced choppy economic data in 2023, and leading indicators such as the Purchasing Managers Index have recently flashed warning signs. China is also in the throes of an economic slowdown led by another property crisis. Property prices are declining, economic growth is slowing, and the country’s policymakers have stopped reporting weak economic data. Economists question whether China has the levers to pull to reinvigorate growth.
The Federal Open Market Committee (FOMC) has been actively striving to corral inflation and bring the U.S. economy to a soft landing in the hopes of averting a recession. The FOMC has aggressively raised the federal funds target rate since its low 18 months ago. Over the past year the committee has hiked the rate seven times, from a range of 2.25%-2.50% on August 31, 2022 to its current range of 5.25%-5.50%. Over the past 18 months, the FOMC has raised the fed funds rate a total of 11 times. The consensus among economists is that the recent reduction in inflation means that this cycle of interest rate increases has likely ended unless inflation accelerates once again.
Despite the concerns about the economy stock prices have remained resilient throughout this period. After suffering an 18.1% decline in 2022–its steepest drop since 2008–the S&P 500 Index has posted an 18.7% gain so far in 2023. The gains have been decidedly top-heavy, with some of the largest technology companies driving the performance of the index, while the broader market has not generated returns nearly as impressive.
| 1 | | Gross Domestic Product (“GDP”) is the total monetary value of all the finished goods and services produced within a country’s borders in a specific period. |
7
The Bureau of Economic Analysis released the second estimate of the second quarter 2023 real GDP, a seasonally adjusted annualized rise of 2.1%, lower than the prior estimate, and in line with the increase in the prior quarter. The employment situation has been lukewarm over the past year. The August 2023 employment report showed that employers added 187,000 jobs in the month, and that the unemployment rate was slightly higher at 3.8%. As mentioned above, the FOMC, in its continuing effort to tame inflation, raised its federal funds rate target range by 0.25% in the quarter, to 5.00% to 5.25%, from a range of 4.75% to 5.00%. The yield on the 10-year U.S. Treasury climbed from 3.2% to 4.1% over the twelve months ended August 31, 2023.
Total Returns as of August 31, 2023*
*Periods of Less than 1-Year Are Unannualized
| | | | | | | | | | | | | | |
Fund
| | | | | Three
Months
| | Six
Months
| | Since
Inception
| | Inception
Date
| | Gross
Expense
Ratio**
|
| ActivePassive US Equity ETF (ticker: APUE) | | | @Market | | | 8.67% | | n/a | | 10.95% | | 5/2/2023 | | 0.33% |
| | | | @NAV | | | 8.55% | | | | 10.78% | | | | |
CRSP U.S. Total Market Index | | | | | | 8.51% | | | | 10.37% | | | | |
| | | | | | |
| ActivePassive International Equity ETF (ticker: APIE) | | | @Market | | | 4.50% | | n/a | | 2.16% | | 5/2/2023 | | 0.45% |
| | | | @NAV | | | 4.70% | | | | 2.12% | | | | |
S&P Classic ADR Composite Index (USD) NTR | | | | | | 3.91% | | | | 1.05% | | | | |
| | | | | | |
| ActivePassive Core Bond ETF (ticker: APCB) | | | @Market | | | -0.80% | | n/a | | -1.80% | | 5/2/2023 | | 0.36% |
| | | | @NAV | | | -0.84% | | | | -1.96% | | | | |
Bloomberg U.S. Aggregate Bond Index | | | | | | -1.06% | | | | -2.12% | | | | |
| | | | | | |
ActivePassive Intermediate Municipal Bond ETF (ticker: APMU) | | | @Market | | | -0.15% | | n/a | | -1.93% | | 5/2/2023 | | 0.35% |
| | | | @NAV | | | -0.01% | | | | -1.94% | | | | |
Bloomberg Municipal 1-10 Year Blend Index | | | | | | 0.24% | | | | -0.64% | | | | |
| * | | Periods of Less than 1-Year Are Unannualized |
| ** | | Gross expense ratio as disclosed in the prospectus dated March 9, 2023, as amended March 31, 2023, includes Acquired Fund Fees and Expenses. Please see the Financial Highlights in this report for the most recent expense ratio. |
The S&P 500 Index represents a broad cross-section of the U.S. equity market, including common stocks traded on U.S. exchanges. The Bloomberg U.S. Aggregate Bond Index is a broad-based flagship benchmark that measures the investment grade, U.S. dollar-denominated, fixed-rate taxable bond market. The CRSP U.S. Total Market Index captures broad U.S. equity market coverage and include securities traded on NYSE, NYSE American, NYSE ARCA, NASDAQ, Bats Global Markets, and the Investors Exchange. Nearly 4,000 constituents across mega, large, small and micro capitalizations, representing nearly 100 percent of the U.S. investable equity market. The S&P Classic ADR Composite Index (USD) NTR seeks to track all American depositary receipts trading on the NYSE, NYSE American, NASDAQ, and over the counter (OTC) in the United States, subject to size and liquidity requirement. The Bloomberg 1-10 Year Municipal Blend Index is a market value-weighted index which covers the short and intermediate components of the Bloomberg Municipal Bond Index–an unmanaged, market value-weighted index which covers the U.S. investment-grade tax-exempt bond market.
An investor cannot invest directly in an index. Past performance is no guarantee of future returns. Current performance may be higher or lower than the performance data shown. Investment return and principal value will fluctuate so that an investor’s shares, when redeemed, may be worth more or less than original cost. Short term performance, in particular, is not a good indication of a fund’s future performance, and an investment should not be made based solely on returns. For the most recent month-end performance, please visit the Funds’ website at www.activepassive.com or by calling 800-617-0004.
8
Market Price: The current price at which shares are bought and sold. Market returns are based upon the last trade price.
NAV: The dollar value of a single share, based on the value of the underlying assets of the fund minus its liabilities, divided by the number of shares outstanding. Calculated at the end of each business day.
ActivePassive U.S. Equity ETF
The ActivePassive U.S. Equity ETF was launched on May 2, 2023, and provides broad U.S. equity exposure. The Fund’s investment objective is long-term capital appreciation.
The Fund is an actively managed exchange-traded fund that blends active and passive investment strategies to optimize costs, tracking and potential return over the Fund’s benchmark index, the CRSP U.S. Total Market Index (the “Benchmark Index”). The Fund also employs a factor active strategy for a portion of the investment portfolio. Passive exposure within the large cap sleeve of the portfolio contributed to results and was a driver of the overall performance in the past three months. In the up-trending market environment for U.S. equities over the past three months, passive strategies have been rewarded. The exposure to well-known value, momentum, and quality asset pricing factors was mixed in its relative contribution to performance. Within the small cap sleeve, factor exposure benefited the Fund, whereas factor exposure within large cap detracted from results. The Fund generated results of 8.55% (NAV), slightly outpacing the Benchmark Index return of 8.51% by 4 basis points, for the three-month period ended August 31, 2023.
In the trailing three months, contributors to performance include exposure to the Information Technology, Consumer Cyclical, and Financial Services sectors, all of which outperformed the Benchmark Index. Detracting from performance was exposure to the weaker performing Utilities, Consumer Defensive, and Real Estate sectors, all of which lagged the Benchmark Index in the trailing three months. The small cap sleeve’s positive relative performance outpaced the large cap sleeve results and was a key driver of the narrow outperformance.
In addition to the risk that the investment strategies employed in the Fund may underperform the Benchmark Index, the primary risks continue to involve systematic risk. Because the Fund’s investment adviser controls the risk of the portfolio relative to the Benchmark Index, the overall portfolio should track the Fund’s benchmark fairly closely on a relative basis. However, in general market declines the Fund’s fully invested strategy would incur a setback commensurate with the decline in the benchmark.
ActivePassive International Equity ETF
The ActivePassive International Equity ETF was launched on May 2, 2023, and provides broad international equity asset class exposure. The Fund’s investment objective is long-term capital appreciation and in addition to the Fund’s investment adviser, two sub-advisers manage a portion of the Fund’s assets: AllianceBernstein L.P. and Causeway Capital Management LLC.
The Fund is an actively managed exchange-traded fund that blends active and passive investment strategies to optimize costs, tracking and potential return over the Fund’s benchmark index, the S&P Classic ADR Composite Index (USD) NTR (the “Benchmark Index”). The Fund also employs a factor active strategy for a portion of the investment portfolio. Strong relative outperformance from the foreign large value equity sleeve and the emerging market equity sleeve drove much of the outperformance over the prior three-month period. The foreign large growth sleeve underperformed as growth equities generally lagged value equities within international equity markets. European equities generally posted weaker relative performance while stronger relative performance from Latin America contributed to results. Stock selection within China and United Kingdom contributed to relative outperformance while
9
negative stock selection in France and Germany detracted from results. For the three-month period ended August 31, 2023, the Fund generated performance of 4.70% (NAV), which outpaced the Benchmark Index return of 3.91% by 79 basis points.
In addition to the risk that the investment strategies employed in the Fund may underperform the benchmark indices, the primary risks continue to involve systematic risk. Because the Adviser and Sub-advisers control the risk of the portfolio relative to the benchmark, the overall portfolio should track the Fund’s benchmark fairly closely on a relative basis. However, in general market declines the Fund’s fully invested strategy would incur a setback commensurate with the decline in the benchmark.
ActivePassive Core Bond ETF
The ActivePassive Core Bond ETF was launched on May 2, 2023, and provides broad fixed income asset class exposure. The Fund’s investment objective is current income consistent with low volatility of principal, and in addition to the Fund’s investment adviser, two sub-advisers manage a portion of the Fund assets: Neuberger Berman Investment Advisers LLC and Sage Advisory Services, Ltd. Co.
The Fund is an actively managed exchange-traded fund that blends active and passive investment strategies to optimize costs, tracking and potential return over the Fund’s benchmark index, the Bloomberg U.S. Aggregate Bond Index (the “Benchmark Index”). Strong relative performance from the active manager sleeves as well as the international bond sleeve, with each slightly outperforming the Benchmark Index, contributed to portfolio results. Over the past 3 months the environment for fixed income securities has to been marked by rising yields resulting from the FOMC’s decision to aggressively raise short-term interest rates in an effort to combat decades-high inflation. The FOMC recently raised the fed funds rate to a range of 5.25%-5.50%. The committee’s actions seem to have had a positive impact, as inflation is moderating from the acceleration of a year ago. As a result, many economists believe the FOMC has completed its rate increases for this cycle. Within this environment, the Fund generated results of -0.84% (NAV), outpacing the Benchmark Index return of -1.06% by 22 basis points, for the three-month period ended August 31, 2023. The passively managed sleeve trailed active manager performance as active credit selection and sector positioning proved additive within fixed income. The primary contributors to fund performance include corporate credit exposure and short duration securities, while U.S. Treasury securities and mortgage- and asset-backed securities were the primary detractors from results. Slightly shorter duration positioning within the Fund relative to the Benchmark Index added to performance as longer duration securities lagged amid the rising rate environment.
The primary risks to the strategies employed by the Fund remain in place and exist at both the macro level and in individual security selection. Due to the Fund’s aggregate overweight exposure to credit securities, the Fund remains likely to underperform the Benchmark Index somewhat if the Federal Reserve makes a policy misstep, and U.S. Treasury securities consequently rise relative to credits. In addition, if the general level of interest rates continues to rise rapidly, the Fund will not be immune to further losses. Similarly, if certain of the individual credits currently owned by the Fund pare adversely affected by economic events, the Fund itself will also be affected.
ActivePassive Intermediate Municipal Bond ETF
The ActivePassive Intermediate Municipal Bond ETF was launched on May 2, 2023, and provides broad municipal fixed income asset class exposure. The Fund’s investment objective is current income that is exempt from federal income taxes consistent with low volatility of principal, and in addition to the Fund’s investment adviser, one sub-adviser manages a portion of the Fund assets: GW&K Investment Management, LLC.
10
The Fund is an actively managed exchange-traded fund that blends active and passive investment strategies to optimize costs, tracking and potential return over the Fund’s benchmark index, the Bloomberg Municipal 1-10 Year Blend Index (the “Benchmark Index”). Over the past 3 months the environment for fixed income securities has been marked by rising yields, including within the municipal fixed income markets. While the FOMC’s ongoing path to combat inflation will continue to have a factor on yields, the long-term trend in lower supply also continues to influence the direction of the municipal markets. The passively managed and actively managed sleeves both slightly trailed the benchmark over the trailing three months. Lower quality municipal bonds generally outperformed leading to some relative weakness for the higher quality issues in the portfolio. Shorter duration municipals outpaced longer duration amid a rising rate environment. The Fund generated results of -0.01% (NAV), trailing the Benchmark Index return of 0.24% by 25 basis points, for the three-month period ended August 31, 2023.
The primary risks to the strategies employed by the Fund remain in place and exist at both the macro level and in individual security selection. Due to the Fund’s exposure to municipal securities, the Fund remains likely to underperform the Benchmark Index somewhat if the Federal Reserve makes a policy misstep and rates moves against positioning in the fund. In addition, if the general level of interest rates continues to rise rapidly, the Fund will not be immune to further losses. Similarly, if certain of the individual securities currently owned by the Fund are adversely affected by economic or municipal-specific events, the Fund itself will also be affected.
Remarks
The U.S. economy is muddling along, with economists having mixed opinions as to whether the FOMC will be able to create conditions that allows the economy to glide to a soft landing or enter a recession. It appears the FOMC has been able to arrest the rise in inflation, with the consensus among economists being that the committee’s rate increase regime has ended. U.S. consumers have been resilient, but confidence is beginning to erode, and is at risk as a result of several factors, including a significant rise in mortgage rates and a surge in oil prices. There are a number of potential downside risks outlined by economists, including a government shutdown at the beginning of the fiscal year in October if Congress cannot come to agreement in the coming weeks; property market weakness in China, which has the potential to impact the global economy; and a continuation in the recent surge in oil prices.
As always, we appreciate your continued trust and confidence in the ActivePassive ETFs. We will continue to do all we can to ensure that such trust and confidence are well placed and will manage the ActivePassive ETFs with that goal clearly in mind.
| | |
| |  |
| |
Brandon R. Thomas Co-Founder and Co-Chief Investment Officer Envestnet Asset Management | | Gregory A. Classen Principal Director, Portfolio Management Envestnet Asset Management |
11
Envestnet Asset Management
The views in this report were those of the Funds’ investment adviser and the Funds’ sub-advisers, as applicable, as of the date of this report and may not reflect their views on the date the report is first published or anytime thereafter. These views are intended to assist the shareholders of the Funds in understanding their investments in the Funds and do not constitute investment advice.
Quantitative easing is a monetary policy strategy used by central banks to keep credit flowing to the economy.
Diversification neither assures a profit nor guarantees against loss in a declining market. Holdings are subject to change and are not a recommendation to buy or sell any security. Please see the schedule of holdings for a full list of fund holdings. Investments in smaller companies carry greater risk than is customarily associated with larger companies for various reasons such as volatility of earnings and prospects, higher failure rates, and limited markets, product lines or financial resources. Investing overseas involves special risks, including the volatility of currency exchange rates and, in some cases, limited geographic focus, political and economic instability, and relatively illiquid markets. Income (bond) funds are subject to interest rate risk, which is the risk that debt securities in a fund’s portfolio will decline in value because of increases in market interest rates.
ActivePassive ETFs are distributed by Foreside Fund Services, LLC. Foreside Fund Services, LLC is not an affiliate of Envestnet Asset Management, Inc.
12
ENVESTNET FUNDS
Expense Examples
(Unaudited)
As a shareholder of the PMC Funds, you incur two types of costs: (1) transaction costs and (2) ongoing costs, including management fees, distribution (12b-1) fees (Advisor Class shares only) and other Fund expenses. As a shareholder of the ActivePassive ETFs (together with the PMC Funds, the “Funds”), you incur two types of costs: (1) transaction costs, including brokerage commissions paid on purchases and sales of Fund shares, and (2) ongoing costs, including management fees of the Fund. This Example is intended to help you understand your ongoing costs (in dollars) of investing in the Funds, and to compare these costs with the ongoing costs of investing in other mutual funds. The Example is based on an investment of $1,000 invested at the beginning of the period and held for the entire period (March 1, 2023 - August 31, 2023).
The first lines of the following tables provide information about actual account values and actual expenses. Although the Funds do not charge a sales load, shareholders of the PMC Funds will be assessed fees for outgoing wire transfers, returned checks and stop payment orders at prevailing rates charged by U.S. Bancorp Fund Services, LLC, the PMC Funds’ transfer agent. Shareholders of the PMC Funds who hold their shares through Individual Retirement Accounts (“IRA”) will be charged a $15.00 annual maintenance fee. To the extent the Funds invest in shares of exchange-traded funds or other investment companies as part of their investment strategy, you will indirectly bear your proportionate share of any fees and expenses charged by the underlying funds in which the Funds invest in addition to the direct expenses of the Funds. Actual expenses of the underlying funds are expected to vary among the various underlying funds. These expenses are not included in the Example. For the PMC Funds, the Example includes, but is not limited to, management fees, distribution (12b-1) fees, fund administration and accounting, custody and transfer agent fees. For the ActivePassive ETFs, the Example includes, but is not limited to, each ActivePassive ETF’s unitary management fee. You may use the information in this line, together with the amount you invested, to estimate the expenses that you paid over the period. Simply divide your account value by $1,000 (for example, an $8,600 account value divided by $1,000 = 8.6), then multiply the result by the number in the first line under the heading entitled “Expenses Paid During Period” to estimate the expenses you paid on your account during this period.
| | Hypothetical | | Example for Comparison Purposes |
The second lines of the following tables provide information about hypothetical account values and hypothetical expenses based on the Funds’ actual expense ratio and an assumed rate of return of 5% per year before expenses, which is not the Funds’ actual returns. The hypothetical account values and expenses may not be used to estimate the actual ending account balance or expenses you paid for the period. You may use this information to compare the ongoing costs of investing in the Funds and other funds. To do so, compare this 5% hypothetical example with the 5% hypothetical examples that appear in the shareholder reports of other funds. Please note that the expenses shown in the table are meant to highlight your ongoing costs only and do not reflect any transactional costs, such as sales charges (loads), or exchange fees. Therefore, the second lines of the tables are useful in comparing ongoing costs only, and will not help you determine the relative total costs of owning different funds. In addition, if these transactional costs were included, your costs would have been higher.
| | | | | | | | | | | | |
| | | Beginning
Account Value
3/1/23
| | | Ending
Account Value
8/31/23
| | | Expenses Paid
During Period
3/1/23-8/31/23*
| |
PMC Core Fixed Income Fund–Advisor Class | | | | | | | | | | | | |
Actual | | $ | 1,000.00 | | | $ | 1,011.00 | | | $ | 4.31 | |
Hypothetical (5% return before expenses) | | | 1,000.00 | | | | 1,020.92 | | | | 4.33 | |
| * | | Expenses are equal to the Fund’s annualized net expense ratio of 0.85%, multiplied by the average account value over the period, multiplied by 184/365 to reflect the one-half year period. |
13
| | | | | | | | | | | | |
| | | Beginning
Account Value
3/1/23
| | | Ending
Account Value
8/31/23
| | | Expenses Paid
During Period
3/1/23-8/31/23*
| |
PMC Core Fixed Income Fund–Institutional Class | | | | | | | | | | | | |
Actual | | $ | 1,000.00 | | | $ | 1,012.50 | | | $ | 3.04 | |
Hypothetical (5% return before expenses) | | | 1,000.00 | | | | 1,022.18 | | | | 3.06 | |
| * | | Expenses are equal to the Fund’s annualized net expense ratio of 0.60%, multiplied by the average account value over the period, multiplied by 184/365 to reflect the one-half year period. |
| | | | | | | | | | | | |
| | | Beginning
Account Value
3/1/23
| | | Ending
Account Value
8/31/23
| | | Expenses Paid
During Period
3/1/23-8/31/23*
| |
PMC Diversified Equity Fund–Advisor Class | | | | | | | | | | | | |
Actual | | $ | 1,000.00 | | | $ | 1,070.40 | | | $ | 4.91 | |
Hypothetical (5% return before expenses) | | | 1,000.00 | | | | 1,020.47 | | | | 4.79 | |
| * | | Expenses are equal to the Fund’s annualized expense ratio of 0.94%, multiplied by the average account value over the period, multiplied by 184/365 to reflect the one-half year period. |
| | | | | | | | | | | | |
| | | Beginning
Account Value
3/1/23
| | | Ending
Account Value
8/31/23
| | | Expenses Paid
During Period
3/1/23-8/31/23*
| |
PMC Diversified Equity Fund–Institutional Class | | | | | | | | | | | | |
Actual | | $ | 1,000.00 | | | $ | 1,071.50 | | | $ | 3.60 | |
Hypothetical (5% return before expenses) | | | 1,000.00 | | | | 1,021.73 | | | | 3.52 | |
| * | | Expenses are equal to the Fund’s annualized expense ratio of 0.69%, multiplied by the average account value over the period, multiplied by 184/365 to reflect the one-half year period. |
| | | | | | | | | | | | |
| | | Beginning
Account Value
5/2/23
| | | Ending
Account Value
8/31/23
| | | Expenses Paid
During Period
5/2/23-8/31/23*
| |
ActivePassive Core Bond ETF | | | | | | | | | | | | |
Actual | | $ | 1,000.00 | | | $ | 980.40 | | | $ | 1.16 | |
Hypothetical (5% return before expenses) | | | 1,000.00 | | | | 1,015.54 | | | | 1.18 | |
| * | | Expenses are equal to the Fund’s annualized expense ratio of 0.35%, multiplied by the average account value over the period, multiplied by 122/365 to reflect the one-half year period. |
| | | | | | | | | | | | |
| | | Beginning
Account Value
5/2/23
| | | Ending
Account Value
8/31/23
| | | Expenses Paid
During Period
5/2/23-8/31/23*
| |
ActivePassive Intermediate Municipal Bond ETF | | | | | | | | | | | | |
Actual | | $ | 1,000.00 | | | $ | 980.60 | | | $ | 1.16 | |
Hypothetical (5% return before expenses) | | | 1,000.00 | | | | 1,015.54 | | | | 1.18 | |
| * | | Expenses are equal to the Fund’s annualized expense ratio of 0.35%, multiplied by the average account value over the period, multiplied by 122/365 to reflect the one-half year period. |
| | | | | | | | | | | | |
| | | Beginning
Account Value
5/2/23
| | | Ending
Account Value
8/31/23
| | | Expenses Paid
During Period
5/2/23-8/31/23*
| |
ActivePassive International Equity ETF | | | | | | | | | | | | |
Actual | | $ | 1,000.00 | | | $ | 1,021.20 | | | $ | 1.52 | |
Hypothetical (5% return before expenses) | | | 1,000.00 | | | | 1,015.21 | | | | 1.52 | |
| * | | Expenses are equal to the Fund’s annualized expense ratio of 0.45%, multiplied by the average account value over the period, multiplied by 122/365 to reflect the one-half year period. |
| | | | | | | | | | | | |
| | | Beginning
Account Value
5/2/23
| | | Ending
Account Value
8/31/23
| | | Expenses Paid
During Period
5/2/23-8/31/23*
| |
ActivePassive U.S. Equity ETF | | | | | | | | | | | | |
Actual | | $ | 1,000.00 | | | $ | 1,107.80 | | | $ | 1.06 | |
Hypothetical (5% return before expenses) | | | 1,000.00 | | | | 1,015.71 | | | | 1.01 | |
| * | | Expenses are equal to the Fund’s annualized expense ratio of 0.30%, multiplied by the average account value over the period, multiplied by 122/365 to reflect the one-half year period. |
14
PMC CORE FIXED INCOME FUND (PMFIX, PMFQX)
Investment Highlights (Unaudited)
The investment objective of the Fund is to provide current income consistent with low volatility of principal. The Fund’s allocation of portfolio holdings as of August 31, 2023 is shown below.
Allocation of Portfolio Holdings
% of Net assets
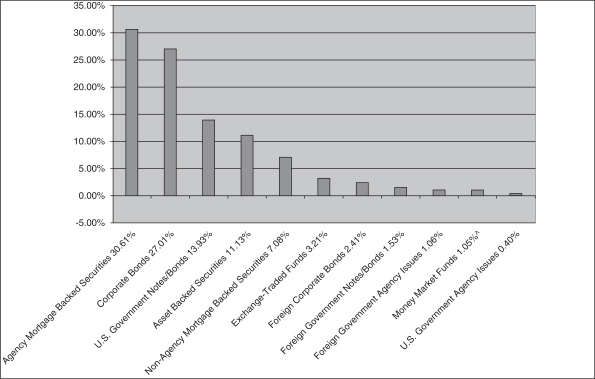
| ^ | | Excludes securities lending collateral. |
15
PMC CORE FIXED INCOME FUND–ADVISOR CLASS (PMFIX)
Investment Highlights (Unaudited) (Continued)
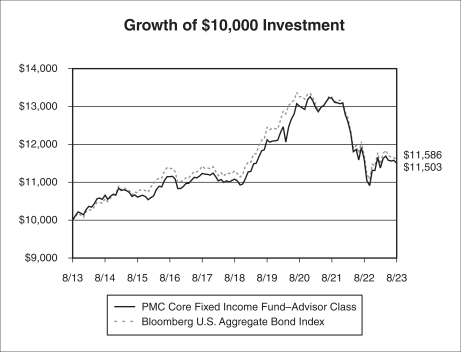
Average Annual Returns as of August 31, 2023
| | | | | | | | |
| | | PMC Core
Fixed Income
Fund–Advisor
Class
| | | Bloomberg U.S.
Aggregate Bond
Index
| |
One Year | | | -0.89 | % | | | -1.19 | % |
Five Year | | | 0.74 | % | | | 0.49 | % |
Ten Year | | | 1.41 | % | | | 1.48 | % |
Since Inception (9/28/07) | | | 3.21 | % | | | 2.78 | % |
| | |
|
|
| |
|
|
|
Performance data quoted represents past performance and does not guarantee future results. The investment return and principal value of an investment will fluctuate so that an investor’s shares, when redeemed, may be worth more or less than their original cost. Current performance of the Fund may be lower or higher than the performance quoted. Performance data current to the most recent month end may be obtained by calling the Fund (toll free) at (866) PMC-7338.
Short-term performance, in particular, is not a good indication of the Fund’s future performance, and an investment should not be made based solely on historical returns.
Investment performance reflects fee waivers in effect. In the absence of such waivers, total return would be reduced.
The returns shown assume reinvestment of Fund distributions and do not reflect the deduction of taxes that a shareholder would pay on Fund distributions or the redemption of Fund shares. The graph illustrates performance of a hypothetical investment made in the Fund and a broad-based securities index on August 31, 2013. The graph does not reflect any future performance.
The Bloomberg U.S. Aggregate Bond Index is an index composed of U.S. securities in Treasury, Government-Related, Corporate and Securitized Sectors. It includes securities that are of investment-grade quality or better, have at least one year to maturity and have an outstanding par value of at least $250 million.
One cannot invest directly in an index.
16
PMC CORE FIXED INCOME FUND–INSTITUTIONAL CLASS (PMFQX)
Investment Highlights (Unaudited) (Continued)
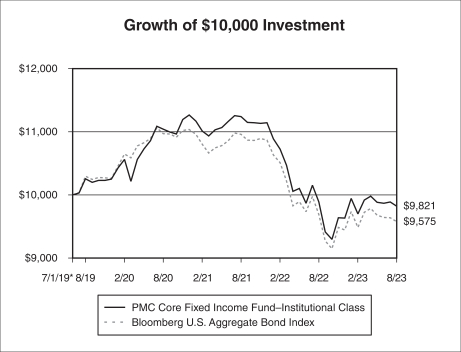
Average Annual Returns as of August 31, 2023
| | | | | | | | |
| | | PMC Core
Fixed Income
Fund–Institutional
Class
| | | Bloomberg U.S.
Aggregate Bond
Index
| |
One Year | | | -0.67 | % | | | -1.19 | % |
Since Inception (7/1/19) | | | -0.43 | % | | | -1.04 | % |
| | |
|
|
| |
|
|
|
Performance data quoted represents past performance and does not guarantee future results. The investment return and principal value of an investment will fluctuate so that an investor’s shares, when redeemed, may be worth more or less than their original cost. Current performance of the Fund may be lower or higher than the performance quoted. Performance data current to the most recent month end may be obtained by calling the Fund (toll free) at (866) PMC-7338.
Short-term performance, in particular, is not a good indication of the Fund’s future performance, and an investment should not be made based solely on historical returns.
Investment performance reflects fee waivers in effect. In the absence of such waivers, total return would be reduced.
The returns shown assume reinvestment of Fund distributions and do not reflect the deduction of taxes that a shareholder would pay on Fund distributions or the redemption of Fund shares. The graph illustrates performance of a hypothetical investment made in the Fund and a broad-based securities index on July 1, 2019, the inception date of the Institutional Class. The graph does not reflect any future performance.
The Bloomberg U.S. Aggregate Bond Index is an index composed of U.S. securities in Treasury, Government-Related, Corporate and Securitized Sectors. It includes securities that are of investment-grade quality or better, have at least one year to maturity and have an outstanding par value of at least $250 million.
One cannot invest directly in an index.
17
PMC DIVERSIFIED EQUITY FUND (PMDEX, PMDQX)
Investment Highlights (Unaudited)
The investment objective of the Fund is long-term capital appreciation. The Fund’s allocation of portfolio holdings as of August 31, 2023 is shown below.
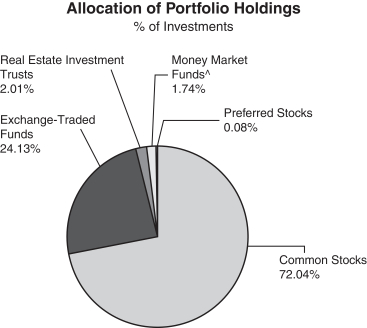
| | ^ | | Excludes securities lending collateral. |
18
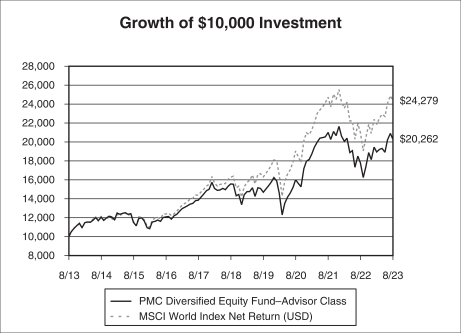
PMC DIVERSIFIED EQUITY FUND–ADVISOR CLASS (PMDEX)
Investment Highlights (Unaudited) (Continued)
Average Annual Returns as of August 31, 2023
| | | | | | | | |
| | | PMC Diversified
Equity Fund–
Advisor Class
| | | MSCI
World Index
Net Return
| |
One Year | | | 13.94 | % | | | 15.60 | % |
Five Year | | | 5.44 | % | | | 8.33 | % |
Ten Year | | | 7.32 | % | | | 9.28 | % |
Since Inception (8/26/09) | | | 8.66 | % | | | 9.54 | % |
| | |
|
|
| |
|
|
|
On May 25, 2018, Envestnet Asset Management, Inc. (the “Adviser”), the Fund’s investment adviser, assumed all responsibilities for selecting investments in the Fund’s portfolio in connection with a change to the Fund’s investment strategies. The Fund’s performance prior to this date reflects the Fund’s returns achieved when the Adviser actively managed a portion of the Fund’s portfolio and used a “manager of managers” investment strategy by engaging sub-advisers to manage other portions of the Fund’s portfolio.
Performance data quoted represents past performance and does not guarantee future results. The investment return and principal value of an investment will fluctuate so that an investor’s shares, when redeemed, may be worth more or less than their original cost. Current performance of the Fund may be lower or higher than the performance quoted. Performance data current to the most recent month end may be obtained by calling the Fund (toll free) at (866) PMC-7338.
Short-term performance, in particular, is not a good indication of the Fund’s future performance, and an investment should not be made based solely on historical returns.
Investment performance reflects fee waivers in effect. In the absence of such waivers, total return would be reduced.
The returns shown assume reinvestment of Fund distributions and do not reflect the deduction of taxes that a shareholder would pay on Fund distributions or the redemption of Fund shares. The graph illustrates performance of a hypothetical investment made in the Fund and a broad-based securities index on August 31, 2013. The graph does not reflect any future performance.
The MSCI World Index Net Return is a free float-adjusted market capitalization weighted index that is designed to measure the equity market performance of developed markets. Net return indices reinvest dividends after the deduction of taxes, using a tax rate applicable to non-resident investors who do not benefit from table taxation treaties. The MSCI World Index consists of the following 23 developed market country indices: Australia, Austria, Belgium, Canada, Denmark, Finland, France, Germany, Hong Kong, Ireland, Israel, Italy, Japan, Netherlands, New Zealand, Norway, Portugal, Singapore, Spain, Sweden, Switzerland, the United Kingdom, and the United States.
One cannot invest directly in an index.
Continued
19
PMC DIVERSIFIED EQUITY FUND–ADVISOR CLASS (PMDEX)
Investment Highlights (Unaudited) (Continued)
20
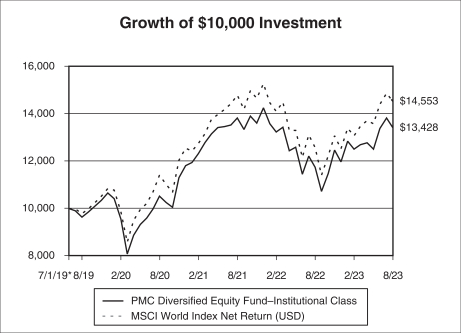
PMC DIVERSIFIED EQUITY FUND–INSTITUTIONAL CLASS (PMDQX)
Investment Highlights (Unaudited) (Continued)
Average Annual Returns as of August 31, 2023
| | | | | | | | |
| | | PMC Diversified
Equity Fund–
Institutional Class
| | | MSCI
World Index
Net Return
| |
One Year | | | 14.19 | % | | | 15.60 | % |
Since Inception (7/1/19) | | | 7.33 | % | | | 9.42 | % |
| | |
|
|
| |
|
|
|
Performance data quoted represents past performance and does not guarantee future results. The investment return and principal value of an investment will fluctuate so that an investor’s shares, when redeemed, may be worth more or less than their original cost. Current performance of the Fund may be lower or higher than the performance quoted. Performance data current to the most recent month end may be obtained by calling the Fund (toll free) at (866) PMC-7338.
Short-term performance, in particular, is not a good indication of the Fund’s future performance, and an investment should not be made based solely on historical returns.
Investment performance reflects fee waivers in effect. In the absence of such waivers, total return would be reduced.
The returns shown assume reinvestment of Fund distributions and do not reflect the deduction of taxes that a shareholder would pay on Fund distributions or the redemption of Fund shares. The graph illustrates performance of a hypothetical investment made in the Fund and a broad-based securities index on July 1, 2019, the inception date of the Institutional Class. The graph does not reflect any future performance.
The MSCI World Index Net Return is a free float-adjusted market capitalization weighted index that is designed to measure the equity market performance of developed markets. Net return indices reinvest dividends after the deduction of taxes, using a tax rate applicable to non-resident investors who do not benefit from table taxation treaties. The MSCI World Index consists of the following 23 developed market country indices: Australia, Austria, Belgium, Canada, Denmark, Finland, France, Germany, Hong Kong, Ireland, Israel, Italy, Japan, Netherlands, New Zealand, Norway, Portugal, Singapore, Spain, Sweden, Switzerland, the United Kingdom, and the United States.
One cannot invest directly in an index.
21
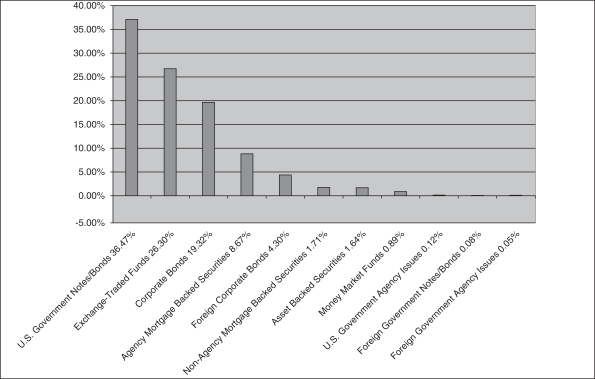
ActivePassive Core Bond ETF (APCB)
Investment Highlights (Unaudited)
The investment objective of the Fund is to provide current income consistent with low volatility of principal. The Fund’s allocation of portfolio holdings as of August 31, 2023 is shown below.
Allocation of Portfolio Holdings
% of Net assets
22
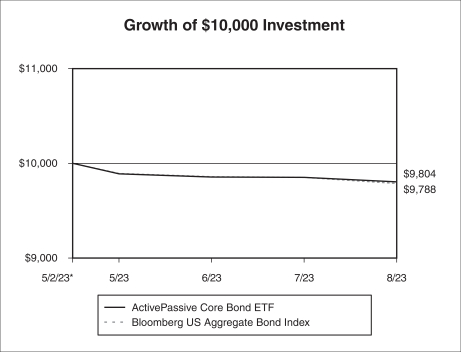
ActivePassive Core Bond ETF (APCB)
Investment Highlights (Unaudited) (Continued)
Average Annual Returns as of August 31, 2023
| | | | | | | | | | | | |
| | | ActivePassive
Core Bond
ETF (NAV)
| | | ActivePassive
Core Bond ETF
(Market Price)
| | | Bloomberg U.S.
Aggregate Bond
Index
| |
Since Inception (5/2/23) | | | -1.96 | % | | | -1.80 | % | | | -2.12 | % |
| | |
|
|
| |
|
|
| |
|
|
|
Performance data quoted represents past performance and does not guarantee future results. The investment return and principal value of an investment will fluctuate so that an investor’s shares, when redeemed, may be worth more or less than their original cost. Current performance of the Fund may be lower or higher than the performance quoted. Performance data current to the most recent month end may be obtained by calling the Fund (toll free) at 800-617-0004.
Short-term performance, in particular, is not a good indication of the Fund’s future performance, and an investment should not be made based solely on historical returns.
Investment performance reflects fee waivers in effect. In the absence of such waivers, total return would be reduced.
The returns shown assume reinvestment of Fund distributions and do not reflect the deduction of taxes that a shareholder would pay on Fund distributions or the redemption of Fund shares. The graph illustrates performance of a hypothetical investment made in the Fund and a broad-based securities index on May 2, 2023, the inception date of the Fund. The graph does not reflect any future performance.
The Bloomberg U.S. Aggregate Bond Index is an index composed of U.S. securities in Treasury, Government-Related, Corporate and Securitized Sectors. It includes securities that are of investment-grade quality or better, have at least one year to maturity and have an outstanding par value of at least $250 million.
One cannot invest directly in an index.
23
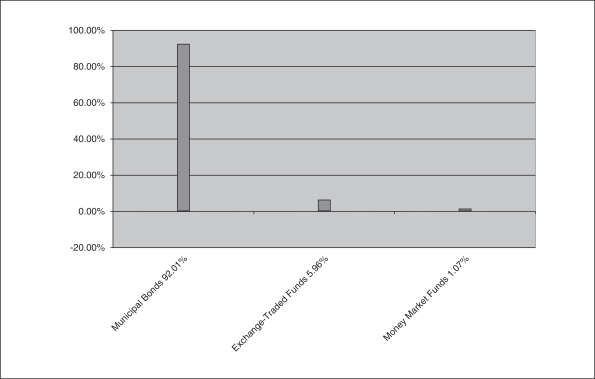
ActivePassive Intermediate Municipal Bond ETF (APMU)
Investment Highlights (Unaudited)
The investment objective of the Fund is to provide current income that is exempt from federal income taxes consistent with low volatility of principal. The Fund’s allocation of portfolio holdings as of August 31, 2023 is shown below.
Allocation of Portfolio Holdings
% of Net assets
24
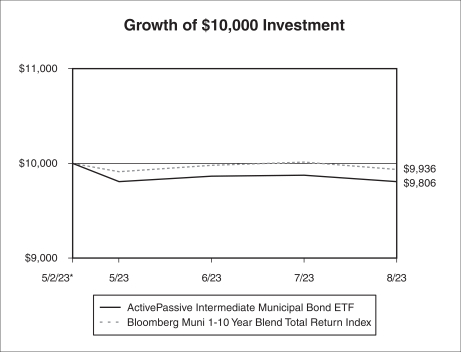
ActivePassive Intermediate Municipal Bond ETF (APMU)
Investment Highlights (Unaudited) (Continued)
Average Annual Returns as of August 31, 2023
| | | | | | | | | | | | |
| | | ActivePassive
Intermediate
Municipal
Bond ETF
(NAV)
| | | ActivePassive
Intermediate
Municipal
Bond ETF
(Market Price)
| | | Bloomberg
Municipal
1-10 Year
Blend Index
| |
Since Inception (5/2/23) | | | -1.94 | % | | | -1.93 | % | | | -0.64 | % |
| | |
|
|
| |
|
|
| |
|
|
|
Performance data quoted represents past performance and does not guarantee future results. The investment return and principal value of an investment will fluctuate so that an investor’s shares, when redeemed, may be worth more or less than their original cost. Current performance of the Fund may be lower or higher than the performance quoted. Performance data current to the most recent month end may be obtained by calling the Fund (toll free) at 800-617-0004.
Short-term performance, in particular, is not a good indication of the Fund’s future performance, and an investment should not be made based solely on historical returns.
Investment performance reflects fee waivers in effect. In the absence of such waivers, total return would be reduced.
The returns shown assume reinvestment of Fund distributions and do not reflect the deduction of taxes that a shareholder would pay on Fund distributions or the redemption of Fund shares. The graph illustrates performance of a hypothetical investment made in the Fund and a broad-based securities index on May 2, 2023, the inception date of the Fund. The graph does not reflect any future performance.
The Bloomberg 1-10 Year Municipal Blend Index is a market value-weighted index which covers the short and intermediate components of the Bloomberg Municipal Bond Index–an unmanaged, market value-weighted index which covers the U.S. investment-grade tax-exempt bond market.
One cannot invest directly in an index.
25
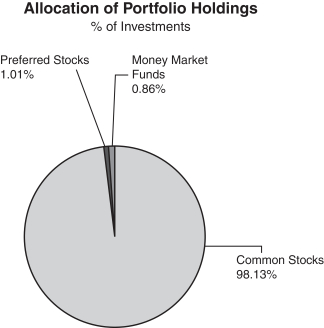
ActivePassive International Equity ETF (APIE)
Investment Highlights (Unaudited)
The investment objective of the Fund is long-term capital appreciation. The Fund’s allocation of portfolio holdings as of August 31, 2023 is shown below.
26
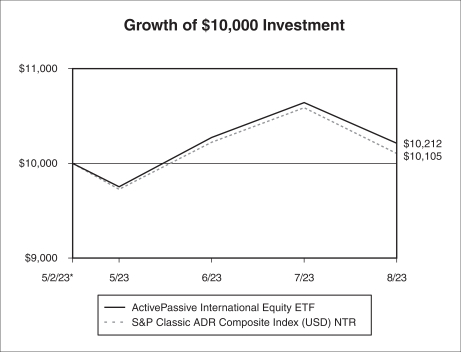
ActivePassive International Equity ETF (APIE)
Investment Highlights (Unaudited) (Continued)
Average Annual Returns as of August 31, 2023
| | | | | | | | | | | | |
| | | ActivePassive
International
Equity ETF
(NAV)
| | | ActivePassive
International
Equity ETF
(Market Price)
| | | S&P Classic
ADR
Composite
Index NTR
| |
Since Inception (5/2/23) | | | 2.12 | % | | | 2.16 | % | | | 1.05 | % |
| | |
|
|
| |
|
|
| |
|
|
|
Performance data quoted represents past performance and does not guarantee future results. The investment return and principal value of an investment will fluctuate so that an investor’s shares, when redeemed, may be worth more or less than their original cost. Current performance of the Fund may be lower or higher than the performance quoted. Performance data current to the most recent month end may be obtained by calling the Fund (toll free) at 800-617-0004.
Short-term performance, in particular, is not a good indication of the Fund’s future performance, and an investment should not be made based solely on historical returns.
Investment performance reflects fee waivers in effect. In the absence of such waivers, total return would be reduced.
The returns shown assume reinvestment of Fund distributions and do not reflect the deduction of taxes that a shareholder would pay on Fund distributions or the redemption of Fund shares. The graph illustrates performance of a hypothetical investment made in the Fund and a broad-based securities index on May 2, 2023, the inception date of the Fund. The graph does not reflect any future performance.
The S&P Classic ADR Composite Index seeks to track all American depositary receipts trading on the NYSE, NYSE American, NASDAQ, and over the counter (OTC) in the United States, subject to size and liquidity requirement.
One cannot invest directly in an index.
27
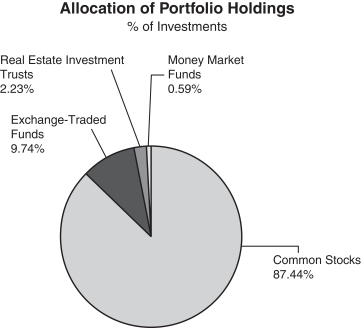
ActivePassive U.S. Equity ETF (APUE)
Investment Highlights (Unaudited)
The investment objective of the Fund is long-term capital appreciation. The Fund’s allocation of portfolio holdings as of August 31, 2023 is shown below.
28
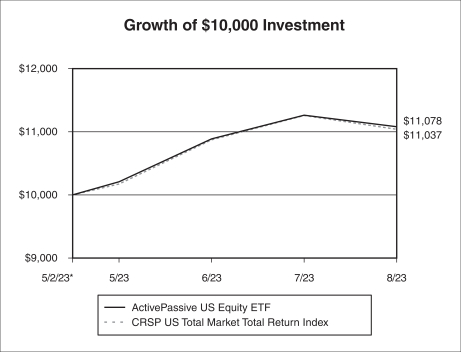
ActivePassive U.S. Equity ETF (APUE)
Investment Highlights (Unaudited) (Continued)
Average Annual Returns as of August 31, 2023
| | | | | | | | | | | | |
| | | ActivePassive
U.S. Equity
ETF (NAV)
| | | ActivePassive
U.S. Equity ETF
(Market Price)
| | | CRSP U.S. Total
Market Index
| |
Since Inception (5/2/23) | | | 10.78 | % | | | 10.95 | % | | | 10.37 | % |
| | |
|
|
| |
|
|
| |
|
|
|
Performance data quoted represents past performance and does not guarantee future results. The investment return and principal value of an investment will fluctuate so that an investor’s shares, when redeemed, may be worth more or less than their original cost. Current performance of the Fund may be lower or higher than the performance quoted. Performance data current to the most recent month end may be obtained by calling the Fund (toll free) at 800-617-0004.
Short-term performance, in particular, is not a good indication of the Fund’s future performance, and an investment should not be made based solely on historical returns.
Investment performance reflects fee waivers in effect. In the absence of such waivers, total return would be reduced.
The returns shown assume reinvestment of Fund distributions and do not reflect the deduction of taxes that a shareholder would pay on Fund distributions or the redemption of Fund shares. The graph illustrates performance of a hypothetical investment made in the Fund and a broad-based securities index on May 2, 2023, the inception date of the Fund. The graph does not reflect any future performance.
The CRSP U.S. Total Market Index captures broad U.S. equity market coverage and include securities traded on NYSE, NYSE American, NYSE ARCA, NASDAQ, Bats Global Markets, and the Investors Exchange. Nearly 4,000 constituents across mega, large, small and micro capitalizations, representing nearly 100 percent of the U.S. investable equity market.
One cannot invest directly in an index.
29
PMC CORE FIXED INCOME FUND | Schedule of Investments |
August 31, 2023
| | | | | | | | |
| | |
| | | Principal
Amount
| | | Value
| |
| ASSET BACKED SECURITIES—11.13% | | | | | | | | |
37 Capital CLO I | | | | | | | | |
2021-1, 6.770% (TSFR3M + 1.462%), 10/15/2034(b) | | $ | 1,000,000 | | | $ | 988,515 | |
AM Capital Funding LLC | | | | | | | | |
2018-1, 4.980%, 12/15/2023 | | | 760,000 | | | | 760,348 | |
Amur Equipment Finance Receivables XI LLC | | | | | | | | |
2022-2A, 5.300%, 06/21/2028 | | | 218,226 | | | | 216,365 | |
Amur Equipment Finance Receivables XII LLC | | | | | | | | |
A-2, 6.090%, 12/20/2029 | | | 610,000 | | | | 611,867 | |
Angel Oak Mortgage Trust | | | | | | | | |
2021-3, 1.068%, 05/25/2066(c) | | | 584,184 | | | | 486,527 | |
2022-5, 4.500%, 05/25/2067 | | | 488,230 | | | | 468,157 | |
Aqua Finance Trust 2021-A | | | | | | | | |
2021-A, 1.540%, 07/17/2046 | | | 425,415 | | | | 376,627 | |
Avis Budget Rental Car Funding AESOP LLC | | | | | | | | |
2018-2 B, 4.250%, 03/20/2025 | | | 360,000 | | | | 357,483 | |
2019-3 A, 2.360%, 03/20/2026 | | | 376,000 | | | | 358,159 | |
2020-2 B, 2.960%, 02/20/2027 | | | 852,000 | | | | 790,497 | |
Beacon Container Finance II LLC | | | | | | | | |
2021-1A, 2.250%, 10/22/2046 | | | 867,300 | | | | 747,813 | |
BlueMountain CLO Ltd. | | | | | | | | |
2013-2R, 6.787% (TSFR3M + 1.442%), 10/22/2030(b) | | | 296,725 | | | | 295,981 | |
BMW Vehicle Owner Trust | | | | | | | | |
2023-A, 5.470%, 02/25/2028 | | | 549,000 | | | | 551,958 | |
Carmax Auto Owner Trust | | | | | | | | |
2023-3, 5.280%, 05/15/2028 | | | 592,000 | | | | 592,302 | |
CCG Receivables Trust | | | | | | | | |
2023-1, 5.820%, 09/16/2030 | | | 400,000 | | | | 400,480 | |
Cedar Funding VI CLO Ltd. | | | | | | | | |
2016-6A, 6.638% (TSFR3M + 1.312%), 04/20/2034(b) | | | 1,480,000 | | | | 1,459,196 | |
Crown Castle Towers LLC | | | | | | | | |
4.241%, 07/15/2028 | | | 439,000 | | | | 406,487 | |
DLLAA LLC | | | | | | | | |
2023-1, 5.640%, 02/22/2028 | | | 381,000 | | | | 384,248 | |
Dryden 75 CLO Ltd. | | | | | | | | |
2019-75R2, 6.610% (TSFR3M + 1.302%), 04/15/2034(b) | | | 850,000 | | | | 840,547 | |
Fort Washington CLO Ltd. | | | | | | | | |
2021-2A, 6.808% (TSFR3M + 1.482%), 10/20/2034(b) | | | 2,000,000 | | | | 1,989,034 | |
Frontier Issuer LLC | | | | | | | | |
2023-1, 6.600%, 08/20/2053 | | | 691,000 | | | | 671,240 | |
GCAT Trust | | | | | | | | |
2019-NQM3, 2.686%, 11/25/2059(c) | | | 104,111 | | | | 96,525 | |
2021-NQM5, 1.262%, 07/25/2066 | | | 482,097 | | | | 378,698 | |
GM Financial Automobile Leasing Trust | | | | | | | | |
2023-3, 5.380%, 11/20/2026 | | | 552,000 | | | | 552,885 | |
Hyundai Auto Receivables Trust | | | | | | | | |
2023-B, 5.480%, 04/17/2028 | | | 458,000 | | | | 461,133 | |
JPMorgan Chase Bank NA—CACLN | | | | | | | | |
2021-3, 0.760%, 02/26/2029 | | | 661,464 | | | | 631,761 | |
Kubota Credit Owner Trust | | | | | | | | |
2023-2, 5.280%, 01/18/2028 | | | 444,000 | | | | 443,762 | |
Madison Park Funding XXVI Ltd. | | | | | | | | |
2007-26, 6.831% (TSFR3M + 1.462%), 07/29/2030(b) | | | 2,251,567 | | | | 2,248,798 | |
The accompanying notes are an integral part of these financial statements.
30
PMC CORE FIXED INCOME FUND | Schedule of Investments |
August 31, 2023 (Continued)
| | | | | | | | |
| | |
| | | Principal
Amount
| | | Value
| |
Magnetite XXIII Ltd. | | | | | | | | |
2019-23R, 6.743% (TSFR3M + 1.392%), 01/25/2035(b) | | $ | 1,000,000 | | | $ | 995,988 | |
MetroNet Infrastructure Issuer LLC | | | | | | | | |
2022-1A, 6.350%, 10/20/2052 | | | 960,000 | | | | 934,303 | |
MMAF Equipment Finance LLC | | | | | | | | |
2023-A, 5.540%, 12/13/2029 | | | 594,000 | | | | 596,764 | |
MVW LLC | | | | | | | | |
2021-2A A, 1.430%, 05/20/2039 | | | 606,459 | | | | 552,242 | |
2021-2A B, 1.830%, 05/20/2039 | | | 494,802 | | | | 437,670 | |
2022-1, 4.400%, 11/21/2039 | | | 236,637 | | | | 222,643 | |
2023-1, 5.420%, 10/20/2040 | | | 507,896 | | | | 496,405 | |
2021-1W, 1.440%, 01/22/2041 | | | 252,036 | | | | 227,666 | |
Navient Private Education Refi Loan Trust | | | | | | | | |
2021-B, 0.940%, 07/15/2069 | | | 974,756 | | | | 845,577 | |
2021-C, 1.060%, 10/15/2069 | | | 728,899 | | | | 624,302 | |
2021-E, 0.970%, 12/16/2069 | | | 1,277,568 | | | | 1,076,581 | |
2021-F, 1.110%, 02/18/2070 | | | 463,130 | | | | 389,965 | |
OneMain Financial Issuance Trust | | | | | | | | |
2018-2, 3.570%, 03/14/2033 | | | 771,760 | | | | 762,153 | |
2023-2, 5.840%, 09/15/2036 | | | 820,000 | | | | 824,754 | |
PFS Financing Corp. | | | | | | | | |
2022-C, 3.890%, 05/15/2027 | | | 1,635,000 | | | | 1,584,206 | |
RASC Trust | | | | | | | | |
2005-KS12, 6.119% (TSFR1M + 0.574%), 01/25/2036(b) | | | 38,450 | | | | 38,191 | |
SBA Tower Trust | | | | | | | | |
2020-1-2, 2.328%, 01/15/2028 | | | 618,000 | | | | 532,358 | |
2021-3, 2.593%, 10/15/2056 | | | 1,243,000 | | | | 979,570 | |
Sierra Timeshare Receivables Funding LLC | | | | | | | | |
2019-2, 2.590%, 05/20/2036 | | | 245,118 | | | | 237,322 | |
2020-2, 3.510%, 07/20/2037 | | | 284,604 | | | | 270,078 | |
2021-2, 1.350%, 09/20/2038 | | | 204,847 | | | | 192,886 | |
2023-2, 5.800%, 04/20/2040 | | | 678,921 | | | | 681,421 | |
SoFi Consumer Loan Program Trust | | | | | | | | |
2023-1S, 5.810%, 05/15/2031 | | | 268,116 | | | | 268,419 | |
SoFi Professional Loan Program Trust | | | | | | | | |
2021-B, 1.140%, 02/15/2047 | | | 92,690 | | | | 77,409 | |
Starwood Mortgage Residential Trust | | | | | | | | |
2021-3, 1.127%, 06/25/2056(c) | | | 543,298 | | | | 436,221 | |
2021-6, 1.920%, 11/25/2066(c) | | | 842,548 | | | | 684,203 | |
Taco Bell Funding LLC | | | | | | | | |
2021-1, 1.946%, 08/25/2051 | | | 786,983 | | | | 683,990 | |
Thayer Park CLO Ltd. | | | | | | | | |
2017-R, 6.628% (TSFR3M + 1.302%), 04/20/2034(b) | | | 500,000 | | | | 495,951 | |
Towd Point Mortgage Trust | | | | | | | | |
2017-5, 6.029% (TSFR1M + 0.714%), 02/25/2057(b) | | | 124,368 | | | | 124,703 | |
2017-2 A1, 2.750%, 04/25/2057(c) | | | 3,743 | | | | 3,715 | |
2017-2, 3.250%, 04/25/2057(c) | | | 351,000 | | | | 340,849 | |
2017-3, 2.750%, 06/25/2057(c) | | | 77,977 | | | | 76,177 | |
2017-4, 2.750%, 06/25/2057(c) | | | 88,188 | | | | 83,632 | |
2022-4, 3.750%, 09/25/2062 | | | 1,432,071 | | | | 1,331,037 | |
TRESTLES CLO Ltd. | | | | | | | | |
2017-1, 6.603% (TSFR3M + 1.252%), 04/25/2032(b) | | | 500,000 | | | | 495,852 | |
TRESTLES CLO V Ltd. | | | | | | | | |
2021-5, 6.758% (TSFR3M + 1.432%), 10/20/2034(b) | | | 1,000,000 | | | | 988,629 | |
The accompanying notes are an integral part of these financial statements.
31
PMC CORE FIXED INCOME FUND | Schedule of Investments |
August 31, 2023 (Continued)
| | | | | | | | |
| | |
| | | Principal
Amount
| | | Value
| |
Vantage Data Centers Issuer LLC | | | | | | | | |
2019-1, 3.188%, 07/15/2044 | | $ | 1,263,360 | | | $ | 1,225,572 | |
2021-1, 2.165%, 10/15/2046 | | | 817,000 | | | | 721,762 | |
Verus Securitization Trust | | | | | | | | |
2021-3, 1.046%, 06/25/2066(c) | | | 667,549 | | | | 562,353 | |
2021-6, 1.630%, 10/25/2066(c) | | | 578,666 | | | | 471,446 | |
2022-7, 5.152%, 07/25/2067 | | | 872,190 | | | | 853,769 | |
| | | | | | |
|
|
|
TOTAL ASSET BACKED SECURITIES (Cost $44,237,229) | | | | | | | 41,996,127 | |
| | | | | | |
|
|
|
| CORPORATE BONDS—27.01% | | | | | | | | |
Automobiles & Components—0.68% | | | | | | | | |
Ford Motor Co. | | | | | | | | |
4.750%, 01/15/2043 | | | 90,000 | | | | 67,366 | |
Ford Motor Credit Co. LLC | | | | | | | | |
5.113%, 05/03/2029 | | | 310,000 | | | | 285,456 | |
General Motors Co. | | | | | | | | |
6.125%, 10/01/2025 | | | 1,248,000 | | | | 1,253,708 | |
General Motors Financial Co., Inc. | | | | | | | | |
5.100%, 01/17/2024 | | | 320,000 | | | | 319,014 | |
3.600%, 06/21/2030(e) | | | 605,000 | | | | 519,872 | |
Goodyear Tire & Rubber Co. | | | | | | | | |
5.250%, 04/30/2031 | | | 125,000 | | | | 109,761 | |
| | | | | | |
|
|
|
| | | | | | | | 2,555,177 | |
| | | | | | |
|
|
|
Banks—3.17% | | | | | | | | |
Bank of America Corp. | | | | | | | | |
3.875%, 08/01/2025 | | | 480,000 | | | | 467,491 | |
3.559% to 04/23/2026, then TSFR3M + 1.322%, 04/23/2027(a) | | | 1,610,000 | | | | 1,525,939 | |
2.884% to 10/22/2029, then TSFR3M + 1.452%, 10/22/2030(a) | | | 743,000 | | | | 637,870 | |
1.922% to 10/24/2030, then SOFR + 1.370%, 10/24/2031(a) | | | 2,430,000 | | | | 1,904,975 | |
Citigroup, Inc. | | | | | | | | |
3.200%, 10/21/2026 | | | 1,121,000 | | | | 1,045,830 | |
3.887% to 01/10/2027, then TSFR3M + 1.825%, 01/10/2028(a) | | | 835,000 | | | | 789,117 | |
2.976% to 11/05/2029, then SOFR + 1.422%, 11/05/2030(a) | | | 495,000 | | | | 425,972 | |
JPMorgan Chase & Co. | | | | | | | | |
2.950%, 10/01/2026 | | | 1,667,000 | | | | 1,558,141 | |
Wells Fargo & Co. | | | | | | | | |
2.406% to 10/30/2024, then TSFR3M + 1.087%, 10/30/2025(a)(e) | | | 900,000 | | | | 863,470 | |
2.393% to 06/02/2027, then SOFR + 2.100%, 06/02/2028(a) | | | 1,020,000 | | | | 908,163 | |
4.150%, 01/24/2029 | | | 1,581,000 | | | | 1,492,047 | |
5.013% to 04/04/2050, then TSFR3M + 4.502%, 04/04/2051(a) | | | 365,000 | | | | 329,899 | |
| | | | | | |
|
|
|
| | | | | | | | 11,948,914 | |
| | | | | | |
|
|
|
Capital Goods—1.48% | | | | | | | | |
Boeing Co. | | | | | | | | |
4.875%, 05/01/2025 | | | 1,181,000 | | | | 1,165,306 | |
3.900%, 05/01/2049 | | | 160,000 | | | | 119,851 | |
5.805%, 05/01/2050 | | | 1,273,000 | | | | 1,240,265 | |
Deere & Co. | | | | | | | | |
5.375%, 10/16/2029 | | | 999,000 | | | | 1,032,196 | |
Honeywell International, Inc. | | | | | | | | |
5.000%, 02/15/2033 | | | 905,000 | | | | 912,991 | |
Ingersoll Rand, Inc. | | | | | | | | |
5.400%, 08/14/2028 | | | 260,000 | | | | 260,729 | |
5.700%, 08/14/2033 | | | 325,000 | | | | 329,741 | |
The accompanying notes are an integral part of these financial statements.
32
PMC CORE FIXED INCOME FUND | Schedule of Investments |
August 31, 2023 (Continued)
| | | | | | | | |
| | |
| | | Principal
Amount
| | | Value
| |
RTX Corp. | | | | | | | | |
7.500%, 09/15/2029 | | $ | 467,000 | | | $ | 520,856 | |
| | | | | | |
|
|
|
| | | | | | | | 5,581,935 | |
| | | | | | |
|
|
|
Commercial & Professional Services—0.27% | | | | | | | | |
ASGN, Inc. | | | | | | | | |
4.625%, 05/15/2028 | | | 350,000 | | | | 314,859 | |
Enviri Corp. | | | | | | | | |
5.750%, 07/31/2027 | | | 165,000 | | | | 143,270 | |
Korn Ferry | | | | | | | | |
4.625%, 12/15/2027 | | | 100,000 | | | | 93,104 | |
Waste Management, Inc. | | | | | | | | |
4.150%, 04/15/2032 | | | 503,000 | | | | 472,087 | |
| | | | | | |
|
|
|
| | | | | | | | 1,023,320 | |
| | | | | | |
|
|
|
Consumer Discretionary Distribution & Retail—0.46% | | | | | | | | |
Amazon.com, Inc. | | | | | | | | |
3.800%, 12/05/2024 | | | 1,038,000 | | | | 1,019,762 | |
eBay, Inc. | | | | | | | | |
2.600%, 05/10/2031 | | | 790,000 | | | | 653,985 | |
Macy’s Retail Holdings LLC | | | | | | | | |
5.875%, 03/15/2030 | | | 75,000 | | | | 65,692 | |
| | | | | | |
|
|
|
| | | | | | | | 1,739,439 | |
| | | | | | |
|
|
|
Consumer Durables & Apparel—0.02% | | | | | | | | |
Shea Homes LP / Shea Homes Funding Corp. | | | | | | | | |
4.750%, 02/15/2028 | | | 75,000 | | | | 69,101 | |
| | | | | | |
|
|
|
Consumer Services—1.22% | | | | | | | | |
Booking Holdings, Inc. | | | | | | | | |
3.550%, 03/15/2028 | | | 1,100,000 | | | | 1,039,499 | |
McDonald’s Corp. | | | | | | | | |
3.500%, 07/01/2027 | | | 1,623,000 | | | | 1,541,769 | |
5.450%, 08/14/2053 | | | 1,440,000 | | | | 1,442,009 | |
Prime Security Services Borrower LLC / Prime Finance, Inc. | | | | | | | | |
5.750%, 04/15/2026 | | | 230,000 | | | | 225,921 | |
Wyndham Hotels & Resorts, Inc. | | | | | | | | |
4.375%, 08/15/2028 | | | 165,000 | | | | 150,628 | |
Wynn Las Vegas LLC | | | | | | | | |
5.500%, 03/01/2025 | | | 52,000 | | | | 51,417 | |
Yum! Brands, Inc. | | | | | | | | |
5.375%, 04/01/2032 | | | 155,000 | | | | 145,607 | |
| | | | | | |
|
|
|
| | | | | | | | 4,596,850 | |
| | | | | | |
|
|
|
Consumer Staples Distribution & Retail—0.27% | | | | | | | | |
Walmart, Inc. | | | | | | | | |
4.150%, 09/09/2032 | | | 392,000 | | | | 380,100 | |
4.500%, 04/15/2053 | | | 673,000 | | | | 627,172 | |
| | | | | | |
|
|
|
| | | | | | | | 1,007,272 | |
| | | | | | |
|
|
|
Energy—2.38% | | | | | | | | |
BP Capital Markets America, Inc. | | | | | | | | |
4.812%, 02/13/2033 | | | 595,000 | | | | 576,200 | |
Buckeye Partners LP | | | | | | | | |
3.950%, 12/01/2026 | | | 75,000 | | | | 69,245 | |
The accompanying notes are an integral part of these financial statements.
33
PMC CORE FIXED INCOME FUND | Schedule of Investments |
August 31, 2023 (Continued)
| | | | | | | | |
| | |
| | | Principal
Amount
| | | Value
| |
ConocoPhillips Co. | | | | | | | | |
5.550%, 03/15/2054 | | $ | 435,000 | | | $ | 436,443 | |
CQP Holdco LP / BIP-V Chinook Holdco LLC | | | | | | | | |
5.500%, 06/15/2031 | | | 155,000 | | | | 141,582 | |
DT Midstream, Inc. | | | | | | | | |
4.125%, 06/15/2029(e) | | | 125,000 | | | | 110,871 | |
Energy Transfer LP | | | | | | | | |
7.125% to 05/15/2030, then 5 Year CMT Rate + 5.306%(a)(g) | | | 910,000 | | | | 807,516 | |
6.625% to 02/15/2028, then 3 Month LIBOR USD + 4.155%(a)(g) | | | 675,000 | | | | 544,475 | |
EQM Midstream Partners LP | | | | | | | | |
5.500%, 07/15/2028(e) | | | 350,000 | | | | 334,727 | |
Exxon Mobil Corp. | | | | | | | | |
3.095%, 08/16/2049 | | | 595,000 | | | | 419,110 | |
Hilcorp Energy I LP / Hilcorp Finance Co. | | | | | | | | |
6.250%, 11/01/2028 | | | 160,000 | | | | 154,506 | |
Kinder Morgan Energy Partners LP | | | | | | | | |
4.150%, 02/01/2024 | | | 650,000 | | | | 644,945 | |
Marathon Petroleum Corp. | | | | | | | | |
4.700%, 05/01/2025 | | | 665,000 | | | | 653,766 | |
MPLX LP | | | | | | | | |
4.700%, 04/15/2048 | | | 700,000 | | | | 562,334 | |
New Fortress Energy, Inc. | | | | | | | | |
6.500%, 09/30/2026(e) | | | 95,000 | | | | 88,390 | |
Occidental Petroleum Corp. | | | | | | | | |
6.125%, 01/01/2031 | | | 468,000 | | | | 472,058 | |
6.450%, 09/15/2036 | | | 430,000 | | | | 440,135 | |
4.300%, 08/15/2039 | | | 260,000 | | | | 198,827 | |
Phillips 66 | | | | | | | | |
1.300%, 02/15/2026 | | | 1,110,000 | | | | 1,008,357 | |
Plains All American Pipeline LP / PAA Finance Corp. | | | | | | | | |
4.650%, 10/15/2025 | | | 670,000 | | | | 653,813 | |
Pioneer Natural Resources Co. | | | | | | | | |
2.150%, 01/15/2031 | | | 687,000 | | | | 557,233 | |
Tallgrass Energy Partners LP / Tallgrass Energy Finance Corp. | | | | | | | | |
6.000%, 09/01/2031 | | | 110,000 | | | | 97,802 | |
| | | | | | |
|
|
|
| | | | | | | | 8,972,335 | |
| | | | | | |
|
|
|
Equity Real Estate Investment Trusts (REITs)—0.77% | | | | | | | | |
Iron Mountain, Inc. | | | | | | | | |
5.250%, 03/15/2028 | | | 45,000 | | | | 42,233 | |
4.875%, 09/15/2029(e) | | | 240,000 | | | | 217,111 | |
5.250%, 07/15/2030 | | | 150,000 | | | | 135,493 | |
Public Storage Operating Co. | | | | | | | | |
2.300%, 05/01/2031 | | | 3,068,000 | | | | 2,528,440 | |
| | | | | | |
|
|
|
| | | | | | | | 2,923,277 | |
| | | | | | |
|
|
|
Financial Services—2.12% | | | | | | | | |
Capital One Financial Corp. | | | | | | | | |
6.377% to 06/08/2033, then SOFR + 2.860%, 06/08/2034(a) | | | 110,000 | | | | 108,728 | |
Goldman Sachs Group, Inc. | | | | | | | | |
3.800%, 03/15/2030 | | | 1,459,000 | | | | 1,327,965 | |
Morgan Stanley | | | | | | | | |
0.791% to 01/22/2024, then SOFR + 0.509%, 01/22/2025(a) | | | 1,300,000 | | | | 1,271,862 | |
6.250%, 08/09/2026 | | | 449,000 | | | | 459,091 | |
The accompanying notes are an integral part of these financial statements.
34
PMC CORE FIXED INCOME FUND | Schedule of Investments |
August 31, 2023 (Continued)
| | | | | | | | |
| | |
| | | Principal
Amount
| | | Value
| |
3.591% (3 Month LIBOR USD + 1.340%), 07/22/2028(b) | | $ | 1,625,000 | | | $ | 1,504,168 | |
2.699% to 01/22/2030, then SOFR + 1.143%, 01/22/2031(a) | | | 1,190,000 | | | | 1,002,216 | |
5.250% to 04/21/2033, then SOFR + 1.870%, 04/21/2034(a) | | | 1,340,000 | | | | 1,302,118 | |
5.424% to 07/21/2033, then SOFR + 1.880%, 07/21/2034(a)(e) | | | 830,000 | | | | 816,406 | |
OneMain Finance Corp. | | | | | | | | |
3.500%, 01/15/2027 | | | 255,000 | | | | 222,143 | |
| | | | | | |
|
|
|
| | | | | | | | 8,014,697 | |
| | | | | | |
|
|
|
Food, Beverage & Tobacco—2.27% | | | | | | | | |
Anheuser-Busch InBev Worldwide, Inc. | | | | | | | | |
5.450%, 01/23/2039 | | | 1,010,000 | | | | 1,025,920 | |
4.350%, 06/01/2040 | | | 866,000 | | | | 775,607 | |
4.600%, 04/15/2048(e) | | | 453,000 | | | | 408,285 | |
4.750%, 04/15/2058 | | | 440,000 | | | | 394,349 | |
Aramark Services, Inc. | | | | | | | | |
5.000%, 02/01/2028(e) | | | 235,000 | | | | 219,447 | |
Constellation Brands, Inc. | | | | | | | | |
4.900%, 05/01/2033 | | | 1,370,000 | | | | 1,321,772 | |
Mars, Inc. | | | | | | | | |
4.750%, 04/20/2033 | | | 1,840,000 | | | | 1,807,618 | |
Performance Food Group, Inc. | | | | | | | | |
5.500%, 10/15/2027(e) | | | 90,000 | | | | 86,743 | |
Philip Morris International, Inc. | | | | | | | | |
3.125%, 08/17/2027 | | | 407,000 | | | | 379,408 | |
5.125%, 02/15/2030 | | | 1,250,000 | | | | 1,236,121 | |
5.750%, 11/17/2032 | | | 900,000 | | | | 913,298 | |
| | | | | | |
|
|
|
| | | | | | | | 8,568,568 | |
| | | | | | |
|
|
|
Health Care Equipment & Services—0.96% | | | | | | | | |
Abbott Laboratories | | | | | | | | |
3.400%, 11/30/2023 | | | 1,128,000 | | | | 1,122,007 | |
Acadia Healthcare Co, Inc. | | | | | | | | |
5.000%, 04/15/2029 | | | 195,000 | | | | 179,577 | |
CVS Health Corp. | | | | | | | | |
5.300%, 06/01/2033 | | | 1,030,000 | | | | 1,009,393 | |
4.780%, 03/25/2038 | | | 650,000 | | | | 582,454 | |
4.125%, 04/01/2040 | | | 485,000 | | | | 395,680 | |
Medline Borrower LP | | | | | | | | |
3.875%, 04/01/2029 | | | 75,000 | | | | 65,544 | |
Tenet Healthcare Corp. | | | | | | | | |
6.125%, 10/01/2028(e) | | | 265,000 | | | | 255,485 | |
| | | | | | |
|
|
|
| | | | | | | | 3,610,140 | |
| | | | | | |
|
|
|
Household & Personal Products—0.12% | | | | | | | | |
Energizer Holdings, Inc. | | | | | | | | |
4.375%, 03/31/2029 | | | 250,000 | | | | 214,405 | |
Procter & Gamble Co. | | | | | | | | |
2.300%, 02/01/2032 | | | 297,000 | | | | 254,031 | |
| | | | | | |
|
|
|
| | | | | | | | 468,436 | |
| | | | | | |
|
|
|
Insurance—0.61% | | | | | | | | |
Alliant Holdings Intermediate LLC | | | | | | | | |
6.750%, 04/15/2028(e) | | | 100,000 | | | | 98,614 | |
The accompanying notes are an integral part of these financial statements.
35
PMC CORE FIXED INCOME FUND | Schedule of Investments |
August 31, 2023 (Continued)
| | | | | | | | |
| | |
| | | Principal
Amount
| | | Value
| |
MetLife, Inc. | | | | | | | | |
6.500%, 12/15/2032 | | $ | 1,755,000 | | | $ | 1,904,035 | |
Travelers Cos, Inc. | | | | | | | | |
5.450%, 05/25/2053 | | | 310,000 | | | | 314,767 | |
| | | | | | |
|
|
|
| | | | | | | | 2,317,416 | |
| | | | | | |
|
|
|
Materials—0.06% | | | | | | | | |
Ball Corp. | | | | | | | | |
2.875%, 08/15/2030(e) | | | 125,000 | | | | 102,371 | |
Standard Industries, Inc. | | | | | | | | |
4.750%, 01/15/2028(e) | | | 130,000 | | | | 119,861 | |
| | | | | | |
|
|
|
| | | | | | | | 222,232 | |
| | | | | | |
|
|
|
Media & Entertainment—2.18% | | | | | | | | |
CCO Holdings LLC / CCO Holdings Capital Corp. | | | | | | | | |
4.250%, 02/01/2031(e) | | | 298,000 | | | | 244,713 | |
Comcast Corp. | | | | | | | | |
4.150%, 10/15/2028 | | | 1,727,000 | | | | 1,666,019 | |
5.350%, 05/15/2053(e) | | | 1,175,000 | | | | 1,150,663 | |
CSC Holdings LLC | | | | | | | | |
4.625%, 12/01/2030(e) | | | 435,000 | | | | 228,006 | |
DISH DBS Corp. | | | | | | | | |
5.875%, 11/15/2024 | | | 110,000 | | | | 102,417 | |
Fox Corp. | | | | | | | | |
5.576%, 01/25/2049 | | | 660,000 | | | | 590,060 | |
Live Nation Entertainment, Inc. | | | | | | | | |
4.750%, 10/15/2027(e) | | | 145,000 | | | | 135,213 | |
Meta Platforms, Inc. | | | | | | | | |
4.950%, 05/15/2033 | | | 1,355,000 | | | | 1,349,239 | |
Paramount Global | | | | | | | | |
4.200%, 05/19/2032(e) | | | 1,760,000 | | | | 1,467,331 | |
Sirius XM Radio, Inc. | | | | | | | | |
4.125%, 07/01/2030(e) | | | 315,000 | | | | 257,138 | |
Warnermedia Holdings, Inc. | | | | | | | | |
5.141%, 03/15/2052 | | | 1,010,000 | | | | 805,689 | |
Ziff Davis, Inc. | | | | | | | | |
4.625%, 10/15/2030 | | | 255,000 | | | | 219,563 | |
| | | | | | |
|
|
|
| | | | | | | | 8,216,051 | |
| | | | | | |
|
|
|
Pharmaceuticals, Biotechnology & Life Sciences—0.74% | | | | | | | | |
AbbVie, Inc. | | | | | | | | |
4.050%, 11/21/2039 | | | 492,000 | | | | 422,032 | |
4.250%, 11/21/2049(e) | | | 420,000 | | | | 353,972 | |
Amgen, Inc. | | | | | | | | |
5.750%, 03/02/2063 | | | 1,585,000 | | | | 1,566,465 | |
Biogen, Inc. | | | | | | | | |
2.250%, 05/01/2030 | | | 276,000 | | | | 227,380 | |
Bristol-Myers Squibb Co. | | | | | | | | |
3.550%, 03/15/2042 | | | 260,000 | | | | 207,134 | |
| | | | | | |
|
|
|
| | | | | | | | 2,776,983 | |
| | | | | | |
|
|
|
Real Estate Management & Development—0.14% | | | | | | | | |
Park Intermediate Holdings LLC / PK Domestic Property LLC | | | | | | | | |
5.875%, 10/01/2028(e) | | | 195,000 | | | | 180,571 | |
The accompanying notes are an integral part of these financial statements.
36
PMC CORE FIXED INCOME FUND | Schedule of Investments |
August 31, 2023 (Continued)
| | | | | | | | |
| | |
| | | Principal
Amount
| | | Value
| |
RHP Hotel Properties LP / RHP Finance Corp. | | | | | | | | |
4.750%, 10/15/2027 | | $ | 205,000 | | | $ | 190,780 | |
Uniti Group LP / Uniti Group Finance Inc / CSL Capital LLC | | | | | | | | |
10.500%, 02/15/2028 | | | 150,000 | | | | 149,780 | |
| | | | | | |
|
|
|
| | | | | | | | 521,131 | |
| | | | | | |
|
|
|
Semiconductors & Semiconductor Equipment—0.99% | | | | | | | | |
Analog Devices, Inc. | | | | | | | | |
2.100%, 10/01/2031(e) | | | 1,394,000 | | | | 1,141,760 | |
CommScope, Inc. | | | | | | | | |
8.250%, 03/01/2027 | | | 377,000 | | | | 250,155 | |
Intel Corp. | | | | | | | | |
3.750%, 03/25/2027 | | | 1,157,000 | | | | 1,110,550 | |
MPH Acquisition Holdings LLC | | | | | | | | |
5.500%, 09/01/2028 | | | 80,000 | | | | 68,011 | |
QUALCOMM, Inc. | | | | | | | | |
5.400%, 05/20/2033 | | | 226,000 | | | | 234,192 | |
Texas Instruments, Inc. | | | | | | | | |
5.050%, 05/18/2063 | | | 965,000 | | | | 925,482 | |
| | | | | | |
|
|
|
| | | | | | | | 3,730,150 | |
| | | | | | |
|
|
|
Software & Services—1.08% | | | | | | | | |
Microsoft Corp. | | | | | | | | |
3.125%, 11/03/2025 | | | 2,684,000 | | | | 2,591,044 | |
ServiceNow, Inc. | | | | | | | | |
1.400%, 09/01/2030 | | | 1,894,000 | | | | 1,490,770 | |
| | | | | | |
|
|
|
| | | | | | | | 4,081,814 | |
| | | | | | |
|
|
|
Technology Hardware & Equipment—1.22% | | | | | | | | |
Apple, Inc. | | | | | | | | |
1.800%, 09/11/2024 | | | 2,818,000 | | | | 2,722,469 | |
CDW LLC / CDW Finance Corp. | | | | | | | | |
2.670%, 12/01/2026 | | | 283,000 | | | | 256,970 | |
3.569%, 12/01/2031 | | | 530,000 | | | | 448,680 | |
Dell International LLC / EMC Corp. | | | | | | | | |
6.200%, 07/15/2030 | | | 980,000 | | | | 1,009,081 | |
Presidio Holdings, Inc. | | | | | | | | |
4.875%, 02/01/2027 | | | 185,000 | | | | 173,133 | |
| | | | | | |
|
|
|
| | | | | | | | 4,610,333 | |
| | | | | | |
|
|
|
Telecommunication Services—1.66% | | | | | | | | |
AT&T, Inc. | | | | | | | | |
3.550%, 09/15/2055 | | | 159,000 | | | | 103,856 | |
Cox Communications, Inc. | | | | | | | | |
5.700%, 06/15/2033 | | | 890,000 | | | | 888,074 | |
Frontier Communications Holdings LLC | | | | | | | | |
5.875%, 10/15/2027(e) | | | 235,000 | | | | 214,250 | |
Sprint Capital Corp. | | | | | | | | |
8.750%, 03/15/2032 | | | 1,705,000 | | | | 2,033,656 | |
T-Mobile USA, Inc. | | | | | | | | |
4.375%, 04/15/2040 | | | 475,000 | | | | 408,559 | |
3.000%, 02/15/2041 | | | 1,021,000 | | | | 721,840 | |
4.500%, 04/15/2050 | | | 560,000 | | | | 462,958 | |
3.300%, 02/15/2051 | | | 305,000 | | | | 204,963 | |
The accompanying notes are an integral part of these financial statements.
37
PMC CORE FIXED INCOME FUND | Schedule of Investments |
August 31, 2023 (Continued)
| | | | | | | | |
| | |
| | | Principal
Amount
| | | Value
| |
Verizon Communications, Inc. | | | | | | | | |
4.329%, 09/21/2028 | | $ | 359,000 | | | $ | 343,973 | |
4.016%, 12/03/2029 | | | 345,000 | | | | 320,892 | |
5.050%, 05/09/2033 | | | 580,000 | | | | 563,041 | |
| | | | | | |
|
|
|
| | | | | | | | 6,266,062 | |
| | | | | | |
|
|
|
Transportation—0.51% | | | | | | | | |
Mileage Plus Holdings LLC / Mileage Plus Intellectual Property Assets Ltd. | | | | | | | | |
6.500%, 06/20/2027 | | | 160,000 | | | | 159,603 | |
Southwest Airlines Co. | | | | | | | | |
5.250%, 05/04/2025(e) | | | 690,000 | | | | 685,993 | |
TransDigm, Inc. | | | | | | | | |
6.250%, 03/15/2026 | | | 275,000 | | | | 272,647 | |
United Airlines Pass Through Trust | | | | | | | | |
5.875%, 10/15/2027 | | | 798,915 | | | | 798,315 | |
| | | | | | |
|
|
|
| | | | | | | | 1,916,558 | |
| | | | | | |
|
|
|
Utilities—1.63% | | | | | | | | |
Calpine Corp. | | | | | | | | |
4.500%, 02/15/2028(e) | | | 310,000 | | | | 287,254 | |
DTE Energy Co. | | | | | | | | |
3.400%, 06/15/2029 | | | 527,000 | | | | 473,247 | |
Exelon Corp. | | | | | | | | |
5.300%, 03/15/2033(e) | | | 1,410,000 | | | | 1,393,189 | |
4.700%, 04/15/2050 | | | 410,000 | | | | 348,553 | |
NextEra Energy Capital Holdings, Inc. | | | | | | | | |
5.250%, 02/28/2053 | | | 625,000 | | | | 579,732 | |
Sempra | | | | | | | | |
5.500%, 08/01/2033(e) | | | 675,000 | | | | 669,380 | |
Southern Co. | | | | | | | | |
5.200%, 06/15/2033 | | | 2,235,000 | | | | 2,175,650 | |
Vistra Operations Co. LLC | | | | | | | | |
4.375%, 05/01/2029(e) | | | 265,000 | | | | 233,898 | |
| | | | | | |
|
|
|
| | | | | | | | 6,160,903 | |
| | | | | | |
|
|
|
TOTAL CORPORATE BONDS (Cost $110,815,318) | | | | | | | 101,899,094 | |
| | | | | | |
|
|
|
FOREIGN CORPORATE BONDS—2.41% | | | | | | | | |
Banks—0.77% | | | | | | | | |
Banco Santander SA | | | | | | | | |
6.921%, 08/08/2033 | | | 1,200,000 | | | | 1,200,586 | |
Barclays PLC | | | | | | | | |
7.119% to 06/27/2033, then SOFR + 3.570%, 06/27/2034(a)(e) | | | 900,000 | | | | 899,230 | |
HSBC Holdings PLC | | | | | | | | |
6.000% to 05/22/2027, then 5 Year Mid Swap Rate USD + 3.746%(a)(g) | | | 910,000 | | | | 816,525 | |
| | | | | | |
|
|
|
| | | | | | | | 2,916,341 | |
| | | | | | |
|
|
|
Consumer Discretionary Distribution & Retail—0.02% | | | | | | | | |
Jaguar Land Rover Automotive PLC | | | | | | | | |
5.500%, 07/15/2029 | | | 85,000 | | | | 73,936 | |
| | | | | | |
|
|
|
Consumer Services—0.14% | | | | | | | | |
Carnival Corp. | | | | | | | | |
7.625%, 03/01/2026(e) | | | 340,000 | | | | 339,299 | |
The accompanying notes are an integral part of these financial statements.
38
PMC CORE FIXED INCOME FUND | Schedule of Investments |
August 31, 2023 (Continued)
| | | | | | | | |
| | |
| | | Principal
Amount
| | | Value
| |
Royal Caribbean Cruises Ltd. | | | | | | | | |
5.500%, 04/01/2028 | | $ | 205,000 | | | $ | 192,352 | |
| | | | | | |
|
|
|
| | | | | | | | 531,651 | |
| | | | | | |
|
|
|
Materials—0.10% | | | | | | | | |
First Quantum Minerals Ltd. | | | | | | | | |
8.625%, 06/01/2031 | | | 250,000 | | | | 254,718 | |
Hudbay Minerals, Inc. | | | | | | | | |
6.125%, 04/01/2029 | | | 125,000 | | | | 117,637 | |
| | | | | | |
|
|
|
| | | | | | | | 372,355 | |
| | | | | | |
|
|
|
Pharmaceuticals, Biotechnology & Life Sciences—0.26% | | | | | | | | |
Pfizer Investment Enterprises Pte Ltd. | | | | | | | | |
5.340%, 05/19/2063 | | | 475,000 | | | | 468,410 | |
Takeda Pharmaceutical Co. Ltd. | | | | | | | | |
3.025%, 07/09/2040 | | | 690,000 | | | | 502,031 | |
| | | | | | |
|
|
|
| | | | | | | | 970,441 | |
| | | | | | |
|
|
|
Semiconductors & Semiconductor Equipment—0.23% | | | | | | | | |
NXP BV / NXP Funding LLC / NXP USA, Inc. | | | | | | | | |
5.000%, 01/15/2033 | | | 930,000 | | | | 883,790 | |
| | | | | | |
|
|
|
Telecommunications—0.15% | | | | | | | | |
Vodafone Group PLC | | | | | | | | |
4.375%, 02/19/2043 | | | 715,000 | | | | 582,893 | |
| | | | | | |
|
|
|
Transportation—0.74% | | | | | | | | |
American Airlines Inc/AAdvantage Loyalty IP Ltd. | | | | | | | | |
5.500%, 04/20/2026 | | | 215,417 | | | | 211,610 | |
Delta Air Lines, Inc. / SkyMiles IP Ltd. | | | | | | | | |
4.500%, 10/20/2025 | | | 2,624,270 | | | | 2,566,375 | |
| | | | | | |
|
|
|
| | | | | | | | 2,777,985 | |
| | | | | | |
|
|
|
TOTAL FOREIGN CORPORATE BONDS (Cost $9,478,647) | | | | | | | 9,109,392 | |
| | | | | | |
|
|
|
FOREIGN GOVERNMENT AGENCY ISSUES—1.15% | | | | | | | | |
Asian Development Bank | | | | | | | | |
4.500%, 08/25/2028 | | | 1,170,000 | | | | 1,175,552 | |
European Investment Bank | | | | | | | | |
4.500%, 10/16/2028 | | | 730,000 | | | | 735,321 | |
Inter-American Development Bank | | | | | | | | |
4.500%, 05/15/2026 | | | 585,000 | | | | 582,574 | |
International Bank for Reconstruction & Development | | | | | | | | |
4.000%, 07/25/2030 | | | 890,000 | | | | 871,442 | |
Province of Manitoba Canada | | | | | | | | |
4.300%, 07/27/2033 | | | 645,000 | | | | 632,470 | |
Saudi Government International Bond | | | | | | | | |
4.500%, 10/26/2046 | | | 400,000 | | | | 338,413 | |
| | | | | | |
|
|
|
TOTAL FOREIGN GOVERNMENT AGENCY ISSUES (Cost $4,436,310) | | | | | | | 4,335,772 | |
| | | | | | |
|
|
|
FOREIGN GOVERNMENT NOTES/BONDS—1.44% | | | | | | | | |
Colombia Government International Bond | | | | | | | | |
4.000%, 02/26/2024 | | | 590,000 | | | | 584,967 | |
3.000%, 01/30/2030 | | | 570,000 | | | | 454,196 | |
Dominican Republic International Bond | | | | | | | | |
6.875%, 01/29/2026 | | | 330,000 | | | | 333,053 | |
6.850%, 01/27/2045 | | | 560,000 | | | | 503,234 | |
Hungary Government International Bond | | | | | | | | |
7.625%, 03/29/2041(e) | | | 360,000 | | | | 398,574 | |
The accompanying notes are an integral part of these financial statements.
39
PMC CORE FIXED INCOME FUND | Schedule of Investments |
August 31, 2023 (Continued)
| | | | | | | | |
| | |
| | | Principal
Amount
| | | Value
| |
Indonesia Government International Bond | | | | | | | | |
4.350%, 01/08/2027 | | $ | 550,000 | | | $ | 537,636 | |
Mexico Government International Bond | | | | | | | | |
4.350%, 01/15/2047(e) | | | 740,000 | | | | 578,965 | |
Province of Quebec | | | | | | | | |
4.500%, 09/08/2033 | | | 1,460,000 | | | | 1,456,999 | |
Republic of South Africa Government International Bond | | | | | | | | |
5.000%, 10/12/2046 | | | 150,000 | | | | 99,830 | |
Romanian Government International Bond | | | | | | | | |
6.125%, 01/22/2044 | | | 505,000 | | | | 477,907 | |
| | | | | | |
|
|
|
TOTAL FOREIGN GOVERNMENT NOTES/BONDS (Cost $6,083,603) | | | | | | | 5,425,361 | |
| | | | | | |
|
|
|
NON-AGENCY MORTGAGE-BACKED SECURITIES—7.08% | | | | | | | | |
American Tower Trust #1 | | | | | | | | |
2023-1, 5.490%, 03/15/2053 | | | 924,000 | | | | 922,212 | |
Angel Oak Mortgage Trust | | | | | | | | |
2019-6, 2.620%, 11/25/2059(c) | | | 65,657 | | | | 63,109 | |
Bank | | | | | | | | |
2021-BNK31, 1.739%, 02/15/2054 | | | 454,000 | | | | 386,332 | |
2022-BNK39, 2.928%, 02/15/2055(c) | | | 179,000 | | | | 148,967 | |
2023-BNK45 B, 6.148%, 02/15/2056(c) | | | 483,000 | | | | 456,907 | |
2023-BNK45 C, 6.489%, 02/15/2056(c) | | | 522,000 | | | | 445,772 | |
BBCMS Mortgage Trust | | | | | | | | |
2021-C11, 1.495%, 09/15/2054(c)(d) | | | 7,937,238 | | | | 576,224 | |
2022-C18, 5.710%, 12/15/2055(c) | | | 575,000 | | | | 587,870 | |
BB-UBS Trust | | | | | | | | |
2012-SHOW, 3.430%, 11/05/2036 | | | 1,646,000 | | | | 1,502,551 | |
Benchmark Mortgage Trust | | | | | | | | |
2020-B17, 3.371%, 03/15/2053(c) | | | 470,000 | | | | 329,423 | |
2021-B23, 1.766%, 02/15/2054 | | | 612,000 | | | | 509,811 | |
2021-B26, 0.997%, 06/15/2054(c)(d) | | | 9,530,394 | | | | 436,188 | |
2021-B31 C, 3.195%, 12/15/2054(c) | | | 415,000 | | | | 269,491 | |
BMO Mortgage Trust | | | | | | | | |
2023-C5, 6.848%, 06/15/2056(c) | | | 180,000 | | | | 167,282 | |
BX Commercial Mortgage Trust | | | | | | | | |
2021-VOLT, 7.075% (TSFR1M + 1.764%), 09/15/2036(b) | | | 1,085,000 | | | | 1,033,328 | |
BX Trust | | | | | | | | |
2019-OC11, 3.202%, 12/09/2041 | | | 971,000 | | | | 835,695 | |
BXP Trust | | | | | | | | |
2017-GM, 3.379%, 06/13/2039 | | | 331,000 | | | | 299,737 | |
CAMB Commercial Mortgage Trust | | | | | | | | |
2019-LIFE, 6.675% (TSFR1M + 1.364%), 12/15/2037(b) | | | 978,000 | | | | 971,545 | |
Citigroup Commercial Mortgage Trust | | | | | | | | |
2023-SMRT, 6.048%, 06/10/2028(c) | | | 298,000 | | | | 288,970 | |
2023-PRM3, 6.572%, 07/10/2028(c) | | | 244,000 | | | | 236,063 | |
2013-GC17, 5.095%, 11/10/2046(c) | | | 145,000 | | | | 143,081 | |
2014-GC25, 1.091%, 10/10/2047(c)(d) | | | 1,260,343 | | | | 7,899 | |
2015-GC27, 1.451%, 02/10/2048(c)(d) | | | 884,810 | | | | 10,802 | |
2022-GC48, 4.742%, 05/15/2054(c) | | | 619,207 | | | | 586,362 | |
COMM Mortgage Trust | | | | | | | | |
2012-CCRE4, 3.251%, 10/15/2045 | | | 476,000 | | | | 416,083 | |
2014-UBS2, 3.472%, 03/10/2047 | | | 58,011 | | | | 57,709 | |
2014-CR16, 1.094%, 04/10/2047(c)(d) | | | 1,192,075 | | | | 3,405 | |
2014-LC15, 1.204%, 04/10/2047(c)(d) | | | 1,155,012 | | | | 1,820 | |
The accompanying notes are an integral part of these financial statements.
40
PMC CORE FIXED INCOME FUND | Schedule of Investments |
August 31, 2023 (Continued)
| | | | | | | | |
| | |
| | | Principal
Amount
| | | Value
| |
2014-CR17, 1.104%, 05/10/2047(c)(d) | | $ | 1,010,898 | | | $ | 2,591 | |
2014-UBS3, 1.206%, 06/10/2047(c)(d) | | | 843,490 | | | | 2,523 | |
2014-UBS6, 0.978%, 12/10/2047(c)(d) | | | 1,359,366 | | | | 9,028 | |
2014-CCRE21, 3.987%, 12/10/2047 | | | 281,514 | | | | 270,291 | |
Connecticut Avenue Securities Trust | | | | | | | | |
2021-R01, 6.838% (SOFR30A + 1.550%), 10/25/2041(b) | | | 480,000 | | | | 473,620 | |
2021-R03, 6.938% (SOFR30A + 1.650%), 12/25/2041(b) | | | 1,050,000 | | | | 1,024,734 | |
2022-R01, 7.188% (SOFR30A + 1.900%), 12/25/2041(b) | | | 915,000 | | | | 898,725 | |
2022-R03, 8.788% (SOFR30A + 3.500%), 03/25/2042(b) | | | 1,065,000 | | | | 1,102,655 | |
2022-R07, 8.246% (SOFR30A + 2.950%), 06/25/2042(b) | | | 515,047 | | | | 528,408 | |
2022-R07, 9.946% (SOFR30A + 4.650%), 06/25/2042(b) | | | 1,005,000 | | | | 1,075,794 | |
2022-R08, 7.838% (SOFR30A + 2.550%), 07/25/2042(b) | | | 921,176 | | | | 939,256 | |
2023-R02, 7.588% (SOFR30A + 2.300%), 01/25/2043(b) | | | 678,596 | | | | 687,540 | |
Credit Suisse Mortgage Capital Certificates | | | | | | | | |
2019-ICE4, 6.788% (TSFR1M + 1.477%), 05/15/2036(b) | | | 132,670 | | | | 131,795 | |
CSAIL Commercial Mortgage Trust | | | | | | | | |
2019-C17, 3.016%, 9/15/2052 | | | 850,000 | | | | 732,910 | |
2015-C1, 4.044%, 04/15/2050(c) | | | 450,000 | | | | 401,062 | |
2015-C2, 0.851%, 06/15/2057(c)(d) | | | 1,384,398 | | | | 11,071 | |
CyrusOne Data Centers Issuer I LLC | | | | | | | | |
A-2, 4.300%, 04/20/2048 | | | 332,000 | | | | 299,035 | |
FIVE Mortgage Trust | | | | | | | | |
2023-V1, 5.668%, 02/10/2056(c) | | | 600,000 | | | | 599,343 | |
2023-V1, 6.618%, 02/10/2056(c) | | | 315,000 | | | | 288,401 | |
GS Mortgage Securities Trust | | | | | | | | |
2014-GC18, 1.180%, 01/10/2047(c)(d) | | | 2,722,500 | | | | 589 | |
2014-GC26, 1.061%, 11/10/2047(c)(d) | | | 1,683,552 | | | | 12,751 | |
2015-GC34, 3.278%, 10/10/2048 | | | 54,846 | | | | 53,174 | |
2019-GC42, 3.817%, 09/10/2052(c) | | | 449,000 | | | | 338,188 | |
2020-GC47, 2.377%, 05/12/2053 | | | 73,000 | | | | 60,033 | |
Hilton USA Trust | | | | | | | | |
2016-HHV, 3.719%, 11/05/2038 | | | 283,000 | | | | 263,480 | |
J.P. Morgan Chase Commercial Mortgage Securities Trust | | | | | | | | |
2022-OPO, 3.377%, 01/05/2039 | | | 501,000 | | | | 375,788 | |
Morgan Stanley Capital I Trust | | | | | | | | |
2015-MS1, 3.779%, 05/15/2048(c) | | | 200,000 | | | | 191,179 | |
2018-L1, 4.869%, 10/15/2051(c) | | | 325,000 | | | | 285,060 | |
2018-H4, 5.237%, 12/15/2051(c) | | | 293,000 | | | | 243,849 | |
New Residential Mortgage Loan Trust | | | | | | | | |
2019-NQM5, 2.710%, 11/25/2059(c) | | | 136,782 | | | | 123,416 | |
OBX Trust | | | | | | | | |
2021-NQM3, 1.054%, 07/25/2061(c) | | | 733,309 | | | | 550,686 | |
Taubman Centers Commercial Mortgage Trust | | | | | | | | |
2022-DPM, 8.242% (TSFR1M + 2.932%), 05/15/2037(b) | | | 1,045,000 | | | | 1,019,867 | |
UBS Commercial Mortgage Trust | | | | | | | | |
2017-C2, 3.487%, 08/15/2050 | | | 625,000 | | | | 570,280 | |
2017-C4 AS, 3.836%, 10/15/2050(c) | | | 200,000 | | | | 179,382 | |
Verus Securitization Trust | | | | | | | | |
2019-4, 2.642%, 11/25/2059 | | | 36,919 | | | | 35,330 | |
Wells Fargo Commercial Mortgage Trust | | | | | | | | |
2015-C29, 3.637%, 06/15/2048 | | | 130,000 | | | | 124,198 | |
2016-NXS6, 4.534%, 11/15/2049(c) | | | 625,000 | | | | 512,672 | |
2018-C48, 4.302%, 01/15/2052 | | | 333,945 | | | | 313,592 | |
The accompanying notes are an integral part of these financial statements.
41
PMC CORE FIXED INCOME FUND | Schedule of Investments |
August 31, 2023 (Continued)
| | | | | | | | |
| | |
| | | Principal
Amount
| | | Value
| |
WFRBS Commercial Mortgage Trust | | | | | | | | |
2014-LC14, 1.397%, 03/15/2047(c)(d) | | $ | 588,851 | | | $ | 271 | |
2014-C22 XA, 0.923%, 09/15/2057(c)(d) | | | 2,676,008 | | | | 12,500 | |
2014-C22 AS, 4.069%, 09/15/2057(c) | | | 290,000 | | | | 264,695 | |
| | | | | | |
|
|
|
TOTAL NON-AGENCY MORTGAGE-BACKED SECURITIES (Cost $30,073,419) | | | | | | | 26,704,400 | |
| | | | | | |
|
|
|
| AGENCY MORTGAGE BACKED SECURITIES—30.42% | | | | | | | | |
Fannie Mae Connecticut Avenue Securities | | | | | | | | |
2017-C06, 8.202% (SOFR30A + 2.914%), 02/25/2030(b) | | | 966,013 | | | | 992,140 | |
2017-C07, 7.802% (SOFR30A + 2.514%), 05/25/2030(b) | | | 449,361 | | | | 456,443 | |
2018-C01, 7.652% (SOFR30A + 2.364%), 07/25/2030(b) | | | 981,281 | | | | 995,457 | |
2018-C02, 7.602% (SOFR30A + 2.314%), 08/25/2030(b) | | | 955,457 | | | | 969,365 | |
2018-C04, 7.952% (SOFR30A + 2.664%), 12/25/2030(b) | | | 835,340 | | | | 857,539 | |
Fannie Mae Interest Strip | | | | | | | | |
4.000%, 08/25/2043(d) | | | 1,205,123 | | | | 223,352 | |
Fannie Mae Pool | | | | | | | | |
MA0096, 4.500%, 06/01/2029 | | | 2,403 | | | | 2,352 | |
AB3000, 4.500%, 05/01/2031 | | | 7,395 | | | | 7,219 | |
AB1389, 4.500%, 08/01/2040 | | | 23,382 | | | | 22,794 | |
MA0510, 4.500%, 09/01/2040 | | | 244 | | | | 238 | |
AE8714, 3.500%, 11/01/2040 | | | 9,046 | | | | 8,337 | |
890310, 4.500%, 12/01/2040 | | | 5,596 | | | | 5,455 | |
AE0954, 4.500%, 02/01/2041 | | | 19,288 | | | | 18,802 | |
AS7001, 3.000%, 04/01/2041 | | | 481,147 | | | | 426,387 | |
AL0065, 4.500%, 04/01/2041 | | | 9,237 | | | | 9,004 | |
AB3194, 4.500%, 06/01/2041 | | | 6,246 | | | | 6,089 | |
AH7395, 4.500%, 06/01/2041 | | | 787 | | | | 754 | |
FM0040, 3.000%, 10/01/2041 | | | 88,344 | | | | 78,299 | |
AL1547, 4.500%, 11/01/2041 | | | 3,721 | | | | 3,627 | |
AJ6346, 3.500%, 12/01/2041 | | | 15,120 | | | | 13,935 | |
AJ9278, 3.500%, 12/01/2041 | | | 4,609 | | | | 4,248 | |
AO1214, 3.500%, 04/01/2042 | | | 51,966 | | | | 47,892 | |
AK9393, 3.500%, 04/01/2042 | | | 9,279 | | | | 8,551 | |
AK6568, 3.500%, 04/01/2042 | | | 18,487 | | | | 17,038 | |
AL4029, 4.500%, 04/01/2042 | | | 26,620 | | | | 25,949 | |
AL7306, 4.500%, 09/01/2042 | | | 15,736 | | | | 15,184 | |
AP8743, 3.500%, 10/01/2042 | | | 145,891 | | | | 134,452 | |
AQ9330, 3.500%, 01/01/2043 | | | 18,641 | | | | 17,178 | |
AL2897, 3.500%, 01/01/2043 | | | 20,487 | | | | 18,881 | |
AL3714, 3.500%, 01/01/2043 | | | 13,444 | | | | 12,389 | |
AB7965, 3.500%, 02/01/2043 | | | 11,939 | | | | 11,002 | |
AB9046, 3.500%, 04/01/2043 | | | 35,749 | | | | 32,945 | |
AT1001, 3.500%, 04/01/2043 | | | 14,246 | | | | 13,128 | |
AT2021, 3.500%, 04/01/2043 | | | 12,262 | | | | 11,300 | |
AB9260, 3.500%, 05/01/2043 | | | 32,836 | | | | 30,240 | |
AS0212, 3.500%, 08/01/2043 | | | 32,080 | | | | 29,544 | |
AU0949, 3.500%, 08/01/2043 | | | 28,675 | | | | 26,435 | |
AU4658, 4.500%, 09/01/2043 | | | 5,412 | | | | 5,216 | |
MA1600, 3.500%, 10/01/2043 | | | 13,945 | | | | 12,842 | |
AS1333, 4.500%, 12/01/2043 | | | 9,228 | | | | 8,938 | |
AL4450, 4.500%, 12/01/2043 | �� | | 10,969 | | | | 10,630 | |
AS2516, 4.500%, 05/01/2044 | | | 11,491 | | | | 11,131 | |
AS2751, 4.500%, 06/01/2044 | | | 14,248 | | | | 13,800 | |
MA1926, 4.500%, 06/01/2044 | | | 11,897 | | | | 11,524 | |
The accompanying notes are an integral part of these financial statements.
42
PMC CORE FIXED INCOME FUND | Schedule of Investments |
August 31, 2023 (Continued)
| | | | | | | | |
| | |
| | | Principal
Amount
| | | Value
| |
AL6223, 4.500%, 08/01/2044 | | $ | 12,949 | | | $ | 12,543 | |
AZ0814, 3.500%, 07/01/2045 | | | 24,693 | | | | 22,538 | |
AZ0862, 3.500%, 07/01/2045 | | | 42,224 | | | | 38,531 | |
BM1953, 3.500%, 08/01/2045 | | | 52,469 | | | | 48,354 | |
AZ4775, 3.500%, 10/01/2045 | | | 10,469 | | | | 9,549 | |
CA2929, 3.500%, 12/01/2045 | | | 83,663 | | | | 76,284 | |
AS6311, 3.500%, 12/01/2045 | | | 15,120 | | | | 13,782 | |
AS6464, 3.500%, 01/01/2046 | | | 21,086 | | | | 19,213 | |
BC4114, 3.500%, 02/01/2046 | | | 122,065 | | | | 111,263 | |
AL8219, 4.000%, 02/01/2046 | | | 169,831 | | | | 161,518 | |
AL8387, 4.000%, 03/01/2046 | | | 441,819 | | | | 419,467 | |
FM1370, 3.000%, 04/01/2046 | | | 30,592 | | | | 27,079 | |
BC0793, 3.500%, 04/01/2046 | | | 100,774 | | | | 91,989 | |
AS7200, 4.500%, 05/01/2046 | | | 6,334 | | | | 6,136 | |
AS7388, 3.500%, 06/01/2046 | | | 435,015 | | | | 397,793 | |
AS7580, 3.000%, 07/01/2046 | | | 97,209 | | | | 85,291 | |
AS7801, 3.500%, 08/01/2046 | | | 89,915 | | | | 81,821 | |
MA2737, 3.000%, 09/01/2046 | | | 544,436 | | | | 476,189 | |
AS8056, 3.000%, 10/01/2046 | | | 54,062 | | | | 47,417 | |
MA2771, 3.000%, 10/01/2046 | | | 82,466 | | | | 72,343 | |
BM3932, 3.500%, 10/01/2046 | | | 75,604 | | | | 68,889 | |
AS8269, 3.000%, 11/01/2046 | | | 69,552 | | | | 60,998 | |
MA2872, 4.500%, 01/01/2047 | | | 58,182 | | | | 56,356 | |
AS8700, 4.500%, 01/01/2047 | | | 22,231 | | | | 21,533 | |
BE5475, 3.500%, 02/01/2047 | | | 36,457 | | | | 33,155 | |
AL9879, 3.500%, 02/01/2047 | | | 1,321,457 | | | | 1,202,786 | |
FM4894, 4.000%, 03/01/2047 | | | 416,885 | | | | 394,119 | |
AS8982, 4.500%, 03/01/2047 | | | 7,167 | | | | 6,937 | |
FM1000, 3.000%, 04/01/2047 | | | 196,500 | | | | 172,374 | |
CA5843, 3.000%, 04/01/2047 | | | 107,254 | | | | 94,572 | |
MA2959, 3.500%, 04/01/2047 | | | 74,247 | | | | 67,396 | |
BM5784, 3.500%, 05/01/2047 | | | 89,487 | | | | 81,474 | |
AS9536, 3.500%, 05/01/2047 | | | 38,099 | | | | 34,662 | |
BM5347, 3.500%, 05/01/2047 | | | 83,975 | | | | 76,455 | |
BM5348, 3.500%, 05/01/2047 | | | 42,994 | | | | 39,130 | |
MA3008, 4.500%, 05/01/2047 | | | 14,775 | | | | 14,196 | |
AS9829, 3.500%, 06/01/2047 | | | 33,183 | | | | 30,179 | |
AS9831, 4.000%, 06/01/2047 | | | 50,502 | | | | 47,524 | |
BE3702, 4.000%, 06/01/2047 | | | 44,390 | | | | 41,636 | |
BM5179, 3.000%, 07/01/2047 | | | 63,418 | | | | 55,755 | |
BE3767, 3.500%, 07/01/2047 | | | 42,649 | | | | 38,795 | |
CA0062, 4.000%, 07/01/2047 | | | 36,700 | | | | 34,547 | |
MA3121, 4.000%, 09/01/2047 | | | 465,777 | | | | 437,428 | |
FM4019, 3.500%, 10/01/2047 | | | 395,811 | | | | 359,636 | |
CA0559, 4.500%, 10/01/2047 | | | 46,424 | | | | 44,879 | |
FM1467, 3.000%, 12/01/2047 | | | 61,670 | | | | 54,881 | |
MA3210, 3.500%, 12/01/2047 | | | 101,806 | | | | 92,589 | |
BH7058, 3.500%, 12/01/2047 | | | 109,560 | | | | 99,645 | |
FM2897, 3.000%, 02/01/2048 | | | 194,732 | | | | 171,719 | |
CA4140, 3.000%, 02/01/2048 | | | 60,112 | | | | 52,660 | |
BJ8783, 3.500%, 02/01/2048 | | | 65,768 | | | | 59,816 | |
CA1535, 3.500%, 02/01/2048 | | | 21,011 | | | | 19,109 | |
MA3278, 4.500%, 02/01/2048 | | | 197,462 | | | | 190,054 | |
CA1218, 4.500%, 02/01/2048 | | | 33,095 | | | | 31,803 | |
The accompanying notes are an integral part of these financial statements.
43
PMC CORE FIXED INCOME FUND | Schedule of Investments |
August 31, 2023 (Continued)
| | | | | | | | |
| | |
| | | Principal
Amount
| | | Value
| |
FM5923, 3.500%, 03/01/2048 | | $ | 535,467 | | | $ | 487,015 | |
BM3590, 3.500%, 03/01/2048 | | | 78,512 | | | | 71,402 | |
BJ0648, 3.500%, 03/01/2048 | | | 42,684 | | | | 38,821 | |
BJ0650, 3.500%, 03/01/2048 | | | 45,901 | | | | 41,746 | |
BM3900, 4.000%, 04/01/2048 | | | 81,507 | | | | 76,586 | |
CA1710, 4.500%, 05/01/2048 | | | 58,213 | | | | 56,103 | |
FM2385, 3.000%, 09/01/2048 | | | 118,433 | | | | 103,744 | |
FM1572, 3.000%, 09/01/2048 | | | 196,079 | | | | 172,298 | |
BM5024, 3.000%, 11/01/2048 | | | 52,096 | | | | 45,609 | |
FM2915, 3.000%, 11/01/2048 | | | 427,866 | | | | 378,156 | |
FM5108, 3.500%, 11/01/2048 | | | 559,553 | | | | 509,330 | |
FM1239, 3.500%, 11/01/2048 | | | 69,352 | | | | 63,076 | |
FM2239, 3.000%, 12/01/2048 | | | 105,433 | | | | 92,463 | |
CA2922, 3.000%, 12/01/2048 | | | 168,293 | | | | 147,247 | |
FM1051, 4.500%, 05/01/2049 | | | 136,025 | | | | 131,198 | |
FM4895, 4.000%, 06/01/2049 | | | 351,264 | | | | 330,557 | |
CA3683, 4.500%, 06/01/2049 | | | 48,404 | | | | 46,651 | |
BO2201, 3.000%, 09/01/2049 | | | 147,145 | | | | 127,900 | |
CA4571, 4.000%, 11/01/2049 | | | 351,132 | | | | 327,751 | |
BO6164, 3.000%, 01/01/2050 | | | 64,152 | | | | 55,815 | |
BO8947, 3.000%, 01/01/2050 | | | 77,296 | | | | 67,273 | |
FM3619, 4.500%, 01/01/2050 | | | 87,036 | | | | 83,107 | |
BP2099, 3.000%, 02/01/2050 | | | 322,996 | | | | 281,114 | |
FM7592, 3.500%, 03/01/2050 | | | 533,636 | | | | 483,956 | |
CA5519, 3.000%, 04/01/2050 | | | 70,431 | | | | 61,180 | |
FM4334, 3.000%, 04/01/2050 | | | 165,701 | | | | 144,252 | |
CA5559, 3.500%, 04/01/2050 | | | 533,048 | | | | 482,130 | |
CA5668, 3.000%, 05/01/2050 | | | 268,064 | | | | 232,854 | |
CA6086, 3.000%, 06/01/2050 | | | 1,064,377 | | | | 928,573 | |
BP6466, 3.000%, 07/01/2050 | | | 177,132 | | | | 153,716 | |
BP6481, 4.500%, 07/01/2050 | | | 34,304 | | | | 32,916 | |
BQ0239, 2.500%, 08/01/2050 | | | 178,310 | | | | 149,977 | |
BP6716, 2.500%, 09/01/2050 | | | 326,026 | | | | 272,871 | |
BK3044, 2.500%, 09/01/2050 | | | 312,697 | | | | 261,731 | |
MA4121, 3.000%, 09/01/2050 | | | 521,330 | | | | 455,041 | |
FM9143, 4.500%, 09/01/2050 | | | 123,085 | | | | 118,490 | |
MA4160, 3.000%, 10/01/2050 | | | 439,220 | | | | 381,004 | |
MA4170, 4.500%, 10/01/2050 | | | 258,720 | | | | 249,691 | |
FM7475, 4.500%, 10/01/2050 | | | 20,421 | | | | 19,685 | |
MA4208, 2.000%, 12/01/2050 | | | 2,307,658 | | | | 1,849,735 | |
FM5316, 2.000%, 12/01/2050 | | | 179,144 | | | | 143,353 | |
BR1269, 2.500%, 01/01/2051 | | | 716,231 | | | | 601,797 | |
MA4256, 2.500%, 02/01/2051 | | | 647,464 | | | | 540,072 | |
MA4282, 2.500%, 03/01/2051 | | | 411,629 | | | | 344,198 | |
BR7795, 2.500%, 04/01/2051 | | | 652,069 | | | | 544,026 | |
MA4306, 2.500%, 04/01/2051 | | | 266,408 | | | | 221,806 | |
MA4325, 2.000%, 05/01/2051 | | | 672,009 | | | | 535,884 | |
BT2488, 2.500%, 05/01/2051 | | | 415,548 | | | | 346,235 | |
MA4326, 2.500%, 05/01/2051 | | | 440,033 | | | | 367,130 | |
FM7189, 2.500%, 05/01/2051 | | | 477,258 | | | | 398,153 | |
FM7738, 2.500%, 06/01/2051 | | | 465,723 | | | | 388,812 | |
MA4356, 2.500%, 06/01/2051 | | | 878,183 | | | | 732,239 | |
BT0417, 2.500%, 06/01/2051 | | | 281,979 | | | | 234,743 | |
MA4378, 2.000%, 07/01/2051 | | | 634,067 | | | | 506,863 | |
The accompanying notes are an integral part of these financial statements.
44
PMC CORE FIXED INCOME FUND | Schedule of Investments |
August 31, 2023 (Continued)
| | | | | | | | |
| | |
| | | Principal
Amount
| | | Value
| |
CB1038, 2.500%, 07/01/2051 | | $ | 305,609 | | | $ | 255,184 | |
MA4379, 2.500%, 07/01/2051 | | | 344,909 | | | | 287,399 | |
FS1550, 2.500%, 07/01/2051 | | | 331,205 | | | | 277,222 | |
CB1027, 2.500%, 07/01/2051 | | | 250,799 | | | | 208,576 | |
FM8178, 2.500%, 07/01/2051 | | | 781,446 | | | | 649,887 | |
BT1339, 2.500%, 07/01/2051 | | | 738,518 | | | | 614,216 | |
FM8360, 2.500%, 08/01/2051 | | | 342,861 | | | | 285,838 | |
FM8422, 2.500%, 08/01/2051 | | | 728,424 | | | | 606,466 | |
MA4399, 2.500%, 08/01/2051 | | | 2,287,598 | | | | 1,904,245 | |
BT3273, 2.500%, 08/01/2051 | | | 748,640 | | | | 622,321 | |
BT7263, 2.500%, 09/01/2051 | | | 440,757 | | | | 366,556 | |
CB2852, 2.000%, 11/01/2051 | | | 1,299,980 | | | | 1,036,631 | |
MA4493, 2.500%, 12/01/2051 | | | 420,545 | | | | 349,266 | |
FS0121, 2.000%, 01/01/2052 | | | 545,297 | | | | 436,091 | |
MA4562, 2.000%, 03/01/2052 | | | 640,752 | | | | 511,071 | |
FS4110, 2.500%, 03/01/2052 | | | 144,507 | | | | 120,280 | |
BV4139, 2.500%, 03/01/2052 | | | 200,061 | | | | 166,885 | |
MA4578, 2.500%, 04/01/2052 | | | 1,472,446 | | | | 1,222,133 | |
BU8667, 4.000%, 05/01/2052 | | | 403,911 | | | | 373,594 | |
CB3622, 4.000%, 05/01/2052 | | | 457,976 | | | | 423,237 | |
MA4626, 4.000%, 06/01/2052 | | | 672,986 | | | | 621,863 | |
CB3914, 4.000%, 06/01/2052 | | | 510,129 | | | | 471,430 | |
BV2558, 5.000%, 06/01/2052 | | | 616,235 | | | | 598,245 | |
BV2634, 4.000%, 07/01/2052 | | | 503,956 | | | | 465,464 | |
BW0036, 4.500%, 07/01/2052 | | | 379,990 | | | | 362,729 | |
BV2623, 4.500%, 07/01/2052 | | | 253,877 | | | | 240,885 | |
FS2603, 4.500%, 08/01/2052 | | | 659,518 | | | | 625,766 | |
CB4404, 5.000%, 08/01/2052 | | | 690,369 | | | | 669,863 | |
BV7959, 5.000%, 08/01/2052 | | | 695,412 | | | | 675,169 | |
BV8055, 4.500%, 09/01/2052 | | | 669,349 | | | | 635,094 | |
BW6232, 5.000%, 09/01/2052 | | | 864,736 | | | | 839,188 | |
BW1201, 5.000%, 09/01/2052 | | | 746,435 | | | | 724,592 | |
MA4785, 5.000%, 10/01/2052 | | | 701,146 | | | | 680,573 | |
FS3642, 5.000%, 11/01/2052 | | | 334,840 | | | | 324,886 | |
MA4842, 5.500%, 12/01/2052 | | | 1,081,705 | | | | 1,069,365 | |
MA4868, 5.000%, 01/01/2053 | | | 650,945 | | | | 631,762 | |
MA4918, 5.000%, 02/01/2053 | | | 688,685 | | | | 668,260 | |
MA4919, 5.500%, 02/01/2053 | | | 617,957 | | | | 610,670 | |
MA4941, 5.500%, 03/01/2053 | | | 664,340 | | | | 656,301 | |
CB6031, 5.000%, 04/01/2053 | | | 380,557 | | | | 369,472 | |
FS4357, 5.500%, 04/01/2053 | | | 542,110 | | | | 536,181 | |
BW4908, 6.000%, 04/01/2053 | | | 458,145 | | | | 459,897 | |
MA5009, 5.000%, 05/01/2053 | | | 171,516 | | | | 166,410 | |
FS4874, 5.500%, 06/01/2053 | | | 1,281,381 | | | | 1,266,225 | |
MA5073, 6.000%, 07/01/2053 | | | 540,687 | | | | 542,329 | |
MA5108, 6.000%, 08/01/2053 | | | 804,490 | | | | 806,933 | |
Fannie Mae REMICS | | | | | | | | |
2012-70, 0.598% (SOFR30A + 5.886%), 07/25/2042(b)(d) | | | 846,255 | | | | 89,958 | |
2012-68, 0.648% (SOFR30A + 5.936%), 07/25/2042(b)(d) | | | 1,378,088 | | | | 137,670 | |
2013-6, 0.698% (SOFR30A + 5.986%), 02/25/2043(b)(d) | | | 901,047 | | | | 98,474 | |
2013-18, 0.698% (SOFR30A + 5.986%), 03/25/2043(b)(d) | | | 995,080 | | | | 97,503 | |
2014-90, 0.748% (SOFR30A + 6.036%), 01/25/2045(b)(d) | | | 1,509,066 | | | | 171,246 | |
2015-32, 0.798% (SOFR30A + 6.086%), 05/25/2045(b)(d) | | | 888,585 | | | | 95,434 | |
2016-40, 0.448% (SOFR30A + 5.736%), 07/25/2046(b)(d) | | | 580,710 | | | | 53,304 | |
The accompanying notes are an integral part of these financial statements.
45
PMC CORE FIXED INCOME FUND | Schedule of Investments |
August 31, 2023 (Continued)
| | | | | | | | |
| | |
| | | Principal
Amount
| | | Value
| |
2018-07, 4.000%, 02/25/2048(d) | | $ | 1,113,024 | | | $ | 210,586 | |
2020-52, 4.500%, 08/25/2050(d) | | | 1,013,062 | | | | 209,277 | |
Freddie Mac Gold Pool | | | | | | | | |
G1-4953, 3.500%, 01/01/2029 | | | 12,289 | | | | 11,791 | |
A8-6315, 4.500%, 05/01/2039 | | | 13,472 | | | | 13,114 | |
A8-6521, 4.500%, 05/01/2039 | | | 26,609 | | | | 25,971 | |
A9-3617, 4.500%, 08/01/2040 | | | 2,319 | | | | 2,263 | |
Q0-0285, 4.500%, 04/01/2041 | | | 3,415 | | | | 3,333 | |
Q0-0876, 4.500%, 05/01/2041 | | | 21,467 | | | | 20,952 | |
Q0-2173, 4.500%, 07/01/2041 | | | 15,674 | | | | 15,299 | |
C0-3795, 3.500%, 04/01/2042 | | | 106,356 | | | | 98,142 | |
Q0-9004, 3.500%, 06/01/2042 | | | 9,745 | | | | 8,992 | |
C0-9004, 3.500%, 07/01/2042 | | | 10,416 | | | | 9,612 | |
Q0-9896, 3.500%, 08/01/2042 | | | 13,449 | | | | 12,410 | |
Q1-1348, 3.500%, 09/01/2042 | | | 28,283 | | | | 26,098 | |
Q1-8305, 3.500%, 05/01/2043 | | | 11,381 | | | | 10,501 | |
Q1-9475, 3.500%, 06/01/2043 | | | 19,330 | | | | 17,836 | |
G6-0030, 3.500%, 07/01/2043 | | | 59,831 | | | | 55,251 | |
Q2-0780, 3.500%, 08/01/2043 | | | 24,578 | | | | 22,678 | |
Q2-0857, 3.500%, 08/01/2043 | | | 15,600 | | | | 14,311 | |
G0-7459, 3.500%, 08/01/2043 | | | 12,535 | | | | 11,566 | |
G0-8541, 3.500%, 08/01/2043 | | | 21,874 | | | | 20,183 | |
Q2-6513, 4.500%, 06/01/2044 | | | 11,459 | | | | 11,110 | |
Q4-5219, 3.500%, 01/01/2045 | | | 77,492 | | | | 70,918 | |
G0-7961, 3.500%, 03/01/2045 | | | 17,001 | | | | 15,566 | |
G0-8636, 3.500%, 04/01/2045 | | | 19,766 | | | | 18,036 | |
Q3-5225, 3.500%, 08/01/2045 | | | 9,681 | | | | 8,839 | |
G0-8659, 3.500%, 08/01/2045 | | | 53,866 | | | | 49,178 | |
G0-8676, 3.500%, 11/01/2045 | | | 23,521 | | | | 21,466 | |
G6-0480, 4.500%, 11/01/2045 | | | 9,276 | | | | 8,998 | |
G0-8681, 3.500%, 12/01/2045 | | | 17,447 | | | | 15,921 | |
Q3-9644, 3.500%, 03/01/2046 | | | 82,368 | | | | 75,166 | |
Q3-9434, 3.500%, 03/01/2046 | | | 3,700 | | | | 3,379 | |
G0-8693, 3.500%, 03/01/2046 | | | 3,892 | | | | 3,551 | |
G0-8702, 3.500%, 04/01/2046 | | | 40,074 | | | | 36,549 | |
G0-8706, 3.500%, 05/01/2046 | | | 18,407 | | | | 16,930 | |
Q4-0718, 3.500%, 05/01/2046 | | | 115,414 | | | | 105,238 | |
Q4-0375, 3.500%, 05/01/2046 | | | 26,802 | | | | 24,444 | |
G0-8708, 4.500%, 05/01/2046 | | | 24,424 | | | | 23,687 | |
Q4-1208, 3.500%, 06/01/2046 | | | 57,711 | | | | 52,724 | |
G0-8721, 3.000%, 09/01/2046 | | | 39,504 | | | | 34,699 | |
G0-8735, 4.500%, 10/01/2046 | | | 33,881 | | | | 32,858 | |
G0-8741, 3.000%, 01/01/2047 | | | 726,040 | | | | 637,515 | |
G0-8743, 4.000%, 01/01/2047 | | | 31,334 | | | | 29,539 | |
Q4-6279, 3.500%, 02/01/2047 | | | 43,668 | | | | 39,795 | |
Q4-6539, 4.500%, 03/01/2047 | | | 3,387 | | | | 3,252 | |
G0-8757, 3.500%, 04/01/2047 | | | 7,396 | | | | 6,737 | |
G0-8759, 4.500%, 04/01/2047 | | | 11,946 | | | | 11,585 | |
V8-3204, 4.500%, 05/01/2047 | | | 28,142 | | | | 27,116 | |
Q4-9100, 4.000%, 07/01/2047 | | | 66,711 | | | | 62,853 | |
Q4-9394, 4.500%, 07/01/2047 | | | 53,510 | | | | 51,798 | |
Q4-9888, 3.500%, 08/01/2047 | | | 38,503 | | | | 35,060 | |
Q5-0035, 3.500%, 08/01/2047 | | | 56,124 | | | | 51,112 | |
Q5-0109, 3.500%, 08/01/2047 | | | 7,336 | | | | 6,680 | |
The accompanying notes are an integral part of these financial statements.
46
PMC CORE FIXED INCOME FUND | Schedule of Investments |
August 31, 2023 (Continued)
| | | | | | | | |
| | |
| | | Principal
Amount
| | | Value
| |
G6-1228, 4.000%, 08/01/2047 | | $ | 104,261 | | | $ | 98,232 | |
G0-8779, 3.500%, 09/01/2047 | | | 158,879 | | | | 143,512 | |
G0-8785, 4.000%, 10/01/2047 | | | 81,667 | | | | 76,364 | |
G6-1631, 3.500%, 11/01/2047 | | | 147,998 | | | | 134,873 | |
Q5-2319, 3.500%, 11/01/2047 | | | 123,157 | | | | 112,145 | |
G6-1467, 4.000%, 11/01/2047 | | | 107,128 | | | | 100,255 | |
G6-1281, 3.500%, 01/01/2048 | | | 68,772 | | | | 62,623 | |
G0-8800, 3.500%, 02/01/2048 | | | 93,160 | | | | 84,830 | |
Q5-4463, 4.000%, 02/01/2048 | | | 52,401 | | | | 49,372 | |
G6-7710, 3.500%, 03/01/2048 | | | 130,333 | | | | 118,680 | |
Freddie Mac Multifamily Structured Pass Through Certificates | | | | | | | | |
K-098, 1.517%, 08/25/2029(c)(d) | | | 1,985,000 | | | | 138,180 | |
Freddie Mac Pool | | | | | | | | |
ZS-9972, 3.000%, 03/01/2042 | | | 665,804 | | | | 589,992 | |
ZM-1590, 3.000%, 08/01/2046 | | | 479,211 | | | | 419,686 | |
SD-0035, 3.000%, 04/01/2047 | | | 433,328 | | | | 384,087 | |
ZM-4908, 3.500%, 11/01/2047 | | | 197,051 | | | | 179,204 | |
ZA-5250, 4.000%, 01/01/2048 | | | 176,510 | | | | 166,599 | |
ZS-4759, 3.500%, 03/01/2048 | | | 118,837 | | | | 108,073 | |
ZM-6197, 4.000%, 04/01/2048 | | | 427,798 | | | | 403,302 | |
SD-0298, 3.000%, 11/01/2048 | | | 306,553 | | | | 270,620 | |
ZN-2103, 4.500%, 12/01/2048 | | | 30,039 | | | | 28,955 | |
ZA-7141, 3.000%, 06/01/2049 | | | 60,480 | | | | 52,654 | |
SD-8005, 3.500%, 08/01/2049 | | | 552,816 | | | | 501,942 | |
SD-8013, 4.500%, 09/01/2049 | | | 79,752 | | | | 76,755 | |
SI-2009, 3.000%, 10/01/2049 | | | 363,961 | | | | 316,930 | |
QA-5549, 3.000%, 12/01/2049 | | | 193,895 | | | | 168,542 | |
QA-7325, 3.000%, 02/01/2050 | | | 147,857 | | | | 128,704 | |
QA-6750, 3.000%, 02/01/2050 | | | 108,945 | | | | 95,143 | |
QA-8311, 3.000%, 03/01/2050 | | | 185,111 | | | | 162,384 | |
SD-8068, 3.000%, 06/01/2050 | | | 506,251 | | | | 439,901 | |
RA-2970, 2.500%, 07/01/2050 | | | 169,551 | | | | 141,780 | |
SD-8074, 3.000%, 07/01/2050 | | | 74,262 | | | | 64,572 | |
QB-2682, 2.500%, 08/01/2050 | | | 128,099 | | | | 107,194 | |
SD-8084, 3.000%, 08/01/2050 | | | 217,551 | | | | 188,661 | |
SD-8086, 4.000%, 08/01/2050 | | | 160,174 | | | | 149,441 | |
RA-3484, 3.000%, 09/01/2050 | | | 251,172 | | | | 217,777 | |
SD-8098, 2.000%, 10/01/2050 | | | 2,242,198 | | | | 1,796,861 | |
QB-4785, 2.500%, 10/01/2050 | | | 182,178 | | | | 152,448 | |
QB-6037, 2.500%, 11/01/2050 | | | 135,524 | | | | 113,406 | |
SD-1025, 3.500%, 12/01/2050 | | | 682,111 | | | | 614,748 | |
SD-8122, 2.500%, 01/01/2051 | | | 386,331 | | | | 323,283 | |
SD-8129, 2.500%, 02/01/2051 | | | 521,893 | | | | 434,796 | |
RA-4527, 2.500%, 02/01/2051 | | | 266,864 | | | | 223,178 | |
SD-8135, 2.500%, 03/01/2051 | | | 187,083 | | | | 156,557 | |
QC-0945, 2.500%, 04/01/2051 | | | 781,667 | | | | 652,499 | |
SD-8147, 2.500%, 05/01/2051 | | | 437,984 | | | | 365,382 | |
QC-3907, 2.500%, 07/01/2051 | | | 409,291 | | | | 340,595 | |
QC-4235, 2.500%, 07/01/2051 | | | 668,954 | | | | 556,549 | |
SD-8156, 2.500%, 07/01/2051 | | | 408,032 | | | | 339,688 | |
SD-8160, 2.000%, 08/01/2051 | | | 787,435 | | | | 628,326 | |
QC-6209, 2.500%, 08/01/2051 | | | 361,281 | | | | 301,018 | |
QC-5978, 2.500%, 08/01/2051 | | | 584,823 | | | | 487,504 | |
RA-5855, 2.500%, 09/01/2051 | | | 699,944 | | | | 581,535 | |
The accompanying notes are an integral part of these financial statements.
47
PMC CORE FIXED INCOME FUND | Schedule of Investments |
August 31, 2023 (Continued)
| | | | | | | | |
| | |
| | | Principal
Amount
| | | Value
| |
SD-8167, 2.500%, 09/01/2051 | | $ | 1,061,351 | | | $ | 882,246 | |
QC-8520, 2.500%, 10/01/2051 | | | 268,262 | | | | 222,581 | |
SD-0780, 2.500%, 12/01/2051 | | | 474,014 | | | | 393,967 | |
RA-6686, 4.000%, 01/01/2052 | | | 216,648 | | | | 200,303 | |
QE-4039, 4.000%, 06/01/2052 | | | 1,168,591 | | | | 1,080,184 | |
SD-1883, 4.000%, 06/01/2052 | | | 623,815 | | | | 576,993 | |
SD-1117, 4.500%, 06/01/2052 | | | 295,662 | | | | 281,248 | |
SD-8225, 3.000%, 07/01/2052 | | | 846,340 | | | | 729,866 | |
QE-6058, 4.500%, 07/01/2052 | | | 846,726 | | | | 803,429 | |
SD-8231, 4.500%, 07/01/2052 | | | 325,882 | | | | 309,222 | |
SD-8233, 5.000%, 07/01/2052 | | | 638,039 | | | | 619,196 | |
SD-1576, 5.000%, 08/01/2052 | | | 881,246 | | | | 855,390 | |
QE-9381, 4.000%, 09/01/2052 | | | 741,904 | | | | 685,397 | |
SD-1803, 5.500%, 09/01/2052 | | | 299,611 | | | | 296,544 | |
SD-1709, 5.500%, 09/01/2052 | | | 751,252 | | | | 742,604 | |
SD-8256, 4.000%, 10/01/2052 | | | 722,603 | | | | 667,485 | |
SD-8257, 4.500%, 10/01/2052 | | | 382,657 | | | | 363,064 | |
SD-8258, 5.000%, 10/01/2052 | | | 656,433 | | | | 637,172 | |
SD-1719, 5.500%, 10/01/2052 | | | 838,343 | | | | 830,395 | |
SD-1913, 5.000%, 11/01/2052 | | | 401,552 | | | | 389,863 | |
SD-1884, 5.000%, 11/01/2052 | | | 102,233 | | | | 99,194 | |
SD-8268, 5.500%, 11/01/2052 | | | 373,839 | | | | 369,579 | |
QF-4848, 6.000%, 12/01/2052 | | | 591,350 | | | | 593,745 | |
QF-6551, 5.500%, 01/01/2053 | | | 608,498 | | | | 601,014 | |
SD-8289, 5.500%, 01/01/2053 | | | 620,676 | | | | 613,099 | |
SD-8290, 6.000%, 01/01/2053 | | | 376,652 | | | | 377,855 | |
SD-2174, 6.000%, 01/01/2053 | | | 552,822 | | | | 554,500 | |
SD-2334, 5.000%, 02/01/2053 | | | 413,688 | | | | 401,531 | |
SD-8300, 5.500%, 02/01/2053 | | | 894,626 | | | | 883,566 | |
QF-7085, 5.500%, 02/01/2053 | | | 945,943 | | | | 934,248 | |
SD-8309, 6.000%, 03/01/2053 | | | 580,201 | | | | 581,963 | |
SD-8316, 5.500%, 04/01/2053 | | | 479,244 | | | | 473,319 | |
SD-3218, 5.000%, 05/01/2053 | | | 224,146 | | | | 217,530 | |
SD-2913, 5.500%, 05/01/2053 | | | 652,543 | | | | 644,969 | |
SD-8329, 5.000%, 06/01/2053 | | | 758,451 | | | | 735,772 | |
SD-3136, 5.500%, 06/01/2053 | | | 129,604 | | | | 128,204 | |
SD-3010, 5.500%, 06/01/2053 | | | 465,137 | | | | 459,732 | |
SD-3392, 5.500%, 07/01/2053 | | | 323,152 | | | | 319,422 | |
Freddie Mac REMICS | | | | | | | | |
4121, 0.897% (SOFR30A + 6.086%), 10/15/2042(b)(d) | | | 853,307 | | | | 80,114 | |
4122, 4.000%, 10/15/2042(d) | | | 888,937 | | | | 161,557 | |
4159, 0.847% (SOFR30A + 6.036%), 01/15/2043(b)(d) | | | 1,673,164 | | | | 180,953 | |
4459, 4.000%, 08/15/2043(d) | | | 1,846,077 | | | | 326,429 | |
4385, 4.500%, 09/15/2044(d) | | | 176,945 | | | | 34,702 | |
4572, 0.747% (SOFR30A + 5.936%), 04/15/2046(b)(d) | | | 393,194 | | | | 38,700 | |
4583, 0.697% (SOFR30A + 5.886%), 05/15/2046(b)(d) | | | 406,453 | | | | 34,749 | |
4616, 0.697% (SOFR30A + 5.886%), 09/15/2046(b)(d) | | | 950,784 | | | | 100,907 | |
4623, 0.697% (SOFR30A + 5.886%), 10/15/2046(b)(d) | | | 861,507 | | | | 80,757 | |
4648, 0.697% (SOFR30A + 5.886%), 01/15/2047(b)(d) | | | 367,397 | | | | 38,551 | |
5013, 3.000%, 09/25/2050(d) | | | 2,420,043 | | | | 342,917 | |
Freddie Mac STACR REMIC Trust | | | | | | | | |
2021-DNA7, 7.088% (SOFR30A + 1.800%), 11/25/2041(b) | | | 473,000 | | | | 462,967 | |
2022-DNA2, 7.688% (SOFR30A + 2.400%), 02/25/2042(b) | | | 990,000 | | | | 987,293 | |
2022-HQA1, 8.788% (SOFR30A + 3.500%), 03/25/2042(b) | | | 309,000 | | | | 318,874 | |
2022-DNA3, 8.188% (SOFR30A + 2.900%), 04/25/2042(b) | | | 1,162,000 | | | | 1,181,132 | |
The accompanying notes are an integral part of these financial statements.
48
PMC CORE FIXED INCOME FUND | Schedule of Investments |
August 31, 2023 (Continued)
| | | | | | | | |
| | |
| | | Principal
Amount
| | | Value
| |
Freddie Mac Structured Agency Credit Risk Debt Notes | | | | | | | | |
2017-HQA3, 7.752% (SOFR30A + 2.464%), 04/25/2030(b) | | $ | 615,752 | | | $ | 623,963 | |
2018-DNA1, 7.202% (SOFR30A + 1.914%), 07/25/2030(b) | | | 270,547 | | | | 270,758 | |
2018-HQA1, 7.702% (SOFR30A + 2.414%), 09/25/2030(b) | | | 569,566 | | | | 575,749 | |
Ginnie Mae II Pool | | | | | | | | |
MA0699M, 3.500%, 01/20/2043 | | | 22,391 | | | | 20,765 | |
MA0783M, 3.500%, 02/20/2043 | | | 30,564 | | | | 28,350 | |
MA0934M, 3.500%, 04/20/2043 | | | 21,668 | | | | 20,103 | |
MA3663M, 3.500%, 05/20/2046 | | | 37,316 | | | | 34,459 | |
MA3803M, 3.500%, 07/20/2046 | | | 14,483 | | | | 13,356 | |
MA4510M, 3.500%, 06/20/2047 | | | 58,817 | | | | 54,230 | |
MA4586M, 3.500%, 07/20/2047 | | | 81,041 | | | | 74,752 | |
MA4652M, 3.500%, 08/20/2047 | | | 54,689 | | | | 50,266 | |
MA4900M, 3.500%, 12/20/2047 | | | 41,294 | | | | 38,095 | |
MA6542M, 3.500%, 03/20/2050 | | | 220,274 | | | | 203,636 | |
MA6600M, 3.500%, 04/20/2050 | | | 16,477 | | | | 15,117 | |
MA7192M, 2.000%, 02/20/2051 | | | 274,184 | | | | 226,980 | |
MA7193M, 2.500%, 02/20/2051 | | | 274,777 | | | | 234,175 | |
MA7254M, 2.000%, 03/20/2051 | | | 279,712 | | | | 231,813 | |
MA7255M, 2.500%, 03/20/2051 | | | 682,962 | | | | 582,018 | |
MA7311M, 2.000%, 04/20/2051 | | | 797,642 | | | | 660,059 | |
MA7312M, 2.500%, 04/20/2051 | | | 754,782 | | | | 643,249 | |
MA7367M, 2.500%, 05/20/2051 | | | 278,629 | | | | 237,577 | |
MA7418M, 2.500%, 06/20/2051 | | | 582,223 | | | | 496,097 | |
MA7472M, 2.500%, 07/20/2051 | | | 382,624 | | | | 326,073 | |
MA7589M, 2.500%, 09/20/2051 | | | 209,441 | | | | 178,470 | |
MA7648M, 2.000%, 10/20/2051 | | | 280,876 | | | | 232,158 | |
MA7986M, 2.000%, 04/20/2052 | | | 114,591 | | | | 94,629 | |
MA8099M, 3.500%, 06/20/2052 | | | 93,576 | | | | 85,024 | |
MA8147M, 2.500%, 07/20/2052 | | | 251,638 | | | | 214,379 | |
MA8151M, 4.500%, 07/20/2052 | | | 875,226 | | | | 835,097 | |
MA8201M, 4.500%, 08/20/2052 | | | 1,120,190 | | | | 1,069,036 | |
MA8268M, 4.500%, 09/20/2052 | | | 532,957 | | | | 508,506 | |
MA8269M, 5.000%, 09/20/2052 | | | 617,551 | | | | 601,877 | |
MA8347M, 4.500%, 10/20/2052 | | | 203,061 | | | | 193,744 | |
MA8428M, 5.000%, 11/20/2052 | | | 434,938 | | | | 423,744 | |
MA8429M, 5.500%, 11/20/2052 | | | 502,474 | | | | 497,713 | |
MA8492M, 6.000%, 12/20/2052 | | | 434,031 | | | | 435,876 | |
MA8569M, 5.000%, 01/20/2053 | | | 465,556 | | | | 453,277 | |
MA8570M, 5.500%, 01/20/2053 | | | 342,825 | | | | 339,845 | |
MA8725M, 5.000%, 03/20/2053 | | | 345,175 | | | | 336,071 | |
MA8800M, 5.000%, 04/20/2053 | | | 232,666 | | | | 226,529 | |
MA8801M, 5.500%, 04/20/2053 | | | 888,939 | | | | 880,377 | |
MA8948M, 5.500%, 06/20/2053 | | | 497,681 | | | | 492,885 | |
MA9017M, 5.500%, 07/20/2053 | | | 324,362 | | | | 321,238 | |
MA9018M, 6.000%, 07/20/2053 | | | 424,221 | | | | 426,024 | |
MA9107M, 6.000%, 08/20/2053 | | | 175,000 | | | | 175,744 | |
Government National Mortgage Association | | | | | | | | |
2013-23, 3.500%, 02/20/2043(d) | | | 1,010,281 | | | | 148,577 | |
2015-162, 1.322% (TSFR1M + 6.636%), 11/20/2045(b)(d) | | | 823,607 | | | | 105,682 | |
2018-007, 0.772% (TSFR1M + 6.086%), 01/20/2048(b)(d) | | | 899,393 | | | | 88,612 | |
2020-107, 1.000%, 07/20/2050 | | | 982,815 | | | | 747,909 | |
2020-112, 1.000%, 08/20/2050 | | | 852,704 | | | | 648,959 | |
2020-173, 2.500%, 11/20/2050(d) | | | 2,168,219 | | | | 284,005 | |
The accompanying notes are an integral part of these financial statements.
49
PMC CORE FIXED INCOME FUND | Schedule of Investments |
August 31, 2023 (Continued)
| | | | | | | | |
| | |
| | | Principal
Amount
| | | Value
| |
2021-103, 2.000%, 06/20/2051 | | $ | 740,745 | | | $ | 616,724 | |
2021-116, 2.500%, 06/20/2051(d) | | | 2,402,426 | | | | 326,496 | |
| | | | | | |
|
|
|
TOTAL AGENCY MORTGAGE BACKED SECURITIES (Cost $125,772,710) | | | | | | | 114,773,768 | |
| | | | | | |
|
|
|
| U.S. GOVERNMENT AGENCY ISSUES—0.59% | | | | | | | | |
Fannie Mae Principal Strip | | | | | | | | |
0.000%, 07/15/2037 | | | 1,370,000 | | | | 712,147 | |
Federal Home Loan Banks | | | | | | | | |
4.000%, 06/30/2028 | | | 755,000 | | | | 746,442 | |
Federal National Mortgage Association | | | | | | | | |
0.875%, 08/05/2030 | | | 575,000 | | | | 456,378 | |
Tennessee Valley Authority | | | | | | | | |
5.250%, 09/15/2039 | | | 320,000 | | | | 329,481 | |
| | | | | | |
|
|
|
TOTAL U.S. GOVERNMENT AGENCY ISSUES (Cost $2,629,475) | | | | | | | 2,244,448 | |
| | | | | | |
|
|
|
| U.S. GOVERNMENT NOTES/BONDS—13.93% | | | | | | | | |
United States Treasury Note/Bond | | | | | | | | |
4.125%, 07/31/2028(e) | | | 250,000 | | | | 248,555 | |
4.000%, 02/28/2030 | | | 580,000 | | | | 572,704 | |
3.500%, 02/15/2033(e) | | | 17,550,000 | | | | 16,716,375 | |
3.375%, 05/15/2033(e) | | | 11,935,000 | | | | 11,245,008 | |
3.875%, 08/15/2033 | | | 2,210,000 | | | | 2,170,807 | |
3.875%, 02/15/2043 | | | 1,940,000 | | | | 1,805,413 | |
2.875%, 05/15/2043 | | | 2,575,000 | | | | 2,051,551 | |
3.875%, 05/15/2043(e) | | | 220,000 | | | | 204,669 | |
3.750%, 11/15/2043 | | | 1,960,000 | | | | 1,783,294 | |
3.375%, 05/15/2044 | | | 1,380,000 | | | | 1,183,646 | |
3.125%, 05/15/2048 | | | 1,205,000 | | | | 978,921 | |
3.000%, 02/15/2049 | | | 1,675,000 | | | | 1,329,859 | |
2.375%, 05/15/2051 | | | 2,060,000 | | | | 1,432,183 | |
2.875%, 05/15/2052(e) | | | 3,900,000 | | | | 3,028,441 | |
3.000%, 08/15/2052 | | | 5,505,000 | | | | 4,388,732 | |
3.625%, 02/15/2053 | | | 1,450,000 | | | | 1,306,699 | |
3.625%, 05/15/2053 | | | 2,360,000 | | | | 2,128,978 | |
| | | | | | |
|
|
|
TOTAL U.S. GOVERNMENT NOTES/BONDS (Cost $53,896,235) | | | | | | | 52,575,835 | |
| | | | | | |
|
|
|
| | |
| | | Shares
| | | | |
| EXCHANGE TRADED FUNDS—3.21% | | | | | | | | |
iShares Core U.S. Aggregate Bond ETF | | | 125,156 | | | | 12,115,101 | |
| | | | | | |
|
|
|
TOTAL EXCHANGE TRADED FUNDS (Cost $12,504,291) | | | | | | | 12,115,101 | |
| | | | | | |
|
|
|
| INVESTMENTS PURCHASED WITH COLLATERAL FROM SECURITIES LENDING—13.21% | |
Investment Company—13.21% | | | | | | | | |
Mount Vernon Liquid Assets Portfolio, LLC, 5.460%(f) | | | 49,844,301 | | | | 49,844,301 | |
| | | | | | |
|
|
|
TOTAL INVESTMENTS PURCHASED WITH COLLATERAL FROM SECURITIES LENDING (Cost $49,844,301) | | | | | | | 49,844,301 | |
| | | | | | |
|
|
|
| MONEY MARKET FUNDS—1.05% | | | | | | | | |
First American Government Obligations Fund, Class X, 5.247%(f) | | | 3,949,998 | | | | 3,949,998 | |
| | | | | | |
|
|
|
| TOTAL MONEY MARKET FUNDS (Cost $3,949,998) | | | | | | | 3,949,998 | |
| | | | | | |
|
|
|
| Total Investments (Cost $453,721,536)—112.63% | | | | | | | 424,973,597 | |
Liabilities in Excess of Other Assets—(12.63)% | | | | | | | (47,668,084 | ) |
| | | | | | |
|
|
|
| TOTAL NET ASSETS—100.00% | | | | | | $ | 377,305,513 | |
| | | | | | |
|
|
|
The accompanying notes are an integral part of these financial statements.
50
PMC CORE FIXED INCOME FUND | Schedule of Investments |
August 31, 2023 (Continued)
Percentages are stated as a percent of net assets.
| (a) | | Variable rate security; the rate shown represents the rate at August 31, 2023. |
| (b) | | Floating rate security; the rate shown represents the rate at August 31, 2023. The coupon is based on an underlying pool of loans and other conditions at the time the loans are securitized. |
| (c) | | Variable rate security; the rate shown represents the rate at August 31, 2023. The coupon is based on an underlying pool of loans and other conditions at the time the loans are securitized. |
| (d) | | Represents an interest-only security that entitles holders to receive only interest payments on underlying mortgages. |
| (e) | | All or portion of this security is out on loan as of August 31, 2023. Total value of securities out on loan is $48,899,480. |
| (f) | | The rate shown represents the seven day yield at August 31, 2023. |
| (g) | | Perpetual maturity. The date referenced is the next call date. |
Abbreviations
| # | | TBA Pool number to be announced |
The Global Industry Classification Standard (GICS®) was developed by and/or is the exclusive property of MSCI, Inc. and Standard & Poors Financial Services LLC (“S&P”). GICS is a service mark of MSCI and S&P and has been licensed for use by U.S. Bancorp Fund Services, LLC.
The accompanying notes are an integral part of these financial statements.
51
PMC DIVERSIFIED EQUITY FUND | Schedule of Investments |
August 31, 2023
| | | | | | | | |
| | |
| | | Shares
| | | Value
| |
| COMMON STOCKS—71.83% | | | | | | | | |
Automobiles & Components—2.48% | | | | | | | | |
Bayerische Motoren Werke AG—ADR | | | 91,811 | | | $ | 3,226,239 | |
BorgWarner, Inc.(b) | | | 52,016 | | | | 2,119,652 | |
Bridgestone Corp.—ADR | | | 18,241 | | | | 352,599 | |
BYD Co. Ltd.—ADR | | | 2,032 | | | | 128,300 | |
Cie Generale des Etablissements Michelin SCA—ADR | | | 10,123 | | | | 157,818 | |
Ford Motor Co. | | | 44,500 | | | | 539,785 | |
Geely Automobile Holdings Ltd.—ADR | | | 2,379 | | | | 59,344 | |
General Motors Co. | | | 14,916 | | | | 499,835 | |
Harley-Davidson, Inc. | | | 6,461 | | | | 218,059 | |
Honda Motor Co. Ltd.—ADR | | | 154,350 | | | | 4,990,137 | |
Isuzu Motors Ltd.—ADR | | | 24,418 | | | | 312,306 | |
Mazda Motor Corp.—ADR(b) | | | 336,453 | | | | 1,752,920 | |
Mercedes-Benz Group AG—ADR | | | 154,544 | | | | 2,821,973 | |
Renault SA—ADR | | | 149,336 | | | | 1,203,648 | |
Subaru Corp.—ADR | | | 135,236 | | | | 1,292,856 | |
Sumitomo Electric Industries Ltd.—ADR | | | 57,759 | | | | 703,793 | |
Suzuki Motor Corp.—ADR | | | 3,190 | | | | 504,307 | |
Thor Industries, Inc.(b) | | | 5,792 | | | | 607,117 | |
Valeo SE—ADR | | | 3,599 | | | | 35,450 | |
| | | | | | |
|
|
|
| | | | | | | | 21,526,138 | |
| | | | | | |
|
|
|
Banks—3.92% | | | | | | | | |
Akbank TAS—ADR | | | 152,705 | | | | 320,894 | |
Associated Banc-Corp(b) | | | 710 | | | | 12,304 | |
Banco BBVA Argentina SA—ADR(b) | | | 37,299 | | | | 213,350 | |
Banco Bilbao Vizcaya Argentaria SA—ADR | | | 598,439 | | | | 4,751,605 | |
Banco de Chile—ADR | | | 11,110 | | | | 242,420 | |
Banco do Brasil SA—ADR | | | 60,013 | | | | 573,124 | |
Banco Santander SA—ADR | | | 599,375 | | | | 2,319,581 | |
Bank Central Asia Tbk PT—ADR(b) | | | 6,198 | | | | 94,334 | |
Bank Hapoalim BM—ADR | | | 6,906 | | | | 286,703 | |
Bank Mandiri Persero Tbk PT—ADR | | | 26,646 | | | | 419,675 | |
Bank of China Ltd.—ADR | | | 152,904 | | | | 1,293,568 | |
Bank of East Asia Ltd.—ADR | | | 130,225 | | | | 184,268 | |
Bank OZK(b) | | | 330 | | | | 13,256 | |
BNP Paribas SA—ADR | | | 104,452 | | | | 3,379,022 | |
Commerzbank AG—ADR | | | 35,811 | | | | 392,489 | |
Credit Agricole SA—ADR | | | 25,791 | | | | 161,710 | |
Erste Group Bank AG—ADR | | | 7,477 | | | | 133,091 | |
First Citizens BancShares, Inc.(b) | | | 133 | | | | 180,933 | |
FNB Corp/PA | | | 5,793 | | | | 67,373 | |
Grupo Financiero Banorte SAB de CV—ADR | | | 790 | | | | 33,536 | |
HDFC Bank Ltd.—ADR | | | 7,756 | | | | 483,276 | |
HSBC Holdings PLC—ADR | | | 107,296 | | | | 4,004,286 | |
Huntington Bancshares, Inc. | | | 4,280 | | | | 47,465 | |
ICICI Bank Ltd.—ADR | | | 3,229 | | | | 74,816 | |
ING Groep NV—ADR | | | 302,479 | | | | 4,280,077 | |
Intesa Sanpaolo SpA—ADR | | | 22,808 | | | | 367,551 | |
JPMorgan Chase & Co. | | | 24,285 | | | | 3,553,624 | |
Lloyds Banking Group PLC—ADR | | | 42,779 | | | | 89,836 | |
Mediobanca Banca di Credito Finanziario SpA—ADR(b) | | | 68,077 | | | | 887,043 | |
Mitsubishi UFJ Financial Group, Inc.—ADR | | | 142,197 | | | | 1,127,622 | |
NatWest Group PLC—ADR(a) | | | 5,281 | | | | 31,105 | |
The accompanying notes are an integral part of these financial statements.
52
PMC DIVERSIFIED EQUITY FUND | Schedule of Investments |
August 31, 2023 (Continued)
| | | | | | | | |
| | |
| | | Shares
| | | Value
| |
New York Community Bancorp, Inc.(b) | | | 4,108 | | | $ | 50,446 | |
OFG Bancorp | | | 7,117 | | | | 214,649 | |
Piraeus Financial Holdings SA—ADR | | | 63,772 | | | | 215,007 | |
S&T Bancorp, Inc. | | | 403 | | | | 11,417 | |
Sberbank of Russia PJSC—ADR(a)(e) | | | 119,989 | | | | — | |
Shinhan Financial Group Co. Ltd.—ADR | | | 10,524 | | | | 283,096 | |
Societe Generale SA—ADR | | | 11,304 | | | | 64,659 | |
Standard Chartered PLC—ADR | | | 20,287 | | | | 365,369 | |
Sumitomo Mitsui Financial Group, Inc.—ADR | | | 154,068 | | | | 1,402,019 | |
Swedbank AB—ADR | | | 29,506 | | | | 521,076 | |
Texas Capital Bancshares, Inc.(a) | | | 238 | | | | 14,861 | |
Turkiye Garanti Bankasi AS—ADR | | | 268,605 | | | | 530,495 | |
UniCredit SpA—ADR(b) | | | 30,777 | | | | 375,172 | |
Woori Financial Group, Inc.—ADR | | | 1,916 | | | | 51,157 | |
| | | | | | |
|
|
|
| | | | | | | | 34,119,360 | |
| | | | | | |
|
|
|
Capital Goods—6.39% | | | | | | | | |
AAR Corp.(a) | | | 1,198 | | | | 73,797 | |
ACS Actividades de Construccion y Servicios SA—ADR | | | 215,445 | | | | 1,505,961 | |
AGCO Corp. | | | 1,101 | | | | 142,613 | |
Allison Transmission Holdings, Inc. | | | 6,587 | | | | 398,184 | |
American Woodmark Corp.(a) | | | 2,444 | | | | 189,825 | |
Apogee Enterprises, Inc. | | | 5,813 | | | | 293,324 | |
Applied Industrial Technologies, Inc. | | | 81 | | | | 12,504 | |
Ashtead Group PLC—ADR | | | 339 | | | | 95,974 | |
Astra International, Tbk PT—ADR | | | 22,191 | | | | 188,734 | |
Atkore, Inc.(a)(b) | | | 2,685 | | | | 413,409 | |
Atlas Copco AB—Class A—ADR | | | 11,621 | | | | 153,746 | |
BAE Systems PLC—ADR | | | 1,245 | | | | 64,454 | |
Balfour Beatty PLC—ADR | | | 56,705 | | | | 475,188 | |
Beacon Roofing Supply, Inc.(a) | | | 6,335 | | | | 505,850 | |
Bidvest Group Ltd.—ADR | | | 173 | | | | 5,266 | |
Boise Cascade Co. | | | 2,736 | | | | 299,236 | |
Bouygues SA—ADR(b) | | | 94,499 | | | | 648,263 | |
Builders FirstSource, Inc.(a) | | | 8,856 | | | | 1,284,474 | |
Caterpillar, Inc. | | | 2,941 | | | | 826,803 | |
Cie de Saint-Gobain SA—ADR | | | 102,950 | | | | 1,340,409 | |
Comfort Systems USA, Inc. | | | 1,476 | | | | 272,425 | |
Core & Main, Inc.(a)(b) | | | 4,113 | | | | 135,071 | |
Crane Co.(b) | | | 139 | | | | 12,666 | |
Cummins, Inc. | | | 6,913 | | | | 1,590,267 | |
Daimler Truck Holding AG—ADR(b) | | | 3,692 | | | | 65,090 | |
Deere & Co. | | | 105 | | | | 43,149 | |
EHang Holdings Ltd.—ADR(a) | | | 1,595 | | | | 31,469 | |
Embraer SA—ADR(a) | | | 763 | | | | 11,933 | |
EMCOR Group, Inc. | | | 5,105 | | | | 1,144,796 | |
Encore Wire Corp.(b) | | | 2,888 | | | | 475,971 | |
EnerSys | | | 1,523 | | | | 159,885 | |
Ferguson PLC | | | 333 | | | | 53,799 | |
General Electric Co. | | | 19,304 | | | �� | 2,209,536 | |
Gibraltar Industries, Inc.(a) | | | 2,040 | | | | 153,061 | |
GMS, Inc.(a)(b) | | | 7,673 | | | | 532,046 | |
Granite Construction, Inc. | | | 284 | | | | 11,726 | |
Hitachi Ltd.—ADR | | | 17,637 | | | | 2,346,426 | |
Hubbell, Inc. | | | 4,212 | | | | 1,373,323 | |
The accompanying notes are an integral part of these financial statements.
53
PMC DIVERSIFIED EQUITY FUND | Schedule of Investments |
August 31, 2023 (Continued)
| | | | | | | | |
| | |
| | | Shares
| | | Value
| |
ITOCHU Corp.—ADR | | | 34,187 | | | $ | 2,564,709 | |
JGC Holdings Corp.—ADR | | | 15,754 | | | | 410,707 | |
Kawasaki Heavy Industries Ltd.—ADR | | | 59,772 | | | | 616,847 | |
Keppel Corp Ltd.—ADR | | | 48,093 | | | | 493,242 | |
Kingspan Group PLC—ADR | | | 536 | | | | 45,485 | |
KOC Holding AS—ADR | | | 8,243 | | | | 213,082 | |
Komatsu Ltd.—ADR | | | 43,010 | | | | 1,227,075 | |
Leonardo SpA—ADR | | | 94,753 | | | | 682,696 | |
Marubeni Corp.—ADR | | | 10,758 | | | | 1,761,085 | |
Masco Corp. | | | 764 | | | | 45,084 | |
Mitsubishi Electric Corp.—ADR | | | 3,176 | | | | 82,385 | |
Mitsui & Co. Ltd.—ADR(b) | | | 3,305 | | | | 2,463,844 | |
Mueller Industries, Inc.(b) | | | 8,401 | | | | 648,221 | |
NSK Ltd.—ADR | | | 5,408 | | | | 62,544 | |
Owens Corning | | | 6,134 | | | | 882,744 | |
PACCAR, Inc. | | | 35,590 | | | | 2,928,701 | |
Prysmian SpA—ADR | | | 99,107 | | | | 2,026,738 | |
Quanex Building Products Corp. | | | 9,874 | | | | 266,401 | |
Rexel SA—ADR | | | 60,759 | | | | 1,429,355 | |
Rheinmetall AG—ADR(b) | | | 12,493 | | | | 679,494 | |
Rolls-Royce Holdings PLC—ADR(a) | | | 198,355 | | | | 551,427 | |
Rush Enterprises, Inc.—Class A(b) | | | 16,178 | | | | 669,910 | |
Rush Enterprises, Inc.—Class B | | | 3,311 | | | | 152,184 | |
Schneider Electric SE—ADR | | | 10,654 | | | | 365,752 | |
Siemens AG—ADR | | | 19,768 | | | | 1,485,368 | |
Skanska AB—ADR | | | 2,165 | | | | 31,869 | |
SKF AB—ADR | | | 1,897 | | | | 31,111 | |
Snap-on, Inc. | | | 16,224 | | | | 4,357,765 | |
Standex International Corp. | | | 82 | | | | 12,598 | |
Sumitomo Corp.—ADR | | | 88,066 | | | | 1,803,592 | |
Terex Corp. | | | 7,241 | | | | 438,877 | |
Textron, Inc. | | | 637 | | | | 49,501 | |
Thermon Group Holdings, Inc.(a) | | | 10,672 | | | | 293,267 | |
Timken Co. | | | 6,892 | | | | 526,687 | |
Trane Technologies PLC | | | 248 | | | | 50,904 | |
Travis Perkins PLC—ADR | | | 17,443 | | | | 189,169 | |
UFP Industries, Inc. | | | 8,145 | | | | 849,931 | |
United Rentals, Inc. | | | 4,402 | | | | 2,097,729 | |
Vinci SA—ADR | | | 33,947 | | | | 945,424 | |
Volvo AB—ADR | | | 1,949 | | | | 39,175 | |
Wabash National Corp.(b) | | | 10,648 | | | | 240,112 | |
WESCO International, Inc. | | | 297 | | | | 48,069 | |
Westinghouse Air Brake Technologies Corp. | | | 2,962 | | | | 333,284 | |
WW Grainger, Inc. | | | 1,397 | | | | 997,654 | |
| | | | | | |
|
|
|
| | | | | | | | 55,632,451 | |
| | | | | | |
|
|
|
Commercial & Professional Services—0.47% | | | | | | | | |
Brady Corp.—Class A | | | 238 | | | | 12,005 | |
Brambles Ltd.—ADR | | | 28,033 | | | | 541,878 | |
Clean Harbors, Inc.(a) | | | 87 | | | | 14,733 | |
Copart, Inc.(a) | | | 970 | | | | 43,485 | |
Dai Nippon Printing Co. Ltd.—ADR | | | 12,176 | | | | 165,350 | |
HeadHunter Group PLC—ADR(a)(e) | | | 3,254 | | | | — | |
Mitie Group PLC—ADR | | | 68,415 | | | | 340,365 | |
Randstad NV—ADR | | | 57,474 | | | | 1,690,885 | |
The accompanying notes are an integral part of these financial statements.
54
PMC DIVERSIFIED EQUITY FUND | Schedule of Investments |
August 31, 2023 (Continued)
| | | | | | | | |
| | |
| | | Shares
| | | Value
| |
Science Applications International Corp. | | | 3,730 | | | $ | 438,872 | |
TOPPAN, Inc.—ADR | | | 67,798 | | | | 818,321 | |
| | | | | | |
|
|
|
| | | | | | | | 4,065,894 | |
| | | | | | |
|
|
|
Consumer Discretionary Distribution & Retail—2.28% | | | | | | | | |
Abercrombie & Fitch Co.—Class A(a)(b) | | | 1,687 | | | | 90,676 | |
Academy Sports & Outdoors, Inc.(b) | | | 7,305 | | | | 398,634 | |
Alibaba Group Holding Ltd.—ADR(a) | | | 18,497 | | | | 1,718,370 | |
Arhaus, Inc.(a)(b) | | | 14,148 | | | | 140,065 | |
Asbury Automotive Group, Inc.(a)(b) | | | 2,175 | | | | 500,250 | |
AutoNation, Inc.(a)(b) | | | 3,684 | | | | 578,720 | |
B&M European Value Retail SA—ADR | | | 4,127 | | | | 120,550 | |
Baozun, Inc.—ADR(a)(b) | | | 46,449 | | | | 181,616 | |
Best Buy Co., Inc. | | | 4,325 | | | | 330,646 | |
Brilliant Earth Group, Inc.(a) | | | 6,360 | | | | 21,497 | |
Buckle, Inc.(b) | | | 6,746 | | | | 246,499 | |
Caleres, Inc.(b) | | | 6,305 | | | | 180,764 | |
Carvana Co.(a)(b) | | | 1,304 | | | | 65,656 | |
Dick’s Sporting Goods, Inc.(b) | | | 2,886 | | | | 335,757 | |
Dillard’s, Inc.—Class A(b) | | | 367 | | | | 126,659 | |
D-MARKET Elektronik Hizmetler ve Ticaret AS—ADR(a) | | | 17,764 | | | | 25,758 | |
Dufry AG—ADR(a) | | | 106,288 | | | | 466,604 | |
Foot Locker, Inc. | | | 1,333 | | | | 26,153 | |
Genuine Parts Co. | | | 7,898 | | | | 1,214,159 | |
Group 1 Automotive, Inc.(b) | | | 2,124 | | | | 561,628 | |
Guess?, Inc.(b) | | | 7,320 | | | | 176,119 | |
Industria de Diseno Textil SA—ADR | | | 87,910 | | | | 1,681,718 | |
JD.com, Inc.—ADR | | | 8,863 | | | | 294,340 | |
Kingfisher PLC—ADR | | | 82,040 | | | | 490,599 | |
LKQ Corp. | | | 19,739 | | | | 1,036,890 | |
Lojas Renner SA—ADR(b) | | | 3,675 | | | | 11,981 | |
Lowe’s Companies, Inc. | | | 1,416 | | | | 326,360 | |
MINISO Group Holding Ltd.—ADR(a) | | | 15,214 | | | | 394,043 | |
Murphy USA, Inc.(b) | | | 866 | | | | 275,076 | |
Naspers Ltd.—ADR | | | 5,365 | | | | 181,820 | |
Nitori Holdings Co. Ltd.—ADR | | | 15,249 | | | | 167,739 | |
ODP Corp.(a) | | | 2,737 | | | | 134,989 | |
O’Reilly Automotive, Inc.(a) | | | 1,005 | | | | 944,399 | |
PDD Holdings, Inc.—ADR(a) | | | 10,413 | | | | 1,030,574 | |
Penske Automotive Group, Inc.(b) | | | 4,013 | | | | 659,336 | |
Ross Stores, Inc. | | | 3,780 | | | | 460,442 | |
Signet Jewelers Ltd. | | | 2,529 | | | | 189,675 | |
TJX Cos., Inc. | | | 20,668 | | | | 1,911,378 | |
Ulta Beauty, Inc.(a) | | | 1,942 | | | | 805,988 | |
Upbound Group, Inc.(b) | | | 1,555 | | | | 47,614 | |
Urban Outfitters, Inc.(a) | | | 6,451 | | | | 214,238 | |
Vibra Energia SA—ADR | | | 18,341 | | | | 132,972 | |
Vipshop Holdings Ltd.—ADR(a) | | | 40,502 | | | | 639,527 | |
Williams-Sonoma, Inc.(b) | | | 687 | | | | 97,004 | |
Woolworths Holdings Ltd. | | | 60,746 | | | | 239,036 | |
| | | | | | |
|
|
|
| | | | | | | | 19,874,518 | |
| | | | | | |
|
|
|
Consumer Durables & Apparel—3.78% | | | | | | | | |
Barratt Developments PLC—ADR(b) | | | 51,499 | | | | 591,724 | |
Burberry Group PLC—ADR | | | 40,060 | | | | 1,124,084 | |
The accompanying notes are an integral part of these financial statements.
55
PMC DIVERSIFIED EQUITY FUND | Schedule of Investments |
August 31, 2023 (Continued)
| | | | | | | | |
| | |
| | | Shares
| | | Value
| |
Cavco Industries, Inc.(a) | | | 126 | | | $ | 35,220 | |
Cie Financiere Richemont SA—ADR | | | 81,011 | | | | 1,145,496 | |
Crocs, Inc.(a) | | | 886 | | | | 86,243 | |
DR Horton, Inc. | | | 31,924 | | | | 3,799,594 | |
Dream Finders Homes, Inc.(a)(b) | | | 3,607 | | | | 103,954 | |
Haier Smart Home Co. Ltd.—ADR | | | 8,255 | | | | 102,279 | |
Hermes International SCA—ADR(b) | | | 6,247 | | | | 1,287,881 | |
KB Home | | | 9,055 | | | | 459,994 | |
La-Z-Boy, Inc.(b) | | | 10,221 | | | | 315,318 | |
Lennar Corp.—Class A | | | 30,550 | | | | 3,638,200 | |
Lennar Corp.—Class B(b) | | | 23,633 | | | | 2,520,696 | |
LVMH Moet Hennessy Louis Vuitton SE—ADR | | | 21,454 | | | | 3,631,732 | |
MDC Holdings, Inc.(b) | | | 3,747 | | | | 177,795 | |
Meritage Homes Corp. | | | 4,173 | | | | 580,214 | |
NVR, Inc.(a) | | | 313 | | | | 1,996,104 | |
Oxford Industries, Inc.(b) | | | 2,921 | | | | 294,992 | |
Panasonic Holdings Corp.—ADR | | | 54,659 | | | | 630,765 | |
Pandora A/S—ADR | | | 11,189 | | | | 289,124 | |
PRADA SpA—ADR | | | 23,923 | | | | 313,272 | |
PulteGroup, Inc. | | | 57,538 | | | | 4,721,568 | |
PVH Corp. | | | 2,815 | | | | 235,334 | |
Ralph Lauren Corp. | | | 2,180 | | | | 254,253 | |
Sega Sammy Holdings, Inc.—ADR | | | 84,565 | | | | 421,979 | |
Sekisui House Ltd.—ADR | | | 29,278 | | | | 597,857 | |
Skechers U.S.A., Inc.—Class A(a) | | | 4,422 | | | | 222,471 | |
Skyline Champion Corp.(a)(b) | | | 2,941 | | | | 209,605 | |
Swatch Group AG—ADR | | | 66,884 | | | | 936,376 | |
Tapestry, Inc.(b) | | | 10,833 | | | | 360,956 | |
Taylor Morrison Home Corp.(a) | | | 13,043 | | | | 618,238 | |
Toll Brothers, Inc. | | | 9,651 | | | | 790,706 | |
Tri Pointe Homes, Inc (a) | | | 11,128 | | | | 346,081 | |
Yue Yuen Industrial Holdings Ltd.—ADR | | | 18,258 | | | | 116,030 | |
| | | | | | |
|
|
|
| | | | | | | | 32,956,135 | |
| | | | | | |
|
|
|
Consumer Services—1.08% | | | | | | | | |
Adtalem Global Education, Inc.(a) | | | 7,715 | | | | 338,303 | |
Booking Holdings, Inc.(a) | | | 245 | | | | 760,732 | |
Caesars Entertainment, Inc.(a) | | | 11,293 | | | | 624,051 | |
Carnival Corp.(a) | | | 45,020 | | | | 712,216 | |
Carnival PLC—ADR(a) | | | 28,635 | | | | 409,481 | |
Chegg, Inc.(a) | | | 1,237 | | | | 12,630 | |
Darden Restaurants, Inc. | | | 9,730 | | | | 1,513,112 | |
DraftKings, Inc.(a) | | | 3,215 | | | | 95,325 | |
Evolution AB—ADR | | | 3,403 | | | | 367,524 | |
Flutter Entertainment PLC—ADR(a) | | | 4,368 | | | | 396,134 | |
Gaotu Techedu, Inc.—ADR(a) | | | 53,482 | | | | 154,028 | |
Luckin Coffee, Inc.—ADR(a) | | | 11,648 | | | | 380,307 | |
Meituan—ADR(a) | | | 3,030 | | | | 100,626 | |
Melco Resorts & Entertainment Ltd.—ADR(a) | | | 2,907 | | | | 32,617 | |
MGM Resorts International(b) | | | 16,163 | | | | 710,849 | |
New Oriental Education & Technology Group, Inc.—ADR(a) | | | 8,369 | | | | 453,934 | |
OPAP SA—ADR | | | 17,498 | | | | 145,583 | |
Pearson PLC—ADR | | | 2,972 | | | | 31,414 | |
Royal Caribbean Cruises Ltd.(a) | | | 6,585 | | | | 651,520 | |
Sodexo SA—ADR | | | 33,242 | | | | 716,365 | |
The accompanying notes are an integral part of these financial statements.
56
PMC DIVERSIFIED EQUITY FUND | Schedule of Investments |
August 31, 2023 (Continued)
| | | | | | | | |
| | |
| | | Shares
| | | Value
| |
Stride, Inc.(a) | | | 1,963 | | | $ | 83,408 | |
TAL Education Group—ADR(a) | | | 37,405 | | | | 263,705 | |
Trip.com Group Ltd.—ADR(a) | | | 8,944 | | | | 351,589 | |
Tuniu Corp.—ADR(a) | | | 64,696 | | | | 83,458 | |
| | | | | | |
|
|
|
| | | | | | | | 9,388,911 | |
| | | | | | |
|
|
|
Consumer Staples Distribution & Retail—1.54% | | | | | | | | |
111, Inc.—ADR(a) | | | 2,350 | | | | 5,969 | |
Andersons, Inc. | | | 3,980 | | | | 204,413 | |
Casey’s General Stores, Inc. | | | 1,556 | | | | 380,302 | |
J Sainsbury PLC—ADR | | | 52,105 | | | | 718,007 | |
Jeronimo Martins SGPS SA—ADR(b) | | | 15,899 | | | | 806,800 | |
Koninklijke Ahold Delhaize NV—ADR | | | 78,182 | | | | 2,556,551 | |
Kroger Co. | | | 21,972 | | | | 1,019,281 | |
Marks & Spencer Group PLC—ADR(a) | | | 471,805 | | | | 2,734,110 | |
Performance Food Group Co.(a)(b) | | | 6,341 | | | | 393,966 | |
PriceSmart, Inc. | | | 163 | | | | 12,955 | |
Seven & i Holdings Co. Ltd.—ADR | | | 50,146 | | | | 1,027,492 | |
Sprouts Farmers Market, Inc.(a)(b) | | | 6,813 | | | | 277,902 | |
Tesco PLC—ADR | | | 3,616 | | | | 36,305 | |
US Foods Holding Corp.(a) | | | 725 | | | | 29,312 | |
Walmart, Inc. | | | 19,793 | | | | 3,218,539 | |
Weis Markets, Inc. | | | 152 | | | | 9,860 | |
| | | | | | |
|
|
|
| | | | | | | | 13,431,764 | |
| | | | | | |
|
|
|
Energy—2.54% | | | | | | | | |
BP PLC—ADR | | | 90,256 | | | | 3,355,718 | |
Chesapeake Energy Corp.(b) | | | 4,484 | | | | 395,534 | |
Chevron Corp. | | | 275 | | | | 44,303 | |
Chord Energy Corp. | | | 2,127 | | | | 343,511 | |
Civitas Resources, Inc.(b) | | | 6,837 | | | | 562,138 | |
CNX Resources Corp.(a) | | | 11,877 | | | | 265,451 | |
ConocoPhillips | | | 7,231 | | | | 860,706 | |
Eni SpA—ADR | | | 65,120 | | | | 2,016,115 | |
Equinor ASA—ADR(b) | | | 1,013 | | | | 30,967 | |
Exxon Mobil Corp. | | | 52,470 | | | | 5,834,139 | |
Galp Energia SGPS SA—ADR | | | 6,487 | | | | 44,306 | |
Gazprom Neft PJSC—ADR(a)(e) | | | 6,793 | | | | — | |
Gazprom PJSC—ADR(a)(e) | | | 186,205 | | | | — | |
HF Sinclair Corp. | | | 8,351 | | | | 460,057 | |
Inpex Corp.—ADR | | | 4,779 | | | | 66,619 | |
International Seaways, Inc. | | | 6,478 | | | | 278,360 | |
Liberty Energy, Inc. | | | 2,482 | | | | 39,588 | |
LUKOIL PJSC—ADR(a)(e) | | | 10,626 | | | | — | |
Marathon Petroleum Corp. | | | 12,381 | | | | 1,767,635 | |
PBF Energy, Inc.—Class A | | | 9,689 | | | | 454,317 | |
Peabody Energy Corp.(b) | | | 7,913 | | | | 170,763 | |
Petroleo Brasileiro SA—ADR | | | 18,050 | | | | 253,603 | |
Phillips 66 | | | 2,163 | | | | 246,928 | |
Range Resources Corp. | | | 636 | | | | 20,594 | |
Repsol SA—ADR | | | 5,946 | | | | 91,628 | |
RPC, Inc.(b) | | | 1,899 | | | | 15,173 | |
Shell PLC—ADR(b) | | | 18,443 | | | | 1,145,126 | |
Southwestern Energy Co.(a) | | | 5,426 | | | | 36,788 | |
Surgutneftegas PJSC—ADR(a)(e) | | | 15,549 | | | | — | |
The accompanying notes are an integral part of these financial statements.
57
PMC DIVERSIFIED EQUITY FUND | Schedule of Investments |
August 31, 2023 (Continued)
| | | | | | | | |
| | |
| | | Shares
| | | Value
| |
Tenaris SA—ADR | | | 68,644 | | | $ | 2,191,803 | |
Valero Energy Corp. | | | 4,546 | | | | 590,525 | |
Vista Energy SAB de CV—ADR(a) | | | 9,679 | | | | 259,397 | |
YPF SA—ADR(a) | | | 17,435 | | | | 251,761 | |
| | | | | | |
|
|
|
| | | | | | | | 22,093,553 | |
| | | | | | |
|
|
|
Financial Services—4.11% | | | | | | | | |
3i Group PLC—ADR(b) | | | 185,054 | | | | 2,344,633 | |
Adyen NV—ADR(a) | | | 1,600 | | | | 13,328 | |
Affiliated Managers Group, Inc. | | | 5,207 | | | | 697,790 | |
Affirm Holdings, Inc.(a)(b) | | | 901 | | | | 18,750 | |
Ameriprise Financial, Inc. | | | 3,116 | | | | 1,051,899 | |
AMTD IDEA Group—ADR(a)(b) | | | 59,136 | | | | 72,146 | |
Avantax, Inc.(a) | | | 513 | | | | 10,732 | |
Berkshire Hathaway, Inc.—Class A(a) | | | 3 | | | | 1,640,175 | |
Berkshire Hathaway, Inc.—Class B(a) | | | 10,542 | | | | 3,797,228 | |
Capital One Financial Corp. | | | 5,733 | | | | 587,002 | |
Coinbase Global, Inc.(a)(b) | | | 538 | | | | 42,825 | |
Deutsche Bank AG | | | 173,652 | | | | 1,891,069 | |
Discover Financial Services | | | 15,942 | | | | 1,435,895 | |
Enact Holdings, Inc. | | | 13,646 | | | | 391,094 | |
Essent Group Ltd. | | | 14,343 | | | | 720,305 | |
Euronet Worldwide, Inc.(a) | | | 891 | | | | 77,838 | |
Evercore, Inc.—Class A(b) | | | 1,887 | | | | 264,274 | |
Federated Hermes, Inc. | | | 322 | | | | 11,193 | |
FinVolution Group—ADR | | | 92,437 | | | | 464,034 | |
FirstCash Holdings, Inc. | | | 3,860 | | | | 344,775 | |
Fiserv, Inc.(a) | | | 24,752 | | | | 3,004,645 | |
FleetCor Technologies, Inc.(a) | | | 175 | | | | 47,553 | |
Franklin Resources, Inc.(b) | | | 54,748 | | | | 1,463,962 | |
Futu Holdings Ltd.—ADR(a)(b) | | | 5,788 | | | | 344,965 | |
Interactive Brokers Group, Inc.(b) | | | 524 | | | | 47,726 | |
Invesco Ltd. | | | 39,666 | | | | 631,483 | |
Jackson Financial, Inc. | | | 13,093 | | | | 492,297 | |
Janus Henderson Group PLC | | | 9,835 | | | | 270,167 | |
Jefferies Financial Group, Inc. | | | 27,043 | | | | 965,165 | |
Jiayin Group, Inc.—ADR | | | 31,913 | | | | 176,160 | |
Julius Baer Group Ltd.—ADR | | | 12,535 | | | | 173,234 | |
LexinFintech Holdings Ltd.—ADR(a) | | | 83,525 | | | | 216,330 | |
LPL Financial Holdings, Inc.(b) | | | 861 | | | | 198,538 | |
MasterCard, Inc.—Class A | | | 5,252 | | | | 2,167,185 | |
MGIC Investment Corp. | | | 48,927 | | | | 860,137 | |
Mr Cooper Group, Inc.(a) | | | 8,407 | | | | 476,341 | |
Navient Corp. | | | 9,106 | | | | 160,721 | |
Nelnet, Inc.—Class A | | | 5,550 | | | | 509,768 | |
Noah Holdings Ltd.—ADR | | | 2,133 | | | | 29,670 | |
OneMain Holdings, Inc.(b) | | | 8,540 | | | | 354,495 | |
ORIX Corp.—ADR | | | 3,021 | | | | 280,651 | |
PennyMac Financial Services, Inc.(b) | | | 11,961 | | | | 858,441 | |
PROG Holdings, Inc.(a)(b) | | | 16,394 | | | | 562,314 | |
Qifu Technology, Inc.—ADR | | | 23,036 | | | | 391,612 | |
QIWI PLC—ADR(a)(e) | | | 29,317 | | | | — | |
Qudian, Inc.—ADR(a) | | | 40,642 | | | | 102,418 | |
Radian Group, Inc.(b) | | | 22,857 | | | | 618,968 | |
Rocket Cos, Inc.—Class A(a) | | | 1,493 | | | | 15,945 | |
The accompanying notes are an integral part of these financial statements.
58
PMC DIVERSIFIED EQUITY FUND | Schedule of Investments |
August 31, 2023 (Continued)
| | | | | | | | |
| | |
| | | Shares
| | | Value
| |
Shift4 Payments, Inc.(a)(b) | | | 2,701 | | | $ | 153,390 | |
State Street Corp. | | | 12,140 | | | | 834,504 | |
Synchrony Financial(b) | | | 28,163 | | | | 909,102 | |
Toast, Inc.(a) | | | 4,088 | | | | 90,631 | |
Up Fintech Holding Ltd.—ADR(a) | | | 2,858 | | | | 14,033 | |
Victory Capital Holdings, Inc.(b) | | | 1,166 | | | | 40,134 | |
Virtus Investment Partners, Inc. | | | 947 | | | | 196,124 | |
Visa, Inc.(b) | | | 8,628 | | | | 2,119,727 | |
Yiren Digital Ltd.—ADR(a) | | | 36,509 | | | | 98,209 | |
| | | | | | |
|
|
|
| | | | | | | | 35,753,730 | |
| | | | | | |
|
|
|
Food, Beverage & Tobacco—2.36% | | | | | | | | |
Ajinomoto Co., Inc.—ADR(b) | | | 13,376 | | | | 565,805 | |
Altria Group, Inc. | | | 50,662 | | | | 2,240,274 | |
Anheuser-Busch InBev SA/NV—ADR | | | 552 | | | | 31,403 | |
Archer-Daniels-Midland Co. | | | 23,431 | | | | 1,858,077 | |
Associated British Foods PLC—ADR | | | 3,371 | | | | 85,961 | |
British American Tobacco PLC—ADR | | | 37,208 | | | | 1,235,306 | |
Cal-Maine Foods, Inc.(b) | | | 7,020 | | | | 335,486 | |
Campbell Soup Co.(b) | | | 13,981 | | | | 583,008 | |
Coca-Cola Bottlers Japan Holdings, Inc.—ADR | | | 6,242 | | | | 39,013 | |
Coca-Cola Femsa SAB de CV—ADR | | | 6,729 | | | | 570,215 | |
Coca-Cola HBC AG—ADR | | | 1,719 | | | | 49,748 | |
Conagra Foods, Inc. | | | 18,527 | | | | 553,587 | |
Embotelladora Andina SA—Class B—ADR | | | 8,592 | | | | 128,536 | |
First Pacific Co. Ltd.—ADR | | | 241,208 | | | | 496,888 | |
Fomento Economico Mexicano SAB de CV—ADR | | | 377 | | | | 42,420 | |
General Mills, Inc. | | | 30,716 | | | | 2,078,244 | |
Heineken Holding NV—ADR(b) | | | 1,081 | | | | 43,748 | |
Hershey Co. | | | 180 | | | | 38,675 | |
Imperial Brands PLC—ADR | | | 1,351 | | | | 31,114 | |
Ingredion, Inc. | | | 4,440 | | | | 456,920 | |
Japan Tobacco, Inc.—ADR(b) | | | 359,628 | | | | 3,923,540 | |
JM Smucker Co. | | | 4,543 | | | | 658,508 | |
Lamb Weston Holdings, Inc. | | | 485 | | | | 47,244 | |
Marfrig Global Foods SA—ADR | | | 6,364 | | | | 9,864 | |
Molson Coors Brewing Co.—Class B(b) | | | 1,564 | | | | 99,298 | |
Mondelez International, Inc.—Class A | | | 584 | | | | 41,616 | |
PepsiCo, Inc. | | | 14,583 | | | | 2,594,608 | |
SLC Agricola SA—ADR | | | 3,418 | | | | 27,002 | |
Tiger Brands Ltd.—ADR | | | 4,063 | | | | 35,084 | |
Universal Corp. | | | 1,132 | | | | 53,906 | |
WH Group Ltd.—ADR | | | 434 | | | | 4,462 | |
Wilmar International Ltd.—ADR(b) | | | 57,977 | | | | 1,609,442 | |
| | | | | | |
|
|
|
| | | | | | | | 20,569,002 | |
| | | | | | |
|
|
|
Health Care Equipment & Services—3.38% | | | | | | | | |
Acadia Healthcare Co., Inc.(a) | | | 3,508 | | | | 270,467 | |
Accolade, Inc.(a) | | | 10,453 | | | | 141,011 | |
AMN Healthcare Services, Inc.(a)(b) | | | 2,701 | | | | 238,714 | |
Ansell Ltd.—ADR | | | 12,944 | | | | 789,390 | |
Avanos Medical, Inc.(a) | | | 6,483 | | | | 136,402 | |
Cardinal Health, Inc. | | | 11,771 | | | | 1,027,961 | |
Cencora, Inc.(b) | | | 232 | | | | 40,827 | |
Chemed Corp.(b) | | | 797 | | | | 407,618 | |
The accompanying notes are an integral part of these financial statements.
59
PMC DIVERSIFIED EQUITY FUND | Schedule of Investments |
August 31, 2023 (Continued)
| | | | | | | | |
| | |
| | | Shares
| | | Value
| |
Cigna Corp. | | | 6,774 | | | $ | 1,871,385 | |
Cochlear Ltd.—ADR | | | 368 | | | | 32,347 | |
CONMED Corp. | | | 2,514 | | | | 280,210 | |
ConvaTec Group PLC—ADR | | | 2,780 | | | | 32,971 | |
Elekta AB—ADR | | | 5,264 | | | | 37,348 | |
Elevance Health, Inc. | | | 4,225 | | | | 1,867,492 | |
Encompass Health Corp. | | | 7,810 | | | | 554,822 | |
Ensign Group, Inc. | | | 4,034 | | | | 404,287 | |
EssilorLuxottica SA—ADR(b) | | | 37,726 | | | | 3,559,826 | |
Fresenius Medical Care AG & Co. KGaA—ADR | | | 27,781 | | | | 665,633 | |
Globus Medical, Inc.(a)(b) | | | 1,539 | | | | 83,260 | |
GoodRx Holdings, Inc.(a) | | | 3,847 | | | | 25,121 | |
Haemonetics Corp.(a) | | | 4,608 | | | | 413,476 | |
HCA Healthcare, Inc. | | | 8,154 | | | | 2,261,104 | |
Henry Schein, Inc.(a) | | | 538 | | | | 41,179 | |
Hims & Hers Health, Inc.(a) | | | 36,715 | | | | 246,358 | |
Hologic, Inc.(a) | | | 16,706 | | | | 1,248,606 | |
Hoya Corp.—ADR | | | 289 | | | | 32,027 | |
Humana, Inc. | | | 2,639 | | | | 1,218,242 | |
ICU Medical, Inc.(a)(b) | | | 127 | | | | 18,419 | |
Innovage Holding Corp.(a) | | | 3,680 | | | | 20,166 | |
Inspire Medical Systems, Inc.(a) | | | 905 | | | | 205,326 | |
Integer Holdings Corp.(a) | | | 674 | | | | 57,499 | |
Intuitive Surgical, Inc.(a) | | | 409 | | | | 127,886 | |
Koninklijke Philips NV(a) | | | 2,211 | | | | 49,372 | |
Lantheus Holdings, Inc.(a) | | | 3,367 | | | | 230,437 | |
LifeStance Health Group, Inc.(a) | | | 9,054 | | | | 74,333 | |
McKesson Corp. | | | 2,907 | | | | 1,198,614 | |
Merit Medical Systems, Inc.(a) | | | 4,697 | | | | 306,620 | |
NeoGenomics, Inc.(a) | | | 8,955 | | | | 134,594 | |
Option Care Health, Inc.(a) | | | 1,667 | | | | 58,062 | |
Patterson Companies, Inc. | | | 5,737 | | | | 172,339 | |
Penumbra, Inc.(a) | | | 831 | | | | 219,800 | |
Progyny, Inc.(a) | | | 3,121 | | | | 116,538 | |
Quest Diagnostics, Inc. | | | 3,621 | | | | 476,162 | |
QuidelOrtho Corp.(a) | | | 903 | | | | 74,371 | |
Schrodinger, Inc.(a) | | | 2,845 | | | | 104,952 | |
Select Medical Holdings Corp. | | | 4,649 | | | | 135,797 | |
Shockwave Medical, Inc.(a) | | | 880 | | | | 193,943 | |
Siemens Healthineers AG—ADR | | | 6,342 | | | | 158,864 | |
Sinopharm Group Co. Ltd.—ADR(b) | | | 23,765 | | | | 343,880 | |
Smith & Nephew PLC—ADR | | | 23,875 | | | | 643,193 | |
Sonic Healthcare Ltd.—ADR | | | 7,497 | | | | 155,488 | |
Straumann Holding AG—ADR | | | 5,254 | | | | 78,757 | |
Stryker Corp. | | | 586 | | | | 166,160 | |
Surgery Partners, Inc.(a) | | | 3,443 | | | | 124,843 | |
Tenet Healthcare Corp.(a) | | | 4,730 | | | | 366,859 | |
UnitedHealth Group, Inc. | | | 7,837 | | | | 3,734,958 | |
Universal Health Services, Inc.—Class B(b) | | | 2,633 | | | | 354,665 | |
Veradigm, Inc.(a) | | | 2,112 | | | | 28,259 | |
Zimmer Biomet Holdings, Inc. | | | 11,677 | | | | 1,390,965 | |
| | | | | | |
|
|
|
| | | | | | | | 29,450,205 | |
| | | | | | |
|
|
|
Household & Personal Products—0.54% | | | | | | | | |
Beiersdorf AG—ADR(b) | | | 13,550 | | | | 355,281 | |
The accompanying notes are an integral part of these financial statements.
60
PMC DIVERSIFIED EQUITY FUND | Schedule of Investments |
August 31, 2023 (Continued)
| | | | | | | | |
| | |
| | | Shares
| | | Value
| |
Haleon PLC—ADR | | | 106,130 | | | $ | 872,389 | |
L’Oreal SA—ADR | | | 11,528 | | | | 1,012,850 | |
Unilever PLC—ADR | | | 48,642 | | | | 2,481,715 | |
| | | | | | |
|
|
|
| | | | | | | | 4,722,235 | |
| | | | | | |
|
|
|
Insurance—3.08% | | | | | | | | |
Aflac, Inc.(b) | | | 64,388 | | | | 4,801,414 | |
Allianz SE—ADR | | | 15,396 | | | | 373,969 | |
Ambac Financial Group, Inc.(a) | | | 18,597 | | | | 239,529 | |
American Equity Invesment Life Holding Co.(a) | | | 5,252 | | | | 281,927 | |
American International Group, Inc. | | | 40,910 | | | | 2,394,053 | |
Arch Capital Group Ltd.(a) | | | 577 | | | | 44,348 | |
Assicurazioni Generali SpA—ADR(b) | | | 101,217 | | | | 1,044,559 | |
AXA SA—ADR | | | 105,118 | | | | 3,164,053 | |
BB Seguridade Participacoes SA—ADR | | | 42,074 | | | | 257,914 | |
Chubb Ltd. | | | 224 | | | | 44,995 | |
CNO Financial Group, Inc. | | | 9,156 | | | | 214,250 | |
Everest Group Ltd. | | | 4,342 | | | | 1,566,073 | |
Fanhua, Inc.—ADR(a) | | | 2,357 | | | | 15,815 | |
Genworth Financial, Inc.—Class A(a) | | | 57,405 | | | | 332,375 | |
Globe Life, Inc.(b) | | | 7,082 | | | | 790,139 | |
Hannover Rueck SE—ADR | | | 1,195 | | | | 127,507 | |
Hartford Financial Services Group, Inc. | | | 23,193 | | | | 1,665,721 | |
Loews Corp. | | | 20,312 | | | | 1,261,172 | |
Markel Group, Inc.(a) | | | 232 | | | | 343,109 | |
MS&AD Insurance Group Holdings, Inc.—ADR | | | 16,270 | | | | 291,558 | |
Muenchener Rueckversicherungs-Gesellschaft AG—ADR | | | 17,262 | | | | 669,938 | |
Old Republic International Corp. | | | 23,260 | | | | 636,161 | |
Oscar Health, Inc.(a) | | | 9,358 | | | | 58,675 | |
Ping An Insurance Group Co. of China Ltd.—ADR | | | 11,714 | | | | 140,334 | |
Principal Financial Group, Inc. | | | 35,169 | | | | 2,732,983 | |
RLI Corp.(b) | | | 1,173 | | | | 154,273 | |
Suncorp Group Ltd.—ADR(b) | | | 26,822 | | | | 227,451 | |
Tokio Marine Holdings, Inc.—ADR | | | 55,467 | | | | 1,219,719 | |
Unum Group | | | 11,681 | | | | 574,588 | |
Willis Towers Watson PLC | | | 5,453 | | | | 1,127,462 | |
| | | | | | |
|
|
|
| | | | | | | | 26,796,064 | |
| | | | | | |
|
|
|
Materials—2.72% | | | | | | | | |
Air Liquide SA—ADR | | | 7,171 | | | | 259,447 | |
Alpha Metallurgical Resources, Inc. | | | 1,427 | | | | 289,453 | |
APERAM SA(b) | | | 14,945 | | | | 425,933 | |
ArcelorMittal SA | | | 26,448 | | | | 703,781 | |
Arch Resources, Inc. | | | 1,039 | | | | 135,693 | |
Berry Global Group, Inc. | | | 202 | | | | 13,199 | |
BHP Group Ltd.—ADR | | | 68,922 | | | | 3,962,325 | |
Cemex SAB de CV—ADR(a) | | | 5,517 | | | | 43,970 | |
CF Industries Holdings, Inc. | | | 5,109 | | | | 393,751 | |
Commercial Metals Co. | | | 12,839 | | | | 722,707 | |
CRH PLC—ADR | | | 15,311 | | | | 881,454 | |
Dow, Inc. | | | 797 | | | | 43,484 | |
Fortescue Metals Group Ltd.—ADR | | | 19,501 | | | | 537,643 | |
Glencore PLC—ADR(b) | | | 56,643 | | | | 599,283 | |
Greif, Inc.—Class A(b) | | | 4,885 | | | | 354,601 | |
Greif, Inc.—Class B | | | 2,222 | | | | 165,606 | |
The accompanying notes are an integral part of these financial statements.
61
PMC DIVERSIFIED EQUITY FUND | Schedule of Investments |
August 31, 2023 (Continued)
| | | | | | | | |
| | |
| | | Shares
| | | Value
| |
Heidelberg Materials AG—ADR | | | 9,728 | | | $ | 156,524 | |
Holcim Ltd.—ADR | | | 65,168 | | | | 858,263 | |
Impala Platinum Holdings Ltd.—ADR | | | 4,430 | | | | 23,169 | |
International Paper Co. | | | 1,343 | | | | 46,898 | |
Johnson Matthey PLC—ADR | | | 4,075 | | | | 169,153 | |
K+S AG—ADR | | | 29,486 | | | | 276,431 | |
Koppers Holdings, Inc. | | | 346 | | | | 13,248 | |
Kuraray Co. Ltd.—ADR | | | 8,148 | | | | 277,888 | |
LyondellBasell Industries NV—Class A | | | 524 | | | | 51,755 | |
Mechel PJSC—ADR(a)(e) | | | 59,509 | | | | — | |
Mosaic Co. | | | 6,446 | | | | 250,427 | |
Nippon Steel Corp.—ADR(b) | | | 175,863 | | | | 1,387,559 | |
Nitto Denko Corp.—ADR | | | 939 | | | | 31,982 | |
Norsk Hydro ASA—ADR | | | 137,353 | | | | 766,430 | |
Nucor Corp. | | | 9,460 | | | | 1,628,066 | |
O-I Glass, Inc.(a) | | | 575 | | | | 11,420 | |
Olin Corp. | | | 189 | | | | 10,966 | |
Packaging Corp. of America(b) | | | 314 | | | | 46,817 | |
POSCO Holdings, Inc.—ADR | | | 1,888 | | | | 207,227 | |
Reliance Steel & Aluminum Co. | | | 4,869 | | | | 1,387,470 | |
Sappi Ltd.—ADR | | | 27,439 | | | | 58,994 | |
Sasol Ltd.—ADR | | | 386 | | | | 4,976 | |
Shin-Etsu Chemical Co. Ltd.—ADR | | | 14,318 | | | | 227,799 | |
South32 Ltd.—ADR(b) | | | 68,410 | | | | 750,458 | |
Steel Dynamics, Inc. | | | 9,293 | | | | 990,541 | |
Suzano SA—ADR(b) | | | 608 | | | | 6,153 | |
Ternium SA—ADR | | | 7,320 | | | | 305,830 | |
thyssenkrupp AG—ADR | | | 28,604 | | | | 220,251 | |
Vale SA—ADR(b) | | | 45,791 | | | | 603,067 | |
Warrior Met Coal, Inc. | | | 6,058 | | | | 239,654 | |
Westlake Corp.(b) | | | 4,416 | | | | 578,408 | |
Wienerberger AG—ADR | | | 179,410 | | | | 1,004,696 | |
Yara International ASA—ADR | | | 84,414 | | | | 1,540,556 | |
| | | | | | |
|
|
|
| | | | | | | | 23,665,406 | |
| | | | | | |
|
|
|
Media & Entertainment—4.49% | | | | | | | | |
Alphabet, Inc.—Class A(a) | | | 19,302 | | | | 2,628,353 | |
Alphabet, Inc.—Class C(a) | | | 15,594 | | | | 2,141,836 | |
Altice USA, Inc.—Class A(a) | | | 6,453 | | | | 19,811 | |
Autohome, Inc.—ADR | | | 7,648 | | | | 221,027 | |
Baidu, Inc.—ADR(a) | | | 1,392 | | | | 198,819 | |
Cargurus, Inc.(a) | | | 13,198 | | | | 239,016 | |
Cars.com, Inc.(a) | | | 11,054 | | | | 206,599 | |
Comcast Corp.—Class A | | | 65,555 | | | | 3,065,352 | |
Criteo SA—ADR(a) | | | 8,504 | | | | 250,825 | |
DouYu International Holdings Ltd.—ADR(a) | | | 158,606 | | | | 161,778 | |
Electronic Arts, Inc. | | | 333 | | | | 39,953 | |
Eutelsat Communications SA—ADR(b) | | | 236,006 | | | | 358,729 | |
Fox Corp.—Class A | | | 78,136 | | | | 2,583,176 | |
Fox Corp.—Class B | | | 82,455 | | | | 2,516,527 | |
Gravity Co. Ltd.—ADR(a) | | | 2,975 | | | | 222,560 | |
Hello Group, Inc.—ADR | | | 44,499 | | | | 384,026 | |
HUYA, Inc.—ADR(a) | | | 52,385 | | | | 140,392 | |
Informa PLC—ADR | | | 7,199 | | | | 133,613 | |
Integral Ad Science Holding Corp.(a) | | | 6,438 | | | | 91,870 | |
The accompanying notes are an integral part of these financial statements.
62
PMC DIVERSIFIED EQUITY FUND | Schedule of Investments |
August 31, 2023 (Continued)
| | | | | | | | |
| | |
| | | Shares
| | | Value
| |
Interpublic Group of Companies, Inc.(b) | | | 56,779 | | | $ | 1,851,563 | |
iQIYI, Inc.—ADR(a) | | | 11,118 | | | | 56,035 | |
ITV PLC—ADR | | | 29,049 | | | | 262,603 | |
JOYY, Inc.—ADR | | | 12,322 | | | | 422,891 | |
Liberty Media Corp-Liberty Live(a) | | | 1 | | | | 17 | |
Meta Platforms, Inc.—Class A(a) | | | 19,468 | | | | 5,760,388 | |
NetEase, Inc.—ADR | | | 1,115 | | | | 115,380 | |
Netflix, Inc.(a) | | | 1,915 | | | | 830,496 | |
New York Times Co.—Class A | | | 1,351 | | | | 59,809 | |
News Corp.—Class A | | | 120,572 | | | | 2,591,092 | |
News Corp.—Class B(b) | | | 70,589 | | | | 1,552,958 | |
Nexstar Media Group, Inc.—Class A(b) | | | 4,869 | | | | 792,673 | |
Omnicom Group, Inc. | | | 26,701 | | | | 2,163,048 | |
Paramount Global—Class A(b) | | | 6,256 | | | | 114,860 | |
Paramount Global—Class B(b) | | | 11,699 | | | | 176,538 | |
Pinterest, Inc.(a) | | | 17,846 | | | | 490,587 | |
Publicis Groupe SA—ADR | | | 83,989 | | | | 1,635,266 | |
Scholastic Corp. | | | 6,720 | | | | 291,984 | |
Sciplay Corp.—Class A(a) | | | 21,763 | | | | 494,020 | |
Sea Ltd.—ADR(a) | | | 1,020 | | | | 38,383 | |
Sinclair, Inc.(b) | | | 4,700 | | | | 59,314 | |
Sirius XM Holdings, Inc.(b) | | | 118,064 | | | | 519,482 | |
So-Young International, Inc.—ADR(a) | | | 29,455 | | | | 42,415 | |
Tencent Holdings Ltd.—ADR | | | 48,685 | | | | 2,016,046 | |
Tencent Music Entertainment Group—ADR(a) | | | 14,186 | | | | 96,749 | |
Trade Desk, Inc.—Class A(a)(b) | | | 4,841 | | | | 387,425 | |
Trivago NV—ADR(a) | | | 97,320 | | | | 111,918 | |
WPP PLC—ADR | | | 649 | | | | 31,412 | |
Yalla Group Ltd.—ADR(a)(b) | | | 58,329 | | | | 298,644 | |
Yelp, Inc.(a) | | | 3,441 | | | | 147,447 | |
ZipRecruiter, Inc.(a) | | | 7,668 | | | | 116,477 | |
| | | | | | |
|
|
|
| | | | | | | | 39,132,182 | |
| | | | | | |
|
|
|
Pharmaceuticals, Biotechnology & Life Sciences—6.12% | | | | | | | | |
10X Genomics, Inc.(a) | | | 957 | | | | 49,620 | |
Abcam PLC—ADR(a) | | | 7,813 | | | | 176,730 | |
Amarin Corp. PLC—ADR(a)(b) | | | 153,775 | | | | 161,464 | |
Amneal Pharmaceuticals, Inc.(a) | | | 23,412 | | | | 95,755 | |
Astellas Pharma, Inc.—ADR | | | 7,109 | | | | 107,630 | |
AstraZeneca PLC—ADR | | | 51,885 | | | | 3,518,841 | |
Avadel Pharmaceuticals PLC—ADR(a) | | | 2,420 | | | | 32,694 | |
Bavarian Nordic A/S—ADR(a) | | | 27,666 | | | | 205,558 | |
Bayer AG—ADR | | | 55,470 | | | | 760,494 | |
BioNTech SE—ADR(a)(b) | | | 4,345 | | | | 525,441 | |
Bristol-Myers Squibb Co. | | | 45,093 | | | | 2,779,983 | |
Bruker Corp. | | | 2,824 | | | | 185,254 | |
Catalent, Inc.(a) | | | 1,833 | | | | 91,595 | |
Chugai Pharmaceutical Co. Ltd.—ADR | | | 9,932 | | | | 151,463 | |
CryoPort, Inc.(a) | | | 5,406 | | | | 76,225 | |
CSPC Pharmaceutical Group Ltd.—ADR | | | 53,162 | | | | 157,360 | |
Eli Lilly & Co. | | | 3,379 | | | | 1,872,642 | |
Exact Sciences Corp.(a)(b) | | | 3,633 | | | | 303,973 | |
Genfit SA—ADR(a)(b) | | | 38,338 | | | | 131,499 | |
Genmab A/S—ADR(a)(b) | | | 25,831 | | | | 989,069 | |
Gilead Sciences, Inc. | | | 52,520 | | | | 4,016,730 | |
The accompanying notes are an integral part of these financial statements.
63
PMC DIVERSIFIED EQUITY FUND | Schedule of Investments |
August 31, 2023 (Continued)
| | | | | | | | |
| | |
| | | Shares
| | | Value
| |
Gracell Biotechnologies, Inc.—ADR(a) | | | 4,746 | | | $ | 15,567 | |
Grifols SA—ADR(a) | | | 50,480 | | | | 478,046 | |
GSK PLC—ADR | | | 9,909 | | | | 348,103 | |
HUTCHMED China Ltd.—ADR(a) | | | 5,230 | | | | 78,555 | |
Hypera SA—ADR(b) | | | 8,624 | | | | 66,836 | |
Ipsen SA—ADR | | | 30,680 | | | | 992,498 | |
Kiniksa Pharmaceuticals Ltd.(a) | | | 31,661 | | | | 545,519 | |
Ligand Pharmaceuticals, Inc.(a) | | | 2,387 | | | | 156,993 | |
Lonza Group AG—ADR | | | 5,208 | | | | 287,326 | |
Maravai LifeSciences Holdings, Inc.—Class A(a) | | | 7,006 | | | | 72,442 | |
Medpace Holdings, Inc.(a) | | | 1,916 | | | | 517,838 | |
Merck & Co., Inc. | | | 20,139 | | | | 2,194,748 | |
Moderna, Inc.(a)(b) | | | 2,264 | | | | 255,990 | |
MorphoSys AG—ADR(a) | | | 10,917 | | | | 81,878 | |
Novartis AG—ADR | | | 78,670 | | | | 7,904,761 | |
Novo Nordisk A/S—ADR | | | 22,659 | | | | 4,205,964 | |
Nuvalent, Inc.(a) | | | 1,708 | | | | 77,834 | |
Olink Holding AB—ADR(a) | | | 4,828 | | | | 79,807 | |
Ono Pharmaceutical Co. Ltd.—ADR(b) | | | 4,864 | | | | 30,740 | |
Otsuka Holdings Co. Ltd.—ADR | | | 48,578 | | | | 923,468 | |
Pacific Biosciences of California, Inc.(a) | | | 1,323 | | | | 14,923 | |
Pfizer, Inc. | | | 41,585 | | | | 1,471,277 | |
ProKidney Corp.(a) | | | 13,340 | | | | 114,457 | |
Regeneron Pharmaceuticals, Inc.(a) | | | 2,258 | | | | 1,866,214 | |
Sanofi—ADR | | | 95,441 | | | | 5,075,552 | |
Shionogi & Co Ltd.—ADR | | | 11,328 | | | | 124,098 | |
Taisho Pharmaceutical Holdings Co. Ltd.—ADR | | | 45,500 | | | | 468,650 | |
Takeda Pharmaceutical Co. Ltd.—ADR | | | 266,672 | | | | 4,106,749 | |
Twist Bioscience Corp.(a)(b) | | | 5,841 | | | | 128,444 | |
United Therapeutics Corp.(a) | | | 1,798 | | | | 403,399 | |
Veracyte, Inc.(a)(b) | | | 32,706 | | | | 863,438 | |
Verona Pharma PLC—ADR(a) | | | 4,328 | | | | 84,093 | |
Vertex Pharmaceuticals, Inc.(a) | | | 3,674 | | | | 1,279,801 | |
Viatris, Inc. | | | 148,265 | | | | 1,593,849 | |
Wuxi Biologics Cayman, Inc.—ADR(a) | | | 441 | | | | 4,939 | |
| | | | | | |
|
|
|
| | | | | | | | 53,304,816 | |
| | | | | | |
|
|
|
Real Estate Management & Development—0.40% | | | | | | | | |
CBRE Group, Inc.—Class A(a) | | | 543 | | | | 46,182 | |
Daiwa House Industry Co. Ltd.—ADR(b) | | | 5,517 | | | | 152,711 | |
Forestar Group, Inc.(a) | | | 15,079 | | | | 429,902 | |
IRSA Inversiones y Representaciones SA—ADR | | | 4,134 | | | | 29,765 | |
KE Holdings, Inc.—ADR(a) | | | 3,875 | | | | 66,650 | |
Longfor Group Holdings Ltd.—ADR | | | 560 | | | | 12,340 | |
RMR Group, Inc.—Class A | | | 11,065 | | | | 279,723 | |
Sun Hung Kai Properties Ltd.—ADR(b) | | | 79,442 | | | | 901,269 | |
Swire Pacific Ltd.—Class A—ADR | | | 150,217 | | | | 1,234,785 | |
Zillow Group, Inc.—Class A(a) | | | 2,607 | | | | 132,748 | |
Zillow Group, Inc.—Class C(a)(b) | | | 4,389 | | | | 228,930 | |
| | | | | | |
|
|
|
| | | | | | | | 3,515,005 | |
| | | | | | |
|
|
|
Semiconductors & Semiconductor Equipment—6.57% | | | | | | | | |
Advanced Micro Devices, Inc.(a) | | | 682 | | | | 72,101 | |
Advantest Corp.—ADR | | | 242 | | | | 30,301 | |
Allegro MicroSystems, Inc.(a) | | | 731 | | | | 27,961 | |
The accompanying notes are an integral part of these financial statements.
64
PMC DIVERSIFIED EQUITY FUND | Schedule of Investments |
August 31, 2023 (Continued)
| | | | | | | | |
| | |
| | | Shares
| | | Value
| |
Amkor Technology, Inc. | | | 13,681 | | | $ | 382,521 | |
Analog Devices, Inc. | | | 23,095 | | | | 4,198,209 | |
Applied Materials, Inc. | | | 24,294 | | | | 3,711,151 | |
ASE Technology Holding Co Ltd.—ADR(b) | | | 102,013 | | | | 838,547 | |
ASML Holding NV | | | 2,307 | | | | 1,523,843 | |
ASMPT Ltd.—ADR(b) | | | 24,343 | | | | 729,073 | |
Axcelis Technologies, Inc.(a) | | | 983 | | | | 188,883 | |
Broadcom, Inc. | | | 7,134 | | | | 6,583,896 | |
Cirrus Logic, Inc.(a) | | | 3,821 | | | | 313,475 | |
Daqo New Energy Corp.—ADR(a)(b) | | | 14,511 | | | | 536,472 | |
Diodes, Inc.(a) | | | 5,158 | | | | 422,182 | |
Disco Corp.—ADR(b) | | | 90,010 | | | | 1,774,997 | |
Himax Technologies, Inc.—ADR(b) | | | 33,591 | | | | 205,241 | |
Infineon Technologies AG—ADR | | | 49,640 | | | | 1,781,083 | |
JinkoSolar Holding Co. Ltd.—ADR(a) | | | 7,622 | | | | 255,566 | |
KLA Corp. | | | 3,825 | | | | 1,919,653 | |
Lam Research Corp. | | | 4,509 | | | | 3,167,122 | |
Lattice Semiconductor Corp.(a) | | | 234 | | | | 22,759 | |
MACOM Technology Solutions Holdings, Inc.(a)(b) | | | 149 | | | | 12,599 | |
Microchip Technology, Inc. | | | 33,481 | | | | 2,740,085 | |
Monolithic Power Systems, Inc. | | | 299 | | | | 155,842 | |
NVIDIA Corp. | | | 9,977 | | | | 4,924,147 | |
ON Semiconductor Corp.(a) | | | 24,120 | | | | 2,374,855 | |
Onto Innovation, Inc.(a) | | | 5,170 | | | | 718,527 | |
QUALCOMM, Inc. | | | 17,222 | | | | 1,972,436 | |
Rambus, Inc.(a) | | | 2,374 | | | | 134,060 | |
Renesas Electronics Corp.—ADR(a) | | | 214,283 | | | | 1,782,835 | |
Rohm Co. Ltd.—ADR(b) | | | 31,150 | | | | 1,301,759 | |
Skyworks Solutions, Inc. | | | 22,497 | | | | 2,446,324 | |
STMicroelectronics NV | | | 99,604 | | | | 4,707,284 | |
Taiwan Semiconductor Manufacturing Co. Ltd.—ADR | | | 30,282 | | | | 2,833,487 | |
Texas Instruments, Inc. | | | 7,863 | | | | 1,321,456 | |
Tokyo Electron Ltd.—ADR | | | 5,122 | | | | 380,565 | |
United Microelectronics Corp.—ADR | | | 97,797 | | | | 701,204 | |
Universal Display Corp. | | | 150 | | | | 24,384 | |
| | | | | | |
|
|
|
| | | | | | | | 57,216,885 | |
| | | | | | |
|
|
|
Software & Services—2.59% | | | | | | | | |
Adeia, Inc. | | | 11,625 | | | | 116,948 | |
Agora, Inc.—ADR(a) | | | 2,525 | | | | 7,070 | |
Atos SE—ADR(a) | | | 57,331 | | | | 91,793 | |
Capgemini SE—ADR | | | 9,160 | | | | 342,309 | |
Chindata Group Holdings Ltd.—ADR(a)(b) | | | 18,906 | | | | 158,243 | |
Cognizant Technology Solutions Corp.—Class A | | | 15,744 | | | | 1,127,428 | |
Digital Turbine, Inc.(a) | | | 14,025 | | | | 124,963 | |
Dolby Laboratories, Inc.—Class A | | | 1,563 | | | | 132,027 | |
DoubleVerify Holdings, Inc.(a) | | | 581 | | | | 19,644 | |
Dropbox, Inc.(a) | | | 20,565 | | | | 571,501 | |
Ebix, Inc.(b) | | | 5,081 | | | | 84,853 | |
EPAM Systems, Inc.(a) | | | 4,265 | | | | 1,104,592 | |
Fair Isaac Corp.(a) | | | 834 | | | | 754,428 | |
Gartner, Inc.(a) | | | 4,447 | | | | 1,555,027 | |
Kingsoft Cloud Holdings Ltd.—ADR(a) | | | 10,682 | | | | 60,781 | |
Kyndryl Holdings, Inc.(a) | | | 2,935 | | | | 49,543 | |
Microsoft Corp. | | | 39,216 | | | | 12,853,435 | |
The accompanying notes are an integral part of these financial statements.
65
PMC DIVERSIFIED EQUITY FUND | Schedule of Investments |
August 31, 2023 (Continued)
| | | | | | | | |
| | |
| | | Shares
| | | Value
| |
N-able, Inc.(a) | | | 13,519 | | | $ | 180,749 | |
OneConnect Financial Technology Co. Ltd.—ADR(a) | | | 10,513 | | | | 36,585 | |
Opera Ltd.—ADR(b) | | | 30,669 | | | | 457,888 | |
Oracle Corp. | | | 7,530 | | | | 906,537 | |
Palantir Technologies, Inc.(a)(b) | | | 52,041 | | | | 779,574 | |
Progress Software Corp.(b) | | | 3,982 | | | | 242,265 | |
Salesforce, Inc.(a) | | | 1,565 | | | | 346,585 | |
SAP SE—ADR | | | 302 | | | | 42,186 | |
SPS Commerce, Inc.(a) | | | 143 | | | | 26,617 | |
Tuya, Inc.—ADR(a) | | | 15,133 | | | | 27,845 | |
Vnet Group, Inc.—ADR(a) | | | 67,116 | | | | 251,685 | |
Xunlei Ltd.—ADR(a) | | | 65,557 | | | | 115,380 | |
| | | | | | |
|
|
|
| | | | | | | | 22,568,481 | |
| | | | | | |
|
|
|
Technology Hardware & Equipment—5.87% | | | | | | | | |
Advanced Energy Industries, Inc.(b) | | | 4,744 | | | | 560,124 | |
Amphenol Corp.—Class A | | | 73,067 | | | | 6,457,661 | |
Apple, Inc. | | | 80,322 | | | | 15,090,094 | |
Arista Networks, Inc.(a) | | | 5,910 | | | | 1,153,809 | |
Avnet, Inc. | | | 6,174 | | | | 313,331 | |
Belden, Inc. | | | 5,176 | | | | 486,026 | |
Canaan, Inc.—ADR(a) | | | 15,394 | | | | 30,942 | |
CDW Corp. | | | 6,832 | | | | 1,442,577 | |
Cisco Systems, Inc. | | | 56,300 | | | | 3,228,806 | |
Corning, Inc. | | | 1,289 | | | | 42,305 | |
Dell Technologies, Inc.—Class C | | | 18,321 | | | | 1,030,373 | |
Fabrinet(a) | | | 4,815 | | | | 774,108 | |
FUJIFILM Holdings Corp.—ADR | | | 2,381 | | | | 140,622 | |
Hewlett Packard Enterprise Co. | | | 87,571 | | | | 1,487,831 | |
Insight Enterprises, Inc.(a)(b) | | | 6,480 | | | | 1,037,383 | |
IonQ, Inc.(a)(b) | | | 1,040 | | | | 17,878 | |
IPG Photonics Corp.(a) | | | 669 | | | | 72,493 | |
Jabil, Inc. | | | 12,796 | | | | 1,464,118 | |
Juniper Networks, Inc. | | | 69,718 | | | | 2,030,188 | |
Keysight Technologies, Inc.(a) | | | 17,763 | | | | 2,367,808 | |
Lenovo Group Ltd.—ADR | | | 16,856 | | | | 380,482 | |
Littelfuse, Inc. | | | 687 | | | | 183,484 | |
Logitech International SA | | | 16,963 | | | | 1,167,394 | |
National Instruments Corp. | | | 4,664 | | | | 277,974 | |
NetApp, Inc. | | | 12,761 | | | | 978,769 | |
OSI Systems, Inc.(a) | | | 4,358 | | | | 594,213 | |
Plexus Corp.(a) | | | 1,421 | | | | 144,303 | |
Ricoh Co Ltd.—ADR(b) | | | 77,028 | | | | 628,163 | |
Sanmina Corp.(a) | | | 14,008 | | | | 780,246 | |
Super Micro Computer, Inc.(a)(b) | | | 1,949 | | | | 536,131 | |
TDK Corp.—ADR(b) | | | 32,026 | | | | 1,164,786 | |
TE Connectivity Ltd. | | | 19,691 | | | | 2,606,891 | |
Teledyne Technologies, Inc.(a) | | | 3,146 | | | | 1,315,972 | |
Vishay Intertechnology, Inc. | | | 23,966 | | | | 657,627 | |
VTech Holdings Ltd.—ADR(b) | | | 83,297 | | | | 500,198 | |
| | | | | | |
|
|
|
| | | | | | | | 51,145,110 | |
| | | | | | |
|
|
|
Telecommunication Services—1.13% | | | | | | | | |
America Movil SAB de CV—ADR | | | 1,614 | | | | 30,940 | |
AT&T, Inc. | | | 70,761 | | | | 1,046,555 | |
The accompanying notes are an integral part of these financial statements.
66
PMC DIVERSIFIED EQUITY FUND | Schedule of Investments |
August 31, 2023 (Continued)
| | | | | | | | |
| | |
| | | Shares
| | | Value
| |
Deutsche Telekom AG—ADR | | | 101,283 | | | $ | 2,166,443 | |
KT Corp.—ADR | | | 24,902 | | | | 312,271 | |
Magyar Telekom Telecommunications PLC—ADR | | | 38,733 | | | | 251,765 | |
Mobile TeleSystems PJSC—ADR(a)(e) | | | 46,068 | | | | — | |
Nippon Telegraph & Telephone Corp.—ADR | | | 58,818 | | | | 1,694,547 | |
Orange SA—ADR | | | 274,971 | | | | 3,074,176 | |
Rostelecom PJSC—ADR(a)(e) | | | 24,510 | | | | — | |
SK Telecom Co. Ltd.—ADR | | | 5,072 | | | | 101,846 | |
SoftBank Group Corp.—ADR | | | 16,970 | | | | 380,128 | |
Spark New Zealand Ltd.—ADR | | | 32,476 | | | | 488,114 | |
Swisscom AG—ADR | | | 1,196 | | | | 72,872 | |
Telecom Italia SpA/Milano—ADR(a) | | | 15,704 | | | | 48,054 | |
Telecom Italia SpA/Milano—ADR(a) | | | 18,309 | | | | 55,751 | |
T-Mobile US, Inc.(a) | | | 1,018 | | | | 138,703 | |
| | | | | | |
|
|
|
| | | | | | | | 9,862,165 | |
| | | | | | |
|
|
|
Transportation—2.09% | | | | | | | | |
Air France-KLM—ADR(a) | | | 25,847 | | | | 39,287 | |
American Airlines Group, Inc.(a) | | | 52,373 | | | | 771,454 | |
AP Moeller—Maersk A/S—ADR | | | 78,863 | | | | 714,499 | |
ArcBest Corp. | | | 2,399 | | | | 253,310 | |
Avis Budget Group, Inc.(a)(b) | | | 730 | | | | 155,775 | |
bpost SA—ADR | | | 8,226 | | | | 38,744 | |
Delta Air Lines, Inc. | | | 18,542 | | | | 795,081 | |
Deutsche Lufthansa AG—ADR(a) | | | 45,417 | | | | 405,687 | |
DHL Group—ADR | | | 28,068 | | | | 1,310,214 | |
DiDi Global, Inc.—ADR(a) | | | 26,293 | | | | 90,185 | |
DSV A/S—ADR | | | 12,893 | | | | 1,225,093 | |
Expeditors International of Washington, Inc. | | | 19,357 | | | | 2,259,155 | |
FedEx Corp. | | | 1,930 | | | | 503,769 | |
Grupo Aeroportuario del Centro Norte SAB de CV—ADR | | | 1,933 | | | | 178,996 | |
Grupo Aeroportuario del Pacifico SAB de CV—ADR | | | 190 | | | | 34,645 | |
Grupo Aeroportuario del Sureste SAB de CV—ADR | | | 1,217 | | | | 331,364 | |
Hub Group, Inc.—Class A(a) | | | 4,471 | | | | 348,917 | |
JB Hunt Transport Services, Inc. | | | 4,083 | | | | 767,115 | |
Kuehne + Nagel International AG—ADR(b) | | | 7,873 | | | | 474,033 | |
Landstar System, Inc. | | | 1,652 | | | | 313,566 | |
Matson, Inc. | | | 200 | | | | 17,576 | |
Nippon Yusen KK—ADR(b) | | | 128,094 | | | | 680,179 | |
Ryanair Holdings PLC—ADR(a) | | | 32,770 | | | | 3,252,423 | |
Ryder System, Inc. | | | 6,026 | | | | 606,818 | |
Schneider National, Inc.—Class B | | | 25,457 | | | | 735,962 | |
SkyWest, Inc.(a) | | | 268 | | | | 12,087 | |
Uber Technologies, Inc.(a) | | | 1,714 | | | | 80,952 | |
United Airlines Holdings, Inc.(a) | | | 35,002 | | | | 1,743,450 | |
United Parcel Service, Inc.—Class B | | | 237 | | | | 40,148 | |
Werner Enterprises, Inc.(b) | | | 246 | | | | 10,236 | |
| | | | | | |
|
|
|
| | | | | | | | 18,190,720 | |
| | | | | | |
|
|
|
Utilities—1.90% | | | | | | | | |
AGL Energy Ltd.—ADR | | | 4,282 | | | | 30,124 | |
Centrica PLC—ADR | | | 6,974 | | | | 53,595 | |
Cia Energetica de Minas Gerais—ADR | | | 29,807 | | | | 120,122 | |
Consolidated Edison, Inc. | | | 45,303 | | | | 4,030,155 | |
Edison International | | | 679 | | | | 46,749 | |
The accompanying notes are an integral part of these financial statements.
67
PMC DIVERSIFIED EQUITY FUND | Schedule of Investments |
August 31, 2023 (Continued)
| | | | | | | | |
| | |
| | | Shares
| | | Value
| |
Enel Chile SA—ADR | | | 35,875 | | | $ | 118,388 | |
Enel SpA—ADR(b) | | | 28,186 | | | | 187,860 | |
Engie SA—ADR | | | 157,549 | | | | 2,547,567 | |
ENN Energy Holdings Ltd.—ADR | | | 730 | | | | 22,995 | |
Entergy Corp. | | | 422 | | | | 40,196 | |
Evergy, Inc. | | | 726 | | | | 39,908 | |
Iberdrola SA—ADR | | | 65,982 | | | | 3,129,525 | |
Kunlun Energy Co. Ltd.—ADR(b) | | | 7,803 | | | | 55,323 | |
National Grid PLC—ADR(b) | | | 28,675 | | | | 1,812,547 | |
New Jersey Resources Corp. | | | 246 | | | | 10,374 | |
NorthWestern Corp. | | | 1,463 | | | | 73,735 | |
Otter Tail Corp.(b) | | | 5,775 | | | | 475,687 | |
Pampa Energia SA—ADR(a) | | | 3,501 | | | | 159,506 | |
PG&E Corp.(a) | | | 99,395 | | | | 1,620,138 | |
Public Service Enterprise Group, Inc. | | | 656 | | | | 40,068 | |
RWE AG—ADR | | | 736 | | | | 30,308 | |
Spire, Inc. | | | 181 | | | | 10,572 | |
Tokyo Gas Co. Ltd.—ADR(b) | | | 73,289 | | | | 843,557 | |
Veolia Environnement SA—ADR | | | 11,917 | | | | 185,846 | |
Vistra Corp. | | | 27,216 | | | | 855,127 | |
Xcel Energy, Inc. | | | 676 | | | | 38,620 | |
| | | | | | |
|
|
|
| | | | | | | | 16,578,592 | |
| | | | | | |
|
|
|
TOTAL COMMON STOCKS (Cost $501,022,298) | | | | | | | 625,559,322 | |
| | | | | | |
|
|
|
| PREFERRED STOCKS—0.08% | | | | | | | | |
Automobiles & Components—0.00% | | | | | | | | |
Volkswagen AG—ADR, 24.260%(c) | | | 2,485 | | | | 30,392 | |
| | | | | | |
|
|
|
Energy—0.04% | | | | | | | | |
Petroleo Brasileiro SA—ADR, 10.702%(c) | | | 24,904 | | | | 322,258 | |
Surgutneftegas PJSC—ADR(a)(c)(e) | | | 47,748 | | | | — | |
| | | | | | |
|
|
|
| | | | | | | | 322,258 | |
| | | | | | |
|
|
|
Materials—0.04% | | | | | | | | |
Gerdau SA—ADR, 14.043%(c) | | | 66,068 | | | | 344,213 | |
| | | | | | |
|
|
|
Utilities—0.00% | | | | | | | | |
Cia Energetica de Minas Gerais—ADR, 8.911%(c) | | | 11,233 | | | | 27,409 | |
| | | | | | |
|
|
|
TOTAL PREFERRED STOCKS (Cost $826,824) | | | | | | | 724,272 | |
| | | | | | |
|
|
|
| EXCHANGE-TRADED FUNDS—24.06% | | | | | | | | |
iShares Core S&P Small-Cap ETF | | | 91,532 | | | | 9,224,595 | |
iShares MSCI EAFE ETF(b) | | | 331,799 | | | | 23,733,582 | |
iShares MSCI Emerging Markets ETF | | | 122,575 | | | | 4,801,263 | |
iShares Russell 1000 ETF(b) | | | 93,242 | | | | 23,104,435 | |
iShares Russell 2000 ETF(b) | | | 42,205 | | | | 7,960,285 | |
SPDR S&P 500 ETF Trust(b) | | | 57,896 | | | | 26,073,464 | |
Vanguard FTSE All-World ex-US ETF | | | 482,389 | | | | 26,039,359 | |
Vanguard FTSE Developed Markets ETF(b) | | | 566,087 | | | | 25,898,480 | |
Vanguard FTSE Emerging Markets ETF(b) | | | 131,093 | | | | 5,313,199 | |
Vanguard Large-Cap ETF(b) | | | 107,950 | | | | 22,254,972 | |
Vanguard S&P 500 ETF(b) | | | 63,016 | | | | 26,077,911 | |
Vanguard Small-Cap ETF(b) | | | 45,231 | | | | 9,092,788 | |
| | | | | | |
|
|
|
TOTAL EXCHANGE-TRADED FUNDS (Cost $193,120,635) | | | | | | | 209,574,333 | |
| | | | | | |
|
|
|
The accompanying notes are an integral part of these financial statements.
68
PMC DIVERSIFIED EQUITY FUND | Schedule of Investments |
August 31, 2023 (Continued)
| | | | | | | | |
| | |
| | | Shares
| | | Value
| |
| REAL ESTATE INVESTMENT TRUSTS—2.00% | | | | | | | | |
Commercial & Professional Services—0.02% | | | | | | | | |
GEO Group, Inc.(a)(b) | | | 23,556 | | | $ | 170,545 | |
| | | | | | |
|
|
|
Consumer Durables & Apparel—0.03% | | | | | | | | |
Cyrela Brazil Realty SA Empreendimentos e Participacoes—ADR(b) | | | 56,192 | | | | 270,284 | |
| | | | | | |
|
|
|
Equity Real Estate Investment Trusts (REITs)—1.91% | | | | | | | | |
Apple Hospitality REIT, Inc.(b) | | | 61,260 | | | | 920,125 | |
Boston Properties, Inc.(b) | | | 820 | | | | 54,751 | |
Brixmor Property Group, Inc. | | | 16,009 | | | | 351,878 | |
Corporate Office Properties Trust(b) | | | 6,471 | | | | 167,470 | |
DiamondRock Hospitality Co. | | | 52,401 | | | | 422,352 | |
Empire State Realty Trust, Inc.—Class A | | | 16,011 | | | | 139,776 | |
EPR Properties(b) | | | 11,695 | | | | 523,702 | |
Essential Properties Realty Trust, Inc.(b) | | | 478 | | | | 11,482 | |
Gaming and Leisure Properties, Inc. | | | 8,760 | | | | 415,224 | |
Getty Realty Corp.(b) | | | 10,863 | | | | 326,107 | |
Host Hotels & Resorts, Inc. | | | 226,022 | | | | 3,568,888 | |
Innovative Industrial Properties, Inc.(b) | | | 300 | | | | 26,184 | |
Iron Mountain, Inc.(b) | | | 2,610 | | | | 165,839 | |
Park Hotels & Resorts, Inc.(b) | | | 23,815 | | | | 305,546 | |
Public Storage | | | 1,963 | | | | 542,534 | |
Regency Centers Corp. | | | 51,649 | | | | 3,212,567 | |
RPT Realty(b) | | | 11,286 | | | | 127,983 | |
Service Properties Trust(b) | | | 28,773 | | | | 237,665 | |
Simon Property Group, Inc. | | | 19,366 | | | | 2,197,847 | |
SITE Centers Corp. | | | 894 | | | | 11,935 | |
Sunstone Hotel Investors, Inc. | | | 36,349 | | | | 326,414 | |
Tanger Factory Outlet Centers, Inc.(b) | | | 11,782 | | | | 273,932 | |
VICI Properties, Inc. | | | 21,075 | | | | 649,953 | |
Weyerhaeuser Co. | | | 18,874 | | | | 618,124 | |
WP Carey, Inc.(b) | | | 16,164 | | | | 1,051,468 | |
| | | | | | |
|
|
|
| | | | | | | | 16,649,746 | |
| | | | | | |
|
|
|
Financial Services—0.04% | | | | | | | | |
Apollo Commercial Real Estate Finance, Inc. | | | 7,786 | | | | 85,023 | |
Ladder Capital Corp. | | | 17,378 | | | | 190,463 | |
Rithm Capital Corp. | | | 7,790 | | | | 80,315 | |
| | | | | | |
|
|
|
| | | | | | | | 355,801 | |
| | | | | | |
|
|
|
TOTAL REAL ESTATE INVESTMENT TRUSTS (Cost $17,509,986) | | | | | | | 17,446,376 | |
| | | | | | |
|
|
|
| INVESTMENTS PURCHASED WITH COLLATERAL FROM SECURITIES LENDING—23.05% | | | | | | | | |
Investment Company—23.05% | | | | | | | | |
Mount Vernon Liquid Assets Portfolio, LLC, 5.460%(d) | | | 200,726,076 | | | | 200,726,076 | |
| | | | | | |
|
|
|
TOTAL INVESTMENTS PURCHASED WITH COLLATERAL FROM SECURITIES LENDING (Cost $200,726,076) | | | | | | | 200,726,076 | |
| | | | | | |
|
|
|
| MONEY MARKET FUNDS—1.73% | | | | | | | | |
First American Government Obligations Fund, Class X, 5.247%(d) | | | 15,104,598 | | | | 15,104,598 | |
| | | | | | |
|
|
|
TOTAL MONEY MARKET FUNDS (Cost $15,104,598) | | | | | | | 15,104,598 | |
| | | | | | |
|
|
|
| Total Investments (Cost $928,310,417)—122.75% | | | | | | | 1,069,134,977 | |
Liabilities in Excess of Other Assets—(22.75)% | | | | | | | (198,167,570 | ) |
| | | | | | |
|
|
|
| TOTAL NET ASSETS—100.00% | | | | | | $ | 870,967,407 | |
| | | | | | |
|
|
|
The accompanying notes are an integral part of these financial statements.
69
PMC DIVERSIFIED EQUITY FUND | Schedule of Investments |
August 31, 2023 (Continued)
Percentages are stated as a percent of net assets.
| (a) | | Non-income producing security. |
| (b) | | All or portion of this security is out on loan as of August 31, 2023. Total value of securities out on loan is $195,341,452. |
| (c) | | Perpetual preferred stock with no stated maturity. |
| (d) | | The rate shown represents the seven day yield at August 31, 2023. |
| (e) | | Fair valued security. Value determined using significant unobservable inputs. |
| | |
| | | Abbreviations |
| AB | | Aktiebolag is a Swedish term for a stock company. |
| ADR | | American Depositary Receipt |
| AG | | Aktiengesellschaft is a German term that refers to a corporation that is limited by shares, i.e. owned by shareholders. |
| A/S | | An abbreviation used by many countries to signify a stock company whereby shareholders have limited liability. |
| ASA | | Allmennaksjeselskap is a Norwegian term for a stock company. |
| KGaA | | Kommanditgesellschaft auf Aktien is a German term that refers to a Limited Partnership that has shares. |
| NV | | Naamloze Vennootschap is a Dutch term for publicly traded companies. |
| OYJ | | Julkinen osakeyhtio is a Finnish term for publicly-traded companies. |
| PJSC | | An abbreviation used by many countries to signify an open joint-stock company. |
| PLC | | Public Limited Company is a publicly traded company which signifies that shareholders have limited liability. |
| SA | | An abbreviation used by many countries to signify a publicly traded company. |
| SAB de CV | | Sociedad Anonima de Capital Variable is a Spanish term for an SA with variable capital. |
| SE | | Societas Europea is a term for a European Public Limited Liability Company. |
| SpA | | Soicieta per Azioni is an Italian term for limited share company. |
The Global Industry Classification Standard (GICS®) was developed by and/or is the exclusive property of MSCI, Inc. and Standard & Poors Financial Services LLC (“S&P”). GICS is a service mark of MSCI and S&P and has been licensed for use by U.S. Bancorp Fund Services, LLC. The accompanying notes are an integral part of these financial statements.
The accompanying notes are an integral part of these financial statements.
70
ACTIVEPASSIVE CORE BOND ETF | Schedule of Investments |
August 31, 2023
| | | | | | | | |
| | |
| | | Principal
Amount
| | | Value
| |
| ASSET BACKED SECURITIES—1.64% | | | | | | | | |
Aqua Finance Trust | | | | | | | | |
2021-A, 1.540%, 07/17/2046 | | $ | 52,456 | | | $ | 46,313 | |
Avis Budget Rental Car Funding AESOP LLC | | | | | | | | |
2023-2, 6.030%, 10/20/2027 | | | 100,000 | | | | 99,519 | |
2021-2, 1.660%, 02/20/2028 | | | 100,000 | | | | 87,714 | |
BMW Vehicle Owner Trust | | | | | | | | |
2023-A, 5.470%, 02/25/2028 | | | 34,000 | | | | 34,141 | |
Carmax Auto Owner Trust 2023-3 | | | | | | | | |
2023-3, 5.280%, 05/15/2028 | | | 38,000 | | | | 38,019 | |
CCG Receivables Trust | | | | | | | | |
2023-1, 5.820%, 09/16/2030 | | | 100,000 | | | | 100,120 | |
DLLAA LLC | | | | | | | | |
2023-1, 5.640%, 02/22/2028 | | | 32,000 | | | | 32,179 | |
Ellington Financial Mortgage Trust | | | | | | | | |
2022-1, 2.206%, 01/25/2067(c) | | | 85,346 | | | | 70,864 | |
GM Financial Automobile Leasing Trust | | | | | | | | |
2023-3, 5.380%, 11/20/2026 | | | 33,000 | | | | 33,012 | |
Hyundai Auto Receivables Trust | | | | | | | | |
2023-B, 5.480%, 04/17/2028 | | | 28,000 | | | | 28,168 | |
Kubota Credit Owner Trust | | | | | | | | |
2023-2, 5.280%, 01/18/2028 | | | 28,000 | | | | 27,985 | |
MMAF Equipment Finance LLC | | | | | | | | |
2023-A, 5.540%, 12/13/2029 | | | 37,000 | | | | 37,248 | |
MVW LLC | | | | | | | | |
2023-1, 5.420%, 10/20/2040 | | | 92,345 | | | | 90,256 | |
OneMain Financial Issuance Trust | | | | | | | | |
2023-2, 5.840%, 09/15/2036 | | | 100,000 | | | | 100,584 | |
PFS Financing Corp. | | | | | | | | |
2021-B, 0.770%, 08/15/2026 | | | 100,000 | | | | 95,115 | |
Sierra Timeshare Receivables Funding LLC | | | | | | | | |
2021-2 A, 1.350%, 09/20/2038 | | | 65,342 | | | | 61,037 | |
2021-2 B, 1.800%, 09/20/2038 | | | 32,671 | | | | 30,463 | |
Sofi Professional Loan Program LLC | | | | | | | | |
2019-B, 3.090%, 08/17/2048 | | | 32,500 | | | | 30,629 | |
SOFI Professional Loan Program Trust | | | | | | | | |
2021-A, 1.030%, 08/17/2043 | | | 175,390 | | | | 148,339 | |
Towd Point Mortgage Trust | | | | | | | | |
2017-5, 5.118% (TSFR1M + 0.714%), 02/25/2057(b) | | | 49,237 | | | | 49,369 | |
2022-4, 3.750%, 09/25/2062 | | | 117,812 | | | | 108,264 | |
Toyota Auto Receivables Owner Trust | | | | | | | | |
2023-C, 5.160%, 04/17/2028 | | | 53,000 | | | | 52,910 | |
United Airlines Class B Pass Through Trust | | | | | | | | |
2020-1, 4.875%, 07/15/2027 | | | 58,185 | | | | 56,502 | |
Vantage Data Centers Issuer LLC | | | | | | | | |
2021-1, 2.165%, 10/15/2046 | | | 100,000 | | | | 88,343 | |
Verus Securitization Trust | | | | | | | | |
2021-3, 1.046%, 06/25/2066(c) | | | 104,305 | | | | 87,868 | |
| | | | | | |
|
|
|
TOTAL ASSET BACKED SECURITIES (Cost $1,654,292) | | | | | | | 1,634,961 | |
| | | | | | |
|
|
|
| CORPORATE BONDS—19.32% | | | | | | | | |
| Automobiles & Components—0.67% | | | | | | | | |
American Honda Finance Corp. | | | | | | | | |
4.600%, 04/17/2030 | | | 55,000 | | | | 53,556 | |
The accompanying notes are an integral part of these financial statements.
71
ACTIVEPASSIVE CORE BOND ETF | Schedule of Investments |
August 31, 2023 (Continued)
| | | | | | | | |
| | |
| | | Principal
Amount
| | | Value
| |
General Motors Co. | | | | | | | | |
6.800%, 10/01/2027 | | $ | 55,000 | | | $ | 56,742 | |
General Motors Financial Co, Inc. | | | | | | | | |
4.000%, 01/15/2025 | | | 370,000 | | | | 359,886 | |
4.300%, 07/13/2025 | | | 5,000 | | | | 4,859 | |
6.050%, 10/10/2025 | | | 81,000 | | | | 81,133 | |
5.850%, 04/06/2030 | | | 99,000 | | | | 97,005 | |
Goodyear Tire & Rubber Co. | | | | | | | | |
5.250%, 04/30/2031 | | | 25,000 | | | | 21,952 | |
| | | | | | |
|
|
|
| | | | | | | | 675,133 | |
| | | | | | |
|
|
|
| Banks—2.09% | | | | | | | | |
Bank of America Corp. | | | | | | | | |
2.456% to 10/22/2024, then TSFR3M + 1.132%, 10/22/2025(a) | | | 5,000 | | | | 4,809 | |
1.734% to 07/22/2026, then SOFR + 0.960%, 07/22/2027(a) | | | 92,000 | | | | 82,363 | |
3.824% to 01/20/2027, then TSFR3M + 1.837%, 01/20/2028(a) | | | 195,000 | | | | 183,911 | |
5.202% to 04/25/2028, then SOFR + 1.630%, 04/25/2029(a) | | | 264,000 | | | | 260,094 | |
1.922% to 10/24/2030, then SOFR + 1.370%, 10/24/2031(a) | | | 145,000 | | | | 113,671 | |
2.299% to 07/21/2031, then SOFR + 1.220%, 07/21/2032(a) | | | 51,000 | | | | 40,235 | |
5.288% to 04/25/2033, then SOFR + 1.910%, 04/25/2034(a) | | | 19,000 | | | | 18,548 | |
2.482% to 09/21/2031, then 5 Year CMT Rate + 1.200%, 09/21/2036(a) | | | 115,000 | | | | 87,409 | |
4.300% to 01/28/2025, then TSFR3M + 2.926%(a)(e) | | | 40,000 | | | | 36,333 | |
Citigroup, Inc. | | | | | | | | |
3.352% to 04/24/2024, then TSFR3M + 1.158%, 04/24/2025(a) | | | 70,000 | | | | 68,724 | |
4.600%, 03/09/2026 | | | 105,000 | | | | 102,256 | |
1.122% to 01/28/2026, then SOFR + 0.765%, 01/28/2027(a) | | | 110,000 | | | | 98,617 | |
3.887% to 01/10/2027, then TSFR3M + 1.825%, 01/10/2028(a) | | | 37,000 | | | | 34,967 | |
4.075% to 04/23/2028, then TSFR3M + 1.454%, 04/23/2029(a) | | | 80,000 | | | | 75,046 | |
2.572% to 06/03/2030, then SOFR + 2.107%, 06/03/2031(a) | | | 110,000 | | | | 90,893 | |
First-Citizens Bank & Trust Co. | | | | | | | | |
6.125%, 03/09/2028 | | | 65,000 | | | | 65,341 | |
JPMorgan Chase & Co. | | | | | | | | |
3.220% to 03/01/2024, then TSFR3M + 1.417%, 03/01/2025(a) | | | 170,000 | | | | 167,685 | |
1.045% to 11/19/2025, then SOFR + 0.800%, 11/19/2026(a) | | | 60,000 | | | | 54,117 | |
3.540% to 05/01/2027, then TSFR3M + 1.642%, 05/01/2028(a) | | | 60,000 | | | | 56,015 | |
4.000% to 04/01/2025, then TSFR3M + 2.745%(a)(e) | | | 47,000 | | | | 43,254 | |
Synovus Financial Corp. | | | | | | | | |
5.200%, 08/11/2025 | | | 11,000 | | | | 10,683 | |
Truist Financial Corp. | | | | | | | | |
4.260% to 07/28/2025, then SOFR + 1.456%, 07/28/2026(a) | | | 80,000 | | | | 77,330 | |
US Bancorp | | | | | | | | |
5.836% to 06/10/2033, then SOFR + 2.260%, 06/12/2034(a) | | | 40,000 | | | | 39,981 | |
Wells Fargo & Co. | | | | | | | | |
2.164% to 02/11/2025, then TSFR3M + 1.012%, 02/11/2026(a) | | | 80,000 | | | | 75,684 | |
3.908% to 04/25/2025, then SOFR + 1.320%, 04/25/2026(a) | | | 7,000 | | | | 6,771 | |
2.188% to 04/30/2025, then SOFR + 2.000%, 04/30/2026(a) | | | 110,000 | | | | 103,503 | |
2.393% to 06/02/2027, then SOFR + 2.100%, 06/02/2028(a) | | | 70,000 | | | | 62,325 | |
5.389% to 04/24/2033, then SOFR + 2.020%, 04/24/2034(a) | | | 28,000 | | | | 27,283 | |
| | | | | | |
|
|
|
| | | | | | | | 2,087,848 | |
| | | | | | |
|
|
|
| Capital Goods—0.49% | | | | | | | | |
Air Lease Corp. | | | | | | | | |
3.250%, 10/01/2029 | | | 60,000 | | | | 52,365 | |
The accompanying notes are an integral part of these financial statements.
72
ACTIVEPASSIVE CORE BOND ETF | Schedule of Investments |
August 31, 2023 (Continued)
| | | | | | | | |
| | |
| | | Principal
Amount
| | | Value
| |
Boeing Co. | | | | | | | | |
2.196%, 02/04/2026 | | $ | 80,000 | | | $ | 73,842 | |
5.040%, 05/01/2027 | | | 75,000 | | | | 74,205 | |
5.705%, 05/01/2040 | | | 15,000 | | | | 14,603 | |
5.805%, 05/01/2050 | | | 25,000 | | | | 24,357 | |
CNH Industrial Capital LLC | | | | | | | | |
1.450%, 07/15/2026 | | | 55,000 | | | | 49,227 | |
4.550%, 04/10/2028 | | | 192,000 | | | | 185,840 | |
Regal Rexnord Corp. | | | | | | | | |
6.050%, 04/15/2028 | | | 15,000 | | | | 14,853 | |
| | | | | | |
|
|
|
| | | | | | | | 489,292 | |
| | | | | | |
|
|
|
| Commercial & Professional Services—0.40% | | | | | | | | |
ASGN, Inc. | | | | | | | | |
4.625%, 05/15/2028 | | | 25,000 | | | | 22,490 | |
Equifax, Inc. | | | | | | | | |
5.100%, 12/15/2027 | | | 40,000 | | | | 39,504 | |
Republic Services, Inc. | | | | | | | | |
5.000%, 04/01/2034 | | | 212,000 | | | | 208,398 | |
5.700%, 05/15/2041 | | | 129,000 | | | | 131,832 | |
| | | | | | |
|
|
|
| | | | | | | | 402,224 | |
| | | | | | |
|
|
|
| Consumer Discretionary Distribution & Retail—0.21% | | | | | | | | |
Arko Corp. | | | | | | | | |
5.125%, 11/15/2029 | | | 60,000 | | | | 49,331 | |
Lowe’s Cos, Inc. | | | | | | | | |
5.750%, 07/01/2053 | | | 119,000 | | | | 117,777 | |
Macy’s Retail Holdings LLC | | | | | | | | |
5.875%, 03/15/2030 | | | 45,000 | | | | 39,416 | |
| | | | | | |
|
|
|
| | | | | | | | 206,524 | |
| | | | | | |
|
|
|
| Consumer Durables & Apparel—0.13% | | | | | | | | |
Whirlpool Corp. | | | | | | | | |
5.500%, 03/01/2033 | | | 132,000 | | | | 130,968 | |
| | | | | | |
|
|
|
| Consumer Services—0.23% | | | | | | | | |
Churchill Downs, Inc. | | | | | | | | |
6.750%, 05/01/2031 | | | 25,000 | | | | 24,488 | |
Marriott International, Inc. | | | | | | | | |
5.000%, 10/15/2027 | | | 103,000 | | | | 102,088 | |
Prime Security Services Borrower LLC / Prime Finance, Inc. | | | | | | | | |
6.250%, 01/15/2028 | | | 30,000 | | | | 28,604 | |
University of Chicago | | | | | | | | |
2.761%, 04/01/2045 | | | 87,000 | | | | 65,474 | |
Wynn Las Vegas LLC / Wynn Las Vegas Capital Corp. | | | | | | | | |
5.500%, 03/01/2025 | | | 13,000 | | | | 12,854 | |
| | | | | | |
|
|
|
| | | | | | | | 233,508 | |
| | | | | | |
|
|
|
| Consumer Staples Distribution & Retail—0.41% | | | | | | | | |
Walmart, Inc. | | | | | | | | |
4.000%, 04/15/2026 | | | 160,000 | | | | 157,127 | |
3.900%, 04/15/2028 | | | 150,000 | | | | 145,510 | |
4.000%, 04/15/2030 | | | 69,000 | | | | 66,710 | |
4.500%, 04/15/2053 | | | 45,000 | | | | 41,936 | |
| | | | | | |
|
|
|
| | | | | | | | 411,283 | |
| | | | | | |
|
|
|
The accompanying notes are an integral part of these financial statements.
73
ACTIVEPASSIVE CORE BOND ETF | Schedule of Investments |
August 31, 2023 (Continued)
| | | | | | | | |
| | |
| | | Principal
Amount
| | | Value
| |
| Energy—1.74% | | | | | | | | |
Antero Resources Corp. | | | | | | | | |
7.625%, 02/01/2029 | | $ | 35,000 | | | $ | 35,900 | |
BP Capital Markets America, Inc. | | | | | | | | |
4.812%, 02/13/2033 | | | 40,000 | | | | 38,736 | |
4.893%, 09/11/2033 | | | 45,000 | | | | 43,814 | |
Cheniere Corpus Christi Holdings LLC | | | | | | | | |
5.875%, 03/31/2025 | | | 4,000 | | | | 3,989 | |
Comstock Resources, Inc. | | | | | | | | |
6.750%, 03/01/2029 | | | 25,000 | | | | 23,414 | |
Diamondback Energy, Inc. | | | | | | | | |
6.250%, 03/15/2033 | | | 55,000 | | | | 56,856 | |
DT Midstream, Inc. | | | | | | | | |
4.125%, 06/15/2029 | | | 25,000 | | | | 22,174 | |
Energy Transfer LP | | | | | | | | |
2.900%, 05/15/2025 | | | 40,000 | | | | 38,046 | |
5.250%, 04/15/2029 | | | 120,000 | | | | 117,308 | |
EQM Midstream Partners LP | | | | | | | | |
4.125%, 12/01/2026 | | | 45,000 | | | | 42,290 | |
Exxon Mobil Corp. | | | | | | | | |
3.095%, 08/16/2049 | | | 45,000 | | | | 31,697 | |
Gulfstream Natural Gas System LLC | | | | | | | | |
6.190%, 11/01/2025 | | | 293,000 | | | | 292,179 | |
Hilcorp Energy I LP / Hilcorp Finance Co. | | | | | | | | |
6.250%, 11/01/2028 | | | 30,000 | | | | 28,970 | |
Kinder Morgan, Inc. | | | | | | | | |
5.200%, 06/01/2033 | | | 70,000 | | | | 67,085 | |
5.550%, 06/01/2045 | | | 45,000 | | | | 40,707 | |
Marathon Petroleum Corp. | | | | | | | | |
4.700%, 05/01/2025 | | | 130,000 | | | | 127,804 | |
MPLX LP | | | | | | | | |
5.650%, 03/01/2053 | | | 30,000 | | | | 27,220 | |
New Fortress Energy, Inc. | | | | | | | | |
6.500%, 09/30/2026 | | | 30,000 | | | | 27,913 | |
Occidental Petroleum Corp. | | | | | | | | |
6.125%, 01/01/2031 | | | 35,000 | | | | 35,303 | |
6.450%, 09/15/2036 | | | 135,000 | | | | 138,182 | |
Phillips 66 | | | | | | | | |
1.300%, 02/15/2026 | | | 35,000 | | | | 31,795 | |
Pioneer Natural Resources Co. | | | | | | | | |
2.150%, 01/15/2031 | | | 40,000 | | | | 32,444 | |
Sabine Pass Liquefaction LLC | | | | | | | | |
4.500%, 05/15/2030 | | | 50,000 | | | | 47,079 | |
Southwestern Energy Co. | | | | | | | | |
5.375%, 03/15/2030 | | | 28,000 | | | | 26,242 | |
Targa Resources Corp. | | | | | | | | |
5.200%, 07/01/2027 | | | 45,000 | | | | 44,573 | |
Transcontinental Gas Pipe Line Co. LLC | | | | | | | | |
4.000%, 03/15/2028 | | | 341,000 | | | | 322,075 | |
| | | | | | |
|
|
|
| | | | | | | | 1,743,795 | |
| | | | | | |
|
|
|
| Equity Real Estate Investment Trusts (REITs)—0.31% | | | | | | | | |
Crown Castle, Inc. | | | | | | | | |
3.200%, 09/01/2024 | | | 70,000 | | | | 68,225 | |
1.050%, 07/15/2026 | | | 25,000 | | | | 22,115 | |
The accompanying notes are an integral part of these financial statements.
74
ACTIVEPASSIVE CORE BOND ETF | Schedule of Investments |
August 31, 2023 (Continued)
| | | | | | | | |
| | |
| | | Principal
Amount
| | | Value
| |
EPR Properties | | | | | | | | |
4.500%, 04/01/2025 | | $ | 25,000 | | | $ | 23,976 | |
Iron Mountain, Inc. | | | | | | | | |
5.250%, 07/15/2030 | | | 45,000 | | | | 40,648 | |
Kimco Realty OP LLC | | | | | | | | |
4.600%, 02/01/2033 | | | 55,000 | | | | 50,593 | |
Realty Income Corp. | | | | | | | | |
4.700%, 12/15/2028 | | | 103,000 | | | | 100,053 | |
| | | | | | |
|
|
|
| | | | | | | | 305,610 | |
| | | | | | |
|
|
|
| Financial Services—1.76% | | | | | | | | |
Blackstone Private Credit Fund | | | | | | | | |
4.700%, 03/24/2025 | | | 197,000 | | | | 191,633 | |
Capital One Financial Corp. | | | | | | | | |
4.200%, 10/29/2025 | | | 5,000 | | | | 4,808 | |
4.985% to 07/24/205, then SOFR + 2.160%, 07/24/2026(a) | | | 45,000 | | | | 44,007 | |
1.878% to 11/02/2026, then SOFR + 0.855%, 11/02/2027(a) | | | 90,000 | | | | 78,948 | |
6.312% to 06/08/2028, then SOFR + 2.640%, 06/08/2029(a) | | | 30,000 | | | | 30,003 | |
5.817% to 02/01/2033, then SOFR + 2.600%, 02/01/2034(a) | | | 70,000 | | | | 66,537 | |
6.377% to 06/08/2033, then SOFR + 2.860%, 06/08/2034(a) | | | 20,000 | | | | 19,769 | |
Goldman Sachs Group, Inc. | | | | | | | | |
3.272% to 09/29/2024, then TSFR3M + 1.463%, 09/29/2025(a) | | | 100,000 | | | | 97,022 | |
1.093% to 12/09/2025, then SOFR + 0.789%, 12/09/2026(a) | | | 5,000 | | | | 4,490 | |
1.431% to 03/09/2026, then SOFR + 0.798%, 03/09/2027(a) | | | 155,000 | | | | 139,053 | |
1.948% to 10/21/2026, then SOFR + 0.913%, 10/21/2027(a) | | | 110,000 | | | | 97,930 | |
3.814% to 04/23/2028, then TSFR3M + 1.420%, 04/23/2029(a) | | | 105,000 | | | | 97,204 | |
Jane Street Group / JSG Finance, Inc. | | | | | | | | |
4.500%, 11/15/2029 | | | 45,000 | | | | 39,538 | |
Morgan Stanley | | | | | | | | |
2.720% to 07/22/2024, then SOFR + 1.152%, 07/22/2025(a) | | | 50,000 | | | | 48,543 | |
3.625%, 01/20/2027 | | | 50,000 | | | | 47,262 | |
2.475% to 01/21/2027, then SOFR + 1.000%, 01/21/2028(a) | | | 160,000 | | | | 144,416 | |
5.164% to 04/20/2028, then SOFR + 1.590%, 04/20/2029(a) | | | 133,000 | | | | 130,491 | |
5.250% to 04/21/2033, then SOFR + 1.870%, 04/21/2034(a) | | | 85,000 | | | | 82,597 | |
5.948% to 01/19/2033, then 5 Year CMT Rate + 2.430%, 01/19/2038(a) | | | 50,000 | | | | 48,651 | |
Northern Trust Corp. | | | | | | | | |
6.125%, 11/02/2032 | | | 4,000 | | | | 4,086 | |
OneMain Finance Corp. | | | | | | | | |
3.500%, 01/15/2027 | | | 25,000 | | | | 21,779 | |
PRA Group, Inc. | | | | | | | | |
5.000%, 10/01/2029 | | | 48,000 | | | | 36,249 | |
S&P Global, Inc. | | | | | | | | |
3.700%, 03/01/2052 | | | 185,000 | | | | 144,122 | |
3.900%, 03/01/2062 | | | 119,000 | | | | 93,478 | |
United Wholesale Mortgage LLC | | | | | | | | |
5.500%, 04/15/2029 | | | 59,000 | | | | 51,242 | |
| | | | | | |
|
|
|
| | | | | | | | 1,763,858 | |
| | | | | | |
|
|
|
| Food, Beverage & Tobacco—0.63% | | | | | | | | |
Anheuser-Busch Cos LLC / Anheuser-Busch InBev Worldwide, Inc. | | | | | | | | |
4.700%, 02/01/2036 | | | 80,000 | | | | 76,623 | |
Anheuser-Busch InBev Worldwide, Inc. | | | | | | | | |
5.450%, 01/23/2039 | | | 70,000 | | | | 71,103 | |
The accompanying notes are an integral part of these financial statements.
75
ACTIVEPASSIVE CORE BOND ETF | Schedule of Investments |
August 31, 2023 (Continued)
| | | | | | | | |
| | |
| | | Principal
Amount
| | | Value
| |
Aramark Services, Inc. | | | | | | | | |
5.000%, 02/01/2028 | | $ | 45,000 | | | $ | 42,022 | |
Constellation Brands, Inc. | | | | | | | | |
5.000%, 02/02/2026 | | | 55,000 | | | | 54,333 | |
4.900%, 05/01/2033 | | | 95,000 | | | | 91,655 | |
Mars, Inc. | | | | | | | | |
4.750%, 04/20/2033 | | | 130,000 | | | | 127,712 | |
Performance Food Group, Inc. | | | | | | | | |
5.500%, 10/15/2027 | | | 15,000 | | | | 14,457 | |
Philip Morris International, Inc. | | | | | | | | |
5.125%, 02/15/2030 | | | 90,000 | | | | 89,001 | |
5.750%, 11/17/2032 | | | 60,000 | | | | 60,887 | |
| | | | | | |
|
|
|
| | | | | | | | 627,793 | |
| | | | | | |
|
|
|
| Health Care Equipment & Services—1.59% | | | | | | | | |
Acadia Healthcare Co, Inc. | | | | | | | | |
5.000%, 04/15/2029 | | | 20,000 | | | | 18,418 | |
Centene Corp. | | | | | �� | | | |
4.625%, 12/15/2029 | | | 70,000 | | | | 64,431 | |
CVS Health Corp. | | | | | | | | |
3.000%, 08/15/2026 | | | 45,000 | | | | 42,175 | |
5.125%, 02/21/2030 | | | 225,000 | | | | 221,716 | |
5.300%, 06/01/2033 | | | 75,000 | | | | 73,499 | |
4.780%, 03/25/2038 | | | 45,000 | | | | 40,324 | |
5.625%, 02/21/2053 | | | 57,000 | | | | 53,997 | |
HCA, Inc. | | | | | | | | |
5.375%, 09/01/2026 | | | 55,000 | | | | 54,616 | |
4.500%, 02/15/2027 | | | 35,000 | | | | 33,854 | |
5.875%, 02/01/2029 | | | 32,000 | | | | 32,215 | |
5.900%, 06/01/2053 | | | 40,000 | | | | 38,408 | |
Humana, Inc. | | | | | | | | |
5.500%, 03/15/2053 | | | 102,000 | | | | 98,935 | |
SSM Health Care Corp. | | | | | | | | |
4.894%, 06/01/2028 | | | 156,000 | | | | 154,668 | |
Tenet Healthcare Corp. | | | | | | | | |
4.625%, 06/15/2028 | | | 45,000 | | | | 41,485 | |
UnitedHealth Group, Inc. | | | | | | | | |
4.250%, 01/15/2029 | | | 631,000 | | | | 612,421 | |
Zimmer Biomet Holdings, Inc. | | | | | | | | |
1.450%, 11/22/2024 | | | 5,000 | | | | 4,749 | |
| | | | | | |
|
|
|
| | | | | | | | 1,585,911 | |
| | | | | | |
|
|
|
| Household & Personal Products—0.24% | | | | | | | | |
Energizer Holdings, Inc. | | | | | | | | |
4.750%, 06/15/2028 | | | 30,000 | | | | 26,522 | |
Kenvue, Inc. | | | | | | | | |
5.050%, 03/22/2053 | | | 177,000 | | | | 173,476 | |
5.200%, 03/22/2063 | | | 41,000 | | | | 40,154 | |
| | | | | | |
|
|
|
| | | | | | | | 240,152 | |
| | | | | | |
|
|
|
| Insurance—0.91% | | | | | | | | |
Alliant Holdings Intermediate LLC / Alliant Holdings Co-Issuer | | | | | | | | |
6.750%, 04/15/2028 | | | 15,000 | | | | 14,792 | |
The accompanying notes are an integral part of these financial statements.
76
ACTIVEPASSIVE CORE BOND ETF | Schedule of Investments |
August 31, 2023 (Continued)
| | | | | | | | |
| | |
| | | Principal
Amount
| | | Value
| |
Aon Corp. / Aon Global Holdings PLC | | | | | | | | |
5.350%, 02/28/2033 | | $ | 211,000 | | | $ | 210,821 | |
Arthur J Gallagher & Co. | | | | | | | | |
5.750%, 03/02/2053 | | | 4,000 | | | | 3,927 | |
CNA Financial Corp. | | | | | | | | |
4.500%, 03/01/2026 | | | 85,000 | | | | 82,901 | |
CNO Financial Group, Inc. | | | | | | | | |
5.250%, 05/30/2029 | | | 70,000 | | | | 66,750 | |
Guardian Life Global Funding | | | | | | | | |
3.246%, 03/29/2027 | | | 66,000 | | | | 61,528 | |
Marsh & McLennan Cos, Inc. | | | | | | | | |
5.450%, 03/15/2053 | | | 47,000 | | | | 46,480 | |
Metropolitan Life Global Funding I | | | | | | | | |
5.150%, 03/28/2033 | | | 233,000 | | | | 228,005 | |
Primerica, Inc. | | | | | | | | |
2.800%, 11/19/2031 | | | 75,000 | | | | 61,735 | |
Principal Financial Group, Inc. | | | | | | | | |
5.500%, 03/15/2053 | | | 77,000 | | | | 71,998 | |
Prudential Financial, Inc. | | | | | | | | |
5.700% to 09/15/2028, then 3 Month LIBOR USD + 2.665%, 09/15/2048(a) | | | 42,000 | | | | 39,823 | |
Travelers Cos, Inc. | | | | | | | | |
5.450%, 05/25/2053 | | | 20,000 | | | | 20,308 | |
| | | | | | |
|
|
|
| | | | | | | | 909,068 | |
| | | | | | |
|
|
|
| Materials—0.13% | | | | | | | | |
Cleveland-Cliffs, Inc. | | | | | | | | |
6.750%, 04/15/2030 | | | 35,000 | | | | 33,410 | |
Packaging Corp of America | | | | | | | | |
4.050%, 12/15/2049 | | | 92,000 | | | | 71,474 | |
Standard Industries, Inc. | | | | | | | | |
4.750%, 01/15/2028 | | | 30,000 | | | | 27,660 | |
| | | | | | |
|
|
|
| | | | | | | | 132,544 | |
| | | | | | |
|
|
|
| Media & Entertainment—0.79% | | | | | | | | |
Alphabet, Inc. | | | | | | | | |
2.250%, 08/15/2060 | | | 60,000 | | | | 35,147 | |
CCO Holdings LLC / CCO Holdings Capital Corp. | | | | | | | | |
4.500%, 05/01/2032 | | | 40,000 | | | | 32,464 | |
Comcast Corp. | | | | | | | | |
2.350%, 01/15/2027 | | | 45,000 | | | | 41,302 | |
5.350%, 05/15/2053 | | | 75,000 | | | | 73,447 | |
Cox Communications, Inc. | | | | | | | | |
5.700%, 06/15/2033 | | | 55,000 | | | | 54,881 | |
Meta Platforms, Inc. | | | | | | | | |
4.950%, 05/15/2033 | | | 90,000 | | | | 89,617 | |
Paramount Global | | | | | | | | |
4.200%, 05/19/2032 | | | 55,000 | | | | 45,854 | |
Take-Two Interactive Software, Inc. | | | | | | | | |
4.950%, 03/28/2028 | | | 214,000 | | | | 210,893 | |
TEGNA, Inc. | | | | | | | | |
5.000%, 09/15/2029 | | | 29,000 | | | | 25,556 | |
Walt Disney Co. | | | | | | | | |
3.800%, 05/13/2060 | | | 121,000 | | | | 91,640 | |
The accompanying notes are an integral part of these financial statements.
77
ACTIVEPASSIVE CORE BOND ETF | Schedule of Investments |
August 31, 2023 (Continued)
| | | | | | | | |
| | |
| | | Principal
Amount
| | | Value
| |
Warnermedia Holdings, Inc. | | | | | | | | |
5.141%, 03/15/2052 | | $ | 70,000 | | | $ | 55,840 | |
Ziff Davis, Inc. | | | | | | | | |
4.625%, 10/15/2030 | | | 35,000 | | | | 30,136 | |
| | | | | | |
|
|
|
| | | | | | | | 786,777 | |
| | | | | | |
|
|
|
| Pharmaceuticals, Biotechnology & Life Sciences—1.54% | | | | | | | | |
AbbVie, Inc. | | | | | | | | |
2.950%, 11/21/2026 | | | 175,000 | | | | 163,874 | |
4.050%, 11/21/2039 | | | 20,000 | | | | 17,156 | |
Amgen, Inc. | | | | | | | | |
5.507%, 03/02/2026 | | | 65,000 | | | | 65,012 | |
5.600%, 03/02/2043 | | | 115,000 | | | | 112,940 | |
5.650%, 03/02/2053 | | | 22,000 | | | | 21,825 | |
5.750%, 03/02/2063 | | | 481,000 | | | | 475,376 | |
Eli Lilly & Co. | | | | | | | | |
5.000%, 02/27/2026 | | | 228,000 | | | | 228,093 | |
4.950%, 02/27/2063 | | | 147,000 | | | | 143,748 | |
Johnson & Johnson | | | | | | | | |
3.400%, 01/15/2038 | | | 246,000 | | | | 209,078 | |
Merck & Co, Inc. | | | | | | | | |
3.900%, 03/07/2039 | | | 30,000 | | | | 26,286 | |
Regeneron Pharmaceuticals, Inc. | | | | | | | | |
2.800%, 09/15/2050 | | | 76,000 | | | | 47,300 | |
Viatris, Inc. | | | | | | | | |
2.700%, 06/22/2030 | | | 30,000 | | | | 24,383 | |
| | | | | | |
|
|
|
| | | | | | | | 1,535,071 | |
| | | | | | |
|
|
|
| Real Estate Management & Development—0.95% | | | | | | | | |
Corporate Office Properties LP | | | | | | | | |
2.750%, 04/15/2031 | | | 90,000 | | | | 69,481 | |
2.900%, 12/01/2033 | | | 70,000 | | | | 50,631 | |
Park Intermediate Holdings LLC / PK Domestic Property LLC / PK Finance Co-Issuer | | | | | | | | |
5.875%, 10/01/2028 | | | 25,000 | | | | 23,150 | |
Prologis LP | | | | | | | | |
4.750%, 06/15/2033 | | | 583,000 | | | | 559,364 | |
RHP Hotel Properties LP / RHP Finance Corp. | | | | | | | | |
4.750%, 10/15/2027 | | | 15,000 | | | | 13,960 | |
Simon Property Group LP | | | | | | | | |
5.850%, 03/08/2053 | | | 84,000 | | | | 82,490 | |
Spirit Realty LP | | | | | | | | |
4.000%, 07/15/2029 | | | 40,000 | | | | 36,017 | |
Uniti Group LP / Uniti Group Finance, Inc. / CSL Capital LLC | | | | | | | | |
10.500%, 02/15/2028 | | | 25,000 | | | | 24,963 | |
Ventas Realty LP | | | | | | | | |
3.500%, 04/15/2024 | | | 90,000 | | | | 88,552 | |
| | | | | | |
|
|
|
| | | | | | | | 948,608 | |
| | | | | | |
|
|
|
| Semiconductors & Semiconductor Equipment—0.32% | | | | | | | | |
Analog Devices, Inc. | | | | | | | | |
2.100%, 10/01/2031 | | | 100,000 | | | | 81,905 | |
Micron Technology, Inc. | | | | | | | | |
5.375%, 04/15/2028 | | | 139,000 | | | | 136,726 | |
5.875%, 09/15/2033 | | | 38,000 | | | | 37,281 | |
The accompanying notes are an integral part of these financial statements.
78
ACTIVEPASSIVE CORE BOND ETF | Schedule of Investments |
August 31, 2023 (Continued)
| | | | | | | | |
| | |
| | | Principal
Amount
| | | Value
| |
Texas Instruments, Inc. | | | | | | | | |
5.050%, 05/18/2063 | | $ | 65,000 | | | $ | 62,338 | |
| | | | | | |
|
|
|
| | | | | | | | 318,250 | |
| | | | | | |
|
|
|
| Software & Services—0.12% | | | | | | | | |
CommScope, Inc. | | | | | | | | |
4.750%, 09/01/2029 | | | 35,000 | | | | 26,041 | |
VMware, Inc. | | | | | | | | |
3.900%, 08/21/2027 | | | 100,000 | | | | 94,276 | |
| | | | | | |
|
|
|
| | | | | | | | 120,317 | |
| | | | | | |
|
|
|
| Technology Hardware & Equipment—0.62% | | | | | | | | |
Apple, Inc. | | | | | | | | |
3.350%, 02/09/2027 | | | 35,000 | | | | 33,467 | |
Avnet, Inc. | | | | | | | | |
6.250%, 03/15/2028 | | | 305,000 | | | | 307,706 | |
CDW LLC / CDW Finance Corp. | | | | | | | | |
2.670%, 12/01/2026 | | | 20,000 | | | | 18,160 | |
3.569%, 12/01/2031 | | | 45,000 | | | | 38,096 | |
Dell International LLC / EMC Corp. | | | | | | | | |
6.020%, 06/15/2026 | | | 14,000 | | | | 14,151 | |
5.300%, 10/01/2029 | | | 30,000 | | | | 29,635 | |
Hewlett Packard Enterprise Co. | | | | | | | | |
4.900%, 10/15/2025 | | | 69,000 | | | | 68,118 | |
Jabil, Inc. | | | | | | | | |
5.450%, 02/01/2029 | | | 107,000 | | | | 105,901 | |
| | | | | | |
|
|
|
| | | | | | | | 615,234 | |
| | | | | | |
|
|
|
| Telecommunication Services—0.57% | | | | | | | | |
AT&T, Inc. | | | | | | | | |
3.500%, 06/01/2041 | | | 20,000 | | | | 14,682 | |
3.500%, 09/15/2053 | | | 125,000 | | | | 82,339 | |
Frontier Communications Holdings LLC | | | | | | | | |
5.875%, 10/15/2027 | | | 45,000 | | | | 41,027 | |
Sprint Capital Corp. | | | | | | | | |
8.750%, 03/15/2032 | | | 120,000 | | | | 143,131 | |
T-Mobile USA, Inc. | | | | | | | | |
2.050%, 02/15/2028 | | | 40,000 | | | | 34,947 | |
3.375%, 04/15/2029 | | | 65,000 | | | | 58,328 | |
2.550%, 02/15/2031 | | | 55,000 | | | | 45,350 | |
4.375%, 04/15/2040 | | | 40,000 | | | | 34,405 | |
3.300%, 02/15/2051 | | | 20,000 | | | | 13,440 | |
Verizon Communications, Inc. | | | | | | | | |
2.355%, 03/15/2032 | | | 70,000 | | | | 55,386 | |
5.050%, 05/09/2033 | | | 35,000 | | | | 33,977 | |
2.650%, 11/20/2040 | | | 15,000 | | | | 10,025 | |
| | | | | | |
|
|
|
| | | | | | | | 567,037 | |
| | | | | | |
|
|
|
| Transportation—0.14% | | | | | | | | |
American Axle & Manufacturing, Inc. | | | | | | | | |
6.875%, 07/01/2028 | | | 40,000 | | | | 36,725 | |
Southwest Airlines Co. | | | | | | | | |
5.250%, 05/04/2025 | | | 60,000 | | | | 59,652 | |
The accompanying notes are an integral part of these financial statements.
79
ACTIVEPASSIVE CORE BOND ETF | Schedule of Investments |
August 31, 2023 (Continued)
| | | | | | | | |
| | |
| | | Principal
Amount
| | | Value
| |
TransDigm, Inc. | | | | | | | | |
6.750%, 08/15/2028 | | $ | 45,000 | | | $ | 45,214 | |
| | | | | | |
|
|
|
| | | | | | | | 141,591 | |
| | | | | | |
|
|
|
| Utilities—2.33% | | | | | | | | |
American Electric Power Co, Inc. | | | | | | | | |
5.625%, 03/01/2033 | | | 4,000 | | | | 4,009 | |
Arizona Public Service Co. | | | | | | | | |
2.950%, 09/15/2027 | | | 92,000 | | | | 84,632 | |
Calpine Corp. | | | | | | | | |
5.000%, 02/01/2031 | | | 45,000 | | | | 38,117 | |
CenterPoint Energy Houston Electric LLC | | | | | | | | |
4.950%, 04/01/2033 | | | 249,000 | | | | 245,057 | |
5.300%, 04/01/2053 | | | 122,000 | | | | 121,427 | |
DTE Energy Co. | | | | | | | | |
1.050%, 06/01/2025 | | | 40,000 | | | | 36,911 | |
Duke Energy Corp. | | | | | | | | |
5.000%, 08/15/2052 | | | 55,000 | | | | 48,295 | |
Duke Energy Indiana LLC | | | | | | | | |
5.400%, 04/01/2053 | | | 113,000 | | | | 110,020 | |
Edison International | | | | | | | | |
5.750%, 06/15/2027 | | | 47,000 | | | | 47,127 | |
6.950%, 11/15/2029 | | | 15,000 | | | | 15,826 | |
5.000% to 03/15/2027, then 5 Year CMT Rate + 3.901%(a)(e) | | | 65,000 | | | | 56,062 | |
Essential Utilities, Inc. | | | | | | | | |
2.704%, 04/15/2030 | | | 55,000 | | | | 46,358 | |
Evergy Kansas Central, Inc. | | | | | | | | |
5.700%, 03/15/2053 | | | 62,000 | | | | 62,063 | |
Evergy, Inc. | | | | | | | | |
2.450%, 09/15/2024 | | | 20,000 | | | | 19,300 | |
Evergy Metro, Inc. | | | | | | | | |
4.950%, 04/15/2033 | | | 60,000 | | | | 58,436 | |
Exelon Corp. | | | | | | | | |
5.300%, 03/15/2033 | | | 100,000 | | | | 98,808 | |
5.600%, 03/15/2053 | | | 139,000 | | | | 134,330 | |
Ferrellgas LP / Ferrellgas Finance Corp. | | | | | | | | |
5.875%, 04/01/2029 | | | 40,000 | | | | 35,328 | |
Interstate Power and Light Co. | | | | | | | | |
2.300%, 06/01/2030 | | | 25,000 | | | | 20,544 | |
National Fuel Gas Co. | | | | | | | | |
5.500%, 10/01/2026 | | | 77,000 | | | | 76,389 | |
NextEra Energy Capital Holdings, Inc. | | | | | | | | |
4.900%, 02/28/2028 | | | 35,000 | | | | 34,419 | |
5.250%, 02/28/2053 | | | 40,000 | | | | 37,103 | |
Pacific Gas and Electric Co. | | | | | | | | |
1.700%, 11/15/2023 | | | 85,000 | | | | 84,223 | |
Public Service Co. of Colorado | | | | | | | | |
5.250%, 04/01/2053 | | | 104,000 | | | | 96,183 | |
Public Service Electric and Gas Co. | | | | | | | | |
5.125%, 03/15/2053 | | | 117,000 | | | | 114,312 | |
San Diego Gas & Electric Co. | | | | | | | | |
5.350%, 04/01/2053 | | | 48,000 | | | | 46,576 | |
Sempra | | | | | | | | |
5.500%, 08/01/2033 | | | 50,000 | | | | 49,584 | |
The accompanying notes are an integral part of these financial statements.
80
ACTIVEPASSIVE CORE BOND ETF | Schedule of Investments |
August 31, 2023 (Continued)
| | | | | | | | |
| | |
| | | Principal
Amount
| | | Value
| |
Southern Co. | | | | | | | | |
3.250%, 07/01/2026 | | $ | 85,000 | | | $ | 80,446 | |
5.200%, 06/15/2033 | | | 155,000 | | | | 150,884 | |
Southern Co. Gas Capital Corp. | | | | | | | | |
1.750%, 01/15/2031 | | | 40,000 | | | | 31,117 | |
Union Electric Co. | | | | | | | | |
5.450%, 03/15/2053 | | | 60,000 | | | | 59,083 | |
Virginia Electric and Power Co. | | | | | | | | |
5.450%, 04/01/2053 | | | 164,000 | | | | 159,012 | |
Vistra Operations Co. LLC | | | | | | | | |
4.375%, 05/01/2029 | | | 30,000 | | | | 26,479 | |
| | | | | | |
|
|
|
| | | | | | | | 2,328,460 | |
| | | | | | |
|
|
|
TOTAL CORPORATE BONDS (Cost $19,702,444) | | | | | | | 19,306,856 | |
| | | | | | |
|
|
|
| FOREIGN CORPORATE BONDS—4.30% | | | | | | | | |
| Banks—2.18% | | | | | | | | |
Banco Bilbao Vizcaya Argentaria SA | | | | | | | | |
6.138% to 09/14/2027, then 1 Year CMT Rate + 2.700%, 09/14/2028(a) | | | 167,000 | | | | 167,861 | |
Bancolombia SA | | | | | | | | |
3.000%, 01/29/2025 | | | 203,000 | | | | 193,805 | |
Bank of Nova Scotia | | | | | | | | |
1.450%, 01/10/2025 | | | 788,000 | | | | 745,760 | |
4.500%, 12/16/2025 | | | 70,000 | | | | 67,923 | |
Credit Suisse AG/New York NY | | | | | | | | |
2.950%, 04/09/2025 | | | 251,000 | | | | 238,480 | |
Deutsche Bank AG/New York NY | | | | | | | | |
4.162%, 05/13/2025 | | | 151,000 | | | | 147,117 | |
Mitsubishi UFJ Financial Group, Inc. | | | | | | | | |
5.719% to 02/20/2025, then 1 Year CMT Rate + 1.080%, 02/20/2026(a) | | | 200,000 | | | | 199,526 | |
5.475% to 02/22/2030, then 1 Year CMT Rate + 1.530%, 02/22/2031(a) | | | 238,000 | | | | 236,216 | |
Societe Generale SA | | | | | | | | |
1.488% to 12/14/2025, then 1 Year CMT Rate + 1.100%, 12/14/2026(a) | | | 200,000 | | | | 179,318 | |
Toronto-Dominion Bank | | | | | | | | |
5.103%, 01/09/2026 | | | 4,000 | | | | 3,971 | |
| | | | | | |
|
|
|
| | | | | | | | 2,179,977 | |
| | | | | | |
|
|
|
| Capital Goods—0.25% | | | | | | | | |
Weir Group PLC | | | | | | | | |
2.200%, 05/13/2026 | | | 281,000 | | | | 253,998 | |
| | | | | | |
|
|
|
| Consumer Services—0.05% | | | | | | | | |
Carnival Corp. | | | | | | | | |
7.625%, 03/01/2026 | | | 45,000 | | | | 44,907 | |
| | | | | | |
|
|
|
| Consumer Staples Distribution & Retail—0.18% | | | | | | | | |
Viterra Finance BV | | | | | | | | |
2.000%, 04/21/2026 | | | 201,000 | | | | 181,616 | |
| | | | | | |
|
|
|
| Energy—0.28% | | | | | | | | |
BP Capital Markets PLC | | | | | | | | |
4.375% to 6/22/2025, then 5 Year CMT Rate + 4.036%(a)(e) | | | 19,000 | | | | 18,226 | |
Enbridge, Inc. | | | | | | | | |
5.700%, 03/08/2033 | | | 234,000 | | | | 234,219 | |
Newcastle Coal Infrastructure Group Pty Ltd. | | | | | | | | |
4.400%, 09/29/2027 | | | 32,000 | | | | 29,115 | |
| | | | | | |
|
|
|
| | | | | | | | 281,560 | |
| | | | | | |
|
|
|
The accompanying notes are an integral part of these financial statements.
81
ACTIVEPASSIVE CORE BOND ETF | Schedule of Investments |
August 31, 2023 (Continued)
| | | | | | | | |
| | |
| | | Principal
Amount
| | | Value
| |
| Financial Services—0.07% | | | | | | | | |
UBS Group AG | | | | | | | | |
2.193% to 06/05/2025, then SOFR + 2.044%, 06/05/2026(a) | | $ | 65,000 | | | $ | 60,580 | |
1.305% to 02/02/2026, then SOFRINDX + 0.980%, 02/02/2027(a) | | | 13,000 | | | | 11,590 | |
| | | | | | |
|
|
|
| | | | | | | | 72,170 | |
| | | | | | |
|
|
|
| Health Care Equipment & Services—0.07% | | | | | | | | |
Utah Acquisition Sub, Inc. | | | | | | | | |
3.950%, 06/15/2026 | | | 75,000 | | | | 70,916 | |
| | | | | | |
|
|
|
| Insurance—0.21% | | | | | | | | |
Fairfax Financial Holdings Ltd. | | | | | | | | |
3.375%, 03/03/2031 | | | 253,000 | | | | 212,361 | |
| | | | | | |
|
|
|
| Materials—0.60% | | | | | | | | |
BHP Billiton Finance USA Ltd. | | | | | | | | |
4.900%, 02/28/2033 | | | 328,000 | | | | 323,958 | |
Hudbay Minerals, Inc. | | | | | | | | |
6.125%, 04/01/2029 | | | 25,000 | | | | 23,527 | |
NOVA Chemicals Corp. | | | | | | | | |
4.875%, 06/01/2024 | | | 35,000 | | | | 34,460 | |
OCI NV | | | | | | | | |
6.700%, 03/16/2033 | | | 218,000 | | | | 214,190 | |
UPM-Kymmene Oyj | | | | | | | | |
7.450%, 11/26/2027 | | | 6,000 | | | | 6,282 | |
| | | | | | |
|
|
|
| | | | | | | | 602,417 | |
| | | | | | |
|
|
|
| Pharmaceuticals, Biotechnology & Life Sciences -0.04% | | | | | | | | |
Pfizer Investment Enterprises Pte Ltd. | | | | | | | | |
5.340%, 05/19/2063 | | | 35,000 | | | | 34,514 | |
| | | | | | |
|
|
|
| Technology Hardware & Equipment—0.06% | | | | | | | | |
NXP BV / NXP Funding LLC / NXP USA, Inc. | | | | | | | | |
5.000%, 01/15/2033 | | | 65,000 | | | | 61,771 | |
| | | | | | |
|
|
|
| Transportation—0.31% | | | | | | | | |
AerCap Ireland Capital DAC / AerCap Global Aviation Trust | | | | | | | | |
3.500%, 01/15/2025 | | | 150,000 | | | | 144,951 | |
American Airlines Inc/AAdvantage Loyalty IP Ltd. | | | | | | | | |
5.500%, 04/20/2026 | | | 77,917 | | | | 76,540 | |
Canadian Pacific Railway Co. | | | | | | | | |
2.875%, 11/15/2029 | | | 33,000 | | | | 29,069 | |
Delta Air Lines Inc / SkyMiles IP Ltd. | | | | | | | | |
4.750%, 10/20/2028 | | | 57,000 | | | | 54,768 | |
| | | | | | |
|
|
|
| | | | | | | | 305,328 | |
| | | | | | |
|
|
|
TOTAL FOREIGN CORPORATE BONDS—($4,350,321) | | | | | | | 4,301,535 | |
| | | | | | |
|
|
|
| FOREIGN GOVERNMENT AGENCY ISSUES—0.05% | | | | | | | | |
International Bank for Reconstruction & Development | | | | | | | | |
4.000%, 07/25/2030 | | | 55,000 | | | | 53,853 | |
| | | | | | |
|
|
|
TOTAL FOREIGN GOVERNMENT AGENCY ISSUES (Cost $54,890) | | | | | | | 53,853 | |
| | | | | | |
|
|
|
| FOREIGN GOVERNMENT NOTES/BONDS—0.08% | | | | | | | | |
Province of Quebec | | | | | | | | |
4.500%, 09/08/2033 | | | 85,000 | | | | 84,786 | |
| | | | | | |
|
|
|
TOTAL FOREIGN GOVERNMENT NOTES/BONDS (Cost $84,675) | | | | | | | 84,786 | |
| | | | | | |
|
|
|
The accompanying notes are an integral part of these financial statements.
82
ACTIVEPASSIVE CORE BOND ETF | Schedule of Investments |
August 31, 2023 (Continued)
| | | | | | | | |
| | |
| | | Principal
Amount
| | | Value
| |
| NON-AGENCY MORTGAGE BACKED SECURITIES—1.71% | | | | | | | | |
American Tower Trust #1 | | | | | | | | |
2018-1, 3.652%, 03/23/2028 | | $ | 54,000 | | | $ | 50,090 | |
BANK | | | | | | | | |
2022-BNK39, 2.928%, 02/15/2055(c) | | | 100,000 | | | | 83,221 | |
Benchmark Mortgage Trust | | | | | | | | |
2020-B21, 1.978%, 12/17/2053 | | | 65,000 | | | | 50,951 | |
2021-B29, 2.388%, 09/15/2054 | | | 100,000 | | | | 79,859 | |
2022-B34, 3.786%, 04/15/2055(c) | | | 100,000 | | | | 84,666 | |
2019-B15, 3.231%, 12/15/2072 | | | 25,000 | | | | 20,612 | |
BMO Mortgage Trust | | | | | | | | |
2023-C5, 6.848%, 06/15/2056(c) | | | 10,000 | | | | 9,293 | |
BX Commercial Mortgage Trust | | | | | | | | |
2021-VOLT, 6.525% (TSFR1M + 1.214%), 09/15/2036(b) | | | 100,000 | | | | 95,788 | |
BX Trust | | | | | | | | |
2019-OC11, 3.202%, 12/09/2041 | | | 50,000 | | | | 43,033 | |
Citigroup Commercial Mortgage Trust | | | | | | | | |
2014-GC19, 4.023%, 03/11/2047 | | | 103,000 | | | | 102,281 | |
2022-GC48, 4.742%, 05/15/2054(c) | | | 55,000 | | | | 51,950 | |
COMM Mortgage Trust | | | | | | | | |
2014-CCRE21, 3.987%, 12/10/2047 | | | 20,000 | | | | 19,203 | |
Connecticut Avenue Securities Trust | | | | | | | | |
2021-R03, 6.938% (SOFR30A + 1.650%), 12/25/2041(b) | | | 55,000 | | | | 53,677 | |
2022-R02, 6.488% (SOFR30A + 1.200%), 01/25/2042(b) | | | 52,767 | | | | 52,517 | |
2022-R04, 8.388% (SOFR30A + 3.100%), 03/25/2042(b) | | | 55,000 | | | | 55,852 | |
2022-R03, 8.788% (SOFR30A + 3.500%), 03/25/2042(b) | | | 60,000 | | | | 61,754 | |
2022-R07, 9.946% (SOFR30A + 4.650%), 06/25/2042(b) | | | 55,000 | | | | 58,874 | |
2022-R08, 7.838% (SOFR30A + 2.550%), 07/25/2042(b) | | | 92,538 | | | | 94,353 | |
2023-R02, 7.588% (SOFR30A + 2.300%), 01/25/2043(b) | | | 91,826 | | | | 93,037 | |
FIVE Mortgage Trust | | | | | | | | |
2023-V1, 5.668%, 02/10/2056(c) | | | 100,000 | | | | 99,891 | |
JPMBB Commercial Mortgage Securities Trust | | | | | | | | |
2015-C33, 3.504%, 12/15/2048 | | | 78,971 | | | | 74,879 | |
Morgan Stanley Capital I Trust | | | | | | | | |
2015-MS1, 3.779%, 05/15/2048(c) | | | 60,000 | | | | 57,354 | |
2018-H4, 5.237%, 12/15/2051(c) | | | 25,000 | | | | 20,806 | |
2020-HR8, 2.041%, 07/15/2053 | | | 55,000 | | | | 43,929 | |
SG Residential Mortgage Trust | | | | | | | | |
2021-2, 1.737%, 12/25/2061(c) | | | 81,309 | | | | 66,670 | |
Taubman Centers Commercial Mortgage Trust | | | | | | | | |
2022-DPM, 7.496% (TSFR1M + 2.186%), 05/15/2037(b) | | | 100,000 | | | | 97,841 | |
Wells Fargo Commercial Mortgage Trust | | | | | | | | |
2019-C54, 3.146%, 12/15/2052 | | | 100,000 | | | | 86,927 | |
| | | | | | |
|
|
|
TOTAL NON-AGENCY MORTGAGE BACKED SECURITIES (Cost $1,733,431) | | | | | | | 1,709,308 | |
| | | | | | |
|
|
|
| AGENCY MORTGAGE BACKED SECURITIES—8.67% | | | | | | | | |
Fannie Mae Connecticut Avenue Securities | | | | | | | | |
2014-C02, 8.002% (SOFR30A + 2.714%), 05/25/2024(b) | | | 134,581 | | | | 135,624 | |
Fannie Mae Pool | | | | | | | | |
CB1149, 3.000%, 07/01/2051 | | | 293,826 | | | | 254,010 | |
BT6823, 2.500%, 10/01/2051 | | | 184,284 | | | | 153,260 | |
FM9540, 2.000%, 11/01/2051 | | | 225,549 | | | | 180,553 | |
FS0288, 2.000%, 01/01/2052 | | | 85,545 | | | | 68,428 | |
FS0176, 2.500%, 01/01/2052 | | | 428,488 | | | | 355,847 | |
The accompanying notes are an integral part of these financial statements.
83
ACTIVEPASSIVE CORE BOND ETF | Schedule of Investments |
August 31, 2023 (Continued)
| | | | | | | | |
| | |
| | | Principal
Amount
| | | Value
| |
MA4512, 2.500%, 01/01/2052 | | $ | 48,526 | | | $ | 40,291 | |
FS2040, 2.000%, 02/01/2052 | | | 93,120 | | | | 74,336 | |
MA4548, 2.500%, 02/01/2052 | | | 31,788 | | | | 26,365 | |
FS0631, 3.000%, 02/01/2052 | | | 33,980 | | | | 29,373 | |
MA4563, 2.500%, 03/01/2052 | | | 61,262 | | | | 50,810 | |
FS4110, 2.500%, 03/01/2052 | | | 24,084 | | | | 20,047 | |
MA4579, 3.000%, 04/01/2052 | | | 52,610 | | | | 45,370 | |
CB3586, 3.000%, 05/01/2052 | | | 194,346 | | | | 167,742 | |
MA4600, 3.500%, 05/01/2052 | | | 275,355 | | | | 246,470 | |
MA4625, 3.500%, 06/01/2052 | | | 84,295 | | | | 75,398 | |
FS2512, 3.500%, 07/01/2052 | | | 331,099 | | | | 297,523 | |
CB4121, 4.000%, 07/01/2052 | | | 247,543 | | | | 228,963 | |
FS3497, 3.500%, 08/01/2052 | | | 216,956 | | | | 194,057 | |
MA4700, 4.000%, 08/01/2052 | | | 283,627 | | | | 261,964 | |
FS2805, 2.500%, 09/01/2052 | | | 354,864 | | | | 294,380 | |
MA4732, 4.000%, 09/01/2052 | | | 23,765 | | | | 21,955 | |
MA4761, 5.000%, 09/01/2052 | | | 227,154 | | | | 220,507 | |
MA4784, 4.500%, 10/01/2052 | | | 23,678 | | | | 22,465 | |
MA4786, 5.500%, 10/01/2052 | | | 31,558 | | | | 31,172 | |
MA4805, 4.500%, 11/01/2052 | | | 190,607 | | | | 180,843 | |
BX5065, 5.500%, 01/01/2053 | | | 23,320 | | | | 23,044 | |
MA4918, 5.000%, 02/01/2053 | | | 173,375 | | | | 168,233 | |
MA4940, 5.000%, 03/01/2053 | | | 28,931 | | | | 28,066 | |
CB6031, 5.000%, 04/01/2053 | | | 54,365 | | | | 52,782 | |
MA5009, 5.000%, 05/01/2053 | | | 171,516 | | | | 166,410 | |
FS4874, 5.500%, 06/01/2053 | | | 24,642 | | | | 24,350 | |
FS5235, 5.500%, 07/01/2053 | | | 219,701 | | | | 217,143 | |
MA5073, 6.000%, 07/01/2053 | | | 24,577 | | | | 24,651 | |
MA5108, 6.000%, 08/01/2053 | | | 54,626 | | | | 54,792 | |
Fannie Mae or Freddie Mac | | | | | | | | |
#TBA, 5.500%, 9/14/2023 | | | 35,000 | | | | 34,560 | |
Freddie Mac Pool | | | | | | | | |
RA-3661, 2.500%, 10/01/2050 | | | 123,774 | | | | 103,574 | |
SD-8157, 3.000%, 07/01/2051 | | | 69,463 | | | | 60,043 | |
SD-0781, 3.000%, 11/01/2051 | | | 83,370 | | | | 72,219 | |
SD-8188, 2.000%, 01/01/2052 | | | 106,832 | | | | 85,305 | |
SD-8199, 2.000%, 03/01/2052 | | | 46,345 | | | | 36,949 | |
SD-8205, 2.500%, 04/01/2052 | | | 204,068 | | | | 169,245 | |
SD-8214, 3.500%, 05/01/2052 | | | 229,036 | | | | 204,862 | |
SD-8221, 3.500%, 06/01/2052 | | | 28,035 | | | | 25,080 | |
RA-7587, 3.500%, 06/01/2052 | | | 208,133 | | | | 186,244 | |
SD-8222, 4.000%, 06/01/2052 | | | 91,039 | | | | 84,086 | |
SD-1117, 4.500%, 06/01/2052 | | | 22,399 | | | | 21,307 | |
QE-6074, 4.000%, 07/01/2052 | | | 34,879 | | | | 32,218 | |
SD-1505, 4.500%, 08/01/2052 | | | 91,816 | | | | 87,163 | |
SD-8244, 4.000%, 09/01/2052 | | | 190,533 | | | | 176,020 | |
RA-8249, 5.500%, 11/01/2052 | | | 147,202 | | | | 145,405 | |
SD-2253, 3.500%, 12/01/2052 | | | 169,951 | | | | 152,013 | |
SD-8289, 5.500%, 01/01/2053 | | | 181,428 | | | | 179,214 | |
QF-7085, 5.500%, 02/01/2053 | | | 70,946 | | | | 70,069 | |
SD-8315, 5.000%, 04/01/2053 | | | 194,798 | | | | 188,973 | |
SD-8316, 5.500%, 04/01/2053 | | | 600,013 | | | | 592,595 | |
SD-3218, 5.000%, 05/01/2053 | | | 24,905 | | | | 24,170 | |
SD-8324, 5.500%, 05/01/2053 | | | 77,429 | | | | 76,471 | |
The accompanying notes are an integral part of these financial statements.
84
ACTIVEPASSIVE CORE BOND ETF | Schedule of Investments |
August 31, 2023 (Continued)
| | | | | | | | |
| | |
| | | Principal
Amount
| | | Value
| |
SD-8325, 6.000%, 05/01/2053 | | $ | 129,649 | | | $ | 130,042 | |
SD-2862, 6.000%, 05/01/2053 | | | 24,222 | | | | 24,296 | |
Freddie Mac STACR REMIC Trust | | | | | | | | |
2021-DNA6, 6.088% (SOFR30A + 0.800%), 10/25/2041(b) | | | 44,641 | | | | 44,481 | |
2021-HQA4, 6.238% (SOFR30A + 0.950%), 12/25/2041(b) | | | 85,074 | | | | 83,422 | |
2022-DNA2, 7.688% (SOFR30A + 2.400%), 02/25/2042(b) | | | 60,000 | | | | 59,835 | |
2022-HQA1, 8.788% (SOFR30A + 3.500%), 03/25/2042(b) | | | 55,000 | | | | 56,703 | |
2022-DNA3, 8.188% (SOFR30A + 2.900%), 04/25/2042(b) | | | 55,000 | | | | 55,998 | |
2022-DNA4, 8.638% (SOFR30A + 3.350%), 05/25/2042(b) | | | 55,000 | | | | 56,712 | |
Ginnie Mae | | | | | | | | |
#TBA, 5.500%, 9/21/2023 | | | 115,000 | | | | 113,841 | |
Ginnie Mae II Pool | | | | | | | | |
MA7935M, 2.000%, 03/20/2052 | | | 91,581 | | | | 75,627 | |
MA7936M, 2.500%, 03/20/2052 | | | 180,493 | | | | 153,731 | |
MA8147M, 2.500%, 07/20/2052 | | | 22,876 | | | | 19,489 | |
MA8149M, 3.500%, 07/20/2052 | | | 38,742 | | | | 35,201 | |
MA8151M, 4.500%, 07/20/2052 | | | 165,583 | | | | 157,992 | |
MA8492M, 6.000%, 12/20/2052 | | | 24,113 | | | | 24,215 | |
MA8800M, 5.000%, 04/20/2053 | | | 119,798 | | | | 116,638 | |
MA8948M, 5.500%, 06/20/2053 | | | 24,884 | | | | 24,644 | |
MA9018M, 6.000%, 07/20/2053 | | | 49,908 | | | | 50,121 | |
MA9107M, 6.000%, 08/20/2053 | | | 25,000 | | | | 25,106 | |
Government National Mortgage Association | | | | | | | | |
2020-107, 1.000%, 07/20/2050 | | | 56,161 | | | | 42,737 | |
2020-112, 1.000%, 08/20/2050 | | | 51,162 | | | | 38,938 | |
2021-103, 2.000%, 06/20/2051 | | | 38,987 | | | | 32,459 | |
| | | | | | |
|
|
|
TOTAL AGENCY MORTGAGE BACKED SECURITIES (Cost $8,897,682) | | | | | | | 8,667,237 | |
| | | | | | |
|
|
|
| U.S. GOVERNMENT NOTES/BONDS—36.47% | | | | | | | | |
United States Treasury Inflation Indexed Bonds | | | | | | | | |
1.250%, 04/15/2028 | | | 147,494 | | | | 142,044 | |
1.125%, 01/15/2033 | | | 316,503 | | | | 295,349 | |
United States Treasury Note/Bond | | | | | | | | |
0.375%, 08/15/2024 | | | 405,000 | | | | 386,128 | |
4.625%, 02/28/2025 | | | 1,809,000 | | | | 1,796,633 | |
3.875%, 03/31/2025 | | | 2,285,000 | | | | 2,243,851 | |
3.875%, 04/30/2025 | | | 279,000 | | | | 273,954 | |
4.750%, 07/31/2025 | | | 370,000 | | | | 369,032 | |
4.250%, 10/15/2025 | | | 68,000 | | | | 67,248 | |
4.000%, 12/15/2025 | | | 303,000 | | | | 298,135 | |
4.000%, 02/15/2026 | | | 1,002,000 | | | | 986,305 | |
0.500%, 02/28/2026 | | | 384,000 | | | | 346,770 | |
4.625%, 03/15/2026 | | | 1,657,000 | | | | 1,655,900 | |
3.750%, 04/15/2026 | | | 626,000 | | | | 612,551 | |
4.125%, 06/15/2026 | | | 573,000 | | | | 566,419 | |
1.875%, 07/31/2026 | | | 345,000 | | | | 320,109 | |
1.500%, 08/15/2026 | | | 158,000 | | | | 144,848 | |
6.750%, 08/15/2026 | | | 1,637,000 | | | | 1,735,795 | |
0.750%, 08/31/2026 | | | 132,000 | | | | 118,197 | |
2.000%, 11/15/2026 | | | 111,000 | | | | 102,788 | |
1.625%, 11/30/2026 | | | 205,000 | | | | 187,463 | |
4.125%, 10/31/2027 | | | 791,000 | | | | 783,739 | |
6.125%, 11/15/2027 | | | 1,666,000 | | | | 1,779,300 | |
4.000%, 02/29/2028 | | | 756,000 | | | | 746,757 | |
The accompanying notes are an integral part of these financial statements.
85
ACTIVEPASSIVE CORE BOND ETF | Schedule of Investments |
August 31, 2023 (Continued)
| | | | | | | | |
| | |
| | | Principal
Amount
| | | Value
| |
3.625%, 03/31/2028 | | $ | 2,160,000 | | | $ | 2,099,924 | |
3.500%, 04/30/2028 | | | 697,000 | | | | 673,925 | |
4.000%, 06/30/2028 | | | 230,000 | | | | 227,269 | |
4.125%, 07/31/2028 | | | 806,000 | | | | 801,340 | |
5.250%, 11/15/2028 | | | 1,659,000 | | | | 1,732,618 | |
3.250%, 06/30/2029 | | | 589,000 | | | | 558,676 | |
4.000%, 02/28/2030 | | | 1,610,000 | | | | 1,589,749 | |
3.625%, 03/31/2030 | | | 658,000 | | | | 635,690 | |
1.875%, 02/15/2032 | | | 1,941,000 | | | | 1,631,805 | |
2.750%, 08/15/2032 | | | 1,286,000 | | | | 1,154,537 | |
3.500%, 02/15/2033 | | | 1,600,200 | | | | 1,524,191 | |
3.375%, 05/15/2033 | | | 860,000 | | | | 810,281 | |
3.875%, 08/15/2033 | | | 207,000 | | | | 203,329 | |
4.750%, 02/15/2037 | | | 587,000 | | | | 627,265 | |
1.125%, 05/15/2040 | | | 589,000 | | | | 365,042 | |
1.125%, 08/15/2040 | | | 98,000 | | | | 60,209 | |
1.375%, 11/15/2040 | | | 638,000 | | | | 407,572 | |
1.875%, 02/15/2041 | | | 640,000 | | | | 444,425 | |
2.250%, 05/15/2041 | | | 147,000 | | | | 108,378 | |
1.750%, 08/15/2041 | | | 637,000 | | | | 428,283 | |
2.000%, 11/15/2041 | | | 615,000 | | | | 430,596 | |
3.125%, 11/15/2041 | | | 19,000 | | | | 16,033 | |
2.375%, 02/15/2042 | | | 587,000 | | | | 436,879 | |
3.125%, 02/15/2042 | | | 16,000 | | | | 13,448 | |
3.875%, 02/15/2043 | | | 540,000 | | | | 502,538 | |
2.875%, 05/15/2043 | | | 250,000 | | | | 199,180 | |
3.750%, 11/15/2043 | | | 165,000 | | | | 150,124 | |
3.375%, 05/15/2044 | | | 165,000 | | | | 141,523 | |
2.500%, 02/15/2045 | | | 105,000 | | | | 77,122 | |
3.125%, 05/15/2048 | | | 215,000 | | | | 174,662 | |
2.250%, 08/15/2049 | | | 357,000 | | | | 242,913 | |
2.000%, 02/15/2050 | | | 338,000 | | | | 216,492 | |
1.375%, 08/15/2050 | | | 388,000 | | | | 209,778 | |
1.625%, 11/15/2050 | | | 364,000 | | | | 210,637 | |
1.875%, 02/15/2051 | | | 370,000 | | | | 228,316 | |
2.375%, 05/15/2051 | | | 421,000 | | | | 292,694 | |
2.000%, 08/15/2051 | | | 359,000 | | | | 227,979 | |
1.875%, 11/15/2051 | | | 39,000 | | | | 23,971 | |
2.250%, 02/15/2052 | | | 335,000 | | | | 226,099 | |
2.875%, 05/15/2052 | | | 95,000 | | | | 73,770 | |
3.000%, 08/15/2052 | | | 296,000 | | | | 235,979 | |
3.625%, 02/15/2053 | | | 40,000 | | | | 36,047 | |
3.625%, 05/15/2053 | | | 35,000 | | | | 31,574 | |
| | | | | | |
|
|
|
TOTAL U.S. GOVERNMENT NOTES/BONDS (Cost $37,781,139) | | | | | | | 36,442,177 | |
| | | | | | |
|
|
|
| US GOVERNMENT AGENCY ISSUE—0.12% | | | | | | | | |
Federal Home Loan Banks | | | | | | | | |
4.000%, 06/30/2028 | | | 50,000 | | | | 49,433 | |
Federal National Mortgage Association | | | | | | | | |
7.250%, 05/15/2030 | | | 60,000 | | | | 70,093 | |
| | | | | | |
|
|
|
TOTAL US GOVERNMENT AGENCY ISSUE (Cost $119,990) | | | | | | | 119,526 | |
| | | | | | |
|
|
|
The accompanying notes are an integral part of these financial statements.
86
ACTIVEPASSIVE CORE BOND ETF | Schedule of Investments |
August 31, 2023 (Continued)
| | | | | | | | |
| | |
| | | Shares
| | | Value
| |
| EXCHANGE TRADED FUNDS—26.30% | | | | | | | | |
iShares Core U.S. Aggregate Bond ETF | | | 32,152 | | | $ | 3,112,314 | |
iShares MBS ETF | | | 141,799 | | | | 13,031,328 | |
Vanguard Total International Bond ETF | | | 207,841 | | | | 10,134,327 | |
| | | | | | |
|
|
|
TOTAL EXCHANGE TRADED FUNDS (Cost $26,684,083) | | | | | | | 26,277,969 | |
| | | | | | |
|
|
|
| MONEY MARKET FUNDS—0.89% | | | | | | | | |
First American Government Obligations Fund, Class X, 5.247%(d) | | | 886,421 | | | | 886,421 | |
| | | | | | |
|
|
|
| TOTAL MONEY MARKET FUNDS (Cost $886,421) | | | | | | | 886,421 | |
| | | | | | |
|
|
|
| Total Investments (Cost $101,949,368)—99.55% | | | | | | | 99,484,629 | |
Other Assets in Excess of Liabilities—0.45% | | | | | | | 448,218 | |
| | | | | | |
|
|
|
| TOTAL NET ASSETS—100.00% | | | | | | $ | 99,932,847 | |
| | | | | | |
|
|
|
Percentages are stated as a percent of net assets.
| (a) | | Variable rate security; the rate shown represents the rate at August 31, 2023. |
| (b) | | Floating rate security; the rate shown represents the rate at August 31, 2023. The coupon is based on an underlying pool of loans and other conditions at the time the loans are securitized. |
| (c) | | Variable rate security; the rate shown represents the rate at August 31, 2023. The coupon is based on an underlying pool of loans and other conditions at the time the loans are securitized. |
| (d) | | The rate shown represents the seven day yield at August 31, 2023. |
| (e) | | Perpetual maturity. The date referenced is the next call date. |
Abbreviations
| # | | TBA Pool number to be announced |
The Global Industry Classification Standard (GICS®) was developed by and/or is the exclusive property of MSCI, Inc. and Standard & Poors Financial Services LLC (“S&P”). GICS is a service mark of MSCI and S&P and has been licensed for use by U.S. Bancorp Fund Services, LLC.
The accompanying notes are an integral part of these financial statements.
87
ACTIVEPASSIVE INTERMEDIATE MUNICIPAL BOND ETF | Schedule of Investments |
August 31, 2023 (Continued)
| | | | | | | | |
| | |
| | | Principal
Amount
| | | Value
| |
| MUNICIPAL BONDS—92.01% | | | | | | | | |
Allegheny County Hospital Development Authority | | | | | | | | |
5.000%, 07/15/2028 | | $ | 345,000 | | | $ | 370,161 | |
5.000%, 07/15/2031 | | | 200,000 | | | | 216,750 | |
Anaheim Public Financing Authority | | | | | | | | |
0.000%, 09/01/2031 | | | 170,000 | | | | 125,657 | |
Bartow County Development Authority | | | | | | | | |
2.875%, 08/01/2043(a) | | | 135,000 | | | | 130,809 | |
Bay Area Toll Authority | | | | | | | | |
4.000%, 04/01/2032 | | | 145,000 | | | | 148,758 | |
Black Belt Energy Gas District | | | | | | | | |
4.000%, 07/01/2052(a) | | | 20,000 | | | | 19,789 | |
Board of Regents of the University of Texas System | | | | | | | | |
5.000%, 08/15/2025 | | | 85,000 | | | | 87,776 | |
California State Public Works Board | | | | | | | | |
5.000%, 12/01/2024 | | | 320,000 | | | | 327,427 | |
Canadian County Educational Facilities Authority | | | | | | | | |
3.000%, 09/01/2029 | | | 175,000 | | | | 171,204 | |
Central Florida Expressway Authority | | | | | | | | |
5.000%, 07/01/2028 | | | 170,000 | | | | 185,525 | |
Central Puget Sound Regional Transit Authority | | | | | | | | |
5.000%, 11/01/2024 | | | 170,000 | | | | 173,188 | |
5.000%, 11/01/2030 | | | 245,000 | | | | 277,762 | |
City & County of Honolulu HI | | | | | | | | |
5.000%, 03/01/2031 | | | 95,000 | | | | 106,691 | |
City of Dallas TX | | | | | | | | |
5.000%, 02/15/2031 | | | 200,000 | | | | 224,651 | |
City of Houston TX Airport System Revenue | | | | | | | | |
5.000%, 07/01/2029 | | | 220,000 | | | | 237,408 | |
City of New York NY | | | | | | | | |
5.000%, 08/01/2029 | | | 265,000 | | | | 276,147 | |
5.000%, 08/01/2030 | | | 150,000 | | | | 168,093 | |
5.000%, 12/01/2032 | | | 90,000 | | | | 94,081 | |
City of San Antonio TX Electric & Gas Systems Revenue | | | | | | | | |
5.000%, 02/01/2025 | | | 225,000 | | | | 229,922 | |
5.000%, 02/01/2032 | | | 95,000 | | | | 98,571 | |
Cleveland County Independent School District No 2 Moore | | | | | | | | |
3.000%, 03/01/2025 | | | 115,000 | | | | 114,070 | |
Commonwealth of Massachusetts | | | | | | | | |
5.250%, 09/01/2024 | | | 280,000 | | | | 285,322 | |
Commonwealth of Pennsylvania | | | | | | | | |
5.000%, 10/01/2024 | | | 370,000 | | | | 376,586 | |
3.000%, 03/15/2030 | | | 70,000 | | | | 67,830 | |
5.000%, 08/15/2032 | | | 420,000 | | | | 434,451 | |
Connecticut State Health & Educational Facilities Authority | | | | | | | | |
5.000%, 07/01/2029 | | | 160,000 | | | | 178,652 | |
County of Clark NV | | | | | | | | |
5.000%, 07/01/2026 | | | 120,000 | | | | 125,889 | |
County of Harris TX | | | | | | | | |
5.000%, 08/15/2030 | | | 410,000 | | | | 427,320 | |
County of Harris TX Toll Road Revenue | | | | | | | | |
5.000%, 08/15/2027 | | | 220,000 | | | | 235,501 | |
The accompanying notes are an integral part of these financial statements.
88
ACTIVEPASSIVE INTERMEDIATE MUNICIPAL BOND ETF | Schedule of Investments |
August 31, 2023 (Continued)
| | | | | | | | |
| | |
| | | Principal
Amount
| | | Value
| |
County of King WA Sewer Revenue | | | | | | | | |
5.000%, 07/01/2024 | | $ | 200,000 | | | $ | 202,797 | |
4.000%, 07/01/2030 | | | 290,000 | | | | 295,268 | |
County of Manatee FL Public Utilities Revenue | | | | | | | | |
5.000%, 10/01/2032 | | | 200,000 | | | | 231,864 | |
County of Montgomery MD | | | | | | | | |
5.000%, 11/01/2028 | | | 105,000 | | | | 107,029 | |
County of Prince George’s MD | | | | | | | | |
5.000%, 09/15/2029 | | | 95,000 | | | | 106,224 | |
County of Wake NC | | | | | | | | |
5.000%, 05/01/2030 | | | 95,000 | | | | 107,343 | |
Curators of the University of Missouri | | | | | | | | |
5.000%, 11/01/2030 | | | 250,000 | | | | 282,741 | |
Dallas College | | | | | | | | |
5.000%, 02/15/2030 | | | 35,000 | | | | 38,779 | |
Dallas Fort Worth International Airport | | | | | | | | |
5.000%, 11/01/2031 | | | 55,000 | | | | 61,570 | |
District of Columbia | | | | | | | | |
5.000%, 10/15/2025 | | | 290,000 | | | | 300,739 | |
5.000%, 06/01/2026 | | | 150,000 | | | | 154,000 | |
5.000%, 10/15/2028 | | | 250,000 | | | | 274,886 | |
Energy Northwest | | | | | | | | |
5.000%, 07/01/2026 | | | 150,000 | | | | 151,927 | |
Ernest N Morial New Orleans Exhibition Hall Authority | | | | | | | | |
5.000%, 07/15/2029 | | | 200,000 | | | | 219,607 | |
Florida Department of Management Services | | | | | | | | |
5.000%, 11/01/2028 | | | 295,000 | | | | 323,865 | |
Georgia State Road & Tollway Authority | | | | | | | | |
5.000%, 06/01/2030 | | | 165,000 | | | | 185,831 | |
Hillsborough County School Board | | | | | | | | |
5.000%, 07/01/2029 | | | 355,000 | | | | 384,475 | |
Houston County Health Care Authority | | | | | | | | |
5.000%, 10/01/2030 | | | 135,000 | | | | 136,563 | |
Illinois Finance Authority | | | | | | | | |
5.000%, 07/01/2027 | | | 225,000 | | | | 237,876 | |
Illinois State Toll Highway Authority | | | | | | | | |
5.000%, 01/01/2030 | | | 150,000 | | | | 165,988 | |
Indiana Finance Authority | | | | | | | | |
5.000%, 06/01/2027 | | | 165,000 | | | | 174,437 | |
5.000%, 06/01/2028 | | | 125,000 | | | | 132,268 | |
Intermountain Power Agency | | | | | | | | |
5.000%, 07/01/2026 | | | 200,000 | | | | 209,926 | |
5.000%, 07/01/2031 | | | 320,000 | | | | 363,002 | |
Iowa Finance Authority | | | | | | | | |
5.000%, 08/01/2032 | | | 250,000 | | | | 285,878 | |
JEA Water & Sewer System Revenue | | | | | | | | |
5.000%, 10/01/2028 | | | 160,000 | | | | 172,220 | |
Johnson County Unified School District No 233 Olathe | | | | | | | | |
2.250%, 09/01/2026 | | | 405,000 | | | | 384,645 | |
Kendall Kane & Will Counties Community Unit School District No 308 | | | | | | | | |
5.000%, 02/01/2029 | | | 125,000 | | | | 136,227 | |
Kentucky Asset Liability Commission | | | | | | | | |
5.000%, 09/01/2026 | | | 410,000 | | | | 416,123 | |
The accompanying notes are an integral part of these financial statements.
89
ACTIVEPASSIVE INTERMEDIATE MUNICIPAL BOND ETF | Schedule of Investments |
August 31, 2023 (Continued)
| | | | | | | | |
| | |
| | | Principal
Amount
| | | Value
| |
Los Angeles Department of Water & Power | | | | | | | | |
5.000%, 07/01/2026 | | $ | 200,000 | | | $ | 211,368 | |
Louisville/Jefferson County Metropolitan Government | | | | | | | | |
5.000%, 10/01/2047(a) | | | 110,000 | | | | 115,924 | |
Lower Colorado River Authority | | | | | | | | |
5.000%, 05/15/2028 | | | 200,000 | | | | 215,274 | |
Maricopa County Industrial Development Authority | | | | | | | | |
5.000%, 01/01/2033 | | | 190,000 | | | | 198,063 | |
Maryland Stadium Authority Built to Learn Revenue | | | | | | | | |
5.000%, 06/01/2025 | | | 175,000 | | | | 179,689 | |
Massachusetts Development Finance Agency | | | | | | | | |
5.000%, 07/01/2050(a) | | | 70,000 | | | | 77,513 | |
Massachusetts Housing Finance Agency | | | | | | | | |
3.350%, 06/01/2027 | | | 265,000 | | | | 260,516 | |
3.050%, 12/01/2027 | | | 520,000 | | | | 508,965 | |
Metropolitan Atlanta Rapid Transit Authority | | | | | | | | |
5.000%, 07/01/2026 | | | 200,000 | | | | 210,369 | |
Michigan Finance Authority | | | | | | | | |
5.000%, 07/01/2031 | | | 50,000 | | | | 50,545 | |
Michigan State Building Authority | | | | | | | | |
5.000%, 10/15/2030 | | | 200,000 | | | | 209,486 | |
Municipal Improvement Corp. of Los Angeles | | | | | | | | |
5.000%, 11/01/2028 | | | 190,000 | | | | 201,912 | |
New Jersey Economic Development Authority | | | | | | | | |
3.125%, 07/01/2031 | | | 255,000 | | | | 244,193 | |
New Jersey Educational Facilities Authority | | | | | | | | |
4.000%, 07/01/2028 | | | 790,000 | | | | 794,272 | |
New Jersey Transportation Trust Fund Authority | | | | | | | | |
5.000%, 12/15/2031 | | | 100,000 | | | | 108,648 | |
5.000%, 06/15/2032 | | | 200,000 | | | | 222,850 | |
New Jersey Turnpike Authority | | | | | | | | |
5.000%, 01/01/2027 | | | 145,000 | | | | 153,740 | |
5.000%, 01/01/2031 | | | 475,000 | | | | 509,577 | |
5.000%, 01/01/2033 | | | 90,000 | | | | 96,559 | |
New York City Housing Development Corp. | | | | | | | | |
0.600%, 05/01/2061(a) | | | 80,000 | | | | 74,228 | |
New York City Transitional Finance Authority Building Aid Revenue | | | | | | | | |
5.000%, 07/15/2027 | | | 230,000 | | | | 247,015 | |
New York City Transitional Finance Authority Future Tax Secured Revenue | | | | | | | | |
5.000%, 08/01/2024 | | | 385,000 | | | | 391,008 | |
5.000%, 08/01/2024 | | | 390,000 | | | | 396,086 | |
New York State Dormitory Authority | | | | | | | | |
5.000%, 02/15/2032 | | | 235,000 | | | | 250,542 | |
5.000%, 03/15/2032 | | | 165,000 | | | | 184,186 | |
New York State Thruway Authority | | | | | | | | |
5.000%, 01/01/2028 | | | 425,000 | | | | 433,110 | |
New York State Urban Development Corp. | | | | | | | | |
5.000%, 03/15/2029 | | | 155,000 | | | | 170,458 | |
North East Independent School District/TX | | | | | | | | |
2.200%, 08/01/2049(a) | | | 255,000 | | | | 251,188 | |
Ohio Water Development Authority | | | | | | | | |
5.000%, 06/01/2027 | | | 175,000 | | | | 187,342 | |
Oklahoma Water Resources Board | | | | | | | | |
5.000%, 04/01/2026 | | | 100,000 | | | | 104,601 | |
The accompanying notes are an integral part of these financial statements.
90
ACTIVEPASSIVE INTERMEDIATE MUNICIPAL BOND ETF | Schedule of Investments |
August 31, 2023 (Continued)
| | | | | | | | |
| | |
| | | Principal
Amount
| | | Value
| |
Parish of St John the Baptist LA | | | | | | | | |
2.375%, 06/01/2037(a) | | $ | 25,000 | | | $ | 23,669 | |
School Board of Miami-Dade County | | | | | | | | |
3.250%, 02/01/2033 | | | 235,000 | | | | 227,666 | |
Seattle Housing Authority | | | | | | | | |
1.000%, 06/01/2026 | | | 225,000 | | | | 205,683 | |
State of California | | | | | | | | |
5.000%, 11/01/2028 | | | 155,000 | | | | 170,868 | |
3.500%, 09/01/2032 | | | 100,000 | | | | 100,001 | |
5.000%, 11/01/2032 | | | 210,000 | | | | 210,512 | |
State of Connecticut Special Tax Revenue | | | | | | | | |
5.000%, 07/01/2027 | | | 125,000 | | | | 133,671 | |
5.000%, 05/01/2031 | | | 65,000 | | | | 72,673 | |
State of Florida | | | | | | | | |
5.000%, 06/01/2027 | | | 245,000 | | | | 262,728 | |
5.000%, 06/01/2030 | | | 105,000 | | | | 118,393 | |
5.000%, 06/01/2031 | | | 15,000 | | | | 17,184 | |
State of Georgia | | | | | | | | |
3.000%, 02/01/2030 | | | 35,000 | | | | 34,484 | |
5.000%, 07/01/2031 | | | 225,000 | | | | 245,529 | |
2.500%, 02/01/2033 | | | 10,000 | | | | 9,074 | |
State of Hawaii | | | | | | | | |
4.000%, 10/01/2031 | | | 55,000 | | | | 55,719 | |
State of Illinois | | | | | | | | |
5.000%, 11/01/2025 | | | 50,000 | | | | 51,322 | |
5.000%, 11/01/2028 | | | 45,000 | | | | 47,307 | |
5.000%, 03/01/2031 | | | 45,000 | | | | 49,201 | |
State of Kansas Department of Transportation | | | | | | | | |
5.000%, 09/01/2025 | | | 120,000 | | | | 123,921 | |
5.000%, 09/01/2026 | | | 355,000 | | | | 366,390 | |
State of Maryland | | | | | | | | |
5.000%, 08/01/2025 | | | 175,000 | | | | 181,051 | |
5.000%, 08/01/2029 | | | 210,000 | | | | 233,967 | |
5.000%, 08/01/2031 | | | 245,000 | | | | 281,788 | |
State of Maryland Department of Transportation | | | | | | | | |
4.000%, 10/01/2030 | | | 735,000 | | | | 774,817 | |
State of Michigan | | | | | | | | |
5.000%, 03/15/2026 | | | 190,000 | | | | 198,099 | |
State of Michigan Trunk Line Revenue | | | | | | | | |
5.000%, 11/15/2031 | | | 140,000 | | | | 159,042 | |
State of Nevada Highway Improvement Revenue | | | | | | | | |
3.000%, 12/01/2029 | | | 780,000 | | | | 760,333 | |
State of New Mexico | | | | | | | | |
5.000%, 03/01/2025 | | | 35,000 | | | | 35,891 | |
State of New Mexico Severance Tax Permanent Fund | | | | | | | | |
4.000%, 07/01/2024 | | | 260,000 | | | | 261,336 | |
State of North Carolina | | | | | | | | |
5.000%, 03/01/2028 | | | 620,000 | | | | 631,321 | |
5.000%, 05/01/2031 | | | 125,000 | | | | 142,647 | |
State of Ohio | | | | | | | | |
5.000%, 08/01/2025 | | | 120,000 | | | | 123,857 | |
State of Oregon | | | | | | | | |
5.000%, 05/01/2028 | | | 265,000 | | | | 288,877 | |
The accompanying notes are an integral part of these financial statements.
91
ACTIVEPASSIVE INTERMEDIATE MUNICIPAL BOND ETF | Schedule of Investments |
August 31, 2023 (Continued)
| | | | | | | | |
| | |
| | | Principal
Amount
| | | Value
| |
State of Washington | | | | | | | | |
5.000%, 06/01/2029 | | $ | 200,000 | | | $ | 221,656 | |
State of Wisconsin | | | | | | | | |
5.000%, 05/01/2031 | | | 105,000 | | | | 119,592 | |
Tennessee Energy Acquisition Corp. | | | | | | | | |
4.000%, 11/01/2049(a) | | | 20,000 | | | | 19,773 | |
Triborough Bridge & Tunnel Authority | | | | | | | | |
0.000%, 11/15/2030 | | | 135,000 | | | | 101,781 | |
Trinity River Authority Central Regional Wastewater System Revenue | | | | | | | | |
5.000%, 08/01/2029 | | | 315,000 | | | | 345,569 | |
Trust for Cultural Resources of The City of New York | | | | | | | | |
5.000%, 07/01/2031 | | | 50,000 | | | | 57,431 | |
Utility Debt Securitization Authority | | | | | | | | |
5.000%, 06/15/2027 | | | 145,000 | | | | 149,712 | |
Virginia College Building Authority | | | | | | | | |
5.000%, 02/01/2025 | | | 210,000 | | | | 215,117 | |
5.000%, 02/01/2031 | | | 275,000 | | | | 311,440 | |
Virginia Public School Authority | | | | | | | | |
5.000%, 08/01/2028 | | | 280,000 | | | | 289,069 | |
West Virginia Commissioner of Highways | | | | | | | | |
5.000%, 09/01/2025 | | | 200,000 | | | | 206,028 | |
| | | | | | |
|
|
|
TOTAL MUNICIPAL BONDS (Cost $28,787,297) | | | | | | | 28,055,505 | |
| | | | | | |
|
|
|
| | |
| | | Shares
| | | | |
| EXCHANGE TRADED FUNDS—5.96% | | | | | | | | |
iShares National Muni Bond ETF | | | 17,230 | | | | 1,817,076 | |
| | | | | | |
|
|
|
TOTAL EXCHANGE TRADED FUNDS (Cost $1,832,464) | | | | | | | 1,817,076 | |
| | | | | | |
|
|
|
| MONEY MARKET FUNDS—1.07% | | | | | | | | |
First American Government Obligations Fund, 5.247%(b) | | | 325,636 | | | | 325,636 | |
| | | | | | |
|
|
|
| TOTAL MONEY MARKET FUNDS (Cost $325,636) | | | | | | | 325,636 | |
| | | | | | |
|
|
|
| Total Investments (Cost $30,945,397)—99.04% | | | | | | | 30,198,217 | |
Other Assets in Excess of Liabilities—0.96% | | | | | | | 292,146 | |
| | | | | | |
|
|
|
| TOTAL NET ASSETS—100.00% | | | | | | $ | 30,490,363 | |
| | | | | | |
|
|
|
Percentages are stated as a percent of net assets.
| (a) | | Variable rate security; the rate shown represents the rate at August 31, 2023. |
| (b) | | The rate shown represents the seven day yield at August 31, 2023. |
The accompanying notes are an integral part of these financial statements.
92
ACTIVEPASSIVE INTERNATIONAL EQUITY ETF | Schedule of Investments |
August 31, 2023
| | | | | | | | |
| | |
| | | Shares
| | | Value
| |
| COMMON STOCKS—97.83% | | | | | | | | |
Automobiles & Components—3.41% | | | | | | | | |
BYD Co. Ltd.—ADR | | | 2,581 | | | $ | 162,964 | |
Dr Ing hc F Porsche AG—ADR | | | 845 | | | | 9,270 | |
Honda Motor Co. Ltd.—ADR | | | 43,295 | | | | 1,399,728 | |
NIO, Inc.—ADR(a) | | | 2,496 | | | | 25,634 | |
Toyota Motor Corp.—ADR | | | 5,671 | | | | 976,149 | |
Valeo SE—ADR | | | 5,124 | | | | 50,471 | |
| | | | | | |
|
|
|
| | | | | | | | 2,624,216 | |
| | | | | | |
|
|
|
Banks—12.14% | | | | | | | | |
Agricultural Bank of China Ltd.—ADR | | | 1,247 | | | | 10,637 | |
Banco BBVA Argentina SA—ADR | | | 14,072 | | | | 80,492 | |
Banco Bilbao Vizcaya Argentaria SA—ADR | | | 76,436 | | | | 606,902 | |
Banco Bradesco SA—ADR | | | 12 | | | | 33 | |
Banco de Chile—ADR | | | 5,612 | | | | 122,454 | |
Banco Santander Chile—ADR | | | 8 | | | | 153 | |
Banco Santander SA—ADR | | | 122,647 | | | | 474,644 | |
Bank Central Asia Tbk PT—ADR | | | 2,958 | | | | 45,021 | |
Bank Mandiri Persero Tbk PT—ADR | | | 3,603 | | | | 56,747 | |
Bank of China Ltd.—ADR | | | 4,233 | | | | 35,811 | |
Bank Rakyat Indonesia Persero Tbk PT—ADR | | | 3,821 | | | | 69,217 | |
Barclays PLC—ADR | | | 51,232 | | | | 384,752 | |
BNP Paribas SA—ADR | | | 1,605 | | | | 51,922 | |
China Construction Bank Corp.—ADR | | | 84,424 | | | | 901,648 | |
China Merchants Bank Co. Ltd.—ADR | | | 1,129 | | | | 22,421 | |
Commonwealth Bank of Australia—ADR | | | 5,418 | | | | 355,854 | |
HDFC Bank Ltd.—ADR | | | 13,667 | | | | 851,591 | |
HSBC Holdings PLC—ADR | | | 25,398 | | | | 947,853 | |
ICICI Bank Ltd.—ADR | | | 16,097 | | | | 372,967 | |
Industrial & Commercial Bank of China Ltd.—ADR | | | 3,661 | | | | 33,535 | |
ING Groep NV—ADR | | | 42,754 | | | | 604,969 | |
KB Financial Group, Inc.—ADR | | | 2,305 | | | | 93,053 | |
Lloyds Banking Group PLC—ADR | | | 131,093 | | | | 275,295 | |
Mitsubishi UFJ Financial Group, Inc.—ADR | | | 51,420 | | | | 407,761 | |
Mizuho Financial Group, Inc.—ADR | | | 197,472 | | | | 647,708 | |
NatWest Group PLC—ADR(a) | | | 55,366 | | | | 326,106 | |
Shinhan Financial Group Co. Ltd.—ADR | | | 12,560 | | | | 337,864 | |
Sumitomo Mitsui Financial Group, Inc.—ADR | | | 86,992 | | | | 791,627 | |
Swedbank AB—ADR | | | 1,440 | | | | 25,430 | |
UniCredit SpA—ADR | | | 22,819 | | | | 278,164 | |
United Overseas Bank Ltd.—ADR | | | 1,586 | | | | 66,612 | |
Woori Financial Group, Inc.—ADR | | | 2,731 | | | | 72,918 | |
| | | | | | |
|
|
|
| | | | | | | | 9,352,161 | |
| | | | | | |
|
|
|
Capital Goods—6.70% | | | | | | | | |
Airbus SE—ADR | | | 13,794 | | | | 505,826 | |
Alstom SA—ADR | | | 138,348 | | | | 374,923 | |
Ashtead Group PLC—ADR | | | 918 | | | | 259,895 | |
Daikin Industries Ltd.—ADR | | | 13,357 | | | | 230,675 | |
Embraer SA—ADR(a) | | | 2,468 | | | | 38,600 | |
FANUC Corp.—ADR | | | 27,407 | | | | 388,905 | |
KION Group AG—ADR | | | 17,812 | | | | 178,296 | |
Rolls-Royce Holdings PLC—ADR(a) | | | 189,674 | | | | 527,294 | |
Schneider Electric SE—ADR | | | 34,826 | | | | 1,195,578 | |
The accompanying notes are an integral part of these financial statements.
93
ACTIVEPASSIVE INTERNATIONAL EQUITY ETF | Schedule of Investments |
August 31, 2023 (Continued)
| | | | | | | | |
| | |
| | | Shares
| | | Value
| |
Siemens AG—ADR | | | 15,839 | | | $ | 1,190,142 | |
Sociedad Quimica y Minera de Chile SA—ADR | | | 1,063 | | | | 66,533 | |
Techtronic Industries Co. Ltd.—ADR | | | 2,440 | | | | 120,731 | |
Vinci SA—ADR | | | 3,008 | | | | 83,773 | |
| | | | | | |
|
|
|
| | | | | | | | 5,161,171 | |
| | | | | | |
|
|
|
Commercial & Professional Services—2.97% | | | | | | | | |
RELX PLC—ADR | | | 53,606 | | | | 1,743,804 | |
Rentokil Initial PLC—ADR | | | 11,431 | | | | 433,806 | |
Teleperformance SE—ADR | | | 1,586 | | | | 110,179 | |
| | | | | | |
|
|
|
| | | | | | | | 2,287,789 | |
| | | | | | |
|
|
|
Consumer Discretionary Distribution & Retail—4.49% | | | | | | | | |
Alibaba Group Holding Ltd.—ADR(a) | | | 11,651 | | | | 1,082,379 | |
Fast Retailing Co. Ltd.—ADR | | | 7,753 | | | | 176,923 | |
Industria de Diseno Textil SA—ADR | | | 38,125 | | | | 729,332 | |
JD.com, Inc.—ADR | | | 6,881 | | | | 228,518 | |
Jumia Technologies AG—ADR(a) | | | 17,904 | | | | 54,965 | |
MINISO Group Holding Ltd.—ADR(a) | | | 1,309 | | | | 33,903 | |
MYT Netherlands Parent BV—ADR(a) | | | 20,984 | | | | 70,716 | |
Naspers Ltd.—ADR | | | 7,896 | | | | 267,595 | |
Pan Pacific International Holdings Corp.—ADR | | | 11,590 | | | | 230,409 | |
PDD Holdings, Inc.—ADR(a) | | | 4,148 | | | | 410,528 | |
Prosus NV—ADR | | | 19 | | | | 262 | |
Vipshop Holdings Ltd.—ADR(a) | | | 10,736 | | | | 169,521 | |
| | | | | | |
|
|
|
| | | | | | | | 3,455,051 | |
| | | | | | |
|
|
|
Consumer Durables & Apparel—4.20% | | | | | | | | |
Cie Financiere Richemont SA—ADR | | | 9 | | | | 127 | |
Hermes International SCA—ADR | | | 3,660 | | | | 754,546 | |
Kering SA—ADR | | | 1,515 | | | | 81,207 | |
LVMH Moet Hennessy Louis Vuitton SE—ADR | | | 8,924 | | | | 1,510,655 | |
Samsonite International SA—ADR(a) | | | 12,682 | | | | 212,262 | |
Sony Group Corp.—ADR | | | 8,158 | | | | 678,664 | |
| | | | | | |
|
|
|
| | | | | | | | 3,237,461 | |
| | | | | | |
|
|
|
Consumer Services—2.47% | | | | | | | | |
Amadeus IT Group SA—ADR | | | 1,433 | | | | 98,189 | |
Carnival PLC—ADR(a) | | | 1,365 | | | | 19,520 | |
Compass Group PLC—ADR | | | 14,444 | | | | 363,411 | |
H World Group Ltd.—ADR(a) | | | 5 | | | | 201 | |
InterContinental Hotels Group PLC—ADR | | | 2,656 | | | | 201,776 | |
Meituan—ADR(a) | | | 12,980 | | | | 431,065 | |
New Oriental Education & Technology Group, Inc.—ADR(a) | | | 1,830 | | | | 99,259 | |
Pearson PLC—ADR | | | 24,101 | | | | 254,748 | |
TAL Education Group—ADR(a) | | | 4,595 | | | | 32,395 | |
Trip.com Group Ltd.—ADR(a) | | | 6,832 | | | | 268,566 | |
Yum China Holdings, Inc. | | | 2,440 | | | | 131,004 | |
| | | | | | |
|
|
|
| | | | | | | | 1,900,134 | |
| | | | | | |
|
|
|
Consumer Staples Distribution & Retail—0.16% | | | | | | | | |
Carrefour SA—ADR | | | 20,496 | | | | 78,090 | |
Wal-Mart de Mexico SAB de CV—ADR | | | 1,083 | | | | 42,605 | |
| | | | | | |
|
|
|
| | | | | | | | 120,695 | |
| | | | | | |
|
|
|
The accompanying notes are an integral part of these financial statements.
94
ACTIVEPASSIVE INTERNATIONAL EQUITY ETF | Schedule of Investments |
August 31, 2023 (Continued)
| | | | | | | | |
| | |
| | | Shares
| | | Value
| |
Energy—5.36% | | | | | | | | |
BP PLC—ADR | | | 28,720 | | | $ | 1,067,810 | |
China Shenhua Energy Co. Ltd.—ADR | | | 966 | | | | 11,210 | |
Eni SpA—ADR | | | 20,966 | | | | 649,107 | |
Equinor ASA—ADR | | | 5,503 | | | | 168,227 | |
Petroleo Brasileiro SA—ADR | | | 14,504 | | | | 203,781 | |
Shell PLC—ADR | | | 18,693 | | | | 1,160,649 | |
Tenaris SA—ADR | | | 2,868 | | | | 91,575 | |
TotalEnergies SE—ADR | | | 8,916 | | | | 560,906 | |
Vista Energy SAB de CV—ADR(a) | | | 1,178 | | | | 31,570 | |
Woodside Energy Group Ltd.—ADR | | | 7,808 | | | | 186,455 | |
YPF SA—ADR(a) | | | 23 | | | | 332 | |
| | | | | | |
|
|
|
| | | | | | | | 4,131,622 | |
| | | | | | |
|
|
|
Financial Services—3.49% | | | | | | | | |
Adyen NV—ADR(a) | | | 10,980 | | | | 91,463 | |
AMTD IDEA Group—ADR(a) | | | 66,057 | | | | 80,590 | |
Deutsche Bank AG | | | 10,736 | | | | 116,915 | |
FinVolution Group—ADR | | | 21,716 | | | | 109,014 | |
Futu Holdings Ltd.—ADR(a) | | | 878 | | | | 52,329 | |
Jiayin Group, Inc.—ADR | | | 6,525 | | | | 36,018 | |
LexinFintech Holdings Ltd.—ADR(a) | | | 743 | | | | 1,924 | |
London Stock Exchange Group PLC—ADR | | | 6,302 | | | | 165,112 | |
Noah Holdings Ltd.—ADR | | | 177 | | | | 2,462 | |
Nomura Holdings, Inc.—ADR | | | 86,572 | | | | 335,900 | |
ORIX Corp.—ADR | | | 8,486 | | | | 788,350 | |
Qifu Technology, Inc.—ADR | | | 3,411 | | | | 57,987 | |
UBS Group AG | | | 27,347 | | | | 730,439 | |
Worldline SA/France—ADR(a) | | | 6,588 | | | | 106,857 | |
X Financial—ADR(a) | | | 2,520 | | | | 10,836 | |
Yiren Digital Ltd.—ADR(a) | | | 1,063 | | | | 2,859 | |
| | | | | | |
|
|
|
| | | | | | | | 2,689,055 | |
| | | | | | |
|
|
|
Food, Beverage & Tobacco—6.16% | | | | | | | | |
Ambev SA—ADR | | | 13,300 | | | | 36,841 | |
Anheuser-Busch InBev SA/NV—ADR | | | 10,785 | | | | 613,559 | |
British American Tobacco PLC—ADR | | | 19,749 | | | | 655,666 | |
Coca-Cola Femsa SAB de CV—ADR | | | 3,196 | | | | 270,829 | |
Danone SA—ADR | | | 17,825 | | | | 208,196 | |
Diageo PLC—ADR | | | 2,611 | | | | 432,512 | |
Embotelladora Andina SA—ADR | | | 5,853 | | | | 71,719 | |
Embotelladora Andina SA—ADR | | | 3,703 | | | | 55,397 | |
Fomento Economico Mexicano SAB de CV—ADR | | | 2,684 | | | | 302,004 | |
Kerry Group PLC—ADR | | | 2,423 | | | | 226,454 | |
Nestle SA—ADR | | | 13,739 | | | | 1,650,465 | |
Oatly Group AB—ADR(a) | | | 4,506 | | | | 5,542 | |
Pernod Ricard SA—ADR | | | 5,420 | | | | 214,524 | |
| | | | | | |
|
|
|
| | | �� | | | | | 4,743,708 | |
| | | | | | |
|
|
|
Health Care Equipment & Services—1.24% | | | | | | | | |
EDAP TMS SA—ADR(a) | | | 1,669 | | | | 13,435 | |
Fresenius Medical Care AG & Co KGaA—ADR | | | 8,765 | | | | 210,009 | |
Koninklijke Philips NV—ADR(a) | | | 15,443 | | | | 344,843 | |
Smith & Nephew PLC—ADR | | | 8,620 | | | | 232,223 | |
The accompanying notes are an integral part of these financial statements.
95
ACTIVEPASSIVE INTERNATIONAL EQUITY ETF | Schedule of Investments |
August 31, 2023 (Continued)
| | | | | | | | |
| | |
| | | Shares
| | | Value
| |
Terumo Corp.—ADR | | | 5,002 | | | $ | 151,060 | |
| | | | | | |
|
|
|
| | | | | | | | 951,570 | |
| | | | | | |
|
|
|
Household & Personal Products—3.65% | | | | | | | | |
Haleon PLC—ADR | | | 9,059 | | | | 74,465 | |
Kose Corp.—ADR(a) | | | 4,438 | | | | 73,493 | |
L’Oreal SA—ADR | | | 15,234 | | | | 1,338,459 | |
Reckitt Benckiser Group PLC—ADR | | | 16,004 | | | | 230,618 | |
Unilever PLC—ADR | | | 21,511 | | | | 1,097,491 | |
| | | | | | |
|
|
|
| | | | | | | | 2,814,526 | |
| | | | | | |
|
|
|
Insurance—1.69% | | | | | | | | |
AIA Group Ltd.—ADR | | | 11,965 | | | | 432,057 | |
Allianz SE—ADR | | | 12,153 | | | | 295,196 | |
AXA SA—ADR | | | 4,933 | | | | 148,483 | |
Fanhua, Inc.—ADR(a) | | | 1,020 | | | | 6,844 | |
Legal & General Group PLC—ADR | | | 4,116 | | | | 57,892 | |
Ping An Insurance Group Co of China Ltd.—ADR | | | 4,185 | | | | 50,136 | |
Prudential PLC—ADR | | | 9,200 | | | | 227,332 | |
Zurich Insurance Group AG—ADR | | | 1,708 | | | | 80,071 | |
| | | | | | |
|
|
|
| | | | | | | | 1,298,011 | |
| | | | | | |
|
|
|
Materials—5.89% | | | | | | | | |
Air Liquide SA—ADR | | | 2,382 | | | | 86,181 | |
Akzo Nobel NV—ADR | | | 6,466 | | | | 175,681 | |
AngloGold Ashanti Ltd.—ADR | | | 12 | | | | 204 | |
ArcelorMittal SA—ADR | | | 12,444 | | | | 331,135 | |
BHP Group Ltd.—ADR | | | 17,024 | | | | 978,710 | |
Cemex SAB de CV—ADR(a) | | | 14,698 | | | | 117,143 | |
CRH PLC—ADR | | | 15,616 | | | | 899,013 | |
DRDGOLD Ltd.—ADR | | | 858 | | | | 8,769 | |
Gold Fields Ltd.—ADR | | | 7,215 | | | | 91,125 | |
Grupo Simec SAB de CV—ADR(a) | | | 1 | | | | 35 | |
James Hardie Industries PLC—ADR(a) | | | 9,008 | | | | 271,861 | |
POSCO Holdings, Inc.—ADR | | | 2,924 | | | | 320,938 | |
Rio Tinto PLC—ADR | | | 9,871 | | | | 616,938 | |
Sasol Ltd.—ADR | | | 3,773 | | | | 48,634 | |
Sika AG—ADR | | | 9,200 | | | | 260,820 | |
Suzano SA—ADR | | | 10,183 | | | | 103,052 | |
Ternium SA—ADR | | | 1,164 | | | | 48,632 | |
Vale SA—ADR | | | 13,639 | | | | 179,626 | |
| | | | | | |
|
|
|
| | | | | | | | 4,538,497 | |
| | | | | | |
|
|
|
Media & Entertainment—3.30% | | | | | | | | |
Baidu, Inc.—ADR(a) | | | 1,359 | | | | 194,105 | |
Bilibili, Inc.—ADR(a) | | | 3 | | | | 45 | |
Criteo SA—ADR(a) | | | 1,843 | | | | 54,359 | |
DouYu International Holdings Ltd.—ADR(a) | | | 94 | | | | 96 | |
Gravity Co. Ltd.—ADR(a) | | | 916 | | | | 68,526 | |
Hello Group, Inc.—ADR | | | 6,383 | | | | 55,085 | |
iQIYI, Inc.—ADR(a) | | | 1,697 | | | | 8,553 | |
JOYY, Inc.—ADR | | | 1,436 | | | | 49,284 | |
NetEase, Inc.—ADR | | | 1,824 | | | | 188,748 | |
Sea Ltd.—ADR(a) | | | 2,514 | | | | 94,602 | |
Sohu.com Ltd.—ADR(a) | | | 23 | | | | 243 | |
The accompanying notes are an integral part of these financial statements.
96
ACTIVEPASSIVE INTERNATIONAL EQUITY ETF | Schedule of Investments |
August 31, 2023 (Continued)
| | | | | | | | |
| | |
| | | Shares
| | | Value
| |
Tencent Holdings Ltd.—ADR | | | 38,915 | | | $ | 1,611,469 | |
Tencent Music Entertainment Group—ADR(a) | | | 6,654 | | | | 45,380 | |
Trivago NV—ADR(a) | | | 16,470 | | | | 18,941 | |
WPP PLC—ADR | | | 2,664 | | | | 128,938 | |
Yalla Group Ltd.—ADR(a) | | | 4,721 | | | | 24,172 | |
| | | | | | |
|
|
|
| | | | | | | | 2,542,546 | |
| | | | | | |
|
|
|
Pharmaceuticals, Biotechnology & Life Sciences—13.88% | | | | | | | | |
Abcam PLC—ADR(a) | | | 5,003 | | | | 113,168 | |
Amarin Corp. PLC—ADR(a) | | | 28,716 | | | | 30,152 | |
Argenx SE—ADR(a) | | | 119 | | | | 59,796 | |
AstraZeneca PLC—ADR | | | 17,132 | | | | 1,161,892 | |
Avadel Pharmaceuticals PLC—ADR(a) | | | 754 | | | | 10,187 | |
Bayer AG—ADR | | | 5,982 | | | | 82,013 | |
BeiGene Ltd.—ADR(a) | | | 198 | | | | 41,095 | |
BioLine RX Ltd.—ADR(a) | | | 26 | | | | 46 | |
BioNTech SE—ADR(a) | | | 732 | | | | 88,521 | |
Calliditas Therapeutics AB—ADR(a) | | | 979 | | | | 17,348 | |
Cellectis SA—ADR(a) | | | 7,740 | | | | 15,790 | |
DBV Technologies SA—ADR(a) | | | 11,714 | | | | 18,508 | |
Dr Reddy’s Laboratories Ltd.—ADR | | | 4,207 | | | | 285,992 | |
Evotec SE—ADR(a) | | | 2,373 | | | | 28,084 | |
Galapagos NV—ADR(a) | | | 698 | | | | 26,447 | |
Genfit SA—ADR(a) | | | 13,634 | | | | 46,765 | |
Genmab A/S—ADR(a) | | | 18,636 | | | | 713,572 | |
Grifols SA—ADR(a) | | | 6,535 | | | | 61,886 | |
GSK PLC—ADR | | | 13,725 | | | | 482,159 | |
HUTCHMED China Ltd.—ADR(a) | | | 2,035 | | | | 30,566 | |
Immutep Ltd.—ADR(a) | | | 14,656 | | | | 27,846 | |
Innate Pharma SA—ADR(a) | | | 6,755 | | | | 19,387 | |
Lonza Group AG—ADR | | | 5,856 | | | | 323,076 | |
Mereo Biopharma Group PLC—ADR(a) | | | 8,540 | | | | 11,700 | |
Mesoblast Ltd.—ADR(a) | | | 4,300 | | | | 6,923 | |
MorphoSys AG—ADR(a) | | | 2,640 | | | | 19,800 | |
Novartis AG—ADR | | | 19,978 | | | | 2,007,390 | |
Novo Nordisk A/S—ADR | | | 8,555 | | | | 1,587,979 | |
Olink Holding AB—ADR(a) | | | 1,096 | | | | 18,117 | |
Orchard Therapeutics PLC—ADR(a) | | | 1,022 | | | | 5,069 | |
Roche Holding AG—ADR | | | 26,857 | | | | 983,772 | |
Sanofi—ADR | | | 17,562 | | | | 933,947 | |
Silence Therapeutics PLC—ADR(a) | | | 985 | | | | 8,767 | |
Takeda Pharmaceutical Co. Ltd.—ADR | | | 90,506 | | | | 1,393,792 | |
Teva Pharmaceutical Industries Ltd.—ADR(a) | | | 3,201 | | | | 31,242 | |
Zai Lab Ltd.—ADR(a) | | | 3 | | | | 76 | |
| | | | | | |
|
|
|
| | | | | | | | 10,692,870 | |
| | | | | | |
|
|
|
Real Estate Management & Development—0.21% | | | | | | | | |
IRSA Inversiones y Representaciones SA—ADR | | | 15,547 | | | | 111,939 | |
KE Holdings, Inc.—ADR(a) | | | 2,707 | | | | 46,560 | |
| | | | | | |
|
|
|
| | | | | | | | 158,499 | |
| | | | | | |
|
|
|
Semiconductors & Semiconductor Equipment—5.59% | | | | | | | | |
ASE Technology Holding Co. Ltd.—ADR | | | 28,792 | | | | 236,670 | |
ASML Holding NV | | | 1,835 | | | | 1,212,073 | |
Daqo New Energy Corp.—ADR(a) | | | 465 | | | | 17,191 | |
The accompanying notes are an integral part of these financial statements.
97
ACTIVEPASSIVE INTERNATIONAL EQUITY ETF | Schedule of Investments |
August 31, 2023 (Continued)
| | | | | | | | |
| | |
| | | Shares
| | | Value
| |
JinkoSolar Holding Co Ltd.—ADR(a) | | | 160 | | | $ | 5,365 | |
Sequans Communications SA—ADR(a) | | | 21,640 | | | | 60,376 | |
STMicroelectronics NV | | | 10,754 | | | | 508,234 | |
Taiwan Semiconductor Manufacturing Co. Ltd.—ADR | | | 22,235 | | | | 2,080,528 | |
Tokyo Electron Ltd.—ADR | | | 290 | | | | 21,547 | |
United Microelectronics Corp.—ADR | | | 22,923 | | | | 164,358 | |
| | | | | | |
|
|
|
| | | | | | | | 4,306,342 | |
| | | | | | |
|
|
|
Software & Services—2.89% | | | | | | | | |
AMTD Digital, Inc.—ADR(a) | | | 4,617 | | | | 25,855 | |
Capgemini SE—ADR | | | 5,092 | | | | 190,288 | |
Chindata Group Holdings Ltd.—ADR(a) | | | 999 | | | | 8,362 | |
Endava PLC—ADR(a) | | | 2,251 | | | | 110,074 | |
Infosys Ltd.—ADR | | | 11,361 | | | | 197,341 | |
Nice Ltd.—ADR(a) | | | 1,420 | | | | 276,616 | |
Opera Ltd.—ADR | | | 7,424 | | | | 110,840 | |
SAP SE—ADR | | | 9,334 | | | | 1,303,866 | |
Xunlei Ltd.—ADR(a) | | | 2,275 | | | | 4,004 | |
| | | | | | |
|
|
|
| | | | | | | | 2,227,246 | |
| | | | | | |
|
|
|
Technology Hardware & Equipment—1.66% | | | | | | | | |
Logitech International SA | | | 5,158 | | | | 354,974 | |
Murata Manufacturing Co Ltd.—ADR | | | 25,986 | | | | 363,024 | |
Nano Dimension Ltd.—ADR(a) | | | 26,596 | | | | 84,575 | |
Nokia Oyj—ADR | | | 85,315 | | | | 340,407 | |
Telefonaktiebolaget LM Ericsson—ADR | | | 26,718 | | | | 137,865 | |
| | | | | | |
|
|
|
| | | | | | | | 1,280,845 | |
| | | | | | |
|
|
|
Telecommunication Services—3.34% | | | | | | | | |
America Movil SAB de CV—ADR | | | 12,078 | | | | 231,535 | |
Deutsche Telekom AG—ADR | | | 44,975 | | | | 962,015 | |
KT Corp.—ADR | | | 11,029 | | | | 138,304 | |
Nippon Telegraph & Telephone Corp.—ADR | | | 11,134 | | | | 320,771 | |
Orange SA—ADR | | | 22,005 | | | | 246,016 | |
SK Telecom Co. Ltd.—ADR | | | 12,846 | | | | 257,948 | |
Telefonica Brasil SA—ADR | | | 1,080 | | | | 9,115 | |
Telefonica SA—ADR | | | 20,381 | | | | 83,358 | |
Telkom Indonesia Persero Tbk PT—ADR | | | 7 | | | | 170 | |
TIM SA/Brazil—ADR | | | 2,578 | | | | 37,793 | |
Turkcell Iletisim Hizmetleri AS—ADR | | | 17,075 | | | | 89,815 | |
Vodafone Group PLC—ADR | | | 21,389 | | | | 199,345 | |
| | | | | | |
|
|
|
| | | | | | | | 2,576,185 | |
| | | | | | |
|
|
|
Transportation—1.54% | | | | | | | | |
Aena SME SA—ADR | | | 7,667 | | | | 120,372 | |
Canadian National Railway Co. | | | 1 | | | | 113 | |
Canadian Pacific Kansas City Ltd. | | | 1,061 | | | | 84,222 | |
Grupo Aeroportuario del Centro Norte SAB de CV—ADR | | | 799 | | | | 73,987 | |
Grupo Aeroportuario del Pacifico SAB de CV—ADR | | | 541 | | | | 98,646 | |
Grupo Aeroportuario del Sureste SAB de CV—ADR | | | 902 | | | | 245,597 | |
Ryanair Holdings PLC—ADR(a) | | | 5,144 | | | | 510,542 | |
ZTO Express Cayman, Inc.—ADR | | | 2,086 | | | | 52,442 | |
| | | | | | |
|
|
|
| | | | | | | | 1,185,921 | |
| | | | | | |
|
|
|
The accompanying notes are an integral part of these financial statements.
98
ACTIVEPASSIVE INTERNATIONAL EQUITY ETF | Schedule of Investments |
August 31, 2023 (Continued)
| | | | | | | | |
| | |
| | | Shares
| | | Value
| |
Utilities—1.40% | | | | | | | | |
Centrais Eletricas Brasileiras SA—ADR | | | 27 | | | $ | 192 | |
Cia de Saneamento Basico do Estado de Sao Paulo SABESP—ADR | | | 1,342 | | | | 15,567 | |
Cia Energetica de Minas Gerais—ADR | | | 6,540 | | | | 26,356 | |
Enel Chile SA—ADR | | | 41,724 | | | | 137,689 | |
Enel SpA—ADR | | | 38,186 | | | | 254,510 | |
Iberdrola SA—ADR | | | 1,586 | | | | 75,224 | |
National Grid PLC—ADR | | | 6,316 | | | | 399,234 | |
Pampa Energia SA—ADR(a) | | | 1,187 | | | | 54,080 | |
RWE AG—ADR | | | 2,684 | | | | 110,527 | |
| | | | | | |
|
|
|
| | | | | | | | 1,073,379 | |
| | | | | | |
|
|
|
TOTAL COMMON STOCKS (Cost $74,996,634) | | | | | | | 75,349,500 | |
| | | | | | |
|
|
|
| PREFERRED STOCKS—1.01% | | | | | | | | |
Banks—0.34% | | | | | | | | |
Banco Bradesco SA—ADR, 6.406%(b) | | | 19,996 | | | | 59,788 | |
Bancolombia SA—ADR 9.503%(b) | | | 2,771 | | | | 73,986 | |
Itau Unibanco Holding SA—ADR 4.316%(b) | | | 23,796 | | | | 130,878 | |
| | | | | | |
|
|
|
| | | | | | | | 264,652 | |
| | | | | | |
|
|
|
Energy—0.41% | | | | | | | | |
Petroleo Brasileiro SA—ADR 10.702%(b) | | | 23,751 | | | | 307,338 | |
| | | | | | |
|
|
|
Materials—0.18% | | | | | | | | |
Gerdau SA—ADR 14.043%(b) | | | 27,206 | | | | 141,743 | |
| | | | | | |
|
|
|
Utilities—0.08% | | | | | | | | |
Cia Energetica de Minas Gerais—ADR 8.911%(b) | | | 20,847 | | | | 50,867 | |
Cia Paranaense de Energia—ADR 4.014%(b) | | | 1,613 | | | | 13,791 | |
| | | | | | |
|
|
|
| | | | | | | | 64,658 | |
| | | | | | |
|
|
|
TOTAL PREFERRED STOCKS (Cost $714,122) | | | | | | | 778,391 | |
| | | | | | |
|
|
|
| MONEY MARKET FUNDS—0.85% | | | | | | | | |
First American Government Obligations Fund, Class X, 5.247%(c) | | | 657,783 | | | | 657,783 | |
| | | | | | |
|
|
|
TOTAL MONEY MARKET FUNDS (Cost $657,783) | | | | | | | 657,783 | |
| | | | | | |
|
|
|
| Total Investments (Cost $76,368,539)—99.69% | | | | | | | 76,785,674 | |
Other Assets in Excess of Liabilities—0.31% | | | | | | | 236,715 | |
| | | | | | |
|
|
|
TOTAL NET ASSETS—100.00% | | | | | | $ | 77,022,389 | |
| | | | | | |
|
|
|
Percentages are stated as a percent of net assets.
| (a) | | Non-income producing security. |
| (b) | | Perpetual preferred stock with no stated maturity. |
| (c) | | The rate shown represents the seven day yield at August 31, 2023. |
The accompanying notes are an integral part of these financial statements.
99
ACTIVEPASSIVE INTERNATIONAL EQUITY ETF | Schedule of Investments |
August 31, 2023 (Continued)
| | |
| | | Abbreviations |
| AB | | Aktiebolag is a Swedish term for a stock company. |
| ADR | | American Depositary Receipt |
| AG | | Aktiengesellschaft is a German term that refers to a corporation that is limited by shares, i.e. owned by shareholders. |
| A/S | | An abbreviation used by many countries to signify a stock company whereby shareholders have limited liability. |
| ASA | | Allmennaksjeselskap is a Norwegian term for a stock company. |
| KGaA | | Kommanditgesellschaft auf Aktien is a German term that refers to a Limited Partnership that has shares. |
| NV | | Naamloze Vennootschap is a Dutch term for publicly traded companies. |
| OYJ | | Julkinen osakeyhtio is a Finnish term for publicly-traded companies. |
| PLC | | Public Limited Company is a publicly traded company which signifies that shareholders have limited liability. |
| SA | | An abbreviation used by many countries to signify a publicly traded company. |
| SAB de CV | | Sociedad Anonima de Capital Variable is a Spanish term for an SA with variable capital. |
| SE | | Societas Europea is a term for a European Public Limited Liability Company. |
| SpA | | Soicieta per Azioni is an Italian term for limited share company. |
The Global Industry Classification Standard (GICS®) was developed by and/or is the exclusive property of MSCI, Inc. and Standard & Poors Financial Services LLC (“S&P”). GICS is a service mark of MSCI and S&P and has been licensed for use by U.S. Bancorp Fund Services, LLC.
The accompanying notes are an integral part of these financial statements.
100
ACTIVEPASSIVE U.S. EQUITY ETF | Schedule of Investments |
August 31, 2023
| | | | | | | | |
| | |
| | | Shares
| | | Value
| |
| COMMON STOCKS—87.34% | | | | | | | | |
Automobiles & Components—1.90% | | | | | | | | |
BorgWarner, Inc. | | | 4,997 | | | $ | 203,628 | |
General Motors Co. | | | 6,462 | | | | 216,542 | |
Rivian Automotive, Inc.(a) | | | 1,997 | | | | 45,392 | |
Tesla, Inc.(a) | | | 11,434 | | | | 2,950,886 | |
| | | | | | |
|
|
|
| | | | | | | | 3,416,448 | |
| | | | | | |
|
|
|
Banks—2.42% | | | | | | | | |
Bank of America Corp. | | | 27,352 | | | | 784,182 | |
Citigroup, Inc. | | | 8,942 | | | | 369,215 | |
Huntington Bancshares, Inc. | | | 12,361 | | | | 137,083 | |
JPMorgan Chase & Co. | | | 16,832 | | | | 2,463,027 | |
Wells Fargo & Co. | | | 14,728 | | | | 608,119 | |
| | | | | | |
|
|
|
| | | | | | | | 4,361,626 | |
| | | | | | |
|
|
|
Capital Goods—4.83% | | | | | | | | |
Boeing Co.(a) | | | 1,841 | | | | 412,439 | |
Carrier Global Corp. | | | 8,224 | | | | 472,469 | |
Cummins, Inc. | | | 746 | | | | 171,610 | |
Deere & Co. | | | 789 | | | | 324,232 | |
Eaton Corp PLC | | | 3,577 | | | | 824,033 | |
Ferguson PLC | | | 1,052 | | | | 169,961 | |
Fortive Corp. | | | 7,569 | | | | 596,816 | |
General Electric Co. | | | 10,239 | | | | 1,171,956 | |
Honeywell International, Inc. | | | 3,626 | | | | 681,470 | |
Howmet Aerospace, Inc. | | | 3,419 | | | | 169,138 | |
Hubbell, Inc. | | | 528 | | | | 172,154 | |
Illinois Tool Works, Inc. | | | 789 | | | | 195,159 | |
Lockheed Martin Corp. | | | 789 | | | | 353,748 | |
PACCAR, Inc. | | | 8,524 | | | | 701,440 | |
Raytheon Technologies Corp. | | | 5,786 | | | | 497,827 | |
Snap-on, Inc. | | | 1,010 | | | | 271,286 | |
Textron, Inc. | | | 6,049 | | | | 470,068 | |
Trane Technologies PLC | | | 1,950 | | | | 400,257 | |
United Rentals, Inc. | | | 901 | | | | 429,363 | |
WW Grainger, Inc. | | | 311 | | | | 222,098 | |
| | | | | | |
|
|
|
| | | | | | | | 8,707,524 | |
| | | | | | |
|
|
|
Commercial & Professional Services—1.60% | | | | | | | | |
Automatic Data Processing, Inc. | | | 3,915 | | | | 996,799 | |
Cintas Corp. | | | 1,785 | | | | 899,943 | |
Copart, Inc.(a) | | | 21,904 | | | | 981,956 | |
| | | | | | |
|
|
|
| | | | | | | | 2,878,698 | |
| | | | | | |
|
|
|
Consumer Discretionary Distribution & Retail—4.35% | | | | | | | | |
Amazon.com, Inc.(a) | | | 37,962 | | | | 5,239,136 | |
Chewy, Inc.(a) | | | 2,480 | | | | 59,470 | |
Home Depot, Inc. | | | 4,586 | | | | 1,514,756 | |
LKQ Corp. | | | 5,523 | | | | 290,123 | |
Lowe’s Cos, Inc. | | | 789 | | | | 181,849 | |
Ross Stores, Inc. | | | 435 | | | | 52,987 | |
TJX Cos, Inc. | | | 4,208 | | | | 389,156 | |
Ulta Beauty, Inc.(a) | | | 288 | | | | 119,529 | |
| | | | | | |
|
|
|
| | | | | | | | 7,847,006 | |
| | | | | | |
|
|
|
The accompanying notes are an integral part of these financial statements.
101
ACTIVEPASSIVE U.S. EQUITY ETF | Schedule of Investments |
August 31, 2023 (Continued)
| | | | | | | | |
| | |
| | | Shares
| | | Value
| |
Consumer Durables & Apparel—1.56% | | | | | | | | |
DR Horton, Inc. | | | 4,448 | | | $ | 529,401 | |
Garmin Ltd. | | | 1,138 | | | | 120,651 | |
Lennar Corp.—Class A | | | 5,651 | | | | 672,978 | |
Lennar Corp.—Class B | | | 5,730 | | | | 611,162 | |
NIKE, Inc. | | | 1,644 | | | | 167,211 | |
PulteGroup, Inc. | | | 8,719 | | | | 715,480 | |
| | | | | | |
|
|
|
| | | | | | | | 2,816,883 | |
| | | | | | |
|
|
|
Consumer Services—1.23% | | | | | | | | |
Caesars Entertainment, Inc.(a) | | | 4,440 | | | | 245,354 | |
Darden Restaurants, Inc. | | | 2,630 | | | | 408,991 | |
DoorDash, Inc.(a) | | | 2,104 | | | | 177,010 | |
McDonald’s Corp. | | | 3,945 | | | | 1,109,137 | |
MGM Resorts International | | | 3,326 | | | | 146,277 | |
Starbucks Corp. | | | 1,422 | | | | 138,560 | |
| | | | | | |
|
|
|
| | | | | | | | 2,225,329 | |
| | | | | | |
|
|
|
Consumer Staples Distribution & Retail—1.24% | | | | | | | | |
Costco Wholesale Corp. | | | 1,087 | | | | 597,067 | |
Kroger Co. | | | 3,855 | | | | 178,833 | |
Walmart, Inc. | | | 8,991 | | | | 1,462,027 | |
| | | | | | |
|
|
|
| | | | | | | | 2,237,927 | |
| | | | | | |
|
|
|
Energy—3.27% | | | | | | | | |
Cheniere Energy, Inc. | | | 333 | | | | 54,346 | |
Chevron Corp. | | | 5,558 | | | | 895,394 | |
ConocoPhillips | | | 2,807 | | | | 334,117 | |
Coterra Energy, Inc. | | | 6,494 | | | | 183,066 | |
Exxon Mobil Corp. | | | 20,985 | | | | 2,333,321 | |
Marathon Petroleum Corp. | | | 6,032 | | | | 861,189 | |
Occidental Petroleum Corp. | | | 3,062 | | | | 192,263 | |
Phillips 66 | | | 4,706 | | | | 537,237 | |
Valero Energy Corp. | | | 3,925 | | | | 509,858 | |
| | | | | | |
|
|
|
| | | | | | | | 5,900,791 | |
| | | | | | |
|
|
|
Financial Services—7.29% | | | | | | | | |
Bank of New York Mellon Corp. | | | 11,835 | | | | 531,036 | |
Berkshire Hathaway, Inc.(a) | | | 9,871 | | | | 3,555,534 | |
BlackRock, Inc. | | | 1,514 | | | | 1,060,618 | |
Blackstone, Inc. | | | 546 | | | | 58,078 | |
Block, Inc.(a) | | | 3,617 | | | | 208,520 | |
Cboe Global Markets, Inc. | | | 798 | | | | 119,469 | |
Charles Schwab Corp. | | | 1,762 | | | | 104,222 | |
Coinbase Global, Inc.(a) | | | 391 | | | | 31,124 | |
Equitable Holdings, Inc. | | | 9,994 | | | | 287,827 | |
Fiserv, Inc.(a) | | | 4,127 | | | | 500,977 | |
Franklin Resources, Inc. | | | 12,854 | | | | 343,716 | |
Goldman Sachs Group, Inc. | | | 1,841 | | | | 603,314 | |
Interactive Brokers Group, Inc. | | | 3,682 | | | | 335,357 | |
MarketAxess Holdings, Inc. | | | 284 | | | | 68,424 | |
Mastercard, Inc. | | | 4,042 | | | | 1,667,891 | |
Morgan Stanley | | | 7,683 | | | | 654,207 | |
PayPal Holdings, Inc.(a) | | | 3,259 | | | | 203,720 | |
State Street Corp. | | | 6,610 | | | | 454,371 | |
The accompanying notes are an integral part of these financial statements.
102
ACTIVEPASSIVE U.S. EQUITY ETF | Schedule of Investments |
August 31, 2023 (Continued)
| | | | | | | | |
| | |
| | | Shares
| | | Value
| |
Synchrony Financial | | | 4,997 | | | $ | 161,303 | |
Visa, Inc. | | | 8,942 | | | | 2,196,871 | |
| | | | | | |
|
|
|
| | | | | | | | 13,146,579 | |
| | | | | | |
|
|
|
Food, Beverage & Tobacco—2.49% | | | | | | | | |
Altria Group, Inc. | | | 12,983 | | | | 574,108 | |
Coca-Cola Co. | | | 2,042 | | | | 122,173 | |
Hershey Co. | | | 789 | | | | 169,525 | |
J M Smucker Co. | | | 2,630 | | | | 381,219 | |
Mondelez International, Inc. | | | 18,410 | | | | 1,311,896 | |
PepsiCo, Inc. | | | 9,630 | | | | 1,713,369 | |
Philip Morris International, Inc. | | | 2,199 | | | | 211,236 | |
| | | | | | |
|
|
|
| | | | | | | | 4,483,526 | |
| | | | | | |
|
|
|
Health Care Equipment & Services—3.92% | | | | | | | | |
Boston Scientific Corp.(a) | | | 10,520 | | | | 567,449 | |
Cardinal Health, Inc. | | | 2,367 | | | | 206,710 | |
Cigna Group | | | 1,052 | | | | 290,626 | |
Elevance Health, Inc. | | | 321 | | | | 141,885 | |
HCA Healthcare, Inc. | | | 2,293 | | | | 635,848 | |
Hologic, Inc.(a) | | | 6,871 | | | | 513,539 | |
Humana, Inc. | | | 467 | | | | 215,581 | |
Intuitive Surgical, Inc.(a) | | | 1,157 | | | | 361,771 | |
McKesson Corp. | | | 789 | | | | 325,320 | |
Medtronic PLC | | | 1,413 | | | | 115,160 | |
Quest Diagnostics, Inc. | | | 1,216 | | | | 159,904 | |
Stryker Corp. | | | 1,480 | | | | 419,654 | |
UnitedHealth Group, Inc. | | | 4,734 | | | | 2,256,129 | |
Veeva Systems, Inc.(a) | | | 1,578 | | | | 329,329 | |
Zimmer Biomet Holdings, Inc. | | | 4,491 | | | | 534,968 | |
| | | | | | |
|
|
|
| | | | | | | | 7,073,873 | |
| | | | | | |
|
|
|
Household & Personal Products—1.20% | | | | | | | | |
Kimberly-Clark Corp. | | | 1,052 | | | | 135,529 | |
Procter & Gamble Co. | | | 13,189 | | | | 2,035,590 | |
| | | | | | |
|
|
|
| | | | | | | | 2,171,119 | |
| | | | | | |
|
|
|
Insurance—1.94% | | | | | | | | |
Aflac, Inc. | | | 16,321 | | | | 1,217,058 | |
Aon PLC | | | 996 | | | | 332,056 | |
Arch Capital Group Ltd.(a) | | | 5,192 | | | | 399,057 | |
Everest Group Ltd. | | | 405 | | | | 146,075 | |
Fidelity National Financial, Inc. | | | 7,101 | | | | 293,981 | |
Globe Life, Inc. | | | 2,367 | | | | 264,086 | |
Hartford Financial Services Group, Inc. | | | 2,523 | | | | 181,202 | |
Principal Financial Group, Inc. | | | 8,656 | | | | 672,658 | |
| | | | | | |
|
|
|
| | | | | | | | 3,506,173 | |
| | | | | | |
|
|
|
Materials—1.75% | | | | | | | | |
Albemarle Corp. | | | 774 | | | | 153,802 | |
CF Industries Holdings, Inc. | | | 789 | | | | 60,808 | |
Corteva, Inc. | | | 4,471 | | | | 225,830 | |
DuPont de Nemours, Inc. | | | 8,153 | | | | 626,884 | |
Freeport-McMoRan, Inc. | | | 6,027 | | | | 240,538 | |
International Paper Co. | | | 4,734 | | | | 165,311 | |
The accompanying notes are an integral part of these financial statements.
103
ACTIVEPASSIVE U.S. EQUITY ETF | Schedule of Investments |
August 31, 2023 (Continued)
| | | | | | | | |
| | |
| | | Shares
| | | Value
| |
Linde PLC | | | 3,260 | | | $ | 1,261,751 | |
Newmont Corp. | | | 827 | | | | 32,600 | |
Nucor Corp. | | | 422 | | | | 72,626 | |
Packaging Corp of America | | | 617 | | | | 91,995 | |
Steel Dynamics, Inc. | | | 2,012 | | | | 214,459 | |
| | | | | | |
|
|
|
| | | | | | | | 3,146,604 | |
| | | | | | |
|
|
|
Media & Entertainment—7.48% | | | | | | | | |
Activision Blizzard, Inc. | | | 12 | | | | 1,104 | |
Alphabet, Inc.—Class C(a) | | | 19,896 | | | | 2,732,716 | |
Alphabet, Inc.—Class A(a) | | | 30,588 | | | | 4,165,167 | |
Comcast Corp. | | | 16,660 | | | | 779,022 | |
Endeavor Group Holdings, Inc.(a) | | | 1,144 | | | | 25,042 | |
Fox Corp.—Class A | | | 15,732 | | | | 520,100 | |
Fox Corp.—Class B | | | 14,547 | | | | 443,974 | |
Meta Platforms, Inc.(a) | | | 10,340 | | | | 3,059,502 | |
Netflix, Inc.(a) | | | 2,026 | | | | 878,636 | |
ROBLOX Corp.(a) | | | 1,737 | | | | 49,140 | |
Trade Desk, Inc.(a) | | | 2,620 | | | | 209,679 | |
Walt Disney Co.(a) | | | 7,490 | | | | 626,763 | |
| | | | | | |
|
|
|
| | | | | | | | 13,490,845 | |
| | | | | | |
|
|
|
Pharmaceuticals, Biotechnology & Life Sciences—6.94% | | | | | | | | |
AbbVie, Inc. | | | 8,584 | | | | 1,261,505 | |
Amgen, Inc. | | | 1,143 | | | | 292,997 | |
Biogen, Inc.(a) | | | 678 | | | | 181,270 | |
Bristol-Myers Squibb Co. | | | 14,728 | | | | 907,981 | |
Eli Lilly & Co. | | | 4,150 | | | | 2,299,930 | |
Gilead Sciences, Inc. | | | 11,624 | | | | 889,004 | |
Johnson & Johnson | | | 13,350 | | | | 2,158,428 | |
Merck & Co, Inc. | | | 13,136 | | | | 1,431,561 | |
Moderna, Inc.(a) | | | 1,602 | | | | 181,138 | |
Pfizer, Inc. | | | 27,409 | | | | 969,730 | |
Regeneron Pharmaceuticals, Inc.(a) | | | 575 | | | | 475,232 | |
Seagen, Inc.(a) | | | 397 | | | | 81,810 | |
Thermo Fisher Scientific, Inc. | | | 1,841 | | | | 1,025,621 | |
Vertex Pharmaceuticals, Inc.(a) | | | 1,001 | | | | 348,688 | |
| | | | | | |
|
|
|
| | | | | | | | 12,504,895 | |
| | | | | | |
|
|
|
Real Estate Management & Development—0.21% | | | | | | | | |
CBRE Group, Inc.(a) | | | 2,367 | | | | 201,313 | |
Zillow Group, Inc.—Class A(a) | | | 1,024 | | | | 52,142 | |
Zillow Group, Inc.—Class C(a) | | | 2,360 | | | | 123,098 | |
| | | | | | |
|
|
|
| | | | | | | | 376,553 | |
| | | | | | |
|
|
|
Semiconductors & Semiconductor Equipment—6.98% | | | | | | | | |
Advanced Micro Devices, Inc.(a) | | | 6,000 | | | | 634,320 | |
Analog Devices, Inc. | | | 2,864 | | | | 520,618 | |
Applied Materials, Inc. | | | 7,309 | | | | 1,116,523 | |
Broadcom, Inc. | | | 2,780 | | | | 2,565,634 | |
KLA Corp. | | | 526 | | | | 263,984 | |
Lam Research Corp. | | | 526 | | | | 369,462 | |
Microchip Technology, Inc. | | | 9,629 | | | | 788,037 | |
NVIDIA Corp. | | | 10,553 | | | | 5,208,433 | |
ON Semiconductor Corp.(a) | | | 2,441 | | | | 240,341 | |
The accompanying notes are an integral part of these financial statements.
104
ACTIVEPASSIVE U.S. EQUITY ETF | Schedule of Investments |
August 31, 2023 (Continued)
| | | | | | | | |
| | |
| | | Shares
| | | Value
| |
QUALCOMM, Inc. | | | 2,250 | | | $ | 257,693 | |
Skyworks Solutions, Inc. | | | 5,677 | | | | 617,317 | |
| | | | | | |
|
|
|
| | | | | | | | 12,582,362 | |
| | | | | | |
|
|
|
Software & Services—10.65% | | | | | | | | |
Accenture PLC | | | 5,837 | | | | 1,889,846 | |
Adobe, Inc.(a) | | | 3,239 | | | | 1,811,703 | |
ANSYS, Inc.(a) | | | 893 | | | | 284,751 | |
Atlassian Corp.(a) | | | 542 | | | | 110,601 | |
Cloudflare, Inc.(a) | | | 2,884 | | | | 187,547 | |
Datadog, Inc.(a) | | | 2,835 | | | | 273,521 | |
DocuSign, Inc.(a) | | | 2,367 | | | | 119,060 | |
Microsoft Corp. | | | 31,336 | | | | 10,270,688 | |
Okta, Inc.(a) | | | 1,044 | | | | 87,184 | |
Oracle Corp. | | | 3,667 | | | | 441,470 | |
Palantir Technologies, Inc.(a) | | | 15,480 | | | | 231,890 | |
Palo Alto Networks, Inc.(a) | | | 1,248 | | | | 303,638 | |
Roper Technologies, Inc. | | | 1,841 | | | | 918,769 | |
Salesforce, Inc.(a) | | | 5,930 | | | | 1,313,258 | |
Snowflake, Inc.(a) | | | 1,917 | | | | 300,681 | |
Synopsys, Inc.(a) | | | 711 | | | | 326,271 | |
Twilio, Inc.(a) | | | 1,841 | | | | 117,290 | |
Zoom Video Communications, Inc.(a) | | | 2,630 | | | | 186,809 | |
| | | | | | |
|
|
|
| | | | | | | | 19,174,977 | |
| | | | | | |
|
|
|
Technology Hardware & Equipment—8.90% | | | | | | | | |
Amphenol Corp. | | | 9,748 | | | | 861,528 | |
Apple, Inc. | | | 62,940 | | | | 11,824,539 | |
Arista Networks, Inc.(a) | | | 1,264 | | | | 246,771 | |
CDW Corp. | | | 789 | | | | 166,597 | |
Cisco Systems, Inc. | | | 28,871 | | | | 1,655,752 | |
Corning, Inc. | | | 11,309 | | | | 371,161 | |
Hewlett Packard Enterprise Co. | | | 16,569 | | | | 281,507 | |
Juniper Networks, Inc. | | | 13,574 | | | | 395,275 | |
Keysight Technologies, Inc.(a) | | | 1,841 | | | | 245,405 | |
| | | | | | |
|
|
|
| | | | | | | | 16,048,535 | |
| | | | | | |
|
|
|
Telecommunication Services—0.98% | | | | | | | | |
AT&T, Inc. | | | 8,936 | | | | 132,163 | |
T-Mobile US, Inc.(a) | | | 5,639 | | | | 768,314 | |
Verizon Communications, Inc. | | | 24,722 | | | | 864,776 | |
| | | | | | |
|
|
|
| | | | | | | | 1,765,253 | |
| | | | | | |
|
|
|
Transportation—1.71% | | | | | | | | |
American Airlines Group, Inc.(a) | | | 5,374 | | | | 79,159 | |
Delta Air Lines, Inc. | | | 4,077 | | | | 174,822 | |
Expeditors International of Washington, Inc. | | | 1,841 | | | | 214,863 | |
FedEx Corp. | | | 789 | | | | 205,945 | |
Old Dominion Freight Line, Inc. | | | 1,269 | | | | 542,333 | |
Uber Technologies, Inc.(a) | | | 9,889 | | | | 467,057 | |
Union Pacific Corp. | | | 2,842 | | | | 626,859 | |
United Airlines Holdings, Inc.(a) | | | 3,106 | | | | 154,710 | |
United Parcel Service, Inc. | | | 3,604 | | | | 610,518 | |
| | | | | | |
|
|
|
| | | | | | | | 3,076,266 | |
| | | | | | |
|
|
|
The accompanying notes are an integral part of these financial statements.
105
ACTIVEPASSIVE U.S. EQUITY ETF | Schedule of Investments |
August 31, 2023 (Continued)
| | | | | | | | |
| | |
| | | Shares
| | | Value
| |
Utilities—2.50% | | | | | | | | |
AES Corp. | | | 8,346 | | | $ | 149,644 | |
Ameren Corp. | | | 5,523 | | | | 437,808 | |
CenterPoint Energy, Inc. | | | 19,443 | | | | 542,265 | |
Consolidated Edison, Inc. | | | 4,068 | | | | 361,889 | |
Edison International | | | 1,841 | | | | 126,753 | |
Evergy, Inc. | | | 9,994 | | | | 549,370 | |
NextEra Energy, Inc. | | | 9,963 | | | | 665,528 | |
NiSource, Inc. | | | 20,757 | | | | 555,457 | |
PG&E Corp.(a) | | | 22,137 | | | | 360,833 | |
PPL Corp. | | | 14,728 | | | | 367,022 | |
Public Service Enterprise Group, Inc. | | | 4,287 | | | | 261,850 | |
Vistra Corp. | | | 2,411 | | | | 75,754 | |
Xcel Energy, Inc. | | | 1,052 | | | | 60,101 | |
| | | | | | |
|
|
|
| | | | | | | | 4,514,274 | |
| | | | | | |
|
|
|
TOTAL COMMON STOCKS (Cost $143,293,454) | | | | | | | 157,454,066 | |
| | | | | | |
|
|
|
| EXCHANGE TRADED FUNDS—9.73% | | | | | | | | |
Dimensional US Small Cap ETF | | | 315,600 | | | | 17,537,892 | |
| | | | | | |
|
|
|
TOTAL EXCHANGE TRADED FUNDS (Cost $16,177,248) | | | | | | | 17,537,892 | |
| | | | | | |
|
|
|
| REAL ESTATE INVESTMENT TRUSTS—2.22% | | | | | | | | |
Equity Real Estate Investment Trusts (REITs)—2.22% | | | | | | | | |
American Tower Corp. | | | 2,878 | | | | 521,839 | |
Boston Properties, Inc. | | | 2,630 | | | | 175,605 | |
Host Hotels & Resorts, Inc. | | | 15,007 | | | | 236,961 | |
Iron Mountain, Inc. | | | 4,471 | | | | 284,087 | |
Prologis, Inc. | | | 4,945 | | | | 614,169 | |
Public Storage | | | 289 | | | | 79,874 | |
Regency Centers Corp. | | | 8,820 | | | | 548,604 | |
Simon Property Group, Inc. | | | 3,014 | | | | 342,059 | |
VICI Properties, Inc. | | | 19,550 | | | | 602,922 | |
Weyerhaeuser Co. | | | 10,783 | | | | 353,143 | |
WP Carey, Inc. | | | 3,848 | | | | 250,312 | |
| | | | | | |
|
|
|
TOTAL REAL ESTATE INVESTMENT TRUSTS (Cost $4,011,538) | | | | | | | 4,009,575 | |
| | | | | | |
|
|
|
| MONEY MARKET FUNDS—0.59% | | | | | | | | |
First American Government Obligations Fund, Class X, 5.247%(b) | | | 1,069,655 | | | | 1,069,655 | |
| | | | | | |
|
|
|
TOTAL MONEY MARKET FUNDS (Cost $1,069,655) | | | | | | | 1,069,655 | |
| | | | | | |
|
|
|
| Total Investments (Cost $164,551,895)—99.88% | | | | | | | 180,071,188 | |
Other Assets in Excess of Liabilities—0.12% | | | | | | | 209,246 | |
| | | | | | |
|
|
|
TOTAL NET ASSETS—100.00% | | | | | | $ | 180,280,434 | |
| | | | | | |
|
|
|
Percentages are stated as a percent of net assets.
| (a) | | Non-income producing security. |
| (b) | | The rate shown represents the seven day yield at August 31, 2023. |
| | |
| | | Abbreviations |
| PLC | | Public Limited Company is a publicly traded company which signifies that shareholders have limited liability. |
The Global Industry Classification Standard (GICS®) was developed by and/or is the exclusive property of MSCI, Inc. and Standard & Poors Financial Services LLC (“S&P”). GICS is a service mark of MSCI and S&P and has been licensed for use by U.S. Bancorp Fund Services, LLC.
The accompanying notes are an integral part of these financial statements.
106
Envestnet Funds
August 31, 2023
| | | | | | | | | | | | | | | | | | | | | | | | |
| Statements of Assets and Liabilities | |
| | | | | | |
| | | PMC Core
Fixed
Income
Fund
| | | PMC
Diversified
Equity Fund
| | | ActivePassive
Core Bond
ETF
| | | ActivePassive
Intermediate
Municipal
Bond ETF
| | | ActivePassive
International
Equity ETF
| | | ActivePassive
U.S. Equity
ETF
| |
| Assets | | | | | | | | | | | | | | | | | | | | | | | | |
Investments, at value(1)(2) | | $ | 424,973,597 | | | $ | 1,069,134,977 | | | $ | 99,484,629 | | | $ | 30,198,217 | | | $ | 76,785,674 | | | $ | 180,071,188 | |
Receivables: | | | | | | | | | | | | | | | | | | | | | | | | |
Investments sold | | | 6,878,082 | | | | — | | | | 277,556 | | | | — | | | | 96,274 | | | | — | |
Dividends and interest | | | 2,509,040 | | | | 2,415,873 | | | | 651,511 | | | | 296,457 | | | | 203,003 | | | | 249,532 | |
Fund shares sold | | | 610,438 | | | | 1,312,907 | | | | — | | | | — | | | | — | | | | — | |
Securities lending | �� | | 6,705 | | | | 100,191 | | | | — | | | | — | | | | — | | | | — | |
Other assets | | | 26,412 | | | | 25,275 | | | | — | | | | — | | | | — | | | | — | |
| | |
|
|
| |
|
|
| |
|
|
| |
|
|
| |
|
|
| |
|
|
|
Total Assets | | | 435,004,274 | | | | 1,072,989,223 | | | | 100,413,696 | | | | 30,494,674 | | | | 77,084,951 | | | | 180,320,720 | |
| | |
|
|
| |
|
|
| |
|
|
| |
|
|
| |
|
|
| |
|
|
|
| Liabilities | | | | | | | | | | | | | | | | | | | | | | | | |
Payables: | | | | | | | | | | | | | | | | | | | | | | | | |
Investments purchased | | | 7,288,508 | | | | — | | | | 456,281 | | | | — | | | | 38,350 | | | | — | |
Fund shares redeemed | | | 232,752 | | | | 619,816 | | | | — | | | | — | | | | — | | | | — | |
Collateral on securities loaned | | | 49,844,301 | | | | 200,726,076 | | | | — | | | | — | | | | — | | | | — | |
Affiliates | | | 148,939 | | | | 202,042 | | | | — | | | | — | | | | — | | | | — | |
Adviser | | | 125,336 | | | | 391,739 | | | | 24,568 | | | | 4,311 | | | | 24,212 | | | | 40,286 | |
Distributor | | | 7,487 | | | | 18,952 | | | | — | | | | — | | | | — | | | | — | |
Accrued expenses and other liabilities | | | 51,438 | | | | 63,191 | | | | — | | | | — | | | | — | | | | — | |
| | |
|
|
| |
|
|
| |
|
|
| |
|
|
| |
|
|
| |
|
|
|
Total Liabilities | | | 57,698,761 | | | | 202,021,816 | | | | 480,849 | | | | 4,311 | | | | 62,562 | | | | 40,286 | |
| | |
|
|
| |
|
|
| |
|
|
| |
|
|
| |
|
|
| |
|
|
|
| Net Assets | | $ | 377,305,513 | | | $ | 870,967,407 | | | $ | 99,932,847 | | | $ | 30,490,363 | | | $ | 77,022,389 | | | $ | 180,280,434 | |
| | |
|
|
| |
|
|
| |
|
|
| |
|
|
| |
|
|
| |
|
|
|
| Net assets consist of: | | | | | | | | | | | | | | | | | | | | | | | | |
Paid-in capital | | $ | 441,345,781 | | | $ | 681,698,091 | | | $ | 102,325,481 | | | $ | 31,185,636 | | | $ | 76,391,493 | | | $ | 164,429,552 | |
Total distributable earnings (deficit) | | | (64,040,268 | ) | | | 189,269,316 | | | | (2,392,634 | ) | | | (695,273 | ) | | | 630,896 | | | | 15,850,882 | |
| | |
|
|
| |
|
|
| |
|
|
| |
|
|
| |
|
|
| |
|
|
|
| Net assets | | $ | 377,305,513 | | | $ | 870,967,407 | | | $ | 99,932,847 | | | $ | 30,490,363 | | | $ | 77,022,389 | | | $ | 180,280,434 | |
| | |
|
|
| |
|
|
| |
|
|
| |
|
|
| |
|
|
| |
|
|
|
| Advisor Class Shares | | | | | | | | | | | | | | | | | | | | | | | | |
Net assets | | | 35,212,452 | | | | 89,079,371 | | | | N/A | | | | N/A | | | | N/A | | | | N/A | |
Shares of beneficial interest outstanding (unlimited shares of $0.001 par value authorized) | | | 2,395,306 | | | | 3,101,743 | | | | N/A | | | | N/A | | | | N/A | | | | N/A | |
Net asset value and redemption price per share | | $ | 14.70 | | | $ | 28.72 | | | | N/A | | | | N/A | | | | N/A | | | | N/A | |
| | |
|
|
| |
|
|
| |
|
|
| |
|
|
| |
|
|
| |
|
|
|
| Institutional Class Shares | | | | | | | | | | | | | | | | | | | | | | | | |
Net assets | | | 342,093,061 | | | | 781,888,036 | | | | N/A | | | | N/A | | | | N/A | | | | N/A | |
Shares of beneficial interest outstanding (unlimited shares of $0.001 par value authorized) | | | 23,382,733 | | | | 27,306,321 | | | | N/A | | | | N/A | | | | N/A | | | | N/A | |
Net asset value and redemption price per share | | $ | 14.63 | | | $ | 28.63 | | | | N/A | | | | N/A | | | | N/A | | | | N/A | |
| | |
|
|
| |
|
|
| |
|
|
| |
|
|
| |
|
|
| |
|
|
|
| Total Fund Shares | | | | | | | | | | | | | | | | | | | | | | | | |
Net assets | | | N/A | | | | N/A | | | | 99,932,847 | | | | 30,490,363 | | | | 77,022,389 | | | | 180,280,434 | |
Shares of beneficial interest outstanding (unlimited shares of $0.001 par value authorized) | | | N/A | | | | N/A | | | | 3,425,000 | | | | 1,250,000 | | | | 3,050,000 | | | | 6,575,000 | |
Net asset value and redemption price per share | | | N/A | | | | N/A | | | $ | 29.18 | | | $ | 24.39 | | | $ | 25.25 | | | $ | 27.42 | |
| | |
|
|
| |
|
|
| |
|
|
| |
|
|
| |
|
|
| |
|
|
|
(1) Cost of investments | | $ | 453,721,536 | | | $ | 928,310,417 | | | $ | 101,949,368 | | | $ | 30,945,397 | | | $ | 76,368,539 | | | $ | 164,551,895 | |
(2) Includes loaned securities with a value of | | $ | 48,889,480 | | | $ | 195,341,462 | | | | N/A | | | | N/A | | | | N/A | | | | N/A | |
The accompanying notes are an integral part of these financial statements.
107
Envestnet Funds
For the Year/Period Ended August 31, 2023
| | | | | | | | | | | | | | | | | | | | | | | | |
| Statements of Operations | | | | | | | | | | | | | |
| | | | | | |
| | | PMC Core
Fixed
Income
Fund
| | | PMC
Diversified
Equity Fund
| | | ActivePassive
Core Bond
ETF(2)
| | | ActivePassive
Intermediate
Municipal
Bond ETF(2)
| | | ActivePassive
International
Equity ETF(2)
| | | ActivePassive
U.S. Equity
ETF(2)
| |
| Investment Income: | | | | | | | | | | | | | | | | | | | | | | | | |
Interest | | $ | 15,013,303 | | | $ | 460,334 | | | $ | 1,021,234 | | | $ | 228,368 | | | $ | 10,876 | | | $ | 24,653 | |
Dividends | | | 103,658 | | | | 21,257,602 | (1) | | | 165,928 | | | | 5,197 | | | | 633,963 | | | | 860,329 | |
Securities lending, net | | | 48,258 | | | | 1,504,350 | | | | — | | | | — | | | | — | | | | — | |
| | |
|
|
| |
|
|
| |
|
|
| |
|
|
| |
|
|
| |
|
|
|
| | | | 15,165,219 | | | | 23,222,286 | | | | 1,187,162 | | | | 233,565 | | | | 644,839 | | | | 884,982 | |
| | |
|
|
| |
|
|
| |
|
|
| |
|
|
| |
|
|
| |
|
|
|
| Expenses: | | | | | | | | | | | | | | | | | | | | | | | | |
Investment management fees | | | 2,589,631 | | | | 4,898,995 | | | | 105,625 | | | | 32,777 | | | | 102,214 | | | | 157,362 | |
Transfer agent fees and expenses | | | 309,395 | | | | 421,203 | | | | — | | | | — | | | | — | | | | — | |
Fund accounting fees | | | 223,590 | | | | 251,261 | | | | — | | | | — | | | | — | | | | — | |
Fund administration fees | | | 220,371 | | | | 422,270 | | | | — | | | | — | | | | — | | | | — | |
Distribution fees—Advisor Class | | | 101,481 | | | | 246,836 | | | | — | | | | — | | | | — | | | | — | |
Custody fees | | | 70,983 | | | | 113,390 | | | | — | | | | — | | | | — | | | | — | |
Federal and state registration fees | | | 45,302 | | | | 49,159 | | | | — | | | | — | | | | — | | | | — | |
Reports to shareholders | | | 37,454 | | | | 57,634 | | | | — | | | | — | | | | — | | | | — | |
Audit and tax fees | | | 32,964 | | | | 30,275 | | | | — | | | | — | | | | — | | | | — | |
Trustees’ fees | | | 20,944 | | | | 20,944 | | | | — | | | | — | | | | — | | | | — | |
Legal fees | | | 20,757 | | | | 25,386 | | | | — | | | | — | | | | — | | | | — | |
Chief Compliance Officer fees | | | 16,848 | | | | 12,008 | | | | — | | | | — | | | | — | | | | — | |
Insurance fees | | | 6,687 | | | | 9,410 | | | | — | | | | — | | | | — | | | | — | |
Other expenses | | | 11,721 | | | | 52,738 | | | | — | | | | — | | | | — | | | | — | |
| | |
|
|
| |
|
|
| |
|
|
| |
|
|
| |
|
|
| |
|
|
|
Total expenses before waiver or recoupment | | | 3,708,128 | | | | 6,611,509 | | | | 105,625 | | | | 32,777 | | | | 102,214 | | | | 157,362 | |
Recoupment or (waivers) by Adviser (Note 4) | | | (1,216,182 | ) | | | — | | | | — | | | | — | | | | — | | | | — | |
| | |
|
|
| |
|
|
| |
|
|
| |
|
|
| |
|
|
| |
|
|
|
Net expenses | | | 2,491,946 | | | | 6,611,509 | | | | 105,625 | | | | 32,777 | | | | 102,214 | | | | 157,362 | |
| | |
|
|
| |
|
|
| |
|
|
| |
|
|
| |
|
|
| |
|
|
|
| Net Investment Income | | | 12,673,273 | | | | 16,610,777 | | | | 1,081,537 | | | | 200,788 | | | | 542,625 | | | | 727,620 | |
| | |
|
|
| |
|
|
| |
|
|
| |
|
|
| |
|
|
| |
|
|
|
| Realized and Unrealized Gain (Loss): | | | | | | | | | | | | | | | | | | | | | | | | |
Net realized gain (loss) on: | | | | | | | | | | | | | | | | | | | | | | | | |
Investments | | | (29,394,666 | ) | | | 43,875,237 | | | | (243,469 | ) | | | — | | | | (328,864 | ) | | | (396,031 | ) |
Foreign currency translations | | | — | | | | (34 | ) | | | — | | | | — | | | | — | | | | — | |
| | |
|
|
| |
|
|
| |
|
|
| |
|
|
| |
|
|
| |
|
|
|
| | | | (29,394,666 | ) | | | 43,875,203 | | | | (243,469 | ) | | | — | | | | (328,864 | ) | | | (396,031 | ) |
| | |
|
|
| |
|
|
| |
|
|
| |
|
|
| |
|
|
| |
|
|
|
Net change in unrealized appreciation/ depreciation on: | | | | | | | | | | | | | | | | | | | | | | | | |
Investments | | | 14,364,708 | | | | 62,550,516 | | | | (2,464,739 | ) | | | (747,180 | ) | | | 417,135 | | | | 15,519,293 | |
Foreign currency translations | | | — | | | | 175 | | | | — | | | | — | | | | — | | | | — | |
| | |
|
|
| |
|
|
| |
|
|
| |
|
|
| |
|
|
| |
|
|
|
| | | | 14,364,708 | | | | 62,550,691 | | | | (2,464,739 | ) | | | (747,180 | ) | | | 417,135 | | | | 15,519,293 | |
| | |
|
|
| |
|
|
| |
|
|
| |
|
|
| |
|
|
| |
|
|
|
Net gain (loss) on investments and foreign currency | | | (15,029,958 | ) | | | 106,425,894 | | | | (2,708,208 | ) | | | (747,180 | ) | | | 88,271 | | | | 15,123,262 | |
| | |
|
|
| |
|
|
| |
|
|
| |
|
|
| |
|
|
| |
|
|
|
Net Increase (Decrease) in Net Assets Resulting from Operations | | $ | (2,356,685 | ) | | $ | 123,036,671 | | | $ | (1,626,671 | ) | | $ | (546,392 | ) | | $ | 630,896 | | | $ | 15,850,882 | |
| | |
|
|
| |
|
|
| |
|
|
| |
|
|
| |
|
|
| |
|
|
|
| (1) | | Net of $2,487,632 in foreign withholding tax and ADR issuance fees. |
| (2) | | The ActivePassive ETFs commenced operations on May 2, 2023. |
The accompanying notes are an integral part of these financial statements.
108
PMC Funds
| | | | | | | | |
| Statements of Changes in Net Assets | |
| |
| | | Core Fixed Income Fund
| |
| | |
| | | Year Ended
August 31,
2023
| | | Year Ended
August 31,
2022
| |
| Operations: | | | | | | | | |
Net investment income | | $ | 12,673,273 | | | $ | 8,061,814 | |
Net realized loss on investments and foreign currency | | | (28,245,864 | ) | | | (13,664,537 | ) |
Net change in unrealized appreciation/depreciation | | | 13,215,906 | | | | (53,405,265 | ) |
| | |
|
|
| |
|
|
|
Net decrease in net assets resulting from operations | | | (2,356,685 | ) | | | (59,007,988 | ) |
| | |
| Dividends and distributions to shareholders: | | | | | | | | |
Net dividends and distributions—Advisor Class | | | (975,810 | ) | | | (1,595,925 | ) |
Net dividends and distributions—Institutional Class | | | (9,508,545 | ) | | | (12,321,690 | ) |
| | |
|
|
| |
|
|
|
Net decrease in net assets resulting from distributions paid | | | (10,484,355 | ) | | | (13,917,615 | ) |
| | |
|
|
| |
|
|
|
| Fund share transactions: | | | | | | | | |
Shares sold—Advisor Class | | | 3,007,135 | | | | 7,168,556 | |
Shares issued to holders in reinvestment of dividends—Advisor Class | | | 924,231 | | | | 1,491,948 | |
Shares redeemed—Advisor Class | | | (15,925,172 | ) | | | (14,596,658 | ) |
Shares sold—Institutional Class | | | 72,607,206 | | | | 86,898,216 | |
Shares issued to holders in reinvestment of dividends—Institutional Class | | | 9,327,707 | | | | 12,049,084 | |
Shares redeemed—Institutional Class | | | (111,997,721 | ) | | | (69,108,827 | ) |
| | |
|
|
| |
|
|
|
Net increase (decrease) in net assets from share transactions | | | (42,056,614 | ) | | | 23,902,319 | |
| | |
|
|
| |
|
|
|
Net decrease in net assets | | | (54,897,654 | ) | | | (49,023,284 | ) |
| | |
| Net Assets: | | | | | | | | |
Beginning of year | | | 432,203,167 | | | | 481,226,451 | |
| | |
|
|
| |
|
|
|
End of year | | $ | 377,305,513 | | | $ | 432,203,167 | |
| | |
|
|
| |
|
|
|
| Change in shares outstanding: | | | | | | | | |
Shares sold—Advisor Class | | | 204,480 | | | | 441,871 | |
Shares issued to holders in reinvestment of dividends—Advisor Class | | | 62,702 | | | | 87,096 | |
Shares redeemed—Advisor Class | | | (1,083,240 | ) | | | (907,842 | ) |
Shares sold—Institutional Class | | | 4,965,378 | | | | 5,358,720 | |
Shares issued to holders in reinvestment of dividends—Institutional Class | | | 636,704 | | | | 707,521 | |
Shares redeemed—Institutional Class | | | (7,601,130 | ) | | | (4,317,982 | ) |
| | |
|
|
| |
|
|
|
Net increase (decrease) | | | (2,815,106 | ) | | | 1,369,384 | |
| | |
|
|
| |
|
|
|
The accompanying notes are an integral part of these financial statements.
109
PMC Funds
| | | | | | | | |
| Statements of Changes in Net Assets | |
| |
| | | Diversified Equity Fund
| |
| | |
| | | Year Ended
August 31,
2023
| | | Year Ended
August 31,
2022
| |
| Operations: | | | | | | | | |
Net investment income | | $ | 16,610,777 | | | $ | 17,834,029 | |
Net realized gain on investments and foreign currency | | | 43,875,203 | | | | 18,110,194 | |
Net change in unrealized appreciation/depreciation | | | 62,550,691 | | | | (204,917,579 | ) |
| | |
|
|
| |
|
|
|
Net increase (decrease) in net assets resulting from operations | | | 123,036,671 | | | | (168,973,356 | ) |
| | |
| Dividends and distributions to shareholders: | | | | | | | | |
Net dividends and distributions—Advisor Class | | | (2,458,329 | ) | | | (12,392,239 | ) |
Net dividends and distributions—Institutional Class | | | (21,858,127 | ) | | | (84,074,812 | ) |
| | |
|
|
| |
|
|
|
Net decrease in net assets resulting from distributions paid | | | (24,316,456 | ) | | | (96,467,051 | ) |
| | |
|
|
| |
|
|
|
| Fund share transactions: | | | | | | | | |
Shares sold—Advisor Class | | | 4,071,696 | | | | 7,572,421 | |
Shares issued to holders in reinvestment of dividends—Advisor Class | | | 2,215,697 | | | | 11,072,585 | |
Shares redeemed—Advisor Class | | | (34,595,745 | ) | | | (32,248,448 | ) |
Shares sold—Institutional Class | | | 95,220,105 | | | | 160,802,988 | |
Shares issued to holders in reinvestment of dividends—Institutional Class | | | 21,411,668 | | | | 81,786,080 | |
Shares redeemed—Institutional Class | | | (247,585,292 | ) | | | (134,799,799 | ) |
| | |
|
|
| |
|
|
|
Net increase (decrease) in net assets from share transactions | | | (159,261,871 | ) | | | 94,185,827 | |
| | |
|
|
| |
|
|
|
Net decrease in net assets | | | (60,541,656 | ) | | | (171,254,580 | ) |
| | |
| Net Assets: | | | | | | | | |
Beginning of year | | | 931,509,063 | | | | 1,102,763,643 | |
| | |
|
|
| |
|
|
|
End of year | | $ | 870,967,407 | | | $ | 931,509,063 | |
| | |
|
|
| |
|
|
|
| Change in shares outstanding: | | | | | | | | |
Shares sold—Advisor Class | | | 153,167 | | | | 250,610 | |
Shares issued to holders in reinvestment of dividends—Advisor Class | | | 86,315 | | | | 363,274 | |
Shares redeemed—Advisor Class | | | (1,279,701 | ) | | | (1,120,394 | ) |
Shares sold—Institutional Class | | | 3,570,221 | | | | 5,455,371 | |
Shares issued to holders in reinvestment of dividends—Institutional Class | | | 838,030 | | | | 2,696,541 | |
Shares redeemed—Institutional Class | | | (9,121,606 | ) | | | (4,671,737 | ) |
| | |
|
|
| |
|
|
|
Net increase (decrease) | | | (5,753,574 | ) | | | 2,973,665 | |
| | |
|
|
| |
|
|
|
The accompanying notes are an integral part of these financial statements.
110
ActivePassive ETFs
| | | | |
| Statements of Changes in Net Assets | |
| |
| | | Core Bond ETF
| |
| |
| | | Period Ended
August 31,
2023(1)
| |
| Operations: | | | | |
Net investment income | | $ | 1,081,537 | |
Net realized loss on investments and foreign currency | | | (243,469 | ) |
Net change in unrealized depreciation | | | (2,464,739 | ) |
| | |
|
|
|
Net decrease in net assets resulting from operations | | | (1,626,671 | ) |
| |
| Dividends and distributions to shareholders: | | | | |
Net dividends and distributions | | | (765,963 | ) |
| | |
|
|
|
Net decrease in net assets resulting from distributions paid | | | (765,963 | ) |
| | |
|
|
|
| Fund share transactions: | | | | |
Shares sold | | | 102,315,967 | |
Transaction fees (Note 7) | | | 9,514 | |
| | |
|
|
|
Net increase in net assets from share transactions | | | 102,325,481 | |
| | |
|
|
|
Net increase in net assets | | | 99,932,847 | |
| |
| Net Assets: | | | | |
Beginning of period | | | — | |
| | |
|
|
|
End of period | | $ | 99,932,847 | |
| | |
|
|
|
| |
| Change in shares outstanding: | | | | |
Shares sold | | | 3,425,000 | |
| | |
|
|
|
Net increase | | | 3,425,000 | |
| | |
|
|
|
| (1) | | The Fund commenced operations on May 2, 2023. |
The accompanying notes are an integral part of these financial statements.
111
ActivePassive ETFs
| | | | |
| Statements of Changes in Net Assets | |
| |
| | | Intermediate
Municipal
Bond ETF
| |
| |
| | | Period Ended
August 31,
2023(1)
| |
| Operations: | | | | |
Net investment income | | $ | 200,788 | |
Net change in unrealized depreciation | | | (747,180 | ) |
| | |
|
|
|
Net decrease in net assets resulting from operations | | | (546,392 | ) |
| |
| Dividends and distributions to shareholders: | | | | |
Net dividends and distributions | | | (148,881 | ) |
| | |
|
|
|
Net decrease in net assets resulting from distributions paid | | | (148,881 | ) |
| | |
|
|
|
| Fund share transactions: | | | | |
Shares sold | | | 31,183,795 | |
Transaction fees (Note 7) | | | 1,841 | |
| | |
|
|
|
Net increase in net assets from share transactions | | | 31,185,636 | |
| | |
|
|
|
Net increase in net assets | | | 30,490,363 | |
| |
| Net Assets: | | | | |
Beginning of period | | | — | |
| | |
|
|
|
End of period | | $ | 30,490,363 | |
| | |
|
|
|
| |
| Change in shares outstanding: | | | | |
Shares sold | | | 1,250,000 | |
| | |
|
|
|
Net increase | | | 1,250,000 | |
| | |
|
|
|
| (1) | | The Fund commenced operations on May 2, 2023. |
The accompanying notes are an integral part of these financial statements.
112
ActivePassive ETFs
| | | | |
| Statements of Changes in Net Assets | |
| |
| | | International
Equity ETF
| |
| |
| | | Period Ended
August 31,
2023(1)
| |
| Operations: | | | | |
Net investment income | | $ | 542,625 | |
Net realized loss on investments and foreign currency | | | (328,864 | ) |
Net change in unrealized appreciation | | | 417,135 | |
| | |
|
|
|
Net increase in net assets resulting from operations | | | 630,896 | |
| |
| Fund share transactions: | | | | |
Shares sold | | | 76,391,493 | |
| | |
|
|
|
Net increase in net assets from share transactions | | | 76,391,493 | |
| | |
|
|
|
Net increase in net assets | | | 77,022,389 | |
| |
| Net Assets: | | | | |
Beginning of period | | | — | |
| | |
|
|
|
End of period | | $ | 77,022,389 | |
| | |
|
|
|
| |
| Change in shares outstanding: | | | | |
Shares sold | | | 3,050,000 | |
| | |
|
|
|
Net increase | | | 3,050,000 | |
| | |
|
|
|
| (1) | | The Fund commenced operations on May 2, 2023. |
The accompanying notes are an integral part of these financial statements.
113
ActivePassive ETFs
| | | | |
| Statements of Changes in Net Assets | |
| |
| | | U.S. Equity ETF
| |
| |
| | | Period Ended
August 31,
2023(1)
| |
| Operations: | | | | |
Net investment income | | $ | 727,620 | |
Net realized loss on investments and foreign currency | | | (396,031 | ) |
Net change in unrealized appreciation | | | 15,519,293 | |
| | |
|
|
|
Net increase in net assets resulting from operations | | | 15,850,882 | |
| |
| Fund share transactions: | | | | |
Shares sold | | | 164,429,552 | |
| | |
|
|
|
Net increase in net assets from share transactions | | | 164,429,552 | |
| | |
|
|
|
Net increase in net assets | | | 180,280,434 | |
| |
| Net Assets: | | | | |
Beginning of period | | | — | |
| | |
|
|
|
End of period | | $ | 180,280,434 | |
| | |
|
|
|
| |
| Change in shares outstanding: | | | | |
Shares sold | | | 6,575,000 | |
| | |
|
|
|
Net increase | | | 6,575,000 | |
| | |
|
|
|
| (1) | | The Fund commenced operations on May 2, 2023. |
The accompanying notes are an integral part of these financial statements.
114
PMC Core Fixed Income Fund—Advisor Class
| | | | | | | | | | | | | | | | | | | | |
| Financial Highlights | | | | | | | | | | | | | | | |
| |
| | | Per Share Data for a Share Outstanding Throughout Each Year | |
| | | | | |
| | | Year
Ended
August 31,
2023
| | | Year
Ended
August 31,
2022
| | | Year
Ended
August 31,
2021
| | | Year
Ended
August 31,
2020
| | | Year
Ended
August 31,
2019
| |
Net asset value, beginning of year | | $ | 15.17 | | | $ | 17.74 | | | $ | 18.50 | | | $ | 17.65 | | | $ | 16.53 | |
| | |
|
|
| |
|
|
| |
|
|
| |
|
|
| |
|
|
|
| Income from investment operations: | | | | | | | | | | | | | | | | | | | | |
Net investment income(1) | | | 0.43 | | | | 0.25 | | | | 0.27 | | | | 0.35 | | | | 0.42 | |
Net realized and unrealized gain (loss)(4) | | | (0.57 | ) | | | (2.36 | ) | | | 0.01 | | | | 0.92 | | | | 1.09 | |
| | |
|
|
| |
|
|
| |
|
|
| |
|
|
| |
|
|
|
Total from investment operations | | | (0.14 | ) | | | (2.11 | ) | | | 0.28 | | | | 1.27 | | | | 1.51 | |
| | |
|
|
| |
|
|
| |
|
|
| |
|
|
| |
|
|
|
| Less distributions paid: | | | | | | | | | | | | | | | | | | | | |
Dividends from net investment income | | | (0.33 | ) | | | (0.24 | ) | | | (0.33 | ) | | | (0.40 | ) | | | (0.39 | ) |
Distributions from net realized gains | | | — | | | | (0.22 | ) | | | (0.71 | ) | | | (0.02 | ) | | | — | |
| | |
|
|
| |
|
|
| |
|
|
| |
|
|
| |
|
|
|
Total distributions paid | | | (0.33 | ) | | | (0.46 | ) | | | (1.04 | ) | | | (0.42 | ) | | | (0.39 | ) |
| | |
|
|
| |
|
|
| |
|
|
| |
|
|
| |
|
|
|
Net asset value, end of year | | $ | 14.70 | | | $ | 15.17 | | | $ | 17.74 | | | $ | 18.50 | | | $ | 17.65 | |
| | |
|
|
| |
|
|
| |
|
|
| |
|
|
| |
|
|
|
Total return | | | -0.89 | % | | | -12.20 | % | | | 1.53 | % | | | 7.39 | % | | | 9.37 | % |
| | | | | |
| Ratios / supplemental data | | | | | | | | | | | | | | | | | | | | |
Net assets, end of year (000’s) | | $ | 35,212 | | | $ | 48,723 | | | $ | 63,678 | | | $ | 121,267 | | | $ | 399,389 | |
Ratio of expenses to average net assets before waiver and reimbursements | | | 1.16 | % | | | 1.13 | % | | | 1.22 | % | | | 1.31 | % | | | 1.28 | % |
Ratio of expenses to average net assets after waiver and reimbursements | | | 0.85 | % | | | 0.85 | % | | | 0.92 | %(3) | | | 1.00 | %(2) | | | 1.00 | %(2) |
Ratio of net investment income to average net assets before waiver and reimbursements | | | 2.63 | % | | | 1.22 | % | | | 1.22 | % | | | 1.72 | % | | | 2.22 | % |
Ratio of net investment income to average net assets after waiver and reimbursements | | | 2.94 | % | | | 1.50 | % | | | 1.52 | % | | | 2.03 | % | | | 2.50 | % |
Portfolio turnover rate(5) | | | 195.1 | % | | | 201.7 | % | | | 227.0 | % | | | 180.7 | % | | | 144.3 | % |
| (1) | | Per share net investment income was calculated using average shares outstanding. |
| (2) | | Reflects expense cap of 0.75% (plus Rule 12b-1 fees of 0.25%). |
| (3) | | Effective January 26, 2021, the expense limitation cap was reduced from 0.75% to 0.60% (plus Rule 12b-1 fees of 0.25%). |
| (4) | | Realized gains and losses per share in the caption are balancing amounts necessary to reconcile the change in net asset value per share for the period, and may not reconcile with the aggregate gains and losses in the Statement of Operations due to share transactions for the period. |
| (5) | | Portfolio turnover rates are calculated at the Fund level (not by individual share class). |
The accompanying notes are an integral part of these financial statements.
115
PMC Core Fixed Income Fund—Institutional Class
| | | | | | | | | | | | | | | | | | | | |
| Financial Highlights | | | | | | | | | | | | | | | |
| |
| | | Per Share Data for a Share Outstanding Throughout Each Year/Period | |
| | | | | |
| | | Year
Ended
August 31,
2023
| | | Year
Ended
August 31,
2022
| | | Year
Ended
August 31,
2021
| | | Year
Ended
August 31,
2020
| | | Period
Ended
August 31,
2019(1)
| |
Net asset value, beginning of year/period | | $ | 15.11 | | | $ | 17.67 | | | $ | 18.47 | | | $ | 17.66 | | | $ | 17.23 | |
| | |
|
|
| |
|
|
| |
|
|
| |
|
|
| |
|
|
|
| Income from investment operations: | | | | | | | | | | | | | | | | | | | | |
Net investment income(2) | | | 0.47 | | | | 0.29 | | | | 0.30 | | | | 0.39 | | | | 0.07 | |
Net realized and unrealized gain (loss)(6) | | | (0.57 | ) | | | (2.35 | ) | | | 0.02 | | | | 0.92 | | | | 0.36 | |
| | |
|
|
| |
|
|
| |
|
|
| |
|
|
| |
|
|
|
Total from investment operations | | | (0.10 | ) | | | (2.06 | ) | | | 0.32 | | | | 1.31 | | | | 0.43 | |
| | |
|
|
| |
|
|
| |
|
|
| |
|
|
| |
|
|
|
| Less distributions paid: | | | | | | | | | | | | | | | | | | | | |
Dividends from net investment income | | | (0.38 | ) | | | (0.28 | ) | | | (0.41 | ) | | | (0.48 | ) | | | — | |
Distributions from net realized gains | | | — | | | | (0.22 | ) | | | (0.71 | ) | | | (0.02 | ) | | | — | |
| | |
|
|
| |
|
|
| |
|
|
| |
|
|
| |
|
|
|
Total distributions paid | | | (0.38 | ) | | | (0.50 | ) | | | (1.12 | ) | | | (0.50 | ) | | | — | |
| | |
|
|
| |
|
|
| |
|
|
| |
|
|
| |
|
|
|
Net asset value, end of year/period | | $ | 14.63 | | | $ | 15.11 | | | $ | 17.67 | | | $ | 18.47 | | | $ | 17.66 | |
| | |
|
|
| |
|
|
| |
|
|
| |
|
|
| |
|
|
|
Total return(3) | | | -0.67 | % | | | -11.95 | % | | | 1.77 | % | | | 7.65 | % | | | 2.50 | % |
| | | | | |
| Ratios / supplemental data | | | | | | | | | | | | | | | | | | | | |
Net assets, end of year/period (000’s) | | $ | 342,093 | | | $ | 383,481 | | | $ | 417,548 | | | $ | 284,610 | | | $ | 1 | |
Ratio of expenses to average net assets before waiver and reimbursements(4) | | | 0.91 | % | | | 0.88 | % | | | 0.96 | % | | | 1.06 | % | | | 0.75 | % |
Ratio of expenses to average net assets after waiver and reimbursements(4) | | | 0.60 | % | | | 0.60 | % | | | 0.66 | %(5) | | | 0.75 | % | | | 0.75 | % |
Ratio of net investment income to average net assets before waiver and reimbursements(4) | | | 2.90 | % | | | 1.49 | % | | | 1.42 | % | | | 1.87 | % | | | 2.33 | % |
Ratio of net investment income to average net assets after waiver and reimbursements(4) | | | 3.21 | % | | | 1.77 | % | | | 1.72 | % | | | 2.18 | % | | | 2.33 | % |
Portfolio turnover rate(3)(7) | | | 195.1 | % | | | 201.7 | % | | | 227.0 | % | | | 180.7 | % | | | 144.3 | % |
| (1) | | Institutional Class shares commenced operations on July 1, 2019. |
| (2) | | Per share net investment income was calculated using average shares outstanding. |
| (3) | | Not annualized for periods less than one year. |
| (4) | | Annualized for periods less than one year. |
| (5) | | Effective January 26, 2021, the expense limitation cap was reduced from 0.75% to 0.60%. |
| (6) | | Realized gains and losses per share in the caption are balancing amounts necessary to reconcile the change in net asset value per share for the period, and may not reconcile with the aggregate gains and losses in the Statement of Operations due to share transactions for the period. |
| (7) | | Portfolio turnover rates are calculated at the Fund level (not by individual share class). |
The accompanying notes are an integral part of these financial statements.
116
PMC Diversified Equity Fund—Advisor Class
| | | | | | | | | | | | | | | | | | | | |
| Financial Highlights | |
| |
| | | Per Share Data for a Share Outstanding Throughout Each Year | |
| | | | | |
| | | Year
Ended
August 31,
2023
| | | Year
Ended
August 31,
2022
| | | Year
Ended
August 31,
2021
| | | Year
Ended
August 31,
2020
| | | Year
Ended
August 31,
2019
| |
Net asset value, beginning of year | | $ | 25.83 | | | $ | 33.27 | | | $ | 25.61 | | | $ | 23.77 | | | $ | 28.40 | |
| | |
|
|
| |
|
|
| |
|
|
| |
|
|
| |
|
|
|
| Income (loss) from investment operations: | | | | | | | | | | | | | | | | | | | | |
Net investment income(1) | | | 0.42 | | | | 0.43 | | | | 0.32 | | | | 0.29 | | | | 0.34 | |
Net realized and unrealized gain (loss)(3) | | | 3.10 | | | | (5.10 | ) | | | 7.61 | | | | 1.86 | | | | (2.21 | ) |
| | |
|
|
| |
|
|
| |
|
|
| |
|
|
| |
|
|
|
Total from investment operations | | | 3.52 | | | | (4.67 | ) | | | 7.93 | | | | 2.15 | | | | (1.87 | ) |
| | |
|
|
| |
|
|
| |
|
|
| |
|
|
| |
|
|
|
| Less distributions paid: | | | | | | | | | | | | | | | | | | | | |
Dividends from net investment income | | | (0.29 | ) | | | (0.53 | ) | | | (0.27 | ) | | | (0.31 | ) | | | (0.17 | ) |
Distributions from net realized gains | | | (0.34 | ) | | | (2.24 | ) | | | — | | | | — | | | | (2.59 | ) |
| | |
|
|
| |
|
|
| |
|
|
| |
|
|
| |
|
|
|
Total distributions paid | | | (0.63 | ) | | | (2.77 | ) | | | (0.27 | ) | | | (0.31 | ) | | | (2.76 | ) |
| | |
|
|
| |
|
|
| |
|
|
| |
|
|
| |
|
|
|
Net asset value, end of year | | $ | 28.72 | | | $ | 25.83 | | | $ | 33.27 | | | $ | 25.61 | | | $ | 23.77 | |
| | |
|
|
| |
|
|
| |
|
|
| |
|
|
| |
|
|
|
Total return | | | 13.94 | % | | | -15.34 | % | | | 31.20 | % | | | 9.01 | % | | | -5.54 | % |
| | | | | |
| Ratios / supplemental data | | | | | | | | | | | | | | | | | | | | |
Net assets, end of year (000’s) | | $ | 89,079 | | | $ | 107,004 | | | $ | 154,671 | | | $ | 235,018 | | | $ | 818,269 | |
Ratio of expenses to average net assets before waiver and reimbursements | | | 0.94 | % | | | 0.93 | % | | | 0.93 | % | | | 0.95 | % | | | 0.94 | % |
Ratio of expenses to average net assets after waiver and reimbursements | | | 0.94 | % | | | 0.93 | % | | | 0.97 | %(2) | | | 0.98 | %(2) | | | 0.98 | %(2) |
Ratio of net investment income to average net assets before waiver and reimbursements | | | 1.57 | % | | | 1.46 | % | | | 1.14 | % | | | 1.21 | % | | | 1.42 | % |
Ratio of net investment income to average net assets after waiver and reimbursements | | | 1.57 | % | | | 1.46 | % | | | 1.10 | % | | | 1.18 | % | | | 1.38 | % |
Portfolio turnover rate(4) | | | 100.6 | % | | | 59.6 | % | | | 72.3 | % | | | 55.1 | % | | | 111.4 | % |
| (1) | | Per share net investment income was calculated using average shares outstanding. |
| (2) | | Reflects expense cap of 0.73% (plus Rule 12b-1 fees of 0.25%). |
| (3) | | Realized gains and losses per share in the caption are balancing amounts necessary to reconcile the change in net asset value per share for the period, and may not reconcile with the aggregate gains and losses in the Statement of Operations due to share transactions for the period. |
| (4) | | Portfolio turnover rates are calculated at the Fund level (not by individual share class). |
The accompanying notes are an integral part of these financial statements.
117
PMC Diversified Equity Fund—Institutional Class
| | | | | | | | | | | | | | | | | | | | |
| Financial Highlights | |
|
| Per Share Data for a Share Outstanding Throughout Each Year/Period | |
| | | | | |
| | | Year
Ended
August 31,
2023
| | | Year
Ended
August 31,
2022
| | | Year
Ended
August 31,
2021
| | | Year
Ended
August 31,
2020
| | | Period
Ended
August 31,
2019(1)
| |
Net asset value, beginning of year/period | | $ | 25.75 | | | $ | 33.22 | | | $ | 25.59 | | | $ | 23.78 | | | $ | 24.69 | |
| | |
|
|
| |
|
|
| |
|
|
| |
|
|
| |
|
|
|
| Income from investment operations: | | | | | | | | | | | | | | | | | | | | |
Net investment income(2) | | | 0.49 | | | | 0.51 | | | | 0.42 | | | | 0.39 | | | | 0.06 | |
Net realized and unrealized gain (loss)(5) | | | 3.08 | | | | (5.09 | ) | | | 7.58 | | | | 1.84 | | | | (0.97 | ) |
| | |
|
|
| |
|
|
| |
|
|
| |
|
|
| |
|
|
|
Total from investment operations | | | 3.57 | | | | (4.58 | ) | | | 8.00 | | | | 2.23 | | | | (0.91 | ) |
| | |
|
|
| |
|
|
| |
|
|
| |
|
|
| |
|
|
|
| Less distributions paid: | | | | | | | | | | | | | | | | | | | | |
Dividends from net investment income | | | (0.35 | ) | | | (0.65 | ) | | | (0.37 | ) | | | (0.42 | ) | | | — | |
Distributions from net realized gains | | | (0.34 | ) | | | (2.24 | ) | | | — | | | | — | | | | — | |
| | |
|
|
| |
|
|
| |
|
|
| |
|
|
| |
|
|
|
Total distributions paid | | | (0.69 | ) | | | (2.89 | ) | | | (0.37 | ) | | | (0.42 | ) | | | — | |
| | |
|
|
| |
|
|
| |
|
|
| |
|
|
| |
|
|
|
Net asset value, end of year/period | | $ | 28.63 | | | $ | 25.75 | | | $ | 33.22 | | | $ | 25.59 | | | $ | 23.78 | |
| | |
|
|
| |
|
|
| |
|
|
| |
|
|
| |
|
|
|
Total return(3) | | | 14.19 | % | | | -15.13 | % | | | 31.56 | % | | | 9.36 | % | | | -3.69 | % |
| | | | | |
| Ratios / supplemental data | | | | | | | | | | | | | | | | | | | | |
Net assets, end of year/period (000’s) | | $ | 781,888 | | | $ | 824,505 | | | $ | 948,092 | | | $ | 664,055 | | | $ | 1 | |
Ratio of expenses to average net assets(4) | | | 0.69 | % | | | 0.68 | % | | | 0.68 | % | | | 0.71 | % | | | 0.73 | % |
Ratio of net investment income to average net assets(4) | | | 1.83 | % | | | 1.73 | % | | | 1.43 | % | | | 1.64 | % | | | 1.42 | % |
Portfolio turnover rate(3)(6) | | | 100.6 | % | | | 59.6 | % | | | 72.3 | % | | | 55.1 | % | | | 111.4 | % |
| (1) | | Institutional Class shares commenced operations on July 1, 2019. |
| (2) | | Per share net investment income was calculated using average shares outstanding. |
| (3) | | Not annualized for periods less than one year. |
| (4) | | Annualized for periods less than one year. |
| (5) | | Realized gains and losses per share in the caption are balancing amounts necessary to reconcile the change in net asset value per share for the period, and may not reconcile with the aggregate gains and losses in the Statement of Operations due to share transactions for the period. |
| (6) | | Portfolio turnover rates are calculated at the Fund level (not by individual share class). |
The accompanying notes are an integral part of these financial statements.
118
ActivePassive Core Bond ETF
| | | | |
| Financial Highlights | |
|
| Per Share Data for a Share Outstanding Throughout Each Period | |
| |
| | | Period Ended
August 31,
2023(1)
| |
Net asset value, beginning of period | | $ | 30.00 | |
| | |
|
|
|
| Income from investment operations: | | | | |
Net investment income(2) | | | 0.35 | |
Net realized and unrealized gain (loss)(5) | | | (0.93 | ) |
| | |
|
|
|
Total from investment operations | | | (0.58 | ) |
| | |
|
|
|
| Less distributions paid: | | | | |
Dividends from net investment income | | | (0.24 | ) |
| | |
|
|
|
Total distributions paid | | | (0.24 | ) |
| | |
|
|
|
Net asset value, end of period | | $ | 29.18 | |
| | |
|
|
|
Total return(3)(6) | | | -1.96 | % |
| |
| Ratios / supplemental data | | | | |
Net assets, end of period (000’s) | | $ | 99,933 | |
Ratio of expenses to average net assets(4) | | | 0.35 | % |
Ratio of net investment income to average net assets(4) | | | 3.58 | % |
Portfolio turnover rate(3) | | | 12.7 | % |
| (1) | | Fund commenced operations on May 2, 2023. |
| (2) | | Per share net investment income was calculated using average shares outstanding. |
| (3) | | Not annualized for periods less than one year. |
| (4) | | Annualized for periods less than one year. |
| (5) | | Realized gains and losses per share in the caption are balancing amounts necessary to reconcile the change in net asset value per share for the period, and may not reconcile with the aggregate gains and losses in the Statement of Operations due to share transactions for the period. |
| (6) | | Total return represents the rate that investor would have earned or lost on an investment in the Fund, assuming reinvestment of dividends. Total return for a period less than one year is not annualized. Total return represented is total return of Net Asset Value. Total return of the Market Value is -1.80%. |
The accompanying notes are an integral part of these financial statements.
119
ActivePassive Intermediate Municipal Bond ETF
| | | | |
| Financial Highlights | |
|
| Per Share Data for a Share Outstanding Throughout Each Period | |
| |
| | | Period Ended
August 31,
2023(1)
| |
Net asset value, beginning of period | | $ | 25.00 | |
| | |
|
|
|
| Income from investment operations: | | | | |
Net investment income(2) | | | 0.17 | |
Net realized and unrealized gain (loss)(5) | | | (0.66 | ) |
| | |
|
|
|
Total from investment operations | | | (0.49 | ) |
| | |
|
|
|
| Less distributions paid: | | | | |
Dividends from net investment income | | | (0.12 | ) |
| | |
|
|
|
Total distributions paid | | | (0.12 | ) |
| | |
|
|
|
Net asset value, end of period | | $ | 24.39 | |
| | |
|
|
|
Total return(3)(6) | | | -1.94 | % |
| |
| Ratios / supplemental data | | | | |
Net assets, end of period (000’s) | | $ | 30,490 | |
Ratio of expenses to average net assets(4) | | | 0.35 | % |
Ratio of net investment income to average net assets(4) | | | 2.14 | % |
Portfolio turnover rate(3) | | | 0.0 | % |
| (1) | | Fund commenced operations on May 2, 2023. |
| (2) | | Per share net investment income was calculated using average shares outstanding. |
| (3) | | Not annualized for periods less than one year. |
| (4) | | Annualized for periods less than one year. |
| (5) | | Realized gains and losses per share in the caption are balancing amounts necessary to reconcile the change in net asset value per share for the period, and may not reconcile with the aggregate gains and losses in the Statement of Operations due to share transactions for the period. |
| (6) | | Total return represents the rate that investor would have earned or lost on an investment in the Fund, assuming reinvestment of dividends. Total return for a period less than one year is not annualized. Total return represented is total return of Net Asset Value. Total return of the Market Value is -1.93%. |
The accompanying notes are an integral part of these financial statements.
120
ActivePassive International Equity ETF
| | | | |
| Financial Highlights | |
|
| Per Share Data for a Share Outstanding Throughout Each Period | |
| |
| | | Period Ended
August 31,
2023(1)
| |
Net asset value, beginning of period | | $ | 24.73 | |
| | |
|
|
|
| Income from investment operations: | | | | |
Net investment income(2) | | | 0.20 | |
Net realized and unrealized gain (loss)(5) | | | 0.32 | |
| | |
|
|
|
Total from investment operations | | | 0.52 | |
| | |
|
|
|
Net asset value, end of period | | $ | 25.25 | |
| | |
|
|
|
Total return(3)(6) | | | 2.12 | % |
| |
| Ratios / supplemental data | | | | |
Net assets, end of period (000’s) | | $ | 77,022 | |
Ratio of expenses to average net assets(4) | | | 0.45 | % |
Ratio of net investment income to average net assets(4) | | | 2.39 | % |
Portfolio turnover rate(3) | | | 15.1 | % |
| (1) | | Fund commenced operations on May 2, 2023. |
| (2) | | Per share net investment income was calculated using average shares outstanding. |
| (3) | | Not annualized for periods less than one year. |
| (4) | | Annualized for periods less than one year. |
| (5) | | Realized gains and losses per share in the caption are balancing amounts necessary to reconcile the change in net asset value per share for the period, and may not reconcile with the aggregate gains and losses in the Statement of Operations due to share transactions for the period. |
| (6) | | Total return represents the rate that investor would have earned or lost on an investment in the Fund, assuming reinvestment of dividends. Total return for a period less than one year is not annualized. Total return represented is total return of Net Asset Value. Total return of the Market Value is 2.16%. |
The accompanying notes are an integral part of these financial statements.
121
ActivePassive U.S. Equity ETF
| | | | |
| Financial Highlights | |
|
| Per Share Data for a Share Outstanding Throughout Each Period | |
| |
| | | Period Ended
August 31,
2023(1)
| |
Net asset value, beginning of period | | $ | 24.75 | |
| | |
|
|
|
| Income from investment operations: | | | | |
Net investment income(2) | | | 0.12 | |
Net realized and unrealized gain (loss)(5) | | | 2.55 | |
| | |
|
|
|
Total from investment operations | | | 2.67 | |
| | |
|
|
|
Net asset value, end of period | | $ | 27.42 | |
| | |
|
|
|
Total return(3)(6) | | | 10.78 | % |
| |
| Ratios / supplemental data | | | | |
Net assets, end of period (000’s) | | $ | 180,280 | |
Ratio of expenses to average net assets(4) | | | 0.30 | % |
Ratio of net investment income to average net assets(4) | | | 1.39 | % |
Portfolio turnover rate(3) | | | 8.9 | % |
| (1) | | Fund commenced operations on May 2, 2023. |
| (2) | | Per share net investment income was calculated using average shares outstanding. |
| (3) | | Not annualized for periods less than one year. |
| (4) | | Annualized for periods less than one year. |
| (5) | | Realized gains and losses per share in the caption are balancing amounts necessary to reconcile the change in net asset value per share for the period, and may not reconcile with the aggregate gains and losses in the Statement of Operations due to share transactions for the period. |
| (6) | | Total return represents the rate that investor would have earned or lost on an investment in the Fund, assuming reinvestment of dividends. Total return for a period less than one year is not annualized. Total return represented is total return of Net Asset Value. Total return of the Market Value is 10.95%. |
The accompanying notes are an integral part of these financial statements.
122
ENVESTNET FUNDS
Notes to Financial Statements
August 31, 2023
Trust for Professional Managers (the “Trust”) was organized as a Delaware statutory trust under a Declaration of Trust dated May 29, 2001. The Trust is registered under the Investment Company Act of 1940, as amended (the “1940 Act”), as an open-end management investment company. Each of the PMC Funds and the ActivePassive ETFs (each, a “Fund” and together, the “Funds”) represents a distinct series with its own investment objective and policies within the Trust. The Trust may issue an unlimited number of shares of beneficial interest at $0.001 par value.
The investment objective of the PMC Core Fixed Income Fund (the “Core Fixed Income Fund”) is to provide current income consistent with low volatility of principal. The investment objective of the PMC Diversified Equity Fund (the “Diversified Equity Fund”) is long-term capital appreciation. The Advisor Class of the Core Fixed Income Fund became effective and commenced operations on September 28, 2007. The Institutional Class of the Core Fixed Income Fund became effective and commenced operations on July 1, 2019. The Advisor Class of the Diversified Equity Fund became effective and commenced operations on August 26, 2009. The Institutional Class of the Diversified Equity Fund became effective and commenced operations on July 1, 2019. The Advisor Class shares are subject to a 0.25% Rule 12b-1 distribution fee. Each class of shares has identical rights and privileges except with respect to distribution fees and voting rights on matters affecting a single class of shares. Envestnet Asset Management, Inc. (the “Adviser”) serves as the PMC Fund’s investment adviser. Neuberger Berman Investment Advisers LLC serves as the Core Fixed Income Fund’s sub-adviser.
The investment objective of the ActivePassive Core Bond ETF (“Core Bond ETF”) is to provide current income consistent with low volatility of principal. The investment objective of the ActivePassive Intermediate Municipal Bond ETF (“Intermediate Municipal Bond ETF”) is to provide current income that is exempt from federal income taxes consistent with low volatility of principal. The investment objective of each of the ActivePassive International Equity ETF (“International Equity ETF”) and the ActivePassive U.S. Equity ETF (“U.S. Equity ETF”) is to provide long-term capital appreciation. The ActivePassive ETFs commenced operations on May 2, 2023. Envestnet Asset Management, Inc. (the “Adviser”) serves as the ActivePassive ETFs’ investment adviser. Neuberger Berman Investment Advisers LLC and Sage Advisory Services, Ltd Co. serve as the Core Bond ETF’s sub-advisers. GW&K Investment Management, LLC serves as the Intermediate Municipal Bond ETF’s sub-adviser. AllianceBernstein L.P. and Causeway Capital Management LLC serve as the International Equity ETF’s sub-advisers.
The Funds are investment companies and accordingly follow the investment company accounting and reporting guidance of the Financial Accounting Standards Board (“FASB”) Accounting Standards Codification Topic 946 “Financial Services-Investment Companies”.
| (2) | | Significant Accounting Policies |
The following is a summary of significant accounting policies consistently followed by the Funds in the preparation of the financial statements. These policies are in conformity with accounting principles generally accepted in the United States of America (“GAAP”).
Each security owned by the Funds that is listed on a securities exchange, except for securities listed on the NASDAQ Stock Market, LLC (“NASDAQ”), is valued at its last sale price on that exchange on the date as of which assets are valued. If the security is listed on more than one exchange, the Funds will use the price of the exchange that the Funds generally consider to be the principal exchange on which the stock is traded.
123
ENVESTNET FUNDS
Notes to Financial Statements, continued
August 31, 2023
Fund securities listed on the NASDAQ will be valued at the NASDAQ Official Closing Price, which may not necessarily represent the last sale price. If there has been no sale on such exchange or on NASDAQ on such day, the security is valued at the mean between the bid and asked prices on such day or at the latest sale price on the Composite Market (defined as the consolidation of the trade information provided by national securities and foreign exchanges and over-the-counter markets as published by an approved pricing service (“Pricing Service”)).
Debt securities, including short-term debt instruments having a maturity of 60 days or less, are valued at the mean in accordance with prices supplied by an approved Pricing Service. Pricing Services may use various valuation methodologies such as the mean between the bid and the asked prices, matrix pricing and other analytical pricing models as well as market transactions and dealer quotations. If a price is not available from a Pricing Service, the most recent quotation obtained from one or more broker-dealers know to follow the issue will be obtained. Quotations will be valued at the mean between the bid and the offer. Odd lots may trade at lower prices than institutional round lots.
Redeemable securities issued by open-end, registered investment companies, including money market funds, are valued at the net asset values (“NAVs”) of such companies for purchase and/or redemption orders placed on that day. All exchange-traded funds are valued at the last reported sale price on the exchange on which the security is principally traded.
Futures contracts are valued at the last settlement price at the close of trading on the relevant exchange or board of trade. Futures contracts for which reliable market quotations are not readily available shall each be valued at a price, supplied by a Pricing Service approved by the Trust’s Board of Trustees (the “Board”) which is in the opinion of such Pricing Service representative of the market value of such positions at the time of determination of the NAV, it being the opinion of the Board that the valuations supplied by such Pricing Service accurately reflect the fair value of such position.
Forward foreign currency contracts are valued at the mean between the bid and asked prices.
If market quotations are not readily available, any security or other financial instrument is valued at its fair value in accordance with Rule 2a-5 of the 1940 Act as determined under the Adviser’s fair value pricing procedures, subject to oversight by the Board. These fair value procedures will also be used to price a security when corporate events, events in the securities market and/or world events cause the Adviser to believe that a security’s last sale price may not reflect its actual market value. The intended effect of using fair value pricing procedures is to ensure that the Funds are accurately priced. The Adviser will regularly evaluate whether the Funds’ fair value pricing procedures continue to be appropriate in light of the specific circumstances of each Fund and the quality of prices obtained through application of such procedures.
FASB Accounting Standards Codification, “Fair Value Measurement” Topic 820 (“ASC 820”), establishes an authoritative definition of fair value and sets out a hierarchy for measuring fair value. ASC 820 requires an entity to evaluate certain factors to determine whether there has been a significant decrease in volume and level of activity for the security such that recent transactions and quoted prices may not be determinative of fair value and further analysis and adjustment may be necessary to estimate fair value. ASC 820 also requires enhanced disclosure regarding the inputs and valuation techniques used to measure fair value in those instances as well as expanded disclosure of valuation levels for major security types. These inputs are summarized in the three broad levels listed below:
| | • | | Level 1—Quoted prices in active markets for identical securities. |
| | • | | Level 2—Other significant observable inputs (including quoted prices for similar securities, interest rates, prepayment speeds, credit risk, etc.). |
| | • | | Level 3—Significant unobservable inputs (including the Funds’ own assumptions in determining the fair value of investments). |
124
ENVESTNET FUNDS
Notes to Financial Statements, continued
August 31, 2023
The inputs or methodology used for valuing securities are not necessarily an indication of the risk associated with investing in those securities. The following is a summary of the inputs used to value the Funds’ investments carried at fair value as of August 31, 2023:
Core Fixed Income Fund
| | | | | | | | | | | | | | | | |
| | | Level 1
| | | Level 2
| | | Level 3
| | | Total
| |
| Fixed Income Securities | | | | | | | | | | | | | | | | |
Asset Backed Securities | | $ | — | | | $ | 41,996,127 | | | $ | — | | | $ | 41,996,127 | |
Corporate Bonds* | | | — | | | | 101,899,094 | | | | — | | | | 101,899,094 | |
Foreign Corporate Bonds* | | | — | | | | 9,109,392 | | | | — | | | | 9,109,392 | |
Foreign Government Agency Issues | | | — | | | | 4,335,772 | | | | — | | | | 4,335,772 | |
Foreign Government Notes/Bonds | | | — | | | | 5,425,361 | | | | — | | | | 5,425,361 | |
Non-Agency Mortgage Backed Securities | | | — | | | | 26,704,400 | | | | — | | | | 26,704,400 | |
Agency Mortgage Backed Securities | | | — | | | | 114,773,768 | | | | — | | | | 114,773,768 | |
U.S. Government Agency Issues | | | — | | | | 2,244,448 | | | | — | | | | 2,244,448 | |
U.S. Government Notes/Bonds | | | — | | | | 52,575,835 | | | | — | | | | 52,575,835 | |
| | |
|
|
| |
|
|
| |
|
|
| |
|
|
|
| Total Fixed Income Securities | | | — | | | | 359,064,197 | | | | — | | | | 359,064,197 | |
| Exchange-Traded Funds | | | 12,115,101 | | | | — | | | | — | | | | 12,115,101 | |
Investments Purchased with Collateral from
Securities Lending** | | | — | | | | — | | | | — | | | | 49,844,301 | |
| Money Market Funds | | | 3,949,998 | | | | — | | | | — | | | | 3,949,998 | |
| | |
|
|
| |
|
|
| |
|
|
| |
|
|
|
| Total Investments in Securities | | $ | 16,065,099 | | | $ | 359,064,197 | | | $ | — | | | $ | 424,973,597 | |
| | |
|
|
| |
|
|
| |
|
|
| |
|
|
|
| | * | | For further breakdown by industry, please refer to the Schedule of Investments. |
| | ** | | Certain investments that are measured at fair value using the NAV per share (or its equivalent) as a practical expedient have not been characterized in the fair value hierarchy. The fair value amounts presented in the table are intended to permit reconciliation of the fair value hierarchy to the amount presented in the Statements of Assets and Liabilities. See Note 10 for additional information regarding securities lending activity. |
The Fund did not hold any Level 3 securities during the year ended August 31, 2023.
125
ENVESTNET FUNDS
Notes to Financial Statements, continued
August 31, 2023
Diversified Equity Fund
| | | | | | | | | | | | | | | | |
| | | Level 1
| | | Level 2
| | | Level 3^
| | | Total
| |
| Equity | | | | | | | | | | | | | | | | |
Common Stocks* | | $ | 618,505,931 | | | $ | 7,053,391 | | | $ | 0 | | | $ | 625,559,322 | |
Preferred Stocks* | | | 724,272 | | | | — | | | | 0 | | | | 724,272 | |
Exchange-Traded Funds | | | 209,574,333 | | | | — | | | | — | | | | 209,574,333 | |
Real Estate Investment Trusts* | | | 17,446,376 | | | | — | | | | — | | | | 17,446,376 | |
| | |
|
|
| |
|
|
| |
|
|
| |
|
|
|
| Total Equity | | | 846,250,912 | | | | 7,053,391 | | | | 0 | | | | 853,304,303 | |
Investments Purchased with Collateral from
Securities Lending** | | | — | | | | — | | | | — | | | | 200,726,076 | |
| Money Market Funds | | | 15,104,598 | | | | — | | | | — | | | | 15,104,598 | |
| | |
|
|
| |
|
|
| |
|
|
| |
|
|
|
| Total Investments in Securities | | $ | 861,355,510 | | | $ | 7,053,391 | | | $ | 0 | | | $ | 1,069,134,977 | |
| | |
|
|
| |
|
|
| |
|
|
| |
|
|
|
| | * | | For further breakdown by industry, please refer to the Schedule of Investments. |
| | ** | | Certain investments that are measured at fair value using the NAV per share (or its equivalent) as a practical expedient have not been characterized in the fair value hierarchy. The fair value amounts presented in the table are intended to permit reconciliation of the fair value hierarchy to the amount presented in the Statements of Assets and Liabilities. See Note 11 for additional information regarding securities lending activity. |
| | ^ | | The Fund measures Level 3 activity as of the end of each financial reporting period. |
As of August 31, 2023, the Fund held Level 3 investments that were valued at the most recent trade price in an inactive market. The Level 3 investments in securities represented less than 1% of the Fund’s net assets and were not considered a significant portion of the Fund’s portfolio. As the Level 3 investments were not considered significant to the financial statements, a reconciliation of Level 3 investments for the year ended August 31, 2023 is not presented.
ActivePassive Core Bond ETF
| | | | | | | | | | | | | | | | |
| | | Level 1
| | | Level 2
| | | Level 3
| | | Total
| |
| Fixed Income Securities | | | | | | | | | | | | | | | | |
Asset Backed Securities | | $ | — | | | $ | 1,634,961 | | | $ | — | | | $ | 1,634,961 | |
Corporate Bonds* | | | — | | | | 19,306,856 | | | | — | | | | 19,306,856 | |
Foreign Corporate Bonds* | | | — | | | | 4,301,535 | | | | — | | | | 4,301,535 | |
Foreign Government Agency Issues | | | — | | | | 53,853 | | | | — | | | | 53,853 | |
Foreign Government Notes/Bonds | | | — | | | | 84,786 | | | | — | | | | 84,786 | |
Non-Agency Mortgage Backed Securities | | | — | | | | 1,709,308 | | | | — | | | | 1,709,308 | |
Agency Mortgage Backed Securities | | | — | | | | 8,667,237 | | | | — | | | | 8,667,237 | |
U.S. Government Notes/Bonds | | | — | | | | 36,442,177 | | | | — | | | | 36,442,177 | |
U.S. Government Agency Issues | | | — | | | | 119,526 | | | | — | | | | 119,526 | |
| | |
|
|
| |
|
|
| |
|
|
| |
|
|
|
| Total Fixed Income Securities | | | — | | | | 72,320,239 | | | | — | | | | 72,320,239 | |
| Exchange-Traded Funds | | | 26,277,969 | | | | — | | | | — | | | | 26,277,969 | |
| Money Market Funds | | | 886,421 | | | | — | | | | — | | | | 886,421 | |
| | |
|
|
| |
|
|
| |
|
|
| |
|
|
|
| Total Investments in Securities | | $ | 27,164,390 | | | $ | 72,320,239 | | | $ | — | | | $ | 99,484,629 | |
| | |
|
|
| |
|
|
| |
|
|
| |
|
|
|
| | * | | For further breakdown by industry, please refer to the Schedule of Investments. |
The Fund did not hold any Level 3 securities during the year ended August 31, 2023.
126
ENVESTNET FUNDS
Notes to Financial Statements, continued
August 31, 2023
ActivePassive Intermediate Municipal Bond ETF
| | | | | | | | | | | | | | | | |
| | | Level 1
| | | Level 2
| | | Level 3
| | | Total
| |
| Fixed Income Securities | | | | | | | | | | | | | | | | |
Municipal Bonds | | $ | — | | | $ | 28,055,505 | | | $ | — | | | $ | 28,055,505 | |
| | |
|
|
| |
|
|
| |
|
|
| |
|
|
|
| Total Fixed Income Securities | | | — | | | | 28,055,505 | | | | — | | | | 28,055,505 | |
| Exchange-Traded Funds | | | 1,817,076 | | | | — | | | | — | | | | 1,817,076 | |
| Money Market Funds | | | 325,636 | | | | — | | | | — | | | | 325,636 | |
| | |
|
|
| |
|
|
| |
|
|
| |
|
|
|
| Total Investments in Securities | | $ | 2,142,712 | | | $ | 28,055,505 | | | $ | — | | | $ | 30,198,217 | |
| | |
|
|
| |
|
|
| |
|
|
| |
|
|
|
The Fund did not hold any Level 3 securities during the year ended August 31, 2023.
ActivePassive International Equity ETF
| | | | | | | | | | | | | | | | |
| | | Level 1
| | | Level 2
| | | Level 3
| | | Total
| |
| Equity | | | | | | | | | | | | | | | | |
Common Stocks* | | $ | 75,137,203 | | | $ | 212,297 | | | $ | — | | | $ | 75,349,500 | |
Preferred Stocks* | | | 778,391 | | | | — | | | | — | | | | 778,391 | |
| | |
|
|
| |
|
|
| |
|
|
| |
|
|
|
| Total Equity | | | 75,915,594 | | | | 212,297 | | | | — | | | | 76,127,891 | |
| Money Market Funds | | | 657,783 | | | | — | | | | — | | | | 657,783 | |
| | |
|
|
| |
|
|
| |
|
|
| |
|
|
|
| Total Investments in Securities | | $ | 76,573,377 | | | $ | 212,297 | | | $ | — | | | $ | 76,785,674 | |
| | |
|
|
| |
|
|
| |
|
|
| |
|
|
|
| | * | | For further breakdown by industry, please refer to the Schedule of Investments. |
The Fund did not hold any Level 3 securities during the year ended August 31, 2023.
ActivePassive U.S. Equity ETF
| | | | | | | | | | | | | | | | |
| | | Level 1
| | | Level 2
| | | Level 3
| | | Total
| |
| Equity | | | | | | | | | | | | | | | | |
Common Stocks* | | $ | 157,454,066 | | | $ | — | | | $ | — | | | $ | 157,454,066 | |
Exchange-Traded Funds | | | 17,537,892 | | | | — | | | | — | | | | 17,537,892 | |
Real Estate Investment Trusts* | | | 4,009,575 | | | | — | | | | — | | | | 4,009,575 | |
| | |
|
|
| |
|
|
| |
|
|
| |
|
|
|
| Total Equity | | | 179,001,533 | | | | — | | | | — | | | | 179,001,533 | |
| Money Market Funds | | | 1,069,655 | | | | — | | | | — | | | | 1,069,655 | |
| | |
|
|
| |
|
|
| |
|
|
| |
|
|
|
| Total Investments in Securities | | $ | 180,071,188 | | | $ | — | | | $ | — | | | $ | 180,071,188 | |
| | |
|
|
| |
|
|
| |
|
|
| |
|
|
|
| | * | | For further breakdown by industry, please refer to the Schedule of Investments. |
The Fund did not hold any Level 3 securities during the year ended August 31, 2023.
Foreign currencies and other assets denominated in foreign currencies are translated to U.S. dollars at the exchange rate of such currencies against the U.S. dollar using the applicable currency exchange rate as of the close of the New York Stock Exchange (“NYSE”), generally at 4:00 P.M., Eastern time.
127
ENVESTNET FUNDS
Notes to Financial Statements, continued
August 31, 2023
The Funds may use certain options, futures and forward foreign currency contracts (collectively, “derivative instruments”) as a substitute for a comparable market position in the underlying security, to attempt to hedge or limit the exposure of a Fund’s position, to create a synthetic money market position, for certain tax-related purposes and to effect closing transactions.
Options and futures prices can diverge from the prices of their underlying instruments. Options and futures prices are affected by such factors as current and anticipated short-term interest rates, changes in volatility of the underlying instrument and the time remaining until expiration of the contract, which may not affect security prices the same way. Imperfect or no correlation also may result from differing levels of demand in the options and futures markets and the securities markets, from structural differences in how options and futures and securities are traded and from imposition of daily price fluctuation limits or trading halts.
The Funds did not hold derivative instruments during the year ended August 31, 2023.
| | (b) | | Foreign Securities and Currency |
Investment securities and other assets and liabilities denominated in foreign currencies are translated into U.S. dollar amounts at the date of valuation. Purchases and sales of investment securities and income and expense items denominated in foreign currencies are translated into U.S. dollar amounts on the respective dates of such transactions.
The Funds isolate the portion of the results of operations from changes in foreign exchange rates on investments from those resulting from changes in market prices of securities held. Reported net realized foreign exchange gains or losses arise from sales of portfolio securities, sales and maturities of short-term securities, sales of foreign currencies, currency gains or losses realized between the trade and settlement dates on securities transactions, and the difference between the amounts of dividends, interest and foreign withholding taxes recorded on the Funds’ books, and the U.S. dollar equivalent of the amounts actually received or paid. Net unrealized foreign exchange gains and losses arise from changes in the values of assets and liabilities, including investments in securities at fiscal period end, resulting from changes in the exchange rate.
Investments in foreign securities entail certain risks. There may be a possibility of nationalization or expropriation of assets, confiscatory taxation, political or financial instability, and diplomatic developments that could affect the value of the Funds’ investments in certain foreign countries. Since foreign securities normally are denominated and traded in foreign currencies, the value of the Funds’ assets may be affected favorably or unfavorably by currency exchange rates, currency exchange control regulations, foreign withholding taxes, and restrictions or prohibitions on the repatriation of foreign currencies. There may be less information publicly available about a foreign issuer than about a U.S. issuer, and foreign issuers are not generally subject to accounting, auditing, and financial reporting standards and practices comparable to those in the United States. The securities of some foreign issuers are less liquid and at times more volatile than securities of comparable U.S. issuers.
The Funds may enter into futures contracts traded on domestic exchanges, including stock index futures contracts, as a substitute for a comparable market position in the underlying security, to attempt to hedge or limit the exposure of a Fund’s position, to create a synthetic money market position, for certain tax-related purposes and to effect closing transactions. Upon entering into a contract, the Funds deposit and maintain as collateral such initial margin as required by the exchange on which the transaction is effected. Pursuant to the contract, the Funds agree to receive from or pay to the broker an amount of cash equal to the daily fluctuation in value of the contract. Such receipts or payments are known as variation margin and are recorded by the Funds as unrealized gains and losses. When the contract is closed, the Funds record a realized gain or loss equal to the difference between the value of the contract at the time it was opened and the value at the time it
128
ENVESTNET FUNDS
Notes to Financial Statements, continued
August 31, 2023
was closed. A stock index futures contract does not involve the physical delivery of the underlying stocks in the index. As collateral for futures contracts, the Funds are required to maintain assets consisting of cash, cash equivalents or liquid securities. This collateral is required to be adjusted daily to reflect the market value of the purchase obligation for long futures contracts or the market value of the instrument underlying the contract, but not less than the market price at which the futures contract was established, for short futures contracts. The Funds did not enter into any futures contracts during the year ended August 31, 2023.
The risks inherent in the use of futures contracts include 1) adverse changes in the value of such instruments and 2) the possible absence of a liquid secondary market for any particular instrument at any time. Futures contracts may also expose the Funds to counterparty credit risk. The Funds will not enter into these contracts unless they own either 1) an offsetting position in the securities or 2) the position provides cash and liquid assets with a value marked-to-market daily, sufficient to cover the counter-party’s potential obligations.
| | (d) | | Forward Foreign Currency Contracts |
The Core Fixed Income Fund might purchase a particular currency or enter into a forward foreign currency contract to preserve the U.S. dollar price of securities it intends to or has contracted to purchase. Alternatively, it might sell a particular currency on either a spot or forward basis to hedge against an anticipated decline in the dollar value of securities it intends to or has contracted to sell. Although this strategy could minimize the risk of loss due to a decline in the value of the hedged currency, it could also limit any potential gain from an increase in the value of the currency. When entering into a forward foreign currency contract, the Fund agrees to receive or deliver a fixed quantity of foreign currency for an agreed-upon price at a future date. The market value of the contract fluctuates with changes in currency exchange rates. The contract is marked-to-market daily and the change in market value is recorded by the Fund as an unrealized gain or loss. The Fund records a realized gain or loss equal to the difference between the value of the contract at the time it was opened and the value at the time it was closed. The risks inherent in the use of currency forward exchange contracts include adverse changes in the value of such instruments and exposure to counterparty credit risk. Forward contracts are subject to the risks that the counterparty to such contract will default on its obligations. Since a forward foreign currency exchange contract is not guaranteed by an exchange or clearing house, a default on the contract would deprive the Fund of unrealized profits, transaction costs or the benefits of a currency hedge or force the Fund to cover its purchase or sale commitments, if any, at the current market price. The Fund did not enter into any forward foreign currency contracts during the year ended August 31, 2023.
The Core Fixed Income Fund may enter into written call options to hedge against changes in the value of equities. The writing of call options is intended to reduce the volatility of the portfolio and to earn premium income. Written call options expose the Fund to minimal counterparty credit risk since they are exchange traded and the exchange’s clearing house guarantees the options against default. The Fund may also purchase put options to provide protection against adverse price effects from anticipated changes in prices of securities. In addition, the Fund may enter into written put options to hedge against changes in the value of purchased put options.
The Fund may purchase and write call and put options on securities and indices and enter into related closing transactions.
When the Fund writes an option, an amount equal to the premium received by the Fund is recorded as a liability and is subsequently adjusted to the current fair value of the option written. Premiums received from writing options that expire unexercised are treated by the Fund on the expiration date as realized gains from options written. The difference between the premium and the amount paid on effecting a closing purchase transaction, including brokerage commissions, is also treated as a realized gain, or, if the premium is less
129
ENVESTNET FUNDS
Notes to Financial Statements, continued
August 31, 2023
than the amount paid for the closing purchase transaction, as a realized loss. If a call option is exercised, the premium is added to the proceeds from the sale of the underlying security or currency in determining whether the Fund has realized a gain or a loss. If a put option is exercised, the premium is deducted from the cost basis of the security purchased. The Fund, as writer of an option, bears the market risk of an unfavorable change in the price of the security underlying the written option.
When purchasing options, the Fund will recognize a realized loss equal to the premium paid to purchase the option, if the option expires unexercised. The difference between the proceeds received on effecting a closing sale transaction and the premium paid will be recognized as a realized gain or loss. If a put option is exercised, the premium paid is deducted from the proceeds on the sale of the underlying security in determining whether the Fund has a realized gain or loss. The Fund did not enter into any options contracts during the year ended August 31, 2023.
When the PMC Funds loan securities held in their portfolios, the PMC Funds receive compensation in the form of fees, or retain a portion of the interest on the investment of any cash received as collateral. The loans are secured by collateral at least equal to: (i) 105% of the market value of the loaned securities that are foreign securities, or 102% of the market value of any other loaned securities, at the time the securities are loaned; and (ii) 100% of the market value of the loaned securities at all times. Gain or loss in the value of securities loaned that may occur during the term of the loan will be for the account of the PMC Funds. The PMC Funds have the right under the lending agreement to recover the securities from the borrower on demand. See Note 11 for additional information.
The Funds comply with the requirements of Subchapter M of the Internal Revenue Code of 1986, as amended (the “Code”), necessary to qualify as a regulated investment company and make the requisite distributions of income and capital gains to their shareholders sufficient to relieve them from all or substantially all federal income taxes. Therefore, no federal income tax provision has been provided.
As of and during the year ended August 31, 2023, the Funds did not have a liability for any unrecognized tax benefits. The Funds recognize interest and penalties, if any, related to uncertain tax benefits as income tax expense in the Statements of Operations. During the year ended August 31, 2023, the Funds did not incur any interest or penalties. The PMC Funds are not subject to examination by U.S. taxing authorities for the tax periods prior to the year ended August 31, 2019.
| | (h) | | Distributions to Shareholders |
The Funds will distribute net investment income and net realized capital gains at least annually. Distributions from net realized gains for book purposes may include short-term capital gains. All short-term capital gains are included in ordinary income for tax purposes. Distributions to shareholders are recorded on the ex-dividend date. The Funds may also pay a special distribution at the end of the calendar year to comply with federal tax requirements.
The preparation of financial statements in conformity with GAAP requires management to make estimates and assumptions that affect the reported amounts of assets and liabilities and disclosure of contingent assets and liabilities at the date of the financial statements and the reported amounts of revenues and expenses during the reporting period. Actual results could differ from those estimates.
130
ENVESTNET FUNDS
Notes to Financial Statements, continued
August 31, 2023
The NAV per share of a Fund is calculated by dividing the sum of the value of the securities held by the Fund, plus cash or other assets, minus all liabilities (including estimated accrued expenses) by the total number of shares outstanding for the Fund, rounded to the nearest cent. The Funds’ shares will not be priced on the days on which the NYSE is closed for trading. The Funds do not charge a redemption fee, therefore the offering and redemption price per share are equal to a Fund’s net asset value per share.
| | (k) | | Allocation of Income, Expenses and Gains/Losses |
Income, expenses (other than those deemed attributable to a specific share class), and gains and losses of each Fund are allocated daily to each class of shares based upon the ratio of net assets represented by each class as a percentage of the net assets of the Fund. Expenses deemed directly attributable to a class of shares are recorded by the specific class. Most expenses are allocated by class based on relative net assets. Distribution (Rule 12b-1) fees are expensed at 0.25% of average daily net assets of the Advisor Class shares of the PMC Funds. Expenses associated with a specific fund in the Trust are charged to that fund. Common expenses are typically allocated evenly between the funds of the Trust or other equitable means.
Investment transactions are recorded on the trade date. The Funds determine the gain or loss from investment transactions on the identified cost basis by comparing the original cost of the security lot sold with the net sale proceeds. Dividend income is recognized on the ex-dividend date, and interest income is recognized on an accrual basis. Discounts, premiums and interest-only strips are accreted or amoritzed over the expected life of the respective securities using the constant yield method. Gains and losses on principal payments and short-falls of mortgage backed securities (paydown gains and losses) are included as an adjustment to interest income in the Statements of Operations.
Certain instruments in which the Funds may invest previously relied in some fashion upon the London Interbank Offered Rate (LIBOR). As of June 30, 2023, the ICE Benchmark Administration (“IBA”), as LIBOR administrator, ceased publication of U.S. dollar (“USD”) LIBOR for the most common tenors (overnight and one, three, six and twelve months), and as of December 31, 2021, the IBA had ceased publication of USD LIBOR for the less commonly used tenors of one week and two months as well as all tenors of non-USD LIBOR. Until September 30, 2024, the IBA will continue to publish the one-month, three-month and six-month USD LIBOR tenors using a synthetic methodology that is permanently unrepresentative of the underlying markets such tenors previously sought to measure. The U.S. Congress passed the Adjustable Interest Rate (LIBOR) Act on March 15, 2022. The LIBOR Act replaces references to LIBOR for U.S. contracts that did not mature before June 30, 2023 with benchmark replacements based on the Secured Overnight Financing Rate (“SOFR”). SOFR is a broad measure of the cost of borrowing cash overnight collateralized by U.S. Treasury securities and is published daily by the Federal Reserve Bank of New York. The benchmark replacement rate may not have the same value or economic equivalence as LIBOR. The transition from LIBOR could have a significant impact on the financial markets, including increased volatility and illiquidity in markets for instruments that currently rely on LIBOR to determine interest rates and a reduction in the values of some LIBOR-based investments. The transition to an alternative interest rate may not be orderly, may occur over various time periods or may have unintended consequences.
131
ENVESTNET FUNDS
Notes to Financial Statements, continued
August 31, 2023
The tax character of distributions paid to shareholders were as follows:
| | | | | | | | | | | | |
PMC Core Fixed Income Fund
| | Ordinary
Income
| | | Tax Exempt
Income
| | | Long-Term
Capital Gains
| |
Year Ended August 31, 2023 | | $ | 10,484,355 | | | $ | — | | | $ | — | |
Year Ended August 31, 2022 | | $ | 9,240,233 | | | $ | — | | | $ | 4,677,382 | |
| | | |
PMC Diversified Equity Fund
| | Ordinary
Income
| | | Tax Exempt
Income
| | | Long-Term
Capital Gains
| |
Year Ended August 31, 2023 | | $ | 12,064,740 | | | $ | — | | | $ | 12,251,716 | |
Year Ended August 31, 2022 | | $ | 21,468,568 | | | $ | — | | | $ | 74,998,483 | |
| | | |
ActivePassive Core Bond ETF
| | Ordinary
Income
| | | Tax Exempt
Income
| | | Long-Term
Capital Gains
| |
Period Ended August 31, 2023 | | $ | 765,963 | | | $ | — | | | $ | — | |
| | | |
ActivePassive Intermediate Municipal Bond ETF
| | Ordinary
Income
| | | Tax Exempt
Income
| | | Long-Term
Capital Gains
| |
Period Ended August 31, 2023 | | $ | 22,927 | | | $ | 125,954 | | | $ | — | |
| | | |
ActivePassive International Equity ETF
| | Ordinary
Income
| | | Tax Exempt
Income
| | | Long-Term
Capital Gains
| |
Period Ended August 31, 2023 | | $ | — | | | $ | — | | | $ | — | |
| | | |
ActivePassive U.S. Equity ETF
| | Ordinary
Income
| | | Tax Exempt
Income
| | | Long-Term
Capital Gains
| |
Period Ended August 31, 2023 | | $ | — | | | $ | — | | | $ | — | |
132
ENVESTNET FUNDS
Notes to Financial Statements, continued
August 31, 2023
As of August 31, 2023, the components of distributable earnings (deficit) for income tax purposes were as follows:
| | | | | | | | | | | | | | | | | | | | | | | | |
| | | PMC Core
Fixed
Income
Fund
| | | PMC
Diversified
Equity Fund
| | | ActivePassive
Core Bond
ETF
| | | ActivePassive
Intermediate
Municipal
Bond ETF
| | | ActivePassive
International
Equity ETF
| | | ActivePassive
U.S. Equity
ETF
| |
Cost basis of investments for federal income tax purposes | | $ | 454,634,959 | | | $ | 932,776,465 | | | $ | 101,985,505 | | | $ | 30,945,397 | | | $ | 76,580,220 | | | $ | 164,661,425 | |
| | |
|
|
| |
|
|
| |
|
|
| |
|
|
| |
|
|
| |
|
|
|
Gross tax unrealized appreciation | | $ | 1,070,075 | | | $ | 159,617,200 | | | $ | 75,527 | | | $ | 1 | | | $ | 3,610,822 | | | $ | 17,938,243 | |
Gross tax unrealized depreciation | | | (30,157,036 | ) | | | (23,258,637 | ) | | | (2,576,403 | ) | | | (747,181 | ) | | | (3,405,368 | ) | | | (2,528,480 | ) |
| | |
|
|
| |
|
|
| |
|
|
| |
|
|
| |
|
|
| |
|
|
|
Net tax unrealized appreciation | | $ | (29,086,961 | ) | | $ | 136,358,563 | | | $ | (2,500,876 | ) | | $ | (747,180 | ) | | $ | 205,454 | | | $ | 15,409,763 | |
| | |
|
|
| |
|
|
| |
|
|
| |
|
|
| |
|
|
| |
|
|
|
Undistributed ordinary income | | $ | 8,804,784 | | | $ | 19,859,389 | | | $ | 316,066 | | | $ | 51,907 | | | $ | 671,642 | | | $ | 727,620 | |
Undistributed long-term capital gain | | | — | | | | 33,051,364 | | | | — | | | | — | | | | — | | | | — | |
| | |
|
|
| |
|
|
| |
|
|
| |
|
|
| |
|
|
| |
|
|
|
Total distributable earnings | | $ | 8,804,784 | | | $ | 52,910,753 | | | $ | 316,066 | | | $ | 51,907 | | | $ | 671,642 | | | $ | 727,620 | |
Other accumulated loss | | | (43,758,088 | ) | | | — | | | | (207,824 | ) | | | — | | | | (246,200 | ) | | | (286,501 | ) |
| | |
|
|
| |
|
|
| |
|
|
| |
|
|
| |
|
|
| |
|
|
|
Total accumulated earnings | | $ | (64,040,265 | ) | | $ | 189,269,316 | | | $ | (2,392,634 | ) | | $ | (695,273 | ) | | $ | 630,896 | | | $ | 15,850,882 | |
| | |
|
|
| |
|
|
| |
|
|
| |
|
|
| |
|
|
| |
|
|
|
The difference between book-basis and tax-basis cost is attributable primarily to the tax deferral of losses on wash sale adjustments and PFIC mark-to-market adjustments.
At August 31, 2023, the Funds had capital loss carryovers as follows:
| | | | | | | | |
| | | Short-Term
| | | Long-Term
| |
PMC Core Fixed Income Fund | | $ | (20,029,413 | ) | | $ | (23,728,675 | ) |
PMC Diversified Equity Fund | | | — | | | | — | |
ActivePassive Core Bond ETF | | | (207,824 | ) | | | — | |
ActivePassive Intermediate Municipal Bond ETF | | | — | | | | — | |
ActivePassive International Equity ETF | | | (246,200 | ) | | | — | |
ActivePassive U.S. Equity ETF | | | (286,501 | ) | | | — | |
Additionally, GAAP requires that certain components of net assets relating to permanent differences be reclassified between financial and tax reporting. These reclassifications have no effect on net assets or net
133
ENVESTNET FUNDS
Notes to Financial Statements, continued
August 31, 2023
asset value per share. For the year ended August 31, 2023, the following reclassifications were made for permanent tax differences due to equalization on the Statements of Assets and Liabilities:
| | | | | | | | | | | | | | | | | | | | | | | | |
| | | PMC Core
Fixed
Income Fund
| | | PMC Diversified
Equity Fund
| | | ActivePassive
Core Bond ETF
| | | ActivePassive
Intermediate
Municipal
Bond ETF
| | | ActivePassive
International
Equity ETF
| | | ActivePassive
U.S.
Equity ETF
| |
Total distributable earnings | | $ | — | | | $ | (8,175,223 | ) | | $ | — | | | $ | — | | | $ | — | | | $ | — | |
Paid-in capital | | $ | — | | | $ | 8,175,223 | | | $ | — | | | $ | — | | | $ | — | | | $ | — | |
The Funds had no material uncertain tax positions and have not recorded a liability for unrecognized tax benefits as of August 31, 2023. Also, the Funds recognized no interest and penalties related to uncertain tax benefits in fiscal year 2023. At August 31, 2023, the fiscal years 2020 through 2023 remain open to examination in the Funds’ major tax jurisdictions.
The Trust has entered into an Investment Advisory Agreement (the “Agreement”), on behalf of the PMC Funds, with the Adviser to furnish investment advisory services to the PMC Funds. Under terms of the Agreement, the Trust, on behalf of the PMC Funds, the Adviser is entitled to receive from the Diversified Equity Fund a management fee equal to 0.53% of the Fund’s average daily net assets and is entitled to receive from the Core Fixed Income Fund a management fee equal to 0.65% of the Fund’s average daily net assets if the Fund’s net assets are $2,500,000,000 or less; 0.625% if the Fund’s net assets are greater than $2,500,000,000 but less than $5,000,000,000; and 0.60% if the Fund’s assets are greater than $5,000,000,000.
The Adviser has contractually agreed to waive its management fees and/or reimburse other expenses of each PMC Fund at least through December 29, 2023 to the extent necessary to ensure that the Fund’s total annual operating expenses (excluding front-end or contingent deferred sales loads, Rule 12b-1 plan fees, shareholder servicing plan fees, taxes, leverage, interest, brokerage commissions and other transactional expenses, expenses incurred in connections with any merger or reorganizations, dividends or interest on short positions, acquired fund fees and expenses, or extraordinary expenses such as litigation) do not exceed 0.60% for the Core Fixed Income Fund and 0.73% for the Diversified Equity Fund (the “Expense Limitation Cap”) of each Fund’s average daily net assets.
Any such waiver or reimbursement is subject to later adjustment to allow the Adviser to recoup amounts waived or reimbursed to the extent actual fees and expenses for a fiscal period do not exceed the lesser of: (1) the Expense Limitation Cap in place at the time of the waiver or reimbursement or (2) the Expense Limitation Cap in place at the time of recoupment; provided, however, that the Adviser shall only be entitled to recoup such amounts over the following three year period from the date of the waiver or reimbursement.
The following table shows the remaining waived or reimbursed expenses subject to potential recovery expiring by:
| | | | | | | | |
| | | Core Fixed
Income Fund
| | | Diversified
Equity Fund
| |
August 31, 2024 | | $ | 1,255,760 | | | $ | — | |
August 31, 2025 | | $ | 1,309,991 | | | $ | — | |
August 31, 2026 | | $ | 1,216,182 | | | $ | — | |
Sub-advisory services are provided to the Core Fixed Income Fund, pursuant to an agreement between the Adviser and Neuberger Berman Investment Advisers LLC (the “Sub-Adviser”). Under the terms of the sub-advisory agreement, the Adviser compensates the Sub-Adviser based on the Fund’s average daily net assets.
134
ENVESTNET FUNDS
Notes to Financial Statements, continued
August 31, 2023
In addition, the Trust, on behalf of the ActivePassive ETFs (“ETFs”), has entered into an investment advisory agreement (the “ETF Agreement”) with the Adviser to furnish investment advisory services to the ETFs. Pursuant to the ETF Agreement, the Core Bond ETF, Intermediate Municipal Bond ETF, International Equity ETF and U.S. Equity ETF pay a unitary management fee to the Adviser, which is calculated daily and paid monthly, at an annual rate of 0.35%, 0.35%, 0.45% and 0.30%, respectively, of the ETF’s average daily net assets. Pursuant to the ETF Agreement, the Adviser has agreed to pay all expenses of the ETFs except the unitary management fee paid to the Adviser under the ETF Agreement, interest charges on any borrowings, dividends and other expenses on securities sold short, taxes, brokerage commissions and other expenses incurred in placing orders for the purchase and sale of securities and other investment instruments, acquired fund fees and expenses, accrued deferred tax liability, extraordinary expenses, distribution fees and expenses paid by the ETFs under any distribution plan adopted pursuant to Rule 12b-1 under the 1940 Act.
Sub-advisory services are provided to the ETFs, pursuant to agreements between the Adviser and the below listed sub-advisers. Under the terms of these sub-advisory agreements, the Adviser compensates the subadvisers based on each Fund’s average daily net assets.
ActivePassive Core Bond ETF
Neuberger Berman Investment Advisers LLC
Sage Advisory Services, Ltd Co.
ActivePassive Intermediate Municipal Bond ETF
GW&K Investment Management, LLC
ActivePassive International Equity ETF
AllianceBernstein L.P.
Causeway Capital Management LLC
The Trust has adopted a Distribution Plan pursuant to Rule 12b-1 under the 1940 Act (the “12b-1 Plan”), on behalf of the Advisor Class shares of the PMC Funds, which authorizes the Trust to pay Foreside Fund Services, LLC (the “Distributor”), the Funds’ principal distributor, a distribution fee of 0.25% of each Fund’s average daily net assets of Advisor Class shares. During the year ended August 31, 2023, the PMC Funds incurred fees pursuant to the 12b-1 Plan as follows:
| | | | |
Core Fixed Income Fund | | $ | 101,481 | |
Diversified Equity Fund | | $ | 246,836 | |
| (6) | | Related Party Transactions |
U.S. Bancorp Fund Services, LLC (doing business as U.S. Bank Global Fund Services (“Fund Services”)) acts as the Funds’ Administrator under an Administration Agreement. Fund Services prepares various federal and state regulatory filings, reports and returns for the Funds; prepares reports and materials to be supplied to the Trustees; monitors the activities of the Funds’ custodian, transfer agent and accountants; coordinates the preparation and payment of the Funds’ expenses and reviews the Funds’ expense accruals. Fees incurred by the PMC Funds for the year ended August 31, 2023, and owed as of August 31, 2023, are as follows:
| | | | | | | | |
| | | Incurred
| | | Owed
| |
Core Fixed Income Fund | | $ | 220,371 | | | $ | 48,929 | |
Diversified Equity Fund | | $ | 422,270 | | | $ | 70,210 | |
135
ENVESTNET FUNDS
Notes to Financial Statements, continued
August 31, 2023
Fund Services also serves as the fund accountant and transfer agent to the Funds. U.S. Bank, N.A. (“U.S. Bank”), an affiliate of Fund Services, serves as each Fund’s custodian. Fees incurred for the year ended August 31, 2023, and owed as of August 31, 2023 are as follows:
| | | | | | | | |
Fund Accounting
| | Incurred
| | | Owed
| |
Core Fixed Income Fund | | $ | 223,590 | | | $ | 35,723 | |
Diversified Equity Fund | | $ | 251,261 | | | $ | 41,068 | |
| | | | | | | | |
Transfer Agency
| | Incurred
| | | Owed
| |
Core Fixed Income Fund | | $ | 309,395 | | | $ | 49,639 | |
Diversified Equity Fund | | $ | 421,203 | | | $ | 69,222 | |
| | | | | | | | |
Custody
| | Incurred
| | | Owed
| |
Core Fixed Income Fund | | $ | 70,983 | | | $ | 11,453 | |
Diversified Equity Fund | | $ | 113,390 | | | $ | 19,604 | |
Under the terms of the ETF Agreement, the Adviser pays the fund administration and accounting, transfer agency and custody fees for the ActivePassive ETFs.
The PMC Funds each have an unsecured line of credit with U.S. Bank (see Note 9).
Certain officers of the Funds are also employees of Fund Services. A Trustee of the Trust is affiliated with Fund Services and U.S. Bank.
The Trust’s Chief Compliance Officer is also an employee of Fund Services. Each Fund’s allocation of the Trust’s Chief Compliance Officer fee incurred by the PMC Funds for the year ended August 31, 2023, and owed as of August 31, 2023 is as follows:
| | | | | | | | |
| | | Incurred
| | | Owed
| |
Core Fixed Income Fund | | $ | 16,848 | | | $ | 3,195 | |
Diversified Equity Fund | | $ | 12,008 | | | $ | 1,938 | |
Under the terms of the ETF Agreement, the Adviser pays the chief compliance officer fees for the ActivePassive ETFs.
| (7) | | Creation and Redemption Transactions |
Shares of the ActivePassive ETFs are listed and traded on the NYSE Arca, Inc. The ActivePassive ETFs issue and redeem shares on a continuous basis at NAV only in large blocks of shares called “Creation Units.” Creation Units are to be issued and redeemed principally in kind for a basket of securities and a balancing cash amount. Shares generally will trade in the secondary market in amounts less than a Creation Unit at market prices that change throughout the day. Market prices for the shares may be different from their NAV. The NAV is determined as of the close of trading (generally, 4:00 p.m. Eastern Time) on each day the NYSE is open for trading. The NAV of the shares of each ActivePassive ETF will be equal to the ActivePassive ETF’s total assets minus the ActivePassive ETF’s total liabilities divided by the total number of shares outstanding. The NAV that is published will be rounded to the nearest cent; however, for purposes of determining the price of Creation Units, the NAV will be calculated to five decimal places.
Only “Authorized Participants” may purchase or redeem shares directly from the ActivePassive ETFs. An Authorized Participant is either (i) a broker-dealer or other participant in the clearing process through the Continuous Net Settlement System of National Securities Clearing Corporation or (ii) a DTC participant and, in each case, must have executed a Participant Agreement with the Distributor. Most retail investors will not
136
ENVESTNET FUNDS
Notes to Financial Statements, continued
August 31, 2023
qualify as Authorized Participants or have the resources to buy and sell whole Creation Units. Therefore, they will be unable to purchase or redeem the shares directly from the ActivePassive ETFs. Rather, most retail investors will purchase shares in the secondary market with the assistance of a broker and will be subject to customary brokerage commissions or fees. Securities received or delivered in connection with in-kind creates and redeems are valued as of the close of business on the effective date of the creation or redemption.
Creation Unit Transaction Fee
Authorized Participants will be required to pay to the Custodian a fixed transaction fee (the “Creation Transaction Fee”) in connection with the issuance of Creation Units. The standard Creation Transaction Fee will be the same regardless of the number of Creation Units purchased by an investor on the applicable Business Day. The Creation Transaction Fee for each ActivePassive ETF is $500.
An additional variable fee of up to a maximum of 3% of the value of the Creation Units subject to the transaction may be imposed for cash purchases, non-standard orders, or partial purchase of Creation Units. For orders comprised entirely of cash, a variable fee of 0.25% of the value of the order will be charged by each ActivePassive ETF. The variable charge is primarily designed to cover additional costs (e.g., brokerage, taxes) involved with buying the securities with cash. Each ActivePassive ETF may determine to not charge a variable fee on certain orders when the Adviser has determined that doing so is in the best interests of the ActivePassive ETF’s shareholders.
A creation unit will generally not be issued until the transfer of good title of the deposit securities to the ActivePassive ETFs and the payment of any cash amounts have been completed. To the extent contemplated by the applicable participant agreement, Creation Units of each ActivePassive ETF will be issued to such authorized participant notwithstanding the fact that the ActivePassive ETF’s deposits have not been received in part or in whole, in reliance on the undertaking of the authorized participant to deliver the missing deposit securities as soon as possible. If the ActivePassive ETFs or their agents do not receive all of the deposit securities, or the required cash amounts, by such time, then the order may be deemed rejected and the authorized participant shall be liable to the ActivePassive ETFs for losses, if any.
| (8) | | Investment Transactions |
Purchases and sales of investment securities (excluding short-term instruments) for the year ended August 31, 2023 are summarized below.
| | | | | | | | | | | | | | | | | | | | | | | | |
| | | PMC Core Fixed
Income Fund
| | | PMC Diversified
Equity Fund
| | | ActivePassive
Core Bond ETF
| | | ActivePassive
Intermediate
Municipal
Bond ETF
| | | ActivePassive
International
Equity ETF
| | | ActivePassive
U.S. Equity
ETF
| |
Purchases: | | | | | | | | | | | | | | | | | | | | | | | | |
U.S. Government | | $ | 608,965,981 | | | $ | — | | | $ | 56,075,335 | | | $ | — | | | $ | — | | | $ | — | |
Other | | | 171,801,860 | | | | 915,303,374 | | | | 56,992,748 | | | | 30,774,995 | | | | 11,663,292 | | | | 17,160,324 | |
| | |
|
|
| |
|
|
| |
|
|
| |
|
|
| |
|
|
| |
|
|
|
Total Purchases | | $ | 780,767,841 | | | $ | 915,303,374 | | | $ | 113,068,083 | | | $ | 30,774,995 | | | $ | 11,663,292 | | | $ | 17,160,324 | |
Sales | | | | | | | | | | | | | | | | | | | | | | | | |
U.S. Government | | $ | 616,916,757 | | | $ | — | | | $ | 8,998,257 | | | $ | — | | | $ | — | | | $ | — | |
Other | | | 224,673,908 | | | | 1,090,388,741 | | | | 3,038,591 | | | | — | | | | 10,934,834 | | | | 15,166,494 | |
| | |
|
|
| |
|
|
| |
|
|
| |
|
|
| |
|
|
| |
|
|
|
Total Sales | | $ | 841,590,665 | | | $ | 1,090,388,741 | | | $ | 12,036,848 | | | $ | — | | | $ | 10,934,834 | | | $ | 15,166,494 | |
The above ActivePassive International Equity ETF and ActivePassive U.S. Equity ETF purchases and sales exclude any in-kind transactions associated with creations and redemptions. During the period ended August 31, 2023, the International Equity ETF had $75,312,025 of creations in-kind and $0 of redemptions in-kind, and the U.S. Equity ETF had $161,890,707 of creations in-kind and $0 of redemptions in-kind.
137
ENVESTNET FUNDS
Notes to Financial Statements, continued
August 31, 2023
At August 31, 2023, the Core Fixed Income Fund and Diversified Equity Fund had unsecured lines of credit in the lesser amount of $20,000,000 and $35,000,000, respectively, or 33.33% of the fair value of unencumbered assets of each Fund, as defined, which both mature August 5, 2024. These unsecured lines of credit are intended to provide short-term financing, if necessary, subject to certain restrictions, in connection with shareholder redemptions. The credit facility is with the Funds’ custodian, US Bank. Interest was scheduled to be incurred at the bank’s prime rate of 5.50% from September 1, 2022 through September 21, 2022, 6.25% from September 22, 2022 through November 2, 2022, 7.00% from November 3, 2022 through December 14, 2022, 7.50% from December 15, 2022 through February 1, 2023, 7.75% from February 2, 2023 through March 22, 2023, 8.00% from March 23, 2023 through May 3, 2023, 8.25% from May 4, 2023 through July 26, 2023, 8.50% from July 27, 2023 through August 31, 2023. The following table provides information regarding usage of the line of credit for the year ended August 31, 2023 for the Funds. The Funds did not have an outstanding balance on either line of credit as of August 31, 2023.
| | | | | | | | | | | | | | | | | | | | | | | | |
| | | Days
Utilitized
| | | Average
Amount of
Borrowing
| | | Weighted
Average
Borrowing
Rate
| | | Interest
Expense*
| | | Maximum
Amount of
Borrowing
| | | Date of
Maximum
Borrowing
| |
Core Fixed Income Fund | | | 7 | | | $ | 27,000 | | | | 7.18 | % | | $ | 38 | | | $ | 45,000 | | | | 1/30/2023 | |
Diversified Equity Fund | | | 23 | | | $ | 4,895,391 | | | | 7.58 | % | | $ | 23,719 | | | $ | 32,269,000 | | | | 1/6/2023 | |
| * | | Interest expense is reported within Other Expenses on the Statements of Operations. |
| (10) | | Beneficial Ownership |
The beneficial ownership, either directly or indirectly, of more than 25% of the voting securities of a fund creates a presumption of control of a fund, under Section 2(a)(9) of the 1940 Act. At August 31, 2023, National Financial Services, LLC, for the benefit of its customers, held 43.02% and 94.79%, respectively, of the PMC Core Fixed Income Fund’s outstanding Advisor Class and Institutional Class shares. At August 31, 2023, National Financial Services, LLC, for the benefit of its customers, held 54.43% and 93.65%, respectively, of the PMC Diversified Equity Fund’s outstanding Advisor Class and Institutional Class shares.
Pursuant to the terms of a securities lending agreement with U.S. Bank, each PMC Fund may lend securities from its portfolio to brokers, dealers and financial institutions in order to increase the return on its portfolio, primarily through the receipt of borrowing fees and earnings on invested collateral. Any such loan must be continuously secured by collateral in cash or cash equivalents maintained on a current basis in an amount at least equal to the market value of the securities loaned by a PMC Fund. During the time securities are on loan, the borrower will pay the applicable PMC Fund any accrued income on those securities, and the PMC Fund may invest the cash collateral and earn income or receive an agreed-upon fee from a borrower that has delivered cash-equivalent collateral. In determining whether or not to lend a security to a particular broker, dealer or financial institution, the Adviser considers all relevant facts and circumstances, including the size, creditworthiness and reputation of the broker, dealer or financial institution.
Securities lending involves the risk of a default or insolvency of the borrower. In either of these cases, a PMC Fund could experience delays in recovering securities or collateral or could lose all or part of the value of the loaned securities. A PMC Fund also could lose money in the event of a decline in the value of the collateral provided for loaned securities. Additionally, the loaned portfolio securities may not be available to a PMC Fund on a timely basis and that PMC Fund may therefore lose the opportunity to sell the securities at a desirable price. Any decline in the value of a security that occurs while the security is out on loan would continue to be borne by the applicable PMC Fund.
138
ENVESTNET FUNDS
Notes to Financial Statements, continued
August 31, 2023
As of August 31, 2023, the value of the securities on loan and value of collateral received for securities lending were as follows:
| | | | | | | | | | | | |
| | | Loaned Securities
Value
| | | Value of Cash Collateral
| | | % of Net Assets
| |
Core Fixed Income Fund | | $ | 48,899,480 | | | $ | 49,844,301 | | | | 12.96 | % |
Diversified Equity Fund | | $ | 195,341,462 | | | $ | 200,726,076 | | | | 22.43 | % |
The PMC Funds receive cash as collateral in return for securities lent as part of the securities lending program. The collateral is invested in the Mount Vernon Liquid Assets Portfolio, LLC as noted on the Schedules of Investments. The investment objective is to seek to maximize current income with the preservation of capital and liquidity and maintain a stable NAV of $1.00 per unit. The remaining contractual maturity of all securities lending transactions is overnight and continuous.
The PMC Funds are not subject to a master netting agreement with respect to securities lending; therefore, no additional disclosures regarding netting arrangements are required.
The net fee and interest income earned by the PMC Funds on investments of cash collateral received from borrowers for the securities loaned to them are reflected in the PMC Funds’ Statements of Operations.
| (12) | | Recent Market Events |
U.S. and international markets have experienced significant periods of volatility in recent years and months due to a number of economic, political and global macro factors including rising inflation, uncertainty regarding central banks’ interest rate increases, the possibility of a national or global recession, trade tensions, political events, the war between Russia and Ukraine and the impact of the coronavirus (COVID-19) global pandemic. The global recovery from COVID-19 may last for an extended period of time. As a result of continuing political tensions and armed conflicts, including the war between Ukraine and Russia, the U.S. and the European Union imposed sanctions on certain Russian individuals and companies, including certain financial institutions, and have limited certain exports and imports to and from Russia. The war has contributed to recent market volatility and may continue to do so. These developments, as well as other events, could result in further market volatility and negatively affect financial asset prices, the liquidity of certain securities and the normal operations of securities exchanges and other markets, despite government efforts to address market disruptions. Continuing market volatility as a result of recent market conditions or other events may have adverse effects on your account.
The ActivePassive Core Bond ETF paid distributions to shareholders as follows:
| | | | | | | | | | | | | | | | |
Record Date
| | Ex-Date
| | | Payable Date
| | | Ordinary Income
Rate
| | | Ordinary Income
Distribution Paid
| |
9/5/2023 | | | 9/1/2023 | | | | 9/6/2023 | | | $ | 0.09106299 | | | $ | 311,891 | |
10/3/2023 | | | 10/2/2023 | | | | 10/4/2023 | | | $ | 0.08432858 | | | $ | 301,475 | |
The ActivePassive Intermediate Municipal Bond ETF paid distributions to shareholders as follows:
| | | | | | | | | | | | | | | | |
Record Date
| | Ex-Date
| | | Payable Date
| | | Ordinary Income
Rate
| | | Ordinary Income
Distribution Paid
| |
9/5/2023 | | | 9/1/2023 | | | | 9/6/2023 | | | $ | 0.04284544 | | | $ | 53,557 | |
10/3/2023 | | | 10/2/2023 | | | | 10/4/2023 | | | $ | 0.04096220 | | | $ | 51,203 | |
The Funds have evaluated events and transactions that have occurred subsequent to August 31, 2023 through the date the financial statements were issued and determined there were no other subsequent events that would require disclosure in the financial statements.
139
Report of Independent Registered Public Accounting Firm
To the Shareholders of PMC Funds and ActivePassive ETFs and
Board of Trustees of Trust for Professional Managers
Opinion on the Financial Statements
We have audited the accompanying statements of assets and liabilities, including the schedules of investments, of PMC Funds and ActivePassive ETFs comprising the funds listed below (the “Funds”), each a series of Trust for Professional Managers, as of August 31, 2023, the related statements of operations, the statements of changes in net assets, the related notes, and the financial highlights for each of the periods indicated below (collectively referred to as the “financial statements”). In our opinion, the financial statements present fairly, in all material respects, the financial position of each of the Funds as of August 31, 2023, the results of their operations, the changes in net assets, and the financial highlights for each of the periods indicated below in conformity with accounting principles generally accepted in the United States of America.
| | | | | | |
Fund Name
| | Statements of Operations
| | Statements of
Changes in Net
Assets
| | Financial
Highlights
|
PMC Core Fixed Income Fund | | For the year ended August 31, 2023* |
PMC Diversified Equity Fund | | For the year ended August 31, 2023* |
ActivePassive Core Bond ETF | | For the period from May 2, 2023 (commencement of operations) through August 31, 2023 |
ActivePassive Intermediate Municipal Bond ETF | | For the period from May 2, 2023 (commencement of operations) through August 31, 2023 |
ActivePassive International Equity ETF | | For the period from May 2, 2023 (commencement of operations) through August 31, 2023 |
ActivePassive U.S. Equity ETF | | For the period from May 2, 2023 (commencement of operations) through August 31, 2023 |
| * | | The Funds’ financial statements and financial highlights for the years ended August 31, 2022, and prior, were audited by other auditors whose report dated October 27, 2022, expressed an unqualified opinion on those financial statements and financial highlights. |
Basis for Opinion
These financial statements are the responsibility of the Funds’ management. Our responsibility is to express an opinion on the Funds’ financial statements based on our audits. We are a public accounting firm registered with the Public Company Accounting Oversight Board (United States) (“PCAOB”) and are required to be independent with respect to the Funds in accordance with the U.S. federal securities laws and the applicable rules and regulations of the Securities and Exchange Commission and the PCAOB.
We conducted our audits in accordance with the standards of the PCAOB. Those standards require that we plan and perform the audit to obtain reasonable assurance about whether the financial statements are free of material misstatement whether due to error or fraud.
Our audits included performing procedures to assess the risks of material misstatement of the financial statements, whether due to error or fraud, and performing procedures that respond to those risks. Such procedures included examining, on a test basis, evidence regarding the amounts and disclosures in the financial statements. Our procedures included confirmation of securities owned as of August 31,
140
2023, by correspondence with the custodian and brokers; when replies were not received from brokers, we performed other auditing procedures. Our audits also included evaluating the accounting principles used and significant estimates made by management, as well as evaluating the overall presentation of the financial statements. We believe that our audits provide a reasonable basis for our opinion.
We have served as the Funds’ auditor since 2023.

COHEN & COMPANY, LTD.
Milwaukee, Wisconsin
October 26, 2023
141
BASIS FOR TRUSTEES’ APPROVAL OF INVESTMENT ADVISORY AGREEMENT (PMC FUNDS)
The Board of Trustees (the “Trustees”) of Trust for Professional Managers (the “Trust”) met on August 17, 2023 to consider the renewal of the Investment Advisory Agreement (the “Agreement”) between the Trust, on behalf of the PMC Core Fixed Income Fund (the “Core Fixed Income Fund”) and the PMC Diversified Equity Fund (the “Diversified Equity Fund”) (each, a “Fund,” and together, the “Funds”), each a series of the Trust, and Envestnet Asset Management, Inc., the Funds’ investment adviser (the “Adviser”). The Trustees also met at a prior meeting held on June 22, 2023 (the “June 22, 2023 Meeting”) to review materials related to the renewal of the Agreement. Prior to these meetings, the Trustees requested and received materials to assist them in considering the renewal of the Agreement. The materials provided contained information with respect to the factors enumerated below, including a copy of the Agreement, a memorandum prepared by the Trust’s outside legal counsel discussing in detail the Trustees’ fiduciary obligations and the factors they should assess in considering the renewal of the Agreement, detailed comparative information relating to the Funds’ performance, as well as the management fees and other expenses of the Funds, due diligence materials relating to the Adviser (including a due diligence questionnaire completed on behalf of the Funds by the Adviser, the Adviser’s Form ADV, select financial statements of the Adviser, biographical information of the Adviser’s key management and compliance personnel, comparative fee information for the Funds and a summary detailing key provisions of the Adviser’s written compliance program, including its code of ethics) and other pertinent information. The Trustees also received information periodically throughout the year that was relevant to the Agreement renewal process, including performance, management fee and other expense information. Based on their evaluation of the information provided by the Adviser, in conjunction with the Funds’ other service providers, the Trustees, by a unanimous vote (including a separate vote of the Trustees who are not “interested persons,” as that term is defined in the Investment Company Act of 1940, as amended (the “Independent Trustees”)), approved the continuation of the Agreement for an additional one-year term ending August 31, 2024.
DISCUSSION OF FACTORS CONSIDERED
In considering the renewal of the Agreement and reaching their conclusions, the Trustees reviewed and analyzed various factors that they determined were relevant, including the factors enumerated below.
1. NATURE, EXTENT AND QUALITY OF SERVICES PROVIDED TO THE FUNDS
The Trustees considered the nature, extent and quality of services provided by the Adviser to the Funds and the amount of time devoted to the Funds’ operation by the Adviser’s staff. The Trustees considered the Adviser’s specific responsibilities in all aspects of day-to-day management of the Funds, including its recommendations with respect to the hiring, termination or replacement of the PMC Core Fixed Income Fund’s sub-adviser and its oversight of investment strategies implemented by the PMC Core Fixed Income Fund’s sub-adviser. The Trustees also considered the qualifications of key personnel at the Adviser involved in the day-to-day activities of the Funds, including Brandon R. Thomas, who serves as a portfolio manager to the Diversified Equity Fund and for the segment of the Core Fixed Income Fund’s assets managed by the Adviser, and Janis Zvingelis, who serves as a portfolio manager to the Diversified Equity Fund. The Trustees reviewed information provided by the Adviser in a due diligence questionnaire, including the structure of the Adviser’s compliance program. The Trustees noted that during the course of the prior year the Adviser had participated in a Trust board meeting to discuss the Funds’ performance and outlook, along with the compliance efforts made by the Adviser, including reports provided by the Adviser in its role as the Funds’ valuation designee. The Trustees also noted any services that extended beyond portfolio management, and they considered the brokerage practices of the Adviser. The Trustees discussed the Adviser’s handling of compliance matters, including the reports of the Trust’s chief compliance officer to the Trustees on the effectiveness of the Adviser’s compliance program and oversight of the compliance program of the PMC Core Fixed Income Fund’s sub-adviser. The Trustees also considered the Adviser’s overall financial condition, as well as the implementation and operational effectiveness of the Adviser’s business continuity plan. The Trustees concluded that the Adviser had sufficient quality and depth of personnel, resources, investment methods and compliance policies and procedures essential to performing its duties under the Advisory Agreement and managing the PMC Core Fixed Income Fund under the “manager of managers” structure and that the nature, overall quality and extent of the management services provided to the Funds, as well as the Adviser’s compliance program, were satisfactory and reliable.
142
2. INVESTMENT PERFORMANCE OF THE FUNDS AND THE ADVISER
The Trustees discussed the performance of the Advisor Class shares of the PMC Core Fixed Income Fund and PMC Diversified Equity Fund for the quarter, one-year, three-year, five-year, ten-year and since inception periods ended March 31, 2023. In assessing the quality of the portfolio management services delivered by the Adviser, the Trustees also compared the short-term and longer-term performance of the Advisor Class shares of the Funds on both an absolute basis and in comparison to a benchmark index (the Bloomberg U.S. Aggregate Bond Index for the PMC Core Fixed Income Fund and the MSCI World Index Net Return for the PMC Diversified Equity Fund) and in comparison to a peer group of funds as constructed using publicly-available data provided by Morningstar, Inc. and presented by Barrington Financial Group, LLC d/b/a Barrington Partners, an independent third-party benchmarking firm, through its cohort selection process (a peer group of U.S. open-end intermediate core-plus bond and intermediate core bond funds for the PMC Core Fixed Income Fund and a peer group of U.S. open-end global large-cap stock blend, global large-cap stock value and large-cap value funds for the PMC Diversified Equity Fund) (each, a “Barrington Cohort”). The Trustees noted that the Adviser did not manage any other accounts with the same or similar investment strategies as either Fund.
The Trustees noted the PMC Core Fixed Income Fund’s performance for Institutional Class shares for each of the one-year and three-year periods ended March 31, 2023 was above the Barrington Cohort average. The Trustees noted that for each of the quarter, one-year and since inception periods ended March 31, 2023, the Institutional Class shares of the PMC Core Fixed Income Fund had underperformed the Bloomberg U.S. Aggregate Bond Index. The Trustees then noted that for the three-year period ended March 31, 2023, the Institutional Class shares of the PMC Core Fixed Income Fund had outperformed the Bloomberg U.S. Aggregate Bond Index.
The Trustees noted the PMC Diversified Equity Fund’s performance for Institutional Class shares for each of the one-year and three-year periods ended March 31, 2023 was above the Barrington Cohort average. The Trustees noted that for the quarter and since inception period ended March 31, 2023, the Institutional Class shares of the PMC Diversified Equity Fund had underperformed the MSCI World Index Net Return. The Trustees noted that for the one-year and three-year periods ended March 31, 2023, the Institutional Class shares of the PMC Diversified Equity Fund had outperformed the MSCI World Index Net Return.
After considering all of the information, the Trustees concluded that the performance obtained by the Adviser for each Fund was satisfactory under current market conditions and that the Adviser has developed the necessary expertise and resources in selecting and managing the sub-adviser to the PMC Core Fixed Income Fund and providing investment advisory services in accordance with each Fund’s investment objective and strategies. Although past performance is not a guarantee or indication of future results, the Trustees determined that each Fund and its shareholders were likely to benefit from the Adviser’s continued management.
3. COSTS OF SERVICES PROVIDED AND PROFITS REALIZED BY THE ADVISER
The Trustees considered the cost of services and the structure of the Adviser’s fees, including a review of the expense analyses and other pertinent material with respect to the Funds. The Trustees reviewed the related statistical information and other materials provided, including the comparative expenses and Barrington Cohort comparisons. The Trustees considered the cost structure of each Fund relative to its Barrington Cohort, as well as any fee waivers, expense reimbursements and expense recoupments of the Adviser. In reviewing the PMC Core Fixed Income Fund’s fees and total expense structure, the Trustees took into account the Fund’s “manager of managers” structure, noting that the Adviser pays the Fund’s sub-advisory fees out of its own management fees, and that the Fund was not directly responsible for payment of any sub-advisory fees.
The Trustees also considered the overall profitability of the Adviser and reviewed the Adviser’s financial information and noted that the Adviser had subsidized each Fund’s operations since inception and had not yet fully recouped those subsidies for the PMC Core Fixed Income Fund. The Trustees also examined the level of profits that could be expected to accrue to the Adviser from the fees payable under the Advisory Agreement and the expense subsidizations undertaken by the Adviser, as well as the Funds’ brokerage practices, noting that the Adviser makes no effort to seek soft dollar arrangements. These considerations were based on materials requested by the Trustees and the Funds’ administrator specifically for the June 22, 2023 meeting and the August 17, 2023 meeting at which the Advisory Agreement was formally considered, as well as the reports prepared by the Adviser over the course of the year.
143
The Trustees noted that the PMC Core Fixed Income Fund’s contractual management fee of 0.65% was above the Barrington Cohort average of 0.39%. The Trustees noted that the PMC Core Fixed Income Fund was operating above its expense cap of 0.60% for Institutional Class shares. The Trustees observed that the PMC Core Fixed Income Fund’s total expense ratio (net of fee waivers and expense reimbursements) of 0.60% was above the Barrington Cohort average of 0.48%. The Trustees also compared the fees paid by the PMC Core Fixed Income Fund to the fees associated with the Adviser’s fixed-income separately-managed account portfolios.
The Trustees noted that the PMC Diversified Equity Fund’s contractual management fee of 0.53% was below the Barrington Cohort average of 0.69%. The Trustees noted that the PMC Diversified Equity Fund was operating below its expense cap of 0.73% for Institutional Class shares. The Trustees observed that the PMC Diversified Equity Fund’s total expense ratio of 0.68% was below the Barrington Cohort average of 0.83%. The Trustees also compared the fees paid by the PMC Diversified Equity Fund to the fees associated with the Adviser’s equity/balanced separately-managed account portfolios.
The Trustees concluded that each Fund’s expenses and the management fees paid to the Adviser were fair and reasonable in light of the comparative performance, expense and management fee information and, with respect to the PMC Core Fixed Income Fund, considering the Fund’s “manager-of-managers” structure. The Trustees further concluded, based on a profitability analysis prepared by the Adviser, that the Adviser’s profits from sponsoring each of the Funds were not excessive and that the Adviser maintained adequate profit levels to support the services to the Funds from the revenues of its overall investment advisory business, despite its subsidies to support the PMC Core Fixed Income Fund’s operations.
4. EXTENT OF ECONOMIES OF SCALE AS THE FUNDS GROW
The Trustees compared each Fund’s expenses relative to its peer group and discussed realized and potential economies of scale. The Trustees also reviewed the structure of each Fund’s management fee and whether each Fund was large enough to generate economies of scale for shareholders or whether economies of scale would be expected to be realized as Fund assets grow (and if so, how those economies of scale were being or would be shared with shareholders). The Trustees reviewed all fee waivers and expense reimbursements by the Adviser, as applicable, with respect to the Funds. The Trustees noted that the PMC Core Fixed Income Fund’s management fee structure contained breakpoint reductions as the Fund’s assets grow in size, and that while the PMC Diversified Equity Fund’s did not, the feasibility of incorporating breakpoints would continue to be reviewed on a regular basis. The Trustees concluded that the Adviser’s management fee structures were reasonable and reflected a sharing of economies of scale between the Adviser and each Fund at the Fund’s current asset level.
5. BENEFITS DERIVED FROM THE RELATIONSHIP WITH THE FUNDS
The Trustees considered the direct and indirect benefits that could be received by the Adviser from its association with the Funds. The Trustees examined the brokerage practices of the Adviser with respect to the Funds. The Trustees concluded that the benefits the Adviser may receive, such as greater name recognition and increased ability to attract additional investor assets, appear to be reasonable, and in many cases may benefit the Funds.
CONCLUSIONS
The Trustees considered all of the foregoing factors. In considering the renewal of the Advisory Agreement, the Trustees did not identify any one factor as all-important, but rather considered these factors collectively in light of the Funds’ surrounding circumstances. Based on this review, the Trustees, including a majority of the Independent Trustees, approved the continuation of the Advisory Agreement for an additional one-year term ending August 31, 2024 as being in the best interests of each Fund and its shareholders.
144
BASIS FOR TRUSTEES’ APPROVAL OF INVESTMENT SUB-ADVISORY AGREEMENT (PMC CORE FIXED INCOME FUND)
The Board of Trustees (the “Trustees”) of Trust for Professional Managers (the “Trust”) met on August 17, 2023 to consider the renewal of the sub-advisory agreement (the “Sub-Advisory Agreement”) for the PMC Core Fixed Income Fund (the “Fund”), entered into between Envestnet Asset Management, Inc. (“Envestnet”), the Fund’s investment adviser and Neuberger Berman Investment Advisers LLC (“NBIA”), the Fund’s sub-adviser. The Trustees also met at a prior meeting held on June 22, 2023 (the “June 22, 2023 Meeting”) to review materials related to the renewal of the Sub-Advisory Agreement. Prior to these meetings, the Trustees requested and received materials to assist them in considering the renewal of the Sub-Advisory Agreement. The materials provided contained information with respect to the factors enumerated below, including copies of the Sub-Advisory Agreement, a memorandum prepared by the Trust’s outside legal counsel discussing in detail the Trustees’ fiduciary obligations and the factors they should assess in considering the renewal of the Sub-Advisory Agreement, due diligence materials relating to NBIA (including a due questionnaire, Form ADV, biographical information of key management and compliance personnel, a summary detailing key provisions of NBIA’s written compliance program, including its code of ethics) and other pertinent information. The Trustees also received information periodically throughout the year that was relevant to the Sub-Advisory Agreement renewal process, including performance information for the Fund. Based on their evaluation of the information provided by Envestnet and NBIA, in conjunction with the Fund’s other service providers, the Trustees, by a unanimous vote (including a separate vote of the Trustees who are not “interested persons,” as that term is defined in the Investment Company Act of 1940, as amended (the “Independent Trustees”), approved the continuation of the Sub-Advisory Agreement for an additional one-year term ending August 31, 2024.
DISCUSSION OF FACTORS CONSIDERED
In considering the renewal of the sub-advisory agreements between Envestnet, on behalf of the PMC Core Fixed Income Fund, and the Core Fixed Income Fund’s sub-adviser, NBIA, the Board reviewed and analyzed various factors that it determined were relevant, including the factors enumerated below.
1. NATURE, EXTENT AND QUALITY OF SERVICES PROVIDED BY NBIA
The Trustees considered the nature, extent and quality of services provided by NBIA to the Fund. The Trustees considered NBIA’s responsibilities in its management of Fund assets, as well as the qualifications, experience and responsibilities of David M. Brown, Thanos Bardas, Nathan Kush and Olumide Owolabi, and other key personnel at NBIA. The Trustees noted that NBIA was the sole third-party sub-adviser to the Fund and was responsible for managing approximately 88% of the Fund’s portfolio, with Envestnet managing the remaining portion of the Fund’s portfolio. The Trustees also considered information provided by NBIA at the June 15, 2023 meeting and the August 17, 2023 meeting at which the Sub-Advisory Agreement was formally considered, relating to the investment objective and strategies for the Fund, brokerage practices and compliance and risk management. The Trustees also noted any services that extended beyond portfolio management. The Trustees also considered the overall financial condition, as well as the implementation and operational effectiveness of the business continuity plan for NBIA. The Trustees concluded that NBIA had sufficient quality and depth of personnel, resources, investment methods and compliance programs essential to performing its duties under the Sub-Advisory Agreement and that the nature, overall quality and extent of investment management services provided by NBIA to the Fund were satisfactory.
2. INVESTMENT PERFORMANCE OF THE FUND AND NBIA
The Trustees discussed the Fund’s performance, including the performance relating specifically to the segment of the Fund’s portfolio managed by NBIA. The Trustees discussed the performance of the segment of the Fund’s portfolio managed by NBIA for the quarter, one-year, three-year, five-year, ten-year, and since inception periods ended March 31, 2023. The Trustees compared the short-term and longer-term performance of the segment of the Fund’s portfolio managed by NBIA on both an absolute basis and in comparison to a benchmark index (the Bloomberg U.S. Aggregate Bond Index) and in comparison to a separate sub-advised fund with similar investment strategies to that utilized by NBIA in managing its segment of the Fund’s portfolio. The Trustees noted that for the quarter, three-year, five-year, ten-year, and since inception periods ended March 31, 2023, the segment of the Fund’s portfolio managed by NBIA outperformed the benchmark index. The Trustees also noted that for the
145
one-year period ended March 31, 2023, the segment of the Fund’s portfolio managed by NBIA underperformed the benchmark index. The Trustees noted the performance of the segment of the Fund’s portfolio managed by NBIA generally outperformed the historical performance of a composite of other separately-managed accounts of NBIA that were the same or similar to the Fund in terms of investment strategies.
After considering all the information, the Trustees concluded that the performance obtained by NBIA for the Fund was satisfactory under current market conditions. Although past performance is not a guarantee or indication of future results, the Trustees determined that the Fund and its shareholders were likely to benefit from the continued management of Fund assets by NBIA.
3. COSTS OF SERVICES PROVIDED AND PROFITS REALIZED BY NBIA
The Trustees reviewed and considered the sub-advisory fees payable by Envestnet to NBIA under the Sub-Advisory Agreement. The Trustees noted that Envestnet had previously confirmed to the Trustees that the sub-advisory fees payable under the Sub-Advisory Agreement were reasonable in light of the quality of the services performed by NBIA. Since the sub-advisory fees are paid by Envestnet, the overall advisory fee paid by the Fund is not directly affected by the sub-advisory fees paid to NBIA. Consequently, the Trustees did not consider the costs of services provided by NBIA or the profitability of its relationship with the Fund to be material factors for consideration given that NBIA is not affiliated with Envestnet and, therefore, the sub-advisory fees were negotiated on an arm’s-length basis. Based on all these factors, the Trustees concluded that the sub-advisory fees paid to NBIA by Envestnet were reasonable in light of the services provided by NBIA.
4. EXTENT OF ECONOMIES OF SCALE AS THE FUND GROWS
Since the sub-advisory fees payable to NBIA are not paid by the Fund, the Trustees did not consider whether the sub-advisory fees should reflect any potential economies of scale that might be realized as the Fund’s assets increase.
5. BENEFITS DERIVED FROM THE RELATIONSHIP WITH THE FUND
The Trustees considered the direct and indirect benefits that could be received by NBIA from its association with the Fund. The Trustees concluded that the benefits that NBIA may receive, such as greater name recognition and increased ability to attract additional investor assets, appear to be reasonable, and in many cases may benefit the Fund.
CONCLUSIONS
The Trustees considered all of the foregoing factors. In considering the renewal of the Sub-Advisory Agreement with NBIA, the Trustees did not identify any one factor as all-important, but rather considered these factors collectively in light of the Fund’s surrounding circumstances. Based on this review, the Trustees, including a majority of the Independent Trustees, approved the continuation of the Sub-Advisory Agreement with NBIA for an additional one-year term ending August 31, 2024 as being in the best interests of the Fund and its shareholders.
146
BASIS FOR TRUSTEES’ APPROVAL OF INVESTMENT ADVISORY AGREEMENT (ACTIVEPASSIVE ETFS)
The Board of Trustees (the “Trustees”) of Trust for Professional Managers (the “Trust”) met on January 19, 2023 to consider the initial approval of the Investment Advisory Agreement (the “ActivePassive ETFs Advisory Agreement”) between the Trust, on behalf of the ActivePassive Core Bond ETF, ActivePassive Intermediate Municipal Bond ETF, ActivePassive International Equity ETF and ActivePassive U.S. Equity ETF (collectively, the “ActivePassive ETFs” or the “Funds”), each a series of the Trust, and Envestnet Asset Management, Inc., the Funds’ investment adviser (the “Adviser”). In advance of the meeting, the Trustees requested and received materials to assist them in considering the approval of the ActivePassive ETFs Advisory Agreement, including a memorandum provided by the Funds’ legal counsel, which outlined the Trustees’ responsibilities in considering the ActivePassive ETFs Advisory Agreement. The materials provided contained information with respect to the factors enumerated below, including a copy of the ActivePassive ETFs Advisory Agreement, as well as the management fees and other expenses of the Funds, due diligence materials relating to the Adviser (including a due diligence questionnaire completed on behalf of the Funds by the Adviser, the Adviser’s Form ADV, select financial statements of the Adviser, biographical information of the Adviser’s key management and compliance personnel, comparative fee information for each Fund and the Adviser’s other separately-managed accounts and a summary detailing key provisions of the Adviser’s written compliance program, including its code of ethics) and other pertinent information. In considering approval of the ActivePassive ETFs Advisory Agreement, the Trustees also reviewed the Trust’s post effective amendment to its Form N-1A registration statement, including the prospectus and statement of additional information included therein, relating to the initial registration of the Funds.
Based on its evaluation of information provided by the Adviser, in conjunction with the Funds’ other service providers, the Trustees, by a unanimous vote (including a separate vote of the Trustees who are not “interested persons,” as that term is defined in the Investment Company Act of 1940, as amended (the “Independent Trustees”)), approved the ActivePassive ETFs Advisory Agreement for an initial term ending two years following the Funds’ commencement of operations pursuant to an effective registration statement.
1. NATURE, EXTENT AND QUALITY OF SERVICES TO BE PROVIDED TO THE ACTIVEPASSIVE ETFS
The Trustees considered the nature, extent and quality of services provided by the Adviser to the ActivePassive ETFs and the amount of time devoted by the Adviser’s staff to the ActivePassive ETFs’ operations. The Trustees considered the Adviser’s specific responsibilities in all aspects of day-to-day management of each ActivePassive ETF, including its recommendations with respect to the hiring, termination or replacement of one or more sub-advisers to the ActivePassive ETFs and its oversight of investment strategies implemented by any such sub-advisers. The Trustees also considered the qualifications, experience and responsibilities of Brandon R. Thomas, Janis Zvingelis, Greg Classen, and Tim Murphy, who serve as co-portfolio managers for the ActivePassive U.S. Equity ETF and for the segment of the assets managed by the Adviser for each of the ActivePassive Core Bond ETF, ActivePassive Intermediate Municipal Bond ETF and ActivePassive International Equity ETF, and other key personnel at the Adviser involved in the day-to-day activities of the ActivePassive ETFs. The Trustees reviewed information provided by the Adviser in a due diligence questionnaire, including the structure of the Adviser’s compliance program and discussed the Adviser’s commitment to the growth of assets for each ActivePassive ETF. The Trustees also noted any services that extended beyond portfolio management, and they considered the overall capability of the Adviser. The Trustees discussed the Adviser’s handling of compliance matters, including the reports of the Trust’s chief compliance officer to the Trustees on the effectiveness of the Adviser’s compliance program with respect to other series of the Trust managed by the Adviser. The Trustees also considered the Adviser’s overall financial condition, as well as the implementation and operational effectiveness of the Adviser’s business continuity plan. The Trustees concluded that the Adviser had sufficient quality and depth of personnel, resources, investment methods and compliance policies and procedures essential to performing its duties under the ActivePassive ETFs Advisory Agreement and that the nature, overall quality and extent of the management services to be provided to the ActivePassive ETFs, as well as the Adviser’s compliance program, were satisfactory and reliable.
2. INVESTMENT PERFORMANCE OF THE ACTIVEPASSIVE ETFS AND THE ADVISER
The Trustees noted that the ActivePassive ETFs had not yet commenced operations and, therefore, that performance of the ActivePassive ETFs was not a relevant factor for consideration. In assessing the portfolio
147
management services to be provided by the Adviser, the Trustees considered the investment management experience of Messrs. Thomas, Zvingelis, Classen, and Murphy, who will serve as co-portfolio managers for the ActivePassive U.S. Equity ETF and for the segment of the assets managed by the Adviser for each of the ActivePassive Core Bond ETF, ActivePassive Intermediate Municipal Bond ETF and ActivePassive International Equity ETF. The Trustees also discussed the Adviser’s process for identifying, recommending, and monitoring one or more sub-advisers for each ActivePassive ETF, as applicable, and for allocating and reallocating assets among such sub-advisers consistent with each ActivePassive ETF’s investment objectives and strategies. The Trustees considered the Adviser’s role in assessing each sub-adviser’s investment style and historical performance and in allocating each ActivePassive ETF’s assets to such sub-adviser on the basis of the particular strategy assigned to it as well as the strategies assigned to other sub-advisers for such ActivePassive ETF, as applicable. The Trustees noted that the Adviser did not manage any other accounts with the same or similar investment strategies as the ActivePassive ETFs. After considering all of the information, the Trustees determined that each ActivePassive ETF and its shareholders were likely to benefit from the Adviser’s management.
3. COSTS OF SERVICES TO BE PROVIDED AND PROFITS TO BE REALIZED BY THE ADVISER
The Trustees considered the cost of services and the structure of the Adviser’s proposed management fee, including a review of the expense analyses and other pertinent material with respect to each ActivePassive ETF. The Trustees took into consideration that the management fee was a “unitary management fee” whereby the Adviser agrees to pay all expenses incurred by each ActivePassive ETF, except the unitary management fee payable to the Adviser and certain other costs of each ActivePassive ETF, specifically interest charges on any borrowings, dividends and other expenses on securities sold short, taxes, brokerage commissions and other expenses incurred in placing orders for the purchase and sale of securities and other investment instruments, acquired fund fees and expenses, accrued deferred tax liability, extraordinary expenses and any Rule 12b-1 plan fees. The Trustees reviewed the related statistical information and other materials provided, including the comparative expenses, expense components and peer group selection. The Trustees also considered the cost structure of each ActivePassive ETF relative to a peer group of funds as constructed using publicly-available data provided by Morningstar, Inc. and presented by Barrington Financial Group, LLC d/b/a Barrington Partners, an independent third-party benchmarking firm, through its cohort selection process (a peer group of U.S. intermediate core bond and intermediate core-plus bond exchange-traded funds for the ActivePassive Core Bond ETF, a peer group of U.S. municipal national intermediate bond exchange-traded funds for the ActivePassive Intermediate Municipal Bond ETF, a peer group of U.S. foreign large blend exchange-traded funds for the ActivePassive International Equity ETF, and a peer group of U.S. large blend, mid-cap value, large value and large growth exchange-traded funds for the ActivePassive U.S. Equity ETF) (each, a “Barrington Cohort”).
The Trustees noted that the ActivePassive Core Bond ETF’s proposed contractual management fee of 0.35% was below the Barrington Cohort average of 0.37%. The Trustees further noted that the ActivePassive Core Bond ETF’s proposed unitary fee structure will limit the Fund’s total annual fund operating expenses to 0.35% of the Fund’s average annual assets and was lower than the Barrington Cohort average of 0.38%.
The Trustees noted that the ActivePassive Intermediate Municipal Bond ETF’s proposed contractual management fee of 0.35% was below the Barrington Cohort average of 0.40%. The Trustees further noted that the ActivePassive Intermediate Municipal Bond ETF’s proposed unitary fee structure will limit the Fund’s total annual fund operating expenses to 0.35% of the Fund’s average annual assets and was lower than the Barrington Cohort average of 0.36%.
The Trustees noted that the ActivePassive U.S. Equity ETF’s proposed contractual management fee of 0.30% was below the Barrington Cohort average of 0.46%. The Trustees further noted that the ActivePassive U.S. Equity ETF’s proposed unitary fee structure will limit the Fund’s total annual fund operating expenses to 0.30% of the Fund’s average annual assets and was lower than the Barrington Cohort average of 0.51%.
The Trustees noted that the ActivePassive International Equity ETF’s proposed contractual management fee of 0.45% was below the Barrington Cohort average of 0.47%. The Trustees further noted that the ActivePassive International Equity ETF’s proposed unitary fee structure will limit the Fund’s total annual fund operating expenses to 0.45% of the Fund’s average annual assets and was lower than the Barrington Cohort average of 0.47%.
148
The Trustees also considered the overall profitability that may result from the Adviser’s management of each ActivePassive ETF and reviewed the Adviser’s financial information. The Trustees also examined the level of profits that could be expected to accrue to the Adviser from the fees payable under the ActivePassive ETFs Advisory Agreement anticipated by the Adviser.
The Trustees concluded that the estimated expenses and the proposed management fees paid to the Adviser for each ActivePassive ETF were fair and reasonable in light of the comparative performance, expense and management fee information and the investment management services to be provided to each ActivePassive ETF by the Adviser. The Trustees noted, based on a pro forma profitability analysis prepared by the Adviser, that the Adviser did not anticipate that the ActivePassive ETFs would be profitable to the Adviser during each ActivePassive ETF’s first twelve months of operation, but the Adviser maintained adequate profit levels to support its services to each ActivePassive ETF.
4. EXTENT OF ECONOMIES OF SCALE AS THE ACTIVEPASSIVE ETFS GROW
The Trustees compared each ActivePassive ETF’s estimated expenses relative to its peer group and discussed economies of scale. The Trustees noted that each ActivePassive ETF’s proposed management fee structure did not contain any breakpoint reductions as the Fund’s assets grow in size, but that the feasibility of incorporating breakpoints would be reviewed on a regular basis. With respect to the Adviser’s fee structure, the Trustees concluded that the potential economies of scale with respect to each ActivePassive ETF were acceptable.
5. BENEFITS TO BE DERIVED FROM THE RELATIONSHIP WITH THE ACTIVEPASSIVE ETFS
The Trustees considered the direct and indirect benefits that could be realized by the Adviser from its association with the ActivePassive ETFs. The Trustees concluded that the benefits the Adviser may receive, such as greater name recognition or the ability to attract additional investor assets, appear to be reasonable, and in many cases may benefit the ActivePassive ETFs.
CONCLUSIONS
The Trustees considered all of the foregoing factors. In considering the approval of the ActivePassive ETFs Advisory Agreement, the Trustees did not identify any one factor as all-important, but rather considered these factors collectively in light of the ActivePassive ETFs’ surrounding circumstances. Based on this review, the Trustees, including a majority of the Independent Trustees, approved the proposed ActivePassive ETFs Advisory Agreement for an initial two-year term as being in the best interests of each ActivePassive ETF and its shareholders.
149
BASIS FOR TRUSTEES’ APPROVAL OF INVESTMENT SUB-ADVISORY AGREEMENTS (ACTIVEPASSIVE ETFS)
ActivePassive Core Bond ETF—Investment Sub-Advisory Agreement
The Board of Trustees (the “Trustees”) of Trust for Professional Managers (the “Trust”) met on January 19, 2023 to consider the initial approval of the investment sub-advisory agreement (the “NBIA Sub-Advisory Agreement”) for the ActivePassive Core Bond ETF (the “Fund”) entered into between Envestnet Asset Management, Inc. (the “Adviser”) and Neuberger Berman Investment Advisers LLC (“NBIA”), a sub-adviser to the Fund, and to consider the initial approval of the investment sub-advisory agreement (the “Sage Sub-Advisory Agreement,” and together with the NBIA Sub-Advisory Agreement, the “Sub-Advisory Agreements”) for the Fund entered into between the Adviser and Sage Advisory Services, Ltd Co. (“Sage”), a sub-adviser to the Fund. Prior to the meeting, the Trustees requested and received materials to assist them in considering the approval of the Sub-Advisory Agreements. The materials provided contained information with respect to the factors enumerated below, including copies of each Sub-Advisory Agreement, a memorandum prepared by the Trust’s outside legal counsel discussing in detail the Trustees’ fiduciary obligations and the factors they should assess in considering the approval of the Sub-Advisory Agreements, due diligence materials relating to each of NBIA and Sage (including a due questionnaire, Form ADV, biographical information of key management and compliance personnel, a summary detailing key provisions of each of NBIA’s and Sage’s written compliance program, including its code of ethics) and other pertinent information.
Based on its evaluation of information provided by NBIA and Sage, in conjunction with the Fund’s other service providers, the Trustees, by a unanimous vote (including a separate vote of the Trustees who are not “interested persons,” as that term is defined in the Investment Company Act of 1940, as amended (the “Independent Trustees”)), approved each of the NBIA Sub-Advisory Agreement and the Sage Sub-Advisory Agreement for an initial term ending two years following the Fund’s commencement of operations pursuant to an effective registration statement.
DISCUSSION OF FACTORS CONSIDERED
1. NATURE, EXTENT AND QUALITY OF SERVICES TO BE PROVIDED BY THE SUB-ADVISERS TO THE FUND
The Trustees considered the nature, extent and quality of services to be provided by NBIA and Sage to the ActivePassive Core Bond ETF (the “Fund”). The Trustees considered NBIA’s responsibilities in its management of Fund assets, as well as the qualifications, experience and responsibilities of Nathan Kush, David M. Brown, and Thanos Bardas, who would serve as the portfolio managers for the segment of the Fund’s assets managed by NBIA, and other key personnel at NBIA. The Trustees also considered Sage’s responsibilities in its management of Fund assets, as well as the qualifications, experience and responsibilities of Robert G. Smith III and Thomas H. Urano, who would serve as the portfolio managers for the segment of the Fund’s assets managed by Sage, and other key personnel at Sage.
The Trustees also considered information provided by each of NBIA and Sage and included in a due diligence questionnaire, relating to each of their investment strategies for the Fund, brokerage practices and compliance and risk management programs. The Trustees also noted any services that extended beyond portfolio management. The Trustees also considered the overall financial condition of each of NBIA and Sage, as well as the implementation and operational effectiveness of each firm’s business continuity plan. The Trustees concluded that each of NBIA and Sage had sufficient quality and depth of personnel, resources, investment methods and compliance programs essential to performing their duties under each Sub-Advisory Agreement and that the nature, overall quality and extent of investment management services to be provided by each of NBIA and Sage to the Fund were satisfactory.
2. INVESTMENT PERFORMANCE OF THE FUND AND THE SUB-ADVISERS
The Trustees did not consider the performance of the Fund, as it has no performance history. However, the Trustees reviewed the qualifications, backgrounds and experience of the personnel of NBIA and Sage, as well as information concerning the performance history of NBIA and Sage with respect to a sub-advised registered
150
investment company and separately managed accounts, respectively, that use a strategy similar to the strategy NBIA and Sage will apply to its respective segment of Fund assets. After considering all of the information provided to them, the Trustees concluded that the Fund and its shareholders were likely to benefit from each of NBIA’s and Sage’s management of the Fund’s portfolio.
3. COSTS OF SERVICES TO BE PROVIDED AND PROFITS TO BE REALIZED BY THE SUB-ADVISERS
The Trustees then considered the cost of services and the structure of the proposed sub-advisory fees schedules for each of NBIA and Sage, under the respective Sub-Advisory Agreement. The Trustees noted that Envestnet had confirmed to the Trustees that the sub-advisory fees payable under the NBIA Sub-Advisory Agreement and the Sage Sub-Advisory Agreement were reasonable in light of the quality of the services to be performed by each of NBIA and Sage. Since the sub-advisory fees are paid by Envestnet, the overall advisory fee paid by the Fund is not directly affected by the sub-advisory fees paid to each of NBIA and Sage. Consequently, the Trustees did not consider the costs of services to be provided by each of NBIA and Sage or their profitability from their relationship with the Fund because the Trustees did not consider these factors as relevant. Based on all these factors, the Trustees concluded that the sub-advisory fees to be paid to each of NBIA and Sage by Envestnet were reasonable in light of the services to be provided by NBIA and Sage.
4. EXTENT OF ECONOMIES OF SCALE AS THE FUND GROWS
Since the sub-advisory fees payable to each of NBIA and Sage are not paid by the Fund, the Trustees did not consider whether the sub-advisory fees should reflect any potential economies of scale that might be realized as the Fund’s assets increase.
5. BENEFITS TO BE DERIVED FROM THE RELATIONSHIP WITH THE FUND
The Trustees next considered the direct and indirect benefits that could be received by each of NBIA and Sage from its association with the Fund. The Trustees concluded that the benefits each of NBIA and Sage may receive, such as greater name recognition or the ability to attract additional investor assets, appear to be reasonable, and in many cases may benefit the Fund.
CONCLUSIONS
In considering the NBIA Sub-Advisory Agreement and the Sage Sub-Advisory Agreement, the Trustees did not identify any one factor as all-important, but rather considered these factors collectively in light of the Fund’s surrounding circumstances, including the recommendation of Envestnet with respect to each of NBIA and Sage. Based on this review, the Trustees, including a majority of the Independent Trustees, approved each of the proposed NBIA Sub-Advisory Agreement and the Sage Sub-Advisory Agreement for an initial two-year term as being in the best interests of the Fund and its shareholders.
151
ActivePassive Intermediate Municipal Bond ETF—Investment Sub-Advisory Agreement
The Board of Trustees (the “Trustees”) of Trust for Professional Managers (the “Trust”) met on January 19, 2023 to consider the initial approval of the investment sub-advisory agreement (the “GW&K Sub-Advisory Agreement”) for the ActivePassive Intermediate Municipal Bond ETF (the “Fund”) entered into between Envestnet Asset Management, Inc. (the “Adviser”) and GW&K Investment Management, LLC (“GW&K”), the sub-adviser to the Fund. Prior to the meeting, the Trustees requested and received materials to assist them in considering the approval of the GW&K Sub-Advisory Agreement. The materials provided contained information with respect to the factors enumerated below, including a copy of the GW&K Sub-Advisory Agreement, a memorandum prepared by the Trust’s outside legal counsel discussing in detail the Trustees’ fiduciary obligations and the factors they should assess in considering the approval of the GW&K Sub-Advisory Agreement, due diligence materials relating to GW&K (including a due questionnaire, Form ADV, biographical information of key management and compliance personnel, a summary detailing key provisions of GW&K’s written compliance program, including its code of ethics) and other pertinent information.
Based on its evaluation of information provided by GW&K, in conjunction with the Fund’s other service providers, the Trustees, by a unanimous vote (including a separate vote of the Trustees who are not “interested persons,” as that term is defined in the Investment Company Act of 1940, as amended (the “Independent Trustees”)), approved the GW&K Sub-Advisory Agreement for an initial term ending two years following the Fund’s commencement of operations pursuant to an effective registration statement.
DISCUSSION OF FACTORS CONSIDERED
1. NATURE, EXTENT AND QUALITY OF SERVICES TO BE PROVIDED BY THE SUB-ADVISER TO THE FUND
The Trustees considered the nature, extent and quality of services provided by GW&K to the Fund. The Trustees considered GW&K’s responsibilities in its management of Fund assets, as well as the qualifications, experience and responsibilities of John B. Fox, Kara M. South, Martin R. Tourigny, Nancy G. Angell, and Brian T. Moreland, who would serve as the portfolio managers for the segment of the Fund’s assets managed by GW&K, and other key personnel at GW&K.
The Trustees also considered information provided by GW&K and included in a due diligence questionnaire, relating to GW&K’s investment strategies for the Fund, brokerage practices and compliance and risk management programs. The Trustees also noted any services that extended beyond portfolio management. The Trustees also considered the overall financial condition of GW&K, as well as the implementation and operational effectiveness of the firm’s business continuity plan. The Trustees concluded that GW&K had sufficient quality and depth of personnel, resources, investment methods and compliance program essential to performing its duties under the GW&K Sub-Advisory Agreement and that the nature, overall quality and extent of investment management services to be provided by GW&K to the Fund were satisfactory.
2. INVESTMENT PERFORMANCE OF THE FUND AND THE SUB-ADVISER
The Trustees did not consider the performance of the Fund, as it has no performance history. However, the Trustees reviewed the qualifications, backgrounds and experience of the personnel of GW&K, as well as information concerning the performance history of GW&K with respect to separately managed accounts that use a strategy similar to the strategy GW&K will apply to its respective segment of Fund assets. After considering all of the information provided to them, the Trustees concluded that the Fund and its shareholders were likely to benefit from GW&K’s management of the Fund’s portfolio.
3. COSTS OF SERVICES TO BE PROVIDED AND PROFITS TO BE REALIZED BY THE SUB-ADVISER
The Trustees then considered the cost of services and the structure of the proposed sub-advisory fees schedule for GW&K, under the GW&K Sub-Advisory Agreement. The Trustees noted that Envestnet had confirmed to the Trustees that the sub-advisory fees payable under the GW&K Sub-Advisory Agreement were reasonable in light of the quality of the services to be performed by GW&K. Since the sub-advisory fees are paid by Envestnet, the overall advisory fee paid by the Fund is not directly affected by the sub-advisory fees paid to GW&K.
152
Consequently, the Trustees did not consider the costs of services to be provided by GW&K or its profitability from its relationship with the Fund because the Trustees did not consider these factors as relevant. Based on all these factors, the Trustees concluded that the sub-advisory fees to be paid to GW&K by Envestnet were reasonable in light of the services to be provided by GW&K.
4. EXTENT OF ECONOMIES OF SCALE AS THE FUND GROWS
Since the sub-advisory fees payable to GW&K are not paid by the Fund, the Trustees did not consider whether the sub-advisory fees should reflect any potential economies of scale that might be realized as the Fund’s assets increase.
5. BENEFITS TO BE DERIVED FROM THE RELATIONSHIP WITH THE FUND
The Trustees next considered the direct and indirect benefits that could be received by GW&K from its association with the Fund. The Trustees concluded that the benefits GW&K may receive, such as greater name recognition or the ability to attract additional investor assets, appear to be reasonable, and in many cases may benefit the Fund.
CONCLUSIONS
In considering the GW&K Sub-Advisory Agreement, the Trustees did not identify any one factor as all-important, but rather considered these factors collectively in light of the Fund’s surrounding circumstances, including the recommendation of Envestnet with respect to GW&K. Based on this review, the Trustees, including a majority of the Independent Trustees, approved the proposed GW&K Sub-Advisory Agreement for an initial two-year term as being in the best interests of the Fund and its shareholders.
153
ActivePassive International Equity ETF—Investment Sub-Advisory Agreement
The Board of Trustees (the “Trustees”) of Trust for Professional Managers (the “Trust”) met on January 19, 2023 to consider the initial approval of the investment sub-advisory agreement (the “Causeway Sub-Advisory Agreement”) for the ActivePassive International Equity ETF (the “Fund”) entered into between Envestnet Asset Management, Inc. (the “Adviser”) and Causeway Capital Management LLC (“Causeway”), a sub-adviser to the Fund, and to consider the initial approval of the investment sub-advisory agreement (the “AllianceBernstein Sub-Advisory Agreement,” and together with the Causeway Sub-Advisory Agreement, the “Sub-Advisory Agreements”) for the Fund entered into between the Adviser and AllianceBernstein L.P. (“AllianceBernstein”), a sub-adviser to the Fund. Prior to the meeting, the Trustees requested and received materials to assist them in considering the approval of the Sub-Advisory Agreements. The materials provided contained information with respect to the factors enumerated below, including copies of each Sub-Advisory Agreement, a memorandum prepared by the Trust’s outside legal counsel discussing in detail the Trustees’ fiduciary obligations and the factors they should assess in considering the approval of the Sub-Advisory Agreements, due diligence materials relating to each of Causeway and AllianceBernstein (including a due questionnaire, Form ADV, biographical information of key management and compliance personnel, a summary detailing key provisions of each of Causeway’s and AllianceBernstein’s written compliance program, including its code of ethics) and other pertinent information.
Based on its evaluation of information provided by Causeway and AllianceBernstein, in conjunction with the Fund’s other service providers, the Trustees, by a unanimous vote (including a separate vote of the Trustees who are not “interested persons,” as that term is defined in the Investment Company Act of 1940, as amended (the “Independent Trustees”)), approved each of the Causeway Sub-Advisory Agreement and the AllianceBernstein Sub-Advisory Agreement for an initial term ending two years following the Fund’s commencement of operations pursuant to an effective registration statement.
DISCUSSION OF FACTORS CONSIDERED
1. NATURE, EXTENT AND QUALITY OF SERVICES TO BE PROVIDED BY THE SUB-ADVISERS TO THE FUND
The Trustees considered the nature, extent and quality of services to be provided by Causeway and AllianceBernstein to the Fund. The Trustees considered Causeway’s responsibilities in its management of Fund assets, as well as the qualifications, experience and responsibilities of Sarah Ketterer, Harry Hartford, Jonathan Eng, Conor Muldoon, Alessandro Valentini, Ellen Lee, Steven Nguyen, and Brian Cho, who would serve as the portfolio managers for the segment of the Fund’s assets managed by Causeway, and other key personnel at Causeway. The Trustees also considered AllianceBernstein’s responsibilities in its management of Fund assets, as well as the qualifications, experience and responsibilities of Dev Chakrabarti, who would serve as the portfolio manager for the segment of the Fund’s assets managed by AllianceBernstein, and other key personnel at AllianceBernstein.
The Trustees also considered information provided by each of Causeway and AllianceBernstein and included in a due diligence questionnaire, relating to each of their investment strategies for the Fund, brokerage practices and compliance and risk management programs. The Trustees also noted any services that extended beyond portfolio management. The Trustees also considered the overall financial condition of each of Causeway and AllianceBernstein, as well as the implementation and operational effectiveness of each firm’s business continuity plan. The Trustees concluded that each of Causeway and AllianceBernstein had sufficient quality and depth of personnel, resources, investment methods and compliance programs essential to performing their duties under each Sub-Advisory Agreement and that the nature, overall quality and extent of investment management services to be provided by each of Causeway and AllianceBernstein to the Fund were satisfactory.
2. INVESTMENT PERFORMANCE OF THE FUND AND THE SUB-ADVISERS
The Trustees did not consider the performance of the Fund, as it has no performance history. However, the Trustees reviewed the qualifications, backgrounds and experience of the personnel of Causeway and AllianceBernstein, as well as information concerning the performance history of Causeway and AllianceBernstein with respect to separately managed accounts that use a strategy similar to the strategy Causeway and
154
AllianceBernstein will apply to its respective segment of Fund assets. After considering all of the information provided to them, the Trustees concluded that the Fund and its shareholders were likely to benefit from each of Causeway’s and AllianceBernstein’s management of the Fund’s portfolio.
3. COSTS OF SERVICES TO BE PROVIDED AND PROFITS TO BE REALIZED BY THE SUB-ADVISERS
The Trustees then considered the cost of services and the structure of the proposed sub-advisory fees schedules for each of Causeway and AllianceBernstein, under the respective Sub-Advisory Agreement. The Trustees noted that Envestnet had confirmed to the Trustees that the sub-advisory fees payable under the Causeway Sub-Advisory Agreement and the AllianceBernstein Sub-Advisory Agreement were reasonable in light of the quality of the services to be performed by each of Causeway and AllianceBernstein. Since the sub-advisory fees are paid by Envestnet, the overall advisory fee paid by the Fund is not directly affected by the sub-advisory fees paid to each of Causeway and AllianceBernstein. Consequently, the Trustees did not consider the costs of services to be provided by Causeway and AllianceBernstein or their profitability from their relationship with the Fund because the Trustees did not consider these factors as relevant. Based on all these factors, the Trustees concluded that the sub-advisory fees to be paid to each of Causeway and AllianceBernstein by Envestnet were reasonable in light of the services to be provided by Causeway and AllianceBernstein.
4. EXTENT OF ECONOMIES OF SCALE AS THE FUND GROWS
Since the sub-advisory fees payable to each of Causeway and AllianceBernstein are not paid by the Fund, the Trustees did not consider whether the sub-advisory fees should reflect any potential economies of scale that might be realized as the Fund’s assets increase.
5. BENEFITS TO BE DERIVED FROM THE RELATIONSHIP WITH THE FUND
The Trustees next considered the direct and indirect benefits that could be received by each of Causeway and AllianceBernstein from its association with the Fund. The Trustees concluded that the benefits each of Causeway and AllianceBernstein may receive, such as greater name recognition or the ability to attract additional investor assets, appear to be reasonable, and in many cases may benefit the Fund.
CONCLUSIONS
In considering the Causeway Sub-Advisory Agreement and the AllianceBernstein Sub-Advisory Agreement, the Trustees did not identify any one factor as all-important, but rather considered these factors collectively in light of the Fund’s surrounding circumstances, including the recommendation of Envestnet with respect to each of Causeway and AllianceBernstein. Based on this review, the Trustees, including a majority of the Independent Trustees, approved each of the proposed Causeway Sub-Advisory Agreement and the AllianceBernstein Sub-Advisory Agreement for an initial two-year term as being in the best interests of the Fund and its shareholders.
155
Statement Regarding Liquidity Risk Management Program—PMC Funds
(Unaudited)
In accordance with Rule 22e-4 under the Investment Company Act of 1940, as amended, Trust for Professional Managers (the “Trust”) has adopted and implemented a liquidity risk management program (the “Trust Program”). As required under the Trust Program, Envestnet Asset Management, Inc. (“Envestnet”), the investment adviser to the PMC Core Fixed Income Fund and PMC Diversified Equity Fund (the “Funds”), each a series of the Trust, has adopted and implemented a liquidity risk management program tailored specifically to each Fund (the “Adviser Program”). The Adviser Program seeks to promote effective liquidity risk management for each Fund and to protect Fund shareholders from dilution of their interests. The Board of Trustees (the “Board”) of the Trust has approved Envestnet as the administrator for the Adviser Program (the “Program Administrator”). The Program Administrator has further delegated administration of the Adviser Program to an appointed committee of officers of the Adviser. The Program Administrator also requires the investment sub-adviser to the PMC Core Fixed Income Fund, specifically Neuberger Berman Investment Advisers, LLC, to adopt a liquidity risk management program applicable to the Fund and to provide portfolio investment classification information to the Program Administrator on a monthly basis. The Program Administrator is required to provide a written annual report to the Board and the Trust’s chief compliance officer regarding the adequacy and effectiveness of the Adviser Program, including the operation of each Fund’s highly liquid investment minimum, if applicable, and any material changes to the Adviser Program.
On April 20, 2023, the Board reviewed the Program Administrator’s written annual report for the period January 1, 2022 through December 31, 2022 (the “Report”). The Report provided an assessment of each Fund’s liquidity risk: the risk that a Fund could not meet requests to redeem shares issued by the Fund without significant dilution of the remaining investors’ interests in the Fund. The Adviser Program assesses liquidity risk under both normal and reasonably foreseeable stressed market conditions. The Program Administrator has retained ICE Data Services, Inc., a third party vendor, to provide portfolio investment classification services, and the Report noted that each Fund primarily held investments that were classified as highly liquid during the review period. The Report noted that each Fund’s portfolio is expected to continue to primarily hold highly liquid investments and the determination that each Fund be designated as a “primarily highly liquid fund” (as defined in Rule 22e-4) remains appropriate and each Fund can therefore continue to rely on the exclusion in Rule 22e-4 from the requirements to determine and review a highly liquid investment minimum for the Fund and to adopt policies and procedures for responding to a highly liquid investment minimum shortfall. The Report noted that there were no breaches of a Fund’s restriction on holding illiquid investments exceeding 15% of its net assets during the review period. The Report confirmed that each Fund’s investment strategy was appropriate for an open-end management investment company. The Report also indicated that no material changes had been made to the Adviser Program during the review period.
The Program Administrator determined that each Fund is reasonably likely to be able to meet redemption requests without adversely affecting non-redeeming Fund shareholders through significant dilution. The Program Administrator concluded that the Adviser Program was adequately designed and effectively implemented during the review period.
156
Notice of Privacy Policy & Practices
(Unaudited)
We collect non-public personal information about you from the following sources:
| | • | | information we receive about you on applications or other forms; |
| | • | | information you give us orally; and |
| | • | | information about your transactions with us or others. |
The types of non-public personal information we collect and share can include:
| | • | | social security numbers; |
| | • | | wire transfer instructions; and |
| | • | | checking account information. |
What Information We Disclose
We do not disclose any non-public personal information about our shareholders or former shareholders without the shareholder’s authorization, except as permitted by law or in response to inquiries from governmental authorities. We may share information with affiliated parties and unaffiliated third parties with whom we have contracts for servicing the Funds. We will provide unaffiliated third parties with only the information necessary to carry out their assigned responsibility. All shareholder records will be disposed of in accordance with applicable law. We maintain physical, electronic and procedural safeguards to protect your non-public personal information and require third parties to treat your non-public personal information with the same high degree of confidentiality.
How We Protect Your Information
In the event that you hold shares of the Funds through a financial intermediary, including, but not limited to, a broker-dealer, bank or trust company, the privacy policy of your financial intermediary would govern how your non-public personal information would be shared with unaffiliated third parties.
157
ENVESTNET FUNDS
Additional Information
(Unaudited)
Tax Information
For the fiscal year ended August 31, 2023, certain dividends paid by the Funds may be subject to a maximum tax rate of 15%, as provided for by the Jobs and Growth Tax Relief Reconciliation Act of 2003. The percentage of dividends declared from ordinary income designated as qualified dividend income was as follows:
| | | | |
Core Fixed Income Fund | | | 0.00 | % |
Diversified Equity Fund | | | 100.00 | % |
ActivePassive Core Bond ETF | | | 0.00 | % |
ActivePassive Intermediate Bond ETF | | | 0.00 | % |
ActivePassive International Equity ETF | | | 0.00 | % |
ActivePassive U.S. Equity ETF | | | 0.00 | % |
For corporate shareholders, the percent of ordinary income distributions qualifying for the corporate dividends received deduction for the fiscal year ended August 31, 2023 was as follows:
| | | | |
Core Fixed Income Fund | | | 0.00 | % |
Diversified Equity Fund | | | 42.43 | % |
ActivePassive Core Bond ETF | | | 0.00 | % |
ActivePassive Intermediate Bond ETF | | | 0.00 | % |
ActivePassive International Equity ETF | | | 0.00 | % |
ActivePassive U.S. Equity ETF | | | 0.00 | % |
For the fiscal year ended August 31, 2023, taxable ordinary income distributions are designated as short-term capital gain distributions under Section 871(k)(2)(c) of the Code for the Funds as follows:
| | | | |
Core Fixed Income Fund | | | 0.00 | % |
Diversified Equity Fund | | | 0.00 | % |
ActivePassive Core Bond ETF | | | 0.00 | % |
ActivePassive Intermediate Bond ETF | | | 0.00 | % |
ActivePassive International Equity ETF | | | 0.00 | % |
ActivePassive U.S. Equity ETF | | | 0.00 | % |
Indemnification
Under the Trust’s organizational documents, its officers and Trustees are indemnified against certain liabilities arising out of the performance of their duties to the Funds. In addition, in the normal course of business, the Funds enter into contracts that provide general indemnifications to other parties. The Funds’ maximum exposure under these arrangements is unknown as this would involve future claims that may be made against the Funds that have not yet occurred. However, the Funds have not had prior claims or losses pursuant to these contracts and expect the risk of loss to be remote.
Information about Trustees
The business and affairs of the Trust are managed under the direction of the Trust’s Board of Trustees. Information pertaining to the Trustees of the Trust is set forth below. The Funds’ Statement of Additional Information includes additional information about the Trust’s Trustees and is available, without charge, upon request by calling (866) PMC-7338.
158
Envestnet Funds
Additional Information (Continued)
(Unaudited)
Independent Trustees
| | | | | | | | | | |
| | | | | | |
Name, Address and
Year of Birth
| | Position(s)
Held with
the Trust
| | Term of
Office and
Length of
Time Served
| | Number of
Portfolios
in the Trust
Overseen
by Trustee
| | Principal Occupation(s)
During the Past
Five Years
| | Other Directorships
Held by Trustee During
the Past Five Years
|
Michael D. Akers, Ph.D. 615 E. Michigan St. Milwaukee, WI 53202 Year of Birth: 1955 | | Trustee | | Indefinite Term; Since August 22, 2001 | | 28 | | Professor Emeritus, Department of Accounting (June 2019-present), Professor, Department of Accounting (2004-2019), Chair, Department of Accounting (2004-2017), Marquette University. | | Independent Trustee, USA MUTUALS (an open-end investment company (2001-2021). |
| | | | | |
Gary A. Drska 615 E. Michigan St. Milwaukee, WI 53202 Year of Birth: 1956 | | Trustee | | Indefinite Term; Since August 22, 2001 | | 28 | | Retired; Pilot, Frontier/Midwest Airlines, Inc. (airline company) (1986-2021). | | Independent Trustee, USA MUTUALS (an open-end investment company (2001-2021). |
| | | | | |
Vincent P. Lyles 615 E. Michigan St. Milwaukee, WI 53202 Year of Birth: 1961 | | Trustee | | Indefinite Term; Since April 6, 2022 | | 28 | | Executive Director, Milwaukee Succeeds (education advocacy organization) (2023-present); System Vice President of Community Relations, Advocate Aurora Health Care (health care provider) (2019-2022); President and Chief Executive Officer, Boys & Girls Club of Greater Milwaukee (2012-2018). | | Independent Director, BMO Funds, Inc. (an open-end investment company) (2017–2022). |
| | | | | |
Erik K. Olstein 615 E. Michigan St. Milwaukee, WI 53202 Year of Birth: 1967 | | Trustee | | Indefinite Term; Since April 6, 2022 | | 28 | | Retired; President and Chief Operating Officer (2000-2020), Vice President of Sales and Chief Operating Officer (1995-2000), Olstein Capital Management, L.P. (asset management firm); Secretary and Assistant Treasurer, The Olstein Funds (1995-2018). | | Trustee, The Olstein Funds (an open-end investment company) (1995–2018). |
| | | | | |
Lisa Zúñiga Ramírez 615 E. Michigan St. Milwaukee, WI 53202 Year of Birth: 1969 | | Trustee | | Indefinite Term; Since April 6, 2022 | | 28 | | Retired; Principal and Senior Portfolio Manager, Segall, Bryant & Hamill, LLC (asset management firm) (2018-2020); Partner and Senior Portfolio Manager, Denver Investments LLC (asset management firm) (2009-2018). | | Director, Peoples Financial Services Corp. (a publicly-traded bank holding company) (2022-present). |
| | | | | |
Gregory M. Wesley 615 E. Michigan St. Milwaukee, WI 53202 Year of Birth: 1969 | | Trustee | | Indefinite Term; Since April 6, 2022 | | 28 | | Senior Vice President of Strategic Alliances and Business Development, Medical College of Wisconsin (2016-present). | | N/A |
159
Envestnet Funds
Additional Information (Continued)
(Unaudited)
| | | | | | | | | | |
| | | | | | |
Name, Address and
Year of Birth
| | Position(s)
Held with
the Trust
| | Term of
Office and
Length of
Time Served
| | Number of
Portfolios
in the Trust
Overseen
by Trustee
| | Principal Occupation(s)
During the Past
Five Years
| | Other Directorships
Held by Trustee During
the Past Five Years
|
|
Interested Trustee and Officers |
| | | | | |
John P. Buckel* 615 E. Michigan St. Milwaukee, WI 53202 Year of Birth: 1957 | | Chairperson, Trustee, President and Principal Executive Officer | | Indefinite Term; Chairperson and Trustee (since January 19, 2023); President and Principal Executive Officer (since January 24, 2013) | | 28 | | Vice President, U.S. Bancorp Fund Services, LLC (2004-present). | | N/A |
| | | | | |
Jennifer A. Lima 615 E. Michigan St. Milwaukee, WI 53202 Year of Birth: 1974 | | Vice President, Treasurer and Principal Financial and Accounting Officer | | Indefinite Term; Since January 24, 2013 | | N/A | | Vice President, U.S. Bancorp Fund Services, LLC (2002-present). | | N/A |
| | | | | |
Deanna B. Marotz 615 E. Michigan St. Milwaukee, WI 53202 Year of Birth: 1965 | | Chief Compliance Officer, Vice President and Anti-Money Laundering Officer | | Indefinite Term; Since October 21, 2021 | | N/A | | Senior Vice President, U.S. Bancorp Fund Services, LLC (2021-present); Chief Compliance Officer of Keeley-Teton Advisors, LLC and Teton Advisors, Inc. (2017-2021). | | N/A |
| | | | | |
Jay S. Fitton 615 E. Michigan St. Milwaukee, WI 53202 Year of Birth: 1970 | | Secretary | | Indefinite Term; Since July 22, 2019 | | N/A | | Assistant Vice President, U.S. Bancorp Fund Services, LLC (2019-present); Partner, Practus, LLP (2018-2019); Counsel, Drinker Biddle & Reath LLP (2016-2018). | | N/A |
| | | | | |
Kelly A. Strauss 615 E. Michigan St. Milwaukee, WI 53202 Year of Birth: 1987 | | Assistant Treasurer | | Indefinite Term; Since April 23, 2015 | | N/A | | Assistant Vice President, U.S. Bancorp Fund Services, LLC (2011-present). | | N/A |
| | | | | |
Laura Carroll 615 E. Michigan St. Milwaukee, WI 53202 Year of Birth: 1985 | | Assistant Treasurer | | Indefinite Term; Since August 20, 2018 | | N/A | | Assistant Vice President, U.S. Bancorp Fund Services, LLC (2007-present). | | N/A |
| | | | | |
Shannon Coyle 615 E. Michigan St. Milwaukee, WI 53202 Year of Birth: 1990 | | Assistant Treasurer | | Indefinite Term; Since August 26, 2022 | | N/A | | Officer, U.S. Bancorp Fund Services, LLC (2015-present). | | N/A |
| * | | Mr. Buckel is deemed to be an “interested person” of the Trust as defined by the 1940 Act due to his position and material business relationship with the Trust. |
160
A NOTE ON FORWARD LOOKING STATEMENTS
Except for historical information contained in this report for the Funds, the matters discussed in this report may constitute forward-looking statements made pursuant to the safe-harbor provisions of the Securities Litigation Reform Act of 1995. These include any Adviser, Sub-adviser or portfolio manager predictions, assessments, analyses or outlooks for individual securities, industries, market sectors and/or markets. These statements involve risks and uncertainties. In addition to the general risks described for the Funds in the current Prospectus, other factors bearing on this report include the accuracy of the Adviser’s, sub-adviser’s or portfolio manager’s forecasts and predictions, and the appropriateness of the investment programs designed by the Adviser, sub-adviser or portfolio manager to implement their strategies efficiently and effectively. Any one or more of these factors, as well as other risks affecting the securities markets and investment instruments generally, could cause the actual results of the Funds to differ materially as compared to benchmarks associated with the Funds.
ADDITIONAL INFORMATION
The Funds have adopted proxy voting policies and procedures that delegate to the Adviser the authority to vote proxies. A description of the Funds’ proxy voting policies and procedures is available without charge, upon request, by calling the Funds toll free at (866) PMC-7338. A description of these policies and procedures is also included in the Funds’ Statement of Additional Information, which is available on the SEC’s website at http://www.sec.gov.
The Funds’ proxy voting record for the most recent 12-month period ended June 30 is available without charge, either upon request by calling the Funds toll free at (866) PMC-7338 or by accessing the SEC’s website at http://www.sec.gov.
The Funds file their complete schedule of portfolio holdings with the SEC for the first and third quarters of each fiscal year on Part F of Form N-PORT. Shareholders may view the Funds’ filings on the SEC’s website at http://www.sec.gov.
HOUSEHOLDING
In an effort to decrease costs, the Funds intend to reduce the number of duplicate prospectuses and certain other shareholder documents you receive by sending only one copy of each to those addresses shared by two or more accounts and to shareholders we reasonably believe are from the same family or household. Once implemented, if you would like to discontinue householding for your accounts, please call toll-free at (866) PMC-7338 to request individual copies of these documents. Once the Funds receive notice to stop householding, we will begin sending individual copies 30 days after receiving your request. This policy does not apply to account statements.
FREQUENCY DISTRIBUTION OF PREMIUMS AND DISCOUNTS
Information regarding how often shares of the ActivePassive ETFs trade on an exchange at a price above (i.e., at a premium) or below (i.e., at a discount) NAV is available without charge, on the ActivePassive ETFs’ website at www.activepassive.com.
PMC FUNDS and ActivePassive ETFs
| | |
Investment Adviser | | Envestnet Asset Management, Inc. One North Wacker Drive, Suite 1925 Chicago, Illinois 60606 |
| |
Legal Counsel | | Godfrey & Kahn, S.C. 833 East Michigan Street, Suite 1800 Milwaukee, Wisconsin 53202 |
| |
Independent Registered Public Accounting Firm | | Cohen & Company, Ltd. 324 North Water Street, Suite 830 Milwaukee, Wisconsin 53202 |
| |
Transfer Agent, Fund Accountant and Fund Administrator | | U.S. Bancorp Fund Services, LLC 615 East Michigan Street Milwaukee, Wisconsin 53202 |
| |
Custodian | | U.S. Bank, N.A. Custody Operations 1555 North RiverCenter Drive, Suite 302 Milwaukee, Wisconsin 53212 |
| |
Distributor | | Foreside Fund Services, LLC 3 Canal Plaza, Suite 100 Portland, Maine 04101 |
This report is intended for shareholders of the Funds and may not be used as sales literature unless preceded or accompanied by a current prospectus.
(b) Not applicable.
Item 2. Code of Ethics.
The registrant has adopted a code of ethics that applies to the registrant’s principal executive officer and principal financial officer. The registrant has not made any substantive amendments to its code of ethics during the period covered by this report. The registrant has not granted any waivers from any provisions of the code of ethics during the period covered by this report. A copy of the registrant’s Code of Ethics is incorporated by reference to the Registrant’s Form N-CSR filed on November 9, 2009.
Item 3. Audit Committee Financial Expert.
The registrant’s board of Trustees has determined that there is at least one audit committee financial expert serving on its audit committee. Dr. Michael Akers is the “audit committee financial expert” and is considered to be “independent” as each term is defined in Item 3 of Form N-CSR. Dr. Akers holds a Ph.D. in accounting and is a professor Emeritus of accounting at Marquette University in Milwaukee, Wisconsin.
Item 4. Principal Accountant Fees and Services.
The registrant has engaged its principal accountant to perform audit services, audit-related services, tax services and other services during the past two fiscal years. “Audit services” refer to performing an audit of the registrant’s annual financial statements or services that are normally provided by the accountant in connection with statutory and regulatory filings or engagements for those fiscal years. “Audit-related services” refer to the assurance and related services by the principal accountant that are reasonably related to the performance of the audit. “Tax services” refer to professional services rendered by the principal accountant for tax compliance, tax advice, and tax planning. The following table details the aggregate fees billed or expected to be billed for each of the last two fiscal years for audit fees, audit-related fees, tax fees and other fees by the principal accountant.
| | | | | | | | |
| | | FYE 8/31/2023 | | | FYE 8/31/2022 | |
(a) Audit Fees | | $ | 102,000 | | | $ | 67,900 | |
(b) Audit-Related Fees | | $ | 0 | | | $ | 0 | |
(c) Tax Fees | | $ | 19,000 | | | $ | 13,400 | |
(d) All Other Fees | | $ | 0 | | | $ | 0 | |
(e)(1) The audit committee has adopted pre-approval policies and procedures that require the audit committee to pre-approve all audit and non-audit services of the registrant, including services provided to any entity affiliated with the registrant.
(e)(2) The percentage of fees billed by Cohen & Co. applicable to non-audit services pursuant to waiver of pre-approval requirement were as follows:
| | | | | | | | |
| | | FYE 8/31/2023 | | | FYE 8/31/2022 | |
Audit-Related Fees | | | 0 | % | | | 0 | % |
Tax Fees | | | 0 | % | | | 0 | % |
All Other Fees | | | 0 | % | | | 0 | % |
(f) All of the principal accountant’s hours spent on auditing the registrant’s financial statements were attributed to work performed by full-time permanent employees of the principal accountant.
(g) The following table indicates the non-audit fees billed or expected to be billed by the registrant’s accountant for services to the registrant and to the registrant’s investment adviser (and any other controlling entity, etc.—not sub-adviser) for the last two years.
| | | | | | | | |
Non-Audit Related Fees | | FYE 8/31/2023 | | | FYE 8/31/2022 | |
Registrant | | $ | 0 | | | $ | 0 | |
Registrant’s Investment Adviser | | $ | 0 | | | $ | 0 | |
(h) The audit committee of the board of trustees/directors has considered whether the provision of non-audit services that were rendered to the registrant’s investment adviser is compatible with maintaining the principal accountant’s independence and has concluded that the provision of such non-audit services by the accountant has not compromised the accountant’s independence.
(i) Not applicable.
(j) Not applicable.
Item 5. Audit Committee of Listed Registrants.
| (a) | The registrant is an issuer as defined in Rule 10A-3 under the Securities Exchange Act of 1934, (the “Act”) and has a separately-designated standing audit committee established in accordance with Section 3(a)(58)(A) of the Act. The entire Board of Trustees is acting as the registrant’s audit committee. |
Item 6. Investments.
| (a) | Schedule of Investments is included as part of the report to shareholders filed under Item 1 of this Form. |
Item 7. Disclosure of Proxy Voting Policies and Procedures for Closed-End Management Investment Companies.
Not applicable to open-end investment companies.
Item 8. Portfolio Managers of Closed-End Management Investment Companies.
Not applicable to open-end investment companies.
Item 9. Purchases of Equity Securities by Closed-End Management Investment Company and Affiliated Purchasers.
Not applicable to open-end investment companies.
Item 10. Submission of Matters to a Vote of Security Holders.
There have been no material changes to the procedures by which shareholders may recommend nominees to the registrant’s board of trustees.
Item 11. Controls and Procedures.
| (a) | The Registrant’s President and Treasurer have reviewed the Registrant’s disclosure controls and procedures (as defined in Rule 30a-3(c) under the Investment Company Act of 1940 (the “Act”)) as of a date within 90 days of the filing of this report, as required by Rule 30a-3(b) under the Act and Rules 13a-15(b) or 15d-15(b) under the Securities Exchange Act of 1934. Based on their review, such officers have concluded that the disclosure controls and procedures are effective in ensuring that information required to be disclosed in this report is appropriately recorded, processed, summarized and reported and made known to them by others within the Registrant and by the Registrant’s service provider. |
| (b) | There were no changes in the Registrant’s internal control over financial reporting (as defined in Rule 30a-3(d) under the Act) that occurred during the last fiscal half-year covered by this report that has materially affected, or is reasonably likely to materially affect, the Registrant’s internal control over financial reporting. |
Item 12. Disclosure of Securities Lending Activities for Closed-End Management Investment Companies.
Not applicable to open-end investment companies.
Item 13. Exhibits.
(2) A separate certification for each principal executive and principal financial officer pursuant to Section 302 of the Sarbanes-Oxley Act of 2002. Filed herewith.
(3) Any written solicitation to purchase securities under Rule 23c-1 under the Act sent or given during the period covered by the report by or on behalf of the registrant to 10 or more persons. Not applicable to open-end investment companies.
(4) Change in the registrant’s independent public accountant. There was no change in the registrant’s independent public accountant for the period covered by this report.
SIGNATURES
Pursuant to the requirements of the Securities Exchange Act of 1934 and the Investment Company Act of 1940, the registrant has duly caused this report to be signed on its behalf by the undersigned, thereunto duly authorized.
| | |
| (Registrant) Trust for Professional Managers |
| |
| By (Signature and Title)* | | /s/ John Buckel |
| | John Buckel, President |
| |
| Date 10/31/2023 | | |
Pursuant to the requirements of the Securities Exchange Act of 1934 and the Investment Company Act of 1940, this report has been signed below by the following persons on behalf of the registrant and in the capacities and on the dates indicated.
| | |
| By (Signature and Title)* | | /s/ John Buckel |
| | John Buckel, President |
| |
| Date 10/31/2023 | | |
| |
| By (Signature and Title)* | | /s/ Jennifer Lima |
| | Jennifer Lima, Treasurer |
| |
| Date 10/31/2023 | | |
| * | Print the name and title of each signing officer under his or her signature. |