UNITED STATES
SECURITIES AND EXCHANGE COMMISSION
Washington, D.C. 20549
FORM N-CSR
CERTIFIED SHAREHOLDER REPORT OF REGISTERED
MANAGEMENT INVESTMENT COMPANIES
Investment Company Act file number 811-10401
Trust for Professional Managers
(Exact name of registrant as specified in charter)
615 East Michigan Street
Milwaukee, WI 53202
(Address of principal executive offices) (Zip code)
Jay S. Fitton
U.S. Bancorp Fund Services, LLC
615 East Michigan Street
Milwaukee, WI 53202
(Name and address of agent for service)
(513) 520-5925
Registrant’s telephone number, including area code
Date of fiscal year end: November 30, 2024
Date of reporting period: May 31, 2024
Item 1. Reports to Stockholders.
| | |
| Rockefeller Climate Solutions Fund | |
| Institutional Class | RKCIX |
| Semi-Annual Shareholder Report | May 31, 2024 |
This semi-annual shareholder report contains important information about the Rockefeller Climate Solutions Fund for the period of December 1, 2023, to May 31, 2024. You can find additional information about the Fund at https://www.rockefellerfunds.com/. You can also request this information by contacting us at 1-855-369-6209.
WHAT WERE THE FUND COSTS FOR THE LAST SIX MONTHS? (based on a hypothetical $10,000 investment)
| | |
Class Name | Costs of a $10,000 investment | Costs paid as a percentage of a $10,000 investment |
| Institutional Class | $53 | 0.99% |
HOW DID THE FUND PERFORM DURING THE LAST SIX MONTHS AND WHAT AFFECTED ITS PERFORMANCE?
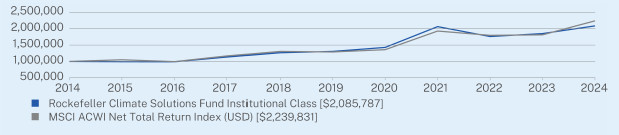
The MSCI ACWI Net Total Return Index returned 14.11% versus the Fund’s Institutional Class shares return of 13.63% during the period. The Fund underperformed as stock selection struggled, though allocation was positive. Utilities was the top detracting sector mostly due to weakness from Sunnova Energy, the biggest single-name detractor, and SSE PLC. Industrials contributed given strength in several holdings, led by top contributing stock Mueller Industries and Schneider Electric.
HOW DID THE FUND PERFORM OVER THE PAST 10 YEARS?*
The $1,000,000 chart reflects a hypothetical $1,000,000 investment in the class of shares noted and assumes the maximum sales charge. The chart uses total return NAV performance and assumes reinvestment of dividends and capital gains. Fund expenses, including 12b-1 fees, management fees and other expenses were deducted.
CUMULATIVE PERFORMANCE (Initial Investment of $1,000,000)
ANNUAL AVERAGE TOTAL RETURN (%)
| | | |
| | 1 Year | 5 Year | 10 Year |
Insitutional Class | 12.67 | 9.81 | 7.63 |
MSCI ACWI Net Total Return Index (USD) | 23.56 | 11.68 | 8.40 |
Visit https://www.rockefellerfunds.com/ for more recent performance information.
| * | The Fund’s past performance is not a good predictor of the Fund’s future performance. The returns do not reflect the deduction of taxes that a shareholder would pay on Fund distributions or redemption of Fund shares. |
| Rockefeller Climate Solutions Fund | PAGE 1 | TSR_SAR_89834G794 |
KEY FUND STATISTICS (as of May 31, 2024)
| |
Net Assets | $94,833,954 |
Number of Holdings | 48 |
Portfolio Turnover | 11.10% |
Visit https://www.rockefellerfunds.com/ for more recent performance information.
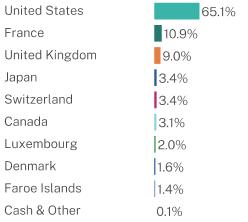
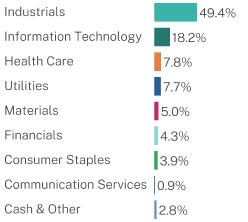
WHAT DID THE FUND INVEST IN? (% of net assets as of May 31, 2024)
| |
Top 10 Issuers | |
Mueller Industries, Inc. | 4.7% |
Schneider Electric SE | 3.8% |
Cie de Saint-Gobain | 3.6% |
Bureau Veritas SA | 3.5% |
Badger Meter, Inc. | 3.3% |
Air Products and Chemicals, Inc. | 3.1% |
StoneX Group, Inc. | 2.9% |
SSE PLC | 2.9% |
Trimble, Inc. | 2.9% |
Atkore, Inc. | 2.8% |
| * | The Global Industry Classification Standard (“GICS®”) was developed by and/or is the exclusive property of MSCI, Inc. (“MSCI”) and Standard & Poor’s Financial Services LLC (“S&P”). GICS® is a service mark of MSCI and S&P and has been licensed for use by U.S. Bank Global Fund Services. |
For additional information about the Fund; including its prospectus, financial information, holdings and proxy information, scan the QR code above or visit https://www.rockefellerfunds.com/.
The Rockefeller mutual funds are distributed by Quasar Distributors, LLC.
HOUSEHOLDING
In an effort to decrease costs, the Funds intend to reduce the number of duplicate prospectuses and certain other shareholder documents you receive by sending only one copy of each to those addresses shared by two or more accounts and to shareholders the Funds reasonably believes are from the same family or household. Once implemented, if you would like to discontinue householding for your accounts, please call toll-free at 855-369-6209 to request individual copies of these documents. Once the Funds receive notice to stop householding, the Funds will begin sending individual copies 30 days after receiving your request. This policy does not apply to account statements.
| Rockefeller Climate Solutions Fund | PAGE 2 | TSR_SAR_89834G794 |
100000099198198969811337391265648130646514281542063826176082318512162085787100000010508019938411168055130631112894181359433192829417975121812799223983149.418.27.87.75.04.33.90.92.865.110.99.03.43.43.12.01.61.40.1
| | |
| Rockefeller Climate Solutions Fund | |
| Class A | RKCAX |
| Semi-Annual Shareholder Report | May 31, 2024 |
This semi-annual shareholder report contains important information about the Rockefeller Climate Solutions Fund for the period of December 1, 2023, to May 31, 2024. You can find additional information about the Fund at https://www.rockefellerfunds.com/. You can also request this information by contacting us at 1-855-369-6209.
WHAT WERE THE FUND COSTS FOR THE LAST SIX MONTHS? (based on a hypothetical $10,000 investment)
| | |
Class Name | Costs of a $10,000 investment | Costs paid as a percentage of a $10,000 investment |
| Class A | $66 | 1.24% |
HOW DID THE FUND PERFORM DURING THE LAST SIX MONTHS AND WHAT AFFECTED ITS PERFORMANCE?
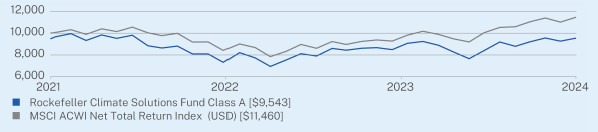
The MSCI ACWI Net Total Return Index returned 14.11% versus the Fund’s Class A shares return of 13.48% during the period. The Fund underperformed as stock selection struggled, though allocation was positive. Utilities was the top detracting sector mostly due to weakness from Sunnova Energy, the biggest single-name detractor, and SSE PLC. Industrials contributed given strength in several holdings, led by top contributing stock Mueller Industries and Schneider Electric.
HOW DID THE FUND PERFORM SINCE INCEPTION?*
The $10,000 chart reflects a hypothetical $10,000 investment in the class of shares noted and assumes the maximum sales charge. The chart uses total return NAV performance and assumes reinvestment of dividends and capital gains. Fund expenses, including 12b-1 fees, management fees and other expenses were deducted.
CUMULATIVE PERFORMANCE (Initial Investment of $10,000)
ANNUAL AVERAGE TOTAL RETURN (%)
| | |
| | 1 Year | Since Inception
(07/21/2021) |
Class A | 12.39 | 0.25 |
MSCI ACWI Net Total Return Index (USD) | 23.56 | 4.88 |
Visit https://www.rockefellerfunds.com/ for more recent performance information.
| * | The Fund’s past performance is not a good predictor of the Fund’s future performance. The returns do not reflect the deduction of taxes that a shareholder would pay on Fund distributions or redemption of Fund shares. |
| Rockefeller Climate Solutions Fund | PAGE 1 | TSR_SAR_89834G786 |
KEY FUND STATISTICS (as of May 31, 2024)
| |
Net Assets | $94,833,954 |
Number of Holdings | 48 |
Portfolio Turnover | 11.10% |
Visit https://www.rockefellerfunds.com/ for more recent performance information.
WHAT DID THE FUND INVEST IN? (% of net assets as of May 31, 2024)
| |
Top 10 Issuers | |
Mueller Industries, Inc. | 4.7% |
Schneider Electric SE | 3.8% |
Cie de Saint-Gobain | 3.6% |
Bureau Veritas SA | 3.5% |
Badger Meter, Inc. | 3.3% |
Air Products and Chemicals, Inc. | 3.1% |
StoneX Group, Inc. | 2.9% |
SSE PLC | 2.9% |
Trimble, Inc. | 2.9% |
Atkore, Inc. | 2.8% |
| * | The Global Industry Classification Standard (“GICS®”) was developed by and/or is the exclusive property of MSCI, Inc. (“MSCI”) and Standard & Poor’s Financial Services LLC (“S&P”). GICS® is a service mark of MSCI and S&P and has been licensed for use by U.S. Bank Global Fund Services. |
For additional information about the Fund; including its prospectus, financial information, holdings and proxy information, scan the QR code above or visit https://www.rockefellerfunds.com/.
The Rockefeller mutual funds are distributed by Quasar Distributors, LLC.
HOUSEHOLDING
In an effort to decrease costs, the Funds intend to reduce the number of duplicate prospectuses and certain other shareholder documents you receive by sending only one copy of each to those addresses shared by two or more accounts and to shareholders the Funds reasonably believes are from the same family or household. Once implemented, if you would like to discontinue householding for your accounts, please call toll-free at 855-369-6209 to request individual copies of these documents. Once the Funds receive notice to stop householding, the Funds will begin sending individual copies 30 days after receiving your request. This policy does not apply to account statements.
| Rockefeller Climate Solutions Fund | PAGE 2 | TSR_SAR_89834G786 |
809784919543919792751146049.418.27.87.75.04.33.90.92.865.110.99.03.43.43.12.01.61.40.1
| | |
| Rockefeller US Small Cap Core Fund | |
| Class A | RKSAX |
| Semi-Annual Shareholder Report | May 31, 2024 |
This semi-annual shareholder report contains important information about the Rockefeller US Small Cap Core Fund for the period of December 1, 2023, to May 31, 2024. You can find additional information about the Fund at https://www.rockefellerfunds.com/. You can also request this information by contacting us at 1-855-369-6209.
WHAT WERE THE FUND COSTS FOR THE LAST SIX MONTHS? (based on a hypothetical $10,000 investment)
| | |
Class Name | Costs of a $10,000 investment | Costs paid as a percentage of a $10,000 investment |
| Class A | $64 | 1.20% |
HOW DID THE FUND PERFORM DURING THE LAST SIX MONTHS AND WHAT AFFECTED ITS PERFORMANCE?
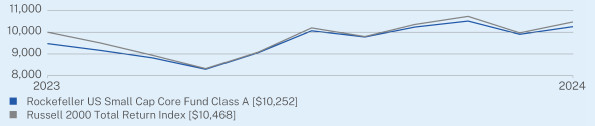
The Russell 2000 Total Return Index returned 15.23% versus the Fund’s Class A shares return of 13.18% during the period. The Fund underperformed as stock selection and ‘quality’ factors struggled. Information Technology was the top detracting sector mostly due to weakness from PROS Holdings, the biggest single-name detractor, and Calix. Financials contributed given strength in several holdings, particularly Hannon Armstrong, while Radnet was the top contributing stock.
HOW DID THE FUND PERFORM SINCE INCEPTION?*
The $10,000 chart reflects a hypothetical $10,000 investment in the class of shares noted and assumes the maximum sales charge. The chart uses total return NAV performance and assumes reinvestment of dividends and capital gains. Fund expenses, including 12b-1 fees, management fees and other expenses were deducted.
CUMULATIVE PERFORMANCE (Initial Investment of $10,000)
ANNUAL AVERAGE TOTAL RETURN (%)
| |
| | Since Inception
(07/31/2023) |
Class A | 8.20 |
Russell 2000 Total Return Index | 4.68 |
Visit https://www.rockefellerfunds.com/ for more recent performance information.
| * | The Fund’s past performance is not a good predictor of the Fund’s future performance. The returns do not reflect the deduction of taxes that a shareholder would pay on Fund distributions or redemption of Fund shares. |
| Rockefeller US Small Cap Core Fund | PAGE 1 | TSR_SAR_89834G653 |
KEY FUND STATISTICS (as of May 31, 2024)
| |
Net Assets | $87,355,320 |
Number of Holdings | 40 |
Portfolio Turnover | 24.55% |
Visit https://www.rockefellerfunds.com/ for more recent performance information.
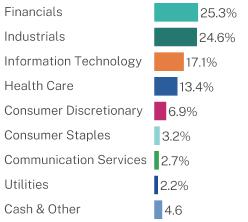
WHAT DID THE FUND INVEST IN? (% of net assets as of May 31, 2024)
| |
Top 10 Issuers | |
Mueller Industries, Inc. | 4.7% |
Invesco Government & Agency Portfolio | 4.6% |
PROS Holdings, Inc. | 4.3% |
Stride, Inc. | 4.3% |
Merit Medical Systems, Inc. | 4.1% |
Korn Ferry | 4.1% |
StoneX Group, Inc. | 3.6% |
SunOpta, Inc. | 3.2% |
RadNet, Inc. | 3.0% |
Donnelley Financial Solutions, Inc. | 3.0% |
| * | The Global Industry Classification Standard (“GICS®”) was developed by and/or is the exclusive property of MSCI, Inc. (“MSCI”) and Standard & Poor’s Financial Services LLC (“S&P”). GICS® is a service mark of MSCI and S&P and has been licensed for use by U.S. Bank Global Fund Services. |
For additional information about the Fund; including its prospectus, financial information, holdings and proxy information, scan the QR code above or visit https://www.rockefellerfunds.com/.
The Rockefeller mutual funds are distributed by Quasar Distributors, LLC.
HOUSEHOLDING
In an effort to decrease costs, the Funds intend to reduce the number of duplicate prospectuses and certain other shareholder documents you receive by sending only one copy of each to those addresses shared by two or more accounts and to shareholders the Funds reasonably believes are from the same family or household. Once implemented, if you would like to discontinue householding for your accounts, please call toll-free at 855-369-6209 to request individual copies of these documents. Once the Funds receive notice to stop householding, the Funds will begin sending individual copies 30 days after receiving your request. This policy does not apply to account statements.
| Rockefeller US Small Cap Core Fund | PAGE 2 | TSR_SAR_89834G653 |
102521046825.324.617.113.46.93.22.72.24.6
| | |
| Rockefeller US Small Cap Core Fund | |
| Class I | RKSIX |
| Semi-Annual Shareholder Report | May 31, 2024 |
This semi-annual shareholder report contains important information about the Rockefeller US Small Cap Core Fund for the period of December 1, 2023, to May 31, 2024. You can find additional information about the Fund at https://www.rockefellerfunds.com/. You can also request this information by contacting us at 1-855-369-6209.
WHAT WERE THE FUND COSTS FOR THE LAST SIX MONTHS? (based on a hypothetical $10,000 investment)
| | |
Class Name | Costs of a $10,000 investment | Costs paid as a percentage of a $10,000 investment |
| Class I | $51 | 0.95% |
HOW DID THE FUND PERFORM DURING THE LAST SIX MONTHS AND WHAT AFFECTED ITS PERFORMANCE?
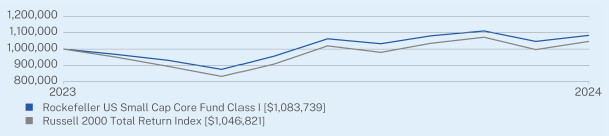
The Russell 2000 Total Return Index returned 15.23% versus the Fund’s Class I shares return of 13.24% during the period. The Fund underperformed as stock selection and ‘quality’ factors struggled. Information Technology was the top detracting sector mostly due to weakness from PROS Holdings, the biggest single-name detractor, and Calix. Financials contributed given strength in several holdings, particularly Hannon Armstrong, while Radnet was the top contributing stock.
HOW DID THE FUND PERFORM SINCE INCEPTION?*
The $1,000,000 chart reflects a hypothetical $1,000,000 investment in the class of shares noted and assumes the maximum sales charge. The chart uses total return NAV performance and assumes reinvestment of dividends and capital gains. Fund expenses, including 12b-1 fees, management fees and other expenses were deducted.
CUMULATIVE PERFORMANCE (Initial Investment of $1,000,000)
ANNUAL AVERAGE TOTAL RETURN (%)
| |
| | Since Inception
(07/31/2023) |
Class I | 8.37 |
Russell 2000 Total Return Index | 4.68 |
Visit https://www.rockefellerfunds.com/ for more recent performance information.
| * | The Fund’s past performance is not a good predictor of the Fund’s future performance. The returns do not reflect the deduction of taxes that a shareholder would pay on Fund distributions or redemption of Fund shares. |
| Rockefeller US Small Cap Core Fund | PAGE 1 | TSR_SAR_89834G646 |
KEY FUND STATISTICS (as of May 31, 2024)
| |
Net Assets | $87,355,320 |
Number of Holdings | 40 |
Portfolio Turnover | 24.55% |
Visit https://www.rockefellerfunds.com/ for more recent performance information.
WHAT DID THE FUND INVEST IN? (% of net assets as of May 31, 2024)
| |
Top 10 Issuers | |
Mueller Industries, Inc. | 4.7% |
Invesco Government & Agency Portfolio | 4.6% |
PROS Holdings, Inc. | 4.3% |
Stride, Inc. | 4.3% |
Merit Medical Systems, Inc. | 4.1% |
Korn Ferry | 4.1% |
StoneX Group, Inc. | 3.6% |
SunOpta, Inc. | 3.2% |
RadNet, Inc. | 3.0% |
Donnelley Financial Solutions, Inc. | 3.0% |
| * | The Global Industry Classification Standard (“GICS®”) was developed by and/or is the exclusive property of MSCI, Inc. (“MSCI”) and Standard & Poor’s Financial Services LLC (“S&P”). GICS® is a service mark of MSCI and S&P and has been licensed for use by U.S. Bank Global Fund Services. |
For additional information about the Fund; including its prospectus, financial information, holdings and proxy information, scan the QR code above or visit https://www.rockefellerfunds.com/.
The Rockefeller mutual funds are distributed by Quasar Distributors, LLC.
HOUSEHOLDING
In an effort to decrease costs, the Funds intend to reduce the number of duplicate prospectuses and certain other shareholder documents you receive by sending only one copy of each to those addresses shared by two or more accounts and to shareholders the Funds reasonably believes are from the same family or household. Once implemented, if you would like to discontinue householding for your accounts, please call toll-free at 855-369-6209 to request individual copies of these documents. Once the Funds receive notice to stop householding, the Funds will begin sending individual copies 30 days after receiving your request. This policy does not apply to account statements.
| Rockefeller US Small Cap Core Fund | PAGE 2 | TSR_SAR_89834G646 |
1083739104682125.324.617.113.46.93.22.72.24.6
| (b) | Not applicable for this Registrant. |
Item 2. Code of Ethics.
Not applicable for semi-annual reports.
Item 3. Audit Committee Financial Expert.
Not applicable for semi-annual reports.
Item 4. Principal Accountant Fees and Services.
Not applicable for semi-annual reports.
Item 5. Audit Committee of Listed Registrants.
Not applicable to registrants who are not listed issuers (as defined in Rule 10A-3 under the Securities Exchange Act of 1934).
Item 6. Investments.
| (a) | Schedule of Investments is included within the financial statements filed under Item 7(a) of this Form. |
Item 7. Financial Statements and Financial Highlights for Open-End Investment Companies.
Rockefeller Climate Solutions Fund
Rockefeller US Small Cap Core Fund
Core Financial Statements
May 31, 2024
Back to Table of Contents
Rockefeller Climate Solutions Fund
Schedule of Investments
As of May 31, 2024 (Unaudited)
| | | | | | | | |
Common Stocks — 97.2% | | | | | | | |
Building Products — 10.9% | | | | | | | |
A. O. Smith Corp. | | | 27,220 | | | $ 2,276,681 | |
AAON, Inc. | | | 18,617 | | | 1,397,206 | |
AZEK Co., Inc.(a) | | | 40,528 | | | 1,943,723 | |
Cie de Saint-Gobain | | | 38,502 | | | 3,399,382 | |
Geberit AG | | | 2,095 | | | 1,288,570 | |
| | | | | | 10,305,562 | |
Capital Markets — 2.9% | | | | | | | |
StoneX Group, Inc.(a) | | | 37,131 | | | 2,787,424 | |
Chemicals — 5.1% | | | | | | | |
Air Products and Chemicals, Inc. | | | 10,812 | | | 2,883,561 | |
DSM-Firmenich AG | | | 16,574 | | | 1,918,486 | |
| | | | | | 4,802,047 | |
Commercial Services & Supplies — 6.8% | | | | | | | |
Rentokil Initial PLC | | | 403,585 | | | 2,151,594 | |
Tetra Tech, Inc. | | | 12,241 | | | 2,564,367 | |
Veralto Corp. | | | 17,211 | | | 1,696,661 | |
| | | | | | 6,412,622 | |
Construction & Engineering — 1.5% | | | | | | | |
Stantec, Inc. | | | 17,349 | | | 1,400,191 | |
Diversified Telecommunication Services — 0.9% | | | | | | | |
Iridium Communications, Inc. | | | 29,688 | | | 893,906 | |
Electric Utilities — 2.9% | | | | | | | |
SSE PLC | | | 122,600 | | | 2,758,013 | |
Electrical Equipment — 8.8% | | | | | | | |
Array Technologies, Inc.(a) | | | 37,406 | | | 530,417 | |
Atkore, Inc. | | | 17,636 | | | 2,683,317 | |
Schneider Electric SE | | | 14,497 | | | 3,616,704 | |
Vestas Wind Systems AS(a) | | | 52,907 | | | 1,484,485 | |
| | | | | | 8,314,923 | |
Electronic Equipment, Instruments & Components — 11.8% | | | | | | | |
Badger Meter, Inc. | | | 16,270 | | | 3,139,459 | |
Halma PLC | | | 63,426 | | | 1,815,597 | |
TE Connectivity Ltd. | | | 10,526 | | | 1,575,742 | |
Teledyne Technologies, Inc.(a) | | | 4,781 | | | 1,897,818 | |
Trimble, Inc.(a) | | | 49,326 | | | 2,746,472 | |
| | | | | | 11,175,088 | |
| | | | | | | | |
The accompanying notes are an integral part of these financial statements.
Back to Table of Contents
Rockefeller Climate Solutions Fund
Schedule of Investments (Cont’d)
As of May 31, 2024 (Unaudited)
| | | | | | | | |
Common Stocks — continued | | | | | | | |
Food Products — 3.9% | | | | | | | |
Bakkafrost P/F | | | 24,190 | | | $ 1,332,792 | |
Darling Ingredients, Inc.(a) | | | 58,055 | | | 2,345,422 | |
| | | | | | 3,678,214 | |
Financial Services — 1.3% | | | | | | | |
Hannon Armstrong Sustainable Infrastructure Capital, Inc. | | | 37,647 | | | 1,253,269 | |
Health Care Providers & Services — 1.9% | | | | | | | |
Progyny, Inc.(a) | | | 67,616 | | | 1,822,251 | |
Independent Power & Renewable Electricity Producers — 1.6% | | | | | | | |
Brookfield Renewable Corp. - Class A | | | 31,340 | | | 988,464 | |
Sunnova Energy International, Inc.(a) | | | 106,014 | | | 553,393 | |
| | | | | | 1,541,857 | |
Industrial Conglomerates — 2.0% | | | | | | | |
Hitachi Ltd. | | | 18,900 | | | 1,946,467 | |
Life Sciences Tools & Services — 5.9% | | | | | | | |
Agilent Technologies, Inc. | | | 17,297 | | | 2,255,702 | |
Danaher Corp. | | | 5,397 | | | 1,385,949 | |
Eurofins Scientific SE(a) | | | 31,754 | | | 1,916,756 | |
| | | | | | 5,558,407 | |
Machinery — 13.4% | | | | | | | |
ATS Corp.(a) | | | 49,182 | | | 1,566,809 | |
Kubota Corp. | | | 92,400 | | | 1,307,795 | |
Mueller Industries, Inc. | | | 75,168 | | | 4,428,147 | |
Pentair PLC | | | 22,600 | | | 1,839,188 | |
Timken Co. | | | 20,546 | | | 1,785,242 | |
Xylem, Inc./NY | | | 12,649 | | | 1,783,762 | |
| | | | | | 12,710,943 | |
Multi-Utilities — 2.0% | | | | | | | |
CMS Energy Corp. | | | 30,451 | | | 1,916,281 | |
Professional Services — 6.1% | | | | | | | |
Bureau Veritas SA | | | 110,009 | | | 3,313,153 | |
Verisk Analytics, Inc. | | | 9,923 | | | 2,508,336 | |
| | | | | | 5,821,489 | |
Semiconductors & Semiconductor Equipment — 0.8% | | | | | | | |
Enphase Energy, Inc.(a) | | | 6,003 | | | 767,784 | |
Software — 5.6% | | | | | | | |
ANSYS, Inc.(a) | | | 6,629 | | | 2,104,376 | |
Bentley Systems, Inc. - Class B | | | 34,560 | | | 1,736,294 | |
| | | | | | | | |
The accompanying notes are an integral part of these financial statements.
Back to Table of Contents
Rockefeller Climate Solutions Fund
Schedule of Investments (Cont’d)
As of May 31, 2024 (Unaudited)
| | | | | | | | |
Common Stocks — continued | | | | | | | |
Software — continued | | | | | | | |
Roper Technologies, Inc. | | | 2,784 | | | $ 1,483,204 | |
| | | | | | 5,323,874 | |
Water Utilities — 1.1% | | | | | | | |
American Water Works Co., Inc. | | | 8,041 | | | 1,051,522 | |
Total Common Stocks (Cost $85,009,991) | | | | | | 92,242,134 | |
Short-Term Investments — 2.7% | | | | | | | |
Money Market Funds — 2.7% | | | | | | | |
Invesco Government & Agency Portfolio - Class Institutional, 5.24%(b) | | | 2,532,511 | | | 2,532,511 | |
Total Short-Term Investments (Cost $2,532,511) | | | | | | 2,532,511 | |
Total Investments — 99.9% (Cost $87,542,502) | | | | | | $94,774,645 | |
Other Assets in Excess of Liabilities — 0.1% | | | | | | 59,309 | |
TOTAL NET ASSETS — 100.0% | | | | | | $94,833,954 | |
| | | | | | | | |
Percentages are stated as a percent of net assets.
The Global Industry Classification Standard (“GICS®”) was developed by and/or is the exclusive property of MSCI, Inc. (“MSCI”) and Standard & Poor’s Financial Services LLC (“S&P”). GICS® is a service mark of MSCI and S&P and has been licensed for use by U.S. Bank Global Fund Services.
AG - Aktiengesellschaft
PLC - Public Limited Company
SA - Sociedad Anónima
(a)
| Non-income producing security.
|
(b)
| The rate shown represents the 7-day effective yield as of May 31, 2024. |
The accompanying notes are an integral part of these financial statements.
Back to Table of Contents
Rockefeller US Small Cap Core Fund
Schedule of Investments
As of May 31, 2024 (Unaudited)
| | | | | | | | |
COMMON STOCKS — 95.4%
| | | | | | | |
Automobile Components — 2.6%
| | | | | | | |
Gentherm, Inc.(a) | | | 23,657 | | | $ 1,276,059 | |
XPEL, Inc.(a) | | | 26,298 | | | 999,324 | |
| | | | | | 2,275,383 | |
Banks — 2.0% | | | | | | | |
First Bancorp. | | | 56,596 | | | 1,785,604 | |
Building Products — 4.0% | | | | | | | |
AAON, Inc. | | | 17,063 | | | 1,280,578 | |
AZEK Co., Inc.(a) | | | 45,466 | | | 2,180,549 | |
| | | | | | 3,461,127 | |
Capital Markets — 8.8% | | | | | | | |
Donnelley Financial Solutions, Inc.(a) | | | 43,560 | | | 2,655,418 | |
PJT Partners, Inc. - Class A | | | 17,970 | | | 1,916,860 | |
StoneX Group, Inc.(a) | | | 41,704 | | | 3,130,719 | |
| | | | | | 7,702,997 | |
Communications Equipment — 2.0% | | | | | | | |
Calix, Inc.(a) | | | 49,963 | | | 1,783,679 | |
Construction & Engineering — 2.0% | | | | | | | |
Sterling Infrastructure, Inc.(a) | | | 14,486 | | | 1,779,895 | |
Consumer Finance — 2.0% | | | | | | | |
FirstCash Holdings, Inc. | | | 14,831 | | | 1,748,871 | |
Diversified Consumer Services — 4.3% | | | | | | | |
Stride, Inc.(a) | | | 54,583 | | | 3,747,669 | |
Electrical Equipment — 2.4% | | | | | | | |
Atkore, Inc. | | | 13,781 | | | 2,096,779 | |
Electronic Equipment, Instruments & Components — 8.6% | | | | | | | |
Badger Meter, Inc. | | | 11,015 | | | 2,125,454 | |
CTS Corp. | | | 25,352 | | | 1,342,388 | |
Insight Enterprises, Inc.(a) | | | 10,629 | | | 2,077,970 | |
Napco Security Technologies, Inc. | | | 39,492 | | | 1,960,778 | |
| | | | | | 7,506,590 | |
Financial Services — 8.3% | | | | | | | |
AvidXchange Holdings, Inc.(a) | | | 132,433 | | | 1,402,465 | |
Hannon Armstrong Sustainable Infrastructure Capital, Inc. | | | 70,042 | | | 2,331,698 | |
International Money Express, Inc.(a) | | | 77,045 | | | 1,607,159 | |
Walker & Dunlop, Inc. | | | 19,946 | | | 1,914,617 | |
| | | | | | 7,255,939 | |
Food Products — 3.2% | | | | | | | |
SunOpta, Inc.(a) | | | 467,598 | | | 2,810,264 | |
| | | | | | | | |
The accompanying notes are an integral part of these financial statements.
Back to Table of Contents
Rockefeller US Small Cap Core Fund
Schedule of Investments (Cont’d)
As of May 31, 2024 (Unaudited)
| | | | | | | | |
Common Stocks — continued | | | | | | | |
Gas Utilities — 2.2% | | | | | | | |
ONE Gas, Inc. | | | 31,482 | | | $ 1,940,236 | |
Ground Transportation — 2.2% | | | | | | | |
ArcBest Corp. | | | 17,784 | | | 1,876,568 | |
Health Care Equipment & Supplies — 5.6% | | | | | | | |
Merit Medical Systems, Inc.(a) | | | 44,715 | | | 3,628,622 | |
Omnicell, Inc.(a) | | | 39,454 | | | 1,285,806 | |
| | | | | | 4,914,428 | |
Health Care Providers & Services — 7.7% | | | | | | | |
Progyny, Inc.(a) | | | 64,382 | | | 1,735,095 | |
RadNet, Inc.(a) | | | 45,596 | | | 2,673,750 | |
US Physical Therapy, Inc. | | | 22,897 | | | 2,348,545 | |
| | | | | | 6,757,390 | |
Insurance — 4.2% | | | | | | | |
Skyward Specialty Insurance Group, Inc.(a) | | | 34,237 | | | 1,277,725 | |
Stewart Information Services Corp. | | | 37,179 | | | 2,353,802 | |
| | | | | | 3,631,527 | |
Machinery — 6.8% | | | | | | | |
ATS Corp.(a) | | | 58,191 | | | 1,852,219 | |
Mueller Industries, Inc. | | | 68,689 | | | 4,046,469 | |
| | | | | | 5,898,688 | |
Media — 2.7% | | | | | | | |
TechTarget, Inc.(a) | | | 79,319 | | | 2,397,020 | |
Professional Services — 7.3% | | | | | | | |
Huron Consulting Group, Inc.(a) | | | 19,884 | | | 1,755,956 | |
Korn Ferry | | | 53,858 | | | 3,551,397 | |
Paycor HCM, Inc.(a) | | | 84,047 | | | 1,039,661 | |
| | | | | | 6,347,014 | |
Software — 6.5% | | | | | | | |
Agilysys, Inc.(a) | | | 20,056 | | | 1,914,746 | |
PROS Holdings, Inc.(a) | | | 127,897 | | | 3,770,404 | |
| | | | | | 5,685,150 | |
TOTAL COMMON STOCKS (Cost $77,766,141) | | | | | | 83,402,818 | |
| | | | | | | | |
The accompanying notes are an integral part of these financial statements.
Back to Table of Contents
Rockefeller US Small Cap Core Fund
Schedule of Investments (Cont’d)
As of May 31, 2024 (Unaudited)
| | | | | | | | |
Short-Term Investments — 4.6% | | | | | | | |
Money Market Funds — 4.6% | | | | | | | |
Invesco Government & Agency Portfolio - Class Institutional, 5.24%(b) | | | 3,991,760 | | | $ 3,991,760 | |
Total Short-Term Investments (Cost $3,991,760) | | | | | | 3,991,760 | |
Total Investments — 100.0% (Cost $81,757,901) | | | | | | 87,394,578 | |
Liabilities in Excess of Other Assets — 0.0%(c) | | | | | | (39,258) | |
TOTAL NET ASSETS — 100.0% | | | | | | $87,355,320 | |
| | | | | | | | |
Percentages are stated as a percent of net assets.
The Global Industry Classification Standard (“GICS®”) was developed by and/or is the exclusive property of MSCI, Inc. (“MSCI”) and Standard & Poor’s Financial Services LLC (“S&P”). GICS® is a service mark of MSCI and S&P and has been licensed for use by U.S. Bank Global Fund Services.
(a)
| Non-income producing security. |
(b)
| The rate shown represents the 7-day effective yield as of May 31, 2024. |
(c)
| Represents less than 0.05% of net assets. |
The accompanying notes are an integral part of these financial statements.
Back to Table of Contents
Rockefeller Funds
Statements of Assets and Liabilities
May 31, 2024 (Unaudited)
| | | | | | | | |
Assets | | | | | | | |
Investments, at value (cost $87,542,502 and 81,757,901 respectively) | | | $94,774,645 | | | $87,394,578 | |
Dividends and interest receivable | | | 119,827 | | | 46,415 | |
Receivable for capital shares sold | | | 16,710 | | | 309 | |
Other assets | | | 22,632 | | | 32,242 | |
Total Assets | | | 94,933,814 | | | 87,473,544 | |
Liabilities | | | | | | | |
Payable to adviser | | | 40,996 | | | 40,804 | |
Payable to affiliates | | | 30,998 | | | 21,109 | |
Audit fees payable | | | 26,106 | | | 26,106 | |
Payable for fund shares redeemed | | | 1,316 | | | 695 | |
Payable for 12b-1 fees - Class A | | | 102 | | | 246 | |
Payable for investments purchased | | | — | | | 29,058 | |
Accrued expenses and other liabilities | | | 342 | | | 206 | |
Total Liabilities | | | 99,860 | | | 118,224 | |
Net Assets | | | $94,833,954 | | | $87,355,320 | |
Net Assets Consist of: | | | | | | | |
Paid-in capital | | | $72,861,764 | | | $81,395,495 | |
Total distributable earnings | | | 21,972,190 | | | 5,959,825 | |
Net Assets | | | $94,833,954 | | | $87,355,320 | |
Institutional Class | | | | | | | |
Net assets | | | $94,567,765 | | | $— | |
Shares of beneficial interest outstanding
(unlimited shares authorized, $0.001 par value) | | | 9,414,957 | | | — | |
Net asset value, redemption price and offering price per share | | | $10.04 | | | $— | |
Class A | | | | | | | |
Net assets | | | $266,189 | | | $145,378 | |
Shares of beneficial interest outstanding
(unlimited shares authorized, $0.001 par value) | | | 26,587 | | | 13,432 | |
Net asset value, redemption price and offering price per share | | | $10.01 | | | $10.82 | |
Class I | | | | | | | |
Net assets | | | $— | | | $87,209,942 | |
Shares of beneficial interest outstanding
(unlimited shares authorized, $0.001 par value) | | | — | | | 8,050,020 | |
Net asset value, redemption price and offering price per share | | | $— | | | $10.83 | |
| | | | | | | | |
The accompanying notes are an integral part of these financial statements.
Back to Table of Contents
Rockefeller Funds
Statements of Operations
Period Ended May 31, 2024 (Unaudited)
| | | | | | | | |
Investment Income | | | | | | | |
Dividend income | | | $496,975 | | | $249,443 | |
Less: Foreign withholding taxes and issuance fees | | | (33,652) | | | — | |
Interest income | | | 67,921 | | | 59,705 | |
Total Investment Income | | | 531,244 | | | 309,148 | |
Expenses | | | | | | | |
Management fees | | | 389,569 | | | 326,411 | |
Transfer agent fees and expenses | | | 64,629 | | | 23,315 | |
Administration and accounting fees | | | 55,496 | | | 42,411 | |
Audit and tax fees | | | 19,406 | | | 19,406 | |
Federal & state registration fees | | | 18,035 | | | 26,535 | |
Trustees’ fees | | | 14,755 | | | 14,169 | |
Legal fees | | | 14,382 | | | 11,437 | |
Custody fees | | | 9,722 | | | 4,294 | |
Chief Compliance Officer fees | | | 6,703 | | | 6,020 | |
Pricing fees | | | 2,554 | | | 642 | |
Insurance expense | | | 1,281 | | | 1,090 | |
Reports to shareholders | | | 881 | | | 926 | |
12b-1 fees – Class A | | | 314 | | | 170 | |
Other expenses | | | 4,491 | | | 4,451 | |
Total Expenses | | | 602,218 | | | 481,277 | |
Expense Waiver by Adviser (Note 4) | | | (148,171) | | | (116,295) | |
Net Expenses | | | 454,047 | | | 364,982 | |
Net Investment Income (Loss) | | | 77,197 | | | (55,834) | |
Realized and Unrealized Gain (Loss) on Investments | | | | | | | |
Net realized gain/(loss) from: | | | | | | | |
Investments | | | (82,913) | | | 643,189 | |
Foreign currency | | | 9,568 | | | — | |
Net change in unrealized appreciation/(depreciation) on: | | | | | | | |
Investments | | | 11,496,487 | | | 7,995,366 | |
Foreign currency | | | (1,492) | | | — | |
Net Realized and Unrealized Gain on Investments | | | 11,421,650 | | | 8,638,555 | |
Net Increase in Net Assets from Operations | | | $11,498,847 | | | $8,582,721 | |
| | | | | | | | |
The accompanying notes are an integral part of these financial statements.
Back to Table of Contents
Rockefeller Climate Solutions Fund
Statement of Changes in Net Assets
| | | | | | | | |
From Operations | | | | | | | |
Net investment income | | | $77,197 | | | $381,804 | |
Net realized loss from investments and foreign currency translation | | | (73,345) | | | (4,107,421) | |
Net change in unrealized appreciation on investment and foreign currency translation | | | 11,494,995 | | | 6,967,218 | |
Net increase in net assets from operations | | | 11,498,847 | | | 3,241,601 | |
From Distributions | | | | | | | |
Net dividends and distributions | | | (382,022) | | | (123,855) | |
Net decrease in net assets resulting from distributions paid | | | (382,022) | | | (123,855) | |
From Capital Share Transactions | | | | | | | |
Proceeds from shares sold - Class A | | | 18,975 | | | 9,550 | |
Proceeds from shares sold - Institutional Class | | | 2,159,961 | | | 13,096,439 | |
Reinvestments - Class A | | | 184 | | | — | |
Reinvestments - Institutional Class | | | 202,049 | | | 43,627 | |
Cost of shares redeemed - Class A | | | (7,487) | | | (923,590) | |
Cost of shares redeemed - Institutional Class | | | (2,824,260) | | | (23,262,950) | |
Net decrease in net assets from capital share transactions | | | (450,578) | | | (11,036,924) | |
Total increase/(decrease) in net assets | | | 10,666,247 | | | (7,919,178) | |
Net Assets | | | | | | | |
Beginning of period | | | 84,167,707 | | | 92,086,885 | |
End of period | | | $94,833,954 | | | $84,167,707 | |
| | | | | | | | |
The accompanying notes are an integral part of these financial statements.
Back to Table of Contents
Rockefeller US Small Cap Core Fund
Statement of Changes in Net Assets
| | | | | | | | |
From Operations | | | | | | | |
Net investment income (Loss) | | | $(55,834) | | | $32,919 | |
Net realized gain/(loss) from investments | | | 643,189 | | | (261,888) | |
Net change in unrealized appreciation/(depreciation) on from investments | | | 7,995,366 | | | (2,347,664) | |
Net increase/(decrease) in net assets from operations | | | 8,582,721 | | | (2,576,633) | |
From Distributions | | | | | | | |
Net dividends and distributions | | | (46,263) | | | — | |
Net decrease in net assets resulting from distributions paid | | | (46,263) | | | — | |
From Capital Share Transactions | | | | | | | |
Proceeds from shares sold - Class A | | | 29,000 | | | 105,000 | |
Proceeds from shares sold - Class I | | | 19,901,699 | | | 65,584,204 | |
Reinvestments - Class I | | | 11,811 | | | — | |
Cost of shares redeemed - Class I | | | (2,773,929) | | | (1,462,290) | |
Net increase in net assets from capital share transactions | | | 17,168,581 | | | 64,226,914 | |
Total increase in net assets | | | 25,705,039 | | | 61,650,281 | |
Net Assets | | | | | | | |
Beginning of period | | | 61,650,281 | | | — | |
End of period | | | $87,355,320 | | | $61,650,281 | |
| | | | | | | | |
(1)
| The Fund commenced operations on July 31, 2023. |
The accompanying notes are an integral part of these financial statements.
Back to Table of Contents
Rockefeller Climate Solutions Fund - Institutional Class
Financial Highlights
| | | |
| | Per share data for a share outstanding throughout each period | |
| | | |
| | | | | | | | | | | |
Net Asset Value, Beginning of Period | | | $8.88 | | | $8.56 | | | $10.06 | | | $10.00 | |
Income from investment operations: | | | | | | | | | | | | | |
Net investment income/(loss)(2) | | | 0.01 | | | 0.04 | | | 0.03 | | | (0.01) | |
Net realized and unrealized gain/(loss) | | | 1.19 | | | 0.29 | | | (1.49) | | | 0.07 | |
Total from investment operations | | | 1.20 | | | 0.33 | | | (1.46) | | | 0.06 | |
Paid from net investment income | | | (0.04) | | | (0.01) | | | — | | | — | |
Paid from realized gains | | | — | | | — | | | (0.04) | | | — | |
Total distributions paid | | | (0.04) | | | (0.01) | | | (0.04) | | | — | |
Net Asset Value, End of Period | | | $10.04 | | | $8.88 | | | $8.56 | | | $10.06 | |
Total return | | | 13.63% | | | 3.87% | | | (14.55)% | | | 0.58%(3) | |
Supplemental Data and Ratios: | | | | | | | | | | | | | |
Net assets at end of period (000’s) | | | $94,568 | | | $83,944 | | | $90,942 | | | $113,235 | |
Ratio of expenses to average net assets: | | | | | | | | | | | | | |
Before waiver, expense reimbursement | | | 1.30% | | | 1.30% | | | 1.26% | | | 1.25%(4) | |
After waiver, expense reimbursement | | | 0.99% | | | 0.99% | | | 0.99% | | | 0.99%(4) | |
Ratio of net investment income/(loss) to average net assets: | |
Before waiver, expense reimbursement | | | (0.14)% | | | 0.15% | | | 0.04% | | | (0.69)%(4) | |
After waiver, expense reimbursement | | | 0.17% | | | 0.46% | | | 0.31% | | | (0.43)%(4) | |
Portfolio turnover rate | | | 11.10% | | | 38.13% | | | 16.93% | | | 13.14%(5) | |
| | | | | | | | | | | | | | |
(1)
| Fund commenced operations on July 21, 2021. |
(2)
| Net investment income per share has been calculated using the daily average shares method. |
(3)
| Not annualized for periods less than one year. |
(4)
| Annualized for periods less than one year. |
(5)
| Portfolio turnover rate is not annualized and excludes the value of portfolio securities received as a result of in-kind subscriptions. |
The accompanying notes are an integral part of these financial statements.
Back to Table of Contents
Rockefeller Climate Solutions Fund - Class A
Financial Highlights
| | | |
| | Per share data for a share outstanding throughout each period | |
| | | |
| | | | | | | | | | | |
Net Asset Value, Beginning of Period | | | $8.84 | | | $8.53 | | | $10.05 | | | $10.00 | |
Income from investment operations: | | | | | | | | | | | | | |
Net investment income/(loss)(2) | | | — | | | 0.02 | | | 0.01 | | | (0.03) | |
Net realized and unrealized gain/(loss) | | | 1.19 | | | 0.29 | | | (1.49) | | | 0.08 | |
Total from investment operations | | | 1.19 | | | 0.31 | | | (1.48) | | | 0.05 | |
Paid from net investment income | | | (0.02) | | | — | | | — | | | — | |
Paid from realized gains | | | — | | | — | | | (0.04) | | | — | |
Total distributions paid | | | (0.02) | | | — | | | (0.04) | | | — | |
Net asset value, end of period | | | $10.01 | | | $8.84 | | | $8.53 | | | $10.05 | |
Total return | | | 13.48% | | | 3.61% | | | (14.76)% | | | 0.50%(3) | |
Supplemental data and ratios: | | | | | | | | | | | | | |
Net assets at end of period (000’s) | | | $266 | | | $224 | | | $1,145 | | | $887 | |
Ratio of expenses to average net assets: | | | | | | | | | | | | | |
Before waiver, expense reimbursement | | | 1.55% | | | 1.55% | | | 1.53% | | | 1.56%(4) | |
After waiver, expense reimbursement | | | 1.24% | | | 1.24% | | | 1.24% | | | 1.24%(4) | |
Ratio of net investment income/(loss) to average net assets: | |
Before waiver, expense reimbursement | | | (0.38)% | | | (0.08)% | | | (0.19)% | | | (1.21)%(4) | |
After waiver, expense reimbursement | | | (0.07)% | | | 0.23% | | | 0.08% | | | (0.89)%(4) | |
Portfolio turnover rate | | | 11.10% | | | 38.13% | | | 16.93% | | | 13.14%(5) | |
| | | | | | | | | | | | | | |
(1)
| Fund commenced operations on July 21, 2021.
|
(2)
| Net investment income per share has been calculated using the daily average shares method.
|
(3)
| Not annualized for periods less than one year.
|
(4)
| Annualized for periods less than one year.
|
(5)
| Portfolio turnover rate is not annualized and excludes the value of portfolio securities received as a result of in-kind subscriptions. |
The accompanying notes are an integral part of these financial statements.
Back to Table of Contents
Rockefeller US Small Cap Core Fund - Class I
Financial Highlights
| | | |
| | Per Share Data for a Share Outstanding Throughout each Period | |
| | | |
| | | | | | | | |
Net Asset Value, Beginning of Period | | | $9.57 | | | $10.00 | |
Income from investment operations: | | | | | | | |
Net investment income/(loss)(2) | | | (0.01) | | | 0.01 | |
Net realized and unrealized gain/(loss) | | | 1.28 | | | (0.44) | |
Total from investment operations | | | 1.27 | | | (0.43) | |
Paid from net investment income | | | (0.01) | | | — | |
Paid from realized gains | | | — | | | — | |
Total distributions paid | | | (0.01) | | | — | |
Net Asset Value, End of Period | | | $10.83 | | | $9.57 | |
Total Return(3) | | | 13.24% | | | (4.30)% | |
Supplemental Data and Ratios: | | | | | | | |
Net assets at end of period(000’s) | | | $87,210 | | | $61,548 | |
Ratio of expenses to average net assets: | | | | | | | |
Before waiver, expense recoupment(4) | | | 1.25% | | | 1.55% | |
After waiver, expense recoupment(4) | | | 0.95% | | | 0.95% | |
Ratio of net investment income/(loss) to average net assets: | | | | | | | |
Before waiver, expense recoupment(4) | | | (0.45)% | | | (0.43)% | |
After waiver, expense recoupment(4) | | | (0.15)% | | | 0.17% | |
Portfolio turnover rate(5) | | | 24.55% | | | 19.77% | |
| | | | | | | | |
(1)
| Fund commenced operations on July 31, 2023. |
(2)
| Net investment income per share has been calculated using the daily average shares method. |
(3)
| Not annualized for periods less than one year. |
(4)
| Annualized for periods less than one year. |
(5)
| Portfolio turnover rate is not annualized and excludes the value of portfolio securities received as a result of in-kind subscriptions. |
The accompanying notes are an integral part of these financial statements.
Back to Table of Contents
Rockefeller US Small Cap Core Fund - Class A
Financial Highlights
| | | |
| | Per Share Data for a Share Outstanding Throughout each Period | |
| | | |
| | | | | | | | |
Net Asset Value, Beginning of Period | | | $ 9.56 | | | $ 10.00 | |
Income from investment operations: | | | | | | | |
Net investment income/(loss)(2) | | | (0.02) | | | — | |
Net realized and unrealized gain/(loss) | | | 1.28 | | | (0.44) | |
Total from investment operations | | | 1.26 | | | (0.44) | |
Net Asset Value, End of Period | | | $ 10.82 | | | $ 9.56 | |
Total Return(3) | | | 13.18% | | | (4.40%) | |
Supplemental Data and Ratios: | | | | | | | |
Net assets at end of period (000’s) | | | $ 145 | | | $ 102 | |
Ratio of expenses to average net assets: | | | | | | | |
Before waiver, expense reimbursement(4) | | | 1.50% | | | 3.98% | |
After waiver, expense reimbursement(4) | | | 1.20% | | | 1.20% | |
Ratio of net investment income/(loss) to average net assets: | |
Before waiver, expense reimbursement(4) | | | (0.71)% | | | (2.89)% | |
After waiver, expense reimbursement(4) | | | (0.41)% | | | (0.11)% | |
Portfolio turnover rate(5) | | | 24.55% | | | 19.77% | |
| | | | | | | | |
(1)
| Fund commenced operations on July 21, 2023. |
(2)
| Net investment income per share has been calculated using the daily average shares method. |
(3)
| Not annualized for periods less than one year. |
(4)
| Annualized for periods less than one year. |
(5)
| Portfolio turnover rate is not annualized and excludes the value of portfolio securities received as a result of in-kind subscriptions. |
The accompanying notes are an integral part of these financial statements.
Back to Table of Contents
Rockefeller Funds
Notes to Financial Statements
May 31, 2024 (Unaudited)
(1) Organization
Trust for Professional Managers (the “Trust”) was organized as a Delaware statutory trust under a Declaration of Trust dated May 29, 2001. The Trust is registered under the Investment Company Act of 1940, as amended (the “1940 Act”), as an open-end management investment company. The Rockefeller Funds (the “Funds”) are comprised of the Rockefeller Climate Solutions Fund that commenced operations on July 21, 2021, and the Rockefeller US Small Cap Core Fund that commenced operations July 31, 2023. Each represents a distinct diversified series with its own investment objective and policies within the Trust.
Effective July 21, 2021, the Rockefeller Climate Solutions Fund, L.P. (formerly, the Rockefeller Ocean Fund, L.P.) (the “Predecessor Fund”) was reorganized into the Rockefeller Climate Solutions Fund, a series of the Trust, by transferring all of the Predecessor Fund’s assets to the Fund in exchange solely for Institutional Class shares of the Fund. The Fund’s investment adviser, portfolio managers, investment objective, strategies, policies, guidelines and restrictions are, in all material respects, the same as those of the Predecessor Fund.
The investment objective of the Rockefeller Climate Solutions Fund is to seek long- term growth of capital principally through equity investments in public companies across the market capitalization spectrum offering climate change mitigation or adaptation products and services. The investment objective of the Rockefeller US Small Cap Core Fund is to seek long-term capital appreciation principally through equity investments in U.S. small capitalization companies. The Trust may issue an unlimited number of shares of beneficial interest at $0.001 par value. Costs incurred by the Funds in connection with the organization, registration and initial public offering of shares were borne by the Adviser.
(2) Significant Accounting Policies
The following is a summary of significant accounting policies consistently followed by the Funds in the preparation of the financial statements. These policies are in conformity with accounting principles generally accepted in the United States of America (“GAAP”).
The Funds are investment companies and accordingly follow the investment company accounting reporting guidance of the Financial Accounting Standards Board (FASB) Accounting Standard Codification Topic 946 “Financial Services-Investment Companies”.
(a) Investment Valuation. Each equity security owned by the Funds that is listed on a securities exchange, except for securities listed on the NASDAQ Stock Market LLC (“NASDAQ”), is valued at its last sale price at the close of that exchange on the date as of which assets are valued. If a security is listed on more than one exchange, the Funds will use the price on the exchange that the Funds generally consider to be the principal exchange on which the security is traded.
Fund securities, including common stocks, preferred stocks and exchange traded funds, listed on NASDAQ will be valued at the NASDAQ Official Closing Price, which may not necessarily represent the last sale price. If, on a particular day, an exchange-listed or NASDAQ security does not trade, then: (i) the security is valued at the mean between the most recent quoted bid and asked prices at the close of the exchange on such day; or (ii) the security is valued at the latest sales price on the Composite Market for the day such security is being valued. “Composite Market” means a consolidation of the trade information provided by national securities and foreign exchanges and the over-the-counter markets as published by an approved independent pricing service (“Pricing Service”).
Foreign securities will be priced in their local currencies as of the close of their primary exchange or market or as of the time each Fund calculates its NAV, whichever is earlier. Foreign securities, currencies and other assets denominated in foreign currencies are then translated into U.S. dollars at the exchange rate of such currencies against the U.S. dollar using the applicable currency exchange rates as of the close of the New York Stock Exchange (“NYSE”), generally 4:00 p.m. Eastern Time.
Foreign securities are traded on foreign exchanges which typically close before the close of business on each day on which the NYSE is open. Each security trading on these exchanges may be valued utilizing a systematic fair valuation model provided by a pricing service. The valuation of each security that meets certain criteria in relation to the
Back to Table of Contents
Rockefeller Funds
Notes to Financial Statements (Cont’d)
May 31, 2024 (Unaudited)
valuation model is systematically adjusted to reflect the impact of movement in the U.S. market after the foreign markets close and are classified as Level 2 securities. Securities that do not meet the criteria, or that are principally traded in other foreign markets, are valued as of the last reported sale price at the time the respective Fund determines its NAV, or when reliable market prices or quotations are not readily available, at the mean between the most recent bid and asked quotations as of the close of the appropriate exchange or other designated time.
Debt securities, including short-term debt instruments having a maturity of 60 days or less, are generally valued at the mean in accordance with prices provided by a Pricing Service. Pricing Services may use various valuation methodologies such as the mean between the bid and the asked prices, matrix pricing and other analytical pricing models as well as market transactions and dealer quotations. If a price is not available from a Pricing Service, the most recent quotation obtained from one or more brokerdealers known to follow the issue will be obtained. Quotations will be valued at the mean between the bid and the offer. In the absence of available quotations, the securities will be priced at fair value, as described below.
When market quotations are not readily available, any security or other asset is valued at its fair value in accordance with Rule 2a-5 of the 1940 Act as determined under the Adviser’s fair value pricing procedures, subject to oversight by the Board of Trustees. These fair value pricing procedures will also be used to price a security when corporate events, events in the securities market and/or world events cause the Adviser to believe that a security’s last sale price may not reflect its actual fair market value. The intended effect of using fair value pricing procedures is to ensure that the Funds are accurately priced. The Adviser will regularly evaluate whether the Funds’ fair value pricing procedures continue to be appropriate in light of the specific circumstances of the Funds and the quality of prices obtained through the application of such procedures.
The Funds have adopted Statement of Financial Accounting Standards, “Fair Value Measurements and Disclosures,” which requires each Fund to classify its securities based on a valuation method. These inputs are summarized in the three broad levels listed below:
•
| Level 1 – Quoted prices in active markets for identical securities. |
•
| Level 2 – Other significant observable inputs (including quoted prices for similar securities, interest rates, prepayment speeds, credit risk, etc.). |
•
| Level 3 – Significant unobservable inputs (including the Funds’ own assumptions in determining the fair value of investments). |
The inputs or methodology used for valuing securities are not necessarily an indication of the risk associated with investing in those securities. The following is a summary of the inputs used to value the Funds’ investments carried at fair value as of May 31, 2024:
Rockefeller Climate Solutions Fund
| | | | | | | | | | | | | | |
Assets(1): | | | | | | | | | | | | | |
Equities: | | | | | | | | | | | | | |
Common Stocks | | | $63,992,338 | | | $28,249,796 | | | $ — | | | $92,242,13 | |
Money Market Funds | | | 2,532,511 | | | — | | | — | | | 2,532,511 | |
Total Investments in Securities | | | $66,524,849 | | | $28,249,796 | | | $— | | | $94,774,645 | |
| | | | | | | | | | | | | | |
Back to Table of Contents
Rockefeller Funds
Notes to Financial Statements (Cont’d)
May 31, 2024 (Unaudited)
Rockefeller US Small Cap Core Fund
| | | | | | | | | | | | | | |
Assets(1): | | | | | | | | | | | | | |
Equities: | | | | | | | | | | | | | |
Common Stocks | | | $83,402,818 | | | $ — | | | $ — | | | $83,402,818 | |
Money Market Funds | | | 3,991,760 | | | — | | | — | | | 3,991,760 | |
Total Investments in Securities | | | $87,394,578 | | | $ — | | | $ — | | | $87,394,578 | |
| | | | | | | | | | | | | | |
(1)
| See the Schedule of Investments for industry classifications. |
The Funds held no Level 3 securities during the six months ended May 31, 2024.
The Funds did not invest in derivative securities or engage in hedging activities during the six months ended May 31, 2024.
(b) Federal Income Taxes. The Funds comply with the requirements of Subchapter M of the Internal Revenue Code of 1986, as amended the (“Code”), necessary to qualify as a regulated investment company and make the requisite distributions of income and capital gains to shareholders sufficient to relieve them from all or substantially all federal income taxes. Therefore, no federal income tax provision has been provided.
(c) Distributions to Shareholders. The Funds will distribute net investment income (less operation expenses) and net capital gains at least annually. Distributions from net realized gains for book purposes may include short-term capital gains. All short-term capital gains are included in ordinary income for tax purposes. Distributions to shareholders are recorded on the ex-dividend date. The Funds may also pay a special distribution at the end of the calendar year to comply with federal tax requirements.
The amounts of dividends from net investment income and distributions from net realized gains are determined in accordance with federal income tax regulations, which may differ from GAAP. These differences are either temporary or permanent in nature. To the extent these differences are permanent in nature, such amounts are reclassified within the composition of net assets based on their federal tax-basis treatment.
(d) Use of Estimates. The preparation of financial statements in conformity with GAAP requires management to make estimates and assumptions that affect the reported amounts of assets and liabilities and disclosure of contingent assets and liabilities at the date of the financial statements and the reported amounts of revenues and expenses during the reporting period. Actual results could differ from those estimates.
(e) Share Valuation. The NAV per share of each Fund is calculated by dividing the sum of the value of the securities held by the Fund, plus cash or other assets, minus all liabilities (including estimated accrued expenses) by the total number of shares outstanding, rounded to the nearest cent. The Funds’ shares will not be priced on the days on which the NYSE is closed for trading. The offering and redemption price per share for the Funds is equal to each Fund’s NAV per share.
(f) Expenses. Expenses associated with a specific fund in the Trust are charged to that fund. Expenses are recognized on an accrual basis. Common expenses are typically allocated evenly between the series of the Trust, or by other equitable means.
(g) Other. Investment transactions are recorded on the trade date. The Funds determine the gain or loss from investment transactions on a high amortized cost basis. Dividend income is recognized on the ex-dividend date and interest income is recognized on an accrual basis. Distributions received from the Funds’ investments in REITs are comprised of ordinary income, capital gains and return of capital, as applicable. For financial statement purposes, the Funds use estimates to characterize these distributions received as return of capital, capital gain or ordinary income. Such estimates are based on historical information available from each REIT and other industry sources. These estimates may subsequently be revised based on information received for the security after the tax reporting periods
Back to Table of Contents
Rockefeller Funds
Notes to Financial Statements (Cont’d)
May 31, 2024 (Unaudited)
are concluded, as the actual character of these distributions is not known until after the fiscal year end of the Funds. Changes to estimates will be recorded in the period they are known. The distributions received from REIT securities that have been classified as income and capital gains are included in dividend income and net realized gain on investments, respectively, on the Statement of Operations. The distributions received that are classified as return of capital reduced the cost of investments on the Statement of Assets and Liabilities. Any discount or premium is accreted or amortized using the constant yield method until maturity, or where applicable, the first call date of the security. Constant yield amortization takes into account the income that is produced on a debt security. This accretion/amortization type utilizes the discount rate used in computing the present value of all future principal and interest payments made by a debt instrument and produces an amount equal to the cost of the debt instrument.
(3) Federal Tax Matters
The tax character of distributions paid during the year ended November 30, 2023 was as follows:
| | | | | | | | |
Distributions paid from: | | | | | | | |
Ordinary Income | | | $ 123,855 | | | $ — | |
Long-Term Capital Gains | | | — | | | — | |
Total Distributions Paid | | | $123,855 | | | $— | |
| | | | | | | | |
As of November 30, 2023, the components of accumulated earnings (losses) for income tax purposes were as follows:
| | | | | | | | |
Cost basis of investments for federal income tax purposes | | | $71,725,460 | | | $ 64,315,359 | |
Gross tax unrealized appreciation | | | 24,725,027 | | | 2,911,863 | |
Gross tax unrealized depreciation | | | (12,319,739) | | | (5,306,247) | |
Net tax unrealized appreciation | | | 12,405,288 | | | (2,394,384) | |
Undistributed ordinary income | | | 373,054
| | | 32,919 | |
Undistributed capital gains | | | — | | | — | |
Total other accumulated loss | | | (1,922,977) | | | (215,168) | |
Total distributable earnings | | | $10,855,365 | | | $(2,576,633) | |
| | | | | | | | |
The difference between cost amounts for financial statement and federal income tax purposes is due to wash sale and partnership adjustments and timing differences in recognizing certain gains and losses in security transactions.
At November 30, 2023, the Funds had capital loss carryovers as follows:
| | | | | | | | |
Rockefeller Climate Solutions Fund | | | 1,922,977 | | | — | |
Rockefeller US Small Cap Core Fund | | | 215,168 | | | — | |
| | | | | | | | |
As of November 30, 2023, the tax years that remain open to examination by major tax jurisdictions include tax years ended November 30, 2021 through November 30, 2023 (Rockefeller Climate Solutions Fund) and November 30, 2023 (Rockefeller US Small Cap Core Fund). The Funds are also not aware of any tax positions for which it is reasonably possible that the total amounts of unrecognized tax benefits will significantly change in the next year. The Funds recognize interest and penalties, if any, related to unrecognized tax benefits as income tax expense in the Statement of Operations. During the period, the Funds did not incur any interest or penalties, nor were any accrued as of November 30, 2023.
Back to Table of Contents
Rockefeller Funds
Notes to Financial Statements (Cont’d)
May 31, 2024 (Unaudited)
GAAP requires that certain components of net assets relating to permanent differences be reclassified between financial and tax reporting. These reclassifications have no effect on net assets or NAV per share. For the year ended November 30, 2023, the following reclassifications were made for permanent tax differences on the Statement of Assets and Liabilities.
| | | | | | | | |
Total Distributable Earnings/(Losses) | | | $ — | | | $ — | |
Paid-In Capital | | | — | | | — | |
| | | | | | | | |
(4) Investment Adviser
The Trust has an Investment Advisory Agreement (the “Agreement”) with the Adviser to furnish investment advisory services to the Funds. Under the terms of the Agreement, the Funds compensate the Adviser for its management services at the annual rate of 0.85% of the average daily net assets of each Fund.
The Adviser has contractually agreed to waive its management fee and/or reimburse a Fund’s other expenses through the expiration date listed below to the extent necessary to ensure that such Fund’s total annual operating expenses do not exceed the Fund’s Expense Limitation Cap, listed below, of the Fund’s average daily net assets.
| | | | | | | | |
Rockefeller Climate Solutions Fund | | | 0.99% | | | March 31, 2025 | |
Rockefeller US Small Cap Core Fund | | | 0.95% | | | July 31, 2024* | |
| | | | | | | | |
*
| Beginning August 1, 2024, the Fund’s expense limitation cap will be 1.05% until March 31, 2025. |
Any such waiver or reimbursement is subject to later adjustment to allow the Adviser to recover amounts waived or reimbursed to the extent actual fees and expenses for a fiscal period do not exceed the lesser of: (1) the Expense Limitation Cap in place at the time of the waiver and/or reimbursement; or (2) the Expense Limitation Cap in place at the time of recovery; provided, however, that the Adviser shall only be entitled to recover such amounts for a period of up to three years from the date such amount was waived or reimbursed.
The following table shows the remaining waived or reimbursed expenses subject to potential recovery expiring by:
| | | | | | | | |
November 30, 2024 | | | $ 100,316 | | | $— | |
November 30, 2025 | | | $261,030 | | | $— | |
November 30, 2026 | | | $260,048 | | | $ 115,968 | |
May 31, 2027 | | | $148,171 | | | $116,295 | |
| | | | | | | | |
(5) Related Party Transactions
U.S. Bancorp Fund Services, LLC, doing business as U.S. Bank Global Fund Services (“Fund Services” or the “Administrator”), acts as the Funds’ Administrator under an Administration Agreement. The Administrator prepares various federal and state regulatory filings, reports and returns for the Funds; prepares reports and materials to be supplied to the Trustees; monitors the activities of the Funds’ custodian, transfer agent and accountants; coordinates the preparation and payment of the Funds’ expenses; and reviews the Funds’ expense accruals. Fund Services also serves as the fund accountant and transfer agent to the Fund U.S. Bank National Association (“US Bank”), an affiliate
Back to Table of Contents
Rockefeller Funds
Notes to Financial Statements (Cont’d)
May 31, 2024 (Unaudited)
of Fund Services, serves as the Funds’ custodian. The Trust’s Chief Compliance Officer is also an employee of Fund Services. Fees and expenses incurred for the six months ended May 31, 2024, and owed as of May 31, 2024, are as follows:
| | | | | | | | |
Rockefeller Climate Solutions Fund | | | $ 55,496 | | | $ 20,674 | |
Rockefeller US Small Cap Core Fund | | | $42,411 | | | $10,738 | |
| | | | | | | | |
| | | | | | | | |
Rockefeller Climate Solutions Fund | | | $ 2,554 | | | $ 907 | |
Rockefeller US Small Cap Core Fund | | | $642 | | | $219 | |
| | | | | | | | |
| | | | | | | | |
Rockefeller Climate Solutions Fund | | | $ 64,629 | | | $292 | |
Rockefeller US Small Cap Core Fund | | | $23,315 | | | $ 6,458 | |
| | | | | | | | |
| | | | | | | | |
Rockefeller Climate Solutions Fund | | | $ 9,722 | | | $ 5,832 | |
Rockefeller US Small Cap Core Fund | | | $4,294 | | | $1,215 | |
| | | | | | | | |
| | | | | | | | |
Rockefeller Climate Solutions Fund | | | $ 6,703 | | | $ 3,293 | |
Rockefeller US Small Cap Core Fund | | | $6,020 | | | $2,479 | |
| | | | | | | | |
The Rockefeller Climate Solutions Fund has a line of credit with US Bank (see Note 9). Certain officers of the Funds are also employees of Fund Services.
(6) Distribution Plan
The Trust has adopted a Distribution Plan pursuant to Rule 12b-1 under the 1940 Act (the “12b-1 Plan”), on behalf of the Class A shares of the Funds which authorizes the Trust to pay Quasar Distributors, LLC (the “Distributor”), the Funds’ principal distributor, a distribution fee of 0.25% of the Funds’ average daily net assets of each Fund’s Class A shares. During the six months ended May 31, 2024, the Class A shares incurred fees pursuant to the 12b-1 Plan of $314 for the Rockefeller Climate Solutions Fund and $170 for the Rockefeller US Small Cap Core Fund.
(7) Capital Share Transactions
Transactions in the shares of the Funds were as follows:
Rockefeller Climate Solutions Fund
| | | | | | | | |
Shares Sold | | | 1,977 | | | 1,025 | |
Shares Reinvested | | | 20 | | | — | |
Shares Redeemed | | | (754) | | | (109,844) | |
Net increase (decrease) | | | 1,243 | | | (108,819) | |
| | | | | | | | |
Back to Table of Contents
Rockefeller Funds
Notes to Financial Statements (Cont’d)
May 31, 2024 (Unaudited)
| | | | | | | | |
Shares Sold | | | 231,436 | | | 1,443,347 | |
Shares Reinvested | | | 21,586 | | | 5,256 | |
Shares Redeemed | | | (293,720) | | | (2,617,709) | |
Net decrease | | | (40,698) | | | (1,169,106) | |
| | | | | | | | |
Rockefeller US Small Cap Core Fund
| | | | | | | | |
Shares Sold | | | 2,778 | | | 10,654 | |
Shares Reinvested | | | — | | | — | |
Shares Redeemed | | | — | | | — | |
Net increase | | | 2,778 | | | 10,654 | |
| | | | | | | | |
| | | | | | | | |
Shares Sold | | | 1,881,552 | | | 6,591,654 | |
Shares Reinvested | | | — | | | — | |
Shares Redeemed | | | — | | | (158,190) | |
Net increase | | | 1,616,556 | | | 6,433,464 | |
| | | | | | | | |
(8) Investment Transactions
The aggregate securities transactions, excluding short-term investments and amounts transferred in-kind noted below, for the Funds for the six months ended May 31, 2024 are listed below.
| | | | | | | | | | | | | | |
Rockefeller Climate Solutions Fund | | | $9,848,474 | | | $ 10,675,401 | | | $ — | | | $ — | |
Rockefeller US Small Cap Core Fund | | | $32,896,360 | | | $18,260,835 | | | $— | | | $— | |
| | | | | | | | | | | | | | |
(9) Line of Credit
As of May 31, 2024, the Rockefeller Climate Solutions Fund had a line of credit in the amount of $10,000,000, which will mature on August 3, 2024. This secured line of credit is intended to provide short-term financing, if necessary, and subject to certain restrictions, in connection with shareholder redemptions. The credit facility is with the Funds’ custodian, US Bank. Interest will accrue at the prime rate. During the six months ended May 31, 2024, the Fund did not utilize the line of credit.
U.S. and international markets have experienced and may continue to experience significant periods of volatility in recent years and months due to a number of economic, political and global macro factors including uncertainty regarding inflation and central banks’ interest rate increases, the possibility of a national or global recession, trade tensions, political events, the war between Russia and Ukraine, significant conflict between Israel and Hamas in the Middle East, and the impact of the coronavirus (COVID-19) global pandemic. The impact of COVID-19 may last for an extended period of time. As a result of continuing political tensions and armed conflicts, including the war between Ukraine and Russia, the U.S. and the European Union imposed sanctions on certain Russian individuals and companies,
including certain financial institutions, and have limited certain exports and imports to and from Russia. The war has
Back to Table of Contents
Rockefeller Funds
Notes to Financial Statements (Cont’d)
May 31, 2024 (Unaudited)
contributed to recent market volatility and may continue to do so. These developments, as well as other events, could result in further market volatility and negatively affect financial asset prices, the liquidity of certain securities and the normal operations of securities exchanges and other markets, despite government efforts to address market disruptions. Continuing market volatility as a result of recent market conditions or other events may have adverse effects on your account.
The Funds have evaluated events and transactions that have occurred subsequent to May 31, 2024 and determined there were no subsequent events that would require recognition or disclosure within the financial statements other than as described below.
Back to Table of Contents
Additional Information (Unaudited)
Tax information
For the year ended November 30, 2023, certain dividends paid by the Funds may be subject to a maximum tax rate of 23.8%, as provided for by the Jobs and Growth Tax Relief Reconciliation Act of 2003. The percentage of dividends declared from ordinary income designated as qualified dividend income was as follows:
| | | | | |
Rockefeller Climate Solutions Fund | | | 100.00%
| |
Rockefeller US Small Cap Core Fund | | | 0.00% | |
| | | | | |
For corporate shareholders, the percent of ordinary income distributions qualifying for the corporate dividends received deduction for the fiscal year ended November 30, 2023, was as follows:
| | | | | |
Rockefeller Climate Solutions Fund | | | 100.00% | |
Rockefeller US Small Cap Core Fund | | | 0.00% | |
| | | | | |
For the year ended November 30, 2023, the percentage of taxable ordinary income distributions designated as short-term capital gain distributions under Section 871(k)(2)(c) of the Code for the Funds was as follows:
| | | | | |
Rockefeller Climate Solutions Fund | | | 0.00% | |
Rockefeller US Small Cap Core Fund | | | 0.00% | |
| | | | | |
Indemnifications
Under the Trust’s organizational documents, its officers and Trustees are indemnified against certain liabilities arising out of the performance of their duties to the Funds. In addition, in the normal course of business, the Funds enter into contracts that provide general indemnifications to other parties. The Funds’ maximum exposure under these arrangements is unknown as this would involve future claims that may be made against the Funds that have not yet occurred. However, the Funds have not had prior claims or losses pursuant to these contracts and expect the risk of loss to be remote.
| (b) | Financial Highlights are included within the financial statements filed under Item 7(a) of this Form. |
Item 8. Changes in and Disagreements with Accountants for Open-End Investment Companies.
There were no changes in or disagreements with accountants during the period covered by this report.
Item 9. Proxy Disclosure for Open-End Investment Companies.
There were no matters submitted to a vote of shareholders during the period covered by this report.
Item 10. Remuneration Paid to Directors, Officers, and Others of Open-End Investment Companies.
This information is included within the financial statements filed under Item 7(a) of this Form.
Item 11. Statement Regarding Basis for Approval of Investment Advisory Contract.
Not applicable.
Item 12. Disclosure of Proxy Voting Policies and Procedures for Closed-End Management Investment Companies.
Not applicable to open-end investment companies.
Item 13. Portfolio Managers of Closed-End Management Investment Companies.
Not applicable to open-end investment companies.
Item 14. Purchases of Equity Securities by Closed-End Management Investment Company and Affiliated Purchasers.
Not applicable to open-end investment companies.
Item 15. Submission of Matters to a Vote of Security Holders.
There have been no material changes to the procedures by which shareholders may recommend nominees to the registrant’s board of trustees.
Item 16. Controls and Procedures.
| (a) | The Registrant’s Principal Executive Officer and Principal Financial Officer have reviewed the Registrant’s disclosure controls and procedures (as defined in Rule 30a-3(c) under the Investment Company Act of 1940 (the “Act”)) as of a date within 90 days of the filing of this report, as required by Rule 30a-3(b) under the Act and Rules 13a-15(b) or 15d-15(b) under the Securities Exchange Act of 1934. Based on their review, such officers have concluded that the disclosure controls and procedures are effective in ensuring that information required to be disclosed in this report is appropriately recorded, processed, summarized and reported and made known to them by others within the Registrant and by the Registrant’s service provider. |
| (b) | There were no changes in the Registrant’s internal control over financial reporting (as defined in Rule 30a-3(d) under the Act) that occurred during the period covered by this report that have materially affected, or are reasonably likely to materially affect, the Registrant’s internal control over financial reporting. |
Item 17. Disclosure of Securities Lending Activities for Closed-End Management Investment Companies
Not applicable to open-end investment companies.
Item 18. Recovery of Erroneously Awarded Compensation.
Not applicable.
Item 19. Exhibits.
| (a) | (1) Any code of ethics or amendment thereto, that is the subject of the disclosure required by Item 2, to the extent that the registrant intends to satisfy Item 2 requirements through filing an exhibit. Incorporated by reference to the Registrant’s Form N-CSR filed on February 6, 2019. |
(2) A separate certification for each principal executive officer and principal financial officer pursuant to Section 302 of the Sarbanes-Oxley Act of 2002. Filed herewith.
SIGNATURES
Pursuant to the requirements of the Securities Exchange Act of 1934 and the Investment Company Act of 1940, the registrant has duly caused this report to be signed on its behalf by the undersigned, thereunto duly authorized.
| | (Registrant) | Trust for Professional Managers | |
| | By (Signature and Title) | /s/ John Buckel | |
| | | John Buckel, President | |
Pursuant to the requirements of the Securities Exchange Act of 1934 and the Investment Company Act of 1940, this report has been signed below by the following persons on behalf of the registrant and in the capacities and on the dates indicated.
| | By (Signature and Title)* | /s/ John Buckel | |
| | | John Buckel, President | |
| | By (Signature and Title)* | /s/ Jennifer Lima | |
| | | Jennifer Lima, Treasurer | |
* Print the name and title of each signing officer under his or her signature.