UNITED STATES
SECURITIES AND EXCHANGE COMMISSION
Washington, D.C. 20549
FORM N-CSR
CERTIFIED SHAREHOLDER REPORT OF REGISTERED
MANAGEMENT INVESTMENT COMPANIES
Investment Company Act file number 811-10401
Trust for Professional Managers
(Exact name of registrant as specified in charter)
615 East Michigan Street
Milwaukee, WI 53202
(Address of principal executive offices) (Zip code)
Jay S. Fitton
U.S. Bancorp Fund Services, LLC
615 East Michigan Street
Milwaukee, WI 53202
(Name and address of agent for service)
(513) 520-5925
Registrant’s telephone number, including area code
Date of fiscal year end: December 31, 2024
Date of reporting period: June 30, 2024
Item 1. Reports to Stockholders.
| | |
| Mairs & Power Growth Fund | |
| MPGFX |
| Semi-Annual Shareholder Report | June 30, 2024 |
This semi-annual shareholder report contains important information about the Mairs & Power Growth Fund for the period of January 1, 2024, to June 30, 2024. You can find additional information about the Fund at mairsandpower.com/funds/growth-fund. You can also request this information by contacting us at 1-800-304-7404.
What were the Fund costs for the last six months?
(based on a hypothetical $10,000 investment)
| | |
Fund Name | Costs of a $10,000 investment | Costs paid as a percentage of a $10,000 investment |
| Mairs & Power Growth Fund | $33 | 0.62% |
Key Fund Statistics (as of June 30, 2024)
| |
Net Assets | $5,561,687,517 |
Number of Holdings | 48 |
Portfolio Turnover | 5% |
30-Day SEC Yield | 0.92% |
Visit mairsandpower.com/funds/growth-fund for more recent performance information.
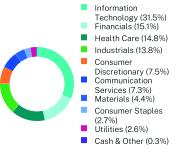
What did the Fund invest in? (% of net assets as of June 30, 2024)
Sector Breakdown*
| * | The Global Industry Classification Standard (“GICS®”) was developed by and/or is the exclusive property of MSCI, Inc. (“MSCI”) and Standard & Poor’s Financial Services LLC (“S&P”). GICS® is a service mark of MSCI and S&P and has been licensed for use by U.S. Bank Global Fund Services. |
| |
Top 10 Holdings | |
Microsoft Corp. | 10.6% |
NVIDIA Corp. | 7.8% |
Amazon.com, Inc. | 5.8% |
UnitedHealth Group, Inc. | 4.9% |
JPMorgan Chase & Co. | 4.6% |
Alphabet, Inc. | 4.5% |
Apple, Inc. | 3.6% |
QUALCOMM, Inc. | 2.9% |
Graco, Inc. | 2.9% |
Toro Co. | 2.9% |
| |
Security Type | |
Common Stocks | 99.7% |
Short-Term Investments | 0.2% |
Cash & Other | 0.1% |
| Mairs & Power Growth Fund | PAGE 1 | TSR_SAR_89834G711 |
Householding
To reduce Fund expenses, only one copy of most shareholder documents may be mailed to shareholders with multiple accounts at the same address (Householding). If you would prefer that your Mairs & Power Funds documents not be householded, please contact Mairs & Power Funds at 1-800-304-7404, or contact your financial intermediary. Your instructions will typically be effective within 30 days of receipt by Mairs & Power Funds or your financial intermediary.
For additional information about the Fund; including its prospectus, financial information, holdings and proxy voting information, scan the QR code above or visit mairsandpower.com/funddocuments.
| Mairs & Power Growth Fund | PAGE 2 | TSR_SAR_89834G711 |
31.515.114.813.87.57.34.42.72.60.3
| | |
| Mairs & Power Balanced Fund | |
| MAPOX |
| Semi-Annual Shareholder Report | June 30, 2024 |
This semi-annual shareholder report contains important information about the Mairs & Power Balanced Fund for the period of January 1, 2024, to June 30, 2024. You can find additional information about the Fund at mairsandpower.com/funds/balanced-fund. You can also request this information by contacting us at 1-800-304-7404.
What were the Fund costs for the last six months?
(based on a hypothetical $10,000 investment)
| | |
Fund Name | Costs of a $10,000 investment | Costs paid as a percentage of a $10,000 investment |
| Mairs & Power Balanced Fund | $36 | 0.70% |
Key Fund Statistics (as of June 30, 2024)
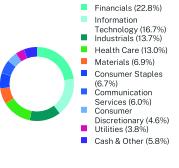
Sector Breakdown*
| * | The Global Industry Classification Standard (“GICS®”) was developed by and/or is the exclusive property of MSCI, Inc. (“MSCI”) and Standard & Poor’s Financial Services LLC (“S&P”). GICS® is a service mark of MSCI and S&P and has been licensed for use by U.S. Bank Global Fund Services. |
| |
Net Assets | $764,221,747 |
Number of Holdings | 264 |
Portfolio Turnover | 6% |
Weighted Average Maturity | 10.07 years |
| |
Effective Duration | 5.39 years |
30-Day SEC Yield | 2.38% |
Average Credit Quality | BBB |
Visit mairsandpower.com/funds/balanced-fund for more recent performance information.
What did the Fund invest in? (% of net assets as of June 30, 2024)
| |
Top 10 Issuers | |
Microsoft Corp. | 4.1% |
Alphabet, Inc. | 4.0% |
JPMorgan Chase & Co. | 3.2% |
UnitedHealth Group, Inc. | 2.8% |
Fiserv, Inc. | 2.6% |
Texas Instruments, Inc. | 2.2% |
Toro Co. | 2.2% |
Ecolab, Inc. | 2.2% |
Motorola Solutions, Inc. | 2.2% |
United States Treasury Note/Bond | 2.1% |
| |
Security Type | |
Common Stocks | 63.9% |
Corporate Bonds | 31.1% |
U.S. Treasury Securities | 2.1% |
Municipal Bonds | 1.0% |
Asset-Backed Securities | 0.8% |
Short-Term Investments | 0.6% |
Preferred Stocks | 0.1% |
Cash & Other | 0.4% |
| Mairs & Power Balanced Fund | PAGE 1 | TSR_SAR_89834G695 |
Householding
To reduce Fund expenses, only one copy of most shareholder documents may be mailed to shareholders with multiple accounts at the same address (Householding). If you would prefer that your Mairs & Power Funds documents not be householded, please contact Mairs & Power Funds at 1-800-304-7404, or contact your financial intermediary. Your instructions will typically be effective within 30 days of receipt by Mairs & Power Funds or your financial intermediary.
For additional information about the Fund; including its prospectus, financial information, holdings and proxy voting information, scan the QR code above or visit mairsandpower.com/funddocuments.
| Mairs & Power Balanced Fund | PAGE 2 | TSR_SAR_89834G695 |
22.816.713.713.06.96.76.04.63.85.8
| | |
| Mairs & Power Small Cap Fund | |
| MSCFX |
| Semi-Annual Shareholder Report | June 30, 2024 |
This semi-annual shareholder report contains important information about the Mairs & Power Small Cap Fund for the period of January 1, 2024, to June 30, 2024. You can find additional information about the Fund at mairsandpower.com/funds/small-cap-fund. You can also request this information by contacting us at 1-800-304-7404.
What were the Fund costs for the last six months?
(based on a hypothetical $10,000 investment)
| | |
Fund Name | Costs of a $10,000 investment | Costs paid as a percentage of a $10,000 investment |
| Mairs & Power Small Cap Fund | $47 | 0.93% |
Key Fund Statistics (as of June 30, 2024)
| |
Net Assets | $311,805,066 |
Number of Holdings | 39 |
Portfolio Turnover | 8% |
30-Day SEC Yield | 0.11% |
Visit mairsandpower.com/funds/small-cap-fund for more recent performance information.
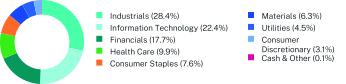
What did the Fund invest in? (% of net assets as of June 30, 2024)
| |
Top 10 Holdings | |
Casey’s General Stores, Inc. | 4.5% |
AAR Corp. | 4.1% |
Altair Engineering, Inc. | 4.1% |
Hub Group, Inc. | 4.0% |
Piper Sandler Cos. | 3.9% |
Medpace Holdings, Inc. | 3.7% |
Littelfuse, Inc. | 3.7% |
HB Fuller Co. | 3.7% |
John Bean Technologies Corp. | 3.7% |
AZEK Co., Inc. | 3.5% |
| |
Security Type | |
Common Stocks | 99.9% |
Short-Term Investments | 0.2% |
Cash & Other | -0.1% |
Sector Breakdown*
| * | The Global Industry Classification Standard (“GICS®”) was developed by and/or is the exclusive property of MSCI, Inc. (“MSCI”) and Standard & Poor’s Financial Services LLC (“S&P”). GICS® is a service mark of MSCI and S&P and has been licensed for use by U.S. Bank Global Fund Services. |
Householding
To reduce Fund expenses, only one copy of most shareholder documents may be mailed to shareholders with multiple accounts at the same address (Householding). If you would prefer that your Mairs & Power Funds documents not be householded, please contact Mairs & Power Funds at 1-800-304-7404, or contact your financial intermediary. Your instructions will typically be effective within 30 days of receipt by Mairs & Power Funds or your financial intermediary.
For additional information about the Fund; including its prospectus, financial information, holdings and proxy voting information, scan the QR code above or visit mairsandpower.com/funddocuments.
| Mairs & Power Small Cap Fund | PAGE 1 | TSR_SAR_89834G687 |
28.422.417.79.97.66.34.53.10.1
| | |
| Mairs & Power Minnesota Municipal Bond ETF | |
| MINN (Principal U.S. Listing Exchange: CBOE) |
| Semi-Annual Shareholder Report | June 30, 2024 |
This semi-annual shareholder report contains important information about the Mairs & Power Minnesota Municipal Bond ETF for the period of January 1, 2024, to June 30, 2024. You can find additional information about the Fund at mairsandpower.com/funds/mn-muni-bond-etf. You can also request this information by contacting us at 1-855-839-2800.
What were the Fund costs for the last six months?
(based on a hypothetical $10,000 investment)
| | |
Fund Name | Costs of a $10,000 investment | Costs paid as a percentage of a $10,000 investment |
| Mairs & Power Minnesota Municipal Bond ETF | $12 | 0.25% |
Key Fund Statistics (as of June 30, 2024)
| |
Credit Breakdown | |
AAA | 22.4% |
AA | 54.5% |
A | 14.8% |
BBB & Lower | 5.2% |
Unrated | 1.4% |
Cash & Cash Equivalent | 1.7% |
| |
Net Assets | $18,689,679 |
Number of Holdings | 97 |
Portfolio Turnover | 21% |
Weighted Average Maturity | 10.63 years |
| |
Effective Duration | 6.02 years |
30-Day SEC Yield | 3.27% |
Average Credit Quality | AA |
Visit mairsandpower.com/funds/mn-muni-bond-etf for more recent performance information.
What did the Fund invest in? (% of net assets as of June 30, 2024)
| |
Top 10 Issuers | |
State of Minnesota | 8.8% |
Anoka-Hennepin Independent School District No 11 | 4.1% |
First American Government Obligations Fund | 3.4% |
Minnesota Higher Education Facilities Authority | 3.4% |
Housing & Redevelopment Authority of The City of St Paul Minnesota | 2.7% |
Forest Lake Independent School District No 831 | 2.7% |
St Paul Independent School District No 625 | 2.6% |
University of Minnesota | 2.6% |
County of Wright MN | 2.6% |
Minneapolis-St Paul Metropolitan Airports Commission | 2.0% |
| |
Security Type | |
Municipal Bonds | 98.3% |
Short-Term Investments | 3.4% |
Cash & Other | -1.7% |
| Mairs & Power Minnesota Municipal Bond ETF | PAGE 1 | TSR_SAR_89834G836 |
Householding
To reduce Fund expenses, only one copy of most shareholder documents may be mailed to shareholders with multiple accounts at the same address (Householding). If you would prefer that your Mairs & Power Funds documents not be householded, please contact Mairs & Power Funds at 1-855-839-2800, or contact your financial intermediary. Your instructions will typically be effective within 30 days of receipt by Mairs & Power Funds or your financial intermediary.
For additional information about the Fund; including its prospectus, financial information, holdings and proxy voting information, scan the QR code above or visit mairsandpower.com/funddocuments.
| Mairs & Power Minnesota Municipal Bond ETF | PAGE 2 | TSR_SAR_89834G836 |
Item 2. Code of Ethics.
Not applicable for semi-annual reports.
Item 3. Audit Committee Financial Expert.
Not applicable for semi-annual reports.
Item 4. Principal Accountant Fees and Services.
Not applicable for semi-annual reports.
Item 5. Audit Committee of Listed Registrants.
| (a) | Not applicable for semi-annual reports. |
Item 6. Investments.
| (a) | Schedule of Investments is included as part of the report to shareholders filed under Item 7(a) of this Form. |
Item 7. Financial Statements and Financial Highlights for Open-End Investment Companies.
TABLE OF CONTENTS
Mairs & Power Growth Fund
Schedule of Investments
as of June 30, 2024 (Unaudited)
| | | | | | | |
COMMON STOCKS - 99.7%
|
Communication Services - 7.3%
|
Alphabet, Inc. - Class C | | | 1,351,419 | | | $ 247,877,273 |
Verizon Communications, Inc. | | | 3,821,000 | | | 157,578,040 |
| | | | | | 405,455,313 |
Consumer Discretionary - 7.5%
| | | | | | |
Amazon.com, Inc.(a) | | | 1,672,000 | | | 323,114,000 |
Best Buy Co., Inc. | | | 655,700 | | | 55,268,953 |
Polaris, Inc. | | | 218,000 | | | 17,071,580 |
Ulta Beauty, Inc.(a) | | | 55,900 | | | 21,570,133 |
| | | | | | 417,024,666 |
Consumer Staples - 2.7%
| | | | | | |
Casey's General Stores, Inc. | | | 42,748 | | | 16,310,927 |
Hormel Foods Corp. | | | 2,810,592 | | | 85,694,950 |
Sysco Corp. | | | 555,000 | | | 39,621,450 |
Target Corp. | | | 75,870 | | | 11,231,795 |
| | | | | | 152,859,122 |
Financials - 15.1%
| | | | | | |
Charles Schwab Corp. | | | 820,000 | | | 60,425,800 |
Fiserv, Inc.(a) | | | 989,000 | | | 147,400,560 |
JPMorgan Chase & Co. | | | 1,263,000 | | | 255,454,380 |
Piper Sandler Cos. | | | 168,000 | | | 38,668,560 |
Principal Financial Group, Inc. | | | 655,000 | | | 51,384,750 |
US Bancorp/MN | | | 3,117,000 | | | 123,744,900 |
Visa, Inc. - Class A | | | 350,000 | | | 91,864,500 |
Wells Fargo & Co. | | | 1,190,500 | | | 70,703,795 |
| | | | | | 839,647,245 |
Health Care - 14.8%
| | | | | | |
Abbott Laboratories | | | 255,829 | | | 26,583,191 |
Bio-Techne Corp. | | | 1,393,800 | | | 99,865,770 |
Eli Lilly & Co. | | | 124,539 | | | 112,755,120 |
Johnson & Johnson | | | 513,232 | | | 75,013,989 |
Medtronic PLC | | | 1,760,000 | | | 138,529,600 |
Roche Holding AG - ADR | | | 2,852,509 | | | 98,896,487 |
UnitedHealth Group, Inc. | | | 531,000 | | | 270,417,060 |
| | | | | | 822,061,217 |
Industrials - 13.8%
| | | | | | |
CH Robinson Worldwide, Inc. | | | 360,000 | | | 31,723,200 |
Donaldson Co., Inc. | | | 673,613 | | | 48,203,746 |
Fastenal Co. | | | 1,416,000 | | | 88,981,440 |
Graco, Inc. | | | 2,044,774 | | | 162,109,683 |
Honeywell International, Inc. | | | 195,594 | | | 41,767,143 |
nVent Electric PLC | | | 1,318,919 | | | 101,042,384 |
Rockwell Automation, Inc. | | | 250,000 | | | 68,820,000 |
Tennant Co. | | | 669,300 | | | 65,885,892 |
Toro Co. | | | 1,705,523 | | | 159,483,456 |
| | | | | | 768,016,944 |
| | | | | | | |
The accompanying notes are an integral part of these financial statements.
TABLE OF CONTENTS
Mairs & Power Growth Fund
Schedule of Investments
as of June 30, 2024 (Unaudited)
| | | | | | | |
COMMON STOCKS - (Continued)
|
Information Technology - 31.5%(b)
| | | | | | |
Apple, Inc. | | | 946,800 | | | $199,415,016 |
Entegris, Inc. | | | 503,000 | | | 68,106,200 |
Littelfuse, Inc. | | | 473,000 | | | 120,894,070 |
Microsoft Corp. | | | 1,315,000 | | | 587,739,250 |
Motorola Solutions, Inc. | | | 288,500 | | | 111,375,425 |
NVIDIA Corp. | | | 3,523,061 | | | 435,238,956 |
QUALCOMM, Inc. | | | 821,000 | | | 163,526,780 |
Salesforce, Inc. | | | 114,000 | | | 29,309,400 |
Workiva, Inc.(a) | | | 512,857 | | | 37,433,433 |
| | | | | | 1,753,038,530 |
Materials - 4.4%
| | | | | | |
Ecolab, Inc. | | | 278,015 | | | 66,167,570 |
HB Fuller Co. | | | 1,087,674 | | | 83,707,391 |
Sherwin-Williams Co. | | | 315,000 | | | 94,005,450 |
| | | | | | 243,880,411 |
Utilities - 2.6%
| | | | | | |
Alliant Energy Corp. | | | 2,872,000 | | | 146,184,800 |
TOTAL COMMON STOCKS
(Cost $2,495,698,679) | | | | | | 5,548,168,248 |
SHORT-TERM INVESTMENTS - 0.2%
| | | | | | |
Money Market Funds - 0.2%
| | | | | | |
First American Government Obligations Fund - Class X, 5.23%(c) | | | 9,963,463 | | | 9,963,463 |
TOTAL SHORT-TERM INVESTMENTS
(Cost $9,963,463) | | | | | | 9,963,463 |
TOTAL INVESTMENTS - 99.9%
(Cost $2,506,662,142) | | | | | | $5,558,131,711 |
Other Assets in Excess of Liabilities - 0.1% | | | | | | 3,555,806 |
TOTAL NET ASSETS - 100.0% | | | | | | $5,561,687,517 |
| | | | | | | |
Percentages are stated as a percent of net assets.
The Global Industry Classification Standard (“GICS®”) was developed by and/or is the exclusive property of MSCI, Inc. (“MSCI”) and Standard & Poor’s Financial Services LLC (“S&P”). GICS® is a service mark of MSCI and S&P and has been licensed for use by U.S. Bank Global Fund Services.
ADR - American Depositary Receipt
AG - Aktiengesellschaft
PLC - Public Limited Company
(a)
| Non-income producing security.
|
(b)
| To the extent that the Fund invests more heavily in a particular industry or sector of the economy, its performance will be especially sensitive to developments that significantly affect those industries or sectors.
|
(c)
| The rate shown represents the 7-day effective yield as of June 30, 2024. |
The accompanying notes are an integral part of these financial statements.
TABLE OF CONTENTS
Mairs & Power Balanced Fund
Schedule of Investments
as of June 30, 2024 (Unaudited)
| | | | | | | |
COMMON STOCKS - 63.9%
|
Communication Services - 5.2%
|
Alphabet, Inc. - Class C | | | 167,810 | | | $ 30,779,710 |
Walt Disney Co. | | | 92,000 | | | 9,134,680 |
| | | | | | 39,914,390 |
Consumer Discretionary - 1.0%
| | | | | | |
Home Depot, Inc. | | | 22,702 | | | 7,814,936 |
Consumer Staples - 5.9%
| | | | | | |
Casey’s General Stores, Inc. | | | 21,000 | | | 8,012,760 |
Hershey Co. | | | 47,283 | | | 8,692,034 |
Hormel Foods Corp. | | | 306,943 | | | 9,358,692 |
Procter & Gamble Co. | | | 37,000 | | | 6,102,040 |
Sysco Corp. | | | 107,000 | | | 7,638,730 |
Target Corp. | | | 36,000 | | | 5,329,440 |
| | | | | | 45,133,696 |
Financials - 11.4%
| | | | | | |
American Express Co. | | | 26,574 | | | 6,153,210 |
Ameriprise Financial, Inc. | | | 12,000 | | | 5,126,280 |
Fiserv, Inc.(a) | | | 128,000 | | | 19,077,120 |
JPMorgan Chase & Co. | | | 100,698 | | | 20,367,177 |
Principal Financial Group, Inc. | | | 59,000 | | | 4,628,550 |
US Bancorp/MN | | | 221,848 | | | 8,807,366 |
Visa, Inc. - Class A | | | 57,000 | | | 14,960,790 |
Wells Fargo & Co. | | | 139,089 | | | 8,260,496 |
| | | | | | 87,380,989 |
Health Care - 11.8%
| | | | | | |
Abbott Laboratories | | | 120,843 | | | 12,556,796 |
Bio-Techne Corp. | | | 91,000 | | | 6,520,150 |
Eli Lilly & Co. | | | 17,475 | | | 15,821,516 |
Johnson & Johnson | | | 73,092 | | | 10,683,127 |
Medtronic PLC | | | 179,000 | | | 14,089,090 |
Neogen Corp.(a) | | | 165,000 | | | 2,578,950 |
Roche Holding AG - ADR | | | 197,000 | | | 6,829,990 |
UnitedHealth Group, Inc. | | | 42,013 | | | 21,395,540 |
| | | | | | 90,475,159 |
Industrials - 10.2%
| | | | | | |
3M Co. | | | 6,527 | | | 666,994 |
Automatic Data Processing, Inc. | | | 39,000 | | | 9,308,910 |
CH Robinson Worldwide, Inc. | | | 28,000 | | | 2,467,360 |
Donaldson Co., Inc. | | | 59,000 | | | 4,222,040 |
Fastenal Co. | | | 130,000 | | | 8,169,200 |
Graco, Inc. | | | 135,915 | | | 10,775,341 |
Honeywell International, Inc. | | | 37,500 | | | 8,007,750 |
nVent Electric PLC | | | 71,000 | | | 5,439,310 |
Rockwell Automation, Inc. | | | 25,000 | | | 6,882,000 |
| | | | | | | |
The accompanying notes are an integral part of these financial statements.
TABLE OF CONTENTS
Mairs & Power Balanced Fund
Schedule of Investments
as of June 30, 2024 (Unaudited)
| | | | | | | |
COMMON STOCKS - (Continued)
|
Industrials - (Continued)
| | | | | | |
Tennant Co. | | | 57,750 | | | $5,684,910 |
Toro Co. | | | 170,323 | | | 15,926,904 |
| | | | | | 77,550,719 |
Information Technology - 12.7%
| | | | | | |
Entegris, Inc. | | | 51,000 | | | 6,905,400 |
Littelfuse, Inc. | | | 44,000 | | | 11,245,960 |
Microsoft Corp. | | | 70,213 | | | 31,381,700 |
Motorola Solutions, Inc. | | | 31,000 | | | 11,967,550 |
QUALCOMM, Inc. | | | 66,494 | | | 13,244,275 |
Salesforce, Inc. | | | 22,000 | | | 5,656,200 |
Texas Instruments, Inc. | | | 86,000 | | | 16,729,580 |
| | | | | | 97,130,665 |
Materials - 4.4%
| | | | | | |
Ecolab, Inc. | | | 69,000 | | | 16,422,000 |
HB Fuller Co. | | | 98,205 | | | 7,557,857 |
Sherwin-Williams Co. | | | 31,000 | | | 9,251,330 |
| | | | | | 33,231,187 |
Utilities - 1.3%
| | | | | | |
Xcel Energy, Inc. | | | 184,700 | | | 9,864,827 |
TOTAL COMMON STOCKS
(Cost $262,659,866) | | | | | | 488,496,568 |
| | | Par | | | |
CORPORATE BONDS - 31.1%
|
Communication Services - 0.8%
| | | | | | |
AT&T, Inc., 4.50%, 05/15/2035 | | | $3,000,000 | | | 2,770,505 |
Comcast Corp., 4.25%, 01/15/2033 | | | 2,000,000 | | | 1,874,199 |
Netflix, Inc., 5.88%, 11/15/2028 | | | 1,688,000 | | | 1,740,666 |
| | | | | | 6,385,370 |
Consumer Discretionary - 3.6%
| | | | | | |
Advance Auto Parts, Inc., 3.90%, 04/15/2030 | | | 2,000,000 | | | 1,810,110 |
AutoNation, Inc., 3.80%, 11/15/2027 | | | 1,110,000 | | | 1,045,426 |
Block Financial LLC | | | | | | |
5.25%, 10/01/2025 | | | 1,064,000 | | | 1,057,106 |
3.88%, 08/15/2030 | | | 1,000,000 | | | 917,827 |
Choice Hotels International, Inc. | | | | | | |
3.70%, 12/01/2029 | | | 1,000,000 | | | 898,776 |
5.85%, 08/01/2034 | | | 750,000 | | | 740,920 |
eBay, Inc., 6.30%, 11/22/2032 | | | 2,000,000 | | | 2,128,788 |
Ford Motor Co. | | | | | | |
6.10%, 08/19/2032 | | | 500,000 | | | 500,522 |
4.75%, 01/15/2043 | | | 1,000,000 | | | 812,509 |
| | | | | | | |
The accompanying notes are an integral part of these financial statements.
TABLE OF CONTENTS
Mairs & Power Balanced Fund
Schedule of Investments
as of June 30, 2024 (Unaudited)
| | | | | | | |
CORPORATE BONDS - (Continued)
|
Consumer Discretionary - (Continued)
| | | | | | |
General Motors Co.
| | | | | | |
4.20%, 10/01/2027 | | | $1,000,000 | | | $ 964,711 |
5.15%, 04/01/2038 | | | 1,000,000 | | | 922,878 |
Hasbro, Inc.
| | | | | | |
3.90%, 11/19/2029 | | | 2,000,000 | | | 1,847,400 |
5.10%, 05/15/2044 | | | 750,000 | | | 646,561 |
Kohl’s Corp.
| | | | | | |
4.63%, 05/01/2031 | | | 1,000,000 | | | 837,653 |
6.88%, 12/15/2037 | | | 500,000 | | | 396,813 |
5.55%, 07/17/2045 | | | 1,073,000 | | | 734,163 |
Lear Corp., 3.80%, 09/15/2027 | | | 2,245,000 | | | 2,144,694 |
Lowe’s Cos., Inc., 4.65%, 04/15/2042 | | | 880,000 | | | 772,954 |
Mohawk Industries, Inc., 3.63%, 05/15/2030 | | | 2,000,000 | | | 1,835,940 |
Polaris, Inc., 6.95%, 03/15/2029 | | | 1,806,000 | | | 1,890,333 |
Starbucks Corp., 3.00%, 02/14/2032 | | | 1,000,000 | | | 868,683 |
Tapestry, Inc.
| | | | | | |
7.70%, 11/27/2030 | | | 500,000 | | | 522,963 |
3.05%, 03/15/2032 | | | 500,000 | | | 404,193 |
United Airlines 2014-2 Class A Pass Through Trust, Series A,
3.75%, 09/03/2026 | | | 365,690 | | | 352,160 |
Whirlpool Corp.
| | | | | | |
5.75%, 03/01/2034 | | | 1,000,000 | | | 1,000,810 |
5.15%, 03/01/2043 | | | 1,100,000 | | | 978,011 |
Wildlife Conservation Society, 3.41%, 08/01/2050 | | | 1,000,000 | | | 706,914 |
| | | | | | 27,739,818 |
Consumer Staples - 0.8%
| | | | | | |
Anheuser-Busch Cos. LLC / Anheuser-Busch InBev Worldwide, Inc.,
4.70%, 02/01/2036 | | | 1,000,000 | | | 956,152 |
Land O’ Lakes, Inc.
| | | | | | |
7.25%, Perpetual(b) | | | 2,500,000 | | | 2,037,500 |
7.00%, Perpetual(b) | | | 2,500,000 | | | 1,962,500 |
Molson Coors Beverage Co., 4.20%, 07/15/2046 | | | 1,000,000 | | | 803,755 |
Smithfield Foods, Inc., 3.00%, 10/15/2030(b) | | | 250,000 | | | 212,594 |
| | | | | | 5,972,501 |
Energy - 0.3%
| | | | | | |
Boardwalk Pipelines LP, 4.95%, 12/15/2024 | | | 1,000,000 | | | 996,286 |
Kinder Morgan, Inc., 5.30%, 12/01/2034 | | | 1,200,000 | | | 1,166,104 |
Murphy Oil Corp., 5.88%, 12/01/2042 | | | 500,000 | | | 443,911 |
| | | | | | 2,606,301 |
Financials - 11.3%
| | | | | | |
Allstate Corp., 5.25%, 03/30/2033 | | | 1,000,000 | | | 998,335 |
American Express Co., 4.99% to 05/26/2032 then SOFR + 2.26%, 05/26/2033 | | | 500,000 | | | 482,790 |
Ashtead Capital, Inc., 5.80%, 04/15/2034(b) | | | 1,000,000 | | | 994,807 |
Associated Banc-Corp., 4.25%, 01/15/2025 | | | 1,627,000 | | | 1,610,001 |
| | | | | | | |
The accompanying notes are an integral part of these financial statements.
TABLE OF CONTENTS
Mairs & Power Balanced Fund
Schedule of Investments
as of June 30, 2024 (Unaudited)
| | | | | | | |
CORPORATE BONDS - (Continued)
|
Financials - (Continued)
| | | | | | |
Assurant, Inc., 3.70%, 02/22/2030 | | | $2,300,000 | | | $ 2,081,500 |
BAC Capital Trust XIV, 6.00% (3 mo. Term SOFR + 0.66%), Perpetual | | | 500,000 | | | 429,120 |
Bank of America Corp.
| | | | | | |
5.02% to 07/22/2032 then SOFR + 2.16%, 07/22/2033 | | | 1,000,000 | | | 981,575 |
4.00%, 08/15/2034 | | | 538,000 | | | 477,420 |
Bank of Montreal, 3.09% to 01/10/2032 then 5 yr. CMT Rate + 1.40%, 01/10/2037 | | | 2,150,000 | | | 1,762,813 |
Bank of New York Mellon Corp., 3.75% to 12/20/2026 then 5 yr. CMT Rate + 2.63%, Perpetual | | | 2,000,000 | | | 1,850,609 |
Blackstone Holdings Finance Co. LLC, 2.55%, 03/30/2032(b) | | | 1,000,000 | | | 833,182 |
Capital One Financial Corp., 5.25% to 07/26/2029 then SOFR + 2.60%, 07/26/2030 | | | 4,000,000 | | | 3,933,462 |
Charles Schwab Corp., 4.00% to 12/01/2030 then 10 yr. CMT Rate + 3.08%, Perpetual | | | 6,000,000 | | | 5,129,978 |
Cincinnati Financial Corp., 6.13%, 11/01/2034 | | | 1,301,000 | | | 1,359,725 |
Citigroup, Inc.
| | | | | | |
4.00%, 08/05/2024 | | | 1,000,000 | | | 997,984 |
3.07% to 02/24/2027 then SOFR + 1.28%, 02/24/2028 | | | 500,000 | | | 472,018 |
CNA Financial Corp., 5.50%, 06/15/2033 | | | 2,000,000 | | | 1,999,728 |
Farmers Exchange Capital, 7.05%, 07/15/2028(b) | | | 500,000 | | | 514,942 |
Fiserv, Inc., 4.20%, 10/01/2028 | | | 1,000,000 | | | 961,961 |
FMR LLC, 6.45%, 11/15/2039(b) | | | 1,141,000 | | | 1,246,119 |
Ford Motor Credit Co. LLC, 3.63%, 06/17/2031 | | | 1,750,000 | | | 1,512,065 |
Fulton Financial Corp., 3.75% to 03/15/2030 then 3 mo. Term SOFR + 2.70%, 03/15/2035 | | | 3,000,000 | | | 2,161,010 |
General Motors Financial Co., Inc., 5.75%, 02/08/2031 | | | 500,000 | | | 501,867 |
Goldman Sachs Group, Inc.
| | | | | | |
4.25%, 11/15/2030 | | | 500,000 | | | 467,664 |
4.00%, 02/15/2031 | | | 500,000 | | | 469,310 |
2.65% to 10/21/2031 then SOFR + 1.26%, 10/21/2032 | | | 2,000,000 | | | 1,666,574 |
4.30%, 12/15/2032 | | | 500,000 | | | 462,872 |
HSBC Holdings PLC, 4.25%, 08/18/2025 | | | 2,000,000 | | | 1,964,852 |
Huntington National Bank, 4.60%, 02/27/2025 | | | 1,050,000 | | | 1,036,938 |
Janus Henderson US Holdings, Inc., 4.88%, 08/01/2025 | | | 2,000,000 | | | 1,979,885 |
JPMorgan Chase & Co.
| | | | | | |
3.65% to 06/01/2026 then 5 yr. CMT Rate + 2.85%, Perpetual | | | 3,000,000 | | | 2,844,644 |
4.13%, 12/15/2026 | | | 1,000,000 | | | 974,420 |
Kemper Corp., 4.35%, 02/15/2025 | | | 4,000,000 | | | 3,962,035 |
Land O’ Lakes Capital Trust I, 7.45%, 03/15/2028(b) | | | 1,949,000 | | | 1,888,815 |
Legg Mason, Inc.
| | | | | | |
3.95%, 07/15/2024 | | | 3,088,000 | | | 3,085,922 |
4.75%, 03/15/2026 | | | 1,520,000 | | | 1,511,382 |
Liberty Mutual Insurance Co., 8.50%, 05/15/2025(b) | | | 250,000 | | | 254,985 |
M&T Bank Corp., 5.13% to 11/01/2026 then 3 mo. Term SOFR + 3.78%, Perpetual | | | 2,500,000 | | | 2,378,953 |
| | | | | | | |
The accompanying notes are an integral part of these financial statements.
TABLE OF CONTENTS
Mairs & Power Balanced Fund
Schedule of Investments
as of June 30, 2024 (Unaudited)
| | | | | | | |
CORPORATE BONDS - (Continued)
|
Financials - (Continued)
| | | | | | |
Mercury General Corp., 4.40%, 03/15/2027 | | | $4,000,000 | | | $ 3,860,021 |
Morgan Stanley
| | | | | | |
2.94% to 01/21/2032 then SOFR + 1.29%, 01/21/2033 | | | 1,700,000 | | | 1,448,045 |
2.48% to 09/16/2031 then SOFR + 1.36%, 09/16/2036 | | | 750,000 | | | 594,450 |
Old Republic International Corp.
| | | | | | |
4.88%, 10/01/2024 | | | 2,000,000 | | | 1,994,050 |
3.88%, 08/26/2026 | | | 790,000 | | | 763,947 |
5.75%, 03/28/2034 | | | 1,000,000 | | | 1,000,023 |
Park National Corp., 4.50% to 09/01/2025 then 3 mo. Term SOFR + 4.39%, 09/01/2030 | | | 500,000 | | | 470,675 |
PNC Bank NA, 3.88%, 04/10/2025 | | | 1,000,000 | | | 985,572 |
PNC Financial Services Group, Inc., 3.40% to 09/15/2026 then 5 yr. CMT Rate + 2.60%, Perpetual | | | 4,000,000 | | | 3,599,182 |
Principal Financial Group, Inc., 4.35%, 05/15/2043 | | | 500,000 | | | 428,709 |
Prudential Insurance Co. of America, 8.30%, 07/01/2025(b) | | | 1,000,000 | | | 1,022,000 |
Synchrony Financial
| | | | | | |
4.25%, 08/15/2024 | | | 3,000,000 | | | 2,992,913 |
4.50%, 07/23/2025 | | | 1,000,000 | | | 984,048 |
2.88%, 10/28/2031 | | | 2,000,000 | | | 1,607,631 |
Unum Group, 7.25%, 03/15/2028 | | | 250,000 | | | 262,134 |
US Bancorp, 5.85% to 10/21/2032 then SOFR + 2.09%, 10/21/2033 | | | 2,000,000 | | | 2,036,235 |
Wells Fargo & Co., 4.10%, 06/03/2026 | | | 1,000,000 | | | 974,540 |
Wintrust Financial Corp., 4.85%, 06/06/2029 | | | 3,500,000 | | | 3,201,264 |
| | | | | | 86,467,701 |
Health Care - 1.2%
| | | | | | |
AbbVie, Inc., 3.80%, 03/15/2025 | | | 2,000,000 | | | 1,975,660 |
Bristol-Myers Squibb Co.
| | | | | | |
3.88%, 08/15/2025 | | | 43,000 | | | 42,320 |
2.35%, 11/13/2040 | | | 1,500,000 | | | 1,002,098 |
CVS Health Corp.
| | | | | | |
4.78%, 03/25/2038 | | | 1,400,000 | | | 1,253,992 |
2.70%, 08/21/2040 | | | 1,500,000 | | | 1,001,694 |
Humana, Inc., 5.95%, 03/15/2034 | | | 1,000,000 | | | 1,025,590 |
Quest Diagnostics, Inc., 6.40%, 11/30/2033 | | | 500,000 | | | 536,242 |
Viatris, Inc., 2.30%, 06/22/2027 | | | 1,500,000 | | | 1,370,174 |
Zimmer Biomet Holdings, Inc., 4.25%, 08/15/2035 | | | 700,000 | | | 613,655 |
| | | | | | 8,821,425 |
Industrials - 3.5%
| | | | | | |
Eaton Corp., 4.00%, 11/02/2032 | | | 2,000,000 | | | 1,868,817 |
Equifax, Inc., 7.00%, 07/01/2037 | | | 1,000,000 | | | 1,117,288 |
FedEx Corp., 4.10%, 04/15/2043 | | | 1,000,000 | | | 808,318 |
Flowserve Corp., 3.50%, 10/01/2030 | | | 1,000,000 | | | 892,168 |
GATX Corp.
| | | | | | |
4.90%, 03/15/2033 | | | 1,000,000 | | | 959,479 |
| | | | | | | |
The accompanying notes are an integral part of these financial statements.
TABLE OF CONTENTS
Mairs & Power Balanced Fund
Schedule of Investments
as of June 30, 2024 (Unaudited)
| | | | | | | |
CORPORATE BONDS - (Continued)
|
Industrials - (Continued)
| |
5.45%, 09/15/2033 | | | $1,000,000 | | | $ 989,525 |
6.05%, 03/15/2034 | | | 500,000 | | | 512,555 |
6.90%, 05/01/2034 | | | 500,000 | | | 545,888 |
Hillenbrand, Inc., 3.75%, 03/01/2031 | | | 3,000,000 | | | 2,610,038 |
Howmet Aerospace, Inc., 5.95%, 02/01/2037 | | | 1,000,000 | | | 1,029,892 |
Kennametal, Inc., 4.63%, 06/15/2028 | | | 1,500,000 | | | 1,464,199 |
Leidos Holdings, Inc., 5.95%, 12/01/2040 | | | 1,400,000 | | | 1,376,130 |
Leidos, Inc., 5.50%, 07/01/2033 | | | 3,850,000 | | | 3,793,049 |
nVent Finance Sarl, 5.65%, 05/15/2033 | | | 1,495,000 | | | 1,493,170 |
Penske Truck Leasing Co. Lp / PTL Finance Corp.
| | | | | | |
5.70%, 02/01/2028(b) | | | 500,000 | | | 504,902 |
6.05%, 08/01/2028(b) | | | 500,000 | | | 512,414 |
Steelcase, Inc., 5.13%, 01/18/2029 | | | 2,000,000 | | | 1,896,042 |
Toro Co., 7.80%, 06/15/2027 | | | 500,000 | | | 532,784 |
United Rentals North America, Inc., 3.75%, 01/15/2032 | | | 4,000,000 | | | 3,485,176 |
| | | | | | 26,391,834 |
Information Technology - 4.0%
| | | | | | |
Analog Devices, Inc., 2.80%, 10/01/2041 | | | 1,000,000 | | | 708,685 |
Arrow Electronics, Inc., 4.00%, 04/01/2025 | | �� | 1,031,000 | | | 1,017,238 |
Autodesk, Inc., 2.40%, 12/15/2031 | | | 1,000,000 | | | 831,786 |
Avnet, Inc.
| | | | | | |
3.00%, 05/15/2031 | | | 2,000,000 | | | 1,684,051 |
5.50%, 06/01/2032 | | | 1,000,000 | | | 969,280 |
Broadcom, Inc.
| | | | | | |
4.30%, 11/15/2032 | | | 1,000,000 | | | 936,917 |
3.47%, 04/15/2034(b) | | | 1,000,000 | | | 854,796 |
4.93%, 05/15/2037(b) | | | 1,500,000 | | | 1,414,993 |
Cox Communications, Inc., 4.80%, 02/01/2035(b) | | | 1,880,000 | | | 1,705,231 |
Dell, Inc., 5.40%, 09/10/2040 | | | 1,000,000 | | | 945,288 |
Discovery Communications LLC, 4.95%, 05/15/2042 | | | 570,000 | | | 447,780 |
Entegris, Inc., 4.75%, 04/15/2029(b) | | | 3,000,000 | | | 2,872,946 |
Fortinet, Inc., 2.20%, 03/15/2031 | | | 2,000,000 | | | 1,650,462 |
Hewlett Packard Enterprise Co., 4.90%, 10/15/2025 | | | 1,000,000 | | | 992,259 |
HP, Inc.
| | | | | | |
2.65%, 06/17/2031 | | | 1,000,000 | | | 849,188 |
5.50%, 01/15/2033 | | | 2,000,000 | | | 2,017,550 |
Micron Technology, Inc., 5.88%, 02/09/2033 | | | 1,000,000 | | | 1,023,583 |
Motorola Solutions, Inc.
| | | | | | |
4.60%, 02/23/2028 | | | 2,500,000 | | | 2,460,144 |
5.50%, 09/01/2044 | | | 2,000,000 | | | 1,954,874 |
Oracle Corp., 3.60%, 04/01/2040 | | | 3,000,000 | | | 2,316,195 |
T-Mobile USA, Inc., 5.75%, 01/15/2034 | | | 2,000,000 | | | 2,060,826 |
Warnermedia Holdings, Inc., 4.28%, 03/15/2032 | | | 1,000,000 | | | 874,384 |
| | | | | | 30,588,456 |
| | | | | | | |
The accompanying notes are an integral part of these financial statements.
TABLE OF CONTENTS
Mairs & Power Balanced Fund
Schedule of Investments
as of June 30, 2024 (Unaudited)
| | | | | | | |
CORPORATE BONDS - (Continued)
|
Materials - 2.5%
| | | | | | |
Albemarle Corp., 5.45%, 12/01/2044 | | | $325,000 | | | $ 298,567 |
Albemarle Wodgina Pty Ltd., 3.45%, 11/15/2029 | | | 1,175,000 | | | 1,044,245 |
Cabot Corp.
| | | | | | |
3.40%, 09/15/2026 | | | 1,500,000 | | | 1,433,304 |
4.00%, 07/01/2029 | | | 2,800,000 | | | 2,643,115 |
Eastman Chemical Co.
| | | | | | |
3.80%, 03/15/2025 | | | 756,000 | | | 746,304 |
5.63%, 02/20/2034 | | | 1,000,000 | | | 996,038 |
Freeport-McMoRan, Inc., 4.25%, 03/01/2030 | | | 3,000,000 | | | 2,836,636 |
HB Fuller Co., 4.25%, 10/15/2028 | | | 3,200,000 | | | 3,033,071 |
International Flavors & Fragrances, Inc.
| | | | | | |
1.83%, 10/15/2027(b) | | | 486,000 | | | 434,348 |
2.30%, 11/01/2030(b) | | | 1,200,000 | | | 1,001,895 |
3.27%, 11/15/2040(b) | | | 1,000,000 | | | 710,376 |
Mosaic Co., 5.45%, 11/15/2033 | | | 2,000,000 | | | 1,985,203 |
Newmont Corp., 4.88%, 03/15/2042 | | | 1,000,000 | | | 927,294 |
Steel Dynamics, Inc., 3.25%, 10/15/2050 | | | 250,000 | | | 166,144 |
Union Carbide Corp., 7.50%, 06/01/2025 | | | 865,000 | | | 878,073 |
| | | | | | 19,134,613 |
Professional, Scientific, and Technical Services - 0.3%
| | | | | | |
LPL Holdings, Inc., 6.00%, 05/20/2034 | | | 2,000,000 | | | 2,002,522 |
Real Estate - 0.3%
| | | | | | |
CBRE Services, Inc., 5.95%, 08/15/2034 | | | 2,000,000 | | | 2,029,891 |
Utilities - 2.5%
| | | | | | |
Alliant Energy Finance LLC, 3.60%, 03/01/2032(b) | | | 1,000,000 | | | 873,414 |
Black Hills Corp.
| | | | | | |
4.35%, 05/01/2033 | | | 1,000,000 | | | 904,129 |
6.15%, 05/15/2034 | | | 2,000,000 | | | 2,043,954 |
Duke Energy Carolinas LLC, 6.10%, 06/01/2037 | | | 1,000,000 | | | 1,033,943 |
Duke Energy Progress LLC, 5.70%, 04/01/2035 | | | 1,165,000 | | | 1,174,148 |
Interstate Power and Light Co., 6.25%, 07/15/2039 | | | 2,000,000 | | | 2,089,950 |
National Fuel Gas Co.
| | | | | | |
3.95%, 09/15/2027 | | | 2,000,000 | | | 1,913,394 |
4.75%, 09/01/2028 | | | 1,000,000 | | | 973,705 |
Niagara Mohawk Power Corp., 4.28%, 10/01/2034(b) | | | 2,000,000 | | | 1,782,591 |
Northern Natural Gas Co., 4.10%, 09/15/2042(b) | | | 1,021,000 | | | 818,248 |
Public Service Co. of Colorado, 6.50%, 08/01/2038 | | | 2,000,000 | | | 2,168,960 |
Southwestern Public Service Co., 6.00%, 10/01/2036 | | | 1,000,000 | | | 993,608 |
Toledo Edison Co., 2.65%, 05/01/2028(b) | | | 416,000 | | | 375,436 |
Virginia Electric and Power Co., 6.35%, 11/30/2037 | | | 1,065,000 | | | 1,138,026 |
Wisconsin Power and Light Co., 4.95%, 04/01/2033 | | | 1,000,000 | | | 970,074 |
| | | | | | 19,253,580 |
TOTAL CORPORATE BONDS
(Cost $254,809,960) | | | | | | $237,394,012 |
| | | | | | | |
The accompanying notes are an integral part of these financial statements.
TABLE OF CONTENTS
Mairs & Power Balanced Fund
Schedule of Investments
as of June 30, 2024 (Unaudited)
| | | | | | | |
U.S. TREASURY OBLIGATIONS - 2.1%
| | | | | | |
United States Treasury Note/Bond
| | | | | | |
0.75%, 03/31/2026 | | | $1,000,000 | | | $932,734 |
0.75%, 04/30/2026 | | | 1,000,000 | | | 930,195 |
1.13%, 10/31/2026 | | | 1,000,000 | | | 923,067 |
2.63%, 05/31/2027 | | | 3,000,000 | | | 2,845,957 |
1.25%, 06/30/2028 | | | 1,000,000 | | | 885,371 |
1.00%, 07/31/2028 | | | 1,000,000 | | | 874,082 |
1.25%, 09/30/2028 | | | 1,000,000 | | | 879,356 |
2.63%, 02/15/2029 | | | 2,000,000 | | | 1,855,430 |
1.38%, 11/15/2031 | | | 2,000,000 | | | 1,629,492 |
2.88%, 05/15/2032 | | | 2,000,000 | | | 1,805,234 |
3.25%, 05/15/2042 | | | 1,000,000 | | | 835,625 |
3.00%, 02/15/2049 | | | 2,000,000 | | | 1,524,531 |
TOTAL U.S. TREASURY OBLIGATIONS
(Cost $17,202,417) | | | | | | 15,921,074 |
MUNICIPAL BONDS - 1.0%
| | | | | | |
Borough of Naugatuck CT, 3.09%, 09/15/2046 | | | 1,000,000 | | | 712,810 |
Crowley Independent School District, 3.01%, 08/01/2038 | | | 1,000,000 | | | 810,890 |
DeKalb Kane & LaSalle Counties Etc Community College District No 523 Kishwaukee, 3.02%, 02/01/2036 | | | 500,000 | | | 404,644 |
Desert Community College District, 2.46%, 08/01/2040 | | | 300,000 | | | 218,021 |
Glendale Community College District/CA, 2.11%, 08/01/2031 | | | 650,000 | | | 547,220 |
Idaho Bond Bank Authority, 2.35%, 09/15/2038 | | | 500,000 | | | 370,459 |
Massachusetts Development Finance Agency, 2.55%, 05/01/2040 | | | 885,000 | | | 619,752 |
Michigan State University, 4.50%, 08/15/2048 | | | 1,000,000 | | | 917,118 |
Pierre School District No 32-2, 2.04%, 08/01/2033 | | | 920,000 | | | 749,638 |
Redondo Beach Unified School District, 2.04%, 08/01/2034 | | | 500,000 | | | 380,505 |
Socorro Independent School District, 2.13%, 08/15/2031 | | | 500,000 | | | 423,598 |
Village of Ashwaubenon WI, 2.97%, 06/01/2040 | | | 505,000 | | | 386,750 |
Woodbury County Law Enforcement Center Authority, 3.09%, 06/01/2040 | | | 750,000 | | | 583,215 |
Worthington Independent School District No 518, 3.30%, 02/01/2039 | | | 850,000 | | | 704,280 |
TOTAL MUNICIPAL BONDS
(Cost $9,966,528) | | | | | | 7,828,900 |
ASSET-BACKED SECURITIES - 0.8%
| | | | | | |
American Airlines Group, Inc.
| | | | | | |
Series 2013-1, 3.95%, 11/15/2025 | | | 348,353 | | | 340,515 |
Series 2014-1, 3.70%, 10/01/2026 | | | 982,467 | | | 941,940 |
Series 2015-1, 3.38%, 05/01/2027 | | | 255,716 | | | 241,012 |
Series 2015-2, 4.00%, 09/22/2027 | | | 388,754 | | | 365,429 |
Series 2015-2, 3.60%, 09/22/2027 | | | 119,234 | | | 113,272 |
Series 2016-3B, 3.75%, 10/15/2025 | | | 425,507 | | | 410,614 |
Series 2017-1B, 4.95%, 02/15/2025 | | | 459,498 | | | 454,903 |
| | | | | | | |
The accompanying notes are an integral part of these financial statements.
TABLE OF CONTENTS
Mairs & Power Balanced Fund
Schedule of Investments
as of June 30, 2024 (Unaudited)
| | | | | | | |
ASSET-BACKED SECURITIES - (Continued)
| | | | | | |
British Airways PLC, Series 2018-1, 4.13%, 09/20/2031(b) | | | $605,126 | | | $565,792 |
Hawaiian Holdings, Inc., Series 2013-1, 3.90%, 01/15/2026 | | | 1,222,623 | | | 1,155,379 |
Spirit Airlines, Inc., Series 2015-1, 4.10%, 04/01/2028 | | | 72,777 | | | 67,501 |
United Airlines, Inc.
| | | | | | |
Series A, 4.00%, 10/29/2024 | | | 888,824 | | | 886,601 |
Series A, 4.30%, 08/15/2025 | | | 554,738 | | | 546,195 |
Series A, 4.00%, 04/11/2026 | | | 435,176 | | | 422,391 |
TOTAL ASSET-BACKED SECURITIES
(Cost $6,734,647) | | | | | | 6,511,544 |
| | | Shares | | | |
PREFERRED STOCKS - 0.1%
|
Financials - 0.1%
| | | | | | |
Wells Fargo & Co, Series AA, 4.70%, Perpetual | | | 20,000 | | | 406,200 |
TOTAL PREFERRED STOCKS
(Cost $500,000) | | | | | | 406,200 |
SHORT-TERM INVESTMENTS - 0.6%
| | | | | | |
Money Market Funds - 0.6%
| | | | | | |
First American Government Obligations Fund - Class X, 5.23%(c) | | | 4,660,996 | | | 4,660,996 |
TOTAL SHORT-TERM INVESTMENTS
(Cost $4,660,996) | | | | | | 4,660,996 |
TOTAL INVESTMENTS - 99.6%
(Cost $556,534,414) | | | | | | $761,219,294 |
Other Assets in Excess of Liabilities - 0.4% | | | | | | 3,002,453 |
TOTAL NET ASSETS - 100.0% | | | | | | $764,221,747 |
| | | | | | | |
Percentages are stated as a percent of net assets.
The Global Industry Classification Standard (“GICS®”) was developed by and/or is the exclusive property of MSCI, Inc. (“MSCI”) and Standard & Poor’s Financial Services LLC (“S&P”). GICS® is a service mark of MSCI and S&P and has been licensed for use by U.S. Bank Global Fund Services.
ADR - American Depositary Receipt
AG - Aktiengesellschaft
CMT - Constant Maturity Treasury Rate
PLC - Public Limited Company
SOFR - Secured Overnight Financing Rate
(a)
| Non-income producing security.
|
(b)
| Security is exempt from registration pursuant to Rule 144A under the Securities Act of 1933, as amended. These securities may only be resold in transactions exempt from registration to qualified institutional investors. As of June 30, 2024, the value of these securities total $25,394,826 or 3.3% of the Fund’s net assets.
|
(c)
| The rate shown represents the 7-day effective yield as of June 30, 2024. |
The accompanying notes are an integral part of these financial statements.
TABLE OF CONTENTS
Mairs & Power Small Cap Fund
Schedule of Investments
as of June 30, 2024 (Unaudited)
| | | | | | | |
COMMON STOCKS - 99.9%
|
Consumer Discretionary - 3.1%
|
Gentherm, Inc.(a) | | | 137,380 | | | $ 6,775,581 |
Polaris, Inc. | | | 38,400 | | | 3,007,104 |
| | | | | | 9,782,685 |
Consumer Staples - 7.6%
| | | | | | |
Casey’s General Stores, Inc. | | | 36,603 | | | 13,966,241 |
MGP Ingredients, Inc. | | | 128,210 | | | 9,538,824 |
| | | | | | 23,505,065 |
Financials - 17.7%
| | | | | | |
Alerus Financial Corp. | | | 96,441 | | | 1,891,208 |
Associated Banc-Corp. | | | 365,361 | | | 7,727,385 |
Cullen/Frost Bankers, Inc. | | | 85,150 | | | 8,653,795 |
Glacier Bancorp, Inc. | | | 192,420 | | | 7,181,114 |
Piper Sandler Cos. | | | 53,100 | | | 12,222,027 |
QCR Holdings, Inc. | | | 128,078 | | | 7,684,680 |
Wintrust Financial Corp. | | | 99,146 | | | 9,771,830 |
| | | | | | 55,132,039 |
Health Care - 9.9%
| | | | | | |
Bio-Techne Corp. | | | 98,000 | | | 7,021,700 |
CVRx, Inc.(a) | | | 137,456 | | | 1,648,097 |
Exact Sciences Corp.(a) | | | 37,700 | | | 1,592,825 |
Inspire Medical Systems, Inc.(a) | | | 48,625 | | | 6,507,484 |
Medpace Holdings, Inc.(a) | | | 28,370 | | | 11,684,185 |
Neogen Corp.(a) | | | 151,100 | | | 2,361,693 |
| | | | | | 30,815,984 |
Industrials - 28.4%(b)
| | | | | | |
AAR Corp.(a) | | | 175,361 | | | 12,748,745 |
AZEK Co., Inc.(a) | | | 258,277 | | | 10,881,210 |
Generac Holdings, Inc.(a) | | | 70,972 | | | 9,383,918 |
Hub Group, Inc. - Class A | | | 288,320 | | | 12,412,176 |
John Bean Technologies Corp. | | | 120,735 | | | 11,466,203 |
nVent Electric PLC | | | 136,889 | | | 10,487,066 |
Oshkosh Corp. | | | 39,750 | | | 4,300,950 |
Tennant Co. | | | 84,064 | | | 8,275,260 |
Toro Co. | | | 92,300 | | | 8,630,973 |
| | | | | | 88,586,501 |
Information Technology - 22.4%
| | | | | | |
Altair Engineering, Inc. - Class A(a) | | | 128,850 | | | 12,637,608 |
Clearfield, Inc.(a) | | | 275,893 | | | 10,638,434 |
Entegris, Inc. | | | 74,507 | | | 10,088,248 |
Jamf Holding Corp.(a) | | | 381,667 | | | 6,297,505 |
Littelfuse, Inc. | | | 44,927 | | | 11,482,892 |
Plexus Corp.(a) | | | 98,020 | | | 10,113,704 |
| | | | | | | |
The accompanying notes are an integral part of these financial statements.
TABLE OF CONTENTS
Mairs & Power Small Cap Fund
Schedule of Investments
as of June 30, 2024 (Unaudited)
| | | | | | | |
COMMON STOCKS - (Continued)
|
Information Technology - (Continued)
| | | | | | |
SkyWater Technology, Inc.(a) | | | 166,390 | | | $1,272,884 |
Workiva, Inc.(a) | | | 101,267 | | | 7,391,478 |
| | | | | | 69,922,753 |
Materials - 6.3%
| | | | | | |
HB Fuller Co. | | | 149,109 | | | 11,475,428 |
Knife River Corp.(a) | | | 114,650 | | | 8,041,551 |
| | | | | | 19,516,979 |
Utilities - 4.5%
| | | | | | |
Black Hills Corp. | | | 136,200 | | | 7,406,556 |
Northwestern Energy Group, Inc. | | | 132,600 | | | 6,640,608 |
| | | | | | 14,047,164 |
TOTAL COMMON STOCKS
(Cost $225,213,494) | | | | | | 311,309,170 |
SHORT-TERM INVESTMENTS - 0.2%
| | | | | | |
Money Market Funds - 0.2%
| | | | | | |
First American Government Obligations Fund - Class X, 5.23%(c) | | | 688,351 | | | 688,351 |
TOTAL SHORT-TERM INVESTMENTS
(Cost $688,351) | | | | | | 688,351 |
TOTAL INVESTMENTS - 100.1%
(Cost $225,901,845) | | | | | | $311,997,521 |
Liabilities in Excess of Other Assets - (0.1)% | | | | | | (192,455) |
TOTAL NET ASSETS - 100.0% | | | | | | $311,805,066 |
| | | | | | | |
Percentages are stated as a percent of net assets.
The Global Industry Classification Standard (“GICS®”) was developed by and/or is the exclusive property of MSCI, Inc. (“MSCI”) and Standard & Poor’s Financial Services LLC (“S&P”). GICS® is a service mark of MSCI and S&P and has been licensed for use by U.S. Bank Global Fund Services.
PLC - Public Limited Company
(a)
| Non-income producing security.
|
(b)
| To the extent that the Fund invests more heavily in a particular industry or sector of the economy, its performance will be especially sensitive to developments that significantly affect those industries or sectors.
|
(c)
| The rate shown represents the 7-day effective yield as of June 30, 2024. |
The accompanying notes are an integral part of these financial statements.
TABLE OF CONTENTS
Mairs & Power Minnesota Municipal Bond ETF
Schedule of Investments
as of June 30, 2024 (Unaudited)
| | | | | | | |
MUNICIPAL BONDS - 98.3%
|
Alden-Conger Independent School District No 242, 3.00%, 02/01/2027 | | | $330,000 | | | $ 323,389 |
Alexandria Lake Area Sanitation District, 4.00%, 02/01/2036 | | | 150,000 | | | 152,132 |
Anoka-Hennepin Independent School District No 11
| | | | | | |
4.00%, 02/01/2032 | | | 320,000 | | | 329,378 |
3.00%, 02/01/2043 | | | 500,000 | | | 420,013 |
Bold Independent School District No 2534, 5.00%, 02/01/2044 | | | 200,000 | | | 219,796 |
City of Apple Valley MN, 4.00%, 09/01/2041 | | | 290,000 | | | 265,928 |
City of Carver MN, 3.00%, 02/01/2032 | | | 195,000 | | | 185,019 |
City of Center City MN
| | | | | | |
4.00%, 11/01/2027 | | | 135,000 | | | 135,916 |
4.50%, 11/01/2034 | | | 100,000 | | | 100,115 |
City of Chaska MN Electric Revenue, 5.00%, 10/01/2025 | | | 140,000 | | | 143,100 |
City of Coon Rapids MN, 2.50%, 02/01/2036 | | | 100,000 | | | 85,148 |
City of Delano MN, 5.00%, 02/01/2038 | | | 250,000 | | | 276,858 |
City of Elk River MN Electric Revenue, 3.00%, 08/01/2032 | | | 365,000 | | | 347,039 |
City of Hanover MN, 3.30%, 02/01/2037 | | | 100,000 | | | 91,738 |
City of Hutchinson MN, 2.00%, 02/01/2034 | | | 300,000 | | | 244,854 |
City of Madelia MN, 2.00%, 02/01/2033 | | | 115,000 | | | 97,999 |
City of Minneapolis MN
| | | | | | |
5.00%, 11/15/2036 | | | 150,000 | | | 154,528 |
4.00%, 11/15/2040 | | | 175,000 | | | 172,522 |
City of New Prague MN, 4.00%, 02/01/2037 | | | 315,000 | | | 328,615 |
City of Richfield MN, 4.00%, 02/01/2027 | | | 100,000 | | | 101,949 |
City of Rochester MN, 5.00%, 02/01/2040 | | | 150,000 | | | 168,901 |
City of Rosemount MN, 5.00%, 02/01/2037 | | | 250,000 | | | 280,286 |
City of St Cloud MN, 2.00%, 02/01/2034 | | | 200,000 | | | 163,236 |
City of St Paul MN, 2.00%, 05/01/2033 | | | 300,000 | | | 248,515 |
City of St Paul MN Sales & Use Tax Revenue, 5.00%, 11/01/2026 | | | 100,000 | | | 100,523 |
City of Wayzata MN, 3.00%, 12/01/2027 | | | 100,000 | | | 97,438 |
County of Beltrami MN, 4.00%, 12/01/2042 | | | 250,000 | | | 255,315 |
County of Carlton MN, 5.00%, 02/01/2042 | | | 250,000 | | | 278,427 |
County of Itasca MN, 4.00%, 02/01/2044 | | | 200,000 | | | 200,002 |
County of Koochiching MN, 5.00%, 02/01/2035 | | | 300,000 | | | 335,356 |
County of Pennington MN, 2.38%, 02/01/2035 | | | 100,000 | | | 84,907 |
County of St Louis MN, 2.00%, 12/01/2035 | | | 350,000 | | | 277,721 |
County of Wright MN
| | | | | | |
3.00%, 12/01/2038 | | | 295,000 | | | 256,924 |
3.00%, 12/01/2039 | | | 250,000 | | | 216,873 |
Crookston Independent School District No 593, 5.00%, 02/01/2029 | | | 250,000 | | | 270,238 |
Dakota County Community Development Agency, 2.00%, 01/01/2032 | | | 65,000 | | | 55,933 |
Duluth Independent School District No 709, 0.00%, 02/01/2031(a) | | | 200,000 | | | 147,338 |
Eastern Carver County Schools Independent School District No 112,
4.00%, 02/01/2035 | | | 250,000 | | | 259,488 |
Elk River Independent School District No 728, 4.00%, 02/01/2026 | | | 125,000 | | | 126,702 |
Fergus Falls Independent School District No 544, 3.00%, 02/01/2037 | | | 225,000 | | | 195,281 |
Forest Lake Independent School District No 831, 4.00%, 02/01/2039 | | | 500,000 | | | 510,787 |
Hibbing Independent School District No 701, 3.00%, 03/01/2033 | | | 300,000 | | | 285,945 |
| | | | | | | |
The accompanying notes are an integral part of these financial statements.
TABLE OF CONTENTS
Mairs & Power Minnesota Municipal Bond ETF
Schedule of Investments
as of June 30, 2024 (Unaudited)
| | | | | | | |
MUNICIPAL BONDS - (Continued)
|
Housing & Redevelopment Authority of The City of St Paul Minnesota
| | | | | | |
3.50%, 09/01/2026 | | | $95,000 | | | $ 93,440 |
4.00%, 10/01/2032 | | | 75,000 | | | 75,702 |
3.13%, 11/15/2032 | | | 110,000 | | | 100,834 |
4.00%, 10/01/2037 | | | 250,000 | | | 250,088 |
Iron Range Resources & Rehabilitation Commissioner, 5.00%, 10/01/2035 | | | 220,000 | | | 254,607 |
Mankato Independent School District No 77, 5.00%, 02/01/2026 | | | 200,000 | | | 205,695 |
Metropolitan Council
| | | | | | |
5.00%, 03/01/2026 | | | 100,000 | | | 103,035 |
5.00%, 12/01/2028 | | | 100,000 | | | 108,193 |
4.00%, 03/01/2030 | | | 140,000 | | | 143,108 |
Minneapolis-St Paul Metropolitan Airports Commission
| | | | | | |
5.00%, 01/01/2029 | | | 220,000 | | | 228,962 |
5.00%, 01/01/2029 | | | 50,000 | | | 52,037 |
5.00%, 01/01/2032 | | | 75,000 | | | 78,140 |
5.00%, 01/01/2052 | | | 25,000 | | | 26,572 |
Minnesota Agricultural & Economic Development Board, 5.00%, 01/01/2042 | | | 250,000 | | | 273,695 |
Minnesota Higher Education Facilities Authority
| | | | | | |
3.00%, 10/01/2036 | | | 200,000 | | | 179,807 |
3.00%, 10/01/2041 | | | 400,000 | | | 341,277 |
3.00%, 03/01/2043 | | | 125,000 | | | 103,382 |
Minnesota Municipal Power Agency, 5.00%, 10/01/2047 | | | 85,000 | | | 85,798 |
Minnesota State Colleges And Universities Foundation, 4.00%, 10/01/2029 | | | 200,000 | | | 200,076 |
Minnetonka Independent School District No 276, 3.00%, 07/01/2036 | | | 150,000 | | | 139,282 |
North St Paul-Maplewood-Oakdale Independent School District No 622,
2.00%, 02/01/2031 | | | 200,000 | | | 173,320 |
Northfield Independent School District No 659, 5.00%, 02/01/2025 | | | 230,000 | | | 232,126 |
Owatonna Independent School District No 761/MN, 4.00%, 02/01/2028 | | | 150,000 | | | 153,941 |
Pelican Rapids Independent School District No 548, 2.15%, 02/01/2031 | | | 50,000 | | | 46,318 |
Pine City Independent School District No 578, 2.00%, 04/01/2032 | | | 200,000 | | | 172,692 |
Princeton Public Utilities Commission, 5.00%, 04/01/2031 | | | 100,000 | | | 108,727 |
Rochester Independent School District No 535, 2.50%, 02/01/2039 | | | 250,000 | | | 197,962 |
Rocori Area Schools Independent School District No 750, 4.00%, 02/01/2038 | | | 300,000 | | | 304,383 |
Rosemount-Apple Valley-Eagan Independent School District No 196
| | | | | | |
5.00%, 04/01/2025 | | | 250,000 | | | 252,679 |
1.30%, 04/01/2030 | | | 150,000 | | | 128,061 |
Southern Plains Education Cooperative No 915, 3.00%, 02/01/2026 | | | 200,000 | | | 197,136 |
St Cloud Housing & Redevelopment Authority
| | | | | | |
2.00%, 02/01/2031 | | | 130,000 | | | 115,335 |
2.00%, 02/01/2033 | | | 160,000 | | | 136,347 |
St Cloud Independent School District No 742/MN, 5.00%, 02/01/2041 | | | 225,000 | | | 242,006 |
St Francis Independent School District No 15, 4.00%, 02/01/2036 | | | 150,000 | | | 157,112 |
St Paul Independent School District No 625
| | | | | | |
3.00%, 02/01/2033 | | | 200,000 | | | 193,461 |
2.25%, 02/01/2035 | | | 100,000 | | | 83,031 |
5.00%, 02/01/2042 | | | 200,000 | | | 222,976 |
| | | | | | | |
The accompanying notes are an integral part of these financial statements.
TABLE OF CONTENTS
Mairs & Power Minnesota Municipal Bond ETF
Schedule of Investments
as of June 30, 2024 (Unaudited)
| | | | | | | |
MUNICIPAL BONDS - (Continued)
|
State of Minnesota
| | | | | | |
5.00%, 08/01/2024 | | | $265,000 | | | $ 265,257 |
5.00%, 08/01/2027 | | | 190,000 | | | 190,250 |
5.00%, 08/01/2028 | | | 155,000 | | | 166,792 |
5.00%, 08/01/2034 | | | 250,000 | | | 266,449 |
5.00%, 08/01/2040 | | | 295,000 | | | 321,815 |
5.00%, 08/01/2043 | | | 400,000 | | | 447,182 |
Stillwater Independent School District No 834, 5.00%, 02/01/2040 | | | 250,000 | | | 276,295 |
University of Minnesota
| | | | | | |
5.00%, 12/01/2024 | | | 90,000 | | | 90,577 |
5.00%, 10/01/2026 | | | 220,000 | | | 228,778 |
5.00%, 04/01/2040 | | | 150,000 | | | 160,004 |
Waconia Independent School District No 110, 3.00%, 02/01/2028 | | | 100,000 | | | 96,742 |
Western Minnesota Municipal Power Agency
| | | | | | |
5.00%, 01/01/2025 | | | 120,000 | | | 120,951 |
5.00%, 01/01/2049 | | | 100,000 | | | 102,793 |
Westonka Independent School District No 277, 4.00%, 02/01/2041 | | | 100,000 | | | 100,443 |
Zumbro Education District
| | | | | | |
4.00%, 02/01/2034 | | | 125,000 | | | 120,597 |
4.00%, 02/01/2038 | | | 275,000 | | | 258,154 |
TOTAL MUNICIPAL BONDS
(Cost $19,649,630) | | | | | | 18,366,594 |
| | | Shares | | | |
SHORT-TERM INVESTMENTS - 3.4%
| | | | | | |
Money Market Funds - 3.4%
| | | | | | |
First American Government Obligations Fund - Class X, 5.23%(b) | | | 643,194 | | | 643,194 |
TOTAL SHORT-TERM INVESTMENTS
(Cost $643,194) | | | | | | 643,194 |
TOTAL INVESTMENTS - 101.7%
(Cost $20,292,824) | | | | | | $19,009,788 |
Liabilities in Excess of Other Assets - (1.7)% | | | | | | (320,109) |
TOTAL NET ASSETS - 100.0% | | | | | | $18,689,679 |
| | | | | | | |
Percentages are stated as a percent of net assets.
(a)
| Zero coupon bonds make no periodic interest payments.
|
(b)
| The rate shown represents the 7-day effective yield as of June 30, 2024. |
The accompanying notes are an integral part of these financial statements.
TABLE OF CONTENTS
STATEMENTS OF ASSETS AND LIABILITIES
June 30, 2024 (Unaudited)
| | | | | | | | | | | | | |
ASSETS
| | | | | | | | | | | | |
Investments, at fair value (Note 1)*: | | | $5,558,131,711 | | | $761,219,294 | | | $311,997,521 | | | $19,009,788 |
Receivable for Fund shares sold | | | 2,219,529 | | | 885,119 | | | 66,927 | | | — |
Receivable for securities sold | | | — | | | — | | | 324,345 | | | — |
Dividends and interest receivable | | | 5,949,243 | | | 3,976,270 | | | 65,545 | | | 254,032 |
Receivable from Adviser | | | — | | | — | | | — | | | 2,428 |
Prepaid expenses and other assets | | | 36,297 | | | 18,098 | | | 21,815 | | | — |
| | | 5,566,336,780 | | | 766,098,781 | | | 312,476,153 | | | 19,266,248 |
LIABILITIES
| | | | | | | | | | | | |
Payable for Fund shares redeemed | | | 368,664 | | | 403,241 | | | 26,885 | | | — |
Payable for securities purchased | | | — | | | 741,113 | | | 320,292 | | | 576,569 |
Payable to Affiliates (Note 6) | | | 278,402 | | | 63,207 | | | 28,188 | | | — |
Payable to ReFlow (Note 10) | | | 1,480,168 | | | 272,310 | | | 65,635 | | | — |
Accrued investment management fees (Note 4) | | | 2,419,314 | | | 364,782 | | | 198,269 | | | — |
Accrued audit and tax fees | | | 8,194 | | | 8,747 | | | 8,199 | | | — |
Other accrued fees | | | 94,521 | | | 23,634 | | | 23,619 | | | — |
| | | 4,649,263 | | | 1,877,034 | | | 671,087 | | | 576,569 |
NET ASSETS | | | $5,561,687,517 | | | $764,221,747 | | | $311,805,066 | | | $18,689,679 |
Net Assets Consists of:
| | | | | | | | | | | | |
Paid-in capital | | | $1,941,890,671 | | | $465,981,179 | | | $193,845,183 | | | $850 |
Additional paid-in capital | | | — | | | — | | | — | | | 21,026,638 |
Total distributable earnings/(accumulated loss) | | | 3,619,796,846 | | | 298,240,568 | | | 117,959,883 | | | (2,337,809) |
Total net assets | | | $5,561,687,517 | | | $764,221,747 | | | $311,805,066 | | | $18,689,679 |
Fund shares, par value | | | $0.01 | | | $0.01 | | | $0.01 | | | $0.001 |
Authorized | | | unlimited | | | unlimited | | | unlimited | | | unlimited |
Fund shares issued and outstanding | | | 33,205,380 | | | 7,199,108 | | | 10,466,508 | | | 850,000 |
Net asset value per share | | | $167.49 | | | $106.16 | | | $29.79 | | | $21.99 |
* Cost of investments | | | $2,505,662,142 | | | $556,534,414 | | | $225,901,845 | | | $20,292,824 |
| | | | | | | | | | | | | |
See accompanying Notes to Financial Statements.
TABLE OF CONTENTS
STATEMENTS OF OPERATIONS
June 30, 2024 (Unaudited)
| | | | | | | | | | | | | |
INVESTMENT INCOME
| | | | | | | | | | | | |
Income:
| | | | | | | | | | | | |
Dividends* | | | $42,012,317 | | | $4,373,179 | | | $1,737,693 | | | $— |
Interest income | | | 330,362 | | | 6,363,898 | | | 18,466 | | | 257,967 |
TOTAL INCOME | | | 42,342,679 | | | 10,737,077 | | | 1,756,159 | | | 257,967 |
EXPENSES:
| | | | | | | | | | | | |
Investment management fees (Note 4) | | | 14,423,452 | | | 2,305,439 | | | 1,265,574 | | | 23,332 |
Transfer agent fees (Note 6) | | | 759,672 | | | 133,918 | | | 81,676 | | | — |
Fund administration fees (Note 6) | | | 379,998 | | | 67,064 | | | 30,890 | | | — |
Fund accounting fees (Note 6) | | | 251,946 | | | 56,744 | | | 17,684 | | | — |
ReFlow fees (Note 10) | | | 172,140 | | | 49,632 | | | 26,280 | | | — |
Custodian fees (Note 6) | | | 127,762 | | | 21,762 | | | 9,898 | | | — |
Printing and mailing fees | | | 54,838 | | | 12,988 | | | 8,324 | | | — |
Legal and audit fees | | | 22,032 | | | 16,776 | | | 16,164 | | | — |
Trustees’ fees | | | 13,426 | | | 13,426 | | | 13,426 | | | — |
Chief Compliance Officer fees (Note 6) | | | 5,638 | | | 5,638 | | | 5,638 | | | — |
Other fees | | | 49,708 | | | 21,120 | | | 18,374 | | | — |
TOTAL EXPENSES | | | 16,260,612 | | | 2,704,507 | | | 1,493,928 | | | 23,332 |
Less: Waivers by Adviser (Note 4) | | | (4,492) | | | (14,952) | | | (16,414) | | | — |
NET EXPENSES | | | 16,256,120 | | | 2,689,555 | | | 1,477,514 | | | 23,332 |
NET INVESTMENT INCOME | | | 26,086,559 | | | 8,047,522 | | | 278,645 | | | 234,635 |
REALIZED AND UNREALIZED GAIN
(LOSS) (Note 3)
|
Net realized gain (loss) on investments | | | 125,803,838 | | | 639,798 | | | 3,624,811 | | | (263,918) |
Redemptions in-kind (Note 8, 10) | | | 112,039,122 | | | 31,032,326 | | | 10,967,657 | | | — |
| | | 237,842,960 | | | 31,672,124 | | | 14,592,468 | | | (263,918) |
Change in net unrealized appreciation/
depreciation on investments | | | 444,016,108 | | | 1,511,842 | | | (8,138,290) | | | (221,680) |
NET GAIN (LOSS) ON INVESTMENTS | | | 681,859,068 | | | 33,183,966 | | | 6,454,178 | | | (485,598) |
NET INCREASE (DECREASE) IN NET ASSETS FROM OPERATIONS | | | $707,945,627 | | | $41,231,488 | | | $6,732,823 | | | $(250,963) |
* Net of foreign taxes and fees withheld of: | | | $677,733 | | | $63,173 | | | $— | | | $— |
| | | | | | | | | | | | | |
See accompanying Notes to Financial Statements.
TABLE OF CONTENTS
Mairs & Power Growth Fund
STATEMENTS OF CHANGES IN NET ASSETS
| | | | | | | |
OPERATIONS
| | | | | | |
Net investment income | | | $26,086,559 | | | $41,537,892 |
Net realized gain on investments sold | | | 237,842,960 | | | 375,703,830 |
Net change in unrealized appreciation/depreciation of investments | | | 444,016,108 | | | 727,255,104 |
NET INCREASE IN NET ASSETS FROM OPERATIONS | | | 707,945,627 | | | 1,144,496,826 |
DISTRIBUTIONS TO SHAREHOLDERS | | | (24,350,445) | | | (116,601,518) |
|
CAPITAL TRANSACTIONS
| | | | | | |
Proceeds from shares sold | | | 187,359,801 | | | 396,029,979 |
Reinvestment of distributions | | | 22,405,286 | | | 107,928,239 |
Cost of shares redeemed(1) | | | (351,240,319) | | | (848,771,623) |
DECREASE IN NET ASSETS FROM CAPITAL TRANSACTIONS | | | (141,475,232) | | | (344,813,405) |
TOTAL INCREASE IN NET ASSETS: | | | 542,119,950 | | | 683,081,903 |
|
NET ASSETS
| | | | | | |
Beginning of period/year | | | 5,019,567,567 | | | 4,336,485,664 |
End of period/year | | | $5,561,687,517 | | | $5,019,567,567 |
|
FUND SHARE TRANSACTIONS
| | | | | | |
Shares sold | | | 1,188,147 | | | 2,989,298 |
Shares issued for reinvested distributions | | | 133,859 | | | 750,132 |
Shares redeemed | | | (2,227,948) | | | (6,379,102) |
NET DECREASE IN FUND SHARES | | | (905,942) | | | (2,639,672) |
| | | | | | | |
(1)
| Includes redemption in-kind transactions. See additional information contained in Note 10. |
See accompanying Notes to Financial Statements.
TABLE OF CONTENTS
Mairs & Power Balanced Fund
STATEMENTS OF CHANGES IN NET ASSETS
| | | | | | | |
OPERATIONS
| | | | | | |
Net investment income | | | $8,047,522 | | | $16,001,964 |
Net realized gain on investments sold | | | 31,672,124 | | | 67,987,343 |
Net change in unrealized appreciation/depreciation of investments | | | 1,511,842 | | | 12,287,382 |
NET INCREASE IN NET ASSETS FROM OPERATIONS | | | 41,231,488 | | | 96,276,689 |
DISTRIBUTIONS TO SHAREHOLDERS | | | (7,730,303) | | | (28,567,755) |
|
CAPITAL TRANSACTIONS
| | | | | | |
Proceeds from shares sold | | | 46,933,922 | | | 90,864,435 |
Reinvestment of distributions | | | 7,343,285 | | | 27,590,465 |
Cost of shares redeemed(1) | | | (103,608,164) | | | (186,959,398) |
DECREASE IN NET ASSETS FROM CAPITAL TRANSACTIONS | | | (49,330,957) | | | (68,504,498) |
TOTAL DECREASE IN NET ASSETS: | | | (15,829,772) | | | (795,564) |
|
NET ASSETS
| | | | | | |
Beginning of period/year | | | 780,051,519 | | | 780,847,083 |
End of period/year | | | $764,221,747 | | | $780,051,519 |
|
FUND SHARE TRANSACTIONS
| | | | | | |
Shares sold | | | 449,839 | | | 942,266 |
Shares issued for reinvested distributions | | | 68,951 | | | 280,748 |
Shares redeemed | | | (993,611) | | | (1,939,662) |
NET DECREASE IN FUND SHARES | | | (474,821) | | | (716,648) |
| | | | | | | |
(1)
| Includes redemption in-kind transactions. See additional information contained in Note 10. |
See accompanying Notes to Financial Statements.
TABLE OF CONTENTS
Mairs & Power Small Cap Fund
STATEMENTS OF CHANGES IN NET ASSETS
| | | | | | | |
OPERATIONS
| | | | | | |
Net investment income | | | $278,645 | | | $543,198 |
Net realized gain on investments sold | | | 14,592,468 | | | 18,060,116 |
Net change in unrealized appreciation/depreciation of investments | | | (8,138,290) | | | 14,438,137 |
NET INCREASE IN NET ASSETS FROM OPERATIONS | | | 6,732,823 | | | 33,041,451 |
DISTRIBUTIONS TO SHAREHOLDERS | | | — | | | (2,235,597) |
|
CAPITAL TRANSACTIONS
| | | | | | |
Proceeds from shares sold | | | 21,595,537 | | | 39,771,850 |
Reinvestment of distributions | | | — | | | 2,154,894 |
Cost of shares redeemed(1)(2) | | | (48,015,669) | | | (78,441,654) |
DECREASE IN NET ASSETS FROM CAPITAL TRANSACTIONS | | | (26,420,132) | | | (36,514,910) |
TOTAL DECREASE IN NET ASSETS: | | | (19,687,309) | | | (5,709,056) |
|
NET ASSETS
| | | | | | |
Beginning of period/year | | | 331,492,375 | | | 337,201,431 |
End of period/year | | | $311,805,066 | | | $331,492,375 |
|
FUND SHARE TRANSACTIONS
| | | | | | |
Shares sold | | | 739,812 | | | 1,491,770 |
Shares issued for reinvested distributions | | | — | | | 74,901 |
Shares redeemed | | | (1,646,550) | | | (2,952,723) |
NET DECREASE IN FUND SHARES | | | (906,738) | | | (1,386,052) |
(1)Net of redemption fees of: | | | $2,172 | | | $2,980 |
| | | | | | | |
(2)
| Includes redemption in-kind transactions. See additional information contained in Note 10. |
See accompanying Notes to Financial Statements.
TABLE OF CONTENTS
Mairs & Power Minnesota Municpal Bond ETF
STATEMENTS OF CHANGES IN NET ASSETS
| | | | | | | |
OPERATIONS
| | | | | | |
Net investment income | | | $234,635 | | | $333,590 |
Net realized loss on investments sold | | | (263,918) | | | (433,270) |
Net change in unrealized appreciation/depreciation of investments | | | (221,680) | | | 1,027,136 |
NET INCREASE (DECREASE) IN NET ASSETS FROM OPERATIONS | | | (250,963) | | | 927,456 |
DISTRIBUTIONS TO SHAREHOLDERS | | | (220,713) | | | (335,643) |
|
CAPITAL TRANSACTIONS
| | | | | | |
Proceeds from shares sold | | | 2,001,445 | | | 881,401 |
Cost of shares redeemed | | | (1,311,264) | | | (443,918) |
Transaction fees (Note 7) | | | 3,878 | | | (1,472) |
INCREASE IN NET ASSETS FROM CAPITAL TRANSACTIONS | | | 694,059 | | | 436,011 |
TOTAL INCREASE IN NET ASSETS: | | | 222,383 | | | 1,027,824 |
|
NET ASSETS
| | | | | | |
Beginning of period/year | | | 18,467,296 | | | 17,439,472 |
End of period/year | | | $18,689,679 | | | $18,467,296 |
|
FUND SHARE TRANSACTIONS
| | | | | | |
Shares sold | | | 90,000 | | | 40,000 |
Shares redeemed | | | (60,000) | | | (20,000) |
NET INCREASE IN FUND SHARES | | | 30,000 | | | 20,000 |
| | | | | | | |
See accompanying Notes to Financial Statements.
TABLE OF CONTENTS
Mairs & Power Growth Fund
FINANCIAL HIGHLIGHTS
SELECTED DATA AND RATIOS (for a share outstanding throughout each year/period)
| | | | | | | |
Per Share
|
Net asset value, beginning of year/period | | | $147.15 | | | $118.00 | | | $162.55 | | | $136.08 | | | $127.22 | | | $106.45 |
Income from investmentoperations:
|
Net investment income | | | 0.78(3) | | | 1.18(3) | | | 1.02(3) | | | 0.87 | | | 1.48 | | | 1.59 |
Net realized and unrealized gain (loss) | | | 20.30 | | | 31.41 | | | (35.15) | | | 38.82 | | | 19.37 | | | 28.59 |
Total from investment operations | | | 21.08 | | | 32.59 | | | (34.13) | | | 39.69 | | | 20.85 | | | 30.18 |
Distributions to shareholders from:
|
Net investment income | | | (0.74) | | | (1.22) | | | (1.01) | | | (0.91) | | | (1.45) | | | (1.58) |
Net realized gains on investments sold | | | — | | | (2.22) | | | (9.41) | | | (12.31) | | | (10.54) | | | (7.83) |
Total distributions | | | (0.74) | | | (3.44) | | | (10.42) | | | (13.22) | | | (11.99) | | | (9.41) |
Net asset value, end of year/period | | | $167.49 | | | $147.15 | | | $118.00 | | | $162.55 | | | $136.08 | | | $127.22 |
Total investment return
(loss) | | | 14.32% | | | 27.70% | | | (21.07)% | | | 29.27% | | | 16.67% | | | 28.39% |
Net assets, end of year/period, in thousands | | | $5,561,688 | | | $5,019,568 | | | $4,336,486 | | | $5,950,161 | | | $4,858,189 | | | $4,633,937 |
Ratios/supplemental data:
|
Ratio of expenses to average net assets | | | 0.62% | | | 0.64% | | | 0.63% | | | 0.61% | | | 0.64% | | | 0.65% |
Ratio of net investment income to average net assets | | | 0.99 | | | 0.89 | | | 0.01 | | | 0.55 | | | 1.12(1) | | | 1.28 |
Portfolio turnover rate | | | 5.28(4) | | | 13.45(4) | | | 11.04(4) | | | 13.17 | | | 14.52 | | | 10.77 |
| | | | | | | | | | | | | | | | | | | |
(1)
| Ratio revised subsequent to the completion of the annual report dated December 31, 2020 to include immaterial reclass adjustments related to the Fund’s holding of real estate investment trusts. |
(2)
| For the six months ended June 30, 2024, all ratios have been annualized except total investment return and portfolio turnover. |
(3)
| Per share net investment income was calculated using average shares outstanding. |
(4)
| Excludes in-kind transactions associated with redemptions of the Fund. |
See accompanying Notes to Financial Statements.
TABLE OF CONTENTS
Mairs & Power Balanced Fund
FINANCIAL HIGHLIGHTS
SELECTED DATA AND RATIOS (for a share outstanding throughout each year/period)
| | | | | | | |
Per Share
|
Net asset value, beginning of year/period | | | $101.65 | | | $93.06 | | | $116.89 | | | $105.23 | | | $99.74 | | | $86.79 |
Income from investment operations:
|
Net investment income | | | 1.09(3) | | | 2.01(3) | | | 1.86(3) | | | 1.68 | | | 1.98 | | | 2.13 |
Net realized and unrealized gain (loss) | | | 4.48 | | | 10.28 | | | (19.21) | | | 17.42 | | | 8.10 | | | 15.39 |
Total from investment operations | | | 5.57 | | | 12.29 | | | (17.35) | | | 19.10 | | | 10.08 | | | 17.52 |
Distributions toshareholders from:
|
Net investment income | | | (1.06) | | | (2.07) | | | (1.86) | | | (1.68) | | | (1.99) | | | (2.12) |
Net realized gains on investments sold | | | — | | | (1.63) | | | (4.62) | | | (5.76) | | | (2.60) | | | (2.45) |
Total distributions | | | (1.06) | | | (3.70) | | | (6.48) | | | (7.44) | | | (4.59) | | | (4.57) |
Net asset value, end of year/period | | | $106.16 | | | $101.65 | | | $93.06 | | | $116.89 | | | $105.23 | | | $99.74 |
Total investment return
(loss) | | | 5.48% | | | 13.39% | | | (14.91)% | | | 18.30% | | | 10.44% | | | 20.32% |
Net assets, end of year/period, in thousands | | | $764,222 | | | $780,052 | | | $780,847 | | | $1,022,951 | | | $895,253 | | | $928,828 |
Ratios/supplemental data:
|
Ratio of expenses to average net assets | | | 0.70% | | | 0.71% | | | 0.69% | | | 0.69% | | | 0.71% | | | 0.71% |
Ratio of net investment income to average net assets | | | 2.09 | | | 2.08 | | | 1.81 | | | 1.45 | | | 2.01(1) | | | 2.22 |
Portfolio turnover rate | | | 5.77(4) | | | 11.74(4) | | | 9.68(4) | | | 13.00 | | | 15.96 | | | 13.60 |
| | | | | | | | | | | | | | | | | | | |
(1)
| Ratio revised subsequent to the completion of the annual report dated December 31, 2020 to include immaterial reclass adjustments related to the Fund’s holding of real estate investment trusts.
|
(2)
| For the six months ended June 30, 2024, all ratios have been annualized except total investment return and portfolio turnover. |
(3)
| Per share net investment income was calculated using average shares outstanding. |
(4)
| Excludes in-kind transactions associated with redemptions of the Fund. |
See accompanying Notes to Financial Statements.
TABLE OF CONTENTS
Mairs & Power Small Cap Fund
FINANCIAL HIGHLIGHTS
SELECTED DATA AND RATIOS (for a share outstanding throughout each year/period)
| | | | | | | |
Per Share
|
Net asset value, beginning of year/period | | | $29.15 | | | $26.43 | | | $32.69 | | | $28.15 | | | $26.41 | | | $22.48 |
Income from investment operations:
|
Net investment income | | | 0.03(5) | | | 0.05(5) | | | 0.05(5) | | | 0.01 | | | 0.19 | | | 0.13 |
Net realized and unrealized gain
(loss) | | | 0.61 | | | 2.87 | | | (4.59) | | | 7.25 | | | 2.13 | | | 4.62 |
Total from investment operations | | | 0.64 | | | 2.92 | | | (4.54) | | | 7.26 | | | 2.32 | | | 4.75 |
Distributions to shareholders from:
|
Net investment income | | | — | | | (0.06) | | | (0.05) | | | (0.01) | | | (0.17) | | | (0.11) |
Net realized gains on investments sold | | | — | | | (0.14) | | | (1.67) | | | (2.71) | | | (0.41) | | | (0.71) |
Redemption fees(1)(2) | | | 0.00 | | | 0.00 | | | 0.00 | | | 0.00 | | | 0.00 | | | 0.00 |
Total distributions | | | — | | | (0.20) | | | (1.72) | | | (2.72) | | | (0.58) | | | (0.82) |
Net asset value, end of year/period | | | $29.79 | | | $29.15 | | | $26.43 | | | $32.69 | | | $28.15 | | | $26.41 |
Total investment return
(loss) | | | 2.20% | | | 11.04% | | | (13.93)% | | | 26.00% | | | 8.78% | | | 21.13% |
Net assets, end of year/period, in thousands | | | $311,805 | | | $331,492 | | | $337,201 | | | $427,257 | | | $361,594 | | | $437,300 |
Ratios/supplemental data:
|
Ratio of net expenses to average net assets
| | | | | | | | | | | | | | | | | | |
Before waivers and reimbursements of expenses | | | 0.93% | | | 0.94% | | | 0.92% | | | 0.95% | | | 1.04% | | | 1.05% |
After waivers and reimbursements of expenses | | | 0.94 | | | 0.94 | | | 0.92 | | | 0.95 | | | 1.04 | | | 1.05 |
Ratio of net investment income to average net assets
| | | | | | | | | | | | | | | | | | |
Before waivers and reimbursements of expenses | | | 0.19 | | | 0.17 | | | 0.18 | | | 0.02 | | | 0.58(3) | | | 0.48 |
After waivers and reimbursements of expenses | | | 0.18 | | | 0.17 | | | 0.18 | | | 0.02 | | | 0.58(3) | | | 0.48 |
Portfolio turnover rate | | | 7.66(6) | | | 19.05(6) | | | 19.81(6) | | | 21.45 | | | 16.39 | | | 15.07 |
| | | | | | | | | | | | | | | | | | | |
(1)
| The Fund charges a 1.00% redemption fee on shares held 180 days or less. |
(2)
| Amount per share is less than $0.005. |
(3)
| Ratio revised subsequent to the completion of the annual report dated December 31, 2020 to include immaterial reclass adjustments related to the Fund’s holding of real estate investment trusts. |
(4)
| For the six months ended June 30, 2024, all ratios have been annualized except total investment return and portfolio turnover. |
(5)
| Per share net investment income was calculated using average shares outstanding. |
(6)
| Excludes in-kind transactions associated with redemptions of the Fund. |
See accompanying Notes to Financial Statements.
TABLE OF CONTENTS
Mairs & Power Minnesota Municipal Bond ETF
FINANCIAL HIGHLIGHTS
SELECTED DATA AND RATIOS (for a share outstanding throughout each year/period)
| | | | | | | | | | |
Per Share
|
Net asset value, beginning of year/period | | | $22.52 | | | $21.80 | | | $25.16 | | | $25.00 |
Income from investment operations:
|
Net investment income(2) | | | 0.28 | | | 0.40 | | | 0.29 | | | 0.18 |
Net realized and unrealized gain (loss) | | | (0.55) | | | 0.72 | | | (3.36) | | | 0.14 |
Total from investment operations | | | (0.27) | | | 1.12 | | | (3.07) | | | 0.32 |
Distributions to shareholders from:
|
Net investment income | | | (0.26) | | | (0.40) | | | (0.29) | | | (0.16) |
Total distributions | | | (0.26) | | | (0.40) | | | (0.29) | | | (0.16) |
Net asset value, end of year/period | | | $21.99 | | | $22.52 | | | $21.80 | | | $25.16 |
Total investment return, at NAV(3)(4) | | | (1.22)% | | | 5.26% | | | (12.20)% | | | 1.29% |
Total investment return, at Market(3)(4) | | | (1.41)% | | | 5.41% | | | (12.27)% | | | 1.32% |
Net assets, end of year/period, in thousands | | | $18,690 | | | $18,467 | | | $17,439 | | | $ 18,619 |
Ratios/supplemental data:
|
Ratio of expenses to average net assets(5) | | | 0.25% | | | 0.34%(6) | | | 0.39% | | | 0.39% |
Ratio of net investment income to average
net assets(5) | | | 2.51 | | | 1.85 | | | 1.33 | | | 0.88 |
Portfolio turnover rate(4)(7) | | | 21.27 | | | 26.84 | | | 17.81 | | | 2.54 |
| | | | | | | | | | | | | |
(1)
| The Fund commenced investment operations on March 11, 2021. |
(2)
| Per share net investment income was calculated using average shares outstanding. |
(3)
| Total return in the table represents the rate that the investor would have earned or lost on an investment in the Fund, assuming reinvestment of dividends. |
(4)
| Not annualized for periods less than one year. |
(5)
| Annualized for periods less than one year. |
(6)
| Effective September 1, 2023, the management fee was lowered to 0.25% from 0.39%. |
(7)
| Excludes in-kind transations associated with creations and redemptions of the Fund. |
See accompanying Notes to Financial Statements.
TABLE OF CONTENTS
NOTES TO THE FINANCIAL STATEMENTS
June 30, 2024 (Unaudited)
Note 1 – Organization
Trust for Professional Managers (the “Trust”) was organized as a Delaware statutory trust under a Declaration of Trust dated May 29, 2001. The Trust is registered under the Investment Company Act of 1940, as amended (the “1940 Act”), as an open-end, management investment company. The Mairs & Power Funds (the “Funds”) are comprised of the Mairs & Power Growth Fund (the “Growth Fund”), Mairs & Power Balanced Fund (the “Balanced Fund”), Mairs & Power Small Cap Fund (the “Small Cap Fund”) (collectively, the “Mutual Funds”) and the Mairs & Power Minnesota Municipal Bond ETF (the “Minnesota ETF”), each representing a distinct series with its own investment objective and policies within the Trust.
The investment objective of the Growth Fund is to provide shareholders with a diversified portfolio of common stocks, which have the potential for above-average, long-term appreciation. The investment objective of the Balanced Fund is to provide capital growth, current income and preservation of capital. The investment objective of the Small Cap Fund is to seek above-average, long-term appreciation.
Pursuant to three tax-free reorganizations that took place after the close of business on April 29, 2022 (each such transaction, a “Reorganization,” and collectively, the “Reorganizations”), the Growth Fund, the Balanced Fund and the Small Cap Fund are the successors to the Mairs & Power Growth Fund (the “Predecessor Growth Fund”), the Mairs & Power Balanced Fund (the “Predecessor Balanced Fund”) and the Mairs & Power Small Cap Fund (the “Predecessor Small Cap Fund,” and together with the Predecessor Growth Fund and the Predecessor Balanced Fund, the “Predecessor Funds”), respectively, each a series of Mairs & Power Funds Trust. Each Predecessor Fund was deemed to be the accounting survivor of its Reorganization for financial reporting purposes and as a result, the financial statements of each Mutual Fund reflect the operations of the corresponding Predecessor Fund for the period prior to April 29, 2022.
The Predecessor Growth Fund commenced operations on November 7, 1958. The Predecessor Balanced Fund commenced operations on January 10, 1961. The Predecessor Small Cap Fund commenced operations on August 11, 2011.
The Minnesota ETF is an actively-managed exchange-traded fund. The investment objective of the Minnesota ETF is to seek current income that is exempt from federal and Minnesota state income tax consistent with the preservation of capital. The Minnesota ETF commenced operations on March 11, 2021.
Costs incurred by the Funds in connection with the organization and the initial public offering of shares were paid by Mairs & Power, Inc. (the “Adviser”), the Funds’ investment adviser. The Trust may issue an unlimited number of shares of beneficial interest at par value of $0.001 for the Funds. The assets of the Funds are segregated, and a shareholder’s interest is limited to the fund in which shares are held.
The Funds are investment companies and accordingly follows the investment company accounting and reporting guidance of the Financial Accounting Standards Board (“FASB”) Accounting Standards Codification (“ASC”) Topic 946 “Financial Services – Investment Companies”.
Note 2 – Significant Accounting Policies
The following is a summary of significant accounting policies consistently followed by the Funds in the preparation of the financial statements. These policies are in conformity with generally accepted accounting principles in the United States of America (“GAAP”).
Investment Valuation
Each equity security owned by a Fund that is listed on a securities exchange, except for securities listed on the NASDAQ Stock Market LLC (“NASDAQ”), is valued at its last sale price on the exchange on the date as of which assets are valued. When the security is listed on more than one exchange, the Fund will use the price of the exchange that the Fund generally considers to be the principal exchange on which the stock is traded. Fund securities listed on NASDAQ will be valued at the NASDAQ Official Closing Price (“NOCP”), which may not necessarily represent the last sale price. If the NOCP is not available, such securities shall be valued at the last sale price on the day of valuation. If there has been no sale on such exchange or on NASDAQ on such day, the security is valued at (i) the mean between the most recent quoted bid and asked prices at the close of the exchange on such day or (ii) the latest sales price on the Composite Market for the day such security is being valued. “Composite Market” means a consolidation of the trade
TABLE OF CONTENTS
NOTES TO THE FINANCIAL STATEMENTS
June 30, 2024 (Unaudited)(Continued)
information provided by national securities and foreign exchanges and over-the- counter markets as published by an approved independent pricing service (a “Pricing Service”).
Debt securities, such as U.S. government securities, corporate securities, municipal securities and asset-backed and mortgage-backed securities, including short-term debt instruments having a maturity of 60 days or less, are valued at the mean in accordance with prices supplied by a Pricing Service. Pricing Services may use various valuation methodologies such as the mean between the bid and the asked prices, matrix pricing and other analytical pricing models as well as market transactions and dealer quotations. If a price is not available from a Pricing Service, the most recent quotation obtained from one or more broker-dealers known to follow the issue will be obtained. Quotations will be valued at the mean between the bid and the offer. In the absence of available quotations, the securities will be priced at fair value. Any discount or premium is accreted or amortized over the expected life of the respective security using the constant yield to maturity method. Pricing Services generally value debt securities assuming orderly transactions of an institutional round lot size, but such securities may be held or transactions may be conducted in such securities in smaller, odd lot sizes. Odd lots often trade at lower prices than institutional round lots.
Demand notes and repurchase agreements are valued at cost. If cost does not represent current market value the securities will be priced at fair value.
Redeemable securities issued by open-end, registered investment companies are valued at the net asset values (“NAVs”) of such companies for purchase and/or redemption orders placed on that day. If, on a particular day, a share of an investment company is not listed on NASDAQ, such security’s fair value will be determined.
When market quotations are not readily available, any security or other asset is valued at its fair value in accordance with Rule 2a-5 of the 1940 Act as determined under the Adviser’s fair value pricing procedures, subject to oversight by the Trust’s Board of Trustees (the “Board”). These fair value procedures will also be used to price a security when corporate events, events in the securities market or world events cause the Adviser to believe that a security’s last sale price may not reflect its actual fair market value. The intended effect of using fair value pricing procedures is to ensure that each Fund is accurately priced.
FASB ASC Topic 820, “Fair Value Measurements and Disclosures” (“ASC 820”), establishes an authoritative definition of fair value and sets out a hierarchy for measuring fair value. ASC 820 requires an entity to evaluate certain factors to determine whether there has been a significant decrease in volume and level of activity for the security such that recent transactions and quoted prices may not be determinative of fair value and further analysis and adjustment may be necessary to estimate fair value. ASC 820 also requires enhanced disclosure regarding the inputs and valuation techniques used to measure fair value in those instances as well as expanded disclosure of valuation levels for each class of investments. These inputs are summarized in the three broad levels listed below:
Level 1 –
| Quoted prices in active markets for identical securities. |
Level 2 –
| Other significant observable inputs (including quoted prices for similar securities, interest rates, prepayment speeds, credit risk, etc.). |
Level 3 –
| Significant unobservable inputs (including the Fund’s own assumptions in determining the fair value of investments). |
The inputs or methodology used for valuing securities are not necessarily an indication of the risk associated with investing in those securities. The following is a summary of the inputs used to value the Funds’ investments carried at fair value as of June 30, 2024:
| | | | | | | | | | | | | |
Level 1* | | | $5,558,131,711 | | | $493,563,764 | | | $311,997,521 | | | $643,194 |
Level 2** | | | — | | | 267,655,530 | | | — | | | 18,366,594 |
Level 3 | | | — | | | — | | | — | | | — |
Total | | | $5,558,131,711 | | | $761,219,294 | | | $311,997,521 | | | $19,009,788 |
| | | | | | | | | | | | | |
*
| All Level 1 investments are equity securities (common stocks and preferred stocks) and short-term investments. |
**
| All Level 2 investments are fixed income securities. |
TABLE OF CONTENTS
NOTES TO THE FINANCIAL STATEMENTS
June 30, 2024 (Unaudited)(Continued)
For detail of securities by major sector classification for the Funds, please refer to the Schedules of Investments. The Funds did not hold any Level 3 investments during the six months ended June 30, 2024.
The Funds did not hold any financial derivative instruments during the six months ended June 30, 2024.
Federal Income Taxes
The Funds intend to comply with the requirements of Subchapter M of the Internal Revenue Code of 1986 (the “Code”), as amended, necessary to qualify as a regulated investment company and to make the requisite distributions of income and capital gains to its shareholders sufficient to relieve it from all or substantially all federal income taxes. Therefore, no federal income tax provision has been provided.
The Funds’ federal income tax returns are subject to examination by the Internal Revenue Service (the “IRS”) for a period of three fiscal years after they are filed. State and local tax returns may be subject to examination for an additional fiscal year depending on the jurisdiction. As of and during the period ended December 31, 2023, the Funds did not have a liability for any unrecognized tax benefits.
The Funds recognize interest and penalties, if any, related to uncertain tax benefits as income tax expense in the Statements of Operations. During the year, the Funds did not incur any interest or penalties.
Distributions to Shareholders
In general, the Growth Fund will distribute any net investment income semiannually. The Balanced Fund will distribute any net investment income quarterly. The Small Cap Fund will distribute any net investment income at least annually. The Minnesota ETF will distribute any net investment income monthly. The Funds will distribute any net realized long- or short-term capital gains, if any, at least annually. Distributions from net realized gains for book purposes may include short-term capital gains. All short-term capital gains are included in ordinary income for tax purposes.
Distributions to shareholders are recorded on the ex-dividend date. The Funds may also pay a special distribution at the end of the calendar year to comply with federal tax requirements. Income and capital gain distributions may differ from GAAP, primarily due to timing differences in the recognition of income, gains and losses by the Funds. To the extent that these differences are attributable to permanent book and tax accounting differences, the components of net assets have been adjusted.
The Minnesota ETF intends to make distributions that are exempt from federal and Minnesota state income tax, in the form of exempt-interest dividends. However, some of the Minnesota ETF’s distributions other than exempt-interest dividends may be taxed as ordinary income or capital gains (or a combination). The Minnesota ETF may invest a portion of its assets in securities that generate income that is not exempt from federal income tax or Minnesota state income tax. Income exempt from federal income tax may be subject to state and local income tax. The federal income tax status of all distributions made by the Minnesota ETF for the preceding year will be reported annually to shareholders.
Use of Estimates
The preparation of financial statements in conformity with GAAP requires management to make estimates and assumptions that affect the reported amounts of assets and liabilities and disclosure of contingent assets and liabilities at the date of the financial statements and the reported amounts of revenues and expenses during the reporting period. Actual results could differ from those estimates.
Share Transactions
The NAV per share of a Fund is calculated by dividing the sum of the value of the securities held by the Fund, plus cash or other assets, minus all liabilities (including estimated accrued expenses) divided by the total number of shares outstanding for the Fund, rounded to the nearest cent. The Funds’ shares will not be priced on the days on which the New York Stock Exchange (“NYSE”) is closed for trading.
Expenses
Expenses associated with a specific fund in the Trust are charged to that fund. Common expenses are typically allocated evenly between the series of the Trust, or by other equitable means.
TABLE OF CONTENTS
NOTES TO THE FINANCIAL STATEMENTS
June 30, 2024 (Unaudited)(Continued)
Other
Investment transactions are recorded on the trade date. The Funds determine the gain or loss from investment transactions on the identified cost basis by comparing the cost of the security lot sold with the net sales proceeds. Any discount or premium on securities purchased are accreted or amortized over the expected life of the respective securities using the constant yield method. Dividend income, less foreign withholding tax, is recognized on the ex-dividend date and interest income is recognized on an accrual basis. Withholding taxes on foreign dividends and interest, net of any reclaims, have been provided for in accordance with the Funds’ understanding of the applicable country’s tax rules and rates.
Note 3 – Federal Tax Matters
Mutual Funds
At December 31, 2023, the Mutual Funds’ components of accumulated earnings (losses) on a tax basis were as follows:
| | | | | | | | | | |
Cost of investments | | | $2,407,786,979 | | | $572,740,255 | | | $238,366,281 |
Gross unrealized appreciation | | | $2,645,883,088 | | | $235,883,557 | | | $112,493,240 |
Gross unrealized depreciation | | | (37,429,627) | | | (32,711,525) | | | (19,133,639) |
Net unrealized appreciation | | | 2,608,453,461 | | | 203,172,032 | | | 93,359,601 |
Undistributed ordinary income | | | 651,937 | | | — | | | — |
Undistributed long-term capital gains | | | 53,329,948 | | | — | | | — |
Distributable earnings | | | 53,981,885 | | | — | | | — |
Other accumulated earnings | | | — | | | — | | | (301,170) |
Total distributable earnings | | | $2,662,435,346 | | | $203,172,032 | | | $93,058,431 |
| | | | | | | | | | |
The Mutual Funds’ tax character of distributions paid during the years ended December 31, 2023 and December 31, 2022 were as follows:
| | | | | | | | | | |
Ordinary income | | | $41,862,078 | | | $16,211,476 | | | $642,561 |
Long-term capital gains | | | 74,739,440 | | | 12,356,279 | | | 1,593,036 |
Total distributions paid | | | $116,601,518 | | | $28,567,755 | | | $ 2,235,597 |
| | | | | | | | | | |
| | | | | | | | | | |
Ordinary income | | | $35,434,587 | | | $15,541,461 | | | $565,335 |
Long-term capital gains | | | 323,569,156 | | | 37,460,751 | | | 20,298,445 |
Total distributions paid | | | $359,003,743 | | | $53,002,212 | | | $20,863,780 |
| | | | | | | | | | |
As of December 31, 2023, the Small Cap Fund had post-October losses of $301,170.
In addition, GAAP requires that certain components of net assets relating to permanent difference be reclassified between financial and tax reporting. The permanent differences primarily relate to utilization of earnings and profits distributed to shareholders on redemption of shares and distribution reclasses and securities redeemed in- kind. These
TABLE OF CONTENTS
NOTES TO THE FINANCIAL STATEMENTS
June 30, 2024 (Unaudited)(Continued)
reclassifications have no effect on net assets or net asset value per share. On the Statements of Assets and Liabilities, the following reclassifications were made for the year end ended December 31, 2023:
| | | | | | | |
Growth Fund | | | $(273,766,318) | | | $273,766,318 |
Balanced Fund | | | (61,567,351) | | | 61,567,351 |
Small Cap Fund | | | (18,168,629) | | | 18,168,629 |
| | | | | | | |
Minnesota ETF
As of December 31, 2023, the Minnesota ETF’s cost and unrealized on investments on a tax basis were as follows:
| | | | |
Cost of investments for tax purposes | | | $19,296,939 |
Gross tax unrealized appreciation | | | $177,169 |
Gross tax unrealized depreciation | | | (1,238,525) |
Net tax unrealized depreciation | | | $(1,061,356) |
| | | | |
As of November 30, 2023, the Minnesota ETF’s tax year end, the tax basis of distributable earnings/(accumulated losses) were as follows:
| | | | |
Undistributed ordinary income | | | $16,464 |
Other accumulated losses | | | (782,150) |
Unrealized depreciation on investments | | | (1,585,834) |
Total distributable earnings | | | $(2,351,520) |
| | | | |
At November 30, 2023, the Minnesota ETF had short-term and long-term capital losses of $(243,006) and $(539,144), respectively, which will be carried forward indefinitely to offset future realized capital gains. To the extent the Minnesota ETF realizes future net capital gains, taxable distributions to its shareholders will be first offset by any unused capital loss carryovers from the period ended November 30, 2023.
The Minnesota ETF’s tax character of distributions paid during the years ended November 30, 2023 and November 30, 2022 were as follows:
| | | | |
Ordinary income | | | $13,386 |
Tax-exempt income | | | 299,990 |
Long-term capital gains | | | — |
Total distributions paid | | | $313,376 |
| | | | |
| | | | |
Ordinary income | | | $2,453 |
Tax-exempt income | | | 223,112 |
Long-term capital gains | | | — |
Total distributions paid | | | $225,565 |
| | | | |
For the year ended December 31, 2023, the Minnesota ETF had no required reclassifications to certain components of net assets related financial and tax reporting.
TABLE OF CONTENTS
NOTES TO THE FINANCIAL STATEMENTS
June 30, 2024 (Unaudited)(Continued)
Note 4 – Investment Adviser
The Trust has an investment advisory agreement (the “Mutual Funds Agreement”) with the Adviser to furnish investment advisory services to the Mutual Funds. Under the terms of the Mutual Funds Agreement between the Trust, on behalf of each Mutual Fund, and the Adviser, the Adviser is paid a monthly fee on average daily net assets at the following annual rates for the Mutual Funds:
| | | | | | | | | | |
Up to $2.5 Billion | | | 0.60% | | | 0.60% | | | 0.80% |
Over $2.5 Billion | | | 0.50% | | | 0.60% | | | 0.80% |
| | | | | | | | | | |
Under the investment advisory agreement, the Adviser has agreed to reimburse the Growth Fund or Balanced Fund in the event that the total expenses incurred by either Fund in any fiscal year, excluding interest, taxes, brokerage commissions and extraordinary litigation costs, but including payments to the Adviser, shall exceed 1.50% of the first $30 million dollars and 1.00% of the balance of the average value of the net assets of the Fund during such fiscal year, based upon computations of such value made as of the close of business on the last valuation day of each month during such fiscal year. Any amounts waived or reimbursed by the Adviser pursuant to the investment advisory agreement may not be recouped.
The Adviser has also agreed to waive its management fees and/or reimburse expenses of the Growth Fund, Balanced Fund or Small Cap Fund for a period of two years following the closing of the Reorganizations, to the extent that Covered Expenses (defined below) accrued for the twelve months ending on the first anniversary of the closing of the Reorganizations and the twelve months ending on the second anniversary of the Reorganizations exceed $137,000, $72,000 and $62,500, respectively. Covered Expenses shall be limited to outside legal expenses, audit and tax expenses, trustees’ fees, insurance expenses, ICI membership fees, and chief compliance officer fees (Covered Expenses). For the six months ended June 30, 2024, covered expenses in the amount of $4,492, $14,952, and $16,414 were waived for the Growth Fund, Balanced Fund, and Small Cap Fund, respectively.
In addition, the Trust, on behalf of the Minnesota ETF, has entered into an investment advisory agreement (the “ETF Agreement”) with the Adviser to furnish investment advisory services to the Minnesota ETF. Pursuant to the ETF Agreement, the Minnesota ETF pays a unitary management fee to the Adviser, which is calculated daily and paid monthly, at an annual rate of 0.39% of the Minnesota ETF’s average daily net assets through August 31, 2023 and at annual rate of 0.25% thereafter. The Adviser has agreed to pay all expenses of the Minnesota ETF except the unitary management fee paid to the Adviser under the ETF Agreement, interest charges on any borrowings, dividends and other expenses on securities sold short, taxes, brokerage commissions and other expenses incurred in placing orders for the purchase and sale of securities and other investment instruments, acquired fund fees and expenses, accrued deferred tax liability, extraordinary expenses, distribution fees and expenses paid by the Minnesota ETF under any distribution plan adopted pursuant to Rule 12b-1 under the 1940 Act.
Note 5 – Distribution Agreement
Foreside Fund Services, LLC (the “Distributor”) serves as the Mutual Funds’ distributor pursuant to a Distribution Agreement and the Minnesota ETF’s distributor pursuant to an ETF Distributor Agreement. The Distributor receives compensation for the statutory underwriting services it provides to the Funds. The Distributor enters into agreements with certain broker-dealers and others that will allow those parties to be “Authorized Participants” and to subscribe for and redeem shares of the Minnesota ETF. With respect to the Minnesota ETF, the Distributor will not distribute shares in less than whole Creation Units and does not maintain a secondary market in shares.
Note 6 – Related Party Transactions
U.S. Bancorp Fund Services, LLC, doing business as U.S. Bank Global Fund Services (“Fund Services” or the “Administrator”), acts as the Funds’ administrator under a Fund Servicing Agreement. The Administrator prepares various federal and state regulatory filings, reports and returns for the Funds; prepares reports and materials to be supplied to the Trustees; monitors the activities of the Funds’ custodian, transfer agent and fund accountant; coordinates the preparation and payment of the Funds’ expenses; and reviews the Funds’ expense accruals. Fund Services also serves as the fund accountant and transfer agent to the Funds.
TABLE OF CONTENTS
NOTES TO THE FINANCIAL STATEMENTS
June 30, 2024 (Unaudited)(Continued)
U.S. Bank N.A. (the “Custodian”), an affiliate of Fund Services, serves as the Funds’ custodian pursuant to a Custody Agreement. The Trust’s Chief Compliance Officer is also an employee of Fund Services. Under the terms of the ETF Agreement, the Adviser pays the Minnesota ETF’s administrative, custody, transfer agency, accounting and Chief Compliance Officer fees. Expenses incurred by the Mutual Funds for the six months ended June 30, 2024, and owed as of June 30, 2024 are as follows:
| | | | | | | |
Mairs & Power Growth Fund | | | $379,998 | | | $92,007 |
Mairs & Power Balanced Fund | | | 67,064 | | | 19,942 |
Mairs & Power Small Cap Fund | | | 30,890 | | | 9,231 |
| | | | | | | |
| | | | | | | |
Mairs & Power Growth Fund | | | $251,946 | | | $62,290 |
Mairs & Power Balanced Fund | | | 56,744 | | | 17,785 |
Mairs & Power Small Cap Fun | | | 17,684 | | | 5,629 |
| | | | | | | |
| | | | | | | |
Mairs & Power Growth Fund | | | $394,422 | | | $92,397 |
Mairs & Power Balanced Fund | | | 57,144 | | | 17,073 |
Mairs & Power Small Cap Fund | | | 28,104 | | | 8,198 |
| | | | | | | |
(1)
| These amounts do not include sub-transfer agency fees, therefore they do not agree to the amounts referenced on the Statement of Operations. |
| | | | | | | |
Mairs & Power Growth Fund | | | $127,762 | | | $29,816 |
Mairs & Power Balanced Fund | | | 21,762 | | | 6,515 |
Mairs & Power Small Cap Fund | | | 9,898 | | | 3,240 |
| | | | | | | |
| | | | | | | |
Mairs & Power Growth Fund | | | $ 5,638 | | | $ 1,892 |
Mairs & Power Balanced Fund | | | 5,638 | | | 1,892 |
Mairs & Power Small Cap Fund | | | 5,638 | | | 1,890 |
| | | | | | | |
Certain officers of the Funds are also employees of Fund Services.
The Trust’s Chief Compliance Officer is also an employee of Fund Services.
Note 7 – Creation and Redemption Transactions
Shares of the Minnesota ETF are listed and traded on the Cboe BZX Exchange, Inc. (the “Exchange”). The Minnesota ETF issues and redeems shares on a continuous basis at NAV only in large blocks of shares called “Creation Units.” A Creation Unit generally consists of 10,000 shares though this may change from time to time. Creation Units are to be issued and redeemed principally in kind for a basket of securities and a balancing cash amount. Shares generally will trade in the secondary market in amounts less than a Creation Unit at market prices that change throughout the day. Market prices for the shares may be different from their NAV. The NAV is determined as of the close of trading (generally, 4:00 p.m. Eastern Time) on each day the NYSE is open for trading. The NAV of the shares of the Minnesota ETF will be equal to a Fund’s total assets minus a Fund’s total liabilities divided by the total number of shares outstanding. The NAV that is published will be rounded to the nearest cent; however, for purposes of determining the price of Creation Units, the NAV will be calculated to five decimal places.
Only “Authorized Participants” may purchase or redeem shares directly from the Minnesota ETF. An Authorized Participant is either (i) a broker-dealer or other participant in the clearing process through the Continuous Net Settlement System of National Securities Clearing Corporation or (ii) a DTC participant and, in each case, must have executed a Participant Agreement with the Distributor. Most retail investors will not qualify as Authorized Participants
TABLE OF CONTENTS
NOTES TO THE FINANCIAL STATEMENTS
June 30, 2024 (Unaudited)(Continued)
or have the resources to buy and sell whole Creation Units. Therefore, they will be unable to purchase or redeem the shares directly from the Minnesota ETF. Rather, most retail investors will purchase shares in the secondary market with the assistance of a broker and will be subject to customary brokerage commissions or fees. Securities received or delivered in connection with in-kind creates and redeems are valued as of the close of business on the effective date of the creation or redemption.
Creation Unit Transaction Fee
Authorized Participants will be required to pay to the Custodian a fixed transaction fee (the “Creation Transaction Fee”) in connection with the issuance of Creation Units. The standard Creation Transaction Fee will be the same regardless of the number of Creation Units purchased by an investor on the applicable Business Day. The Creation Transaction Fee for the Minnesota ETF is $300.
An additional variable fee of up to a maximum of 2% of the value of the Creation Units subject to the transaction may be imposed for cash purchases, non-standard orders, or partial purchase of Creation Units. For orders comprised entirely of cash, a variable fee of 0.03% of the value of the order will be charged by the Minnesota ETF. The variable charge is primarily designed to cover additional costs (e.g., brokerage, taxes) involved with buying the securities with cash. The Minnesota ETF may determine to not charge a variable fee on certain orders when the Adviser has determined that doing so is in the best interests of Fund shareholders.
A creation unit will generally not be issued until the transfer of good title of the deposit securities to the Minnesota ETF and the payment of any cash amounts have been completed. To the extent contemplated by the applicable participant agreement, Creation Units of the Minnesota ETF will be issued to such authorized participant notwithstanding the fact that the Minnesota ETF’s deposits have not been received in part or in whole, in reliance on the undertaking of the authorized participant to deliver the missing deposit securities as soon as possible. If the Minnesota ETF or its agents do not receive all of the deposit securities, or the required cash amounts, by such time, then the order may be deemed rejected and the authorized participant shall be liable to the Minnesota ETF for losses, if any.
Note 8 – Investment Transactions
Purchases and sales of investment securities, excluding government securities, short-term securities and temporary cash investments, during the six months ended June 30, 2024 were as follows:
| | | | | | | |
Growth Fund | | | $278,463,240 | | | $295,051,286(a) |
Balanced Fund | | | 44,041,113 | | | 53,283,830(a) |
Small Cap Fund | | | 24,411,769 | | | 35,017,236(a) |
Minnesota ETF | | | 4,136,699 | | | 3,843,097 |
| | | | | | | |
The Funds did not have any purchases or sales of government securities during the six months ended June 30, 2024.
(a)
| Sales exclude redemptions in-kind of $121,863,592, $38,202,435, and $15,561,650 for the Growth Fund, Balanced Fund and Small Cap Fund, respectively. See Note 10. |
Note 9 – Principal Risks of the Funds
As with all investment companies, shareholders of the Funds are subject to the risk that their investment could lose money. Each Fund is subject to its principal risks, any of which may adversely affect a Fund’s NAV, trading price, yield, total return and ability to meet its investment objective as applicable. A description of the principal risks of each Fund is included in the applicable prospectus under the heading “Principal Risks”.
Note 10 – ReFlow Transactions
The Mutual Funds may participate in the ReFlow Fund, LLC (“ReFlow”) liquidity program, which is designed to provide an alternative liquidity source for mutual funds experiencing net redemptions of their shares. Pursuant to the program, ReFlow provides participating mutual funds (including each Mutual Fund) with a source of cash to meet net shareholder redemptions by standing ready each business day to purchase Fund shares up to the value of the net shares redeemed by other shareholders that are to settle the next business day.
TABLE OF CONTENTS
NOTES TO THE FINANCIAL STATEMENTS
June 30, 2024 (Unaudited)(Continued)
Following purchases of a Fund’s shares, ReFlow then generally redeems those shares when the Fund experiences net sales, at the end of a maximum holding period determined by ReFlow (currently 8 days) or at other times at ReFlow’s or the Adviser’s discretion. While ReFlow holds a Fund’s shares, it will have the same rights and privileges with respect to those shares as any other shareholder. For use of the ReFlow service, a Fund pays a fee to ReFlow each time it purchases Fund shares, calculated by applying to the purchase amount a fee rate determined through an automated daily auction among participating mutual funds. The current minimum fee rate is 0.14% of the value of the Fund shares purchased by ReFlow, although a Fund may submit a bid at a higher fee rate if it determines that doing so is in the best interest of Fund shareholders. ReFlow’s purchases of a Fund’s shares through the liquidity program are made on an investment-blind basis without regard to a Fund’s objective, policies or anticipated performance. In accordance with federal securities laws, ReFlow is prohibited from acquiring more than 3% of the outstanding voting securities of a Fund. ReFlow will not be subject to the Funds’ investment minimums, the Small Cap Fund’s redemption fee, or the limitations noted in the “Frequent Purchases and Redemptions of Fund Shares” section within the Funds’ prospectus. ReFlow will periodically redeem its entire share position in a Fund and request that such redemption be met in-kind in accordance with the Funds’ redemption in-kind policies. The Board has approved the Funds’ use of the ReFlow program. The Adviser believes that the program may assist in stabilizing each Fund’s net assets, to the benefit of the Fund and its shareholders, although there is no guarantee that the program will do so. To the extent that the Funds’ assets do not decline, the Adviser may also benefit. ReFlow fees that were incurred by the Funds during the six months ended June 30, 2024 are recorded within the Statement of Operations, if applicable.
During the six months ended June 30, 2024 the Mutual Funds satisfied redemption in-kind requests made by Reflow. The transfers were effected in accordance with policies and procedures approved by the Board.
Consideration paid and shares sold were as follows:
| | | | | | | | | | |
Growth Fund | | | January 2024-June 2024 | | | $121,863,592 | | | 803,026 |
Balanced Fund | | | January 2024-June 2024 | | | 38,202,435 | | | 375,504 |
Small Cap Fund | | | January 2024-June 2024 | | | 15,561,650 | | | 580,936 |
| | | | | | | | | | |
Note 11 – Recent Market Events
U.S. and international markets have experienced and may continue to experience significant periods of volatility in recent years and months due to a number of economic, political and global macro factors including uncertainty regarding inflation and central banks’ interest rate increases, the possibility of a national or global recession, trade tensions, political events, the war between Russia and Ukraine, significant conflict between Israel and Hamas in the Middle East, and the impact of the coronavirus (COVID-19) global pandemic. The impact of COVID-19 may last for an extended period of time. As a result of continuing political tensions and armed conflicts, including the war between Ukraine and Russia, the U.S. and the European Union imposed sanctions on certain Russian individuals and companies, including certain financial institutions, and have limited certain exports and imports to and from Russia. The war has contributed to recent market volatility and may continue to do so. These developments, as well as other events, could result in further market volatility and negatively affect financial asset prices, the liquidity of certain securities and the normal operations of securities exchanges and other markets, despite government efforts to address market disruptions. Continuing market volatility as a result of recent market conditions or other events may have adverse effects on your account.
Note 12 – Beneficial Ownership
The beneficial ownership, either directly or indirectly, of more than 25% of the voting securities of a fund creates a presumption of control of a fund, under Section 2(a)(9) of the 1940 Act. At June 30, 2024, Charles Schwab & Co. Inc., for the benefit of its customers, held 37.28% of the outstanding shares of the Small Cap Fund.
TABLE OF CONTENTS
NOTES TO THE FINANCIAL STATEMENTS
June 30, 2024 (Unaudited)(Continued)
Note 13 – Subsequent Events
The Minnesota ETF paid distributions to shareholders as follows:
| | | | | | | | | | | | | |
7/25/2024 | | | 7/25/2024 | | | 7/31/2024 | | | $0.05447300 | | | $46,302 |
8/26/2024 | | | 8/26/2024 | | | 8/30/2024 | | | $0.04394444 | | | $41,308 |
| | | | | | | | | | | | | |
Other than as disclosed, there were no other subsequent events requiring recognition or disclosure through the date the financial statements were issued.
TABLE OF CONTENTS
Mairs & Power Growth Fund, established 1958
Mairs & Power Balanced Fund, established 1961
Mairs & Power Small Cap Fund, established 2011
Mairs & Power Minnesota Municipal Bond ETF, established 2021
To Contact the Mutual Funds
Call 1-800-304-7404
For the Minnesota ETF
Call 1-855-839-2800
For the Mutual Funds
Write to:
| | | | |
(via Regular Mail)
c/o U.S. Bancorp Fund Services, LLC
615 East Michigan Street
P. O. Box 701
Milwaukee, WI 53201-0701 | | | (via Overnight or Express Mail)
c/o U.S. Bancorp Fund Services, LLC
3rd Floor
615 East Michigan Street
Milwaukee, WI 53202-0701 |
| | | | |
For Fund literature and information, visit the Fund’s website at:
www.mairsandpower.com
Investment Manager
Mairs & Power, Inc.
30 East 7th Street
Suite 2500
Saint Paul, MN 55101
Custodian
U.S. Bank, N.A.
Custody Operations
1555 North River Center Drive, Suite 302
Milwaukee, WI 53212
Distributor
Foreside Fund Services, LLC
Three Canal Plaza, Suite 100
Portland, ME 04101
Independent Registered Public Accounting Firm
Cohen & Company, Ltd.
342 North Water Street, Suite 830
Milwaukee, WI 53202
This report is intended for shareholders of the Funds and may not be used as sales literature unless preceded or accompanied by a current prospectus.
Mairs & Power, Inc.
c/o U.S. Bancorp Fund Services, LLC
3rd Floor
615 East Michigan Street
Milwaukee, WI 53202-0701
| (b) | Financial Highlights are included within the financial statements filed under Item 7(a) of this Form. |
Item 8. Changes in and Disagreements with Accountants for Open-End Investment Companies.
There were no changes in or disagreements with accountants during the period covered by this report.
Item 9. Proxy Disclosure for Open-End Investment Companies
There were no matters submitted to a vote of shareholders during the period covered by this report.
Item 10. Remuneration Paid to Directors, Officers, and Others of Open-End Investment Companies.
This information is included within the financial statements filed under Item 7(a) of this Form.
Item 11. Statement Regarding Basis for Approval of Investment Advisory Contract.
Not applicable
Item 12. Disclosure of Proxy Voting Policies and Procedures for Closed-End Management Investment Companies.
Not applicable to open-end investment companies.
Item 13. Portfolio Managers of Closed-End Management Investment Companies.
Not applicable to open-end investment companies.
Item 14. Purchases of Equity Securities by Closed-End Management Investment Company and Affiliated Purchasers.
Not applicable to open-end investment companies.
Item 15. Submission of Matters to a Vote of Security Holders.
There have been no material changes to the procedures by which shareholders may recommend nominees to the registrant’s board of trustees.
Item 16. Controls and Procedures.
| (a) | The Registrant’s Principal Executive and Principal Financial Officer have reviewed the Registrant’s disclosure controls and procedures (as defined in Rule 30a-3(c) under the Investment Company Act of 1940 (the “Act”)) as of a date within 90 days of the filing of this report, as required by Rule 30a-3(b) under the Act and Rules 13a-15(b) or 15d-15(b) under the Securities Exchange Act of 1934. Based on their review, such officers have concluded that the disclosure controls and procedures are effective in ensuring that information required to be disclosed in this report is appropriately recorded, processed, summarized and reported and made known to them by others within the Registrant and by the Registrant’s service provider. |
| (b) | There were no changes in the Registrant’s internal control over financial reporting (as defined in Rule 30a-3(d) under the Act) that occurred during the period covered by this report that has materially affected, or is reasonably likely to materially affect, the Registrant’s internal control over financial reporting. |
Item 17. Disclosure of Securities Lending Activities for Closed-End Management Investment Companies
Not applicable to open-end investment companies.
Item 18. Recovery of Erroneously Awarded Compensation.
Not applicable
Item 19. Exhibits.
| (a) | (1) Any code of ethics or amendment thereto, that is the subject of the disclosure required by Item 2, to the extent that the registrant intends to satisfy Item 2 requirements through filing an exhibit. Not applicable. |
(2) Any policy required by the listing standards adopted pursuant to Rule 10D-1 under the Exchange Act (17 CFR 240.10D-1) by the registered national securities exchange or registered national securities association upon which the registrant's securities are listed. Not applicable.
(3) A separate certification for each principal executive officer and principal financial officer of the registrant as required by Rule 30a-2(a) under the Investment Company Act of 1940 (17 CFR 270.30a-2(a)). Filed herewith.
(4) Any written solicitation to purchase securities under Rule 23c-1 under the Act sent or given during the period covered by the report by or on behalf of the registrant to 10 or more persons. Not applicable.
(5) Change in the registrant’s independent public accountant. Provide the information called for by Item 4 of Form 8-K under the Exchange Act (17 CFR 249.308). Unless otherwise specified by Item 4, or related to and necessary for a complete understanding of information not previously disclosed, the information should relate to events occurring during the reporting period. Not applicable.
SIGNATURES
Pursuant to the requirements of the Securities Exchange Act of 1934 and the Investment Company Act of 1940, the registrant has duly caused this report to be signed on its behalf by the undersigned, thereunto duly authorized.
| | (Registrant) | Trust for Professional Managers | |
| | By (Signature and Title)* | /s/ John Buckel | |
| | | John Buckel, Principal Executive | |
Pursuant to the requirements of the Securities Exchange Act of 1934 and the Investment Company Act of 1940, this report has been signed below by the following persons on behalf of the registrant and in the capacities and on the dates indicated.
| | By (Signature and Title)* | /s/ John Buckel | |
| | | John Buckel, Principal Executive | |
| | | | |
| | By (Signature and Title)* | /s/ Jennifer Lima | |
| | | Jennifer Lima, Principal Financial Officer | |
* Print the name and title of each signing officer under his or her signature.