UNITED STATES
SECURITIES AND EXCHANGE COMMISSION
Washington, D.C. 20549
FORM N-CSR
CERTIFIED SHAREHOLDER REPORT OF REGISTERED
MANAGEMENT INVESTMENT COMPANIES
Investment Company Act file number 811-10401
Trust for Professional Managers
(Exact name of registrant as specified in charter)
615 East Michigan Street
Milwaukee, WI 53202
(Address of principal executive offices) (Zip code)
Jay Fitton
U.S. Bancorp Fund Services, LLC
615 East Michigan Street
Milwaukee, WI 53202
(Name and address of agent for service)
(513) 520-5925
Registrant’s telephone number, including area code
Date of fiscal year end: May 31, 2025
Date of reporting period: November 30, 2024
Item 1. Reports to Stockholders.
(a)
| | |
| Jensen Quality Growth ETF | |
JGRW (Principal U.S. Listing Exchange: NYSE Arca, Inc.NYSEArca) |
| Semi-Annual Shareholder Report | November 30, 2024 |
This semi-annual shareholder report contains important information about the Jensen Quality Growth ETF (the “Fund”) for the period of August 12, 2024 (commencement of operations) to November 30, 2024. You can find additional information about the Fund at https://www.jenseninvestment.com/reg-docs/. You can also request this information by contacting us at 1-800-992-4144.
WHAT WERE THE FUND COSTS FOR THE LAST SIX MONTHS? (based on a hypothetical $10,000 investment)1
| | |
Fund Name | Costs of a $10,000 investment | Costs paid as a percentage of a $10,000 investment |
| Jensen Quality Growth ETF | $18 | 0.57% |
| 1 | Costs included are for the period August 12, 2024 (commencement of operations) through November 30, 2024. Costs would be higher if the full six month period was included. |
HOW DID THE FUND PERFORM OVER THE LAST SIX MONTHS AND WHAT AFFECTED ITS PERFORMANCE?
For the period from August 12, 2024 (commencement of operations) to November 30, 2024, relative performance for the Jensen Quality Growth ETF was aided by overweight positions in the Information Technology and Industrials sectors and an underweight in the Energy sector. Stock selection benefited relative Fund performance in the Materials, Industrials and Health Care sectors. Relative performance was hindered by the Fund’s underweight positions in the Financials, Consumer Discretionary and Real Estate sectors and overweight positions in the Consumer Staples and Health Care sectors. Stock selection detracted from relative performance in the Consumer Discretionary, Consumer Staples, Financials, Information Technology and Communication Services sectors.
During the period, the Fund continued its high allocation to high-quality companies, defined as those rated A+, A and A- by the S&P Earnings and Dividend Quality Rankings. The Fund’s allocation to these highest-quality companies averaged 54.14% of Fund assets compared to 32.12% of the S&P 500 Index. This significant overweight to quality detracted from the Fund’s relative returns during the period, which we believe were driven by increased investor risk appetite following the reductions to the U.S. federal funds rate.
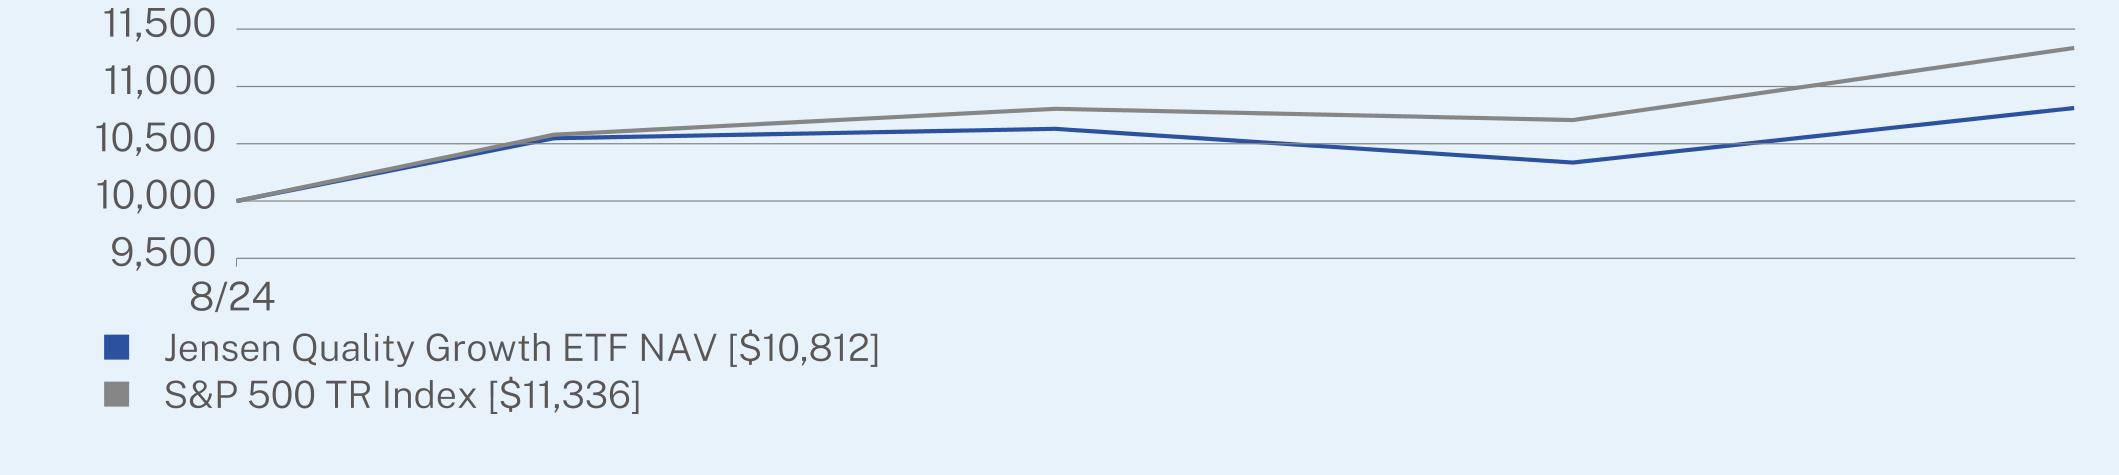
HOW DID THE FUND PERFORM SINCE INCEPTION?*
The $10,000 chart reflects a hypothetical $10,000 investment in the class of shares noted. The chart uses total return NAV performance and assumes reinvestment of dividends and capital gains. Fund expenses, including management fees and other expenses were deducted.
CUMULATIVE PERFORMANCE (Initial Investment of $10,000)
| Jensen Quality Growth ETF | PAGE 1 | TSR-SAR-89834G562 |
ANNUAL AVERAGE TOTAL RETURN (%)
| |
| | Since Inception
(08/12/2024) |
Jensen Quality Growth ETF NAV | 8.12 |
S&P 500 TR Index | 13.36 |
| * | The Fund’s past performance is not a good predictor of the Fund’s future performance. The returns do not reflect the deduction of taxes that a shareholder would pay on Fund distributions or redemption of Fund shares. |
KEY FUND STATISTICS (as of November 30, 2024)
| |
Net Assets | $68,326,974 |
Number of Holdings | 28 |
Portfolio Turnover | 10% |
Visit https://www.jenseninvestment.com/reg-docs/ for more recent performance information.
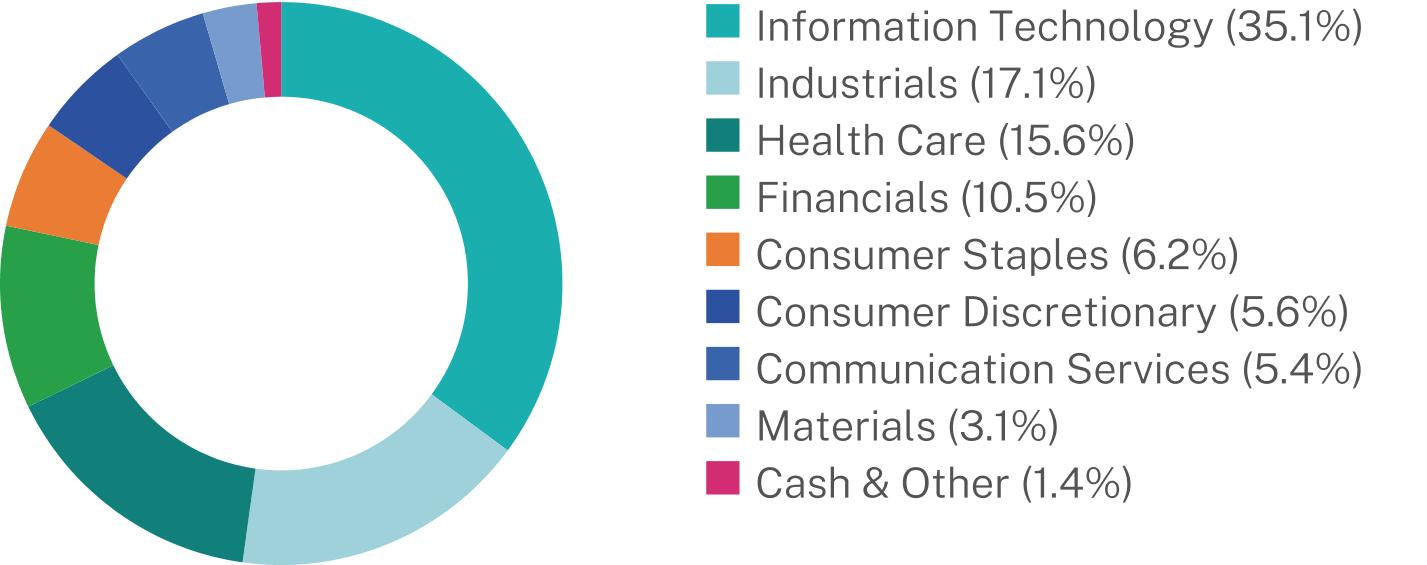
WHAT DID THE FUND INVEST IN? (% of net assets as of November 30, 2024)
| |
Top 10 Issuers | |
Apple, Inc. | 7.4% |
Microsoft Corp. | 7.2% |
Accenture PLC | 7.1% |
Marsh & McLennan Cos., Inc. | 6.1% |
Stryker Corp. | 6.0% |
Intuit, Inc. | 5.5% |
Alphabet, Inc. | 5.4% |
Mastercard, Inc. | 4.4% |
Automatic Data Processing, Inc. | 4.4% |
UnitedHealth Group, Inc. | 3.9% |
| * | The Global Industry Classification Standard (“GICS®”) was developed by and/or is the exclusive property of MSCI, Inc. (“MSCI”) and Standard & Poor’s Financial Services LLC (“S&P”). GICS® is a service mark of MSCI and S&P and has been licensed for use by U.S. Bank Global Fund Services. |
For additional information about the Fund, including its prospectus, financial information, holdings and proxy voting information, scan the QR code above or visit https://www.jenseninvestment.com/reg-docs/.
HOUSEHOLDING
To reduce Fund expenses, only one copy of most shareholder documents may be mailed to shareholders with multiple accounts at the same address (Householding). If you would prefer that your Fund documents not be householded, please contact the Fund at 1-800-992-4144, or contact your financial intermediary. Your instructions will typically be effective within 30 days of receipt by the Fund or your financial intermediary.
| Jensen Quality Growth ETF | PAGE 2 | TSR-SAR-89834G562 |
1000010812100001133635.117.115.610.56.25.65.43.11.4
| | |
| Jensen Global Quality Growth Fund | |
| Class I | JGQIX |
| Semi-Annual Shareholder Report | November 30, 2024 |
This semi-annual shareholder report contains important information about the Jensen Global Quality Growth Fund (the “Fund”) for the period of June 1, 2024 to November 30, 2024. You can find additional information about the Fund at https://www.jenseninvestment.com/reg-docs/. You can also request this information by contacting us at 1-800-992-4144. This report describes changes to the Fund that occurred during the reporting period.
WHAT WERE THE FUND COSTS FOR THE LAST SIX MONTHS? (based on a hypothetical $10,000 investment)
| | |
Class Name | Costs of a $10,000 investment | Costs paid as a percentage of a $10,000 investment |
| Class I | $53 | 1.02% |
HOW DID THE FUND PERFORM OVER THE LAST SIX MONTHS AND WHAT AFFECTED ITS PERFORMANCE?
For the six-month period ended November 30, 2024, relative performance of the Jensen Global Quality Growth Fund was aided by overweight positions in the Information Technology and Industrials sectors and no positions in the Utilities, Real Estate and Materials sectors. Relative performance was hindered by the Fund’s overweight positions in the Consumer Discretionary, Consumer Staples and Health Care sectors and underweight positions in the Financials and Energy sectors.
During the period, the Fund continued its high allocation to high-quality companies, defined as those rated A+, A and A- by the S&P Earnings and Dividend Quality Rankings. The Fund’s allocation to these highest-quality companies averaged 52.25% of Fund assets compared to 32.86% of the MSCI ACWI Net Total Return Index. This significant overweight to quality detracted from the Fund’s relative returns during the period, which we believe were driven by increased investor risk appetite following the reductions to the U.S. federal funds rate.
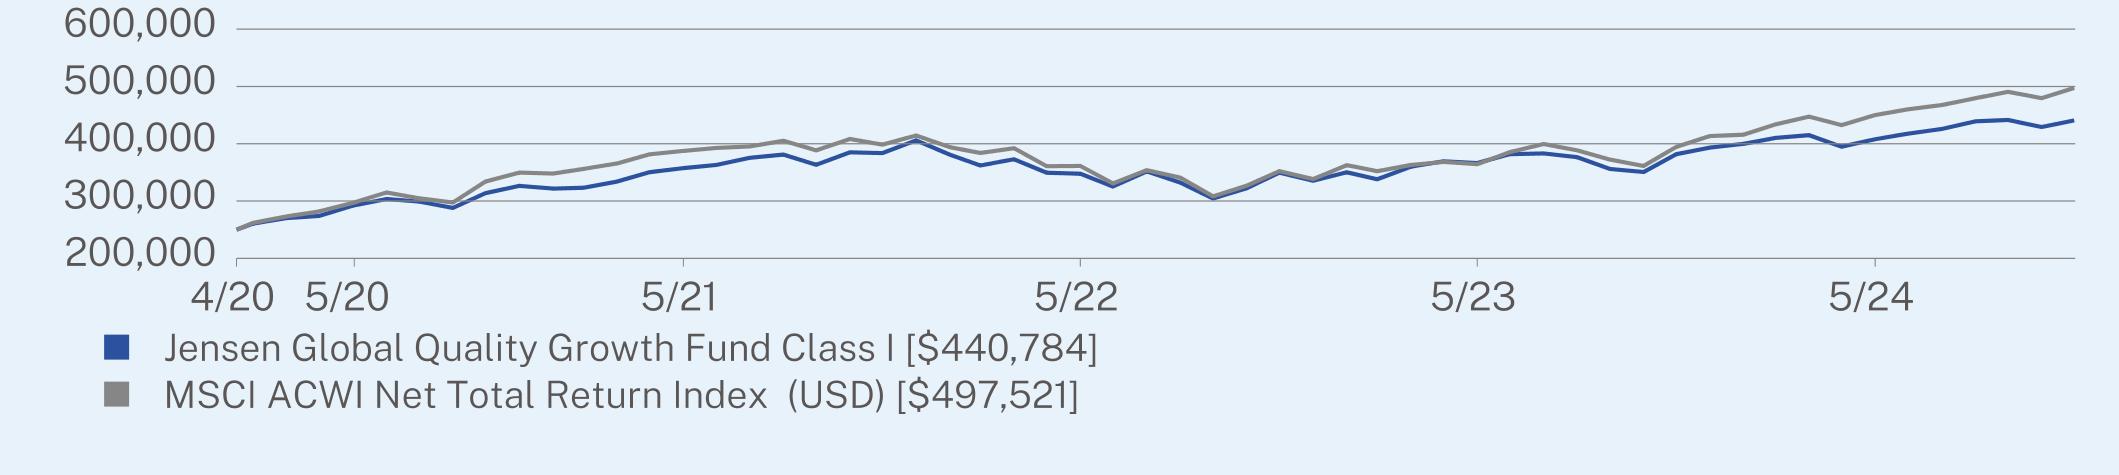
HOW DID THE FUND PERFORM SINCE INCEPTION?*
The $250,000 chart reflects a hypothetical $250,000 investment in the class of shares noted. The chart uses total return NAV performance and assumes reinvestment of dividends and capital gains. Fund expenses, including 12b-1 fees and shareholder servicing fees (as applicable), management fees and other expenses were deducted.
CUMULATIVE PERFORMANCE (Initial Investment of $250,000)
ANNUAL AVERAGE TOTAL RETURN (%)
| | |
| | 1 Year | Since Inception
(04/15/2020) |
Class I | 15.44 | 13.04 |
MSCI ACWI Net Total Return Index (USD) | 26.12 | 16.03 |
| * | The Fund’s past performance is not a good predictor of the Fund’s future performance. The returns do not reflect the deduction of taxes that a shareholder would pay on Fund distributions or redemption of Fund shares. |
| Jensen Global Quality Growth Fund | PAGE 1 | TSR-SAR-89834G844 |
KEY FUND STATISTICS (as of November 30, 2024)
| |
Net Assets | $62,643,711 |
Number of Holdings | 34 |
Portfolio Turnover | 8% |
Visit https://www.jenseninvestment.com/reg-docs/ for more recent performance information.
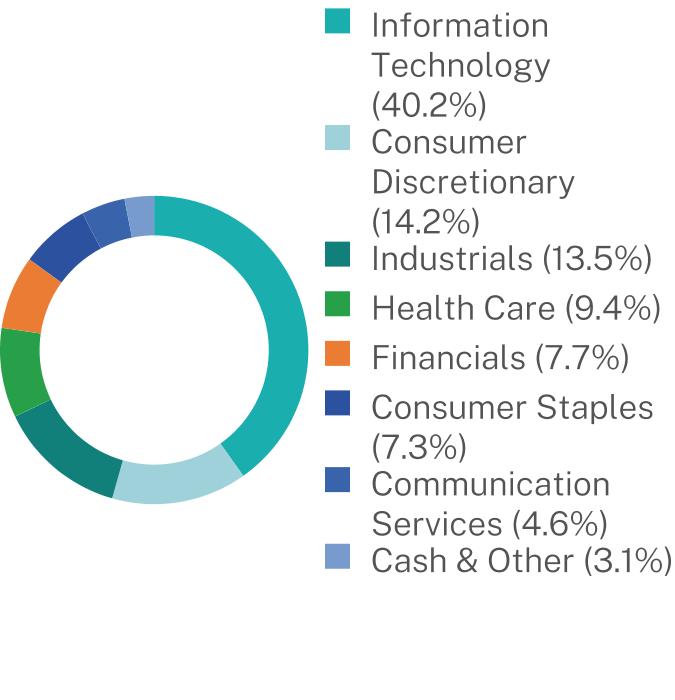
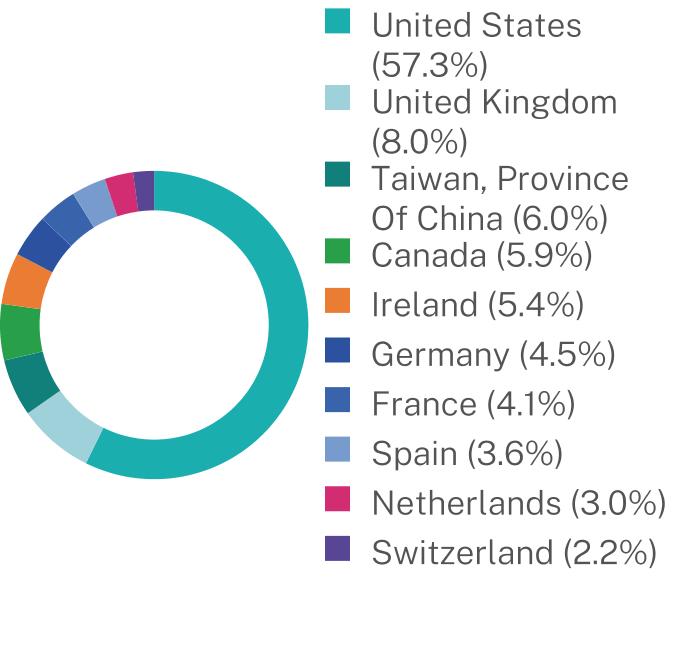
WHAT DID THE FUND INVEST IN? (% of net assets as of November 30, 2024)
| |
Top 10 Issuers | |
Microsoft Corp. | 6.9% |
Taiwan Semiconductor Manufacturing Co. Ltd. | 6.0% |
Aon PLC | 5.5% |
Accenture PLC | 5.4% |
Compass Group PLC | 4.8% |
Alphabet, Inc. | 4.6% |
Apple, Inc. | 4.5% |
SAP SE | 4.5% |
Amadeus IT Group SA | 3.6% |
PepsiCo, Inc. | 3.2% |
| * | The Global Industry Classification Standard (“GICS®”) was developed by and/or is the exclusive property of MSCI, Inc. (“MSCI”) and Standard & Poor’s Financial Services LLC (“S&P”). GICS® is a service mark of MSCI and S&P and has been licensed for use by U.S. Bank Global Fund Services. |
This is a summary of certain changes to the Fund. For more complete information, you may review the Fund’s prospectus. Effective September 30, 2024, the Fund implemented a new investment policy consistent with the Fund’s name, of investing at least 80% of its net assets (plus any borrowings for investment purposes) in U.S. and foreign equity securities of companies meeting the criteria for “quality” and “growth” as determined by the Adviser.
For additional information about the Fund, including its prospectus, financial information, holdings and proxy voting information, scan the QR code above or visit https://www.jenseninvestment.com/reg-docs/.
HOUSEHOLDING
To reduce Fund expenses, only one copy of most shareholder documents may be mailed to shareholders with multiple accounts at the same address (Householding). If you would prefer that your Fund documents not be householded, please contact the Fund at 1-800-992-4144, or contact your financial intermediary. Your instructions will typically be effective within 30 days of receipt by the Fund or your financial intermediary.
| Jensen Global Quality Growth Fund | PAGE 2 | TSR-SAR-89834G844 |
25000027025035745034764336636740788425000027320338752636124336431645013640.214.213.59.47.77.34.63.157.38.06.05.95.44.54.13.63.02.2
| | |
| Jensen Global Quality Growth Fund | |
| Class J | JGQSX |
| Semi-Annual Shareholder Report | November 30, 2024 |
This semi-annual shareholder report contains important information about the Jensen Global Quality Growth Fund (the “Fund”) for the period of June 1, 2024 to November 30, 2024. You can find additional information about the Fund at https://www.jenseninvestment.com/reg-docs/. You can also request this information by contacting us at 1-800-992-4144. This report describes changes to the Fund that occurred during the reporting period.
WHAT WERE THE FUND COSTS FOR THE LAST SIX MONTHS? (based on a hypothetical $10,000 investment)
| | |
Class Name | Costs of a $10,000 investment | Costs paid as a percentage of a $10,000 investment |
| Class J | $65 | 1.25% |
HOW DID THE FUND PERFORM OVER THE LAST SIX MONTHS AND WHAT AFFECTED ITS PERFORMANCE?
For the six-month period ended November 30, 2024, relative performance of the Jensen Global Quality Growth Fund was aided by overweight positions in the Information Technology and Industrials sectors and no positions in the Utilities, Real Estate and Materials sectors. Relative performance was hindered by the Fund’s overweight positions in the Consumer Discretionary, Consumer Staples and Health Care sectors and underweight positions in the Financials and Energy sectors.
During the period, the Fund continued its high allocation to high-quality companies, defined as those rated A+, A and A- by the S&P Earnings and Dividend Quality Rankings. The Fund’s allocation to these highest-quality companies averaged 52.25% of Fund assets compared to 32.86% of the MSCI ACWI Net Total Return Index. This significant overweight to quality detracted from the Fund’s relative returns during the period, which we believe were driven by increased investor risk appetite following the reductions to the U.S. federal funds rate.
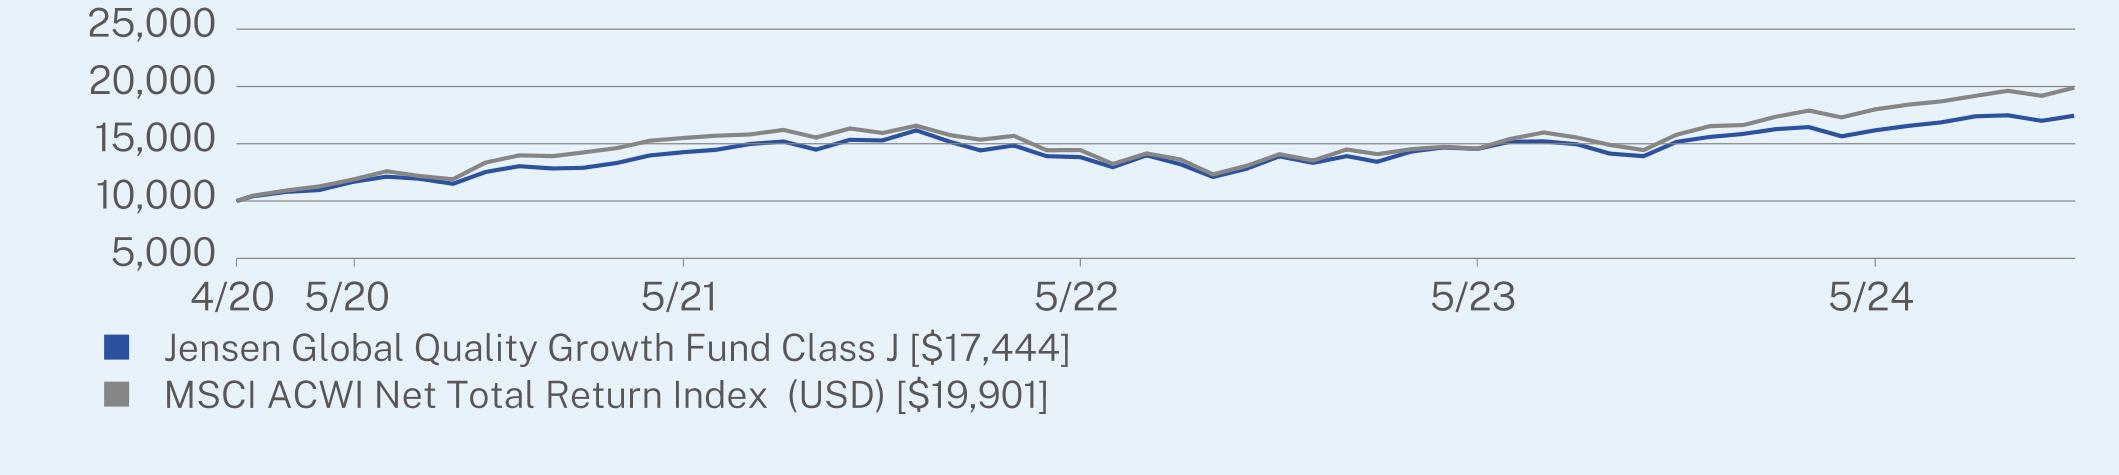
HOW DID THE FUND PERFORM SINCE INCEPTION?*
The $10,000 chart reflects a hypothetical $10,000 investment in the class of shares noted. The chart uses total return NAV performance and assumes reinvestment of dividends and capital gains. Fund expenses, including 12b-1 fees and shareholder servicing fees (as applicable), management fees and other expenses were deducted.
CUMULATIVE PERFORMANCE (Initial Investment of $10,000)
ANNUAL AVERAGE TOTAL RETURN (%)
| | |
| | 1 Year | Since Inception
(04/15/2020) |
Class J | 15.12 | 12.78 |
MSCI ACWI Net Total Return Index (USD) | 26.12 | 16.03 |
| * | The Fund’s past performance is not a good predictor of the Fund’s future performance. The returns do not reflect the deduction of taxes that a shareholder would pay on Fund distributions or redemption of Fund shares. |
| Jensen Global Quality Growth Fund | PAGE 1 | TSR-SAR-89834G851 |
KEY FUND STATISTICS (as of November 30, 2024)
| |
Net Assets | $62,643,711 |
Number of Holdings | 34 |
Portfolio Turnover | 8% |
Visit https://www.jenseninvestment.com/reg-docs/ for more recent performance information.
WHAT DID THE FUND INVEST IN? (% of net assets as of November 30, 2024)
| |
Top 10 Issuers | |
Microsoft Corp. | 6.9% |
Taiwan Semiconductor Manufacturing Co. Ltd. | 6.0% |
Aon PLC | 5.5% |
Accenture PLC | 5.4% |
Compass Group PLC | 4.8% |
Alphabet, Inc. | 4.6% |
Apple, Inc. | 4.5% |
SAP SE | 4.5% |
Amadeus IT Group SA | 3.6% |
PepsiCo, Inc. | 3.2% |
| * | The Global Industry Classification Standard (“GICS®”) was developed by and/or is the exclusive property of MSCI, Inc. (“MSCI”) and Standard & Poor’s Financial Services LLC (“S&P”). GICS® is a service mark of MSCI and S&P and has been licensed for use by U.S. Bank Global Fund Services. |
This is a summary of certain changes to the Fund. For more complete information, you may review the Fund’s prospectus. Effective September 30, 2024, the Fund implemented a new investment policy consistent with the Fund’s name, of investing at least 80% of its net assets (plus any borrowings for investment purposes) in U.S. and foreign equity securities of companies meeting the criteria for “quality” and “growth” as determined by the Adviser.
For additional information about the Fund, including its prospectus, financial information, holdings and proxy voting information, scan the QR code above or visit https://www.jenseninvestment.com/reg-docs/.
HOUSEHOLDING
To reduce Fund expenses, only one copy of most shareholder documents may be mailed to shareholders with multiple accounts at the same address (Householding). If you would prefer that your Fund documents not be householded, please contact the Fund at 1-800-992-4144, or contact your financial intermediary. Your instructions will typically be effective within 30 days of receipt by the Fund or your financial intermediary.
| Jensen Global Quality Growth Fund | PAGE 2 | TSR-SAR-89834G851 |
10000108101426313832145561617010000109281550114450145731800540.214.213.59.47.77.34.63.157.38.06.05.95.44.54.13.63.02.2
| | |
| Jensen Global Quality Growth Fund | |
| Class Y | JGQYX |
| Semi-Annual Shareholder Report | November 30, 2024 |
This semi-annual shareholder report contains important information about the Jensen Global Quality Growth Fund (the “Fund”) for the period of June 1, 2024 to November 30, 2024. You can find additional information about the Fund at https://www.jenseninvestment.com/reg-docs/. You can also request this information by contacting us at 1-800-992-4144. This report describes changes to the Fund that occurred during the reporting period.
WHAT WERE THE FUND COSTS FOR THE LAST SIX MONTHS? (based on a hypothetical $10,000 investment)
| | |
Class Name | Costs of a $10,000 investment | Costs paid as a percentage of a $10,000 investment |
| Class Y | $52 | 1.00% |
HOW DID THE FUND PERFORM OVER THE LAST SIX MONTHS AND WHAT AFFECTED ITS PERFORMANCE?
For the six-month period ended November 30, 2024, relative performance of the Jensen Global Quality Growth Fund was aided by overweight positions in the Information Technology and Industrials sectors and no positions in the Utilities, Real Estate and Materials sectors. Relative performance was hindered by the Fund’s overweight positions in the Consumer Discretionary, Consumer Staples and Health Care sectors and underweight positions in the Financials and Energy sectors.
During the period, the Fund continued its high allocation to high-quality companies, defined as those rated A+, A and A- by the S&P Earnings and Dividend Quality Rankings. The Fund’s allocation to these highest-quality companies averaged 52.25% of Fund assets compared to 32.86% of the MSCI ACWI Net Total Return Index. This significant overweight to quality detracted from the Fund’s relative returns during the period, which we believe were driven by increased investor risk appetite following the reductions to the U.S. federal funds rate.
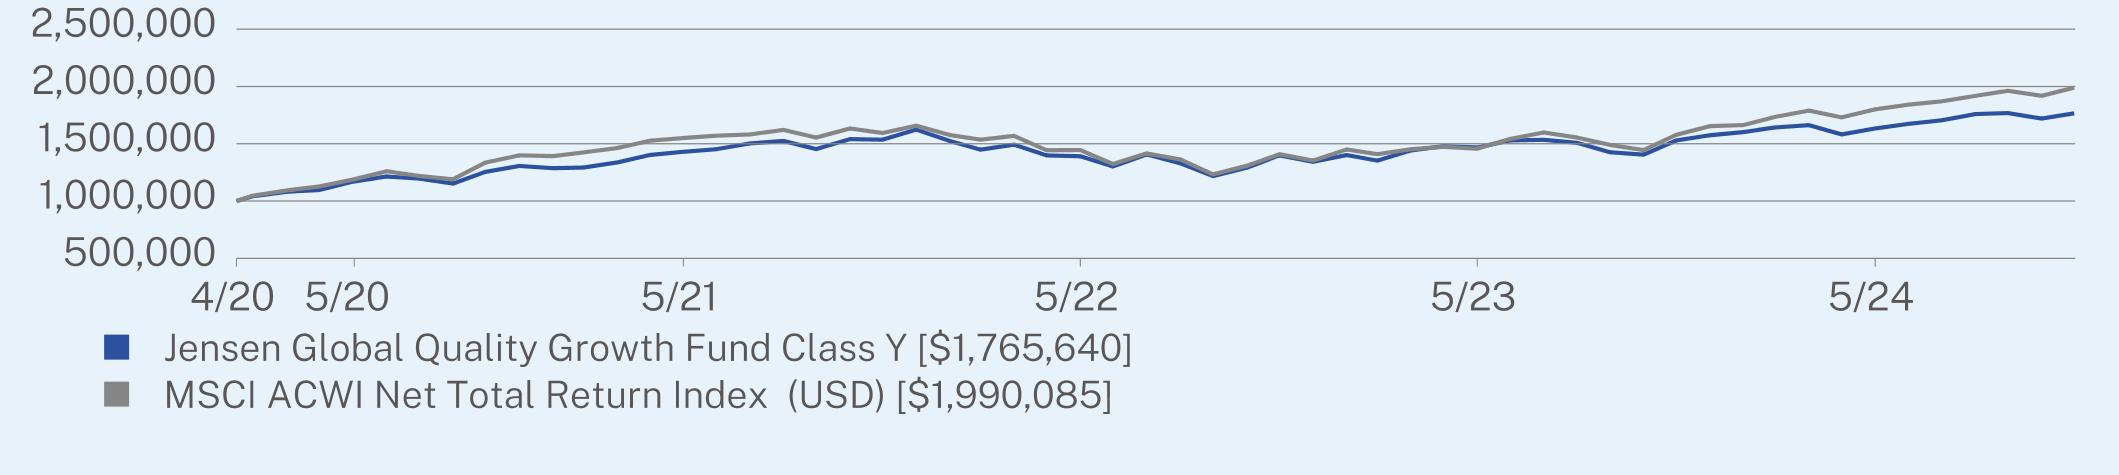
HOW DID THE FUND PERFORM SINCE INCEPTION?*
The $1,000,000 chart reflects a hypothetical $1,000,000 investment in the class of shares noted. The chart uses total return NAV performance and assumes reinvestment of dividends and capital gains. Fund expenses, including 12b-1 fees and shareholder servicing fees (as applicable), management fees and other expenses were deducted.
CUMULATIVE PERFORMANCE (Initial Investment of $1,000,000)
ANNUAL AVERAGE TOTAL RETURN (%)
| | |
| | 1 Year | Since Inception
(04/15/2020) |
Class Y | 15.46 | 13.07 |
MSCI ACWI Net Total Return Index (USD) | 26.12 | 16.03 |
| * | The Fund’s past performance is not a good predictor of the Fund’s future performance. The returns do not reflect the deduction of taxes that a shareholder would pay on Fund distributions or redemption of Fund shares. |
| Jensen Global Quality Growth Fund | PAGE 1 | TSR-SAR-89834G869 |
KEY FUND STATISTICS (as of November 30, 2024)
| |
Net Assets | $62,643,711 |
Number of Holdings | 34 |
Portfolio Turnover | 8% |
Visit https://www.jenseninvestment.com/reg-docs/ for more recent performance information.
WHAT DID THE FUND INVEST IN? (% of net assets as of November 30, 2024)
| |
Top 10 Issuers | |
Microsoft Corp. | 6.9% |
Taiwan Semiconductor Manufacturing Co. Ltd. | 6.0% |
Aon PLC | 5.5% |
Accenture PLC | 5.4% |
Compass Group PLC | 4.8% |
Alphabet, Inc. | 4.6% |
Apple, Inc. | 4.5% |
SAP SE | 4.5% |
Amadeus IT Group SA | 3.6% |
PepsiCo, Inc. | 3.2% |
| * | The Global Industry Classification Standard (“GICS®”) was developed by and/or is the exclusive property of MSCI, Inc. (“MSCI”) and Standard & Poor’s Financial Services LLC (“S&P”). GICS® is a service mark of MSCI and S&P and has been licensed for use by U.S. Bank Global Fund Services. |
This is a summary of certain changes to the Fund. For more complete information, you may review the Fund’s prospectus. Effective September 30, 2024, the Fund implemented a new investment policy consistent with the Fund’s name, of investing at least 80% of its net assets (plus any borrowings for investment purposes) in U.S. and foreign equity securities of companies meeting the criteria for “quality” and “growth” as determined by the Adviser.
For additional information about the Fund, including its prospectus, financial information, holdings and proxy voting information, scan the QR code above or visit https://www.jenseninvestment.com/reg-docs/.
HOUSEHOLDING
To reduce Fund expenses, only one copy of most shareholder documents may be mailed to shareholders with multiple accounts at the same address (Householding). If you would prefer that your Fund documents not be householded, please contact the Fund at 1-800-992-4144, or contact your financial intermediary. Your instructions will typically be effective within 30 days of receipt by the Fund or your financial intermediary.
| Jensen Global Quality Growth Fund | PAGE 2 | TSR-SAR-89834G869 |
10000001081000143000513910451467272163377810000001092813155010514449731457262180054240.214.213.59.47.77.34.63.157.38.06.05.95.44.54.13.63.02.2
| | |
| Jensen Quality Mid Cap Fund | |
| Class I | JNVIX |
| Semi-Annual Shareholder Report | November 30, 2024 |
This semi-annual shareholder report contains important information about the Jensen Quality Mid Cap Fund (the “Fund”)(formerly, the Jensen Quality Value Fund) for the period of June 1, 2024 to November 30, 2024. You can find additional information about the Fund at https://www.jenseninvestment.com/reg-docs/. You can also request this information by contacting us at 1-800-992-4144. This report describes changes to the Fund that occurred during the reporting period.
WHAT WERE THE FUND COSTS FOR THE LAST SIX MONTHS? (based on a hypothetical $10,000 investment)
| | |
Class Name | Costs of a $10,000 investment | Costs paid as a percentage of a $10,000 investment |
| Class I | $43 | 0.82% |
HOW DID THE FUND PERFORM OVER THE LAST SIX MONTHS AND WHAT AFFECTED ITS PERFORMANCE?
For the six months ended November 30, 2024, the Jensen Quality Mid Cap Fund’s performance relative to the Russell Midcap Index was aided by an overweight position in the Industrials sector and specific companies in the Consumer Staples and Health Care sectors. Relative performance was hindered by the Fund’s overweight positions in the Consumer Staples and Health Care sectors; an underweight in the Financials sector; and specific companies in the Consumer Discretionary, Information Technology, Industrials and Financials sectors.
During the period, the Fund continued its high allocation to high-quality companies, defined as those rated A+, A and A- by the S&P Earnings and Dividend Quality Rankings. The Fund’s allocation to these highest-quality companies averaged 44.33% of Fund assets compared to 22.15% of the Russell Midcap Total Return Index. This significant overweight to quality detracted from the Fund’s relative returns during the period, which we believe were driven by increased investor risk appetite following the reductions to the U.S. federal funds rate.
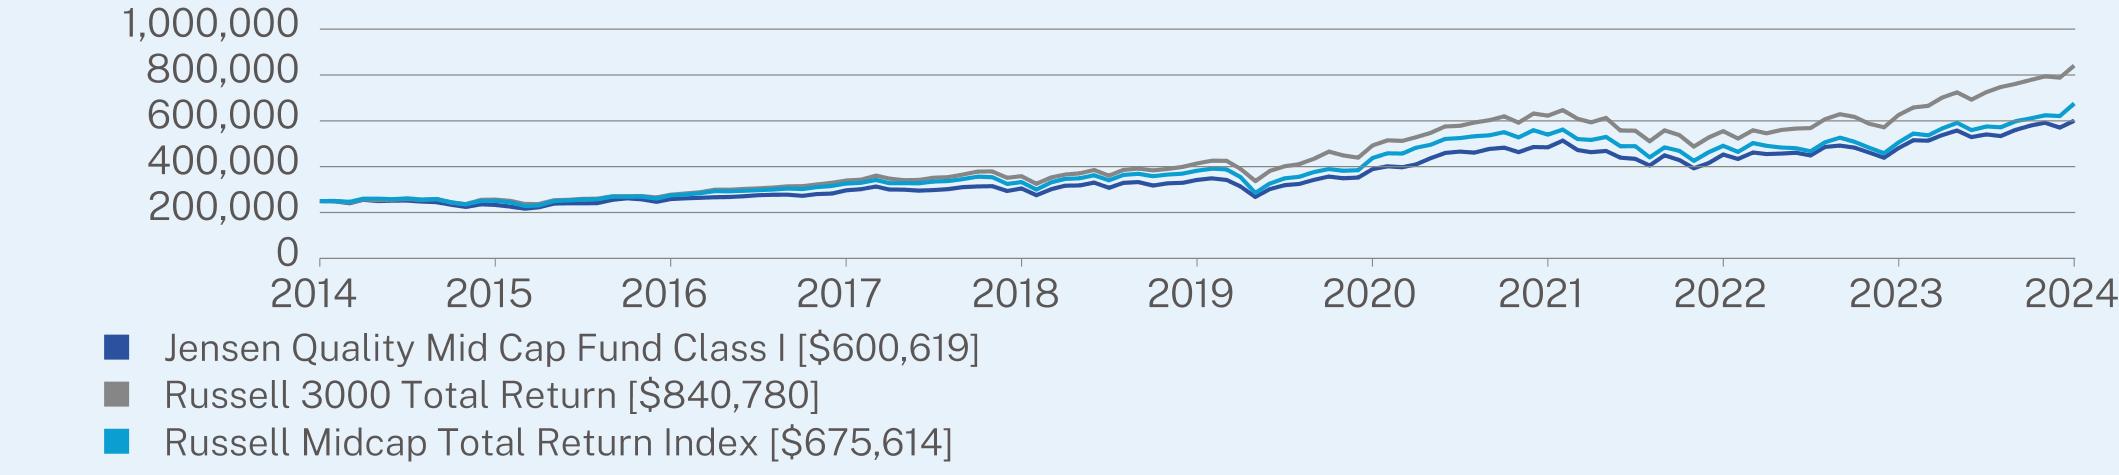
HOW DID THE FUND PERFORM OVER THE PAST 10 YEARS?*
The $250,000 chart reflects a hypothetical $250,000 investment in the class of shares noted. The chart uses total return NAV performance and assumes reinvestment of dividends and capital gains. Fund expenses, including 12b-1 fees and shareholder servicing fees (as applicable), management fees and other expenses were deducted.
CUMULATIVE PERFORMANCE (Initial Investment of $250,000)
| Jensen Quality Mid Cap Fund | PAGE 1 | TSR-SAR-89833W519 |
ANNUAL AVERAGE TOTAL RETURN (%)
| | | |
| | 1 Year | 5 Year | 10 Year |
Class I | 24.92 | 11.93 | 9.16 |
Russell 3000 Total Return | 34.49 | 15.23 | 12.89 |
Russell Midcap Total Return Index | 33.66 | 12.05 | 10.45 |
| * | The Fund’s past performance is not a good predictor of the Fund’s future performance. The returns do not reflect the deduction of taxes that a shareholder would pay on Fund distributions or redemption of Fund shares. |
KEY FUND STATISTICS (as of November 30, 2024)
| |
Net Assets | $215,347,810 |
Number of Holdings | 39 |
Portfolio Turnover | 18% |
Visit https://www.jenseninvestment.com/reg-docs/ for more recent performance information.
WHAT DID THE FUND INVEST IN? (% of net assets as of November 30, 2024)
| |
Top 10 Issuers | |
Copart, Inc. | 4.4% |
Broadridge Financial Solutions, Inc. | 4.2% |
Labcorp Holdings, Inc. | 4.1% |
Genpact Ltd. | 3.9% |
Encompass Health Corp. | 3.9% |
Crown Holdings, Inc. | 3.9% |
Equifax, Inc. | 3.6% |
Kroger Co. | 3.4% |
Tractor Supply Co. | 3.3% |
Keysight Technologies, Inc. | 3.1% |
| * | The Global Industry Classification Standard (“GICS®”) was developed by and/or is the exclusive property of MSCI, Inc. (“MSCI”) and Standard & Poor’s Financial Services LLC (“S&P”). GICS® is a service mark of MSCI and S&P and has been licensed for use by U.S. Bank Global Fund Services. |
This is a summary of certain changes to the Fund. For more complete information, you may review the Fund’s prospectus. Effective September 30, 2024, the Fund changed its name from the Jensen Quality Value Fund to the Jensen Quality Mid Cap Fund. In connection with the name change, the Fund incorporated into its principal investment strategies an investment policy of investing at least 80% of its net assets (plus any borrowings for investment purposes) in equity securities of companies meeting the criteria for “quality” and “mid-capitalization” as determined by the Adviser.
For additional information about the Fund, including its prospectus, financial information, holdings and proxy voting information, scan the QR code above or visit https://www.jenseninvestment.com/reg-docs/.
HOUSEHOLDING
To reduce Fund expenses, only one copy of most shareholder documents may be mailed to shareholders with multiple accounts at the same address (Householding). If you would prefer that your Fund documents not be householded, please contact the Fund at 1-800-992-4144, or contact your financial intermediary. Your instructions will typically be effective within 30 days of receipt by the Fund or your financial intermediary.
| Jensen Quality Mid Cap Fund | PAGE 2 | TSR-SAR-89833W519 |
25000023329525859229690730510734195138931248444045287448079160061925000025645827776433962835839841391549265762241955518262518384078025000025115127502232661633279938257743777053973249104350545767561430.015.514.813.812.56.15.71.6
| | |
| Jensen Quality Mid Cap Fund | |
| Class J | JNVSX |
| Semi-Annual Shareholder Report | November 30, 2024 |
This semi-annual shareholder report contains important information about the Jensen Quality Mid Cap Fund (the “Fund”)(formerly, the Jensen Quality Value Fund) for the period of June 1, 2024 to November 30, 2024. You can find additional information about the Fund at https://www.jenseninvestment.com/reg-docs/. You can also request this information by contacting us at 1-800-992-4144. This report describes changes to the Fund that occurred during the reporting period.
WHAT WERE THE FUND COSTS FOR THE LAST SIX MONTHS? (based on a hypothetical $10,000 investment)
| | |
Class Name | Costs of a $10,000 investment | Costs paid as a percentage of a $10,000 investment |
| Class J | $56 | 1.05% |
HOW DID THE FUND PERFORM OVER THE LAST SIX MONTHS AND WHAT AFFECTED ITS PERFORMANCE?
For the six months ended November 30, 2024, the Jensen Quality Mid Cap Fund’s performance relative to the Russell Midcap Index was aided by an overweight position in the Industrials sector and specific companies in the Consumer Staples and Health Care sectors. Relative performance was hindered by the Fund’s overweight positions in the Consumer Staples and Health Care sectors; an underweight in the Financials sector; and specific companies in the Consumer Discretionary, Information Technology, Industrials and Financials sectors.
During the period, the Fund continued its high allocation to high-quality companies, defined as those rated A+, A and A- by the S&P Earnings and Dividend Quality Rankings. The Fund’s allocation to these highest-quality companies averaged 44.33% of Fund assets compared to 22.15% of the Russell Midcap Total Return Index. This significant overweight to quality detracted from the Fund’s relative returns during the period, which we believe were driven by increased investor risk appetite following the reductions to the U.S. federal funds rate.
HOW DID THE FUND PERFORM OVER THE PAST 10 YEARS?*
The $10,000 chart reflects a hypothetical $10,000 investment in the class of shares noted. The chart uses total return NAV performance and assumes reinvestment of dividends and capital gains. Fund expenses, including 12b-1 fees and shareholder servicing fees (as applicable), management fees and other expenses were deducted.
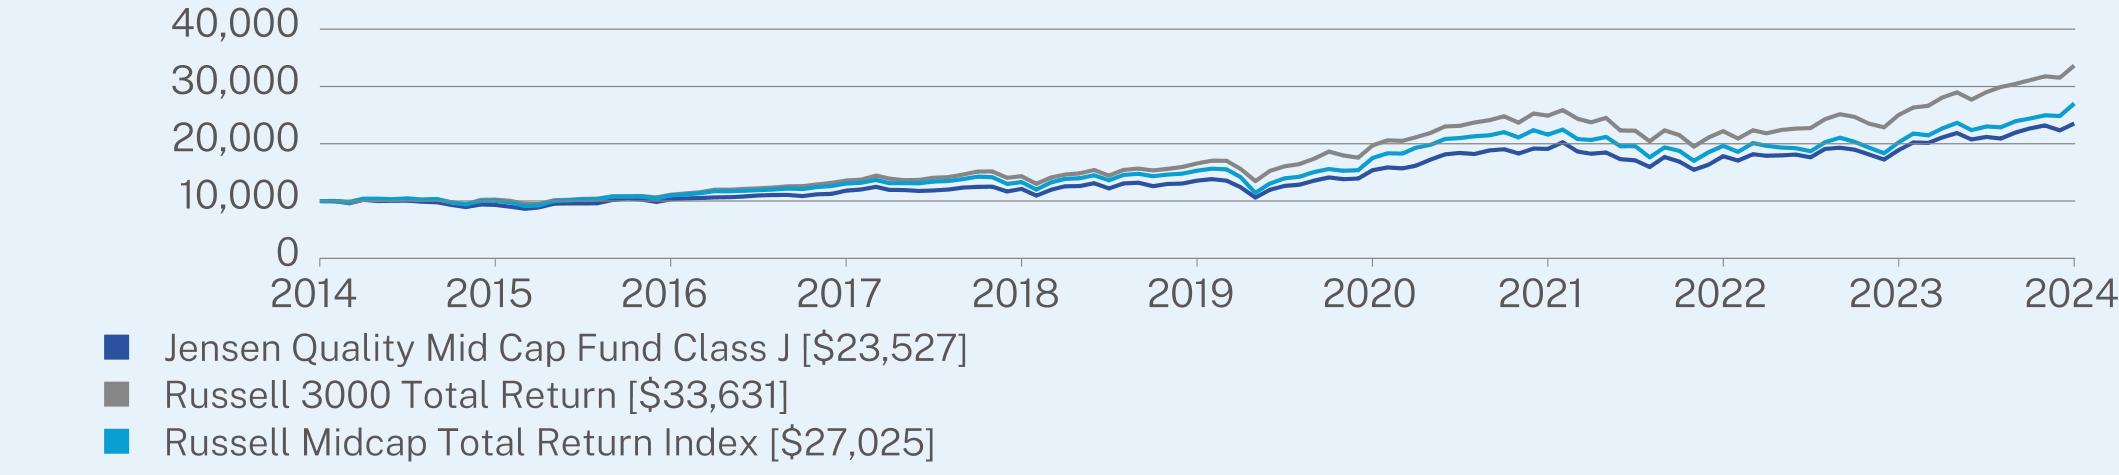
CUMULATIVE PERFORMANCE (Initial Investment of $10,000)
| Jensen Quality Mid Cap Fund | PAGE 1 | TSR-SAR-89833W527 |
ANNUAL AVERAGE TOTAL RETURN (%)
| | | |
| | 1 Year | 5 Year | 10 Year |
Class J | 24.62 | 11.67 | 8.93 |
Russell 3000 Total Return | 34.49 | 15.23 | 12.89 |
Russell Midcap Total Return Index | 33.66 | 12.05 | 10.45 |
| * | The Fund’s past performance is not a good predictor of the Fund’s future performance. The returns do not reflect the deduction of taxes that a shareholder would pay on Fund distributions or redemption of Fund shares. |
KEY FUND STATISTICS (as of November 30, 2024)
| |
Net Assets | $215,347,810 |
Number of Holdings | 39 |
Portfolio Turnover | 18% |
Visit https://www.jenseninvestment.com/reg-docs/ for more recent performance information.
WHAT DID THE FUND INVEST IN? (% of net assets as of November 30, 2024)
| |
Top 10 Issuers | |
Copart, Inc. | 4.4% |
Broadridge Financial Solutions, Inc. | 4.2% |
Labcorp Holdings, Inc. | 4.1% |
Genpact Ltd. | 3.9% |
Encompass Health Corp. | 3.9% |
Crown Holdings, Inc. | 3.9% |
Equifax, Inc. | 3.6% |
Kroger Co. | 3.4% |
Tractor Supply Co. | 3.3% |
Keysight Technologies, Inc. | 3.1% |
| * | The Global Industry Classification Standard (“GICS®”) was developed by and/or is the exclusive property of MSCI, Inc. (“MSCI”) and Standard & Poor’s Financial Services LLC (“S&P”). GICS® is a service mark of MSCI and S&P and has been licensed for use by U.S. Bank Global Fund Services. |
This is a summary of certain changes to the Fund. For more complete information, you may review the Fund’s prospectus. Effective September 30, 2024, the Fund changed its name from the Jensen Quality Value Fund to the Jensen Quality Mid Cap Fund. In connection with the name change, the Fund incorporated into its principal investment strategies an investment policy of investing at least 80% of its net assets (plus any borrowings for investment purposes) in equity securities of companies meeting the criteria for “quality” and “mid-capitalization” as determined by the Adviser.
For additional information about the Fund, including its prospectus, financial information, holdings and proxy voting information, scan the QR code above or visit https://www.jenseninvestment.com/reg-docs/.
HOUSEHOLDING
To reduce Fund expenses, only one copy of most shareholder documents may be mailed to shareholders with multiple accounts at the same address (Householding). If you would prefer that your Fund documents not be householded, please contact the Fund at 1-800-992-4144, or contact your financial intermediary. Your instructions will typically be effective within 30 days of receipt by the Fund or your financial intermediary.
| Jensen Quality Mid Cap Fund | PAGE 2 | TSR-SAR-89833W527 |
1000093161031911818121221354815388191001782518879235271000010258111111358514336165571970624897222072500733631100001004611001130651331215303175112158919642202182702530.015.514.813.812.56.15.71.6
| | |
| Jensen Quality Mid Cap Fund | |
| Class Y | JNVYX |
| Semi-Annual Shareholder Report | November 30, 2024 |
This semi-annual shareholder report contains important information about the Jensen Quality Mid Cap Fund (the “Fund”)(formerly, the Jensen Quality Value Fund) for the period of June 1, 2024 to November 30, 2024. You can find additional information about the Fund at https://www.jenseninvestment.com/reg-docs/. You can also request this information by contacting us at 1-800-992-4144. This report describes changes to the Fund that occurred during the reporting period.
WHAT WERE THE FUND COSTS FOR THE LAST SIX MONTHS? (based on a hypothetical $10,000 investment)
| | |
Class Name | Costs of a $10,000 investment | Costs paid as a percentage of a $10,000 investment |
| Class Y | $42 | 0.80% |
HOW DID THE FUND PERFORM OVER THE LAST SIX MONTHS AND WHAT AFFECTED ITS PERFORMANCE?
For the six months ended November 30, 2024, the Jensen Quality Mid Cap Fund’s performance relative to the Russell Midcap Index was aided by an overweight position in the Industrials sector and specific companies in the Consumer Staples and Health Care sectors. Relative performance was hindered by the Fund’s overweight positions in the Consumer Staples and Health Care sectors; an underweight in the Financials sector; and specific companies in the Consumer Discretionary, Information Technology, Industrials and Financials sectors.
During the period, the Fund continued its high allocation to high-quality companies, defined as those rated A+, A and A- by the S&P Earnings and Dividend Quality Rankings. The Fund’s allocation to these highest-quality companies averaged 44.33% of Fund assets compared to 22.15% of the Russell Midcap Total Return Index. This significant overweight to quality detracted from the Fund’s relative returns during the period, which we believe were driven by increased investor risk appetite following the reductions to the U.S. federal funds rate.
HOW DID THE FUND PERFORM SINCE INCEPTION?*
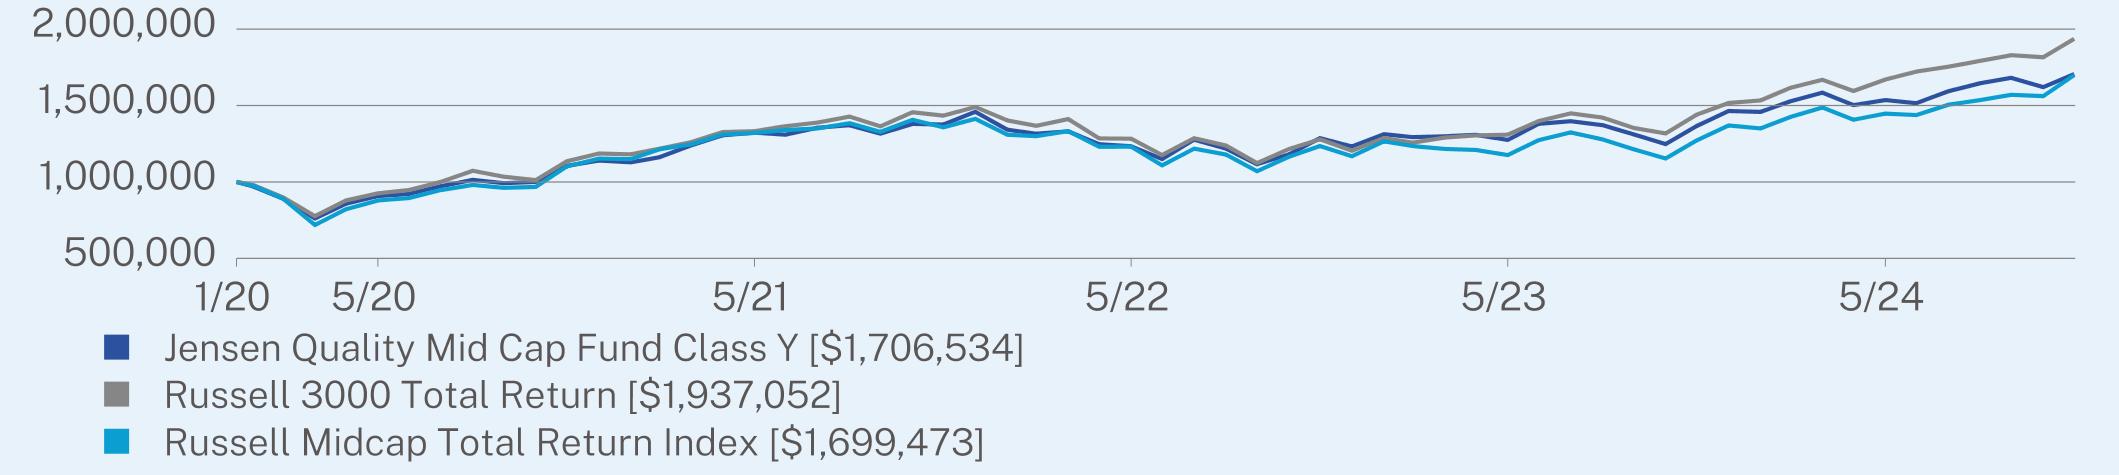
The $1,000,000 chart reflects a hypothetical $1,000,000 investment in the class of shares noted. The chart uses total return NAV performance and assumes reinvestment of dividends and capital gains. Fund expenses, including 12b-1 fees and shareholder servicing fees (as applicable), management fees and other expenses were deducted.
CUMULATIVE PERFORMANCE (Initial Investment of $1,000,000)
| Jensen Quality Mid Cap Fund | PAGE 1 | TSR-SAR-89834G877 |
ANNUAL AVERAGE TOTAL RETURN (%)
| | |
| | 1 Year | Since Inception
(01/15/2020) |
Class Y | 24.95 | 11.58 |
Russell 3000 Total Return | 34.49 | 14.52 |
Russell Midcap Total Return Index | 33.66 | 11.49 |
| * | The Fund’s past performance is not a good predictor of the Fund’s future performance. The returns do not reflect the deduction of taxes that a shareholder would pay on Fund distributions or redemption of Fund shares. |
KEY FUND STATISTICS (as of November 30, 2024)
| |
Net Assets | $215,347,810 |
Number of Holdings | 39 |
Portfolio Turnover | 18% |
Visit https://www.jenseninvestment.com/reg-docs/ for more recent performance information.
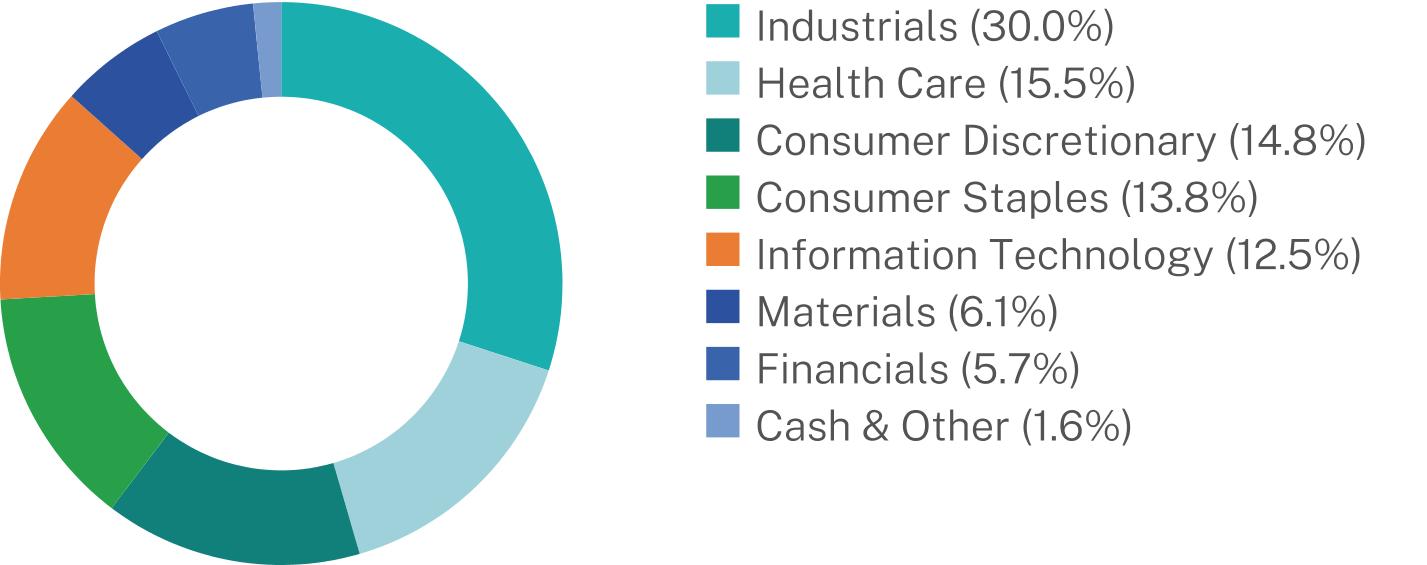
WHAT DID THE FUND INVEST IN? (% of net assets as of November 30, 2024)
| |
Top 10 Issuers | |
Copart, Inc. | 4.4% |
Broadridge Financial Solutions, Inc. | 4.2% |
Labcorp Holdings, Inc. | 4.1% |
Genpact Ltd. | 3.9% |
Encompass Health Corp. | 3.9% |
Crown Holdings, Inc. | 3.9% |
Equifax, Inc. | 3.6% |
Kroger Co. | 3.4% |
Tractor Supply Co. | 3.3% |
Keysight Technologies, Inc. | 3.1% |
| * | The Global Industry Classification Standard (“GICS®”) was developed by and/or is the exclusive property of MSCI, Inc. (“MSCI”) and Standard & Poor’s Financial Services LLC (“S&P”). GICS® is a service mark of MSCI and S&P and has been licensed for use by U.S. Bank Global Fund Services. |
This is a summary of certain changes to the Fund. For more complete information, you may review the Fund’s prospectus. Effective September 30, 2024, the Fund changed its name from the Jensen Quality Value Fund to the Jensen Quality Mid Cap Fund. In connection with the name change, the Fund incorporated into its principal investment strategies an investment policy of investing at least 80% of its net assets (plus any borrowings for investment purposes) in equity securities of companies meeting the criteria for “quality” and “mid-capitalization” as determined by the Adviser.
For additional information about the Fund, including its prospectus, financial information, holdings and proxy voting information, scan the QR code above or visit https://www.jenseninvestment.com/reg-docs/.
HOUSEHOLDING
To reduce Fund expenses, only one copy of most shareholder documents may be mailed to shareholders with multiple accounts at the same address (Householding). If you would prefer that your Fund documents not be householded, please contact the Fund at 1-800-992-4144, or contact your financial intermediary. Your instructions will typically be effective within 30 days of receipt by the Fund or your financial intermediary.
| Jensen Quality Mid Cap Fund | PAGE 2 | TSR-SAR-89834G877 |
10000009075891322579123356112747831535658100000092587413324401283354130946616706571000000878761132065112311861175615144729630.015.514.813.812.56.15.71.6
(b) Not applicable.
Item 2. Code of Ethics.
Not applicable for semi-annual reports.
Item 3. Audit Committee Financial Expert.
Not applicable for semi-annual reports.
Item 4. Principal Accountant Fees and Services.
Not applicable for semi-annual reports.
Item 5. Audit Committee of Listed Registrants.
Not applicable for semi-annual reports.
Item 6. Investments.
| (a) | Schedule of Investments is included as part of the report to shareholders filed under Item 7(a) of this Form. |
Item 7. Financial Statements and Financial Highlights for Open-End Investment Companies.
TABLE OF CONTENTS
Jensen Quality Mid Cap Fund
Schedule of Investments
November 30, 2024 (Unaudited)
| | | | | | | |
COMMON STOCKS — 98.4%
| | | | | | |
Automobile Components — 2.5%
| | | | | | |
Gentex Corp. | | | 178,920 | | | $5,467,795 |
Building Products — 2.5%
| | | | | | |
Lennox International, Inc. | | | 8,200 | | | 5,470,466 |
Capital Markets — 5.7%
| | | | | | |
FactSet Research Systems, Inc. | | | 12,000 | | | 5,888,040 |
MSCI, Inc. | | | 10,350 | | | 6,309,671 |
| | | | | | 12,197,711 |
Chemicals — 2.2%
| | | | | | |
Air Products and Chemicals, Inc. | | | 13,900 | | | 4,647,187 |
Commercial Services & Supplies — 4.4%
| | | | | | |
Copart, Inc.(a) | | | 150,150 | | | 9,518,008 |
Communications Equipment — 2.7%
| | | | | | |
F5, Inc.(a) | | | 23,130 | | | 5,790,596 |
Consumer Staples Distribution & Retail — 3.4%
| | | | | | |
Kroger Co. | | | 120,630 | | | 7,368,080 |
Containers & Packaging — 3.9%
| | | | | | |
Crown Holdings, Inc. | | | 90,510 | | | 8,335,066 |
Distributors — 1.8%
| | | | | | |
Genuine Parts Co. | | | 30,330 | | | 3,843,721 |
Electronic Equipment, Instruments & Components — 4.1%
| | | | | | |
Amphenol Corp. - Class A | | | 31,110 | | | 2,260,142 |
Keysight Technologies, Inc.(a) | | | 39,010 | | | 6,664,468 |
| | | | | | 8,924,610 |
Food Products — 4.7%
| | | | | | |
General Mills, Inc. | | | 75,940 | | | 5,031,784 |
The Campbell’s Co. | | | 110,270 | | | 5,094,474 |
| | | | | | 10,126,258 |
Health Care Equipment & Supplies — 2.9%
| | | | | | |
Hologic, Inc.(a) | | | 31,400 | | | 2,496,300 |
IDEXX Laboratories, Inc.(a) | | | 9,020 | | | 3,804,185 |
| | | | | | 6,300,485 |
Health Care Providers & Services — 8.0%
| | | | | | |
Encompass Health Corp. | | | 81,730 | | | 8,413,286 |
Labcorp Holdings, Inc. | | | 36,590 | | | 8,824,045 |
| | | | | | 17,237,331 |
Health Care Technology — 2.7%
| | | | | | |
Veeva Systems, Inc. - Class A(a) | | | 25,211 | | | 5,744,326 |
| | | | | | | |
The accompanying notes are an integral part of these financial statements.
TABLE OF CONTENTS
Jensen Quality Mid Cap Fund
Schedule of Investments
November 30, 2024 (Unaudited)(Continued)
| | | | | | | |
COMMON STOCKS — (Continued)
| | | | | | |
Household Products — 5.7%
| | | | | | |
Church & Dwight Co., Inc. | | | 56,010 | | | $6,168,381 |
Clorox Co. | | | 36,530 | | | 6,106,720 |
| | | | | | 12,275,101 |
Life Sciences Tools & Services — 1.9%
| | | | | | |
Bio-Techne Corp. | | | 54,760 | | | 4,126,714 |
Machinery — 4.4%
| | | | | | |
Donaldson Co., Inc. | | | 71,210 | | | 5,557,941 |
Toro Co. | | | 45,550 | | | 3,966,494 |
| | | | | | 9,524,435 |
Professional Services — 18.7%
| | | | | | |
Booz Allen Hamilton Holding Corp. | | | 44,370 | | | 6,574,747 |
Broadridge Financial Solutions, Inc. | | | 38,609 | | | 9,112,496 |
Equifax, Inc. | | | 30,000 | | | 7,846,800 |
Genpact Ltd. | | | 183,180 | | | 8,455,589 |
Maximus, Inc. | | | 44,220 | | | 3,294,390 |
Verisk Analytics, Inc. | | | 16,540 | | | 4,866,233 |
| | | | | | 40,150,255 |
Semiconductors & Semiconductor Equipment — 3.1%
| | | | | | |
Microchip Technology, Inc. | | | 46,850 | | | 3,193,764 |
ON Semiconductor Corp.(a) | | | 47,840 | | | 3,402,381 |
| | | | | | 6,596,145 |
Software — 2.6%
| | | | | | |
Manhattan Associates, Inc.(a) | | | 19,530 | | | 5,574,643 |
Specialty Retail — 8.9%
| | | | | | |
Best Buy Co., Inc. | | | 47,710 | | | 4,293,900 |
Ross Stores, Inc. | | | 35,970 | | | 5,570,674 |
Tractor Supply Co. | | | 25,230 | | | 7,156,994 |
Ulta Beauty, Inc.(a) | | | 5,380 | | | 2,080,123 |
| | | | | | 19,101,691 |
Textiles, Apparel & Luxury Goods — 1.6%
| | | | | | |
Levi Strauss & Co. - Class A | | | 200,970 | | | 3,508,936 |
TOTAL COMMON STOCKS
(Cost $162,988,626) | | | | | | 211,829,560 |
| | | | | | | |
The accompanying notes are an integral part of these financial statements.
TABLE OF CONTENTS
Jensen Quality Mid Cap Fund
Schedule of Investments
November 30, 2024 (Unaudited)(Continued)
| | | | | | | |
SHORT-TERM INVESTMENTS — 1.6%
| | | | | | |
Money Market Funds — 1.6%
| | | | | | |
First American Treasury Obligations Fund - Class X, 4.55%(b) | | | 3,426,550 | | | $3,426,550 |
TOTAL SHORT-TERM INVESTMENTS
(Cost $3,426,550) | | | | | | 3,426,550 |
TOTAL INVESTMENTS — 100.0%
(Cost $166,415,176) | | | | | | $215,256,110 |
Other Assets in Excess of Liabilities — 0.0%(c) | | | | | | 91,700 |
TOTAL NET ASSETS — 100.0% | | | | | | $215,347,810 |
| | | | | | | |
Percentages are stated as a percent of net assets.
The Global Industry Classification Standard (“GICS®”) was developed by and/or is the exclusive property of MSCI, Inc. (“MSCI”) and Standard & Poor’s Financial Services LLC (“S&P”). GICS® is a service mark of MSCI and S&P and has been licensed for use by U.S. Bank Global Fund Services.
(a)
| Non-income producing security. |
(b)
| The rate shown represents the 7-day annualized effective yield as of November 30, 2024. |
(c)
| Represents less than 0.05% of net assets. |
The accompanying notes are an integral part of these financial statements.
TABLE OF CONTENTS
Jensen Global Quality Growth Fund
Schedule of Investments
November 30, 2024 (Unaudited)
| | | | | | | |
COMMON STOCKS — 97.0%
| | | | | | |
Canada — 5.9%
| | | | | | |
Alimentation Couche-Tard, Inc. | | | 9,400 | | | $549,948 |
Canadian National Railway Co. | | | 16,060 | | | 1,793,379 |
Constellation Software, Inc./Canada | | | 400 | | | 1,352,569 |
| | | | | | 3,695,896 |
France — 4.1%
| | | | | | |
Dassault Systemes SE | | | 18,480 | | | 637,870 |
Hermes International SCA | | | 890 | | | 1,942,534 |
| | | | | | 2,580,404 |
Germany — 4.5%
| | | | | | |
SAP SE | | | 11,780 | | | 2,797,341 |
Ireland — 5.4%
| | | | | | |
Accenture PLC - Class A | | | 9,390 | | | 3,402,654 |
Netherlands — 3.0%
| | | | | | |
ASML Holding NV | | | 2,700 | | | 1,844,930 |
Spain — 3.6%
| | | | | | |
Amadeus IT Group SA | | | 31,700 | | | 2,226,302 |
Switzerland — 2.2%
| | | | | | |
Nestle SA | | | 16,180 | | | 1,405,067 |
Taiwan — 6.0%
| | | | | | |
Taiwan Semiconductor Manufacturing Co. Ltd. - ADR | | | 20,420 | | | 3,770,757 |
United Kingdom — 8.0%
| | | | | | |
AstraZeneca PLC | | | 9,970 | | | 1,349,377 |
Compass Group PLC | | | 87,650 | | | 3,003,200 |
Diageo PLC | | | 21,720 | | | 648,876 |
| | | | | | 5,001,453 |
United States — 54.3%(a)
| | | | | | |
Alphabet, Inc. - Class A | | | 16,950 | | | 2,863,702 |
Aon PLC - Class A | | | 8,830 | | | 3,457,298 |
Apple, Inc. - Class A | | | 11,860 | | | 2,814,734 |
Automatic Data Processing, Inc. | | | 6,230 | | | 1,912,174 |
Broadridge Financial Solutions, Inc. | | | 5,170 | | | 1,220,223 |
Copart, Inc.(b) | | | 23,500 | | | 1,489,665 |
Equifax, Inc. | | | 5,230 | | | 1,367,959 |
Intuit, Inc. | | | 2,790 | | | 1,790,427 |
KLA Corp. | | | 1,990 | | | 1,287,590 |
Marriott International, Inc./MD - Class A | | | 3,190 | | | 922,197 |
Mastercard, Inc. - Class A | | | 2,580 | | | 1,374,985 |
Microsoft Corp. | | | 10,140 | | | 4,293,884 |
NIKE, Inc. - Class B | | | 10,090 | | | 794,789 |
PepsiCo, Inc. | | | 12,150 | | | 1,985,918 |
Stryker Corp. | | | 3,260 | | | 1,278,409 |
| | | | | | | |
The accompanying notes are an integral part of these financial statements.
TABLE OF CONTENTS
Jensen Global Quality Growth Fund
Schedule of Investments
November 30, 2024 (Unaudited)(Continued)
| | | | | | | |
COMMON STOCKS — (Continued)
|
United States — (Continued)
|
Texas Instruments, Inc. | | | 5,750 | | | $1,155,923 |
UnitedHealth Group, Inc. | | | 2,640 | | | 1,610,928 |
Verisk Analytics, Inc. | | | 2,340 | | | 688,451 |
Zoetis, Inc. | | | 9,580 | | | 1,678,895 |
| | | | | | 33,988,151 |
TOTAL COMMON STOCKS
(Cost $45,772,327) | | | | | | 60,712,955 |
SHORT-TERM INVESTMENTS — 3.0%
| | | | | | |
Money Market Funds — 3.0%
| | | | | | |
First American Treasury Obligations Fund - Class X, 4.55%(c) | | | 1,903,376 | | | 1,903,376 |
TOTAL SHORT-TERM INVESTMENTS
(Cost $1,903,376) | | | | | | 1,903,376 |
TOTAL INVESTMENTS — 100.0%
(Cost $47,675,703) | | | | | | $62,616,331 |
Other Assets in Excess of Liabilities — 0.0%(d) | | | | | | 27,380 |
TOTAL NET ASSETS — 100.0% | | | | | | $62,643,711 |
| | | | | | | |
Percentages are stated as a percent of net assets.
ADR - American Depositary Receipt
NV - Naamloze Vennootschap
PLC - Public Limited Company
SA - Sociedad Anónima
SCA - Societe en commandite par actions
SE - Societas Europeae
(a)
| To the extent that the Fund invests a significant portion of its assets in the securities of companies of a single country or region, it is more likely to be impacted by events or conditions affecting the country or region.
|
(b)
| Non-income producing security.
|
(c)
| The rate shown represents the 7-day annualized effective yield as of November 30, 2024.
|
(d)
| Represents less than 0.05% of net assets. |
The accompanying notes are an integral part of these financial statements.
TABLE OF CONTENTS
Jensen Quality Growth ETF
Schedule of Investments
November 30, 2024 (Unaudited)
| | | | | | | |
COMMON STOCKS — 98.5%
| | | | | | |
Beverages — 3.4%
| | | | | | |
PepsiCo, Inc. | | | 14,336 | | | $2,343,219 |
Chemicals — 1.8%
| | | | | | |
Sherwin-Williams Co. | | | 3,072 | | | 1,220,813 |
Commercial Services & Supplies — 4.8%
| | | | | | |
Copart, Inc.(a) | | | 20,272 | | | 1,285,042 |
Waste Management, Inc. | | | 8,704 | | | 1,986,427 |
| | | | | | 3,271,469 |
Containers & Packaging — 1.3%
| | | | | | |
Ball Corp. | | | 14,080 | | | 875,213 |
Electronic Equipment, Instruments & Components — 1.9%
| | | | | | |
Amphenol Corp. - Class A | | | 17,408 | | | 1,264,691 |
Financial Services — 4.4%
| | | | | | |
Mastercard, Inc. - Class A | | | 5,632 | | | 3,001,518 |
Health Care Equipment & Supplies — 6.0%
| | | | | | |
Stryker Corp. | | | 10,509 | | | 4,121,104 |
Health Care Providers & Services — 3.9%
| | | | | | |
UnitedHealth Group, Inc. | | | 4,352 | | | 2,655,590 |
Hotels, Restaurants & Leisure — 1.6%
| | | | | | |
McDonald’s Corp. | | | 3,584 | | | 1,060,900 |
Household Products — 2.8%
| | | | | | |
Procter & Gamble Co. | | | 10,496 | | | 1,881,513 |
Insurance — 6.1%
| | | | | | |
Marsh & McLennan Cos., Inc. | | | 17,920 | | | 4,179,482 |
Interactive Media & Services — 5.4%
| | | | | | |
Alphabet, Inc. - Class A | | | 21,814 | | | 3,685,475 |
IT Services — 7.1%
| | | | | | |
Accenture PLC - Class A | | | 13,325 | | | 4,828,580 |
Pharmaceuticals — 5.7%
| | | | | | |
Johnson & Johnson | | | 10,496 | | | 1,626,985 |
Zoetis, Inc. | | | 12,806 | | | 2,244,251 |
| | | | | | 3,871,236 |
Professional Services — 12.2%
| | | | | | |
Automatic Data Processing, Inc. | | | 9,728 | | | 2,985,816 |
Broadridge Financial Solutions, Inc. | | | 9,472 | | | 2,235,581 |
Equifax, Inc. | | | 6,921 | | | 1,810,257 |
Verisk Analytics, Inc. | | | 4,608 | | | 1,355,720 |
| | | | | | 8,387,374 |
| | | | | | | |
The accompanying notes are an integral part of these financial statements.
TABLE OF CONTENTS
Jensen Quality Growth ETF
Schedule of Investments
November 30, 2024 (Unaudited)(Continued)
| | | | | | | | |
COMMON STOCKS — (Continued)
| |
Semiconductors & Semiconductor Equipment — 6.1%
| | | | | | | |
KLA Corp. | | | 3,072 | | | $1,987,676 | |
Texas Instruments, Inc. | | | 10,810 | | | 2,173,134 | |
| | | | | | 4,160,810 | |
Software — 12.6%
| | | | | | | |
Intuit, Inc. | | | 5,888 | | | 3,778,507 | |
Microsoft Corp. | | | 11,581 | | | 4,904,091 | |
| | | | | | 8,682,598 | |
Specialty Retail — 1.8%
| | | | | | | |
Home Depot, Inc. | | | 2,816 | | | 1,208,430 | |
Technology Hardware, Storage & Peripherals — 7.3%
| | | | | | | |
Apple, Inc. - Class A | | | 21,300 | | | 5,055,129 | |
Textiles, Apparel & Luxury Goods — 2.3%
| | | | | | | |
NIKE, Inc. - Class B | | | 19,737 | | | 1,554,683 | |
TOTAL COMMON STOCKS
(Cost $65,926,284) | | | | | | 67,309,827 | | | |
SHORT-TERM INVESTMENTS — 1.5%
| | | | | | | |
Money Market Funds — 1.5%
| | | | | | | |
First American Treasury Obligations Fund - Class X, 4.55%(b) | | | 995,803 | | | 995,803 | |
TOTAL SHORT-TERM INVESTMENTS
(Cost $995,803) | | | | | | 995,803 | |
TOTAL INVESTMENTS — 100.0%
(Cost $66,922,087) | | | | | | $68,305,630 | |
Other Assets in Excess of Liabilities — 0.0%(c) | | | | | | 21,344 | |
TOTAL NET ASSETS — 100.0% | | | | | | $68,326,974 | | | |
| | | | | | | | | | |
Percentages are stated as a percent of net assets.
The Global Industry Classification Standard (“GICS®”) was developed by and/or is the exclusive property of MSCI, Inc. (“MSCI”) and Standard & Poor’s Financial Services LLC (“S&P”). GICS® is a service mark of MSCI and S&P and has been licensed for use by U.S. Bank Global Fund Services.
PLC - Public Limited Company
(a)
| Non-income producing security.
|
(b)
| The rate shown represents the 7-day annualized effective yield as of November 30, 2024.
|
(c)
| Represents less than 0.05% of net assets. |
The accompanying notes are an integral part of these financial statements.
TABLE OF CONTENTS
Statements of Assets & Liabilities
November 30, 2024 (Unaudited)
| | | | | | | | | | |
Assets:
| | | | | | | | | |
Investments, at value (cost $166,415,176, $47,675,703 and $66,922,087) | | | $215,256,110 | | | $62,616,331 | | | $68,305,630 |
Income receivable | | | 199,879 | | | 59,595 | | | 43,064 |
Receivable for capital stock issued | | | 18,741 | | | 6,631 | | | — |
Other assets | | | 20,264 | | | 8,701 | | | — |
Total Assets | | | 215,494,994 | | | 62,691,258 | | | 68,348,694 |
Liabilities:
| | | | | | | | | |
Payable for capital stock redeemed | | | 967 | | | — | | | — |
Payable for 12b-1 fees - Class J | | | 13,317 | | | 3,123 | | | — |
Payable to adviser | | | 100,647 | | | 26,724 | | | 21,720 |
Payable to affiliates | | | 27,350 | | | 14,260 | | | — |
Accrued expenses and other liabilities | | | 4,903 | | | 3,440 | | | — |
Total Liabilities | | | 147,184 | | | 47,547 | | | 21,720 |
NET ASSETS | | | $ 215,347,810 | | | $62,643,711 | | | $68,326,974 |
Net Assets Consist of:
| | | | | | | | | |
Capital stock | | | $164,912,085 | | | $48,371,591 | | | $66,869,458 |
Total distributable earnings | | | 50,435,725 | | | 14,272,120 | | | 1,457,516 |
Total Net Assets | | | $ 215,347,810 | | | $62,643,711 | | | $68,326,974 |
Net Assets Consist of:
| | | | | | | | | |
Class J Shares:
| | | | | | | | | |
Net Assets | | | $32,275,220 | | | $2,637,402 | | | N/A |
Shares of beneficial interest outstanding | | | 1,618,052 | | | 153,389 | | | N/A |
Net Asset Value, Offering Price and Redemption Price Per Share (unlimited number of shares authorized, $.001 par value) | | | $19.95 | | | $17.19 | | | N/A |
Class I Shares:
| | | | | | | | | |
Net Assets | | | $103,633,644 | | | $3,066,115 | | | N/A |
Shares of beneficial interest outstanding | | | 5,210,099 | | | 178,279 | | | N/A |
Net Asset Value, Offering Price and Redemption Price Per Share (unlimited number of shares authorized, $.001 par value) | | | $19.89 | | | $17.20 | | | N/A |
Class Y Shares:
| | | | | | | | | |
Net Assets | | | $79,438,946 | | | $56,940,194 | | | N/A |
Shares of beneficial interest outstanding | | | 4,003,501 | | | 3,309,231 | | | N/A |
Net Asset Value, Offering Price and Redemption Price Per Share (unlimited number of shares authorized, $.001 par value) | | | $19.84 | | | $17.21 | | | N/A |
| | | | | | | | | | |
The accompanying notes are an integral part of these financial statements.
TABLE OF CONTENTS
Statements of Assets & Liabilities
November 30, 2024 (Unaudited)(Continued)
| | | | | | | | | | |
Total Fund Shares:
| | | | | | | | | |
Net Assets | | | N/A | | | N/A | | | $68,326,974 |
Shares of beneficial interest outstanding | | | N/A | | | N/A | | | 2,530,000 |
Net Asset Value, Offering Price and Redemption Price Per Share (unlimited number of shares authorized, $.001 par value) | | | N/A | | | N/A | | | $27.01 |
| | | | | | | | | | |
The accompanying notes are an integral part of these financial statements.
TABLE OF CONTENTS
Statements of Operations
For the Six Months Ended November 30, 2024 (Unaudited)
| | | | | | | | | | |
Investment Income:
| | | | | | | | | |
Dividend income | | | $1,380,393 | | | $325,358(1) | | | $98,835 |
Interest income | | | 80,169 | | | 17,594 | | | 5,176 |
Total investment income | | | 1,460,562 | | | 342,952 | | | 104,011 |
Expenses:
| | | | | | | | | |
Investment management fees | | | 667,891 | | | 222,692 | | | 46,046 |
12b-1 fees - Class J | | | 38,827 | | | 3,242 | | | — |
Administration fees | | | 26,126 | | | 12,767 | | | — |
Federal and state registration fees | | | 24,870 | | | 31,188 | | | — |
Transfer agent fees | | | 23,241 | | | 22,692 | | | — |
Fund accounting fees | | | 22,134 | | | 14,346 | | | — |
Transfer agent expenses | | | 15,111 | | | 2,739 | | | — |
Trustees’ fees | | | 14,751 | | | 14,751 | | | — |
Reports to shareholders | | | 14,103 | | | 2,085 | | | — |
Legal fees | | | 12,303 | | | 7,905 | | | — |
Shareholder servicing fees - Class I | | | 9,885 | | | 299 | | | — |
Audit and tax fees | | | 9,552 | | | 10,101 | | | — |
Chief Compliance Officer fees | | | 6,222 | | | 6,222 | | | — |
Custody fees | | | 4,378 | | | 5,941 | | | — |
Insurance expense | | | 1,902 | | | 1,131 | | | — |
Other | | | 4,557 | | | 4,879 | | | — |
Total expenses | | | 895,853 | | | 362,980 | | | 46,046 |
Less waivers and reimbursements by Adviser (Note 4) | | | (25,121) | | | (62,375) | | | — |
Net expenses | | | 870,732 | | | 300,605 | | | 46,046 |
Net Investment Income | | | 589,830 | | | 42,347 | | | 57,965 |
Realized and Unrealized Gain (Loss) on Investments:
| | | | | | | | | |
Net realized gain (loss) on:
| | | | | | | | | |
Investments | | | (3,009,589) | | | 129,782 | | | 29,998 |
Foreign currency translations | | | — | | | (10,142) | | | — |
Change in unrealized appreciation (depreciation) on:
| | | | | | | | | |
Investments | | | 12,802,012 | | | 4,346,503 | | | 1,383,543 |
Foreign currency translations | | | — | | | (246) | | | — |
Net realized and unrealized gain on investments | | | 9,792,423 | | | 4,465,897 | | | 1,413,541 |
NET INCREASE IN NET ASSETS RESULTING FROM OPERATIONS | | | $10,382,253 | | | $4,508,244 | | | $1,471,506 |
| | | | | | | | | | |
(1)
| Net of $12,897 in dividend withholding tax.
|
The accompanying notes are an integral part of these financial statements.
TABLE OF CONTENTS
Statements of Changes in Net Assets
| | | | |
Operations:
| | | | | | |
Net investment income | | | $589,830 | | | $1,020,387 |
Net realized gain (loss) on investment transactions | | | (3,009,589) | | | 10,038,843 |
Change in unrealized appreciation on investments | | | 12,802,012 | | | 23,061,829 |
Net increase in net assets resulting from operations | | | 10,382,253 | | | 34,121,059 |
Capital Share Transactions:
| | | | | | |
Shares sold - Class J | | | 2,624,818 | | | 4,877,402 |
Shares sold - Class I | | | 7,269,578 | | | 23,201,589 |
Shares sold - Class Y | | | 1,322,459 | | | 7,384,040 |
Shares issued to holders in reinvestment of dividends - Class J | | | 1,781,368 | | | 127,590 |
Shares issued to holders in reinvestment of dividends - Class I | | | 5,844,111 | | | 615,383 |
Shares issued to holders in reinvestment of dividends - Class Y | | | 4,523,483 | | | 413,459 |
Shares redeemed - Class J | | | (3,783,382) | | | (8,497,401) |
Shares redeemed - Class I | | | (8,433,262) | | | (39,910,116) |
Shares redeemed - Class Y | | | (1,943,172) | | | (1,917,674) |
Net increase (decrease) in net assets from capital share transactions | | | 9,206,001 | | | (13,705,728) |
DIVIDENDS AND DISTRIBUTIONS TO SHAREHOLDERS:
| | | | | | |
Net dividends and distributions to shareholders - Class J | | | (70,778) | | | (127,762) |
Net dividends and distributions to shareholders - Class I | | | (407,928) | | | (615,532) |
Net dividends and distributions to shareholders - Class Y | | | (325,112) | | | (413,459) |
Total dividends and distributions | | | (803,818) | | | (1,156,753) |
Increase in net assets | | | 18,784,436 | | | 19,258,578 |
NET ASSETS:
| | | | | | |
Beginning of period | | | $ 196,563,374 | | | $177,304,796 |
End of period | | | $ 215,347,810 | | | $196,563,374 |
| | | | | | | |
The accompanying notes are an integral part of these financial statements.
TABLE OF CONTENTS
Statements of Changes in Net Assets
| | | | |
Operations:
| | | | | | |
Net investment income | | | $42,347 | | | $269,867 |
Net realized gain (loss) on:
| | | | | | |
Investments | | | 129,782 | | | (48,633) |
Foreign currency translations | | | (10,142) | | | (7,026) |
Change in unrealized appreciation (depreciation) on:
| | | | | | |
Investments | | | 4,346,503 | | | 4,941,399 |
Foreign currency translations | | | (246) | | | 740 |
Net increase in net assets resulting from operations | | | 4,508,244 | | | 5,156,347 |
Capital Share Transactions:
| | | | | | |
Shares sold - Class J | | | 13,167 | | | 352,493 |
Shares sold - Class I | | | 54,891 | | | 339,476 |
Shares sold - Class Y | | | 2,969,275 | | | 7,010,224 |
Shares issued to holders in reinvestment of dividends - Class J | | | 2,552 | | | 7,556 |
Shares issued to holders in reinvestment of dividends - Class I | | | 6,233 | | | 12,125 |
Shares issued to holders in reinvestment of dividends - Class Y | | | 115,976 | | | 231,210 |
Shares redeemed - Class J | | | (51,413) | | | (600,250) |
Shares redeemed - Class I | | | (28,391) | | | (22,254) |
Shares redeemed - Class Y | | | (432,299) | | | (936,710) |
Net increase in net assets from capital share transactions | | | 2,649,991 | | | 6,393,870 |
DIVIDENDS AND DISTRIBUTIONS TO SHAREHOLDERS:
| | | | | | |
Net dividends and distributions to shareholders - Class J | | | (2,552) | | | (7,562) |
Net dividends and distributions to shareholders - Class I | | | (6,233) | | | (12,125) |
Net dividends and distributions to shareholders - Class Y | | | (115,977) | | | (231,209) |
Total dividends and distributions | | | (124,762) | | | (250,896) |
Increase in net assets | | | 7,033,473 | | | 11,299,321 |
NET ASSETS:
| | | | | | |
Beginning of period | | | $ 55,610,238 | | | $44,310,917 |
End of period | | | $62,643,711 | | | $55,610,238 |
| | | | | | | |
The accompanying notes are an integral part of these financial statements.
TABLE OF CONTENTS
Statements of Changes in Net Assets
| | | | |
Operations:
| | | |
Net investment income | | | $57,965 |
Net realized gain on investment transactions | | | 29,998 |
Change in unrealized appreciation on investments | | | 1,383,543 |
Net increase in net assets resulting from operations | | | 1,471,506 |
Capital Share Transactions:
| | | |
Shares sold | | | 67,677,400 |
Shares redeemed | | | (807,942) |
Net increase in net assets from capital share transactions | | | 66,869,458 |
DIVIDENDS AND DISTRIBUTIONS TO SHAREHOLDERS:
| | | |
Net dividends and distributions to shareholders | | | (13,990) |
Total dividends and distributions | | | (13,990) |
Increase in net assets | | | 68,326,974 |
NET ASSETS:
| | | |
Beginning of period | | | $— |
End of period | | | $ 68,326,974 |
| | | | |
(1)
| The Fund commenced operations on August 12, 2024. |
The accompanying notes are an integral part of these financial statements.
TABLE OF CONTENTS
Jensen Quality Mid Cap Fund
Financial Highlights
Class J
| | | | | | | |
Per Share Data:
| | | | | | | | | | | | | | | | | | |
Net asset value, beginning of period | | | $19.01 | | | $15.89 | | | $15.85 | | | $17.47 | | | $12.17 | | | $ 12.24 |
Income (loss) from investment operations:
| | | | | | | | | | | | | | | | | | |
Net investment income(1) | | | 0.04 | | | 0.06 | | | 0.08 | | | 0.05 | | | 0.06 | | | 0.08 |
Net realized and unrealized gain (loss) on investments | | | 0.93 | | | 3.13 | | | 0.40 | | | (1.21) | | | 5.43 | | | 0.41 |
Total from investment operations | | | 0.97 | | | 3.19 | | | 0.48 | | | (1.16) | | | 5.49 | | | 0.49 |
Less distributions:
| | | | | | | | | | | | | | | | | | |
Dividends from net investment income | | | (0.03) | | | (0.07) | | | (0.06) | | | (0.04) | | | (0.06) | | | (0.08) |
Distributions from net realized gain on investments | | | — | | | — | | | (0.38) | | | (0.42) | | | (0.13) | | | (0.48) |
Total distributions | | | (0.03) | | | (0.07) | | | (0.44) | | | (0.46) | | | (0.19) | | | (0.56) |
Net asset value, end of period | | | $19.95 | | | $19.01 | | | $15.89 | | | $15.85 | | | $17.47 | | | $ 12.17 |
Total return(2) | | | 11.02% | | | 20.14% | | | 3.12% | | | −6.98% | | | 45.37% | | | 3.72% |
Supplemental data and ratios:
| | | | | | | | | | | | | | | | | | |
Net assets, end of period (000’s) | | | $ 32,275 | | | $ 30,191 | | | $ 28,366 | | | $ 38,942 | | | $ 37,105 | | | $ 6,569 |
Ratio of expenses to average net assets
| | | | | | | | | | | | | | | | | | |
Before waivers and reimbursements of expenses(3) | | | 1.07% | | | 1.08% | | | 1.10% | | | 1.11% | | | 1.25% | | | 1.57% |
After waivers and reimbursements of expenses(3) | | | 1.05% | | | 1.05% | | | 1.05% | | | 1.05% | | | 1.05% | | | 1.05% |
Ratio of net investment income to average net assets
| | | | | | | | | | | | | | | | | | |
Before waivers and reimbursements of expenses(3) | | | 0.35% | | | 0.32% | | | 0.47% | | | 0.25% | | | 0.18% | | | 0.16% |
After waivers and reimbursements of expenses(3) | | | 0.37% | | | 0.35% | | | 0.52% | | | 0.31% | | | 0.38% | | | 0.68% |
Portfolio turnover rate(2) | | | 17.68% | | | 24.92% | | | 15.57% | | | 17.78% | | | 18.15% | | | 36.19% |
| | | | | | | | | | | | | | | | | | | |
(1)
| Per share amounts are calculated using the average shares outstanding method.
|
(2)
| Not annualized for periods less than one year.
|
(3)
| Annualized for periods less than one year. |
The accompanying notes are an integral part of these financial statements.
TABLE OF CONTENTS
Jensen Quality Mid Cap Fund
Financial Highlights
Class I
| | | | | | | |
Per Share Data:
| | | | | | | | | | | | | | | | | | |
Net asset value, beginning of period | | | $18.98 | | | $15.86 | | | $15.81 | | | $17.43 | | | $12.13 | | | $ 12.18 |
Income (loss) from investment operations:
| | | | | | | | | | | | | | | | | | |
Net investment income(1) | | | 0.06 | | | 0.10 | | | 0.12 | | | 0.09 | | | 0.09 | | | 0.12 |
Net realized and unrealized gain (loss) on investments | | | 0.90 | | | 3.13 | | | 0.40 | | | (1.21) | | | 5.42 | | | 0.39 |
Total from investment operations | | | 0.96 | | | 3.23 | | | 0.52 | | | (1.12) | | | 5.51 | | | 0.51 |
Less distributions:
| | | | | | | | | | | | | | | | | | |
Dividends from net investment income | | | (0.05) | | | (0.11) | | | (0.09) | | | (0.08) | | | (0.08) | | | (0.08) |
Distributions from net realized gain on investments | | | — | | | — | | | (0.38) | | | (0.42) | | | (0.13) | | | (0.48) |
Total distributions | | | (0.05) | | | (0.11) | | | (0.47) | | | (0.50) | | | (0.21) | | | (0.56) |
Net asset value, end of period | | | $19.89 | | | $18.98 | | | $15.86 | | | $15.81 | | | $17.43 | | | $ 12.13 |
Total return(2) | | | 11.08% | | | 20.45% | | | 3.38% | | | −6.79% | | | 45.80% | | | 3.88% |
Supplemental data and ratios:
| | | | | | | | | | | | | | | | | | |
Net assets, end of period (000’s) | | | $ 103,634 | | | $ 94,339 | | | $ 93,813 | | | $ 104,867 | | | $ 44,113 | | | $ 2,491 |
Ratio of expenses to average net assets
| | | | | | | | | | | | | | | | | | |
Before waivers and reimbursements of expenses(3) | | | 0.84% | | | 0.85% | | | 0.87% | | | 0.88% | | | 1.00% | | | 1.23% |
After waivers and reimbursements of expenses(3) | | | 0.82% | | | 0.82% | | | 0.82% | | | 0.82% | | | 0.82% | | | 0.82% |
Ratio of net investment income to average net assets
| | | | | | | | | | | | | | | | | | |
Before waivers and reimbursements of expenses(3) | | | 0.58% | | | 0.54% | | | 0.70% | | | 0.50% | | | 0.42% | | | 0.51% |
After waivers and reimbursements of expenses(3) | | | 0.60% | | | 0.57% | | | 0.75% | | | 0.56% | | | 0.60% | | | 0.92% |
Portfolio turnover rate(2) | | | 17.68% | | | 24.92% | | | 15.57% | | | 0.18% | | | 18.15% | | | 36.19% |
| | | | | | | | | | | | | | | | | | | |
(1)
| Per share amounts are calculated using the average shares outstanding method.
|
(2)
| Not annualized for periods less than one year. |
(3)
| Annualized for periods less than one year. |
The accompanying notes are an integral part of these financial statements.
TABLE OF CONTENTS
Jensen Quality Mid Cap Fund
Financial Highlights
Class Y
| | | | | | | |
Per Share Data:
| | | | | | | | | | | | | | | | | | |
Net asset value, beginning of period | | | $18.93 | | | $15.82 | | | $15.78 | | | $17.39 | | | $12.11 | | | $13.38 |
Income (LOSS) from investment operations:
| | | | | | | | | | | | | | | | | | |
Net investment income(2) | | | 0.06 | | | 0.11 | | | 0.12 | | | 0.09 | | | 0.10 | | | 0.04 |
Net realized and unrealized gain (loss) on investments | | | 0.90 | | | 3.12 | | | 0.39 | | | (1.20) | | | 5.40 | | | (1.28) |
Total from investment operations | | | 0.96 | | | 3.23 | | | 0.51 | | | (1.11) | | | 5.50 | | | (1.24) |
Less distributions:
| | | | | | | | | | | | | | | | | | |
Dividends from net investment income | | | (0.05) | | | (0.12) | | | (0.09) | | | (0.08) | | | (0.09) | | | (0.03) |
Distributions from net realized gain on investments | | | — | | | — | | | (0.38) | | | (0.42) | | | (0.13) | | | — |
Total distributions | | | (0.05) | | | (0.12) | | | (0.47) | | | (0.50) | | | (0.22) | | | (0.03) |
Net asset value, end of period | | | $19.84 | | | $18.93 | | | $15.82 | | | $15.78 | | | $17.39 | | | $12.11 |
Total return(3) | | | 11.13% | | | 20.46% | | | 3.34% | | | −6.73% | | | 45.72% | | | −9.24% |
Supplemental data and ratios:
| | | | | | | | | | | | | | | | | | |
Net assets, end of period (000’s) | | | $ 79,439 | | | $ 72,033 | | | $ 55,126 | | | $ 57,196 | | | $ 50,693 | | | $ 35,326 |
Ratio of expenses to average net assets
| | | | | | | | | | | | | | | | | | |
Before waivers and reimbursements of expenses(4) | | | 0.82% | | | 0.83% | | | 0.85% | | | 0.86% | | | 1.05% | | | 1.52% |
After waivers and reimbursements of expenses(4) | | | 0.80% | | | 0.80% | | | 0.80% | | | 0.80% | | | 0.80% | | | 0.80% |
Ratio of net investment income to average net assets
| | | | | | | | | | | | | | | | | | |
Before waivers and reimbursements of expenses(4) | | | 0.60% | | | 0.56% | | | 0.73% | | | 0.50% | | | 0.40% | | | 0.23% |
After waivers and reimbursements of expenses(4) | | | 0.62% | | | 0.59% | | | 0.78% | | | 0.56% | | | 0.65% | | | 0.95% |
Portfolio turnover rate(3) | | | 17.68% | | | 24.92% | | | 15.57% | | | 17.78% | | | 18.15% | | | 36.19% |
| | | | | | | | | | | | | | | | | | | |
(1)
| Class Y shares commenced operations on January 15, 2020.
|
(2)
| Per share amounts are calculated using the average shares outstanding method.
|
(3)
| Not annualized for periods less than one year.
|
(4)
| Annualized for periods less than one year. |
The accompanying notes are an integral part of these financial statements.
TABLE OF CONTENTS
Jensen Global Quality Growth Fund
Financial Highlights
Class J
| | | | | | | |
Per Share Data:
| | | | | | | | | | | | | | | | | | |
Net asset value, beginning of period | | | $ 15.95 | | | $ 14.40 | | | $ 13.73 | | | $14.20 | | | $ 10.81 | | | $10.00 |
Income (LOSS) from investment operations:
| | | | | | | | | | | | | | | | | | |
Net investment income (loss)(2) | | | (0.01) | | | 0.04 | | | 0.05 | | | 0.05 | | | 0.06 | | | 0.02 |
Net realized and unrealized gain (loss) on investments | | | 1.27 | | | 1.55 | | | 0.66 | | | (0.48) | | | 3.38 | | | 0.79 |
Total from investment operations | | | 1.26 | | | 1.59 | | | 0.71 | | | (0.43) | | | 3.44 | | | 0.81 |
Less distributions:
| | | | | | | | | | | | | | | | | | |
Dividends from net investment income | | | (0.02) | | | (0.04) | | | (0.04) | | | (0.04) | | | (0.05) | | | — |
Total distributions | | | (0.02) | | | (0.04) | | | (0.04) | | | (0.04) | | | (0.05) | | | — |
Net asset value, end of period | | | $ 17.19 | | | $ 15.95 | | | $ 14.40 | | | $13.73 | | | $ 14.20 | | | $10.81 |
Total return(3) | | | 7.88% | | | 11.09% | | | 5.23% | | | −3.02% | | | 31.94% | | | 8.10% |
Supplemental data and ratios:
| | | | | | | | | | | | | | | | | | |
Net assets, end of period (000’s) | | | $ 2,637 | | | $ 2,482 | | | $ 2,526 | | | $2,145 | | | $ 1,700 | | | $454 |
Ratio of expenses to average net assets
| | | | | | | | | | | | | | | | | | |
Before waivers and reimbursements of expenses(4) | | | 1.46% | | | 1.52% | | | 1.61% | | | 1.64% | | | 2.68% | | | 33.40% |
After waivers and reimbursements of expenses(4) | | | 1.25% | | | 1.25% | | | 1.25% | | | 1.25% | | | 1.25% | | | 1.25% |
Ratio of net investment income to average net assets
| | | | | | | | | | | | | | | | | | |
Before waivers and reimbursements of expenses(4) | | | (0.30)% | | | 0.04% | | | 0.02% | | | (0.06)% | | | (0.92)% | | | (30.52)% |
After waivers and reimbursements of expenses(4) | | | (0.09)% | | | 0.31% | | | 0.38% | | | 0.33% | | | 0.51% | | | 1.63% |
Portfolio turnover rate(3) | | | 8.09% | | | 11.76% | | | 16.82% | | | 3.04% | | | 4.05% | | | 0.00% |
| | | | | | | | | | | | | | | | | | | |
(1)
| The Fund commenced operations on April 15, 2020. |
(2)
| Per share amounts are calculated using the average shares outstanding method. |
(3)
| Not annualized for periods less than one year. |
(4)
| Annualized for periods less than one year. |
The accompanying notes are an integral part of these financial statements.
TABLE OF CONTENTS
Jensen Global Quality Growth Fund
Financial Highlights
Class I
| | | | | | | |
Per Share Data:
| | | | | | | | | | | | | | | | | | |
Net asset value, beginning of period | | | $ 15.95 | | | $ 14.40 | | | $ 13.75 | | | $14.21 | | | $ 10.81 | | | $10.00 |
Income (LOSS) from investment operations:
| | | | | | | | | | | | | | | | | | |
Net investment income(2) | | | 0.01 | | | 0.08 | | | 0.08 | | | 0.09 | | | 0.11 | | | 0.02 |
Net realized and unrealized gain (loss) on investments | | | 1.27 | | | 1.55 | | | 0.65 | | | (0.48) | | | 3.37 | | | 0.79 |
Total from investment operations | | | 1.28 | | | 1.63 | | | 0.73 | | | (0.39) | | | 3.48 | | | 0.81 |
Less distributions:
| | | | | | | | | | | | | | | | | | |
Dividends from net investment income | | | (0.03) | | | (0.08) | | | (0.08) | | | (0.07) | | | (0.08) | | | — |
Total distributions | | | (0.03) | | | (0.08) | | | (0.08) | | | (0.07) | | | (0.08) | | | — |
Net asset value, end of period | | | $ 17.20 | | | $ 15.95 | | | $ 14.40 | | | $13.75 | | | $ 14.21 | | | $10.81 |
Total return(3) | | | 8.07% | | | 11.33% | | | 5.39% | | | −2.74% | | | 32.27% | | | 8.10% |
Supplemental data and ratios:
| | | | | | | | | | | | | | | | | | |
Net assets, end of period (000’s) | | | $ 3,066 | | | $ 2,813 | | | $ 2,249 | | | $2,350 | | | $ 1,842 | | | $227 |
Ratio of expenses to average net assets
| | | | | | | | | | | | | | | | | | |
Before waivers and reimbursements of expenses(4) | | | 1.23% | | | 1.29% | | | 1.36% | | | 1.42% | | | 2.11% | | | 33.49% |
After waivers and reimbursements of expenses(4) | | | 1.02% | | | 1.02% | | | 1.02% | | | 1.02% | | | 1.02% | | | 1.02% |
Ratio of net investment income to average net assets
| | | | | | | | | | | | | | | | | | |
Before waivers and reimbursements of expenses(4) | | | (0.07)% | | | 0.27% | | | 0.28% | | | 0.17% | | | (0.28)% | | | (30.60)% |
After waivers and reimbursements of expenses(4) | | | 0.14% | | | 0.54% | | | 0.62% | | | 0.57% | | | 0.81% | | | 1.87% |
Portfolio turnover rate(3) | | | 8.09% | | | 11.76% | | | 16.82% | | | 3.04% | | | 4.05% | | | 0.00% |
| | | | | | | | | | | | | | | | | | | |
(1)
| The Fund commenced operations on April 15, 2020. |
(2)
| Per share amounts are calculated using the average shares outstanding method. |
(3)
| Not annualized for periods less than one year. |
(4)
| Annualized for periods less than one year. |
The accompanying notes are an integral part of these financial statements.
TABLE OF CONTENTS
Jensen Global Quality Growth Fund
Financial Highlights
Class Y
| | | | | | | |
Per Share Data:
| | | | | | | | | | | | | | | | | | |
Net asset value, beginning of period | | | $15.96 | | | $14.41 | | | $13.75 | | | $14.21 | | | $10.81 | | | $10.00 |
Income (LOSS) from investment operations:
| | | | | | | | | | | | | | | | | | |
Net investment income(2) | | | 0.01 | | | 0.08 | | | 0.08 | | | 0.09 | | | 0.11 | | | 0.03 |
Net realized and unrealized gain (loss) on investments | | | 1.27 | | | 1.55 | | | 0.66 | | | (0.48) | | | 3.37 | | | 0.78 |
Total from investment operations | | | 1.28 | | | 1.63 | | | 0.74 | | | (0.39) | | | 3.48 | | | 0.81 |
Less distributions:
| | | | | | | | | | | | | | | | | | |
Dividends from net investment income | | | (0.03) | | | (0.08) | | | (0.08) | | | (0.07) | | | (0.08) | | | — |
Total distributions | | | (0.03) | | | (0.08) | | | (0.08) | | | (0.07) | | | (0.08) | | | — |
Net asset value, end of period | | | $17.21 | | | $15.96 | | | $14.41 | | | $13.75 | | | $14.21 | | | $10.81 |
Total return(3) | | | 8.07% | | | 11.35% | | | 5.48% | | | −2.72% | | | 32.29% | | | 8.10% |
Supplemental data and ratios:
| | | | | | | | | | | | | | | | | | |
Net assets, end of period (000’s) | | | $ 56,940 | | | $ 50,316 | | | $ 39,536 | | | $ 33,361 | | | $ 23,555 | | | $1,206 |
Ratio of expenses to average net assets
| | | | | | | | | | | | | | | | | | |
Before waivers and reimbursements of expenses(4) | | | 1.21% | | | 1.27% | | | 1.36% | | | 1.40% | | | 2.15% | | | 32.29% |
After waivers and reimbursements of expenses(4) | | | 1.00% | | | 1.00% | | | 1.00% | | | 1.00% | | | 1.00% | | | 1.00% |
Ratio of net investment income to average net assets
| | | | | | | | | | | | | | | | | | |
Before waivers and reimbursements of expenses(4) | | | (0.06)% | | | 0.30% | | | 0.27% | | | 0.18% | | | (0.32)% | | | (29.29)% |
After waivers and reimbursements of expenses(4) | | | 0.15% | | | 0.57% | | | 0.63% | | | 0.58% | | | 0.82% | | | 2.00% |
Portfolio turnover rate(3) | | | 8.09% | | | 11.76% | | | 16.82% | | | 3.04% | | | 4.05% | | | 0.00% |
| | | | | | | | | | | | | | | | | | | |
(1)
| The Fund commenced operations on April 15, 2020. |
(2)
| Per share amounts are calculated using the average shares outstanding method. |
(3)
| Not annualized for periods less than one year. |
(4)
| Annualized for periods less than one year. |
The accompanying notes are an integral part of these financial statements.
TABLE OF CONTENTS
Jensen Quality Growth ETF
Financial Highlights
| | | | |
Per Share Data:
| | | |
Net asset value, beginning of period | | | $25.00 |
Income from investment operations:
| | | |
Net investment income(2) | | | 0.06 |
Net realized and unrealized gain on investments | | | 1.97 |
Total from investment operations | | | 2.03 |
Less distributions:
| | | |
Dividends from net investment income | | | (0.02) |
Total distributions | | | (0.02) |
Net asset value, end of period | | | $27.01 |
Total return(3)(5) | | | 8.12% |
Supplemental data and ratios:
| | | |
Net assets, end of period (000’s) | | | $ 68,327 |
Ratio of expenses to average net assets(4) | | | 0.57% |
Ratio of net investment income to average net assets(4) | | | 0.71% |
Portfolio turnover rate(3) | | | 10.43% |
| | | | |
(1)
| The Fund commenced operations on August 12, 2024. |
(2)
| Per share amounts are calculated using the average shares outstanding method. |
(3)
| Not annualized for periods less than one year. |
(4)
| Annualized for periods less than one year. |
(5)
| Total return represents the rate that investor would have earned or lost on an investment in the Fund, assuming reinvestment of dividends. Total return for a period less than one year is not annualized. Total return represented is total return of Net Asset Value. Total return of the Market Value is 8.37% for the period ended November 30, 2024. |
The accompanying notes are an integral part of these financial statements.
TABLE OF CONTENTS
Notes to Financial Statements
November 30, 2024 (Unaudited)
1. ORGANIZATION
Trust for Professional Managers (the “Trust”) was organized as a Delaware statutory trust under a Declaration of Trust dated May 29, 2001. The Trust is registered under the Investment Company Act of 1940, as amended (the “1940 Act”), as an open-end management investment company. The Jensen Quality Mid Cap Fund (formerly known as the Jensen Quality Value Fund from March 30, 2012 to September 30, 2024 and prior hereto as the Jensen Value Fund), the Jensen Global Quality Growth Fund (collectively, the “Mutual Funds”), and the Jensen Quality Growth ETF (each, a “Fund,” and together, the “Funds”), each represent a distinct series with its own investment objective and policies within the Trust.
The investment objective of each of the Jensen Quality Mid Cap Fund, the Jensen Global Quality Growth Fund and the Jensen Quality Growth ETF is long-term capital appreciation. The Trust may issue an unlimited number of shares of beneficial interest at $0.001 par value. The assets of the Funds are segregated, and a shareholder’s interest is limited to the Fund in which shares are held. The Class J and Class I shares of the Jensen Quality Mid Cap Fund became effective and commenced operations on March 31, 2010. The Class Y shares of the Jensen Quality Mid Cap Fund became effective and commenced operations on January 15, 2020. The Jensen Global Quality Growth Fund commenced investment operations on April 15, 2020 for Class J, Class I, and Class Y shares. The Jensen Quality Growth ETF commenced operations on August 12, 2024. For the Mutual Funds, Class J shares are subject to a 0.25% distribution (Rule 12b-1) and shareholder servicing fee and Class I shares are subject to a shareholder servicing fee of up to 0.10%. Each class of shares has identical rights and privileges except with respect to the distribution (Rule 12b-1) and shareholder servicing fees, and voting rights on matters affecting a single share class. Costs incurred by the Funds in connection with the organization, registration and the initial public offering of shares were paid by Jensen Investment Management, Inc. (the “Adviser”), the Funds’ investment adviser.
The Funds are investment companies and accordingly follow the investment company accounting and reporting guidance of the Financial Accounting Standards Board (“FASB”) Accounting Standards Codification Topic 946, Financial Services–Investment Companies.
2. SIGNIFICANT ACCOUNTING POLICIES
The following is a summary of significant accounting policies consistently followed by the Funds in the preparation of the financial statements. These policies are in conformity with generally accepted accounting principles in the United States of America (“GAAP”).
(a)
Investment Valuation – Each equity security owned by the Funds that is listed on a securities exchange, except those listed on the NASDAQ Stock Market LLC (“NASDAQ”), is valued at its last sale price on that exchange on the date as of which assets are valued. If a security is listed on more than one exchange, the Funds will use the price of the exchange that the Funds generally consider to be the principal exchange on which the stock is traded.
Fund securities listed on NASDAQ will be valued at the NASDAQ Official Closing Price, which may not necessarily represent the last sale price. If there has been no sale on such exchange or on NASDAQ on such day, the security is valued at (i) the mean between the most recent quoted bid and asked prices at the close of the exchange or (ii) the latest sales price on the Composite Market for the day such security is being valued. “Composite Market” means a consolidation of the trade information provided by national securities and foreign exchanges and over-the-counter markets, as published by an approved independent pricing service (“Pricing Service”).
Foreign securities will be priced in their local currencies as of the close of their primary exchange or market or as of the time a Fund calculates its net asset value (“NAV”), whichever is earlier. Foreign securities, currencies and other assets denominated in foreign currencies are then translated into U.S. dollars at the exchange rate of such currencies
TABLE OF CONTENTS
Notes to Financial Statements
November 30, 2024 (Unaudited)(Continued)
against the U.S. dollar, as provided by a Pricing Service or reporting agency. All assets denominated in foreign currencies will be converted into U.S. dollars using the applicable currency exchange rates as of the close of the New York Stock Exchange (“NYSE”), generally 4:00 p.m. Eastern Time.
Foreign securities are traded on foreign exchanges which typically close before the close of business on each day on which the NYSE is open. Each security trading on these exchanges may be valued utilizing a systematic fair valuation model provided by a Pricing Service. The valuation of each security that meets certain criteria in relation to the valuation model is systematically adjusted to reflect the impact of movement in the U.S. market after the foreign markets close and are classified as Level 2 securities. Securities that do not meet the criteria, or that are principally traded in other foreign markets, are valued as of the last reported sale price at the time the respective Fund determines its NAV, or when reliable market prices or quotations are not readily available, at the mean between the most recent bid and asked quotations as of the close of the appropriate exchange or other designated time.
Debt securities, including short-term debt instruments having a maturity of 60 days or less, are valued at the mean in accordance with prices supplied by a Pricing Service. Pricing Services may use various valuation methodologies such as the mean between the bid and the asked prices, matrix pricing and other analytical pricing models as well as market transactions and dealer quotations. If a price is not available from a Pricing Service, the most recent quotation obtained from one or more broker-dealers known to follow the issue will be obtained. Quotations will be valued at the mean between the bid and the offer. In the absence of available quotations, the securities will be priced at fair value, as described below. Any discount or premium is accreted or amortized using the constant yield method until maturity.
Redeemable securities issued by open-end, registered investment companies, including money market mutual funds, are valued at the NAV of such companies for purchase and/or redemption orders placed on that day. If, on a particular day, a share of an investment company is not listed on NASDAQ, such security’s fair value will be determined.
When market quotations are not readily available, any security or other asset is valued at its fair value in accordance with Rule 2a-5 of the 1940 Act as determined under the Adviser’s fair value pricing procedures, subject to oversight by the Board of Trustees. These fair value procedures will also be used to price a security when corporate events, events in the securities market or world events cause the Adviser to believe that a security’s last sale price may not reflect its actual fair value. The intended effect of using fair value pricing procedures is to ensure that the Funds are accurately priced. The Adviser will regularly evaluate whether the Funds’ fair value pricing procedures continue to be appropriate in light of the specific circumstances of the Funds and the quality of prices obtained through the application of such procedures.
FASB Accounting Standards Codification, Fair Value Measurements and Disclosures (“ASC 820”) Topic 820, establishes an authoritative definition of fair value and sets out a hierarchy for measuring fair value. ASC 820 requires an entity to evaluate certain factors to determine whether there has been a significant decrease in volume and level of activity for the security such that recent transactions and quoted prices may not be determinative of fair value and further analysis and adjustment may be necessary to estimate fair value. ASC 820 also requires enhanced disclosure regarding the inputs and valuation techniques used to measure fair value in those instances as well as expanded disclosure of valuation levels for each class of investments. These inputs are summarized in the three broad levels listed below:
Level 1 – Quoted prices in active markets for identical securities.
Level 2 –
Other significant observable inputs (including quoted prices for similar securities, interest rates, prepayment speeds, credit risk, etc.).
TABLE OF CONTENTS
Notes to Financial Statements
November 30, 2024 (Unaudited)(Continued)
Level 3 –
Significant unobservable inputs (including a Fund’s own assumptions in determining the fair value of investments).
The inputs or methodology used for valuing securities are not necessarily an indication of the risk associated with investing in those securities. The following is a summary of the inputs used to value each Fund’s investments carried at fair value as of November 30, 2024:
Jensen Quality Mid Cap Fund
| | | | | | | | | | | | | |
Common Stock(1) | | | $211,829,560 | | | $— | | | $ — | | | $211,829,560 |
Money Market Funds | | | 3,426,550 | | | — | | | — | | | 3,426,550 |
Total Investments | | | $215,256,110 | | | $— | | | $ — | | | $215,256,110 |
| | | | | | | | | | | | | |
Jensen Global Quality Growth Fund
| | | | | | | | | | | | | |
Common Stock(1) | | | $44,857,458 | | | $15,855,497 | | | $ — | | | $60,712,955 |
Money Market Funds | | | 1,903,376 | | | — | | | — | | | 1,903,376 |
Total Investments | | | $46,760,834 | | | $15,855,497 | | | $— | | | $62,616,331 |
| | | | | | | | | | | | | |
Jensen Quality Growth ETF
| | | | | | | | | | | | | |
Common Stock(1) | | | $67,309,827 | | | $— | | | $ — | | | $67,309,827 |
Money Market Funds | | | 995,803 | | | — | | | — | | | 995,803 |
Total Investments | | | $68,305,630 | | | $— | | | $— | | | $68,305,630 |
| | | | | | | | | | | | | |
(1)
| Refer to the Schedules of Investments for industry classifications.The Funds did not hold any investments during the six months ended November 30, 2024, with significant unobservable inputs which would be classified as Level 3. The Funds did not hold financial derivative instruments during the six months ended November 30, 2024. |
(b)
Foreign Securities and Currency – Investment securities and other assets and liabilities denominated in foreign currencies are translated into U.S. dollar amounts on the date of valuation. Purchases and sales of investment securities and income and expense items denominated in foreign currencies are translated into U.S. dollar amounts on the respective dates of such transactions.
The Funds do not isolate the portion of the results of operations from changes in foreign exchange rates on investments from those resulting from the changes in market prices of securities held. Reported net realized foreign exchange gains or losses arise from sales of portfolio securities, sales and maturities of short-term securities, sales of foreign currencies, currency gains or losses realized between trade and settlement dates on securities transactions, and the difference between the amounts of dividends, interest and foreign withholding taxes recorded on the Funds’ books, and the U.S. dollar equivalent of the amounts actually received or paid. Net unrealized foreign exchange gains and losses arise from changes in the values of assets and liabilities, including investments in securities at fiscal period end, resulting from changes in the exchange rate.
Investments in foreign securities entail certain risks. Individual foreign economies of certain countries may differ favorably or unfavorably from the U.S. economy in such respects as growth of gross national product, rate of inflation, capital reinvestment, resource self-sufficiency, diversification and balance of payments position. The internal politics of certain foreign countries may not be as stable as those of the United States. Since foreign securities normally are
TABLE OF CONTENTS
Notes to Financial Statements
November 30, 2024 (Unaudited)(Continued)
denominated and traded in foreign currencies, the value of a Fund’s assets may be affected favorably or unfavorably by currency exchange rates, currency exchange control regulations, foreign withholding taxes, and restrictions or prohibitions on the repatriation of foreign currencies. There may be less information publicly available about a foreign issuer than about a U.S. issuer, and foreign issuers are not generally subject to accounting, auditing, and financial reporting standards and practices comparable to those in the United States. The securities of some foreign issuers are less liquid and at times more volatile than securities of comparable U.S. issuers.
(c)
| Federal Income Taxes – Each Fund intends to comply with the requirements of Subchapter M of the Internal Revenue Code necessary to qualify as a regulated investment company and to make the requisite distributions of income and capital gains to their shareholders sufficient to relieve them from all or substantially all federal income taxes. Therefore, no federal income tax provision has been provided. |
As of and during the six months ended November 30, 2024, the Funds did not have a liability for any unrecognized tax benefits. The Funds recognize interest and penalties, if any, related to uncertain tax benefits as income tax expense in the Statements of Operations. During the six months ended November 30, 2024, the Funds did not incur any interest or penalties. The Funds’ federal income tax returns are subject to examination by the Internal Revenue Service (the “IRS”) for a period of three fiscal years after they are filed. The Funds have no examinations in progress. The Funds are also not aware of any tax provisions for which it is reasonably possible that the total amounts of unrecognized tax benefits will significantly change in the next twelve months.
(d)
| Distributions to Shareholders – The Funds will declare and distribute any net investment income quarterly. The Funds will distribute any net realized long- or short-term capital gains at least annually. Distributions from net realized gains for book purposes may include short- term capital gains. All short-term capital gains are included in ordinary income for tax purposes. Distributions to shareholders are recorded on the ex-dividend date. The Funds may also pay a special distribution at the end of the calendar year to comply with federal tax requirements. The Funds may utilize earnings and profits distributed to shareholders on redemption of shares as part of the dividend paid deduction. |
(e)
| Use of Estimates – The preparation of financial statements in conformity with GAAP requires management to make estimates and assumptions that affect the reported amounts of assets and liabilities and disclosure of contingent assets and liabilities at the date of the financial statements and the reported amounts of revenues and expenses during the reporting period. Actual results could differ from those estimates. |
(f)
| Share Valuation – The NAV per share of each Fund is calculated by dividing the sum of the value of the securities held by each Fund, plus cash or other assets, minus all liabilities (including estimated accrued expenses) by the total number of shares outstanding for each Fund, rounded to the nearest cent. The Funds’ shares will not be priced on the days on which the NYSE is closed for trading. |
(g)
| Allocation of Income, Expenses and Gains/Losses – Income, expenses (other than those deemed attributable to a specific share class), and gains and losses of each Fund are allocated daily to each class of shares based upon the ratio of net assets represented by each class as a percentage of the net assets of the Fund. Expenses deemed directly attributable to a class of shares are recorded by the specific class. Most Fund expenses are allocated by class based on relative net assets. Distribution (12b-1) and shareholder servicing fees are expensed at 0.25% of average daily net assets of Class J shares of the Mutual Funds. Shareholder servicing fees are expensed at up to 0.10% of the average daily |
TABLE OF CONTENTS
Notes to Financial Statements
November 30, 2024 (Unaudited)(Continued)
net assets of Class I shares of the Mutual Funds. Expenses associated with a specific fund in the Trust are charged to that fund. Common Trust expenses are typically allocated evenly between the funds of the Trust, or by other equitable means.
(h)
| Other – Investment transactions are recorded on the trade date. The Funds determine the gain or loss from investment transactions using the specific identification method by comparing the original cost of the security lot sold with the net sale proceeds. Dividend income is recognized on the ex-dividend date and interest income is recognized on an accrual basis. |
Withholding taxes on foreign dividends, net of any reclaims, have been provided for in accordance with the Funds’ understanding of the applicable country’s tax rules and rates.
3. FEDERAL TAX MATTERS
The tax character of distributions paid during the fiscal years ended May 31, 2024 and May 31, 2023 was as follows:
Jensen Quality Mid Cap Fund
| | | | | | | |
Ordinary Income | | | $1,156,753 | | | $1,050,886 |
Long-Term Capital Gain | | | $— | | | $4,354,266 |
| | | | | | | |
Jensen Global Quality Growth Fund
| | | | | | | |
Ordinary Income | | | $250,896 | | | $251,052 |
Long-Term Capital Gain | | | $— | | | $— |
| | | | | | | |
The components of distributable earnings on a tax basis as of May 31, 2024 were as follows:
| | | | | | | |
Cost basis of investments for federal income tax purposes | | | $160,901,537 | | | $44,972,903 |
Gross tax unrealized appreciation | | | $42,801,862 | | | $12,102,210 |
Gross tax unrealized depreciation | | | (7,170,031) | | | (1,512,360) |
Net tax unrealized appreciation | | | 35,631,831 | | | 10,589,850 |
Undistributed ordinary income | | | 154,293 | | | 54,758 |
Undistributed long-term capital gain | | | 5,071,166 | | | — |
Distributable earnings | | | 5,225,459 | | | 54,758 |
Other accumulated losses | | | — | | | (755,970) |
Total distributable earnings | | | $40,857,290 | | | $9,888,638 |
| | | | | | | |
The difference between book basis and tax basis of investments is primarily attributable to the deferral of losses on wash sales.
At May 31, 2024, the Jensen Global Quality Growth Fund had short-term capital loss carryovers of $232,322 and long-term capital loss carryovers of $523,855 with no expiration. During the year ended May 31, 2024, the Jensen Quality Mid Cap Fund utilized $5,222,132 of capital loss carryovers.
Additionally, GAAP requires that certain components of net assets relating to permanent differences be reclassified between financial and tax reporting. These reclassifications have no effect on net assets or NAV per share.
For the year ended May 31, 2024, no reclassifications were made between total distributable earnings and paid in capital.
TABLE OF CONTENTS
Notes to Financial Statements
November 30, 2024 (Unaudited)(Continued)
The Jensen Quality Growth ETF had not commenced operations as of May 31, 2024.
4. INVESTMENT ADVISER
The Trust has an Investment Advisory Agreement (the “Mutual Fund Agreement”) with the Adviser to furnish investment advisory services to the Jensen Quality Mid Cap Fund and Jensen Global Quality Growth Fund. Under the terms of the Mutual Fund Agreement, the Mutual Funds compensate the Adviser for its management services at the annual rate of 0.65% and 0.75% of each Fund’s average daily net assets for the Jensen Quality Mid Cap Fund and Jensen Global Quality Growth Fund, respectively.
The Adviser has contractually agreed to waive its management fee and/or reimburse a Mutual Fund’s other expenses at least through the expiration dates listed below to the extent necessary to ensure that each Fund’s Total Annual Operating Expenses (exclusive of front-end or contingent deferred sales loads, Rule 12b-1 plan fees, shareholder servicing plan fees, taxes, leverage (i.e., any expenses incurred in connection with borrowings made by the Fund), interest (including interest incurred in connection with bank and custody overdrafts), brokerage commissions and other transactional expenses, expenses incurred in connection with any merger or reorganization, dividends or interest expenses on short positions, acquired fund fees and expenses and extraordinary expenses such as litigation) do not exceed the expense limitation caps listed below of each Fund’s average daily net assets (the “Expense Limitation Cap”).
| | | | | | | |
Jensen Quality Mid Cap Fund | | | September 30, 2025 | | | 0.80% |
Jensen Global Quality Growth Fund | | | September 30, 2025 | | | 1.00% |
| | | | | | | |
For the six months ended November 30, 2024, expenses of $3,790, $12,086 and $9,245 were waived or reimbursed by the Adviser for Class J, Class I and Class Y shares, respectively, for the Jensen Quality Mid Cap Fund. For the six months ended November 30, 2024, expenses of $2,734, $3,145 and $56,496 were waived or reimbursed by the Adviser for Class J, Class I and Class Y shares, respectively, for the Jensen Global Quality Growth Fund. Any such waiver or reimbursement is subject to later adjustment to allow the Adviser to recoup amounts waived or reimbursed to the extent actual fees and expenses for a fiscal period do not exceed the lesser of: (1) the Expense Limitation Cap in place at the time of waiver or reimbursement or (2) the Expense Limitation Cap in place at the time of the recoupment; provided, however, that the Adviser shall only be entitled to recoup such amounts over the following three-year period from the date of the waiver or reimbursement. During the six months ended November 30, 2024, $37,811 of previously waived expenses subject to recovery for the Jensen Quality Mid Cap Fund and $71,909 of previously waived expenses subject to recovery for the Jensen Global Quality Growth Fund expired.
The following table shows the remaining waived or reimbursed expenses subject to potential recovery expiring during the fiscal year/period ending:
| | | | | | | |
May 31, 2025 | | | $72,473 | | | $66,594 |
May 31, 2026 | | | $ 85,638 | | | $147,282 |
May 31, 2027 | | | $ 59,040 | | | $131,328 |
November 30, 2027 | | | $ 25,121 | | | $62,375 |
| | | | | | | |
In addition, the Trust, on behalf of the Jensen Quality Growth ETF, has entered into an investment advisory agreement (the “ETF Agreement”) with the Adviser to furnish investment advisory services to the Jensen Quality Growth ETF. Pursuant to the ETF Agreement, the Jensen Quality Growth ETF pays a unitary management fee to the Adviser, which is calculated daily and paid monthly, at an annual rate of 0.57% of the Jensen Quality Growth ETF’s average daily net assets. Pursuant to the ETF Agreement, the Adviser has agreed to pay all expenses of the ETF except the unitary management fee paid to the Adviser under the ETF Agreement, interest charges on any borrowings, dividends and other expenses on securities sold short, taxes, brokerage commissions and other expenses incurred in placing orders for the
TABLE OF CONTENTS
Notes to Financial Statements
November 30, 2024 (Unaudited)(Continued)
purchase and sale of securities and other investment instruments, acquired fund fees and expenses, accrued deferred tax liability, extraordinary expenses, distribution fees and expenses paid by the ETF under any distribution plan adopted pursuant to Rule 12b-1 under the 1940 Act.
5. DISTRIBUTION AND SHAREHOLDER SERVICING PLAN
The Trust adopted a distribution and shareholder servicing plan pursuant to Rule 12b-1 (the
“12b-1 Plan”), on behalf of the Jensen Quality Mid Cap Fund and Jensen Global Quality Growth Fund, which authorizes Class J shares to pay Quasar Distributors, LLC (the “Distributor” or “Quasar”), the Mutual Funds’ distributor and principal underwriter, a distribution fee of 0.25% of a Fund’s average daily net assets attributable to Class J shares for services to Class J shareholders and distribution of Class J shares. The Trust adopted a shareholder servicing plan (the “Shareholder Servicing Plan”), on behalf of the Mutual Funds, which authorizes Class I shares to pay up to 0.10% of a Mutual Fund’s average daily net assets attributable to Class I shares to other financial institutions for shareholder servicing and maintenance of Class I shareholder accounts. The Distributor acts as the Mutual Funds’ principal underwriter in a continuous public offering of the Mutual Funds’ shares. Fees incurred for the six months ended November 30, 2024, and owed as of November 30, 2024 are summarized below. The fees owed to the Distributor are included within accrued expenses and other liabilities on the Statements of Assets and Liabilities.
| | | | | | | |
Jensen Quality Mid Cap Fund | | | $38,827 | | | $13,317 |
Jensen Global Quality Growth Fund | | | $3,242 | | | $3,123 |
| | | | | | | |
| | | | | | | |
Jensen Quality Mid Cap Fund | | | $9,885 | | | $1,059 |
Jensen Global Quality Growth Fund | | | $299 | | | $164 |
| | | | | | | |
6. RELATED PARTY TRANSACTIONS
U.S. Bancorp Fund Services, LLC, doing business as U.S. Bank Global Fund Services (“Fund Services” or the “Administrator”), acts as the Funds’ Administrator under an Administration Agreement. The Administrator prepares various federal and state regulatory filings, reports and returns for the Funds; prepares reports and materials to be supplied to the Trustees; monitors the activities of the Funds’ custodian, transfer agent and fund accountant; coordinates the preparation and payment of the Funds’ expenses and reviews the Funds’ expense accruals. Fees incurred for the Mutual Funds for the six months ended November 30, 2024, and owed as of November 30, 2024 are as follows:
| | | | | | | |
Jensen Quality Mid Cap Fund | | | $26,126 | | | $1,588 |
Jensen Global Quality Growth Fund | | | $12,767 | | | $— |
| | | | | | | |
Fund Services also serves as the fund accountant and transfer agent to the Funds. U.S. Bank National Association (“US Bank”), an affiliate of Fund Services, serves as the Funds’ custodian. Fees incurred for the Mutual Funds for the six months ended November 30, 2024 and owed as of November 30, 2024 for fund accounting, transfer agency, and custody fees are as follows:
| | | | | | | |
Jensen Quality Mid Cap Fund | | | $22,134 | | | $7,125 |
Jensen Global Quality Growth Fund | | | $14,346 | | | $5,184 |
| | | | | | | |
| | | | | | | |
Jensen Quality Mid Cap Fund | | | $38,352 | | | $15,435 |
Jensen Global Quality Growth Fund | | | $25,431 | | | $8,994 |
| | | | | | | |
TABLE OF CONTENTS
Notes to Financial Statements
November 30, 2024 (Unaudited)(Continued)
| | | | | | | |
Jensen Quality Mid Cap Fund | | | $4,378 | | | $1,071 |
Jensen Global Quality Growth Fund | | | $5,941 | | | $1,193 |
| | | | | | | |
Under the terms of the ETF Agreement, the Adviser pays the fund administration and accounting, transfer agency and custody fees for the Jensen Quality Growth ETF.
The Jensen Quality Mid Cap Fund and Jensen Global Quality Growth Fund have lines of credit with US Bank (see Note 11).
Certain officers of the Funds are also employees of Fund Services. A Trustee of the Trust is affiliated with Fund Services and US Bank.
The Trust’s Chief Compliance Officer is also an employee of Fund Services. Each Mutual Fund’s allocation of the Trust’s Chief Compliance Officer fees incurred for the six months ended November 30, 2024, and owed as of November 30, 2024 were as follows:
| | | | | | | |
Jensen Quality Mid Cap Fund | | | $6,222 | | | $2,131 |
Jensen Global Quality Growth Fund | | | $6,222 | | | $2,132 |
| | | | | | | |
Under the terms of the ETF Agreement, the Adviser pays the Chief Compliance Officer fees for the Jensen Quality Growth ETF.
7. CREATION AND REDEMPTION TRANSACTIONS
Shares of the Jensen Quality Growth ETF are listed and traded on the NYSE Arca, Inc. The Jensen Quality Growth ETF issues and redeems shares on a continuous basis at NAV only in large blocks of shares called “Creation Units.” Creation Units are to be issued and redeemed principally in kind for a basket of securities and a balancing cash amount. Shares generally will trade in the secondary market in amounts less than a Creation Unit at market prices that change throughout the day. Market prices for the shares may be different from their NAV. The NAV is determined as of the close of trading (generally, 4:00 p.m. Eastern Time) on each day the NYSE is open for trading. The NAV of the shares of the Jensen Quality Growth ETF will be equal to the Fund’s total assets minus the Fund’s total liabilities divided by the total number of shares outstanding. The NAV that is published will be rounded to the nearest cent; however, for purposes of determining the price of Creation Units, the NAV will be calculated to five decimal places.
Only “Authorized Participants” may purchase or redeem shares directly from the Jensen Quality Growth ETF. An Authorized Participant is either (i) a broker-dealer or other participant in the clearing process through the Continuous Net Settlement System of National Securities Clearing Corporation or (ii) a DTC participant and, in each case, must have executed a Participant Agreement with the Distributor. Most retail investors will not qualify as Authorized Participants or have the resources to buy and sell whole Creation Units. Therefore, they will be unable to purchase or redeem the shares directly from the Jensen Quality Growth ETF. Rather, most retail investors will purchase shares in the secondary market with the assistance of a broker and will be subject to customary brokerage commissions or fees. Securities received or delivered in connection with in-kind creates and redeems are valued as of the close of business on the effective date of the creation or redemption.
Creation Unit Transaction Fee
Authorized Participants will be required to pay to the Custodian a fixed transaction fee (the “Creation Transaction Fee”) in connection with the issuance of Creation Units. The standard Creation Transaction Fee will be the same regardless of the number of Creation Units purchased by an investor on the applicable Business Day. The Creation Transaction Fee for the Jensen Quality Growth ETF is $300.
An additional variable fee of up to a maximum of 2% of the value of the Creation Units subject to the transaction may be imposed for cash purchases, non-standard orders, or partial purchase of Creation
TABLE OF CONTENTS
Notes to Financial Statements
November 30, 2024 (Unaudited)(Continued)
Units. The variable charge is primarily designed to cover additional costs (e.g., brokerage, taxes) involved with buying the securities with cash. The Jensen Quality Growth ETF may determine to not charge a variable fee on certain orders when the Adviser has determined that doing so is in the best interests of the Jensen Quality Growth ETF’s shareholders.
A creation unit will generally not be issued until the transfer of good title of the deposit securities to the Jensen Quality Growth ETF and the payment of any cash amounts have been completed. To the extent contemplated by the applicable participant agreement, Creation Units of the Jensen Quality Growth ETF will be issued to such authorized participant notwithstanding the fact that the Fund’s deposits have not been received in part or in whole, in reliance on the undertaking of the authorized participant to deliver the missing deposit securities as soon as possible. If the Jensen Quality Growth ETF or its agents do not receive all of the deposit securities, or the required cash amounts, by such time, then the order may be deemed rejected and the authorized participant shall be liable to the Fund for losses, if any.
8. CAPITAL SHARE TRANSACTIONS
Transactions in shares of the Funds were as follows:
| | | | |
Class J
| | | | | | |
Shares sold | | | 133,684 | | | 276,014 |
Shares issued in reinvestment of dividends | | | 90,218 | | | 7,329 |
Shares redeemed | | | (193,671) | | | (480,660) |
Net increase (decrease) | | | 30,231 | | | (197,317) |
Class I
| | | | | | |
Shares sold | | | 370,442 | | | 1,321,365 |
Shares issued in reinvestment of dividends | | | 296,807 | | | 35,464 |
Shares redeemed | | | (428,530) | | | (2,301,358) |
Net increase (decrease) | | | 238,719 | | | (944,529) |
Class Y
| | | | | | |
Shares sold | | | 67,614 | | | 405,960 |
Shares issued in reinvestment of dividends | | | 230,323 | | | 23,792 |
Shares redeemed | | | (98,900) | | | (109,455) |
Net increase | | | 199,037 | | | 320,297 |
| | | | | | | |
| | | | |
Class J
| | | | | | |
Shares sold | | | 803 | | | 23,450 |
Shares issued in reinvestment of dividends | | | 155 | | | 502 |
Shares redeemed | | | (3,161) | | | (43,761) |
Net decrease | | | (2,203) | | | (19,809) |
Class I
| | | | | | |
Shares sold | | | 3,250 | | | 20,815 |
Shares issued in reinvestment of dividends | | | 376 | | | 797 |
Shares redeemed | | | (1,664) | | | (1,479) |
Net increase | | | 1,962 | | | 20,133 |
| | | | | | | |
TABLE OF CONTENTS
Notes to Financial Statements
November 30, 2024 (Unaudited)(Continued)
| | | | |
Class Y
| | | | | | |
Shares sold | | | 175,420 | | | 454,466 |
Shares issued in reinvestment of dividends | | | 7,003 | | | 15,153 |
Shares redeemed | | | (25,627) | | | (61,306) |
Net increase | | | 156,796 | | | 408,313 |
| | | | | | | |
| | | | |
Shares sold | | | 2,560,000 |
Shares issued in reinvestment of dividends | | | — |
Shares redeemed | | | (30,000) |
Net increase | | | 2,530,000 |
| | | | |
9. INVESTMENT TRANSACTIONS
The aggregate purchases and sales of securities, excluding short-term investments, for the Funds for the six months ended November 30, 2024 are summarized below. For the six months ended November 30, 2024, there were no purchases or sales of U.S. government securities for the Funds.
| | | | | | | |
Jensen Quality Mid Cap Fund | | | $35,823,621 | | | $38,197,948 |
Jensen Global Quality Growth Fund | | | $7,032,714 | | | $4,711,613 |
Jensen Quality Growth ETF | | | $509,172 | | | $3,392,567 |
| | | | | | | |
The above Jensen Quality Growth ETF purchases and sales exclude any in-kind transactions associated with creations and redemptions. During the period ended November 30, 2024, the Jensen Quality Growth ETF had $66,560,873 of creations in-kind and $0 of redemptions in-kind.
10. BENEFICIAL OWNERSHIP
The beneficial ownership, either directly or indirectly, of more than 25% of the voting securities of a fund creates a presumption of control of the fund under Section 2(a)(9) of the 1940 Act. At November 30, 2024, the following shareholders held over 25% of a Fund’s shares outstanding:
Jensen Quality Mid Cap Fund
| | | | |
Charles Schwab & Co. Inc. | | | 44.07% |
National Financial Services LLC | | | 32.35% |
| | | | |
TABLE OF CONTENTS
Notes to Financial Statements
November 30, 2024 (Unaudited)(Continued)
Jensen Global Quality Growth Fund
| | | | |
Wells Fargo Clearing Services LLC | | | 67.17% |
| | | | |
| | | | |
Charles Schwab & Co. Inc. | | | 87.90% |
| | | | |
11. LINE OF CREDIT
At November 30, 2024, the Jensen Quality Mid Cap Fund and Jensen Global Quality Growth Fund had lines of credit in the amount of the lesser of $12,000,000 and $5,000,000, respectively, or 33.33% and 20%, respectively, of the fair value of unencumbered assets of each Fund, which both mature August 2, 2025. These secured lines of credit are intended to provide short-term financing, if necessary, subject to certain restrictions, in connection with shareholder redemptions. The credit facility is with the Funds’ custodian, US Bank. Interest was scheduled to be incurred at the bank’s prime rate (8.50% as of November 30, 2024). The following table provides information regarding usage of the line of credit for the six months ended November 30, 2024 for the Funds. The Funds did not have outstanding balances on their line of credits as of November 30, 2024.
| | | | | | | | | | | | | | | | | | | |
Jensen Global Quality Growth Fund | | | 1 | | | $602,000 | | | 8.50% | | | $ 142 | | | $602,000 | | | 9/11/24 |
| | | | | | | | | | | | | | | | | | | |
*
| Interest expense is reported within Other Expenses on the Statements of Operations. |
12. RECENT MARKET EVENTS
U.S. and international markets have experienced and may continue to experience significant periods of volatility in recent years and months due to a number of economic, political and global macro factors including uncertainty regarding inflation and central banks’ interest rate changes, the possibility of a national or global recession, trade tensions, political events, the war between Russia and Ukraine, and significant conflict between Israel and Hamas in the Middle East. As a result of continuing political tensions and armed conflicts, including the war between Ukraine and Russia, the U.S. and the European Union imposed sanctions on certain Russian individuals and companies, including certain financial institutions, and have limited certain exports and imports to and from Russia. The war has contributed to recent market volatility and may continue to do so. Continuing market volatility as a result of recent market conditions or other events may have adverse effects on your account.
13. SUBSEQUENT EVENTS
In preparing these financial statements, the Funds have evaluated events and transactions for potential recognition or disclosure resulting from subsequent events after the Statements of Assets and Liabilities date of November 30, 2024 through the date the financial statements were issued.
The Jensen Quality Growth ETF paid a distribution as follows:
| | | | | | | | | | | | | | |
| | 12/19/24 | | | 12/19/24 | | | 12/20/24 | | | 0.04088046 | | | $108,742 |
| | | | | | | | | | | | | | |
TABLE OF CONTENTS
ADDITIONAL INFORMATION (Unaudited)
Shareholder Notification of Federal Tax Status
The Jensen Quality Mid Cap Fund and Jensen Global Quality Growth Fund each designated 100.00% of dividends declared during the fiscal year ended May 31, 2024 as dividends qualifying for the dividends received deduction available to corporate shareholders.
The Jensen Quality Mid Cap Fund and Jensen Global Quality Growth Fund each designated 100.00% of dividends declared from net investment income during the fiscal year ended May 31, 2024 as qualified dividend income under the Jobs and Growth Tax Relief Reconciliation Act of 2003.
The Jensen Quality Mid Cap Fund and Jensen Global Quality Growth Fund each designated 100.00% of taxable ordinary income distributions as short-term capital gain distributions under Internal Revenue Code Section 871(k)(2)(c) for the year ended May 31, 2024.
Additional Information Applicable to Foreign Shareholders Only:
The Jensen Quality Mid Cap Fund and Jensen Global Quality Growth Fund each designated 0.00% of ordinary income distributions as interest-related dividends under Internal Revenue Code Section 871(k)(1)(c).
TABLE OF CONTENTS
INVESTMENT Advisory Agreement Renewal (JENSEN MUTUAL FUNDS)
BASIS FOR TRUSTEES’ APPROVAL OF INVESTMENT ADVISORY AGREEMENT
The Board of Trustees (the “Trustees”) of Trust for Professional Managers (the “Trust”) met on August 15, 2024 to consider the renewal of the Investment Advisory Agreement (the “Agreement”) between the Trust, on behalf of the Jensen Quality Value Fund and the Jensen Global Quality Growth Fund (each, a “Fund,” and together, the “Funds”), each a series of the Trust, and Jensen Investment Management, Inc. (“Jensen”), the Funds’ investment adviser (the “Adviser”). The Trustees also met at a prior meeting held on June 20, 2024 (the “June 20, 2024 meeting”) to review materials related to the renewal of the Agreement. Prior to these meetings, the Trustees requested and received materials to assist them in considering the renewal of the Agreement. The materials provided contained information with respect to the factors enumerated below, including a copy of the Agreement, a memorandum prepared by the Trust’s outside legal counsel discussing in detail the Trustees’ fiduciary obligations and the factors they should assess in considering the renewal of the Agreement, detailed comparative information relating to the Funds’ performance, as well as the management fees and other expenses of the Funds, due diligence materials relating to the Adviser (including a due diligence questionnaire completed on behalf of the Funds by the Adviser, the Adviser’s Form ADV, select financial statements of the Adviser, biographical information of the Adviser’s key management and compliance personnel, comparative fee information for the Funds and a summary detailing key provisions of the Adviser’s written compliance program, including its code of ethics) and other pertinent information. The Trustees also received information periodically throughout the year that was relevant to the Agreement renewal process, including performance, management fee and other expense information. Based on their evaluation of the information provided by the Adviser, in conjunction with the Funds’ other service providers, the Trustees, by a unanimous vote (including a separate vote of the Trustees who are not “interested persons,” as that term is defined in the Investment Company Act of 1940, as amended (the “Independent Trustees”)), approved the continuation of the Agreement for an additional one-year term ending August 31, 2025.
DISCUSSION OF FACTORS CONSIDERED
In considering the renewal of the Agreement and reaching their conclusions, the Trustees reviewed and analyzed various factors that they determined were relevant, including the factors enumerated below.
1. NATURE, EXTENT AND QUALITY OF SERVICES PROVIDED TO THE FUNDS
The Trustees considered the nature, extent and quality of services provided by the Adviser to the Funds and the amount of time devoted to the Funds’ operations by the Adviser’s staff. The Trustees considered the Adviser’s specific responsibilities in all aspects of day-to-day management of the Funds, including the investment strategies implemented by the Adviser, as well as the qualifications, experience and responsibilities of Eric H. Schoenstein, Robert D. McIver, Allen T. Bond, Kevin J. Walkush and Jeffrey D. Wilson, the Jensen Global Quality Growth Fund’s portfolio managers, and Eric H. Schoenstein, Kurt M. Havnaer, Adam D. Calamar, and Tyra S. Pratt, the Jensen Quality Value Fund’s portfolio managers, and other key personnel at the Adviser involved in the day-to-day activities of the Funds. The Trustees reviewed information provided by the Adviser in a due diligence questionnaire, including the structure of the Adviser’s compliance program and its continuing commitment to the Funds. The Trustees noted that during the course of the prior year the Adviser had participated in a Trust board meeting to discuss the Funds’ performance and outlook, along with the compliance efforts made by the Adviser, including reports provided by the Adviser in its role as the Funds’ valuation designee. The Trustees also noted any services that extended beyond portfolio management, and they considered the brokerage practices of the Adviser. The Trustees discussed the Adviser’s handling of compliance matters, including the reports of the Trust’s chief compliance officer to the Trustees on the effectiveness of the Adviser’s compliance program. The Trustees also considered the Adviser’s overall financial condition, as well as the implementation and operational effectiveness of the Adviser’s business continuity plan. The Trustees concluded that the Adviser had sufficient quality and depth of personnel, resources, investment methods and compliance policies and procedures essential to performing its duties under the Advisory Agreement and that the nature, overall quality and extent of the management services provided to the Funds, as well as the Adviser’s compliance program, were satisfactory and reliable.
TABLE OF CONTENTS
INVESTMENT Advisory Agreement Renewal (JENSEN MUTUAL FUNDS)(Continued)
2. INVESTMENT PERFORMANCE OF THE FUNDS AND THE ADVISER
The Trustees discussed the performance of the Class I shares of the Jensen Global Quality Growth Fund and Jensen Quality Value Fund for the quarter, one-year, three-year, five year, ten-year and since inception periods ended March 31, 2024, as applicable. In assessing the quality of the portfolio management services delivered by the Adviser, the Trustees also compared the short-term and longer-term performance of the Class I shares of each Fund on both an absolute basis and in comparison to a benchmark index (the MSCI All Country World Index for the Jensen Global Quality Growth Fund and the Russell Midcap Total Return Index for the Jensen Quality Value Fund) and in comparison to a peer group of funds as constructed using publicly-available data provided by Morningstar, Inc. and presented by Barrington Financial Group, LLC d/b/a Barrington Partners, an independent third-party benchmarking firm, through its cohort selection process (a peer group of U.S. open-end global large-cap stock blend and global large-cap stock growth funds for the Jensen Global Quality Growth Fund and a peer group of U.S. open-end mid-cap blend funds for the Jensen Quality Value Fund) (each, a “Barrington Cohort”). The Trustees noted that the Adviser did not manage any other accounts with the same or similar investment strategies as either Fund.
The Trustees noted the Jensen Quality Value Fund’s performance for Class I shares for the one-year period ended March 31, 2024 was slightly below the Barrington Cohort average. The Trustees noted that the Jensen Quality Value Fund’s performance for Class I shares for the three-year, five-year and ten-year periods ended March 31, 2024 were above the Barrington Cohort average. The Trustees noted that for the three-year and five-year periods ended March 31, 2024, the Class I shares of the Jensen Quality Value Fund had outperformed the Russell Midcap Total Return Index. The Trustees noted that for the quarter, one-year, ten-year and since inception periods ended March 31, 2024, the Class I shares of the Jensen Quality Value Fund had underperformed the Russell Midcap Total Return Index.
The Trustees noted the Jensen Global Quality Growth Fund’s performance for Class I shares for the one-year period ended March 31, 2024 was below the Barrington Cohort average. The Trustees noted the Jensen Global Quality Growth Fund’s performance for Class I shares for the three-year period ended March 31, 2024 was above the Barrington Cohort average. The Trustees noted that for the quarter, one-year and since inception periods ended March 31, 2024, the Class I shares of the Jensen Global Quality Growth Fund had underperformed the MSCI All Country World Index. The Trustees noted that for the three-year period ended March 31, 2024, the Class I shares of the Jensen Global Quality Growth Fund had outperformed the MSCI All Country World Index.
After considering all of the information, the Trustees concluded that the performance obtained by the Adviser for each Fund was satisfactory under current market conditions. Although past performance is not a guarantee or indication of future results, the Trustees determined that each Fund and its shareholders were likely to benefit from the Adviser’s continued management.
3. COSTS OF SERVICES PROVIDED AND PROFITS REALIZED BY THE ADVISER
The Trustees considered the cost of services and the structure of the Adviser’s fees, including a review of the expense analyses and other pertinent material with respect to the Funds. The Trustees reviewed the related statistical information and other materials provided, including the comparative expenses and Barrington Cohort comparisons. The Trustees considered the cost structure of each Fund relative to its Barrington Cohort, as well as any fee waivers and expense reimbursements of the Adviser.
The Trustees also considered the overall profitability of the Adviser and reviewed the Adviser’s financial information and noted that the Adviser has subsidized each Fund’s operations since the Fund’s inception. The Trustees also examined the level of profits that could be expected to accrue to the Adviser from the fees payable under the Advisory Agreement, as well as the Funds’ brokerage practices. These considerations were based on materials requested by the Trustees and the Funds’ administrator specifically for the June 20, 2024 meeting and the August 15, 2024 meeting at which the Advisory Agreement was formally considered, as well as the reports prepared by the Adviser over the course of the year.
TABLE OF CONTENTS
INVESTMENT Advisory Agreement Renewal (JENSEN MUTUAL FUNDS)(Continued)
The Trustees noted that the Jensen Quality Value Fund’s contractual management fee of 0.65% was below the Barrington Cohort average of 0.72%. The Trustees noted that the Jensen Quality Value Fund was operating above its expense cap of 0.80% for Class I shares. The Trustees observed that the Jensen Quality Value Fund’s total expense ratio (net of fee waivers and expense reimbursements and including shareholder servicing plan fees of 0.02%) of 0.82% for Class I shares was below the Barrington Cohort average of 1.00%.
The Trustees noted that the Jensen Global Quality Growth Fund’s contractual management fee of 0.75% was below the Barrington Cohort average of 0.82%. The Trustees noted that the Jensen Global Quality Growth Fund was operating above its expense cap of 1.00% for Class I shares. The Trustees observed that the Jensen Quality Growth Fund’s total expense ratio (net of fee waivers and expense reimbursements and including shareholder servicing plan fees of 0.02%) of 1.02% for Class I shares was above the Barrington Cohort average of 0.94%.
The Trustees concluded that each Fund’s expenses and the management fees paid to the Adviser were fair and reasonable in light of the comparative performance, expense and management fee information. The Trustees further concluded, based on a profitability analysis prepared by the Adviser, that neither Fund was currently profitable to the Adviser after reflecting marketing and distribution expenses, but the Adviser maintained adequate profit levels to support the services to each Fund from the revenues of its overall investment advisory business, despite its subsidies to support each Fund’s operations.
4. EXTENT OF ECONOMIES OF SCALE AS THE FUNDS GROW
The Trustees compared each Fund’s expenses relative to its peer group and discussed realized and potential economies of scale. The Trustees also reviewed the structure of each Fund’s management fee and whether each Fund was large enough to generate economies of scale for shareholders or whether economies of scale would be expected to be realized as Fund assets grow (and if so, how those economies of scale were being or would be shared with shareholders). The Trustees reviewed all fee waivers, expense reimbursements and potential recoupments by the Adviser with respect to each Fund. The Trustees noted that each Fund’s management fee structure did not contain any breakpoint reductions as the Fund’s assets grow in size, but that the feasibility of incorporating breakpoints would continue to be reviewed on a regular basis. With respect to the Adviser’s fee structures, the Trustees concluded that the current fee structures were reasonable and reflected a sharing of economies of scale between the Adviser and each Fund at the Fund’s current asset level.
5. BENEFITS DERIVED FROM THE RELATIONSHIP WITH THE FUNDS
The Trustees considered the direct and indirect benefits that could be received by the Adviser from its association with the Funds. The Trustees examined the brokerage practices of the Adviser with respect to the Funds. The Trustees concluded that the benefits the Adviser may receive, such as greater name recognition and increased ability to attract additional investor assets, appear to be reasonable, and in many cases may benefit the Funds.
CONCLUSIONS
The Trustees considered all of the foregoing factors. In considering the renewal of the Advisory Agreement, the Trustees did not identify any one factor as all-important, but rather considered these factors collectively in light of the Funds’ surrounding circumstances. Based on this review, the Trustees, including a majority of the Independent Trustees, approved the continuation of the Advisory Agreement for an additional one-year term ending August 31, 2025 as being in the best interests of each Fund and its shareholders.
TABLE OF CONTENTS
INVESTMENT Advisory Agreement Approval (JENSEN QUALITY GROWTH ETF)
BASIS FOR TRUSTEES’ APPROVAL OF INVESTMENT ADVISORY AGREEMENT
The Board of Trustees (the “Trustees”) of Trust for Professional Managers (the “Trust”) met on June 20, 2024 to consider the initial approval of the Investment Advisory Agreement (the “Jensen ETF Advisory Agreement”) between the Trust, on behalf of the Jensen Quality Growth ETF (the “Jensen ETF” or the “Fund”), a series of the Trust, and Jensen Investment Management, Inc. (“Jensen”), the Jensen ETF’s investment adviser (the “Adviser”). In advance of the meeting, the Trustees requested and received materials to assist them in considering the approval of the Jensen ETF Advisory Agreement, including a memorandum provided by the Fund’s legal counsel, which outlined the Trustees’ responsibilities in considering the Jensen ETF Advisory Agreement. The materials provided contained information with respect to the factors enumerated below, including a copy of the Jensen ETF Advisory Agreement, detailed comparative information relating to the Fund’s performance, as well as the management fees and other expenses of the Fund, due diligence materials relating to the Adviser (including a due diligence questionnaire completed on behalf of the Fund by the Adviser, the Adviser’s Form ADV, select financial statements of the Adviser, biographical information of the Adviser’s key management and compliance personnel, comparative fee information for the Fund and the Adviser’s other separately-managed accounts and a summary detailing key provisions of the Adviser’s written compliance program, including its code of ethics) and other pertinent information.
Based on their evaluation of information provided by the Adviser, in conjunction with the Jensen ETF’s other service providers, the Trustees, by a unanimous vote (including a separate vote of the Trustees who are not “interested persons,” as that term is defined in the Investment Company Act of 1940, as amended (the “Independent Trustees”)), approved the Jensen ETF Advisory Agreement for an initial term ending two years following the Jensen ETF’s commencement of operations pursuant to an effective registration statement.
1. NATURE, EXTENT AND QUALITY OF SERVICES TO BE PROVIDED TO THE FUND
The Trustees considered the nature, extent and quality of services to be provided by the Adviser to the Jensen ETF and the amount of time to be devoted by the Adviser’s staff to the Jensen ETF’s operations. The Trustees considered the Adviser’s specific responsibilities in all aspects of day-to-day management of the Jensen ETF, as well as the qualifications, experience and responsibilities of Eric H. Schoenstein, Robert D. McIver, Kurt M. Havnaer, Allen T. Bond, Kevin J. Walkush and Adam D. Calamar, who will serve as co-portfolio managers for the Jensen ETF and other key personnel at the Adviser involved in the day-to-day activities of the Jensen ETF. The Trustees reviewed information provided by the Adviser in due diligence questionnaires, including the structure of the Adviser’s compliance program and discussed the Adviser’s commitment to the growth of assets for the Jensen ETF. The Trustees also noted any services that extended beyond portfolio management, and they considered the overall capability of the Adviser. The Trustees discussed the Adviser’s handling of compliance matters, including the reports of the Trust’s chief compliance officer to the Trustees on the effectiveness of the Adviser’s compliance program with respect to other series of the Trust managed by the Adviser. The Trustees also considered the Adviser’s overall financial condition, as well as the implementation and operational effectiveness of the Adviser’s business continuity plan. The Trustees concluded that the Adviser had sufficient quality and depth of personnel, resources, investment methods and compliance policies and procedures essential to performing its duties under the Jensen ETF Advisory Agreement and that the nature, overall quality and extent of the management services to be provided to the Jensen ETF, as well as the Adviser’s compliance program, were satisfactory and reliable.
2. INVESTMENT PERFORMANCE OF THE FUND AND THE ADVISER
In assessing the portfolio management services to be provided by the Adviser, the Trustees considered the investment management experience of Messrs. Schoenstein, McIver, Havnaer, Bond, Walkush, and Calamar, who will serve as co-portfolio managers for the Jensen ETF. Because the Jensen ETF had not yet commenced operations and did not have its own performance history, the Trustees considered the historical performance of The Jensen Quality Growth Fund Inc. (the “Jensen Mutual Fund”), an Oregon corporation and a separate registered investment company operating as an open-end
TABLE OF CONTENTS
INVESTMENT Advisory Agreement Approval (JENSEN QUALITY GROWTH ETF)(Continued)
mutual fund and managed by the Adviser utilizing the same or similar investment strategies as that to be employed for the Jensen ETF. The Trustees compared the performance of the Class I shares of the Jensen Mutual Fund to the S&P 500 Index for the quarter, one-year, three-year, five-year and 10-year periods ended March 31, 2024. The Trustees also noted the performance of other accounts managed by the Adviser with the same or similar investment strategies as that to be employed for the Jensen ETF. After considering all of the information, the Trustees determined that the Jensen ETF and its shareholders were likely to benefit from the Adviser’s management.
3. COSTS OF SERVICES TO BE PROVIDED AND PROFITS TO BE REALIZED BY THE ADVISER
The Trustees considered the cost of services and the structure of the Adviser’s proposed management fee, including a review of the expense analyses and other pertinent material with respect to the Jensen ETF. The Trustees took into consideration that the management fee was a “unitary management fee” whereby the Adviser agrees to pay all expenses incurred by the Jensen ETF, except the unitary management fee payable to the Adviser and certain other costs of the Jensen ETF, specifically interest charges on any borrowings, dividends and other expenses on securities sold short, taxes, brokerage commissions and other expenses incurred in placing orders for the purchase and sale of securities and other investment instruments, acquired fund fees and expenses, accrued deferred tax liability, extraordinary expenses and any Rule 12b 1 plan fees. The Trustees reviewed the related statistical information and other materials provided, including the comparative expenses, expense components and peer group selection. The Trustees also considered the cost structure of the Jensen ETF relative to a peer group of funds as constructed using publicly-available data provided by Morningstar, Inc. and presented by Barrington Financial Group, LLC d/b/a Barrington Partners, an independent third-party benchmarking firm, through its cohort selection process (a peer group of U.S. large blend exchange-traded funds) (the “Barrington Cohort”)).
The Trustees noted that the Jensen ETF’s proposed contractual management fee of 0.57% was slightly below the Barrington Cohort average of 0.58%. The Trustees further noted that the Jensen ETF’s proposed unitary fee structure will limit the Fund’s total annual fund operating expenses to 0.57% of the Jensen ETF’s average annual assets and was lower than the Barrington Cohort average of 0.62%. The Trustees also noted that Jensen had provided additional supplemental materials to support the reasonableness of the proposed unitary management fee.
The Trustees also considered the overall profitability that may result from the Adviser’s management of the Jensen ETF and reviewed the Adviser’s financial information. The Trustees also examined the level of profits that could be realized by the Adviser from the fees payable under the Jensen ETF Advisory Agreement anticipated by the Adviser.
The Trustees concluded that the estimated expenses and the proposed unitary management fee to be paid to the Adviser was fair and reasonable in light of the comparative expense and management fee information and the investment management services to be provided to the Jensen ETF by the Adviser. The Trustees further concluded, based on a pro forma profitability analysis prepared by the Adviser, that the Adviser did not anticipate that the Jensen ETF would be profitable to the Adviser during the first twelve months of operation, but the Adviser maintained adequate profit levels to support its services to the Jensen ETF.
4. EXTENT OF ECONOMIES OF SCALE AS THE FUND GROWS
The Trustees compared the Jensen ETF’s estimated expenses relative to its Barrington Cohort and discussed economies of scale. With respect to the Jensen ETF, the Trustees noted that the Jensen ETF’s proposed unitary management fee structure did not contain any breakpoint reductions as the Jensen ETF’s assets grow in size, but that the feasibility of incorporating breakpoints would be reviewed on a regular basis. With respect to the Adviser’s fee structure, the Trustees concluded that the potential economies of scale with respect to the Jensen ETF was acceptable.
TABLE OF CONTENTS
INVESTMENT Advisory Agreement Approval (JENSEN QUALITY GROWTH ETF)(Continued)
5. BENEFITS TO BE DERIVED FROM THE RELATIONSHIP WITH THE FUND
The Trustees considered the direct and indirect benefits that could be realized by the Adviser from its association with the Jensen ETF. The Trustees concluded that the benefits the Adviser may receive, such as greater name recognition or the ability to attract additional investor assets, appear to be reasonable, and in many cases may benefit the Jensen ETF.
CONCLUSIONS
The Trustees considered all of the foregoing factors. In considering the approval of the Jensen ETF Advisory Agreement, the Trustees did not identify any one factor as all-important, but rather considered these factors collectively in light of the Jensen ETF’s surrounding circumstances. Based on this review, the Trustees, including a majority of the Independent Trustees, approved the proposed Jensen ETF Advisory Agreement for an initial two-year term as being in the best interests of the Jensen ETF and its shareholders
TABLE OF CONTENTS
New Investment Advisory Agreement Approval (Jensen Mutual Funds)
BASIS FOR TRUSTEES’ APPROVAL OF INVESTMENT ADVISORY AGREEMENT
In connection with a proposed change in control of Jensen Investment Management, Inc. (the “Adviser”), the Board of Trustees (the “Trustees”) of Trust for Professional Managers (the “Trust”) met on August 15, 2024 to consider the approval of a new investment advisory agreement (the “New Jensen Mutual Funds Advisory Agreement”) between the Trust, on behalf of the Jensen Quality Value Fund and the Jensen Global Quality Growth Fund (each, a “Fund,” and together, the “Funds”), each a series of the Trust, and the Adviser. The materials provided contained information with respect to the factors enumerated below, including a copy of the New Jensen Mutual Funds Advisory Agreement, a memorandum prepared by the Trust’s outside legal counsel discussing in detail the Trustees’ fiduciary obligations and the factors they should assess in considering the approval of the New Jensen Mutual Funds Advisory Agreement, detailed comparative information relating to each Fund’s performance, as well as the management fees and other expenses of each Fund, due diligence materials relating to the Adviser (including a due diligence questionnaire completed on behalf of the Funds by the Adviser, the Adviser’s Form ADV, select financial statements of the Adviser, biographical information of the Adviser’s key management and compliance personnel, comparative fee information for the Funds and a summary detailing key provisions of the Adviser’s written compliance program, including its code of ethics) and other pertinent information.
The Trustees also received information periodically throughout the year that was relevant to the New Jensen Mutual Funds Advisory Agreement approval, including performance, management fee and other expense information. Based on their evaluation of the information provided by the Adviser, in conjunction with the Funds’ other service providers, the Trustees, by a unanimous vote (including a separate vote of the Independent Trustees), approved the New Jensen Mutual Funds Advisory Agreement for an initial term ending two years following the effective date of the change in control of the Adviser.
DISCUSSION OF FACTORS CONSIDERED
In considering the approval of the New Jensen Mutual Funds Advisory Agreement and reaching their conclusions, the Trustees reviewed and analyzed various factors that they determined were relevant, including the factors enumerated below.
1. NATURE, EXTENT AND QUALITY OF SERVICES PROVIDED TO THE FUNDS
The Trustees considered the nature, extent and quality of services provided by the Adviser to the Funds and the amount of time devoted to the Funds’ operation by the Adviser’s staff. The Trustees considered the Adviser’s specific responsibilities in all aspects of day-to-day management of the Funds, including the investment strategies implemented by the Adviser, as well as the qualifications, experience and responsibilities of the Adviser’s investment teams subsequent to the retirement of Mr. Schoenstein, specifically Robert D. McIver, Allen T. Bond, Kevin J. Walkush and Jeffrey D. Wilson, the Jensen Global Quality Growth Fund’s portfolio managers, and Kurt M. Havnaer, Adam D. Calamar, and Tyra S. Pratt, the Jensen Quality Value Fund’s portfolio managers, and other key personnel at the Adviser involved in the day-to-day activities of the Funds. The Trustees reviewed information provided by the Adviser in a due diligence questionnaire, including the structure of the Adviser’s compliance program and its continuing commitment to the Funds. The Trustees noted that during the course of the prior year the Adviser had participated in a Trust board meeting to discuss the Funds’ performance and outlook, along with the compliance efforts made by the Adviser, including reports provided by the Adviser in its role as the Funds’ valuation designee. The Trustees also noted any services that extended beyond portfolio management, and they considered the brokerage practices of the Adviser. The Trustees discussed the Adviser’s handling of compliance matters, including the reports of the Trust’s chief compliance officer to the Trustees on the effectiveness of the Adviser’s compliance program. The Trustees also considered the Adviser’s overall financial condition, as well as the implementation and operational effectiveness of the Adviser’s business continuity plan. The Trustees concluded that the Adviser had sufficient quality and
TABLE OF CONTENTS
New Investment Advisory Agreement Approval (Jensen Mutual Funds)(Continued)
depth of personnel, resources, investment methods and compliance policies and procedures essential to performing its duties under the Advisory Agreement and that the nature, overall quality and extent of the management services provided to the Funds, as well as the Adviser’s compliance program, were satisfactory and reliable.
2. INVESTMENT PERFORMANCE OF THE ADVISER AND THE FUNDS
The Trustees discussed the performance of the Class I shares of the Jensen Global Quality Growth Fund and Jensen Quality Value Fund for the quarter, one-year, three-year, five-year, ten-year and since inception periods ended March 31, 2024, as applicable. In assessing the quality of the portfolio management services delivered by the Adviser, the Trustees also compared the short-term and longer-term performance of the Class I shares of each Fund on both an absolute basis and in comparison to a benchmark index (the MSCI All Country World Index for the Jensen Global Quality Growth Fund and the Russell Midcap Total Return Index for the Jensen Quality Value Fund) and in comparison to a peer group of funds as constructed using publicly-available data provided by Morningstar, Inc. and presented by Barrington Financial Group, LLC d/b/a Barrington Partners, an independent third-party benchmarking firm, through its cohort selection process (a peer group of U.S. open-end global large-cap stock blend and global large-cap stock growth funds for the Jensen Global Quality Growth Fund and a peer group of U.S. open-end mid-cap blend funds for the Jensen Quality Value Fund) (each, a “Barrington Cohort”). The Trustees noted that the Adviser did not manage any other accounts with the same or similar investment strategies as either Fund.
The Trustees noted the Jensen Quality Value Fund’s performance for Class I shares for the one-year period ended March 31, 2024 was below the Barrington Cohort average. The Trustees noted that the Jensen Quality Value Fund’s performance for Class I shares for the three-year, five-year and ten-year periods ended March 31, 2024 were above the Barrington Cohort average. The Trustees noted that for the three-year and five-year periods ended March 31, 2024, the Class I shares of the Jensen Quality Value Fund had outperformed the Russell Midcap Total Return Index. The Trustees noted that for the quarter, one-year, ten-year and since inception periods ended March 31, 2024, the Class I shares of the Jensen Quality Value Fund had underperformed the Russell Midcap Total Return Index.
The Trustees noted the Jensen Global Quality Growth Fund’s performance for Class I shares for the one-year period ended March 31, 2024 was below the Barrington Cohort average. The Trustees noted the Jensen Global Quality Growth Fund’s performance for Class I shares for the three-year period ended March 31, 2024 was above the Barrington Cohort average. The Trustees noted that for the quarter, one-year and since inception periods ended March 31, 2024, the Class I shares of the Jensen Global Quality Growth Fund had underperformed the MSCI All Country World Index. The Trustees noted that for the three-year period ended March 31, 2024, the Class I shares of the Jensen Global Quality Growth Fund had outperformed the MSCI All Country World Index.
After considering all of the information, the Trustees concluded that the performance obtained by the Adviser for each Fund was satisfactory under current market conditions. Although past performance is not a guarantee or indication of future results, the Trustees determined that each Fund and its shareholders were likely to benefit from the Adviser’s continued management.
3. COSTS OF SERVICES PROVIDED AND PROFITS REALIZED BY THE ADVISER
The Trustees considered the cost of services and the structure of the Adviser’s fees, including a review of the expense analyses and other pertinent material with respect to the Funds. The Trustees reviewed the related statistical information and other materials provided, including the comparative expenses and Barrington Cohort comparisons. The Trustees considered the cost structure of each Fund relative to its Barrington Cohort, as well as any fee waivers and expense reimbursements of the Adviser.
The Trustees also considered the overall profitability of the Adviser and reviewed the Adviser’s financial information and noted that the Adviser has subsidized each Fund’s operations since the Fund’s inception. The Trustees also examined the level of profits that could be expected to accrue to the Adviser from the fees payable under the New Jensen Mutual Funds Advisory Agreement, as well as the Funds’
TABLE OF CONTENTS
New Investment Advisory Agreement Approval (Jensen Mutual Funds)(Continued)
brokerage practices. These considerations were based on materials requested by the Trustees and the Funds’ administrator specifically for the August 15, 2024 meeting at which the New Jensen Mutual Funds Advisory Agreement was formally considered, as well as the reports prepared by the Adviser over the course of the year.
The Trustees noted that the Jensen Quality Value Fund’s contractual management fee of 0.65% was below the Barrington Cohort average of 0.72%. The Trustees noted that the Jensen Quality Value Fund was operating above its expense cap of 0.80% for Class I shares. The Trustees observed that the Jensen Quality Value Fund’s total expense ratio (net of fee waivers and expense reimbursements and including shareholder servicing plan fees of 0.02%) of 0.82% for Class I shares was below the Barrington Cohort average of 1.00%.
The Trustees noted that the Jensen Global Quality Growth Fund’s contractual management fee of 0.75% was below the Barrington Cohort average of 0.82%. The Trustees noted that the Jensen Global Quality Growth Fund was operating above its expense cap of 1.00% for Class I shares. The Trustees observed that the Jensen Quality Growth Fund’s total expense ratio (net of fee waivers and expense reimbursements and including shareholder servicing plan fees of 0.02%) of 1.02% for Class I shares was above the Barrington Cohort average of 0.94%.
The Trustees then noted the New Mutual Funds Advisory Agreement contained the identical fee structure as the Existing Jensen Mutual Funds Advisory Agreement. The Trustees further noted the Adviser had agreed to waive advisory fees and/or reimburse expenses of the Funds for at least two years after the effective date of the New Jensen Mutual Funds Advisory Agreement under a new operating expense limitation agreement between the Adviser and the trust, on behalf of each Fund.
The Trustees concluded that each Fund’s expenses and the management fees paid to the Adviser were fair and reasonable in light of the comparative performance, expense and management fee information. The Trustees further concluded, based on a profitability analysis prepared by the Adviser, that neither Fund was currently profitable to the Adviser after reflecting marketing and distribution expenses, but the Adviser maintained adequate profit levels to support the services to each Fund from the revenues of its overall investment advisory business, despite its subsidies to support each Fund’s operations.
4. EXTENT OF ECONOMIES OF SCALE AS THE FUNDS GROW
The Trustees compared each Fund’s expenses relative to its Barrington Cohort and discussed realized and potential economies of scale. The Trustees also reviewed the structure of each Fund’s management fee and whether each Fund was large enough to generate economies of scale for shareholders or whether economies of scale would be expected to be realized as Fund assets grow (and if so, how those economies of scale were being or would be shared with shareholders). The Trustees reviewed all fee waivers, expense reimbursements and potential recoupments by the Adviser with respect to each Fund. The Trustees noted that each Fund’s management fee structure did not contain any breakpoint reductions as the Fund’s assets grow in size, but that the feasibility of incorporating breakpoints would continue to be reviewed on a regular basis. With respect to the Adviser’s fee structures, the Trustees concluded that the current fee structures were reasonable and reflected a sharing of economies of scale between the Adviser and each Fund at the Fund’s current asset level.
5. BENEFITS DERIVED FROM THE RELATIONSHIP WITH THE FUNDS
The Trustees considered the direct and indirect benefits that could be received by the Adviser from its association with the Funds. The Trustees examined the brokerage practices of the Adviser with respect to the Funds. The Trustees concluded that the benefits the Adviser may receive, such as greater name recognition and increased ability to attract additional investor assets, appear to be reasonable, and in many cases may benefit the Funds.
TABLE OF CONTENTS
New Investment Advisory Agreement Approval (Jensen Mutual Funds)(Continued)
CONCLUSIONS
The Trustees considered all of the foregoing factors. No single factor was determinative in the Board’s decision to approve the New Jensen Mutual Funds Advisory Agreement for the Funds, but rather the Board based its determination on the total mix of information available to the Trustees. Based on a consideration of all the factors in their totality, the Board, including a majority of the Independent Trustees, determined that the New Jensen Mutual Funds Advisory Agreement with the Adviser, including the advisory fees to be paid thereunder, was fair and reasonable, and approved the New Jensen Mutual Funds Advisory Agreement for an initial two-year term as being in the best interests of each Fund and its shareholders.
TABLE OF CONTENTS
New Investment Advisory Agreement Approval (Jensen Quality Growth ETF)
BASIS FOR TRUSTEES’ APPROVAL OF INVESTMENT ADVISORY AGREEMENT
In connection with a proposed change in control of Jensen Investment Management, Inc. (the “Adviser”), the Board of Trustees (the “Trustees”) of Trust for Professional Managers (the “Trust”) met on August 15, 2024 to consider the approval of a new investment advisory agreement (the “New Jensen ETF Advisory Agreement”) between the Trust, on behalf of the Jensen Quality Growth ETF (the “Fund” or the “Jensen ETF”), a series of the Trust, and the Adviser. The materials provided contained information with respect to the factors enumerated below, including a copy of the New Jensen ETF Advisory Agreement, a memorandum prepared by the Trust’s outside legal counsel discussing in detail the Trustees’ fiduciary obligations and the factors they should assess in considering the approval of the New Jensen ETF Advisory Agreement, detailed comparative information relating to the Fund’s performance, as well as the unitary management fee and other expenses of the Fund, due diligence materials relating to the Adviser (including a due diligence questionnaire completed on behalf of the Fund by the Adviser, the Adviser’s Form ADV, select financial statements of the Adviser, biographical information of the Adviser’s key management and compliance personnel, comparative fee information for the Fund and a summary detailing key provisions of the Adviser’s written compliance program, including its code of ethics) and other pertinent information.
The Trustees also received information periodically throughout the year that was relevant to the New Jensen ETF Advisory Agreement approval, including performance, unitary management fee and other expense information. Based on their evaluation of the information provided by the Adviser, in conjunction with the Fund’s other service providers, the Trustees, by a unanimous vote (including a separate vote of the Independent Trustees), approved the New Jensen ETF Advisory Agreement for an initial term ending two years following the effective date of the change in control of the Adviser.
DISCUSSION OF FACTORS CONSIDERED
In considering the approval of the New Jensen ETF Advisory Agreement and reaching their conclusions, the Trustees reviewed and analyzed various factors that they determined were relevant, including the factors enumerated below.
1. NATURE, EXTENT AND QUALITY OF SERVICES PROVIDED TO THE FUND
The Trustees considered the nature, extent and quality of services to be provided by the Adviser to the Jensen ETF and the amount of time to be devoted by the Adviser’s staff to the Jensen ETF’s operations. The Trustees considered the Adviser’s specific responsibilities in all aspects of day-to-day management of the Jensen ETF, as well as the qualifications, experience and responsibilities of the Adviser’s investment team subsequent to the retirement of Mr. Schoenstein, specifically Robert D. McIver, Kurt M. Havnaer, Allen T. Bond, Kevin J. Walkush and Adam D. Calamar, who will serve as co-portfolio managers for the Jensen ETF and other key personnel at the Adviser involved in the day-to-day activities of the Jensen ETF. The Trustees reviewed information provided by the Adviser in due diligence questionnaires, including the structure of the Adviser’s compliance program and discussed the Adviser’s commitment to the growth of assets for the Jensen ETF. The Trustees also noted any services that extended beyond portfolio management, and they considered the overall capability of the Adviser. The Trustees discussed the Adviser’s handling of compliance matters, including the reports of the Trust’s chief compliance officer to the Trustees on the effectiveness of the Adviser’s compliance program. The Trustees also considered the Adviser’s overall financial condition, as well as the implementation and operational effectiveness of the Adviser’s business continuity plan. The Trustees concluded that the Adviser had sufficient quality and depth of personnel, resources, investment methods and compliance policies and procedures essential to performing its duties under the New Jensen ETF Advisory Agreement and that the nature, overall quality and extent of the management services to be provided to the Jensen ETF, as well as the Adviser’s compliance program, were satisfactory and reliable.
TABLE OF CONTENTS
New Investment Advisory Agreement Approval (Jensen Quality Growth ETF)(Continued)
2. INVESTMENT PERFORMANCE OF THE ADVISER AND THE FUND
In assessing the portfolio management services to be provided by the Adviser, the Trustees considered the investment management experience of Messrs. McIver, Havnaer, Bond, Walkush, and Calamar, who serve as co-portfolio managers for the Jensen ETF. Because the Jensen ETF had only recently commenced operations it did not have its own performance history. However the Trustees considered the historical performance of the Jensen Mutual Fund, an Oregon corporation and a separate registered investment company operating as an open-end mutual fund and managed by the Adviser utilizing the same or similar investment strategies as that to be employed for the Jensen ETF. The Trustees compared the performance of the Class I shares of the Jensen Mutual Fund to the S&P 500 Index for the quarter, one-year, three-year, five-year and 10-year periods ended March 31, 2024. The Trustees also noted the performance of other accounts managed by the Adviser with the same or similar investment strategies as that to be employed for the Jensen ETF. After considering all of the information, the Trustees determined that the Jensen ETF and its shareholders were likely to benefit from the Adviser’s continued management.
3. COSTS OF SERVICES PROVIDED AND PROFITS REALIZED BY THE ADVISER
The Trustees considered the cost of services and the structure of the Adviser’s management fee, including a review of the expense analyses and other pertinent material with respect to the Jensen ETF. The Trustees took into consideration that the management fee was a “unitary management fee” whereby the Adviser agrees to pay all expenses incurred by the Jensen ETF, except the unitary management fee payable to the Adviser and certain other costs of the Jensen ETF, specifically interest charges on any borrowings, dividends and other expenses on securities sold short, taxes, brokerage commissions and other expenses incurred in placing orders for the purchase and sale of securities and other investment instruments, acquired fund fees and expenses, accrued deferred tax liability, extraordinary expenses and any Rule 12b-1 plan fees. The Trustees reviewed the related statistical information and other materials provided, including the comparative expenses, expense components and peer group selection. The Trustees also considered the cost structure of the Jensen ETF relative to a peer group of funds as constructed using publicly-available data provided by Morningstar, Inc. and presented by Barrington Partners through its cohort selection process (a peer group of U.S. large blend exchange-traded funds) (the “Barrington Cohort”)).
The Trustees noted that the Jensen ETF’s proposed contractual management fee of 0.57% was slightly below the Barrington Cohort average of 0.58%. The Trustees further noted that the Jensen ETF’s proposed unitary fee structure will limit the Fund’s total annual fund operating expenses to 0.57% of the Jensen ETF’s average annual assets and was lower than the Barrington Cohort average of 0.62%.
The Trustees then noted the New Jensen ETF Advisory Agreement contained the identical unitary fee structure as the Existing Jensen ETF Advisory Agreement and that the New Jensen ETF Advisory Agreement would remain in effect for at least two years after its effective date.
The Trustees also considered the overall profitability that may result from the Adviser’s management of the Jensen ETF and reviewed the Adviser’s financial information. The Trustees also examined the level of profits that could be realized by the Adviser from the fees payable under the New Jensen ETF Advisory Agreement anticipated by the Adviser.
The Trustees concluded that the estimated expenses and the unitary management fee to be paid to the Adviser were fair and reasonable in light of the comparative expense and management fee information and the investment management services to be provided to the Jensen ETF by the Adviser. The Trustees further concluded, based on a pro forma profitability analysis prepared by the Adviser, that the Adviser did not anticipate that the Jensen ETF would be profitable to the Adviser during the first twelve months of operation, but the Adviser maintained adequate profit levels to support its services to the Jensen ETF.
TABLE OF CONTENTS
New Investment Advisory Agreement Approval (Jensen Quality Growth ETF)(Continued)
4. EXTENT OF ECONOMIES OF SCALE AS THE FUND GROWS
The Trustees compared the Jensen ETF’s estimated expenses relative to its Barrington Cohort and discussed economies of scale. With respect to the Jensen ETF, the Trustees noted that the Jensen ETF’s unitary management fee structure did not contain any breakpoint reductions as the Jensen ETF’s assets grow in size, but that the feasibility of incorporating breakpoints would be reviewed on a regular basis. With respect to the Adviser’s fee structure, the Trustees concluded that the potential economies of scale with respect to the Jensen ETF was acceptable.
5. BENEFITS DERIVED FROM THE RELATIONSHIP WITH THE FUND
The Trustees considered the direct and indirect benefits that could be realized by the Adviser from its association with the Jensen ETF. The Trustees concluded that the benefits the Adviser may receive, such as greater name recognition or the ability to attract additional investor assets, appear to be reasonable, and in many cases may benefit the Jensen ETF.
CONCLUSIONS
No single factor was determinative in the Board’s decision to approve the New Jensen ETF Advisory Agreement for the Jensen ETF, but rather the Board based its determination on the total mix of information available to the Trustees. Based on a consideration of all the factors in their totality, the Board, including a majority of the Independent Trustees, determined that the New Jensen ETF Advisory Agreement with the Adviser, including the advisory fees to be paid thereunder, was fair and reasonable, and approved the New Jensen ETF Advisory Agreement for an initial two-year term as being in the best interests of the Jensen ETF and its shareholders.
| (b) | Financial Highlights are included within the financial statements filed under Item 7(a) of this Form. |
Item 8. Changes in and Disagreements with Accountants for Open-End Investment Companies.
There were no changes in or disagreements with accountants during the period covered by this report.
Item 9. Proxy Disclosure for Open-End Investment Companies
A Special Joint Meeting of Shareholders (the “Special Meeting”) of the Jensen Quality Mid Cap Fund, Jensen Global Quality Growth Fund and Jensen Quality Growth ETF (the “Funds”) was held on November 1, 2024 at the offices of U.S. Bancorp Fund Services, LLC, 615 East Michigan Avenue, Milwaukee, Wisconsin, pursuant to notice given to all shareholders of record of the Jensen Quality Mid Cap Fund and the Jensen Global Quality Growth Fund at the close of business on August 26, 2024 and the Jensen Quality Growth ETF at the close of business on September 20, 2024. At the Special Meeting, shareholders were asked to approve the following:
To approve an Investment Advisory Agreement between the Adviser and the Trust, on behalf of each of the Jensen Quality Mid Cap Fund and the Jensen Global Quality Growth Fund; and
To approve an Investment Advisory Agreement between the Adviser and the Trust, on behalf of the Jensen Quality Growth ETF.
The tabulation of the shareholder votes rendered the following results:
For the Jensen Quality Mid Cap Fund, of the 5,209,746 shares present, 5,130,139, or 98.47% voted in favor, 10,094, or 0.19% voted against, 69,513, or 1.33% abstained from voting, and there were no broker non-votes.
For the Jensen Global Quality Growth Fund, of the 3,365,442 shares present, 3,365,442, or 100% voted in favor, 0, or 0% voted against, 0, or 0% abstained from voting, and there were no broker non-votes.
For the Jensen Quality Growth ETF, of the 600,366 shares present, 600,366, or 100% voted in favor, 0, or 0%, voted against, 0, or 0% abstained from voting, and there were no broker non-votes.
Item 10. Remuneration Paid to Directors, Officers, and Others of Open-End Investment Companies.
See Item 7(a) for compensation information related to the Jensen mutual funds. For the Jensen Quality Growth ETF, all fund expenses, including Trustee compensation, are paid by the Investment Adviser pursuant to the Investment Advisory Agreement. Additional information related to those fees is available in the ETF’s Statement of Additional Information
Item 11. Statement Regarding Basis for Approval of Investment Advisory Contract.
This information is included within the financial statements filed under Item 7(a) of this Form.
Item 12. Disclosure of Proxy Voting Policies and Procedures for Closed-End Management Investment Companies.
Not applicable to open-end investment companies.
Item 13. Portfolio Managers of Closed-End Management Investment Companies.
Not applicable to open-end investment companies.
Item 14. Purchases of Equity Securities by Closed-End Management Investment Company and Affiliated Purchasers.
Not applicable to open-end investment companies.
Item 15. Submission of Matters to a Vote of Security Holders.
There have been no material changes to the procedures by which shareholders may recommend nominees to the registrant’s board of trustees.
Item 16. Controls and Procedures.
| (a) | The Registrant’s Principal Executive Officer and Principal Financial Officer have reviewed the Registrant’s disclosure controls and procedures (as defined in Rule 30a-3(c) under the Investment Company Act of 1940 (the “Act”)) as of a date within 90 days of the filing of this report, as required by Rule 30a-3(b) under the Act and Rules 13a-15(b) or 15d-15(b) under the Securities Exchange Act of 1934. Based on their review, such officers have concluded that the disclosure controls and procedures are effective in ensuring that information required to be disclosed in this report is appropriately recorded, processed, summarized and reported and made known to them by others within the Registrant and by the Registrant’s service provider. |
| (b) | There were no changes in the Registrant’s internal control over financial reporting (as defined in Rule 30a-3(d) under the Act) that occurred during period of the period covered by this report that has materially affected, or is reasonably likely to materially affect, the Registrant’s internal control over financial reporting. |
Item 17. Disclosure of Securities Lending Activities for Closed-End Management Investment Companies
Not applicable to open-end investment companies.
Item 18. Recovery of Erroneously Awarded Compensation.
Not applicable
Item 19. Exhibits.
(2) Any policy required by the listing standards adopted pursuant to Rule 10D-1 under the Exchange Act (17 CFR 240.10D-1) by the registered national securities exchange or registered national securities association upon which the registrant’s securities are listed. Not applicable.
(3) A separate certification for each principal executive officer and principal financial officer of the registrant as required by Rule 30a-2(a) under the Investment Company Act of 1940 (17 CFR 270.30a-29(a)). Filed herewith.
(4) Any written solicitation to purchase securities under Rule 23c-1 under the Act sent or given during the period covered by the report by or on behalf of the registrant to 10 or more persons. Not Applicable.
(5) Change in the registrant’s independent public accountant. Provide the information called for by Item 4 of Form 8-K under the Exchange Act (17 CFR 249.308). Not Applicable.
SIGNATURES
Pursuant to the requirements of the Securities Exchange Act of 1934 and the Investment Company Act of 1940, the registrant has duly caused this report to be signed on its behalf by the undersigned, thereunto duly authorized.
| | (Registrant) | Trust for Professional Managers | |
| | By (Signature and Title) | /s/ John Buckel | |
| | | John Buckel, Principal Executive Officer | |
Pursuant to the requirements of the Securities Exchange Act of 1934 and the Investment Company Act of 1940, this report has been signed below by the following persons on behalf of the registrant and in the capacities and on the dates indicated.
| | By (Signature and Title) | /s/ John Buckel | |
| | | John Buckel, Principal Executive Officer | |
| | By (Signature and Title)* | /s/ Jennifer Lima | |
| | | Jennifer Lima, Principal Financial Officer | |
* Print the name and title of each signing officer under his or her signature.