UNITED STATES
SECURITIES AND EXCHANGE COMMISSION
Washington, D.C. 20549
FORM N-CSR
CERTIFIED SHAREHOLDER REPORT OF REGISTERED
MANAGEMENT INVESTMENT COMPANIES
Investment Company Act file number 811-10401
Trust for Professional Managers
(Exact name of registrant as specified in charter)
615 East Michigan Street
Milwaukee, WI 53202
(Address of principal executive offices) (Zip code)
Jay S. Fitton
U.S. Bancorp Fund Services, LLC
615 East Michigan Street
Milwaukee, WI 53202
(Name and address of agent for service)
(513) 520-5925
Registrant’s telephone number, including area code
Date of fiscal year end: November 30, 2024
Date of reporting period: November 30, 2024
Item 1. Reports to Stockholders.
| | |
| Rockefeller Climate Solutions Fund | |
| Class A | RKCAX |
| Annual Shareholder Report | November 30, 2024 |
This annual shareholder report contains important information about the Rockefeller Climate Solutions Fund for the period of December 1, 2023, to November 30, 2024. You can find additional information about the Fund at https://www.rockefellerfunds.com/equity-funds/. You can also request this information by contacting us at 1-855-369-6209.
WHAT WERE THE FUND COSTS FOR THE PAST YEAR? (based on a hypothetical $10,000 investment)
| | |
Class Name | Costs of a $10,000 investment | Costs paid as a percentage of a $10,000 investment |
| Class A | $137 | 1.24% |
HOW DID THE FUND PERFORM LAST YEAR AND WHAT AFFECTED ITS PERFORMANCE?
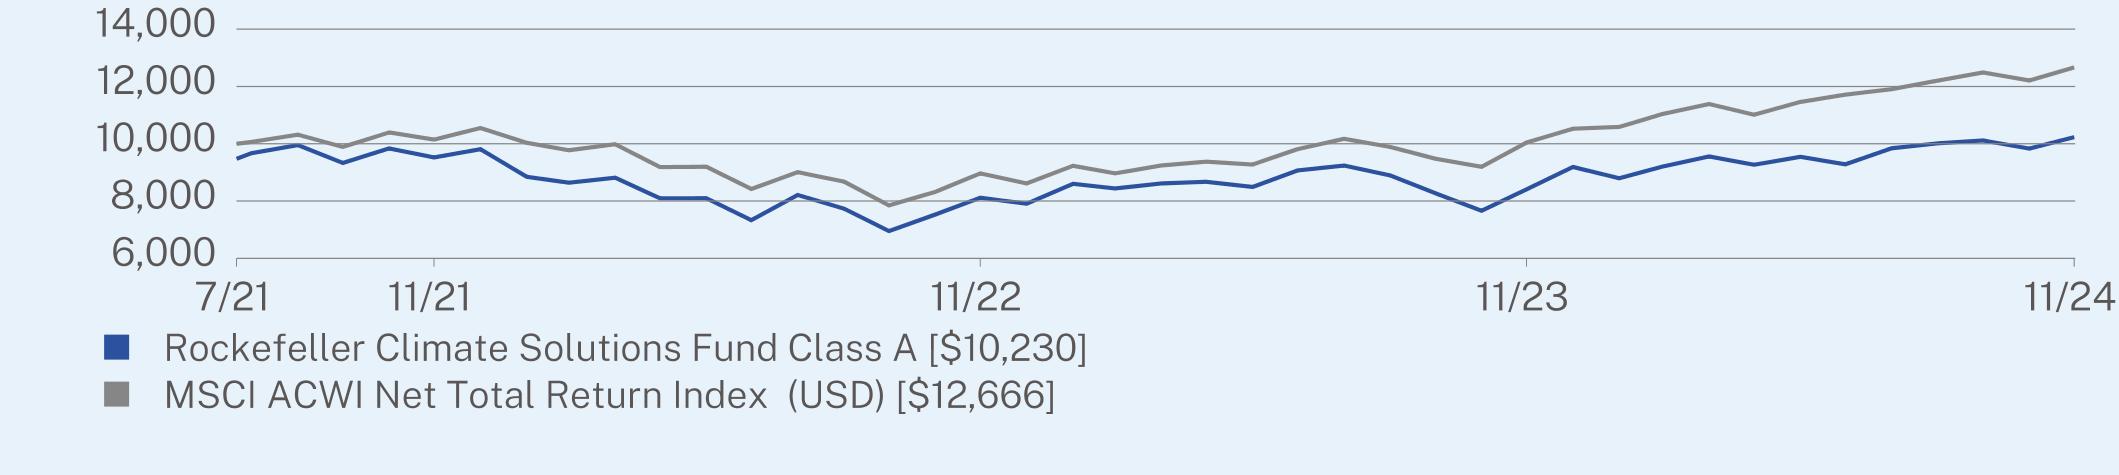
The MSCI ACWI Net Total Return Index returned 26.12% versus the Fund’s Class A shares return of 21.65% for the fiscal year ended November 30, 2024. The Fund underperformed as stock selection struggled in the Information Technology, Utilities and Health Care sectors. Bentley Systems in Information Technology, Sunnova Energy in Utilities and Progyny in Healthcare were the weakest performing names in their respective sectors with Progyny being the top detracting stock in the portfolio overall. Industrials was the top contributor due to stock selection and allocation, with Mueller Industries being the top contributing stock in the sector. Consumer Discretionary also contributed positively with Sweetgreen being the top performing stock within the sector.
HOW DID THE FUND PERFORM SINCE INCEPTION?*
The $10,000 chart reflects a hypothetical $10,000 investment in the class of shares noted and assumes the maximum sales charge. The chart uses total return NAV performance and assumes reinvestment of dividends and capital gains. Fund expenses, including 12b-1 fees, management fees and other expenses were deducted.
CUMULATIVE PERFORMANCE (Initial Investment of $10,000)
ANNUAL AVERAGE TOTAL RETURN (%)
| | |
| | 1 Year | Since Inception
(07/21/2021) |
Class A (without sales charge) | 21.65 | 2.31 |
Class A (with sales charge) | 15.26 | 0.68 |
MSCI ACWI Net Total Return Index (USD) | 26.12 | 7.28 |
Visit https://www.rockefellerfunds.com/equity-funds/ for more recent performance information.
| * | The Fund’s past performance is not a good predictor of how the Fund will perform in the future. The graph and table do not reflect the deduction of taxes that a shareholder would pay on Fund distributions or redemption of Fund shares. |
| Rockefeller Climate Solutions Fund | PAGE 1 | TSR-AR-89834G786 |
KEY FUND STATISTICS (as of November 30, 2024)
| |
Net Assets | $95,944,320 |
Number of Holdings | 48 |
Net Advisory Fee | $465,239 |
Portfolio Turnover | 35% |
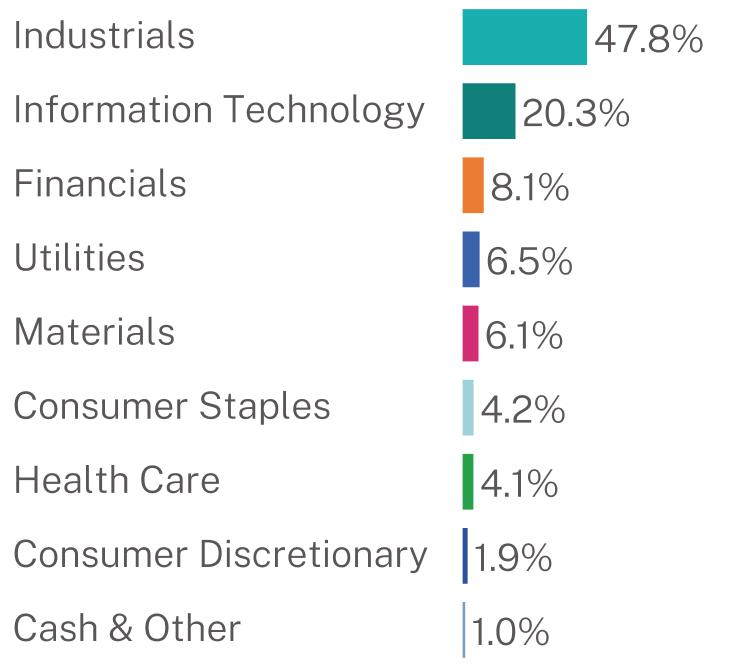
WHAT DID THE FUND INVEST IN? ( % of net assets as of November 30, 2024)
| |
Top 10 Issuers | |
Mueller Industries, Inc. | 4.3% |
StoneX Group, Inc. | 3.8% |
Schneider Electric SE | 3.7% |
Chubb Ltd. | 3.4% |
Trimble, Inc. | 3.2% |
Air Products and Chemicals, Inc. | 3.1% |
Badger Meter, Inc. | 3.1% |
Bureau Veritas SA | 3.0% |
Cie de Saint-Gobain | 3.0% |
Darling Ingredients, Inc. | 2.8% |
| * | The Global Industry Classification Standard (“GICS®”) was developed by and/or is the exclusive property of MSCI, Inc. (“MSCI”) and Standard & Poor’s Financial Services LLC (“S&P”). GICS® is a service mark of MSCI and S&P and has been licensed for use by U.S. Bank Global Fund Services. |
For additional information about the Fund, including its prospectus, financial information, holdings and proxy voting information, scan the QR code above or visit https://www.rockefellerfunds.com/equity-funds/.
HOUSEHOLDING
To reduce Fund expenses, only one copy of most shareholder documents may be mailed to shareholders with multiple accounts at the same address (Householding). If you would prefer that your Fund documents not be householded, please contact the Fund at 1-855-369-6209, or contact your financial intermediary. Your instructions will typically be effective within 30 days of receipt by the Fund or your financial intermediary.
| Rockefeller Climate Solutions Fund | PAGE 2 | TSR-AR-89834G786 |
94759522811684091023010000101458966100431266647.820.38.16.56.14.24.11.91.062.19.79.26.34.22.01.91.81.41.4
| | |
| Rockefeller Climate Solutions Fund | |
| Institutional Class | RKCIX |
| Annual Shareholder Report | November 30, 2024 |
This annual shareholder report contains important information about the Rockefeller Climate Solutions Fund for the period of December 1, 2023, to November 30, 2024. You can find additional information about the Fund at https://www.rockefellerfunds.com/equity-funds/. You can also request this information by contacting us at 1-855-369-6209.
WHAT WERE THE FUND COSTS FOR THE PAST YEAR? (based on a hypothetical $10,000 investment)
| | |
Class Name | Costs of a $10,000 investment | Costs paid as a percentage of a $10,000 investment |
| Institutional Class | $110 | 0.99% |
HOW DID THE FUND PERFORM LAST YEAR AND WHAT AFFECTED ITS PERFORMANCE?
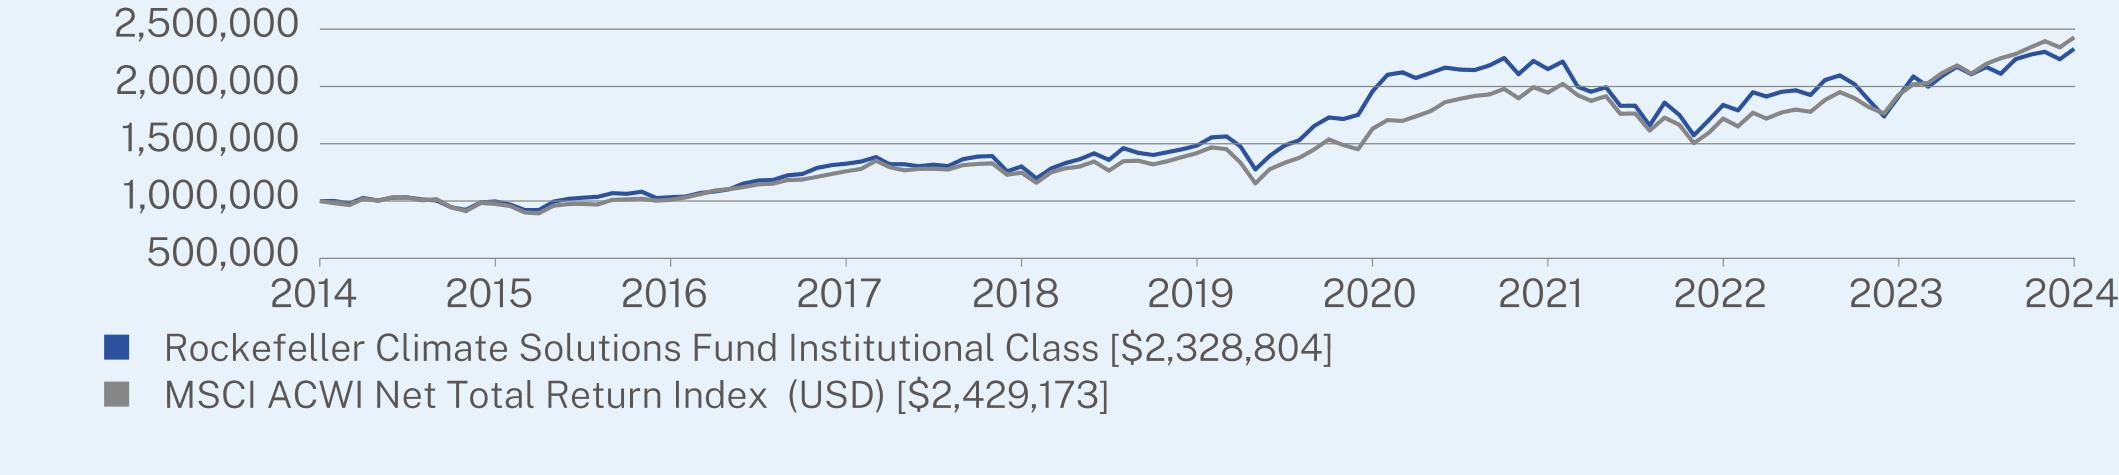
The MSCI ACWI Net Total Return Index returned 26.12% versus the Fund’s Institutional Class shares return of 21.95% for the fiscal year ended November 30, 2024. The Fund underperformed as stock selection struggled in the Information Technology, Utilities and Health Care sectors. Bentley Systems in Information Technology, Sunnova Energy in Utilities and Progyny in Healthcare were the weakest performing names in their respective sectors with Progyny being the top detracting stock in the portfolio overall. Industrials was the top contributor due to stock selection and allocation, with Mueller Industries being the top contributing stock in the sector. Consumer Discretionary also contributed positively with Sweetgreen being the top performing stock within the sector.
HOW DID THE FUND PERFORM OVER THE PAST 10 YEARS?*
The $1,000,000 chart reflects a hypothetical $1,000,000 investment in the class of shares noted. The chart uses total return NAV performance and assumes reinvestment of dividends and capital gains. Fund expenses, including management fees and other expenses were deducted.
CUMULATIVE PERFORMANCE (Initial Investment of $1,000,000)
ANNUAL AVERAGE TOTAL RETURN (%)
| | | |
| | 1 Year | 5 Year | 10 Year ** |
Institutional Class | 21.95 | 9.44 | 8.82 |
MSCI ACWI Net Total Return Index (USD) | 26.12 | 11.36 | 9.28 |
Visit https://www.rockefellerfunds.com/equity-funds/ for more recent performance information.
| * | The Fund’s past performance is not a good predictor of how the Fund will perform in the future. The graph and table do not reflect the deduction of taxes that a shareholder would pay on Fund distributions or redemption of Fund shares. |
| ** | Performance prior to July 21, 2021 is that of its predecessor fund, the Rockefeller Climate Solutions Fund, L.P. |
| Rockefeller Climate Solutions Fund | PAGE 1 | TSR-AR-89834G794 |
KEY FUND STATISTICS (as of November 30, 2024)
| |
Net Assets | $95,944,320 |
Number of Holdings | 48 |
Net Advisory Fee | $465,239 |
Portfolio Turnover | 35% |
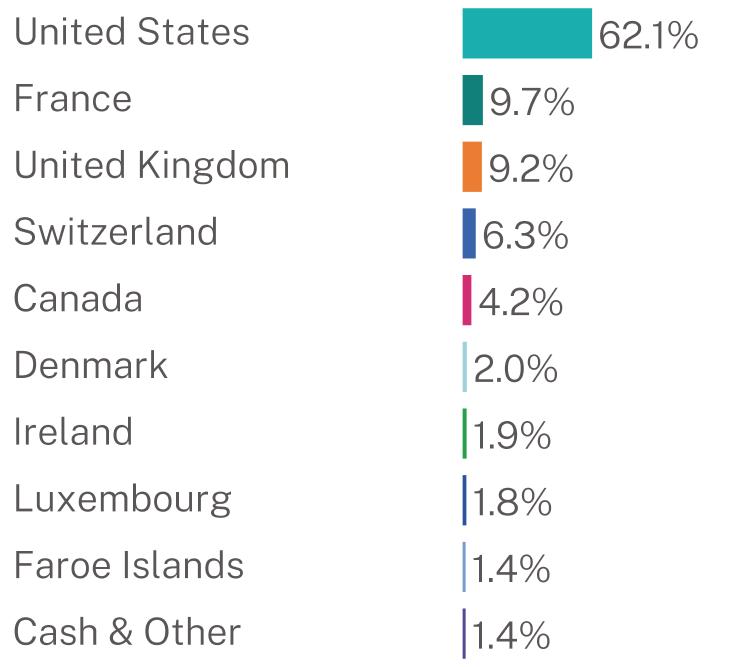
WHAT DID THE FUND INVEST IN? ( % of net assets as of November 30, 2024)
| |
Top 10 Issuers | |
Mueller Industries, Inc. | 4.3% |
StoneX Group, Inc. | 3.8% |
Schneider Electric SE | 3.7% |
Chubb Ltd. | 3.4% |
Trimble, Inc. | 3.2% |
Air Products and Chemicals, Inc. | 3.1% |
Badger Meter, Inc. | 3.1% |
Bureau Veritas SA | 3.0% |
Cie de Saint-Gobain | 3.0% |
Darling Ingredients, Inc. | 2.8% |
| * | The Global Industry Classification Standard (“GICS®”) was developed by and/or is the exclusive property of MSCI, Inc. (“MSCI”) and Standard & Poor’s Financial Services LLC (“S&P”). GICS® is a service mark of MSCI and S&P and has been licensed for use by U.S. Bank Global Fund Services. |
For additional information about the Fund, including its prospectus, financial information, holdings and proxy voting information, scan the QR code above or visit https://www.rockefellerfunds.com/equity-funds/.
HOUSEHOLDING
To reduce Fund expenses, only one copy of most shareholder documents may be mailed to shareholders with multiple accounts at the same address (Householding). If you would prefer that your Fund documents not be householded, please contact the Fund at 1-855-369-6209, or contact your financial intermediary. Your instructions will typically be effective within 30 days of receipt by the Fund or your financial intermediary.
| Rockefeller Climate Solutions Fund | PAGE 2 | TSR-AR-89834G794 |
1000000996642103386213262811301596148363619588862151472183840219096252328804100000097510210109801260094124775214184121631301194565417195541926123242917347.820.38.16.56.14.24.11.91.062.19.79.26.34.22.01.91.81.41.4
| | |
| Rockefeller US Small Cap Core Fund | |
| Class A | RKSAX |
| Annual Shareholder Report | November 30, 2024 |
This annual shareholder report contains important information about the Rockefeller US Small Cap Core Fund for the period of December 1, 2023, to November 30, 2024. You can find additional information about the Fund at https://www.rockefellerfunds.com/equity-funds/. You can also request this information by contacting us at 1-855-369-6209.
WHAT WERE THE FUND COSTS FOR THE PAST YEAR? (based on a hypothetical $10,000 investment)
| | |
Class Name | Costs of a $10,000 investment | Costs paid as a percentage of a $10,000 investment |
| Class A | $144 | 1.24% |
HOW DID THE FUND PERFORM LAST YEAR AND WHAT AFFECTED ITS PERFORMANCE?
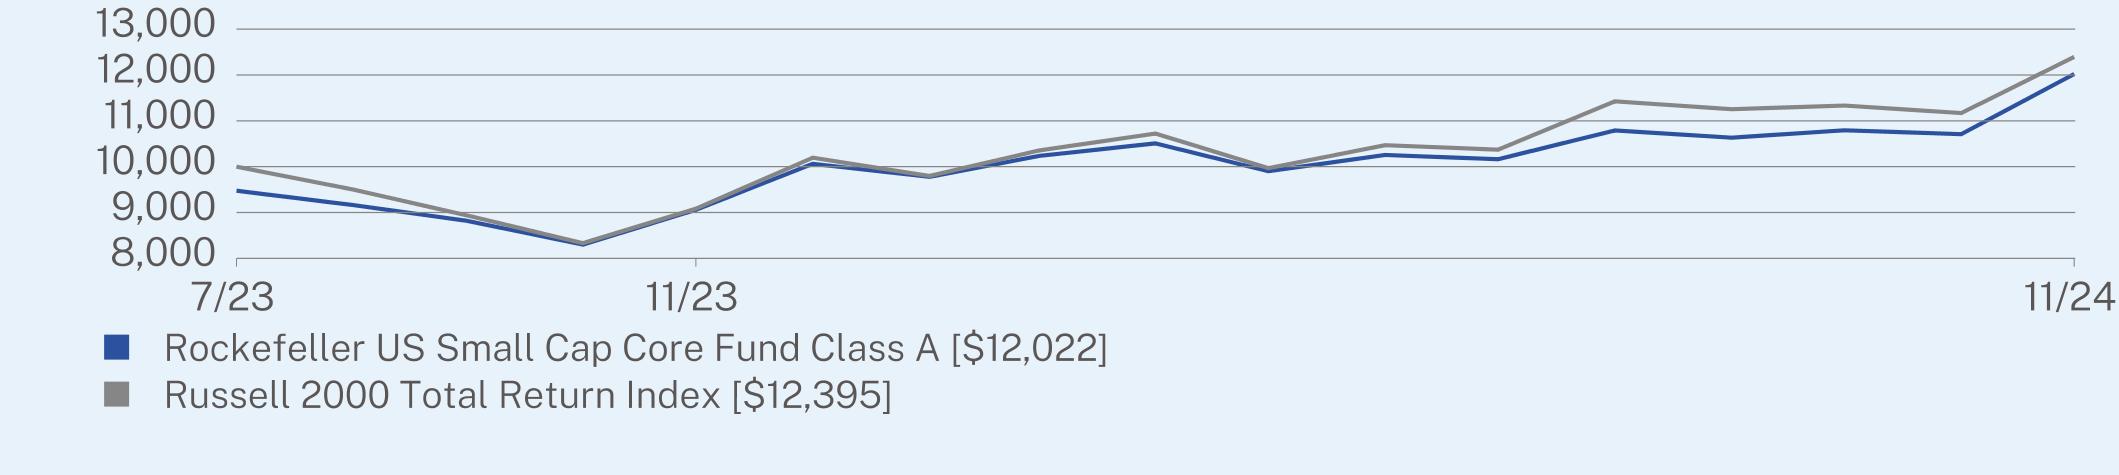
The Russell 2000 Total Return Index returned 36.43% versus the Fund’s Class A shares return of 32.74% for the fiscal year ended November 30, 2024. The Fund underperformed as stock selection in the largest detracting sector, Information Technology, struggled. Pros Holdings and Calix were the two top detracting stocks within the sector. The Industrials and Consumer Discretionary sectors contributed positively to performance given stock selection and allocation. Mueller Industries and Sterling Infrastructure were the top performing stocks within Industrials while Stride was the top performing stock within Consumer Discretionary.
HOW DID THE FUND PERFORM SINCE INCEPTION?*
The $10,000 chart reflects a hypothetical $10,000 investment in the class of shares noted and assumes the maximum sales charge. The chart uses total return NAV performance and assumes reinvestment of dividends and capital gains. Fund expenses, including 12b-1 fees, management fees and other expenses were deducted.
CUMULATIVE PERFORMANCE (Initial Investment of $10,000)
ANNUAL AVERAGE TOTAL RETURN (%)
| | |
| | 1 Year | Since Inception
(07/31/2023) |
Class A (without sales charge) | 32.74 | 19.55 |
Class A (with sales charge) | 25.77 | 14.81 |
Russell 2000 Total Return Index | 36.43 | 17.46 |
Visit https://www.rockefellerfunds.com/equity-funds/ for more recent performance information.
| * | The Fund’s past performance is not a good predictor of how the Fund will perform in the future. The graph and table do not reflect the deduction of taxes that a shareholder would pay on Fund distributions or redemption of Fund shares. |
| Rockefeller US Small Cap Core Fund | PAGE 1 | TSR-AR-89834G653 |
KEY FUND STATISTICS (as of November 30, 2024)
| |
Net Assets | $112,036,626 |
Number of Holdings | 45 |
Net Advisory Fee | $478,217 |
Portfolio Turnover | 52% |
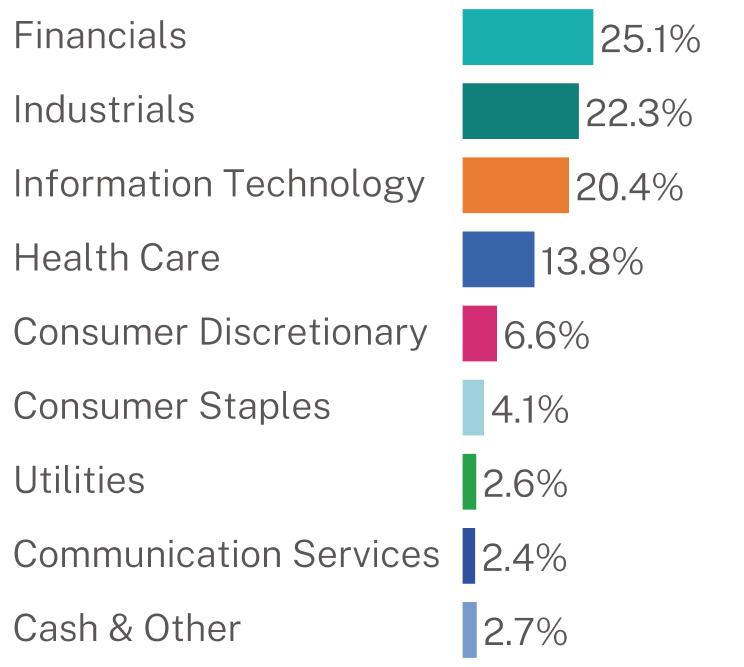
WHAT DID THE FUND INVEST IN? ( % of net assets as of November 30, 2024)
| |
Top 10 Issuers | |
Korn Ferry | 4.3% |
SunOpta, Inc. | 4.1% |
Stride, Inc. | 3.9% |
StoneX Group, Inc. | 3.6% |
Merit Medical Systems, Inc. | 3.5% |
Agilysys, Inc. | 3.0% |
PROS Holdings, Inc. | 2.9% |
BioLife Solutions, Inc. | 2.9% |
First Bancorp. | 2.8% |
Invesco Government & Agency Portfolio | 2.8% |
| * | The Global Industry Classification Standard (“GICS®”) was developed by and/or is the exclusive property of MSCI, Inc. (“MSCI”) and Standard & Poor’s Financial Services LLC (“S&P”). GICS® is a service mark of MSCI and S&P and has been licensed for use by U.S. Bank Global Fund Services. |
For additional information about the Fund, including its prospectus, financial information, holdings and proxy voting information, scan the QR code above or visit https://www.rockefellerfunds.com/equity-funds/.
HOUSEHOLDING
To reduce Fund expenses, only one copy of most shareholder documents may be mailed to shareholders with multiple accounts at the same address (Householding). If you would prefer that your Fund documents not be householded, please contact the Fund at 1-855-369-6209, or contact your financial intermediary. Your instructions will typically be effective within 30 days of receipt by the Fund or your financial intermediary.
| Rockefeller US Small Cap Core Fund | PAGE 2 | TSR-AR-89834G653 |
94759058120221000090851239525.122.320.413.86.64.12.62.42.7
| | |
| Rockefeller US Small Cap Core Fund | |
| Class I | RKSIX |
| Annual Shareholder Report | November 30, 2024 |
This annual shareholder report contains important information about the Rockefeller US Small Cap Core Fund for the period of December 1, 2023, to November 30, 2024. You can find additional information about the Fund at https://www.rockefellerfunds.com/equity-funds/. You can also request this information by contacting us at 1-855-369-6209.
WHAT WERE THE FUND COSTS FOR THE PAST YEAR? (based on a hypothetical $10,000 investment)
| | |
Class Name | Costs of a $10,000 investment | Costs paid as a percentage of a $10,000 investment |
| Class I | $115 | 0.99% |
HOW DID THE FUND PERFORM LAST YEAR AND WHAT AFFECTED ITS PERFORMANCE?
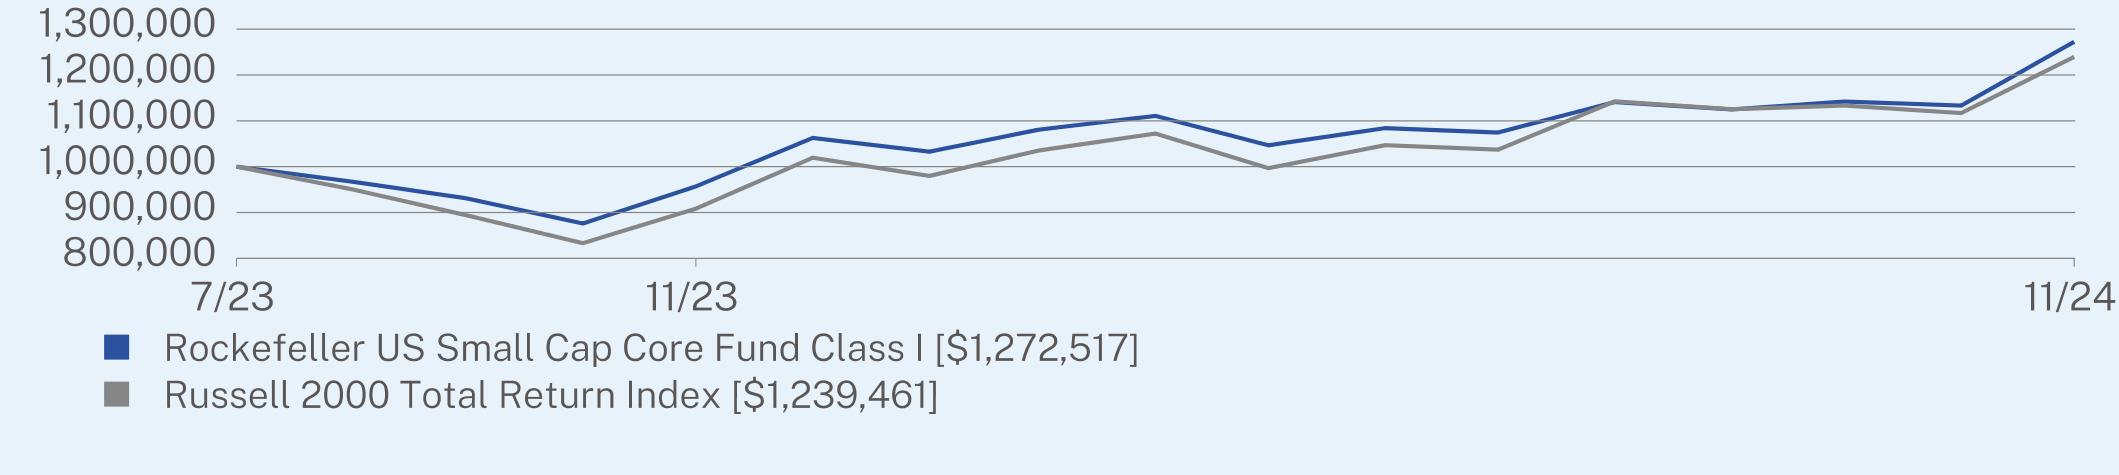
The Russell 2000 Total Return Index returned 36.43% versus the Fund’s Class I shares return of 33.01% for the fiscal year ended November 30, 2024. The Fund underperformed as stock selection in the largest detracting sector, Information Technology, struggled. Pros Holdings and Calix were the two top detracting stocks within the sector. The Industrials and Consumer Discretionary sectors contributed positively to performance given stock selection and allocation. Mueller Industries and Sterling Infrastructure were the top performing stocks within Industrials while Stride was the top performing stock within Consumer Discretionary.
HOW DID THE FUND PERFORM SINCE INCEPTION?*
The $1,000,000 chart reflects a hypothetical $1,000,000 investment in the class of shares noted. The chart uses total return NAV performance and assumes reinvestment of dividends and capital gains. Fund expenses, including management fees and other expenses were deducted.
CUMULATIVE PERFORMANCE (Initial Investment of $1,000,000)
ANNUAL AVERAGE TOTAL RETURN (%)
| | |
| | 1 Year | Since Inception
(07/31/2023) |
Class I | 33.01 | 19.82 |
Russell 2000 Total Return Index | 36.43 | 17.46 |
Visit https://www.rockefellerfunds.com/equity-funds/ for more recent performance information.
| * | The Fund’s past performance is not a good predictor of how the Fund will perform in the future. The graph and table do not reflect the deduction of taxes that a shareholder would pay on Fund distributions or redemption of Fund shares. |
| Rockefeller US Small Cap Core Fund | PAGE 1 | TSR-AR-89834G646 |
KEY FUND STATISTICS (as of November 30, 2024)
| |
Net Assets | $112,036,626 |
Number of Holdings | 45 |
Net Advisory Fee | $478,217 |
Portfolio Turnover | 52% |
WHAT DID THE FUND INVEST IN? ( % of net assets as of November 30, 2024)
| |
Top 10 Issuers | |
Korn Ferry | 4.3% |
SunOpta, Inc. | 4.1% |
Stride, Inc. | 3.9% |
StoneX Group, Inc. | 3.6% |
Merit Medical Systems, Inc. | 3.5% |
Agilysys, Inc. | 3.0% |
PROS Holdings, Inc. | 2.9% |
BioLife Solutions, Inc. | 2.9% |
First Bancorp. | 2.8% |
Invesco Government & Agency Portfolio | 2.8% |
| * | The Global Industry Classification Standard (“GICS®”) was developed by and/or is the exclusive property of MSCI, Inc. (“MSCI”) and Standard & Poor’s Financial Services LLC (“S&P”). GICS® is a service mark of MSCI and S&P and has been licensed for use by U.S. Bank Global Fund Services. |
For additional information about the Fund, including its prospectus, financial information, holdings and proxy voting information, scan the QR code above or visit https://www.rockefellerfunds.com/equity-funds/.
HOUSEHOLDING
To reduce Fund expenses, only one copy of most shareholder documents may be mailed to shareholders with multiple accounts at the same address (Householding). If you would prefer that your Fund documents not be householded, please contact the Fund at 1-855-369-6209, or contact your financial intermediary. Your instructions will typically be effective within 30 days of receipt by the Fund or your financial intermediary.
| Rockefeller US Small Cap Core Fund | PAGE 2 | TSR-AR-89834G646 |
100000095700012725171000000908473123946125.122.320.413.86.64.12.62.42.7
Item 2. Code of Ethics.
The registrant has adopted a code of ethics that applies to the registrant’s principal executive officer and principal financial officer. The registrant has not made any substantive amendments to its code of ethics during the period covered by this report. The registrant has not granted any waivers from any provisions of the code of ethics during the period covered by this report. A copy of the registrant’s Code of Ethics is incorporated by reference to the Registrant’s Form N-CSR filed on February 6, 2019.
Item 3. Audit Committee Financial Expert.
The registrant’s board of trustees has determined that there is at least one audit committee financial expert serving on its audit committee. Dr. Michael Akers and Lisa Zúñiga Ramírez are the “audit committee financial experts” and are considered to be “independent” as each term is defined in Item 3 of Form N-CSR.
Item 4. Principal Accountant Fees and Services.
The registrant has engaged its principal accountant to perform audit services, audit-related services, tax services and other services during the past two fiscal years. “Audit services” refer to performing an audit of the registrant’s annual financial statements or services that are normally provided by the accountant in connection with statutory and regulatory filings or engagements for those fiscal years. “Audit-related services” refer to the assurance and related services by the principal accountant that are reasonably related to the performance of the audit. “Tax services” refer to professional services rendered by the principal accountant for tax compliance, tax advice, and tax planning. The following table details the aggregate fees billed or expected to be billed for each of the last two fiscal years for audit fees, audit-related fees, tax fees and other fees by the principal accountant.
| | FYE 11/30/2024 | FYE 11/30/2023 |
| (a) Audit Fees | $63,740 | $60,700 |
| (b) Audit-Related Fees | 0 | 0 |
| (c) Tax Fees | $14,070 | $13,400 |
| (d) All Other Fees | 0 | 0 |
(e)(1) The audit committee has adopted pre-approval policies and procedures that require the audit committee to pre-approve all audit and non-audit services of the registrant, including services provided to any entity affiliated with the registrant.
(e)(2) The percentage of fees billed by Deloitte & Touche LLP applicable to non-audit services pursuant to waiver of pre-approval requirement were as follows:
| | FYE 11/30/2024 | FYE 11/30/2023 |
| Audit-Related Fees | 0% | 0% |
| Tax Fees | 0% | 0% |
| All Other Fees | 0% | 0% |
(f) During the audit of the registrant’s financial statements all of the hours were attributed to work performed by persons other than full-time permanent employees of the principal accountant.
(g) The following table indicates the non-audit fees billed or expected to be billed by the registrant’s accountant for services to the registrant and to the registrant’s investment adviser (and any other controlling entity, etc.—not sub-adviser) for the last two years.
| Non-Audit Related Fees | FYE 11/30/2024 | FYE 11/30/2023 |
| Registrant | $0 | $0 |
| Registrant’s Investment Adviser | $169,500 | $145,000 |
(h) The audit committee of the board of trustees/directors has considered whether the provision of non-audit services that were rendered to the registrant’s investment adviser is compatible with maintaining the principal accountant’s independence and has concluded that the provision of such non-audit services by the accountant has not compromised the accountant’s independence.
(i) Not applicable.
(j) Not applicable.
Item 5. Audit Committee of Listed Registrants.
Not applicable to registrants who are not listed issuers (as defined in Rule 10A-3 under the Securities Exchange Act of 1934).
Item 6. Investments
| (a) | Schedule of Investments is included as part of the report to shareholders filed under Item 7(a) of this Form. |
Item 7. Financial Statements and Financial Highlights for Open-End Investment Companies.
Rockefeller Climate Solutions Fund
Rockefeller US Small Cap Core Fund
Core Financial Statements and Other Information
November 30, 2024
TABLE OF CONTENTS
Rockefeller Climate Solutions Fund
Schedule of Investments
November 30, 2024
| | | | | | | | |
COMMON STOCKS — 99.0%
| |
Building Products — 8.9%
| | | | | | | |
A. O. Smith Corp. | | | 25,723 | | | $1,916,106 | |
AAON, Inc. | | | 10,502 | | | 1,431,843 | |
AZEK Co., Inc.(a) | | | 43,723 | | | 2,322,566 | |
Cie de Saint-Gobain | | | 31,109 | | | 2,840,538 | |
| | | | | | 8,511,053 | |
Capital Markets — 3.8% | | | | | | | |
StoneX Group, Inc.(a) | | | 35,089 | | | 3,640,835 | |
Chemicals — 6.1% | | | | | | | |
Air Products and Chemicals, Inc. | | | 8,992 | | | 3,006,295 | |
DSM-Firmenich AG | | | 15,663 | | | 1,720,482 | |
Novonesis (Novozymes) B | | | 19,751 | | | 1,159,069 | |
| | | | | | 5,885,846 | |
Commercial Services & Supplies — 9.4% | | | | | | | |
Rentokil Initial PLC | | | 439,093 | | | 2,203,901 | |
Republic Services, Inc. | | | 9,540 | | | 2,082,582 | |
Tetra Tech, Inc. | | | 57,840 | | | 2,400,938 | |
Veralto Corp. | | | 21,222 | | | 2,296,008 | |
| | | | | | 8,983,429 | |
Construction & Engineering — 4.0% | | | | | | | |
Limbach Holdings, Inc.(a) | | | 19,096 | | | 1,899,861 | |
Stantec, Inc. | | | 22,898 | | | 1,983,387 | |
| | | | | | 3,883,248 | |
Electric Utilities — 4.4% | | | | | | | |
NextEra Energy, Inc. | | | 20,121 | | | 1,582,919 | |
SSE PLC | | | 115,859 | | | 2,612,982 | |
| | | | | | 4,195,901 | |
Electrical Equipment — 8.9% | | | | | | | |
Accelleron Industries AG | | | 19,004 | | | 1,067,469 | |
Array Technologies, Inc.(a) | | | 104,128 | | | 698,699 | |
GE Vernova, Inc.(a) | | | 3,005 | | | 1,004,030 | |
Schneider Electric SE | | | 13,700 | | | 3,529,400 | |
Vertiv Holdings Co. - Class A | | | 11,525 | | | 1,470,590 | |
Vestas Wind Systems AS(a) | | | 49,998 | | | 782,840 | |
| | | | | | 8,553,028 | |
Electronic Equipment, Instruments & Components — 12.7% | | | | | | | |
Badger Meter, Inc. | | | 13,749 | | | 2,981,058 | |
Halma PLC | | | 59,939 | | | 2,066,031 | |
TE Connectivity PLC | | | 12,311 | | | 1,860,438 | |
Teledyne Technologies, Inc.(a) | | | 4,518 | | | 2,192,405 | |
Trimble, Inc.(a) | | | 42,663 | | | 3,113,119 | |
| | | | | | 12,213,051 | |
| | | | | | | | |
The accompanying notes are an integral part of these financial statements.
TABLE OF CONTENTS
Rockefeller Climate Solutions Fund
Schedule of Investments(Cont’d)
November 30, 2024
| | | | | | | | |
Common Stocks — continued | | | | | | | |
Financial Services — 0.9% | | | | | | | |
HA Sustainable Infrastructure Capital, Inc. | | | 26,895 | | | $843,427 | |
Food Products — 4.2% | | | | | | | |
Bakkafrost P/F | | | 22,860 | | | 1,355,235 | |
Darling Ingredients, Inc.(a) | | | 65,736 | | | 2,664,280 | |
| | | | | | 4,019,515 | |
Household Durables — 1.9% | | | | | | | |
TopBuild Corp.(a) | | | 4,648 | | | 1,815,695 | |
Industrial Conglomerates — 1.4% | | | | | | | |
Hitachi Ltd. | | | 53,200 | | | 1,340,685 | |
Insurance — 3.4% | | | | | | | |
Chubb Ltd. | | | 11,241 | | | 3,245,614 | |
Life Sciences Tools & Services — 4.1% | | | | | | | |
Agilent Technologies, Inc. | | | 16,346 | | | 2,255,258 | |
Eurofins Scientific SE(a) | | | 34,715 | | | 1,717,633 | |
| | | | | | 3,972,891 | |
Machinery — 9.9% | | | | | | | |
ATS Corp(a) | | | 65,200 | | | 2,135,689 | |
Mueller Industries, Inc. | | | 51,618 | | | 4,169,186 | |
Pentair PLC | | | 17,599 | | | 1,918,115 | |
Xylem, Inc./NY | | | 10,294 | | | 1,304,765 | |
| | | | | | 9,527,755 | |
Multi-Utilities — 2.1% | | | | | | | |
CMS Energy Corp. | | | 28,777 | | | 2,006,045 | |
Professional Services — 5.3% | | | | | | | |
Bureau Veritas SA | | | 94,133 | | | 2,866,774 | |
Verisk Analytics, Inc. | | | 7,535 | | | 2,216,872 | |
| | | | | | 5,083,646 | |
Semiconductors & Semiconductor Equipment — 0.5% | | | | | | | |
Enphase Energy, Inc.(a) | | | 7,089 | | | 505,800 | |
Software — 7.1% | | | | | | | |
ANSYS, Inc.(a) | | | 4,768 | | | 1,674,045 | |
Bentley Systems, Inc. - Class B | | | 32,660 | | | 1,616,670 | |
Roper Technologies, Inc. | | | 2,631 | | | 1,490,304 | |
Synopsys, Inc.(a) | | | 3,558 | | | 1,987,107 | |
| | | | | | 6,768,126 | |
Total Common Stocks (Cost $79,132,179) | | | | | | 94,995,590 | |
| | | | | | | | |
The accompanying notes are an integral part of these financial statements.
TABLE OF CONTENTS
Rockefeller Climate Solutions Fund
Schedule of Investments(Cont’d)
November 30, 2024
| | | | | | | | |
Short-Term Investments — 1.0% | | | | | | | |
Money Market Funds — 1.0% | | | | | | | |
Invesco Government & Agency Portfolio - Class Institutional, 4.58%(b) | | | 952,162 | | | $952,162 | |
Total Short-Term Investments (Cost $952,162) | | | | | | 952,162 | |
Total Investments — 100.0% (Cost $80,084,341) | | | | | | $95,947,752 | |
Liabilities in Excess of Other Assets — (0.0)%(c) | | | | | | (3,432) | |
TOTAL NET ASSETS — 100.0% | | | | | | $95,944,320 | |
| | | | | | | | |
Percentages are stated as a percent of net assets.
The Global Industry Classification Standard (“GICS®”) was developed by and/or is the exclusive property of MSCI, Inc. (“MSCI”) and Standard & Poor’s Financial Services LLC (“S&P”). GICS® is a service mark of MSCI and S&P and has been licensed for use by U.S. Bank Global Fund Services.
AG - Aktiengesellschaft
AS - Aksjeselskap
PLC - Public Limited Company
SA - Sociedad Anónima
SE - Societas Europeae
(a)
| Non-income producing security. |
(b)
| The rate shown represents the 7-day annualized effective yield as of November 30, 2024. |
(c)
| Represents less than 0.05% of net assets. |
The accompanying notes are an integral part of these financial statements.
TABLE OF CONTENTS
Rockefeller US Small Cap Core Fund
Schedule of Investments
November 30, 2024
| | | | | | | | |
Common Stocks — 97.3% | | | | | | | |
Aerospace & Defense — 1.8% | | | | | | | |
Kratos Defense & Security Solutions, Inc.(a) | | | 74,176 | | | $2,009,428 | |
Automobile Components — 1.2% | | | | | | | |
XPEL, Inc.(a) | | | 31,001 | | | 1,348,543 | |
Banks — 2.8% | | | | | | | |
First Bancorp. | | | 65,466 | | | 3,096,542 | |
Building Products — 2.3% | | | | | | | |
AZEK Co., Inc.(a) | | | 49,114 | | | 2,608,936 | |
Capital Markets — 7.8% | | | | | | | |
Donnelley Financial Solutions, Inc.(a) | | | 39,525 | | | 2,381,381 | |
PJT Partners, Inc. - Class A | | | 13,848 | | | 2,317,601 | |
StoneX Group, Inc.(a) | | | 38,732 | | | 4,018,833 | |
| | | | | | 8,717,815 | |
Communications Equipment — 2.7% | | | | | | | |
Calix, Inc.(a) | | | 93,294 | | | 3,034,854 | |
Construction & Engineering — 3.7% | | | | | | | |
Limbach Holdings, Inc.(a) | | | 18,719 | | | 1,862,353 | |
Sterling Infrastructure, Inc.(a) | | | 11,532 | | | 2,242,398 | |
| | | | | | 4,104,751 | |
Consumer Finance — 1.4% | | | | | | | |
FirstCash Holdings, Inc. | | | 14,122 | | | 1,537,321 | |
Diversified Consumer Services — 3.9% | | | | | | | |
Stride, Inc.(a) | | | 41,102 | | | 4,392,571 | |
Electronic Equipment, Instruments & Components — 7.6% | | | | | | | |
Badger Meter, Inc. | | | 6,362 | | | 1,379,409 | |
CTS Corp. | | | 27,384 | | | 1,503,655 | |
ePlus, Inc.(a) | | | 27,193 | | | 2,198,826 | |
Insight Enterprises, Inc.(a) | | | 6,860 | | | 1,073,247 | |
Napco Security Technologies, Inc. | | | 59,835 | | | 2,347,327 | |
| | | | | | 8,502,464 | |
Financial Services — 8.1% | | | | | | | |
AvidXchange Holdings, Inc.(a) | | | 244,945 | | | 2,802,171 | |
HA Sustainable Infrastructure Capital, Inc. | | | 87,612 | | | 2,747,512 | |
International Money Express, Inc.(a) | | | 52,647 | | | 1,109,272 | |
Walker & Dunlop, Inc. | | | 21,545 | | | 2,373,828 | |
| | | | | | 9,032,783 | |
Food Products — 4.1% | | | | | | | |
SunOpta, Inc.(a) | | | 594,785 | | | 4,609,584 | |
| | | | | | | | |
The accompanying notes are an integral part of these financial statements.
TABLE OF CONTENTS
Rockefeller US Small Cap Core Fund
Schedule of Investments(Cont’d)
November 30, 2024
| | | | | | | | |
Common Stocks — continued | | | | | | | |
Gas Utilities — 2.6% | | | | | | | |
ONE Gas, Inc. | | | 37,711 | | | $2,940,327 | |
Ground Transportation — 2.0% | | | | | | | |
ArcBest Corp. | | | 19,013 | | | 2,191,819 | |
Health Care Equipment & Supplies — 4.8% | | | | | | | |
Merit Medical Systems, Inc.(a) | | | 37,528 | | | 3,899,159 | |
Omnicell, Inc.(a) | | | 32,219 | | | 1,501,083 | |
| | | | | | 5,400,242 | |
Health Care Providers & Services — 6.1% | | | | | | | |
Progyny, Inc.(a) | | | 90,465 | | | 1,408,540 | |
RadNet, Inc.(a) | | | 36,402 | | | 2,976,228 | |
US Physical Therapy, Inc. | | | 24,732 | | | 2,442,532 | |
| | | | | | 6,827,300 | |
Insurance — 5.0% | | | | | | | |
Skyward Specialty Insurance Group, Inc.(a) | | | 48,511 | | | 2,624,930 | |
Stewart Information Services Corp. | | | 40,162 | | | 3,015,765 | |
| | | | | | 5,640,695 | |
Life Sciences Tools & Services — 2.9% | | | | | | | |
BioLife Solutions, Inc.(a) | | | 116,628 | | | 3,203,771 | |
Machinery — 4.5% | | | | | | | |
ATS Corp.(a) | | | 53,855 | | | 1,760,520 | |
ESCO Technologies, Inc. | | | 10,884 | | | 1,615,294 | |
Helios Technologies, Inc. | | | 31,305 | | | 1,637,878 | |
| | | | | | 5,013,692 | |
Media — 2.4% | | | | | | | |
TechTarget, Inc.(a) | | | 85,685 | | | 2,751,345 | |
Professional Services — 8.0% | | | | | | | |
Huron Consulting Group, Inc.(a) | | | 16,361 | | | 2,009,295 | |
Korn Ferry | | | 61,942 | | | 4,852,536 | |
Paycor HCM, Inc.(a) | | | 119,105 | | | 2,151,036 | |
| | | | | | 9,012,867 | |
Software — 10.1% | | | | | | | |
Agilysys, Inc.(a) | | | 25,298 | | | 3,397,521 | |
DoubleVerify Holdings, Inc.(a) | | | 108,835 | | | 2,212,616 | |
PROS Holdings, Inc.(a) | | | 141,977 | | | 3,289,607 | |
Q2 Holdings, Inc.(a) | | | 23,568 | | | 2,468,512 | |
| | | | | | 11,368,256 | |
| | | | | | | | |
The accompanying notes are an integral part of these financial statements.
TABLE OF CONTENTS
Rockefeller US Small Cap Core Fund
Schedule of Investments(Cont’d)
November 30, 2024
| | | | | | | | |
Common Stocks — continued | | | | | | | |
Specialty Retail — 1.5% | | | | | | | |
Winmark Corp. | | | 4,039 | | | $1,663,765 | |
TOTAL COMMON STOCKS (Cost $90,427,796) | | | | | | 109,009,671 | |
SHORT-TERM INVESTMENTS — 2.8% | | | | | | | |
Money Market Funds — 2.8% | | | | | | | |
Invesco Government & Agency Portfolio - Class Institutional, 4.58%(b) | | | 3,093,574 | | | 3,093,574 | |
TOTAL SHORT-TERM INVESTMENTS (Cost $3,093,574) | | | | | | 3,093,574 | |
TOTAL INVESTMENTS — 100.1% (Cost $93,521,370) | | | | | | $112,103,245 | |
Liabilities in Excess of Other Assets — (0.1)% | | | | | | (66,619) | |
TOTAL NET ASSETS — 100.0% | | | | | | $112,036,626 | |
| | | | | | | | |
Percentages are stated as a percent of net assets.
The Global Industry Classification Standard (“GICS®”) was developed by and/or is the exclusive property of MSCI, Inc. (“MSCI”) and Standard & Poor’s Financial Services LLC (“S&P”). GICS® is a service mark of MSCI and S&P and has been licensed for use by U.S. Bank Global Fund Services.
(a)
| Non-income producing security. |
(b)
| The rate shown represents the 7-day annualized effective yield as of November 30, 2024. |
The accompanying notes are an integral part of these financial statements.
TABLE OF CONTENTS
Rockefeller Funds
Statements of Assets and Liabilities
November 30, 2024
| | | | | | | | |
Assets | | | | | | | |
Investments, at value (cost $80,084,341 and $93,521,370 respectively) | | | $95,947,752 | | | $112,103,245 | |
Dividends and interest receivable | | | 99,532 | | | 95,564 | |
Receivable for capital shares sold | | | 4,151 | | | 2,370 | |
Other assets | | | 22,780 | | | 8,608 | |
Total Assets | | | 96,074,215 | | | 112,209,787 | |
Liabilities | | | | | | | |
Payable to affiliates | | | 48,977 | | | 31,279 | |
Audit fees payable | | | 38,568 | | | 38,568 | |
Payable to adviser | | | 38,142 | | | 55,632 | |
Payable for fund shares redeemed | | | 737 | | | 40,956 | |
Payable for 12b-1 fees - Class A | | | 115 | | | 434 | |
Accrued expenses and other liabilities | | | 3,356 | | | 6,292 | |
Total Liabilities | | | 129,895 | | | 173,161 | |
Net Assets | | | 95,944,320 | | | 112,036,626 | |
Net Assets Consist of: | | | | | | | |
Paid-in capital | | | $67,352,091 | | | $89,788,545 | |
Total distributable earnings | | | 28,592,229 | | | 22,248,081 | |
Net Assets | | | $95,944,320 | | | $112,036,626 | |
Institutional Class | | | | | | | |
Net assets | | | $95,642,188 | | | $— | |
Shares of beneficial interest outstanding
(unlimited shares authorized, $0.001 par value) | | | 8,872,000 | | | — | |
Net asset value, redemption price and offering price per share | | | $10.78 | | | $— | |
Class A | | | | | | | |
Net assets | | | $302,132 | | | $173,949 | |
Shares of beneficial interest outstanding
(unlimited shares authorized, $0.001 par value) | | | 28,152 | | | 13,710 | |
Net asset value, redemption price and offering price per share | | | $10.73 | | | $12.69 | |
Class I | | | | | | | |
Net assets | | | $— | | | $111,862,677 | |
Shares of beneficial interest outstanding
(unlimited shares authorized, $0.001 par value) | | | — | | | 8,796,640 | |
Net asset value, redemption price and offering price per share | | | $— | | | $12.72 | |
| | | | | | | | |
The accompanying notes are an integral part of these financial statements.
TABLE OF CONTENTS
Rockefeller Funds
Statements of Operations
Year Ended November 30, 2024
| | | | | | | | |
Investment Income | | | | | | | |
Dividend income | | | $1,078,914 | | | $586,214 | |
Less: Foreign withholding taxes and issuance fees | | | (65,437) | | | — | |
Interest income | | | 109,455 | | | 126,069 | |
Total Investment Income | | | 1,122,932 | | | 712,283 | |
Expenses | | | | | | | |
Management fees | | | 787,773 | | | 730,027 | |
Transfer agent fees and expenses | | | 153,883 | | | 50,427 | |
Administration and accounting fees | | | 111,977 | | | 105,487 | |
Audit and tax fees | | | 38,903 | | | 38,903 | |
Federal & state registration fees | | | 36,554 | | | 82,685 | |
Legal fees | | | 29,234 | | | 28,320 | |
Trustees’ fees | | | 28,707 | | | 28,705 | |
Custody fees | | | 18,641 | | | 9,117 | |
Chief Compliance Officer fees | | | 12,259 | | | 11,876 | |
Reports to shareholders | | | 7,033 | | | 4,120 | |
Pricing fees | | | 4,803 | | | 1,245 | |
Insurance expense | | | 2,172 | | | 2,287 | |
12b-1 fees - Class A | | | 666 | | | 357 | |
Other expenses | | | 8,313 | | | 7,364 | |
Total expenses | | | 1,240,918 | | | 1,100,920 | |
Expense Waiver by Adviser (Note 4) | | | (322,534) | | | (251,810) | |
Net expenses | | | 918,384 | | | 849,110 | |
Net Investment Income (Loss) | | | 204,548 | | | (136,827) | |
Realized and Unrealized Gain (Loss) on Investments | | | | | | | |
Net realized gain/(loss) from: | | | | | | | |
Investments | | | (2,204,879) | | | 4,078,264 | |
Foreign currency | | | 11,767 | | | — | |
Net change in unrealized appreciation/(depreciation) on: | | | | | | | |
Investments | | | 20,109,209 | | | 20,929,539 | |
Foreign currency | | | (1,538) | | | — | |
Net Realized and Unrealized Gain on Investments | | | 17,914,559 | | | 25,007,803 | |
Net Increase in Net Assets from Operations | | | $18,119,107 | | | $24,870,976 | |
| | | | | | | | |
The accompanying notes are an integral part of these financial statements.
TABLE OF CONTENTS
Rockefeller Climate Solutions Fund
Statements of Changes in Net Assets
| | | | | |
From Operations | | | | | | | |
Net investment income | | | $204,548 | | | $381,804 | |
Net realized loss from investments and foreign currency translation | | | (2,193,112) | | | (4,107,421) | |
Net change in unrealized appreciation on investment and foreign currency translation | | | 20,107,671 | | | 6,967,218 | |
Net increase in net assets from operations | | | 18,119,107 | | | 3,241,601 | |
From Distributions | | | | | | | |
Net dividends and distributions | | | (382,243) | | | (123,855) | |
Net decrease in net assets resulting from distributions paid | | | (382,243) | | | (123,855) | |
From Capital Share Transactions | | | | | | | |
Proceeds from shares sold - Class A | | | 39,470 | | | 9,550 | |
Proceeds from shares sold - Institutional Class | | | 6,748,900 | | | 13,096,439 | |
Reinvestments - Class A | | | 184 | | | — | |
Reinvestments - Institutional Class | | | 202,159 | | | 43,627 | |
Cost of shares redeemed - Class A | | | (12,540) | | | (923,590) | |
Cost of shares redeemed - Institutional Class | | | (12,938,424) | | | (23,262,950) | |
Net decrease in net assets from capital share transactions | | | (5,960,251) | | | (11,036,924) | |
Total increase/(decrease) in Net Assets | | | 11,776,613 | | | (7,919,178) | |
Net Assets | | | | | | | |
Beginning of year | | | 84,167,707 | | | 92,086,885 | |
End of year | | | $95,944,320 | | | $84,167,707 | |
| | | | | | | | |
The accompanying notes are an integral part of these financial statements.
TABLE OF CONTENTS
Rockefeller US Small Cap Core Fund
Statements of Changes in Net Assets
| | | | | | | | |
From Operations | | | | | | | |
Net investment income (Loss) | | | $(136,827) | | | $32,919 | |
Net realized gain/(loss) from investments | | | 4,078,264 | | | (261,888) | |
Net change in unrealized appreciation/(depreciation) on from investments | | | 20,929,539 | | | (2,347,664) | |
Net increase/(decrease) in net assets from operations | | | 24,870,976 | | | (2,576,633) | |
From Distributions | | | | | | | |
Net dividends and distributions | | | (46,262) | | | — | |
Net decrease in net assets resulting from distributions paid | | | (46,262) | | | — | |
From Capital Share Transactions | | | | | | | |
Proceeds from shares sold - Class A | | | 32,501 | | | 105,000 | |
Proceeds from shares sold - Class I | | | 29,604,108 | | | 65,584,204 | |
Reinvestments - Class I | | | 11,811 | | | — | |
Cost of shares redeemed - Class I | | | (4,086,789) | | | (1,462,290) | |
Net increase in net assets from capital share transactions | | | 25,561,631 | | | 64,226,914 | |
Total Increase in Net Assets | | | 50,386,345 | | | 61,650,281 | |
Net Assets | | | | | | | |
Beginning of year | | | 61,650,281 | | | — | |
End of year | | | $112,036,626 | | | $61,650,281 | |
| | | | | | | | |
(1)
| The Fund commenced operations on July 31, 2023. |
The accompanying notes are an integral part of these financial statements.
TABLE OF CONTENTS
Rockefeller Climate Solutions Fund
Financial Highlights
Institutional Class
| | | |
| | Per share data for a share outstanding throughout each period | |
| | | |
| | | | | | | | |
Net Asset Value, Beginning of Period | | | $8.88 | | | $8.56 | | | $10.06 | | | $10.00 | |
Income from investment operations: | | | | | | | | | | | | | |
Net investment income/(loss)(2) | | | 0.02 | | | 0.04 | | | 0.03 | | | (0.01) | |
Net realized and unrealized gain/(loss) | | | 1.92 | | | 0.29 | | | (1.49) | | | 0.07 | |
Total from investment operations | | | 1.94 | | | 0.33 | | | (1.46) | | | 0.06 | |
Paid from net investment income | | | (0.04) | | | (0.01) | | | — | | | — | |
Paid from realized gains | | | — | | | — | | | (0.04) | | | — | |
Total distributions paid | | | (0.04) | | | (0.01) | | | (0.04) | | | — | |
Net Asset Value, End of Period | | | $10.78 | | | $8.88 | | | $8.56 | | | $10.06 | |
Total return | | | 21.95% | | | 3.87% | | | −14.55% | | | 0.58%(3) | |
Supplemental Data and Ratios: | | | | | | | | | | | | | |
Net assets at end of period (000’s) | | | $95,642 | | | $83,944 | | | $90,942 | | | $113,235 | |
Ratio of expenses to average net assets: | | | | | | | | | | | | | |
Before waiver, expense reimbursement | | | 1.33% | | | 1.30% | | | 1.26% | | | 1.25%(4) | |
After waiver, expense reimbursement | | | 0.99% | | | 0.99% | | | 0.99% | | | 0.99%(4) | |
Ratio of net investment income/(loss) to average net assets: | | | | | | | | | | |
Before waiver, expense reimbursement | | | (0.12)% | | | 0.15% | | | 0.04% | | | (0.69)%(4) | |
After waiver, expense reimbursement | | | 0.22% | | | 0.46% | | | 0.31% | | | (0.43)%(4) | |
Portfolio turnover rate | | | 34.63% | | | 38.13% | | | 16.93% | | | 13.14%(5) | |
| | | | | | | | | | | | | | |
(1)
| Fund commenced operations on July 21, 2021. |
(2)
| Net investment income per share has been calculated using the daily average shares method. |
(3)
| Not annualized for periods less than one year. |
(4)
| Annualized for periods less than one year. |
(5)
| Portfolio turnover rate is not annualized and excludes the value of portfolio securities received as a result of in-kind subscriptions. |
The accompanying notes are an integral part of these financial statements.
TABLE OF CONTENTS
Rockefeller Climate Solutions Fund
Financial Highlights
Class A
| | | |
| | Per Share Data for a Share Outstanding Throughout Each Period | |
| | | |
| | | | | | | | |
Net Asset Value, Beginning of Period | | | $8.84 | | | $8.53 | | | $10.05 | | | $10.00 | |
Income from investment operations: | | | | | | | | | | | | | |
Net investment income/(loss)(2) | | | — | | | 0.02 | | | 0.01 | | | (0.03) | |
Net realized and unrealized gain/(loss) | | | 1.91 | | | 0.29 | | | (1.49) | | | 0.08 | |
Total from investment operations | | | 1.91 | | | 0.31 | | | (1.48) | | | 0.05 | |
Paid from net investment income | | | (0.02) | | | — | | | — | | | | |
Paid from realized gains | | | — | | | — | | | (0.04) | | | — | |
Total distributions paid | | | (0.02) | | | — | | | (0.04) | | | — | |
Net Asset Value, End of Period | | | $10.73 | | | $8.84 | | | $8.53 | | | $10.05 | |
Total return | | | 21.65% | | | 3.61% | | | −14.76% | | | 0.50%(3) | |
Supplemental Data and Ratios: | | | | | | | | | | | | | |
Net assets at end of period (000’s) | | | $302 | | | $224 | | | $1,145 | | | $887 | |
Ratio of expenses to average net assets: | | | | | | | | | | | | | |
Before waiver, expense reimbursement | | | 1.58% | | | 1.55% | | | 1.53% | | | 1.56%(4) | |
After waiver, expense reimbursement | | | 1.24% | | | 1.24% | | | 1.24% | | | 1.24%(4) | |
Ratio of net investment income/(loss) to average net assets: | | | | | | | | | | |
Before waiver, expense reimbursement | | | (0.38)% | | | (0.08)% | | | (0.19)% | | | (1.21)%(4) | |
After waiver, expense reimbursement | | | (0.04)% | | | 0.23% | | | 0.08% | | | (0.89)%(4) | |
Portfolio turnover rate | | | 34.63% | | | 38.13% | | | 16.93% | | | 13.14%(5) | |
| | | | | | | | | | | | | | |
(1)
| Fund commenced operations on July 21, 2021. |
(2)
| Net investment income per share has been calculated using the daily average shares method. |
(3)
| Not annualized for periods less than one year. |
(4)
| Annualized for periods less than one year. |
(5)
| Portfolio turnover rate is not annualized and excludes the value of portfolio securities received as a result of in-kind subscriptions. |
The accompanying notes are an integral part of these financial statements.
TABLE OF CONTENTS
Rockefeller US Small Cap Core Fund
Financial Highlights
Class I
| | | |
| | Per Share Data for a Share Outstanding Throughout each Period | |
| | | |
| | | | | | | | |
Net Asset Value, Beginning of Period | | | $9.57 | | | $10.00 | |
Income from investment operations: | | | | | | | |
Net investment income/(loss)(2) | | | (0.02) | | | 0.01 | |
Net realized and unrealized gain/(loss) | | | 3.18 | | | (0.44) | |
Total from investment operations | | | 3.16 | | | (0.43) | |
Paid from net investment income | | | (0.01) | | | — | |
Paid from realized gains | | | — | | | — | |
Total distributions paid | | | (0.01) | | | — | |
Net Asset Value, End of Period | | | $12.72 | | | $9.57 | |
Total Return(3) | | | 33.01% | | | −4.30% | |
Supplemental Data and Ratios: | | | | | | | |
Net assets at end of period (000’s) | | | $111,863 | | | $61,548 | |
Ratio of expenses to average net assets: | | | | | | | |
Before waiver, expense reimbursement(4) | | | 1.28% | | | 1.55% | |
After waiver, expense reimbursement(4) | | | 0.99% | | | 0.95% | |
Ratio of net investment income/(loss) to average net assets: | | | | | | | |
Before waiver, expense reimbursement(4) | | | (0.45)% | | | (0.43)% | |
After waiver, expense reimbursement(4) | | | (0.16)% | | | 0.17% | |
Portfolio turnover rate(5) | | | 52.35% | | | 19.77% | |
| | | | | | | | |
(1)
| Fund commenced operations on July 31, 2023. |
(2)
| Net investment income per share has been calculated using the daily average shares method. |
(3)
| Not annualized for periods less than one year. |
(4)
| Annualized for periods less than one year. |
(5)
| Portfolio turnover rate is not annualized and excludes the value of portfolio securities received as a result of in-kind subscriptions. |
The accompanying notes are an integral part of these financial statements.
TABLE OF CONTENTS
Rockefeller US Small Cap Core Fund
Financial Highlights
Class A
| | | |
| | Per Share Data for a Share Outstanding Throughout Each Period | |
| | | |
| | | | | | | | |
Net Asset Value, Beginning of Period | | | $9.56 | | | $10.00 | |
Income from investment operations: | | | | | | | |
Net investment income/(loss)(2) | | | (0.05) | | | — | |
Net realized and unrealized gain/(loss) | | | 3.18 | | | (0.44) | |
Total from investment operations | | | 3.13 | | | (0.44) | |
Net Asset Value, End of Period | | | $12.69 | | | $9.56 | |
Total Return(3) | | | 32.74% | | | −4.40% | |
Supplemental Data and Ratios: | | | | | | | |
Net assets at end of period (000’s) | | | $174 | | | $102 | |
Ratio of expenses to average net assets: | | | | | | | |
Before waiver, expense reimbursement(4) | | | 1.53% | | | 3.98% | |
After waiver, expense reimbursement(4) | | | 1.24% | | | 1.20% | |
Ratio of net investment income/(loss) to average net assets: | | | | | | | |
Before waiver, expense reimbursement(4) | | | (0.71)% | | | (2.89)% | |
After waiver, expense reimbursement(4) | | | (0.42)% | | | (0.11)% | |
Portfolio turnover rate(5) | | | 52.35% | | | 19.77% | |
| | | | | | | | |
(1)
| Fund commenced operations on July 31, 2023. |
(2)
| Net investment income per share has been calculated using the daily average shares method. |
(3)
| Not annualized for periods less than one year. |
(4)
| Annualized for periods less than one year. |
(5)
| Portfolio turnover rate is not annualized and excludes the value of portfolio securities received as a result of in-kind subscriptions. |
The accompanying notes are an integral part of these financial statements.
TABLE OF CONTENTS
Rockefeller Funds
Notes to Financial Statements
November 30, 2024
(1) Organization
Trust for Professional Managers (the “Trust”) was organized as a Delaware statutory trust under a Declaration of Trust dated May 29, 2001. The Trust is registered under the Investment Company Act of 1940, as amended (the “1940 Act”), as an open-end management investment company. The Rockefeller Funds (the “Funds”) are comprised of the Rockefeller Climate Solutions Fund that commenced operations on July 21, 2021, and the Rockefeller US Small Cap Core Fund that commenced operations July 31, 2023. Each represents a distinct diversified series with its own investment objective and policies within the Trust.
Effective July 21, 2021, the Rockefeller Climate Solutions Fund, LP. (formerly, the Rockefeller Ocean Fund, LP.) (the “Predecessor Fund”) was reorganized into the Rockefeller Climate Solutions Fund, a series of the Trust, by transferring all of the Predecessor Fund’s assets to the Fund in exchange solely for Institutional Class shares of the Fund. The Fund’s investment adviser, portfolio managers, investment objective, strategies, policies, guidelines and restrictions are, in all material respects, the same as those of the Predecessor Fund.
The investment objective of the Rockefeller Climate Solutions Fund is to seek long- term growth of capital principally through equity investments in public companies across the market capitalization spectrum offering climate change mitigation or adaptation products and services. The investment objective of the Rockefeller US Small Cap Core Fund is to seek long-term capital appreciation principally through equity investments in U.S. small capitalization companies. The Trust may issue an unlimited number of shares of beneficial interest at $0.001 par value. Costs incurred by the Funds in connection with the organization, registration and initial public offering of shares were borne by Rockefeller & Co. LLC (the “Adviser”). Rockefeller Asset Management is a division of the Adviser.
(2) Significant Accounting Policies
The following is a summary of significant accounting policies consistently followed by the Funds in the preparation of the financial statements. These policies are in conformity with accounting principles generally accepted in the United States of America (“GAAP”).
The Funds are investment companies and accordingly follow the investment company accounting reporting guidance of the Financial Accounting Standards Board (FASB) Accounting Standard Codification Topic 946 “Financial Services Investment Companies”.
(a) Investment Valuation. Each equity security owned by the Funds that is listed on a securities exchange, except for securities listed on the NASDAQ Stock Market LLC (“NASDAQ”), is valued at its last sale price at the close of that exchange on the date as of which assets are valued. If a security is listed on more than one exchange, the Funds will use the price on the exchange that the Funds generally consider to be the principal exchange on which the security is traded.
Fund securities, including common stocks, preferred stocks and exchange traded funds, listed on NASDAQ will be valued at the NASDAQ Official Closing Price, which may not necessarily represent the last sale price. If, on a particular day, an exchange-listed or NASDAQ security does not trade, then: (i) the security is valued at the mean between the most recent quoted bid and asked prices at the close of the exchange on such day; or (ii) the security is valued at the latest sales price on the Composite Market for the day such security is being valued. “Composite Market” means a consolidation of the trade information provided by national securities and foreign exchanges and the over-the counter markets as published by an approved independent pricing service (“Pricing Service”).
Foreign securities will be priced in their local currencies as of the close of their primary exchange or market or as of the time each Fund calculates its NAV, whichever is earlier. Foreign securities, currencies and other assets denominated in foreign currencies are then translated into U.S. dollars at the exchange rate of such currencies against the U.S. dollar using the applicable currency exchange rates as of the close of the New York Stock Exchange (“NYSE”), generally 4:00 p.m. Eastern Time.
Foreign securities are traded on foreign exchanges which typically close before the close of business on each day on which the NYSE is open. Each security trading on these exchanges may be valued utilizing a systematic fair valuation model provided by a pricing service. The valuation of each security that meets certain criteria in relation to the
TABLE OF CONTENTS
Rockefeller Funds
Notes to Financial Statements(Cont’d)
November 30, 2024
valuation model is systematically adjusted to reflect the impact of movement in the U.S. market after the foreign markets close and are classified as Level 2 securities. Securities that do not meet the criteria, or that are principally traded in other foreign markets, are valued as of the last reported sale price at the time the respective Fund determines its NAV, or when reliable market prices or quotations are not readily available, at the mean between the most recent bid and asked quotations as of the close of the appropriate exchange or other designated time.
Debt securities, including short-term debt instruments having a maturity of 60 days or less, are generally valued at the mean in accordance with prices provided by a Pricing Service. Pricing Services may use various valuation methodologies such as the mean between the bid and the asked prices, matrix pricing and other analytical pricing models as well as market transactions and dealer quotations. If a price is not available from a Pricing Service, the most recent quotation obtained from one or more broker dealers known to follow the issue will be obtained. Quotations will be valued at the mean between the bid and the offer. In the absence of available quotations, the securities will be priced at fair value, as described below.
When market quotations are not readily available, any security or other asset is valued at its fair value in accordance with Rule 2a-5 of the 1940 Act as determined under the Adviser’s fair value pricing procedures, subject to oversight by the Board of Trustees. These fair value pricing procedures will also be used to price a security when corporate events, events in the securities market and/or world events cause the Adviser to believe that a security’s last sale price may not reflect its actual fair market value. The intended effect of using fair value pricing procedures is to ensure that the Funds are accurately priced. The Adviser will regularly evaluate whether the Funds’ fair value pricing procedures continue to be appropriate in light of the specific circumstances of the Funds and the quality of prices obtained through the application of such procedures.
The Funds have adopted Statement of Financial Accounting Standards, “Fair Value Measurements and Disclosures,” which requires each Fund to classify its securities based on a valuation method. These inputs are summarized in the three broad levels listed below:
| • | Level 1 – Quoted prices in active markets for identical securities. |
| • | Level 2 – Other significant observable inputs (including quoted prices for similar securities, interest rates, prepayment speeds, credit risk, etc.). |
| • | Level 3 – Significant unobservable inputs (including the Funds’ own assumptions in determining the fair value of investments). |
The inputs or methodology used for valuing securities are not necessarily an indication of the risk associated with investing in those securities. The following is a summary of the inputs used to value the Funds’ investments carried at fair value as of November 30, 2024:
Rockefeller Climate Solutions Fund
| | | | | | | | | | | | | | |
Assets(1): | | | | | | | | | | | | | |
Equities: | | | | | | | | | | | | | |
Common Stocks | | | $69,732,552 | | | $25,263,038 | | | $— | | | $94,995,590 | |
Money Market Funds | | | 952,162 | | | — | | | — | | | 952,162 | |
Total Investments in Securities | | | $70,684,714 | | | $25,263,038 | | | $— | | | $95,947,752 | |
| | | | | | | | | | | | | | |
TABLE OF CONTENTS
Rockefeller Funds
Notes to Financial Statements(Cont’d)
November 30, 2024
Rockefeller US Small Cap Core Fund
| | | | | | | | | | | | | | |
Assets(1): | | | | | | | | | | | | | |
Equities: | | | | | | | | | | | | | |
Common Stocks | | | $109,009,671 | | | $— | | | $— | | | $109,009,671 | |
Money Market Funds | | | 3,093,574 | | | — | | | — | | | 3,093,574 | |
Total Investments in Securities | | | $112,103,245 | | | $— | | | $— | | | $112,103,245 | |
| | | | | | | | | | | | | | |
(1)
| See the Schedule of Investments for industry classifications. |
The Funds held no Level 3 securities during the year ended November 30, 2024.
The Funds did not invest in derivative securities or engage in hedging activities during the year ended November 30, 2024.
Federal Income Taxes. The Funds comply with the requirements of Subchapter M of the Internal Revenue Code of 1986, as amended the (“Code”), necessary to qualify as a regulated investment company and make the requisite distributions of income and capital gains to shareholders sufficient to relieve them from all or substantially all federal income taxes. Therefore, no federal income tax provision has been provided.
(b) Distributions to Shareholders. The Funds will distribute net investment income (less operation expenses) and net capital gains at least annually. Distributions from net realized gains for book purposes may include short-term capital gains. All short-term capital gains are included in ordinary income for tax purposes. Distributions to shareholders are recorded on the ex-dividend date. The Funds may also pay a special distribution at the end of the calendar year to comply with federal tax requirements.
The amounts of dividends from net investment income and distributions from net realized gains are determined in accordance with federal income tax regulations, which may differ from GAAP. These differences are either temporary or permanent in nature. To the extent these differences are permanent in nature, such amounts are reclassified within the composition of net assets based on their federal tax-basis treatment.
(c) Use of Estimates. The preparation of financial statements in conformity with GAAP requires management to make estimates and assumptions that affect the reported amounts of assets and liabilities and disclosure of contingent assets and liabilities at the date of the financial statements and the reported amounts of revenues and expenses during the reporting period. Actual results could differ from those estimates.
(d) Share Valuation. The NAV per share of each Fund is calculated by dividing the sum of the value of the securities held by the Fund, plus cash or other assets, minus all liabilities (including estimated accrued expenses) by the total number of shares outstanding, rounded to the nearest cent. The Funds’ shares will not be priced on the days on which the NYSE is closed for trading. The offering and redemption price per share for the Funds is equal to each Fund’s NAV per share.
(e) Expenses. Expenses associated with a specific fund in the Trust are charged to that fund. Expenses are recognized on an accrual basis. Common expenses are typically allocated evenly between the series of the Trust, or by other equitable means.
(f) Other. Investment transactions are recorded on the trade date. The Funds determine the gain or loss from investment transactions on a high amortized cost basis. Dividend income is recognized on the ex-dividend date and interest income is recognized on an accrual basis. Distributions received from the Funds’ investments in REITs are comprised of ordinary income, capital gains and return of capital, as applicable. For financial statement purposes, the Funds use estimates to characterize these distributions received as return of capital, capital gain or ordinary income. Such estimates are based on historical information available from each REIT and other industry sources. These estimates may subsequently be revised based on information received for the security after the tax reporting periods are concluded, as the actual character of these distributions is not known until after the fiscal year end of the Funds. Changes to estimates will be recorded in the period they are known. The distributions received from REIT securities that have been classified as income and capital gains are included in dividend income and net realized gain on
TABLE OF CONTENTS
Rockefeller Funds
Notes to Financial Statements(Cont’d)
November 30, 2024
investments, respectively, on the Statement of Operations. The distributions received that are classified as return of capital reduced the cost of investments on the Statement of Assets and Liabilities. Any discount or premium is accreted or amortized using the constant yield method until maturity, or where applicable, the first call date of the security. Constant yield amortization takes into account the income that is produced on a debt security. This accretion/amortization type utilizes the discount rate used in computing the present value of all future principal and interest payments made by a debt instrument and produces an amount equal to the cost of the debt instrument.
(3) Federal Tax Matters
The tax character of distributions paid during the year ended November 30, 2024 was as follows:
| | | | | | | | |
Distributions paid from: | | | | | | | |
Ordinary Income | | | $382,243 | | | $46,262 | |
Long-Term Capital Gains | | | — | | | — | |
Total Distributions Paid | | | $382,243 | | | $46,262 | |
| | | | | | | | |
As of November 30, 2024, the components of accumulated earnings (losses) for income tax purposes were as follows:
| | | | | | | | |
Cost basis of investments for federal income tax purposes | | | $69,562,614 | | | $93,876,958 | |
Gross tax unrealized appreciation | | | 31,929,311 | | | 23,662,339 | |
Gross tax unrealized depreciation | | | (5,545,893) | | | (5,436,052) | |
Net tax unrealized appreciation | | | 26,383,418 | | | 18,226,287 | |
Undistributed ordinary income | | | 198,713 | | | 3,208,526 | |
Undistributed capital gains | | | 2,010,098 | | | 855,626 | |
Total other accumulated loss | | | — | | | (42,358) | |
Total distributable earnings | | | $28,592,229 | | | $22,248,081 | |
| | | | | | | | |
The difference between cost amounts for financial statement and federal income tax purposes is due to wash sale adjustments and timing differences in recognizing certain gains and losses in security transactions.
At November 30, 2024, the Funds had capital loss carryovers as follows:
| | | | | | | | |
Rockefeller Climate Solutions Fund | | | — | | | — | |
Rockefeller US Small Cap Core Fund | | | — | | | — | |
| | | | | | | | |
As of November 30, 2024, the tax years that remain open to examination by major tax jurisdictions include tax years ended November 30, 2022 through November 30, 2024 (Rockefeller Climate Solutions Fund) and November 30, 2023 through November 30, 2024 (Rockefeller US Small Cap Core Fund). The Funds are also not aware of any tax positions for which it is reasonably possible that the total amounts of unrecognized tax benefits will significantly change in the next year. The Funds recognize interest and penalties, if any, related to unrecognized tax benefits as income tax expense in the Statement of Operations. During the period, the Funds did not incur any interest or penalties, nor were any accrued as of November 30, 2024.
TABLE OF CONTENTS
Rockefeller Funds
Notes to Financial Statements(Cont’d)
November 30, 2024
GAAP requires that certain components of net assets relating to permanent differences be reclassified between financial and tax reporting. These reclassifications have no effect on net assets or NAV per share. For the year ended November 30, 2024, the following reclassifications were made for permanent tax differences on the Statement of Assets and Liabilities.
| | | | | | | | |
Total Distributable Earnings/(Losses) | | | $ — | | | $ — | |
Paid-In Capital | | | — | | | — | |
| | | | | | | | |
(4) Investment Adviser
The Trust has an Investment Advisory Agreement (the “Agreement”) with the Adviser to furnish investment advisory services to the Funds. Under the terms of the Agreement, each Fund compensates the Adviser for its management services at the annual rate of 0.85% of the average daily net assets of each Fund.
The Adviser has contractually agreed to waive its management fee and/or reimburse a Fund’s other expenses through the expiration date listed below to the extent necessary to ensure that such Fund’s total annual operating expenses do not exceed the Fund’s Expense Limitation Cap, listed below, of the Fund’s average daily net assets.
| | | | | | | | |
Rockefeller Climate Solutions Fund | | | 0.99% | | | March 31, 2026 | |
Rockefeller US Small Cap Core Fund | | | 1.05% | | | March 31, 2026* | |
| | | | | | | | |
*
| Prior to August 1, 2024, the Fund’s expense limitation cap was 0.95%. |
Any such waiver or reimbursement is subject to later adjustment to allow the Adviser to recover amounts waived or reimbursed to the extent actual fees and expenses for a fiscal period do not exceed the lesser of: (1) the Expense Limitation Cap in place at the time of the waiver and/or reimbursement; or (2) the Expense Limitation Cap in place at the time of recovery; provided, however, that the Adviser shall only be entitled to recover such amounts for a period of up to three years from the date such amount was waived or reimbursed.
The following table shows the remaining waived or reimbursed expenses subject to potential recovery expiring by:
| | | | | | | | |
November 30, 2025 | | | $261,030 | | | $— | |
November 30, 2026 | | | $260,048 | | | $115,968 | |
November 30, 2027 | | | $322,534 | | | $251,810 | |
| | | | | | | | |
(5) Related Party Transactions
U.S. Bancorp Fund Services, LLC, doing business as U.S. Bank Global Fund Services (“Fund Services” or the “Administrator”), acts as the Funds’ Administrator under an Administration Agreement. The Administrator prepares various federal and state regulatory filings, reports and returns for the Funds; prepares reports and materials to be supplied to the Trustees; monitors the activities of the Funds’ custodian, transfer agent and accountant; coordinates the preparation and payment of the Funds’ expenses; and reviews the Funds’ expense accruals. Fund Services also serves as the fund accountant and transfer agent to the Fund. U.S. Bank National Association (“US Bank”), an affiliate
TABLE OF CONTENTS
Rockefeller Funds
Notes to Financial Statements(Cont’d)
November 30, 2024
of Fund Services, serves as the Funds’ custodian. The Trust’s Chief Compliance Officer is also an employee of Fund Services. Fees and expenses incurred for the year ended November 30, 2024, and owed as of November 30, 2024, are as follows:
| | | | | | | | |
Rockefeller Climate Solutions Fund | | | $111,977 | | | $19,442 | |
Rockefeller US Small Cap Core Fund | | | $105,487 | | | $18,932 | |
| | | | | | | | |
| | | | | | | | |
Rockefeller Climate Solutions Fund | | | $4,803 | | | $812 | |
Rockefeller US Small Cap Core Fund | | | $1,245 | | | $236 | |
| | | | | | | | |
| | | | | | | | |
Rockefeller Climate Solutions Fund | | | $153,883 | | | $22,443 | |
Rockefeller US Small Cap Core Fund | | | $50,427 | | | $8,499 | |
| | | | | | | | |
| | | | | | | | |
Rockefeller Climate Solutions Fund | | | $18,641 | | | $3,681 | |
Rockefeller US Small Cap Core Fund | | | $9,117 | | | $1,527 | |
| | | | | | | | |
| | | | | | | | |
Rockefeller Climate Solutions Fund | | | $12,259 | | | $2,599 | |
Rockefeller US Small Cap Core Fund | | | $11,876 | | | $2,084 | |
| | | | | | | | |
Each Fund has a line of credit with US Bank (see Note 9). Certain officers of the Funds are also employees of Fund Services.
(6) Distribution Plan
The Trust has adopted a Distribution Plan pursuant to Rule 12b-1 under the 1940 Act (the “12b-1 Plan”), on behalf of the Class A shares of the Funds which authorizes the Trust, on behalf of each Fund, to pay Quasar Distributors, LLC (the “Distributor”), the Funds’ principal distributor, a distribution fee of 0.25% of the Funds’ average daily net assets of each Fund’s Class A shares. During the year ended November 30, 2024, the Class A shares incurred fees pursuant to the 12b-1Plan of $666 for the Rockefeller Climate Solutions Fund and $357 for the Rockefeller US Small Cap Core Fund.
(7) Capital Share Transactions
Transactions in the shares of the Funds were as follows:
Rockefeller Climate Solutions Fund
| | | | | | | | |
Shares Sold | | | 4,022 | | | 1,025 | |
Shares Reinvested | | | 20 | | | — | |
Shares Redeemed | | | (1,234) | | | (109,844) | |
Net increase (decrease) | | | 2,808 | | | (108,819) | |
| | | | | | | | |
TABLE OF CONTENTS
Rockefeller Funds
Notes to Financial Statements(Cont’d)
November 30, 2024
| | | | | | | | |
Shares Sold | | | 674,132 | | | 1,443,347 | |
Shares Reinvested | | | 21,597 | | | 5,256 | |
Shares Redeemed | | | (1,279,384) | | | (2,617,709) | |
Net decrease | | | (583,655) | | | (1,169,106) | |
| | | | | | | | |
Rockefeller US Small Cap Core Fund
| | | | | | | | |
Shares Sold | | | 3,056 | | | 10,654 | |
Shares Reinvested | | | — | | | — | |
Shares Redeemed | | | — | | | — | |
Net increase | | | 3,056 | | | 10,654 | |
| | | | | | | | |
| | | | | | | | |
Shares Sold | | | 2,744,881 | | | 6,591,654 | |
Shares Reinvested | | | 1,135 | | | — | |
Shares Redeemed | | | (382,840) | | | (158,190) | |
Net increase | | | 2,363,176 | | | 6,433,464 | |
| | | | | | | | |
(8) Investment Transactions
The aggregate securities transactions, excluding short-term investments for the Funds for the year ended November 30, 2024 are listed below.
| | | | | | | | | | | | | | |
Rockefeller Climate Solutions Fund | | | $31,402,917 | | | $35,981,060 | | | $ — | | | $ — | |
Rockefeller US Small Cap Core Fund | | | $67,935,747 | | | $44,026,847 | | | $ — | | | $ — | |
| | | | | | | | | | | | | | |
(9) Line of Credit
As of November 30, 2024, the Rockefeller Climate Solutions Fund and Rockefeller US Small Cap Core Fund each had a line of credit in the amount of $10,000,000 and $8,000,000, respectively, which will mature on August 2, 2025. The secured lines of credit are intended to provide short-term financing, if necessary, and subject to certain restrictions, in connection with shareholder redemptions. The credit facilities are with the Funds’ custodian, US Bank. Interest will accrue at the prime rate. The following table provides information regarding usage of the lines of credit for the year ended November 30, 2024. The Funds did not have an outstanding balance on the line of credit as of November 30, 2024.
| | | | | | | | | | | | | | | | | |
Rockefeller Climate Solutions Fund | | | 1 | | | $819,000 | | | $193.37 | | | $819,000 | | | 7/15/2024 | |
Rockefeller US Small Cap Core Fund | | | — | | | $— | | | $— | | | $— | | | — | |
| | | | | | | | | | | | | | | | | |
TABLE OF CONTENTS
Rockefeller Funds
Notes to Financial Statements(Cont’d)
November 30, 2024
(10) Recent Market Events
U.S. and international markets have experienced and may continue to experience significant periods of volatility in recent years and months due to a number of economic, political and global macro factors including uncertainty regarding inflation and central banks’ interest rate increases, the possibility of a national or global recession, trade tensions, political events, the war between Russia and Ukraine and, significant conflict between Israel and Hamas in the Middle East. As a result of continuing political tensions and armed conflicts, including the war between Ukraine and Russia, the U.S. and the European Union imposed sanctions on certain Russian individuals and companies, including certain financial institutions, and have limited certain exports and imports to and from Russia. The war has contributed to recent market volatility and may continue to do so. Continuing market volatility as a result of recent market conditions or other events may have an adverse effect on the performance of the Funds.
(11) Subsequent Events
The Funds have evaluated events and transactions that have occurred subsequent to November 30, 2024 and determined there were no subsequent events that would require recognition or disclosure within the financial statements other than as described below. On December 20, 2024, the Funds declared and paid distributions from ordinary income to shareholders of record as of December 19, 2024 as follows:
| | | | | | | | | | | |
Rockefeller Climate Solutions Fund - Class A | | | $30 | | | $— | | | $6,463 | |
Rockefeller Climate Solutions Fund - Institutional Class | | | 201,180 | | | — | | | 2,003,665 | |
Rockefeller US Small Cap Core Fund - Class A | | | 5 | | | 4,941 | | | 1,266 | |
Rockefeller US Small Cap Core Fund - Class I | | | 24,889 | | | 3,196,806 | | | 818,870 | |
| | | | | | | | | | | |
TABLE OF CONTENTS
Rockefeller Funds
Report of Independent Registered Public Accounting Firm
November 30, 2024
To the Shareholders of the Rockefeller Funds and the
Board of Trustees of Trust for Professional Managers:
Opinion on the Financial Statements and Financial Highlights
We have audited the accompanying statement of assets and liabilities, including the schedules of investments, of the Rockefeller Funds, comprising of the Rockefeller Climate Solutions Fund and Rockefeller US Small Cap Core Fund (the “Funds”), each portfolios of the series constituting the Trust for Professional Managers, as of November 30, 2024; the related statement of operations for the year then ended, the statements of changes in net assets for each of the two years in the period then ended and the financial highlights for each of the three years in the period then ended and for the period from July 21, 2021 (commencement of operations) through November 30, 2021 for the Rockefeller Climate Solutions Fund; the related statements of operations for the year then ended, and the statements of changes in net assets and financial highlights for the year then ended and for the period from July 31, 2023 (commencement of operations) through November 30, 2023 for the Rockefeller US Small Cap Core Fund; and the related notes. In our opinion, the financial statements and financial highlights present fairly, in all material respects, the financial position of the Rockefeller Climate Solutions Fund as of November 30, 2024; the results of its operations for the year then ended, the changes in its net assets for each of the two years in the period then ended, and the financial highlights for each of the three years in the period then ended and for the period from July 21, 2021 (commencement of operations) through November 30, 2021. Also in our opinion, the financial statements and financial highlights present fairly, in all material respects, the financial position of Rockefeller US Small Cap Core Fund as of November 30, 2024; and the results of its operations for the year then ended, the changes in its net assets and the financial highlights for the year then ended and for the period from July 31, 2023 (commencement of operations) through November 30, 2023 in conformity with accounting principles generally accepted in the United States of America.
Basis for Opinion
The financial statements and financial highlights are the responsibility of the Funds’ management. Our responsibility is to express an opinion on the Funds’ financial statements and financial highlights based on our audits. We are a public accounting firm registered with the Public Company Accounting Oversight Board (United States) (PCAOB) and are required to be independent with respect to the Funds in accordance with the U.S. federal securities laws and the applicable rules and regulations of the Securities and Exchange Commission and the PCAOB.
We conducted our audits in accordance with the standards of the PCAOB. Those standards require that we plan and perform the audit to obtain reasonable assurance about whether the financial statements and financial highlights are free of material misstatement, whether due to error or fraud. The Funds are not required to have, nor were we engaged to perform, an audit of their internal control over financial reporting. As part of our audits, we are required to obtain an understanding of internal control over financial reporting but not for the purpose of expressing an opinion on the effectiveness of the Funds’ internal control over financial reporting. Accordingly, we express no such opinion.
Our audits included performing procedures to assess the risks of material misstatement of the financial statements and financial highlights, whether due to error or fraud, and performing procedures that respond to those risks. Such procedures included examining, on a test basis, evidence regarding the amounts and disclosures in the financial statements and financial highlights. Our audits also included evaluating the accounting principles used and significant estimates made by management, as well as evaluating the overall presentation of the financial statements and financial highlights. Our procedures included confirmation of securities owned as of November 30, 2024, by correspondence with the custodian and brokers. We believe that our audits provide a reasonable basis for our opinion.
/s/ Deloitte & Touche LLP
Chicago, Illinois
January 28, 2025
We have served as the auditor of one or more Trust for Professional Managers’ investment companies since 2002.
TABLE OF CONTENTS
Rockefeller Funds
Investment advisory agreement
BASIS FOR TRUSTEES’ APPROVAL OF INVESTMENT ADVISORY AGREEMENT
The Board of Trustees (the “Trustees”) of Trust for Professional Managers (the “Trust”) met on August 15, 2024 to consider the renewal of the Investment Advisory Agreement (the “Agreement”) between the Trust, on behalf of the Rockefeller Climate Solutions Fund and the Rockefeller US Small Cap Core Fund (each, a “Fund,” and together, the “Funds”), each a series of the Trust, and Rockefeller & Co. LLC (“Rockefeller”), the Funds’ investment adviser (the “Adviser”). The Trustees also met at a prior meeting held on June 20, 2024 (the “June 20, 2024 meeting”) to review materials related to the renewal of the Agreement. Prior to these meetings, the Trustees requested and received materials to assist them in considering the renewal of the Agreement. The materials provided contained information with respect to the factors enumerated below, including a copy of the Agreement, a memorandum prepared by the Trust’s outside legal counsel discussing in detail the Trustees’ fiduciary obligations and the factors they should assess in considering the renewal of the Agreement, detailed comparative information relating to each Fund’s performance, as well as the management fees and other expenses of the Funds, due diligence materials relating to the Adviser (including a due diligence questionnaire completed on behalf of the Funds by the Adviser, the Adviser’s Form ADV, select financial statements of the Adviser, biographical information of the Adviser’s key management and compliance personnel, comparative fee information for the Funds and the Adviser’s other separately-managed accounts and a summary detailing key provisions of the Adviser’s written compliance program, including its code of ethics) and other pertinent information. The Trustees also received information periodically throughout the year that was relevant to the Agreement renewal process, including performance, management fee and other expense information. Based on their evaluation of the information provided by the Adviser, in conjunction with the Funds’ other service providers, the Trustees, by a unanimous vote (including a separate vote of the Trustees who are not “interested persons,” as that term is defined in the Investment Company Act of 1940, as amended (the “Independent Trustees”)), approved the continuation of the Agreement for an additional one-year term ending August 31, 2025.
DISCUSSION OF FACTORS CONSIDERED
In considering the renewal of the Agreement and reaching their conclusions, the Trustees reviewed and analyzed various factors that they determined were relevant, including the factors enumerated below.
1. NATURE, EXTENT AND QUALITY OF SERVICES PROVIDED TO THE FUNDS
The Trustees considered the nature, extent and quality of services provided by the Adviser to the Funds and the amount of time devoted to the Funds’ operations by the Adviser’s staff. The Trustees considered the Adviser’s specific responsibilities in all aspects of day-to-day management of the Funds, including the investment strategies implemented by the Adviser, as well as the qualifications, experience and responsibilities of Rolando F. Morillo and Jose Garza, the Rockefeller Climate Solutions Fund’s portfolio managers, and Jason Kotik and Tim Skiendzielewski, the Rockefeller US Small Cap Core Fund’s portfolio managers, and other key personnel at the Adviser involved in the day-to-day activities of the Funds. The Trustees reviewed information provided by the Adviser in a due diligence questionnaire, including the structure of the Adviser’s compliance program and its continuing commitment to the Funds. The Trustees noted that during the course of the prior year the Adviser had participated in a Trust board meeting to discuss the Funds’ performance and outlook, along with the compliance efforts made by the Adviser, including reports provided by the Adviser in its role as the Funds’ valuation designee. The Trustees also noted any services that extended beyond portfolio management, and they considered the brokerage practices of the Adviser. The Trustees discussed the Adviser’s handling of compliance matters, including the reports of the Trust’s chief compliance officer to the Trustees on the effectiveness of the Adviser’s compliance program. The Trustees also considered the Adviser’s overall financial condition, as well as the implementation and operational effectiveness of the Adviser’s business continuity plan. The Trustees concluded that the Adviser had sufficient quality and depth of personnel, resources, investment methods and compliance policies and procedures essential to performing its duties under the Advisory Agreement and that the nature, overall quality and extent of the management services provided to the Funds, as well as the Adviser’s compliance program, were satisfactory and reliable.
TABLE OF CONTENTS
Rockefeller Funds
Investment advisory agreement(Cont’d)
2. INVESTMENT PERFORMANCE OF THE FUNDS AND THE ADVISER
The Trustees discussed the performance of the Institutional Class shares of the Rockefeller Climate Solutions Fund and the Class I shares of the Rockefeller US Small Cap Core Fund for the quarter, one-year and since inception periods ended March 31, 2024, as applicable. The Trustees also reviewed supplemental performance information of the Institutional Class shares of the Rockefeller Climate Solutions Fund for the one-year and three-year periods ended July 31, 2024, and supplemental performance information of the Class I shares of the Rockefeller US Small Cap Core Fund for the one-year period ended July 31, 2024. In assessing the quality of the portfolio management services delivered by the Adviser, the Trustees also compared the short-term and longer-term performance of the Institutional Class shares of the Rockefeller Climate Solutions Fund and the Class I shares of the Rockefeller US Small Cap Core Fund on both an absolute basis and in comparison to a benchmark index (the MSCI All Country World Index for the Rockefeller Climate Solutions Fund and the Russell 2000 Total Return Index for the Rockefeller US Small Cap Core Fund) and in comparison to a peer group of funds as constructed using publicly-available data provided by Morningstar, Inc. and presented by Barrington Financial Group, LLC d/b/a Barrington Partners, an independent third-party benchmarking firm, through its cohort selection process (a peer group of U.S. open-end global small/mid-cap stock, global large-cap stock blend, global large-cap stock growth, mid-cap growth and small-cap blend funds for the Rockefeller Climate Solutions Fund and a peer group of U.S. open-end small-cap blend funds for the Rockefeller US Small Cap Core Fund) (each, a “Barrington Cohort”). The Trustees also reviewed information on the historical performance of other separately-managed accounts of the Adviser with the same or similar investment strategies as each Fund.
The Trustees noted the Rockefeller Climate Solutions Fund’s Institutional Class shares performance for the one-year period ended March 31, 2024 was above the Barrington Cohort average. The Trustees noted that for the quarter, one-year and since inception periods ended March 31, 2024, the Rockefeller Climate Solutions Fund’s Institutional Class shares had underperformed the MSCI All Country World Index. The Trustees further noted that the Adviser considered the performance dispersion between the performance of the Rockefeller Climate Solutions Fund’s Institutional Class shares and the performance of the comparable separately-managed account composite to be within an acceptable range during the relevant time periods.
The Trustees reviewed the performance of the Class I shares of the Rockefeller US Small Cap Core Fund for the one-year period ended July 31, 2024. The Trustees also noted that for the quarter ended March 31, 2024, the Rockefeller US Small Cap Core Fund’s Class I shares had underperformed the Russell 2000 Index. The Trustees noted that for the since inception period ended March 31, 2024, the Rockefeller US Small Cap Core Fund’s Class I shares had outperformed the Russell 2000 Index. The Trustees further noted that the Adviser considered the performance dispersion between the performance of the Rockefeller US Small Cap Core Fund’s Class I shares and the performance of the comparable separately-managed account composite to be within an acceptable range during the relevant time periods.
After considering all of the information, the Trustees concluded that the performance obtained by the Adviser for the Funds was satisfactory under current market conditions. Although past performance is not a guarantee or indication of future results, the Trustees determined that each Fund and its shareholders were likely to benefit from the Adviser’s continued management.
3. COSTS OF SERVICES PROVIDED AND PROFITS REALIZED BY THE ADVISER
The Trustees considered the cost of services and the structure of the Adviser’s fees, including a review of the expense analyses and other pertinent material with respect to each Fund. The Trustees reviewed the related statistical information and other materials provided, including the comparative expenses and Barrington Cohort comparisons. The Trustees considered the cost structure of the Funds relative to the Barrington Cohort and the Adviser’s separately-managed accounts with the same or similar investment strategies as each Fund, as well as any fee waivers and expense reimbursements of the Adviser.
The Trustees also considered the overall profitability of the Adviser and reviewed the Adviser’s financial information and noted that the Adviser has subsidized each Fund’s operations since the Fund’s inception. The Trustees also examined the level of profits that could be expected to accrue to the Adviser from the fees payable under the Advisory
TABLE OF CONTENTS
Rockefeller Funds
Investment advisory agreement(Cont’d)
Agreement, as well as the Funds’ brokerage practices and use of soft dollars by the Adviser. These considerations were based on materials requested by the Trustees and the Funds’ administrator specifically for the June 20, 2024 meeting and the August 15, 2024 meeting at which the Advisory Agreement was formally considered, as well as the reports prepared by the Adviser over the course of the year.
The Trustees noted that the Rockefeller Climate Solutions Fund’s contractual management fee of 0.85% was above the Barrington Cohort average of 0.81%. The Trustees noted that the Rockefeller Climate Solutions Fund was operating above its expense cap of 0.99% for Institutional Class shares. The Trustees observed that the Rockefeller Climate Solutions Fund’s total expense ratio (net of fee waivers and expense reimbursements) of 0.99% for Institutional Class shares was below the Barrington Cohort average of 1.13%. The Trustees also compared the fees paid by the Rockefeller Climate Solutions Fund to the fees paid by separately-managed accounts of the Adviser that are managed by the Adviser with similar investment strategies.
The Trustees noted that the Rockefeller US Small Cap Core Fund’s contractual management fee of 0.85% was above the Barrington Cohort average of 0.82%. The Trustees noted that the Rockefeller US Small Cap Core Fund was operating above its expense cap of 0.95% for Class I shares. The Trustees observed that the Rockefeller US Small Cap Core Fund’s total expense ratio (net of fee waivers and expense reimbursements) of 0.95% for Class I shares effective through July 31, 2024 was below the Barrington Cohort average of 0.97%. The Trustees also observed that the Rockefeller US Small Cap Core Fund’s total expense ratio (net of fee waivers and expense reimbursements) increased from 0.95% to 1.05% for Class I shares effective August 1, 2024 and was above the Barrington Cohort average of 0.97% The Trustees also compared the fees paid by the Rockefeller US Small Cap Core Fund to the fees paid by separately-managed accounts of the Adviser that are managed by the Adviser with similar investment strategies.
The Trustees concluded that each Fund’s expenses and the management fees paid to the Adviser were fair and reasonable in light of the comparative performance, expense and management fee information. The Trustees noted, based on a profitability analysis prepared by the Adviser, that the Adviser’s profits from sponsoring the Rockefeller Climate Solutions Fund were not excessive, and while the Rockefeller US Small Cap Core Fund was not yet profitable to the Adviser, the Adviser maintained adequate profit levels to support its services to each Fund from the revenues of its overall investment advisory business, despite subsidizing the operations of the Rockefeller US Small Cap Core Fund.
4. EXTENT OF ECONOMIES OF SCALE AS THE FUNDS GROW
The Trustees compared each Fund’s expenses relative to its peer group and discussed realized and potential economies of scale. The Trustees also reviewed the structure of each Fund’s management fee and whether each Fund was large enough to generate economies of scale for shareholders or whether economies of scale would be expected to be realized as Fund assets grow (and if so, how those economies of scale were being or would be shared with shareholders). The Trustees reviewed all fee waivers, expense reimbursements and potential recoupments by the Adviser with respect to each Fund. The Trustees noted that the Funds’ management fee structures did not contain any breakpoint reductions as the Funds’ assets grow in size, but that the feasibility of incorporating breakpoints would continue to be reviewed on a regular basis. With respect to the Adviser’s fee structure, the Trustees concluded that the current fee structure was reasonable and reflected a sharing of economies of scale between the Adviser and each Fund at the Fund’s current asset level.
5. BENEFITS DERIVED FROM THE RELATIONSHIP WITH THE FUNDS
The Trustees considered the direct and indirect benefits that could be received by the Adviser from its association with each Fund. The Trustees examined the brokerage practices of the Adviser with respect to the Funds. The Trustees concluded that the benefits the Adviser may receive, such as greater name recognition and increased ability to obtain research or brokerage services or to attract additional investor assets, appear to be reasonable, and in many cases may benefit the Funds.
TABLE OF CONTENTS
Rockefeller Funds
Investment advisory agreement(Cont’d)
CONCLUSIONS
The Trustees considered all of the foregoing factors. In considering the renewal of the Advisory Agreement, the Trustees did not identify any one factor as all-important, but rather considered these factors collectively in light of each Fund’s surrounding circumstances. Based on this review, the Trustees, including a majority of the Independent Trustees, approved the continuation of the Advisory Agreement for an additional one-year term ending August 31, 2025 as being in the best interests of each Fund and its shareholders.
TABLE OF CONTENTS
Additional Information (Unaudited)
Tax information
For the year ended November 30, 2024, certain dividends paid by the Funds may be subject to a maximum tax rate of 23.8%, as provided for by the Jobs and Growth Tax Relief Reconciliation Act of 2003. The percentage of dividends declared from ordinary income designated as qualified dividend income was as follows:
| | | | | |
Rockefeller Climate Solutions Fund | | | 100.00% | |
Rockefeller US Small Cap Core Fund | | | 81.92% | |
| | | | | |
For corporate shareholders, the percent of ordinary income distributions qualifying for the corporate dividends received deduction for the fiscal year ended November 30, 2024, was as follows:
| | | | | |
Rockefeller Climate Solutions Fund | | | 100.00% | |
Rockefeller US Small Cap Core Fund | | | 81.93% | |
| | | | | |
For the year ended November 30, 2024, the percentage of taxable ordinary income distributions designated as short-term capital gain distributions under Section 871(k)(2)(c) of the Code for the Funds was as follows:
| | | | | |
Rockefeller Climate Solutions Fund | | | 0.00% | |
Rockefeller US Small Cap Core Fund | | | 21.57% | |
| | | | | |
Indemnifications
Under the Trust’s organizational documents, its officers and Trustees are indemnified against certain liabilities arising out of the performance of their duties to the Funds. In addition, in the normal course of business, the Funds enter into contracts that provide general indemnifications to other parties. The Funds’ maximum exposure under these arrangements is unknown as this would involve future claims that may be made against the Funds that have not yet occurred. However, the Funds have not had prior claims or losses pursuant to these contracts and expect the risk of loss to be remote.
TABLE OF CONTENTS
ROCKEFELLER FUNDS
Investment Adviser
Rockefeller & Co. LLC
45 Rockefeller Plaza, 5th Floor
New York, New York 10111
Legal Counsel
Godfrey & Kahn, S.C.
833 East Michigan Street
Suite 1800
Milwaukee, Wisconsin 53202
Independent Registered Public Accounting Firm
Deloitte & Touche LLP
111 South Wacker Drive
Chicago, Illinois 60606
Transfer Agent, Fund Accountant and Fund Administrator
U.S. Bancorp Fund Services, LLC
615 East Michigan Street
Milwaukee, Wisconsin 53202
Custodian
U.S. Bank National Association
Custody Operations
1555 North River Center Drive
Suite 302
Milwaukee, Wisconsin 53212
Distributor
Quasar Distributors, LLC
111 East Kilbourn Avenue
Suite 2200
Milwaukee, Wisconsin 53202
This report is intended for shareholders of the Funds and may not be used as sales literature unless preceded or accompanied by a current prospectus.
| (b) | Financial Highlights are included within the financial statements filed under Item 7(a) of this Form. |
Item 8. Changes in and Disagreements with Accountants for Open-End Investment Companies.
There were no changes in or disagreements with accountants during the period covered by this report.
Item 9. Proxy Disclosure for Open-End Investment Companies.
There were no matters submitted to a vote of shareholders during the period covered by this report.
Item 10. Remuneration Paid to Directors, Officers, and Others of Open-End Investment Companies.
This information is included within the financial statement filed under item 7(a) of this form.
Item 11. Statement Regarding Basis for Approval of Investment Advisory Contract.
This information is included within the financial statements filed under Item 7(a) of this Form.
Item 12. Disclosure of Proxy Voting Policies and Procedures for Closed-End Management Investment Companies.
Not applicable to open-end investment companies.
Item 13. Portfolio Managers of Closed-End Management Investment Companies.
Not applicable to open-end investment companies.
Item 14. Purchases of Equity Securities by Closed-End Management Investment Company and Affiliated Purchasers.
Not applicable to open-end investment companies.
Item 15. Submission of Matters to a Vote of Security Holders.
There have been no material changes to the procedures by which shareholders may recommend nominees to the registrant’s board of trustees.
Item 16. Controls and Procedures.
| (a) | The Registrant’s Principal Executive Officer and Principal Financial Officer have reviewed the Registrant’s disclosure controls and procedures (as defined in Rule 30a-3(c) under the Investment Company Act of 1940 (the “Act”)) as of a date within 90 days of the filing of this report, as required by Rule 30a-3(b) under the Act and Rules 13a-15(b) or 15d-15(b) under the Securities Exchange Act of 1934. Based on their review, such officers have concluded that the disclosure controls and procedures are effective in ensuring that information required to be disclosed in this report is appropriately recorded, processed, summarized and reported and made known to them by others within the Registrant and by the Registrant’s service provider. |
| (b) | There were no changes in the Registrant’s internal control over financial reporting (as defined in Rule 30a-3(d) under the Act) that occurred during the period covered by this report that have materially affected, or are reasonably likely to materially affect, the Registrant’s internal control over financial reporting. |
Item 17. Disclosure of Securities Lending Activities for Closed-End Management Investment Companies
Not applicable to open-end investment companies.
Item 18. Recovery of Erroneously Awarded Compensation.
Not applicable.
Item 19. Exhibits.
(2) Any policy required by the listing standards adopted pursuant to Rule 10D-1 under the Exchange Act (17 CFR 240.10D-1) by the registered national securities exchange or registered national securities association upon which the registrant’s securities are listed. Not applicable.
(3) A separate certification for each principal executive officer and principal financial officer of the registrant as required by Rule 30a-2(a) under the Investment Company Act of 1940 (17 CFR 270.30a-2(a)). Filed herewith.
(4) Any written solicitation to purchase securities under Rule 23c-1 under the Act sent or given during the period covered by the report by or on behalf of the registrant to 10 or more persons. Not applicable.
(5) Change in the registrant’s independent public accountant. Provide the information called for by Item 4 of Form 8-K under the Exchange Act (17 CFR 249.308). Unless otherwise specified by Item 4, or related to and necessary for a complete understanding of information not previously disclosed, the information should relate to events occurring during the reporting period. Not applicable.
SIGNATURES
Pursuant to the requirements of the Securities Exchange Act of 1934 and the Investment Company Act of 1940, the registrant has duly caused this report to be signed on its behalf by the undersigned, thereunto duly authorized.
| | (Registrant) | Trust for Professional Managers | |
| | By (Signature and Title)* | /s/ John Buckel | |
| | | John Buckel, Principal Executive Officer | |
Pursuant to the requirements of the Securities Exchange Act of 1934 and the Investment Company Act of 1940, this report has been signed below by the following persons on behalf of the registrant and in the capacities and on the dates indicated.
| | By (Signature and Title)* | /s/ John Buckel | |
| | | John Buckel, Principal Executive Officer | |
| | By (Signature and Title)* | /s/ Jennifer Lima | |
| | | Jennifer Lima, Principal Financial Officer | |
* Print the name and title of each signing officer under his or her signature.