UNITED STATES
SECURITIES AND EXCHANGE COMMISSION
Washington, D.C. 20549
FORM N-CSR
CERTIFIED SHAREHOLDER REPORT OF REGISTERED
MANAGEMENT INVESTMENT COMPANIES
Investment Company Act file number 811-10401
Trust for Professional Managers
(Exact name of registrant as specified in charter)
615 East Michigan Street
Milwaukee, WI 53202
(Address of principal executive offices) (Zip code)
Jay S. Fitton
U.S. Bancorp Fund Services, LLC
615 East Michigan Street
Milwaukee, WI 53202
(Name and address of agent for service)
(513) 629-8104
Registrant’s telephone number, including area code
Date of fiscal year end: February 28, 2021
Date of reporting period: August 31, 2020
Item 1. Reports to Stockholders.
Semi-Annual Report

August 31, 2020
Snow Capital Small Cap Value Fund
Class A Shares (SNWAX)
Class C Shares (SNWCX)
Institutional Class Shares (SNWIX)
Snow Capital Long/Short Opportunity Fund
Class A Shares (SNOAX)
Class C Shares (SNOCX)
Institutional Class Shares (SNOIX)
Investment Adviser
Snow Capital Management L.P.
1605 Carmody Court, Suite 300
Sewickley, Pennsylvania 15143
Phone: 1-877-SNOWFND (877-766-9363)
| 3 | ||||
| 14 | ||||
| 17 | ||||
| 23 | ||||
SCHEDULE OF INVESTMENTS (Snow Capital Long/Short Opportunity Fund) | 27 | |||
| 32 | ||||
| 36 | ||||
| 38 | ||||
| 40 | ||||
| 42 | ||||
| 54 | ||||
BASIS FOR TRUSTEES’ APPROVAL OF INVESTMENT ADVISORY AGREEMENT | 69 | |||
| 74 | ||||
| 75 | ||||
Amid unparalleled oscillating market action, equity prices, as measured by the S&P 500® Total Return Index, rose by 19.63% for the six-month period ending August 31, 2020.
In the early part of the year, the severity of the COVID-19 pandemic took investors by surprise leading to a rapid selloff in capital assets. In the latter part of the period, government stimulus actions had a large impact on investors’ risk tolerance, accelerating the pace of the recovery in equity returns. While the rebound in the broad markets has been significant, it has been uneven and largely led by a narrow scope of large cap momentum-driven growth companies. Market breadth has also been weak with the largest gainers concentrated in the Technology sector. To illustrate, the Technology heavy Russell 3000® Growth Index returned 35.62%, while the Russell 3000® Value Total Return Index posted a paltry 2.17% return for the same period ended August 31, 2020. As a result, the valuation differential between growth and value, as measured by the Russell Indices, has expanded to historic levels. We expect these divergent return streams to correct as the recovery continues.
While the pace of the recovery has been varied with asymmetrical performance patterns in substyles and large differences in returns between sectors, the broad market has advanced. Overall, our economic outlook remains positive and we expect equity prices to continue to appreciate. Fiscal policy working in tandem with monetary policy should continue to buoy the economy and markets. Currently, legislators are negotiating an additional fiscal relief package that would provide aid to local governments and offer businesses financial protection. The Fed remains highly supportive and emphasized that interest rates are expected to be flat or near zero through the next two to three years. In turn, this is likely to help boost risk asset prices and valuations. The path to recovery also seems to be getting clearer on the employment front. With many businesses continuing to rehire employees following coronavirus lockdowns there have been four consecutive months of job gains. While the current unemployment rate of 8.4% remains well above 3.5% in February - before the pandemic hit - it is still substantially lower than its peak of 14.7% in April. We expect continued improvement in labor to fuel investor sentiment and consumer spending, which should bode well for further increases in equity returns.
In closing, our Funds are populated with companies that we believe are positioned to benefit throughout the economic and market cycle. The firms we
3
own have strong balance sheets, proven management teams, recurring cash flow streams and the flexibility to adapt to the new world post COVID-19. We believe these companies will be able to compound earnings over an extended period through both rising and declining markets. All told, we remain dedicated to delivering strong long-term performance and transparent communications to our shareholders. Thank you for your commitment and loyalty to Snow Capital.
Snow Capital Small Cap Value Fund
How did the Fund perform?
For the six-month period ended August 31, 2020, the Snow Capital Small Cap Value Fund’s Institutional Class Shares recorded a return of 4.51% compared to a return of -3.66% for the Russell 2000® Value Total Return Index.
How is the Fund managed?
We employ a contrarian value process rooted in fundamental investing to build a portfolio of investments. The Snow Capital Small Cap Value Fund typically maintains a portfolio of between 40 and 60 U.S.-listed equities. We weight position sizes based on our assessment of upside potential and near-term catalysts. The Fund draws at least 80% of its investments, at cost, from companies with market capitalizations in the range of the Russell 2000 Value® Total Return Index which, as of August 31, 2020, was between $50 million and $7.3 billion.
Top Positive Contributors to the Fund’s Return
For the six-month period ended August 31, 2020, the Consumer Discretionary, Materials, Health Care, Information Technology, Industrials, Consumer Staples, Energy, and Communication Services sectors added to overall performance. In order of magnitude, the best performing stocks for the six months were:
National General Holdings Corp (NGHC), a specialty personal lines insurance company, was acquired by Allstate (ALL) in July for $3.9 billion, a nearly 70%
4
premium from where it was trading. The deal is expected to close at the end of Q1, 2021. Global leader in aviation services Atlas Air Worldwide Holdings (AAWW) outperformed as demand for air freight increased while capacity on commercial airlines for similar services declined, leading to substantial pricing power. The company was instrumental in transporting personal protective equipment when it was most needed during the spring and should continue to benefit from a tight air freight market and historic demand for e-commerce moving forward. Brinker International (EAT), which operates Chili’s and Maggiano’s restaurants, positively contributed to performance as the company did well to pivot to online and take-away sales amidst the nationwide stay-at-home orders. The company launched the first digital restaurant brand this summer, called “It’s Just Wings”, leveraging their brick-and-mortal assets and partnering with DoorDash to add a brand-new high margin growth channel that investors are excited about. Bloomin’ Brands Inc (BLMN), operator of global restaurant chains including Outback Steakhouse, added to performance during the period as management did well managing the variable costs of the business, preserving cash during the initial lock-down period and quickly resuming sales when they were able to. Both BLMN and EAT used the sudden changes to the operating model to cut costs and emerge as leaner businesses that project a better margin profile moving forward, which led to stock price appreciation as investors extrapolated their results forward. Sporting goods retailer Dick’s Sporting Goods (DKS) outperformed during the period due to strong operating performance led by consumer demand for fitness products, bikes, outdoor goods and golf supplies. The company managed substantial e-commerce demand deftly, with online sales rising nearly 200% during the second quarter.
Top Detractors from the Fund’s Return
For the six-month period ended August 31, 2020, the Financials sector detracted from overall performance. Great Western Bancorp (GWB), a regional bank based in Sioux Falls, South Dakota, fell on weak earnings, deteriorating credit trends and multiple dividend cuts. We maintained a position in the company as of the end of the period because we feel the risk reward profile is favorable given the balance sheet and liquidity ratios, which the banks make publicly available. JetBlue Airways (JBLU) detracted as airline demand has been slow to recover from widespread lockdowns across the country. We
5
believe JBLU is well positioned to rebound as a domestic only, low cost carrier with a homogeneous fleet and the balance sheet strength to weather the downturn. Regional banks Umpqua Holdings (UMPQ), based in Portland, OR, FNB Corp (FNB), based in Pittsburgh, PA, and First Commonwealth Financial Corp (FCF), based in Indiana, PA, bore the brunt of COVID-related macro headwinds during the spring and into the summer with investors expecting rates to remain lower for longer, loan reserves increasing, and uncertainty continuing surrounding individual and small business credit trends. We maintained a position in all three companies as of the end of the period based on each company’s risk reward profile, balance sheet status, and regional outlook in the markets in which they participate. Rules that emerged following the housing crisis in 2008 led to more public disclosure of bank’s capital levels and credit trends, which when evaluated today gives us confidence in the long-term trajectories of the companies.
Were there significant changes to the portfolio?
Compared to the Russell 2000® Value Total Return Index, the Fund holds an above-average weight in the Consumer Discretionary, Financials, Information Technology, and Materials Sectors, and a below-average weight in the Industrials, Health Care, Consumer Staples, Communication Services, and Energy sectors. The Fund maintained a zero percent weighting in the Real Estate and Utilities sectors as of August 31, 2020.
We reduced our exposure to Financials, Consumer Staples, Health Care, and Information Technology and increased our investments in Consumer Discretionary, Industrials, Materials, and Communication Services during the period.
Comments on the Fund’s Five Largest Holdings
Bloomin’ Brands Inc (BLMN)
Bloomin’ Brands (BLMN) owns and operates a chain of casual dining restaurants worldwide, with four different concepts ranging in price point and degree of formality from casual (Outback Steakhouse and Carrabba’s Italian
6
Grill) to upscale casual (Bonefish Grill) and fine dining (Fleming’s Prime Steakhouse & Wine Bar). Macro-consumer sentiment has continued to depress restaurant valuations, with BLMN showcasing a historically favorable risk/reward profile.
BankUnited Inc. (BKU)
BankUnited (BKU) is a bank holding that provides a range of financial products and services including personal, commercial and business banking. Over the years, BankUnited has built out a national or non-geographically focused platform and scaled up its banking operation through several acquisitions. The company is focused on reducing costs and improving efficiencies, increasing its low-cost deposit base and growing the loan portfolio.
Dave & Buster’s Entertainment (PLAY)
Leading owner and operator of high-volume entertainment and dining venues Dave & Buster’s Entertainment (PLAY) offers customers the opportunity to “Eat, Drink, Play, and Watch” all in one location. The company has done well to improve profitability at lower sales volumes, which should translate well when normalized foot traffic returns.
CNO Financial Group (CNO)
CNO Financial Group (CNO) provides life insurance, annuity, and supplemental health insurance products to more than four million customers in the United States through its insurance subsidiaries primarily serving middle-income pre-retirees and retired Americans, which are underserved high growth markets. The company took actions in 2018/2019 to de-risk the investment portfolio, which should enable the management team flexibility looking for yield opportunities in the current environment.
Commercial Metals Company (CMC)
Commercial Metals Company (CMC) manufactures, recycles, and markets rebar and other metal products used in a variety of industries. CMC boasts a low-cost structure, strong free-cash-flow generation, and a disciplined capital allocation strategy that should support the valuation over time. CMC should benefit from any increases in infrastructure spending.
7
Snow Capital Long/Short Opportunity Fund
How did the Fund perform?
For the six-month period ended August 31, 2020, the Snow Capital Long/Short Opportunity Fund’s Institutional Class Shares recorded a return of -4.48% compared to a return of 2.21% for the blended index of 70% Russell 3000® Value Total Return and 30% ICE BofAML 3-Month T-Bill Index and a return of 2.17% for the Russell 3000 Value Total Return Index.
How is the Fund managed?
The Long/Short Opportunity Fund is an all-cap, contrarian value, liquid alternatives fund that uses a variety of hedging strategies which are designed to reduce the overall volatility of the Fund’s investment portfolio.
The Fund employs a fundamental value philosophy and a disciplined bottom-up investment process to select long equity positions. Thorough reviews are conducted on each company to ensure they are in line with our investment thesis and upside target potential return. The portfolio consists of our highest conviction companies as core holdings, while the Fund simultaneously utilizes various hedging strategies such as short equity positions, long and short options, ETFs, and closed-ended funds. The Fund is managed with a conviction-weighted long portfolio and an opportunistic, research-driven process for our short positioning with the goal of smoothing volatility of investment returns for our shareholders.
Top Positive Contributors to the Fund’s Return
For the six-month period ended August 31, 2020, the Industrials, Health Care, Materials, Consumer Staples, Communication Services, and Information Technology sectors added to overall performance. In order of magnitude, the best performing stocks for the six months were:
FedEx Corp (FDX) outperformed driven by record package volumes as a result of increased e-commerce and delivery trends with people adhering to
8
stay-at-home orders. The company did well to manage costs as package volumes grew, improving profitability as output grew. Rio Tinto PLC (RIO), an international mining company, added to performance as the spot price of iron ore increased throughout the summer of 2020. The increase in commodity spot prices increased profitability due to RIO’s low production costs, while the valuation improved with the company’s strong balance sheet and significant capital return profile. RIO should benefit from a robust recovery in China post-COVID-19. Amgen Inc (AMGN), an independent biotechnology medicines company, added to overall performance after a positive patent ruling alleviated near-term generic competition concerns. Investors rewarded the company for its lower-risk, higher-visibility profile in the biotech space. United Parcel Service (UPS) was also a beneficiary of record package deliveries as a result of the COVID-19 pandemic. Historically a superior operator, UPS did well to leverage elevated volume into increased profitability despite a rise of new logistical challenges brought on by ever shortening delivery windows. Emerson Electric Co (EMR), a designer and manufacturer of electrical software, systems, and services, outperformed due to structural cost cuts that should position the company for a higher profit base during the next cycle.
Top Detractors from the Fund’s Return
For the six-month period ended August 31, 2020, the Consumer Discretionary, Financials, Energy, Real Estate, and Utilities sectors detracted from overall performance.
BankUnited Inc (BKU), a regional bank based in Miami, Florida, detracted from performance due to macro trends of lower-for-longer interest rates and heightened concerns on individual and small business credit trends as a result of the COVID-19 pandemic. BKU holds a relatively large portion of commercial real estate loans and construction and industrial loans, amplifying the macro concerns. Tapestry Inc (TPR), designer and marketer of Coach, Kate Spade, and Stuart Weitzman, detracted on concerns about what demand may look like for their products should the global economy enter a prolonged recession. The Fund maintains a position in the name as we like the steps the company has taken since the downturn, including increased focus on each brand’s core customers, a greater focus on digital efforts and prudent store rationalization. Occidental Petroleum (OXY) fell in early March as macro
9
conditions deteriorated in the oil markets, reducing the spot price of Brent Crude. The Fund promptly exited the position once it became clear oil demand would be lower during the COVID-19 pandemic, as our thesis for the name included higher sustained oil prices over time. OUTFRONT Media (OUT), an out-of-home advertising company including billboards and municipal transit systems, fell in early March as it became clear commuting, and human movement from place-to-place in general, would be restricted for a period of time and perhaps structurally changed going forward. The Fund exited this position during the period. CNO Financial Group (CNO) fell on a general concerned outlook for supplemental health, long-term care, and life insurance companies during the COVID-19 pandemic. Company specific results have been encouraging, including the reinstitution of a share repurchase plan, and the Fund has maintained a position in the company.
Were there significant changes to the portfolio?
Compared to the blended index of 70% Russell 3000® Value Total Return and 30% ICE BofAML 3-Month T-Bill Index, the Fund holds an above-average weight in the Financials, Energy, Consumer Discretionary, Materials, Communication Services, and Health Care sectors, and a below-average weight in the Utilities, Real Estate, Industrials, Consumer Staples, and Information Technology sectors as of August 31, 2020.
We reduced our exposure to Consumer Discretionary, Communication Services, Real Estate, Utilities, Information Technology, and Health Care, and increased our investments in Financials, Industrials, Materials, Consumer Staples, and Energy during the period. As of the end of August, the portfolio held 52 core long positions and was approximately 61% net long.
The purchase and/or sale of short positions, options, exchange-traded funds, or other securities aim to serve as a hedge to our long equity portfolio. We are holding cash as a component of our strategies and to take advantage of any opportunities the market volatility may provide.
10
Comments on the Fund’s Five Largest Holdings
PulteGroup Inc (PHM)
Operating in 23 states led by Texas, Florida, and Arizona, well-balanced homebuilder PulteGroup (PHM) is nicely positioned to benefit from increased demand due to prolonged low interest rates and a continued uptick in first-time homebuyers. The company also provides mortgage financing, title insurance, and other services to homebuyers.
JPMorgan Chase & Co (JPM)
Under the leadership of CEO Jamie Dimon, JPMorgan Chase & Co (JPM) has become a premier money center bank. The company remains focused on capital generation, cost reduction, regulatory compliance and shareholder returns. Credit trends remain benign, loan growth is solid and the balance sheet is well capitalized. The company continues to take share from the competition and strives for a mid-teen return on equity.
FedEx Corp (FDX)
Integrated global delivery company FedEx Corp (FDX) is the world’s largest express transportation provider, operating in more than 220 countries with services ranging from ground small-parcel delivery to global supply chain solutions. The oligopolistic nature of the business FDX operates in creates natural barriers to entry that should enable material pricing power with e-commerce ramping across the world.
Bank of America Corporation (BAC)
One of the largest financial institutions in the U.S., Bank of America Corporation (BAC) may benefit from greater economies of scale and less competition over the long-term. Capital levels have been bolstered and the business model has been simplified under the direction of CEO Brian Moynihan.
PVH Corp (PVH)
Based in New York, New York, PVH Corp (PVH) owns and operates global brands Calvin Klein, Tommy Hilfiger, and Heritage Brands, as well as several
11
third-party brands. The company has diverse sales channels, helping to mitigate changing consumer preferences for consumption and driving customer engagement.
Past performance is not a guarantee of future results.
The views expressed herein are solely the opinions of Snow Capital Management L.P. We make no representations as to their accuracy. This communication is intended for informational purposes only and does not constitute a solicitation to invest money nor a recommendation to buy or sell certain securities. Equity investments are not appropriate for all investors. Individual investment decisions should be discussed with a financial advisor.
Mutual fund investing involves risk. Principal loss is possible. Investments in small- and medium-capitalization companies involve additional risks such as limited liquidity and greater volatility. Investments in foreign securities involve political, economic, and currency risks, greater volatility and differences in accounting methods. The Snow Capital Long/Short Opportunity Fund may invest in debt securities. Investments in debt securities typically decrease in value when interest rates rise. This risk is usually greater for longer-term debt securities. The Snow Capital Long/Short Opportunity Fund may use options or futures contracts which have the risks of unlimited losses and the underlying holdings due to unanticipated market movements and failure to correctly predict the direction of the securities prices, interest rates, and currency exchange rates. Investments in ETFs are subject to additional risks that do not apply to conventional mutual funds, including the risks that the market price of an ETF’s shares may trade at a discount to their net asset value (“NAV”), an active secondary trading market may not develop or be maintained, or trading may be halted by the exchange in which they trade, which may impact a Fund’s ability to sell ETF shares. This investment may not be suitable for all investors.
Earnings growth is not representative of the Fund’s future performance.
12
Fund holdings and sector allocations are subject to change at any time and should not be considered recommendations to buy or sell any security. Please refer to the Schedules of Investments in this report for a complete list of Fund holdings.
The S&P 500® Total Return Index is a broad-based unmanaged index of 500 stocks, which is widely recognized as representative of the equity market in general.
The Russell 2000® Value Total Return Index measures the performance of the small-cap value segment of the U.S. equity universe. It includes those Russell 2000 companies with lower price-to-book ratios and lower forecasted growth values.
The Russell 3000® Value Total Return Index measures the performance of the broad value segment of the U.S. equity value universe. It includes those Russell 3000 companies with lower price-to-book ratios and lower forecasted growth values.
The Russell 3000® Growth Index is a market capitalization-weighted index based on the Russell 3000 companies. The Russell 3000 Growth Index includes companies that display signs of above-average growth and high price-to-book ratios.
The blended index of 70% Russell 3000 Value Total Return and 30% ICE BofAML 3-Month T-Bill Index is a weighted blend of the Russell 3000 Value Total Return Index, defined above, and the ICE BofAML 3-Month T-Bill Index, which is an unmanaged index that measures returns of three-month Treasury Bills.
The Russell 2000® Index is comprised of the smallest 2000 companies in the Russell 3000® Index, which represents approximately 98% of the investable U.S. equity market. Indexes are unmanaged. It is not possible to invest directly in an index.
Return on Equity or ROE is calculated as net income divided by common stockholders’ equity.
Market Capitalization is the market price of an entire company, calculated by multiplying the number of shares outstanding by the price per share.
The Snow Capital Family of Funds are distributed by Quasar Distributors, LLC.
13
Expense Example (Unaudited)
As a shareholder of the Funds, you incur two types of costs: (1) transaction costs, including sales charges (loads) on purchase payments (Class A shares only) and redemption fees, and (2) ongoing costs, including management fees, distribution (12b-1) and service fees (Class A and Class C shares only) and other Fund expenses. This Example is intended to help you understand your ongoing costs (in dollars) of investing in the Funds, and to compare these costs with the ongoing costs of investing in other mutual funds. The Example is based on an investment of $1,000 invested at the beginning of the period and held for the entire period (3/1/20-8/31/20).
Actual Expenses
The following table provides information about actual account values and actual expenses. If you purchase Class A shares of the Funds you will pay an initial sales charge of 5.25% when you invest. Class A shares are also subject to a contingent deferred sales charge of 0.50% for purchases made at the $1,000,000 breakpoint and are redeemed within twelve months of purchase. A 1.00% contingent deferred sales charge is imposed on Class C shares redeemed within twelve months of purchase. In addition, you will be assessed fees for outgoing wire transfers, returned checks and stop payment orders at prevailing rates charged by U.S. Bancorp Fund Services, LLC, the Funds’ transfer agent. If you request that a redemption be made by wire transfer, currently a $15.00 fee is charged by the Funds’ transfer agent. You will be charged a redemption fee equal to 0.50% of the net amount of the redemption if you redeem your shares of the Funds within 30 days of purchase. IRA accounts will be charged a $15.00 annual maintenance fee. To the extent a Fund invests in shares of exchange-traded funds or other investment companies as part of its investment strategy, you will indirectly bear your proportionate share of any fees and expenses charged by the underlying funds in which a Fund invests in addition to the expenses of the Fund. Actual expenses of the underlying funds are expected to vary among the various underlying funds. These expenses are not included in the Example. The Example includes, but is not limited to, management fees, distribution (12b-1) and service fees, fund administration and accounting, custody and transfer agent fees. You may use the information in this table, together with the amount you invested, to estimate the expenses that you paid over the period. Simply divide your account value by $1,000 (for example, an $8,600 account value divided by $1,000 = 8.6), then multiply the result by the number under the heading entitled “Expenses Paid During Period” to estimate the expenses you paid on your account during this period.
14
Fund Expense Examples (Unaudited)
| Beginning Account Balance 3/1/20 | Ending Account Balance 8/31/20 | Expenses Paid During Period 3/1/20- 8/31/20 | Annualized Expense Ratio | |||||||||||||
Based on Actual Fund Returns* | ||||||||||||||||
Long/Short Opportunity Fund | ||||||||||||||||
Class A | $ | 1,000.00 | $ | 954.00 | $ | 10.24 | 2.08 | % | ||||||||
Class C | 1,000.00 | 950.50 | 13.91 | 2.83 | % | |||||||||||
Institutional Class | 1,000.00 | 955.20 | 9.02 | 1.83 | % | |||||||||||
Small Cap Value Fund | ||||||||||||||||
Class A | 1,000.00 | 1,043.60 | 7.73 | 1.50 | % | |||||||||||
Class C | 1,000.00 | 1,040.00 | 11.57 | 2.25 | % | |||||||||||
Institutional Class | 1,000.00 | 1,045.10 | 6.44 | 1.25 | % | |||||||||||
| * | Expenses are equal to each Fund’s annualized expense ratio by class multiplied by the average account value over the period, multiplied by the number of days in the most recent six-month period (184), then divided by the number of days in the 12-month period (365). |
Hypothetical Example for Comparison Purposes
The following table provides information about hypothetical account values and hypothetical expenses based on the Funds’ actual expense ratios and an assumed rate of return of 5% per year before expenses, which is not the Funds’ actual return. The hypothetical account values and expenses may not be used to estimate the actual ending account balance or expenses you paid for the period. You may use this information to compare the ongoing costs of investing in the Funds and other funds. To do so, compare this 5% hypothetical example with the 5% hypothetical examples that appear in the shareholder reports of other funds. Please note that the expenses shown in the table are meant to highlight your ongoing costs only and do not reflect any transactional costs, such as sales charges (loads), redemption fees or exchange fees. Therefore, the information in this table is useful in comparing ongoing costs only, and will not help you determine the relative total costs of owning different funds. In addition, if these transactional costs were included, your costs would have been higher.
15
| Beginning Account Balance 3/1/20 | Ending Account Balance 8/31/20 | Expenses Paid During Period 3/1/20- 8/31/20 | Annualized Expense Ratio | |||||||||||||
Based on Hypothetical 5% Yearly Returns* |
| |||||||||||||||
Long/Short Opportunity Fund | ||||||||||||||||
Class A | $ | 1,000.00 | $ | 1,014.72 | $ | 10.56 | 2.08 | % | ||||||||
Class C | 1,000.00 | 1,010.94 | 14.34 | 2.83 | % | |||||||||||
Institutional Class | 1,000.00 | 1,015.98 | 9.30 | 1.83 | % | |||||||||||
Small Cap Value Fund | ||||||||||||||||
Class A | 1,000.00 | 1,017.64 | 7.63 | 1.50 | % | |||||||||||
Class C | 1,000.00 | 1,013.86 | 11.42 | 2.25 | % | |||||||||||
Institutional Class | 1,000.00 | 1,018.90 | 6.36 | 1.25 | % | |||||||||||
| * | Expenses are equal to each Fund’s annualized expense ratio by class multiplied by the average account value over the period, multiplied by the number of days in the most recent six-month period (184), then divided by the number of days in the 12-month period (365). |
16
Snow Capital Small Cap Value Fund
Investment Highlights (Unaudited)
The investment objective of the Fund is long-term capital appreciation. To achieve its investment objective, under normal market conditions the Fund will invest at least 80% of its net assets, at cost, in equity securities of companies with market capitalizations in the range of the Russell 2000® Value Total Return Index (“small cap companies”). Snow Capital Management L.P. (the “Adviser”) selects equity securities for the Fund using a bottom-up approach that seeks to identify small cap companies that the Adviser believes are undervalued and are likely to experience a rebound in earnings due to an event or series of events that creates a price-to-earnings expansion that leads to higher stock price valuations. The Fund’s allocation of portfolio assets as of August 31, 2020 is shown below.
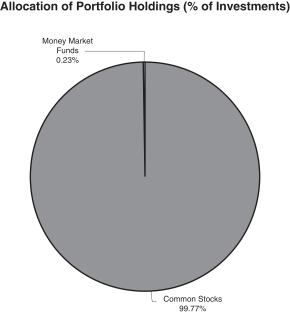
17
Snow Capital Long/Short Opportunity Fund
Investment Highlights (Unaudited) (Continued)
The investment objective of the Fund is long-term capital appreciation and protection of investment principal. The Fund seeks to achieve its investment objective by investing primarily in equity securities that Snow Capital Management L.P. (the “Adviser”), the Fund’s investment adviser, believes are undervalued, selling short equity securities the Adviser believes are overvalued and selling short equity securities to hedge market risk. The Fund may also invest in options, futures contracts and options on futures contracts (collectively, “Derivative Instruments”) as a substitute for a comparable market position in the underlying equity security or to attempt to “hedge” or limit the exposure of the Fund’s position in an equity security. Long and short investments can include common and preferred stocks, convertible securities, shares of other investment companies and ETFs that invest in equity securities. With a long position, the Fund purchases a security outright, while with a short position, the Fund sells a security that it has borrowed. When the Fund sells a security short, it borrows the security from a third party and sells it at the then-current market price. The Fund is then obligated to buy the security on a later date so that it can return the security to the lender. The Fund may invest in securities of companies of any size and is not managed toward sector or industry weights. In addition to domestic securities, the Fund may have up to 25% of its net assets invested directly or indirectly in foreign securities, including investments in emerging markets. The Fund’s allocation of portfolio assets as of August 31, 2020 is shown below.
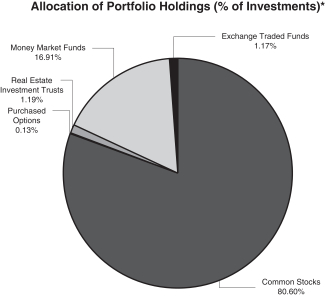
| * | Short Securities (17.27%); Options Written (1.04%), each as a percent of total net assets. |
18
Snow Capital Family of Funds
Investment Highlights (Unaudited) (Continued)
Average Annual Returns as of August 31, 2020(1)
| One Year | Three Years | Five Years | Since Inception (11/30/10) | |||||||||||||
Snow Capital Small Cap Value Fund | ||||||||||||||||
Class A (with sales charge) | -4.14% | -2.93% | -1.12% | 5.06% | ||||||||||||
Class A (without sales charge) | 1.18% | -1.17% | -0.04% | 5.64% | ||||||||||||
Class C (with sales charge) | -0.57% | -1.90% | -0.79% | 4.86% | ||||||||||||
Class C (without sales charge) | 0.43% | -1.90% | -0.79% | 4.86% | ||||||||||||
Institutional Class | 1.47% | -0.91% | 0.21% | 5.91% | ||||||||||||
Russell 2000® Value Total Return Index | -6.14% | -1.39% | 4.37% | 7.11% | ||||||||||||
| One Year | Five Years | Ten Years | Since Inception (4/28/06) | |||||||||||||
Snow Capital Long/Short Opportunity Fund | ||||||||||||||||
Class A (with sales charge) | -8.03% | 0.67% | 6.17% | 3.35% | ||||||||||||
Class A (without sales charge) | -2.92% | 1.77% | 6.74% | 3.74% | ||||||||||||
Class C (with sales charge) | -4.60% | 1.00% | 5.98% | 2.98% | ||||||||||||
Class C (without sales charge) | -3.64% | 1.00% | 5.98% | 2.98% | ||||||||||||
Institutional Class | -2.69% | 2.02% | 7.02% | 3.99% | ||||||||||||
Russell 3000® Value Total Return Index | 0.39% | 7.33% | 10.89% | 6.02% | ||||||||||||
70% Russell 3000® Value Total Return / 30% ICE BofA Merrill Lynch 3 Month Treasury Bill Blend Index | 1.38% | 5.75% | 7.95% | 4.85% | ||||||||||||
| (1) | With sales charge returns reflect the deduction of the current maximum initial sales charge of 5.25% for Class A shares and the applicable contingent deferred sales charge for Class C shares. Returns without sales charges do not reflect the current maximum sales charges. Had the sales charges been included, the returns would have been lower. |
19
Snow Capital Family of Funds
Investment Highlights (Unaudited) (Continued)
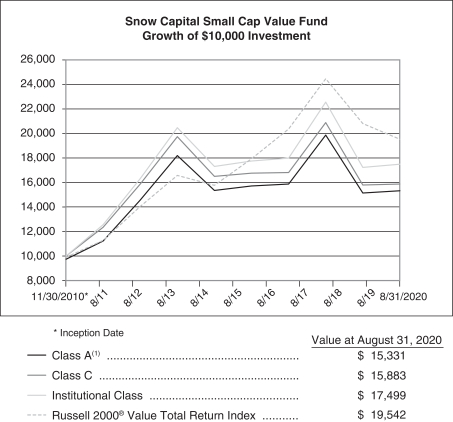
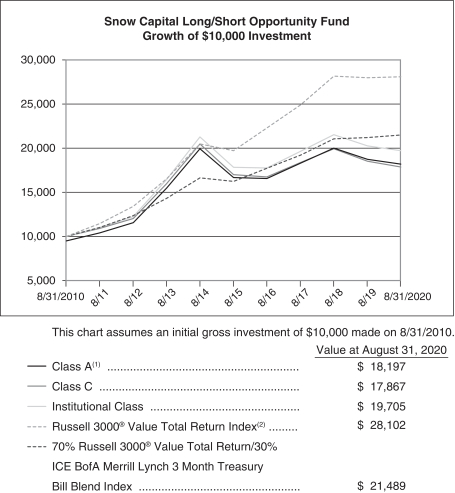
Performance data quoted represents past performance and does not guarantee future results. The investment return and principal value of an investment will fluctuate so that an investor’s shares, when redeemed, may be worth more or less than their original cost. Current performance of the Funds may be lower or higher than the performance quoted. Performance data current to the most recent month end may be obtained by calling 1-877-SNOWFND (877-766-9363). The Funds impose a 0.50% redemption fee on shares held 30 days or less. Performance data does not reflect the redemption fee. If reflected, total returns would be reduced.
Short-term performance, in particular, is not a good indication of the Funds’ future performance, and an investment should not be made solely on returns.
Investment performance reflects fee waivers in effect. In the absence of such waivers, total returns would be reduced.
The returns shown in the table above and the following graphs assume reinvestment of Fund distributions and do not reflect the deduction of taxes that a shareholder would pay on Fund distributions or the redemption of Fund shares. The graphs below illustrate performance of a hypothetical investment made in the Funds and a broad- based securities index on each Fund’s inception date. The graphs do not reflect any future performance.
The Russell 2000® Value Total Return Index measures the performance of the small-cap value segment of the U.S. equity universe. It includes those Russell 2000® companies with lower price-to-book ratios and lower forecasted growth values. The Russell 3000® Value Total Return Index measures the performance of the broad value segment of U.S. equity value universe. It includes those Russell 3000® companies with lower price-to-book ratios and lower forecasted growth values. The 70% Russell 3000® Value Total Return/30% ICE BofA Merrill Lynch 3 Month Treasury Bill Blend Index consists of 70% Russell 3000® Value Total Return Index and 30% ICE BofA Merrill Lynch 3 Month U.S. Treasury Bill Index. The Russell 3000® Value Total Return Index measures the performance of the broad value segment of U.S. equity value universe. It includes those Russell 3000® companies with lower price-to-book ratios and lower forecasted growth values. The ICE BofA Merrill Lynch 3 Month U.S. Treasury Bill Index is an unmanaged market index of U.S. Treasury securities maturing in 90 days that assumes reinvestment of all income.
20
Snow Capital Family of Funds
Investment Highlights (Unaudited) (Continued)
| (1) | Reflects 5.25% initial sales charge. |
21
Snow Capital Family of Funds
Investment Highlights (Unaudited) (Continued)
| (1) | Reflects 5.25% initial sales charge. |
22
Snow Capital Small Cap Value Fund
Schedule of Investments
August 31, 2020 (Unaudited)
| Shares | Value | |||||||
COMMON STOCKS - 99.99% | ||||||||
Air Freight & Logistics - 1.41% | ||||||||
Atlas Air Worldwide Holdings, Inc. (a) | 2,995 | $ | 168,888 | |||||
|
| |||||||
Airlines - 3.56% | ||||||||
JetBlue Airways Corp. (a) | 37,025 | 426,528 | ||||||
|
| |||||||
Auto Components - 2.66% | ||||||||
Modine Manufacturing Co. (a) | 46,960 | 317,919 | ||||||
|
| |||||||
Banks - 22.64% | ||||||||
BankUnited, Inc. | 23,821 | 556,936 | ||||||
First Commonwealth Financial Corp. | 28,292 | 231,994 | ||||||
First Horizon National Corp. | 46,231 | 441,506 | ||||||
FNB Corp. | 59,306 | 444,795 | ||||||
Great Western Bancorp, Inc. | 7,795 | 108,584 | ||||||
OFG Bancorp (b) | 14,954 | 192,009 | ||||||
TCF Financial Corp. | 11,300 | 303,744 | ||||||
Umpqua Holdings Corp. | 37,786 | 426,226 | ||||||
|
| |||||||
| 2,705,794 | ||||||||
|
| |||||||
Capital Markets - 0.55% | ||||||||
Affiliated Managers Group, Inc. | 950 | 65,218 | ||||||
|
| |||||||
Construction & Engineering - 1.24% | ||||||||
AECOM (a) | 3,742 | 147,846 | ||||||
|
| |||||||
Electrical Equipment - 0.48% | ||||||||
nVent Electric PLC | 3,000 | 57,360 | ||||||
|
| |||||||
Electronic Equipment, Instruments & Components - 0.48% |
| |||||||
II-VI, Inc. (a) | 1,288 | 57,316 | ||||||
|
| |||||||
Entertainment - 0.51% | ||||||||
Cinemark Holdings, Inc. (a) | 4,200 | 61,530 | ||||||
|
| |||||||
Food Products - 1.52% | ||||||||
Pilgrim’s Pride Corp. (a) | 11,354 | 181,664 | ||||||
|
| |||||||
The accompanying notes are an integral part of these financial statements.
23
Snow Capital Small Cap Value Fund
Schedule of Investments (Continued)
August 31, 2020 (Unaudited)
| Shares | Value | |||||||
Health Care Equipment & Supplies - 1.53% | ||||||||
Integra LifeSciences Holdings Corp. (a) | 3,836 | $ | 183,322 | |||||
|
| |||||||
Health Care Providers & Services - 1.58% | ||||||||
AMN Healthcare Services, Inc. (a) | 3,501 | 188,494 | ||||||
|
| |||||||
Hotels, Restaurants & Leisure - 16.79% | ||||||||
Bloomin’ Brands, Inc. | 43,312 | 621,094 | ||||||
Brinker International, Inc. | 6,682 | 300,957 | ||||||
Dave & Buster’s Entertainment, Inc. | 33,322 | 554,145 | ||||||
Norwegian Cruise Line Holdings Ltd. (a)(b) | 3,000 | 51,330 | ||||||
The Cheesecake Factory, Inc. | 16,260 | 480,158 | ||||||
|
| |||||||
| 2,007,684 | ||||||||
|
| |||||||
Household Durables - 0.89% | ||||||||
Taylor Morrison Home Corp. | 4,500 | 105,885 | ||||||
|
| |||||||
Insurance - 12.34% | ||||||||
American Equity Investment Life Holding Co. | 18,875 | 451,301 | ||||||
Argo Group International Holdings Ltd. (b) | 4,700 | 174,558 | ||||||
CNO Financial Group, Inc. | 32,120 | 523,556 | ||||||
Lincoln National Corp. | 9,038 | 325,820 | ||||||
|
| |||||||
| 1,475,235 | ||||||||
|
| |||||||
Metals & Mining - 7.66% | ||||||||
B2Gold Corp. (b) | 25,340 | 170,792 | ||||||
Century Aluminum Co. (a) | 13,485 | 133,097 | ||||||
Commercial Metals Co. | 24,345 | 508,080 | ||||||
Gold Resource Corp. | 26,070 | 103,759 | ||||||
|
| |||||||
| 915,728 | ||||||||
|
| |||||||
Oil, Gas & Consumable Fuels - 2.70% | ||||||||
Cabot Oil & Gas Corp. | 2,970 | 56,341 | ||||||
Cimarex Energy Co. | 6,901 | 191,710 | ||||||
Delek US Holdings, Inc. | 4,765 | 74,953 | ||||||
|
| |||||||
| 323,004 | ||||||||
|
| |||||||
The accompanying notes are an integral part of these financial statements.
24
Snow Capital Small Cap Value Fund
Schedule of Investments (Continued)
August 31, 2020 (Unaudited)
| Shares | Value | |||||||
Paper & Forest Products - 0.73% | ||||||||
Domtar Corp. | 3,060 | $ | 87,271 | |||||
|
| |||||||
Semiconductors & Semiconductor Equipment - 0.97% | ||||||||
Diodes, Inc. (a) | 2,371 | 115,847 | ||||||
|
| |||||||
Software - 2.11% | ||||||||
J2 Global, Inc. (a) | 3,600 | 251,964 | ||||||
|
| |||||||
Specialty Retail - 7.09% | ||||||||
American Eagle Outfitters, Inc. | 31,581 | 398,236 | ||||||
Dick’s Sporting Goods, Inc. | 1,281 | 69,328 | ||||||
Urban Outfitters, Inc. (a) | 16,125 | 379,583 | ||||||
|
| |||||||
| 847,147 | ||||||||
|
| |||||||
Technology Hardware, Storage & Peripherals - 6.51% | ||||||||
NCR Corp. (a) | 15,880 | 324,587 | ||||||
Super Micro Computer, Inc. (a) | 16,560 | 453,579 | ||||||
|
| |||||||
| 778,166 | ||||||||
|
| |||||||
Textiles, Apparel & Luxury Goods - 0.50% | ||||||||
Skechers U.S.A., Inc. - Class A (a) | 1,985 | 59,252 | ||||||
|
| |||||||
Trading Companies & Distributors - 3.54% | ||||||||
WESCO International, Inc. (a) | 9,020 | 422,587 | ||||||
|
| |||||||
TOTAL COMMON STOCKS | 11,951,649 | |||||||
|
| |||||||
MONEY MARKET FUND - 0.23% | ||||||||
Fidelity Investment Money Market Funds - Government Portfolio, Institutional Class, 0.010% (c) | 27,861 | 27,861 | ||||||
|
| |||||||
TOTAL MONEY MARKET FUND | 27,861 | |||||||
|
| |||||||
Total Investments | 11,979,510 | |||||||
Liabilities in Excess of Other Assets - (0.22)% | (25,781 | ) | ||||||
|
| |||||||
TOTAL NET ASSETS - 100.00% | $ | 11,953,729 | ||||||
|
| |||||||
The accompanying notes are an integral part of these financial statements.
25
Snow Capital Small Cap Value Fund
Schedule of Investments (Continued)
August 31, 2020 (Unaudited)
Percentages are stated as a percent of net assets.
| (a) | Non-income producing security. |
| (b) | Foreign issued security. |
| (c) | Seven day yield as of August 31, 2020. |
The Global Industry Classification Standard (GICS®) was developed by and/or is the exclusive property of MSCI, Inc. and Standard & Poor Financial Services LLC (“S&P”). GICS is a service mark of MSCI and S&P and has been licensed for use by U.S. Bancorp Fund Services.
The accompanying notes are an integral part of these financial statements.
26
Snow Capital Long/Short Opportunity Fund
Schedule of Investments
August 31, 2020 (Unaudited)
| Shares | Value | |||||||
COMMON STOCKS - 81.44% | ||||||||
Air Freight & Logistics - 3.84% | ||||||||
FedEx Corp. | 10,380 | $ | 2,281,939 | |||||
United Parcel Service, Inc. - Class B | 4,940 | 808,283 | ||||||
|
| |||||||
| 3,090,222 | ||||||||
|
| |||||||
Banks - 9.41% | ||||||||
Bank of America Corp. (a) | 85,920 | 2,211,581 | ||||||
JPMorgan Chase & Co. (a)(b) | 22,560 | 2,260,287 | ||||||
Truist Financial Corp. | 40,050 | 1,554,341 | ||||||
Umpqua Holdings Corp. | 137,678 | 1,553,008 | ||||||
|
| |||||||
| 7,579,217 | ||||||||
|
| |||||||
Beverages - 1.01% | ||||||||
Constellation Brands, Inc. - Class A | 4,390 | 809,867 | ||||||
|
| |||||||
Biotechnology - 4.07% | ||||||||
Amgen, Inc. (a)(b) | 6,975 | 1,766,906 | ||||||
Biogen, Inc. (a)(c) | 5,234 | 1,505,508 | ||||||
|
| |||||||
| 3,272,414 | ||||||||
|
| |||||||
Capital Markets - 1.38% | ||||||||
The Goldman Sachs Group, Inc. | 5,420 | 1,110,395 | ||||||
|
| |||||||
Communications Equipment - 1.48% | ||||||||
Cisco Systems, Inc. (b) | 28,158 | 1,188,831 | ||||||
|
| |||||||
Consumer Finance - 1.83% | ||||||||
American Express Co. | 14,505 | 1,473,563 | ||||||
|
| |||||||
Containers & Packaging - 1.30% | ||||||||
International Paper Co. | 28,770 | 1,043,488 | ||||||
|
| |||||||
Diversified Telecommunication Services - 2.95% | ||||||||
CenturyLink, Inc. (b) | 126,150 | 1,356,112 | ||||||
Verizon Communications, Inc. (a) | 17,200 | 1,019,444 | ||||||
|
| |||||||
| 2,375,556 | ||||||||
|
| |||||||
Electric Utilities - 1.34% | ||||||||
Exelon Corp. (b) | 29,151 | 1,075,963 | ||||||
|
| |||||||
The accompanying notes are an integral part of these financial statements.
27
Snow Capital Long/Short Opportunity Fund
Schedule of Investments (Continued)
August 31, 2020 (Unaudited)
| Shares | Value | |||||||
Electrical Equipment - 2.64% | ||||||||
Emerson Electric Co. (a)(b) | 18,800 | $ | 1,306,036 | |||||
nVent Electric PLC | 42,850 | 819,292 | ||||||
|
| |||||||
| 2,125,328 | ||||||||
|
| |||||||
Entertainment - 1.33% | ||||||||
The Walt Disney Co. | 8,110 | 1,069,466 | ||||||
|
| |||||||
Food Products - 2.03% | ||||||||
Tyson Foods, Inc. - Class A | 25,970 | 1,630,916 | ||||||
|
| |||||||
Health Care Equipment & Supplies - 0.81% | ||||||||
Zimmer Biomet Holdings, Inc. | 4,640 | 653,683 | ||||||
|
| |||||||
Health Care Providers & Services - 3.88% | ||||||||
Centene Corp. (c) | 27,380 | 1,678,942 | ||||||
Laboratory Corp. of America Holdings (a)(b)(c) | 8,240 | 1,448,180 | ||||||
|
| |||||||
| 3,127,122 | ||||||||
|
| |||||||
Hotels, Restaurants & Leisure - 1.55% | ||||||||
Las Vegas Sands Corp. | 24,650 | 1,250,002 | ||||||
|
| |||||||
Household Durables - 3.10% | ||||||||
PulteGroup, Inc. (a)(b) | 56,030 | 2,498,378 | ||||||
|
| |||||||
Insurance - 8.19% | ||||||||
Argo Group International Holdings Ltd. (a)(d) | 22,520 | 836,393 | ||||||
CNO Financial Group, Inc. | 49,570 | 807,991 | ||||||
Hartford Financial Services Group, Inc. | 37,320 | 1,509,594 | ||||||
MetLife, Inc. (a) | 47,455 | 1,825,119 | ||||||
The Travelers Companies, Inc. (a) | 13,890 | 1,611,796 | ||||||
|
| |||||||
| 6,590,893 | ||||||||
|
| |||||||
Machinery - 1.64% | ||||||||
Caterpillar, Inc. | 9,265 | 1,318,502 | ||||||
|
| |||||||
Media - 1.69% | ||||||||
The Interpublic Group of Cos., Inc. | 76,500 | 1,358,640 | ||||||
|
| |||||||
Metals & Mining - 3.63% | ||||||||
B2Gold Corp. (d) | 72,100 | 485,954 | ||||||
The accompanying notes are an integral part of these financial statements.
28
Snow Capital Long/Short Opportunity Fund
Schedule of Investments (Continued)
August 31, 2020 (Unaudited)
| Shares | Value | |||||||
Commercial Metals Co. | 50,360 | $ | 1,051,013 | |||||
Rio Tinto PLC - ADR | 22,700 | 1,389,921 | ||||||
|
| |||||||
| 2,926,888 | ||||||||
|
| |||||||
Multiline Retail - 1.41% | ||||||||
Kohl’s Corp. | 52,980 | 1,131,653 | ||||||
|
| |||||||
Oil, Gas & Consumable Fuels - 7.68% | ||||||||
BP PLC - ADR | 41,968 | 878,390 | ||||||
Chevron Corp. (b) | 4,000 | 335,720 | ||||||
Cimarex Energy Co. | 27,790 | 772,006 | ||||||
Marathon Petroleum Corp. (a) | 44,760 | 1,587,191 | ||||||
Pioneer Natural Resources Co. | 8,300 | 862,619 | ||||||
Suncor Energy, Inc. (d) | 68,140 | 1,092,284 | ||||||
Valero Energy Corp. | 12,470 | 655,797 | ||||||
|
| |||||||
| 6,184,007 | ||||||||
|
| |||||||
Pharmaceuticals - 1.99% | ||||||||
AbbVie, Inc. (a) | 16,744 | 1,603,573 | ||||||
|
| |||||||
Semiconductors & Semiconductor Equipment - 1.36% |
| |||||||
Broadcom, Inc. (b) | 3,160 | 1,096,994 | ||||||
|
| |||||||
Specialty Retail - 1.23% | ||||||||
The TJX Cos Inc. | 18,150 | 994,439 | ||||||
|
| |||||||
Technology Hardware, Storage & Peripherals - 4.18% |
| |||||||
NCR Corp. (c) | 84,450 | 1,726,158 | ||||||
NetApp, Inc. | 34,596 | 1,639,504 | ||||||
|
| |||||||
| 3,365,662 | ||||||||
|
| |||||||
Textiles, Apparel & Luxury Goods - 4.49% | ||||||||
PVH Corp. (c) | 34,256 | 1,910,114 | ||||||
Tapestry, Inc. | 115,790 | 1,705,586 | ||||||
|
| |||||||
| 3,615,700 | ||||||||
|
| |||||||
TOTAL COMMON STOCKS | 65,561,362 | |||||||
|
| |||||||
The accompanying notes are an integral part of these financial statements.
29
Snow Capital Long/Short Opportunity Fund
Schedule of Investments (Continued)
August 31, 2020 (Unaudited)
| Contracts | Notional Value | Value | ||||||||||
PURCHASED OPTIONS - 0.13% | ||||||||||||
Exchange Traded Call Options - 0.08% |
| |||||||||||
CenturyLink, Inc. | ||||||||||||
Expiration: October, 2020, Exercise Price: $10.000 | 700 | $ | 752,500 | $ | 70,000 | |||||||
|
| |||||||||||
Exchange Traded Put Options - 0.05% |
| |||||||||||
SPDR S&P 500 ETF Trust | ||||||||||||
Expiration: December, 2020, Exercise Price: $300.000 | 50 | 1,746,550 | 37,800 | |||||||||
|
| |||||||||||
TOTAL PURCHASED OPTIONS | 107,800 | |||||||||||
|
| |||||||||||
| Shares | ||||||||
EXCHANGE TRADED FUNDS - 1.18% | ||||||||
VanEck Vectors Junior Gold Miners ETF | 15,800 | $ | 951,002 | |||||
|
| |||||||
TOTAL EXCHANGE TRADED FUNDS | 951,002 | |||||||
|
| |||||||
REAL ESTATE INVESTMENT TRUSTS (REITS) - 1.20% |
| |||||||
Mortgage Real Estate Investment Trusts (REITs) - 1.20% |
| |||||||
Annaly Capital Management, Inc. | 131,380 | 965,643 | ||||||
|
| |||||||
TOTAL REAL ESTATE INVESTMENT TRUSTS (REITS) | 965,643 | |||||||
|
| |||||||
MONEY MARKET FUND - 17.08% | ||||||||
Fidelity Investments Money Market Funds - Government Portfolio, Institutional Class, 0.010% (e) | 13,752,762 | 13,752,762 | ||||||
|
| |||||||
TOTAL MONEY MARKET FUND | 13,752,762 | |||||||
|
| |||||||
Total Investments | 81,338,569 | |||||||
Liabilities in Excess of Other Assets - (1.03)% | (829,895 | ) | ||||||
|
| |||||||
TOTAL NET ASSETS - 100.00% | $ | 80,508,674 | ||||||
|
| |||||||
The accompanying notes are an integral part of these financial statements.
30
Snow Capital Long/Short Opportunity Fund
Schedule of Investments (Continued)
August 31, 2020 (Unaudited)
Percentages are stated as a percent of net assets.
| (a) | All or a portion of this security is pledged as collateral for securities sold short. |
| (b) | All or a portion of this security may be subject to call options written. |
| (c) | Non-income producing security. |
| (d) | Foreign issued security. |
| (e) | Seven day yield as of August 31, 2020. |
Abbreviations:
| ADR | American Depositary Receipt |
| PLC | Public Limited Company. |
The Global Industry Classification Standard (GICS®) was developed by and/or is the exclusive property of MSCI, Inc. and Standard & Poor Financial Services LLC (“S&P”). GICS is a service mark of MSCI and S&P and has been licensed for use by U.S. Bancorp Fund Services.
The accompanying notes are an integral part of these financial statements.
31
Snow Capital Long/Short Opportunity Fund
Schedule of Securities Sold Short
August 31, 2020 (Unaudited)
| Shares | Value | |||||||
SECURITIES SOLD SHORT - (17.45)% | ||||||||
COMMON STOCKS - (2.61)% | ||||||||
Health Care Providers & Services - (0.56)% | ||||||||
Humana, Inc. | (1,080 | ) | $ | (448,384 | ) | |||
|
| |||||||
Insurance - (0.56)% | ||||||||
Prudential Financial, Inc. | (6,660 | ) | (451,348 | ) | ||||
|
| |||||||
Oil, Gas & Consumable Fuels - (0.41)% | ||||||||
Phillips 66 | (5,650 | ) | (330,356 | ) | ||||
|
| |||||||
Specialty Retail - (0.54)% | ||||||||
Foot Locker, Inc. | (14,270 | ) | (432,809 | ) | ||||
|
| |||||||
Textiles, Apparel & Luxury Goods - (0.54)% | ||||||||
VF Corp. | (6,615 | ) | (434,936 | ) | ||||
|
| |||||||
TOTAL COMMON STOCKS | (2,097,833 | ) | ||||||
|
| |||||||
EXCHANGE TRADED FUNDS - (14.84)% | ||||||||
Energy Select Sector SPDR Fund | (10,700 | ) | (381,455 | ) | ||||
iShares Russell 1000 Value ETF | (40,010 | ) | (4,877,619 | ) | ||||
iShares Russell 2000 ETF | (18,940 | ) | (2,943,844 | ) | ||||
SPDR S&P 500 ETF Trust | (10,730 | ) | (3,748,096 | ) | ||||
|
| |||||||
TOTAL EXCHANGE TRADED FUNDS | (11,951,014 | ) | ||||||
|
| |||||||
Total for Shares Sold Short | $ | (14,048,847 | ) | |||||
|
| |||||||
The accompanying notes are an integral part of these financial statements.
32
Snow Capital Long/Short Opportunity Fund
Schedule of Options Written
August 31, 2020 (Unaudited)
| Contracts | Notional Value | Value | ||||||||||
EXCHANGED TRADED CALL OPTIONS |
| |||||||||||
Amgen, Inc. |
| |||||||||||
Expiration: October, 2020, Exercise Price: $260.00 | (15 | ) | $ | (379,980 | ) | $ | (11,250 | ) | ||||
Broadcom, Inc. | ||||||||||||
Expiration: September, 2020, Exercise Price: $300.00 | (13 | ) | (451,295 | ) | (65,195 | ) | ||||||
Chevron Corp. |
| |||||||||||
Expiration: September, 2020, Exercise Price: $100.00 | (40 | ) | (335,720 | ) | (160 | ) | ||||||
Cisco Systems, Inc. |
| |||||||||||
Expiration: September, 2020, Exercise Price: $47.50 | (85 | ) | (358,870 | ) | (170 | ) | ||||||
Emerson Electric Co. | ||||||||||||
Expiration: September, 2020, Exercise Price: $67.50 | (60 | ) | (416,820 | ) | (19,200 | ) | ||||||
Exelon Corp. | ||||||||||||
Expiration: October, 2020, Exercise Price: $40.00 | (101 | ) | (372,791 | ) | (4,545 | ) | ||||||
Invesco QQQ Trust Series 1 | ||||||||||||
Expiration: September, 2020, Exercise Price: $235.00 | (36 | ) | (1,061,568 | ) | (220,680 | ) | ||||||
JPMorgan Chase & Co. | ||||||||||||
Expiration: September, 2020, Exercise Price: $105.00 | (36 | ) | (360,684 | ) | (5,112 | ) | ||||||
Laboratory Corp. of America Holdings |
| |||||||||||
Expiration: November, 2020, Exercise Price: $190.00 | (21 | ) | (369,075 | ) | (12,810 | ) | ||||||
Expiration: February, 2021, Exercise Price: $210.00 | (41 | ) | (720,575 | ) | (18,450 | ) | ||||||
PulteGroup, Inc. | ||||||||||||
Expiration: October, 2020, Exercise Price: $37.00 | (103 | ) | (459,277 | ) | (84,460 | ) | ||||||
Expiration: October, 2020, Exercise Price: $40.00 | (140 | ) | (624,260 | ) | (79,800 | ) | ||||||
The accompanying notes are an integral part of these financial statements.
33
Snow Capital Long/Short Opportunity Fund
Schedule of Options Written (Continued)
August 31, 2020 (Unaudited)
| Contracts | Notional Value | Value | ||||||||||
Rio Tinto PLC | ||||||||||||
Expiration: October, 2020, Exercise Price: $60.00 | (67 | ) | $ | (410,241 | ) | $ | (23,450 | ) | ||||
VanEck Vectors Junior Gold Miners ETF | ||||||||||||
Expiration: January, 2021, Exercise Price: $60.00 | (100 | ) | (601,900 | ) | (84,500 | ) | ||||||
|
| |||||||||||
| (629,782 | ) | |||||||||||
|
| |||||||||||
EXCHANGED TRADED PUT OPTIONS |
| |||||||||||
Ally Financial, Inc. |
| |||||||||||
Expiration: December, 2020, Exercise | (269 | ) | (615,472 | ) | (10,491 | ) | ||||||
American Express Co. | ||||||||||||
Expiration: January, 2021, Exercise | (45 | ) | (457,155 | ) | (19,800 | ) | ||||||
Biogen, Inc. |
| |||||||||||
Expiration: December, 2020, Exercise | (18 | ) | (517,752 | ) | (6,300 | ) | ||||||
Broadcom, Inc. |
| |||||||||||
Expiration: September, 2020, Exercise Price: $220.00 | (23 | ) | (798,445 | ) | (1,035 | ) | ||||||
CenturyLink, Inc. | ||||||||||||
Expiration: October, 2020, Exercise | (700 | ) | (752,500 | ) | (7,350 | ) | ||||||
Hartford Financial Services Group, Inc. | ||||||||||||
Expiration: October, 2020, Exercise | (135 | ) | (546,075 | ) | (3,038 | ) | ||||||
Honeywell Intl, Inc. | ||||||||||||
Expiration: September, 2020, Exercise Price: $135.00 | (40 | ) | (662,200 | ) | (520 | ) | ||||||
JPMorgan Chase & Co. | ||||||||||||
Expiration: September, 2020, Exercise | (57 | ) | (571,083 | ) | (1,140 | ) | ||||||
The accompanying notes are an integral part of these financial statements.
34
Snow Capital Long/Short Opportunity Fund
Schedule of Options Written (Continued)
August 31, 2020 (Unaudited)
| Contracts | Notional Value | Value | ||||||||||
Kohl’s Corp. |
| |||||||||||
Expiration: January, 2021, Exercise | (230 | ) | $ | (491,280 | ) | $ | (43,930 | ) | ||||
Laboratory Corp. of America Holdings | ||||||||||||
Expiration: February, 2021, Exercise Price: $160.00 | (25 | ) | (439,375 | ) | (25,750 | ) | ||||||
NetApp, Inc. | ||||||||||||
Expiration: March, 2021, Exercise Price: $40.00 | (101 | ) | (478,639 | ) | (33,835 | ) | ||||||
Skechers USA, Inc. | ||||||||||||
Expiration: October, 2020, Exercise | (168 | ) | (501,480 | ) | (5,040 | ) | ||||||
Suncor Energy, Inc. |
| |||||||||||
Expiration: September, 2020, Exercise | (270 | ) | (432,810 | ) | (7,020 | ) | ||||||
The Goldman Sachs Group, Inc. |
| |||||||||||
Expiration: January, 2021, Exercise | (25 | ) | (512,175 | ) | (11,250 | ) | ||||||
Tyson Foods, Inc. - Class A | ||||||||||||
Expiration: October, 2020, Exercise | (88 | ) | (552,640 | ) | (6,160 | ) | ||||||
Valero Energy Corp. | ||||||||||||
Expiration: September, 2020, Exercise | (82 | ) | (431,238 | ) | (27,470 | ) | ||||||
Zimmer Biomet Holdings, Inc. | ||||||||||||
Expiration: September, 2020, Exercise | (43 | ) | (605,784 | ) | (2,451 | ) | ||||||
Expiration: December, 2020, Exercise | (40 | ) | (563,520 | ) | (5,160 | ) | ||||||
|
| |||||||||||
| (217,740 | ) | |||||||||||
|
| |||||||||||
Total Options Written | $ | (847,522 | ) | |||||||||
|
| |||||||||||
The accompanying notes are an integral part of these financial statements.
35
Snow Capital Family of Funds
Statements of Assets and Liabilities
August 31, 2020 (Unaudited)
| Snow Capital Small Cap Value Fund | Snow Capital Long/Short Opportunity Fund | |||||||
ASSETS | ||||||||
Investments, at value: (Cost $12,686,794 and $83,202,447, respectively) | $ | 11,979,510 | $ | 81,338,569 | ||||
Dividends and interest receivable | 7,884 | 275,672 | ||||||
Receivable from Adviser | 21,438 | — | ||||||
Deposits at Broker | — | 16,403,243 | ||||||
Other assets | 15,427 | 23,602 | ||||||
|
|
|
| |||||
TOTAL ASSETS | 12,024,259 | 98,041,086 | ||||||
|
|
|
| |||||
| ||||||||
LIABILITIES | ||||||||
Short securities, at value (premiums received of $0 and | — | 14,048,847 | ||||||
Written options, at value (premiums received of $0 and | — | 847,522 | ||||||
Payable for dividends on short positions | — | 14,362 | ||||||
Payable for investments purchased | — | 2,196,363 | ||||||
Payable for Fund shares redeemed | 9,003 | 233,288 | ||||||
Payable to affiliates | 26,021 | 48,413 | ||||||
Payable to Adviser | — | 51,367 | ||||||
Payable for distribution fees | 804 | 33,190 | ||||||
Payable for shareholder servicing fees | 1,463 | 17,729 | ||||||
Accrued expenses and other liabilities | 33,239 | 41,331 | ||||||
|
|
|
| |||||
TOTAL LIABILITIES | 70,530 | 17,532,412 | ||||||
|
|
|
| |||||
NET ASSETS | $ | 11,953,729 | $ | 80,508,674 | ||||
|
|
|
| |||||
| ||||||||
Net assets consist of: | ||||||||
Paid-in Capital | $ | 20,813,114 | $ | 87,636,507 | ||||
Accumulated deficit | (8,859,385 | ) | (7,127,833 | ) | ||||
|
|
|
| |||||
NET ASSETS | $ | 11,953,729 | $ | 80,508,674 | ||||
|
|
|
| |||||
The accompanying notes are an integral part of these financial statements.
36
Snow Capital Family of Funds
Statements of Assets and Liabilities (Continued)
August 31, 2020 (Unaudited)
| COMPUTATION OF NET ASSET VALUE | Snow Capital Small Cap Value Fund | Snow Capital Long/Short Opportunity Fund | ||||||
CLASS A SHARES | ||||||||
Net assets | $ | 5,817,650 | $ | 37,548,459 | ||||
Shares of beneficial interest outstanding (unlimited shares authorized, $0.001 par value) | 211,227 | 1,548,290 | ||||||
Net asset value, redemption price and offering price per share | $ | 27.54 | $ | 24.25 | ||||
Maximum offering price per share (Net asset value per share | $ | 29.07 | $ | 25.60 | ||||
| ||||||||
CLASS C SHARES | ||||||||
Net assets | $ | 1,446,677 | $ | 6,096,197 | ||||
Shares of beneficial interest outstanding (unlimited shares authorized, $0.001 par value) | 56,819 | 268,941 | ||||||
Net asset value, redemption price and offering price per share(1) (3) | $ | 25.46 | $ | 22.67 | ||||
| ||||||||
INSTITUTIONAL CLASS SHARES |
| |||||||
Net assets | $ | 4,689,402 | $ | 36,864,018 | ||||
Shares of beneficial interest outstanding (unlimited shares authorized, $0.001 par value) | 165,886 | 1,503,010 | ||||||
Net asset value, redemption price and offering price per share | $ | 28.27 | $ | 24.53 | ||||
| (1) | If applicable, redemption price per share may be reduced by a 0.50% redemption fee for shares redeemed within thirty days of purchase. |
| (2) | A contingent deferred sales charge (“CDSC”) of 0.50% may be charged on Class A share purchases of $1,000,000 or more that are redeemed within twelve months of purchase and a CDSC of 1.00% may be charged on Class C shares redeemed within twelve months of purchase. |
| (3) | Reflects a maximum sales charge of 5.25%. |
The accompanying notes are an integral part of these financial statements.
37
Snow Capital Family of Funds
For the Six Months Ended August 31, 2020 (Unaudited)
| Snow Capital Small Cap Value Fund | Snow Capital Long/Short Opportunity Fund | |||||||
INVESTMENT INCOME | ||||||||
Dividend income | $ | 117,545 | $ | 1,274,169 | ||||
Interest income | 149 | 19,678 | ||||||
|
|
|
| |||||
TOTAL INVESTMENT INCOME | 117,694 | 1,293,847 | ||||||
|
|
|
| |||||
EXPENSES | ||||||||
Administration fees | 60,925 | 81,214 | ||||||
Management fees | 56,113 | 332,520 | ||||||
Transfer agent fees and expenses | 32,489 | 47,612 | ||||||
Federal and state registration fees | 21,902 | 22,537 | ||||||
Audit and tax fees | 17,397 | 18,780 | ||||||
Legal fees | 7,746 | 14,091 | ||||||
Distribution fees - Class C | 7,033 | 27,869 | ||||||
Distribution fees - Class A | 6,316 | 47,528 | ||||||
Chief Compliance Officer fees and expenses | 6,256 | 6,256 | ||||||
Trustees’ fees and expenses | 5,799 | 5,799 | ||||||
Custody fees | 4,719 | 7,425 | ||||||
Reports to shareholders | 2,463 | 13,705 | ||||||
Shareholder servicing fees - Class C | 2,344 | 9,290 | ||||||
Accounting expense | 1,193 | 2,202 | ||||||
Insurance expense | 920 | 920 | ||||||
Broker fees | — | 57,077 | ||||||
Dividends on short positions | — | 166,541 | ||||||
Other expenses | 2,291 | 2,653 | ||||||
|
|
|
| |||||
TOTAL EXPENSES | 235,906 | 864,019 | ||||||
|
|
|
| |||||
Less waivers and reimbursements by Adviser (Note 4) | (146,380 | ) | (17,466 | ) | ||||
|
|
|
| |||||
NET EXPENSES | 89,526 | 846,553 | ||||||
|
|
|
| |||||
NET INVESTMENT INCOME | 28,168 | 447,294 | ||||||
|
|
|
| |||||
The accompanying notes are an integral part of these financial statements.
38
Snow Capital Family of Funds
Statements of Operations (Continued)
For the Six Months Ended August 31, 2020 (Unaudited)
| Snow Capital Small Cap Value Fund | Snow Capital Long/Short Opportunity Fund | |||||||
REALIZED AND UNREALIZED GAIN (LOSS) ON INVESTMENTS | ||||||||
Net realized gain (loss) on: | ||||||||
Investments | $ | (4,237,626 | ) | $ | (6,586,579 | ) | ||
Securities sold short | — | 926,428 | ||||||
Purchased options | — | 323,765 | ||||||
Written options | — | 785,207 | ||||||
Net change in unrealized appreciation (depreciation) on: | ||||||||
Investments | 2,075,005 | (1,237,309 | ) | |||||
Securities sold short | — | (2,036,416 | ) | |||||
Purchased options | — | (353,226 | ) | |||||
Written options | — | 353,619 | ||||||
Foreign currency translation | — | 144 | ||||||
|
|
|
| |||||
NET REALIZED AND UNREALIZED LOSS | (2,162,621 | ) | (7,824,367 | ) | ||||
|
|
|
| |||||
NET DECREASE IN NET ASSETS FROM OPERATIONS | $ | (2,134,453 | ) | $ | (7,377,073 | ) | ||
|
|
|
| |||||
The accompanying notes are an integral part of these financial statements.
39
Snow Capital Family of Funds
Snow Capital Small Cap Value Fund
Statements of Changes in Net Assets
| Six Months Ended August 31, 2020 (Unaudited) | Year Ended February 29, 2020 | |||||||
FROM OPERATIONS | ||||||||
Net investment income | $ | 28,168 | $ | 7,932 | ||||
Net realized loss on: | ||||||||
Investments | (4,237,626 | ) | (2,780,526 | ) | ||||
Net change in unrealized appreciation (depreciation) Investments | 2,075,005 | (1,625,480 | ) | |||||
|
|
|
| |||||
Decrease in Net Assets from Operations | (2,134,453 | ) | (4,398,074 | ) | ||||
|
|
|
| |||||
FROM CAPITAL SHARE TRANSACTIONS | ||||||||
Proceeds from shares sold - Class A | 577,131 | 579,612 | ||||||
Proceeds from shares sold - Class C | 5,937 | 118,051 | ||||||
Proceeds from shares sold - Institutional Class | 192,526 | 1,979,250 | ||||||
Payments for shares redeemed - Class A | (3,207,088 | ) | (1,411,323 | ) | ||||
Payments for shares redeemed - Class C | (1,177,794 | ) | (1,106,761 | ) | ||||
Payments for shares redeemed - Institutional Class(1) | (2,747,929 | ) | (7,395,345 | ) | ||||
|
|
|
| |||||
Net Decrease from capital share transactions | (6,357,217 | ) | (7,236,516 | ) | ||||
|
|
|
| |||||
TOTAL DECREASE IN NET ASSETS | (8,491,670 | ) | (11,634,590 | ) | ||||
NET ASSETS | ||||||||
Beginning of Period | $ | 20,445,399 | $ | 32,079,989 | ||||
|
|
|
| |||||
End of Period | $ | 11,953,729 | $ | 20,445,399 | ||||
|
|
|
| |||||
| (1) | Net of redemption fees of $1 and $105 for the six months ended August 31, 2020 and the year ended February 29, 2020, respectively. |
The accompanying notes are an integral part of these financial statements.
40
Snow Capital Family of Funds
Snow Capital Long/Short Opportunity Fund
Statements of Changes in Net Assets
| Six Months Ended August 31, 2020 (Unaudited) | Year Ended February 29, 2020 | |||||||
FROM OPERATIONS | ||||||||
Net investment income | $ | 447,294 | $ | 1,339,307 | ||||
Net realized gain (loss) on: | ||||||||
Investments | (6,586,579 | ) | 3,901,880 | |||||
Securities sold short | 926,428 | (2,743,121 | ) | |||||
Purchased options | 323,765 | (172,629 | ) | |||||
Written options | 785,207 | 1,510,009 | ||||||
Net change in unrealized appreciation (depreciation) | ||||||||
Investments | (1,237,309 | ) | (5,803,715 | ) | ||||
Securities sold short | (2,036,416 | ) | 1,758,572 | |||||
Purchased options | (353,226 | ) | 276,525 | |||||
Written options | 353,619 | (661,335 | ) | |||||
Foreign currency translation | 144 | — | ||||||
|
|
|
| |||||
Decrease in Net Assets from Operations | (7,377,073 | ) | (594,507 | ) | ||||
|
|
|
| |||||
FROM DISTRIBUTIONS | ||||||||
Net investment income - Class A | — | (982,205 | ) | |||||
Net investment income - Class C | — | (61,228 | ) | |||||
Net investment income - Institutional Class | — | (987,581 | ) | |||||
|
|
|
| |||||
Net decrease in net assets resulting from distributions paid | — | (2,031,014 | ) | |||||
|
|
|
| |||||
FROM CAPITAL SHARE TRANSACTIONS | ||||||||
Proceeds from shares sold - Class A | 1,364,247 | 2,239,996 | ||||||
Proceeds from shares sold - Class C | 1,200 | 70,625 | ||||||
Proceeds from shares sold - Institutional Class | 250,279 | 1,927,779 | ||||||
Net asset value of shares issued to shareholders in payment of distributions declared - Class A | — | 179,072 | ||||||
Net asset value of shares issued to shareholders in payment of distributions declared - Class C | — | 46,095 | ||||||
Net asset value of shares issued to shareholders in payment of distributions declared - Institutional Class | — | 816,091 | ||||||
Payments for shares redeemed - Class A(1) | (11,008,993 | ) | (13,925,734 | ) | ||||
Payments for shares redeemed - Class C | (3,020,090 | ) | (7,082,907 | ) | ||||
Payments for shares redeemed - Institutional Class(2) | (5,482,516 | ) | (27,407,576 | ) | ||||
|
|
|
| |||||
Net decrease from capital share transactions | (17,895,873 | ) | (43,136,559 | ) | ||||
|
|
|
| |||||
TOTAL DECREASE IN NET ASSETS | (25,272,946 | ) | (45,762,080 | ) | ||||
NET ASSETS | ||||||||
Beginning of Period | $ | 105,781,620 | $ | 151,543,700 | ||||
|
|
|
| |||||
End of Period | $ | 80,508,674 | $ | 105,781,620 | ||||
|
|
|
| |||||
| (1) | Net of redemption fees of $0 and $29 for the six months ended August 31, 2020 and the year ended February 29, 2020, respectively. |
| (2) | Net of redemption fees of $0 and $149 for the six months ended August 31, 2020 and the year ended February 29, 2020, respectively. |
The accompanying notes are an integral part of these financial statements.
41
Snow Capital Small Cap Value Fund - Class A
Per Share Data for a Share Outstanding Throughout Each Period
| For the Six Months Ended August 31, 2020 (Unaudited) | Year Ended February 29, 2020 | Year Ended February 28, 2019 | Year Ended February 28, 2018 | Year Ended February 28, 2017 | Year Ended February 29, 2016 | |||||||||||||||||||
Net Asset Value, Beginning of Period | $ | 26.39 | $ | 31.57 | $ | 32.36 | $ | 30.61 | $ | 23.62 | $ | 30.94 | ||||||||||||
|
|
|
|
|
|
|
|
|
|
|
| |||||||||||||
Income from investment operations: | ||||||||||||||||||||||||
Net investment income (loss)(1) | 0.06 | 0.01 | (0.06 | ) | (0.16 | ) | (0.19 | ) | (0.08 | ) | ||||||||||||||
Net realized and unrealized gain (loss) on investments | 1.09 | (5.19 | ) | (0.73 | ) | 1.91 | 7.18 | (7.13 | ) | |||||||||||||||
|
|
|
|
|
|
|
|
|
|
|
| |||||||||||||
Total from Investment Operations | 1.15 | (5.18 | ) | (0.79 | ) | 1.75 | 6.99 | (7.21 | ) | |||||||||||||||
|
|
|
|
|
|
|
|
|
|
|
| |||||||||||||
Less Distributions: | ||||||||||||||||||||||||
From net realized gain on investments | — | — | — | — | — | (0.11 | ) | |||||||||||||||||
|
|
|
|
|
|
|
|
|
|
|
| |||||||||||||
Total Distributions to Shareholders | — | — | — | — | — | (0.11 | ) | |||||||||||||||||
|
|
|
|
|
|
|
|
|
|
|
| |||||||||||||
Paid-in capital from redemption fees (Note 2) | — | — | — | 0.00 | (2) | 0.00 | (2) | 0.00 | (2) | |||||||||||||||
|
|
|
|
|
|
|
|
|
|
|
| |||||||||||||
Net Asset Value, End of Period | $ | 27.54 | $ | 26.39 | $ | 31.57 | $ | 32.36 | $ | 30.61 | $ | 23.62 | ||||||||||||
|
|
|
|
|
|
|
|
|
|
|
| |||||||||||||
Total Return(3) (4) | 4.36 | % | -16.41 | % | -2.44 | % | 5.72 | % | 29.59 | % | -23.35 | % | ||||||||||||
|
|
|
|
|
|
|
|
|
|
|
| |||||||||||||
Supplemental Data and Ratios: | ||||||||||||||||||||||||
Net Assets at End of Period (000’s Omitted) | $ | 5,818 | $ | 10,071 | $ | 12,948 | $ | 15,236 | $ | 21,013 | $ | 20,174 | ||||||||||||
Ratio of expenses to average net assets | ||||||||||||||||||||||||
Before waivers and reimbursements of expenses(5) (6) | 3.97 | % | 2.41 | % | 2.14 | % | 2.14 | % | 2.05 | % | 1.93 | % | ||||||||||||
After waivers and reimbursements of of expenses(6) (7) | 1.50 | % | 1.51 | % | 1.50 | % | 1.64 | %(8) | 1.71 | % | 1.72 | % | ||||||||||||
Ratio of net investment loss to average net assets | ||||||||||||||||||||||||
Before waivers and reimbursements of expenses(6) | (1.95 | )% | (0.90 | )% | (0.83 | )% | (1.02 | )% | (1.02 | )% | (0.51 | )% | ||||||||||||
After waivers and reimbursements of expenses(6) | 0.52 | % | 0.02 | % | (0.19 | )% | (0.52 | )% | (0.68 | )% | (0.30 | )% | ||||||||||||
Portfolio turnover rate(4) | 44.97 | % | 44.25 | % | 51.90 | % | 52.76 | % | 73.84 | % | 60.78 | % | ||||||||||||
| ||||||||||||||||||||||||
The accompanying notes are an integral part of these financial statements.
42
Snow Capital Small Cap Value Fund - Class A
Financial Highlights (Continued)
Per Share Data for a Share Outstanding Throughout Each Period
| (1) | Per share net investment income (loss) was calculated using average shares outstanding. |
| (2) | Less than 0.05 cent per share. |
| (3) | Based on net asset value, which does not reflect the sales charge. |
| (4) | Not annualized for periods less than a year. |
| (5) | The expense ratio before waivers and reimbursements of expenses excluding interest expenses are 3.97%, 2.40%, 2.14%, 2.12% , 2.04% and 1.91% for the six months ended August 31, 2020 and the years ended February 29, 2020, February 28, 2019, February 28, 2018, and February 28, 2017, and February 29, 2016, respectively. |
| (6) | Annualized for periods less than a year. |
| (7) | The expense ratio after waivers and reimbursements of expenses excluding interest expenses are 1.50%, 1.50%, 1.50%, 1.62%, 1.70% and 1.70% for the six months ended August 31, 2020 and the years ended February 29, 2020, February 28, 2019, February 28, 2018, and February 28, 2017, and February 29, 2016, respectively. |
| (8) | Effective October 1, 2017, the operating expense limit was reduced by 0.20%. |
The accompanying notes are an integral part of these financial statements.
43
Snow Capital Small Cap Value Fund - Class C
Financial Highlights
Per Share Data for a Share Outstanding Throughout Each Period
| For the Six Months Ended August 31, 2020 (Unaudited) | Year Ended February 29, 2020 | Year Ended February 28, 2019 | Year Ended February 28, 2018 | Year Ended February 28, 2017 | Year Ended February 29, 2016 | |||||||||||||||||||
Net Asset Value, Beginning of Period | $ | 24.48 | $ | 29.51 | $ | 30.48 | $ | 29.05 | $ | 22.58 | $ | 29.80 | ||||||||||||
|
|
|
|
|
|
|
|
|
|
|
| |||||||||||||
Income from investment operations: | ||||||||||||||||||||||||
Net investment income (loss)(1) | (0.03 | ) | (0.21 | ) | (0.29 | ) | (0.36 | ) | (0.38 | ) | (0.26 | ) | ||||||||||||
Net realized and unrealized gain (loss) on investments | 1.01 | (4.82 | ) | (0.68 | ) | 1.79 | 6.85 | (6.85 | ) | |||||||||||||||
|
|
|
|
|
|
|
|
|
|
|
| |||||||||||||
Total from Investment Operations | 0.98 | (5.03 | ) | (0.97 | ) | 1.43 | 6.47 | (7.11 | ) | |||||||||||||||
|
|
|
|
|
|
|
|
|
|
|
| |||||||||||||
Less Distributions: | ||||||||||||||||||||||||
From net realized gain on investments | — | — | — | — | — | (0.11 | ) | |||||||||||||||||
|
|
|
|
|
|
|
|
|
|
|
| |||||||||||||
Total Distributions to Shareholders | — | — | — | — | — | (0.11 | ) | |||||||||||||||||
|
|
|
|
|
|
|
|
|
|
|
| |||||||||||||
Paid-in capital from redemption fees (Note 2) | — | — | — | — | 0.00 | (2) | 0.00 | (2) | ||||||||||||||||
|
|
|
|
|
|
|
|
|
|
|
| |||||||||||||
Net Asset Value, End of Period | $ | 25.46 | $ | 24.48 | $ | 29.51 | $ | 30.48 | $ | 29.05 | $ | 22.58 | ||||||||||||
|
|
|
|
|
|
|
|
|
|
|
| |||||||||||||
Total Return(3) (4) | 4.00 | % | -17.05 | % | -3.18 | % | 4.92 | % | 28.65 | % | -23.88 | % | ||||||||||||
|
|
|
|
|
|
|
|
|
|
|
| |||||||||||||
Supplemental Data and Ratios: | ||||||||||||||||||||||||
Net Assets at End of Period (000’s Omitted) | $ | 1,447 | $ | 2,695 | $ | 4,294 | $ | 5,230 | $ | 8,394 | $ | 10,560 | ||||||||||||
Ratio of expenses to average net assets | ||||||||||||||||||||||||
Before waivers and reimbursements of expenses(5) (6) | 4.72 | % | 3.16 | % | 2.89 | % | 2.89 | % | 2.73 | % | 2.42 | % | ||||||||||||
After waivers and reimbursements of of expenses(6) (7) | 2.25 | % | 2.26 | % | 2.25 | % | 2.39 | %(8) | 2.46 | % | 2.41 | % | ||||||||||||
Ratio of net investment income (loss) to average net assets | ||||||||||||||||||||||||
Before waivers and reimbursements of expenses(6) | (2.78 | )% | (1.64 | )% | (1.58 | )% | (1.77 | )% | (1.71 | )% | (1.00 | )% | ||||||||||||
After waivers and reimbursements of expenses(6) | (0.31 | )% | (0.73 | )% | 0.94 | % | (1.27 | )% | (1.44 | )% | (0.98 | )% | ||||||||||||
Portfolio turnover rate(4) | 44.97 | % | 44.25 | % | 51.90 | % | 52.76 | % | 73.84 | % | 60.78 | % | ||||||||||||
| ||||||||||||||||||||||||
The accompanying notes are an integral part of these financial statements.
44
Snow Capital Small Cap Value Fund - Class C
Financial Highlights (Continued)
Per Share Data for a Share Outstanding Throughout Each Period
| (1) | Per share net investment income (loss) was calculated using average shares outstanding. |
| (2) | Less than 0.05 cent per share. |
| (3) | Based on net asset value, which does not reflect the sales charge. |
| (4) | Not annualized for periods less than a year. |
| (5) | The expense ratio before waivers and reimbursements of expenses excluding interest expenses are 4.72%, 3.15%, 2.89%, 2.87%, 2.72% and 2.41% for the six months ended August 31, 2020 and the years ended February 29, 2020, February 28, 2019, February 28, 2018, and February 28, 2017, and February 29, 2016, respectively. |
| (6) | Annualized for periods less than a year. |
| (7) | The expense ratio after waivers and reimbursements of expenses excluding interest expenses are 2.25%, 2.25%, 2.25%, 2.37%, 2.45% and 2.40% for the six months ended August 31, 2020 and the years ended February 29, 2020, February 28, 2019, February 28, 2018, and February 28, 2017, and February 29, 2016, respectively. |
| (8) | Effective October 1, 2017, the operating expense limit was reduced by 0.20%. |
The accompanying notes are an integral part of these financial statements.
45
Snow Capital Small Cap Value Fund - Institutional Class
Financial Highlights
Per Share Data for a Share Outstanding Throughout Each Period
| �� | For the Six Months Ended August 31, 2020 (Unaudited) | Year Ended February 29, 2020 | Year Ended February 28, 2019 | Year Ended February 28, 2018 | Year Ended February 28, 2017 | Year Ended February 29, 2016 | ||||||||||||||||||
Net Asset Value, Beginning of Period | $ | 27.05 | $ | 32.28 | $ | 33.00 | $ | 31.14 | $ | 23.96 | $ | 31.31 | ||||||||||||
|
|
|
|
|
|
|
|
|
|
|
| |||||||||||||
Income from investment operations: | ||||||||||||||||||||||||
Net investment income (loss)(1) | 0.08 | 0.09 | 0.02 | (0.08 | ) | (0.12 | ) | (0.01 | ) | |||||||||||||||
Net realized and unrealized gain (loss) on investments | 1.14 | (5.32 | ) | (0.74 | ) | 1.94 | 7.30 | (7.23 | ) | |||||||||||||||
|
|
|
|
|
|
|
|
|
|
|
| |||||||||||||
Total from Investment Operations | 1.22 | (5.23 | ) | (0.72 | ) | 1.86 | 7.18 | (7.24 | ) | |||||||||||||||
|
|
|
|
|
|
|
|
|
|
|
| |||||||||||||
Less Distributions: | ||||||||||||||||||||||||
From net realized gain on investments | — | — | — | — | — | (0.11 | ) | |||||||||||||||||
|
|
|
|
|
|
|
|
|
|
|
| |||||||||||||
Total Distributions to Shareholders | — | — | — | — | — | (0.11 | ) | |||||||||||||||||
|
|
|
|
|
|
|
|
|
|
|
| |||||||||||||
Paid-in capital from redemption fees (Note 2) | 0.00 | (2) | 0.00 | (2) | 0.00 | (2) | 0.00 | (2) | 0.00 | (2) | 0.00 | (2) | ||||||||||||
|
|
|
|
|
|
|
|
|
|
|
| |||||||||||||
Net Asset Value, End of Period | $ | 28.27 | $ | 27.05 | $ | 32.28 | $ | 33.00 | $ | 31.14 | $ | 23.96 | ||||||||||||
|
|
|
|
|
|
|
|
|
|
|
| |||||||||||||
Total Return(3) (4) | 4.51 | % | -16.20 | % | -2.21 | % | 6.01 | % | 29.97 | % | -23.17 | % | ||||||||||||
|
|
|
|
|
|
|
|
|
|
|
| |||||||||||||
Supplemental Data and Ratios: | ||||||||||||||||||||||||
Net Assets at End of Period (000’s Omitted) | $ | 4,689 | $ | 7,679 | $ | 14,839 | $ | 19,220 | $ | 28,201 | $ | 28,304 | ||||||||||||
Ratio of expenses to average net assets | ||||||||||||||||||||||||
Before waivers and reimbursements of expenses(5) (6) | 3.72 | % | 2.16 | % | 1.89 | % | 1.89 | % | 1.80 | % | 1.67 | % | ||||||||||||
After waivers and reimbursements of of expenses(6) (7) | 1.25 | % | 1.26 | % | 1.25 | % | 1.39 | %(8) | 1.46 | % | 1.46 | % | ||||||||||||
Ratio of net investment income (loss) to average net assets | ||||||||||||||||||||||||
Before waivers and reimbursements of expenses(6) | (1.75 | )% | (0.63 | )% | (0.57 | )% | (0.77 | )% | (0.77 | )% | (0.24 | )% | ||||||||||||
After waivers and reimbursements of expenses(6) | 0.73 | % | 0.27 | % | 0.07 | % | (0.27 | )% | (0.43 | )% | (0.04 | )% | ||||||||||||
Portfolio turnover rate(4) | 44.97 | % | 44.25 | % | 51.90 | % | 52.76 | % | 73.84 | % | 60.78 | % | ||||||||||||
| ||||||||||||||||||||||||
The accompanying notes are an integral part of these financial statements.
46
Snow Capital Small Cap Value Fund - Institutional Class
Financial Highlights (Continued)
Per Share Data for a Share Outstanding Throughout Each Period
| (1) | Per share net investment income (loss) was calculated using average shares outstanding. |
| (2) | Less than 0.05 cent per share. |
| (3) | Based on net asset value, which does not reflect the sales charge. |
| (4) | Not annualized for periods less than a year. |
| (5) | The expense ratio before waivers and reimbursements of expenses excluding interest expenses are 3.72%, 2.15%, 1.88%, 1.88%, 1.79% and 1.66% for the six months ended August 31, 2020 and the years ended February 29, 2020, February 28, 2019, February 28, 2018, and February 28, 2017, and February 29, 2016, respectively. |
| (6) | Annualized for periods less than a year. |
| (7) | The expense ratio after waivers and reimbursements of expenses excluding interest expenses are 1.25%, 1.25%, 1.25%, 1.37%, 1.45% and 1.45% for the six months ended August 31, 2020 and the years ended February 29, 2020, February 28, 2019, February 28, 2018, and February 28, 2017, and February 29, 2016, respectively. |
(8) Effective October 1, 2017, the operating expense limit was reduced by 0.20%.
The accompanying notes are an integral part of these financial statements.
47
Snow Capital Long/Short Opportunity Fund - Class A
Financial Highlights
Per Share Data for a Share Outstanding Throughout Each Period
| For the Six Months Ended August 31, 2020 (Unaudited) | Year Ended February 29, 2020 | Year Ended February 28, 2019 | Year Ended February 28, 2018 | Year Ended February 28, 2017 | Year Ended February 29, 2016 | |||||||||||||||||||
Net Asset Value, Beginning of Period | $ | 25.42 | $ | 26.07 | $ | 26.95 | $ | 26.55 | $ | 18.61 | $ | 27.96 | ||||||||||||
|
|
|
|
|
|
|
|
|
|
|
| |||||||||||||
Income from investment operations: | ||||||||||||||||||||||||
Net investment income(1) | 0.13 | 0.27 | 0.31 | 0.32 | 0.99 | 0.10 | ||||||||||||||||||
Net realized and unrealized gain (loss) on investments | (1.30 | ) | (0.44 | ) | (0.77 | ) | 1.33 | 6.95 | (8.85 | ) | ||||||||||||||
|
|
|
|
|
|
|
|
|
|
|
| |||||||||||||
Total from Investment Operations | (1.17 | ) | (0.17 | ) | (0.46 | ) | 1.65 | 7.94 | (8.75 | ) | ||||||||||||||
|
|
|
|
|
|
|
|
|
|
|
| |||||||||||||
Less Distributions: | ||||||||||||||||||||||||
From net investment income | — | (0.48 | ) | (0.42 | ) | (1.25 | ) | — | — | |||||||||||||||
From net realized gain on investments | — | — | — | — | — | (0.60 | ) | |||||||||||||||||
|
|
|
|
|
|
|
|
|
|
|
| |||||||||||||
Total Distributions to Shareholders | — | (0.48 | ) | (0.42 | ) | (1.25 | ) | — | (0.60 | ) | ||||||||||||||
|
|
|
|
|
|
|
|
|
|
|
| |||||||||||||
Paid-in capital from redemption fees (Note 2) | 0.00 | (2) | 0.00 | (2) | — | 0.00 | (2) | — | 0.00 | (2) | ||||||||||||||
|
|
|
|
|
|
|
|
|
|
|
| |||||||||||||
Net Asset Value, End of Period | $ | 24.25 | $ | 25.42 | $ | 26.07 | $ | 26.95 | $ | 26.55 | $ | 18.61 | ||||||||||||
|
|
|
|
|
|
|
|
|
|
|
| |||||||||||||
Total Return(3) (4) | -4.60 | % | -0.85 | % | -1.55 | % | 6.12 | % | 42.59 | % | -31.55 | % | ||||||||||||
|
|
|
|
|
|
|
|
|
|
|
| |||||||||||||
Supplemental Data and Ratios: | ||||||||||||||||||||||||
Net Assets at End of Period (000’s Omitted) | $ | 37,549 | $ | 51,478 | $ | 64,079 | $ | 72,100 | $ | 79,907 | $ | 68,874 | ||||||||||||
Ratio of expenses to average net assets | ||||||||||||||||||||||||
Before waivers and reimbursements of expenses(5)(6) | 2.12 | % | 1.70 | % | 1.57 | % | 1.58 | %(9) | 1.58 | % | 1.59 | % | ||||||||||||
After waivers and reimbursements of of expenses(6)(7) | 2.08 | % | 1.70 | % | 1.57 | % | 1.58 | %(9) | 1.58 | % | 1.59 | % | ||||||||||||
Ratio of net investment income to average net assets | ||||||||||||||||||||||||
Before waivers and reimbursements of expenses(8) | 1.03 | % | 0.98 | % | 1.15 | % | 1.18 | % | 4.26 | % | 0.40 | % | ||||||||||||
After waivers and reimbursements of expenses(8) | 1.07 | % | 0.98 | % | 1.15 | % | 1.18 | % | 4.26 | % | 0.40 | % | ||||||||||||
Portfolio turnover rate(4) | 43.12 | % | 53.97 | % | 37.64 | % | 71.53 | % | 83.56 | % | 67.95 | % | ||||||||||||
| ||||||||||||||||||||||||
The accompanying notes are an integral part of these financial statements.
48
Snow Capital Long/Short Opportunity Fund - Class A
Financial Highlights (Continued)
Per Share Data for a Share Outstanding Throughout Each Period
| (1) | Per share net investment income (loss) was calculated using average shares outstanding. |
| (2) | Less than 0.05 cent per share. |
| (3) | Based on net asset value, which does not reflect the sales charge. |
| (4) | Not annualized for periods less than a year. |
| (5) | The expense ratio before waivers and reimbursements of expenses excluding dividends on short positions and interest expenses are 1.59%, 1.41%, 1.41%, 1.50%, 1.54% and 1.50% for the six months ended August 31, 2020 and the years ended February 29, 2020, February 28, 2019, February 28, 2018, and February 28, 2017, and February 29, 2016, respectively. |
| (6) | Annualized for periods less than a year. |
| (7) | The expense ratio after waivers and reimbursements of expenses excluding dividends on short positions and interest expenses are 1.55%, 1.41%, 1.41%, 1.50%, 1.54% and 1.50% for the six months ended August 31, 2020 and the years ended February 29, 2020, February 28, 2019, February 28, 2018, and February 28, 2017, and February 29, 2016, respectively. |
| (8) | The net investment income ratios include dividends on short positions and interest expense. |
| (9) | Effective October 1, 2017, the operating expense limit was reduced by 0.20%. |
The accompanying notes are an integral part of these financial statements.
49
Snow Capital Long/Short Opportunity Fund - Class C
Financial Highlights
Per Share Data for a Share Outstanding Throughout Each Period
| For the Six Months Ended August 31, 2020 (Unaudited) | Year Ended February 29, 2020 | Year Ended February 28, 2019 | Year Ended February 28, 2018 | Year Ended February 28, 2017 | Year Ended February 29, 2016 | |||||||||||||||||||
Net Asset Value, Beginning of Period | $ | 23.85 | $ | 24.36 | $ | 25.11 | $ | 24.74 | $ | 17.47 | $ | 26.49 | ||||||||||||
|
|
|
|
|
|
|
|
|
|
|
| |||||||||||||
Income from investment operations: | ||||||||||||||||||||||||
Net investment income (loss)(1) | 0.03 | 0.07 | 0.10 | 0.12 | 0.77 | (0.08 | ) | |||||||||||||||||
Net realized and unrealized gain (loss) on investments | (1.21 | ) | (0.44 | ) | (0.70 | ) | 1.22 | 6.50 | (8.34 | ) | ||||||||||||||
|
|
|
|
|
|
|
|
|
|
|
| |||||||||||||
Total from Investment Operations | (1.18 | ) | (0.37 | ) | (0.60 | ) | 1.34 | 7.27 | (8.42 | ) | ||||||||||||||
|
|
|
|
|
|
|
|
|
|
|
| |||||||||||||
Less Distributions: | ||||||||||||||||||||||||
From net investment income | — | (0.14 | ) | (0.15 | ) | (0.97 | ) | — | — | |||||||||||||||
From net realized gain on investments | — | — | — | — | — | (0.60 | ) | |||||||||||||||||
|
|
|
|
|
|
|
|
|
|
|
| |||||||||||||
Total Distributions to Shareholders | — | (0.14 | ) | (0.15 | ) | (0.97 | ) | — | (0.60 | ) | ||||||||||||||
|
|
|
|
|
|
|
|
|
|
|
| |||||||||||||
Paid-in capital from redemption fees (Note 2) | — | — | — | 0.00 | (2) | — | 0.00 | (2) | ||||||||||||||||
|
|
|
|
|
|
|
|
|
|
|
| |||||||||||||
Net Asset Value, End of Period | $ | 22.67 | $ | 23.85 | $ | 24.36 | $ | 25.11 | $ | 24.74 | $ | 17.47 | ||||||||||||
|
|
|
|
|
|
|
|
|
|
|
| |||||||||||||
Total Return(3) (4) | -4.95 | % | -1.58 | % | -2.29 | % | 5.31 | % | 41.53 | % | -32.05 | % | ||||||||||||
|
|
|
|
|
|
|
|
|
|
|
| |||||||||||||
Supplemental Data and Ratios: | ||||||||||||||||||||||||
Net Assets at End of Period (000’s Omitted) | $ | 6,096 | $ | 9,744 | $ | 16,735 | $ | 20,597 | $ | 28,286 | $ | 27,099 | ||||||||||||
Ratio of expenses to average net assets | ||||||||||||||||||||||||
Before waivers and reimbursements of expenses(5) (6) | 2.87 | % | 1.70 | % | 1.57 | % | 2.33 | %(6) | 2.33 | % | 2.33 | % | ||||||||||||
After waivers and reimbursements of of expenses(6) (7) | 2.83 | % | 1.70 | % | 1.57 | % | 2.33 | %(6) | 2.33 | % | 2.33 | % | ||||||||||||
Ratio of net investment income (loss) to average net assets | 0.40 | % | 0.50 | % | 3.53 | % | (0.37 | )% | ||||||||||||||||
Before waivers and reimbursements of expenses(8) | 0.20 | % | 0.66 | % | 0.96 | % | 0.50 | % | 3.53 | % | (0.37 | )% | ||||||||||||
After waivers and reimbursements of expenses(8) | 0.24 | % | 0.66 | % | 0.96 | % | 0.50 | % | 3.53 | % | (0.37 | )% | ||||||||||||
Portfolio turnover rate | 43.12 | % | 53.97 | % | 37.64 | % | 71.53 | % | 83.56 | % | 67.95 | % | ||||||||||||
| ||||||||||||||||||||||||
The accompanying notes are an integral part of these financial statements.
50
Snow Capital Long/Short Opportunity Fund - Class C
Financial Highlights (Continued)
Per Share Data for a Share Outstanding Throughout Each Period
| (1) | Per share net investment income (loss) was calculated using average shares outstanding. |
| (2) | Less than 0.05 cent per share. |
| (3) | Based on net asset value, which does not reflect the sales charge. |
| (4) | Not annualized for periods less than a year. |
| (5) | The expense ratio before waivers and reimbursements of expenses excluding dividends on short positions and interest expenses are 2.34%, 2.16%, 2.16%, 2.25%, 2.29% and 2.25% for the six months ended August 31, 2020 and the years ended February 29, 2020, February 28, 2019, February 28, 2018, and February 28, 2017, and February 29, 2016, respectively. |
| (6) | Annualized for periods less than a year. |
| (7) | The expense ratio after waivers and reimbursements of expenses excluding dividends on short positions and interest expenses are 2.30%, 2.16%, 2.16%, 2.25%, 2.29% and 2.25% for the six months ended August 31, 2020 and the years ended February 29, 2020, February 28, 2019, February 28, 2018, and February 28, 2017, and February 29, 2016, respectively. |
| (8) | The net investment income ratios include dividends on short positions and interest expense. |
| (9) | Effective October 1, 2017, the operating expense limit was reduced by 0.20%. |
The accompanying notes are an integral part of these financial statements.
51
Snow Capital Long/Short Opportunity Fund - Institutional Class
Financial Highlights
Per Share Data for a Share Outstanding Throughout Each Period
| For the Six Months Ended August 31, 2020 (Unaudited) | Year Ended February 29, 2020 | Year Ended February 28, 2019 | Year Ended February 28, 2018 | Year Ended February 28, 2017 | Year Ended February 29, 2016 | |||||||||||||||||||
Net Asset Value, Beginning of Period | $ | 25.68 | $ | 26.34 | $ | 27.24 | $ | 26.83 | $ | 18.83 | $ | 28.20 | ||||||||||||
|
|
|
|
|
|
|
|
|
|
|
| |||||||||||||
Income from investment operations: | ||||||||||||||||||||||||
Net investment income(1) | 0.15 | 0.34 | 0.37 | 0.38 | 1.05 | 0.16 | ||||||||||||||||||
Net realized and unrealized gain (loss) on investments | (1.30 | ) | (0.44 | ) | (0.78 | ) | 1.35 | 7.04 | (8.93 | ) | ||||||||||||||
|
|
|
|
|
|
|
|
|
|
|
| |||||||||||||
Total from Investment Operations | (1.15 | ) | (0.10 | ) | (0.41 | ) | 1.73 | 8.09 | (8.77 | ) | ||||||||||||||
|
|
|
|
|
|
|
|
|
|
|
| |||||||||||||
Less Distributions: | ||||||||||||||||||||||||
From net investment income | — | (0.56 | ) | (0.49 | ) | (1.32 | ) | (0.09 | ) | — | ||||||||||||||
From net realized gain on investments | — | — | — | — | — | (0.60 | ) | |||||||||||||||||
|
|
|
|
|
|
|
|
|
|
|
| |||||||||||||
Total Distributions to Shareholders | — | (0.56 | ) | (0.49 | ) | (1.32 | ) | (0.09 | ) | (0.60 | ) | |||||||||||||
|
|
|
|
|
|
|
|
|
|
|
| |||||||||||||
Paid-in capital from redemption fees (Note 2) | 0.00 | (2) | 0.00 | (2) | — | 0.00 | (2) | 0.00 | (2) | 0.00 | (2) | |||||||||||||
|
|
|
|
|
|
|
|
|
|
|
| |||||||||||||
Net Asset Value, End of Period | $ | 24.53 | $ | 25.68 | $ | 26.34 | $ | 27.24 | $ | 26.83 | $ | 18.83 | ||||||||||||
|
|
|
|
|
|
|
|
|
|
|
| |||||||||||||
Total Return(3) | -4.48 | % | -0.60 | % | -1.30 | % | 6.37 | % | 43.00 | % | -31.38 | % | ||||||||||||
|
|
|
|
|
|
|
|
|
|
|
| |||||||||||||
Supplemental Data and Ratios: | ||||||||||||||||||||||||
Net Assets at End of Period (000’s Omitted) | $ | 36,864 | $ | 44,559 | $ | 70,730 | $ | 96,661 | $ | 108,727 | $ | 87,274 | ||||||||||||
Ratio of expenses to average net assets | ||||||||||||||||||||||||
Before waivers and reimbursements of expenses(5)(6) | 1.87 | % | 1.45 | % | 1.40 | %(7) | 1.41 | %(7) | 4.47 | %(7) | 0.63 | %(7) | ||||||||||||
After waivers and reimbursements of of expenses(6)(7) | 1.83 | % | 1.45 | % | 1.32 | % | 1.33 | % | 1.33 | % | 1.33 | % | ||||||||||||
Ratio of net investment income to average net assets | ||||||||||||||||||||||||
Before waivers, reimbursements and recoupments of expenses(8) | 1.20 | % | 0.89 | % | 1.22 | % | 1.41 | % | 4.47 | % | 0.63 | % | ||||||||||||
After waivers, reimbursements and recoupments of expenses(8) | 1.24 | % | 0.89 | % | 1.22 | % | 1.41 | % | 4.47 | % | 0.63 | % | ||||||||||||
Portfolio turnover rate | 43.12 | % | 53.97 | % | 37.64 | % | 71.53 | % | 83.56 | % | 67.95 | % | ||||||||||||
| ||||||||||||||||||||||||
The accompanying notes are an integral part of these financial statements.
52
Snow Capital Long/Short Opportunity Fund - Institutional Class
Financial Highlights (Continued)
Per Share Data for a Share Outstanding Throughout Each Period
| (1) | Per share net investment income (loss) was calculated using average shares outstanding. |
| (2) | Less than 0.05 cent per share. |
| (3) | Based on net asset value, which does not reflect the sales charge. |
| (4) | Not annualized for periods less than a year. |
| (5) | The expense ratio before waivers and reimbursements of expenses excluding dividends on short positions and interest expenses are 1.34%, 1.16%, 1.16%, 1.25%, 1.29% and 1.29% for the six months ended August 31, 2020 and the years ended February 29, 2020, February 28, 2019, February 28, 2018, and February 28, 2017, and February 29, 2016, respectively. |
| (6) | Annualized for periods less than a year. |
| (7) | The expense ratio after waivers and reimbursements of expenses excluding dividends on short positions and interest expenses are 1.30%, 1.16%, 1.16%, 1.25%, 1.29% and 1.25% for the six months ended August 31, 2020 and the years ended February 29, 2020, February 28, 2019, February 28, 2018, and February 28, 2017, and February 29, 2016, respectively. |
| (8) | The net investment income ratios include dividends on short positions and interest expense. |
| (9) | Effective October 1, 2017, the operating expense limit was reduced by 0.20%. |
The accompanying notes are an integral part of these financial statements.
53
Snow Capital Family of Funds
August 31, 2020
| (1) | Organization |
Trust for Professional Managers (the “Trust”) was organized as a Delaware statutory trust under a Declaration of Trust dated May 29, 2001. The Trust is registered under the Investment Company Act of 1940, as amended (the “1940 Act”), as an open-end management investment company. Each of the Snow Capital Family of Funds (the “Funds”) represents a distinct portfolio with its own investment objective and policies within the Trust. The investment objective of the Snow Capital Long/Short Opportunity Fund is long-term capital appreciation and protection of investment principal. The investment objective of the Snow Capital Small Cap Value Fund is long-term capital appreciation. The Trust may issue an unlimited number of shares of beneficial interest at $0.001 par value. The assets of the Trust are segregated, and a shareholder’s interest is limited to the Fund(s) in which shares are held. The Trust has designated three classes of Fund shares: Class A, Class C and Institutional Class. The classes differ principally in their respective distribution expense arrangements as well as their respective sales and redemption fee arrangements. All classes of shares have identical rights to earnings, assets and voting privileges, except for class-specific expenses and exclusive rights to vote on matters affecting only individual classes. Class A shares are subject to an initial maximum sales charge of 5.25% imposed at the time of purchase. The sales charge declines as the amount purchased increases in accordance with the Funds’ current prospectus. Class A shares are subject to a contingent deferred sales charge of 0.50% for purchases made at the $1,000,000 breakpoint that are redeemed within twelve months of purchase. Class C shares are subject to a contingent deferred sales charge for redemptions made within twelve months of purchase, in accordance with the Funds’ current prospectus. The contingent deferred sales charge is 1.00% of the lesser of the original purchase price or the value of shares being redeemed. Institutional Class shares are no-load shares. The Snow Capital Long/Short Opportunity Fund became effective and commenced operations on April 28, 2006. Prior to June 28, 2018, the Snow Capital Long/Short Opportunity Fund was named the “Snow Capital Opportunity Fund.” The Snow Capital Small Cap Value Fund became effective and commenced operations on November 30, 2010. Costs incurred in connection with the organization, registration and the initial public offering of shares were paid by Snow Capital Management L.P. (the “Adviser”), the Funds’ investment adviser.
The Funds are investment companies and accordingly follow the investment company accounting and reporting guidance of the Financial Accounting
54
Standards Board (FASB) Accounting Standard Codification Topic 946 “Financial Services—Investment Companies”.
| (2) | Significant Accounting Policies |
The following is a summary of significant accounting policies consistently followed by the Funds in the preparation of the financial statements. These policies are in conformity with accounting principles generally accepted in the United States of America (“GAAP”).
| (a) | Investment Valuation |
Each equity security owned by a Fund that is listed on a securities exchange, except those securities listed on the NASDAQ Stock Market LLC (“NASDAQ”), is valued at its last sale price on that exchange at the close of the exchange on the date as of which assets are valued. If the security is listed on more than one exchange, a Fund will use the price of the exchange that the Fund generally considers to be the principal exchange on which the security is traded.
Fund securities listed on NASDAQ will be valued at the NASDAQ Official Closing Price, which may not necessarily represent the last sale price. If there has been no sale on such exchange or on NASDAQ on such day, the security is valued at the mean between the most recent quoted bid and asked prices at the close of the exchange on such day or at the latest sale price on the “composite market” for the day such security is being valued. The composite market is defined as the consolidation of the trade information provided by national securities and foreign exchanges and over-the-counter markets as published by an approved independent pricing service (“Pricing Service”).
Debt securities, including short-term debt instruments having a maturity of 60 days or less, are valued at the mean in accordance with prices supplied by a Pricing Service. Pricing Services may use various valuation methodologies such as the mean between the bid and the asked prices, matrix pricing and other analytical pricing models as well as market transactions and dealer quotations. If a price is not available from a Pricing Service, the most recent quotation obtained from one or more broker-dealers known to follow the issue will be obtained. Quotations will be valued at the mean between the bid and the offer. In the absence of available quotations, the security will be priced at fair value in accordance with the procedures approved by the Trust’s Board of Trustees (the “Board”). Any discount or premium is accreted or amortized using the constant yield to maturity method. Constant yield amortization takes into account the income that is produced on a debt security. This accretion/amortization type utilizes the discount rate used in
55
computing the present value of all future principal and interest payments made by a debt instrument and produces an amount equal to the cost of the debt instrument.
Money market funds, demand notes and repurchase agreements are valued at cost. If cost does not represent current market value the securities will be priced at fair value.
Redeemable securities issued by open-end, registered investment companies are valued at the net asset values (“NAVs”) of such companies for purchase and/or redemption orders placed on that day. If, on a particular day, a share of an investment company is not listed on NASDAQ, such security’s fair value will be determined. All exchange-traded funds are valued at the last reported sale price on the exchange on which the security is principally traded. In the event market quotations are not readily available, such security will be valued at its fair value.
If market quotations are not readily available, any security or other financial instrument is valued at its fair value as determined under fair value pricing procedures approved by the Board. These fair value pricing procedures will also be used to price a security when corporate events, events in the securities market and/or world events cause the Adviser to believe that a security’s last sale price may not reflect its actual market value. The intended effect of using fair value pricing procedures is to ensure that the Funds are accurately priced. The Board will regularly evaluate whether the Funds’ fair value pricing procedures continue to be appropriate in light of the specific circumstances of each Fund and the quality of prices obtained through application of such procedures by the Trust’s valuation committee.
FASB Accounting Standards Codification, “Fair Value Measurement” Topic 820 (“ASC 820”), establishes an authoritative definition of fair value and sets out a hierarchy for measuring fair value. ASC 820 requires an entity to evaluate certain factors to determine whether there has been a significant decrease in volume and level of activity for the security such that recent transactions and quoted prices may not be determinative of fair value and further analysis and adjustment may be necessary to estimate fair value. ASC 820 also requires enhanced disclosure regarding the inputs and valuation techniques used to measure fair value in those instances as well as expanded disclosure of valuation levels for major security types. These inputs are summarized in the three broad levels listed below:
| • | Level 1 – Quoted prices in active markets for identical securities. |
| • | Level 2 – Other significant observable inputs (including quoted prices for similar securities, interest rates, prepayment speeds, credit risk, etc.). |
| • | Level 3 – Significant unobservable inputs (including the Funds’ own assumptions in determining the fair value of investments). |
56
The inputs or methodology used for valuing securities are not necessarily an indication of the risk associated with investing in those securities. The Funds held no Level 3 securities throughout the six months ended August 31, 2020. The following is a summary of the inputs used to value the Funds’ investments carried at fair value as of August 31, 2020.
Snow Capital Small Cap Value Fund |
| |||||||||||||||
| Level 1 | Level 2 | Level 3 | Total | |||||||||||||
Assets: | ||||||||||||||||
Common Stocks(1) | $ | 11,951,649 | $ | — | $ | — | $ | 11,951,649 | ||||||||
Money Market Funds | 27,861 | — | — | 27,861 | ||||||||||||
|
|
|
|
|
|
|
| |||||||||
Total Assets | $ | 11,979,510 | $ | — | $ | — | $ | 11,979,510 | ||||||||
|
|
|
|
|
|
|
| |||||||||
| ||||||||||||||||
Snow Capital Long/Short Opportunity Fund |
| |||||||||||||||
| Level 1 | Level 2 | Level 3 | Total | |||||||||||||
Assets: | ||||||||||||||||
Common Stocks(1) | $ | 65,561,362 | $ | — | $ | — | $ | 65,561,362 | ||||||||
Purchased Options | 107,800 | — | — | 107,800 | ||||||||||||
Exchange-Traded Funds | 951,002 | — | — | 951,002 | ||||||||||||
Real Estate Investment Trusts | 965,643 | — | — | 965,643 | ||||||||||||
Money Market Funds | 13,752,762 | — | — | 13,752,762 | ||||||||||||
|
|
|
|
|
|
|
| |||||||||
Total Assets | $ | 81,338,569 | $ | — | $ | — | $ | 81,338,569 | ||||||||
|
|
|
|
|
|
|
| |||||||||
Liabilities: | ||||||||||||||||
Securities Sold Short(2) | $ | (14,048,847 | ) | $ | — | $ | — | $ | (14,048,847 | ) | ||||||
|
|
|
|
|
|
|
| |||||||||
Written Options | $ | (727,489 | ) | $ | (120,033 | ) | $ | — | $ | (847,522 | ) | |||||
|
|
|
|
|
|
|
| |||||||||
Total Liabilities | $ | (14,776,336 | ) | $ | (120,033 | ) | $ | — | $ | (14,896,369 | ) | |||||
|
|
|
|
|
|
|
| |||||||||
| ||||||||||||||||
| (1) | See the Schedules of Investments for industry classifications. |
| (2) | See the Schedule of Securities Sold Short for industry classifications. |
The Snow Capital Small Cap Value Fund did not hold derivative instruments during the period presented.
The Snow Capital Long/Short Opportunity Fund used put and call options during the period presented. The Fund may use certain options and futures contracts and options on futures contracts (collectively, “Derivative Instruments”) as a substitute for a comparable market position in the underlying security, to attempt to hedge or limit the exposure of the Fund’s position, to create a synthetic money market position, for certain tax-related purposes and to effect closing transactions.
57
Options and futures prices can diverge from the prices of their underlying instruments. Options and futures prices are affected by such factors as current and anticipated short-term interest rates, changes in volatility of the underlying instrument and the time remaining until expiration of the contract, which may not affect security prices the same way. Imperfect or no correlation also may result from differing levels of demand in the options and futures markets and the securities markets, from structural differences in how options and futures and securities are traded and from imposition of daily price fluctuation limits or trading halts.
Snow Capital Long/Short Opportunity Fund
The fair value of derivative instruments as reported within the Statement of Assets and Liabilities as of August 31, 2020:
| Asset Derivatives | Liability Derivatives | |||||||||||||||
| Derivatives not accounted for as hedging instruments | Statement of Assets & Liabilities Location | Value | Statement of Assets & Liabilities Location | Value | ||||||||||||
Equity Contracts—Options | | Investments, at value | | $ | 107,800 | | Options written, at value | | (847,522 | ) | ||||||
|
|
|
| |||||||||||||
Total | $ | 107,800 | $ | (847,522 | ) | |||||||||||
|
|
|
| |||||||||||||
|
|
|
| |||||||||||||
The effect of derivative instruments on the income for the six months ended August 31, 2020 was as follows:
| Amount of Realized Gain or (Loss) on Derivatives Recognized in Income | ||||||||||||
| Derivatives not accounted for as hedging instruments | Purchased Options | Written Options | Total | |||||||||
Equity Contracts | $ | 323,765 | $ | 785,207 | $ | 1,108,972 | ||||||
|
|
|
|
|
| |||||||
Total | $ | 323,765 | $ | 785,207 | $ | 1,108,972 | ||||||
|
|
|
|
|
| |||||||
|
|
|
|
|
| |||||||
58
| Change in Unrealized Appreciation or (Depreciation) on Derivatives Recognized in Income | ||||||||||||
| Derivatives not accounted for as hedging instruments | Purchased Options | Written Options | Total | |||||||||
Equity Contracts | $ | (353,226 | ) | $ | 353,619 | $ | 393 | |||||
|
|
|
|
|
| |||||||
Total | $ | (353,226 | ) | $ | 353,619 | $ | 393 | |||||
|
|
|
|
|
| |||||||
|
|
|
|
|
| |||||||
The average monthly notional amount outstanding for purchased and written options during the six months ended August 31, 2020 were $2,710,775 and $(17,957,790), respectively.
The Fund is not subject to any Master Netting Arrangements, therefore the Fund did not offset any assets or liabilities.
| (b) | Options |
The Snow Capital Long/Short Opportunity Fund may purchase and write call or put options on securities and indices and enter into related closing transactions. As a holder of a call option, the Fund has the right, but not the obligation, to purchase a security at the exercise price during the exercise period. As the writer of a call option, the Fund has the obligation to sell the security at the exercise price during the exercise period. As a holder of a put option, the Fund has the right, but not the obligation, to sell a security at the exercise price during the exercise period. As the writer of a put option, the Fund has the obligation to buy the underlying security at the exercise price during the exercise period.
The premium that the Fund pays when purchasing an option or receives when writing an option will reflect, among other things, the relationship of the exercise price to the market price of the security, the relationship of the exercise price to the volatility of the security, the length of the option period, current interest rates and supply and demand factors. The premium is the market value of an option at the time the contract trade is executed.
A purchaser (holder) of a put option pays a non-refundable premium to the seller (writer) of a put option to obtain the right to sell a specified amount of a security at a fixed price (the exercise price) during a specified period (exercise period). Conversely, the seller (writer) of a put option, upon payment by the holder of the premium, has the obligation to buy the security from the holder of the put option at the exercise price during the exercise period.
Exchange traded options are valued at the composite price, using the National Best Bid and Offer quotes (“NBBO”). NBBO consists of the highest bid price and lowest ask price across any of the exchanges on which
59
an option is quoted, thus providing a view across the entire U.S. options marketplace. Specifically, composite pricing looks at the last trades on the exchanges where the options are traded. If there are no trades for the option on a given business day, composite option pricing calculates the mean of the highest bid price and lowest ask price across the exchanges where the option is traded.
| (c) | Federal Income Taxes |
Each Fund complies with the requirements of Subchapter M of the Internal Revenue Code of 1986, as amended (the “Code”), necessary to qualify as a regulated investment company and makes the requisite distributions of income and capital gains to its shareholders sufficient to relieve it from all or substantially all federal income taxes. Therefore, no federal income tax provision has been provided.
| (d) | Distributions to Shareholders |
The Funds will distribute any net investment income and any net realized long- or short-term capital gains at least annually. Distributions from net realized gains for book purposes may include short-term capital gains. All short-term capital gains are included in ordinary income for tax purposes. Distributions to shareholders are recorded on the ex-dividend date. The Funds may also pay a special distribution at the end of the calendar year to comply with federal tax requirements.
The amount of the dividends from net investment income and distributions from net realized gains are determined in accordance with federal income tax regulations, which may differ from GAAP. The differences are either temporary or permanent in nature. To the extent these differences are permanent in nature, such amounts are reclassified within the composition of net assets based on their federal tax-basis treatment.
| (e) | Use of Estimates |
The preparation of financial statements in conformity with GAAP requires management to make estimates and assumptions that affect the reported amounts of assets and liabilities and disclosure of contingent assets and liabilities at the date of the financial statements and the reported amounts of revenues and expenses during the reporting period. Actual results could differ from those estimates.
| (f) | Share Valuation |
The NAV per share of each Fund is calculated by dividing the sum of the value of the securities held by the Fund, plus cash or other assets, minus all liabilities (including estimated accrued expenses) by the total number of shares outstanding for the Fund, rounded to the nearest cent.
60
The Funds’ shares will not be priced on the days on which the New York Stock Exchange (“NYSE”) is closed for trading. The Funds charge a 0.50% redemption fee on shares held thirty days or less. These fees are deducted from the redemption proceeds otherwise payable to the shareholder. The Funds will retain the fee charged as an increase in paid-in capital and such fees become part of the Funds’ daily NAV calculation.
Redemption fees were charged by the Funds as follows:
| Six Months Ended August 31, 2020 | Year Ended February 28, 2020 | |||||||
Snow Capital Small Cap Value Fund | $ | 1 | $ | 105 | ||||
Snow Capital Long/Short Opportunity Fund | $ | — | $ | 178 | ||||
| (g) | Expenses |
Expenses associated with a specific fund in the Trust are charged to that fund. Common expenses are typically allocated evenly between the funds of the Trust or by other equitable means. Expenses directly attributable to a class of shares, which presently only include 12b-l distribution and service fees, are recorded to the specific class.
| (h) | Other |
Investment transactions are recorded on the trade date. The Funds determine the gain or loss from investment transactions on the identified cost basis by comparing the original cost of the security lot sold with the net sale proceeds. Dividend income is recognized on the ex-dividend date and interest income is recognized on an accrual basis.
| (3) | Federal Tax Matters |
The tax character of distributions paid were as follows:
|
| Year Ended February 29, 2020 | Year Ended February 28, 2019 | ||||||
Snow Capital Small Cap Value Fund | ||||||||
Ordinary Income | $ | — | $ | — | ||||
Long Term Capital Gain | $ | — | $ | — | ||||
Snow Capital Long/Short Opportunity Fund | ||||||||
Ordinary Income | $ | 2,031,014 | $ | 2,464,845 | ||||
Long Term Capital Gain | $ | — | $ | — | ||||
61
As of February 29, 2020, the components of accumulated earnings on a tax basis were as follows:
|
| Snow Capital Small Cap Value Fund | Snow Capital Long/Short Opportunity Fund | ||||||
Cost basis of investment for Federal income tax purposes | $ | 23,297,742 | $ | 86,292,675 | ||||
|
|
|
| |||||
Gross tax unrealized appreciation | 962,977 | 10,443,136 | ||||||
Gross tax unrealized depreciation | (3,828,446 | ) | (10,210,029 | ) | ||||
|
|
|
| |||||
Net tax unrealized appreciation (depreciation) | (2,865,469 | ) | 233,107 | |||||
|
|
|
| |||||
Undistributed ordinary income | — | 1,352,961 | ||||||
Undistributed long-term capital gain | — | — | ||||||
|
|
|
| |||||
Total distributable earnings | — | 1,352,961 | ||||||
|
|
|
| |||||
Other accumulated losses | (3,859,463 | ) | (1,336,828 | ) | ||||
|
|
|
| |||||
Total accumulated earnings (losses) | $ | (6,724,932 | ) | $ | 249,240 | |||
|
|
|
| |||||
The difference between book basis and tax basis of investments is attributable to deferral of losses on wash sales. The cost basis of investment for Federal income tax purposes for Snow Capital Long/Short Opportunity Fund includes a reduction of $19,840,250 and $798,200 for short securities and written options, respectively.
At February 29, 2020, the Snow Capital Small Cap Value Fund deferred, on a tax basis, late-year ordinary losses of $17,859.
At February 29, 2020, the following Funds had capital losses remaining, which will be carried forward indefinitely to offset future realized capital gains. To the extent a Fund realizes future net capital gains, taxable distributions to its shareholders will be first offset by any unused capital loss carryovers from the year ended February 29, 2020.
| Short-term | Long-term | |||||||
Snow Capital Small Cap Value Fund | $ | — | $ | 3,841,603 | ||||
Snow Capital Long/Short Opportunity Fund | $ | 1,336,829 | $ | — | ||||
The Funds had no material uncertain tax positions and have not recorded a liability for unrecognized tax benefits as of February 29, 2020. Also, the Funds have not recognized interest and penalties related to uncertain tax benefits in fiscal 2020. At February 29, 2020, fiscal years 2017 through 2020 for both Funds remain open to examination in the Funds’ major tax jurisdictions.
62
| (4) | Investment Adviser |
The Trust has entered into an Investment Advisory Agreement (the “Agreement”) with the Adviser to furnish investment advisory services to the Funds. Under the terms of the Agreement, the Trust, on behalf of the Funds, compensates the Adviser for its management services at the following annual rates based on each Fund’s average daily net assets.
| Rate | ||||
Snow Capital Small Cap Value Fund | 0.95 | % | ||
Snow Capital Long/Short Opportunity Fund | 0.80 | % | ||
The Adviser has agreed to waive its management fees and/or reimburse a Fund’s other expenses at least through the expiration dates listed below, to the extent necessary to ensure that each Fund’s total annual operating expenses (exclusive of front-end or contingent deferred sales loads, Rule 12b-1 plan fees, shareholder servicing plan fees, taxes, leverage, interest, brokerage commissions and other transactional expenses, acquired fund fees and expenses, dividends or interest expense on short positions, expenses incurred in connection with any merger or reorganization or extraordinary expenses such as litigation) do not exceed the Expense Caps as follows:
Expense | Expiration Date | |||||
Snow Capital Small Cap Value Fund | 1.25 | % | June 28, 2022 | |||
Snow Capital Long/Short Opportunity Fund | 1.30 | % | June 28, 2022 | |||
Any such waiver or reimbursement is subject to later adjustment to allow the Adviser to recoup amounts waived or reimbursed to the extent actual fees and expenses for a fiscal period do not exceed the lesser of: (1) the Expense Cap in place at the time of the waiver or reimbursement or (2) the Expense Cap in place at the time of recoupment; provided, however, that the Adviser shall only be entitled to recoup such amounts over the following three year period from the date of the waiver or reimbursement. The following table details the remaining waived or reimbursed expenses subject to potential recovery expiring:
| Snow Capital Small Cap Value Fund | Snow Capital Long/Short Opportunity Fund | |||||||
February 28, 2022 | $ | 235,088 | $ | — | ||||
February 29, 2023 | $ | 251,464 | $ | — | ||||
August 31, 2023 | $ | 146,380 | $ | 17,466 | ||||
63
| (5) | Distribution and Shareholder Servicing Plan |
The Trust has adopted a plan pursuant to Rule 12b-1 under the 1940 Act (the “12b-1 Plan”), on behalf of the Funds, which authorizes it to pay Quasar Distributors, LLC (the “Distributor”) a distribution fee of 0.25% and 0.75% of each Fund’s average daily net assets of Class A and Class C shares, respectively, for services to prospective Fund shareholders and the distribution of Fund shares, and 0.25% of each Fund’s average daily net assets of Class C shares for shareholder servicing, as applicable. During the six months ended August 31, 2020, the Funds accrued expenses pursuant to the 12b-1 Plan as follows:
| 12b-1 Fees | Shareholder Servicing Fees | |||||||
Snow Capital Small Cap Value Fund | ||||||||
Class A | $ | 6,316 | N/A | |||||
Class C | $ | 7,033 | $ | 2,344 | ||||
Snow Capital Long/Short Opportunity Fund | ||||||||
Class A | $ | 47,528 | N/A | |||||
Class C | $ | 27,869 | $ | 9,290 | ||||
| (6) | Related Party Transactions |
U.S. Bancorp Fund Services, LLC (doing business as U.S. Bank Global Fund Services) (“Fund Services”) acts as the Funds’ Administrator and Fund Accountant under an Administration Agreement. The Administrator prepares various federal and state regulatory filings, reports and returns for the Funds; prepares reports and materials to be supplied to the Trustees; monitors the activities of the Funds’ custodian, transfer agent and accountants; coordinates the preparation and payment of the Funds’ expenses and reviews the Funds’ expense accruals. Fund Services also serves as the transfer agent to the Funds. U.S. Bank, N.A. (“US Bank”), an affiliate of Fund Services, serves as each Fund’s custodian. Fees incurred for the six months ended August 31, 2020, and owed as of August 31, 2020, are as follows:
| Administration and Accounting | Incurred | Owed | ||||||
Snow Capital Small Cap Value Fund | $ | 62,118 | $ | 11,790 | ||||
Snow Capital Long/Short Opportunity Fund | $ | 83,416 | $ | 26,903 | ||||
| Transfer Agency(1) | Incurred | Owed | ||||||
Snow Capital Small Cap Value Fund | $ | 28,312 | $ | 10,423 | ||||
Snow Capital Long/Short Opportunity Fund | $ | 41,696 | $ | 15,437 | ||||
| (1) | This amount does not include sub-transfer agency fees, and therefore it does not agree to the amount on the Statement of Operations for the Snow Capital Small Cap Value and Snow Capital Long/Short Opportunity Funds. |
64
| Custody | Incurred | Owed | ||||||
Snow Capital Small Cap Value Fund | $ | 4,719 | $ | 1,717 | ||||
Snow Capital Long/Short Opportunity Fund | $ | 7,425 | $ | 3,986 | ||||
The Snow Capital Small Cap Value and Snow Capital Long/Short Opportunity Funds each have a line of credit with US Bank (see Note 9).
Certain officers of the Funds are also employees of Fund Services. A Trustee of the Trust is affiliated with Fund Services and US Bank.
The Trust’s Chief Compliance Officer is also an employee of Fund Services. Each Fund’s allocation of the Trust’s Chief Compliance Officer fee incurred for the six months ended August 31, 2020, and owed as of August 31, 2020, is as follows:
| Incurred | Owed | |||||||
Snow Capital Small Cap Value Fund | $ | 6,256 | $ | 2,091 | ||||
Snow Capital Long/Short Opportunity Fund | $ | 6,256 | $ | 2,087 | ||||
| (7) | Capital Share Transactions |
Transactions in shares of the Funds were as follows:
Snow Capital Small Cap Value Fund – Class A Shares | Six Months Ended August 31, 2020 | Year Ended February 29, 2020 | ||||||
Shares sold | 23,186 | 19,451 | ||||||
Shares reinvested | — | — | ||||||
Shares redeemed | (193,636 | ) | (47,926 | ) | ||||
|
|
|
| |||||
Net decrease | (170,450 | ) | (28,475 | ) | ||||
|
|
|
| |||||
|
|
|
| |||||
Snow Capital Small Cap Value Fund – Class C Shares | Six Months Ended August 31, 2020 | Year Ended February 29, 2020 | ||||||
Shares sold | 305 | 4,192 | ||||||
Shares reinvested | — | — | ||||||
Shares redeemed | (53,576 | ) | (39,594 | ) | ||||
|
|
|
| |||||
Net decrease | (53,271 | ) | (35,402 | ) | ||||
|
|
|
| |||||
|
|
|
| |||||
65
Snow Capital Small Cap Value Fund – Institutional Class Shares | Six Months Ended August 31, 2020 | Year Ended February 29, 2020 | ||||||
Shares sold | 8,590 | 64,865 | ||||||
Shares reinvested | — | — | ||||||
Shares redeemed | (126,612 | ) | (240,713 | ) | ||||
|
|
|
| |||||
Net decrease | (118,022 | ) | (175,848 | ) | ||||
|
|
|
| |||||
|
|
|
| |||||
Snow Capital Long/Short Opportunity Fund Class A Shares | Six Months Ended August 31, 2020 | Year Ended February 29, 2020 | ||||||
Shares sold | 57,926 | 81,570 | ||||||
Shares reinvested | — | 6,286 | ||||||
Shares redeemed | (534,564 | ) | (521,148 | ) | ||||
|
|
|
| |||||
Net decrease | (476,638 | ) | (433,292 | ) | ||||
|
|
|
| |||||
|
|
|
| |||||
Snow Capital Long/Short Opportunity Fund Class C Shares | Six Months Ended August 31, 2020 | Year Ended February 29, 2020 | ||||||
Shares sold | 54 | 2,734 | ||||||
Shares reinvested | — | 1,722 | ||||||
Shares redeemed | (139,633 | ) | (282,871 | ) | ||||
|
|
|
| |||||
Net decrease | (139,579 | ) | (278,415 | ) | ||||
|
|
|
| |||||
|
|
|
| |||||
Snow Capital Long/Short Opportunity Fund Institutional Class Shares | Six Months Ended August 31, 2020 | Year Ended February 29, 2020 | ||||||
Shares sold | 10,631 | 71,019 | ||||||
Shares reinvested | — | 28,366 | ||||||
Shares redeemed | (242,869 | ) | (1,049,812 | ) | ||||
|
|
|
| |||||
Net decrease | (232,238 | ) | (950,427 | ) | ||||
|
|
|
| |||||
|
|
|
| |||||
66
| (8) | Investment Transactions |
Purchases and sales of investment securities (excluding short-term instruments) for the six months ended August 31, 2020 are summarized below.
| Snow Capital Small Cap Value Fund | Snow Capital Long/Short Opportunity Fund | |||||||
Purchases: | ||||||||
U.S. Government | $ | — | $ | — | ||||
Other | $ | 5,584,450 | $ | 29,009,424 | ||||
Sales: | ||||||||
U.S. Government | $ | — | $ | — | ||||
Other | $ | 11,402,377 | $ | 46,085,255 | ||||
| (9) | Line of Credit |
At August 31, 2020, the Snow Capital Small Cap Value Fund and the Snow Capital Long/Short Opportunity Fund each had a line of credit with a maximum amount of borrowing for the lesser of $1,500,000 and $8,000,000, respectively, or 33% of unencumbered assets maturing August 7, 2021. These unsecured lines of credit are intended to provide short-term financing, if necessary, subject to certain restrictions, in connection with shareholder redemptions. The credit facility is with US Bank, the Funds’ custodian. Interest was accrued at the prime rate at the time of the loan (3.25%). There were no loans outstanding at period end. The following table provides information regarding the usage of the line of credit during the six months ended August 31, 2020.
| Days Utilized | Average Amount of Borrowing | Interest Expense* | Maximum Amount of Borrowing | Date of Maximum Borrowing | ||||||||||||||
Snow Capital Small Cap Value Fund | 96 | $ | 148,823 | $ | 1,304 | $ | 2,700,000 | 3/24/2020 | ||||||||||
| * | Interest expense is reported on the Statement of Operations. |
| (10) | Recent Market Events |
U.S. and international markets have experienced significant periods of volatility in recent months and years due to a number of economic, political and global macro factors including the impact of the coronavirus as a global pandemic and related public health issues, business interruptions, growth concerns in the U.S.
67
and overseas, uncertainties regarding interest rates, trade tensions and the threat of tariffs imposed by the U.S. and other countries. In particular, the spread of COVID-19 worldwide has resulted in disruptions to supply chains and customer activity, stress on the global healthcare system, temporary and permanent layoffs in the private sector, and rising unemployment claims, changed travel and social behaviour, reduced consumer spending, quarantines, cancellations, market declines, the closing of borders, restrictions on travel and widespread concern and uncertainty, all of which may lead to a substantial economic downturn or recession in the u.s. and global economies. The recovery from the effects of COVID-19 is uncertain and may last for an extended period of time. These developments as well as other events, such as the upcoming U.S. presidential election, could result in further market volatility and negatively affect financial asset prices, the liquidity of certain securities and the normal operations of securities exchanges and other markets. As a result, the risk environment remains elevated. The Funds’ investment adviser will monitor developments and seek to manage each Fund in a manner consistent with achieving the Fund’s investment objective, but there can be no assurance that it will be successful in doing so.
| (11) | Subsequent Events |
Management has evaluated subsequent events after August 31, 2020 and through the date the financial statements were issued and determined there were no subsequent events that would require recognition or disclosure in financial statements.
68
Basis for Trustees’ Approval of Investment Advisory Agreement
The Board of Trustees (the “Trustees”) of Trust for Professional Managers (the “Trust”) met on August 18, 2020 to consider the renewal of the Investment Advisory Agreement (the “Agreement”) between the Trust, on behalf of the Snow Capital Small Cap Value Fund (the “Small Cap Value Fund”) and the Snow Long/Short Opportunity Fund (the “Long/Short Opportunity Fund”) (each, a “Fund,” and together, the “Funds”), each a series of the Trust, and Snow Capital Management L.P. the Funds’ investment adviser (the “Adviser”). The Trustees also met at a prior meeting held on June 25, 2020 (the “June 25, 2020 Meeting”) to review materials related to the renewal of the Agreement. Prior to these meetings, the Trustees requested and received materials to assist them in considering the renewal of the Agreement. The materials provided contained information with respect to the factors enumerated below, including a copy of the Agreement, a memorandum prepared by the Trust’s outside legal counsel discussing in detail the Trustees’ fiduciary obligations and the factors they should assess in considering the renewal of the Agreement, detailed comparative information relating to the Funds’ performance, as well as the management fees and other expenses of the Funds, due diligence materials relating to the Adviser (including a due diligence questionnaire completed on behalf of the Funds by the Adviser, the Adviser’s Form ADV, select financial statements of the Adviser, bibliographic information of the Adviser’s key management and compliance personnel, comparative fee information for the Funds and, with respect to be Small Cap Value Fund, the Adviser’s other separately-managed accounts and a summary detailing key provisions of the Adviser’s written compliance program, including its code of ethics) and other pertinent information. The Trustees also received information periodically throughout the year that was relevant to the Agreement renewal process, including performance, management fee and other expense information. Based on their evaluation of the information provided by the Adviser, in conjunction with the Funds’ other service providers, the Trustees, by a unanimous vote (including a separate vote of the Trustees who are not “interested persons,” as that term is defined in the Investment Company Act of 1940, as amended (the “Independent Trustees”)), approved the continuation of the Agreement for an additional one-year term ending August 31, 2020.
DISCUSSION OF FACTORS CONSIDERED
In considering the renewal of the Agreement and reaching their conclusions, the Trustees reviewed and analyzed various factors that they determined were relevant, including the factors enumerated below.
| 1. | NATURE, EXTENT AND QUALITY OF SERVICES PROVIDED TO THE FUNDS |
The Trustees considered the nature, extent and quality of services provided by the Adviser to the Funds and the amount of time devoted by the Adviser’s staff to the
69
Basis for Trustees’ Approval of Investment Advisory Agreement (Continued)
Funds’ operations. The Trustees considered the Adviser’s specific responsibilities in all aspects of day-to-day management of the Funds, as well as the qualifications, experience and responsibilities of Anne S. Wickland, who serves as a portfolio manager for each of the Funds, Richard A. Snow and Jessica W. Bemer, who each serve as a portfolio manager for the Long/Short Opportunity Fund, and Joshua R. Schachter, who serves as portfolio manager for the Small Cap Value Fund, as well as other key personnel at the Adviser involved in the day-to-day activities of the Funds. The Trustees reviewed information provided by the Adviser in a due diligence summary, including the structure of the Adviser’s compliance program and discussed the Adviser’s marketing activities and its continuing commitment to the Funds. The Trustees noted that during the course of the prior year they had met with the Adviser to discuss various performance, marketing and compliance issues. The Trustees also noted any services that extended beyond portfolio management, and they considered the brokerage practices of the Adviser. The Trustees discussed the Adviser’s handling of compliance matters, including the reports of the Trust’s chief compliance officer to the Trustees on the effectiveness of the Adviser’s compliance program. The Trustees also considered the Adviser’s overall financial condition, as well as the implementation and operational effectiveness of the Adviser’s business continuity plan in response to the novel coronavirus (COVID-19) pandemic and challenges to day-to-day operations in a predominately work-from-home environment. The Trustees concluded that the Adviser had sufficient quality and depth of personnel, resources, investment methods and compliance policies and procedures essential to performing its duties under the Agreement and that the nature, overall quality and extent of the management services to be provided to the Funds, as well as the Adviser’s compliance program, were satisfactory and reliable.
| 2. | INVESTMENT PERFORMANCE OF THE FUNDS AND THE ADVISER |
The Trustees discussed the performance of the Long/Short Opportunity Fund’s Institutional Class shares for the quarter, one-year, three-year, five-year, ten-year and since inception periods ended March 31, 2020. The Trustees also discussed the performance of the Institutional Class shares of the Small Cap Value Fund for the quarter, one-year, three-year and five-year periods ended March 31, 2020. In assessing the quality of the portfolio management services delivered by the Adviser, the Trustees compared the short-term and longer-term performance of the Institutional Class shares of the Funds on both an absolute basis and in comparison to benchmark indices (the Russell 3000® Value Total Return Index, the S&P 500® Index and the 70% Russell 3000® Value Total Return/30% ICE BofA Merrill Lynch 3-Month U.S. Treasury Bill Blend Index for the Long/Short Opportunity Fund, and the Russell 2000® Value Index for the Small Cap Value Fund), and in comparison to a
70
Basis for Trustees’ Approval of Investment Advisory Agreement (Continued)
peer group of funds in each Fund’s current Morningstar category as constructed by data presented by Morningstar Direct (a peer group of U.S. open-end long-short equity funds for the Long/Short Opportunity Fund, and a peer group of U.S. open-end small value funds for the Small Cap Value Fund) (each, a “Morningstar Peer Group”). The Trustees also reviewed information on the historical performance of other separately-managed accounts that were similar to the Small Cap Value Fund in terms of investment strategies. The Trustees noted that the Adviser did not manage any other accounts with the same or similar investment strategies as the Long/Short Opportunity Fund.
The Trustees noted the Long/Short Opportunity Fund’s performance for Institutional Class shares for each of the quarter, one-year, three-year, five-year and ten-year periods ended March 31, 2020 was below the Morningstar Peer Group median. The Trustees further noted that for the same time periods the Institutional Class shares of the Long/Short Opportunity Fund underperformed the 70% Russell 3000® Value Total Return/30% ICE BofA Merrill Lynch 3-Month U.S. Treasury Bill Blend Index and the S&P 500® Index. The Trustees noted that the Institutional Class shares of the Long/Short Opportunity Fund outperformed the Russell 3000® Value Total Return Index for the quarter and one-year period ended March 31, 2020, and underperformed the Index for the three-year, five-year, ten-year and since inception periods ended March 31, 2020.
The Trustees noted that the performance of the Small Cap Value Fund’s Institutional Class shares for the quarter, one-year, three-year and five-year periods ended March 31, 2020 was below the Morningstar Peer Group median. The Trustees further noted that for the same time periods the Small Cap Value Fund’s Institutional Class shares underperformed the Russell 2000® Value Index. The Trustees also observed that the Fund’s performance was generally in-line with the performance of the comparable separately-managed account composite for all periods reviewed.
After considering all of the information, the Trustees concluded that the performance obtained by the Adviser for each Fund while lagging over certain periods was satisfactory under current market conditions. Although past performance is not a guarantee or indication of future results, the Trustees determined that, despite comparative underperformance for certain periods reviewed, each Fund and its shareholders could benefit from the Adviser’s continued management.
71
Basis for Trustees’ Approval of Investment Advisory Agreement (Continued)
| 3. | COSTS OF SERVICES PROVIDED AND PROFITS REALIZED BY THE ADVISER |
The Trustees considered the cost of services and the structure of the Adviser’s fees, including a review of the expense analyses and other pertinent material with respect to the Funds. The Trustees reviewed the related statistical information and other materials provided, including the comparative expenses, expense components and peer group selections. The Trustees considered the cost structure of each Fund relative to its peer group(s), and the Adviser’s separately-managed accounts (with respect to the Small Cap Value Fund), as well as the fee waivers and expense reimbursements of the Adviser.
The Trustees also considered the overall profitability of the Adviser, reviewing the Adviser’s financial information and noted that the Adviser was subsidizing each Fund’s operations. The Trustees also examined the level of profits realized by the Adviser from the fees payable under the Agreement, as well as the Funds’ brokerage practices and use of soft dollars by the Adviser. These considerations were based on materials requested by the Trustees and the Funds’ administrator specifically for the June 25, 2020 Meeting and the August 18, 2020 meeting at which the Agreement was formally considered, as well as the reports prepared by the Adviser over the course of the year.
The Trustees noted that the Long/Short Opportunity Fund’s contractual management fee of 0.80% was below the Morningstar Peer Group average of 1.14%. The Trustees observed that the Long/Short Opportunity Fund’s total expense ratio of 1.59% for Institutional Class shares was below the Morningstar Peer Group average (which excludes Rule 12b-1 fees) of 1.90%.
The Trustees noted that the Small Cap Value Fund’s contractual management fee of 0.95% was above the Morningstar Peer Group average of 0.83%. The Trustees observed that the Small Cap Value Fund’s total expense ratio (net of fee waivers and expense reimbursements) of 1.25% for Institutional Class shares was above the Morningstar Peer Group average (which excludes Rule 12b-1 fees) of 1.00%. The Trustees also compared the fees paid by the Small Cap Value Fund to the fees paid by separately managed accounts that were similar to the Fund in terms of their underlying investment strategies.
The Trustees concluded that the Funds’ expenses and the management fees paid to the Adviser were fair and reasonable in light of the comparative performance, expense and management fee information. The Trustees further concluded, based on a
72
Basis for Trustees’ Approval of Investment Advisory Agreement (Continued)
profitability analysis prepared by the Adviser, that the Adviser’s profit from sponsoring the Long/Short Opportunity Fund had not been, and currently was not, excessive and that while the Small Cap Value Fund was not yet profitable to the Adviser, the Adviser maintained adequate profit levels to support its services to the Funds from the revenues of its overall investment advisory business, despite its subsidies to support the Small Cap Value Fund’s operations.
| 4. | EXTENT OF ECONOMIES OF SCALE AS THE FUNDS GROW |
The Trustees compared the Funds’ expenses relative to their respective peer groups and discussed realized and potential economies of scale. The Trustees also reviewed the structure of the Funds’ management fee and whether the Funds were large enough to generate economies of scale for shareholders or whether economies of scale would be expected to be realized as Fund assets grow (and if so, how those economies of scale were being or would be shared with shareholders). The Trustees noted that the Funds’ management fee structures did not contain any breakpoint reductions as the Funds’ assets grow in size, but the feasibility of incorporating breakpoints would continue to be reviewed on a regular basis. With respect to the Adviser’s fee structure and any applicable expense waivers, the Trustees concluded that the current fee structure was reasonable and reflected a sharing of economies of scale between the Adviser and the Funds at the Funds’ current asset levels.
| 5. | BENEFITS DERIVED FROM THE RELATIONSHIP WITH THE FUNDS |
The Trustees considered the direct and indirect benefits that could be realized by the Adviser from its association with the Funds. The Trustees examined the brokerage practices of the Adviser with respect to the Funds. The Trustees concluded that the benefits the Adviser may receive, such as greater name recognition or increased ability to obtain research or brokerage services or attract additional investor assets, appear to be reasonable, and in many cases may benefit the Funds.
CONCLUSIONS
The Trustees considered all of the foregoing factors. In considering the renewal of the Agreement, the Trustees did not identify any one factor as all-important, but rather considered these factors collectively in light of each Fund’s surrounding circumstances. Based on this review, the Trustees, including a majority of the Independent Trustees, approved the continuation of the Agreement for an additional term ending August 31, 2021 as being in the best interests of each Fund and its shareholders.
73
Notice of Privacy Policy & Practices
We collect non-public personal information about you from the following sources:
| • | information we receive about you on applications or other forms; |
| • | information you give us orally; and |
| • | information about your transactions with us or others. |
We do not disclose any non-public personal information about our shareholders or former shareholders without the shareholder’s authorization, except as permitted by law or in response to inquiries from governmental authorities. We may share information with affiliated parties and unaffiliated third parties with whom we have contracts for servicing the Funds. We will provide unaffiliated third parties with only the information necessary to carry out their assigned responsibility. All shareholder records will be disposed of in accordance with applicable law. We maintain physical, electronic and procedural safeguards to protect your non-public personal information and require third parties to treat your non-public personal information with the same high degree of confidentiality.
In the event that you hold shares of the Funds through a financial intermediary, including, but not limited to, a broker-dealer, bank or trust company, the privacy policy of your financial intermediary would govern how your non-public personal information would be shared with unaffiliated third parties.
74
Snow Capital Family of Funds
(Unaudited)
Tax Information
For the fiscal year ended February 29, 2020, certain dividends paid by the Funds may be subject to a maximum tax rate of 20%, as provided for by the Jobs and Growth Tax Relief Reconciliation Act of 2003. The percentage of dividends declared from ordinary income designated as qualified dividend income was as follows:
Small Cap Value Fund | 0.00% | |||
Long/Short Opportunity Fund | 100.00% |
For corporate shareholders, the percent of ordinary income distributions qualifying for the corporate dividends received deduction for the fiscal year ended February 29, 2020 was as follows:
Small Cap Value Fund | 0.00% | |||
Long/Short Opportunity Fund | 91.37% |
For the year ended February 29, 2020, taxable ordinary income distributions are designated as short-term capital gain distributions under the Code Section 871(k)(2)(c) for the Funds as follows:
Small Cap Value Fund | 0.00% | |||
Long/Short Opportunity Fund | 0.00% |
Indemnification
Under the Trust’s organizational documents, its officers and Trustees are indemnified against certain liabilities arising out of the performance of their duties to the Funds. In addition, in the normal course of business, the Funds enter into contracts that provide general indemnifications to other parties. The Funds’ maximum exposure under these arrangements is unknown, as this would involve future claims that may be made against the Funds that have not yet occurred. However, the Funds have not had prior claims or losses pursuant to these contracts and expect the risk of loss to be remote.
Information about Trustees
The business and affairs of the Trust are managed under the direction of the Trust’s Board of Trustees. Information pertaining to the Trustees of the Trust is set forth below. The Funds’ Statement of Additional Information includes additional information about the Trustees and is available, without charge, upon request by calling 1-877-SNOWFND (877-766-9363).
75
Snow Capital Family of Funds
Additional Information (Continued)
(Unaudited)
Independent Trustees
Name, Address and | Position(s) | Term of | Number of | Principal | Other | |||||
Michael D. Akers, Ph.D. 615 E. Michigan St. Milwaukee, WI 53202 Year of Birth: 1955 | Trustee | Indefinite Term; Since August 22, 2001 | 21 | Professor Emeritus, Department of Accounting (June 2019-present), Professor, Department of Accounting (2004-2019), Chair, Department of Accounting (2004-2017), Marquette University. | Independent Trustee, USA MUTUALS (an open-end investment company with two portfolios). | |||||
Gary A. Drska 615 E. Michigan St. Milwaukee, WI 53202 Year of Birth: 1956 | Trustee | Indefinite Term; Since August 22, 2001 | 21 | Pilot, Frontier/Midwest Airlines, Inc. (airline company) (1986-present). | Independent Trustee, USA MUTUALS (an open-end investment company with two portfolios). | |||||
Jonas B. Siegel 615 E. Michigan St. Milwaukee, WI 53202 Year of Birth: 1943 | Trustee | Indefinite Term; Since October 23, 2009 | 21 | Retired (2011-present); Managing Director, Chief Administrative Officer (“CAO”) and Chief Compliance Officer (“CCO”), Granite Capital International Group, L.P. (an investment management firm) (1994-2011). | Independent Trustee, Gottex Trust (an open-end investment company) (2010-2016); Independent Manager, Ramins IDF fund complex (two closed-end investment companies) (2010-2015); Independent Trustee, Gottex Multi-Asset Endorsement fund complex (three closed-end investment companies) (2010-2015). | |||||
76
Snow Capital Family of Funds
Additional Information (Continued)
(Unaudited)
Interested Trustee and Officers
Name, Address and | Position(s) | Term of | Number of | Principal | Other | |||||
Joseph C. Neuberger* 615 E. Michigan St. Milwaukee, WI 53202 Year of Birth: 1962 | Chairperson and Trustee | Indefinite Term; Since August 22, 2001 | 21 | President (2017-present), Chief Operating Officer (2016-2020), Executive Vice President (1994-2017), U.S. Bancorp Fund Services, LLC. | Trustee, Buffalo Funds (an open-end investment company) (2003-2017), Trustee, USA MUTUALS (an open-end investment company) (2001-2018). | |||||
John P. Buckel 615 E. Michigan St. Milwaukee, WI 53202 Year of Birth: 1957 | President and Principal Executive Officer | Indefinite Term; Since January 24, 2013 | N/A | Vice President, U.S. Bancorp Fund Services, LLC (2004-present). | N/A | |||||
Jennifer A. Lima 615 E. Michigan St. Milwaukee, WI 53202 Year of Birth: 1974 | Vice President, Treasurer and Principal Financial and Accounting Officer | Indefinite Term; Since January 24, 2013 | N/A | Vice President, U.S. Bancorp Fund Services, LLC (2002-present). | N/A | |||||
77
Snow Capital Family of Funds
Additional Information (Continued)
(Unaudited)
Name, Address and | Position(s) | Term of | Number of | Principal | Other | |||||
Elizabeth B. Scalf 615 E. Michigan St. Milwaukee, WI 53202 Year of Birth: 1985 | Chief Compliance Officer, Vice President and Anti-Money Laundering Officer | Indefinite Term; Since July 1, 2017 | N/A | Senior Vice President, U.S. Bancorp Fund Services, LLC (February 2017-present); Vice President and Assistant CCO, Heartland Advisors, Inc. (December 2016-January 2017); Vice President and CCO, Heartland Group, Inc. (May 2016-November 2016); Vice President, CCO and Senior Legal Counsel (May 2016-November 2016), Assistant CCO and Senior Legal Counsel (January 2016-April 2016), Senior Legal and Compliance Counsel (2013-2015), Heartland Advisors, Inc. | N/A | |||||
Jay S. Fitton 615 E. Michigan St. Milwaukee, WI 53202 Year of Birth: 1970 | Secretary | Indefinite Term; Since July 22, 2019 | N/A | Assistant Vice President, U.S. Bancorp Fund Services, LLC (2019-present); Partner, Practus, LLP (2018-2019); Counsel, Drinker Biddle & Reath LLP (2016-2018); Counsel, Huntington Bancshares Inc. (2011-2015). | N/A | |||||
Kelly A. Burns 615 E. Michigan St. Milwaukee, WI 53202 Year of Birth: 1987 | Assistant Treasurer | Indefinite Term; Since April 23, 2015 | N/A | Assistant Vice President, U.S. Bancorp Fund Services, LLC (2011-present). | N/A | |||||
Melissa Aguinaga 615 E. Michigan St. Milwaukee, WI 53202 Year of Birth: 1987 | Assistant Treasurer | Indefinite Term; Since July 1, 2015 | N/A | Assistant Vice President, U.S. Bancorp Fund Services, LLC (2010-present). | N/A | |||||
Laura A. Carroll 615 E. Michigan St. Milwaukee, WI 53202 Year of Birth: 1985 | Assistant Treasurer | Indefinite Term; Since August 20, 2018 | N/A | Assistant Vice President, U.S. Bancorp Fund Services, LLC (2007-present). | N/A | |||||
| * | Mr. Neuberger is deemed to be an “interested person” of the Trust as defined by the 1940 Act due to his position and material business relationship with the Trust. |
78
A NOTE ON FORWARD LOOKING STATEMENTS
The matters discussed in this report may constitute forward-looking statements made pursuant to the safe-harbor provisions of the Securities Litigation Reform Act of 1995. These include any Adviser or portfolio manager predictions, assessments, analyses or outlooks for individual securities, industries, market sectors and/or markets. These statements involve risks and uncertainties. In addition to the general risks described for the Funds in the current Prospectus, other factors bearing on this report include the accuracy of the Adviser’s or portfolio managers’ forecasts and predictions, and the appropriateness of the investment programs designed by the Adviser or portfolio managers to implement their strategies efficiently and effectively. Any one or more of these factors, as well as other risks affecting the securities markets and investment instruments generally, could cause the actual results of the Funds to differ materially as compared to benchmarks associated with the Funds.
ADDITIONAL INFORMATION
The Funds have adopted proxy voting policies and procedures that delegate to the Adviser the authority to vote proxies. A description of the Funds’ proxy voting policies and procedures is available without charge, upon request, by calling the Funds toll free at 1-877-SNOWFND (877-766-9363). A description of these policies and procedures is also included in the Funds’ Statement of Additional Information, which is available on the SEC’s website at http://www.sec.gov.
The Funds’ proxy voting record during the most recent 12-month period ended June 30 is available without charge, upon request, by calling 1-877-SNOWFND (877-766-9363), or by accessing the SEC’s website at http://www.sec.gov.
The Funds file their complete schedule of portfolio holdings with the SEC for the first and third quarters of each fiscal year on Part F of Form N-PORT. Shareholders may view the Funds’ Form N-PORT filings on the SEC’s website at www.sec.gov.
HOUSEHOLDING
In an effort to decrease costs, the Funds intend to reduce the number of duplicate prospectuses and annual and semi-annual reports you receive by sending only one copy of each to those addresses shared by two or more accounts and to shareholders the Funds reasonably believe are from the same family or household. Once implemented, if you would like to discountinue householding for your accounts, please call toll-free at 1-877-SNOWFND (877-766-9363) to request individual copies of these documents. Once the Funds receive notice to stop householding, the Funds will begin sending individual copies 30 days after receiving your request. This policy does not apply to account statements.
SNOW CAPITAL FAMILY OF FUNDS
Investment Adviser
Snow Capital Management L.P.
1605 Carmody Court, Suite 300
Sewickley, Pennsylvania 15143
Legal Counsel
Godfrey & Kahn, S.C.
833 East Michigan Street, Suite 1800
Milwaukee, Wisconsin 53202
Independent Registered Public Accounting Firm
Deloitte & Touche LLP
111 South Wacker Drive
Chicago, Illinois 60606
Transfer Agent, Fund Accountant and Fund Administrator
U.S. Bancorp Fund Services, LLC
615 East Michigan Street
Milwaukee, Wisconsin 53202
Custodian
U.S. Bank, N.A.
Custody Operations
1555 North RiverCenter Drive, Suite 302
Milwaukee, Wisconsin 53212
Distributor
Quasar Distributors, LLC
111 East Kilbourn Ave., Suite 2200
Milwaukee, Wisconsin 53202
This report is intended for shareholders of the Funds and may not be used as sales literature unless preceded or accompanied by a current prospectus.
Item 2. Code of Ethics.
Not applicable for semi-annual reports.
Item 3. Audit Committee Financial Expert.
Not applicable for semi-annual reports.
Item 4. Principal Accountant Fees and Services.
Not applicable for semi-annual reports.
Item 5. Audit Committee of Listed Registrants.
Not applicable to registrants who are not listed issuers (as defined in Rule 10A-3 under the Securities Exchange Act of 1934).
Item 6. Investments.
| (a) | Schedule of Investments is included as part of the report to shareholders filed under Item 1 of this Form. |
| (b) | Not Applicable. |
Item 7. Disclosure of Proxy Voting Policies and Procedures for Closed-End Management Investment Companies.
Not applicable to open-end investment companies.
Item 8. Portfolio Managers of Closed-End Management Investment Companies.
Not applicable to open-end investment companies.
Item 9. Purchases of Equity Securities by Closed-End Management Investment Company and Affiliated Purchasers.
Not applicable to open-end investment companies.
Item 10. Submission of Matters to a Vote of Security Holders.
There have been no material changes to the procedures by which shareholders may recommend nominees to the registrant’s board of trustees.
Item 11. Controls and Procedures.
| (a) | The Registrant’s President and Treasurer have reviewed the Registrant’s disclosure controls and procedures (as defined in Rule 30a-3(c) under the Investment Company Act of 1940 (the “Act”)) as of a date within 90 days of the filing of this report, as required by Rule 30a-3(b) under the Act and Rules 13a-15(b) or 15d-15(b) under the Securities Exchange Act of 1934. Based on their review, such officers have concluded that the disclosure controls and procedures are effective in ensuring that information required to be disclosed in this report is appropriately recorded, processed, summarized and reported and made known to them by others within the Registrant and by the Registrant’s service provider. |
| (b) | There were no changes in the Registrant’s internal control over financial reporting (as defined in Rule 30a-3(d) under the Act) that occurred during the last fiscal half-year covered by this report that has materially affected, or is reasonably likely to materially affect, the Registrant’s internal control over financial reporting. |
Item 12. Disclosure of Securities Lending Activities for Closed-End Management Investment Companies
Not applicable to open-end investment companies.
Item 13. Exhibits.
| (a) | (1) Any code of ethics or amendment thereto, that is the subject of the disclosure required by Item 2, to the extent that the registrant intends to satisfy Item 2 requirements through filing an exhibit. Incorporated by reference to previous Form N-CSR filed May 3, 2017. |
(2) A separate certification for each principal executive and principal financial officer pursuant to Section 302 of the Sarbanes-Oxley Act of 2002. Filed herewith.
(3) Any written solicitation to purchase securities under Rule 23c-1 under the Act sent or given during the period covered by the report by or on behalf of the registrant to 10 or more persons. Not applicable to open-end investment companies.
(4) Change in the registrant’s independent public accountant. There was no change in the registrant’s independent public accountant for the period covered by this report.
| (b) | Certifications pursuant to Section 906 of the Sarbanes-Oxley Act of 2002. Furnished herewith. |
SIGNATURES
Pursuant to the requirements of the Securities Exchange Act of 1934 and the Investment Company Act of 1940, the registrant has duly caused this report to be signed on its behalf by the undersigned, thereunto duly authorized.
| (Registrant) Trust for Professional Managers | ||
| By (Signature and Title) * | /s/ John Buckel | |
John Buckel, President | ||
| Date 10/29/2020 | ||
Pursuant to the requirements of the Securities Exchange Act of 1934 and the Investment Company Act of 1940, this report has been signed below by the following persons on behalf of the registrant and in the capacities and on the dates indicated.
| By (Signature and Title)* | /s/ John Buckel | |
John Buckel, President | ||
| Date 10/29/2020 | ||
| By (Signature and Title)* | /s/ Jennifer Lima | |
Jennifer Lima, Treasurer | ||
| Date 10/29/2020 | ||
| * | Print the name and title of each signing officer under his or her signature. |