UNITED STATES
SECURITIES AND EXCHANGE COMMISSION
Washington, D.C. 20549
FORM N-CSR
CERTIFIED SHAREHOLDER REPORT OF REGISTERED
MANAGEMENT INVESTMENT COMPANIES
Investment Company Act file number 811-10401
Trust for Professional Managers
(Exact name of registrant as specified in charter)
615 East Michigan Street
Milwaukee, WI 53202
(Address of principal executive offices) (Zip code)
Jay S. Fitton
U.S. Bancorp Fund Services, LLC
615 East Michigan Street
Milwaukee, WI 53202
(Name and address of agent for service)
(513) 629-8104
Registrant’s telephone number, including area code
Date of fiscal year end: May 31, 2021
Date of reporting period: November 30, 2020
Item 1. Reports to Stockholders.
![]()
Letter from the Investment Adviser
Dear Fellow Shareholders,
The Jensen Quality Value Fund (the “Fund”)—Class J Shares—posted a return of 21.66% for the six months ended November 30, 2020, compared to a return of 28.98% for the Russell 2500 Total Return Index (the “Index”). Please see pages 8 through 10 of this report for complete standardized performance information for the Fund.
Market Perspective
For the six months ended November 30, 2020, the U.S. economy struggled under the weight of a global recession caused by the coronavirus pandemic. However, stock prices largely recovered from the bear market in early 2020, rallying on expectations for a recovery driven by pent up demand, low interest rates, government stimulus efforts, and the announcement of several effective vaccines for the novel coronavirus.
Overall, we continue to be impressed by the underlying business performance of the companies in the Fund, which seeks to hold high-quality businesses at reasonable prices. We believe that attention to valuation is critical and that investors in high quality, reasonably priced businesses should be rewarded over the long term.
Commentary on Results
For the six months ended November 30, 2020, the Fund’s performance relative to the Index was aided by an underweight position in the Utilities, Real Estate, Financial and Energy sectors and an overweight in the Industrials and Consumer Discretionary sectors. Specific companies in the Industrials and Real Estate sectors also contributed positively to performance.
Relative to the Index, the Fund’s cash position and its overweight in the Consumer Staples sector detracted from performance. At the company level, the Fund’s performance was most negatively impacted by specific companies in the Consumer Staples, Consumer Discretionary, and Industrial sectors.
Historically, the Fund has shown relative outperformance during down-market periods and underperformance in periods of strong market appreciation. This relative performance pattern is typical of the high-quality businesses in which we invest. During the six-month period, the strategy continued its high allocation to quality companies, as defined by the S&P Earnings and Dividend Quality Rankings. Our portfolio’s allocation to the highest quality companies, those rated A+, A, and A- averaged 48% of portfolio assets, compared to just 12% of the Index.
This meaningful overweight to quality detracted from returns during the six-month period, as share prices of lower-quality companies (rated B+ and below) recovered and outperformed the shares of high- quality companies (those rated A+, A, and A-) by a factor of 1.6x in the portfolio and 1.7x in the Index. While the shares of low-quality companies may outperform the Index when recovering from a bear market, we believe that over the full market cycle investors in higher-quality businesses have the potential to be rewarded with better returns and lower volatility.
| Semi-Annual Report | Jensen Quality Value Fund | 1 |
During the six-month period, the investment team continued to purchase the shares of companies we considered undervalued and sold the shares of companies we believed to be overvalued. New companies to the portfolio included Maximus, a provider of business services, Microchip Technology, a semiconductor manufacturer, and Verisk Analytics, a provider of risk management software. Companies sold from the portfolio included Middleby, a restaurant equipment company, Varian Medical Systems, a provider of radiation therapy equipment, Western Union, a payment and money transfer business, and Xilinx, a semiconductor company. As of November 30, 2020, the Fund held 37 companies.
The top contributor to Fund performance for the six months ended November 30, 2020 was ON Semiconductor, a manufacturer and marketer of semiconductor components and electronic modules for many electronic devices worldwide. During the period, ON Semiconductor reported revenue and earnings ahead of investor expectations, driven by improving global business activity, particularly in the automotive end market. In addition, lean channel inventories coincided with demand acceleration after the disruption brought about by the coronavirus pandemic, supporting a constructive outlook for the industry. ON Semiconductor was selected for the Fund because of its compelling valuation at the time of purchase and its positive fundamental attributes, including global scale, high customer switching costs, high barriers to entry, and diversified revenue sources.
Other notable companies that contributed positively to portfolio performance were Crown Holdings, a manufacturer of packaging products including steel and aluminum cans, Varian Medical Systems, a provider of radiation therapy equipment, Lennox International, a heating, ventilation, air conditioning, and refrigeration company, and CBRE Group, a commercial real estate services company.
The largest negative contributor to Fund performance for the six months ended November 30, 2020 was Hill-Rom Holdings, a medical technology company that provides patient beds, patient monitoring equipment, and diagnostic tools. While the company’s stock performed well in the early stages of the pandemic, it later underperformed due to expectations of weak health care utilization as patients postponed elective procedures. Hill-Rom was selected for the Fund for its attractive valuation at the time of purchase and its compelling fundamental attributes, which include leading market positions, global economies of scale, solid recurring revenue from service contracts, and an integrated product suite.
Other notable holdings that weighed on relative performance included General Mills, a consumer-packaged foods company, Maximus, a provider of government and business process outsourcing services, Kellogg, a provider of cereal and convenience foods, and the fund’s cash balance, which is necessary to accommodate cash flows into and out of the Fund. In the early months of the pandemic, General Mills and Kellogg benefitted as consumers stockpiled goods and Maximus benefitted from speculation that government spending on social and medical programs would increase. However, market sentiment subsequently turned more negative although there have been no major changes in their business models.
| 2 | Jensen Quality Value Fund | Semi-Annual Report |
The Jensen Outlook
After a transitory but severe stage of negative sentiment from mid-February to mid-March, investors were willing to optimistically ‘look through’ a sharp decline in earnings and host of uncertainties, focusing instead on the forward-looking implications of economic stimulus and progress on solving the coronavirus pandemic, including monetary easing, fiscal stimulus, and vaccine development.
At a high level, a 2021 rebound presumes successful progress on coronavirus vaccine approvals and deployment on a global scale. Further, analysis of sector forecasts suggests 2021 earnings growth is dependent on reflation in energy prices, consumer spending, and industrial activity concurrent with accelerating growth for companies in the technology and healthcare sectors.
Making a detailed outlook for 2021 is challenging, but there are some positives for next year, including relatively healthy household balance sheets, pent-up consumer demand, and a steadily recovering job market. However, we expect the path could be volatile due to the uncertain pace of economic recovery primarily driven by the timing of vaccine distribution and any further economic stimulus.
At Jensen, we prefer to focus on those companies which we believe can produce strong underlying business results, and we attempt to use short-term volatility as an opportunity to take advantage of pricing disconnects in the stocks of these companies. We believe companies with strong fundamentals, durable competitive advantages, and a history of growing free cash flow can “chart their own paths” and have the potential to outperform lower-quality businesses over time.
Whatever happens moving forward, we believe that paying attention to important company fundamentals as discussed above helps manage risk, may provide a measure of capital protection in volatile markets, and offers the opportunity for long-term capital appreciation in our clients’ portfolios. We are tremendously grateful for the ongoing support of our firm and investment strategies from our partners and fellow shareholders.
We invite you to seek additional information about The Jensen Quality Value Fund at www.jenseninvestment.com where additional content, including updated holdings and performance information, is available. We take our investment responsibilities seriously and appreciate the trust you have placed in us. As always, we welcome your feedback.
Cordially,
The Jensen Quality Value Investment Team
| Semi-Annual Report | Jensen Quality Value Fund | 3 |
This discussion and analysis of the Fund is as of November 30, 2020 and is subject to change, and any forecasts made cannot be guaranteed and should not be considered investment advice.
Past performance is no guarantee of future results. Fund holdings and sector weightings are subject to change and are not recommendations to buy or sell any security. For more complete information regarding performance and holdings, please refer to the financial statements and schedule of investments headings of this report.
Mutual fund investing involves risk, and principal loss is possible. The Fund invests in mid- and smaller capitalization companies, which involve additional risks such as limited liquidity and greater volatility. Growth stocks typically are more volatile than value stocks; however, value stocks have a lower expected growth rate in earnings and sales.
Earnings growth is not a measure of the Fund’s future performance.
The Russell 2500 Total Return Index is a market cap weighted index that includes the smallest 2,500 companies covered in the Russell 3000 universe of United States-based listed equities. The index is unmanaged, and you cannot invest directly in an index.
S&P Quality Rankings. S&P ranks index constituents from A+ through C based on trailing earnings and dividend consistency. We consider stocks rated A- and above as high quality and those rated B+ and below as low quality.
Free Cash Flow: Is equal to the after-tax net income of a company plus depreciation and amortization less capital expenditures.
Must be preceded or accompanied by a prospectus for the Jensen Quality Value Fund.
The Jensen Quality Value Fund is distributed by Quasar Distributors, LLC. |
| 4 | Jensen Quality Value Fund | Semi-Annual Report |
Letter from the Investment Adviser
Dear Fellow Shareholders,
The Jensen Global Quality Growth Fund (the “Fund”)—Class Y Shares—posted a return of 16.13% for the six months ended November 30, 2020, compared to a return of 22.29% for the MSCI All Country World Index (the “Index”). Please see pages 12 through 14 of this report for complete standardized performance information for the Fund. During this period, the Fund management team continued to receive and deploy additional seed capital in positions initiated upon launch of the Fund as well as follow-on investments in the Fund. The timing of the trades relative to fund flows resulted in a higher-than-expected cash balance that acted as a headwind to the Fund’s relative performance to the Index over the period.
Market Perspective
The Fund was launched on April 15, 2020, and while we acknowledge launching a new strategy during a global pandemic with its associated economic and market upheaval is not ideal, as long-term investors we are not unduly concerned: we believe that the enduring strength of the global quality businesses in which the Fund invests should enable it to meet our goal to outperform the market net of fees over a full market cycle. Indeed, the underlying performance of the companies in the Fund has generally been solid over the last six months despite the economic stresses and strains endured by numerous companies in a variety of industries.
Commentary on Results
For the six months ended November 30, 2020, the Fund’s relative overweight to the Information Technology sector contributed to performance as did the lack of exposure to the Energy, Utilities and Real Estate sectors (where few companies qualify for the Jensen investable universe) while the relative overweight to the Healthcare and Consumer Staples sectors detracted from performance. From a stock selection perspective, Healthcare stocks have underperformed since the global bear market in the spring and detracted from performance along with economically sensitive stocks in the Consumer Discretionary sector. Stock selection was positive in the Information Technology and Communication Services sector where a number of companies held up well in the face of pandemic-induced economic and market turmoil.
The U.S. stock market has been quite resilient despite the economic upheaval resulting from the pandemic. The market’s “V-shaped” recovery helped propel momentum and lower quality stocks to outperform over the last six months, both of which are underweight exposures for the Fund given its strategic emphasis on high-quality companies. The Fund’s European businesses also detracted from performance as European stocks, particularly the more consistent companies, have not kept pace with the rally in European markets.
At a company level the Fund’s top performers were Apple (AAPL) and Taiwan Semiconductor (TSMC). Apple has been a beneficiary of global economic activity moving to a virtual and online environment and has seen strong demand for its products and services while TSMC has experienced improving business and demand for its chips as a result of the economic shifts that have taken place during the pandemic.
The largest detractors to performance were GlaxoSmithKline (GSK) and AstraZeneca (AZN), both of which evidenced share price weakness in the late spring (GSK) and summer (AZN) as a result slowing European growth and a softer U.S. dollar. Business performance at both companies has
| Semi-Annual Report | Jensen Global Quality Growth Fund | 5 |
remained relatively strong although AZN has more recently been held back by concerns about the reported efficacy for the company’s COVID-19 vaccine despite the fact that the vaccine trials appear to show strong enough efficacy to move forward. We continue to believe that the long-term outlooks for both companies remain sound and we would look to add to our positions as valuation levels allow or with rising confidence in the nearer term outlook: we expect both companies to remain core Fund holdings assuming their business performance continues to be solid.
The Jensen Outlook
Global markets suffered in early 2020 as the impact of the COVID-19 pandemic took hold. However, investors subsequently looked past the negative sentiment early in the year, despite the sharp slow-down in earnings and a host of uncertainties. The market recovery resulted from substantial monetary easing and fiscal stimulus on the part of central banks and governments around the world in an effort to stave off economic disaster. More recently, vaccine developments in record time have provided encouragement that the pandemic may be controlled and provide a return to more normalized economic activity.
While markets have shown resilience and these recent developments are noteworthy, the anticipated rebound in 2021 presumes successful progress on coronavirus vaccine approvals and deployment on a global scale. Even so, widespread deployment for the majority of global populations may still take considerable time, perhaps into 2022. Further, analyses of 2021 forecasts show they presume strong reflation of energy prices, consumer spending and industrial activity concurrent with accelerating growth for companies in the technology and healthcare sectors.
Global economies will likely face a difficult few months ahead with a resurgence in the pandemic in many places and the return of more stringent lockdowns that will hamper or prolong a more sustained economic recovery, all of which have the potential to jeopardize the anticipated rebound. Additional stimulus is likely to be forthcoming, but its impact may be muted in the face of rising small business failures and job losses. Consequently, the path forward could continue to be volatile, reflecting the many uncertainties currently affecting global economies.
We believe the antidote for such uncertainties and the accompanying volatility is to “know what you own” and to focus on underlying long-term business attributes, including competitive advantages, balance sheet strength, and free cash flow consistency. We are confident that while the companies in the Fund are not immune to global stresses, they possess business models that have the demonstrated ability to mitigate economic risk. Our goal has been and remains to produce stable long-term returns while minimizing the risk of permanent loss of capital.
At Jensen, we invest in those companies which we believe can produce reliable and sustainable business results. We attempt to use market volatility as an opportunity to take advantage of disconnects between the shareholder value generated by these companies and the price of their stocks. We believe companies with strong fundamentals, durable competitive advantages, and a history of growing free cash flow can “chart their own paths” and have the potential to outperform lower-quality businesses over time. We believe we have a constructed a portfolio of such opportunities within the Fund.
Whatever happens moving forward, we are confident that paying attention to company fundamentals, as discussed above, helps manage risk, should provide a measure of capital protection in volatile markets, and offers the opportunity for long-term capital appreciation. We are tremendously grateful for the ongoing support of our firm and investment strategies from our partners and fellow shareholders.
| 6 | Jensen Global Quality Growth Fund | Semi-Annual Report |
We invite you to seek additional information about The Jensen Global Quality Growth Fund at www.jenseninvestment.com where additional content, including updated holdings and prospectus information, is available. We take our investment responsibilities seriously and appreciate the trust you have placed in us. As always, we welcome your feedback.
Cordially,
The Jensen Global Quality Growth Investment Team
This discussion and analysis of the Fund is as of November 30, 2020 and is subject to change, and any forecasts made cannot be guaranteed and should not be considered investment advice.
Past performance is no guarantee of future results. Fund holdings and sector weightings are subject to change and are not recommendations to buy or sell any security. For more complete information regarding performance and holdings, please refer to the financial statements and schedule of investments headings of this report.
Mutual fund investing involves risk, and principal loss is possible. The Fund invests in global large capitalization companies, which involve additional risks such as limited liquidity and greater volatility.
Earnings growth is not a measure of the Fund’s future performance.
The MSCI All Country World Cap Index is a market cap-weighted index that is designed to represent performance of the full opportunity set of large- and mid-cap stocks across 23 developed and 26 emerging markets. As of December 2019, it covers more than 3,000 constituents across 11 sectors and approximately 85% of the free float-adjusted market capitalization in each market. The index is unmanaged, and you cannot invest directly in an index.
Free Cash Flow: Is equal to the after-tax net income of a company plus depreciation and amortization less capital expenditures.
Must be preceded or accompanied by a prospectus for the Jensen Global Quality Growth Fund.
The Jensen Global Quality Growth Fund is distributed by Quasar Distributors, LLC. |
| Semi-Annual Report | Jensen Global Quality Growth Fund | 7 |
Jensen Quality Value Fund - Class J (Unaudited)
Total Returns vs. Russell 2500® Total Return Index
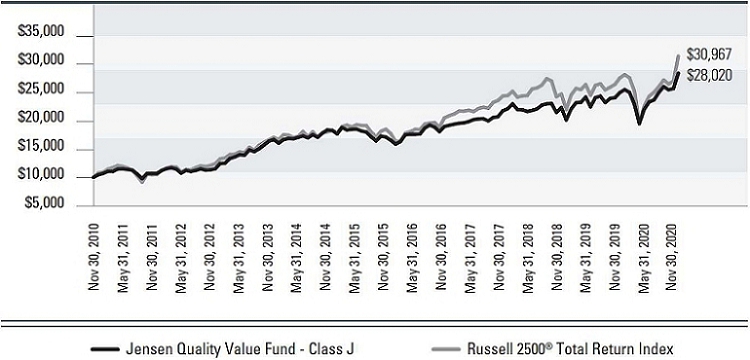
| Average Annual Total Returns – For periods ended November 30, 2020 (Unaudited) | 1 year | 3 years | 5 years | 10 years | Since Inception (3/31/2010) |
| Jensen Quality Value Fund - Class J | 13.59% | 9.20% | 10.56% | 10.85% | 10.00% |
| Russell 2500® Total Return Index | 13.86% | 8.76% | 11.06% | 11.97% | 11.97% |
The Russell 2500® Total Return Index is a market capitalization weighted index that includes the smallest 2,500 companies covered in the Russell 3000® universe of United States-based listed equities.
The chart at the top of the page assumes an initial gross investment of $10,000 made on November 30, 2010. Returns shown include the reinvestment of all Fund distributions. Returns shown do not reflect the deduction of taxes that a shareholder would pay on Fund distributions or the redemption of Fund shares.
Investment performance reflects fee waivers in effect. In the absence of such waivers, total returns would be reduced.
Performance data shown represents past performance. Past performance does not guarantee future results. The investment return and principal value of an investment will fluctuate so that an investor’s shares, when redeemed, may be worth more or less than their original cost. Current performance of the Fund may be lower or higher than the performance shown. Performance data current to the most recent month-end may be obtained by calling 800-992-4144 or by visiting www.jenseninvestment.com.
| 8 | Jensen Quality Value Fund | Semi-Annual Report |
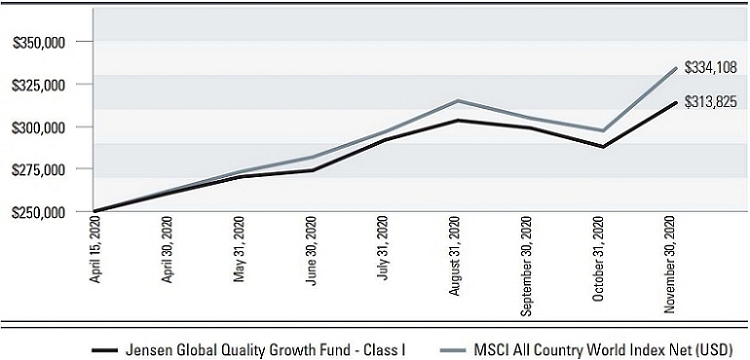
Jensen Quality Value Fund - Class I (Unaudited)
Total Returns vs. Russell 2500® Total Return Index
![]()
| Average Annual Total Returns – For periods ended November 30, 2020 (Unaudited) | 1 year | 3 years | 5 years | 10 years | Since Inception (3/31/2010) |
| Jensen Quality Value Fund - Class I | 13.85% | 9.45% | 10.78% | 11.05% | 10.20% |
| Russell 2500® Total Return Index | 13.86% | 8.76% | 11.06% | 11.97% | 11.97% |
The Russell 2500® Total Return Index is a market capitalization weighted index that includes the smallest 2,500 companies covered in the Russell 3000® universe of United States-based listed equities.
The chart at the top of the page assumes an initial gross investment of $250,000 made on November 30, 2010. Returns shown include the reinvestment of all Fund distributions. Returns shown do not reflect the deduction of taxes that a shareholder would pay on Fund distributions or the redemption of Fund shares.
Investment performance reflects fee waivers in effect. In the absence of such waivers, total returns would be reduced.
Performance data shown represents past performance. Past performance does not guarantee future results. The investment return and principal value of an investment will fluctuate so that an investor’s shares, when redeemed, may be worth more or less than their original cost. Current performance of the Fund may be lower or higher than the performance shown. Performance data current to the most recent month-end may be obtained by calling 800-992-4144 or by visiting www.jenseninvestment.com.
| Semi-Annual Report | Jensen Quality Value Fund | 9 |
Jensen Quality Value Fund - Class Y (Unaudited)
Total Returns vs. Russell 2500® Total Return Index
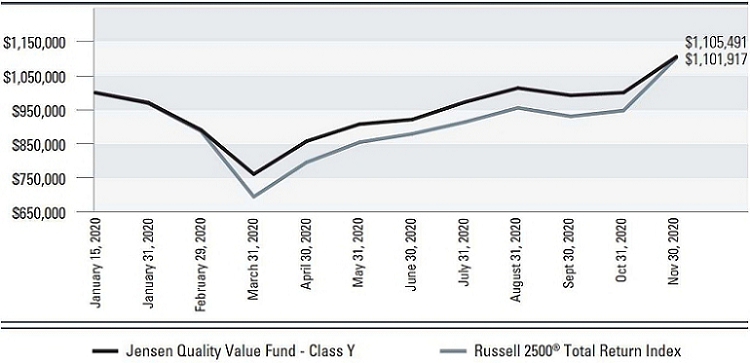
| Total Returns – For the period ended November 30, 2020 (Unaudited) | Since Inception (01/15/2020) |
| Jensen Quality Value Fund - Class Y | 10.55% |
| Russell 2500® Total Return Index | 10.19% |
The Russell 2500® Total Return Index is a market capitalization weighted index that includes the smallest 2,500 companies covered in the Russell 3000® universe of United States-based listed equities.
The chart at the top of the page assumes an initial gross investment of $1,000,000 made on January 15, 2020, the inception date for Class Y shares. Returns shown include the reinvestment of all Fund distributions. Returns shown do not reflect the deduction of taxes that a shareholder would pay on Fund distributions or the redemption of Fund shares.
Investment performance reflects fee waivers in effect. In the absence of such waivers, total returns would be reduced.
Performance data shown represents past performance. Past performance does not guarantee future results. The investment return and principal value of an investment will fluctuate so that an investor’s shares, when redeemed, may be worth more or less than their original cost. Current performance of the Fund may be lower or higher than the performance shown. Performance data current to the most recent month-end may be obtained by calling 800-992-4144 or by visiting www.jenseninvestment.com.
| 10 | Jensen Quality Value Fund | Semi-Annual Report |
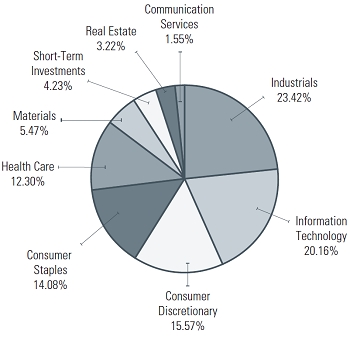
Jensen Quality Value Fund
Investments by Sector as of November 30, 2020
(as a Percentage of Total Investments) (Unaudited)
| Semi-Annual Report | Jensen Quality Value Fund | 11 |
Jensen Global Quality Growth Fund - Class J (Unaudited)
Total Returns vs. MSCI All Country World Index Net (USD)
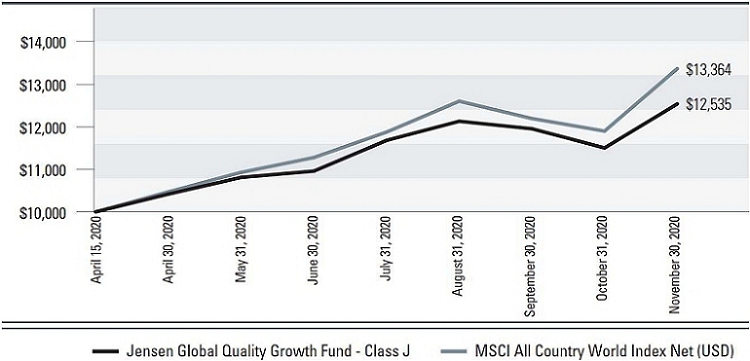
| Total Returns – For the period ended November 30, 2020 (Unaudited) | Since Inception (4/15/2020) |
| Jensen Global Quality Growth Fund - Class J | 25.35% |
| MSCI All Country World Index Net (USD) | 33.64% |
The MSCI All Country World Index Net (USD) (“MSCI ACWI”) is a free float-adjusted market capitalization weighted index that measures the equity performance of global developed and emerging markets. The MSCI ACWI total return indices reinvest dividends after the deduction of withholding taxes, using (for international indices) a tax rate applicable to non-resident institutional investors who do not benefit from double taxation treaties.
The chart at the top of the page assumes an initial gross investment of $10,000 made on April 15, 2020, the inception date for Class J shares. Returns shown include the reinvestment of all Fund distributions. Returns shown do not reflect the deduction of taxes that a shareholder would pay on Fund distributions or the redemption of Fund shares.
Investment performance reflects fee waivers in effect. In the absence of such waivers, total returns would be reduced.
Performance data shown represents past performance. Past performance does not guarantee future results. The investment return and principal value of an investment will fluctuate so that an investor’s shares, when redeemed, may be worth more or less than their original cost. Current performance of the Fund may be lower or higher than the performance shown. Performance data current to the most recent month-end may be obtained by calling 800-992-4144 or by visiting www.jenseninvestment.com.
| 12 | Jensen Global Quality Growth Fund | Semi-Annual Report |
Jensen Global Quality Growth Fund - Class I (Unaudited)
Total Returns vs. MSCI All Country World Index Net (USD)
| Total Returns – For the period ended November 30, 2020 (Unaudited) | Since Inception (4/15/2020) |
| Jensen Global Quality Growth Fund - Class I | 25.53% |
| MSCI All Country World Index Net (USD) | 33.64% |
The MSCI All Country World Index Net (USD) (“MSCI ACWI”) is a free float-adjusted market capitalization weighted index that measures the equity performance of global developed and emerging markets. The MSCI ACWI total return indices reinvest dividends after the deduction of withholding taxes, using (for international indices) a tax rate applicable to non-resident institutional investors who do not benefit from double taxation treaties.
The chart at the top of the page assumes an initial gross investment of $250,000 made on April 15, 2020, the inception date for Class I shares. Returns shown include the reinvestment of all Fund distributions. Returns shown do not reflect the deduction of taxes that a shareholder would pay on Fund distributions or the redemption of Fund shares.
Investment performance reflects fee waivers in effect. In the absence of such waivers, total returns would be reduced.
Performance data shown represents past performance. Past performance does not guarantee future results. The investment return and principal value of an investment will fluctuate so that an investor’s shares, when redeemed, may be worth more or less than their original cost. Current performance of the Fund may be lower or higher than the performance shown. Performance data current to the most recent month-end may be obtained by calling 800-992-4144 or by visiting www.jenseninvestment.com.
| Semi-Annual Report | Jensen Global Quality Growth Fund | 13 |
Jensen Global Quality Growth Fund - Class Y (Unaudited)
Total Returns vs. MSCI All Country World Index Net (USD)
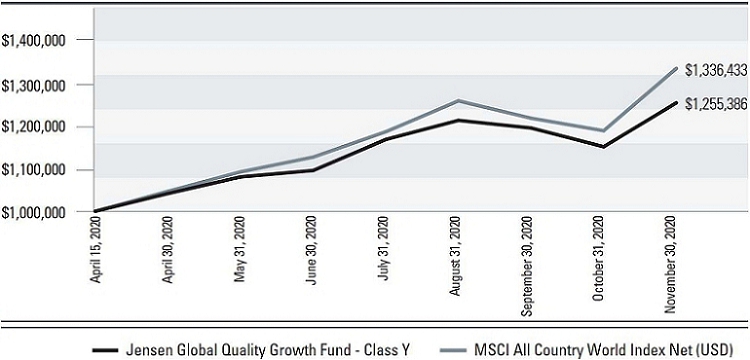
| Total Returns – For the period ended November 30, 2020 (Unaudited) | Since Inception (4/15/2020) |
| Jensen Global Quality Growth Fund - Class Y | 25.54% |
| MSCI All Country World Index Net (USD) | 33.64% |
The MSCI All Country World Index Net (USD) (“MSCI ACWI”) is a free float-adjusted market capitalization weighted index that measures the equity performance of global developed and emerging markets. The MSCI ACWI total return indices reinvest dividends after the deduction of withholding taxes, using (for international indices) a tax rate applicable to non-resident institutional investors who do not benefit from double taxation treaties.
The chart at the top of the page assumes an initial gross investment of $1,000,000 made on April 15, 2020, the inception date for Class Y shares. Returns shown include the reinvestment of all Fund distributions. Returns shown do not reflect the deduction of taxes that a shareholder would pay on Fund distributions or the redemption of Fund shares.
Investment performance reflects fee waivers in effect. In the absence of such waivers, total returns would be reduced.
Performance data shown represents past performance. Past performance does not guarantee future results. The investment return and principal value of an investment will fluctuate so that an investor’s shares, when redeemed, may be worth more or less than their original cost. Current performance of the Fund may be lower or higher than the performance shown. Performance data current to the most recent month-end may be obtained by calling 800-992-4144 or by visiting www.jenseninvestment.com.
| 14 | Jensen Global Quality Growth Fund | Semi-Annual Report |
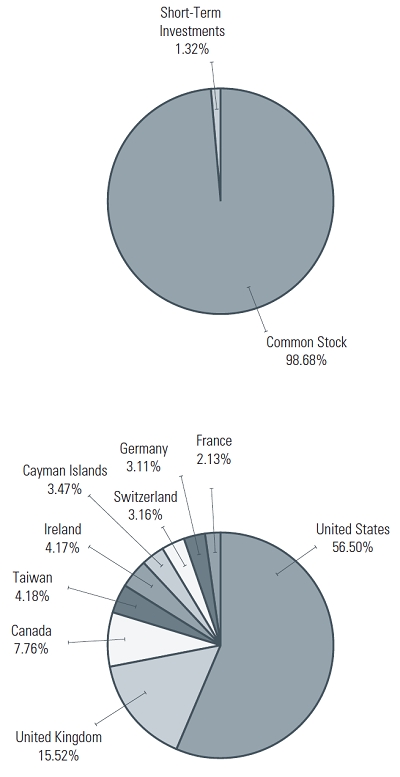
Jensen Global Quality Growth Fund
Allocation of Portfolio Holdings as of November 30, 2020
(as a Percentage of Total Investments) (Unaudited)
| Semi-Annual Report | Jensen Global Quality Growth Fund | 15 |
Statements of Assets & Liabilities
November 30, 2020 (Unaudited)
| Assets: | Jensen Quality Value Fund | Jensen Global Quality Growth Fund | ||||||||
| Investments, at value (cost $65,092,963 and $15,577,145, respectively) | $ | 77,717,262 | $ | 16,920,846 | ||||||
| Dividend and interest income receivable | 83,765 | 27,199 | ||||||||
| Receivable for capital stock issued | 427,689 | – | ||||||||
| Receivable from Adviser | – | 7,967 | ||||||||
| Other Assets | 15,833 | 26,450 | ||||||||
| Total Assets | 78,244,549 | 16,982,462 | ||||||||
| Liabilities: | ||||||||||
| Payable for capital stock redeemed | 257,084 | – | ||||||||
| Payable for 12b-1 fees - Class J | 7,507 | 948 | ||||||||
| Payable for investments purchased | 1,185,377 | – | ||||||||
| Payable to Adviser | 25,347 | – | ||||||||
| Payable to Adviser for prepaid expenses | – | 6,351 | ||||||||
| Payable to affiliates | 39,329 | 40,307 | ||||||||
| Accrued expenses and other liabilities | 34,646 | 40,071 | ||||||||
| Total Liabilities | 1,549,290 | 87,677 | ||||||||
| Net Assets | $ | 76,695,259 | $ | 16,894,785 | ||||||
| Net Assets Consist of: | ||||||||||
| Capital stock | $ | 63,306,768 | $ | 15,539,784 | ||||||
| Total distributable earnings | 13,388,491 | 1,355,001 | ||||||||
| Total Net Assets | $ | 76,695,259 | $ | 16,894,785 | ||||||
| Net Assets Consist of: | ||||||||||
| Class J Shares: | ||||||||||
| Net Assets | $ | 17,083,072 | $ | 1,511,371 | ||||||
| Shares of beneficial interest outstanding | 1,156,508 | 120,829 | ||||||||
| Net Asset Value, Offering Price and Redemption Price Per Share (unlimited number of shares authorized, $.001 par value) | $14.77 | $12.51 | ||||||||
| Class I Shares: | ||||||||||
| Net Assets | $ | 18,118,622 | $ | 1,617,532 | ||||||
| Shares of beneficial interest outstanding | 1,229,779 | 129,200 | ||||||||
| Net Asset Value, Offering Price and Redemption Price Per Share (unlimited number of shares authorized, $.001 par value) | $14.73 | $12.52 | ||||||||
| Class Y Shares: | ||||||||||
| Net Assets | $ | 41,493,565 | $ | 13,765,882 | ||||||
| Shares of beneficial interest outstanding | 2,822,707 | 1,099,635 | ||||||||
| Net Asset Value, Offering Price and Redemption Price Per Share (unlimited number of shares authorized, $.001 par value) | $14.70 | $12.52 | ||||||||
The accompanying notes are an integral part of these financial statements.
| 16 | Jensen Quality Value Fund, Jensen Global Quality Growth Fund | Semi-Annual Report |
Jensen Quality Value Fund
Schedule of Investments
November 30, 2020 (Unaudited)
Common Stocks - 97.04%
| shares | Air Freight & Logistics - 3.72% | value | ||||||
| 31,950 | Expeditors International of Washington, Inc. | $2,855,372 | ||||||
| shares | Building Products - 3.27% | value | ||||||
| 8,720 | Lennox International, Inc. | $2,509,878 | ||||||
| shares | Chemicals - 1.54% | value | ||||||
| 6,710 | Scotts Miracle-Gro Co. | $1,179,417 | ||||||
| shares | Commercial Services & Supplies - 4.49% | value | ||||||
| 22,900 | Copart, Inc. (a) | $2,643,805 | ||||||
| 22,500 | Herman Miller, Inc. | $801,900 | ||||||
| $3,445,705 | ||||||||
| shares | Communications Equipment - 2.78% | value | ||||||
| 13,100 | F5 Networks, Inc. (a) | $2,132,811 | ||||||
| shares | Containers & Packaging - 4.00% | value | ||||||
| 32,560 | Crown Holdings, Inc. (a) | $3,068,780 | ||||||
| shares | Distributors - 3.72% | value | ||||||
| 29,000 | Genuine Parts Co. | $2,852,730 | ||||||
| shares | Electronic Equipment, Instruments & Components - 0.47% | value | ||||||
| 2,770 | Amphenol Corp. - Class A | $362,344 | ||||||
| shares | Food & Staples Retailing - 2.91% | value | ||||||
| 67,660 | Kroger Co. | $2,232,780 | ||||||
| shares | Food Products - 8.62% | value | ||||||
| 41,440 | Campbell Soup Co. | $2,072,829 | ||||||
| 41,410 | General Mills, Inc. | $2,518,556 | ||||||
| 31,610 | Kellogg Co. | $2,020,195 | ||||||
| $6,611,580 | ||||||||
The accompanying notes are an integral part of these financial statements.
| Semi-Annual Report | Jensen Quality Value Fund | 17 |
Jensen Quality Value Fund
Schedule of Investments continued
November 30, 2020 (Unaudited)
| shares | Health Care Equipment & Supplies - 3.59% | value | ||||||
| 28,990 | Hill-Rom Holdings, Inc. | $2,749,991 | ||||||
| shares | Health Care Providers & Services - 8.15% | value | ||||||
| 40,980 | Encompass Health Corp. | $3,302,169 | ||||||
| 14,770 | Laboratory Corporation of America Holdings (a) | $2,951,637 | ||||||
| $6,253,806 | ||||||||
| shares | Household Products - 2.72% | value | ||||||
| 23,800 | Church & Dwight Co., Inc. | $2,088,926 | ||||||
| shares | IT Services - 8.87% | value | ||||||
| 21,830 | Broadridge Financial Solutions, Inc. | $3,206,391 | ||||||
| 24,840 | MAXIMUS, Inc. | $1,783,760 | ||||||
| 19,490 | Paychex, Inc. | $1,815,494 | ||||||
| $6,805,645 | ||||||||
| shares | Leisure Products - 3.02% | value | ||||||
| 24,860 | Hasbro, Inc. | $2,312,726 | ||||||
| shares | Life Sciences Tools & Services - 0.73% | value | ||||||
| 2,400 | Waters Corp. (a) | $556,824 | ||||||
| shares | Machinery - 2.46% | value | ||||||
| 35,410 | Donaldson Company, Inc. | $1,885,228 | ||||||
| shares | Media - 1.57% | value | ||||||
| 19,170 | Omnicom Group, Inc. | $1,207,710 | ||||||
| shares | Professional Services - 4.74% | value | ||||||
| 18,180 | Equifax, Inc. | $3,034,241 | ||||||
| 3,050 | Verisk Analytics, Inc. | $604,846 | ||||||
| $3,639,087 | ||||||||
The accompanying notes are an integral part of these financial statements.
| 18 | Jensen Quality Value Fund | Semi-Annual Report |
Jensen Quality Value Fund
Schedule of Investments continued
November 30, 2020 (Unaudited)
| shares | Real Estate Management & Development - 3.27% | value | ||||||
| 40,970 | CBRE Group, Inc. - Class A (a) | $2,504,906 | ||||||
| shares | Road & Rail - 3.03% | value | ||||||
| 17,670 | Landstar System, Inc. | $2,322,191 | ||||||
| shares | Semiconductors & Semiconductor Equipment - 5.97% | value | ||||||
| 20,380 | Microchip Technology, Inc. | $2,738,868 | ||||||
| 64,011 | ON Semiconductor Corp. (a) | $1,840,316 | ||||||
| $4,579,184 | ||||||||
| shares | Software - 1.12% | value | ||||||
| 39,080 | Teradata Corp. (a) | $857,024 | ||||||
| shares | Specialty Retail - 4.19% | value | ||||||
| 17,210 | Best Buy Company, Inc. | $1,872,448 | ||||||
| 9,500 | Tractor Supply Co. | $1,337,695 | ||||||
| $3,210,143 | ||||||||
| shares | Technology Hardware, Storage & Peripherals - 1.21% | value | ||||||
| 17,400 | NetApp, Inc. | $927,594 | ||||||
| shares | Textiles, Apparel & Luxury Goods - 4.86% | value | ||||||
| 17,970 | Carter’s, Inc. | $1,599,150 | ||||||
| 115,700 | Levi Strauss & Co. - Class A | $2,127,723 | ||||||
| $3,726,873 | ||||||||
| shares | Trading Companies & Distributors - 2.02% | value | ||||||
| 3,700 | WW Grainger, Inc. | $1,547,710 | ||||||
| Total Common Stocks | value | |||||||
| (Cost $61,802,666) | $74,426,965 | |||||||
The accompanying notes are an integral part of these financial statements.
| Semi-Annual Report | Jensen Quality Value Fund | 19 |
Jensen Quality Value Fund
Schedule of Investments continued
November 30, 2020 (Unaudited)
Short-Term Investments - 4.29%
| shares | value | |||||||
| 3,290,297 | First American Treasury Obligations Fund - Class X, 0.046% (b) | $3,290,297 | ||||||
| Total Short-Term Investments | value | |||||||
| (Cost $3,290,297) | $3,290,297 | |||||||
| Total Investments | value | |||||||
| (Cost $65,092,963) - 101.33% | $77,717,262 | |||||||
| Liabilities in Excess of Other Assets - (1.33)% | $(1,022,003 | ) | ||||||
| TOTAL NET ASSETS - 100.00% | $ | 76,695,259 | ||||||
Percentages are stated as a percent of net assets.
| (a) | Non-income producing security. |
| (b) | Seven day yield as of November 30, 2020. |
The accompanying notes are an integral part of these financial statements.
| 20 | Jensen Quality Value Fund | Semi-Annual Report |
Jensen Global Quality Growth Fund
Schedule of Investments
November 30, 2020 (Unaudited)
Common Stocks - 98.83%
| shares | Canada - 7.77% | value | ||||||
| 19,930 | Alimentation Couche-Tard, Inc. - Class B | $ | 661,878 | |||||
| 6,220 | Canadian National Railway Co. | $ | 651,359 | |||||
| $1,313,237 | ||||||||
| shares | Cayman Islands - 3.47% | value | ||||||
| 8,050 | Tencent Holdings Ltd. | $586,827 | ||||||
| shares | France - 2.13% | value | ||||||
| 370 | Hermes International Ltd. | $359,993 | ||||||
| shares | Germany - 3.12% | value | ||||||
| 4,360 | �� | SAP SE | $526,322 | |||||
| shares | Ireland - 4.17% | value | ||||||
| 2,830 | Accenture PLC - Class A | $704,926 | ||||||
| shares | Switzerland - 3.16% | value | ||||||
| 4,770 | Nestle SA | $534,309 | ||||||
| shares | Taiwan - 4.19% | value | ||||||
| 7,290 | Taiwan Semiconductor Manufacturing Co. Ltd. - ADR | $707,276 | ||||||
| shares | United Kingdom - 15.55% | value | ||||||
| 4,700 | AstraZeneca PLC | $ | 491,786 | |||||
| 9,110 | Compass Group PLC | $ | 160,297 | |||||
| 18,080 | Diageo PLC | $ | 696,011 | |||||
| 39,330 | GlaxoSmithKline PLC | $ | 713,836 | |||||
| 9,300 | Unilever PLC | $ | 564,841 | |||||
| $2,626,771 | ||||||||
The accompanying notes are an integral part of these financial statements.
| Semi-Annual Report | Jensen Global Quality Growth Fund | 21 |
Jensen Global Quality Growth Fund
Schedule of Investments continued
November 30, 2020 (Unaudited)
| shares | United States - 55.27% | value | ||||||
| 4,120 | 3M Co. | $ | 711,648 | |||||
| 395 | Alphabet, Inc. - Class A (a) | $ | 692,988 | |||||
| 2,040 | Apple, Inc. | $ | 242,862 | |||||
| 2,690 | Automatic Data Processing, Inc. | $ | 467,737 | |||||
| 2,680 | Becton Dickinson and Company | $ | 629,371 | |||||
| 2,230 | Broadridge Financial Solutions, Inc. | $ | 327,542 | |||||
| 2,350 | Equifax, Inc. | $ | 392,215 | |||||
| 1,140 | Home Depot, Inc. | $ | 316,247 | |||||
| 1,200 | Intuit, Inc. | $ | 422,424 | |||||
| 4,290 | Johnson & Johnson | $ | 620,677 | |||||
| 940 | Mastercard, Inc. - Class A | $ | 316,319 | |||||
| 3,280 | Microsoft Corp. | $ | 702,150 | |||||
| 4,750 | NIKE, Inc. - Class B | $ | 639,825 | |||||
| 5,620 | PepsiCo, Inc. | $ | 810,572 | |||||
| 14,210 | Pfizer, Inc. | $ | 544,385 | |||||
| 4,570 | Starbucks Corp. | $ | 447,952 | |||||
| 2,880 | Stryker Corp. | $ | 672,192 | |||||
| 2,360 | Texas Instruments, Inc. | $ | 380,550 | |||||
| $9,337,656 | ||||||||
| Total Common Stocks | value | |||||||
| (Cost $15,353,616) | $16,697,317 | |||||||
The accompanying notes are an integral part of these financial statements.
| 22 | Jensen Global Quality Growth Fund | Semi-Annual Report |
Jensen Global Quality Growth Fund
Schedule of Investments continued
November 30, 2020 (Unaudited)
Short-Term Investments - 1.32%
| shares | United States - 1.32% | value | ||||||
| 223,529 | First American Treasury Obligations Fund - Class X, 0.046% (b) | $223,529 | ||||||
| Total Short-Term Investments | value | |||||||
| (Cost $223,529) | $223,529 | |||||||
| Total Investments | value | |||||||
| (Cost $15,577,145) - 100.15% | $16,920,846 | |||||||
| Liabilities in Excess of Other Assets - (0.15)% | $(26,061 | ) | ||||||
| TOTAL NET ASSETS - 100.00% | $16,894,785 | |||||||
Percentages are stated as a percent of net assets.
| (a) | Non-income producing security. |
| (b) | Seven day yield as of November 30, 2020. |
Abbreviations:
| ADR | American Depositary Receipt |
| PLC | Public Limited Company is a publicly traded company which signifies that shareholders have limited liability. |
| SA | An abbreviation used by many countries to signify a stock company whereby shareholder have limited liability. |
| SE | Societas Europaea is a term for a European Public Liability Company |
The accompanying notes are an integral part of these financial statements.
| Semi-Annual Report | Jensen Global Quality Growth Fund | 23 |
Statements of Operations
For the Six Months Ended November 30, 2020 (Unaudited)
| Investment Income: | Jensen Quality Value Fund | Jensen Global Quality Growth Fund | ||||||
| Dividend income | $423,699 | $86,422 | (1) | |||||
| Interest income | 746 | 153 | ||||||
| Total Investment Income | 424,445 | 86,575 | ||||||
| Expenses: | ||||||||
| Investment management fees | 181,805 | 38,618 | ||||||
| Federal and state registration fees | 38,795 | 30,274 | ||||||
| Transfer agent fees | 22,884 | 22,603 | ||||||
| Legal fees | 17,739 | 17,165 | ||||||
| Administration fees | 17,222 | 9,252 | ||||||
| 12b-1 fees - Class J | 12,413 | 1,461 | ||||||
| Fund accounting fees | 11,910 | 11,524 | ||||||
| Audit and tax fees | 8,695 | 9,330 | ||||||
| Reports to shareholders | 6,973 | 7,983 | ||||||
| Chief Compliance Officer fees | 6,128 | 6,225 | ||||||
| Trustees’ fees | 6,231 | 5,954 | ||||||
| Transfer agent expenses | 3,533 | 1,958 | ||||||
| Custody fees | 1,624 | 5,539 | ||||||
| Insurance expense | 1,104 | 1,186 | ||||||
| Shareholder servicing fees - Class I | 808 | 49 | ||||||
| Other | 2,376 | 2,467 | ||||||
| Total expenses | 340,240 | 171,588 | ||||||
| Less waivers and reimbursements by Adviser (Note 4) | (103,259 | ) | (118,588 | ) | ||||
| Net expenses | 236,981 | 53,000 | ||||||
| Net Investment Income | 187,464 | 33,575 | ||||||
| Realized and Unrealized Gain (Loss) on Investments: | ||||||||
| Net realized gain (loss) on: | ||||||||
| Investments | 1,328,870 | (5,092 | ) | |||||
| Foreign currency translations | – | 4,515 | ||||||
| Change in unrealized appreciation on: | ||||||||
| Investments | 9,819,645 | 1,233,821 | ||||||
| Foreign currency translations | – | 65 | ||||||
| Net realized and unrealized gain on investments | 11,148,515 | 1,233,309 | ||||||
| Net Increase in Net Assets Resulting from Operations | $ | 11,335,979 | $ | 1,266,884 | ||||
| (1) | Net of $1,534 in dividend withholding tax. |
The accompanying notes are an integral part of these financial statements.
| 24 | Jensen Quality Value Fund, Jensen Global Quality Growth Fund | Semi-Annual Report |
Statements of Changes in Net Assets
| Jensen Quality Value Fund | ||||||||
| Operations: | six months ended November 30, 2020 (Unaudited) | year ended May 31, 2020 | ||||||
| Net investment income | $187,464 | $365,038 | ||||||
| Net realized gain (loss) on investment transactions | 1,328,870 | (20,119) | ||||||
| Change in unrealized appreciation on investments | 9,819,645 | 1,334,611 | ||||||
| Net increase in net assets resulting from operations | 11,335,979 | 1,679,530 | ||||||
| Capital Share Transactions: | six months ended November 30, 2020 (Unaudited) | year ended May 31, 2020 | ||||||
| Shares Sold - Class J | 9,852,848 | 4,915,614 | ||||||
| Shares Sold - Class I | 14,360,087 | 5,079,121 | ||||||
| Shares Sold - Class Y | 136,776 | 38,876,802 | ||||||
| Shares issued to holders in reinvestment of dividends - Class J | 19,649 | 180,055 | ||||||
| Shares issued to holders in reinvestment of dividends - Class I | 20,056 | 1,642,893 | ||||||
| Shares issued to holders in reinvestment of dividends - Class Y | 124,573 | 86,786 | ||||||
| Shares redeemed - Class J | (1,343,150) | (1,012,678) | ||||||
| Shares redeemed - Class I | (566,179) | (40,833,685) | ||||||
| Shares redeemed - Class Y | (1,467,686) | (230,205) | ||||||
| Net increase in net assets from capital share transactions | 21,136,974 | 8,704,703 | ||||||
| Dividends and Distributions to Shareholders: | six months ended November 30, 2020 (Unaudited) | year ended May 31, 2020 | ||||||
| Net dividends and distributions - Class J | (19,709) | (181,128) | ||||||
| Net dividends and distributions - Class I | (20,056) | (1,642,893) | ||||||
| Net dividends and distributions - Class Y | (124,573) | (86,786) | ||||||
| Total dividends and distributions | (164,338) | (1,910,807) | ||||||
| Increase In Net Assets | 32,308,615 | 8,473,426 | ||||||
| Net Assets: | six months ended November 30, 2020 (Unaudited) | year ended May 31, 2020 | ||||||
| Beginning of period | $44,386,644 | $35,913,218 | ||||||
| End of period | $76,695,259 | $44,386,644 | ||||||
The accompanying notes are an integral part of these financial statements.
| Semi-Annual Report | Jensen Quality Value Fund | 25 |
Statement of Changes in Net Assets
| Jensen Global Quality Growth Fund | ||||||||
| Operations: | six months ended November 30, 2020 (Unaudited) | period ended May 31, 2020(1) | ||||||
| Net investment income | $33,575 | $3,555 | ||||||
| Net realized gain (loss) on: | ||||||||
| Investments | (5,092) | 1,557 | ||||||
| Foreign currency translations | 4,515 | (2,430) | ||||||
| Change in unrealized appreciation on: | ||||||||
| Investments | 1,233,821 | 109,880 | ||||||
| Foreign currency translations | 65 | 16 | ||||||
| Net increase in net assets resulting from operations | 1,266,884 | 112,578 | ||||||
| Capital Share Transactions: | six months ended November 30, 2020 (Unaudited) | period ended May 31, 2020(1) | ||||||
| Shares Sold - Class J | 900,316 | 429,814 | ||||||
| Shares Sold - Class I | 1,349,925 | 210,941 | ||||||
| Shares Sold - Class Y | 11,493,045 | 1,134,766 | ||||||
| Shares issued to holders in reinvestment of dividends - Class J | 1,786 | – | ||||||
| Shares issued to holders in reinvestment of dividends - Class I | 1,049 | – | ||||||
| Shares issued to holders in reinvestment of dividends - Class Y | 21,311 | – | ||||||
| Shares redeemed - Class J | (2,864) | (101) | ||||||
| Shares redeemed - Class I | – | (101) | ||||||
| Shares redeemed - Class Y | (2) | (101) | ||||||
| Net increase in net assets from capital share transactions | 13,764,566 | 1,775,218 | ||||||
| Dividends and Distributions to Shareholders: | six months ended November 30, 2020 (Unaudited) | period ended May 31, 2020(1) | ||||||
| Net dividends and distributions - Class J | (2,100) | – | ||||||
| Net dividends and distributions - Class I | (1,050) | – | ||||||
| Net dividends and distributions - Class Y | (21,311) | – | ||||||
| Total dividends and distributions | (24,461) | – | ||||||
| Increase In Net Assets | 15,006,989 | 1,887,796 | ||||||
| Net Assets: | six months ended November 30, 2020 (Unaudited) | period ended May 31, 2020(1) | ||||||
| Beginning of period | $ | 1,887,796 | $ | – | ||||
| End of period | $ | 16,894,785 | $ | 1,887,796 | ||||
| (1) | The Fund commenced operations on April 15, 2020. |
The accompanying notes are an integral part of these financial statements.
| 26 | Jensen Global Quality Growth Fund | Semi-Annual Report |
Financial Highlights
Jensen Quality Value Fund - Class J
| Per Share Data: | six months ended November 30, 2020 (Unaudited) | year ended May 31, 2020 | year ended May 31, 2019 | year ended May 31, 2018 | year ended May 31, 2017 | year ended May 31, 2016 |
| Net asset value, beginning of period | $12.17 | $12.24 | $12.59 | $12.14 | $10.74 | $13.29 |
| Income from investment operations: | ||||||
| Net investment income(1) | 0.03 | 0.08 | 0.10 | 0.11 | 0.15 | 0.12 |
| Net realized and unrealized gain (loss) on investments | 2.60 | 0.41 | 0.22 | 0.86 | 1.40 | (0.89) |
| Total from investment operations | 2.63 | 0.49 | 0.32 | 0.97 | 1.55 | (0.77) |
| Less distributions: | ||||||
| Dividends from net investment income | (0.03) | (0.08) | (0.10) | (0.08) | (0.15) | (0.11) |
| Distributions from net realized gain on investments | – | (0.48) | (0.57) | (0.44) | – | (1.67) |
| Total distributions | (0.03) | (0.56) | (0.67) | (0.52) | (0.15) | (1.78) |
| Net asset value, end of period | $14.77 | $12.17 | $12.24 | $12.59 | $12.14 | $10.74 |
| Total return(2) | 21.66% | 3.72% | 2.89% | 7.98% | 14.52% | -4.86% |
| Supplemental data and ratios: | ||||||
| Net assets, end of period (000’s) | $17,083 | $6,569 | $2,444 | $2,482 | $2,598 | $3,172 |
| Ratio of expenses to average net assets | ||||||
| Before waivers and reimbursements of expenses(3) | 1.41% | 1.57% | 1.50% | 1.51% | 1.68% | 1.63% |
| After waivers and reimbursements of expenses(3) | 1.05% | 1.05% | 1.05% | 1.11%(4) | 1.25% | 1.25% |
| Ratio of net investment income to average net assets | ||||||
| Before waivers and reimbursements of expenses(3) | 0.13% | 0.16% | 0.39% | 0.50% | 0.88% | 0.60% |
| After waivers and reimbursements of expenses(3) | 0.49% | 0.68% | 0.84% | 0.90%(4) | 1.31% | 0.98% |
| Portfolio turnover rate(2) | 11.46% | 36.19% | 42.51% | 44.29% | 71.33% | 92.94% |
| (1) | Per share amounts are calculated using the average shares outstanding method. |
| (2) | Not annualized for periods less than one year. |
| (3) | Annualized for periods less than one year. |
| (4) | Effective September 30, 2017, the expense cap for Class J shares was decreased from 1.00% to 0.80% excluding Rule 12b-1 fees of 0.25% |
The accompanying notes are an integral part of these financial statements.
| Semi-Annual Report | Jensen Quality Value Fund | 27 |
Financial Highlights
Jensen Quality Value Fund - Class l
| Per Share Data: | six months ended November 30, 2020 (Unaudited) | year ended May 31, 2020 | year ended May 31, 2019 | year ended May 31, 2018 | year ended May 31, 2017 | year ended May 31, 2016 |
| Net asset value, beginning of period | $12.13 | $12.18 | $12.52 | $12.08 | $10.69 | $13.26 |
| Income from investment operations: | ||||||
| Net investment income(1) | 0.04 | 0.12 | 0.13 | 0.14 | 0.16 | 0.13 |
| Net realized and unrealized gain (loss) on investments | 2.60 | 0.39 | 0.23 | 0.85 | 1.40 | (0.88) |
| Total from investment operations | 2.64 | 0.51 | 0.36 | 0.99 | 1.56 | (0.75) |
| Less distributions: | ||||||
| Dividends from net investment income | (0.04) | (0.08) | (0.13) | (0.11) | (0.17) | (0.15) |
| Distributions from net realized gain on investments | – | (0.48) | (0.57) | (0.44) | – | (1.67) |
| Total distributions | (0.04) | (0.56) | (0.70) | (0.55) | (0.17) | (1.82) |
| Net asset value, end of period | $14.73 | $12.13 | $12.18 | $12.52 | $12.08 | $10.69 |
| Total return(2) | 21.85% | 3.88% | 3.25% | 8.15% | 14.73% | -4.71% |
| Supplemental data and ratios: | ||||||
| Net assets, end of period (000’s) | $18,119 | $2,491 | $33,470 | $32,555 | $30,550 | $25,761 |
| Ratio of expenses to average net assets | ||||||
| Before waivers and reimbursements of expenses(3) | 1.13% | 1.23% | 1.27% | 1.28% | 1.46% | 1.48% |
| After waivers and reimbursements of expenses(3) | 0.82% | 0.82% | 0.82% | 0.91%(4) | 1.10% | 1.10% |
| Ratio of net investment income to average net assets | ||||||
| Before waivers and reimbursements of expenses(3) | 0.35% | 0.51% | 0.62% | 0.73% | 1.05% | 0.81% |
| After waivers and reimbursements of expenses(3) | 0.66% | 0.92% | 1.07% | 1.10%(4) | 1.41% | 1.19% |
| Portfolio turnover rate(2) | 11.46% | 36.19% | 42.51% | 44.29% | 71.33% | 92.94% |
| (1) | Per share amounts are calculated using the average shares outstanding method. |
| (2) | Not annualized for periods less than one year. |
| (3) | Annualized for periods less than one year. |
| (4) | Effective September 30, 2017, the expense cap for Class I shares was decreased from 1.00% to 0.80% excluding shareholder servicing fees of up to 0.10%. |
The accompanying notes are an integral part of these financial statements.
| 28 | Jensen Quality Value Fund | Semi-Annual Report |
Financial Highlights
Jensen Quality Value Fund - Class Y
| Per Share Data: | six months ended November 30, 2020 (Unaudited) | period ended May 31, 2020(1) |
| Net asset value, beginning of period | $12.11 | $13.38 |
| Income from investment operations: | ||
| Net investment income(2) | 0.05 | 0.04 |
| Net realized and unrealized gain (loss) on investments | 2.58 | (1.28) |
| Total from investment operations | 2.63 | (1.24) |
| Less distributions: | ||
| Dividends from net investment income | (0.04) | (0.03) |
| Total distributions | (0.04) | (0.03) |
| Net asset value, end of period | $14.70 | $12.11 |
| Total return(3) | 21.81% | -9.24% |
| Supplemental data and ratios: | ||
| Net assets, end of period (000’s) | $41,494 | $35,326 |
| Ratio of expenses to average net assets | ||
| Before waivers and reimbursements of expenses(4) | 1.18% | 1.52% |
| After waivers and reimbursements of expenses(4) | 0.80% | 0.80% |
| Ratio of net investment income to average net assets | ||
| Before waivers and reimbursements of expenses(4) | 0.34% | 0.23% |
| After waivers and reimbursements of expenses(4) | 0.72% | 0.95% |
| Portfolio turnover rate(3) | 11.46% | 36.19%(5) |
| (1) | Class Y shares commenced operations on January 15, 2020. |
| (2) | Per share amounts are calculated using the average shares outstanding method. |
| (3) | Not annualized for periods less than one year. |
| (4) | Annualized for periods less than one year. |
| (5) | Portfolio turnover rates are calculated at the Fund level (not by individual share class). |
The accompanying notes are an integral part of these financial statements.
| Semi-Annual Report | Jensen Quality Value Fund | 29 |
Financial Highlights
Jensen Global Quality Growth Fund - Class J
| Per Share Data: | six months ended November 31, 2020 (Unaudited) | period ended May 31, 2020(1) |
| Net asset value, beginning of period | $10.81 | $10.00 |
| Income from investment operations: | ||
| Net investment income(2) | 0.02 | 0.02 |
| Net realized and unrealized gain on investments | 1.70 | 0.79 |
| Total from investment operations | 1.72 | 0.81 |
| Less distributions: | ||
| Dividends from net investment income | (0.02) | – |
| Total distributions | (0.02) | – |
| Net asset value, end of period | $12.51 | $10.81 |
| Total return(3) | 15.95% | 8.10% |
| Supplemental data and ratios: | ||
| Net assets, end of period (000’s) | $1,511 | $454 |
| Ratio of expenses to average net assets | ||
| Before waivers and reimbursements of expenses(4) | 3.77% | 33.40% |
| After waivers and reimbursements of expenses(4) | 1.25% | 1.25% |
| Ratio of net investment income (loss) to average net assets | ||
| Before waivers and reimbursements of expenses(4) | (2.14)% | (30.52)% |
| After waivers and reimbursements of expenses(4) | 0.38% | 1.63% |
| Portfolio turnover rate(3) | 0.27% | 0.00% |
| (1) | Class J shares commenced operations on April 15, 2020. |
| (2) | Per share amounts are calculated using the average shares outstanding method. |
| (3) | Not annualized for periods less than one year. |
| (4) | Annualized for periods less than one year. |
The accompanying notes are an integral part of these financial statements.
| 30 | Jensen Global Quality Growth Fund | Semi-Annual Report |
Financial Highlights
Jensen Global Quality Growth Fund - Class I
| Per Share Data: | six months ended November 30, 2020 (Unaudited) | period ended May 31, 2020(1) |
| Net asset value, beginning of period | $10.81 | $10.00 |
| Income from investment operations: | ||
| Net investment income(2) | 0.04 | 0.02 |
| Net realized and unrealized gain on investments | 1.70 | 0.79 |
| Total from investment operations | 1.74 | 0.81 |
| Less distributions: | ||
| Dividends from net investment income | (0.03) | – |
| Total distributions | (0.03) | – |
| Net asset value, end of period | $12.52 | $10.81 |
| Total return(3) | 16.12% | 8.10% |
| Supplemental data and ratios: | ||
| Net assets, end of period (000’s) | $1,618 | $227 |
| Ratio of expenses to average net assets | ||
| Before waivers and reimbursements of expenses(4) | 3.55% | 33.49% |
| After waivers and reimbursements of expenses(4) | 1.02% | 1.02% |
| Ratio of net investment income (loss) to average net assets | ||
| Before waivers and reimbursements of expenses(4) | (1.85)% | (30.60)% |
| After waivers and reimbursements of expenses(4) | 0.68% | 1.87% |
| Portfolio turnover rate(3) | 0.27% | 0.00% |
| (1) | Class I shares commenced operations on April 15, 2020. |
| (2) | Per share amounts are calculated using the average shares outstanding method. |
| (3) | Not annualized for periods less than one year. |
| (4) | Annualized for periods less than one year. |
The accompanying notes are an integral part of these financial statements.
| Semi-Annual Report | Jensen Global Quality Growth Fund | 31 |
Financial Highlights
Jensen Global Quality Growth Fund - Class Y
| Per Share Data: | six months ended November 30, 2020 (Unaudited) | period ended May 31, 2020(1) |
| Net asset value, beginning of period | $10.81 | $10.00 |
| Income from investment operations: | ||
| Net investment income(2) | 0.04 | 0.03 |
| Net realized and unrealized gain on investments | 1.70 | 0.78 |
| Total from investment operations | 1.74 | 0.81 |
| Less distributions: | ||
| Dividends from net investment income | (0.03) | – |
| Total distributions | (0.03) | – |
| Net asset value, end of period | $12.52 | $10.81 |
| Total return(3) | 16.13% | 8.10% |
| Supplemental data and ratios: | ||
| Net assets, end of period (000’s) | $13,766 | $1,206 |
| Ratio of expenses to average net assets | ||
| Before waivers and reimbursements of expenses(4) | 3.26% | 32.29% |
| After waivers and reimbursements of expenses(4) | 1.00% | 1.00% |
| Ratio of net investment income (loss) to average net assets | ||
| Before waivers and reimbursements of expenses(4) | (1.57)% | (29.29)% |
| After waivers and reimbursements of expenses(4) | 0.69% | 2.00% |
| Portfolio turnover rate(3) | 0.27% | 0.00% |
| (1) | Class Y shares commenced operations on April 15, 2020. |
| (2) | Per share amounts are calculated using the average shares outstanding method. |
| (3) | Not annualized for periods less than one year. |
| (4) | Annualized for periods less than one year. |
The accompanying notes are an integral part of these financial statements.
| 32 | Jensen Global Quality Growth Fund | Semi-Annual Report |
Notes to Financial Statements
November 30, 2020 (Unaudited)
| 1. | Organization |
Trust for Professional Managers (the “Trust”) was organized as a Delaware statutory trust under a Declaration of Trust dated May 29, 2001. The Trust is registered under the Investment Company Act of 1940, as amended (the “1940 Act”), as an open-end management investment company. The Jensen Quality Value Fund, formerly known as the Jensen Value Fund, and the Jensen Global Quality Growth Fund (each, a “Fund” and together the “Funds”), each represent a distinct diversified series with its own investment objective and policies within the Trust. The investment objective of the Jensen Quality Value Fund and the Jensen Global Quality Growth Fund is long-term capital appreciation. The Trust may issue an unlimited number of shares of beneficial interest at $0.001 par value. The assets of the Funds are segregated, and a shareholder’s interest is limited to the Fund in which shares are held. The Class J and Class I shares of the Jensen Quality Value Fund became effective and commenced operations on March 31, 2010. The Class Y shares of the Jensen Quality Value Fund became effective and commenced operations on January 15, 2020. The Jensen Global Quality Growth Fund commenced investment operations on April 15, 2020 for Class J, Class I, and Class Y shares. Class J shares are subject to a 0.25% distribution (Rule 12b-1) and shareholder servicing fee and Class I shares are subject to a shareholder servicing fee of up to 0.10%. Each class of shares has identical rights and privileges except with respect to the distribution (Rule 12b-1) and shareholder servicing fees, and voting rights on matters affecting a single share class. Costs incurred by the Funds in connection with the organization, registration and the initial public offering of shares were paid by Jensen Investment Management, Inc. (the “Adviser”), the Funds’ investment adviser.
The Funds are investment companies and accordingly follow the investment company accounting and reporting guidance of the Financial Accounting Standards Board (“FASB”) Accounting Standard Codification Topic 946 Financial Services–Investment Companies.
| 2. | Significant Accounting Policies |
The following is a summary of significant accounting policies consistently followed by the Funds in the preparation of the financial statements. These policies are in conformity with generally accepted accounting principles in the United States of America (“GAAP”).
(a) Investment Valuation – Each equity security owned by the Funds that is listed on a securities exchange, except those listed on the NASDAQ Stock Market LLC (“NASDAQ”), is valued at its last sale price on that exchange on the date as of which assets are valued. If a security is listed on more than one exchange, the Funds will use the price of the exchange that the Funds generally consider to be the principal exchange on which the stock is traded.
Fund securities listed on NASDAQ will be valued at the NASDAQ Official Closing Price, which may not necessarily represent the last sale price. If there has been no sale on such exchange or on NASDAQ on such day, the security is valued at (i) the mean between the most recent quoted bid and asked prices at the close of the exchange or (ii) the latest sales price on the Composite Market
| Semi-Annual Report | Jensen Quality Value Fund, Jensen Global Quality Growth Fund | 33 |
for the day such security is being valued. “Composite Market” means a consolidation of the trade information provided by national securities and foreign exchanges and over-the-counter markets, as published by an approved independent pricing service (“Pricing Service”).
Foreign securities will be priced in their local currencies as of the close of their primary exchange or market or as of the time a Fund calculates its net asset value (“NAV”), whichever is earlier. Foreign securities, currencies and other assets denominated in foreign currencies are then translated into U.S. dollars at the exchange rate of such currencies against the U.S. dollar, as provided by a Pricing Service or reporting agency. All assets denominated in foreign currencies will be converted into U.S. dollars using the applicable currency exchange rates as of the close of the New York Stock Exchange (“NYSE”), generally 4:00 p.m. Eastern Time.
Foreign securities are traded on foreign exchanges which typically close before the close of business on each day on which the NYSE is open. Each security trading on these exchanges may be valued utilizing a systematic fair valuation model provided by a Pricing Service. The valuation of each security that meets certain criteria in relation to the valuation model is systematically adjusted to reflect the impact of movement in the U.S. market after the foreign markets close and are classified as Level 2 securities. Securities that do not meet the criteria, or that are principally traded in other foreign markets, are valued as of the last reported sale price at the time the respective Fund determines its NAV, or when reliable market prices or quotations are not readily available, at the mean between the most recent bid and asked quotations as of the close of the appropriate exchange or other designated time.
Debt securities, including short-term debt instruments having a maturity of 60 days or less, are valued at the mean in accordance with prices supplied by a Pricing Service. Pricing Services may use various valuation methodologies such as the mean between the bid and the asked prices, matrix pricing and other analytical pricing models as well as market transactions and dealer quotations. If a price is not available from a Pricing Service, the most recent quotation obtained from one or more broker-dealers known to follow the issue will be obtained. Quotations will be valued at the mean between the bid and the offer. In the absence of available quotations, the securities will be priced at fair value, as described below. Any discount or premium is accreted or amortized using the constant yield method until maturity.
Redeemable securities issued by open-end, registered investment companies are valued at the NAV of such companies for purchase and/or redemption orders placed on that day. If, on a particular day, a share of an investment company is not listed on NASDAQ, such security’s fair value will be determined. Money market mutual funds are valued at cost. If cost does not represent current market value the securities will be priced at fair value.
When market quotations are not readily available, any security or other financial instrument is valued at its fair value as determined under procedures approved by the Trust’s Board of Trustees. These fair value procedures will also be used to price a security when corporate events, events in the securities market or world events cause the Adviser to believe that a security’s last sale price may not reflect its actual fair value. The intended effect of using fair value pricing procedures is to ensure that the Funds are accurately priced.
| 34 | Jensen Quality Value Fund, Jensen Global Quality Growth Fund | Semi-Annual Report |
FASB Accounting Standards Codification, “Fair Value Measurements and Disclosures” Topic 820 (“ASC 820”), establishes an authoritative definition of fair value and sets out a hierarchy for measuring fair value. ASC 820 requires an entity to evaluate certain factors to determine whether there has been a significant decrease in volume and level of activity for the security such that recent transactions and quoted prices may not be determinative of fair value and further analysis and adjustment may be necessary to estimate fair value. ASC 820 also requires enhanced disclosure regarding the inputs and valuation techniques used to measure fair value in those instances as well as expanded disclosure of valuation levels for each class of investments. These inputs are summarized in the three broad levels listed below:
| • | Level 1 – | Quoted prices in active markets for identical securities. | |
| • | Level 2 – | Other significant observable inputs (including quoted prices for similar securities, interest rates, prepayment speeds, credit risk, etc.). | |
| • | Level 3 – | Significant unobservable inputs (including a Fund’s own assumptions in determining the fair value of investments). |
The inputs or methodology used for valuing securities are not necessarily an indication of the risk associated with investing in those securities. The following is a summary of the inputs used to value the Fund’s investments carried at fair value as of November 30, 2020:
| Jensen Quality Value Fund | Level 1 | Level 2 | Level 3 | Total | ||||||||||||
| Common Stock(1) | $ | 74,426,965 | $— | $— | $ | 74,426,965 | ||||||||||
| Short-Term Investments | 3,290,297 | — | — | 3,290,297 | ||||||||||||
| Total Investments | $ | 77,717,262 | $— | $— | $ | 77,717,262 | ||||||||||
| Jensen Global Quality Growth Fund | Level 1 | Level 2 | Level 3 | Total | ||||||||||||
| Common Stock(1) | $ | 12,063,095 | $ | 4,634,222 | $— | $ | 16,697,317 | |||||||||
| Short-Term Investments | 223,529 | — | — | 223,529 | ||||||||||||
| Total Investments | $ | 12,286,624 | $ | 4,634,222 | $— | $ | 16,920,846 | |||||||||
| (1) | For further information regarding security characteristics, please see the Schedules of Investments. |
The Funds did not hold any investments during the six months ended November 30, 2020 with significant unobservable inputs which would be classified as Level 3. The Funds did not hold financial derivative instruments during the six months ended November 30, 2020.
(b) Foreign Securities and Currency – Investment securities and other assets and liabilities denominated in foreign currencies are translated into U.S. dollar amounts on the date of valuation. Purchases and sales of investment securities and income and expense items denominated in foreign currencies are translated into U.S. dollar amounts on the respective dates of such transactions.
The Funds do not isolate the portion of the results of operations from changes in foreign exchange rates on investments from those resulting from the changes in market prices of securities held. Reported net realized foreign exchange gains or losses arise from sales of portfolio securities, sales
| Semi-Annual Report | Jensen Quality Value Fund, Jensen Global Quality Growth Fund | 35 |
and maturities of short-term securities, sales of foreign currencies, currency gains or losses realized between trade and settlement dates on securities transactions, and the difference between the amounts of dividends, interest and foreign withholding taxes recorded on the Funds’ books, and the U.S. dollar equivalent of the amounts actually received or paid. Net unrealized foreign exchange gains and losses arise from changes in the values of assets and liabilities, including investments in securities at fiscal period end, resulting from changes in the exchange rate.
Investments in foreign securities entail certain risks. Individual foreign economies of certain countries may differ favorably or unfavorably from the U.S. economy in such respects as growth of gross national product, rate of inflation, capital reinvestment, resource self-sufficiency, diversification and balance of payments position. The internal politics of certain foreign countries may not be as stable as those of the United States. Since foreign securities normally are denominated and traded in foreign currencies, the value of a Fund’s assets may be affected favorably or unfavorably by currency exchange rates, currency exchange control regulations, foreign withholding taxes, and restrictions or prohibitions on the repatriation of foreign currencies. There may be less information publicly available about a foreign issuer than about a U.S. issuer, and foreign issuers are not generally subject to accounting, auditing, and financial reporting standards and practices comparable to those in the United States. The securities of some foreign issuers are less liquid and at times more volatile than securities of comparable U.S. issuers.
(c) Federal Income Taxes – The Funds intend to comply with the requirements of Subchapter M of the Internal Revenue Code necessary to qualify as a regulated investment company and to make the requisite distributions of income and capital gains to their shareholders sufficient to relieve them from all or substantially all federal income taxes. Therefore, no federal income tax provision has been provided.
As of and during the six months ended November 30, 2020, the Funds did not have a liability for any unrecognized tax benefits. The Funds recognize interest and penalties, if any, related to uncertain tax benefits as income tax expense in the Statements of Operations. During the six months ended November 30, 2020, the Funds did not incur any interest or penalties. The Funds have no examinations in progress. The Funds are also not aware of any tax provisions for which it is reasonably possible that the total amounts of unrecognized tax benefits will significantly change in the next twelve months.
(d) Distributions to Shareholders – The Funds will declare and distribute any net investment income quarterly. The Funds will distribute any net realized long- or short-term capital gains at least annually. Distributions from net realized gains for book purposes may include short-term capital gains. All short-term capital gains are included in ordinary income for tax purposes. Distributions to shareholders are recorded on the ex-dividend date. The Funds may also pay a special distribution at the end of the calendar year to comply with federal tax requirements. The Funds may utilize earnings and profits distributed to shareholders on redemption of shares as part of the dividend paid deduction.
| 36 | Jensen Quality Value Fund, Jensen Global Quality Growth Fund | Semi-Annual Report |
(e) Use of Estimates – The preparation of financial statements in conformity with GAAP requires management to make estimates and assumptions that affect the reported amounts of assets and liabilities and disclosure of contingent assets and liabilities at the date of the financial statements and the reported amounts of revenues and expenses during the reporting period. Actual results could differ from those estimates.
(f) Share Valuation – The NAV per share of each Fund is calculated by dividing the sum of the value of the securities held by each Fund, plus cash or other assets, minus all liabilities (including estimated accrued expenses) by the total number of shares outstanding for each Fund, rounded to the nearest cent. The Funds’ shares will not be priced on the days on which the NYSE is closed for trading.
(g) Allocation of Income, Expenses and Gains/Losses – Income, expenses (other than those deemed attributable to a specific share class), and gains and losses of each Fund are allocated daily to each class of shares based upon the ratio of net assets represented by each class as a percentage of the net assets of the Fund. Expenses deemed directly attributable to a class of shares are recorded by the specific class. Most Fund expenses are allocated by class based on relative net assets. Distribution (12b-1) and shareholder servicing fees are expensed at 0.25% of average daily net assets of Class J shares. Shareholder servicing fees are expensed at up to 0.10% of the average daily net assets of Class I shares. Expenses associated with a specific fund in the Trust are charged to that fund. Common Trust expenses are typically allocated evenly between the funds of the Trust, or by other equitable means.
(h) Other – Investment transactions are recorded on the trade date. The Funds determine the gain or loss from investment transactions using the specific identification method by comparing the original cost of the security lot sold with the net sale proceeds. Dividend income is recognized on the ex-dividend date and interest income is recognized on an accrual basis.
Witholding taxes on foreign dividends, net of any reclaims, have been provided for in accordance with the Funds’ understanding of the applicable country’s tax rules and rates.
| 3. | Federal Tax Matters |
The tax character of distributions paid during the years ended May 31, 2020 and May 31, 2019 for the Jensen Quality Value Fund were as follows:
| May 31, 2020 | May 31, 2019 | |||||||
| Ordinary Income | $337,802 | $913,744 | ||||||
| Long-Term Capital Gain | $1,573,005 | $1,040,514 | ||||||
There were no distributions paid during the period ended May 31, 2020 for the Jensen Global Quality Growth Fund.
| Semi-Annual Report | Jensen Quality Value Fund, Jensen Global Quality Growth Fund | 37 |
The components of accumulated earnings on a tax basis as of May 31, 2020 were as follows:
| Jensen Quality Value Fund | Jensen Global Quality Growth Fund | ||||||
| Cost basis of investments for federal income tax purposes | $41,528,721 | $1,786,525 | |||||
| Gross tax unrealized appreciation | $5,283,741 | $117,589 | |||||
| Gross tax unrealized depreciation | (2,525,041 | ) | (7,693 | ) | |||
| Net tax unrealized appreciation | 2,758,700 | 109,896 | |||||
| Undistributed ordinary income | 50,234 | 2,682 | |||||
| Undistributed long-term capital gain | — | — | |||||
| Distributable earnings | 50,234 | 2,682 | |||||
| Other accumulated losses | (592,084 | ) | — | ||||
| Total distributable earnings | $2,216,850 | $112,578 | |||||
The difference between book basis and tax basis of investments is primarily attributable to the deferral of losses on wash sales.
At May 31, 2020, the Jensen Quality Value Fund deferred, on a tax basis, post-October losses of $592,084.
Additionally, GAAP requires that certain components of net assets relating to permanent differences be reclassified between financial and tax reporting. These reclassifications have no effect on net assets or NAV per share. The permanent difference relates to tax equalization.
On the Statement of Assets and Liabilities, the following adjustments were made for permanent tax adjustments:
| Jensen Quality Value Fund | Jensen Global Quality Growth Fund | ||||||
| Total Distributable Earnings | $(25,258 | ) | $— | ||||
| Paid-in Capital | $25,258 | $— | |||||
4. Investment Adviser
The Trust has an Investment Advisory Agreement (the “Agreement”) with the Adviser to furnish investment advisory services to the Funds. Under the terms of the Agreement, the Funds compensate the Adviser for its management services at the annual rate of 0.65% and 0.75% of each Fund’s average daily net assets for the Jensen Quality Value Fund and Jensen Global Quality Growth Fund, respectively.
The Adviser has contractually agreed to waive its management fee and/or reimburse a Fund’s other expenses at least through the expiration dates listed below, to the extent necessary to ensure that the Fund’s total operating expenses (exclusive of front-end or contingent deferred sales loads, Rule 12b-1 plan fees, shareholder servicing plan fees, taxes, leverage (i.e., any expenses incurred in connection with borrowings made by the Fund), interest (including interest incurred in connection
| 38 | Jensen Quality Value Fund, Jensen Global Quality Growth Fund | Semi-Annual Report |
with bank and custody overdrafts), brokerage commissions and other transactional expenses, expenses incurred in connection with any merger or reorganization, dividends or interest expenses on short positions, acquired fund fees and expenses and extraordinary expenses such as litigation) do not exceed the expense limitation caps listed below of each Fund’s average daily net assets.
| Expiration Date | Expense Limitation Cap | ||||||
| Jensen Quality Value Fund | September 30, 2021 | 0.80 | % | ||||
| Jensen Global Quality Growth Fund | April 15, 2022 | 1.00 | % | ||||
For the six months ended November 30, 2020, expenses of $17,869, $12,404 and $72,986 were waived or reimbursed by the Adviser for Class J, Class I and Class Y shares, respectively for the Jensen Quality Value Fund. For the six months ended November 30, 2020, expenses of $14,707, $6,294 and $97,587 were waived or reimbursed by the Adviser for Class J, Class I and Class Y shares, respectively for the Jensen Global Quality Growth Fund. Any such waiver or reimbursement is subject to later adjustment to allow the Adviser to recoup amounts waived or reimbursed to the extent actual fees and expenses for a fiscal period do not exceed the lesser of: (1) the Expense Limitation Cap in place at the time of waiver or reimbursement or (2) the Expense Limitation Cap in place at the time of the recoupment; provided, however, that the Adviser shall only be entitled to recoup such amounts over the following three year period from the date of the waiver or reimbursement. During the six months ended November 30, 2020, $59,216 of previously waived expenses subject to recovery for the Jensen Quality Value Fund expired.
The following table shows the remaining waived or reimbursed expenses subject to potential recovery expiring during the fiscal period ending:
| Jensen Quality Value Fund | Jensen Global Quality Growth Fund | ||||||
| May 31, 2021 | $72,011 | $— | |||||
| May 31, 2022 | $ | 162,498 | $— | ||||
| May 31, 2023 | $ | 199,269 | $58,882 | ||||
| November 30, 2023 | $ | 103,259 | $ | 118,588 | |||
5. Distribution and Shareholder Servicing Plan
The Trust adopted a distribution and shareholder servicing plan pursuant to Rule 12b-1 (the “12b-1 Plan”), on behalf of the Funds, which authorizes it to pay Quasar Distributors, LLC (the “Distributor” or “Quasar”), the Funds’ distributor and principal underwriter, a distribution fee of 0.25% of a Fund’s average daily net assets attributable to Class J shares for services to Class J shareholders and distribution of Class J shares. The Trust adopted a shareholder servicing plan (the “Shareholder Servicing Plan”), on behalf of the Funds, which authorizes it to pay up to 0.10% of a Fund’s average daily net assets attributable to Class I shares to other financial institutions for shareholder servicing and maintenance of Class I shareholder accounts. The Distributor acts as the Funds’ principal underwriter in a continuous public offering of the Funds’ shares. The Distributor was an affiliate of
| Semi-Annual Report | Jensen Quality Value Fund, Jensen Global Quality Growth Fund | 39 |
Fund Services and U.S. Bank through March 30, 2020. Effective March 31, 2020, Foreside Financial Group, LLC (“Foreside”) acquired Quasar from U.S. Bancorp. As a result of the acquisition, Quasar became a wholly-owned broker-dealer subsidiary of Foreside and is no longer affiliated with U.S. Bancorp. The Board of Trustees of the Trust has approved a new Distribution Agreement to enable Quasar to continue serving as the Funds’ distributor. Fees incurred for the six months ended November 30, 2020, and owed as of November 30, 2020 are summarized below. The fees owed to the Distributor are included within accrued expenses and other liabilities on the Statement of Assets and Liabilities.
| 12b-1 Plan | Incurred | Owed | |||||
| Jensen Quality Value Fund | 12,413 | 7,507 | |||||
| Jensen Global Quality Growth Fund | 1,461 | 948 | |||||
| Shareholder Servicing | Incurred | Owed | |||||
| Jensen Quality Value Fund | 808 | 1,279 | |||||
| Jensen Global Quality Growth Fund | 49 | 27 | |||||
6. Related Party Transactions
U.S. Bancorp Fund Services, LLC, doing business as U.S. Bank Global Fund Services (“Fund Services” or the “Administrator”), acts as the Funds’ Administrator under an Administration Agreement. The Administrator prepares various federal and state regulatory filings, reports and returns for the Funds; prepares reports and materials to be supplied to the Trustees; monitors the activities of the Funds’ custodian, transfer agent and fund accountant; coordinates the preparation and payment of the Funds’ expenses and reviews the Funds’ expense accruals. Fees incurred for the six months ended November 30, 2020, and owed as of November 30, 2020 are as follows:
| Administration | Incurred | Owed | |||||
| Jensen Quality Value Fund | 17,222 | 10,184 | |||||
| Jensen Global Quality Growth Fund | 9,252 | 6,738 | |||||
Fund Services also serves as the fund accountant and transfer agent to the Funds. U.S. Bank National Association (“US Bank”), an affiliate of Fund Services, serves as the Funds’ custodian. Fees incurred for the six months ended November 30, 2020 and owed as of November 30, 2020 for fund accounting, transfer agency, and custody fees are as follows:
| Fund Accounting | Incurred | Owed | |||||
| Jensen Quality Value Fund | 11,910 | 7,938 | |||||
| Jensen Global Quality Growth Fund | 11,524 | 7,907 | |||||
| 40 | Jensen Quality Value Fund, Jensen Global Quality Growth Fund | Semi-Annual Report |
| Transfer Agency | Incurred | Owed | |||||
| Jensen Quality Value Fund | 26,417 | 15,937 | |||||
| Jensen Global Quality Growth Fund | 24,561 | 17,515 | |||||
| Custody | Incurred | Owed | |||||
| Jensen Quality Value Fund | 1,624 | 813 | |||||
| Jensen Global Quality Growth Fund | 5,539 | 4,019 | |||||
The Jensen Quality Value Fund has a line of credit with US Bank (see Note 10).
Certain officers of the Funds are also employees of Fund Services. A Trustee of the Trust is affiliated with Fund Services and US Bank.
The Trust’s Chief Compliance Officer is also an employee of Fund Services. Each Fund’s allocation of the Trust’s Chief Compliance Officer fee incurred for the six months ended November 30, 2020, and owed as of November 30, 2020 is as follows:
| Incurred | Owed | ||||||
| Jensen Quality Value Fund | 6,128 | 4,457 | |||||
| Jensen Global Quality Growth Fund | 6,225 | 4,128 | |||||
7. Capital Share Transactions
Transactions in shares of the Funds were as follows:
Jensen Quality Value Fund
| Class J | six months ended November 30, 2020 (Unaudited) | year ended May 31, 2020 | |||||
| Shares sold | 715,734 | 406,959 | |||||
| Shares issued in reinvestment of dividends | 1,558 | 13,720 | |||||
| Shares redeemed | (100,618 | ) | (80,413 | ) | |||
| Net increase | 616,674 | 340,266 | |||||
| Class I | six months ended November 30, 2020 (Unaudited) | year ended May 31, 2020 | |||||
| Shares sold | 1,065,149 | 412,126 | |||||
| Shares issued in reinvestment of dividends | 1,553 | 125,017 | |||||
| Shares redeemed | (42,257 | ) | (3,080,565 | ) | |||
| Net increase (decrease) | 1,024,445 | (2,543,422 | ) | ||||
| Semi-Annual Report | Jensen Quality Value Fund, Jensen Global Quality Growth Fund | 41 |
| Class Y | six months ended November 30, 2020 (Unaudited) | period ended May 31, 2020(1) | |||||
| Shares sold | 10,137 | 2,931,198 | |||||
| Shares issued in reinvestment of dividends | 9,952 | 8,058 | |||||
| Shares redeemed | (115,228 | ) | (21,410 | ) | |||
| Net increase (decrease) | (95,139 | ) | 2,917,846 | ||||
(1) Class Y commenced operations January 15, 2020.
Jensen Global Quality Growth Fund
| Class J | six months ended November 30, 2020 (Unaudited) | period ended May 31, 2020(2) | |||||
| Shares sold | 78,900 | 42,026 | |||||
| Shares issued in reinvestment of dividends | 153 | 0 | |||||
| Shares redeemed | (240 | ) | (10 | ) | |||
| Net increase | 78,813 | 42,016 | |||||
| Class I | six months ended November 30, 2020 (Unaudited) | period ended May 31, 2020(2) | |||||
| Shares sold | 108,069 | 21,050 | |||||
| Shares issued in reinvestment of dividends | 91 | 0 | |||||
| Shares redeemed | 0 | (10 | ) | ||||
| Net increase | 108,160 | 21,040 | |||||
| Class Y | six months ended November 30, 2020 (Unaudited) | period ended May 31, 2020(2) | |||||
| Shares sold | 986,237 | 111,588 | |||||
| Shares issued in reinvestment of dividends | 1,820 | 0 | |||||
| Shares redeemed | 0 | (10 | ) | ||||
| Net increase | 988,057 | 111,578 | |||||
(2) The Jensen Global Quality Growth Fund commenced operations April 15, 2020.
| 42 | Jensen Quality Value Fund, Jensen Global Quality Growth Fund | Semi-Annual Report |
8. Investment Transactions
The aggregate purchases and sales of securities, excluding short-term investments, for the Funds for the six months ended November 30, 2020 are summarized below. For the six months ended November 30, 2020, there were no purchases or sales of U.S. government securities for the Funds.
| Purchases | Sales | ||||||
| Jensen Quality Value Fund | 27,016,098 | 6,119,081 | |||||
| Jensen Global Quality Growth Fund | 13,759,217 | 26,874 | |||||
9. Beneficial Ownership
The beneficial ownership, either directly or indirectly, of more than 25% of the voting securities of a fund creates a presumption of control of the fund under Section 2(a)(9) of the 1940 Act. At November 30, 2020, the following shareholders held over 25% of a Fund’s shares outstanding:
Jensen Quality Value Fund
| Class J | ||||
| Charles Schwab & Co. Inc. | 37.46 | % | ||
| National Financial Services LLC. | 30.84 | % | ||
| Class I | ||||
| National Financial Services LLC. | 37.47 | % | ||
| Class Y | ||||
| Pershing, LLC. | 92.94 | % | ||
| Jensen Global Quality Growth Fund | ||||
| Class J | ||||
| Wells Fargo Clearing Services LLC. | 66.27 | % | ||
| Class I | ||||
| Charles Schwab & Co. Inc. | 84.48 | % | ||
| Class Y | ||||
| Pershing, LLC. | 91.90 | % | ||
| Semi-Annual Report | Jensen Quality Value Fund, Jensen Global Quality Growth Fund | 43 |
10. Line of Credit
At November 30, 2020, the Jensen Quality Value Fund had a line of credit in the amount of the lesser of $3,000,000 or 33.33% of the fair value of unencumbered assets of the Fund, which matures on August 7, 2021. This unsecured line of credit is intended to provide short-term financing, if necessary, subject to certain restrictions, in connection with shareholder redemptions. The interest rate on outstanding principal amounts is equal to the prime rate (3.25% as of November 30, 2020). The credit facility is with the Fund’s custodian, US Bank. During the six months ended November 30, 2020, the Jensen Quality Value Fund did not utilize the line of credit. The Jensen Global Quality Growth Fund does not have a line of credit.
11. Recent Market Events
U.S. and international markets have experienced significant periods of volatility in recent years due to a number of economic, political and global macro factors including the impact of the novel coronavirus (COVID-19) as a global pandemic, which has resulted in related public health issues, growth concerns in the U.S. and overseas, temporary and permanent layoffs in the private sector and rising unemployment claims and reduced consumer spending, all of which may lead to a substantial economic downturn or recession in the U.S. and global economies. The recovery from the effects of COVID-19 is uncertain and may last for an extended period of time. These developments as well as other events could result in further market volatility and negatively affect financial asset prices, the liquidity of certain securities and the normal operations of securities exchanges and other markets. As a result, the risk environment remains elevated. The Adviser will monitor developments and seek to manage each Fund in a manner consistent with achieving the Fund’s investment objective, but there can be no assurance that it will be successful in doing so.
12. Subsequent Events
On December 15, 2020, the following distributions were declared and paid from ordinary income and capital gains to shareholders of record as of December 14, 2020:
Ordinary Income
| Class J | Class I | Class Y | ||||||||
| Jensen Quality Value Fund | 16,170 | 31,433 | 61,064 | |||||||
| Jensen Global Quality Growth Fund | 747 | 1,824 | 16,007 | |||||||
| Short-Term Capital Gains | ||||||||||
| Class J | Class I | Class Y | ||||||||
| Jensen Quality Value Fund | 117,861 | 144,621 | 272,781 | |||||||
| Long-Term Capital Gains | ||||||||||
| Class J | Class I | Class Y | ||||||||
| Jensen Quality Value Fund | 36,831 | 45,193 | 85,242 | |||||||
| 44 | Jensen Quality Value Fund, Jensen Global Quality Growth Fund | Semi-Annual Report |
Expense Example – November 30, 2020 (Unaudited)
As a shareholder of the Funds, you incur ongoing costs, including investment management fees, distribution (12b-1) fees (Class J only) and shareholder servicing fees (Class I only), and other Fund expenses, which are indirectly paid by shareholders. These examples are intended to help you understand your ongoing costs (in dollars) of investing in the Funds and to compare these costs with the ongoing costs of investing in other mutual funds.
The Examples are based on an investment of $1,000 invested at the beginning of the period and held for the entire period referenced in each table.
Actual Expenses
The first lines of the tables below for each share class of the Funds provide information about actual account values and actual expenses. However, the table does not include shareholder specific fees, such as the $15.00 fee charged to IRA accounts or the $15.00 fee charged for wire redemptions. The table also does not include portfolio trading commissions and related trading costs. You may use the information in these lines, together with the amount you invested, to estimate the expenses that you paid over the period. Simply divide your account value by $1,000 (for example, an $8,600 account value divided by $1,000 = 8.6), then multiply the result by the number in the first line under the heading titled “Expenses Paid During Period” to estimate the expenses you paid on your account during this period.
Hypothetical Example for Comparison Purposes
The second lines of the tables below for each share class of the Funds provide information about hypothetical account values and hypothetical expenses based on the actual expense ratios for each share class of the Funds and an assumed rate of return of 5% per year before expenses, which is not the Funds’ actual return. The hypothetical account values and expenses may not be used to estimate the actual ending account balance or expenses you paid for the period. You may use this information to compare the ongoing costs of investing in the Funds and other funds. To do so, compare this 5% hypothetical example with the 5% hypothetical examples that appear in the shareholder reports of the other funds.
Please note that the expenses shown in the table are meant to highlight your ongoing costs only and do not reflect any transactional costs, such as sales charges (loads), redemption fees, or exchange fees which, although not charged by the Funds, may be charged by other funds. Therefore, the second lines of the tables are useful in comparing ongoing costs only, and will not help you determine the relative total costs of owning different funds.
| Semi-Annual Report | Jensen Quality Value Fund, Jensen Global Quality Growth Fund | 45 |
Expense Example Tables (Unaudited)
| Jensen Quality Value Fund – Class J | Beginning Account Value June 1, 2020 | Ending Account Value November 30, 2020 | Expenses Paid During Period* June 1, 2020 – November 30, 2020 | |||||||||||
| Actual | $ | 1,000.00 | $ | 1,216.60 | $5.83 | |||||||||
| Hypothetical (5% return before expenses) | 1,000.00 | 1,019.80 | 5.32 | |||||||||||
| * | Expenses are equal to Class J’s annualized expense ratio of 1.05%, multiplied by the average account value over the period, multiplied by 183/365 to reflect the one-half year period. |
| Jensen Quality Value Fund – Class I | Beginning Account Value June 1, 2020 | Ending Account Value November 30, 2020 | Expenses Paid During Period* June 1, 2020 – November 30, 2020 | |||||||||||
| Actual | $ | 1,000.00 | $ | 1,218.50 | $4.56 | |||||||||
| Hypothetical (5% return before expenses) | 1,000.00 | 1,020.96 | 4.15 | |||||||||||
| * | Expenses are equal to Class I’s annualized expense ratio of 0.82%, multiplied by the average account value over the period, multiplied by 183/365 to reflect the one-half year period. |
| Jensen Quality Value Fund – Class Y | Beginning Account Value June 1, 2020 | Ending Account Value November 30, 2020 | Expenses Paid During Period* June 1, 2020 – November 30, 2020 | |||||||||||
| Actual | $ | 1,000.00 | $ | 1,218.10 | $4.45 | |||||||||
| Hypothetical (5% return before expenses) | 1,000.00 | 1,021.06 | 4.05 | |||||||||||
| * | Expenses are equal to Class Y’s annualized expense ratio of 0.80%, multiplied by the average account value over the period, multiplied by 138/365 to reflect the one-half year period. |
| Jensen Global Quality Growth Fund – Class J | Beginning Account Value June 1, 2020 | Ending Account Value November 30, 2020 | Expenses Paid During Period* June 1, 2020 – November 30, 2020 | |||||||||||
| Actual | $ | 1,000.00 | $ | 1,159.50 | $6.77 | |||||||||
| Hypothetical (5% return before expenses) | 1,000.00 | 1,018.80 | 6.33 | |||||||||||
| * | Expenses are equal to Class J’s annualized expense ratio of 1.25%, multiplied by the average account value over the period, multiplied by 183/365 to reflect the one-half year period. |
| 46 | Jensen Quality Value Fund, Jensen Global Quality Growth Fund | Semi-Annual Report |
| Jensen Global Quality Growth Fund – Class I | Beginning Account Value June 1, 2020 | Ending Account Value November 30, 2020 | Expenses Paid During Period* June 1, 2020 – November 30, 2020 | |||||||||||
| Actual | $ | 1,000.00 | $ | 1,161.20 | $5.53 | |||||||||
| Hypothetical (5% return before expenses) | 1,000.00 | 1,019.95 | 5.16 | |||||||||||
| * | Expenses are equal to Class I’s annualized expense ratio of 1.02%, multiplied by the average account value over the period, multiplied by 183/365 to reflect the one-half year period. |
| Jensen Global Quality Growth Fund – Class Y | Beginning Account Value June 1, 2020 | Ending Account Value November 30, 2020 | Expenses Paid During Period* June 1, 2020 – November 30, 2020 | |||||||||||
| Actual | $ | 1,000.00 | $ | 1,161.30 | $5.42 | |||||||||
| Hypothetical (5% return before expenses) | 1,000.00 | 1,020.05 | 5.06 | |||||||||||
| * | Expenses are equal to Class Y’s annualized expense ratio of 1.00%, multiplied by the average account value over the period, multiplied by 183/365 to reflect the one-half year period. |
1. Shareholder Notification of Federal Tax Status
The Jensen Quality Value Fund designated 100.00% of dividends declared during the fiscal year ended May 31, 2020 as dividends qualifying for the dividends received deduction available to corporate shareholders.
The Jensen Quality Value Fund designated 100.00% of dividends declared from net investment income during the fiscal year ended May 31, 2020 as qualified dividend income under the Jobs and Growth Tax Relief Reconciliation Act of 2003.
The Jensen Quality Value Fund designated 0.00% of taxable ordinary income distributions as short-term capital gain distributions under Internal Revenue Code Section 871(k)(2)(c) for the year ended May 31, 2020.
Additional Information Applicable to Foreign Shareholders Only:
The Jensen Quality Value Fund designated 0.00% of ordinary income distributions as interest-related dividends under Internal Revenue Code Section 871(k)(1)(c).
2. Availability of Proxy Voting Information
The Funds have adopted proxy voting policies and procedures that delegate to the Adviser the authority to vote proxies. A description of the Funds’ proxy voting policies and procedures is available without charge, upon request, by calling the Funds toll free at 800-992-4144. A description of these policies and procedures is also included in the Funds’ Statement of Additional Information, which is available on the SEC’s website at http://www.sec.gov.
| Semi-Annual Report | Jensen Quality Value Fund, Jensen Global Quality Growth Fund | 47 |
The Funds’ proxy voting record for the most recent 12-month period ended June 30 is available without charge, upon request, by calling toll free, 800-992-4144, or by accessing the SEC’s website at http://www.sec.gov.
3. Portfolio Holdings
The Funds file a complete schedule of portfolio holdings with the SEC for the first and third quarters of each fiscal year on Part F of Form N-PORT. Shareholders may view the Funds’ Form N-PORT reports on the SEC’s website at http://www.sec.gov.
4. Householding
In an effort to decrease costs, the Funds intend to reduce the number of duplicate prospectuses and annual and semi-annual reports you receive by sending only one copy of each to those addresses shared by two or more accounts and to shareholders the Funds reasonably believe are from the same family or household. Once implemented, if you would like to discontinue householding for your accounts, please call the Funds toll-free at 800-992-4144 to request individual copies of these documents. Once the Funds receive notice to stop householding, the Funds will begin sending individual copies 30 days after receiving your request. This policy does not apply to account statements.
| 48 | Jensen Quality Value Fund, Jensen Global Quality Growth Fund | Semi-Annual Report |
Basis for Trustees’ Approval of Investment Advisory Agreement
The Board of Trustees (the “Trustees”) of Trust for Professional Managers (the “Trust”) met on August 18, 2020 to consider the renewal of the Investment Advisory Agreement (the “Agreement”) between the Trust, on behalf of the Jensen Quality Value Fund (the “Fund”), a series of the Trust, and Jensen Investment Management, Inc., the Fund’s investment adviser (the “Adviser”). The Trustees also met at a prior meeting held on June 25, 2020 (the “June 25, 2020 Meeting”) to review materials related to the renewal of the Agreement. Prior to these meetings, the Trustees requested and received materials to assist them in considering the renewal of the Agreement. The materials provided contained information with respect to the factors enumerated below, including a copy of the Agreement, a memorandum prepared by the Trust’s outside legal counsel discussing in detail the Trustees’ fiduciary obligations and the factors they should assess in considering the renewal of the Agreement, detailed comparative information relating to the Fund’s performance, as well as the management fees and other expenses of the Fund, due diligence materials relating to the Adviser (including a due diligence questionnaire completed on behalf of the Fund by the Adviser, the Adviser’s Form ADV, select financial statements of the Adviser, bibliographic information of the Adviser’s key management and compliance personnel, comparative fee information for the Fund and a summary detailing key provisions of the Adviser’s written compliance program, including its code of ethics) and other pertinent information. The Trustees also received information periodically throughout the year that was relevant to the Agreement renewal process, including performance, management fee and other expense information. Based on their evaluation of the information provided by the Adviser, in conjunction with the Fund’s other service providers, the Trustees, by a unanimous vote (including a separate vote of the Trustees who are not “interested persons,” as that term is defined in the Investment Company Act of 1940, as amended (the “Independent Trustees”)), approved the continuation of the Agreement for an additional one-year term ending August 31, 2021.
Discussion of Factors Considered
In considering the approval of the Agreement and reaching their conclusions, the Trustees reviewed and analyzed various factors that they determined were relevant, including the factors enumerated below.
1. Nature, Extent and Quality of Services Provided to the Fund
The Trustees considered the nature, extent and quality of services provided by the Adviser to the Fund and the amount of time devoted by the Adviser’s staff to the Fund’s operations. The Trustees considered the Adviser’s specific responsibilities in all aspects of day-to-day management of the Fund, as well as the qualifications, experience and responsibilities of Eric H. Schoenstein, Kurt M. Havnaer and Adam D. Calamar, the Fund’s portfolio managers, and other key personnel at the Adviser involved in the day-to-day activities of the Fund. The Trustees reviewed information provided by the Adviser in a due diligence summary, including the structure of the Adviser’s compliance program and discussed
| Semi-Annual Report | Jensen Quality Value Fund, Jensen Global Quality Growth Fund | 49 |
the Adviser’s marketing activities and its continuing commitment to the Fund. The Trustees noted that during the course of the prior year they had met with the Adviser to discuss various performance, marketing and compliance issues. The Trustees also noted any services that extended beyond portfolio management, and they considered the brokerage practices of the Adviser. The Trustees discussed the Adviser’s handling of compliance matters, including the reports of the Trust’s chief compliance officer to the Trustees on the effectiveness of the Adviser’s compliance program. The Trustees also considered the Adviser’s overall financial condition, as well as the implementation and operational effectiveness of the Adviser’s business continuity plan in response to the novel coronavirus (COVID-19) pandemic and challenges to day-to-day operations in a predominately work-from-home environment. The Trustees concluded that the Adviser had sufficient quality and depth of personnel, resources, investment methods and compliance policies and procedures essential to performing its duties under the Advisory Agreement and that the nature, overall quality and extent of the management services provided to the Fund, as well as the Adviser’s compliance program, were satisfactory and reliable.
2. Investment Performance of the Fund and the Adviser
The Trustees discussed the performance of the Fund’s Class I shares for the quarter, one-year, three-year, five-year, ten-year and since inception periods ended March 31, 2020. In assessing the quality of the portfolio management services provided by the Adviser, the Trustees also compared the short-term and longer-term performance of the Class I shares of the Fund on both an absolute basis and in comparison to a benchmark index, the Russell 2500® Total Return Index. The Trustees also compared the Fund’s Class J shares performance for the quarter, one-year, three-year, five-year and ten-year periods ended March 31, 2020 in comparison to a peer group of U.S. open-end mid-cap value funds in the Fund’s current Morningstar category as constructed by data presented by Morningstar Direct (the “Morningstar Peer Group”). The Trustees noted the Adviser did not manage any other accounts with the same or similar investment strategies as the Fund.
The Trustees noted that for the quarter, one-year, three-year and five-year periods ended March 31, 2020, the Fund’s performance for Class J shares ranked above the Morningstar Peer Group median, and, for the three-year period, was the best performing fund in the Morningstar Peer Group. The Trustees noted that for the ten-year period ended March 31, 2020, the Fund’s performance for Class J shares equaled the Morningstar Peer Group median. The Trustees also noted that for the ten-year and since inception periods ended March 31, 2020, the Fund’s Class I shares had underperformed the Russell 2500® Total Return Index, but that for the quarter, one-year, three-year, and five-year periods ended March 31, 2020, the Fund’s Class I shares had outperformed the Russell 2500® Total Return Index.
After considering all of the information, the Trustees concluded that the performance obtained by the Adviser for the Fund was satisfactory under current market conditions. Although past performance is not a guarantee or indication of future results, the Trustees determined that the Fund and its shareholders were likely to benefit from the Adviser’s continued management.
| 50 | Jensen Quality Value Fund, Jensen Global Quality Growth Fund | Semi-Annual Report |
3. Costs of Services Provided and Profits Realized by the Adviser
The Trustees considered the cost of services and the structure of the Adviser’s fees, including a review of the expense analyses and other pertinent material with respect to the Fund. The Trustees reviewed the related statistical information and other materials provided, including the comparative expenses, expense components and peer group selection. The Trustees also considered the cost structure of the Fund relative to the Morningstar Peer Group.
The Trustees also considered the overall profitability of the Adviser, reviewing the Adviser’s financial information and noted that the Adviser had subsidized the Fund’s operations since the Fund’s inception, and had not yet recouped those subsidies. The Trustees also examined the level of profits realized by the Adviser from the fees payable under the Advisory Agreement, as well as the Fund’s brokerage practices. These considerations were based on materials requested by the Trustees and the Fund’s administrator specifically for the June 25, 2020 meeting and the August 18, 2020 meeting at which the Advisory Agreement was formally considered, as well as the reports prepared by the Adviser over the course of the year.
The Trustees noted that the Fund’s contractual management fee of 0.65% was below its Morningstar Peer Group average of 0.73%. The Trustees observed that the Fund’s total expense ratio of 0.80% (net of fee waivers and expense reimbursements and which includes shareholder servicing fees of 0.02%) for Class J shares was below the Morningstar Peer Group average (which excludes Rule 12b-1 fees) of 0.94%.
The Trustees concluded that the Fund’s expenses and the management fees paid to the Adviser were fair and reasonable in light of the comparative performance, expense and management fee information. The Trustees further concluded, based on a profitability analysis prepared by the Adviser, that the Fund was not profitable to the Adviser, but the Adviser maintained adequate profit levels to support its services to the Fund from the revenues of its overall investment advisory business, despite its subsidies to support the Fund’s operations.
4. Extent of Economies of Scale as the Fund Grows
The Trustees compared the Fund’s expenses relative to its peer group and discussed realized and potential economies of scale. The Trustees also reviewed the structure of the Fund’s management fee and whether the Fund was large enough to generate economies of scale for shareholders or whether economies of scale would be expected to be realized as Fund assets grow (and if so, how those economies of scale were being or would be shared with shareholders). The Trustees reviewed fee waivers and expense reimbursements by the Adviser with respect to the Fund. The Trustees noted that the Fund’s management fee structure did not contain any breakpoint reductions as the Fund’s assets grow in size, but that the feasibility of incorporating breakpoints would continue to be reviewed on a regular basis. With respect to the Adviser’s fee structure, the Trustees concluded that the current fee structure was reasonable and reflected a sharing of economies of scale between the Adviser and the Fund at the Fund’s current asset level.
| Semi-Annual Report | Jensen Quality Value Fund, Jensen Global Quality Growth Fund | 51 |
5. Benefits Derived from the Relationship with the Fund
The Trustees considered the direct and indirect benefits that could be realized by the Adviser from its association with the Fund. The Trustees concluded that the benefits the Adviser may receive, such as greater name recognition or the ability to attract additional investor assets appear to be reasonable, and in many cases may benefit the Fund.
Conclusions
The Trustees considered all of the foregoing factors. In considering the renewal of the Advisory Agreement, the Trustees did not identify any one factor as all-important, but rather considered these factors collectively in light of the Fund’s surrounding circumstances. Based on this review, the Trustees, including a majority of the Independent Trustees, approved the continuation of the Advisory Agreement for an additional term ending August 31, 2021 as being in the best interests of the Fund and its shareholders.
| 52 | Jensen Quality Value Fund, Jensen Global Quality Growth Fund | Semi-Annual Report |
Notice of Privacy Policy & Practices
We collect non-public personal information about you from the following sources:
| · | information we receive about you on applications or other forms; | |
| · | information you give us orally; and | |
| · | information about your transactions with us or others. |
We do not disclose any non-public personal information about our shareholders or former shareholders without the shareholder’s authorization, except as permitted by law or in response to inquiries from governmental authorities. We may share information with affiliated parties and unaffiliated third parties with whom we have contracts for servicing the Funds. We will provide unaffiliated third parties with only the information necessary to carry out their assigned responsibility. All shareholder records will be disposed of in accordance with applicable law. We maintain physical, electronic and procedural safeguards to protect your non-public personal information and require third parties to treat your non-public personal information with the same high degree of confidentiality.
In the event that you hold shares of the Funds through a financial intermediary, including, but not limited to, a broker-dealer, bank or trust company, the privacy policy of your financial intermediary would govern how your non-public personal information would be shared with unaffiliated third parties.
Indemnifications
Under the Trust’s organizational documents, its officers and Trustees are indemnified against certain liabilities arising out of the performance of their duties to the Funds. In addition, in the normal course of business, the Funds enter into contracts that provide general indemnifications to other parties. The Funds’ maximum exposure under these arrangements is unknown as this would involve future claims that may be made against the Funds that have not yet occurred. However, the Funds have not had prior claims or losses pursuant to these contracts and expects the risk of loss to be remote.
Information About Trustees
The business and affairs of the Trust are managed under the direction of the Trust’s Board of Trustees. Information pertaining to the Trustees of the Trust is set forth below. The Statement of Additional Information includes additional information about the Trustees and is available, without charge, upon request by calling 800-992-4144.
| Semi-Annual Report | Jensen Quality Value Fund, Jensen Global Quality Growth Fund | 53 |
Independent Trustees (Unaudited)
Name, Address and Year of Birth | Position(s) Held with the Trust | Term of Office and Length of Time Served | Number of Portfolios in Trust Overseen by Trustee | Principal Occupation(s) During the Past Five Years | Other Directorships Held by Trustee During the Past Five Years |
| Michael D. Akers, Ph.D. 615 E. Michigan St. Milwaukee, WI 53202 Year of Birth: 1955 | Trustee | Indefinite Term; Since August 22, 2001 | 20 | Professor Emeritus, Department of Accounting (June 2019-present), Professor, Department of Accounting (2004-2019), Chair, Department of Accounting (2004-2017), Marquette University. | Independent Trustee, USA MUTUALS (an open-end investment company with two portfolios). |
| Gary A. Drska 615 E. Michigan St. Milwaukee, WI 53202 Year of Birth: 1956 | Trustee | Indefinite Term; Since August 22, 2001 | 20 | Pilot, Frontier/ Midwest Airlines, Inc. (airline company) (1986-present). | Independent Trustee, USA MUTUALS (an open-end investment company with two portfolios). |
| Jonas B. Siegel 615 E. Michigan St. Milwaukee, WI 53202 Year of Birth: 1943 | Trustee | Indefinite Term; Since October 23, 2009 | 20 | Retired (2011-present); Managing Director, Chief Administrative Officer (“CAO”) and Chief Compliance Officer (“CCO”), Granite Capital International Group, L.P. (an investment management firm) (1994-2011). | Independent Trustee, Gottex Trust (an open-end investment company) (2010-2016); Independent Manager, Ramius IDF fund complex (two closed-end investment companies) (2010-2015); Independent Trustee, Gottex Multi-Asset Endowment fund complex (three closed-end investment companies) (2010-2015); Independent Trustee, Gottex Multi-Alternatives fund complex (three closed-end investment companies) (2010-2015). |
| 54 | Jensen Quality Value Fund, Jensen Global Quality Growth Fund | Semi-Annual Report |
Interested Trustee and Officers (Unaudited)
| Name, Address and Year of Birth | Position(s) Held with the Trust | Term of Office and Length of Time Served | Number of Portfolios in Trust Overseen by Trustee | Principal Occupation(s) During the Past Five Years | Other Directorships Held by Trustee During the Past Five Years |
| Joseph C. Neuberger* 615 E. Michigan St. Milwaukee, WI 53202 Year of Birth: 1962 | Chairperson and Trustee | Indefinite Term; Since August 22, 2001 | 20 | President (2017-present), Chief Operating Officer (2016-2020), Executive Vice President (1994-2017), U.S. Bancorp Fund Services, LLC. | Trustee; USA Mutuals (an open-end investment company) (2001-2018); Trustee, Buffalo Funds (an open-end investment company) (2003-2017). |
| John P. Buckel 615 E. Michigan St. Milwaukee, WI 53202 Year of Birth: 1957 | President and Principal Executive Officer | Indefinite Term; Since January 24, 2013 | N/A | Vice President, U.S. Bancorp Fund Services, LLC (2004-present). | N/A |
| Jennifer A. Lima 615 E. Michigan St. Milwaukee, WI 53202 Year of Birth: 1974 | Vice President, Treasurer and Principal Financial and Accounting Officer | Indefinite Term; Since January 24, 2013 | N/A | Vice President, U.S. Bancorp Fund Services, LLC (2002-present). | N/A |
| Elizabeth B. Scalf 615 E. Michigan St. Milwaukee, WI 53202 Year of Birth: 1985 | Chief Compliance Officer, Vice President and Anti- Money Laundering Officer | Indefinite Term; Since July 1, 2017 | N/A | Senior Vice President, U.S. Bancorp Fund Services, LLC (February 2017-present); Vice President and Assistant CCO, Heartland Advisors, Inc. (December 2016-January 2017); Vice President and CCO, Heartland Group, Inc. (May 2016-November 2016); Vice President, CCO and Senior Legal Counsel (May 2016-November 2016), Assistant CCO and Senior Legal Counsel (January 2016-April 2016), Senior Legal and Compliance Counsel (2013-2015), Heartland Advisors, Inc. | N/A |
| Jay S. Fitton 615 E. Michigan St. Milwaukee, WI 53202 Year of Birth: 1970 | Secretary | Indefinite Term; Since July 22, 2019 | N/A | Assistant Vice President, U.S. Bancorp Fund Services, LLC (2019-present); Partner, Practus, LLP (2018-2019); Counsel, Drinker Biddle & Reath LLP (2016-2018); Counsel, Huntington Bancshares, Inc. (2011-2015). | N/A |
| Semi-Annual Report | Jensen Quality Value Fund, Jensen Global Quality Growth Fund | 55 |
| Name, Address and Year of Birth | Position(s) Held with the Trust | Term of Office and Length of Time Served | Number of Portfolios in Trust Overseen by Trustee | Principal Occupation(s) During the Past Five Years | Other Directorships Held by Trustee During the Past Five Years |
| Kelly A. Burns 615 E. Michigan St. Milwaukee, WI 53202 Year of Birth: 1987 | Assistant Treasurer | Indefinite Term; Since April 23, 2015 | N/A | Assistant Vice President, U.S. Bancorp Fund Services, LLC (2011-present). | N/A |
| Melissa Aguinaga 615 E. Michigan St. Milwaukee, WI 53202 Year of Birth: 1987 | Assistant Treasurer | Indefinite Term; Since July 1, 2015 | N/A | Assistant Vice President, U.S. Bancorp Fund Services, LLC (2010-present). | N/A |
| Laura A. Carroll 615 E. Michigan St. Milwaukee, WI 53202 Year of Birth: 1985 | Assistant Treasurer | Indefinite Term; Since August 20, 2018 | N/A | Assistant Vice President, U.S. Bancorp Fund Services, LLC (2007-present). | N/A |
| * | Mr. Neuberger is deemed to be an “interested person” of the Trust as defined by the 1940 Act due to his position and material business relationship with the Trust. |
| 56 | Jensen Quality Value Fund, Jensen Global Quality Growth Fund | Semi-Annual Report |

JN-SEMIQV
Jensen Quality Value Fund
Jensen Global Quality Growth Fund
| Class J Shares | Class I Shares | Class Y Shares |
Investment Adviser Jensen Investment Management, Inc.
Fund Administrator, Transfer Agent, U.S. Bancorp Fund Services, LLC
Custodian U.S. Bank National Association
Legal Counsel Godfrey & Kahn, S.C.
Independent Registered Public Accounting Firm Cohen & Company, Ltd.
Distributor Quasar Distributors, LLC
jenseninvestment.com
| ||
This report has been prepared for shareholders and may be distributed to others only if preceded or accompanied by a current prospectus
Item 2. Code of Ethics.
Not applicable for semi-annual reports.
Item 3. Audit Committee Financial Expert.
Not applicable for semi-annual reports.
Item 4. Principal Accountant Fees and Services.
Not applicable for semi-annual reports.
Item 5. Audit Committee of Listed Registrants.
Not applicable to registrants who are not listed issuers (as defined in Rule 10A-3 under the Securities Exchange Act of 1934).
Item 6. Investments.
| (a) | Schedule of Investments is included as part of the report to shareholders filed under Item 1 of this Form. |
| (b) | Not Applicable. |
Item 7. Disclosure of Proxy Voting Policies and Procedures for Closed-End Management Investment Companies.
Not applicable to open-end investment companies.
Item 8. Portfolio Managers of Closed-End Management Investment Companies.
Not applicable to open-end investment companies.
Item 9. Purchases of Equity Securities by Closed-End Management Investment Company and Affiliated Purchasers.
Not applicable to open-end investment companies.
Item 10. Submission of Matters to a Vote of Security Holders.
There have been no material changes to the procedures by which shareholders may recommend nominees to the registrant’s board of trustees.
1
Item 11. Controls and Procedures.
| (a) | The Registrant’s President and Treasurer have reviewed the Registrant’s disclosure controls and procedures (as defined in Rule 30a-3(c) under the Investment Company Act of 1940 (the “Act”)) as of a date within 90 days of the filing of this report, as required by Rule 30a-3(b) under the Act and Rules 13a-15(b) or 15d-15(b) under the Securities Exchange Act of 1934. Based on their review, such officers have concluded that the disclosure controls and procedures are effective in ensuring that information required to be disclosed in this report is appropriately recorded, processed, summarized and reported and made known to them by others within the Registrant and by the Registrant’s service provider. |
| (b) | There were no changes in the Registrant’s internal control over financial reporting (as defined in Rule 30a-3(d) under the Act) that occurred during the period covered by this report that has materially affected, or is reasonably likely to materially affect, the Registrant’s internal control over financial reporting. |
Item 12. Disclosure of Securities Lending Activities for Closed-End Management Investment Companies
Not applicable to open-end investment companies.
Item 13. Exhibits.
| (a) | (1) Any code of ethics or amendment thereto, that is the subject of the disclosure required by Item 2, to the extent that the registrant intends to satisfy Item 2 requirements through filing an exhibit. Incorporated by reference to previous Form N-CSR filed August 6, 2020. |
(3) Any written solicitation to purchase securities under Rule 23c-1 under the Act sent or given during the period covered by the report by or on behalf of the registrant to 10 or more persons. Not applicable to open-end investment companies.
| (4) | Change in the registrant’s independent public accountant. There was no change in the registrant’s independent public accountant for the period covered by this report. |
| (b) | Certifications pursuant to Section 906 of the Sarbanes-Oxley Act of 2002. Furnished herewith. |
2
SIGNATURES
Pursuant to the requirements of the Securities Exchange Act of 1934 and the Investment Company Act of 1940, the registrant has duly caused this report to be signed on its behalf by the undersigned, thereunto duly authorized.
| (Registrant) | Trust for Professional Managers |
| By (Signature and Title)* | /s/ John Buckel | |||
| John Buckel, President | ||||
| Date | 2/3/2021 |
Pursuant to the requirements of the Securities Exchange Act of 1934 and the Investment Company Act of 1940, this report has been signed below by the following persons on behalf of the registrant and in the capacities and on the dates indicated.
| By (Signature and Title)* | /s/ John Buckel | |||
| John Buckel, President | ||||
| Date | 2/3/2021 |
| By (Signature and Title)* | /s/ Jennifer Lima | |||
| Jennifer Lima, Treasurer | ||||
| Date | 2/3/2021 |
* Print the name and title of each signing officer under his or her signature.
3