UNITED STATES
SECURITIES AND EXCHANGE COMMISSION
Washington, D.C. 20549
FORM N-CSR
CERTIFIED SHAREHOLDER REPORT OF REGISTERED
MANAGEMENT INVESTMENT COMPANIES
Investment Company Act file number 811-10401
Trust for Professional Managers
(Exact name of registrant as specified in charter)
615 East Michigan Street
Milwaukee, WI 53202
(Address of principal executive offices) (Zip code)
Jay S. Fitton
U.S. Bancorp Fund Services, LLC
615 East Michigan Street
Milwaukee, WI 53202
(Name and address of agent for service)
(513) 629-8104
Registrant’s telephone number, including area code
Date of fiscal year end: December 31, 2021
Date of reporting period: June 30, 2021
EX.99.IND.PUB.ACCT
Item 1. Reports to Stockholders.
(a)
Marketfield Fund
Semi-Annual Report

June 30, 2021
Investment Adviser
Marketfield Asset Management LLC
369 Lexington Avenue
3rd Floor
New York, New York 10017
www.marketfield.com
Table of Contents
Marketfield Fund Semi-Annual Report 2021
Chairman’s Report
Marketfield Fund Class I shares generated a return of 5.72% for the six months ended June 30, 2021, compared to a total return of 15.25% for the S&P 500 (SPX) Index. The 2nd quarter started strongly, but from mid-May onwards cyclical exposure lost ground while growth equities broke out to the upside. Absent actually losing money, this is the worst combination for our portfolio, which remains positioned towards strong cyclical activity in the U.S. and elsewhere. Although this view is expressed through a variety of different sectors and geographic exposure this was a very broad divide between winners and losers, with the June performance of the Russell 1000 Growth Index outperforming the Russell 1000 Value Index by the largest amount in 20 years. We do not ourselves target “value” as a concept in our portfolio, but many of the cyclical equities that we own are included in the category, as are most of the country benchmarks that we are exposed to, while our index hedges on the short side gained ground during the last few weeks of the 2nd quarter.
It is hard to point to a clear fundamental catalyst behind the shift in performance, other than the swing of momentum forcing new funds down a very well defined path that generally bypassed our own exposure. Looking ahead, we do not expect this to continue, particularly if earnings once again make clear the power of corporate performance is in cyclically focused sectors. We believe that we are still fairly early in the resurgence of activity centered around durable goods production and consumption, and that the reflationary forces being generated are likely to remain in place for much longer than consensus expects. However, this view is at odds with far more influential voices than our own, particularly that of the Federal Reserve. This institution has thus far managed to keep the debate around monetary policy centered around the concept of “transitory” inflationary pressures, or put another way, a short window of excess profitability for sectors that stand to benefit from them. This means that P/E valuations in many cases (particularly extractive industries and homebuilders) remain quite modest, since current earnings are not expected to persist much longer. If we are correct, and durable goods spending proves to be surprisingly “durable”, then a rerating of many of these sectors should follow in due course.
As to specific performance, we would note that Energy bucked the deterioration during late-May and June, probably reflecting the lower positioning in the average portfolio. We have used periods of weakness to add to this sector, mostly by increasing the size of existing positions, and ended the 2nd quarter with 6.7% of exposure to the sector. Materials overall performed well, but made most of the return early in the 2nd quarter and lagged thereafter. Homebuilders were little changed overall, but again saw the same split between early and late 2nd quarter performance, and Industrial exposure generated a small loss, caused mostly by a sharp decline in machinery and transportation equities late in the 2nd quarter. As far as geographic exposure was concerned, overall U.S. performance was slightly negative, while Japan and Europe were virtually unchanged. Emerging market performance was positive, helped by materials exposure in Brazil and Russia.
On the short side, the portfolio suffered losses in its index hedges and also its Commercial Real Estate exposure. As far as the former is concerned, the hedges did their job during periods of general weakness, but the narrowing of performance later in the 2nd quarter meant that the long side of the portfolio was unable to compensate for the drag of hedging. For Commercial Real Estate, we have been surprised at the market’s willingness to look through the obvious deterioration of market fundamentals, and also the widespread use of the sector as an “inflation hedge” that ignores the long term nature of most office lease obligations. We did therefore trim positions significantly during the 2nd quarter and will wait for a more opportune moment to reengage.
July 8, 2021
Michael Shaoul
Chairman, CEO & Portfolio Manager
1
Chief Investment Officer’s Report
Transflation
This most recent cycle in monetary and economic affairs will likely be remembered not only for the Federal Reserve Board’s generosity but also for its linguistic expansion that features “transitory” as a critical descriptor of the 2021 version of inflation.
Inflation is said to appear in a wide variety of flavors that warrant an array of prefixes and descriptors. These include hyper, dis, low, de, structural, stubborn, Latin American style and persistent. Adding transitory to the mix is either self-evident or self delusional, depending upon one’s level of cynicism.
All phenomena in the known universe are transitory. That does not mean that they can be dismissed.
Economic conditions, as with all else, are subject to unrelenting change. The designation of transitory inflation (or “transflation”, as we prefer), as well as belaboring the obvious, implies a rationale for ignoring price data and persisting with emergency policy measures that have no emergency to address.
We have said for many years that the Federal Reserve Board can dismiss or massage incoming inflation data and do as it pleases with extreme policy measures until obvious, direct and disturbing consequences arise. These can appear in a number of forms.
At first glance, it might appear the adverse reactions might originate in the fixed income markets. The general assumption holds that bonds are directly responsive to changes in realized and expected inflation rates. There is also widespread belief in some quarters that bonds are a reliable leading indicator of activity, i.e., a strong high-grade bond market indicates impending economic slack.
Current circumstances undermine whatever initial validity each of these assumptions might hold. With the Federal Reserve absorbing about two-thirds of issuance, bonds have about the same prognostic content as tea leaves. Their sensitivity to investors’ considerations about inflation and credit demand is similarly diminished.
Bonds have been relegated to a role similar to that of gold in the days when the price of the latter was fixed by government mandates. The urge to devalue during the deflationary morass of the early 1930s prompted an overnight revaluation of gold from $20.67 to $35 and a simultaneous decree outlawing private ownership of gold to prevent speculative gains from the sudden, mandated price jump. Four decades later, the stubborn adherence to a $35 gold price during the building inflation of the late 1960s and early 1970s forced the U.S. to abandon the last vestiges of a gold exchange standard for the dollar in 1971. Gold prices rose from $35 to $850 over the next decade.
If bonds yields are being held down at artificially low levels by government interventions, the challenge for investors is to discern the primary and secondary consequences.
In direct terms, it is becoming clear that a yield of 1 or 2 percent for intermediate and long-term bonds almost guarantees a negative real return and diminished purchasing power over the life of the instrument. The fact that a meaningful number of investors are not dissuaded by the prospect of negative real returns is not surprising. During the great inflation that began in the 1960s, personal savings rates rose relentlessly despite almost no nominal yield, deeply negative real yields and accelerating inflation. The ratio of saving to disposable income did not begin to decline until the final acceleration in inflation rates to double digits.
2
Investors may have rational expectations, but they are nonetheless usually incorrect in assessing macroeconomic prospects.
The effects of artificially suppressed interest rates are more clearly manifest in the willingness to borrow rather than aversion to lend.
Households are increasingly willing to borrow in order to acquire homes, which are appreciating rapidly as construction costs and delivery times rise steadily. Total mortgage debt owed by U.S. households has exceeded the peak level of the 2003-2008 housing mania. It stands well above $10 trillion at present.
The private credit expansion, taking advantage of the enormous advantages given borrowers at the expense of savers and lenders has its epicenter in mortgages, as would be expected. They are the cheapest, most accessible and largest scale form of credit available to household borrowers and are utilized to acquire a highly durable and increasingly scarce asset that provides real economic value to the owner in the form of shelter and relatively stable costs.
Every episode of credit expansion has focal points in different asset types. Price cycles in general commence at points in the economic system where favorable supply/demand balances exist. Storable commodities and durable goods where fundamental imbalances set the stage for steady appreciation become increasingly seductive to those with access to cheap credit or the excess liquidity spawned by it.
Localized price rises in one or another sector, e.g., energy, agricultural products, commercial property, transportation equipment, residential structures and so forth are transmitted throughout the economy in direct proportion to the generosity of money and credit at the time.
If monetary policy is neutral, price increases in one sector of the economy force diminished spending in others, as total spending power is reasonably stable. This is not dissimilar to a family budget where one major expense has risen substantially. If the family income is relatively stable and borrowing is not a practical option, other expenditures will have to be cut in order to maintain solvency.
Inflationary troubles arise when monetary policy is sufficiently accommodative to simply allow the absorption of specific cost increases without any corresponding cutbacks elsewhere. This dynamic was evident during the destructive inflationary wave of the 1970s. In that circumstance, oil supplies and price shocks prompted by OPEC export embargoes provoked the Federal Reserve to rapidly expand money and credit in order to cushion the effects of dramatically higher energy costs on overall purchasing power.
In attempting to preempt any widespread belt-tightening to offset the massive increase in energy expenditures, the Federal Reserve simply allowed the inflationary impulse to spread across a broader swath of the economy and ultimately provoke pandemic speculation and a flight from financial assets. The destruction of value for savers and lenders rapidly expanded from real to nominal losses as fixed income holdings and stocks sensitive to interest rates collapsed.
The shift from inflation-adjusted losses of purchasing power to outright nominal declines usually marks the beginning of the acute phase of serious inflationary cycles.
As stated previously, bonds and shorter-dated fixed income instruments may or may not respond to unambiguous indicia of inflation. The response can be distorted by central bank interventions that vacuum up any excess supplies at the first signs of trouble. In most cases, this tact will be thwarted by reactions in the foreign exchange value of the currency in which the interventions are occurring, as they only serve to further inject liquidity into a system that is already displaying symptoms of overfeeding.
3
Exchange rate depreciation as a means of discipline for monetary authorities is attenuated by the currency in question enjoying the benefits of reserve status. Market responses will be further distorted when there is collusion among nearly all central banks to coordinate their policies to eliminate any discernable bastions of responsibility that might offer alternative stores of value in their orbits.
Coordination of expansive policy among developed world’s central banks has been a notable feature of this cycle. Even the Swiss National Bank, long looked upon as a paragon of monetary restraint, has engineered a near eightfold expansion of its balance sheet in the past dozen years. They have no intention of allowing the Franc to serve as a haven for restless liquidity.
The official notion of current inflationary pressures being “transitory” (meaning temporary), strikes us as the latest and greatest in a long history of presumptuous declarations by the Federal Reserve and its cohort.
Businesses of all types have been sufficiently chastened in the past decade to think twice before adding capacity and embarking on major expenditures with long payback periods. Even in cases where new physical infrastructure is contemplated, bottlenecks in the production, transportation and operation of capital goods have lengthened delivery times and pushed backlogs to record levels.
Planned infrastructure initiatives by the federal government will only add fuel to the fires. A ten-year program of physical infrastructural enhancement involving expenditures in excess of $100 billion annually will either run into a wall of shortages or pay far enough above market rates for materials and labor to crowd out private, profit-conscious businesses.
Labor shortages are unlikely to ease significantly once the supplemental benefits offered during the pandemic are withdrawn. Governments are making it much easier to live reasonably without working and, if earned income is a necessity, lower tier service workers are increasingly likely to seek casual, off-the-books situations that do not undermine one’s ability to collect government benefits or retirement income.
Once central banks have unleashed the four horsemen of credit expansion, asset inflation, speculation and consumer price inflation, they will struggle mightily to keep them from seriously undermining the public’s willingness to hold monetary and fixed income assets. The academic, theoretical designation of “inflation expectations” as a primary regulator of private investors’ inclination to play along with central bankers’ assurances is mistaken.
People will shift allocations in response to return expectations, not some amorphous concept of future inflation rates. The driving force behind a preference shift from A to B is either avoiding losses in A, reaping a superior return from B, or some combination thereof. In any event, the relative appeal of B is sufficiently greater than that of A, so as to provoke a shift from A to B.
The problem for central bankers is when A, the holding from which people are beginning to flee, is an integral aspect of the monetary or financial infrastructure. It may be leveraged equities, as was the case in 1929, currency as with Weimar Germany in 1922 and much of Latin America in the 1970s or high-grade fixed income assets as in the late 1970s.
Assets benefitting from the flight away from certain savings and investment media eventually become objects of intense, leveraged speculation when the monetary environment allows for easy access to underpriced credit.
At this point in the process, the newly favored objects of inflationary speculation replace the traditional assets from which investors and savers fled as critical lynchpins underlying the collateral structure of
4
an ever-increasing proportion of the financial system. When they have grown in market capitalization to such an extent that there is almost no level of central bank liquidity that can adequately support them, the focal point of the next deflationary crisis is defined.
The classic, recent example occurred with the speculative mania in single-family homes following the Federal Reserve’s extraordinary ease in response to the bursting of the technology craze in 2001-2002. Houses became the key collateral element underlying the financial system and, in only four years went from highly favorable fundamental supply and demand metrics at very affordable prices to an historic glut of supply at prices that were clearly beyond the means of the majority of purchasers, particularly after the Federal Reserve undertook a long series of rate hikes.
Because speculation in single-family homes and the complete shrouding of risk in extraordinarily complex and opaque mortgage-backed securities, the Federal Reserve had no precedents to feed its econometric models to help them assess the systemic risks. They were asleep at the switch when the calamity unfolded.
The status of the present credit and price cycle is similarly without specific precedent. Extraordinarily inflated sectors are grazing on the monetary plains like thousand ton dinosaurs. Crypto-currency is a multi-trillion dollar alternative to visible financial assets, institutions have swallowed millions of single-family homes to convert into fixed income assets through long-term leasing, dollar holdings of international institutions and individuals continue to climb to record levels as money pours into U.S. technology companies. These now constitute a far greater share of domestic market capitalization than energy stocks did at their peak in 1980.
All signs in the economy are pointing to continued strength in demand and no easing of supply chain constraints or labor shortages and accelerating wages. Very few indications of credit risk or scarcity are to be found.
Our sense is that the Federal Reserve has lashed itself to the mast and is going to maintain course come Hell or high water. It is unlikely that there will be any overt moves toward tightening for another year, at the least. The major risk is likely in the opposite direction.
If a bout of illiquidity and distress (or panic) strikes one of the engorged sectors that hold significant proportions of personal and institutional wealth, the Federal Reserve may well intervene to restore stability and support nominal values even in the face of a real economy that is strengthening and threatened mainly by upward price pressures in a large number of crucial sectors.
Any moves by the Federal Reserve or another major central bank in that direction would be an admission that price stability has flown the coop as a meaningful influence on policy decisions and prompt an acceleration in the flight from sectors and assets most at risk from non-transitory, accelerating inflation.
August 4, 2021
Michael C. Aronstein
President, CIO & Portfolio Manager
The foregoing represents the opinions of the Chairman, CEO & Portfolio Manager and of the President, CIO & Portfolio Manager, respectively, and are not intended to be a forecast of future events, a guarantee of future results, or investment advice.
5
Definitions:
Russell 1000® Growth Index: Measures the performance of the broad growth segment of the U.S. equity universe. It includes those Russell 1000 companies with higher price-to-book ratios and higher forecasted growth values.
Russell 1000 Value Index: Measures the performance of the broad value segment of U.S. equity value universe. It includes those Russell 1000 companies with lower price-to-book ratios and lower forecasted growth values.
P/E is the price-to-earnings ratio. The ratio for valuing a company that measures its current share price relative to its per-share earnings (EPS).
The S&P 500® Index is a trademark of McGraw Hill Financial Inc. The S&P 500® Index is widely regarded as the standard index for measuring large-cap U.S. stock market performance. The securities holdings and volatility of the Fund differ significantly from the stocks that make up the S&P 500 Index. An investment cannot be made directly into an index.
A mortgage-backed security (MBS) is an investment similar to a bond that is made up of a bundle of home loans bought from the banks that issued them. Investors in MBS receive periodic payments similar to bond coupon payments.
An investment cannot be made directly in an index.
Past performance does not guarantee future results
The Marketfield Fund is managed by Marketfield Asset Management LLC (the “Adviser”) and distributed by Quasar Distributors, LLC.
Must be preceded or accompanied by a current prospectus.
Mutual fund investing involves risk. Principal loss is possible. Before considering an investment in the Fund, you should understand that you could lose money.
The Fund regularly makes short sales of securities, which involves the risk that losses may exceed the original amount invested. The Fund may invest in derivatives, which may increase the volatility of the Fund’s net asset value (“NAV”) and may result in a loss to the Fund. The Fund may also use options and futures contracts, which have the risks of unlimited losses of the underlying holdings due to unanticipated market movements and failure to correctly predict the direction of securities prices, interest rates, and currency exchange rates. However, a mutual fund investor’s risk is limited to the amount invested in a fund. Investments in absolute return strategies are not intended to outperform stocks and bonds during strong market rallies. Investments in exchange-traded funds are subject to additional risks that do not apply to conventional mutual funds, including the risks that the market price of the shares may trade at a discount to its NAV, an active secondary trading market may not develop or be maintained, or trading may be halted by the exchange in which they trade, which may impact the Fund’s ability to sell such shares.
Foreign securities are subject to interest rate, currency exchange rate, economic, and political risks. These risks may be greater for emerging markets. Investing in smaller companies involves special risks, including higher volatility and lower liquidity. Investing in mid-cap stocks may carry more risk than investing in stocks of larger, more well-established companies. This risk is usually greater for longer term debt securities. Investment by the Fund in lower rated and non-rated securities presents a greater risk of loss to principal and interest than higher-rated securities. Investments in asset-backed and mortgage-backed securities involve additional risks such as credit risk, prepayment risk, possible illiquidity and default, and increased susceptibility to adverse economic developments. Investing in the Fund involves the risk that the macroeconomic trends identified by portfolio management will not come to fruition and their advantageous duration may not last as long as portfolio management forecasts.
6
MARKETFIELD FUND
Expense Example
(Unaudited)
As a shareholder of the Fund, you incur two types of costs: (1) transaction costs, including sales charges (loads) on purchases (as applicable), and (2) ongoing costs, including management fees, distribution and/or service (12b-1) fees (as applicable), and other Fund expenses (as applicable). This example is intended to help you understand your ongoing costs (in dollars) of investing in the Fund and to compare these costs with the ongoing costs of investing in other funds. The example is based on an investment of $1,000 made at the beginning of the six-month period and held for the entire period from January 1, 2021 to June 30, 2021.
This example illustrates the Fund’s ongoing costs in two ways:
The first lines of the following tables provide information about actual account values and actual expenses. If you purchase Class A shares of the Fund you will pay an initial sales charge of up to 5.50% when you invest. A contingent deferred sales charge (“CDSC”) may be imposed on certain redemptions of Class A shares redeemed within twelve months of purchase. Class C shares are subject to a CDSC of 1.00% for shares redeemed within twelve months of purchase. In addition, you will be assessed fees for outgoing wire transfers, returned checks and stop payment orders at prevailing rates charged by U.S. Bancorp Fund Services, LLC, the Fund’s transfer agent. If you request that a redemption be made by wire transfer, currently a $15.00 fee is charged by the Fund’s transfer agent. IRA accounts will be charged a $15.00 annual maintenance fee. To the extent the Fund invests in shares of exchange-traded funds or other investment companies as part of its investment strategy, you will indirectly bear your proportionate share of any fees and expenses charged by the underlying funds in which the Fund invests in addition to the expenses of the Fund. Actual expenses of the underlying funds are expected to vary among the various underlying funds. These expenses are not included in the example. The example includes, but is not limited to, management fees, fund administration and accounting, custody and transfer agent fees. You may use the information in these lines, together with the amount you invested, to estimate the expenses that you paid over the period. Simply divide your account value by $1,000 (for example, an $8,600 account value divided by $1,000 = 8.6), then multiply the result by the number in the fourth column under the heading entitled “Expenses Paid During Period” to estimate the expenses you paid on your account during this period.
| | Hypothetical | | Example for Comparison Purposes |
The second lines of the tables below provide information about hypothetical account values and hypothetical expenses based on the Fund’s actual expense ratio and an assumed rate of return of 5% per year before expenses, which is not the Fund’s actual return. The hypothetical account values and expenses may not be used to estimate the actual ending account balances or expenses you paid for the six-month period shown. You may use this information to compare the ongoing costs of investing in the Fund with the ongoing costs of investing in other funds. To do so, compare this 5% hypothetical example with the 5% hypothetical examples that appear in the shareholder reports of other funds.
Please note that the expenses shown in the tables are meant to highlight your ongoing costs only and do not reflect any transactional costs, such as sales charges (loads). Therefore, the second lines of the tables are useful in comparing ongoing costs only and will not help you determine the relative total costs of owning different funds. In addition, if these transactional costs were included, your costs would have been higher.
7
MARKETFIELD FUND
Expense Example (continued)
(Unaudited)
| | | | | | | | | | | | |
| | | Class A
| |
| | | Beginning
Account Value
January 1, 2021
| | | Ending
Account Value
June 30, 2021
| | | Expenses Paid
During Period
January 1, 2021 -
June 30, 2021*
| |
Actual | | $ | 1,000.00 | | | $ | 1,055.60 | | | $ | 11.26 | |
Hypothetical (5% return before expenses) | | $ | 1,000.00 | | | $ | 1,013.84 | | | $ | 11.03 | |
| | * | | Expenses are equal to the Class A shares’ annualized expense ratio of 2.21%, multiplied by the average account value over the period, multiplied by 181/365 to reflect the one-half year period. |
| | | | | | | | | | | | |
| | | Class C
| |
| | | Beginning
Account Value
January 1, 2021
| | | Ending
Account Value
June 30, 2021
| | | Expenses Paid
During Period
January 1, 2021 -
June 30, 2021*
| |
Actual | | $ | 1,000.00 | | | $ | 1,052.20 | | | $ | 15.01 | |
Hypothetical (5% return before expenses) | | $ | 1,000.00 | | | $ | 1,010.17 | | | $ | 14.70 | |
| | * | | Expenses are equal to the Class A shares’ annualized expense ratio of 2.95%, multiplied by the average account value over the period, multiplied by 181/365 to reflect the one-half year period. |
| | | | | | | | | | | | |
| | | Class I
| |
| | | Beginning
Account Value
January 1, 2021
| | | Ending
Account Value
June 30, 2021
| | | Expenses Paid
During Period
January 1, 2021 -
June 30, 2021*
| |
Actual | | $ | 1,000.00 | | | $ | 1,057.20 | | | $ | 10.05 | |
Hypothetical (5% return before expenses) | | $ | 1,000.00 | | | $ | 1,015.03 | | | $ | 9.84 | |
| | * | | Expenses are equal to the Class A shares’ annualized expense ratio of 1.97%, multiplied by the average account value over the period, multiplied by 181/365 to reflect the one-half year period. |
8
MARKETFIELD FUND
Investment Highlights
(Unaudited)
The investment objective of the Fund is capital appreciation. The Fund seeks to achieve its investment objective by allocating the Fund’s assets among investments in equity securities, fixed-income securities, and other investment companies, including exchange-traded funds (“ETFs”), in proportions consistent with Marketfield Asset Management LLC’s (the “Adviser”) evaluation of their expected risks and returns. In making these allocations, the Adviser considers various factors, including macroeconomic conditions, corporate earnings at a macroeconomic level, anticipated inflation and interest rates, consumer risk and the Adviser’s perception of the outlook of the capital markets as a whole. The Adviser may allocate the Fund’s investments between equity securities and fixed-income securities at its discretion, without limitation. The Fund may also engage in short sales of securities or other derivative type transactions. The Fund’s allocation of portfolio assets as of June 30, 2021 is shown below.
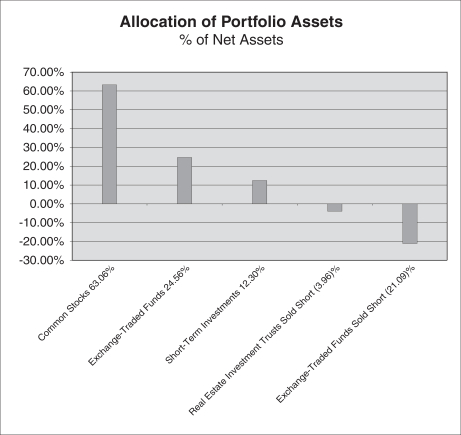
| * | | Valued at the net unrealized appreciation (depreciation). |
9
MARKETFIELD FUND
Investment Highlights (continued)
(Unaudited)
Average Annual Total Returns as of June 30, 2021
| | | | | | | | | | | | | | | | | | | | |
Class
| | Sales Charge
| | | | 1 Year
| | | 5 Years
| | | 10 Years
| | | Since
Inception
(7/31/2007)
| |
Class A(1) | | Maximum 5.5% Initial Sales Charge | | With sales charge | | | 19.72 | % | | | 7.68% | | | | 3.83 | % | | | 5.05 | % |
| | | | | Excluding sales charge | | | 26.70 | % | | | 8.90% | | | | 4.42 | % | | | 5.48 | % |
Class C(1) | | Maximum 1% CDSC if Redeemed | | With sales charge | | | 24.78 | % | | | 8.06% | | | | 3.63 | % | | | 4.68 | % |
| | | within One Year of Purchase | | Excluding sales charge | | | 25.78 | % | | | 8.06% | | | | 3.63 | % | | | 4.68 | % |
Class I(2) | | No Sales Charge | | | | | 27.00 | % | | | 9.16% | | | | 4.66 | % | | | 5.73 | % |
S&P 500 Index | | | | | | | 40.79 | % | | | 17.65% | | | | 14.84 | % | | | 10.37 | % |
Performance data quoted represents past performance and does not guarantee future results. The investment return and principal value of an investment will fluctuate so that an investor’s shares, when redeemed, may be worth more or less than their original cost. Current performance of the Fund may be lower or higher than the performance quoted. Performance data current to the most recent month end may be obtained by calling (800) 311-MKTD (6583) or is available in the Fund’s website at www.marketfieldfund.com.
The returns shown assume reinvestment of Fund distributions and do not reflect the deduction of taxes that a shareholder would pay on Fund distributions or the redemption of Fund shares. The following graph illustrates performance of a hypothetical investment made in the Fund and certain broad-based securities indices on the Fund’s inception date. The graph does not reflect any future performance.
The Total Annual Fund Operating Expenses in the Prospectus dated April 30, 2021 are 2.91%, 3.62% and 2.63% for Class A, Class C and Class I shares, respectively.
The S&P 500® Index is a broad-based measurement of changes in stock market conditions based on a capitalization-weighted average of 500 leading companies representing all major industries in the U.S. economy. It is not possible to invest directly in an index.
| (1) | | Performance figures for Class A and Class C shares, first offered on October 5, 2012, include the historical performance of Class I shares through October 4, 2012 and are adjusted to reflect differences in fees and expenses. Performance data for the classes varies based on differences in their fee and expense structures. The Fund commenced operations on July 31, 2007. Unadjusted, the performance for the newer classes would likely have been different. |
| (2) | | Performance figures for Class I shares prior to April 8, 2016 reflect the historical performance of the then-existing shares of the MainStay Marketfield Fund, a series of MainStay Funds Trust (the predecessor to the Fund, which was subject to a different fee structure, and for which the Adviser served as the investment sub-adviser) for periods from October 5, 2012 to April 8, 2016. The performance figures also reflect the historical performance of the then-existing shares of the predecessor fund to the MainStay Marketfield Fund (which was subject to a different fee structure, and for which a predecessor entity to the Adviser served as the investment adviser) for periods prior to October 5, 2012. |
10
MARKETFIELD FUND
Investment Highlights (continued)
(Unaudited)
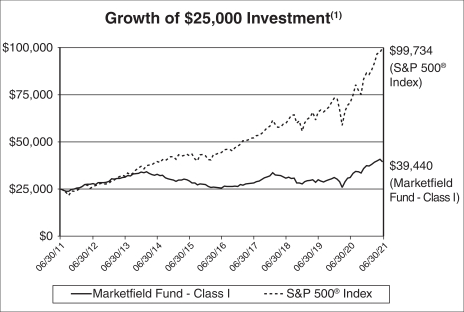
| (1) | | The minimum investment for Class I shares is $25,000 for individual investors. There is no minimum investment for Class I shares for institutional investors. The graph does not illustrate performance for a hypothetical investment made in Class A or Class C shares. If shown, the growth of the investment of Class A or Class C shares would have been lower than Class I shares to the extent those classes have lower minimum investments and sales loads. |
11
MARKETFIELD FUND
Schedule of Investments
June 30, 2021 (Unaudited)
| | | | | | | | |
| | |
| | | Shares
| | | Value
| |
| COMMON STOCKS — 63.06% | | | | | | | | |
| | |
| Auto Components — 0.29% | | | | | | | | |
Continental AG(a) | | | 3,250 | | | $ | 477,779 | |
| | | | | | |
|
|
|
| Building Products — 1.22% | | | | | | | | |
TOTO Ltd.(a) | | | 38,086 | | | | 1,971,236 | |
| | | | | | |
|
|
|
| Chemicals — 2.18% | | | | | | | | |
The Sherwin-Williams Co. | | | 12,936 | | | | 3,524,413 | |
| | | | | | |
|
|
|
| Electrical Equipment — 3.60% | | | | | | | | |
Eaton Corp PLC | | | 16,905 | | | | 2,504,983 | |
Rockwell Automation, Inc. | | | 11,234 | | | | 3,213,149 | |
Siemens Energy AG(a)(b) | | | 3,440 | | | | 103,687 | |
| | | | | | |
|
|
|
| | | | | | | | 5,821,819 | |
| | | | | | |
|
|
|
| Electronic Equipment, Instruments & Components — 2.63% | | | | | | | | |
Keyence Corp.(a) | | | 8,424 | | | | 4,251,620 | |
| | | | | | |
|
|
|
| Energy Equipment & Services — 2.05% | | | | | | | | |
Schlumberger Ltd. | | | 103,495 | | | | 3,312,875 | |
| | | | | | |
|
|
|
| Food & Staples Retailing — 3.98% | | | | | | | | |
Costco Wholesale Corp.(c) | | | 16,279 | | | | 6,441,112 | |
| | | | | | |
|
|
|
| Health Care Equipment & Supplies — 3.56% | | | | | | | | |
Intuitive Surgical, Inc.(b) | | | 6,268 | | | | 5,764,304 | |
| | | | | | |
|
|
|
| Hotels, Restaurants & Leisure — 0.65% | | | | | | | | |
Dalata Hotel Group PLC(a)(b) | | | 233,172 | | | | 1,060,313 | |
| | | | | | |
|
|
|
| Household Durables — 8.19% | | | | | | | | |
DR Horton, Inc.(c) | | | 59,316 | | | | 5,360,387 | |
Lennar Corp. — Class A | | | 33,377 | | | | 3,316,005 | |
PulteGroup, Inc.(c) | | | 83,746 | | | | 4,570,019 | |
| | | | | | |
|
|
|
| | | | | | | | 13,246,411 | |
| | | | | | |
|
|
|
| Industrial Conglomerates — 2.42% | | | | | | | | |
Honeywell International, Inc. | | | 12,859 | | | | 2,820,621 | |
Siemens AG(a) | | | 6,879 | | | | 1,089,906 | |
| | | | | | |
|
|
|
| | | | | | | | 3,910,527 | |
| | | | | | |
|
|
|
| Machinery — 7.99% | | | | | | | | |
Caterpillar, Inc. | | | 17,831 | | | | 3,880,561 | |
Cummins, Inc. | | | 16,650 | | | | 4,059,436 | |
Deere & Co. | | | 14,124 | | | | 4,981,676 | |
| | | | | | |
|
|
|
| | | | | | | | 12,921,673 | |
| | | | | | |
|
|
|
| Metals & Mining — 11.70% | | | | | | | | |
Barrick Gold Corp. — (a)(c) | | | 153,162 | | | | 3,167,390 | |
Compania de Minas Buenaventura SAA — ADR(b) | | | 110,203 | | | | 997,337 | |
MMC Norilsk Nickel PJSC — ADR | | | 106,950 | | | | 3,643,787 | |
Newmont Corp.(c) | | | 58,548 | | | | 3,710,772 | |
Rio Tinto PLC — ADR(c) | | | 40,808 | | | | 3,423,383 | |
Vale SA — ADR | | | 174,879 | | | | 3,988,990 | |
| | | | | | |
|
|
|
| | | | | | | | 18,931,659 | |
| | | | | | |
|
|
|
The accompanying notes are an integral part of these financial statements.
12
MARKETFIELD FUND
Schedule of Investments (continued)
June 30, 2021 (Unaudited)
| | | | | | | | |
| | |
| | | Shares
| | | Value
| |
| Oil, Gas & Consumable Fuels — 3.18% | | | | | | | | |
Devon Energy Corp. | | | 74,590 | | | $ | 2,177,282 | |
EOG Resources, Inc. | | | 19,738 | | | | 1,646,939 | |
Golar LNG Ltd.(a)(b) | | | 99,489 | | | | 1,318,229 | |
| | | | | | |
|
|
|
| | | | | | | | 5,142,450 | |
| | | | | | |
|
|
|
| Real Estate Management & Development — 1.33% | | | | | | | | |
The St. Joe Co. | | | 48,366 | | | | 2,157,607 | |
| | | | | | |
|
|
|
| Road & Rail — 6.55% | | | | | | | | |
Norfolk Southern Corp.(c) | | | 22,588 | | | | 5,995,081 | |
Union Pacific Corp. | | | 20,942 | | | | 4,605,774 | |
| | | | | | |
|
|
|
| | | | | | | | 10,600,855 | |
| | | | | | |
|
|
|
| Semiconductors & Semiconductor Equipment — 1.54% | | | | | | | | |
Intel Corp. | | | 44,441 | | | | 2,494,918 | |
| | | | | | |
|
|
|
TOTAL COMMON STOCKS (Cost $50,524,964) | | | | | | | 102,031,571 | |
| | | | | | |
|
|
|
| EXCHANGE-TRADED FUNDS — 24.56% | | | | | | | | |
iShares MSCI Australia ETF(c) | | | 278,126 | | | | 7,225,713 | |
iShares MSCI Japan ETF(c) | | | 80,324 | | | | 5,425,083 | |
iShares MSCI United Kingdom ETF | | | 220,540 | | | | 7,211,658 | |
SPDR S&P Homebuilders ETF(c) | | | 61,143 | | | | 4,478,113 | |
SPDR S&P Oil & Gas Exploration & Production ETF | | | 25,539 | | | | 2,469,366 | |
VanEck Vectors Gold Miners ETF(c) | | | 143,172 | | | | 4,864,985 | |
VanEck Vectors Russia ETF | | | 83,010 | | | | 2,405,630 | |
WisdomTree Japan Hedged Equity Fund(c) | | | 92,821 | | | | 5,663,937 | |
| | | | | | |
|
|
|
TOTAL EXCHANGE-TRADED FUNDS (Cost $33,363,263) | | | | | | | 39,744,485 | |
| | | | | | |
|
|
|
| SHORT-TERM INVESTMENTS — 12.30% | | | | | | | | |
U.S. Bank Money Market Deposit Account, 0.003%(d) | | | 19,899,717 | | | | 19,899,717 | |
| | | | | | |
|
|
|
| TOTAL SHORT TERM INVESTMENTS (Cost $19,899,717) | | | | | | | 19,899,717 | |
| | | | | | |
|
|
|
| Total Investments (Cost $103,787,944) — 99.92% | | | | | | | 161,675,773 | |
| Other Assets in Excess of Liabilities — 0.08% | | | | | | | 125,918 | |
| | | | | | |
|
|
|
| TOTAL NET ASSETS — 100.00% | | | | | | $ | 161,801,691 | |
| | | | | | |
|
|
|
| (a) | | Foreign issued security. |
| (b) | | Non-income producing security. |
| (c) | | All or a portion of this security is pledged as collateral for securities sold short with an aggregate fair value of $37,226,240 as of June 30, 2021. |
| (d) | | Seven day yield as of June 30, 2021. |
Abbreviations:
| | |
| ADR | | American Depositary Receipt |
| AG | | Aktiengesellschaft is a German term that refers to a corporation that is limited by shares, i.e. owned by shareholders. |
| Ltd. | | Limited is a term indicating a company is incorporated and shareholders have limited liability. |
| PLC | | Public Limited Company is a publicly traded company which signifies that shareholders have limited liability. |
| PJSC | | An abbreviation used by many countries to signify an open joint-stock company. |
| SA | | An abbreciation used by many countries to signify a stock company whereby shareholders have limited liability. |
The Global Industry Classification Standard (GICS®) was developed by and/or is the exclusive property of MSCI, Inc. and Standard & Poor Financial Services LLC (“S&P”). GICS is a service mark of MSCI and S&P and has been licensed for use by U.S. Bancorp Fund Services, LLC.
The accompanying notes are an integral part of these financial statements.
13
MARKETFIELD FUND
Schedule of Securities Sold Short
June 30, 2021 (Unaudited)
| | | | | | | | |
| | |
| | | Shares
| | | Value
| |
| SECURITIES SOLD SHORT — (25.05)% | | | | | | | | |
| | |
| EXCHANGE-TRADED FUNDS — (21.09)% | | | | | | | | |
Invesco QQQ Trust Series 1 | | | (40,891 | ) | | $ | (14,492,997 | ) |
iShares Expanded Tech-Software Sector ETF | | | (23,976 | ) | | | (9,351,599 | ) |
iShares Russell 2000 ETF | | | (44,797 | ) | | | (10,275,088 | ) |
| | | | | | |
|
|
|
TOTAL EXCHANGE-TRADED FUNDS (Proceeds $26,567,262) | | | | | | | (34,119,684 | ) |
| | | | | | |
|
|
|
| REAL ESTATE INVESTMENT TRUSTS — (3.96)% | | | | | | | | |
AvalonBay Communities, Inc. | | | (3,701 | ) | | | (772,362 | ) |
Boston Properties, Inc. | | | (10,565 | ) | | | (1,210,643 | ) |
Equity Residential | | | (11,100 | ) | | | (854,700 | ) |
SL Green Realty Corp. | | | (30,125 | ) | | | (2,410,000 | ) |
Vornado Realty Trust | | | (25,065 | ) | | | (1,169,784 | ) |
| | | | | | |
|
|
|
TOTAL REAL ESTATE INVESTMENT TRUSTS (Proceeds $7,526,132) | | | | | | | (6,417,489 | ) |
| | | | | | |
|
|
|
Total Securities Sold Short (Proceeds $34,093,394) | | | | | | $ | (40,537,173 | ) |
| | | | | | |
|
|
|
The accompanying notes are an integral part of these financial statements.
14
MARKETFIELD FUND
| | |
| Statement of Assets & Liabilities | | |
| |
| | | June 30, 2021 (Unaudited) |
| | | | |
| Assets | | | | |
Investments in securities, at value (cost $103,787,944) | | $ | 161,675,773 | |
Receivables: | | | | |
Fund shares sold | | | 107,376 | |
Dividends and interest | | | 86,505 | |
Dividend tax reclaim | | | 160,898 | |
Deposits at brokers(1) | | | 40,868,572 | |
Other assets | | | 21,148 | |
| | |
|
|
|
Total Assets | | | 202,920,272 | |
| | |
|
|
|
| Liabilities | | | | |
Securities sold short, at value (proceeds received $34,093,394) | | | 40,537,173 | |
Payables: | | | | |
Fund shares redeemed | | | 212,595 | |
To affiliates | | | 51,054 | |
To distributor | | | 26,060 | |
For shareholder servicing fees | | | 18,534 | |
To adviser | | | 157,445 | |
Dividends and interest on short positions | | | 49,316 | |
Accrued expenses and other liabilities | | | 66,404 | |
Total Liabilities | | | 41,118,581 | |
| | |
|
|
|
| Net Assets | | $ | 161,801,691 | |
| | |
|
|
|
Net assets consist of: | | | | |
Paid-in capital | | | 490,581,497 | |
Accumulated deficit | | | (328,779,806 | ) |
| | |
|
|
|
| Net Assets | | $ | 161,801,691 | |
| | |
|
|
|
| |
| Class A | | | | |
Net assets | | | $43,574,976 | |
Shares of beneficial interest outstanding (unlimited number of shares authorized, $0.001 par value) | | | 2,067,794 | |
Net asset value, minimum offering, and redemption price per share | | | $21.07 | |
Maximum offering price per share (net asset value per share divided by 0.945)(2) | | | $22.30 | |
| |
| Class C | | | | |
Net assets | | | $25,821,939 | |
Shares of beneficial interest outstanding (unlimited number of shares authorized, $0.001 par value) | | | 1,306,915 | |
Net asset value, offering, and redemption price per share(3) | | | $19.76 | |
| |
| Class I | | | | |
Net assets | | | $92,404,776 | |
Shares of beneficial interest outstanding (unlimited number of shares authorized, $0.001 par value) | | | 4,307,845 | |
Net asset value, offering, and redemption price per share | | | $21.45 | |
| (1) | | Serves as collateral for securities sold short. |
| (2) | | Reflects a maximum sales charge of 5.50%. |
| (3) | | A contingent deferred sales charge (“CDSC”) of 1.00% may be charged on shares redeemed within twelve months of purchase. |
The accompanying notes are an integral part of these financial statements.
15
MARKETFIELD FUND
| | |
| Statement of Operations |
| |
| | | For the Six Months Ended June 30, 2021 (Unaudited) |
| | | | |
| Investment Income | | | | |
Dividend income(1) | | $ | 1,444,312 | |
Interest income | | | 212 | |
| | |
|
|
|
Total Investment Income | | | 1,325,626 | |
| | |
|
|
|
| Expenses | | | | |
Management fees | | | 1,156,083 | |
Dividend expense | | | 339,159 | |
Broker Interest Expense | | | 118,898 | |
Transfer agent fees and expenses | | | 104,575 | |
Distribution fees — Class C | | | 102,731 | |
Administration and accounting fees | | | 98,473 | |
Distribution fees — Class A | | | 54,638 | |
Federal and state registration fees | | | 27,235 | |
Audit and tax fees | | | 23,291 | |
Custody fees | | | 15,941 | |
Reports to shareholders | | | 14,696 | |
Legal fees | | | 13,988 | |
Shareholder servicing fees — Class C | | | 13,427 | |
Trustees’ fees | | | 7,403 | |
Chief Compliance Officer fees | | | 5,973 | |
Insurance expense | | | 1,810 | |
Pricing fees | | | 905 | |
Other expenses | | | 2,534 | |
| | |
|
|
|
Total Expenses | | | 2,101,760 | |
| | |
|
|
|
Less waivers and reimbursement by Adviser (Note 4) | | | (168,159 | ) |
| | |
|
|
|
Net Expenses | | | 1,933,601 | |
| | |
|
|
|
| Net Investment Loss | | | (489,077 | ) |
| | |
|
|
|
| Realized and Unrealized Gain (Loss) on Investments and Foreign Currency | | | | |
Net realized gain (loss) on: | | | | |
Investments | | | 30,241,803 | |
Securities sold short | | | (4,853,260 | ) |
Foreign currency translations | | | (3,750 | ) |
Purchased options | | | (331,538 | ) |
| | |
|
|
|
| | | | 25,053,255 | |
| | |
|
|
|
Net change in unrealized depreciation on: | | | | |
Investments | | | (13,567,438 | ) |
Securities sold short | | | (1,993,590 | ) |
Foreign currency translations | | | (27,911 | ) |
| | |
|
|
|
| | | | (15,588,939 | ) |
| | |
|
|
|
| Net Realized and Unrealized Gain on Investments and Foreign Currency | | | 9,464,316 | |
| | |
|
|
|
| Net Increase in Net Assets From Operations | | $ | 8,975,239 | |
| | |
|
|
|
| (1) | | Net of $42,242 in foreign withholding taxes and issuance fees. |
The accompanying notes are an integral part of these financial statements.
16
MARKETFIELD FUND
| | | | | | | | |
| Statements of Changes in Net Assets | |
| | |
| | | Six Months Ended
June 30, 2020
(Unaudited)
| | | Year Ended
December 31, 2020
| |
| From Operations | | | | | | | | |
Net investment loss | | $ | (489,077 | ) | | $ | (1,523,743 | ) |
Net realized gain (loss) on: | | | | | | | | |
Investments | | | 30,241,803 | | | | 15,655,650 | |
Futures contracts | | | — | | | | (672,822 | ) |
Securities sold short | | | (4,853,260 | ) | | | (4,160,854 | ) |
Foreign currency translations | | | (3,750 | ) | | | 127,092 | |
Purchased options | | | (331,538 | ) | | | 647,908 | |
Written options | | | — | | | | (5,405 | ) |
Net change in unrealized appreciation (depreciation) on: | | | | | | | | |
Investments | | | (13,567,438 | ) | | | 12,845,267 | |
Futures contracts | | | — | | | | (63,577 | ) |
Securities sold short | | | (1,993,590 | ) | | | 2,856,674 | |
Foreign currency translations | | | (27,911 | ) | | | 27,741 | |
Purchased options | | | — | | | | 17,769 | |
Written options | | | — | | | | 41,082 | |
| | |
|
|
| |
|
|
|
Net increase in net assets from operations | | | 8,975,239 | | | | 25,792,782 | |
| | |
|
|
| |
|
|
|
| From Capital Share Transactions | | | | | | | | |
Proceeds from shares sold — Class A | | | 1,394,293 | | | | 7,888,190 | |
Payments for shares redeemed — Class A | | | (2,673,710 | ) | | | (9,859,664 | ) |
Proceeds from shares sold — Class C | | | 17,553 | | | | 87,440 | |
Payments for shares redeemed — Class C | | | (3,727,573 | ) | | | (15,551,868 | ) |
Proceeds from shares sold — Class I | | | 4,200,966 | | | | 5,056,654 | |
Payments for shares redeemed — Class I | | | (8,589,673 | ) | | | (33,458,225 | ) |
Proceeds from shares sold — Class R6(1) | | | — | | | | 44,645 | |
Payments for shares redeemed — Class R6(1) | | | — | | | | (1,887,622 | ) |
| | |
|
|
| |
|
|
|
Net decrease in net assets from capital share transactions | | | (9,378,144 | ) | | | (47,680,450 | ) |
| | |
|
|
| |
|
|
|
| Total Decrease in Net Assets | | | (402,905 | ) | | | (21,887,668 | ) |
| | |
| Net Assets: | | | | | | | | |
Beginning of Period | | | 162,204,596 | | | | 184,092,264 | |
| | |
|
|
| |
|
|
|
End of Period | | $ | 161,801,691 | | | $ | 162,204,596 | |
| | |
|
|
| |
|
|
|
| (1) | | Class R6 shares of the Fund were liquidated as of the close of business on November 30, 2020. See Note 1 to the financial statements. |
The accompanying notes are an integral part of these financial statements.
17
MARKETFIELD FUND — CLASS A
| | | | | | | | | | | | | | | | | | | | | | | | |
| Financial Highlights | |
|
| Per Share Data for a Share Outstanding Throughout Each Year/Period | |
| | | | | | |
| | | Six Months
Ended
June 30,
2021
(Unaudited)
| | | Year Ended
December 31,
2020
| | | Year Ended
December 31,
2019
| | | Year Ended
December 31,
2018
| | | Year Ended
December 31,
2017
| | | Year Ended
December 31,
2016
| |
| Net Asset Value, Beginning of Period | | $ | 19.96 | | | $ | 16.65 | | | $ | 14.92 | | | $ | 17.23 | | | $ | 14.26 | | | $ | 14.79 | |
| | |
|
|
| |
|
|
| |
|
|
| |
|
|
| |
|
|
| |
|
|
|
| Income (loss) from investment operations: | | | | | | | | | | | | | | | | | | | | | | | | |
Net investment income (loss)(1) | | | (0.06 | ) | | | (0.16 | ) | | | 0.04 | | | | (0.05 | ) | | | (0.11 | ) | | | (0.22 | ) |
Net realized and unrealized gain (loss) on investments and foreign currency | | | 1.17 | | | | 3.47 | | | | 1.73 | | | | (2.26 | ) | | | 3.08 | | | | (0.31 | ) |
| | |
|
|
| |
|
|
| |
|
|
| |
|
|
| |
|
|
| |
|
|
|
Total from investment operations | | | 1.11 | | | | 3.31 | | | | 1.77 | | | | (2.31 | ) | | | 2.97 | | | | (0.53 | ) |
| | |
|
|
| |
|
|
| |
|
|
| |
|
|
| |
|
|
| |
|
|
|
| Less distributions paid: | | | | | | | | | | | | | | | | | | | | | | | | |
From net investment income | | | — | | | | — | | | | (0.04 | ) | | | — | | | | — | | | | — | |
| | |
|
|
| |
|
|
| |
|
|
| |
|
|
| |
|
|
| |
|
|
|
Total distributions paid | | | — | | | | — | | | | (0.04 | ) | | | — | | | | — | | | | — | |
| | |
|
|
| |
|
|
| |
|
|
| |
|
|
| |
|
|
| |
|
|
|
| Net Asset Value, End of Period | | $ | 21.07 | | | $ | 19.96 | | | $ | 16.65 | | | $ | 14.92 | | | $ | 17.23 | | | $ | 14.26 | |
| | |
|
|
| |
|
|
| |
|
|
| |
|
|
| |
|
|
| |
|
|
|
| Total return(2)(3) | | | 5.56 | % | | | 19.88 | % | | | 11.87 | % | | | -13.41 | % | | | 20.83 | % | | | -3.58 | % |
| | |
|
|
| |
|
|
| |
|
|
| |
|
|
| |
|
|
| |
|
|
|
| | | | | | |
| Supplemental Data and Ratios: | | | | | | | | | | | | | | | | | | | | | | | | |
Net assets, end of period (000’s) | | $ | 43,575 | | | $ | 42,483 | | | $ | 37,761 | | | $ | 46,183 | | | $ | 75,929 | | | $ | 101,876 | |
| | | | | | |
Ratio of expenses to average net
assets:(4) | | | | | | | | | | | | | | | | | | | | | | | | |
Before waivers and reimbursements of expenses(5) | | | 2.59 | % | | | 2.75 | % | | | 2.94 | % | | | 2.73 | % | | | 2.72 | % | | | 2.88 | % |
After waivers and reimbursements of expenses(6) | | | 2.36 | % | | | 2.47 | % | | | 2.70 | % | | | 2.52 | % | | | 2.54 | % | | | 2.84 | %(9) |
| | | | | | |
Ratio of net investment income (loss) to average net assets:(4)(7) | | | | | | | | | | | | | | | | | | | | | | | | |
Before waivers and reimbursements of expenses | | | (0.84 | )% | | | (1.23 | )% | | | 0.02 | % | | | (0.51 | )% | | | (0.90 | )% | | | (1.60 | )% |
After waivers and reimbursements of expenses | | | (0.61 | )% | | | (0.95 | )% | �� | | 0.26 | % | | | (0.30 | )% | | | (0.72 | )% | | | (1.56 | )% |
| | | | | | |
Portfolio turnover rate(3)(8) | | | 14 | % | | | 12 | % | | | 17 | % | | | 40 | % | | | 5 | % | | | 86 | % |
| (1) | | Per share net investment income (loss) was calculated using average shares outstanding. |
| (2) | | Total return in the table represents the rate that the investor would have earned or lost on an investment in the Fund, assuming reinvestment of dividends. Based on net asset value, which does not reflect the applicable sales charges. |
| (3) | | Not annualized for periods less than one year. |
| (4) | | Annualized for periods less than one year. |
| (5) | | Expense ratios of expenses to average net assets before waivers and reimbursements of expenses excluding dividend and interest expense on short positions were 2.03% for the six months ended June 30, 2021 and 2.08%, 2.04%, 2.01%, 1.98%, and 1.87% for the years ended December 31, 2020, 2019, 2018, 2017, and 2016, respectively. |
| (6) | | Expense ratios of expenses to average net assets after waivers and reimbursements of expenses excluding dividend and interest expense on short positions were 1.80% for the six months ended June 30, 2021 and 1.80%, 1.80%, 1.80%, 1.80%, and 1.83% for the years ended December 31, 2020, 2019, 2018, 2017, and 2016, respectively. |
| (7) | | The net investment income (loss) ratios include dividend and interest expense on short positions. |
| (8) | | Consists of long-term investments only; excludes securities sold short and derivative instruments. |
| (9) | | Effective after the close of business on April 8, 2016, Class A shares were subject to an expense limitation cap of 1.80%. |
The accompanying notes are an integral part of these financial statements.
18
MARKETFIELD FUND — CLASS C
| | | | | | | | | | | | | | | | | | | | | | | | |
| Financial Highlights | |
|
| Per Share Data for a Share Outstanding Throughout Each Year/Period | |
| | | | | | |
| | | Six Months
Ended
June 30,
2021
(Unaudited)
| | | Year Ended
December 31,
2020
| | | Year Ended
December 31,
2019
| | | Year Ended
December 31,
2018
| | | Year Ended
December 31,
2017
| | | Year Ended
December 31,
2016
| |
| Net Asset Value, Beginning of Period | | $ | 18.78 | | | $ | 15.79 | | | $ | 14.22 | | | $ | 16.56 | | | $ | 13.80 | | | $ | 14.43 | |
| | |
|
|
| |
|
|
| |
|
|
| |
|
|
| |
|
|
| |
|
|
|
| Income (loss) from investment operations: | | | | | | | | | | | | | | | | | | | | | | | | |
Net investment loss(1) | | | (0.13 | ) | | | (0.28 | ) | | | (0.08 | ) | | | (0.17 | ) | | | (0.22 | ) | | | (0.31 | ) |
Net realized and unrealized gain (loss) on investments and foreign currency | | | 1.11 | | | | 3.27 | | | | 1.65 | | | | (2.17 | ) | | | 2.98 | | | | (0.32 | ) |
| | |
|
|
| |
|
|
| |
|
|
| |
|
|
| |
|
|
| |
|
|
|
Total from investment operations | | | 0.98 | | | | 2.99 | | | | 1.57 | | | | (2.34 | ) | | | 2.76 | | | | (0.63 | ) |
| | |
|
|
| |
|
|
| |
|
|
| |
|
|
| |
|
|
| |
|
|
|
| Net Asset Value, End of Period | | $ | 19.76 | | | $ | 18.78 | | | $ | 15.79 | | | $ | 14.22 | | | $ | 16.56 | | | $ | 13.80 | |
| | |
|
|
| |
|
|
| |
|
|
| |
|
|
| |
|
|
| |
|
|
|
| Total return(2)(3) | | | 5.22 | % | | | 18.94 | % | | | 11.04 | % | | | -14.13 | % | | | 20.00 | % | | | -4.37 | % |
| | |
|
|
| |
|
|
| |
|
|
| |
|
|
| |
|
|
| |
|
|
|
| | | | | | |
| Supplemental Data and Ratios: | | | | | | | | | | | | | | | | | | | | | | | | |
Net assets, end of period (000’s) | | $ | 25,822 | | | $ | 28,077 | | | $ | 38,675 | | | $ | 55,958 | | | $ | 92,518 | | | $ | 123,651 | |
| | | | | | |
Ratio of expenses to average net assets:(4) | | | | | | | | | | | | | | | | | | | | | | | | |
Before waivers and reimbursements of expenses(5) | | | 3.18 | % | | | 3.46 | % | | | 3.69 | % | | | 3.49 | % | | | 3.48 | % | | | 3.65 | % |
After waivers and reimbursements of expenses(6) | | | 3.10 | % | | | 3.20 | % | | | 3.46 | % | | | 3.30 | % | | | 3.30 | % | | | 3.59 | %(9) |
| | | | | | |
Ratio of net investment loss to average net assets:(4)(7) | | | | | | | | | | | | | | | | | | | | | | | | |
Before waivers and reimbursements of expenses | | | (1.45 | )% | | | (2.00 | )% | | | (0.76 | )% | | | (1.27 | )% | | | (1.67 | )% | | | (2.36 | )% |
After waivers and reimbursements of expenses | | | (1.37 | )% | | | (1.74 | )% | | | (0.53 | )% | | | (1.08 | )% | | | (1.49 | )% | | | (2.30 | )% |
| | | | | | |
Portfolio turnover rate(3)(8) | | | 14 | % | | | 12 | % | | | 17 | % | | | 40 | % | | | 5 | % | | | 86 | % |
| (1) | | Per share net investment loss was calculated using average shares outstanding. |
| (2) | | Total return in the table represents the rate that the investor would have earned or lost on an investment in the Fund, assuming reinvestment of dividends. Based on net asset value, which does not reflect the applicable sales charges. |
| (3) | | Not annualized for periods less than one year. |
| (4) | | Annualized for periods less than one year. |
| (5) | | Expense ratios of expenses to average net assets before waivers and reimbursements of expenses excluding dividend and interest expense on short positions were 2.63% for the six months ended June 30, 2021 and 2.83%, 2.80%, 2.76%, 2.75%, and 2.65% for the years ended December 31, 2020, 2019, 2018, 2017, and 2016 respectively. |
| (6) | | Expense ratios of expenses to average net assets after waivers and reimbursements of expenses excluding dividend and interest expense on short positions were 2.55% for the six months ended June 30, 2021 and 2.57%, 2.57%, 2.57%, 2.57%, and 2.59% for the years ended December 31, 2020, 2019, 2018, 2017, and 2016, respectively. |
| (7) | | The net investment loss ratios include dividend and interest expense on short positions. |
| (8) | | Consists of long-term investments only; excludes securities sold short and derivative instruments. |
| (9) | | Effective after the close of business on April 8, 2016, Class C shares were subject to an expense limitation cap of 2.57%. |
The accompanying notes are an integral part of these financial statements.
19
MARKETFIELD FUND — CLASS I
| | | | | | | | | | | | | | | | | | | | | | | | |
| Financial Highlights | |
|
| Per Share Data for a Share Outstanding Throughout Each Year/Period | |
| | | | | | |
| | | Six Months
Ended
June 30,
2021
(Unaudited)
| | | Year Ended
December 31,
2020
| | | Year Ended
December 31,
2019
| | | Year Ended
December 31,
2018
| | | Year Ended
December 31,
2017
| | | Year Ended
December 31,
2016
| |
| Net Asset Value, Beginning of Period | | $ | 20.29 | | | $ | 16.88 | | | $ | 15.14 | | | $ | 17.44 | | | $ | 14.39 | | | $ | 14.89 | |
| | |
|
|
| |
|
|
| |
|
|
| |
|
|
| |
|
|
| |
|
|
|
| Income (loss) from investment operations: | | | | | | | | | | | | | | | | | | | | | | | | |
Net investment income (loss)(1) | | | (0.04 | ) | | | (0.12 | ) | | | 0.08 | | | | (0.02 | ) | | | (0.07 | ) | | | (0.19 | ) |
Net realized and unrealized gain (loss) on investments and foreign currency | | | 1.20 | | | | 3.53 | | | | 1.75 | | | | (2.28 | ) | | | 3.12 | | | | (0.31 | ) |
| | |
|
|
| |
|
|
| |
|
|
| |
|
|
| |
|
|
| |
|
|
|
Total from investment operations | | | 1.16 | | | | 3.41 | | | | 1.83 | | | | (2.30 | ) | | | 3.05 | | | | (0.50 | ) |
| | |
|
|
| |
|
|
| |
|
|
| |
|
|
| |
|
|
| |
|
|
|
| Less distributions paid: | | | | | | | | | | | | | | | | | | | | | | | | |
From net investment income | | | — | | | | — | | | | (0.09 | ) | | | — | | | | — | | | | — | |
| | |
|
|
| |
|
|
| |
|
|
| |
|
|
| |
|
|
| |
|
|
|
Total distributions paid | | | — | | | | — | | | | (0.09 | ) | | | — | | | | — | | | | — | |
| | |
|
|
| |
|
|
| |
|
|
| |
|
|
| |
|
|
| |
|
|
|
| Net Asset Value, End of Period | | $ | 21.45 | | | $ | 20.29 | | | $ | 16.88 | | | $ | 15.14 | | | $ | 17.44 | | | $ | 14.39 | |
| | |
|
|
| |
|
|
| |
|
|
| |
|
|
| |
|
|
| |
|
|
|
| Total return(2)(3) | | | 5.72 | % | | | 20.20 | % | | | 12.13 | % | | | -13.25 | % | | | 21.20 | % | | | -3.36 | % |
| | |
|
|
| |
|
|
| |
|
|
| |
|
|
| |
|
|
| |
|
|
|
| | | | | | |
| Supplemental Data and Ratios: | | | | | | | | | | | | | | | | | | | | | | | | |
Net assets, end of period (000’s) | | $ | 92,405 | | | $ | 91,645 | | | $ | 105,998 | | | $ | 163,260 | | | $ | 302,439 | | | $ | 376,791 | |
| | | | | | |
Ratio of expenses to average net assets:(4) | | | | | | | | | | | | | | | | | | | | | | | | |
Before waivers and reimbursements of expenses(5) | | | 2.34 | % | | | 2.47 | % | | | 2.68 | % | | | 2.47 | % | | | 2.48 | % | | | 2.61 | % |
After waivers and reimbursements of expenses(6) | | | 2.12 | % | | | 2.20 | % | | | 2.44 | % | | | 2.27 | % | | | 2.30 | % | | | 2.56 | %(9) |
| | | | | | |
Ratio of net investment gain (loss) to average net assets:(4)(7) | | | | | | | | | | | | | | | | | | | | | | | | |
Before waivers and reimbursements of expenses | | | (0.58 | )% | | | (0.98 | )% | | | 0.25 | % | | | (0.29 | )% | | | (0.64 | )% | | | (1.38 | )% |
After waivers and reimbursements of expenses | | | (0.36 | )% | | | (0.71 | )% | | | 0.49 | % | | | (0.09 | )% | | | (0.46 | )% | | | (1.33 | )% |
| | | | | | |
Portfolio turnover rate(3)(8) | | | 14 | % | | | 12 | % | | | 17 | % | | | 40 | % | | | 5 | % | | | 86 | % |
| (1) | | Per share net investment income (loss) was calculated using average shares outstanding. |
| (2) | | Total return in the table represents the rate that the investor would have earned or lost on an investment in the Fund, assuming reinvestment of dividends. Based on net asset value, which does not reflect the applicable sales charges. |
| (3) | | Not annualized for periods less than one year. |
| (4) | | Annualized for periods less than one year. |
| (5) | | Expense ratios of expenses to average net assets before waivers and reimbursements of expenses excluding dividend and interest expense on short positions were 1.78% for the six months ended June 30, 2021 and 1.83%, 1.80%, 1.76%, 1.74%, and 1.61% for the years ended December 31, 2020, 2019, 2018, 2017, and 2016, respectively. |
| (6) | | Expense ratios of expenses to average net assets after waivers and reimbursements of expenses excluding dividend and interest expense on short positions were 1.56% for the six months ended June 30, 2021 and 1.56%, 1.56%, 1.56%, 1.56%, and 1.56% for the years ended December 31, 2020, 2019, 2018, 2017, and 2016, respectively. |
| (7) | | The net investment income (loss) ratios include dividend and interest expense on short positions. |
| (8) | | Consists of long-term investments only; excludes securities sold short and derivative instruments. |
| (9) | | Effective after the close of business on April 8, 2016, Class I shares were subject to an expense limitation cap of 1.56%. |
The accompanying notes are an integral part of these financial statements.
20
MARKETFIELD FUND
Notes to Financial Statements
June 30, 2021
(Unaudited)
Trust for Professional Managers (the “Trust”) was organized as a Delaware statutory trust under a Declaration of Trust dated May 29, 2001. The Trust is registered under the Investment Company Act of 1940, as amended (the “1940 Act”), as an open-end management investment company. The Marketfield Fund (the “Fund”) represents a distinct series with its own investment objective and policies within the Trust. The investment objective of the Fund is capital appreciation. The Trust may issue an unlimited number of shares of beneficial interest at $0.001 par value. The assets of the Fund are segregated, and a shareholder’s interest is limited to the Fund in which shares are held.
The Fund currently offers three classes of shares. Class I shares commenced operations on July 31, 2007. Class A and Class C shares commenced operations on October 5, 2012. Class R6 shares commenced operations on June 17, 2013. Class R6 shares of the Fund were liquidated as of the close of business on November 30, 2020. Effective as of the close of business on August 15, 2016, the Fund converted its Investor Class shares into Class A shares of the Fund. Effective as of the close of business on August 15, 2016, the Fund converted its Class R2 and Class P shares into Class I shares of the Fund. Class A shares are subject to an initial maximum sales charge of 5.50% imposed at the time of purchase. The sales charge declines as the amount purchased increases in accordance with the Fund’s prospectus. A contingent deferred sales charge (“CDSC”) of 1.00% may be imposed on certain redemptions of Class A shares made within 12 months of the date of purchase of Class A shares. Class C shares are offered at NAV without an initial sales charge, although a 1.00% CDSC may be imposed on redemptions made within 12 months of the date of purchase of Class C shares. Class I shares are offered at NAV and are not subject to a sales charge. In addition, you generally may elect on a voluntary basis to convert your Class A or Class C shares that are no longer subject to a CDSC into Class A or Class I shares of the Fund, subject to satisfying the eligibility requirements of Class A or Class I shares, as applicable. Class C shares of the Fund automatically convert to Class A shares after 10 years. The three classes of shares have the same voting (except for issues that relate solely to one class), dividend, liquidation and other rights, and the same terms and conditions, except that Class C shares are subject to higher distribution and/or service (Rule 12b-1) fee rates than Class A shares under a distribution plan pursuant to Rule 12b-1 under the 1940 Act. Class I shares are not subject to a distribution and/or service (Rule 12b-1) fee.
Pursuant to a reorganization that took place after the close of business on April 8, 2016 (the “Reorganization”), the Fund is the successor to the MainStay Marketfield Fund, a series of MainStay Funds Trust (the “Predecessor Fund”). The Predecessor Fund and the Fund have the same investment objectives and substantially the same strategies and investment policies.
The Fund is an investment company and accordingly follows the investment accounting and reporting guidance of the Financial Accounting Standards Board (FASB) Accounting Standard Codification Topic 946 “Financial Services — Investment Companies.”
| (2) | | Significant Accounting Policies |
The following is a summary of significant accounting policies consistently followed by the Fund in the preparation of these schedules of investments. These policies are in conformity with generally accepted accounting principles in the United States of America (“GAAP”).
Each security owned by the Fund that is listed on a securities exchange, except securities listed on the NASDAQ Stock Market, LLC (“NASDAQ”), is valued at its last sale price on that exchange on the date as of which assets are valued. Swap agreements, such as credit default swaps, interest rate swaps and currency swaps, are priced by an approved independent pricing service (“Pricing Service”). Forward foreign currency contracts are valued at the mean between the bid and asked prices by a Pricing Service. Commodities futures
21
MARKETFIELD FUND
Notes to Financial Statements, continued
June 30, 2021
(Unaudited)
contracts and options thereon traded on a commodities exchange or board of trade are valued at the last sale price at the close of trading.
If the security is listed on more than one exchange, the Fund will use the price of the exchange that the Fund generally considers to be the principal exchange on which the security is traded. Portfolio securities listed on NASDAQ will be valued at the NASDAQ Official Closing Price, which may not necessarily represent the last sale price. If there has been no sale on such exchange or on NASDAQ on such day, the security is valued at the mean between the most recent bid and ask prices at the close of the exchange on such day, or the security shall be valued at the latest sales price on the “composite market” for the day such security is being valued. The composite market is defined as a consolidation of the trade information provided by national securities and foreign exchanges and over-the-counter markets as published by a Pricing Service for the day such security is being valued.
If market quotations are not readily available, any security or other asset will be valued at its fair value as determined under fair value pricing procedures approved by the Trust’s Board of Trustees. These fair value pricing procedures will also be used to price a security when corporate events, events in the securities market and/or world events cause Marketfield Asset Management, LLC (the “Adviser”) to believe that a security’s last sale price may not reflect its actual fair market value. The intended effect of using fair value pricing procedures is to ensure that the Fund’s shares are accurately priced. The Board of Trustees will regularly evaluate whether the Fund’s fair value pricing procedures continue to be appropriate in light of the specific circumstances of the Fund and the quality of prices obtained through the application of such procedures by the Trust’s valuation committee.
Redeemable securities issued by open-end, registered investment companies are valued at the NAVs of such companies for purchase and/or redemption orders placed on that day. If, on a particular day, a share of an investment company is not listed on NASDAQ, such security’s fair value will be determined as described above. All exchange-traded funds are valued at the last reported sale price on the exchange on which the security is principally traded. In the event market quotations are not readily available, such security’s fair value will be determined.
Debt securities, including short-term instruments having a maturity of 60 days or less, are valued at the mean in accordance with prices supplied by a Pricing Service. Pricing Services may use various valuation methodologies such as the mean between the bid and ask prices, matrix pricing method or other analytical pricing models as well as market transactions and dealer quotations. If a price is not available from a Pricing Service, the most recent quotation obtained from one or more broker-dealers known to follow the issue will be obtained. Quotations will be valued at the mean between the bid and the offer. Fixed income securities purchased on a delayed-delivery basis are typically marked to market daily until settlement at the forward settlement date. Any discount or premium is accreted or amortized using the constant yield method until maturity.
Money market funds, demand notes and repurchase agreements are valued at cost. If cost does not represent current market value the securities will be priced at fair value.
Exchange-traded options are valued at the composite price, using the National Best Bid and Offer quotes (“NBBO”). NBBO consists of the highest bid price and lowest ask price across any of the exchanges on which an option is quoted, thus providing a view across the entire U.S. options marketplace. Specifically, composite pricing looks at the last trades on the exchanges where the options are traded. If there are no trades for the option on a given business day, composite option pricing calculates the mean of the highest bid price and lowest ask price across the exchanges where the option is traded. Over-the-counter (“OTC”) option contracts on securities, currencies and other financial instruments with less than 180 days remaining until their expiration shall be valued at the evaluated price provided by the broker-dealer with which the option was traded. Option contracts on securities, currencies and other financial instruments traded in the OTC market with 180 days or more remaining until their expiration shall be valued at the prices provided by a recognized
22
MARKETFIELD FUND
Notes to Financial Statements, continued
June 30, 2021
(Unaudited)
independent broker-dealer. Futures contracts and options thereon are valued at the last settlement price at the closing of trading on the relevant exchange or board of trade. Futures or options on futures positions for which reliable market quotations are not readily available shall be valued at a price supplied by a Pricing Service.
Swap agreements are generally traded over the counter and are valued by a Pricing Service using observable inputs. If a price provided by a Pricing Service differs from the price provided by an independent dealer by 10% or more or the Adviser otherwise believes that the price provided by the Pricing Service is inaccurately stated, the Adviser shall price the swap using the average of two prices obtained by independent dealers. In the event the Adviser determines the price of a swap in this manner does not represent market value, the fair value of the subject swap shall be determined in accordance with the Trust’s fair value procedures.
FASB Accounting Standards Codification, “Fair Value Measurements” Topic 820 (“ASC 820”), establishes an authoritative definition of fair value and sets out a hierarchy for measuring fair value. ASC 820 requires an entity to evaluate certain factors to determine whether there has been a significant decrease in volume and level of activity for the security such that recent transactions and quoted prices may not be determinative of fair value and further analysis and adjustment may be necessary to estimate fair value. ASC 820 also requires enhanced disclosure regarding the inputs and valuation techniques used to measure fair value in those instances as well as expanded disclosure of valuation levels for major security types. These inputs are summarized in the three broad levels listed below:
Level 1 — Quoted prices in active markets for identical securities.
Level 2 — Other significant observable inputs (including quoted prices for similar securities, interest rates, prepayment speeds, credit risk, etc.).
Level 3 — Significant unobservable inputs (including the Fund’s own assumptions in determining the fair value of investments).
The inputs or methodology used for valuing securities are not necessarily an indication of the risk associated with investing in those securities. The following is a summary of the inputs used to value the Fund’s investments carried at fair value as of June 30, 2021:
| | | | | | | | | | | | | | | | |
| | | Level 1
| | | Level 2
| | | Level 3(2)
| | | Total
| |
| Assets: | | | | | | | | | | | | | | | | |
Common Stocks(1) | | $ | 102,031,571 | | | $ | — | | | $ | — | | | $ | 102,031,571 | |
Exchange-Traded Funds | | | 39,744,485 | | | | — | | | | — | | | | 39,744,485 | |
Short-Term Investments | | | 19,899,717 | | | | — | | | | — | | | | 19,899,717 | |
| | |
|
|
| |
|
|
| |
|
|
| |
|
|
|
| Total Assets | | $ | 161,675,773 | | | $ | — | | | $ | — | | | $ | 161,675,773 | |
| | |
|
|
| |
|
|
| |
|
|
| |
|
|
|
| Liabilities: | | | | | | | | | | | | | | | | |
| Securities Sold Short | | | | | | | | | | | | | | | | |
Exchange-Traded Funds | | $ | (34,119,684 | ) | | $ | — | | | $ | — | | | $ | (34,119,684 | ) |
Real Estate Investment Trusts | | | (6,417,489 | ) | | | — | | | | — | | | | (6,417,489 | ) |
| | |
|
|
| |
|
|
| |
|
|
| |
|
|
|
| Total Securities Sold Short | | | (40,537,173 | ) | | | — | | | | — | | | | (40,537,173 | ) |
| | |
|
|
| |
|
|
| |
|
|
| |
|
|
|
| Total Liabilities | | $ | (40,537,173 | ) | | $ | — | | | $ | — | | | $ | (40,537,173 | ) |
| | |
|
|
| |
|
|
| |
|
|
| |
|
|
|
| (1) | | See the Schedule of Investments for industry/geographic classifications. |
| (2) | | The Fund measures Level 3 activity as of the end of each financial reporting period. For the six months ended June 30, 2021, the Fund did not have unobservable inputs (Level 3 securities) used in determining fair value. Therefore, a reconciliation of assets and liabilities in which significant unobservable inputs (Level 3 securities) were used in determining fair value is not applicable. |
| | (b) | | Foreign Securities and Currency Transactions |
Investment securities and other assets and liabilities denominated in foreign currencies are translated into U.S. dollar amounts at the date of valuation. Purchases and sales of investment securities and income and
23
MARKETFIELD FUND
Notes to Financial Statements, continued
June 30, 2021
(Unaudited)
expense items denominated in foreign currencies are translated into U.S. dollar amounts on the respective dates of such transactions. The Fund does not isolate the portion of the results of operations from changes in foreign exchange rates on investments from the fluctuations arising from changes in market prices of securities held. Realized foreign exchange gains or losses arising from sales of portfolio securities and sales and maturities of short-term securities are reported within realized gain (loss) on investments. Net unrealized foreign exchange gains and losses arising from changes in the values of investments in securities from fluctuations in exchange rates are reported within unrealized gain (loss) on investments. The realized gain or loss and unrealized appreciation or depreciation resulting from all other transactions denominated in currency other than U.S. dollars are disclosed separately.
Investments in foreign securities entail certain risks. There may be a possibility of nationalization or expropriation of assets, confiscatory taxation, political or financial instability, and diplomatic developments that could affect the value of the Fund’s investments in certain foreign countries. Since foreign securities normally are denominated and traded in foreign currencies, the value of the Fund’s assets may be affected favorably or unfavorably by currency exchange rates, currency exchange control regulations, foreign withholding taxes, and restrictions or prohibitions on the repatriation of foreign currencies. There may be less information publicly available about a foreign issuer than about a U.S. issuer, and foreign issuers are not generally subject to accounting, auditing, and financial reporting standards and practices comparable to those in the United States. The securities of some foreign issuers are less liquid and at times more volatile than securities of comparable U.S. issuers.
| | (c) | | Derivative Instruments |
GAAP requires enhanced disclosure that enables investors to understand how and why an entity uses derivatives, how derivatives are accounted for, and how derivative instruments affect an entity’s results of operations and financial position.
The Fund may invest in derivatives for hedging purposes, to maintain liquidity or to seek total return. Derivatives have a return tied to a formula based upon an interest rate, index, price of a security or other measurement. Derivatives include options, futures contracts, forward foreign currency contracts, swaps and related products. The Fund invested in derivative instruments such as purchased options, written options, forward currency contracts, swap contracts and futures contracts during the period.
The fair value of derivative instruments as reported within the Statement of Assets and Liabilities as of June 30, 2021:
| | | | | | | | | | | | | | | | |
| | | Asset Derivatives
| | | Liability Derivatives
| |
Derivatives not accounted for as
hedging instruments
| | Statement of Assets
& Liabilities Location
| | | Value
| | | Statement of Assets
& Liabilities Location
| | | Value
| |
Equity Contracts — Options | | | Investments, at value | | | $ | — | | | | Written options, at value | | | $ | — | |
| | | | | | |
|
|
| | | | | |
|
|
|
Total | | | | | | $ | — | | | | | | | $ | — | |
| | | | | | |
|
|
| | | | | |
|
|
|
The effect of derivative instruments on the Statement of Operations for the six months ended June 30, 2021 was as follows:
| | | | | | | | | | | | | | | | |
| | Amount of Realized Gain (Loss) on Derivatives
Recognized in Income
| |
Derivatives not accounted for as hedging instruments
| | Purchased
Options
| | | Written
Options
| | | Futures
Contracts
| | | Total
| |
Equity Contracts | | $ | (331,538 | ) | | $ | — | | | $ | — | | | $ | (331,538 | ) |
| | |
|
|
| |
|
|
| |
|
|
| |
|
|
|
Total | | $ | (331,538 | ) | | $ | — | | | $ | — | | | $ | (331,538 | ) |
| | |
|
|
| |
|
|
| |
|
|
| |
|
|
|
24
MARKETFIELD FUND
Notes to Financial Statements, continued
June 30, 2021
(Unaudited)
| | | | | | | | | | | | | | | | |
| | | Change in Unrealized Appreciation (Depreciation) on
Derivatives Recognized in Income
| |
Derivatives not accounted for as hedging instruments
| | Purchased
Options
| | | Written
Options
| | | Futures
Contracts
| | | Total
| |
Equity Contracts | | $ | — | | | $ | — | | | $ | — | | | $ | — | |
| | |
|
|
| |
|
|
| |
|
|
| |
|
|
|
Total | | $ | — | | | $ | — | | | $ | — | | | $ | — | |
| | |
|
|
| |
|
|
| |
|
|
| |
|
|
|
Options
The Fund may write call and put options on securities and financial derivative instruments it owns or in which it may invest. Writing put options tends to increase the Fund’s exposure to decreases in the value of the underlying instrument. Writing covered call options tends to decrease the Fund’s exposure to the underlying instrument. Writing uncovered call options increases the Fund’s exposure to loss in the event of increase in value of the underlying instrument. When the Fund writes a call or put, an amount equal to the premium received is recorded as a liability and subsequently marked to market to reflect the current value of the option written. These liabilities are reflected as written options outstanding on the Statement of Assets and Liabilities. Premiums received from writing options which expire are treated as realized gains. Premiums received from writing options which are exercised or closed are added to the proceeds or offset against amounts paid on the underlying futures, swaps, security or currency transaction to determine the realized gain or loss. Certain options may be written with premiums to be determined on a future date. The Fund, as a writer of an option, has no control over whether the underlying instrument may be sold (call) or purchased (put) and as a result bears the market risk of an unfavorable change in the price of the instrument underlying the written option. There is the risk the Fund may not be able to enter into a closing transaction because of an illiquid market. Writing call options involves the risk of loss in excess of the related amounts reflected in the Statement of Assets and Liabilities.
The Fund may also purchase put and call options. Purchasing call options tends to increase the Fund’s exposure to the underlying instrument. Alternatively, purchasing put options tends to decrease the Fund’s exposure to the underlying instrument. The Fund pays a premium which is included on the Fund’s Statement of Assets and Liabilities as an investment and subsequently marked to market to reflect the current value of the option. Premiums paid for purchasing options which expire are treated as realized losses. Certain options may be purchased with premiums to be determined on a future date. The premiums for these options are based upon implied volatility parameters at specified terms. The risk associated with purchasing put and call options is limited to the premium paid. Premiums paid for purchasing options which are exercised or closed are added to the amounts paid or offset against the proceeds on the underlying investment transaction to determine the realized gain or loss when the underlying transaction is sold.
The Fund may purchase or write foreign currency options. Purchasing a foreign currency option gives the Fund the right, but not the obligation, to buy or sell a specified amount of the currency at a specified rate of exchange that may be exercised on or before the option’s expiration date. Writing a foreign currency option obligates the Fund to buy or sell a specified amount of foreign currency at a specified rate of exchange, and such option may be exercised on or before the option’s expiration date in exchange for an option premium. These options may be used as a short or long hedge against possible variations in foreign exchange rates or to gain exposure to foreign currencies. The risks associated with writing a foreign currency put option is that the Fund may incur a loss if the value of the referenced foreign currency decreases and the option is exercised. The risks associated with writing a foreign currency call option is that if the value of the referenced foreign currency increases, and if the option is exercised, the Fund must either acquire the referenced foreign currency at the then higher price for delivery or, if the Fund already owns the referenced foreign currency, forego the opportunity for profit with respect to such foreign currency.
25
MARKETFIELD FUND
Notes to Financial Statements, continued
June 30, 2021
(Unaudited)
| | Futures | | and Forward Foreign Currency Contracts |
The Fund may enter into foreign currency forward exchange contracts. When entering into a forward currency contract, the Fund agrees to receive or deliver a fixed quantity of foreign currency for an agreed-upon price at a future date. The fair value of the contract fluctuates with changes in currency exchange rates. The contract is marked to market daily and the change in market value is recorded by the Fund as an unrealized gain or loss. The Fund records a realized gain or loss equal to the difference between the value of the contract at the time it was opened and the value at the time it was closed.
The Fund may enter into futures contracts traded on domestic and international exchanges, including stock index futures contracts. Upon entering into a contract, the Fund deposits and maintains as collateral such initial margin as required by the exchange on which the transaction is effected. Pursuant to the contract, the Fund agrees to receive from or pay to the broker an amount of cash equal to the daily fluctuation in value of the contract. Such receipts or payments are known as variation margin and are recorded by the Fund as unrealized gains and losses. When the contract is closed, the Fund records a realized gain or loss equal to the difference between the value of the contract at the time it was opened and the value at the time it was closed. As collateral for futures contracts, the Fund is required under the 1940 Act to maintain assets consisting of cash, cash equivalents or liquid securities. This collateral is required to be adjusted daily to reflect the market value of the obligations for futures contracts or the market value of the instrument underlying the contract.
The risks inherent in the use of futures contracts include 1) adverse changes in the value of such instruments and 2) the possible absence of a liquid secondary market for any particular instrument at any time. Futures contracts also expose the Fund to counterparty credit risk. The Fund will not enter into these contracts unless it owns either 1) an offsetting position in the securities or 2) cash and liquid assets, with a value marked to market daily, sufficient to cover its potential obligations.
The Fund did not hold any futures contracts or forward foreign currency contracts during the period.
The Fund is subject to equity price, foreign exchange rate, credit, and volatility risk in the normal course of pursuing its investment objective. The Fund may enter into various swap transactions for investment purposes to manage these risks. These would be two-party contracts entered into primarily to exchange the returns (or differentials in rates of returns) earned or realized on particular pre-determined investments or instruments. The gross returns to be exchanged or “swapped” between parties are calculated with respect to a notional amount, i.e., the return on or increase in value of a particular dollar amount invested at a particular interest rate, in a particular foreign currency, or in a “basket” of securities representing a particular index or market segment. Changes in the value of swap agreements are recognized as unrealized gains or losses in the “marking to market” on a daily basis to reflect the value of the swap agreement at the end of each trading day. Payments received or paid at the beginning of the agreement are referred to as upfront payments. The Fund amortizes upfront payments and/or accrues for the fixed payment stream on swap agreements on a daily basis with the net amount recorded as a component of unrealized gain or loss until contracts are closed or payments are received/paid and recognized as income. A liquidation payment received or made at the termination of the swap agreement is recorded as a realized gain or loss on the Statement of Operations. The Fund segregates liquid securities having a value at least equal to the amount of its current obligation under any swap transaction. Entering into these agreements involves, to varying degrees, lack of liquidity and elements of credit, market, and counterparty risk. The Fund’s maximum risk of loss from counterparty credit risk is the discounted net value of the cash flows to be received from/paid to the counterparty over the contract’s remaining life, to the extent that amount is positive.
The Fund may enter into credit default swaps to manage its exposure to the market or certain sectors of the market, to reduce its risk exposure to defaults of corporate issuers or indexes or to create exposure to
26
MARKETFIELD FUND
Notes to Financial Statements, continued
June 30, 2021
(Unaudited)
corporate issuers or indexes to which it is not otherwise exposed. In a credit default swap, the protection buyer makes a stream of payments based on a fixed percentage applied to the contract notional amount to the protection seller in exchange for the right to receive a specified return upon the occurrence of a defined credit event on the reference obligation which may be either a single security or a basket of securities issued by corporate or sovereign issuers. Although contract-specific, credit events are generally defined as bankruptcy, failure to pay, restructuring, obligation acceleration, obligation default, or repudiation/moratorium. Upon the occurrence of a defined credit event, the difference between the value of the reference obligation and the swap’s notional amount is recorded as realized gain (for protection written) or loss (for protection sold) in the Statement of Operations. In the case of credit default swaps where the Fund is selling protection, the notional amount approximates the maximum loss.
The Fund did not hold any swaps during the period.
The Fund may sell a security it does not own in anticipation of a decline in the fair value of that security. When the Fund sells a security short, it must borrow the security sold short and deliver it to the broker-dealer through which it made the short sale. A gain, limited to the price at which the Fund sold the security short, or a loss, unlimited in size, will be recognized upon the termination of a short sale.
For financial statement purposes, an amount equal to the settlement amount is included in the Statement of Assets and Liabilities as a liability. The amount of the liability is subsequently marked to market to reflect the current value of the short positions. Subsequent fluctuations in the market prices of the securities sold, but not yet purchased, may require purchasing the securities at prices which could differ from the amount reflected in the Statement of Assets and Liabilities. The Fund is liable for any dividends or interest payable on securities while those securities are in a short position. Such amounts are recorded on the ex-dividend date as dividend or interest expense. As collateral for its short positions, the Fund is required under the 1940 Act to maintain segregated assets consisting of cash, cash equivalents or liquid securities. The segregated assets are valued consistent with Note 2a above. The amount of segregated assets is required to be adjusted daily to reflect changes in the fair value of the securities sold short.
| | (e) | | Counterparty Credit Risk |
In order to better define its contractual rights and to secure rights that will help the Fund mitigate its counterparty risk, the Fund may enter into an International Swaps and Derivatives Association, Inc. Master Agreement (“ISDA Master Agreement”) or similar agreement with its counterparties. An ISDA Master Agreement is a bilateral agreement between the Fund and a counterparty that governs certain OTC derivatives and typically contains collateral posting terms and netting provisions. Under an ISDA Master Agreement, the Fund may, under certain circumstances, offset with the counterparty certain derivative financial instruments’ payables and/or receivables with collateral held and/or posted and create one single net payment. The provisions of the ISDA Master Agreement typically permit a single net payment in the event of default including the bankruptcy or insolvency of the counterparty. Bankruptcy or insolvency laws of a particular jurisdiction may restrict or prohibit the right of offset in bankruptcy, insolvency or other events. In addition, certain ISDA Master Agreements may contain provisions for early termination of OTC derivative transactions in the event the net assets of the Fund decline below specific levels or if the Fund fails to meet the terms of its ISDA Master Agreements. The result would cause the Fund to accelerate payment of any net liability owed to the counterparty. For financial reporting purposes, the Fund does not offset derivative assets and derivative liabilities that are subject to netting arrangements, if any, in the Statement of Assets and Liabilities.
At June 30, 2021, the Fund had deposits with Bank of America Merrill Lynch, Citibank N.A., and Wells Fargo Securities, LLC (the “Brokers”), which served as collateral for derivative instruments and securities sold short. The Adviser determined, based on information available at the time, that the creditworthiness of each Broker is satisfactory. However, there is no guarantee that the Adviser’s determination is correct or will remain accurate.
27
MARKETFIELD FUND
Notes to Financial Statements, continued
June 30, 2021
(Unaudited)
The Fund intends to comply with the requirements of Subchapter M of the Internal Revenue Code of 1986, as amended, necessary to qualify as a regulated investment company and to make the requisite distributions of income and capital gains to its shareholders sufficient to relieve it from all or substantially all federal income taxes. Therefore, no federal income tax provision has been provided.
As of and during the year ended December 31, 2020, the Fund did not have a liability for any unrecognized tax benefits. The Fund recognizes interest and penalties, if any, related to unrecognized tax benefits as income tax expense in the Statement of Operations. During the year ended December 31, 2020, the Fund did not incur any interest or penalties. The Fund is not subject to examination by U.S. taxing authorities for the tax periods prior to the year ended December 31, 2017.
| | (g) | | Distributions to Shareholders |
In general, the Fund will distribute any net investment income and any net realized long- or short-term capital gains at least annually. Distributions from net realized gains for book purposes may include short-term capital gains. All short-term capital gains are included in ordinary income for tax purposes. Distributions to shareholders are recorded on the ex-dividend date. The Fund may also pay a special distribution at the end of the calendar year to comply with federal tax requirements.
Income and capital gain distributions may differ from GAAP, primarily due to timing differences in the recognition of income and gains and losses by the Fund. To the extent that these differences are attributable to permanent book and tax accounting differences, they are reclassified in the components of net assets.
The preparation of financial statements in conformity with GAAP requires management to make estimates and assumptions that affect the reported amounts of assets and liabilities and disclosure of contingent assets and liabilities at the date of the financial statements and the reported amounts of revenues and expenses during the reporting period. Actual results could differ from those estimates.
The NAV per share of the Fund is calculated by dividing the sum of the value of the securities held by the Fund, plus cash or other assets, minus all liabilities (including estimated accrued expenses) by the total number of shares outstanding for the Fund, rounded to the nearest cent. The Fund’s shares will not be priced on the days on which the New York Stock Exchange is closed for trading.
| | (j) | | Allocation of Income, Expenses and Gains/Losses |
Income, expenses (other than those deemed attributable to a specific share class), and gains and losses of the Fund are allocated daily to each class of shares based upon the ratio of net assets represented by each class as a percentage of the net assets of the Fund. Expenses deemed directly attributable to a class of shares are recorded by the specific class. Most Fund expenses are allocated by class based on relative net assets. Rule 12b-1 distribution and service fees are expensed at 0.25% of average daily net assets of the Class A shares and at 1.00% of average daily net assets of the Class C shares. Expenses associated with a specific fund in the Trust are charged to that fund. Expenses are recognized on an accrual basis. Common Trust expenses are typically allocated evenly between the funds of the Trust, or by other equitable means.
Investment transactions are recorded on the trade date. The Fund determines the gain or loss from investment transactions on the identified cost basis by comparing original cost of the security lot sold with the
28
MARKETFIELD FUND
Notes to Financial Statements, continued
June 30, 2021
(Unaudited)
net sale proceeds. Dividend income and expense, less net foreign withholding tax, are recognized on the ex-dividend date and interest income and expense are recognized on an accrual basis. Withholding taxes on foreign dividends and interest, net of any reclaims, have been provided for in accordance with the Fund’s understanding of the applicable country’s tax rules and rates. Payments received on securities in default are recorded as return of capital.
The tax character of distributions paid during the years ended December 31, 2019 and 2020 were as follows:
| | | | | | | | |
| | Ordinary
Income
| | | Long-Term
Capital Gain
| |
December 31, 2019 | | $ | 639,366 | | | $ | — | |
December 31, 2020 | | $ | — | | | $ | — | |
As of December 31, 2020, the components of accumulated earnings on a tax basis were as follows:
| | | | |
Cost basis of investments for federal income tax purposes | | $ | 91,274,407 | |
| | |
|
|
|
Gross tax unrealized appreciation | | | 78,982,450 | |
Gross tax unrealized depreciation | | | (12,113,338 | ) |
| | |
|
|
|
Net tax unrealized appreciation | | | 66,869,112 | |
| | |
|
|
|
Undistributed ordinary income | | | — | |
Undistributed long-term capital gain | | | — | |
| | |
|
|
|
Total distributable earnings | | | — | |
Other accumulated losses | | | (404,624,157 | ) |
| | |
|
|
|
Total accumulated losses | | $ | (337,755,045 | ) |
| | |
|
|
|
The difference between book-basis and tax-basis unrealized appreciation (depreciation) is primarily due to wash sale loss deferrals.
At December 31, 2020, the Fund had short-term capital losses of $404,624,157, which will be carried forward indefinitely to offset future realized capital gains. To the extent the Fund realizes future net capital gains, taxable distributions to its shareholders will be first offset by any unused capital loss carryovers from the year ended December 31, 2020.
The Fund utilized $11,283,148 of short-term capital loss carryover during the year ended December 31, 2020.
Additionally, U.S. GAAP requires that certain components of net assets relating to permanent differences be reclassified between financial and tax reporting. These reclassifications have no effect on net assets or NAV per share. For the year ended December 31, 2020, the following table shows the reclassifications made:
| | |
Accumulated Deficit
| | Paid In Capital
|
$1,687,557 | | $(1,687,557) |
The Trust, on behalf of the Fund, has an Investment Advisory Agreement (the “Agreement”) with Marketfield Asset Management LLC to furnish investment advisory services to the Fund. Under the terms of the Agreement, the Trust, on behalf of the Fund, compensates the Adviser for its investment advisory services at an annual rate of the Fund’s average daily net assets as follows: 1.40% up to $7.5 billion; 1.38% from $7.5 billion to $15 billion; and 1.36% in excess of $15 billion. For the six months ended June 30, 2021,
29
MARKETFIELD FUND
Notes to Financial Statements, continued
June 30, 2021
(Unaudited)
the effective management fee rate (exclusive of any applicable waivers/reimbursements) was 1.40% and the Adviser earned fees in the amount of $1,156,083 from the Fund.
The Adviser has contractually agreed to waive its management fee and/or reimburse the Fund’s other expenses (the “Expense Limitation Cap”) at least through April 30, 2022, at the discretion of the Adviser and the Board of Trustees, to the extent necessary to ensure that the Fund’s total operating expenses for each share class (exclusive of front-end or contingent deferred sales loads, taxes, leverage, interest, brokerage commissions, expenses incurred in connection with any merger or reorganization, dividends or interest expenses on short positions, acquired fund fees and expenses and extraordinary expenses such as litigation) do not exceed the Expense Limitation Cap as follows:
| | | | |
Class A
| | Class C
| | Class I
|
1.80% | | 2.57% | | 1.56% |
Any such waiver or reimbursement is subject to later adjustment to allow the Adviser to recoup amounts waived or reimbursed to the extent actual fees and expenses for a fiscal period do not exceed the lesser of: (1) the Expense Limitation Cap in place at the time of the waiver or reimbursement; or (2) the Expense Limitation Cap in place at the time of the recoupment; provided, however, that the Adviser shall only be entitled to recoup such amounts over the following three year period from the date of the waiver or reimbursement.
The following table shows the waivers per class that are subject to potential recovery expiring on:
| | | | | | | | | | | | | | | | |
| | | Class A
| | | Class C
| | | Class I
| | | Class R6(1)
| |
December 31, 2021 | | $ | 74,461 | | | $ | 83,167 | | | $ | 266,527 | | | $ | 4,004 | |
December 31, 2022 | | $ | 100,616 | | | $ | 107,074 | | | $ | 309,041 | | | $ | 5,735 | |
December 31, 2023 | | $ | 102,444 | | | $ | 80,122 | | | $ | 237,327 | | | $ | 0 | |
June 30, 2023 | | $ | 51,102 | | | $ | 11,785 | | | $ | 105,272 | | | | | |
| | (1) | | Class R6 shares of the Fund were liquidated as of the close of business on November 30, 2020. |
The Trust has adopted a plan pursuant to Rule 12b-1 under the 1940 Act (the “12b-1 Plan”), on behalf of the Fund, which authorizes it to pay Quasar Distributors, LLC (the “Distributor” or “Quasar”), the Fund’s distributor and principal underwriter. Pursuant to the 12b-1 Plan, the Distributor receives a distribution fee of 0.25% of the average daily net assets of the Class A shares for services to prospective Fund shareholders and distribution of Fund shares. Pursuant to the 12b-1 Plan, Class C shares pay the Distributor a distribution fee of 0.75% of the average daily net assets of the Class C shares, along with a shareholder servicing fee of 0.25% of the average daily net assets of the Class C shares, for a total 12b-1 fee of 1.00%. Class I shares are not subject to the 12b-1 Plan. As of and during the six months ended June 30, 2021, the Fund accrued and owed expenses related to the 12b-1 Plan as presented in the Statement of Operations and Statement of Assets and Liabilities, respectively, as follows:
| | | | | | | | | | | | | | | | |
| | | 12b-1 Fees
| | | Shareholder Servicing Fees
| |
| | | Fees Expensed
| | | Fees Owed
| | | Fees Expensed
| | | Fees Owed
| |
Class A | | $ | 54,638 | | | $ | 5,248 | | | | N/A | | | | N/A | |
Class C | | $ | 102,731 | | | $ | 20,812 | | | $ | 13,427 | | | $ | 18,534 | |
The Distributor acts as the Fund’s principal underwriter in a continuous public offering of the Fund’s shares. The Distributor was an affiliate of Fund Services and U.S. Bancorp through March 30, 2020. Effective March 31, 2020, Foreside Financial Group, LLC (“Foreside”) acquired Quasar from U.S. Bancorp. As a result of the acquisition, Quasar became a wholly-owned broker-dealer subsidiary of Foreside and is no longer
30
MARKETFIELD FUND
Notes to Financial Statements, continued
June 30, 2021
(Unaudited)
affiliated with U.S. Bancorp. The Board of Trustees of the Trust has approved a new Distribution Agreement to enable Quasar to continue serving as the Fund’s distributor.
| (6) | | Related Party Transactions |
U.S. Bancorp Fund Services, LLC, doing business as U.S. Bank Global Fund Services (“Fund Services” or the “Administrator”), acts as the Fund’s Administrator under an Administration Agreement. The Administrator prepares various federal and state regulatory filings, reports and returns for the Fund; prepares reports and materials to be supplied to the Trustees; monitors the activities of the Fund’s custodian, transfer agent and accountants; coordinates the preparation and payment of the Fund’s expenses; and reviews the Fund’s expense accruals. Fund Services also serves as the fund accountant and transfer agent to the Fund. U.S. Bank National Association (“U.S. Bank”), an affiliate of Fund Services, serves as the Fund’s custodian. The following table details the fees expensed for each service during the six months ended June 30, 2021, as well as the fees owed as of June 30, 2021.
| | | | | | | | |
| | | Fees Expensed During
Fiscal Year
| | | Fees Owed as of
June 30, 2021
| |
Administration and Fund Accounting | | $ | 98,473 | | | $ | 32,238 | |
Pricing | | | 905 | | | | 326 | |
Custody | | | 15,941 | | | | 4,102 | |
Transfer Agent | | | 43,214 | (1) | | | 12,425 | |
| | (1) | | This amount does not include sub-transfer agency fees, and therefore it does not agree to the amount on the Statement of Operations. |
The Fund also has a line of credit with U.S. Bank (see Note 9).
Certain officers of the Fund are also employees of Fund Services. A Trustee of the Trust is affiliated with Fund Services and U.S. Bank and is deemed to be an “interested” person of the Trust as defined by the 1940 Act.
The Trust’s Chief Compliance Officer is also an employee of Fund Services. For the six months ended June 30, 2021, the Fund was allocated $5,973 of the Trust’s Chief Compliance Officer fee. At June 30, 2021, the Fund owed fees of $1,963 to Fund Services for the Chief Compliance Officer’s services.
| (7) | | Capital Share Transactions |
Transactions in shares of the Fund were as follows:
| | | | | | | | |
| | | Six Months Ended
June 30, 2021
| | | Year Ended
December 31, 2020
| |
| Class A | | | | | | | | |
Shares sold | | | 65,919 | | | | 446,194 | |
Shares redeemed | | | (126,613 | ) | | | (586,308 | ) |
| | |
|
|
| |
|
|
|
Net decrease | | | (60,694 | ) | | | (140,114 | ) |
| | |
|
|
| |
|
|
|
| Class C | | | | | | | | |
Shares sold | | | 889 | | | | 6,121 | |
Shares redeemed | | | (188,812 | ) | | | (961,327 | ) |
| | |
|
|
| |
|
|
|
Net decrease | | | (187,923 | ) | | | (955,206 | ) |
| | |
|
|
| |
|
|
|
31
MARKETFIELD FUND
Notes to Financial Statements, continued
June 30, 2021
(Unaudited)
| | | | | | | | |
| | | Six Months Ended
June 30, 2021
| | | Year Ended
December 31, 2020(1)
| |
| Class I | | | | | | | | |
Shares sold | | | 193,453 | | | | 285,401 | |
Shares redeemed | | | (401,894 | ) | | | (2,047,576 | ) |
| | |
|
|
| |
|
|
|
Net decrease | | | (208,441 | ) | | | (1,762,175 | ) |
| | |
|
|
| |
|
|
|
| Class R6 | | | | | | | | |
Shares sold | | | — | | | | 2,683 | |
Shares redeemed | | | — | | | | (100,063 | ) |
| | �� |
|
|
| |
|
|
|
Net decrease | | | — | | | | (97,380 | ) |
| | |
|
|
| |
|
|
|
| | (1) | | Class R6 shares of the Fund were liquidated as of the close of business on November 30, 2020. |
| (8) | | Investment Transactions |
The aggregate purchases and sales of securities, excluding short-term investments, securities sold short and derivative instruments for the Fund for the six months ended June 30, 2021 are detailed below.
| | | | |
| Purchases | | | | |
U.S. Government | | $ | 0 | |
Other | | | 21,504,301 | |
| | |
|
|
|
| | | $ | 21,504,301 | |
| | |
|
|
|
| | | | |
| Sales | | | | |
U.S. Government | | $ | 0 | |
Other | | | 54,921,919 | |
| | |
|
|
|
| | | $ | 54,921,919 | |
| | |
|
|
|
The Fund has a line of credit with maximum borrowing for the lesser of 33.33% of the fair value of unencumbered net assets of the Fund or $15,000,000, which expires on August 7, 2021. This unsecured line of credit is intended to provide short-term financing, if necessary, in connection with shareholder redemptions, and subject to certain restrictions. Interest was accrued at the prime rate of 3.25% from January 1, 2021 through June 30, 2021. The credit facility is with the Fund’s custodian, U.S. Bank. The Fund did not borrow on the line of credit during the six months ended June 30, 2021.
| (10) | | Recent Market Events |
U.S. and international markets have experienced significant periods of volatility in recent years due to a number of economic, political and global macro factors including the impact of the novel coronavirus (COVID-19) as a global pandemic, which has resulted in related public health issues, growth concerns in the U.S. and overseas, temporary and permanent layoffs in the private sector and rising unemployment claims and reduced consumer spending. The recovery from the lasting effects of COVID-19 is uncertain and may last for an extended period of time. These developments as well as other events could result in further market volatility and negatively affect financial asset prices, the liquidity of certain securities and the normal operations of securities exchanges and other markets. As a result, the risk environment remains elevated. The Adviser will monitor developments and seek to manage the Fund in a manner consistent with achieving the Fund’s investment objective, but there can be no assurance that it will be successful in doing so.
32
MARKETFIELD FUND
Notes to Financial Statements, continued
June 30, 2021
(Unaudited)
On June 30, 2021, Foreside Financial Group, LLC (“Foreside”), the parent company of Quasar, the Fund’s distributor, and Lovell Minnick Partners, LLC (“LMP”) announced they had entered into a definitive purchase and sale agreement with Genstar Capital (“Genstar”), a private equity firm specializing in financial and related business services companies. Genstar will acquire a majority stake in Foreside, and LMP will exit its investment in Foreside. The transaction is anticipated to close, subject to any necessary governmental and regulatory approvals, in the third quarter of 2021. Quasar will remain the Fund’s distributor at the close of the transaction, subject to Board approval received on August 4, 2021.
33
MARKETFIELD FUND
NOTICE OF PRIVACY POLICY & PRACTICES
We collect non-public personal information about you from the following sources:
| | • | | information we receive about you on applications or other forms; |
| | • | | information you give us orally; and |
| | • | | information about your transactions with us or others. |
We do not disclose any non-public personal information about our shareholders or former shareholders without the shareholder’s authorization, except as permitted by law or in response to inquiries from governmental authorities. We may share information with affiliated parties and unaffiliated third parties with whom we have contracts for servicing the Fund. We will provide unaffiliated third parties with only the information necessary to carry out their assigned responsibility. All shareholder records will be disposed of in accordance with applicable law. We maintain physical, electronic and procedural safeguards to protect your non-public personal information and require third parties to treat your non-public personal information with the same high degree of confidentiality.
In the event that you hold shares of the Fund through a financial intermediary, including, but not limited to, a broker-dealer, bank or trust company, the privacy policy of your financial intermediary would govern how your non-public personal information would be shared with unaffiliated third parties.
34
MARKETFIELD FUND
Statement Regarding Liquidity Risk Management Program
(Unaudited)
In accordance with Rule 22e-4 under the Investment Company Act of 1940, as amended, Trust for Professional Managers (the “Trust”) has adopted and implemented a liquidity risk management program (the “Trust Program”). As required under the Trust Program, Marketfield Asset Management LLC (“Marketfield”), the investment adviser to the Marketfield Fund (the “Fund”), a series of the Trust, has adopted and implemented a liquidity risk management program tailored specifically to the Fund (the “Adviser Program”). The Adviser Program seeks to promote effective liquidity risk management for the Fund and to protect Fund shareholders from dilution of their interests. The Board of Trustees (the “Board”) of the Trust has approved Marketfield as the administrator for the Adviser Program (the “Program Administrator”). The Program Administrator has further delegated administration of the Adviser Program to its LRMP Committee consisting of Portfolio Managers, Senior Traders, the Operations Manager, and the Adviser’s Chief Compliance Officer. The Program Administrator is required to provide a written annual report to the Board and the Trust’s chief compliance officer regarding the adequacy and effectiveness of the Adviser Program, including the operation of the Fund’s highly liquid investment minimum, if applicable, and any material changes to the Adviser Program.
On April 15, 2021, the Board reviewed the Program Administrator’s written annual report for the period July 1, 2020 through December 31, 2020 (the “Report”). The Report provided an assessment of the Fund’s liquidity risk: the risk that the Fund could not meet requests to redeem shares issued by the Fund without significant dilution of the remaining investors’ interests in the Fund. The Adviser Program assesses liquidity risk under both normal and reasonably foreseeable stressed market conditions. The Program Administrator has retained ICE Data Services, Inc., a third party vendor, to provide portfolio investment classification services, and the Report noted that the Fund primarily held investments that were classified as highly liquid during the review period. The Report noted that the Fund’s portfolio is expected to continue to primarily hold highly liquid investments and the determination that the Fund be designated as a “primarily highly liquid fund” (as defined in Rule 22e-4) remains appropriate. The Fund can therefore continue to rely on the exclusion in Rule 22e-4 from the requirements to determine and review a highly liquid investment minimum for the Fund and to adopt policies and procedures for responding to a highly liquid investment minimum shortfall. The Report noted that there were no breaches of the Fund’s restriction on holding illiquid investments exceeding 15% of its net assets during the review period. The Report confirmed that the Fund’s investment strategy was appropriate for an open-end management investment company. The Report also indicated that no material changes had been made to the Adviser Program during the review period.
The Program Administrator determined that the Fund is reasonably likely to be able to meet redemption requests without adversely affecting non-redeeming Fund shareholders through significant dilution. The Program Administrator concluded that the Adviser Program was adequately designed and effectively implemented during the review period.
35
MARKETFIELD FUND
Additional Information
(Unaudited)
Indemnifications
Under the Trust’s organizational documents, its officers and Trustees are indemnified against certain liabilities arising out of the performance of their duties to the Fund. In addition, in the normal course of business, the Fund enters into contracts that provide general indemnifications to other parties. The Fund’s maximum exposure under these arrangements is unknown as this would involve future claims that may be made against the Fund that have not yet occurred. However, the Fund has not had prior claims or losses pursuant to these contracts and expects the risk of loss to be remote.
Information about Trustees
The business and affairs of the Trust are managed under the direction of the Board of Trustees. Information pertaining to the Trustees of the Trust is set forth below. The Statement of Additional Information includes additional information about the Trustees and is available, without charge, upon request by calling 1-800-311-6583.
Independent Trustees
| | | | | | | | | | |
Name,
Address and Year of Birth
| | Position(s)
Held with
the Trust
| | Term of
Office and
Length of
Time Served
| | Number of
Portfolios
in Trust
Overseen
by Trustee
| | Principal Occupation(s)
During the Past Five Years
| | Other
Directorships Held by
Trustee During the Past
Five Years
|
Michael D. Akers, Ph.D. 615 E. Michigan St. Milwaukee, WI 53202 Year of Birth: 1955 | | Trustee | | Indefinite Term; Since August 22, 2001 | | 24 | | Professor Emeritus, Department of Accounting (June 2019–Present), Professor, Department of Accounting (2004–May 2019), Chair, Department of Accounting (2004–2017), Marquette University. | | Independent Trustee, USA MUTUALS (an open-end investment company (2001-2021)). |
| | | | | |
Gary A. Drska 615 E. Michigan St. Milwaukee, WI 53202 Year of Birth: 1956 | | Trustee | | Indefinite Term; Since August 22, 2001 | | 24 | | Pilot, Frontier/Midwest Airlines, Inc. (airline company) (1986–present). | | Independent Trustee, USA MUTUALS (an open-end investment company (2001-2021)). |
Interested Trustee and Officers
| | | | | | | | | | |
Name,
Address and Year of Birth
| | Position(s)
Held with
the Trust
| | Term of
Office and
Length of
Time Served
| | Number of
Portfolios
in Trust
Overseen
by Trustee
| | Principal Occupation(s)
During the Past Five Years
| | Other
Directorships Held by
Trustee During the Past
Five Years
|
Joseph C. Neuberger* 615 E. Michigan St. Milwaukee, WI 53202 Year of Birth: 1962 | | Chairperson and Trustee | | Indefinite Term; Since August 22, 2001 | | 24 | | President (2017–present), Chief Operating Officer (2016–2020), Executive Vice President (1994–2017), U.S. Bancorp Fund Services, LLC. | | Trustee, Buffalo Funds (an open-end investment company) (2003–2017); Trustee, USA MUTUALS (an open-end investment company) (2001–2018). |
| | | | | |
John P. Buckel 615 E. Michigan St. Milwaukee, WI 53202 Year of Birth: 1957 | | President and Principal Executive Officer | | Indefinite Term; Since January 24, 2013 | | N/A | | Vice President, U.S. Bancorp Fund Services, LLC (2004–present). | | N/A |
36
MARKETFIELD FUND
Additional Information (continued)
(Unaudited)
| | | | | | | | | | |
Name,
Address and Year of Birth
| | Position(s)
Held with
the Trust
| | Term of
Office and
Length of
Time Served
| | Number of
Portfolios
in Trust
Overseen
by Trustee
| | Principal Occupation(s)
During the Past Five Years
| | Other
Directorships Held by
Trustee During the Past
Five Years
|
| | | | | |
Jennifer A. Lima 615 E. Michigan St. Milwaukee, WI 53202 Year of Birth: 1974 | | Vice President, Treasurer and Principal Financial and Accounting Officer | | Indefinite Term; Since January 24, 2013 | | N/A | | Vice President, U.S. Bancorp Fund Services, LLC (2002–present). | | N/A |
| | | | | |
Elizabeth B. Scalf 615 E. Michigan St. Milwaukee, WI 53202 Year of Birth: 1985 | | Chief Compliance Officer, Vice President and Anti-Money Laundering Officer | | Indefinite Term; Since July 1, 2017 | | N/A | | Senior Vice President, U.S. Bancorp Fund Services, LLC (February 2017–present); Vice President and Assistant CCO, Heartland Advisors, Inc. (December 2016–January 2017); Vice President and CCO, Heartland Group, Inc. (May 2016–November 2016); Vice President, CCO and Senior Legal Counsel (May 2016–November 2016), Heartland Advisors, Inc. | | N/A |
| | | | | |
Jay S. Fitton 615 E. Michigan St. Milwaukee, WI 53202 Year of Birth: 1970 | | Secretary | | Indefinite Term; Since July 22, 2019 | | N/A | | Assistant Vice President, U.S. Bancorp Fund Services, LLC (2019–present); Partner, Practus, LLP (2018–2019); Counsel, Drinker Biddle & Reath (2016–2018). | | N/A |
| | | | | |
Kelly A. Burns 615 E. Michigan St. Milwaukee, WI 53202 Year of Birth: 1987 | | Assistant Treasurer | | Indefinite Term; Since April 23, 2015 | | N/A | | Assistant Vice President, U.S. Bancorp Fund Services, LLC (2011–present). | | N/A |
| | | | | |
Melissa Aguinaga 615 E. Michigan St. Milwaukee, WI 53202 Year of Birth: 1987 | | Assistant Treasurer | | Indefinite Term; Since July 1, 2015 | | N/A | | Assistant Vice President, U.S. Bancorp Fund Services, LLC (2010–present). | | N/A |
| | | | | |
Laura A. Carroll 615 E. Michigan St. Milwaukee, WI 53202 Year of Birth: 1985 | | Assistant Treasurer | | Indefinite Term; Since August 20, 2018 | | N/A | | Assistant Vice President, U.S. Bancorp Fund Services, LLC (2007–present). | | N/A |
| * | | Mr. Neuberger is deemed to be an “interested person” of the Trust as defined by the 1940 Act due to his position and material business relationship with the Trust. |
37
A NOTE ON FORWARD LOOKING STATEMENTS (Unaudited)
Except for historical information contained in this report for the Fund, the matters discussed in this report may constitute forward-looking statements made pursuant to the safe-harbor provisions of the Private Securities Litigation Reform Act of 1995. These include any Adviser or portfolio manager predictions, assessments, analyses or outlooks for individual securities, industries, market sectors and/or markets. These statements involve risks and uncertainties. In addition to the general risks described for the Fund in the current Prospectus, other factors bearing on this report include the accuracy of the Adviser’s or portfolio manager’s forecasts and predictions, and the appropriateness of the investment programs designed by the Adviser or portfolio manager to implement their strategies efficiently and effectively. Any one or more of these factors, as well as other risks affecting the securities markets and investment instruments generally, could cause the actual results of the Fund to differ materially as compared to benchmarks associated with the Fund.
ADDITIONAL INFORMATION (Unaudited)
The Fund has adopted proxy voting policies and procedures that delegate to the Adviser the authority to vote proxies. A description of the Fund’s proxy voting policies and procedures is available without charge, upon request, by calling the Fund toll free at 1-800-311-6583. A description of these policies and procedures is also included in the Fund’s Statement of Additional Information, which is available on the SEC’s website at http://www.sec.gov.
The Fund’s proxy voting record for the most recent 12-month period ended June 30 is available without charge, upon request, by calling toll free, 1-800-311-6583, or by accessing the SEC’s website at http://www.sec.gov.
The Fund files its complete schedule of portfolio holdings with the SEC for the first and third quarters of each fiscal year on Part F of Form N-PORT. Shareholders may view the Fund’s filings on the SEC’s website at http://www.sec.gov.
HOUSEHOLDING (Unaudited)
In an effort to decrease costs, the Fund intends to reduce the number of duplicate prospectuses, supplements and certain other shareholder documents you receive by sending only one copy of each to those addresses shared by two or more accounts and to shareholders the Fund reasonably believes are from the same family or household. Once implemented, if you would like to discontinue householding for your accounts, please call the Fund toll-free at 1-800-311-6583 to request individual copies of these documents. Once the Fund receives notice to stop householding, the Fund will begin sending individual copies 30 days after receiving your request. This policy does not apply to account statements.
MARKETFIELD FUND
| | |
Investment Adviser | | Marketfield Asset Management LLC 369 Lexington Avenue
3rd Floor New York, New York 10017 |
| |
Legal Counsel | | Godfrey & Kahn, S.C. 833 East Michigan Street, Suite 1800 Milwaukee, Wisconsin 53202 |
| |
Independent Registered Public
Accounting Firm | | Deloitte & Touche LLP 111 South Wacker Drive Chicago, Illinois 60606 |
| |
Transfer Agent, Fund Accountant
and Fund Administrator | | U.S. Bancorp Fund Services, LLC 615 East Michigan Street Milwaukee, Wisconsin 53202 |
| |
Custodian | | U.S. Bank National Association Custody Operations 1555 North River Center Drive Suite 302 Milwaukee, Wisconsin 53212 |
| |
Distributor | | Quasar Distributors, LLC 111 East Kilborn Avenue Suite 2200 Milwaukee, Wisconsin 53202 |
This report is intended for shareholders of the Fund and may not be used as sales literature unless preceded or accompanied by a current prospectus.
MJ SEMI-ANNUAL
EX.99.IND.PUB.ACCT
Item 2. Code of Ethics.
Not applicable for semi-annual reports.
Item 3. Audit Committee Financial Expert.
Not applicable for semi-annual reports.
Item 4. Principal Accountant Fees and Services.
Not applicable for semi-annual reports.
Item 5. Audit Committee of Listed Registrants.
Not applicable to registrants who are not listed issuers (as defined in Rule 10A-3 under the Securities Exchange Act of 1934).
Item 6. Investments.
| (a) | Schedule of Investments is included as part of the report to shareholders filed under Item 1 of this Form. |
Item 7. Disclosure of Proxy Voting Policies and Procedures for Closed-End Management Investment Companies.
Not applicable to open-end investment companies.
Item 8. Portfolio Managers of Closed-End Management Investment Companies.
Not applicable to open-end investment companies.
Item 9. Purchases of Equity Securities by Closed-End Management Investment Company and Affiliated Purchasers.
Not applicable to open-end investment companies.
Item 10. Submission of Matters to a Vote of Security Holders.
There have been no material changes to the procedures by which shareholders may recommend nominees to the registrant’s board of trustees.
EX.99.IND.PUB.ACCT
Item 11. Controls and Procedures.
| (a) | The Registrant’s President and Treasurer have reviewed the Registrant’s disclosure controls and procedures (as defined in Rule 30a-3(c) under the Investment Company Act of 1940 (the “Act”)) as of a date within 90 days of the filing of this report, as required by Rule 30a-3(b) under the Act and Rules 13a-15(b) or 15d-15(b) under the Securities Exchange Act of 1934. Based on their review, such officers have concluded that the disclosure controls and procedures are effective in ensuring that information required to be disclosed in this report is appropriately recorded, processed, summarized and reported and made known to them by others within the Registrant and by the Registrant’s service provider. |
| (b) | There were no changes in the Registrant’s internal control over financial reporting (as defined in Rule 30a-3(d) under the Act) that occurred during the last fiscal half-year covered by this report that has materially affected, or is reasonably likely to materially affect, the Registrant’s internal control over financial reporting. |
Item 12. Disclosure of Securities Lending Activities for Closed-End Management Investment Companies
Not applicable to open-end investment companies.
Item 13. Exhibits.
(2) A separate certification for each principal executive and principal financial officer pursuant to Section 302 of the Sarbanes-Oxley Act of 2002. Filed herewith.
(3) Any written solicitation to purchase securities under Rule 23c-1 under the Act sent or given during the period covered by the report by or on behalf of the registrant to 10 or more persons. Not applicable to open-end investment companies.
(4) Change in the registrant’s independent public accountant. There was no change in the registrant’s independent public accountant for the period covered by this report.
EX.99.IND.PUB.ACCT
SIGNATURES
Pursuant to the requirements of the Securities Exchange Act of 1934 and the Investment Company Act of 1940, the registrant has duly caused this report to be signed on its behalf by the undersigned, thereunto duly authorized.
|
(Registrant) Trust for Professional Managers |
|
By (Signature and Title)* /s/ John Buckel |
John Buckel, President |
|
Date 8/30/2021 |
Pursuant to the requirements of the Securities Exchange Act of 1934 and the Investment Company Act of 1940, this report has been signed below by the following persons on behalf of the registrant and in the capacities and on the dates indicated.
|
By (Signature and Title)* /s/ John Buckel |
John Buckel, President |
|
Date 8/30/2021 |
|
| By (Signature and Title)* /s/ Jennifer Lima |
| Jennifer Lima, Treasurer |
|
Date 8/30/21 |
| * | Print the name and title of each signing officer under his or her signature. |