UNITED STATES
SECURITIES AND EXCHANGE COMMISSION
Washington, D.C. 20549
FORM N-CSR
CERTIFIED SHAREHOLDER REPORT OF REGISTERED
MANAGEMENT INVESTMENT COMPANIES
Investment Company Act file number 811-10401
Trust for Professional Managers
(Exact name of registrant as specified in charter)
615 East Michigan Street
Milwaukee, WI 53202
(Address of principal executive offices) (Zip code)
Jay S. Fitton
U.S. Bancorp Fund Services, LLC
615 East Michigan Street
Milwaukee, WI 53202
(Name and address of agent for service)
(513) 629-8104
Registrant’s telephone number, including area code
Date of fiscal year end: February 28, 2022
Date of reporting period: August 31, 2021
Item 1. Reports to Stockholders.
Semi-Annual Report

August 31, 2021
Snow Capital Small Cap Value Fund
Class A Shares (SNWAX)
Class C Shares (SNWCX)
Institutional Class Shares (SNWIX)
Snow Capital Long/Short Opportunity Fund
Class A Shares (SNOAX)
Class C Shares (SNOCX)
Institutional Class Shares (SNOIX)
Investment Adviser
Easterly Investment Partners LLC
138 Conant Street
Beverly, Massachusetts 01915
Phone: 1-877-SNOWFND (877-766-9363)
TABLE OF CONTENTS
Dear Fellow Shareholder:
Over the past six months ended August 31, 2021, equity returns spiked as vaccines and additional government stimulus gave investors hope of a return to normalization of economic activity and spending patterns. The continued strength of the recovery coupled with strong corporate earnings fueled appreciation in the broad markets with most major indices posting solid gains. Earlier in the period market leadership was largely driven by value stocks. More recently, growth has been outperforming.
Economic data released during the period was strong with consumer spending increasing and unemployment trending lower. The manufacturing and services segments of the economy are reporting positive data. The counterbalance to much of the good news is concerns over inflation. On account of disrupted supply chains, labor shortages, government spending and pent-up consumer demand, inflation metrics have been spiking. Clearly, inflation is in focus due to the effect it may have on the direction of interest rates. The Federal Reserve (Fed) continues to stand by its current policy stance of unchanged interest rates even as data shows prices increasing. In our view, acute increases in prices will ultimately lead the Fed to raise policy rates. We also expect the Fed and other central banks to signal their intentions to taper quantitative easing in the months ahead as job creation continues to improve. Amidst this backdrop, we propose that value stocks appear poised for relative strength, especially if volatility levels increase and interest rates rise.
The companies we own have strong balance sheets, proven management teams, and recurring cash flow streams. We expect these companies to be able to compound earnings over full market cycles. All told, we remain dedicated to delivering strong long-term performance and transparent communications to our shareholders. We believe these companies will be able to compound earnings over an extended period through both rising and declining markets. Thank you for your commitment and loyalty.
Snow Capital Small Cap Value Fund
How did the Fund perform?
For the six-month period ended August 31, 2021, the Snow Capital Small Cap Value Fund’s Institutional Class Shares recorded a return of 8.03% compared to a return of 8.93% for the Russell 2000® Value Total Return Index.
3
How is the Fund managed?
We employ a contrarian value process rooted in fundamental investing to build a portfolio of investments. The Snow Capital Small Cap Value Fund typically maintains a portfolio of between 40 and 60 U.S.-listed equities. We weight position sizes based on our assessment of upside potential and near-term catalysts. The Fund draws at least 80% of its investments, at cost, from companies with market capitalizations in the range of the Russell 2000 Value® Index which, as of August 31, 2021, was between $139 million and $24.2 billion.
Top Positive Contributors to the Fund’s Return
For the six-month period ended August 31, 2021, the Financials, Information Technology, Materials, Industrials, Consumer Staples, and Health Care sectors added to overall performance. In order of magnitude, the best performing stocks for the six months were:
WESCO International (WCC) based in Pittsburgh, PA, benefitted from both strong macro and company specific results. Levered to the distribution of electrical products and other industrial maintenance operating supplies, WCC showcased strong results driven by a boom in contractor and manufacturer activity. Positive execution on integration results following the acquisition of Anixter in June, 2020, re-set investor expectations for growth and set a path to higher sales, earnings, and free cash flow for the company. Commercial Metals Company (CMC), a producer of steel and other metal products based in Irving, Texas, outperformed driven by strong residential housing demand throughout their core southern U.S. markets and high production volumes in both North America and Europe. The company has a strong balance sheet and favorable demographic trends throughout their primary geographic markets, which should be a tailwind moving forward. The passing of any infrastructure package would also be meaningful to CMC. Domtar Corporation (UFS) was acquired by Paper Excellence Canada Holdings in May, 2021 for $3.0B, a 45% premium at the time of announcement. The Fund subsequently exited the position while the deal is expected to close in late 2021. Silicon Motion Technology Corporation (SIMO), a NAND controller vendor based in Zhubei City, Taiwan, outperformed as they were able to leverage global capacity shortages in the semiconductor supply chains into pricing power for their products, driving profitability higher. The company boasts a balance sheet with
4
no debt, $10 per share in cash, and has a return on invested capital of over 20%. Pilgrim’s Pride Corporation (PPC) added to performance following a proposal by majority shareholder JBS Foods to purchase the remaining 20% of the company at more than a 20% premium. The Fund exited the position following the proposal and positive stock reaction.
Top Detractors from the Fund’s Return
For the six-month period ended August 31, 2021, the Consumer Discretionary, Communication Services, and Energy sectors detracted from overall performance.
Delek US Holdings (DK), a petroleum refiner based in Brentwood, TN, detracted as fundamental conditions for refiners were difficult during the summer of 2021, including soft crack spreads and elevated RINs prices. Higher oil prices could lead to increased Permian crude production, which would favor inland refiners such as DK, while consolidation for smaller companies in this space seems likely over the long run. Cinemark Holdings (CNK) pulled back following a summer increase in COVID-19 Delta variant cases, which negatively impacted near-term expectations for consumer-oriented companies such as CNK. The company remains trending in the right direction, with all North American theaters operating at a positive EBITDA level during the most recent quarter. With higher quality content returning to the theaters in the upcoming quarters, we believe CNK will post improving results in 2022. Cooper-Standard Holdings (CPS) detracted as the company was heavily impacted by the global semiconductor shortage and related sporadic shutdowns by customers, including Ford Motor Company. We expect free-cash-flow to turn positive in late 2021 as volumes recover. JetBlue Airways (JBLU) negatively impacted performance as investors extrapolated the potential impacts on domestic travel that the COVID-19 Delta variant might have. The company remains well positioned with both macro and company specific catalysts, including the airline’s highly competitive transatlantic route to London finally embarking in August, 2021. NN Incorporated (NNBR), based in Charlotte, NC, pulled back as several auto customers idled facilities due to semiconductor shortages. The diversified industrial company with exposure to electrical, automotive, medical, and aerospace end markets has done well to improve working capital and set themselves up for margin expansion once demand stabilizes.
5
Were there significant changes to the portfolio?
Compared to the Russell 2000® Value Index, the Fund holds an above-average weight in the Information Technology, Consumer Discretionary, Financials, Communication Services, and Materials sectors, and a below-average weight in the Health Care, Industrials, and Energy sectors. The Fund maintained a zero percent weighting in the Real Estate, Consumer Staples, and Utilities sectors as of August 31, 2021.
We reduced our exposure to the Materials, Consumer Staples, Energy, Financials, and Health Care sectors and increased our investments in the Information Technology, Consumer Discretionary, Industrials, and Communication Services sectors during the period.
Comments on the Fund’s Five Largest Holdings
Acco Brands Corporation (ACCO)
One of the world’s largest designers, marketers, and manufacturers of branded academic, consumer, and business products, Acco Brands Corporation (ACCO) owns several recognizable brands such as Mead, Five-Star, and Rexel. Results have been ahead of expectations as schools and offices reopen, while a recent expansion into the video game space via a 2020 acquisition of PowerA provides a nice growth channel.
Cinemark Holdings (CNK)
Cinemark Holdings (CNK) is one of the most geographically diverse operators in the motion picture industry, boasting nearly 6,000 screens across more than 500 theatres throughout the U.S. and Latin America. Expectations for the company are highlighted by historically low valuation metrics while fundamentals remain intact, including a balance sheet that carries more than 25% of the company’s market capitalization in cash, providing downside protection.
CNO Financial Group (CNO)
CNO Financial Group (CNO) provides life insurance, annuity, and supplemental health insurance products to more than four million customers in
6
the United States primarily serving middle-income pre-retirees and retired Americans, which are underserved high growth markets. The company took recent actions to de-risk the investment portfolio, which should enable the management team flexibility looking for yield opportunities in the current environment.
Alliance Data Systems Corporation (ADS)
Based in Columbus, OH, Alliance Data Systems Corporation (ADS) provides data-driven marketing, loyalty, and payment solutions serving consumer-based businesses in a range of industries, primarily offering private label and co-branded retail credit card programs. Clients include major retailers such as IKEA, Victoria’s Secret, and Signet, as well as banks and other brands in large, consumer-based industries. The company also owns a Buy Now Pay Later company, Bread, which, while currently a small percent of the business is growing rapidly.
BankUnited Inc. (BKU)
BankUnited (BKU) is a bank holding company that provides a range of financial products and services including personal, commercial, and business banking. Over the years, BankUnited has built out a national or non-geographically focused platform and scaled up its banking operation through several acquisitions. The company is focused on reducing costs and improving efficiencies, increasing its low-cost deposit base, and growing the loan portfolio.
Snow Capital Long/Short Opportunity Fund
How did the Fund perform?
For the six-month period ended August 31, 2021, the Snow Capital Long/Short Opportunity Fund’s Institutional Class Shares recorded a return of 9.29% compared to a return of 9.76% for the blended index of 70% Russell 3000® Value Total Return Index and 30% ICE BofAML 3-Month T-Bill Index and a return of 14.13% for the Russell 3000 Value Total Return Index.
7
How is the Fund managed?
The Long/Short Opportunity Fund is an all-cap, contrarian value, liquid alternatives fund that uses a variety of hedging strategies to reduce the overall volatility of the Fund’s investment portfolio.
The Fund employs a fundamental value philosophy and a disciplined bottom-up investment process to select long equity positions. Thorough reviews are conducted on each company to ensure they are in line with our investment thesis and potential return target. The portfolio consists of our highest conviction companies as core holdings, along with short equity positions, long and short options, exchange-traded funds, and closed-end funds as hedging vehicles. The Fund is managed with a conviction-weighted long portfolio and an opportunistic, research-driven process for our short positioning with the goal of smoothing volatility of investment returns for our shareholders.
Top Positive Contributors to the Fund’s Return
For the six-month period ended August 31, 2021, the Financials, Industrials, Health Care, Information Technology, Consumer Discretionary, Materials, Energy, Consumer Staples, Communication Services, and Utilities sectors added to overall performance. In order of magnitude, the best performing stocks for the six months were:
WESCO International (WCC) based in Pittsburgh, PA, benefitted from both strong macro and company specific results. Levered to the distribution of electrical products and other industrial maintenance operating supplies, WCC showcased strong results driven by a boom in contractor and manufacturer activity. Positive execution on integration results following the acquisition of Anixter in June, 2020, re-set investor expectations for growth and set a path to higher sales, earnings, and free cash flow for the company. Hartford Financial Services Group (HIG) outperformed on takeover interest from Chubb Limited (CB). The company’s board of directors rejected the overture, implying further upside to current valuation levels. Company specific results have also been positive, with HIG showcasing improving combined ratios, lower expenses, and good investment performance throughout the period. NetApp, Inc (NTAP),
8
a storage and data management solution company based in Sunnyvale, CA, added to performance through solid execution including expanding margins, share gains, and prudent capital management, all of which have re-rated the multiple higher. The company is on track to generate more than $1.2B in free-cash-flow for the fiscal year, an impressive figure. Wells Fargo & Company (WFC) outperformed as the prospect for revenue growth improved over the period. Higher equity markets raised investor sentiment for the company’s wealth management and corporate banking segments, while the potential for loan growth, asset cap relief, expense saves, and a dividend boost suggest upside relative to peers with higher valuations. Pfizer Inc (PFE) added to performance driven not just by COVID-19 vaccine contribution, but solid execution within their core legacy business lines. Operational revenue growth remains strong even with pricing receding, implying strong momentum.
Top Detractors from the Fund’s Return
For the six-month period ended August 31, 2021, no one sector detracted from overall performance.
JetBlue Airways (JBLU) negatively impacted performance as investors extrapolated the potential impacts on domestic travel that the COVID-19 Delta variant might have. The company remains well positioned with both macro and company specific catalysts, including the airline’s highly competitive transatlantic route to London finally embarking in August, 2021. Las Vegas Sands Corp (LVS) detracted as expectations for the company’s Macau and Singapore operations pulled back with the emergence of the COVID-19 Delta variant. The Fund exited the position as the trajectory of the recovery in these markets deviated from initial projections. Vishay Intertechnology (VSH), a manufacturer of passive and discreet electronic components based in Malvern, PA, pulled back with investors concerned over the state of global supply chains and extended lead times. Shares of Tapestry Inc (TPR), a designer and marketer of clothing and accessories, paused after a great run with the stock tripling since Q3, 2020. Management remains bullish on the remainder of calendar year 2021 where they expect higher profitability while the street is concerned about the impact rising shipping costs may have. Suncor Energy (SU), an integrated energy company based in Calgary, Alberta, Canada, pulled back while hindered by operational disruptions that are not uncommon in oil
9
sands mining. We don’t see these delays altering the long term economics of the company and their projects, and have maintained a position in the company.
Were there significant changes to the portfolio?
Compared to the Russell 3000 Value Total Return Index, the Fund holds an above-average weight in the Consumer Discretionary, Energy, Financials, and Materials sectors, and a below-average weight in the Communication Services, Consumer Staples, Health Care, Utilities, Industrials, and Information Technology sectors. The Fund maintained a zero percent weighting in the Real Estate sector as of August 31, 2021.
We reduced our exposure to the Communication Services, Materials, Energy, and Financials sectors, and increased our investments in the Information Technology, Health Care, Industrials, Utilities, Consumer Discretionary, and Consumer Staples sectors during the period. As of the end of August, the portfolio held 51 core long positions and was approximately 74% net long.
The purchase and/or sale of short positions, options, exchange-traded funds, or other securities aim to serve as a hedge to our long equity portfolio. We are holding cash as a component of our strategies and to take advantage of any opportunities the market volatility may provide.
Comments on the Fund’s Five Largest Holdings
Wells Fargo & Company (WFC)
Wells Fargo & Company (WFC) is a diversified, community-based financial services company. Buoyed by an improving economy, the prospect of loan growth, asset cap relief, expense saves, and a dividend boost provides potential upside. WFC remains mispriced versus peers, the residual reputational discount left by the prior management team.
Truist Financial Corporation (TFC)
Regional powerhouse Truist Financial Corporation (TFC), based in Charlotte, NC, is a financial services company offering a wide range of business lines
10
including retail, small business and commercial banking, asset management, insurance, mortgage, and wealth management, among others. The result of a merger between BB&T and SunTrust, TFC is levered to some of the highest growth markets in the country and offers a best-of-breed management team.
WESCO International (WCC)
WESCO International (WCC) distributes electrical parts and other industrial maintenance, repair, and operating supplies through the world. The company also provides integrated supply services. The acquisition of Anixter in June, 2020, gives WCC material market share in a highly fragmented industry which should enable them to continue to drive outperformance.
Cardinal Health, Inc (CAH)
Cardinal Health (CAH) provides complementary products and services to healthcare providers and manufacturers. The company’s wide range of services include pharmaceutical distribution, health-care product manufacturing, distribution and consulting services, drug delivery systems development, pharmaceutical packings, automated dispensing systems manufacturing, and retail pharmacy franchising. A large cost savings plan recently initiated by management coupled with end-market growth channels provides strong upside for a company that is backboned by a significant amount of free-cash-flow generation.
The Hartford Financial Services Group (HIG)
One of the oldest life insurance companies in the U.S., The Hartford Financial Services Group (HIG) has benefitted from an improving economy and prudent capital management, including actively repurchasing their own shares. Recent takeover interest from Chubb Limited (CB) that was rebuffed by management has rebased the valuation higher, while management continues to target an ROE above the cost of capital through premium growth, capital allocation, and expense reduction.
Past performance is not a guarantee of future results.
The views expressed herein are solely the opinions of Easterly Investment Partners LLC. We make no representations as to their accuracy. This
11
communication is intended for informational purposes only and does not constitute a solicitation to invest money nor a recommendation to buy or sell certain securities. Equity investments are not appropriate for all investors. Individual investment decisions should be discussed with a financial advisor.
Mutual fund investing involves risk. Principal loss is possible. Investments in small- and medium-capitalization companies involve additional risks such as limited liquidity and greater volatility. Investments in foreign securities involve political, economic, and currency risks, greater volatility and differences in accounting methods. The Snow Capital Long/Short Opportunity Fund may invest in debt securities. Investments in debt securities typically decrease in value when interest rates rise. This risk is usually greater for longer-term debt securities. The Snow Capital Long/Short Opportunity Fund may use options or futures contracts which have the risks of unlimited losses and the underlying holdings due to unanticipated market movements and failure to correctly predict the direction of the securities prices, interest rates, and currency exchange rates. Investments in ETFs are subject to additional risks that do not apply to conventional mutual funds, including the risks that the market price of the shares may trade at a discount to their net asset value (“NAV”), an active secondary trading market may not develop or be maintained, or trading may be halted by the exchange in which they trade, which may impact a Fund’s ability to sell its shares. This investment may not be suitable for all investors.
Earnings growth is not representative of the Fund’s future performance.
Fund holdings and sector allocations are subject to change at any time and should not be considered recommendations to buy or sell any security. Please refer to the Schedules of Investments in this report for a complete list of fund holdings.
The Russell 2000® Value Total Return Index measures the performance of small-cap value segment of the U.S. equity universe. It includes those Russell 2000 companies with lower price-to-book ratios and lower forecasted growth values.
12
The Russell 3000® Value Total Return Index measures the performance of the broad value segment of the U.S. equity value universe. It includes those Russell 3000 companies with lower price-to-book ratios and lower forecasted growth values.
The blended index of 70% Russell 3000 Value Total Return and 30% ICE BofAML 3-Month T-Bill Index is a weighted blend of the Russell 3000 Value, defined above, and the ICE BofAML 3-Month T-Bill Index, which is an unmanaged index that measures returns of three-month Treasury Bills.
Free cash flow (FCF) is the cash a company generates after taking into consideration cash outflows that support its operations and maintain its capital assets, or the cash left over after a company pays for its operating expenses and capital expenditures.
Return on invested capital (ROIC) is the amount of money a company makes that is above the average cost it pays for its debt and equity capital. The calculation is used to assess a company’s efficiency at allocating the capital under its control to profitable investments.
EBITDA, or earnings before interest, taxes, depreciation, and amortization, is a measure of a company’s overall financial performance.
Market Capitalization is the market price of an entire company, calculated by multiplying the number of shares outstanding by the price per share.
The Snow Capital Family of Funds are distributed by Quasar Distributors, LLC.
13
Snow Capital Family of Funds
Expense Example (Unaudited)
As a shareholder of the Funds, you incur two types of costs: (1) transaction costs, including sales charges (loads) on purchase payments (Class A shares only) and redemption fees, and (2) ongoing costs, including management fees, distribution (12b-1) and service fees (Class A and Class C shares only) and other Fund expenses. This Example is intended to help you understand your ongoing costs (in dollars) of investing in the Funds, and to compare these costs with the ongoing costs of investing in other mutual funds. The Example is based on an investment of $1,000 invested at the beginning of the period and held for the entire period (3/1/21-8/31/21).
Actual Expenses
The following table provides information about actual account values and actual expenses. If you purchase Class A shares of the Funds you will pay an initial sales charge of 5.25% when you invest. Class A shares are also subject to a contingent deferred sales charge of 0.50% for purchases made at the $1,000,000 breakpoint and redeemed within twelve months of purchase. A 1.00% contingent deferred sales charge is imposed on Class C shares redeemed within twelve months of purchase. In addition, you will be assessed fees for outgoing wire transfers, returned checks and stop payment orders at prevailing rates charged by U.S. Bancorp Fund Services, LLC, the Funds’ transfer agent. If you request that a redemption be made by wire transfer, currently a $15.00 fee is charged by the Funds’ transfer agent. You will be charged a redemption fee equal to 0.50% of the net amount of the redemption if you redeem your shares of the Funds within 30 days of purchase. IRA accounts will be charged a $15.00 annual maintenance fee. To the extent a Fund invests in shares of exchange-traded funds or other investment companies as part of its investment strategy, you will indirectly bear your proportionate share of any fees and expenses charged by the underlying funds in which a Fund invests in addition to the expenses of the Fund. Actual expenses of the underlying funds are expected to vary among the various underlying funds. These expenses are not included in the Example. The Example includes, but is not limited to, management fees, distribution (12b-1) and service fees, fund administration and accounting, custody and transfer agent fees. You may use the information in this table, together with the amount you invested, to estimate the expenses that you paid over the period. Simply divide your account value by $1,000 (for example, an $8,600 account value divided by $1,000 = 8.6), then multiply the result by the number under the heading entitled “Expenses Paid During Period” to estimate the expenses you paid on your account during this period.
14
Fund Expense Examples (Unaudited)
| | | | | | | | | | | | | | | | |
| | | Beginning
Account
Balance
3/1/21 | | | Ending
Account
Balance
8/31/21 | | | Expenses
Paid
During
Period
3/1/21-
8/31/21 | | | Annualized
Expense
Ratio | |
Long/Short Opportunity Fund | | | | | | | | | | | | | | | | |
Class A | | $ | 1,000.00 | | | $ | 1,091.50 | | | $ | 9.12 | | | | 1.73 | % |
Class C | | | 1,000.00 | | | | 1,088.10 | | | | 12.42 | | | | 2.36 | % |
Institutional Class | | | 1,000.00 | | | | 1,092.90 | | | | 7.81 | | | | 1.48 | % |
Small Cap Value Fund | | | | | | | | | | | | | | | | |
Class A | | | 1,000.00 | | | | 1,078.80 | | | | 7.91 | | | | 1.51 | % |
Class C | | | 1,000.00 | | | | 1,074.70 | | | | 11.77 | | | | 2.25 | % |
Institutional Class | | | 1,000.00 | | | | 1,080.30 | | | | 6.61 | | | | 1.26 | % |
| * | Expenses are equal to each Fund’s annualized expense ratio by class multiplied by the average account value over the period, multiplied by the number of days in the most recent six-month period (184), then divided by the number of days in the 12-month period (365). |
Hypothetical Example for Comparison Purposes
The following table provides information about hypothetical account values and hypothetical expenses based on the Funds’ actual expense ratios and assumed rates of return of 5% per year before expenses, which are not the Funds’ actual returns. The hypothetical account values and expenses may not be used to estimate the actual ending account balance or expenses you paid for the period. You may use this information to compare the ongoing costs of investing in the Funds and other funds. To do so, compare this 5% hypothetical example with the 5% hypothetical examples that appear in the shareholder reports of other funds. Please note that the expenses shown in the table are meant to highlight your ongoing costs only and do not reflect any transactional costs, such as sales charges (loads), redemption fees or exchange fees. Therefore, the information in this table is useful in comparing ongoing costs only, and will not help you determine the relative total costs of owning different funds. In addition, if these transactional costs were included, your costs would have been higher.
15
| | | | | | | | | | | | | | | | |
| | | Beginning
Account
Balance
3/1/21 | | | Ending
Account
Balance
8/31/21 | | | Expenses
Paid
During
Period
3/1/21-
8/31/21 | | | Annualized
Expense
Ratio | |
Long/Short Opportunity Fund | | | | | | | | | | | | | | | | |
Class A | | $ | 1,000.00 | | | $
| 1,016.48
|
| | $ | 8.79 | | | | 1.73 | % |
Class C | | | 1,000.00 | | | | 1,013.31 | | | | 11.98 | | | | 2.36 | % |
Institutional Class | | | 1,000.00 | | | | 1,017.74 | | | | 7.53 | | | | 1.48 | % |
Small Cap Value Fund | | | | | | | | | | | | | | | | |
Class A | | | 1,000.00 | | | | 1,017.59 | | | | 7.68 | | | | 1.51 | % |
Class C | | | 1,000.00 | | | | 1,013.86 | | | | 11.42 | | | | 2.25 | % |
Institutional Class | | | 1,000.00 | | | | 1,018.85 | | | | 6.41 | | | | 1.26 | % |
| * | Expenses are equal to each Fund’s annualized expense ratio by class multiplied by the average account value over the period, multiplied by the number of days in the most recent six-month period (184), then divided by the number of days in the 12-month period (365). |
16
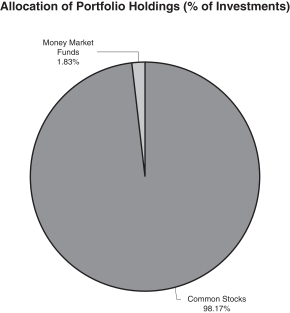
Snow Capital Small Cap Value Fund
Investment Highlights (Unaudited)
The investment objective of the Fund is long-term capital appreciation. To achieve its investment objective, under normal market conditions the Fund will invest at least 80% of its net assets, at cost, in equity securities of companies with market capitalizations in the range of the Russell 2000® Value Total Return Index (“small cap companies”). Easterly Investment Partners LLC (the “Adviser”) selects equity securities for the Fund using a bottom-up approach that seeks to identify small-cap companies that the Adviser believes are undervalued and are likely to experience a rebound in earnings due to an event or series of events that creates a price-to-earnings expansion that leads to higher stock price valuations. The Fund’s allocation of portfolio assets as of August 31, 2021 is shown below.
17
Snow Capital Long/Short Opportunity Fund
Investment Highlights (Unaudited) (Continued)
The investment objective of the Fund is long-term capital appreciation and protection of investment principal. The Fund seeks to achieve its investment objective by investing primarily in equity securities that Easterly Investment Partners LLC (the “Adviser”), the Fund’s investment adviser, believes are undervalued, selling short equity securities the Adviser believes are overvalued and selling short equity securities to hedge market risk. The Fund may also invest in options, futures contracts and options on futures contracts (collectively, “Derivative Instruments”) as a substitute for a comparable market position in the underlying equity security or to attempt to “hedge” or limit the exposure of the Fund’s position in an equity security. Long and short investments can include common and preferred stocks, convertible securities, shares of other investment companies and ETFs that invest in equity securities. With a long position, the Fund purchases a security outright, while with a short position, the Fund sells a security that it has borrowed. When the Fund sells a security short, it borrows the security from a third party and sells it at the then-current market price. The Fund is then obligated to buy the security on a later date so that it can return the security to the lender. The Fund may invest in securities of companies of any size and is not managed toward sector or industry weights. In addition to domestic securities, the Fund may have up to 25% of its net assets invested directly or indirectly in foreign securities, including investments in emerging markets. The Fund’s allocation of portfolio assets as of August 31, 2021 is shown below.
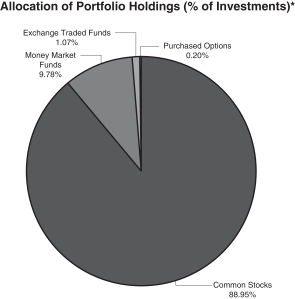
| * | Short Securities (10.08%); Options Written (0.67%), each as a percent of total net assets. |
18
Snow Capital Family of Funds
Investment Highlights (Unaudited) (Continued)
Average Annual Returns as of August 31, 2021(1)
| | | | | | | | | | | | | | | | |
| | | One
Year | | | Five
Years | | | Ten
Years | | | Since Inception
(11/30/10) | |
Snow Capital Small Cap Value Fund | | | | | | | | | | | | | | | | |
Class A (with sales charge) | | | 63.36% | | | | 9.75% | | | | 9.91% | | | | 10.01% | |
Class A (without sales charge) | | | 72.44% | | | | 10.95% | | | | 10.50% | | | | 10.57% | |
Class C (with sales charge) | | | 70.13% | | | | 10.12% | | | | 9.68% | | | | 9.75% | |
Class C (without sales charge) | | | 71.13% | | | | 10.12% | | | | 9.68% | | | | 9.75% | |
Institutional Class | | | 72.83% | | | | 11.23% | | | | 10.77% | | | | 10.84% | |
Russell 2000® Value Total Return Index | | | 59.49% | | | | 11.66% | | | | 12.14% | | | | 11.15% | |
| | | | |
| | | One
Year | | | Five
Years | | | Ten
Years | | | Since Inception
(4/28/06) | |
Snow Capital Long/Short Opportunity Fund | | | | | | | | | | | | | | | | |
Class A (with sales charge) | | | 36.29% | | | | 8.41% | | | | 9.06% | | | | 5.60% | |
Class A (without sales charge) | | | 43.83% | | | | 9.58% | | | | 9.65% | | | | 5.97% | |
Class C (with sales charge) | | | 41.79% | | | | 8.78% | | | | 8.86% | | | | 5.20% | |
Class C (without sales charge) | | | 42.79% | | | | 8.78% | | | | 8.86% | | | | 5.20% | |
Institutional Class | | | 44.16% | | | | 9.86% | | | | 9.93% | | | | 6.23% | |
Russell 3000® Value Total Return Index | | | 37.78% | | | | 11.68% | | | | 12.95% | | | | 7.84% | |
70% Russell 3000® Value Total Return / 30% ICE BofA Merrill Lynch 3 Month U.S. Treasury Bill Blend Index | | | 25.55% | | | | 8.74% | | | | 9.36% | | | | 6.08% | |
| (1) | With sales charge returns reflect the deduction of the current maximum initial sales charge of 5.25% for Class A shares and the applicable contingent deferred sales charge for Class C shares. Returns without sales charges do not reflect the current maximum sales charges. Had the sales charges been included, the returns would have been lower. |
19
Snow Capital Family of Funds
Investment Highlights (Unaudited) (Continued)
Performance data quoted represents past performance and does not guarantee future results. The investment return and principal value of an investment will fluctuate so that an investor’s shares, when redeemed, may be worth more or less than their original cost. Current performance of the Funds may be lower or higher than the performance quoted. Performance data current to the most recent month end may be obtained by calling 1-877-SNOWFND (877-766-9363). The Funds impose a 0.50% redemption fee on shares held 30 days or less. Performance data does not reflect the redemption fee. If reflected, total returns would be reduced.
Short-term performance, in particular, is not a good indication of the Funds’ future performance, and an investment should not be made solely on returns.
Investment performance reflects fee waivers in effect. In the absence of such waivers, total returns would be reduced.
The returns shown in the table above and the following graphs assume reinvestment of Fund distributions and do not reflect the deduction of taxes that a shareholder would pay on Fund distributions or the redemption of Fund shares. The graphs below illustrate performance of a hypothetical investment made in the Funds and a broad- based securities index on each Fund’s inception date. The graphs do not reflect any future performance.
The Russell 2000® Value Total Return Index measures the performance of the small-cap value segment of the U.S. equity universe. It includes those Russell 2000® companies with lower price-to-book ratios and lower forecasted growth values. The Russell 3000® Value Total Return Index measures the performance of the broad value segment of U.S. equity value universe. It includes those Russell 3000® companies with lower price-to-book ratios and lower forecasted growth values. The 70% Russell 3000® Value Total Return/30% ICE BofA Merrill Lynch 3 Month Treasury Bill Blend Index consists of 70% Russell 3000® Value Total Return Index and 30% ICE BofA Merrill Lynch 3 Month U.S. Treasury Bill Index. The ICE BofA Merrill Lynch 3 Month U.S. Treasury Bill Index is an unmanaged market index of U.S. Treasury securities maturing in 90 days that assumes reinvestment of all income.
20
Snow Capital Family of Funds
Investment Highlights (Unaudited) (Continued)
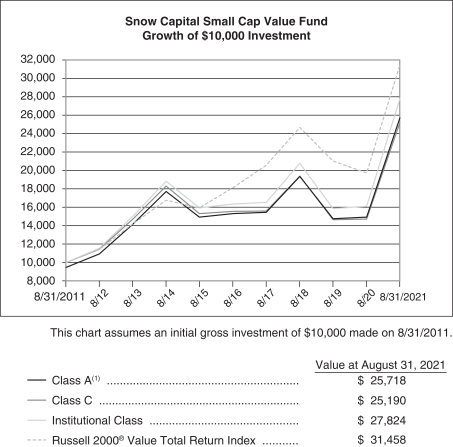
| (1) | Reflects 5.25% initial sales charge. |
21
Snow Capital Family of Funds
Investment Highlights (Unaudited) (Continued)
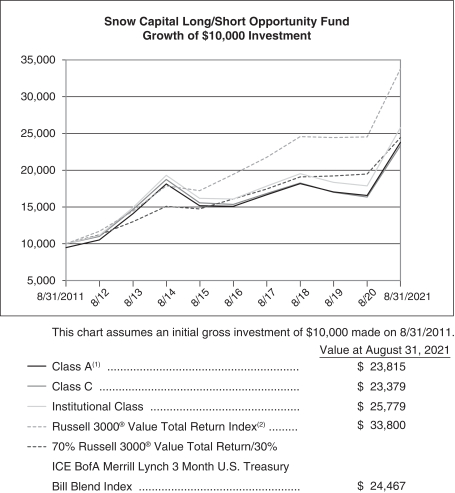
| (1) | Reflects 5.25% initial sales charge. |
22
Snow Capital Small Cap Value Fund
Schedule of Investments
August 31, 2021 (Unaudited)
| | | | | | | | |
| | | Shares | | | Value | |
COMMON STOCKS - 96.35% | | | | | | | | |
Air Freight & Logistics - 0.81% | | | | | | | | |
Atlas Air Worldwide Holdings, Inc. | | | 2,536 | | | $ | 185,559 | |
| | | | | | | | |
Airlines - 2.81% | | | | | | | | |
JetBlue Airways Corp. | | | 42,665 | | | | 645,521 | |
| | | | | | | | |
Auto Components - 3.35% | | | | | | | | |
Cooper-Standard Holdings, Inc. | | | 8,940 | | | | 208,123 | |
Modine Manufacturing Co. (a) | | | 44,960 | | | | 559,303 | |
| | | | | | | | |
| | | | | | | 767,426 | |
| | | | | | | | |
Banks - 19.87% | | | | | | | | |
BankUnited, Inc. | | | 21,821 | | | | 917,136 | |
First Commonwealth Financial Corp. | | | 35,292 | | | | 477,148 | |
First Midwest Bancorp Inc. | | | 23,508 | | | | 440,305 | |
FNB Corp. | | | 62,501 | | | | 730,012 | |
OFG Bancorp (b) | | | 17,434 | | | | 415,104 | |
PacWest Bancorp | | | 17,142 | | | | 729,392 | |
Umpqua Holdings Corp. | | | 43,701 | | | | 850,857 | |
| | | | | | | | |
| | | | | | | 4,559,954 | |
| | | | | | | | |
Commercial Services & Supplies - 5.28% | | | | | | | | |
ACCO Brands Corp. | | | 115,905 | | | | 1,086,031 | |
Matthews International Corp. | | | 3,346 | | | | 123,902 | |
| | | | | | | | |
| | | | | | | 1,209,933 | |
| | | | | | | | |
Communications Equipment - 1.08% | | | | | | | | |
Lumentum Holdings, Inc. | | | 2,870 | | | | 248,657 | |
| | | | | | | | |
Consumer Finance - 2.39% | | | | | | | | |
Green Dot Corp. - Class A | | | 10,499 | | | | 548,468 | |
| | | | | | | | |
Electronic Equipment, Instruments & Components - 1.83% | | | | | |
Vishay Intertechnology, Inc. | | | 19,143 | | | | 420,572 | |
| | | | | | | | |
Entertainment - 7.13% | | | | | | | | |
Cinemark Holdings, Inc. (a) | | | 53,566 | | | | 955,082 | |
Lions Gate Entertainment Corp. - Class A (a) | | | 52,624 | | | | 679,902 | |
| | | | | | | | |
| | | | | | | 1,634,984 | |
| | | | | | | | |
The accompanying notes are an integral part of these financial statements.
23
Snow Capital Small Cap Value Fund
Schedule of Investments (Continued)
August 31, 2021 (Unaudited)
| | | | | | | | |
| | | Shares | | | Value | |
Health Care Equipment & Supplies - 1.36% | | | | | | | | |
Co-Diagnostics, Inc. | | | 28,914 | | | $ | 310,826 | |
| | | | | | | | |
Hotels, Restaurants & Leisure - 5.12% | | | | | | | | |
Bloomin’ Brands, Inc. (a) | | | 22,070 | | | | 591,255 | |
Brinker International, Inc. (a) | | | 9,033 | | | | 481,188 | |
Dave & Buster’s Entertainment, Inc. | | | 2,689 | | | | 100,622 | |
| | | | | | | | |
| | | | | | | 1,173,065 | |
| | | | | | | | |
Household Durables - 1.63% | | | | | | | | |
Taylor Morrison Home Corp. | | | 13,308 | | | | 373,822 | |
| | | | | | | | |
Insurance - 7.52% | | | | | | | | |
American Equity Investment Life Holding Co. | | | 17,253 | | | | 546,748 | |
Argo Group International Holdings Ltd. (b) | | | 4,516 | | | | 238,896 | |
CNO Financial Group, Inc. | | | 38,390 | | | | 939,019 | |
| | | | | | | | |
| | | | | | | 1,724,663 | |
| | | | | | | | |
IT Services - 4.04% | | | | | | | | |
Alliance Data Systems Corp. | | | 9,438 | | | | 925,962 | |
| | | | | | | | |
Machinery - 0.95% | | | | | | | | |
NN, Inc. | | | 40,062 | | | | 217,937 | |
| | | | | | | | |
Metals & Mining - 5.24% | | | | | | | | |
Alamos Gold, Inc. (b) | | | 14,082 | | | | 111,248 | |
B2Gold Corp. (b) | | | 99,961 | | | | 388,848 | |
Century Aluminum Co. (a) | | | 11,285 | | | | 144,674 | |
Commercial Metals Co. | | | 17,092 | | | | 557,541 | |
| | | | | | | | |
| | | | | | | 1,202,311 | |
| | | | | | | | |
Oil, Gas & Consumable Fuels - 5.92% | | | | | | | | |
Cimarex Energy Co. | | | 7,262 | | | | 466,366 | |
Delek US Holdings, Inc. | | | 44,877 | | | | 767,845 | |
HollyFrontier Corp. | | | 3,833 | | | | 123,921 | |
| | | | | | | | |
| | | | | | | 1,358,132 | |
| | | | | | | | |
The accompanying notes are an integral part of these financial statements.
24
Snow Capital Small Cap Value Fund
Schedule of Investments (Continued)
August 31, 2021 (Unaudited)
| | | | | | | | |
| | | Shares | | | Value | |
Semiconductors & Semiconductor Equipment - 5.33% | | | | | | | | |
Photronics, Inc. | | | 34,816 | | | $ | 524,677 | |
Silicon Motion Technology Corp. (b) | | | 9,336 | | | | 697,025 | |
| | | | | | | | |
| | | | | | | 1,221,702 | |
| | | | | | | | |
Software - 2.80% | | | | | | | | |
J2 Global, Inc. (a) | | | 4,665 | | | | 642,371 | |
| | | | | | | | |
Specialty Retail - 1.46% | | | | | | | | |
American Eagle Outfitters, Inc. | | | 3,088 | | | | 94,246 | |
Urban Outfitters, Inc. | | | 7,305 | | | | 241,211 | |
| | | | | | | | |
| | | | | | | 335,457 | |
| | | | | | | | |
Technology Hardware, Storage & Peripherals - 3.19% | | | | | | | | |
Super Micro Computer, Inc. | | | 20,057 | | | | 732,883 | |
| | | | | | | | |
Textiles, Apparel & Luxury Goods - 4.03% | | | | | | | | |
Carter’s, Inc. | | | 3,296 | | | | 337,444 | |
Skechers U.S.A., Inc. - Class A | | | 2,365 | | | | 119,267 | |
Vera Bradley, Inc. | | | 40,894 | | | | 468,645 | |
| | | | | | | | |
| | | | | | | 925,356 | |
| | | | | | | | |
Trading Companies & Distributors - 3.21% | | | | | | | | |
WESCO International, Inc. | | | 6,289 | | | | 735,939 | |
| | | | | | | | |
TOTAL COMMON STOCKS
(Cost $19,955,462) | | | | | | | 22,101,500 | |
| | | | | | | | |
MONEY MARKET FUND - 1.80% | | | | | | | | |
Fidelity Investment Money Market Funds - Government Portfolio, Institutional Class, 0.010% (c) | | | 412,943 | | | | 412,943 | |
| | | | | | | | |
TOTAL MONEY MARKET FUND
(Cost $412,943) | | | | | | | 412,943 | |
| | | | | | | | |
Total Investments
(Cost $20,368,405) - 98.15% | | | | | | | 22,514,443 | |
Other Assets in Excess of Liabilities - 1.85% | | | | | | | 424,591 | |
| | | | | | | | |
TOTAL NET ASSETS - 100.00% | | | | | | $ | 22,939,034 | |
| | | | | | | | |
The accompanying notes are an integral part of these financial statements.
25
Snow Capital Small Cap Value Fund
Schedule of Investments (Continued)
August 31, 2021 (Unaudited)
Percentages are stated as a percent of net assets.
| (a) | Non-income producing security. |
| (b) | Foreign issued security. |
| (c) | Seven day yield as of August 31, 2021. |
The Global Industry Classification Standard (GICS®) was developed by and/or is the exclusive property of MSCI, Inc. and Standard & Poor Financial Services LLC (“S&P”). GICS is a service mark of MSCI and S&P and has been licensed for use by U.S. Bancorp Fund Services, LLC.
The accompanying notes are an integral part of these financial statements.
26
Snow Capital Long/Short Opportunity Fund
Schedule of Investments
August 31, 2021 (Unaudited)
| | | | | | | | |
| | | Shares | | | Value | |
COMMON STOCKS - 87.11% | | | | | | | | |
Aerospace & Defense - 4.61% | | | | | | | | |
General Dynamics Corp. | | | 11,005 | | | $ | 2,204,412 | |
Lockheed Martin Corp. | | | 6,920 | | | | 2,489,815 | |
| | | | | | | | |
| | | | | | | 4,694,227 | |
| | | | | | | | |
Airlines - 1.51% | | | | | | | | |
JetBlue Airways Corp. (a) | | | 67,410 | | | | 1,019,914 | |
Southwest Airlines Co. | | | 10,330 | | | | 514,227 | |
| | | | | | | | |
| | | | | | | 1,534,141 | |
| | | | | | | | |
Banks - 10.96% | | | | | | | | |
Bank of America Corp. (b)(c) | | | 61,957 | | | | 2,586,705 | |
JPMorgan Chase & Co. (b)(c) | | | 16,540 | | | | 2,645,573 | |
Truist Financial Corp. | | | 49,045 | | | | 2,798,507 | |
Umpqua Holdings Corp. | | | 251 | | | | 4,887 | |
Wells Fargo & Co. | | | 68,095 | | | | 3,111,941 | |
| | | | | | | | |
| | | | | | | 11,147,613 | |
| | | | | | | | |
Biotechnology - 3.48% | | | | | | | | |
Amgen, Inc. (c) | | | 7,840 | | | | 1,768,155 | |
Biogen, Inc. (a)(c) | | | 5,234 | | | | 1,773,855 | |
| | | | | | | | |
| | | | | | | 3,542,010 | |
| | | | | | | | |
Capital Markets - 1.74% | | | | | | | | |
The Goldman Sachs Group, Inc. (b) | | | 4,275 | | | | 1,767,755 | |
| | | | | | | | |
Communications Equipment - 1.63% | | | | | | | | |
Lumentum Holdings, Inc. | | | 19,120 | | | | 1,656,557 | |
| | | | | | | | |
Consumer Finance - 0.52% | | | | | | | | |
American Express Co. (b) | | | 3,200 | | | | 531,072 | |
| | | | | | | | |
Diversified Telecommunication Services - 1.12% | | | | | | | | |
Lumen Technologies, Inc. | | | 92,610 | | | | 1,139,103 | |
| | | | | | | | |
Electronic Equipment, Instruments & Components - 1.52% | | | | | | | | |
Vishay Intertechnology, Inc. | | | 70,500 | | | | 1,548,885 | |
| | | | | | | | |
The accompanying notes are an integral part of these financial statements.
27
Snow Capital Long/Short Opportunity Fund
Schedule of Investments (Continued)
August 31, 2021 (Unaudited)
| | | | | | | | |
| | | Shares | | | Value | |
Food Products - 1.71% | | | | | | | | |
Tyson Foods, Inc. - Class A | | | 22,120 | | | $ | 1,736,862 | |
| | | | | | | | |
Health Care Providers & Services - 4.37% | | | | | | | | |
Cardinal Health, Inc. (c) | | | 51,725 | | | | 2,715,046 | |
Centene Corp. (a) | | | 27,380 | | | | 1,724,392 | |
| | | | | | | | |
| | | | | | | 4,439,438 | |
| | | | | | | | |
Hotels, Restaurants & Leisure - 0.64% | | | | | | | | |
Norwegian Cruise Line Holdings Ltd. (a) | | | 25,175 | | | | 650,522 | |
| | | | | | | | |
Household Durables - 2.26% | | | | | | | | |
Mohawk Industries, Inc. (a) | | | 11,610 | | | | 2,295,994 | |
| | | | | | | | |
Independent Power and Renewable Electricity Producers - 1.04% | | | | | | | | |
Vistra Corp. | | | 55,210 | | | | 1,053,959 | |
| | | | | | | | |
Insurance - 9.39% | | | | | | | | |
Argo Group International Holdings Ltd. (d) | | | 42,390 | | | | 2,242,431 | |
CNO Financial Group, Inc. | | | 91,590 | | | | 2,240,291 | |
Hartford Financial Services Group, Inc. | | | 39,910 | | | | 2,682,751 | |
MetLife, Inc. (c) | | | 38,435 | | | | 2,382,970 | |
| | | | | | | | |
| | | | | | | 9,548,443 | |
| | | | | | | | |
Leisure Products - 2.41% | | | | | | | | |
Hasbro, Inc. | | | 24,950 | | | | 2,452,835 | |
| | | | | | | | |
Machinery - 1.44% | | | | | | | | |
Caterpillar, Inc. (b) | | | 2,000 | | | | 421,740 | |
PACCAR, Inc. | | | 12,680 | | | | 1,038,112 | |
| | | | | | | | |
| | | | | | | 1,459,852 | |
| | | | | | | | |
Metals & Mining - 4.17% | | | | | | | | |
Alamos Gold, Inc. (d) | | | 64,260 | | | | 507,654 | |
Commercial Metals Co. (b) | | | 54,500 | | | | 1,777,790 | |
Freeport-McMoRan, Inc. | | | 27,235 | | | | 991,082 | |
Rio Tinto PLC - ADR (b)(d) | | | 12,770 | | | | 958,644 | |
| | | | | | | | |
| | | | | | | 4,235,170 | |
| | | | | | | | |
The accompanying notes are an integral part of these financial statements.
28
Snow Capital Long/Short Opportunity Fund
Schedule of Investments (Continued)
August 31, 2021 (Unaudited)
| | | | | | | | |
| | | Shares | | | Value | |
Multiline Retail - 2.09% | | | | | | | | |
Kohl’s Corp. (b) | | | 36,930 | | | $ | 2,119,782 | |
| | | | | | | | |
Oil, Gas & Consumable Fuels - 9.58% | | | | | | | | |
BP PLC - ADR (d) | | | 61,268 | | | | 1,498,615 | |
Cimarex Energy Co. | | | 29,290 | | | | 1,881,004 | |
Marathon Petroleum Corp. (b)(c) | | | 44,760 | | | | 2,652,925 | |
Pioneer Natural Resources Co. | | | 12,860 | | | | 1,924,756 | |
Suncor Energy, Inc. (d) | | | 95,140 | | | | 1,774,361 | |
| | | | | | | | |
| | | | | | | 9,731,661 | |
| | | | | | | | |
Pharmaceuticals - 5.07% | | | | | | | | |
AbbVie, Inc. (c) | | | 21,524 | | | | 2,599,669 | |
Pfizer, Inc. | | | 55,430 | | | | 2,553,660 | |
| | | | | | | | |
| | | | | | | 5,153,329 | |
| | | | | | | | |
Semiconductors & Semiconductor Equipment - 0.77% | | | | | | | | |
Intel Corp. | | | 14,430 | | | | 780,086 | |
| | | | | | | | |
Software - 1.13% | | | | | | | | |
Check Point Software Technologies Ltd. (a)(d) | | | 9,110 | | | | 1,144,489 | |
| | | | | | | | |
Technology Hardware, Storage & Peripherals - 4.36% | | | | | | | | |
HP, Inc. | | | 66,630 | | | | 1,981,577 | |
NCR Corp. (b)(a) | | | 44,030 | | | | 1,870,394 | |
NetApp, Inc. (b) | | | 6,500 | | | | 578,045 | |
| | | | | | | | |
| | | | | | | 4,430,016 | |
| | | | | | | | |
Textiles, Apparel & Luxury Goods - 6.90% | | | | | | | | |
Carter’s, Inc. | | | 21,890 | | | | 2,241,098 | |
PVH Corp. | | | 24,291 | | | | 2,545,453 | |
Tapestry, Inc. | | | 55,190 | | | | 2,225,261 | |
| | | | | | | | |
| | | | | | | 7,011,812 | |
| | | | | | | | |
Trading Companies & Distributors - 2.69% | | | | | | | | |
WESCO International, Inc. (b)(a) | | | 23,350 | | | | 2,732,417 | |
| | | | | | | | |
TOTAL COMMON STOCKS
(Cost $70,733,924) | | | | | | | 88,538,030 | |
| | | | | | | | |
The accompanying notes are an integral part of these financial statements.
29
Snow Capital Long/Short Opportunity Fund
Schedule of Investments (Continued)
August 31, 2021 (Unaudited)
| | | | | | | | | | | | |
| | | Contracts | | | Notional
Value | | | Value | |
PURCHASED OPTIONS - 0.20% | | | | | | | | | | | | |
Exchange Traded Put Options - 0.20% | | | | | | | | | | | | |
iShares Russell 1000 Value ETF | | | | | | | | | | | | |
Expiration: January, 2022, Exercise Price: $135.000 | | | 130 | | | $ | 2,120,170 | | | $ | 17,550 | |
iShares Russell 2000 ETF | | | | | | | | | | | | |
Expiration: January, 2022, Exercise Price: $215.000 | | | 65 | | | | 1,468,480 | | | | 57,395 | |
SPDR S&P 500 ETF Trust | | | | | | | | | | | | |
Expiration: December, 2021, Exercise Price: $385.000 | | | 20 | | | | 903,120 | | | | 8,580 | |
Expiration: June, 2022, Exercise Price: $430.000 | | | 50 | | | | 2,257,800 | | | | 116,350 | |
| | | | | | | | | | | | |
TOTAL PURCHASED OPTIONS
(Cost $339,916) | | | | | | | | | | | 199,875 | |
| | | | | | | | | | | | |
| | | | | | | | |
| | | Shares | | | | |
EXCHANGE TRADED FUNDS - 1.05% | | | | | | | | |
VanEck Vectors Junior Gold Miners ETF | | | 24,800 | | | | 1,069,128 | |
| | | | | | | | |
TOTAL EXCHANGE TRADED FUNDS
(Cost $992,677) | | | | | | | 1,069,128 | |
| | | | | | | | |
MONEY MARKET FUND - 9.58% | | | | | | | | |
Fidelity Investments Money Market Funds - Government Portfolio, Institutional Class, 0.010% (e) | | | 9,733,204 | | | | 9,733,204 | |
| | | | | | | | |
TOTAL MONEY MARKET FUND
(Cost $9,733,204) | | | | | | | 9,733,204 | |
| | | | | | | | |
Total Investments
(Cost $81,799,721) - 97.94% | | | | | | | 99,540,237 | |
Other Assets in Excess of Liabilities - 2.06% | | | | | | | 2,095,889 | |
| | | | | | | | |
TOTAL NET ASSETS - 100.00% | | | | | | $ | 101,636,126 | |
| | | | | | | | |
The accompanying notes are an integral part of these financial statements.
30
Snow Capital Long/Short Opportunity Fund
Schedule of Investments (Continued)
August 31, 2021 (Unaudited)
Percentages are stated as a percent of net assets.
| (a) | Non-income producing security. |
| (b) | All or a portion of this security may be subject to call options written. |
| (c) | All or a portion of this security is pledged as collateral for securities sold short. |
| (d) | Foreign issued security. |
| (e) | Seven day yield as of August 31, 2021. |
Abbreviations:
| ADR | American Depositary Receipt |
| Ltd. | Limited Liability Company. |
| PLC | Public Limited Company. |
The Global Industry Classification Standard (GICS®) was developed by and/or is the exclusive property of MSCI, Inc. and Standard & Poor Financial Services LLC (“S&P”). GICS is a service mark of MSCI and S&P and has been licensed for use by U.S. Bancorp Fund Services, LLC.
The accompanying notes are an integral part of these financial statements.
31
Snow Capital Long/Short Opportunity Fund
Schedule of Securities Sold Short
August 31, 2021 (Unaudited)
| | | | | | | | |
| | | Shares | | | Value | |
SECURITIES SOLD SHORT - (10.08)% | | | | | | | | |
EXCHANGE TRADED FUNDS - (10.08)% | | | | | | | | |
Invesco QQQ Trust Series 1 | | | (3,600 | ) | | $ | (1,367,820 | ) |
iShares Russell 1000 Value ETF | | | (27,270 | ) | | | (4,447,464 | ) |
iShares Russell 2000 ETF | | | (9,440 | ) | | | (2,132,685 | ) |
SPDR S&P 500 ETF Trust | | | (5,080 | ) | | | (2,293,925 | ) |
TOTAL EXCHANGE TRADED FUNDS
(Proceeds: $6,744,960) | | | | | | | (10,241,894 | ) |
| | | | | | | | |
Total for Shares Sold Short
(Proceeds: $6,744,960) | | | | | | $ | (10,241,894 | ) |
| | | | | | | | |
The Global Industry Classification Standard (GICS®) was developed by and/or is the exclusive property of MSCI, Inc. and Standard & Poor Financial Services LLC (“S&P”). GICS is a service mark of MSCI and S&P and has been licensed for use by U.S. Bancorp Fund Services, LLC.
The accompanying notes are an integral part of these financial statements.
32
Snow Capital Long/Short Opportunity Fund
Schedule of Options Written
August 31, 2021 (Unaudited)
| | | | | | | | | | | | |
| | | Contracts | | | Notional
Value | | | Value | |
EXCHANGE TRADED CALL OPTIONS | | | | | | | | | | | | |
American Express Co. | | | | | | | | | | | | |
Expiration: October, 2021, Exercise Price: $175.00 | | | (32 | ) | | $ | (531,072 | ) | | $ | (6,624 | ) |
Bank of America Corp. | | | | | | | | | | | | |
Expiration: January, 2022, Exercise Price: $45.00 | | | (126 | ) | | | (526,050 | ) | | | (17,892 | ) |
Caterpillar, Inc. | | | | | | | | | | | | |
Expiration: September, 2021, Exercise Price: $260.00 | | | (20 | ) | | | (421,740 | ) | | | (60 | ) |
Commercial Metals Co. | | | | | | | | | | | | |
Expiration: September, 2021, Exercise Price: $34.00 | | | (157 | ) | | | (512,134 | ) | | | (6,280 | ) |
iShares Russell 1000 Value ETF | | | | | | | | | | | | |
Expiration: January, 2022, Exercise Price: $165.00 | | | (65 | ) | | | (1,060,085 | ) | | | (32,500 | ) |
Expiration: January, 2022, Exercise Price: $170.00 | | | (65 | ) | | | (1,060,085 | ) | | | (16,412 | ) |
iShares Russell 2000 ETF | | | | | | | | | | | | |
Expiration: January, 2022, Exercise Price: $245.00 | | | (65 | ) | | | (1,468,480 | ) | | | (24,538 | ) |
JPMorgan Chase & Co. | | | | | | | | | | | | |
Expiration: September, 2021, Exercise Price: $165.00 | | | (30 | ) | | | (479,850 | ) | | | (2,550 | ) |
Kohl’s Corp. | | | | | | | | | | | | |
Expiration: October, 2021, Exercise Price: $62.50 | | | (100 | ) | | | (574,000 | ) | | | (13,200 | ) |
Marathon Petroleum Corp. | | | | | | | | | | | | |
Expiration: January, 2022, Exercise Price: $65.00 | | | (80 | ) | | | (474,160 | ) | | | (22,240 | ) |
NCR Corp. | | | | | | | | | | | | |
Expiration: October, 2021, Exercise Price: $50.00 | | | (106 | ) | | | (450,288 | ) | | | (3,180 | ) |
The accompanying notes are an integral part of these financial statements.
33
Snow Capital Long/Short Opportunity Fund
Schedule of Options Written (Continued)
August 31, 2021 (Unaudited)
| | | | | | | | | | | | |
| | | Contracts | | | Notional
Value | | | Value | |
NetApp, Inc. | | | | | | | | | | | | |
Expiration: September, 2021, Exercise Price: $85.00 | | | (65 | ) | | $ | (578,045 | ) | | $ | (29,250 | ) |
Rio Tinto Plc | | | | | | | | | | | | |
Expiration: September, 2021, Exercise Price: $94.72 | | | (56 | ) | | | (420,392 | ) | | | (280 | ) |
SPDR S&P 500 ETF Trust | | | | | | | | | | | | |
Expiration: December, 2021, Exercise Price: $430.00 | | | (20 | ) | | | (903,120 | ) | | | (61,080 | ) |
Expiration: June, 2022, Exercise Price: $475.00 | | | (50 | ) | | | (2,257,800 | ) | | | (72,400 | ) |
The Goldman Sachs Group, Inc. | | | | | | | | | | | | |
Expiration: October, 2021, Exercise Price: $380.00 | | | (14 | ) | | | (578,914 | ) | | | (53,620 | ) |
WESCO International, Inc. | | | | | | | | | | | | |
Expiration: January, 2022, Exercise Price: $125.00 | | | (42 | ) | | | (491,484 | ) | | | (32,550 | ) |
| | | | | | | | | | | | |
| | | | | | | | | | | (394,656 | ) |
| | | | | | | | | | | | |
EXCHANGE TRADED PUT OPTIONS | | | | | | | | | | | | |
B&G Foods, Inc. | | | | | | | | | | | | |
Expiration: January, 2022, Exercise Price: $30.00 | | | (170 | ) | | | (516,120 | ) | | | (46,325 | ) |
Carters, Inc. | | | | | | | | | | | | |
Expiration: September, 2021, Exercise Price: $75.00 | | | (60 | ) | | | — | | | | (6,450 | ) |
Centene Corp. | | | | | | | | | | | | |
Expiration: September, 2021, Exercise Price: $55.00 | | | (85 | ) | | | (535,330 | ) | | | (85 | ) |
Freeport-McMoRan, Inc. | | | | | | | | | | | | |
Expiration: January, 2022, Exercise Price: $30.00 | | | (170 | ) | | | (618,630 | ) | | | (26,010 | ) |
The accompanying notes are an integral part of these financial statements.
34
Snow Capital Long/Short Opportunity Fund
Schedule of Options Written (Continued)
August 31, 2021 (Unaudited)
| | | | | | | | | | | | |
| | | Contracts | | | Notional
Value | | | Value | |
HP, Inc. | | | | | | | | | | | | |
Expiration: November, 2021, Exercise Price: $28.00 | | | (188 | ) | | $ | (559,112 | ) | | $ | (15,416 | ) |
Expiration: January, 2022, Exercise Price: $27.00 | | | (139 | ) | | | (413,386 | ) | | | (16,402 | ) |
Intel Corp. | | | | | | | | | | | | |
Expiration: January, 2022, Exercise Price: $52.50 | | | (98 | ) | | | (529,788 | ) | | | (29,890 | ) |
Expiration: June, 2022, Exercise Price: $50.00 | | | (100 | ) | | | (540,600 | ) | | | (37,600 | ) |
Kohl’s Corp. | | | | | | | | | | | | |
Expiration: January, 2022, Exercise Price: $45.00 | | | (113 | ) | | | (648,620 | ) | | | (24,408 | ) |
Lumentum Holdings, Inc. | | | | | | | | | | | | |
Expiration: December, 2021, Exercise Price: $65.00 | | | (83 | ) | | | (719,112 | ) | | | (6,225 | ) |
Mohawk Industries, Inc. | | | | | | | | | | | | |
Expiration: November, 2021, Exercise Price: $170.00 | | | (31 | ) | | | (613,056 | ) | | | (12,090 | ) |
Nordstrom, Inc. | | | | | | | | | | | | |
Expiration: October, 2021, Exercise Price: $30.00 | | | (176 | ) | | | (503,536 | ) | | | (48,576 | ) |
Norwegian Cruise Line Holdings Ltd. | | | | | | | | | | | | |
Expiration: September, 2021, Exercise Price: $20.00 | | | (225 | ) | | | (581,400 | ) | | | (2,025 | ) |
Ulta Beauty, Inc. | | | | | | | | | | | | |
Expiration: September, 2021, Exercise Price: $260.00 | | | (19 | ) | | | (735,889 | ) | | | (285 | ) |
Zimmer Biomet Holdings, Inc. | | | | | | | | | | | | |
Expiration: November, 2021, Exercise Price: $140.00 | | | (37 | ) | | | (556,665 | ) | | | (12,950 | ) |
| | | | | | | | | | | | |
| | | | | | | | | | | (284,737 | ) |
| | | | | | | | | | | | |
Total Options Written
(Premiums received $1,190,781) | | | | | | | | | | $ | (679,393 | ) |
| | | | | | | | | | | | |
The accompanying notes are an integral part of these financial statements.
35
Snow Capital Family of Funds
Statements of Assets and Liabilities
August 31, 2021 (Unaudited)
| | | | | | | | |
| | | Snow Capital
Small Cap Value
Fund | | | Snow Capital
Long/Short
Opportunity
Fund | |
ASSETS | | | | | | | | |
Investments, at value: (Cost $20,368,405 and $81,799,721 respectively) | | $ | 22,514,443 | | | $ | 99,540,237 | |
Dividends and interest receivable | | | 13,975 | | | | 330,439 | |
Receivable from Adviser | | | 16,155 | | | | — | |
Receivable for investments sold | | | 460,076 | | | | 4,090,655 | |
Receivable for Fund shares sold | | | 7,863 | | | | — | |
Deposits at Broker | | | — | | | | 9,904,325 | |
Other assets | | | 17,556 | | | | 25,905 | |
| | | | | | | | |
TOTAL ASSETS | | | 23,030,068 | | | | 113,891,561 | |
| | | | | | | | |
|
| |
LIABILITIES | | | | | | | | |
Short securities, at value (premiums received of $0 and $6,744,960 respectively) | | | — | | | | 10,241,894 | |
Written options, at value (premiums received of $0 and $1,190,781 respectively) | | | — | | | | 679,393 | |
Payable for investments purchased | | | — | | | | 1,029,653 | |
Payable for Fund shares redeemed | | | 4,727 | | | | — | |
Payable to affiliates | | | 46,762 | | | | 72,765 | |
Payable to Adviser | | | — | | | | 142,372 | |
Payable for distribution fees | | | 4,465 | | | | 33,273 | |
Payable for shareholder servicing fees | | | 1,715 | | | | 2,255 | |
Accrued expenses and other liabilities | | | 33,365 | | | | 53,830 | |
| | | | | | | | |
TOTAL LIABILITIES | | | 91,034 | | | | 12,255,435 | |
| | | | | | | | |
NET ASSETS | | | 22,939,034 | | | | 101,636,126 | |
| | | | | | | | |
|
| |
Net assets consist of: | | | | | | | | |
Paid-in capital | | $ | 23,550,305 | | | $ | 77,623,339 | |
Total distributable earnings (losses) | | $ | (611,271 | ) | | $ | 24,012,787 | |
| | | | | | | | |
NET ASSETS | | $ | 22,939,034 | | | $ | 101,636,126 | |
| | | | | | | | |
The accompanying notes are an integral part of these financial statements.
36
Snow Capital Family of Funds
Statements of Assets and Liabilities (Continued)
August 31, 2021 (Unaudited)
| | | | | | | | |
COMPUTATION OF
NET ASSET VALUE | | Snow Capital
Small Cap Value
Fund | | | Snow Capital
Long/Short
Opportunity
Fund | |
CLASS A SHARES | | | | | | | | |
Net assets | | $ | 9,845,921 | | | $ | 50,083,814 | |
Shares of beneficial interest outstanding (unlimited shares authorized, $0.001 par value) | | | 207,344 | | | | 1,457,708 | |
Net asset value, redemption price and offering price per share | | $ | 47.49 | | | $ | 34.36 | |
Maximum offering price per share (Net Asset Value per share divided by 0.9475)(2)(3) | | $ | 50.12 | | | $ | 36.26 | |
|
| |
CLASS C SHARES | | | | | | | | |
Net assets | | $ | 1,733,199 | | | $ | 3,811,962 | |
Shares of beneficial interest outstanding (unlimited shares authorized, $0.001 par value) | | | 39,779 | | | | 117,757 | |
Net asset value, redemption price and offering price per share(1)(3) | | $ | 43.57 | | | $ | 32.37 | |
|
| |
INSTITUTIONAL CLASS SHARES | | | | | | | | |
Net assets | | $ | 11,359,914 | | | $ | 47,740,350 | |
Shares of beneficial interest outstanding (unlimited shares authorized, $0.001 par value) | | | 232,499 | | | | 1,375,492 | |
Net asset value, redemption price and offering price per share | | $ | 48.86 | | | $ | 34.71 | |
| (1) | If applicable, redemption price per share may be reduced by a 0.50% redemption fee for shares redeemed within thirty days of purchase. |
| (2) | A contingent deferred sales charge (“CDSC”) of 0.50% may be charged on Class A share purchases of $1,000,000 or more that are redeemed within. twelve months of purchase and a CDSC of 1.00% may be charged on Class C shares redeemed within twelve months of purchase. |
| (3) | Reflects a maximum sales charge of 5.25%. |
The accompanying notes are an integral part of these financial statements.
37
Snow Capital Family of Funds
Statements of Operations
For the Six Months Ended August 31, 2021 (Unaudited)
| | | | | | | | |
| | | Snow Capital
Small Cap Value
Fund | | | Snow Capital
Long/Short
Opportunity
Fund | |
INVESTMENT INCOME | | | | | | | | |
Dividend income | | $ | 156,254 | | | $
|
1,133,630 |
|
Interest income | | | 27 | | | | 591 | |
Other income | | | — | | | | 1,918 | |
| | | | | | | | |
TOTAL INVESTMENT INCOME | | | 156,281 | | | | 1,136,139 | |
| | | | | | | | |
EXPENSES | | | | | | | | |
Management fees | | | 120,627 | | | | 414,938 | |
Administration fees | | | 61,824 | | | | 91,836 | |
Transfer agent fees and expenses | | | 30,734 | | | | 52,939 | |
Federal and state registration fees | | | 21,528 | | | | 21,252 | |
Audit and tax fees | | | 17,664 | | | | 19,044 | |
Distribution fees - Class A | | | 12,552 | | | | 63,296 | |
Legal fees | | | 8,188 | | | | 14,628 | |
Distribution fees - Class C | | | 6,976 | | | | 15,028 | |
Chief Compliance Officer fees | | | 6,256 | | | | 6,256 | |
Trustees’ fees | | | 5,336 | | | | 5,336 | |
Custody fees | | | 3,680 | | | | 6,072 | |
Reports to shareholders | | | 3,036 | | | | 17,020 | |
Shareholder servicing fees - Class C | | | 2,325 | | | | 2,584 | |
Insurance expense | | | 1,564 | | | | 2,024 | |
Accounting expense | | | 1,196 | | | | 2,208 | |
Interest expense | | | 778 | | | | — | |
Broker fees | | | — | | | | 46,036 | |
Dividends on short positions | | | — | | | | 60,774 | |
Other expenses | | | 1,656 | | | | 1,840 | |
| | | | | | | | |
TOTAL EXPENSES | | | 305,920 | | | | 843,111 | |
| | | | | | | | |
Recoupment (or waivers) by Adviser (Note 4) | | | (124,570 | ) | | | 5,003 | |
| | | | | | | | |
NET EXPENSES | | | 181,350 | | | | 848,114 | |
| | | | | | | | |
NET INVESTMENT INCOME (LOSS) | | | (25,069 | ) | | | 288,025 | |
| | | | | | | | |
The accompanying notes are an integral part of these financial statements.
38
Snow Capital Family of Funds
Statements of Operations (Continued)
For the Six Months Ended August 31, 2021 (Unaudited)
| | | | | | | | |
| | | Snow Capital
Small Cap Value
Fund | | | Snow Capital
Long/Short
Opportunity
Fund | |
REALIZED AND UNREALIZED GAIN (LOSS) ON INVESTMENTS | | | | | | | | |
Net realized gain (loss) on: | | | | | | | | |
Investments | | $ | 3,786,427 | | | $ | 10,040,184 | |
Securities sold short | | | — | | | | (111,937 | ) |
Purchased options | | | — | | | | (101,133 | ) |
Written options | | | — | | | | 266,999 | |
Net change in unrealized appreciation (depreciation) on: | | | | | | | | |
Investments | | | (2,399,633 | ) | | | (675,153 | ) |
Securities sold short | | | — | | | | (1,265,575 | ) |
Purchased options | | | — | | | | (144,723 | ) |
Written options | | | — | | | | 513,906 | |
Foreign currency translation | | | — | | | | 53 | |
| | | | | | | | |
NET REALIZED AND UNREALIZED GAIN | | | 1,386,794 | | | | 8,522,621 | |
| | | | | | | | |
NET INCREASE IN NET ASSETS FROM OPERATIONS | | $ | 1,361,725 | | | $ | 8,810,646 | |
| | | | | | | | |
The accompanying notes are an integral part of these financial statements.
39
Snow Capital Family of Funds
Snow Capital Small Cap Value Fund
Statements of Changes in Net Assets
| | | | | | | | |
| | | Six Months Ended
August 31, 2021
(Unaudited) | | | Year Ended
February 28, 2021 | |
FROM OPERATIONS | | | | | | | | |
Net investment income (loss) | | $ | (25,069 | ) | | $ | 39,927 | |
Net realized gain (Loss) on: | | | | | | | | |
Investments | | | 3,786,427 | | | | (2,615,951 | ) |
Net change in unrealized appreciation (depreciation) Investments | | | (2,399,633 | ) | | | 7,327,960 | |
| | | | | | | | |
Increase in Net Assets from Operations | | | 1,361,725 | | | | 4,751,936 | |
| | | | | | | | |
FROM CAPITAL SHARE TRANSACTIONS | | | | | | | | |
Proceeds from shares sold - Class A | | | 61,195 | | | | 762,129 | |
Proceeds from shares sold - Class C | | | 16,623 | | | | 26,902 | |
Proceeds from shares sold - Institutional Class | | | 9,338,167 | | | | 1,855,569 | |
Payments for shares redeemed - Class A | | | (162,646 | ) | | | (3,392,010 | ) |
Payments for shares redeemed - Class C | | | (159,017 | ) | | | (1,642,191 | ) |
Payments for shares redeemed - Institutional Class(1) | | | (6,412,557 | ) | | | (3,912,190 | ) |
| | | | | | | | |
Net Increase (Decrease) from capital share transactions | | | 2,681,765 | | | | (6,301,791 | ) |
| | | | | | | | |
TOTAL INCREASE (DECREASE) IN NET ASSETS | | | 4,043,490 | | | | (1,549,855 | ) |
NET ASSETS | | | | | | | | |
Beginning of Period | | $ | 18,895,544 | | | $ | 20,445,399 | |
| | | | | | | | |
End of Period | | $ | 22,939,034 | | | $ | 18,895,544 | |
| | | | | | | | |
| (1) | Net of redemption fees of $330 and $524 for the six months ended August 31, 2021 and the year ended February 28, 2021, respectively. |
The accompanying notes are an integral part of these financial statements.
40
Snow Capital Family of Funds
Snow Capital Long/Short Opportunity Fund
Statements of Changes in Net Assets
| | | | | | | | |
| | | Six Months Ended
August 31, 2021
(Unaudited) | | | Year Ended
February 28, 2021 | |
FROM OPERATIONS | | | | | | | | |
Net investment income | | $ | 288,025 | | | $ | 556,501 | |
Net realized gain (loss) on: | | | | | | | | |
Investments | | | 10,040,184 | | | | (1,521,881 | ) |
Securities sold short | | | (111,937 | ) | | | 547,537 | |
Purchased options | | | (101,133 | ) | | | 81,538 | |
Written options | | | 266,999 | | | | 972,738 | |
Net change in unrealized appreciation (depreciation) | | | | | | | | |
Investments | | | (675,153 | ) | | | 19,114,442 | |
Securities sold short | | | (1,265,575 | ) | | | (3,413,948 | ) |
Purchased options | | | (144,723 | ) | | | (280,707 | ) |
Written options | | | 513,906 | | | | 249,351 | |
Foreign currency translation | | | 53 | | | | 291 | |
| | | | | | | | |
Increase in Net Assets from Operations | | | 8,810,646 | | | | 16,305,862 | |
| | | | | | | | |
FROM DISTRIBUTIONS | | | | | | | | |
Net investment income - Class A | | | — | | | | (585,909 | ) |
Net investment income - Institutional Class | | | — | | | | (767,052 | ) |
| | | | | | | | |
Net decrease in net assets resulting from distributions paid | | | — | | | | (1,352,961 | ) |
| | | | | | | | |
FROM CAPITAL SHARE TRANSACTIONS | | | | | | | | |
Proceeds from shares sold - Class A | | | 113,417 | | | | 4,486,792 | |
Proceeds from shares sold - Class C | | | 4,500 | | | | 2,200 | |
Proceeds from shares sold - Institutional Class | | | 123,199 | | | | 520,121 | |
Net asset value of shares issued to shareholders in payment of distributions declared - Class A | | | — | | | | 130,502 | |
Net asset value of shares issued to shareholders in payment of distributions declared - Class C | | | — | | | | — | |
Net asset value of shares issued to shareholders in payment of distributions declared - Institutional Class | | | — | | | | 636,641 | |
Payments for shares redeemed - Class A | | | (846,662 | ) | | | (15,482,406 | ) |
Payments for shares redeemed - Class C | | | (478,029 | ) | | | (6,736,652 | ) |
Payments for shares redeemed - Institutional Class(1) | | | (1,952,130 | ) | | | (8,430,534 | ) |
| | | | | | | | |
Net Decrease from capital share transactions | | | (3,035,705 | ) | | | (24,873,336 | ) |
| | | | | | | | |
TOTAL INCREASE (DECREASE) IN NET ASSETS | | | 5,774,941 | | | | (9,920,435 | ) |
NET ASSETS | | | | | | | | |
Beginning of Period | | $ | 95,861,185 | | | $ | 105,781,620 | |
| | | | | | | | |
End of Period | | $ | 101,636,126 | | | $ | 95,861,185 | |
| | | | | | | | |
| (1) | Net of redemption fees of $- and $11 for the six months ended August 31, 2021 and the year ended February 28, 2021, respectively. |
The accompanying notes are an integral part of these financial statements.
41
Snow Capital Small Cap Value Fund - Class A
Financial Highlights
Per Share Data for a Share Outstanding Throughout Each Period
| | | | | | | | | | | | | | | | | | | | | | | | |
| | | For the
Six Months Ended
August 31, 2021
(Unaudited) | | | Year Ended
February 28,
2021 | | | Year Ended
February 29,
2020 | | | Year Ended
February 28,
2019 | | | Year Ended
February 28,
2018 | | | Year Ended
February 28,
2017 | |
Net Asset Value, Beginning of Period | | $ | 44.01 | | | $ | 26.39 | | | $ | 31.57 | | | $ | 32.36 | | | $ | 30.61 | | | $ | 23.62 | |
| | | | | | | | | | | | | | | | | | | | | | | | |
| | | | | | |
Income from investment operations: | | | | | | | | | | | | | | | | | | | | | | | | |
Net investment income (loss)(1) | | | (0.06 | ) | | | 0.09 | | | | 0.01 | | | | (0.06 | ) | | | (0.16 | ) | | | (0.19 | ) |
Net realized and unrealized gain (loss) on investments | | | 3.54 | | | | 17.53 | | | | (5.19 | ) | | | (0.73 | ) | | | 1.91 | | | | 7.18 | |
| | | | | | | | | | | | | | | | | | | | | | | | |
Total from Investment Operations | | | 3.48 | | | | 17.62 | | | | (5.18 | ) | | | (0.79 | ) | | | 1.75 | | | | 6.99 | |
| | | | | | | | | | | | | | | | | | | | | | | | |
Paid-in capital from redemption fees (Note 2) | | | — | | | | — | | | | — | | | | — | | | | 0.00 | (2) | | | 0.00 | (2) |
| | | | | | | | | | | | | | | | | | | | | | | | |
Net Asset Value, End of Period | | $ | 47.49 | | | $ | 44.01 | | | $ | 26.39 | | | $ | 31.57 | | | $ | 32.36 | | | $ | 30.61 | |
| | | | | | | | | | | | | | | | | | | | | | | | |
Total Return(3)(4) | | | 7.88 | % | | | 66.81 | % | | | -16.41 | % | | | -2.44 | % | | | 5.72 | % | | | 29.59 | % |
| | | | | | | | | | | | | | | | | | | | | | | | |
| | | | | | |
Supplemental Data and Ratios: | | | | | | | | | | | | | | | | | | | | | | | | |
Net Assets at End of Period (000’s Omitted) | | $ | 9,846 | | | $ | 9,223 | | | $ | 10,071 | | | $ | 12,948 | | | $ | 15,236 | | | $ | 21,013 | |
Ratio of expenses to average net assets | | | | | | | | | | | | | | | | | | | | | | | | |
Before waivers and reimbursements of expenses(5)(6) | | | 2.49 | % | | | 3.84 | % | | | 2.41 | % | | | 2.14 | % | | | 2.14 | % | | | 2.05 | % |
After waivers and reimbursements of expenses(6)(7) | | | 1.51 | % | | | 1.51 | % | | | 1.51 | % | | | 1.50 | % | | | 1.64 | %(8) | | | 1.71 | % |
Ratio of net investment income (loss) to average net assets | | | | | | | | | | | | | | | | | | | | | | | | |
Before waivers and reimbursements of expenses(6) | | | (1.23 | )% | | | (2.00 | )% | | | (0.90 | )% | | | (0.83 | )% | | | (1.02 | )% | | | (1.02 | )% |
After waivers and reimbursements of expenses(6) | | | (0.24 | )% | | | 0.30 | % | | | 0.02 | % | | | (0.19 | )% | | | (0.52 | )% | | | (0.68 | )% |
Portfolio turnover rate(4) | | | 42.96 | % | | | 85.99 | % | | | 44.25 | % | | | 51.90 | % | | | 52.76 | % | | | 73.84 | % |
|
| |
The accompanying notes are an integral part of these financial statements.
42
Snow Capital Small Cap Value Fund - Class A
Financial Highlights (Continued)
Per Share Data for a Share Outstanding Throughout Each Period
| (1) | Per share net investment income (loss) was calculated using average shares outstanding. |
| (2) | Less than 0.05 cent per share. |
| (3) | Based on net asset value, which does not reflect the sales charge. |
| (4) | Not annualized for periods less than a year. |
| (5) | The expense ratio before waivers and reimbursements of expenses excluding interest expenses are 2.48%, 3.80%, 2.40%, 2.14%, 2.12% and 2.04% for the six months ended August 31, 2021 and the years ended February 28, 2021, February 29, 2020, February 28, 2019, February 28, 2018, and February 28, 2017, respectively. |
| (6) | Annualized for periods less than a year. |
| (7) | The expense ratio after waivers and reimbursements of expenses excluding interest expenses are 1.50%, 1.50%, 1.50%, 1.50%, 1.62% and 1.70% for the six months ended August 31, 2021 and the years ended February 28, 2021, February 29, 2020, February 28, 2019, February 28, 2018, and February 28, 2017, respectively. |
| (8) | Effective October 1, 2017, the operating expense limit was reduced by 0.20%. |
The accompanying notes are an integral part of these financial statements.
43
Snow Capital Small Cap Value Fund - Class C
Financial Highlights
Per Share Data for a Share Outstanding Throughout Each Period
| | | | | | | | | | | | | | | | | | | | | | | | |
| | | For the
Six Months Ended
August 31, 2021
(Unaudited) | | | Year Ended
February 28,
2021 | | | Year Ended
February 29,
2020 | | | Year Ended
February 28,
2019 | | | Year Ended
February 28,
2018 | | | Year Ended
February 28,
2017 | |
Net Asset Value, Beginning of Period | | $ | 40.54 | | | $ | 24.48 | | | $ | 29.51 | | | $ | 30.48 | | | $ | 29.05 | | | $ | 22.58 | |
| | | | | | | | | | | | | | | | | | | | | | | | |
| | | | | | |
Income from investment operations: | | | | | | | | | | | | | | | | | | | | | | | | |
Net investment income (loss)(1) | | | (0.22 | ) | | | (0.10 | ) | | | (0.21 | ) | | | (0.29 | ) | | | (0.36 | ) | | | (0.38 | ) |
Net realized and unrealized gain (loss) on investments | | | 3.25 | | | | 16.16 | | | | (4.82 | ) | | | (0.68 | ) | | | 1.79 | | | | 6.85 | |
| | | | | | | | | | | | | | | | | | | | | | | | |
Total from Investment Operations | | | 3.03 | | | | 16.06 | | | | (5.03 | ) | | | (0.97 | ) | | | 1.43 | | | | 6.47 | |
| | | | | | | | | | | | | | | | | | | | | | | | |
Paid-in capital from redemption fees (Note 2) | | | — | | | | — | | | | — | | | | — | | | | — | | | | 0.00 | (2) |
| | | | | | | | | | | | | | | | | | | | | | | | |
Net Asset Value, End of Period | | $ | 43.57 | | | $ | 40.54 | | | $ | 24.48 | | | $ | 29.51 | | | $ | 30.48 | | | $ | 29.05 | |
| | | | | | | | | | | | | | | | | | | | | | | | |
Total Return(3)(4) | | | 7.47 | % | | | 65.60 | % | | | -17.05 | % | | | -3.18 | % | | | 4.92 | % | | | 28.65 | % |
| | | | | | | | | | | | | | | | | | | | | | | | |
| | | | | | |
Supplemental Data and Ratios: | | | | | | | | | | | | | | | | | | | | | | | | |
Net Assets at End of Period (000’s Omitted) | | $ | 1,733 | | | $ | 1,746 | | | $ | 2,695 | | | $ | 4,294 | | | $ | 5,230 | | | $ | 8,394 | |
Ratio of expenses to average net assets | | | | | | | | | | | | | | | | | | | | | | | | |
Before waivers and reimbursements of expenses(5)(6) | | | 3.24 | % | | | 4.63 | % | | | 3.16 | % | | | 2.89 | % | | | 2.89 | % | | | 2.73 | % |
After waivers and reimbursements of expenses(6)(7) | | | 2.25 | % | | | 2.26 | % | | | 2.26 | % | | | 2.25 | % | | | 2.39 | %(6) | | | 2.46 | % |
Ratio of net investment income loss to average net assets | | | | | | | | | | | | | | | | | | | | | | | | |
Before waivers and reimbursements of expenses(6) | | | (2.02 | )% | | | (2.80 | )% | | | (1.64 | )% | | | (1.58 | )% | | | (1.77 | )% | | | (1.71 | )% |
After waivers and reimbursements of expenses(6) | | | (1.03 | )% | | | (0.43 | )% | | | (0.73 | )% | | | 0.94 | % | | | (1.27 | )% | | | (1.44 | )% |
Portfolio turnover rate(4) | | | 42.96 | % | | | 85.99 | % | | | 44.25 | % | | | 51.90 | % | | | 52.76 | % | | | 73.84 | % |
|
| |
The accompanying notes are an integral part of these financial statements.
44
Snow Capital Small Cap Value Fund - Class C
Financial Highlights (Continued)
Per Share Data for a Share Outstanding Throughout Each Period
| (1) | Per share net investment income (loss) was calculated using average shares outstanding. |
| (2) | Less than 0.05 cent per share. |
| (3) | Based on net asset value, which does not reflect the sales charge. |
| (4) | Not annualized for periods less than a year. |
| (5) | The expense ratio before waivers and reimbursements of expenses excluding interest expenses are 3.24%, 4.62%, 3.15%, 2.89%, 2.87% and 2.72% for the six months ended August 31, 2021 and the years ended February 28, 2021, February 29, 2020, February 28, 2019, February 28, 2018, and February 28, 2017, respectively. |
| (6) | Annualized for periods less than a year. |
| (7) | The expense ratio after waivers and reimbursements of expenses excluding interest expenses are 2.25%, 2.25%, 2.25%, 2.25%, 2.37% and 2.45% for the six months ended August 31, 2021 and the years ended February 28, 2021, February 29, 2020, February 28, 2019, February 28, 2018, and February 28, 2017, respectively. |
| (8) | Effective October 1, 2017, the operating expense limit was reduced by 0.20%. |
The accompanying notes are an integral part of these financial statements.
45
Snow Capital Small Cap Value Fund - Institutional Class
Financial Highlights
Per Share Data for a Share Outstanding Throughout Each Period
| | | | | | | | | | | | | | | | | | | | | | | | |
| | | For the
Six Months Ended
August 31, 2021
(Unaudited) | | | Year Ended
February 28,
2021 | | | Year Ended
February 29,
2020 | | | Year Ended
February 28,
2019 | | | Year Ended
February 28,
2018 | | | Year Ended
February 28,
2017 | |
Net Asset Value, Beginning of Period | | $ | 45.23 | | | $ | 27.05 | | | $ | 32.28 | | | $ | 33.00 | | | $ | 31.14 | | | $ | 23.96 | |
| | | | | | | | | | | | | | | | | | | | | | | | |
| | | | | | |
Income from investment operations: | | | | | | | | | | | | | | | | | | | | | | | | |
Net investment income (loss)(1) | | | (0.01 | ) | | | 0.15 | | | | 0.09 | | | | 0.02 | | | | (0.08 | ) | | | (0.12 | ) |
Net realized and unrealized gain (loss) on investments | | | 3.64 | | | | 18.03 | | | | (5.32 | ) | | | (0.74 | ) | | | 1.94 | | | | 7.30 | |
| | | | | | | | | | | | | | | | | | | | | | | | |
Total from Investment Operations | | | 3.63 | | | | 18.18 | | | | (5.23 | ) | | | (0.72 | ) | | | 1.86 | | | | 7.18 | |
| | | | | | | | | | | | | | | | | | | | | | | | |
Paid-in capital from redemption fees (Note 2) | | | 0.00 | (2) | | | 0.00 | (2) | | | 0.00 | (2) | | | 0.00 | (2) | | | 0.00 | (2) | | | 0.00 | (2) |
| | | | | | | | | | | | | | | | | | | | | | | | |
Net Asset Value, End of Period | | $ | 48.86 | | | $ | 45.23 | | | $ | 27.05 | | | $ | 32.28 | | | $ | 33.00 | | | $ | 31.14 | |
| | | | | | | | | | | | | | | | | | | | | | | | |
Total Return(3)(4) | | | 8.03 | % | | | 67.21 | % | | | -16.20 | % | | | -2.21 | % | | | 6.01 | % | | | 29.97 | % |
| | | | | | | | | | | | | | | | | | | | | | | | |
| | | | | | |
Supplemental Data and Ratios: | | | | | | | | | | | | | | | | | | | | | | | | |
Net Assets at End of Period (000’s Omitted) | | $ | 11,360 | | | $ | 7,926 | | | $ | 7,679 | | | $ | 14,839 | | | $ | 19,220 | | | $ | 28,201 | |
Ratio of expenses to average net assets | | | | | | | | | | | | | | | | | | | | | | | | |
Before waivers and reimbursements of expenses(5)(6) | | | 2.24 | % | | | 3.58 | % | | | 2.16 | % | | | 1.89 | % | | | 1.89 | % | | | 1.80 | % |
After waivers and reimbursements of expenses(6)(7) | | | 1.26 | % | | | 1.26 | % | | | 1.26 | % | | | 1.25 | % | | | 1.39 | %(6) | | | 1.46 | % |
Ratio of net investment income (loss) to average net assets | | | | | | | | | | | | | | | | | | | | | | | | |
Before waivers and reimbursements of expenses(6) | | | (1.02 | )% | | | (1.78 | )% | | | (0.63 | )% | | | (0.57 | )% | | | (0.77 | )% | | | (0.77 | )% |
After waivers and reimbursements of expenses(6) | | | (0.03 | )% | | | 0.54 | % | | | 0.27 | % | | | 0.07 | % | | | (0.27 | )% | | | (0.43 | )% |
Portfolio turnover rate(4) | | | 42.96 | % | | | 85.99 | % | | | 44.25 | % | | | 51.90 | % | | | 52.76 | % | | | 73.84 | % |
|
| |
The accompanying notes are an integral part of these financial statements.
46
Snow Capital Small Cap Value Fund - Institutional Class
Financial Highlights (Continued)
Per Share Data for a Share Outstanding Throughout Each Period
| (1) | Per share net investment income (loss) was calculated using average shares outstanding. |
| (2) | Less than 0.05 cent per share. |
| (3) | Based on net asset value, which does not reflect the sales charge. |
| (4) | Not annualized for periods less than a year. |
| (5) | The expense ratio before waivers and reimbursements of expenses excluding interest expenses are 2.23%, 3.57%, 2.15%, 1.88%, 1.88% and 1.79% for the six months ended August 31, 2021 and the years ended February 28, 2021, February 29, 2020, February 28, 2019, February 28, 2018, and February 28, 2017, respectively. |
| (6) | Annualized for periods less than a year. |
| (7) | The expense ratio after waivers and reimbursements of expenses excluding interest expenses are 1.25%, 1.25%, 1.25%, 1.25%, 1.37% and 1.45% for the six months ended August 31, 2021 and the years ended February 28, 2021, February 29, 2020, February 28, 2019, February 28, 2018, and February 28, 2017, respectively. |
| (8) | Effective October 1, 2017, the operating expense limit was reduced by 0.20%. |
The accompanying notes are an integral part of these financial statements.
47
Snow Capital Long/Short Opportunity Fund - Class A
Financial Highlights
Per Share Data for a Share Outstanding Throughout Each Period
| | | | | | | | | | | | | | | | | | | | | | | | |
| | | For the
Six Months Ended
August 31, 2021
(Unaudited) | | | Year Ended
February 28,
2021 | | | Year Ended
February 29,
2020 | | | Year Ended
February 28,
2019 | | | Year Ended
February 28,
2018 | | | Year Ended
February 28,
2017 | |
Net Asset Value, Beginning of Period | | $ | 31.48 | | | $ | 25.42 | | | $ | 26.07 | | | $ | 26.95 | | | $ | 26.55 | | | $ | 18.61 | |
| | | | | | | | | | | | | | | | | | | | | | | | |
| | | | | | |
Income from investment operations: | | | | | | | | | | | | | | | | | | | | | | | | |
Net investment income(1) | | | 0.08 | | | | 0.16 | | | | 0.27 | | | | 0.31 | | | | 0.32 | | | | 0.99 | |
Net realized and unrealized gain (loss) on investments | | | 2.80 | | | | 6.32 | | | | (0.44 | ) | | | (0.77 | ) | | | 1.33 | | | | 6.95 | |
| | | | | | | | | | | | | | | | | | | | | | | | |
Total from Investment Operations | | | 2.88 | | | | 6.48 | | | | (0.17 | ) | | | (0.46 | ) | | | 1.65 | | | | 7.94 | |
| | | | | | | | | | | | | | | | | | | | | | | | |
| | | | | | |
Less Distributions: | | | | | | | | | | | | | | | | | | | | | | | | |
From investment loss | | | — | | | | (0.42 | ) | | | (0.48 | ) | | | (0.42 | ) | | | (1.25 | ) | | | — | |
| | | | | | | | | | | | | | | | | | | | | | | | |
Total Distributions to Shareholders | | | — | | | | (0.42 | ) | | | (0.48 | ) | | | (0.42 | ) | | | (1.25 | ) | | | — | |
| | | | | | | | | | | | | | | | | | | | | | | | |
Paid-in capital from redemption fees (Note 2) | | | — | | | | — | | | | 0.00 | (2) | | | — | | | | 0.00 | (2) | | | — | |
| | | | | | | | | | | | | | | | | | | | | | | | |
Net Asset Value, End of Period | | $ | 34.36 | | | $ | 31.48 | | | $ | 25.42 | | | $ | 26.07 | | | $ | 26.95 | | | $ | 26.55 | |
| | | | | | | | | | | | | | | | | | | | | | | | |
Total Return(3)(4) | | | 9.15 | % | | | 25.71 | % | | | -0.85 | % | | | -1.55 | % | | | 6.12 | % | | | 42.59 | % |
| | | | | | | | | | | | | | | | | | | | | | | | |
| | | | | | |
Supplemental Data and Ratios: | | | | | | | | | | | | | | | | | | | | | | | | |
Net Assets at End of Period (000’s Omitted) | | $ | 50,084 | | | $ | 46,551 | | | $ | 51,478 | | | $ | 64,079 | | | $ | 72,100 | | | $ | 79,907 | |
Ratio of expenses to average net assets | | | | | | | | | | | | | | | | | | | | | | | | |
Before waivers, reimbursements and recoupments of expenses(5)(6) | | | 1.72 | % | | | 2.04 | % | | | 1.70 | % | | | 1.57 | % | | | 1.58 | %(9) | | | 1.58 | % |
After waivers, reimbursements and recoupments of expenses(6)(7) | | | 1.73 | % | | | 2.00 | % | | | 1.70 | % | | | 1.57 | % | | | 1.58 | %(9) | | | 1.58 | % |
Ratio of net investment income (loss) to average net assets | | | | | | | | | | | | | | | | | | | | | | | | |
Before waivers, reimbursements and recoupments of expenses(8) | | | 0.47 | % | | | 0.59 | % | | | 0.98 | % | | | 1.15 | % | | | 1.18 | % | | | 4.26 | % |
After waivers, reimbursements and recoupments of expenses(8) | | | 0.46 | % | | | 0.63 | % | | | 0.98 | % | | | 1.15 | % | | | 1.18 | % | | | 4.26 | % |
Portfolio turnover rate(4) | | | 27.32 | % | | | 74.07 | % | | | 53.97 | % | | | 37.64 | % | | | 71.53 | % | | | 83.56 | % |
|
| |
The accompanying notes are an integral part of these financial statements.
48
Snow Capital Long/Short Opportunity Fund - Class A
Financial Highlights (Continued)
Per Share Data for a Share Outstanding Throughout Each Period
| (1) | Per share net investment income (loss) was calculated using average shares outstanding. |
| (2) | Less than 0.05 cent per share. |
| (3) | Based on net asset value, which does not reflect the sales charge. |
| (4) | Not annualized for periods less than a year. |
| (5) | The expense ratio before waivers, reimbursements and recoupments of expenses excluding dividends and interest expenses are 1.51%, 1.59%, 1.41%, 1.41%, 1.50% and 1.54% for the six months ended August 31, 2021 and the years ended February 28, 2021, February 29, 2020, February 28, 2019, February 28, 2018, and February 28, 2017, respectively. |
| (6) | Annualized for periods less than a year. |
| (7) | The expense ratio after waivers, reimbursements and recoupments of expenses excluding dividends and interest expenses are 1.52%, 1.55%, 1.41%, 1.41%, 1.50% and 1.54% for the six months ended August 31, 2021 and the years ended February 28, 2021, February 29, 2020, February 28, 2019, February 28, 2018, and February 28, 2017, respectively. |
| (8) | The net investment income ratios include dividends on short positions and interest expense. |
| (9) | Effective October 1, 2017, the operating expense limit was reduced by 0.20%. |
The accompanying notes are an integral part of these financial statements.
49
Snow Capital Long/Short Opportunity Fund - Class C
Financial Highlights
Per Share Data for a Share Outstanding Throughout Each Period
| | | | | | | | | | | | | | | | | | | | | | | | |
| | | For the
Six Months Ended
August 31, 2021
(Unaudited) | | | Year Ended
February 28,
2021 | | | Year Ended
February 29,
2020 | | | Year Ended
February 28,
2019 | | | Year Ended
February 28,
2018 | | | Year Ended
February 28,
2017 | |
Net Asset Value, Beginning of Period | | $ | 29.75 | | | $ | 23.85 | | | $ | 24.36 | | | $ | 25.11 | | | $ | 24.74 | | | $ | 17.47 | |
| | | | | | | | | | | | | | | | | | | | | | | | |
| | | | | | |
Income from investment operations: | | | | | | | | | | | | | | | | | | | | | | | | |
Net investment income (loss)(1) | | | (0.03 | ) | | | (0.03 | ) | | | 0.07 | | | | 0.10 | | | | 0.12 | | | | 0.77 | |
Net realized and unrealized gain (loss) on investments | | | 2.65 | | | | 5.93 | | | | (0.44 | ) | | | (0.70 | ) | | | 1.22 | | | | 6.50 | |
| | | | | | | | | | | | | | | | | | | | | | | | |
Total from Investment Operations | | | 2.62 | | | | 5.90 | | | | (0.37 | ) | | | (0.60 | ) | | | 1.34 | | | | 7.27 | |
| | | | | | | | | | | | | | | | | | | | | | | | |
| | | | | | |
Less Distributions: | | | | | | | | | | | | | | | | | | | | | | | | |
From investment loss | | | — | | | | — | | | | (0.14 | ) | | | (0.15 | ) | | | (0.97 | ) | | | — | |
| | | | | | | | | | | | | | | | | | | | | | | | |
Total Distributions to Shareholders | | | — | | | | — | | | | (0.14 | ) | | | (0.15 | ) | | | (0.97 | ) | | | — | |
| | | | | | | | | | | | | | | | | | | | | | | | |
Paid-in capital from redemption fees (Note 2) | | | — | | | | — | | | | — | | | | — | | | | 0.00 | (2) | | | — | |
| | | | | | | | | | | | | | | | | | | | | | | | |
Net Asset Value, End of Period | | $ | 32.37 | | | $ | 29.75 | | | $ | 23.85 | | | $ | 24.36 | | | $ | 25.11 | | | $ | 24.74 | |
| | | | | | | | | | | | | | | | | | | | | | | | |
Total Return(3)(4) | | | 8.81 | % | | | 24.74 | % | | | -1.58 | % | | | -2.29 | % | | | 5.31 | % | | | 41.53 | % |
| | | | | | | | | | | | | | | | | | | | | | | | |
| | | | | | |
Supplemental Data and Ratios: | | | | | | | | | | | | | | | | | | | | | | | | |
Net Assets at End of Period (000’s Omitted) | | $ | 3,812 | | | $ | 3,938 | | | $ | 9,744 | | | $ | 16,735 | | | $ | 20,597 | | | $ | 28,286 | |
Ratio of expenses to average net assets | | | | | | | | | | | | | | | | | | | | | | | | |
Before waivers, reimbursements and recoupments of expenses(5)(6) | | | 2.35 | % | | | 2.79 | % | | | 2.45 | % | | | 2.32 | % | | | 2.33 | %(9) | | | 2.33 | % |
After waivers, reimbursements and recoupments of expenses(6)(7) | | | 2.36 | % | | | 2.75 | % | | | 2.45 | % | | | 2.32 | % | | | 2.33 | %(9) | | | 2.33 | % |
Ratio of net investment income (loss) to average net assets | | | | | | | | | | | | | | | | | | | | | | | | |
Before waivers, reimbursements and recoupments of expenses(8) | | | (0.16 | )% | | | (0.18 | )% | | | 0.25 | % | | | 0.40 | % | | | 0.50 | % | | | 3.53 | % |
After waivers, reimbursements and recoupments of expenses(8) | | | (0.17 | )% | | | (0.14 | )% | | | 0.25 | % | | | 0.40 | % | | | 0.50 | % | | | 3.53 | % |
Portfolio turnover rate(4) | | | 27.32 | % | | | 74.07 | % | | | 53.97 | % | | | 37.64 | % | | | 71.53 | % | | | 83.56 | % |
|
| |
The accompanying notes are an integral part of these financial statements.
50
Snow Capital Long/Short Opportunity Fund - Class C
Financial Highlights (Continued)
Per Share Data for a Share Outstanding Throughout Each Period
| (1) | Per share net investment income (loss) was calculated using average shares outstanding. |
| (2) | Less than 0.05 cent per share. |
| (3) | Based on net asset value, which does not reflect the sales charge. |
| (4) | Not annualized for periods less than a year. |
| (5) | The expense ratio before waivers, reimbursements and recoupments of expenses excluding dividends and interest expenses are 2.14%, 2.34%, 2.16%, 2.16%, 2.25% and 2.29% for the six months ended August 31, 2021 and the years ended February 28, 2021, February 29, 2020, February 28, 2019, February 28, 2018, and February 28, 2017, respectively. |
| (6) | Annualized for periods less than a year. |
| (7) | The expense ratio after waivers, reimbursements and recoupments of expenses excluding dividends and interest expenses are 2.15%, 2.30%, 2.16%, 2.16%, 2.25% and 2.29% for the six months ended August 31, 2021 and the years ended February 28, 2021, February 29, 2020, February 28, 2019, February 28, 2018, and February 28, 2017, respectively. |
| (8) | The net investment income ratios include dividends on short positions and interest expense. |
| (9) | Effective October 1, 2017, the operating expense limit was reduced by 0.20%. |
The accompanying notes are an integral part of these financial statements.
51
Snow Capital Long/Short Opportunity Fund - Institutional Class
Financial Highlights
Per Share Data for a Share Outstanding Throughout Each Period
| | | | | | | | | | | | | | | | | | | | | | | | |
| | | For the
Six Months Ended
August 31, 2021
(Unaudited) | | | Year Ended
February 28,
2021 | | | Year Ended
February 29,
2020 | | | Year Ended
February 28,
2019 | | | Year Ended
February 28,
2018 | | | Year Ended
February 28,
2017 | |
Net Asset Value, Beginning of Period | | $ | 31.76 | | | $ | 25.68 | | | $ | 26.34 | | | $ | 27.24 | | | $ | 26.83 | | | $ | 18.83 | |
| | | | | | | | | | | | | | | | | | | | | | | | |
| | | | | | |
Income from investment operations: | | | | | | | | | | | | | | | | | | | | | | | | |
Net investment income(1) | | | 0.12 | | | | 0.22 | | | | 0.34 | | | | 0.37 | | | | 0.38 | | | | 1.05 | |
Net realized and unrealized gain (loss) on investments | | | 2.83 | | | | 6.39 | | | | (0.44 | ) | | | (0.78 | ) | | | 1.35 | | | | 7.04 | |
| | | | | | | | | | | | | | | | | | | | | | | | |
Total from Investment Operations | | | 2.95 | | | | 6.61 | | | | (0.10 | ) | | | (0.41 | ) | | | 1.73 | | | | 8.09 | |
| | | | | | | | | | | | | | | | | | | | | | | | |
| | | | | | |
Less Distributions: | | | | | | | | | | | | | | | | | | | | | | | | |
From investment loss | | | — | | | | (0.53 | ) | | | (0.56 | ) | | | (0.49 | ) | | | (1.32 | ) | | | (0.09 | ) |
| | | | | | | | | | | | | | | | | | | | | | | | |
Total Distributions to Shareholders | | | — | | | | (0.53 | ) | | | (0.56 | ) | | | (0.49 | ) | | | (1.32 | ) | | | (0.09 | ) |
| | | | | | | | | | | | | | | | | | | | | | | | |
Paid-in capital from redemption fees (Note 2) | | | — | | | | 0.00 | (2) | | | 0.00 | (2) | | | — | | | | 0.00 | (2) | | | 0.00 | (2) |
| | | | | | | | | | | | | | | | | | | | | | | | |
Net Asset Value, End of Period | | $ | 34.71 | | | $ | 31.76 | | | $ | 25.68 | | | $ | 26.34 | | | $ | 27.24 | | | $ | 26.83 | |
| | | | | | | | | | | | | | | | | | | | | | | | |
Total Return(3)(4) | | | 9.29 | % | | | 26.00 | % | | | -0.60 | % | | | -1.30 | % | | | 6.37 | % | | | 43.00 | % |
| | | | | | | | | | | | | | | | | | | | | | | | |
| | | | | | |
Supplemental Data and Ratios: | | | | | | | | | | | | | | | | | | | | | | | | |
Net Assets at End of Period (000’s Omitted) | | $ | 47,740 | | | $ | 45,372 | | | $ | 44,559 | | | $ | 70,730 | | | $ | 96,661 | | | $ | 108,727 | |
Ratio of expenses to average net assets | | | | | | | | | | | | | | | | | | | | | | | | |
Before waivers, reimbursements and recoupments of expenses(5)(6) | | | 1.47 | % | | | 1.79 | % | | | 1.45 | % | | | 1.32 | % | | | 1.33 | %(9) | | | 1.33 | % |
After waivers, reimbursements and recoupments of expenses(6)(7) | | | 1.48 | % | | | 1.75 | % | | | 1.45 | % | | | 1.32 | % | | | 1.33 | % | | | 1.33 | % |
Ratio of net investment income (loss) to average net assets | | | | | | | | | | | | | | | | | | | | | | | | |
Before waivers, reimbursements and recoupments of expenses(8) | | | 0.72 | % | | | 0.79 | % | | | 1.24 | % | | | 1.40 | % | | | 1.41 | % | | | 4.47 | % |
After waivers, reimbursements and recoupments of expenses(8) | | | 0.71 | % | | | 0.83 | % | | | 1.24 | % | | | 1.40 | % | | | 1.41 | % | | | 4.47 | % |
Portfolio turnover rate(4) | | | 27.32 | % | | | 74.07 | % | | | 53.97 | % | | | 37.64 | % | | | 71.53 | % | | | 83.56 | % |
|
| |
The accompanying notes are an integral part of these financial statements.
52
Snow Capital Long/Short Opportunity Fund - Institutional Class
Financial Highlights (Continued)
Per Share Data for a Share Outstanding Throughout Each Period
| (1) | Per share net investment income (loss) was calculated using average shares outstanding. |
| (2) | Less than 0.05 cent per share. |
| (3) | Based on net asset value, which does not reflect the sales charge. |
| (4) | Not annualized for periods less than a year. |
| (5) | The expense ratio before waivers, reimbursements and recoupments of expenses excluding dividends and interest expenses are 1.26%, 1.34%, 1.16%, 1.16%, 1.25% and 1.29% for the six months ended August 31, 2021 and the years ended February 28, 2021, February 29, 2020, February 28, 2019, February 28, 2018, and February 28, 2017, and February 29, 2016, respectively. |
| (6) | Annualized for periods less than a year. |
| (7) | The expense ratio after waivers, reimbursements and recoupments of expenses excluding dividends and interest expenses are 1.27%, 1.30%, 1.16%, 1.16%, 1.25% and 1.29% for the six months ended August 31, 2021 and the years ended February 28, 2021, February 29, 2020, February 28, 2019, February 28, 2018, and February 28, 2017, and February 29, 2016, respectively. |
| (8) | The net investment income ratios include dividends on short positions and interest expense. |
| (9) | Effective October 1, 2017, the operating expense limit was reduced by 0.20%. |
The accompanying notes are an integral part of these financial statements.
53
Snow Capital Family of Funds
Notes to Financial Statements
August 31, 2021
Trust for Professional Managers (the “Trust”) was organized as a Delaware statutory trust under a Declaration of Trust dated May 29, 2001. The Trust is registered under the Investment Company Act of 1940, as amended (the “1940 Act”), as an open-end management investment company. Each of the Snow Capital Family of Funds (the “Funds”) represents a distinct portfolio with its own investment objective and policies within the Trust. The investment objective of the Snow Capital Long/Short Opportunity Fund is long-term capital appreciation and protection of investment principal. The investment objective of the Snow Capital Small Cap Value Fund is long-term capital appreciation. The Trust may issue an unlimited number of shares of beneficial interest at $0.001 par value. The assets of the Trust are segregated, and a shareholder’s interest is limited to the Fund(s) in which shares are held. The Trust has designated three classes of Fund shares: Class A, Class C and Institutional Class. The classes differ principally in their respective distribution expense arrangements as well as their respective sales charge arrangements. All classes of shares have identical rights to earnings, assets and voting privileges, except for class-specific expenses and exclusive rights to vote on matters affecting only individual classes. Class A shares are subject to an initial maximum sales charge of 5.25% imposed at the time of purchase. The sales charge declines as the amount purchased increases in accordance with the Funds’ current prospectus. Class A shares are subject to a contingent deferred sales charge of 0.50% for purchases made at the $1,000,000 breakpoint that are redeemed within twelve months of purchase. Class C shares are subject to a contingent deferred sales charge for redemptions made within twelve months of purchase, in accordance with the Funds’ current prospectus. The contingent deferred sales charge is 1.00% of the lesser of the original purchase price or the value of shares being redeemed. Institutional Class shares are no-load shares. The Snow Capital Long/Short Opportunity Fund became effective and commenced operations on April 28, 2006. Prior to June 28, 2018, the Snow Capital Long/Short Opportunity Fund was named the “Snow Capital Opportunity Fund.” The Snow Capital Small Cap Value Fund became effective and commenced operations on November 30, 2010. Costs incurred in connection with the organization, registration and the initial public offering of shares were paid by Snow Capital Management L.P. the Funds’ predecessor investment adviser. Easterly Investment Partners LLC (the “Adviser”) serves as the Funds’ investment adviser.
54
The Funds are investment companies and accordingly follow the investment company accounting and reporting guidance of the Financial Accounting Standards Board (FASB) Accounting Standard Codification Topic 946 “Financial Services—Investment Companies”.
| (2) | Significant Accounting Policies |
The following is a summary of significant accounting policies consistently followed by the Funds in the preparation of the financial statements. These policies are in conformity with accounting principles generally accepted in the United States of America (“GAAP”).
Each equity security owned by a Fund that is listed on a securities exchange, except those securities listed on the NASDAQ Stock Market LLC (“NASDAQ”), is valued at its last sale price on that exchange at the close of the exchange on the date as of which assets are valued. If the security is listed on more than one exchange, a Fund will use the price of the exchange that the Fund generally considers to be the principal exchange on which the security is traded.
Fund securities listed on NASDAQ will be valued at the NASDAQ Official Closing Price, which may not necessarily represent the last sale price. If there has been no sale on such exchange or on NASDAQ on such day, the security is valued at the mean between the most recent quoted bid and asked prices at the close of the exchange on such day or at the latest sale price on the “composite market” for the day such security is being valued. The composite market is defined as the consolidation of the trade information provided by national securities and foreign exchanges and over-the-counter markets as published by an approved independent pricing service (“Pricing Service”).
Debt securities, including short-term debt instruments having a maturity of 60 days or less, are valued at the mean in accordance with prices supplied by a Pricing Service. Pricing Services may use various valuation methodologies such as the mean between the bid and the asked prices, matrix pricing and other analytical pricing models as well as market transactions and dealer quotations. If a price is not available from a Pricing Service, the most recent quotation obtained from one or more broker-dealers known to follow the issue will be obtained. Quotations will be valued at the mean between the bid and the offer. In the absence of available quotations, the security will be priced at fair value in accordance with the procedures approved by the Trust’s Board of Trustees (the “Board”). Any discount or premium is accreted or amortized using the constant yield to maturity method. Constant yield amortization takes into account the income that is produced on a debt security. This accretion/amortization type utilizes the discount rate used in
55
computing the present value of all future principal and interest payments made by a debt instrument and produces an amount equal to the cost of the debt instrument.
Money market funds, demand notes and repurchase agreements are valued at cost. If cost does not represent current market value the securities will be priced at fair value.
Redeemable securities issued by open-end, registered investment companies are valued at the net asset values (“NAVs”) of such companies for purchase and/or redemption orders placed on that day. If, on a particular day, a share of an investment company is not listed on NASDAQ, such security’s fair value will be determined. All exchange-traded funds are valued at the last reported sale price on the exchange on which the security is principally traded. In the event market quotations are not readily available, such security will be valued at its fair value.
If market quotations are not readily available, any security or other financial instrument is valued at its fair value as determined under fair value pricing procedures approved by the Board. These fair value pricing procedures will also be used to price a security when corporate events, events in the securities market and/or world events cause the Adviser to believe that a security’s last sale price may not reflect its actual market value. The intended effect of using fair value pricing procedures is to ensure that the Funds are accurately priced. The Board will regularly evaluate whether the Funds’ fair value pricing procedures continue to be appropriate in light of the specific circumstances of each Fund and the quality of prices obtained through application of such procedures by the Trust’s valuation committee.
FASB Accounting Standards Codification, “Fair Value Measurement” Topic 820 (“ASC 820”), establishes an authoritative definition of fair value and sets out a hierarchy for measuring fair value. ASC 820 requires an entity to evaluate certain factors to determine whether there has been a significant decrease in volume and level of activity for the security such that recent transactions and quoted prices may not be determinative of fair value and further analysis and adjustment may be necessary to estimate fair value. ASC 820 also requires enhanced disclosure regarding the inputs and valuation techniques used to measure fair value in those instances as well as expanded disclosure of valuation levels for major security types. These inputs are summarized in the three broad levels listed below:
| | • | | Level 1 – Quoted prices in active markets for identical securities. |
| | • | | Level 2 – Other significant observable inputs (including quoted prices for similar securities, interest rates, prepayment speeds, credit risk, etc.). |
| | • | | Level 3 – Significant unobservable inputs (including the Funds’ own assumptions in determining the fair value of investments). |
56
The inputs or methodology used for valuing securities are not necessarily an indication of the risk associated with investing in those securities. The Funds held no Level 3 securities throughout the six months ended August 31, 2021. The following is a summary of the inputs used to value the Funds’ investments carried at fair value as of August 31, 2021.
| | | | | | | | | | | | | | | | |
Snow Capital Small Cap Value Fund | |
| | | | |
| | | Level 1 | | | Level 2 | | | Level 3 | | | Total | |
Assets: | | | | | | | | | | | | | | | | |
Common Stocks(1) | | $ | 22,101,500 | | | $ | — | | | $ | — | | | $ | 22,101,500 | |
Money Market Funds | | | 412,943 | | | | — | | | | — | | | | 412,943 | |
| | | | |
Total Assets | | $ | 22,514,443 | | | $ | — | | | $ | — | | | $ | 22,514,443 | |
| | | | |
|
| |
|
Snow Capital Long/Short Opportunity Fund | |
| | | | |
| | | Level 1 | | | Level 2 | | | Level 3 | | | Total | |
Assets: | | | | | | | | | | | | | | | | |
Common Stocks(1) | | $ | 88,538,030 | | | $ | — | | | $ | — | | | $ | 88,538,030 | |
Purchased Options | | | 199,875 | | | | | | | | — | | | | 199,875 | |
Exchange-Traded Funds | | | 1,069,128 | | | | — | | | | — | | | | 1,069,128 | |
Money Market Funds | | | 9,733,204 | | | | — | | | | — | | | | 9,733,204 | |
| | | | |
Total Assets | | $ | 99,540,237 | | | $ | — | | | $ | — | | | $ | 99,540,237 | |
| | | | |
Liabilities: | | | | | | | | | | | | | | | | |
Securities Sold Short(2) | | $ | (10,241,894 | ) | | $ | — | | | $ | — | | | $ | (10,241,894 | ) |
| | | | |
Written Options | | $ | (499,498 | ) | | $ | (179,895 | ) | | $ | — | | | $ | (679,393 | ) |
| | | | |
Total Liabilities | | $ | (10,741,392 | ) | | $ | (179,895 | ) | | $ | — | | | $ | (10,921,287 | ) |
| | | | |
|
| |
| (1) | See the Schedules of Investments for industry classifications. |
| (2) | See the Schedule of Securities Sold Short for industry classifications. |
The Snow Capital Small Cap Value Fund did not hold derivative instruments during the period presented.
The Snow Capital Long/Short Opportunity Fund used put and call options during the period presented. The Fund may use certain options and futures contracts and options on futures contracts (collectively, “Derivative Instruments”) as a substitute for a comparable market position in the underlying security, to attempt to hedge or limit the exposure of the Fund’s position in an equity security.
57
Options and futures prices can diverge from the prices of their underlying instruments. Options and futures prices are affected by such factors as current and anticipated short-term interest rates, changes in volatility of the underlying instrument and the time remaining until expiration of the contract, which may not affect security prices the same way. Imperfect or no correlation also may result from differing levels of demand in the options and futures markets and the securities markets, from structural differences in how options and futures and securities are traded and from imposition of daily price fluctuation limits or trading halts.
Snow Capital Long/Short Opportunity Fund
The fair value of derivative instruments as reported within the Statement of Assets and Liabilities as of August 31, 2021:
| | | | | | | | | | | | | | | | |
| | | Asset Derivatives | | | Liability Derivatives | |
Derivatives not accounted
for as hedging instruments | | Statement of
Assets &
Liabilities
Location | | | Value | | | Statement of
Assets &
Liabilities
Location | | | Value | |
Equity Contracts—Options | |
| Investments,
at value |
| | $ | 199,875 | | |
| Options
written,
at value |
| | $ | (679,393 | ) |
| | | | | | | | | | | | | | | | |
Total | | | | | | $ | 199,875 | | | | | | | $ | (679,393 | ) |
| | | | | | | | | | | | | | | | |
| | | | | | | | | | | | | | | | | |
The effect of derivative instruments on the income for the six months ended August 31, 2021 was as follows:
| | | | | | | | | | | | |
Amount of Realized Gain or (Loss) on Derivatives
Recognized in Income | |
Derivatives not accounted
for as hedging instruments | | Purchased Options | | | Written Options | | | Total | |
Equity Contracts | | $ | (101,133 | ) | | $ | 266,999 | | | $ | 165,866 | |
| | | | | | | | | | | | |
Total | | $ | (101,133 | ) | | $ | 266,999 | | | $ | 165,866 | |
| | | | | | | | | | | | |
| | | | | | | | | | | | | |
58
| | | | | | | | | | | | |
Change in Unrealized Appreciation or (Depreciation) on Derivatives
Recognized in Income | |
Derivatives not accounted
for as hedging instruments | | Purchased Options | | | Written Options | | | Total | |
Equity Contracts | | $ | (144,723 | ) | | $ | 513,906 | | | $ | 369,183 | |
| | | | | | | | | | | | |
Total | | $ | (144,723 | ) | | $ | 513,906 | | | $ | 369,183 | |
| | | | | | | | | | | | |
| | | | | | | | | | | | | |
The average monthly notional amount outstanding for purchased and written options during the six months ended August 31, 2021 were $6,258,406 and $(23,725,293), respectively.
The Fund is not subject to any Master Netting Arrangements, therefore the Fund did not offset any assets or liabilities.
The Snow Capital Long/Short Opportunity Fund may purchase and write call or put options on securities and indices and enter into related closing transactions. As a holder of a call option, the Fund has the right, but not the obligation, to purchase a security at the exercise price during the exercise period. As the writer of a call option, the Fund has the obligation to sell the security at the exercise price during the exercise period. As a holder of a put option, the Fund has the right, but not the obligation, to sell a security at the exercise price during the exercise period. As the writer of a put option, the Fund has the obligation to buy the underlying security at the exercise price during the exercise period.
The premium that the Fund pays when purchasing an option or receives when writing an option will reflect, among other things, the relationship of the exercise price to the market price of the security, the relationship of the exercise price to the volatility of the security, the length of the option period, current interest rates and supply and demand factors. The premium is the market value of an option at the time the contract trade is executed.
A purchaser (holder) of a put option pays a non-refundable premium to the seller (writer) of a put option to obtain the right to sell a specified amount of a security at a fixed price (the exercise price) during a specified period (exercise period). Conversely, the seller (writer) of a put option, upon payment by the holder of the premium, has the obligation to buy the security from the holder of the put option at the exercise price during the exercise period.
Exchange traded options are valued at the composite price, using the National Best Bid and Offer quotes (“NBBO”). NBBO consists of the highest bid price and lowest ask price across any of the exchanges on which
59
an option is quoted, thus providing a view across the entire U.S. options marketplace. Specifically, composite pricing looks at the last trades on the exchanges where the options are traded. If there are no trades for the option on a given business day, composite option pricing calculates the mean of the highest bid price and lowest ask price across the exchanges where the option is traded.
The Snow Capital Long/Short Opportunity Fund may sell a security it does not own in anticipation of a decline in the fair value of that security. When the Fund sells a security short, it must borrow the security sold short and deliver it to the broker-dealer through which it made the short sale. A gain, limited to the price at which the Fund sold the security short, or a loss, unlimited in size, will be recognized upon the termination of a short sale. For financial statement purposes, an amount equal to the settlement amount is included in the Statement of Assets and Liabilities as a liability. The amount of the liability is subsequently marked to market to reflect the current value of the short positions. Subsequent fluctuations in the market prices of the securities sold, but not yet purchased, may require purchasing the securities at prices which could differ from the amount reflected in the Statement of Assets and Liabilities. The Fund is liable for any dividends or interest payable on securities while those securities are in a short position. Such amounts are recorded on the ex-dividend date as dividend or interest expense. As collateral for its short positions, the Fund is required under the 1940 Act to maintain segregated assets consisting of cash, cash equivalents or liquid securities. The segregated assets are valued consistent with Note 2a above. The amount of segregated assets is required to be adjusted daily to reflect changes in the fair value of the securities sold short.
Each Fund complies with the requirements of Subchapter M of the Internal Revenue Code of 1986, as amended (the “Code”), necessary to qualify as a regulated investment company and makes the requisite distributions of income and capital gains to its shareholders sufficient to relieve it from all or substantially all federal income taxes. Therefore, no federal income tax provision has been provided.
| | (e) | Distributions to Shareholders |
The Funds will distribute any net investment income and any net realized long- or short-term capital gains at least annually. Distributions from net realized gains for book purposes may include short-term capital gains. All short-term capital gains are included in ordinary income for tax purposes. Distributions to shareholders are recorded on the ex-dividend date. The
60
Funds may also pay a special distribution at the end of the calendar year to comply with federal tax requirements.
The amount of the dividends from net investment income and distributions from net realized gains are determined in accordance with federal income tax regulations, which may differ from GAAP. The differences are either temporary or permanent in nature. To the extent these differences are permanent in nature, such amounts are reclassified within the composition of net assets based on their federal tax-basis treatment.
The preparation of financial statements in conformity with GAAP requires management to make estimates and assumptions that affect the reported amounts of assets and liabilities and disclosure of contingent assets and liabilities at the date of the financial statements and the reported amounts of revenues and expenses during the reporting period. Actual results could differ from those estimates.
The NAV per share of each Fund is calculated by dividing the sum of the value of the securities held by the Fund, plus cash or other assets, minus all liabilities (including estimated accrued expenses) by the total number of shares outstanding for the Fund, rounded to the nearest cent.
The Funds’ shares will not be priced on the days on which the New York Stock Exchange (“NYSE”) is closed for trading. The Funds charge a 0.50% redemption fee on shares held thirty days or less. These fees are deducted from the redemption proceeds otherwise payable to the shareholder. The Funds will retain the fee charged as an increase in paid-in capital and such fees become part of the Funds’ daily NAV calculation.
Redemption fees were charged by the Funds as follows:
| | | | | | | | |
| | | Six Months Ended
August 31, 2021 | | | Year Ended
February 28, 2021 | |
Snow Capital Small Cap Value Fund | | $ | 330 | | | $ | 524 | |
Snow Capital Long/Short Opportunity Fund | | $ | — | | | $ | 11 | |
| | | | | | | | | |
Expenses associated with a specific fund in the Trust are charged to that fund. Common expenses are typically allocated evenly between the funds of
61
the Trust or by other equitable means. Expenses directly attributable to a class of shares, which presently only include 12b-l distribution and service fees, are recorded to the specific class.
Investment transactions are recorded on the trade date. The Funds determine the gain or loss from investment transactions on the identified cost basis by comparing the original cost of the security lot sold with the net sale proceeds. Dividend income is recognized on the ex-dividend date and interest income is recognized on an accrual basis.
The tax character of distributions paid was as follows:
| | | | | | | | |
| | | Year Ended
February 28, 2021 | | | Year Ended
February 29, 2020 | |
Snow Capital Small Cap Value Fund | | | | | | | | |
Ordinary Income | | $ | — | | | $ | — | |
Long Term Capital Gain | | $ | — | | | $ | — | |
Snow Capital Long/Short Opportunity Fund | | | | | | | | |
Ordinary Income | | $ | 1,352,961 | | | $ | 2,031,014 | |
Long Term Capital Gain | | $ | — | | | $ | — | |
| | | | | | | | | |
As of February 28, 2021, the components of accumulated earnings on a tax basis were as follows:
| | | | | | | | |
| | | Snow Capital
Small Cap Value
Fund | | | Snow Capital
Long/Short
Opportunity
Fund | |
Cost basis of investment for Federal income tax purposes | | $ | 15,012,054 | | | $ | 68,872,760 | |
| | | | | | | | |
Gross tax unrealized appreciation | | | 4,759,287 | | | | 20,642,896 | |
Gross tax unrealized depreciation | | | (820,145 | ) | | | (4,316,381 | ) |
| | | | | | | | |
Net tax unrealized appreciation | | | 3,939,142 | | | | 16,326,515 | |
| | | | | | | | |
Undistributed ordinary income | | | 22,068 | | | | 559,120 | |
Undistributed long-term capital gain | | | — | | | | — | |
| | | | | | | | |
Total distributable earnings | | | 22,068 | | | | 559,120 | |
| | | | | | | | |
Other accumulated losses | | | (5,934,206 | ) | | | (1,683,511 | ) |
| | | | | | | | |
Total accumulated earnings (losses) | | | (1,972,996 | ) | | | 15,202,124 | |
| | | | | | | | |
| | |
62
The difference between book basis and tax basis of investments is attributable to deferral of losses on wash sales. The cost basis of investment for Federal income tax purposes for Snow Capital Long/Short Opportunity Fund includes a reduction of $8,062,809 and $1,473,135 for short securities and written options, respectively.
On the Statements of Assets and Liabilities, the following adjustments were made for permanent tax adjustment:
| | | | | | | | |
| | | Total
Distributable
Earnings (losses) | | | Paid In
Capital | |
Snow Capital Small Cap Value Fund | | $ | — | | | $ | — | |
Snow Capital Long/Short Opportunity Fund | | $ | (17 | ) | | $ | 17 | |
| | |
At February 28, 2021, the following Funds had capital losses remaining, which will be carried forward indefinitely to offset future realized capital gains. To the extent a Fund realizes future net capital gains, taxable distributions to its shareholders will be first offset by any unused capital loss carryovers from the year ended February 28, 2021.
| | | | | | | | |
| | | Short-term | | | Long-term | |
Snow Capital Small Cap Value Fund | | $ | — | | | $ | 5,934,206 | |
Snow Capital Long/Short Opportunity Fund | | $ | — | | | $ | 1,590,983 | |
| | |
The Funds had no material uncertain tax positions and have not recorded a liability for unrecognized tax benefits as of February 28, 2021. Also, the Funds have not recognized interest and penalties related to uncertain tax benefits in fiscal 2021. At February 28, 2021, fiscal years 2018 through 2021 for both Funds remain open to examination in the Funds’ major tax jurisdictions.
The Trust has entered into an Interim Investment Advisory Agreement (the “Agreement”) with the Adviser to furnish investment advisory services to the Funds. Under the terms of the Agreement, the Trust, on behalf of the Funds, compensates the Adviser for its management services at the following annual rates based on each Fund’s average daily net assets.
| | | | |
| | |
| | | Rate | |
Snow Capital Small Cap Value Fund | | | 0.95 | % |
Snow Capital Long/Short Opportunity Fund | | | 0.80 | % |
| | | | | |
63
The Adviser has agreed to waive its management fees and/or reimburse a Fund’s other expenses at least through the expiration dates listed below, to the extent necessary to ensure that each Fund’s total annual operating expenses (exclusive of front-end or contingent deferred sales loads, Rule 12b-1 plan fees, shareholder servicing plan fees, taxes, leverage expenses, interest, brokerage commissions and other transactional expenses, acquired fund fees and expenses, dividends or interest expense on short positions, expenses incurred in connection with any merger or reorganization or extraordinary expenses such as litigation) do not exceed the Expense Caps as follows:
| | | | | | |
| | | Expense
Cap | | | Expiration
Date |
Snow Capital Small Cap Value Fund | | | 1.25 | % | | November 28, 2021 |
Snow Capital Long/Short Opportunity Fund | | | 1.30 | % | | November 28, 2021 |
| | | | |
Any such waiver or reimbursement is subject to later adjustment to allow the Adviser to recoup amounts waived or reimbursed to the extent actual fees and expenses for a fiscal period do not exceed the lesser of: (1) the Expense Cap in place at the time of the waiver or reimbursement or (2) the Expense Cap in place at the time of recoupment; provided, however, that the Adviser shall only be entitled to recoup such amounts over the following three year period from the date of the waiver or reimbursement. During the period ended August 31, 2021, the Adviser recouped previously waived expenses of $5,003 related to the Snow Capital Long/Short Opportunity Fund. The following table details the remaining waived or reimbursed expenses subject to potential recovery expiring:
| | | | | | | | |
| | | Snow Capital
Small Cap
Value Fund | | | Snow Capital
Long/Short
Opportunity
Fund | |
February 28, 2022 | | $ | 121,115 | | | $ | — | |
February 29, 2023 | | $ | 251,464 | | | $ | — | |
February 28, 2024 | | $ | 305,449 | | | $ | 34,027 | |
August 31, 2025 | | $ | 124,570 | | | $ | — | |
| | | | | | |
| (5) | Distribution and Shareholder Servicing Plan |
The Trust has adopted a plan pursuant to Rule 12b-1 under the 1940 Act (the “12b-1 Plan”), on behalf of the Funds, which authorizes it to pay Quasar Distributors, LLC (the “Distributor”), the Funds’ distributor, a distribution fee of 0.25% and 0.75% of each Fund’s average daily net assets of Class A and Class C shares, respectively, for services to prospective Fund shareholders and the distribution of Fund shares, and 0.25% of each Fund’s average daily net assets of Class C shares for
64
shareholder servicing, as applicable. During the six months ended August 31, 2021, the Funds accrued expenses pursuant to the 12b-1 Plan as follows:
| | | | | | | | |
| | | 12b-1 Fees | | | Shareholder
Servicing Fees | |
Snow Capital Small Cap Value Fund | | | | | | | | |
Class A | | $ | 12,552 | | | | N/A | |
Class C | | $ | 6,976 | | | $ | 2,325 | |
Snow Capital Long/Short Opportunity Fund | | | | | | | | |
Class A | | $ | 63,296 | | | | N/A | |
Class C | | $ | 15,028 | | | $ | 2,584 | |
| | | | | | |
| (6) | Related Party Transactions |
U.S. Bancorp Fund Services, LLC (doing business as U.S. Bank Global Fund Services) (“Fund Services”) acts as the Funds’ Administrator and Fund Accountant under an Administration Agreement. The Administrator prepares various federal and state regulatory filings, reports and returns for the Funds; prepares reports and materials to be supplied to the Trustees; monitors the activities of the Funds’ custodian, transfer agent and accountants; coordinates the preparation and payment of the Funds’ expenses and reviews the Funds’ expense accruals. Fund Services also serves as the transfer agent to the Funds. U.S. Bank, N.A. (“US Bank”), an affiliate of Fund Services, serves as each Fund’s custodian. Fees incurred for the six months ended August 31, 2021, and owed as of August 31, 2021, are as follows:
| | | | | | | | |
| Administration and Accounting | | Incurred | | | Owed | |
Snow Capital Small Cap Value Fund | | | 63,020 | | | | 28,728 | |
Snow Capital Long/Short Opportunity Fund | | | 94,044 | | | | 46,287 | |
| | | | | | | | | |
| | | | | | | | |
| Transfer Agency(1) | | Incurred | | | Owed | |
Snow Capital Small Cap Value Fund | | | 26,956 | | | | 13,008 | |
Snow Capital Long/Short Opportunity Fund | | | 39,192 | | | | 20,578 | |
| | | | | | | | | |
| | (1) | This amount does not include sub-transfer agency fees, and therefore it does not agree to the amount on the Statement of Operations for the Small Cap Value and Long/Short Opportunity Funds. |
| | | | | | | | |
| Custody | | Incurred | | | Owed | |
Snow Capital Small Cap Value Fund | | | 3,680 | | | | 1,893 | |
Snow Capital Long/Short Opportunity Fund | | | 6,072 | | | | 2,770 | |
| | | | | | | | | |
65
The Small Cap Value and Long/Short Opportunity Funds each have a line of credit with US Bank (see Note 9).
Certain officers of the Funds are also employees of Fund Services. A Trustee of the Trust is affiliated with Fund Services and US Bank.
The Trust’s Chief Compliance Officer is also an employee of Fund Services. Each Fund’s allocation of the Trust’s Chief Compliance Officer fee incurred for the six months ended August 31, 2021, and owed as of August 31, 2021, are as follows:
| | | | | | | | |
| | | Incurred | | | Owed | |
Snow Capital Small Cap Value Fund | | | 6,256 | | | | 3,133 | |
Snow Capital Long/Short Opportunity Fund | | | 6,256 | | | | 3,130 | |
| | | | | | | | | |
| (7) | Capital Share Transactions |
Transactions in shares of the Funds were as follows:
| | | | | | | | |
Snow Capital Small Cap Value Fund – Class A Shares | | Six Months Ended
August 31, 2021 | | | Year Ended
February 28, 2021 | |
Shares sold | | | 1,249 | | | | 27,625 | |
Shares reinvested | | | — | | | | — | |
Shares redeemed | | | (3,469 | ) | | | (199,738 | ) |
| | | | | | | | |
Net decrease | | | (2,220 | ) | | | (172,113 | ) |
| | | | | | | | |
| | | | | | | | | |
| | | | | | | | |
Snow Capital Small Cap Value Fund – Class C Shares | | Six Months Ended
August 31, 2021 | | | Year Ended
February 28, 2021 | |
Shares sold | | | 375 | | | | 869 | |
Shares reinvested | | | — | | | | — | |
Shares redeemed | | | (3,667 | ) | | | (67,888 | ) |
| | | | | | | | |
Net decrease | | | (3,292 | ) | | | (67,019 | ) |
| | | | | | | | |
| | | | | | | | | |
66
| | | | | | | | |
Snow Capital Small Cap Value Fund – Institutional Class Shares | | Six Months Ended
August 31, 2021 | | | Year Ended
February 28, 2021 | |
Shares sold | | | 189,125 | | | | 51,272 | |
Shares reinvested | | | — | | | | — | |
Shares redeemed | | | (131,868 | ) | | | (159,938 | ) |
| | | | | | | | |
Net decrease | | | 57,257 | | | | (108,666 | ) |
| | | | | | | | |
| | | | | | | | | |
| | | | | | | | |
Snow Capital Long/Short Opportunity Fund Class A Shares | | Six Months Ended
August 31, 2021 | | | Year Ended
February 28, 2021 | |
Shares sold | | | 3,248 | | | | 162,377 | |
Shares reinvested | | | — | | | | 4,641 | |
Shares redeemed | | | (24,249 | ) | | | (713,237 | ) |
| | | | | | | | |
Net decrease | | | (21,001 | ) | | | (546,219 | ) |
| | | | | | | | |
| | | | | | | | | |
| | | | | | | | |
Snow Capital Long/Short Opportunity Fund Class C Shares | | Six Months Ended
August 31, 2021 | | | Year Ended
February 28, 2021 | |
Shares sold | | | 136 | | | | 87 | |
Shares reinvested | | | — | | | | — | |
Shares redeemed | | | (14,715 | ) | | | (276,270 | ) |
| | | | | | | | |
Net decrease | | | (14,579 | ) | | | (276,183 | ) |
| | | | | | | | |
| | | | | | | | | |
| | | | | | | | |
Snow Capital Long/Short Opportunity Fund Institutional Class Shares | | Six Months Ended
August 31, 2021 | | | Year Ended
February 28, 2021 | |
Shares sold | | | 3,548 | | | | 20,619 | |
Shares reinvested | | | — | | | | 22,449 | |
Shares redeemed | | | (56,582 | ) | | | (349,790 | ) |
| | | | | | | | |
Net decrease | | | (53,034 | ) | | | (306,722 | ) |
| | | | | | | | |
| | | | | | | | | |
67
| (8) | Investment Transactions |
Purchases and sales of investment securities (excluding short-term instruments) for the six months ended August 31, 2021 are summarized below.
| | | | | | | | |
| | | Snow
Capital
Small Cap
Value
Fund | | | Snow
Capital
Long/Short
Opportunity
Fund | |
Purchases: | | | | | | | | |
U.S. Government | | $ | — | | | $ | — | |
Other | | $ | 12,457,634 | | | $ | 24,788,041 | |
Sales: | | | | | | | | |
U.S. Government | | $ | — | | | $ | — | |
Other | | $ | 10,245,335 | | | $ | 29,081,519 | |
| | | | | | | | | |
At August 31, 2021, the Snow Capital Small Cap Value Fund and the Snow Capital Long/Short Opportunity Fund each had a line of credit with a maximum amount of borrowing for the lesser of $1,500,000 and $8,000,000, respectively, or 33% of unencumbered assets maturing August 6, 2022. These unsecured lines of credit are intended to provide short-term financing, if necessary, subject to certain restrictions, in connection with shareholder redemptions. The credit facility is with the Funds’ custodian, U.S. Bank. Interest was accrued at the prime rate of 3.25%. There were no loans outstanding at period end. The following table provides information regarding the usage of the line of credit during the six months ended August 31, 2021.
| | | | | | | | | | | | | | | | | | |
| | | | | | |
| | | Days
Utilized | | | Average
Amount of
Borrowing | | | Interest
Expense* | | | Maximum
Amount of
Borrowing | | | Date of
Maximum
Borrowing |
Snow Capital Small Cap Value Fund | | | 20 | | | $ | 430,800 | | | $ | 778 | | | $ | 1,401,000 | | | 7/13/2021 |
| | | | | | | | | | | | | | | | | | | |
| | * | Interest expense is reported on the Statement of Operations. |
U.S. and international markets have experienced volatility in recent months and years due to a number of economic, political and global macro factors, including the impact of the coronavirus (COVID-19) global pandemic, which resulted in a
68
public health crisis, business interruptions, growth concerns in the U.S. and overseas, travel restrictions, changed social behaviors, rising inflation and reduced consumer spending. While several countries, including the U.S., have begun to lift public health restrictions in efforts to reopen their respective economies, the outbreak of the Delta variant has led to the renewal of health mandates by local governments and businesses, reduced hiring efforts by employers, event cancellations and additional travel restrictions, supply chain shortages, cessation of return-to-office plans and an overall economic slowdown. While U.S. and global economies are recovering from the effects of COVID-19, the recovery is proceeding at slower than expected rates and may last for a prolonged period of time. These developments as well as other events could result in further market volatility and negatively affect financial asset prices, the liquidity of certain securities and the normal operations of securities exchanges and other markets. As a result, the risk environment remains elevated. The Adviser will monitor developments and seek to manage the Fund in a manner consistent with achieving the Fund’s investment objective, but there can be no assurance that it will be successful in doing so.
On June 30, 2021, Foreside Financial Group, LLC (“FFG”), the parent company of Foreside Fund Services, LLC (“Foreside”), the Funds’ distributor, and Lovell Minnick Partners, LLC (“LMP”) entered into a definitive purchase and sale agreement with Genstar Capital (“Genstar”), a private equity firm specializing in financial and related business services companies. Genstar will acquire a majority stake in FFG, and LMP will exit its investment in FFG. The transaction closed September 30, 2021. The Board has approved Foreside to remain the Funds’ distributor after the close of the transaction.
69
Results of Shareholder Meeting
A Joint Special Meeting of Shareholders of the Funds was held October 27, 2021 at the principal executive offices of Trust for Professional Managers, LLC, 615 East Michigan Avenue, 2nd Floor, Milwaukee, Wisconsin, pursuant to notice given to all shareholders of record of the Funds at the close of business on September 2, 2021. At the Special Meeting, shareholders were asked to approve Proposal One and Two for each Fund:
Proposal One: To approve an Agreement and Plan of Reorganization (the “Agreement”) that provides for the reorganization of each Target Fund into a corresponding, newly-created series of James Alpha Funds Trust d/b/a Easterly Funds Trust (“Easterly Funds Trust”) as set forth in the chart below (each, an “Acquiring Fund,” and collectively, the “Acquiring Funds”), including: (i) the transfer of all of the assets of the Target Fund to the Acquiring Fund solely in exchange for shares of the Acquiring Fund and the assumption by the Acquiring Fund of all of the liabilities of the Target Fund, (ii) the distribution of shares of the Acquiring Fund to shareholders of the Target Fund in complete liquidation of the Target Fund; and (iii) the cancellation of the outstanding shares of the Target Fund (all of the foregoing being referred to each as, a “Reorganization,” and together, the “Reorganizations”).
The tabulation of the shareholder votes rendered the following results:
| | | | | | | | | | | | |
| | | Votes For | | | Votes Against | | | Abstained | |
Snow Capital Long/Short Opportunity Fund | | | 1,733,244 | | | | 4,369 | | | | 20,772 | |
Snow Capital Small Cap Value Fund | | | 239,917 | | | | 651 | | | | 2,234 | |
| | | | | | | | | | | | | |
Proposal Two: To approve the interim investment advisory agreement between Easterly Investment Partners LLC (“Easterly”) and TPM, on behalf of each Target Fund (the “Interim Advisory Agreement”).
The tabulation of the shareholder votes rendered the following results:
| | | | | | | | | | | | |
| | | Votes For | | | Votes Against | | | Abstained | |
Snow Capital Long/Short Opportunity Fund | | | 1,733,244 | | | | 4,369 | | | | 20,772 | |
Snow Capital Small Cap Value Fund | | | 240,196 | | | | 651 | | | | 1,955 | |
| | | | | | | | | | | | | |
Accordingly, Proposal One and Two has been approved by the shareholders of each Fund.
70
Basis for Trustees’ Approval of Interim Investment Advisory Agreement
The Board of Trustees (the “Trustees”) of Trust for Professional Managers (the “Trust”) met on June 23, 2021 to consider the approval of an Interim Investment Advisory Agreement (the “Agreement”) between the Trust, on behalf of the Snow Capital Small Cap Value Fund (the “Small Cap Value Fund”) and the Snow Long/Short Opportunity Fund (the “Long/Short Opportunity Fund”) (each, a “Fund,” and together, the “Funds”), each a series of the Trust, and Easterly Investment Partners LLC, the Funds’ proposed investment adviser (the “Adviser”) under Rule 15a-4 of the Investment Company Act of 1940, as amended. Prior to the meeting, the Trustees requested and received materials to assist them in considering the approval of the Agreement. The materials provided contained information with respect to the factors enumerated below, including a copy of the Agreement, a memorandum prepared by the Trust’s outside legal counsel discussing in detail the Trustees’ fiduciary obligations and the factors they should assess in considering the approval of the Agreement, detailed comparative information relating to the Funds’ performance, as well as the management fees and other expenses of the Funds, due diligence materials relating to the Adviser (including a due diligence questionnaire completed on behalf of the Funds by the Adviser, the Adviser’s Form ADV, select financial statements of the Adviser, bibliographic information of the Adviser’s key management and compliance personnel, comparative fee information for the Funds and the Adviser’s other separately-managed accounts and a summary detailing key provisions of the Adviser’s written compliance program, including its code of ethics) and other pertinent information. Based on their evaluation of the information provided by the Adviser, in conjunction with the Funds’ other service providers, the Trustees, by a unanimous vote (including a separate vote of the Trustees who are not “interested persons,” as that term is defined in the Investment Company Act of 1940, as amended (the “Independent Trustees”)), approved the Agreement for a period no longer than 150 days.
DISCUSSION OF FACTORS CONSIDERED
In considering the approval of the Agreement and reaching their conclusions, the Trustees reviewed and analyzed various factors that they determined were relevant, including the factors enumerated below.
| 1. | NATURE, EXTENT AND QUALITY OF SERVICES TO BE PROVIDED TO THE FUNDS |
The Trustees considered the nature, extent and quality of services provided by the Adviser to the Funds and the amount of time devoted to each Fund’s affairs by the Adviser’s staff. The Trustees considered the Adviser’s specific responsibilities in all aspects of day-to-day management of each Fund, as well as the qualifications, experience and responsibilities of
71
Basis for Trustees’ Approval of Interim Investment Advisory Agreement (Continued)
each Fund’s portfolio managers, and other key personnel at the Adviser, who would continue to be involved in the day-to-day activities of each Fund. The Trustees reviewed the information provided by the Adviser in a due diligence questionnaire, including the structure of the Adviser’s compliance program and discussed the Adviser’s proposed marketing activities and its commitment to the Funds. The Trustees also noted any services that extended beyond portfolio management, and they considered the overall capability of the Adviser. The Trustees noted that the Trust’s chief compliance officer concluded that the Adviser’s written compliance policies and procedures, as required by Rule 206(4)-7 under the Investment Advisers Act of 1940, as amended, are reasonably designed to prevent violations of the federal securities laws. The Trustees noted that the Trust’s chief compliance officer further concluded that the Adviser’s compliance program appears to adequately address the major areas of risk associated with the current advisory business. The Trustees also considered the Adviser’s overall financial condition, as well as the implementation and operational effectiveness of the Adviser’s business continuity plan in response to the novel coronavirus (COVID-19) pandemic and challenges to day-to-day operations in a predominately work-from-home environment. The Trustees concluded that the Adviser had sufficient quality and depth of personnel, resources, investment methods and compliance policies and procedures essential to performing its duties under the Interim Investment Advisory Agreement and that the nature, overall quality and extent of the management services provided to the Funds, as well as the Adviser’s compliance program, were satisfactory and reliable.
| 2. | INVESTMENT PERFORMANCE OF THE ADVISER AND THE FUNDS |
In assessing the portfolio management services to be provided by the Adviser, the Trustees considered the investment management experience of each Fund’s portfolio managers (who will continue to serve as portfolio managers for the Funds with the Adviser) and discussed the performance of the Institutional Class shares of each Fund for the quarter, one-year, three-year, five-year, ten-year and since inception periods ended March 31, 2021. In assessing the quality of the portfolio management services to be delivered by the Adviser, the Trustees also compared the short-term and longer-term performance of the Institutional Class shares of the Funds on both an absolute basis and in comparison to benchmark indexes (the Russell 3000 Value Index and the 70% Russell 3000 Value Total Return/30% ICE BofA Merrill Lynch 3-Month U.S. Treasury Bill Blend Index for the Snow Capital Long/Short Opportunity Fund, and the Russell 2000 Value Index for the Snow Capital Small Cap Value Fund), and in comparison to a peer group of funds in each Fund’s current Morningstar category as constructed by data presented by Morningstar Direct (a peer group of U.S. open-end long-short equity funds for the Snow Capital Long/Short Opportunity Fund, and a peer group of U.S. open-end small value funds for the Snow Capital Small Cap Value Fund
72
Basis for Trustees’ Approval of Interim Investment Advisory Agreement (Continued)
(each, “Morningstar Peer Group”). The Trustees also reviewed information on the historical performance of other separately-managed accounts that were similar to the Snow Capital Small Cap Value Fund in terms of investment strategies. The Trustees noted that the Adviser did not manage any other accounts with the same or similar investment strategies as the Snow Capital Long/Short Opportunity Fund.
The Trustees noted the Snow Capital Long/Short Opportunity Fund’s performance for Institutional Class shares for each of the quarter, one-year, three-year, five-year, ten-year and since inception periods ended March 31, 2021 was above the Morningstar Peer Group median. The Trustees further noted that the Institutional Class shares of the Snow Capital Long/Short Opportunity Fund outperformed the Russell 3000 Value Index for each of the quarter, one-year and five-year periods ended March 31, 2021, and underperformed the Index for each of the three-year, ten-year and since inception periods ended March 31, 2021. The Trustees noted that the Institutional Class shares of the Snow Capital Long/Short Opportunity Fund outperformed the 70% Russell 3000 Value Total Return/30% ICE BofA Merrill Lynch 3-Month U.S. Treasury Bill Blend Index for each of the quarter, one-year, three-year and five-year periods ended March 31, 2021, and underperformed the Index for the ten-year and since inception periods ended March 31, 2021.
The Trustees noted the Snow Capital Small Cap Value Fund’s performance for Institutional Class shares for each of the quarter, one-year, three-year, five-year, ten-year and since inception periods ended March 31, 2021 was above the Morningstar Peer Group median. The Trustees further noted that the Institutional Class shares of the Snow Capital Small Cap Value Fund outperformed the Russell 2000 Value Index for the quarter, one-year and three-year periods ended March 31, 2021, and underperformed the Index for the five-year, ten-year and since inception periods ended March 31, 2021. The Trustees also observed that the Snow Capital Small Cap Value Fund’s performance was generally in-line with the performance of the comparable separately-managed account composite for all periods reviewed.
After considering all of the information, the Trustees concluded that although past performance is not a guarantee or indication of future results, the Trustees determined that each Fund and its shareholders were likely to benefit from the Adviser’s management.
| 3. | COSTS OF SERVICES PROVIDED AND PROFITS REALIZED TO BE BY THE ADVISER |
The Trustees considered the cost of services and the structure of the Adviser’s fees, including a review of the expense analyses and other pertinent material with respect to
73
Basis for Trustees’ Approval of Interim Investment Advisory Agreement (Continued)
each Fund. The Trustees reviewed the related statistical information and other materials provided, including the comparative expenses, expense components and peer group selections. The Trustees considered the cost structure of each Fund relative to its Morningstar Peer Group, and the Adviser’s separately-managed accounts (with respect to the Snow Capital Small Cap Value Fund), as well as the potential fee waivers and expense reimbursements of the Adviser. The Trustees noted the Interim Investment Advisory Agreement with the Adviser contained the identical fee structure as the existing investment advisory agreement between Snow Capital Management L.P. and the Trust, on behalf of the Funds. The Trustees further noted the Adviser had agreed to waive advisory fees and/or reimburse expenses of each Fund for the period that the Interim Investment Advisory Agreement is in place under an interim operating expense limitation agreement between the Adviser and the Trust, on behalf of the Funds.
The Trustees also considered the overall profitability of the Adviser and reviewed relevant financial information of the Adviser. The Trustees also examined the level of profits to be realized by the Adviser from the fees payable under the Interim Investment Advisory Agreement. These considerations were based on materials requested by the Trustees and the Funds’ administrator in advance of the Meeting.
The Trustees noted that the contractual management fee of 0.95% for the Snow Capital Small Cap Value Fund ranked above the Morningstar Peer Group average of 0.86%. The Trustees further noted that the contractual management fee of 0.80% for the Snow Capital Long/Short Opportunity Fund ranked below the Morningstar Peer Group average of 1.16%. The Trustees also observed that the Snow Capital Small Cap Value Fund’s total expense ratio (net of fee waivers and expense reimbursements and excluding the Fund’s Rule 12b-1 plan fee) of 1.25% ranked above the Morningstar Peer Group average of 1.12% (which excludes Rule 12b-1 plan fees). The Trustees further observed that the Snow Capital Long/Short Opportunity Fund’s total expense ratio (net of fee waivers and expense reimbursements and excluding the Fund’s Rule 12b-1 plan fee) of 1.46% ranked slightly above the Morningstar Peer Group average of 1.45% (which excludes Rule 12b-1 plan fees.) The Trustees also compared the fees paid by the Snow Capital Small Cap Value Fund to the fees paid by other separately-managed accounts that were similar to the Fund in terms of their underlying investment strategies.
The Trustees concluded that each Fund’s expenses and the proposed management fees to be paid to the Adviser under the Interim Investment Advisory Agreement were fair and reasonable in light of the comparative performance, expense and management fee information. The Trustees further concluded, based on a pro forma profitability analysis
74
Basis for Trustees’ Approval of Interim Investment Advisory Agreement (Continued)
prepared by the Adviser, that while each Fund would not be profitable to the Adviser in the short-term, the Adviser maintained adequate profit levels to support its services to each Fund from the revenues of its overall investment advisory business, despite potential subsidies to support each Fund’s operations.
| 4. | EXTENT OF ECONOMIES OF SCALE AS THE FUNDS GROW |
The Trustees compared each Fund’s expenses relative to its Morningstar Peer Group and discussed realized and potential economies of scale. The Trustees also reviewed the structure of each Fund’s management fee and whether each Fund is large enough to generate economies of scale for shareholders or whether economies of scale would be expected to be realized as Fund assets grow (and if so, how those economies of scale were being or would be shared with shareholders). The Trustees noted that each Fund’s management fee structure did not contain any breakpoint reductions as the Fund’s assets grow in size, but the feasibility of incorporating breakpoints would continue to be reviewed on a regular basis. With respect to the Adviser’s fee structure and any applicable expense waivers, the Trustees concluded the proposed fee structure under the Interim Investment Advisory Agreement was reasonable and reflects a sharing of economies of scale between the Adviser and each Fund at the current asset levels.
| 5. | BENEFITS DERIVED FROM THE RELATIONSHIP WITH THE FUNDS |
The Trustees considered the direct and indirect benefits that could be realized by the Adviser from its association with the Funds. The Trustees examined the brokerage practices of the Adviser. The Trustees concluded that the benefits the Adviser may receive, such as greater name recognition and increased ability to obtain research or brokerage services or attract additional investor assets, appear to be reasonable, and in many cases may benefit the Funds.
CONCLUSIONS
No single factor was determinative in the Board’s decision to approve the Interim Investment Advisory Agreement on behalf of each Fund, but rather the Board based its determination on the total mix of information available to the Trustees. Based on a consideration of all the factors in their totality, the Board determined that the Interim Investment Advisory Agreement with the Adviser, including the advisory fees to be paid thereunder, was fair and reasonable. The Board therefore determined that the approval of the Interim Investment Advisory Agreement would be in the best interest of each Fund and its shareholders.
75
Statement Regarding Liquidity Risk Management Program – Snow Capital Family of Funds
In accordance with Rule 22e-4 under the Investment Company Act of 1940, as amended, Trust for Professional Managers (the “Trust”) has adopted and implemented a liquidity risk management program (the “Trust Program”). As required under the Trust Program, Snow Capital Management L.P. (“Snow”), the prior investment adviser to the Snow Capital Long/Short Opportunity Fund and Snow Capital Small Cap Value Fund (the “Funds”), each a series of the Trust, adopted and implemented a liquidity risk management program tailored specifically to each Fund (the “Adviser Program”). The Adviser Program seeks to promote effective liquidity risk management for each Fund and to protect Fund shareholders from dilution of their interests. The Board of Trustees (the “Board”) of the Trust approved Snow as the administrator for the Adviser Program (the “Program Administrator”). The Program Administrator has further delegated administration of the Adviser Program to its Trading Committee (as may be constituted from time to time). The Program Administrator is required to provide a written annual report to the Board and the Trust’s chief compliance officer regarding the adequacy and effectiveness of the Adviser Program, including the operation of each Fund’s highly liquid investment minimum, if applicable, and any material changes to the Adviser Program.
On April 15, 2021, the Board reviewed the Program Administrator’s written annual report for the period January 1, 2020 through December 31, 2020 (the “Report”). The Report provided an assessment of each Fund’s liquidity risk: the risk that a Fund could not meet requests to redeem shares issued by a Fund without significant dilution of the remaining investors’ interests in the Fund. The Adviser Program assesses liquidity risk under both normal and reasonably foreseeable stressed market conditions. The Program Administrator has retained ICE Data Services, Inc., a third party vendor, to provide portfolio investment classification services, and the Report noted that each Fund primarily held investments that were classified as highly liquid during the review period. The Report noted that each Fund’s portfolio is expected to continue to primarily hold highly liquid investments and the determination that each Fund be designated as a “primarily highly liquid fund” (as defined in Rule 22e-4) remains appropriate and each Fund can therefore continue to rely on the exclusion in Rule 22e-4 from the requirements to determine and review a highly liquid investment minimum for the Funds and to adopt policies and procedures for responding to a highly liquid investment minimum shortfall. The Report noted that there were no breaches of the Fund’s restriction on holding illiquid investments exceeding 15% of its net assets during the review period. The Report confirmed that each Fund’s investment strategy was appropriate for an open-end management investment company. The Report also indicated that no material changes had been made to the Adviser Program during the review period.
The Program Administrator determined that each Fund is reasonably likely to be able to meet redemption requests without adversely affecting non-redeeming Fund shareholders through significant dilution. The Program Administrator concluded that the Adviser Program was adequately designed and effectively implemented during the review period.
76
Notice of Privacy Policy & Practices
We collect non-public personal information about you from the following sources:
| | • | | information we receive about you on applications or other forms; |
| | • | | information you give us orally; and |
| | • | | information about your transactions with us or others. |
We do not disclose any non-public personal information about our shareholders or former shareholders without the shareholder’s authorization, except as permitted by law or in response to inquiries from governmental authorities. We may share information with affiliated parties and unaffiliated third parties with whom we have contracts for servicing the Funds. We will provide unaffiliated third parties with only the information necessary to carry out their assigned responsibility. All shareholder records will be disposed of in accordance with applicable law. We maintain physical, electronic and procedural safeguards to protect your non-public personal information and require third parties to treat your non-public personal information with the same high degree of confidentiality.
In the event that you hold shares of the Funds through a financial intermediary, including, but not limited to, a broker-dealer, bank or trust company, the privacy policy of your financial intermediary would govern how your non-public personal information would be shared with unaffiliated third parties.
77
Snow Capital Family of Funds
Additional Information
(Unaudited)
Tax Information
For the fiscal year ended February 28, 2021, certain dividends paid by the Funds may be subject to a maximum tax rate of 20%, as provided for by the Jobs and Growth Tax Relief Reconciliation Act of 2003. The percentage of dividends declared from ordinary income designated as qualified dividend income was as follows:
| | | | |
Small Cap Value Fund | | | 0.00% | |
Long/Short Opportunity Fund | | | 100.00% | |
For corporate shareholders, the percent of ordinary income distributions qualifying for the corporate dividends received deduction for the fiscal year ended February 28, 2021 was as follows:
| | | | |
Small Cap Value Fund | | | 0.00% | |
Long/Short Opportunity Fund | | | 100.00% | |
For the year ended February 28, 2021, taxable ordinary income distributions are designated as short-term capital gain distributions under the Code Section 871(k)(2)(c) for the Funds as follows:
| | | | |
Small Cap Value Fund | | | 0.00% | |
Long/Short Opportunity Fund | | | 0.00% | |
Indemnification
Under the Trust’s organizational documents, its officers and Trustees are indemnified against certain liabilities arising out of the performance of their duties to the Funds. In addition, in the normal course of business, the Funds enter into contracts that provide general indemnifications to other parties. The Funds’ maximum exposure under these arrangements is unknown, as this would involve future claims that may be made against the Funds that have not yet occurred. However, the Funds have not had prior claims or losses pursuant to these contracts and expect the risk of loss to be remote.
Information about Trustees
The business and affairs of the Trust are managed under the direction of the Trust’s Board of Trustees. Information pertaining to the Trustees of the Trust is set forth below. The Funds’ Statement of Additional Information includes additional information about the Trustees and is available, without charge, upon request by calling 1-877-SNOWFND (877-766-9363).
78
Snow Capital Family of Funds
Additional Information (Continued)
(Unaudited)
Independent Trustees
| | | | | | | | | | |
Name, Address and
Year of Birth | | Position(s)
Held with
the Trust | | Term of
Office and
Length of
Time Served | | Number of
Portfolios
in the Trust
Overseen
by Trustee | | Principal
Occupation(s)
During the Past
Five Years | | Other
Directorships
Held by Trustee
During the Past
Five Years |
Michael D. Akers, Ph.D. 615 E. Michigan St. Milwaukee, WI 53202 Year of Birth: 1955 | | Trustee | | Indefinite Term; Since August 22, 2001 | | 25 | | Professor Emeritus, Department of Accounting (June 2019-present), Professor, Department of Accounting (2004-2019), Chair, Department of Accounting (2004-2017), Marquette University. | | Independent Trustee, USA MUTUALS (an open-end investment company) (2001-2021). |
| | | | | |
Gary A. Drska 615 E. Michigan St. Milwaukee, WI 53202 Year of Birth: 1956 | | Trustee | | Indefinite Term; Since August 22, 2001 | | 25 | | Pilot, Frontier/Midwest Airlines, Inc. (airline company) (1986-present). | | Independent Trustee, USA MUTUALS (an open-end investment company) (2001-2021). |
79
Snow Capital Family of Funds
Additional Information (Continued)
(Unaudited)
Interested Trustee and Officers
| | | | | | | | | | |
Name, Address and
Year of Birth | | Position(s)
Held with
the Trust | | Term of
Office and
Length of
Time Served | | Number of
Portfolios
in the Trust
Overseen
by Trustee | | Principal
Occupation(s)
During the Past
Five Years | | Other
Directorships
Held by Trustee
During the Past
Five Years |
Joseph C. Neuberger* 615 E. Michigan St. Milwaukee, WI 53202 Year of Birth: 1962 | | Chairperson and Trustee | | Indefinite Term; Since August 22, 2001 | | 25 | | President (2017-present), Chief Operating Officer (2016-2020), Executive Vice President (1994-2017), U.S. Bancorp Fund Services, LLC. | | Trustee, Buffalo Funds (an open-end investment company) (2003-2017), Trustee, USA MUTUALS (an open-end investment company) (2001-2018). |
| | | | | |
John P. Buckel 615 E. Michigan St. Milwaukee, WI 53202 Year of Birth: 1957 | | President and Principal Executive Officer | | Indefinite Term; Since January 24, 2013 | | N/A | | Vice President, U.S. Bancorp Fund Services, LLC (2004-present). | | N/A |
| | | | | |
Jennifer A. Lima 615 E. Michigan St. Milwaukee, WI 53202 Year of Birth: 1974 | | Vice President, Treasurer and Principal Financial and Accounting Officer | | Indefinite Term; Since January 24, 2013 | | N/A | | Vice President, U.S. Bancorp Fund Services, LLC (2002-present). | | N/A |
80
Snow Capital Family of Funds
Additional Information (Continued)
(Unaudited)
| | | | | | | | | | |
Name, Address and
Year of Birth | | Position(s)
Held with
the Trust | | Term of
Office and
Length of
Time Served | | Number of
Portfolios
in the Trust
Overseen
by Trustee | | Principal
Occupation(s)
During the Past
Five Years | | Other
Directorships
Held by Trustee
During the Past
Five Years |
Elizabeth B. Scalf 615 E. Michigan St. Milwaukee, WI 53202 Year of Birth: 1985 | | Chief Compliance Officer, Vice President and Anti-Money Laundering Officer | | Indefinite Term; Since July 1, 2017 | | N/A | | Senior Vice President, U.S. Bancorp Fund Services, LLC (February 2017-present); Vice President and Assistant CCO, Heartland Advisors, Inc. (December 2016-January 2017); Vice President and CCO, Heartland Group, Inc. (May 2016-November 2016); Vice President, CCO and Senior Legal Counsel (May 2016-November 2016), Assistant CCO and Senior Legal Counsel (January 2016-April 2016), Heartland Advisors, Inc. | | N/A |
| | | | | |
Jay S. Fitton 615 E. Michigan St. Milwaukee, WI 53202 Year of Birth: 1970 | | Secretary | | Indefinite Term; Since July 22, 2019 | | N/A | | Assistant Vice President, U.S. Bancorp Fund Services, LLC (2019-present); Partner, Practus, LLP (2018-2019); Counsel, Drinker Biddle & Reath LLP (2016-2018). | | N/A |
| | | | | |
Kelly A. Burns 615 E. Michigan St. Milwaukee, WI 53202 Year of Birth: 1987 | | Assistant Treasurer | | Indefinite Term; Since April 23, 2015 | | N/A | | Assistant Vice President, U.S. Bancorp Fund Services, LLC (2011-present). | | N/A |
| | | | | |
Melissa Aguinaga 615 E. Michigan St. Milwaukee, WI 53202 Year of Birth: 1987 | | Assistant Treasurer | | Indefinite Term; Since July 1, 2015 | | N/A | | Assistant Vice President, U.S. Bancorp Fund Services, LLC (2010-present). | | N/A |
| | | | | |
Laura A. Carroll 615 E. Michigan St. Milwaukee, WI 53202 Year of Birth: 1985 | | Assistant Treasurer | | Indefinite Term; Since August 20, 2018 | | N/A | | Assistant Vice President, U.S. Bancorp Fund Services, LLC (2007-present). | | N/A |
| * | Mr. Neuberger is deemed to be an “interested person” of the Trust as defined by the 1940 Act due to his position and material business relationship with the Trust. |
81
A NOTE ON FORWARD LOOKING STATEMENTS
The matters discussed in this report may constitute forward-looking statements made pursuant to the safe-harbor provisions of the Securities Litigation Reform Act of 1995. These include any Adviser or portfolio manager predictions, assessments, analyses or outlooks for individual securities, industries, market sectors and/or markets. These statements involve risks and uncertainties. In addition to the general risks described for the Funds in the current Prospectus, other factors bearing on this report include the accuracy of the Adviser’s or portfolio managers’ forecasts and predictions, and the appropriateness of the investment programs designed by the Adviser or portfolio managers to implement their strategies efficiently and effectively. Any one or more of these factors, as well as other risks affecting the securities markets and investment instruments generally, could cause the actual results of the Funds to differ materially as compared to benchmarks associated with the Funds.
ADDITIONAL INFORMATION
The Funds have adopted proxy voting policies and procedures that delegate to the Adviser the authority to vote proxies. A description of the Funds’ proxy voting policies and procedures is available without charge, upon request, by calling the Funds toll free at 1-877-SNOWFND (877-766-9363). A description of these policies and procedures is also included in the Funds’ Statement of Additional Information, which is available on the SEC’s website at http://www.sec.gov.
The Funds’ proxy voting record during the most recent 12-month period ended June 30 is available without charge, upon request, by calling 1-877-SNOWFND (877-766-9363), or by accessing the SEC’s website at http://www.sec.gov.
The Funds file their complete schedule of portfolio holdings with the SEC for the first and third quarters of each fiscal year on Part F of Form N-PORT. Shareholders may view the Funds’ Form N-PORT filings on the SEC’s website at www.sec.gov.
HOUSEHOLDING
In an effort to decrease costs, the Funds intend to reduce the number of duplicate prospectuses and certain other shareholder documents you receive by sending only one copy of each to those addresses shared by two or more accounts and to shareholders the Funds reasonably believe are from the same family or household. Once implemented, if you would like to discountinue householding for your accounts, please call toll-free at 1-877-SNOWFND (877-766-9363) to request individual copies of these documents. Once the Funds receive notice to stop householding, the Funds will begin sending individual copies 30 days after receiving your request. This policy does not apply to account statements.
SNOW CAPITAL FAMILY OF FUNDS
Investment Adviser
Easterly Investment Partners LLC
138 Conant Street
Beverly, Massachusetts 01915
Legal Counsel
Godfrey & Kahn, S.C.
833 East Michigan Street, Suite 1800
Milwaukee, Wisconsin 53202
Independent Registered Public Accounting Firm
Deloitte & Touche LLP
111 South Wacker Drive
Chicago, Illinois 60606
Transfer Agent, Fund Accountant and Fund Administrator
U.S. Bancorp Fund Services, LLC
615 East Michigan Street
Milwaukee, Wisconsin 53202
Custodian
U.S. Bank, N.A.
Custody Operations
1555 North RiverCenter Drive, Suite 302
Milwaukee, Wisconsin 53212
Distributor
Quasar Distributors, LLC
111 East Kilbourn Ave., Suite 2200
Milwaukee, Wisconsin 53202
This report is intended for shareholders of the Funds and may not be used as sales literature unless preceded or accompanied by a current prospectus.
| (b) | Not Applicable for this Registrant. |
Item 2. Code of Ethics.
Not applicable for semi-annual reports.
Item 3. Audit Committee Financial Expert.
Not applicable for semi-annual reports.
Item 4. Principal Accountant Fees and Services.
Not applicable for semi-annual reports.
Item 5. Audit Committee of Listed Registrants.
Not applicable to registrants who are not listed issuers (as defined in Rule 10A-3 under the Securities Exchange Act of 1934).
Item 6. Investments.
| (a) | Schedule of Investments is included as part of the report to shareholders filed under Item 1 of this Form. |
Item 7. Disclosure of Proxy Voting Policies and Procedures for Closed-End Management Investment Companies.
Not applicable to open-end investment companies.
Item 8. Portfolio Managers of Closed-End Management Investment Companies.
Not applicable to open-end investment companies.
Item 9. Purchases of Equity Securities by Closed-End Management Investment Company and Affiliated Purchasers.
Not applicable to open-end investment companies.
Item 10. Submission of Matters to a Vote of Security Holders.
There have been no material changes to the procedures by which shareholders may recommend nominees to the registrant’s board of trustees.
Item 11. Controls and Procedures.
| (a) | The Registrant’s President and Treasurer have reviewed the Registrant’s disclosure controls and procedures (as defined in Rule 30a-3(c) under the Investment Company Act of 1940 (the “Act”)) as of a date within 90 days of the filing of this report, as required by Rule 30a-3(b) under the Act and Rules 13a-15(b) or 15d-15(b) under the Securities Exchange Act of 1934. Based on their review, such officers have concluded that the disclosure controls and procedures are effective in ensuring that information required to be disclosed in this report is appropriately recorded, processed, summarized and reported and made known to them by others within the Registrant and by the Registrant’s service provider. |
| (b) | There were no changes in the Registrant’s internal control over financial reporting (as defined in Rule 30a-3(d) under the Act) that occurred during the last fiscal half-year covered by this report that has materially affected, or is reasonably likely to materially affect, the Registrant’s internal control over financial reporting. |
Item 12. Disclosure of Securities Lending Activities for Closed-End Management Investment Companies
Not applicable to open-end investment companies.
Item 13. Exhibits.
| (a) | (1) Any code of ethics or amendment thereto, that is the subject of the disclosure required by Item 2, to the extent that the registrant intends to satisfy Item 2 requirements through filing an exhibit. Not Applicable. |
(2) A separate certification for each principal executive and principal financial officer pursuant to Section 302 of the Sarbanes-Oxley Act of 2002. Filed herewith.
(3) Any written solicitation to purchase securities under Rule 23c-1 under the Act sent or given during the period covered by the report by or on behalf of the registrant to 10 or more persons. Not applicable to open-end investment companies.
(4) Change in the registrant’s independent public accountant. There was no change in the registrant’s independent public accountant for the period covered by this report.
SIGNATURES
Pursuant to the requirements of the Securities Exchange Act of 1934 and the Investment Company Act of 1940, the registrant has duly caused this report to be signed on its behalf by the undersigned, thereunto duly authorized.
| | | | |
| (Registrant) Trust for Professional Managers |
| | |
| By (Signature and Title)* | | /s/ John Buckel | | |
| | John Buckel, President | | |
| | |
| Date: 10/26/2021 | | | | |
Pursuant to the requirements of the Securities Exchange Act of 1934 and the Investment Company Act of 1940, this report has been signed below by the following persons on behalf of the registrant and in the capacities and on the dates indicated.
| | | | |
| By (Signature and Title)* | | /s/ John Buckel | | |
| | John Buckel, President | | |
| | |
| Date: 10/26/2021 | | | | |
| | |
| By (Signature and Title)* | | /s/ Jennifer Lima | | |
| | Jennifer Lima, Treasurer | | |
| | |
| Date: 10/26/2021 | | | | |
| * | Print the name and title of each signing officer under his or her signature. |