UNITED STATES
SECURITIES AND EXCHANGE COMMISSION
Washington, D.C. 20549
FORM N-CSR
CERTIFIED SHAREHOLDER REPORT OF REGISTERED
MANAGEMENT INVESTMENT COMPANIES
Investment Company Act file number 811-10401
Trust for Professional Managers
(Exact name of registrant as specified in charter)
615 East Michigan Street
Milwaukee, WI 53202
(Address of principal executive offices) (Zip code)
Jay S. Fitton
U.S. Bancorp Fund Services, LLC
615 East Michigan Street
Milwaukee, WI 53202
(Name and address of agent for service)
(513) 629-8104
Registrant's telephone number, including area code
Date of fiscal year end: May 31, 2022
Date of reporting period: November 30, 2021
Item 1. Reports to Stockholders.
Letter from the Investment Adviser
Dear Fellow Shareholders,
The Jensen Quality Value Fund (the “Fund”)—Class Y Shares—posted a return of 4.01% for the six months ended November 30, 2021, compared to a return of 2.80% for the Russell Midcap Total Return Index and a return of -1.01% for the Russell 2500 Total Return Index. Please see pages 11 through 13 of this report for complete standardized performance information for the Fund.
After the volatility of calendar year 2020, which arose from the onset of the pandemic followed by a rally in early 2021 that was fueled by some $2 trillion of additional federal stimulus, the domestic stock markets produced somewhat more muted returns over the six-month period ended November 30, 2021. Overall returns remained quite positive as investors were encouraged by a strong rebound in corporate profitability. The recovery in corporate earnings was widespread across nearly every sector, signaling a level of economic normalization as the worst of the pandemic began to fade.
Also contributing to returns was ultra-accommodative monetary policy from the U.S. Federal Reserve, which maintained the historically low Fed Funds Rate reinstituted in March 2020 along with heightened quantitative easing designed to support the domestic economy during the pandemic. The combination of easy monetary policy and unprecedented fiscal stimulus succeeded in bolstering the economic rebound, although we believe this has also contributed to a sharp increase in inflation.
Consumer sentiment rose as vaccinations became commonplace, lifting the business results of many companies, which were reflected in ongoing positive market performance. The Jensen Quality Growth Fund exceeded the market’s positive returns over the last six months as the resilience of the business models of many of the companies held in the Fund became apparent. Such strength was impressive given increasing pressures from the aforementioned inflation, together with associated supply chain disruptions, labor shortages and rising wage costs that were further exacerbated by the newer strains of COVID-19 including the Delta and Omicron variants. We believe such outperformance is an indication of the quality of the businesses and the competitive advantage profiles that provide tools, such as scale, pricing power and brand equity, to mitigate the pressures noted above.
For the six months ended November 30, 2021, the Fund’s performance relative to the Russell Midcap Total Return Index was supported by an underweight position in the Communications and Health Care sectors and specific companies in the Financial, Industrial, Consumer Staples, and Consumer Discretionary sectors. Performance was negatively impacted by an overweight in the Consumer Staples, Consumer Discretionary, and Industrial sectors, an underweight in the Information Technology, Real Estate, and Energy sectors, and specific companies in the Health Care, Materials, and Information Technology sectors.
Relative to the Russell 2500 Total Return Index, the Fund’s performance during the period was aided by an underweight position in the Health Care and Communication sectors, as well as specific companies in most sectors excluding Materials. Performance was hindered by the Fund’s overweight
| | |
Semi-Annual Report | Jensen Quality Value Fund | 1 |
to the Consumer Staples and Consumer Discretionary sectors, its underweight to the Energy and Real Estate sectors, and specific companies in the Materials sector.
During the six-month period ended November 30, 2021, the strategy continued its high allocation to quality companies, as defined by the S&P Earnings and Dividend Quality Rankings. The Fund’s portfolio allocation to the highest quality companies, those rated A+, A, and A-, averaged 51% of portfolio assets, compared to 19% of the Russell Midcap Total Return Index and 10% of the Russell 2500 Total Return Index. This significant overweight to quality added to relative returns during the period, which we believe was driven by the market volatility caused by new coronavirus variants, inflation, and potential interest rate increases. While low-quality businesses can outperform in some periods, we believe that over the full market cycle investors in higher-quality businesses have the potential to be rewarded with better returns and lower volatility.
Top and Bottom Contributors
The top contributor to Fund performance for the six months ended November 30, 2021, was FactSet Research Systems (FDS), a software company providing tools for financial and banking professionals. During the period, FactSet reported revenue and earnings ahead of investor expectations, driven by strong growth in new clients and share gains with existing clients. FactSet was selected for the Jensen Quality Value Fund because of its compelling valuation at the time of purchase and its positive fundamental attributes, including a best-in-class product, solid growth opportunities, high customer switching costs, and a robust balance sheet.
Other notable companies that contributed positively to portfolio performance were Hill-Rom Holdings (HRC), a medical equipment company specializing in hospital beds, surgical tables, and patient monitoring devices, Verisk Analytics (VRSK), a software company primarily targeting the property and casualty insurance markets, Equifax (EFX), a provider of credit reports and related services, and Copart (CPRT), an operator of salvage-title automobile auctions and storage facilities.
The largest negative contributor to Fund performance for the six-month period was Encompass Health (EHC), an operator of patient recovery, rehabilitation, and hospice centers. The company reported solid revenue and earnings growth during the period, but high labor costs and reduced elective procedures during the pandemic kept results below the expectations of many investors. Encompass was selected for the Jensen Quality Value Fund due to its attractive valuation at the time of purchase and its compelling fundamental attributes, which include favorable demographic growth drivers, a leading market position, demonstrable cost effectiveness, high quality of care, and high barriers to entry.
Other notable holdings that weighed on relative performance included Scott’s Miracle-Gro (SMG), a fertilizer and gardening products company, MillerKnoll (MLKN), an office and home furniture manufacturer and distributor, Maximus (MMS), a provider of outsourcing and consulting services for federal, state, and local governments, and Lennox (LII), a manufacturer and marketer of heating, ventilating, and air conditioning equipment.
| | |
2 | Jensen Quality Value Fund | Semi-Annual Report |
During the six-month period ended November 30, 2021, the investment team continued to purchase the shares of companies we consider undervalued and sell the shares of companies we believe to be overvalued. New companies to the portfolio included Pool Corp (POOL), the U.S.’s only nationwide distributor of pool and spa supplies and parts, Resmed (RMD), a vertically integrated medical device company focused on treating, diagnosing, and managing respiratory disorders including sleep-disordered breathing, chronic obstructive pulmonary disease, neuromuscular disease, and other chronic illnesses, and United Rentals (URI), the largest tool and equipment rental company in the U.S.
During the period, the investment team sold Hill-Rom Holdings (HRC) due to the valuation of its shares following the announcement that the company would be acquired by Baxter International, a competing health care company. As of November 30, 2021, the Jensen Quality Value Fund held 37 companies.
As we look forward to 2022, we maintain a more cautious outlook for market returns in the coming year as we recognize that several factors make any forecast challenging. They include, but are not limited to, higher inflation, the specter of rising interest rates and ongoing cost pressures from the labor markets and supply chains, substantially lower fiscal spending in support of the domestic economy and the ongoing evolution of the pandemic with new treatments and rising vaccination rates offset by new variants.
In addition to the factors stated above, we note that business performance of companies and recent market return patterns could influence the outlook for the coming year.
Earnings growth for many companies is forecast to slow meaningfully in 2022 due to (1) challenging base year comparisons, (2) a waning positive impact from fiscal spending, and (3) the likelihood of more hawkish U.S. monetary policy to counter inflationary pressures. According to Strategas, fiscal policy stimulus is forecast to decline in 2022 such that it produces a “$1.5 trillion fiscal drag” on gross domestic product and the U.S. Federal Reserve has already communicated its intent for as many as three increases in the Fed Funds rate next year. This will likely produce additional pressure on companies and their business performance. Further, 2022 market performance will follow three exceptionally strong years in 2019, 2020, and 2021.
We certainly recognize that the market is forward-looking, but we remain mindful that many of the factors we have noted are unlikely to subside for some time, causing overall uncertainty to continue. Consequently, the path forward may continue to be uneven and thus potentially unnerving for investors. However, we believe uncertainty can provide opportunities for higher quality, more resilient businesses to garner favor from investors looking for lower volatility in the face of the issues discussed here. For example, we view pricing power to mitigate inflation and financial flexibility to cope with likely higher interest rates as advantages of the businesses in which we invest. We consider that our ongoing active management of the Fund has enabled us to upgrade the quality and growth outlook of the portfolio while maintaining an adequate margin of safety producing an attractive option to manage future volatility.
| | |
Semi-Annual Report | Jensen Quality Value Fund | 3 |
Whatever happens moving forward, the Jensen Investment Team remains confident in the strategy and process guiding our management of the Fund. Our goal remains the ownership of a portfolio of companies positioned to grow and accrue business value. We seek to participate in this value creation as investors via the long-term ownership of fairly priced, high-quality stocks. Our focus remains on identifying businesses with sustainable competitive advantages, resilient financial results, and attractive long-term growth opportunities. We believe these attributes allow companies to generate business returns consistently above their cost of capital, ultimately resulting in shareholder value creation.
We are tremendously grateful for the ongoing support of our firm and investment strategies from our partners and fellow shareholders.
We invite you to seek additional information about The Jensen Quality Value Fund at www.jenseninvestment.com where additional content, including updated holdings and performance information, is available. We take our investment responsibilities seriously and appreciate the trust you have placed in us. As always, we welcome your feedback.
The Jensen Quality Value Investment Team
| | |
4 | Jensen Quality Value Fund | Semi-Annual Report |
This discussion and analysis of the Fund is as of November 30, 2021 and is subject to change, and any forecasts made cannot be guaranteed and should not be considered investment advice. Past performance is no guarantee of future results. Fund holdings and sector weightings are subject to change and are not recommendations to buy or sell any security. For more complete information regarding performance and holdings, please refer to the financial statements and schedule of investments headings of this report. Current and future portfolio holdings are subject to risk. Mutual fund investing involves risk, and principal loss is possible. The Fund invests in mid- and smaller-capitalization companies, which involve additional risks such as limited liquidity and greater volatility. Growth stocks typically are more volatile than value stocks; however, value stocks have a lower expected growth rate in earnings and sales. The Russell Midcap Total Return Index is an unmanaged index, which measures the performance of the 800 smallest companies in the Russell 1000 Index. The Russell 2500 Total Return Index is a market cap weighted index that includes the smallest 2,500 companies covered in the Russell 3000 universe of United States-based listed equities. The index is unmanaged, and you cannot invest directly in an index. S&P Quality Rankings. S&P ranks index constituents from A+ through C based on trailing earnings and dividend consistency. We consider stocks rated A- and above as high quality and those rated B+ and below as low quality. Earnings Growth: The annual rate of growth of earnings typically measured as Earnings Per Share Growth. Margin of Safety: A principle of investing in which an investor only purchases securities when their market price is significantly below their intrinsic value. Must be preceded or accompanied by a prospectus for the Jensen Quality Value Fund. The Jensen Quality Value Fund is distributed by Quasar Distributors, LLC. |
| | |
Semi-Annual Report | Jensen Quality Value Fund | 5 |
Letter from the Investment Adviser
Dear Fellow Shareholders,
The Jensen Quality Global Growth Fund (the “Fund”) — Class Y Shares — returned 7.36% for the six-month period ended November 30, 2021, compared to a return of 2.83% for the MSCI ACWI Index over the period. Please see pages 15 through 17 of this report for complete standardized performance information for the Fund.
After a sharp rally in early 2021, returns from global stocks moderated, but remained positive, for the six-month period ended November 30, 2021. Investors were encouraged by a widespread rebound in corporate profitability, signaling economic normalization as the worst of the pandemic began to fade and countries emerged from emergency lockdown measures. Additionally, stock market returns were boosted by easy monetary policy and unprecedented fiscal stimulus. We believe these policy efforts were successful in stabilizing the global economy but have contributed to a sharp increase in inflationary pressures.
Due in part to a global COVID-19 vaccination effort, consumer sentiment rose and lifted business performance and the share prices of global companies. The Jensen Quality Global Growth Fund exceeded the market’s positive returns during the past six months due to the resilience of the business models of companies held in the Fund. We are pleased with this relative strength, as we believe it reflects the portfolio companies were well-equipped to offset inflationary pressures caused by supply chain disruptions, labor shortages, and rising wages. We also consider that this outperformance is an indication of the quality of the businesses held in the Fund, as competitive advantages such as economies of scale, pricing power, and brand equity can help quality businesses mitigate inflationary headwinds.
During the period, specific stock selection added value in the Communication Services and Industrials sectors, while detracting from returns primarily in the Technology sector. From a sector perspective, the overweight position in the Industrials and Consumer Staples sectors detracted from performance, while the Fund’s relative overweighting to the Information Technology sector and the low exposure to the Financials sector added value.
From a geographic perspective, the Fund’s relative overweight and security selection in North America was the largest contributor to relative performance. Low exposure to businesses in emerging markets also benefited the Fund’s performance. Security selection in the Emerging Asia Pacific region was the largest geographic detractor to Fund performance.
Leading individual contributors to performance during the period were Microsoft (MSFT) and Pfizer (PFE).
Microsoft is an enterprise and consumer software company, with a host of well‐known products including Windows, Microsoft Office, and Azure. The company produced strong business results during the six-month period, and its financial outlook indicated continued strength as it benefited
| | |
6 | Jensen Global Quality Growth Fund | Semi-Annual Report |
from strong demand for its cloud-enabled products whether from traditional office environments or work-from-home. In our view, competitive advantages for Microsoft include the network effect derived from the ubiquitous nature of its products, brand equity, and high customer switching costs. We also believe in the company’s ongoing growth potential and consequently, Microsoft remains a top portfolio holding.
Pfizer is a diversified, global pharmaceutical company. Its financial results during the period were buoyed by strong performance of Comirnaty, its COVID-19 vaccine, and solid results across many of the company’s major drug franchises. In November, based on promising clinical results, Pfizer submitted its application for regulatory approval for Paxlovid, a COVID-19 antiviral treatment. Further, we are confident in the company’s efforts to deploy excess cash generated from its COVID-19 vaccine into strategic acquisitions to bolster its drug pipeline and long-term growth prospects.
Leading detractors from the Fund’s performance for the period included 3M (MMM) and Tencent (0700.HK).
3M is a global industrial conglomerate serving a diverse set of end markets including Industrial, Healthcare, Consumer, Safety, and Electronics. Business results during the period were solid at both the divisional and geographic segments. However, share price weakness reflected short-term concerns over supply chain disruptions, raw material costs, and litigation exposure. We retain a positive view on 3M’s long-term prospects and believe the stock price weakness underappreciates the short-cycle nature of many of the company’s end markets and overstates the potential financial impact from ongoing litigation. Our valuation model discounts short-term margin pressure from supply chain bottlenecks and raw materials costs, but we remain confident in 3M’s long-term business prospects.
Tencent is a Chinese multinational conglomerate with leading products in gaming, financial services, and communications. The company reported double-digit growth in revenues and earnings during the period, but a deluge of regulatory uncertainty weighed on investor sentiment. Strong operating performance was driven by continued domestic growth of FinTech in mainland China and a growing presence in international gaming franchises. However, the stock came under pressure as the Chinese government and regulatory bodies cracked down on dominant Chinese technology companies, including Tencent, to curb potential antitrust concerns, limit youth gaming activity, and address growing inequality within its society.
We continue to hold a position in Tencent shares due to the company’s dominant position in the Chinese economy and believe Tencent remains a highly-advantaged business levered to attractive growth areas of global gaming, social media, Fintech, and cloud services. However, we recognize the fundamental uncertainty created by the capricious actions of the Chinese regulators. We manage this geopolitical risk by maintaining a lower portfolio weighting in Tencent shares.
We are constantly evaluating all of the businesses owned by the Fund, as well as other investment candidates, to determine whether better opportunities exist within the Jensen Quality Universe. Such determinations ultimately reflect a combination of fundamental considerations, valuation opportunities, and overall risk profiles for the companies.
| | |
Semi-Annual Report | Jensen Global Quality Growth Fund | 7 |
During the period, the Jensen Global Investment Team did not execute any wholesale portfolio changes. However, we did make a number of trims and adds to existing positions based on our view of business fundamentals and security valuation.
The largest addition was in shares of Amadeus IT Group SA (AMS.MC), a leading provider of technology solutions and services for the global travel industry. Headquartered in Spain, Amadeus maintains a leading position in indirect travel bookings, helping facilitate complex transactions between travel providers, including airlines and hotels, and travel sellers, such as online and offline travel agencies and metasearch providers (e.g., KAYAK). The company is also the global leader in the fast-growing industry of direct distribution, where it hosts mission-critical direct selling platforms and inventory management systems for airlines and hotels, including Southwest.com and Marriott International. We expect strength in the direct distribution business to drive revenue and earnings growth for Amadeus for many years to come.
The largest decrease was in shares of GlaxoSmithKline PLC (GSK.L). Glaxo is a global healthcare company with businesses in pharmaceuticals, vaccines, and consumer healthcare. We reduced the Fund’s position Glaxo shares due to execution concerns in its vaccine business and the potential distraction from the spin-off of its consumer healthcare business. We believe Glaxo’s competitive advantages – brand equity, global distribution, and intellectual property – remain intact. However, its relatively low portfolio weight reflects our longer term concerns about growth prospects from the company’s drug pipeline.
We maintain a cautious outlook for market returns in 2022 due to expectations of lower corporate earnings growth, higher inflation, rising interest rates, cost pressures from global labor markets and supply chain disruptions, and intermittent economic disruption from the evolution of the COVID-19 pandemic.
We recognize that the market is forward-looking, but we remain mindful that many of these factors are unlikely to resolve for some time, causing overall uncertainty to continue. Consequently, the path forward may continue to be uneven and thus potentially unnerving for investors.
However, we believe uncertainty can provide opportunities for higher quality, more resilient businesses to garner favor from investors seeking lower volatility in the face of the issues discussed here. For example, we view pricing power to mitigate inflation and financial flexibility to manage likely higher interest rates as advantages of high-quality businesses. We also believe that our ongoing active management of the Fund has enabled us to upgrade the quality and growth outlook of the portfolio while maintaining an adequate margin of safety, that produces an attractive option to manage future volatility.
Whatever happens moving forward, the Jensen Global Quality Growth Investment Team remains confident in the strategy and process guiding our management of the Fund. Our goal remains steadfast in the ownership of a portfolio of companies positioned to grow and accrue business value. We seek to participate in this value creation as investors via the long-term ownership of fairly priced, high-quality stocks. Our focus remains on identifying businesses with sustainable competitive
| | |
8 | Jensen Global Quality Growth Fund | Semi-Annual Report |
advantages, resilient financial results, and attractive long-term growth opportunities. We believe these attributes allow companies to generate business returns consistently above their cost of capital, ultimately resulting in shareholder value creation.
We are tremendously grateful for the ongoing support of our firm and investment strategies from our partners and fellow shareholders.
We invite you to seek additional information about The Jensen Global Quality Growth Fund at www.jenseninvestment.com where additional content, including updated holdings and performance information, is available. We take our investment responsibilities seriously and appreciate the trust you have placed in us. As always, we welcome your feedback.
The Jensen Global Investment Team
| | |
Semi-Annual Report | Jensen Global Quality Growth Fund | 9 |
This discussion and analysis of the Fund is as of November 30, 2021 and is subject to change, and any forecasts made cannot be guaranteed and should not be considered investment advice. Past performance is no guarantee of future results. Fund holdings and sector weightings are subject to change and are not recommendations to buy or sell any security. The MSCI All Country World Index (ACWI) is a stock index designed to track broad global equity-market performance. Maintained by Morgan Stanley Capital International (MSCI), the index is comprised of the stocks of about 3,000 companies from 23 developed countries and 26 emerging markets. One cannot invest directly in an index. For more complete information regarding performance and holdings, please refer to the financial statements and schedule of investments headings of this report. Current and future portfolio holdings are subject to risk. Mutual fund investing involves risk, and principal loss is possible. The Fund invests in global large capitalization companies, which involve additional risks such as the inability to respond quickly to new competition in the market and the inability to attain high growth rates as opposed to smaller companies. The Fund is non-diversified, meaning that it may concentrate its assets in fewer individual holdings than a diversified fund and is therefore more exposed to individual stock volatility than a diversified fund. Earnings Growth: The annual rate of growth of earnings typically measured as Earnings Per Share Growth. Margin of Safety: A principle of investing in which an investor only purchases securities when their market price is significantly below their intrinsic value. For use only when preceded or accompanied by a current prospectus for the Fund. The Jensen Global Quality Growth Fund is distributed by Quasar Distributors, LLC. |
| | |
10 | Jensen Global Quality Growth Fund | Semi-Annual Report |
Jensen Quality Value Fund - Class J (Unaudited)
| | | | | |
Average Annual Total Returns – For periods ended November 30, 2021 (Unaudited) | | | | | Since Inception
(3/31/2010) |
Jensen Quality Value Fund - Class J | | | | | |
Russell Midcap® Total Return Index* | | | | | |
Russell 2500® Total Return Index* | | | | | |
| |
| The Russell Midcap® Total Return Index replaced the Russell 2500® Total Return Index as the Fund's primary benchmark. The Adviser believes the new index better represents the investable opportunity set for the Fund. |
The Russell Midcap® Total Return Index is an unmanaged index, which measures the performance of the 800 smallest companies in the Russell 1000® Index.
The Russell 2500® Total Return Index is a market capitalization weighted index that includes the smallest 2,500 companies covered in the Russell 3000® universe of United States-based listed equities.
The chart at the top of the page assumes an initial gross investment of $10,000 made on November 30, 2011. Returns shown include the reinvestment of all Fund distributions. Returns shown do not reflect the deduction of taxes that a shareholder would pay on Fund distributions or the redemption of Fund shares.
Investment performance reflects fee waivers in effect. In the absence of such waivers, total returns would be reduced.
Performance data shown represents past performance. Past performance does not guarantee future results. The investment return and principal value of an investment will fluctuate so that an investor’s shares, when redeemed, may be worth more or less than their original cost. Current performance of the Fund may be lower or higher than the performance shown. Performance data current to the most recent month-end may be obtained by calling 800-992-4144 or by visiting www.jenseninvestment.com.
| | |
Semi-Annual Report | Jensen Quality Value Fund | 11 |
Jensen Quality Value Fund - Class I (Unaudited)
| | | | | |
Average Annual Total Returns – For periods ended November 30, 2021 (Unaudited) | | | | | Since Inception
(3/31/2010) |
Jensen Quality Value Fund - Class I | | | | | |
Russell Midcap® Total Return Index* | | | | | |
Russell 2500® Total Return Index* | | | | | |
| |
| The Russell Midcap® Total Return Index replaced the Russell 2500® Total Return Index as the Fund's primary benchmark. The Adviser believes the new index better represents the investable opportunity set for the Fund. |
The Russell Midcap® Total Return Index is an unmanaged index, which measures the performance of the 800 smallest companies in the Russell 1000® Index.
The Russell 2500® Total Return Index is a market capitalization weighted index that includes the smallest 2,500 companies covered in the Russell 3000® universe of United States-based listed equities.
The chart at the top of the page assumes an initial gross investment of $250,000 made on November 30, 2011. Returns shown include the reinvestment of all Fund distributions. Returns shown do not reflect the deduction of taxes that a shareholder would pay on Fund distributions or the redemption of Fund shares.
Investment performance reflects fee waivers in effect. In the absence of such waivers, total returns would be reduced.
Performance data shown represents past performance. Past performance does not guarantee future results. The investment return and principal value of an investment will fluctuate so that an investor’s shares, when redeemed, may be worth more or less than their original cost. Current performance of the Fund may be lower or higher than the performance shown. Performance data current to the most recent month-end may be obtained by calling 800-992-4144 or by visiting www.jenseninvestment.com.
| | |
12 | Jensen Quality Value Fund | Semi-Annual Report |
Jensen Quality Value Fund - Class Y (Unaudited)
| | |
Average Annual Total Returns – For periods ended November 30, 2021 (Unaudited) | | Since Inception
(01/15/2020) |
Jensen Quality Value Fund - Class Y | | |
Russell Midcap® Total Return Index* | | |
Russell 2500® Total Return Index* | | |
| |
| The Russell Midcap® Total Return Index replaced the Russell 2500® Total Return Index as the Fund's primary benchmark. The Adviser believes the new index better represents the investable opportunity set for the Fund. |
The Russell Midcap® Total Return Index is an unmanaged index, which measures the performance of the 800 smallest companies in the Russell 1000® Index.
The Russell 2500® Total Return Index is a market capitalization weighted index that includes the smallest 2,500 companies covered in the Russell 3000® universe of United States-based listed equities.
The chart at the top of the page assumes an initial gross investment of $1,000,000 made on January 15, 2020, the inception date for Class Y shares. Returns shown include the reinvestment of all Fund distributions. Returns shown do not reflect the deduction of taxes that a shareholder would pay on Fund distributions or the redemption of Fund shares.
Investment performance reflects fee waivers in effect. In the absence of such waivers, total returns would be reduced.
Performance data shown represents past performance. Past performance does not guarantee future results. The investment return and principal value of an investment will fluctuate so that an investor’s shares, when redeemed, may be worth more or less than their original cost. Current performance of the Fund may be lower or higher than the performance shown. Performance data current to the most recent month-end may be obtained by calling 800-992-4144 or by visiting www.jenseninvestment.com.
| | |
Semi-Annual Report | Jensen Quality Value Fund | 13 |
Jensen Quality Value Fund
Investments by Sector as of November 30, 2021
(as a Percentage of Total Investments) (Unaudited)
The Global Industry Classification Standard (GICS®) was developed by and/
or is the exclusive property of MSCI, Inc. and Standard & Poors Financial
Services LLC (“S&P”). GICS is a service mark of MSCI and S&P and has been
licensed for use by U.S. Bancorp Fund Services, LLC doing business as U.S.
Bank Global Fund Services.
| | |
14 | Jensen Quality Value Fund | Semi-Annual Report |
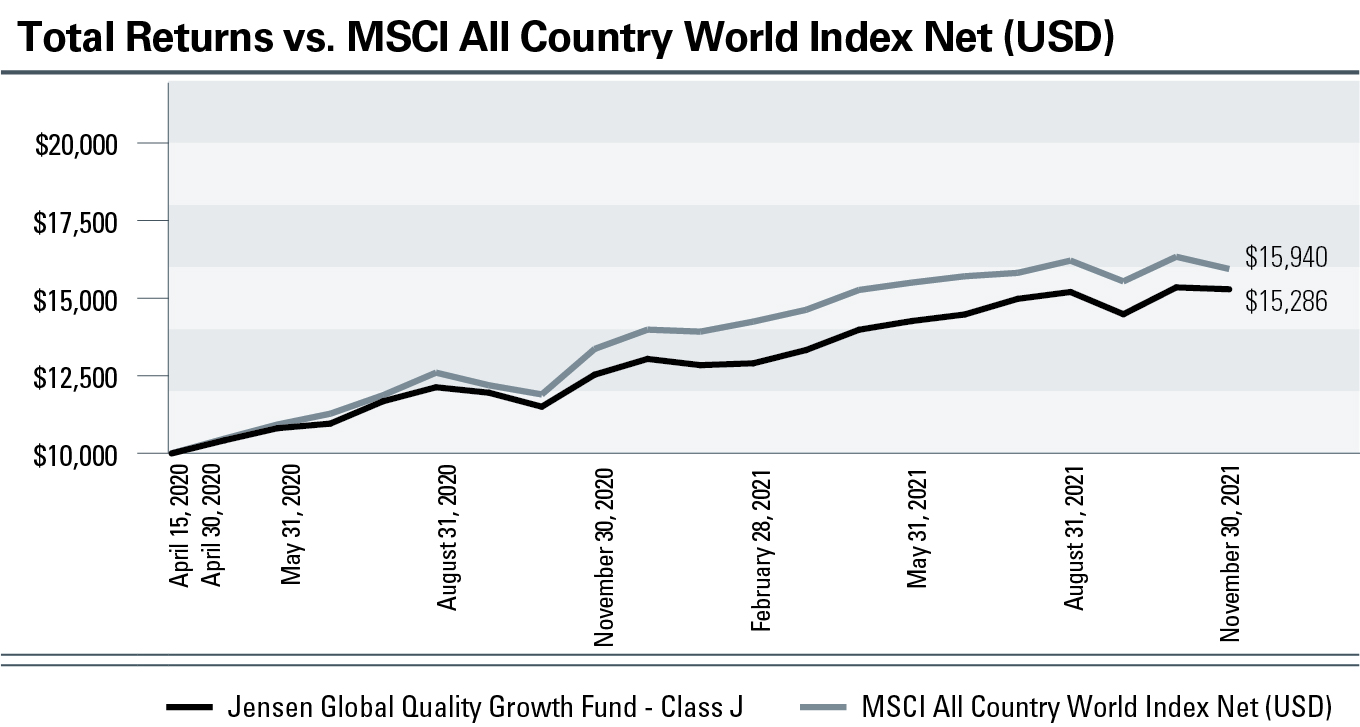
Jensen Global Quality Growth Fund - Class J (Unaudited)
| | |
Average Annual Total Returns – For periods ended November 30, 2021 (Unaudited) | | Since Inception
(4/15/2020) |
Jensen Global Quality Growth Fund - Class J | | |
MSCI All Country World Index Net (USD) | | |
The MSCI All Country World Index Net (USD) (“MSCI ACWI”) is a free float-adjusted market capitalization weighted index that measures the equity performance of global developed and emerging markets. The MSCI ACWI total return indices reinvest dividends after the deduction of withholding taxes, using (for international indices) a tax rate applicable to non-resident institutional investors who do not benefit from double taxation treaties.
The chart at the top of the page assumes an initial gross investment of $10,000 made on April 15, 2020, the inception date for Class J shares. Returns shown include the reinvestment of all Fund distributions. Returns shown do not reflect the deduction of taxes that a shareholder would pay on Fund distributions or the redemption of Fund shares.
Investment performance reflects fee waivers in effect. In the absence of such waivers, total returns would be reduced.
Performance data shown represents past performance. Past performance does not guarantee future results. The investment return and principal value of an investment will fluctuate so that an investor’s shares, when redeemed, may be worth more or less than their original cost. Current performance of the Fund may be lower or higher than the performance shown. Performance data current to the most recent month-end may be obtained by calling 800-992-4144 or by visiting www.jenseninvestment.com.
| | |
Semi-Annual Report | Jensen Global Quality Growth Fund | 15 |
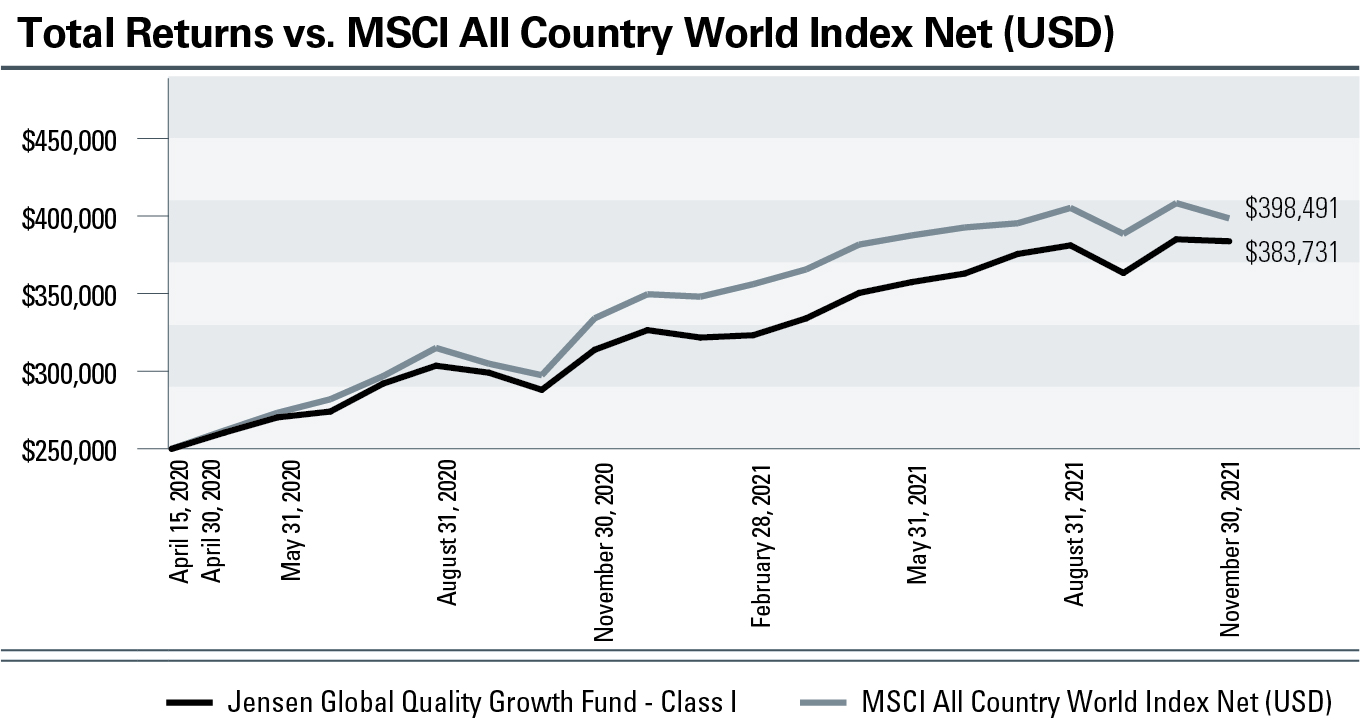
Jensen Global Quality Growth Fund - Class I (Unaudited)
| | |
Average Annual Total Returns – For periods ended November 30, 2021 (Unaudited) | | Since Inception
(4/15/2020) |
Jensen Global Quality Growth Fund - Class I | | |
MSCI All Country World Index Net (USD) | | |
The MSCI All Country World Index Net (USD) (“MSCI ACWI”) is a free float-adjusted market capitalization weighted index that measures the equity performance of global developed and emerging markets. The MSCI ACWI total return indices reinvest dividends after the deduction of withholding taxes, using (for international indices) a tax rate applicable to non-resident institutional investors who do not benefit from double taxation treaties.
The chart at the top of the page assumes an initial gross investment of $250,000 made on April 15, 2020, the inception date for Class I shares. Returns shown include the reinvestment of all Fund distributions. Returns shown do not reflect the deduction of taxes that a shareholder would pay on Fund distributions or the redemption of Fund shares.
Investment performance reflects fee waivers in effect. In the absence of such waivers, total returns would be reduced.
Performance data shown represents past performance. Past performance does not guarantee future results. The investment return and principal value of an investment will fluctuate so that an investor’s shares, when redeemed, may be worth more or less than their original cost. Current performance of the Fund may be lower or higher than the performance shown. Performance data current to the most recent month-end may be obtained by calling 800-992-4144 or by visiting www.jenseninvestment.com.
| | |
16 | Jensen Global Quality Growth Fund | Semi-Annual Report |
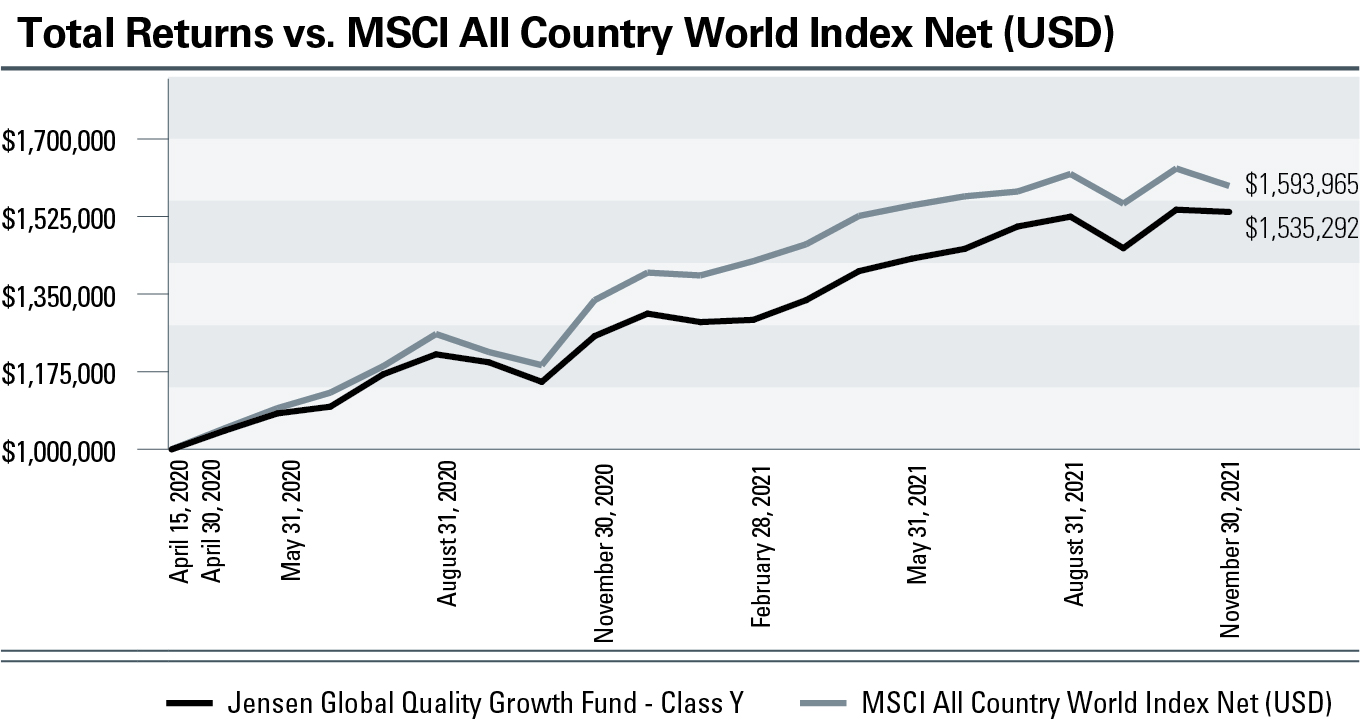
Jensen Global Quality Growth Fund - Class Y (Unaudited)
| | |
Average Annual Total Returns – For periods ended November 30, 2021 (Unaudited) | | Since Inception
(4/15/2020) |
Jensen Global Quality Growth Fund - Class Y | | |
MSCI All Country World Index Net (USD) | | |
The MSCI All Country World Index Net (USD) (“MSCI ACWI”) is a free float-adjusted market capitalization weighted index that measures the equity performance of global developed and emerging markets. The MSCI ACWI total return indices reinvest dividends after the deduction of withholding taxes, using (for international indices) a tax rate applicable to non-resident institutional investors who do not benefit from double taxation treaties.
The chart at the top of the page assumes an initial gross investment of $1,000,000 made on April 15, 2020, the inception date for Class Y shares. Returns shown include the reinvestment of all Fund distributions. Returns shown do not reflect the deduction of taxes that a shareholder would pay on Fund distributions or the redemption of Fund shares.
Investment performance reflects fee waivers in effect. In the absence of such waivers, total returns would be reduced.
Performance data shown represents past performance. Past performance does not guarantee future results. The investment return and principal value of an investment will fluctuate so that an investor’s shares, when redeemed, may be worth more or less than their original cost. Current performance of the Fund may be lower or higher than the performance shown. Performance data current to the most recent month-end may be obtained by calling 800-992-4144 or by visiting www.jenseninvestment.com.
| | |
Semi-Annual Report | Jensen Global Quality Growth Fund | 17 |
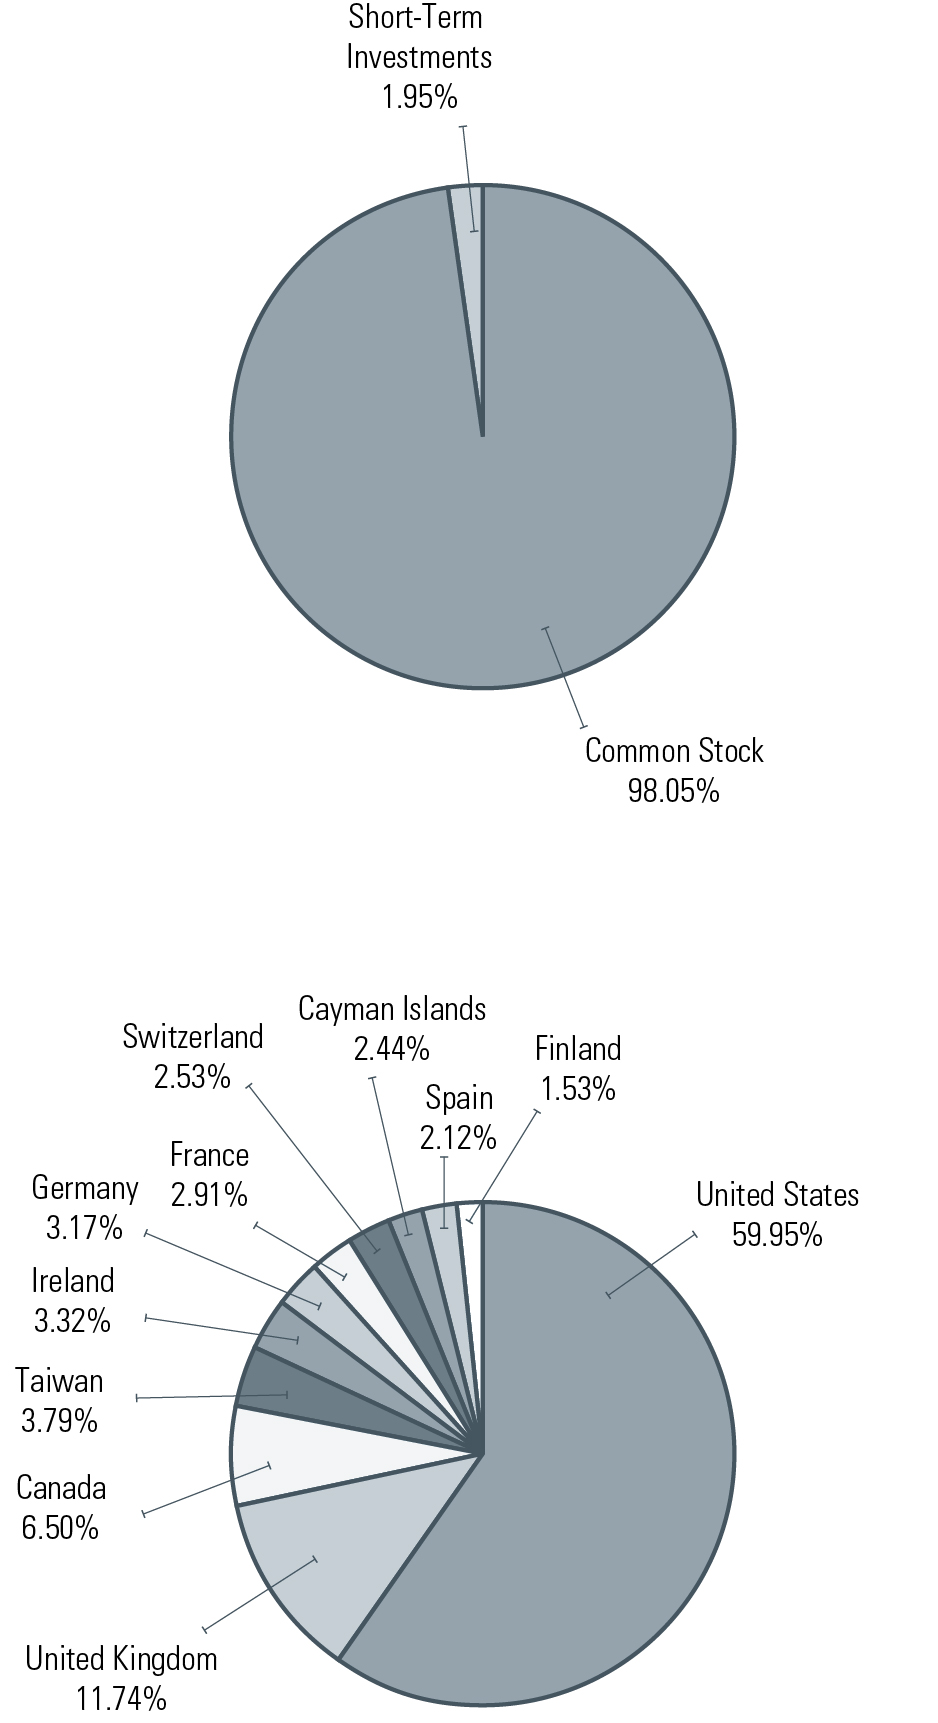
Jensen Global Quality Growth Fund
Allocation of Portfolio Holdings as of November 30, 2021
(as a Percentage of Total Investments) (Unaudited)
| | |
18 | Jensen Global Quality Growth Fund | Semi-Annual Report |
Statements of Assets & Liabilities
November 30, 2021 (Unaudited)
| | | | | | | |
| | Jensen
Global Quality
Growth Fund |
Investments, at value (cost $146,051,290 and $29,204,877) | | | | | | |
| | | | | | |
Receivable for capital stock issued | | | | | | |
Receivables for investments sold | | | | | | |
| | | | | | |
| | | | | | |
| | | | | | |
Payable for capital stock redeemed | | | | | | |
Payable for 12b-1 fees - Class J | | | | | | |
| | | | | | |
Payable for investments purchased | | | | | | |
| | | | | | |
Accrued expenses and other liabilities | | | | | | |
| | | | | | |
| | | | | | |
| | | | | | |
| | | | | | |
Total distributable earnings | | | | | | |
| | | | | | |
| | | | | | |
| | | | | | |
| | | | | | |
Shares of beneficial interest outstanding | | | | | | |
Net Asset Value, Offering Price and Redemption Price Per Share
(unlimited number of shares authorized, $.001 par value) | | | | | | |
| | | | | | |
| | | | | | |
Shares of beneficial interest outstanding | | | | | | |
Net Asset Value, Offering Price and Redemption Price Per Share
(unlimited number of shares authorized, $.001 par value) | | | | | | |
| | | | | | |
| | | | | | |
Shares of beneficial interest outstanding | | | | | | |
Net Asset Value, Offering Price and Redemption Price Per Share
(unlimited number of shares authorized, $.001 par value) | | | | | | |
The accompanying notes are an integral part of these financial statements.
| | |
Semi-Annual Report | Jensen Quality Value Fund, Jensen Global Quality Growth Fund | 19 |
Jensen Quality Value Fund
Schedule of Investments
November 30, 2021 (Unaudited)
| | |
| Air Freight & Logistics - 3.44% | |
| Expeditors International of Washington, Inc. | |
| | |
| Building Products - 2.23% | |
| Lennox International, Inc. | |
| | |
| | |
| FactSet Research Systems, Inc. | |
| | |
| Commercial Services & Supplies - 5.86% | |
| | |
| | |
|
| | |
| Communications Equipment - 3.37% | |
| | |
| | |
| Containers & Packaging - 3.94% | |
| | |
| | |
| Electronic Equipment, Instruments & Components - 2.10% | |
| | |
The accompanying notes are an integral part of these financial statements.
| | |
20 | Jensen Quality Value Fund | Semi-Annual Report |
Jensen Quality Value Fund
Schedule of Investments continued
November 30, 2021 (Unaudited)
| | |
| Food & Staples Retailing - 3.42% | |
| | |
| | |
| Health Care Equipment & Supplies - 1.04% | |
| | |
| | |
| Health Care Providers & Services - 7.19% | |
| | |
| Laboratory Corporation of America Holdings (a) | |
|
| | |
| Household Products - 3.69% | |
| | |
| | |
| | |
| Broadridge Financial Solutions, Inc. | |
| | |
| | |
|
| | |
| Professional Services - 8.29% | |
| | |
| | |
|
The accompanying notes are an integral part of these financial statements.
| | |
Semi-Annual Report | Jensen Quality Value Fund | 21 |
Jensen Quality Value Fund
Schedule of Investments continued
November 30, 2021 (Unaudited)
| | |
| Real Estate Management & Development - 2.04% | |
| CBRE Group, Inc. - Class A (a) | |
| | |
| Semiconductors & Semiconductor Equipment - 4.68% | |
| Microchip Technology, Inc. | |
| ON Semiconductor Corp. (a) | |
|
| | |
| Textiles, Apparel & Luxury Goods - 4.83% | |
| | |
| Levi Strauss & Co. - Class A | |
|
| | |
| Trading Companies & Distributors - 1.79% | |
| | |
| | |
|
The accompanying notes are an integral part of these financial statements.
| | |
22 | Jensen Quality Value Fund | Semi-Annual Report |
Jensen Quality Value Fund
Schedule of Investments continued
November 30, 2021 (Unaudited)
Short-Term Investments - 1.85%
| | |
| | |
| First American Treasury Obligations Fund - Class X, 0.013% (b) | |
| |
Total Short-Term Investments | |
| |
| |
| |
(Cost $146,051,290) - 99.76% | |
Other Assets in Excess of Liabilities - 0.24% | |
TOTAL NET ASSETS - 100.00% | |
Percentages are stated as a percent of net assets.
| |
| Non-income producing security. |
| Seven day yield as of November 30, 2021. |
The accompanying notes are an integral part of these financial statements.
| | |
Semi-Annual Report | Jensen Quality Value Fund | 23 |
Jensen Global Quality Growth Fund
Schedule of Investments
November 30, 2021 (Unaudited)
| | |
| | |
| Alimentation Couche-Tard, Inc. - Class B | |
| Canadian National Railway Co. | |
|
| | |
| Taiwan, Province of China - 3.79% | |
| Taiwan Semiconductor Manufacturing Co. Ltd. - ADR | |
The accompanying notes are an integral part of these financial statements.
| | |
24 | Jensen Global Quality Growth Fund | Semi-Annual Report |
Jensen Global Quality Growth Fund
Schedule of Investments continued
November 30, 2021 (Unaudited)
| | |
| | |
| | |
| Alphabet, Inc. - Class A (a) | |
| | |
| Automatic Data Processing, Inc. | |
| | |
| Broadridge Financial Solutions, Inc. | |
| | |
| | |
| | |
| | |
| Mastercard, Inc. - Class A | |
| | |
| | |
| | |
| | |
| | |
| | |
| | |
| | |
|
The accompanying notes are an integral part of these financial statements.
| | |
Semi-Annual Report | Jensen Global Quality Growth Fund | 25 |
Jensen Global Quality Growth Fund
Schedule of Investments continued
November 30, 2021 (Unaudited)
Short-Term Investments - 1.95%
| | |
| | |
| First American Treasury Obligations Fund - Class X, 0.013% (b) | |
| |
Total Short-Term Investments | |
| |
| |
| |
(Cost $29,204,877) - 99.97% | |
Other Assets in Excess of Liabilities - 0.03% | |
TOTAL NET ASSETS - 100.00% | |
Percentages are stated as a percent of net assets.
| |
| Non-income producing security. |
| Seven day yield as of November 30, 2021. |
| |
| American Depositary Receipt |
| Public Limited Company is a publicly traded company which signifies that shareholders have limited liability. |
| An abbreviation used by many countries to signify a stock company whereby shareholders have limited liability. |
| Societas Europaea is a term for a European Public Liability Company. |
The accompanying notes are an integral part of these financial statements.
| | |
26 | Jensen Global Quality Growth Fund | Semi-Annual Report |
For the Six Months Ended November 30, 2021 (Unaudited)
| | | | | | | |
| | Jensen
Global Quality
Growth Fund |
| | | | | | (1) |
| | | | | | |
| | | | | | |
| | | | | | |
Investment management fees | | | | | | |
| | | | | | |
Federal and state registration fees | | | | | | |
| | | | | | |
| | | | | | |
| | | | | | |
| | | | | | |
| | | | | | |
| | | | | | |
| | | | | | |
Chief Compliance Officer fees | | | | | | |
Shareholder servicing fees - Class I | | | | | | |
| | | | | | |
| | | | | | |
| | | | | | |
| | | | | | |
| | | | | | |
Less waivers and reimbursements by Adviser (Note 4) | | | | | | |
| | | | | | |
| | | | | | |
Realized and Unrealized Gain (Loss) on Investments:
| | | | | | |
Net realized gain (loss) on:
| | | | | | |
| | | | | | |
Foreign currency translations | | | | | | |
Change in unrealized appreciation (depreciation) on:
| | | | | | |
| | | | | | |
Foreign currency translations | | | | | | |
Net realized and unrealized gain on investments | | | | | | |
Net Increase In Net Assets Resulting From Operations | | | | | | |
| |
| (1) | Net of $4,097 in dividend withholding tax. |
The accompanying notes are an integral part of these financial statements.
| | |
Semi-Annual Report | Jensen Quality Value Fund, Jensen Global Quality Growth Fund | 27 |
Statements of Changes in Net Assets
| | |
| Jensen Quality Value Fund |
| Six Months Ended
November 30, 2021
(Unaudited) | |
| | |
Net realized gain on investments | | |
Change in unrealized appreciation on investments | | |
Net increase in net assets resulting from operations | | |
Capital Share Transactions:
| | |
| | |
| | |
| | |
Shares issued to holders in reinvestment of dividends - Class J | | |
Shares issued to holders in reinvestment of dividends - Class I | | |
Shares issued to holders in reinvestment of dividends - Class Y | | |
Shares redeemed - Class J | | |
Shares redeemed - Class I | | |
Shares redeemed - Class Y | | |
Net increase in net assets from capital share transactions | | |
Dividends And Distributions to Shareholders:
| | |
Net dividends and distributions to shareholders - Class J | | |
Net dividends and distributions to shareholders - Class I | | |
Net dividends and distributions to shareholders - Class Y | | |
Total dividends and distributions | | |
| | |
| | |
| | |
| | |
The accompanying notes are an integral part of these financial statements.
| | |
28 | Jensen Quality Value Fund | Semi-Annual Report |
Statements of Changes in Net Assets
| | |
| Jensen Global Quality Growth Fund |
| Six Months Ended
November 30, 2021
(Unaudited) | |
| | |
Net realized gain (loss) on:
| | |
| | |
Foreign currency translations | | |
Change in unrealized appreciation (depreciation) on:
| | |
| | |
Foreign currency translations | | |
Net increase in net assets resulting from operations | | |
Capital Share Transactions:
| | |
| | |
| | |
| | |
Shares issued to holders in reinvestment of dividends - Class J | | |
Shares issued to holders in reinvestment of dividends - Class I | | |
Shares issued to holders in reinvestment of dividends - Class Y | | |
Shares redeemed - Class J | | |
Shares redeemed - Class I | | |
Shares redeemed - Class Y | | |
Net increase in net assets from capital share transactions | | |
Dividends and Distributions to Shareholders:
| | |
Net dividends and distributions to shareholders - Class J | | |
Net dividends and distributions to shareholders - Class I | | |
Net dividends and distributions to shareholders - Class Y | | |
Total dividends and distributions | | |
| | |
| | |
| | |
| | |
The accompanying notes are an integral part of these financial statements.
| | |
Semi-Annual Report | Jensen Global Quality Growth Fund | 29 |
Jensen Quality Value Fund - Class J
| | | | | | |
| six months
ended
November
30, 2021
(unaudited) | | | | | |
Net asset value, beginning of period | | | | | | |
Income from investment
operations: | | | | | | |
| | | | | | |
Net realized and unrealized
gain on investments | | | | | | |
Total from investment operations | | | | | | |
| | | | | | |
Dividends from net
investment income | | | | | | |
Distributions from net realized
gain on investments | | | | | | |
| | | | | | |
Net asset value, end of period | | | | | | |
| | | | | | |
Supplemental data and ratios: | | | | | | |
Net assets, end of period (000’s) | | | | | | |
Ratio of expenses to average
net assets | | | | | | |
Before waivers and
reimbursements of expenses(3) | | | | | | |
After waivers and
reimbursements of expenses(3) | | | | | | |
Ratio of net investment
income to average net assets | | | | | | |
Before waivers and
reimbursements of expenses(3) | | | | | | |
After waivers and
reimbursements of expenses(3) | | | | | | |
Portfolio turnover rate(2) | | | | | | |
| |
| (1) | Per share amounts are calculated using the average shares outstanding method. |
| (2) | Not annualized for periods less than one year. |
| (3) | Annualized for periods less than one year. |
| (4) | Effective September 30, 2017, the expense cap for Class J shares was decreased from 1.00% to 0.80% excluding Rule 12b-1 fees of 0.25%. |
The accompanying notes are an integral part of these financial statements.
| | |
30 | Jensen Quality Value Fund | Semi-Annual Report |
Jensen Quality Value Fund - Class I
| | | | | | |
| six months
ended
November
30, 2021
(unaudited) | | | | | |
Net asset value, beginning of period | | | | | | |
Income from investment
operations: | | | | | | |
| | | | | | |
Net realized and unrealized
gain on investments | | | | | | |
Total from investment operations | | | | | | |
| | | | | | |
Dividends from net
investment income | | | | | | |
Distributions from net realized
gain on investments | | | | | | |
| | | | | | |
Net asset value, end of period | | | | | | |
| | | | | | |
Supplemental data and ratios: | | | | | | |
Net assets, end of period (000’s) | | | | | | |
Ratio of expenses to average
net assets | | | | | | |
Before waivers and
reimbursements of expenses(3) | | | | | | |
After waivers and
reimbursements of expenses(3) | | | | | | |
Ratio of net investment
income to average net assets | | | | | | |
Before waivers and
reimbursements of expenses(3) | | | | | | |
After waivers and
reimbursements of expenses(3) | | | | | | |
Portfolio turnover rate(2) | | | | | | |
| |
| (1) | Per share amounts are calculated using the average shares outstanding method. |
| (2) | Not annualized for periods less than one year. |
| (3) | Annualized for periods less than one year. |
| (4) | Effective September 30, 2017, the expense cap for Class I shares was decreased from 1.00% to 0.80% excluding shareholder servicing fees of up to 0.10%. |
The accompanying notes are an integral part of these financial statements.
| | |
Semi-Annual Report | Jensen Quality Value Fund | 31 |
Jensen Quality Value Fund - Class Y
| | | |
| six months
ended
November
30, 2021
(unaudited) | | period ended
May 31, 2020(1) |
Net asset value, beginning of period | | | |
Income from investment operations: | | | |
| | | |
Net realized and unrealized gain (loss) on investments | | | |
Total from investment operations | | | |
| | | |
Dividends from net investment income | | | |
Distributions from net realized gain on investments | | | |
| | | |
Net asset value, end of period | | | |
| | | |
Supplemental data and ratios: | | | |
Net assets, end of period (000’s) | | | |
Ratio of expenses to average net assets | | | |
Before waivers and reimbursements of expenses(4) | | | |
After waivers and reimbursements of expenses(4) | | | |
Ratio of net investment income to average net assets | | | |
Before waivers and reimbursements of expenses(4) | | | |
After waivers and reimbursements of expenses(4) | | | |
Portfolio turnover rate(3) | | | |
| |
| (1) | Class Y shares commenced operations on January 15, 2020. |
| (2) | Per share amounts are calculated using the average shares outstanding method. |
| (3) | Not annualized for periods less than one year. |
| (4) | Annualized for periods less than one year. |
The accompanying notes are an integral part of these financial statements.
| | |
32 | Jensen Quality Value Fund | Semi-Annual Report |
Jensen Global Quality Growth Fund - Class J
| | | |
| six months
ended
November
30, 2021
(unaudited) | | period ended
May 31, 2020(1) |
Net asset value, beginning of period | | | |
Income from investment operations: | | | |
| | | |
Net realized and unrealized gain on investments | | | |
Total from investment operations | | | |
| | | |
Dividends from net investment income | | | |
| | | |
Net asset value, end of period | | | |
| | | |
Supplemental data and ratios: | | | |
Net assets, end of period (000’s) | | | |
Ratio of expenses to average net assets | | | |
Before waivers and reimbursements of expenses(4) | | | |
After waivers and reimbursements of expenses(4) | | | |
Ratio of net investment income (loss) to average net assets | | | |
Before waivers and reimbursements of expenses(4) | | | |
After waivers and reimbursements of expenses(4) | | | |
Portfolio turnover rate(3) | | | |
| |
| (1) | The Fund commenced operations on April 15, 2020. |
| (2) | Per share amounts are calculated using the average shares outstanding method. |
| (3) | Not annualized for periods less than one year. |
| (4) | Annualized for periods less than one year. |
The accompanying notes are an integral part of these financial statements.
| | |
Semi-Annual Report | Jensen Global Quality Growth Fund | 33 |
Jensen Global Quality Growth Fund - Class I
| | | |
| six months
ended
November
30, 2021
(unaudited) | | period ended
May 31, 2020(1) |
Net asset value, beginning of period | | | |
Income from investment operations: | | | |
| | | |
Net realized and unrealized gain on investments | | | |
Total from investment operations | | | |
| | | |
Dividends from net investment income | | | |
| | | |
Net asset value, end of period | | | |
| | | |
Supplemental data and ratios: | | | |
Net assets, end of period (000’s) | | | |
Ratio of expenses to average net assets | | | |
Before waivers and reimbursements of expenses(4) | | | |
After waivers and reimbursements of expenses(4) | | | |
Ratio of net investment income (loss) to average net assets | | | |
Before waivers and reimbursements of expenses(4) | | | |
After waivers and reimbursements of expenses(4) | | | |
Portfolio turnover rate(3) | | | |
| |
| (1) | The Fund commenced operations on April 15, 2020. |
| (2) | Per share amounts are calculated using the average shares outstanding method. |
| (3) | Not annualized for periods less than one year. |
| (4) | Annualized for periods less than one year. |
The accompanying notes are an integral part of these financial statements.
| | |
34 | Jensen Global Quality Growth Fund | Semi-Annual Report |
Jensen Global Quality Growth Fund - Class Y
| | | |
| six months
ended
November
30, 2021
(unaudited) | | period ended
May 31, 2020(1) |
Net asset value, beginning of period | | | |
Income from investment operations: | | | |
| | | |
Net realized and unrealized gain on investments | | | |
Total from investment operations | | | |
| | | |
Dividends from net investment income | | | |
| | | |
Net asset value, end of period | | | |
| | | |
Supplemental data and ratios: | | | |
Net assets, end of period (000’s) | | | |
Ratio of expenses to average net assets | | | |
Before waivers and reimbursements of expenses(4) | | | |
After waivers and reimbursements of expenses(4) | | | |
Ratio of net investment income (loss) to average net assets | | | |
Before waivers and reimbursements of expenses(4) | | | |
After waivers and reimbursements of expenses(4) | | | |
Portfolio turnover rate(3) | | | |
| |
| (1) | The Fund commenced operations on April 15, 2020. |
| (2) | Per share amounts are calculated using the average shares outstanding method. |
| (3) | Not annualized for periods less than one year. |
| (4) | Annualized for periods less than one year. |
The accompanying notes are an integral part of these financial statements.
| | |
Semi-Annual Report | Jensen Global Quality Growth Fund | 35 |
Notes to Financial Statements
November 30, 2021 (Unaudited)
Trust for Professional Managers (the “Trust”) was organized as a Delaware statutory trust under a Declaration of Trust dated May 29, 2001. The Trust is registered under the Investment Company Act of 1940, as amended (the “1940 Act”), as an open-end management investment company. The Jensen Quality Value Fund, formerly known as the Jensen Value Fund, and the Jensen Global Quality Growth Fund (each, a “Fund,” and together, the “Funds”), each represent a distinct series with its own investment objective and policies within the Trust. The investment objective of the Jensen Quality Value Fund and the Jensen Global Quality Growth Fund is long-term capital appreciation. The Trust may issue an unlimited number of shares of beneficial interest at $0.001 par value. The assets of the Funds are segregated, and a shareholder’s interest is limited to the Fund in which shares are held. The Class J and Class I shares of the Jensen Quality Value Fund became effective and commenced operations on March 31, 2010. The Class Y shares of the Jensen Quality Value Fund became effective and commenced operations on January 15, 2020. The Jensen Global Quality Growth Fund commenced investment operations on April 15, 2020 for Class J, Class I, and Class Y shares. For both Funds, Class J shares are subject to a 0.25% distribution (Rule 12b-1) and shareholder servicing fee and Class I shares are subject to a shareholder servicing fee of up to 0.10%. Each class of shares has identical rights and privileges except with respect to the distribution (Rule 12b-1) and shareholder servicing fees, and voting rights on matters affecting a single share class. Costs incurred by the Funds in connection with the organization, registration and the initial public offering of shares were paid by Jensen Investment Management, Inc. (the “Adviser”), the Funds’ investment adviser.
The Funds are investment companies and accordingly follow the investment company accounting and reporting guidance of the Financial Accounting Standards Board (“FASB”) Accounting Standard Codification Topic 946 Financial Services–Investment Companies.
2. Significant Accounting Policies
The following is a summary of significant accounting policies consistently followed by the Funds in the preparation of the financial statements. These policies are in conformity with generally accepted accounting principles in the United States of America (“GAAP”).
(a) Investment Valuation – Each equity security owned by the Funds that is listed on a securities exchange, except those listed on the NASDAQ Stock Market LLC (“NASDAQ”), is valued at its last sale price on that exchange on the date as of which assets are valued. If a security is listed on more than one exchange, the Funds will use the price of the exchange that the Funds generally consider to be the principal exchange on which the stock is traded.
Fund securities listed on NASDAQ will be valued at the NASDAQ Official Closing Price, which may not necessarily represent the last sale price. If there has been no sale on such exchange or on NASDAQ on such day, the security is valued at (i) the mean between the most recent quoted bid
| | |
36 | Jensen Quality Value Fund, Jensen Global Quality Growth Fund | Semi-Annual Report |
and asked prices at the close of the exchange or (ii) the latest sales price on the Composite Market for the day such security is being valued. “Composite Market” means a consolidation of the trade information provided by national securities and foreign exchanges and over-the-counter markets, as published by an approved independent pricing service (“Pricing Service”).
Foreign securities will be priced in their local currencies as of the close of their primary exchange or market or as of the time a Fund calculates its net asset value (“NAV”), whichever is earlier. Foreign securities, currencies and other assets denominated in foreign currencies are then translated into U.S. dollars at the exchange rate of such currencies against the U.S. dollar, as provided by a Pricing Service or reporting agency. All assets denominated in foreign currencies will be converted into U.S. dollars using the applicable currency exchange rates as of the close of the New York Stock Exchange (“NYSE”), generally 4:00 p.m. Eastern Time.
Foreign securities are traded on foreign exchanges which typically close before the close of business on each day on which the NYSE is open. Each security trading on these exchanges may be valued utilizing a systematic fair valuation model provided by a Pricing Service. The valuation of each security that meets certain criteria in relation to the valuation model is systematically adjusted to reflect the impact of movement in the U.S. market after the foreign markets close and are classified as Level 2 securities. Securities that do not meet the criteria, or that are principally traded in other foreign markets, are valued as of the last reported sale price at the time the respective Fund determines its NAV, or when reliable market prices or quotations are not readily available, at the mean between the most recent bid and asked quotations as of the close of the appropriate exchange or other designated time.
Debt securities, including short-term debt instruments having a maturity of 60 days or less, are valued at the mean in accordance with prices supplied by a Pricing Service. Pricing Services may use various valuation methodologies such as the mean between the bid and the asked prices, matrix pricing and other analytical pricing models as well as market transactions and dealer quotations. If a price is not available from a Pricing Service, the most recent quotation obtained from one or more broker-dealers known to follow the issue will be obtained. Quotations will be valued at the mean between the bid and the offer. In the absence of available quotations, the securities will be priced at fair value, as described below. Any discount or premium is accreted or amortized using the constant yield method until maturity.
Redeemable securities issued by open-end, registered investment companies are valued at the NAV of such companies for purchase and/or redemption orders placed on that day. If, on a particular day, a share of an investment company is not listed on NASDAQ, such security’s fair value will be determined. Money market mutual funds are valued at cost. If cost does not represent current market value the securities will be priced at fair value.
When market quotations are not readily available, any security or other financial instrument is valued at its fair value as determined under procedures approved by the Trust’s Board of Trustees. These fair value procedures will also be used to price a security when corporate events, events in the securities market or world events cause the Adviser to believe that a security’s last sale price may not reflect its actual fair value. The intended effect of using fair value pricing procedures is to ensure that the Funds are accurately priced.
| | |
Semi-Annual Report | Jensen Quality Value Fund, Jensen Global Quality Growth Fund | 37 |
FASB Accounting Standards Codification, “Fair Value Measurements and Disclosures” Topic 820 (“ASC 820”), establishes an authoritative definition of fair value and sets out a hierarchy for measuring fair value. ASC 820 requires an entity to evaluate certain factors to determine whether there has been a significant decrease in volume and level of activity for the security such that recent transactions and quoted prices may not be determinative of fair value and further analysis and adjustment may be necessary to estimate fair value. ASC 820 also requires enhanced disclosure regarding the inputs and valuation techniques used to measure fair value in those instances as well as expanded disclosure of valuation levels for each class of investments. These inputs are summarized in the three broad levels listed below:
| |
| Quoted prices in active markets for identical securities. |
| Other significant observable inputs (including quoted prices for similar securities, interest rates, prepayment speeds, credit risk, etc.). |
| Significant unobservable inputs (including a Fund’s own assumptions in determining the fair value of investments). |
The inputs or methodology used for valuing securities are not necessarily an indication of the risk associated with investing in those securities. The following is a summary of the inputs used to value each Fund’s investments carried at fair value as of November 30, 2021:
| | | | | |
Jensen Quality Value Fund | | | | |
| | | | | | | | | | | | |
| | | | | | | | | | | | |
| | | | | | | | | | | | |
| | | | | |
Jensen Global Quality Growth Fund | | | | |
| | | | | | | | | | | | |
| | | | | | | | | | | | |
| | | | | | | | | | | | |
(1) For further information regarding security characteristics, please see the Schedules of Investments.
The Funds did not hold any investments during the six months ended November 30, 2021 with significant unobservable inputs which would be classified as Level 3. The Funds did not hold financial derivative instruments during the six months ended November 30, 2021.
(b) Foreign Securities and Currency – Investment securities and other assets and liabilities denominated in foreign currencies are translated into U.S. dollar amounts on the date of valuation. Purchases and sales of investment securities and income and expense items denominated in foreign currencies are translated into U.S. dollar amounts on the respective dates of such transactions.
The Funds do not isolate the portion of the results of operations from changes in foreign exchange rates on investments from those resulting from the changes in market prices of securities held. Reported net realized foreign exchange gains or losses arise from sales of portfolio securities, sales
| | |
38 | Jensen Quality Value Fund, Jensen Global Quality Growth Fund | Semi-Annual Report |
and maturities of short-term securities, sales of foreign currencies, currency gains or losses realized between trade and settlement dates on securities transactions, and the difference between the amounts of dividends, interest and foreign withholding taxes recorded on the Funds’ books, and the U.S. dollar equivalent of the amounts actually received or paid. Net unrealized foreign exchange gains and losses arise from changes in the values of assets and liabilities, including investments in securities at fiscal period end, resulting from changes in the exchange rate.
Investments in foreign securities entail certain risks. Individual foreign economies of certain countries may differ favorably or unfavorably from the U.S. economy in such respects as growth of gross national product, rate of inflation, capital reinvestment, resource self-sufficiency, diversification and balance of payments position. The internal politics of certain foreign countries may not be as stable as those of the United States. Since foreign securities normally are denominated and traded in foreign currencies, the value of a Fund’s assets may be affected favorably or unfavorably by currency exchange rates, currency exchange control regulations, foreign withholding taxes, and restrictions or prohibitions on the repatriation of foreign currencies. There may be less information publicly available about a foreign issuer than about a U.S. issuer, and foreign issuers are not generally subject to accounting, auditing, and financial reporting standards and practices comparable to those in the United States. The securities of some foreign issuers are less liquid and at times more volatile than securities of comparable U.S. issuers.
(c) Federal Income Taxes – The Funds intend to comply with the requirements of Subchapter M of the Internal Revenue Code necessary to qualify as regulated investment companies and to make the requisite distributions of income and capital gains to their shareholders sufficient to relieve them from all or substantially all federal income taxes. Therefore, no federal income tax provision has been provided.
As of and during the six months ended November 30, 2021, the Funds did not have a liability for any unrecognized tax benefits. The Funds recognize interest and penalties, if any, related to uncertain tax benefits as income tax expense in the Statements of Operations. During the six months ended November 30, 2021, the Funds did not incur any interest or penalties. The Funds have no examinations in progress. The Funds are also not aware of any tax provisions for which it is reasonably possible that the total amounts of unrecognized tax benefits will significantly change in the next twelve months.
(d) Distributions to Shareholders – The Funds will declare and distribute any net investment income quarterly. The Funds will distribute any net realized long- or short-term capital gains at least annually. Distributions from net realized gains for book purposes may include short-term capital gains. All short-term capital gains are included in ordinary income for tax purposes. Distributions to shareholders are recorded on the ex-dividend date. The Funds may also pay a special distribution at the end of the calendar year to comply with federal tax requirements. The Funds may utilize earnings and profits distributed to shareholders on redemption of shares as part of the dividend paid deduction.
| | |
Semi-Annual Report | Jensen Quality Value Fund, Jensen Global Quality Growth Fund | 39 |
(e) Use of Estimates – The preparation of financial statements in conformity with GAAP requires management to make estimates and assumptions that affect the reported amounts of assets and liabilities and disclosure of contingent assets and liabilities at the date of the financial statements and the reported amounts of revenues and expenses during the reporting period. Actual results could differ from those estimates.
(f) Share Valuation – The NAV per share of each Fund is calculated by dividing the sum of the value of the securities held by each Fund, plus cash or other assets, minus all liabilities (including estimated accrued expenses) by the total number of shares outstanding for each Fund, rounded to the nearest cent. The Funds’ shares will not be priced on the days on which the NYSE is closed for trading.
(g) Allocation of Income, Expenses and Gains/Losses – Income, expenses (other than those deemed attributable to a specific share class), and gains and losses of each Fund are allocated daily to each class of shares based upon the ratio of net assets represented by each class as a percentage of the net assets of the Fund. Expenses deemed directly attributable to a class of shares are recorded by the specific class. Most Fund expenses are allocated by class based on relative net assets. Distribution (12b-1) and shareholder servicing fees are expensed at 0.25% of average daily net assets of Class J shares. Shareholder servicing fees are expensed at up to 0.10% of the average daily net assets of Class I shares. Expenses associated with a specific fund in the Trust are charged to that fund. Common Trust expenses are typically allocated evenly between the funds of the Trust, or by other equitable means.
(h) Other – Investment transactions are recorded on the trade date. The Funds determine the gain or loss from investment transactions using the specific identification method by comparing the original cost of the security lot sold with the net sale proceeds. Dividend income is recognized on the ex-dividend date and interest income is recognized on an accrual basis.
Withholding taxes on foreign dividends, net of any reclaims, have been provided for in accordance with the Funds’ understanding of the applicable country’s tax rules and rates.
The tax character of distributions paid during the fiscal years or periods ended May 31, 2021 and May 31, 2020 were as follows:
| | ; | | | | | |
Jensen Quality Value Fund | | |
| | | | | | |
| | | | | | |
| | ; | | | | | |
Jensen Global Quality Growth Fund | | |
| | | | | | |
| | | | | | |
(1) The Jensen Global Quality Growth Fund commenced operations on April 15, 2020.
| | |
40 | Jensen Quality Value Fund, Jensen Global Quality Growth Fund | Semi-Annual Report |
The components of distributable earnings on a tax basis as of May 31, 2021 were as follows:
| | | | | | | |
| | Jensen Global
Quality Growth Fund |
Cost basis of investments for federal income tax purposes | | | | | | |
Gross tax unrealized appreciation | | | | | | |
Gross tax unrealized depreciation | | | | | | |
Net tax unrealized appreciation | | | | | | |
Undistributed ordinary income | | | | | | |
Undistributed long-term capital gain | | | | | | |
| | | | | | |
| | | | | | |
Total distributable earnings | | | | | | |
The difference between book basis and tax basis of investments is primarily attributable to the deferral of losses on wash sales.
At May 31, 2021, the Jensen Global Quality Growth Fund had short-term capital loss carryovers of $32,448.
Additionally, GAAP requires that certain components of net assets relating to permanent differences be reclassified between financial and tax reporting. These reclassifications have no effect on net assets or NAV per share. The permanent difference relates to tax equalization.
On the Statements of Assets and Liabilities, the following adjustments were made for permanent tax adjustments:
| | | | | | | |
| | Jensen Global
Quality Growth Fund |
Total Distributable Earnings | | | | | | |
| | | | | | |
The Trust has an Investment Advisory Agreement (the “Agreement”) with the Adviser to furnish investment advisory services to the Funds. Under the terms of the Agreement, the Funds compensate the Adviser for its management services at the annual rate of 0.65% and 0.75% of each Fund’s average daily net assets for the Jensen Quality Value Fund and Jensen Global Quality Growth Fund, respectively.
The Adviser has contractually agreed to waive its management fee and/or reimburse a Fund’s other expenses at least through the expiration dates listed below, to the extent necessary to ensure that the Fund’s total operating expenses (exclusive of front-end or contingent deferred sales loads, Rule 12b-1 plan fees, shareholder servicing plan fees, taxes, leverage (i.e., any expenses incurred in connection with borrowings made by the Fund), interest (including interest incurred in connection with bank and custody overdrafts), brokerage commissions and other transactional expenses,
| | |
Semi-Annual Report | Jensen Quality Value Fund, Jensen Global Quality Growth Fund | 41 |
expenses incurred in connection with any merger or reorganization, dividends or interest expenses on short positions, acquired fund fees and expenses and extraordinary expenses such as litigation) do not exceed the expense limitation caps listed below of each Fund’s average daily net assets (the “Expense Limitation Cap”).
| | | | | |
| | |
Jensen Quality Value Fund | | | | |
Jensen Global Quality Growth Fund | | | | |
For the six months ended November 30, 2021, expenses of $10,045, $14,410 and $13,357 were waived or reimbursed by the Adviser for Class J, Class I and Class Y shares, respectively for the Jensen Quality Value Fund. For the six months ended November 30, 2021, expenses of $4,701, $4,358 and $62,850 were waived or reimbursed by the Adviser for Class J, Class I and Class Y shares, respectively for the Jensen Global Quality Growth Fund. Any such waiver or reimbursement is subject to later adjustment to allow the Adviser to recoup amounts waived or reimbursed to the extent actual fees and expenses for a fiscal period do not exceed the lesser of: (1) the Expense Limitation Cap in place at the time of waiver or reimbursement or (2) the Expense Limitation Cap in place at the time of the recoupment; provided, however, that the Adviser shall only be entitled to recoup such amounts over the following three year period from the date of the waiver or reimbursement. During the six months ended November 30, 2021, $75,884 of previously waived expenses subject to recovery for the Jensen Quality Value Fund expired.
The following table shows the remaining waived or reimbursed expenses subject to potential recovery expiring during the fiscal period ending:
| | | | | | | |
| | Jensen Global
Quality Growth Fund |
| | | | | | |
| | | | | | |
| | | | | | |
| | | | | | |
5. Distribution and Shareholder Servicing Plan
The Trust adopted a distribution and shareholder servicing plan pursuant to Rule 12b-1 (the “12b-1 Plan”), on behalf of the Funds, which authorizes it to pay Quasar Distributors, LLC (the “Distributor” or “Quasar”), the Funds’ distributor and principal underwriter, a distribution fee of 0.25% of a Fund’s average daily net assets attributable to Class J shares for services to Class J shareholders and distribution of Class J shares. The Trust adopted a shareholder servicing plan (the “Shareholder Servicing Plan”), on behalf of the Funds, which authorizes it to pay up to 0.10% of a Fund’s average daily net assets attributable to Class I shares to other financial institutions for shareholder servicing and maintenance of Class I shareholder accounts. The Distributor acts as the Funds’ principal
| | |
42 | Jensen Quality Value Fund, Jensen Global Quality Growth Fund | Semi-Annual Report |
underwriter in a continuous public offering of the Funds’ shares. Fees incurred for the six months ended November 30, 2021, and owed as of November 30, 2021 are summarized below. The fees owed to the Distributor are included within accrued expenses and other liabilities on the Statements of Assets and Liabilities.
| | | | | | | |
| | |
Jensen Quality Value Fund | | | | | | |
Jensen Global Quality Growth Fund | | | | | | |
| | | | | | | |
| | |
Jensen Quality Value Fund | | | | | | |
Jensen Global Quality Growth Fund | | | | | | |
6. Related Party Transactions
U.S. Bancorp Fund Services, LLC, doing business as U.S. Bank Global Fund Services (“Fund Services” or the “Administrator”), acts as the Funds’ Administrator under an Administration Agreement. The Administrator prepares various federal and state regulatory filings, reports and returns for the Funds; prepares reports and materials to be supplied to the Trustees; monitors the activities of the Funds’ custodian, transfer agent and fund accountant; coordinates the preparation and payment of the Funds’ expenses and reviews the Funds’ expense accruals. Fees incurred for the six months ended November 30, 2021, and owed as of November 30, 2021 are as follows:
| | | | | | | |
| | |
Jensen Quality Value Fund | | | | | | |
Jensen Global Quality Growth Fund | | | | | | |
Fund Services also serves as the fund accountant and transfer agent to the Funds. U.S. Bank National Association (“US Bank”), an affiliate of Fund Services, serves as the Funds’ custodian. Fees incurred for the six months ended November 30, 2021 and owed as of November 30, 2021 for fund accounting, transfer agency, and custody fees are as follows:
| | | | | | | |
| | |
Jensen Quality Value Fund | | | | | | |
Jensen Global Quality Growth Fund | | | | | | |
| | | | | | | |
| | |
Jensen Quality Value Fund | | | | | | |
Jensen Global Quality Growth Fund | | | | | | |
| | | | | | | |
| | |
Jensen Quality Value Fund | | | | | | |
Jensen Global Quality Growth Fund | | | | | | |
| | |
Semi-Annual Report | Jensen Quality Value Fund, Jensen Global Quality Growth Fund | 43 |
The Jensen Quality Value Fund and Jensen Global Quality Growth Fund have lines of credit with US Bank (see Note 10).
Certain officers of the Funds are also employees of Fund Services. A Trustee of the Trust is affiliated with Fund Services and US Bank.
The Trust’s Chief Compliance Officer is also an employee of Fund Services. Each Fund’s allocation of the Trust’s Chief Compliance Officer fees incurred for the six months ended November 30, 2021, and owed as of November 30, 2021 were as follows:
| | | | | | | |
| | |
Jensen Quality Value Fund | | | | | | |
Jensen Global Quality Growth Fund | | | | | | |
7. Capital Share Transactions
Transactions in shares of the Funds were as follows:
Jensen Quality Value Fund
| | | | | | | |
| six months ended
November 30, 2021
(Unaudited) | |
| | | | | | |
Shares issued in reinvestment of dividends | | | | | | |
| | | | | | |
| | | | | | |
| | | | | | | |
| six months ended
November 30, 2021
(Unaudited) | |
| | | | | | |
Shares issued in reinvestment of dividends | | | | | | |
| | | | | | |
| | | | | | |
| | | | | | | |
| six months ended
November 30, 2021
(Unaudited) | |
| | | | | | |
Shares issued in reinvestment of dividends | | | | | | |
| | | | | | |
| | | | | | |
| | |
44 | Jensen Quality Value Fund, Jensen Global Quality Growth Fund | Semi-Annual Report |
Jensen Global Quality Growth Fund
| | | | | | | |
| six months ended
November 30, 2021
(Unaudited) | |
| | | | | | |
Shares issued in reinvestment of dividends | | | | | | |
| | | | | | |
| | | | | | |
| | | | | | | |
| six months ended
November 30, 2021
(Unaudited) | |
| | | | | | |
Shares issued in reinvestment of dividends | | | | | | |
| | | | | | |
| | | | | | |
| | | | | | | |
| six months ended
November 30, 2021
(Unaudited) | |
| | | | | | |
Shares issued in reinvestment of dividends | | | | | | |
| | | | | | |
| | | | | | |
8. Investment Transactions
The aggregate purchases and sales of securities, excluding short-term investments, for the Funds for the six months ended November 30, 2021 are summarized below. For the six months ended November 30, 2021, there were no purchases or sales of U.S. government securities for the Funds.
| | | | | | | |
| | |
Jensen Quality Value Fund | | | | | | |
Jensen Global Quality Growth Fund | | | | | | |
| | |
Semi-Annual Report | Jensen Quality Value Fund, Jensen Global Quality Growth Fund | 45 |
The beneficial ownership, either directly or indirectly, of more than 25% of the voting securities of a fund creates a presumption of control of the fund under Section 2(a)(9) of the 1940 Act. At November 30, 2021, the following shareholders held over 25% of a Fund’s shares outstanding:
Jensen Quality Value Fund
| | | | |
| |
Charles Schwab & Co. Inc. | | | |
National Financial Services LLC | | | |
Jensen Global Quality Growth Fund
| | | | |
| |
Wells Fargo Clearing Services LLC | | | |
| | | | |
| |
Charles Schwab & Co. Inc. | | | |
At November 30, 2021, the Jensen Quality Value Fund and Jensen Global Quality Growth Fund had lines of credit in the amount of the lesser of $3,000,000 and $2,000,000, respectively, or 33.33% and 20%, respectively, of the fair value of unencumbered assets of each Fund, which mature on August 6, 2022. These secured lines of credit are intended to provide short-term financing, if necessary, subject to certain restrictions, in connection with shareholder redemptions. The interest rate on outstanding principal amounts is equal to the prime rate (3.25% as of November 30, 2021). The credit facility is with the Funds’ custodian, US Bank. During the six months ended November 30, 2021, the Jensen Quality Value Fund and Jensen Global Quality Growth Fund did not utilize their lines of credit.
| | |
46 | Jensen Quality Value Fund, Jensen Global Quality Growth Fund | Semi-Annual Report |
U.S. and international markets have experienced volatility in recent months and years due to a number of economic, political and global macro factors, including the impact of the coronavirus (COVID-19) global pandemic, which resulted in a public health crisis, business interruptions, growth concerns in the U.S. and overseas, travel restrictions, changed social behaviors, rising inflation and reduced consumer spending. While several countries, including the U.S., have begun to lift public health restrictions in efforts to reopen their respective economies, the outbreak of the Delta variant has led to the renewal of health mandates by local governments and businesses, reduced hiring efforts by employers, event cancellations and additional travel restrictions, supply chain shortages, cessation of return-to-office plans and an overall economic slowdown. While U.S. and global economies are recovering from the effects of COVID-19, the recovery is proceeding at slower than expected rates and may last for a prolonged period of time. Uncertainties regarding interest rates, political events, rising government debt in the U.S. and trade tensions have also contributed to market volatility. Global economies and financial markets are increasingly interconnected, which increases the possibility that conditions in one country or region might adversely impact issuers in a different country or region. In particular, a rise in protectionist trade policies, slowing global economic growth, risks associated with epidemic and pandemic diseases, risks associated with the United Kingdom’s departure from the European Union, the risk of trade disputes, and the possibility of changes to some international trade agreements, could affect the economies of many nations, including the United States, in ways that cannot necessarily be foreseen at the present time. Continuing market volatility as a result of recent market conditions or other events may have adverse effects on your account.
On December 15, 2021, the following distributions were declared and paid from ordinary income and capital gains to shareholders of record as of December 14, 2021:
| | | | | | | | | | |
| | | |
Jensen Quality Value Fund | | | | | | | | | |
| | | | | | | | | | |
| | | |
Jensen Quality Value Fund | | | | | | | | | |
| | | | | | | | | | |
| | | |
Jensen Quality Value Fund | | | | | | | | | |
| | |
Semi-Annual Report | Jensen Quality Value Fund, Jensen Global Quality Growth Fund | 47 |
Expense Example – November 30, 2021 (Unaudited)
As a shareholder of the Funds, you incur ongoing costs, including investment management fees, distribution (12b-1) fees (Class J only) and shareholder servicing fees (Class I only), and other Fund expenses, which are indirectly paid by shareholders. These examples are intended to help you understand your ongoing costs (in dollars) of investing in the Funds and to compare these costs with the ongoing costs of investing in other mutual funds.
The Examples are based on an investment of $1,000 invested at the beginning of the period and held for the entire period referenced in each table.
The first lines of the tables below for each share class of the Funds provide information about actual account values and actual expenses. However, the table does not include shareholder specific fees, such as the $15.00 fee charged to IRA accounts or the $15.00 fee charged for wire redemptions. The table also does not include portfolio trading commissions and related trading costs. You may use the information in these lines, together with the amount you invested, to estimate the expenses that you paid over the period. Simply divide your account value by $1,000 (for example, an $8,600 account value divided by $1,000 = 8.6), then multiply the result by the number in the first line under the heading titled “Expenses Paid During Period” to estimate the expenses you paid on your account during this period.
Hypothetical Example for Comparison Purposes
The second lines of the tables below for each share class of the Funds provide information about hypothetical account values and hypothetical expenses based on the actual expense ratios for each share class of the Funds and an assumed rate of return of 5% per year before expenses, which is not the Funds’ actual return. The hypothetical account values and expenses may not be used to estimate the actual ending account balance or expenses you paid for the period. You may use this information to compare the ongoing costs of investing in the Funds and other funds. To do so, compare this 5% hypothetical example with the 5% hypothetical examples that appear in the shareholder reports of the other funds.
Please note that the expenses shown in the table are meant to highlight your ongoing costs only and do not reflect any transactional costs, such as sales charges (loads), redemption fees, or exchange fees which, although not charged by the Funds, may be charged by other funds. Therefore, the second lines of the tables are useful in comparing ongoing costs only, and will not help you determine the relative total costs of owning different funds.
| | |
48 | Jensen Quality Value Fund, Jensen Global Quality Growth Fund | Semi-Annual Report |
Expense Example Tables (Unaudited)
| | | | | | | | | | |
Jensen Quality Value Fund – Class J | Beginning
Account Value
June 1, 2021 | Ending
Account Value
November 30, 2021 | Expenses Paid
During Period*
June 1, 2021 –
November 30, 2021 |
| | | | | | | | | |
Hypothetical (5% return before expenses) | | | | | | | | | |
| |
| Expenses are equal to Class J’s annualized expense ratio of 1.05%, multiplied by the average account value over the period, multiplied by 183/365 to reflect the one-half year period. |
| | | | | | | | | | |
Jensen Quality Value Fund – Class I | Beginning
Account Value
June 1, 2021 | Ending
Account Value
November 30, 2021 | Expenses Paid
During Period*
June 1, 2021 –
November 30, 2021 |
| | | | | | | | | |
Hypothetical (5% return before expenses) | | | | | | | | | |
| |
| Expenses are equal to Class I’s annualized expense ratio of 0.82%, multiplied by the average account value over the period, multiplied by 183/365 to reflect the one-half year period. |
| | | | | | | | | | |
Jensen Quality Value Fund – Class Y | Beginning
Account Value
June 1, 2021 | Ending
Account Value
November 30, 2021 | Expenses Paid
During Period*
June 1, 2021 –
November 30, 2021 |
| | | | | | | | | |
Hypothetical (5% return before expenses) | | | | | | | | | |
| |
| Expenses are equal to Class Y’s annualized expense ratio of 0.80%, multiplied by the average account value over the period, multiplied by 183/365 to reflect the one-half year period. |
| | | | | | | | | | |
Jensen Global Quality Growth Fund –
Class J | Beginning
Account Value
June 1, 2021 | Ending
Account Value
November 30, 2021 | Expenses Paid
During Period*
June 1, 2021 –
November 30, 2021 |
| | | | | | | | | |
Hypothetical (5% return before expenses) | | | | | | | | | |
| |
| Expenses are equal to Class J’s annualized expense ratio of 1.25%, multiplied by the average account value over the period, multiplied by 183/365 to reflect the one-half year period. |
| | |
Semi-Annual Report | Jensen Quality Value Fund, Jensen Global Quality Growth Fund | 49 |
| | | | | | | | | | |
Jensen Global Quality Growth Fund –
Class I | Beginning
Account Value
June 1, 2021 | Ending
Account Value
November 30, 2021 | Expenses Paid
During Period*
June 1, 2021 –
November 30, 2021 |
| | | | | | | | | |
Hypothetical (5% return before expenses) | | | | | | | | | |
| |
| Expenses are equal to Class I’s annualized expense ratio of 1.02%, multiplied by the average account value over the period, multiplied by 183/365 to reflect the one-half year period. |
| | | | | | | | | | |
Jensen Global Quality Growth Fund –
Class Y | Beginning
Account Value
June 1, 2021 | Ending
Account Value
November 30, 2021 | Expenses Paid
During Period*
June 1, 2021 –
November 30, 2021 |
| | | | | | | | | |
Hypothetical (5% return before expenses) | | | | | | | | | |
| |
| Expenses are equal to Class Y’s annualized expense ratio of 1.00%, multiplied by the average account value over the period, multiplied by 183/365 to reflect the one-half year period. |
1. Shareholder Notification of Federal Tax Status
The Jensen Quality Value Fund and Jensen Global Quality Growth Fund designated 93.33% and 100.00%, respectively, of dividends declared during the fiscal year ended May 31, 2021 as dividends qualifying for the dividends received deduction available to corporate shareholders.
The Jensen Quality Value Fund and Jensen Global Quality Growth Fund designated 93.33% and 100.00%, respectively, of dividends declared from net investment income during the fiscal year ended May 31, 2021 as qualified dividend income under the Jobs and Growth Tax Relief Reconciliation Act of 2003.
The Jensen Quality Value Fund and Jensen Global Quality Growth Fund designated 56.68% and 0.00%, respectively, of taxable ordinary income distributions as short-term capital gain distributions under Internal Revenue Code Section 871(k)(2)(c) for the year ended May 31, 2021.
Additional Information Applicable to Foreign Shareholders Only:
The Jensen Quality Value Fund and Jensen Global Quality Growth Fund each designated 0.00% of ordinary income distributions as interest-related dividends under Internal Revenue Code Section 871(k)(1)(c).
2. Availability of Proxy Voting Information
The Funds have adopted proxy voting policies and procedures that delegate to the Adviser the authority to vote proxies. A description of the Funds’ proxy voting policies and procedures is available without charge, upon request, by calling the Funds toll free at 800-992-4144. A description of these policies and procedures is also included in the Funds’ Statement of Additional Information, which is available on the SEC’s website at http://www.sec.gov.
| | |
50 | Jensen Quality Value Fund, Jensen Global Quality Growth Fund | Semi-Annual Report |
The Funds’ proxy voting record for the most recent 12-month period ended June 30 is available without charge, upon request, by calling toll free, 800-992-4144, or by accessing the SEC’s website at http://www.sec.gov.
The Funds file a complete schedule of portfolio holdings with the SEC for the first and third quarters of each fiscal year on Part F of Form N-PORT. Shareholders may view the Funds’ Form N-PORT reports on the SEC’s website at http://www.sec.gov.
In an effort to decrease costs, the Funds intend to reduce the number of duplicate prospectuses, supplements and certain other shareholder documents you receive by sending only one copy of each to those addresses shared by two or more accounts and to shareholders the Funds reasonably believe are from the same family or household. Once implemented, if you would like to discontinue householding for your accounts, please call the Funds toll-free at 800-992-4144 to request individual copies of these documents. Once the Funds receive notice to stop householding, the Funds will begin sending individual copies 30 days after receiving your request. This policy does not apply to account statements.
| | |
Semi-Annual Report | Jensen Quality Value Fund, Jensen Global Quality Growth Fund | 51 |
Basis for Trustees’ Approval of Investment Advisory Agreement
The Board of Trustees (the “Trustees”) of Trust for Professional Managers (the “Trust”) met on August 4, 2021 to consider the renewal of the Investment Advisory Agreement (the “Agreement”) between the Trust, on behalf of the Jensen Quality Value Fund (the “Quality Value Fund”) and the Jensen Global Quality Growth Fund (the “Global Quality Growth Fund”) (each, a “Fund,” and together, the “Funds”), each a series of the Trust, and Jensen Investment Management, Inc., the Funds’ investment adviser (the “Adviser”). The Trustees also met at a prior meeting held on June 23, 2021 (the “June 23, 2021 Meeting”) to review materials related to the renewal of the Agreement. Prior to these meetings, the Trustees requested and received materials to assist them in considering the renewal of the Agreement. The materials provided contained information with respect to the factors enumerated below, including a copy of the Agreement, a memorandum prepared by the Trust’s outside legal counsel discussing in detail the Trustees’ fiduciary obligations and the factors they should assess in considering the renewal of the Agreement, detailed comparative information relating to the Funds’ performance, as well as the management fees and other expenses of the Funds, due diligence materials relating to the Adviser (including a due diligence questionnaire completed on behalf of the Funds by the Adviser, the Adviser’s Form ADV, select financial statements of the Adviser, biographical information of the Adviser’s key management and compliance personnel, comparative fee information for the Funds and a summary detailing key provisions of the Adviser’s written compliance program, including its code of ethics) and other pertinent information. The Trustees also received information periodically throughout the year that was relevant to the Agreement renewal process, including performance, management fee and other expense information. Based on their evaluation of the information provided by the Adviser, in conjunction with the Funds’ other service providers, the Trustees, by a unanimous vote (including a separate vote of the Trustees who are not “interested persons,” as that term is defined in the Investment Company Act of 1940, as amended (the “Independent Trustees”)), approved the continuation of the Agreement for an additional one-year term ending August 31, 2022.
Discussion of Factors Considered
In considering the renewal of the Agreement and reaching their conclusions, the Trustees reviewed and analyzed various factors that they determined were relevant, including the factors enumerated below.
1. Nature, Extent and Quality of Services Provided to the Funds
The Trustees considered the nature, extent and quality of services provided by the Adviser to the Funds and the amount of time devoted by the Adviser’s staff to the Funds’ operations. The Trustees considered the Adviser’s specific responsibilities in all aspects of day-to-day management of the Funds, as well as the qualifications, experience and responsibilities of Eric H. Schoenstein, co-portfolio manager for the Jensen Global Quality Growth Fund and the Jensen Quality Value Fund, Kurt M. Havnaer, Adam D. Calamar and Tyra Pratt, co-portfolio managers for the Jensen Quality Value Fund, Robert D. McIver, Allen T. Bond, Keven J. Walkush, co-portfolio managers for the Jensen
| | |
52 | Jensen Quality Value Fund, Jensen Global Quality Growth Fund | Semi-Annual Report |
Global Quality Growth Fund, and other key personnel at the Adviser involved in the day-to-day activities of the Funds. The Trustees reviewed information provided by the Adviser in a due diligence questionnaire, including the structure of the Adviser’s compliance program and discussed the Adviser’s marketing activities and its continuing commitment to the Funds. The Trustees noted that during the course of the prior year the Adviser had participated in a Trust board meeting to discuss various performance, marketing and compliance issues. The Trustees also noted any services that extended beyond portfolio management, and they considered the brokerage practices of the Adviser. The Trustees discussed the Adviser’s handling of compliance matters, including the reports of the Trust’s chief compliance officer to the Trustees on the effectiveness of the Adviser’s compliance program. The Trustees also considered the Adviser’s overall financial condition, as well as the implementation and operational effectiveness of the Adviser’s business continuity plan in response to the novel coronavirus (COVID-19) pandemic and challenges to day-to-day operations. The Trustees concluded that the Adviser had sufficient quality and depth of personnel, resources, investment methods and compliance policies and procedures essential to performing its duties under the Advisory Agreement and that the nature, overall quality and extent of the management services provided to the Funds, as well as the Adviser’s compliance program, were satisfactory and reliable.
2. Investment Performance of the Funds and the Adviser
The Trustees discussed the performance of the Jensen Quality Value Fund’s Class I shares for the quarter, one-year, three-year, five-year, ten-year and since inception periods ended March 31, 2021. The Trustees discussed the performance of the Jensen Global Quality Growth Fund’s Class I shares for the quarter and since inception periods ended March 31, 2021. In assessing the quality of the portfolio management services provided by the Adviser, the Trustees also compared the short-term and longer-term performance of the Class I shares of each Fund on both an absolute basis and in comparison to a benchmark index (the Russell 2500® Total Return Index for the Jensen Quality Value Fund and the MSCI All Country World Index Net for the Jensen Global Quality Growth Fund). The Trustees also compared the Jensen Quality Value Fund’s Class J shares performance for the quarter, one-year, three-year, five-year and ten-year periods ended March 31, 2021, and the Jensen Global Quality Growth Fund’s Class Y shares performance for the quarter period ended March 31, 2021, in comparison to a peer group of funds in each Fund’s current Morningstar category as constructed by data presented by Morningstar Direct (a peer group of U.S. open-end mid-cap value funds for the Jensen Quality Value Fund, and a peer group of U.S. open-end world large stock funds for the Jensen Global Quality Growth Fund) (each a “Morningstar Peer Group”). The Trustees noted the Adviser did not manage any other accounts with the same or similar investment strategies as either Fund.
The Trustees noted that for the three-year, five-year and ten-year periods ended March 31, 2021, the Jensen Quality Value Fund’s performance for Class J shares ranked above the Morningstar Peer Group median. The Trustees noted that for the quarter and one-year periods ended March 31, 2021, the Jensen Quality Value Fund’s performance for Class J shares ranked below the Morningstar Peer Group median. The Trustees also noted that for the quarter, one-year, three-year, five-year, ten-year and since inception periods ended March 31, 2021, the Jensen Quality Value Fund’s Class I shares had underperformed the Russell 2500® Total Return Index.
| | |
Semi-Annual Report | Jensen Quality Value Fund, Jensen Global Quality Growth Fund | 53 |
The Trustees noted that for the quarter period ended March 31, 2021, the Jensen Global Quality Growth Fund’s performance for Class Y shares ranked below the Morningstar Peer Group median. The Trustees also noted that for the quarter and since inception periods ended March 31, 2021, the Jensen Global Quality Growth Fund’s Class I shares had underperformed the MSCI ACWI Net Index.
After considering all of the information, the Trustees concluded that the performance obtained by the Adviser for the Fund was satisfactory under current market conditions. Although past performance is not a guarantee or indication of future results, the Trustees determined that the Fund and its shareholders were likely to benefit from the Adviser’s continued management.
3. Costs of Services Provided and Profits Realized by the Adviser
The Trustees considered the cost of services and the structure of the Adviser’s fees, including a review of the expense analyses and other pertinent material with respect to the Funds. The Trustees reviewed the related statistical information and other materials provided, including the comparative expenses, expense components and peer group selection. The Trustees also considered the cost structure of each Fund relative to its Morningstar Peer Group, as well as any fee waivers and expense reimbursements of the Adviser.
The Trustees also considered the overall profitability of the Adviser, reviewing the Adviser’s financial information and noted that the Adviser had subsidized the Funds’ operations since each Fund’s inception, and had not yet recouped those subsidies. The Trustees also examined the level of profits realized by the Adviser from the fees payable under the Advisory Agreement, as well as the Funds’ brokerage practices. These considerations were based on materials requested by the Trustees and the Funds’ administrator specifically for the June 23, 2021 meeting and the August 4, 2021 meeting at which the Advisory Agreement was formally considered, as well as the reports prepared by the Adviser over the course of the year.
The Trustees noted that the Jensen Quality Value Fund’s contractual management fee of 0.65% was below its Morningstar Peer Group average of 0.69%. The Trustees observed that the Jensen Quality Value Fund’s total expense ratio of 0.80% (net of fee waivers and expense reimbursements) for Class J shares was below the Morningstar Peer Group average (which excludes Rule 12b-1 fees) of 0.92%.
The Trustees noted that the Jensen Global Quality Growth Fund’s contractual management fee of 0.75% was slightly above its Morningstar Peer Group average of 0.74%. The Trustees observed that the Jensen Global Quality Growth Fund’s total expense ratio of 1.00% (net of fee waivers and expense reimbursements) for Class Y shares was above the Morningstar Peer Group average (which excludes Rule 12b-1 fees) of 0.85%.
The Trustees concluded that the Funds’ expenses and the management fees paid to the Adviser were fair and reasonable in light of the comparative performance, expense and management fee information. The Trustees further concluded, based on a profitability analysis prepared by the Adviser, that neither Fund was profitable to the Adviser, but the Adviser maintained adequate profit levels to support its services to the Funds from the revenues of its overall investment advisory business, despite its subsidies to support the Funds’ operations.
| | |
54 | Jensen Quality Value Fund, Jensen Global Quality Growth Fund | Semi-Annual Report |
4. Extent of Economies of Scale as the Funds Grow
The Trustees compared each Fund’s expenses relative to its peer group and discussed realized and potential economies of scale. The Trustees also reviewed the structure of each Fund’s management fee and whether the Fund was large enough to generate economies of scale for shareholders or whether economies of scale would be expected to be realized as Fund assets grow (and if so, how those economies of scale were being or would be shared with shareholders). The Trustees reviewed the fee waivers, expense reimbursements and potential recoupments by the Adviser with respect to each Fund. The Trustees noted that each Fund’s management fee structure did not contain any breakpoint reductions as the Funds’ assets grow in size, but that the feasibility of incorporating breakpoints would continue to be reviewed on a regular basis. With respect to the Adviser’s fee structures, the Trustees concluded that the current fee structures were reasonable and reflected a sharing of economies of scale between the Adviser and each Fund at the Fund’s current asset level.
5. Benefits Derived from the Relationship with the Funds
The Trustees considered the direct and indirect benefits that could be realized by the Adviser from its association with the Funds. The Trustees concluded that the benefits the Adviser may receive, such as greater name recognition or the ability to attract additional investor assets appear to be reasonable, and in many cases may benefit the Funds.
The Trustees considered all of the foregoing factors. In considering the renewal of the Advisory Agreement, the Trustees did not identify any one factor as all-important, but rather considered these factors collectively in light of each Fund’s surrounding circumstances. Based on this review, the Trustees, including a majority of the Independent Trustees, approved the continuation of the Advisory Agreement for an additional term ending August 31, 2022 as being in the best interests of each Fund and its shareholders.
| | |
Semi-Annual Report | Jensen Quality Value Fund, Jensen Global Quality Growth Fund | 55 |
Notice of Privacy Policy & Practices
We collect non-public personal information about you from the following sources:
•
information we receive about you on applications or other forms;
•
information you give us orally; and
•
information about your transactions with us or others.
We do not disclose any non-public personal information about our shareholders or former shareholders without the shareholder’s authorization, except as permitted by law or in response to inquiries from governmental authorities. We may share information with affiliated parties and unaffiliated third parties with whom we have contracts for servicing the Funds. We will provide unaffiliated third parties with only the information necessary to carry out their assigned responsibility. All shareholder records will be disposed of in accordance with applicable law. We maintain physical, electronic and procedural safeguards to protect your non-public personal information and require third parties to treat your non-public personal information with the same high degree of confidentiality.
In the event that you hold shares of the Funds through a financial intermediary, including, but not limited to, a broker-dealer, bank or trust company, the privacy policy of your financial intermediary would govern how your non-public personal information would be shared with unaffiliated third parties.
Under the Trust’s organizational documents, its officers and Trustees are indemnified against certain liabilities arising out of the performance of their duties to the Funds. In addition, in the normal course of business, the Funds enter into contracts that provide general indemnifications to other parties. The Funds’ maximum exposure under these arrangements is unknown as this would involve future claims that may be made against the Funds that have not yet occurred. However, the Funds have not had prior claims or losses pursuant to these contracts and expects the risk of loss to be remote.
Information About Trustees
The business and affairs of the Trust are managed under the direction of the Trust’s Board of Trustees. Information pertaining to the Trustees of the Trust is set forth below. The Statement of Additional Information includes additional information about the Trustees and is available, without charge, upon request by calling 800-992-4144.
| | |
56 | Jensen Quality Value Fund, Jensen Global Quality Growth Fund | Semi-Annual Report |
Independent Trustees (Unaudited)
| | | | | |
Name, Address and
Year of Birth | Position(s)
Held with
the Trust | Term of Office
and Length of
Time Served | Number of
Portfolios
in Trust
Overseen
by Trustee | Principal Occupation(s)
During the Past Five Years | Other Directorships
Held by Trustee
During the Past Five
Years |
Michael D. Akers,
Ph.D.
615 E. Michigan St.
Milwaukee, WI 53202
Year of Birth: 1955 | | Indefinite Term;
Since August 22,
2001 | | Professor Emeritus, Department of Accounting (June 2019-present), Professor, Department of Accounting (2004-2019), Chair, Department of Accounting (2004-2017), Marquette University. | Independent Trustee, USA MUTUALS (an open-end investment company) (2001-2021). |
Gary A. Drska
615 E. Michigan St.
Milwaukee, WI 53202
Year of Birth: 1956 | | Indefinite Term;
Since August 22,
2001 | | Pilot, Frontier/ Midwest Airlines, Inc. (airline company) (1986-present). | Independent Trustee, USA MUTUALS (an open-end investment company) (2001-2021). |
| | |
Semi-Annual Report | Jensen Quality Value Fund, Jensen Global Quality Growth Fund | 57 |
Interested Trustee and Officers (Unaudited)
| | | | | |
Name, Address and
Year of Birth | Position(s)
Held with
the Trust | Term of Office
and Length of
Time Served | Number of
Portfolios
in Trust
Overseen
by Trustee | Principal Occupation(s)
During the Past Five Years | Other Directorships
Held by Trustee
During the Past Five
Years |
Joseph C. Neuberger*
615 E. Michigan St.
Milwaukee, WI 53202
Year of Birth: 1962 | | Indefinite Term;
Since August 22,
2001 | | President (2017-present), Chief Operating Officer (2016-2020), Executive Vice President (1994-2017), U.S. Bancorp Fund Services, LLC. | Trustee; USA Mutuals (an open-end investment company) (2001-2018); Trustee, Buffalo Funds (an open-end investment company) (2003-2017). |
John P. Buckel
615 E. Michigan St.
Milwaukee, WI 53202
Year of Birth: 1957 | President
and Principal
Executive
Officer | Indefinite Term;
Since January 24,
2013 | | Vice President, U.S. Bancorp Fund Services, LLC (2004-present). | |
Jennifer A. Lima
615 E. Michigan St.
Milwaukee, WI 53202
Year of Birth: 1974 | Vice
President,
Treasurer
and Principal
Financial and
Accounting
Officer | Indefinite Term;
Since January 24,
2013 | | Vice President, U.S. Bancorp Fund Services, LLC (2002-present). | |
Deanna B. Marotz
615 E. Michigan St.
Milwaukee, WI 53202
Year of Birth: 1965 | Chief
Compliance
Officer, Vice
President
and Anti-
Money
Laundering
Officer | Indefinite Term;
Since October 21,
2021 | | Senior Vice President, U.S. Bancorp Fund Services, LLC (2021-present); Chief Compliance Officer of Keeley-Teton Advisors, LLC and Teton Advisors, Inc. (2017-2021); Chief Compliance Officer of Keeley Asset Management Corp. (2015-2017). | |
Jay S. Fitton
615 E. Michigan St.
Milwaukee, WI 53202
Year of Birth: 1970 | | Indefinite Term;
Since July 22,
2019 | | Assistant Vice President, U.S. Bancorp Fund Services, LLC (2019-present); Partner, Practus, LLP (2018- 2019); Counsel, Drinker Biddle & Reath LLP (2016-2018). | |
| | |
58 | Jensen Quality Value Fund, Jensen Global Quality Growth Fund | Semi-Annual Report |
| | | | | |
Name, Address and
Year of Birth | Position(s)
Held with
the Trust | Term of Office
and Length of
Time Served | Number of
Portfolios
in Trust
Overseen
by Trustee | Principal Occupation(s)
During the Past Five Years | Other Directorships
Held by Trustee
During the Past Five
Years |
Kelly A. Strauss
615 E. Michigan St.
Milwaukee, WI 53202
Year of Birth: 1987 | | Indefinite Term;
Since April 23,
2015 | | Assistant Vice
President, U.S. Bancorp
Fund Services, LLC
(2011-present). | |
Melissa Aguinaga
615 E. Michigan St.
Milwaukee, WI 53202
Year of Birth: 1987 | | Indefinite Term;
Since July 1,
2015 | | Assistant Vice
President, U.S. Bancorp
Fund Services, LLC
(2010-present). | |
Laura A. Carroll
615 E. Michigan St.
Milwaukee, WI 53202
Year of Birth: 1985 | | Indefinite Term;
Since August 20,
2018 | | Assistant Vice
President, U.S. Bancorp
Fund Services, LLC
(2007-present). | |
| |
| Mr. Neuberger is deemed to be an “interested person” of the Trust as defined by the 1940 Act due to his position and material business relationship with the Trust. |
| | |
Semi-Annual Report | Jensen Quality Value Fund, Jensen Global Quality Growth Fund | 59 |
| | | |
|
Jensen Quality Value Fund
Jensen Global Quality Growth Fund |
| | | |
|
Investment Adviser
Jensen Investment Management, Inc.
5500 Meadows Road, Suite 200
Lake Oswego, OR 97035
800.992.4144 Fund Administrator, Transfer Agent and Fund Accountant
U.S. Bancorp Fund Services, LLC doing business as
U.S. Bank Global Fund Services
615 East Michigan Street
Milwaukee, WI 53202 Custodian
U.S. Bank, N.A.
Custody Operations
1555 N. RiverCenter Drive, Suite 302
Milwaukee, WI 53212 Legal Counsel
Godfrey & Kahn, S.C.
833 East Michigan Street, Suite 1800
Milwaukee, WI 53202 Independent Registered Public Accounting Firm
Cohen & Company, Ltd.
1350 Euclid Avenue, Suite 800
Cleveland, OH 44115 Distributor
Quasar Distributors, LLC
111 East Kilborn Avenue, Suite 2200
Milwaukee, WI 53202 |
This report has been prepared for shareholders and may be distributed to others only if preceded or accompanied by a current prospectus. |
(b) Not applicable.
Item 2. Code of Ethics.
Not applicable for semi-annual reports.
Item 3. Audit Committee Financial Expert.
Not applicable for semi-annual reports.
Item 4. Principal Accountant Fees and Services.
Not applicable for semi-annual reports.
Item 5. Audit Committee of Listed Registrants.
Not applicable to registrants who are not listed issuers (as defined in Rule 10A-3 under the Securities Exchange Act of 1934).
Item 6. Investments.
| (a) | Schedule of Investments is included as part of the report to shareholders filed under Item 1 of this Form. |
| | |
| (b) | Not Applicable. |
Item 7. Disclosure of Proxy Voting Policies and Procedures for Closed-End Management Investment Companies.
Not applicable to open-end investment companies.
Item 8. Portfolio Managers of Closed-End Management Investment Companies.
Not applicable to open-end investment companies.
Item 9. Purchases of Equity Securities by Closed-End Management Investment Company and Affiliated Purchasers.
Not applicable to open-end investment companies.
Item 10. Submission of Matters to a Vote of Security Holders.
There have been no material changes to the procedures by which shareholders may recommend nominees to the registrant’s board of trustees.
1
Item 11. Controls and Procedures.
| (a) | The Registrant’s President and Treasurer have reviewed the Registrant's disclosure controls and procedures (as defined in Rule 30a-3(c) under the Investment Company Act of 1940 (the “Act”)) as of a date within 90 days of the filing of this report, as required by Rule 30a-3(b) under the Act and Rules 13a-15(b) or 15d-15(b) under the Securities Exchange Act of 1934. Based on their review, such officers have concluded that the disclosure controls and procedures are effective in ensuring that information required to be disclosed in this report is appropriately recorded, processed, summarized and reported and made known to them by others within the Registrant and by the Registrant’s service provider. |
| |
| (b) | There were no changes in the Registrant's internal control over financial reporting (as defined in Rule 30a-3(d) under the Act) that occurred during the period covered by this report that has materially affected, or is reasonably likely to materially affect, the Registrant's internal control over financial reporting. |
Item 12. Disclosure of Securities Lending Activities for Closed-End Management Investment Companies.
Not applicable to open-end investment companies.
Item 13. Exhibits.
2
SIGNATURES
Pursuant to the requirements of the Securities Exchange Act of 1934 and the Investment Company Act of 1940, the registrant has duly caused this report to be signed on its behalf by the undersigned, thereunto duly authorized.
| | (Registrant) | Trust for Professional Managers |
| By (Signature and Title)* | /s/ John Buckel |
| | John Buckel, President |
Pursuant to the requirements of the Securities Exchange Act of 1934 and the Investment Company Act of 1940, this report has been signed below by the following persons on behalf of the registrant and in the capacities and on the dates indicated.
| By (Signature and Title)* | /s/ John Buckel |
| | John Buckel, President |
| By (Signature and Title)* | /s/ Jennifer Lima |
| | Jennifer Lima, Treasurer |
* Print the name and title of each signing officer under his or her signature.
3