Semi-Annual Report
March 31, 2022
CrossingBridge Low Duration High Yield Fund
Institutional Class
(CBLDX)
CrossingBridge Responsible Credit Fund
Institutional Class
(CBRDX)
CrossingBridge Ultra-Short Duration Fund
Institutional Class
(CBUDX)
CrossingBridge Pre-Merger SPAC ETF
(SPC)
Investment Adviser
CrossingBridge Advisors, LLC
427 Bedford Road
Suite 220
Pleasantville, New York 10570
Phone: 1-888-898-2780
Table of Contents
| COMMENTARY | 3 |
| MANAGEMENT’S DISCUSSION OF | |
| FUND PERFORMANCE AND ANALYSIS | 7 |
| EXPENSE EXAMPLE | 15 |
| INVESTMENT HIGHLIGHTS | 17 |
| SCHEDULES OF INVESTMENTS | 25 |
| STATEMENTS OF ASSETS AND LIABILITIES | 57 |
| STATEMENTS OF OPERATIONS | 59 |
| STATEMENTS OF CHANGES IN NET ASSETS | 61 |
| FINANCIAL HIGHLIGHTS | 66 |
| NOTES TO FINANCIAL STATEMENTS | 71 |
| ADDITIONAL INFORMATION | 91 |
Commentary
Our Q1 2022 letter was titled Locomotive Breath, which we believe portrays a loss of control resulting from extreme, unanticipated events and the need to make the best of it as we go forward, which could describe today’s geopolitical and economic backdrop. In our 2021 year-end letter, we anticipated significant volatility. However, the events in the beginning of 2022 have been beyond our expectations with the Russian invasion of Ukraine exacerbating ongoing challenges posed by inflation and supply chain bottlenecks. Capital preservation and investment success often come down to how an investor weathers these episodes and finds ways to take advantage of them.
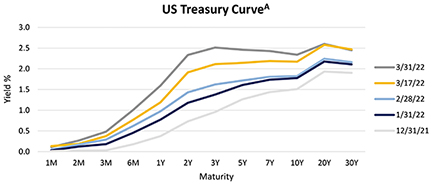
The series of yield curves above reflects the crux of investors’ concerns. Beginning in 2021 and gaining momentum throughout the year, the U.S. economy was running “hot” leading to a steady decline in unemployment, rising wages and an ongoing increase in demand for goods causing inflation. This was compounded by supply chain bottlenecks and labor shortages. The Federal Reserve actively messaged its concern that inflation was no longer “transitory” and its intent to pursue policy to prevent a “runaway train.” Thus, the rise in yields in January and early February 2022 reflects the fact that “Mr. Market” was well prepared for the Federal Reserve to begin reversing its expansionary monetary policy.
Investors were not prepared for the Russian invasion of Ukraine that began on February 24th. Markets reacted quickly, but the typical “flight to quality” into U.S. Treasuries did not occur. Why? Energy and food prices spiked sharply raising fears that inflation might go out of control, similar to the 1970s, given Russia and Ukraine’s roles as significant global producers. On March 16th, true to their word, the Federal Reserve raised the Fed Funds Rate by 25 basis points and indicated that they would raise rates at each meeting through the end of 2022 and possibly into 2023.
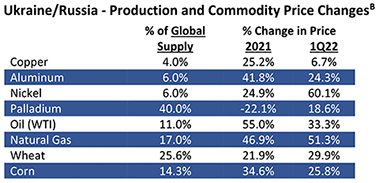
As shown above, oil and gas prices jumped dramatically after many Western countries barred the purchase of Russian-produced energy, effectively taking it off the market. Food prices also rose substantially since Ukrainian farming, which accounts for 8.0% and 13.2% of world wheat and corn exportsc, respectively, was severely reduced by the war. Food prices were also impacted by higher cost for fertilizer, transportation and packaging, which are tied to oil and gas prices. Although Russia is not a major producer of copper, aluminum and nickel, challenges to global supply caused by the war propelled their prices higher. Further, the rise in the price of palladium in Q1 2022 is representative of lesser-known commodities, including helium, neon, argon, krypton and xenon, for which Russia and/or Ukraine are major suppliers. These gases are critical inputs in high tech products such as semiconductors, which have experienced shortages due to supply chain disruptions.
SPAC Update
Special Purpose Acquisition Companies (SPACs) represent a significant holding in our Funds.1 We recognize that the SPAC market has slowed and the SEC has issued proposed regulations concerning disclosures that may impact the volume of issuance going forward,2 but we remain confident that this is a permanent asset class for capital formation.3 Regardless, the outstanding issuance is plentiful for ultra-short investing at attractive yields with limited credit risk as long as one purchases SPACs below trust value and always redeems.
________________
1 | At 3/31/22, CrossingBridge Low Duration High Yield Fund held 11.3% of its net assets in SPACs, CrossingBridge Ultra-Short Duration Fund held 12.1% of its net assets in SPACs, CrossingBridge Responsible Credit Fund held 17.2% of its net assets in SPACs and CrossingBridge Pre-Merger SPAC ETF held 99.3% of its net assets in SPACs. |
2 | For an academic study regarding the quality and effect of greater disclosure for SPACs, see SPACs and Forward-Looking Disclosure: Hype or Information, Chapman, Frankel and Martin, October 2021 |
3 | For an academic study of the merit of capital formation via SPAC transactions, see PE for the Public: The Rise of SPACs, Gryglewicz, Hartman-Glaser and Mayer, 3/18/22 |
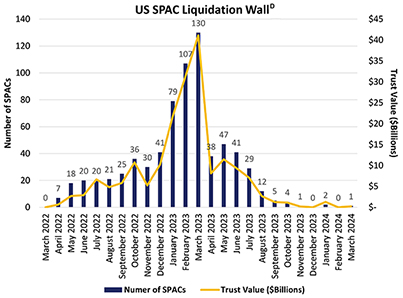
As shown at the bottom of the previous page, there are billions of dollars of capital in trust accounts of SPACs that have yet to complete a merger. However, as each day passes, they are moving toward the date at which they must liquidate, returning their capital to shareholders. This effectively represents the universe of SPACs from which we can select investments for our fixed income-oriented approach to SPACs. The spike in the number of SPACs reaching their liquidation date in early 2023 is an echo of the peak in SPAC issuance during the summer of 2021, reflecting the typical 18-month period during which a SPAC can look for a merger partner.

Despite a slowdown in SPAC issuance in Q1 2022, the number SPACs seeking merger partners and the capital they represent increased during the quarter, providing a growing opportunity set for our investment in SPACs. In addition, the yield to liquidation increased by 49 basis points, reflecting the rise in interest rates, while the months to liquidation declined by nearly 3 months. At quarter-end, the Treasury yield for a T-Bill with maturity 10.6 months out was approximately 1.59%F; thus, on average, an investment in SPACs seeking merger partners had a yield to liquidation that exceeded the yield on the comparable T-Bill by 115 basis points. The yield achieved on a portfolio of such SPACs would likely be higher as some SPAC mergers will likely take place earlier than the liquidation date, thus speeding up the return of capital to shareholders who elect to redeem their shares.
Dynamic Braking
“Dynamic braking” is used to stop runaway trains.4 Similarly, the Fed is using higher interest rates and quantitative tightening to quell inflation. Whether they will be successful, we have no opinion.
Some have taken note that the yield curve has inverted5 between the 3-year and 10-year maturities and pointed to curve inversion as a harbinger of recession. However, members of the Federal Reserve have been dismissive of the signaling power of a 2-year versus 10-year inversion and only become concerned when an inversion of the 3-month T-Bill versus the 10-year bond becomes deeply negative and persistent.G Thus, with the curve quite steep beyond 3 months, the labor market red-hot and GDP at its highest level in over 20 yearsH a recession may seem far off. But what do we know? We remain defensively positioned with a lot of dry powder, prepared to very selectively take advantage of opportunities as they appear.
Focusing on the fundamentals,
David K. Sherman and CrossingBridge Team
________________
4 | For those interested, we recommend Train Wreck: The Forensics of Rail Disaster, George Bibel, The Johns Hopkins University Press 2012 |
5 | An “inverted” yield curve is one in which shorter rates are higher than longer rates. |
Endnotes
________________
A | Bloomberg |
B | Bloomberg and Ukraine/Russia conflict: The read-through for US HY supply chains, Goldman Sachs, 3/11/22 |
C | Ukraine/Russia conflict: The read-through for US HY supply chains, Goldman Sachs, 3/11/22 |
D | www.SPACinformer.com. SPACinformer.com is owned by eBuild Ventures, an affiliate of Cohanzick Management, LLC, the parent company of CrossBridge Advisors, LLC. |
E | www.SPACinformer.com. SPACinformer.com is owned by eBuild Ventures, an affiliate of Cohanzick Management, LLC, the parent company of CrossBridge Advisors, LLC. |
F | The 1.375% Treasury Bond maturing on February 15, 2023 had a yield to maturity of 1.59% on March 31, 2022. |
G | Yield curve: Flashing orange, Barclays, 3/29/22 |
H | Bloomberg |
Disclosures
Opinions expressed are subject to change at any time, are not guaranteed and should not be considered investment advice.
Past performance does not guarantee future results.
A Basis Point (BP) is 1/100 of one percent. LIBOR is the average interbank interest rate at which a selection of banks on the London money market are prepared to lend to one another. Yield to Maturity (YTM) is the total return anticipated on a bond (on an annualized basis) if the bond is held until it matures. Duration is a measure of the sensitivity of the price of a bond or other debt instrument to a change in interest rates.
ETF definitions: the ICE BOFA 0-3 Year U.S. Treasury Index tracks the performance of U.S. dollar denominated sovereign debt publicly issued by the U.S. government in its domestic market with maturities less than three years. Gross Spread is the amount by which a SPAC is trading at a discount or premium to its pro rata share of the collateral trust value. For example, if a SPAC is trading at $9.70 and shareholders’ pro rata share of the trust account is $10.00/share, the SPAC has a gross spread of 3% (trading at a 3% discount). Yield to Liquidation: similar to a bond’s yield to maturity, SPACs have a yield to liquidation/redemption, which can be calculated using the gross spread and time to liquidation. Maturity: similar to a bond’s maturity date, SPAC also have a maturity, which is the defined time period in which they have to complete a business combination. This is referred to as the liquidation or redemption date. Price refers to the price at which the ETF is currently trading. The sec yield is a standard yield calculation developed by the U.S. Securities and Exchange Commission (SEC) that allows for fairer comparisons of bond funds. It is based on the most recent 30-day period covered by the fund’s filings with the SEC. The yield figure reflects the dividends and interest earned during the period after the deduction of the fund’s expenses. It is also referred to as the “standardized yield.”
All performance data greater than 1 year is annualized.
Diversification does not assure a profit nor protect against loss in a declining market.
A stock is a type of security that signifies ownership in a corporation and represents a claim on part of the corporation’s assets and earnings. A bond is a debt investment in which an investor loans money to an entity that borrows the fund for a defined period of time at a fixed interest rate. A stock may trade with more or less liquidity than a bond depending on the number of shares and bonds outstanding, the size of the company, and the demand for the securities. The SEC does not approve, endorse, nor indemnify any security.
Tax features may vary based on personal circumstances. Consult a tax professional for additional information.
Must be preceded or accompanied by a prospectus.
Management’s Discussion of Fund Performance and Analysis
CrossingBridge Low Duration High Yield Fund
(Unaudited)
The 2021-2022 fiscal semi-annual period for the CrossingBridge Low Duration High Yield Fund (CBLDX; the “Fund”) covers the six-month period of October 1, 2021 through March 31, 2022. During this period, the Fund gained 0.73% on its Institutional Class shares while the ICE BofA 0-3 Year U.S. High Yield Excluding Financials Index lost -1.44%, the ICE BofA 1-3 Year U.S. Corporate Bond Index lost -3.69% and the ICE BofA 0-3 Year U.S. Treasury Index lost -2.07%.
Monthly investment results for the fiscal year ranged from -0.03% in March 2022 to 0.31% in December 2021. The Fund generated positive returns for four out of the six months during the fiscal semi-annual period. The median monthly return for the period was 0.10% with an annualized standard deviation of 0.49%.
The total return for the period was positive. The Fund had positive contributions from interest income and had realized gains and unrealized losses during the period. The Fund’s NAV decreased from $10.36 on September 30, 2021 to $10.13 on March 31, 2022, but the Fund distributed $0.31 during the period.
Opinions expressed are subject to change at any time, are not guaranteed and should not be considered investment advice.
Past performance does not guarantee future results.
Fund holdings and sector allocation are subject to change at any time and should not be considered a recommendation to buy or sell any security. Please see the Schedule of Investments for complete Fund holdings.
*Definitions: The ICE BofA 0-3 Year U.S. High Yield Excluding Financials Index (HSNF) tracks the performance of short maturity U.S. dollar denominated below investment grade rating (based on an average of Moody’s, S&P, and Fitch), at least 18 months to final maturity at the time of issuance, at least one month but less than three years remaining term to final maturity as of the rebalancing date, a fixed coupon schedule and minimum amount outstanding of $250 million. The ICE BofA 1-3 Year U.S. Corporate Bond Index (C1A0) is a subset of the ICE BofA U.S. Corporate Bond Index including all securities with a remaining term to final maturity less than three years. The ICE BofA 0-3 Year U.S. Treasury Index (G1QA) tracks the performance of U.S. dollar denominated sovereign debt publicly issued by the U.S. government in its domestic market with maturities less than three years. Standard Deviation is a statistical measure that is used to quantify the amount of variation or dispersion of a set of data values. Duration is the weighted average of the present value of the cash flows and is used as a measure of a bond price’s response to changes in yield. Rising interest rates mean falling bond prices, while declining interest rates mean rising bond prices.
It is not possible to invest directly in an index.
Mutual fund investing involves risk. Principal loss is possible. Investments in foreign securities involve greater volatility and political, economic and currency risks and differences in accounting methods. Investments in debt securities typically decrease in value when interest rates rise. This risk is usually greater for longer-term debt securities. Investment in lower-rated and non-rated securities presents a greater risk of loss to principal and interest than higher-rated securities. The Fund may make short sales of securities, which involves the risk that losses may exceed the original amount invested. The Fund may invest in exchange-traded funds (“ETFs”) and exchange-traded notes (“ETNs”), which are subject to additional risks that do not apply to conventional mutual funds, including the risks that the market price of an ETF’s and ETN’s shares may trade at a discount to its net asset value (“NAV”), an active secondary trading market may not develop or be maintained, or trading may be halted by the
exchange in which they trade, which may impact the Fund’s ability to sell the shares. The value of ETNs may be influenced by the level of supply and demand for the ETN, volatility and lack of liquidity. The Fund may invest in derivative securities, which derive their performance from the performance of an underlying asset, index, interest rate or currency exchange rate. Derivatives can be volatile and involve various types and degrees of risks, and, depending upon the characteristics of a particular derivative, suddenly can become illiquid. Investments in asset-backed, mortgage-backed, and collateralized mortgage-backed securities include additional risks that investors should be aware of such as credit risk, prepayment risk, possible illiquidity and default, as well as increased susceptibility to adverse economic developments. The Fund invests in equity securities and warrants of special purpose acquisition companies (“SPACs”) . Pre-combination SPACs have no operating history or ongoing business other than seeking a merger, share exchange, asset acquisition, share purchase negotiation or similar business combination (a “Combination”), and the value of their securities is particularly dependent on the ability of the entity’s management to identify and complete a profitable Combination. There is no guarantee that the SPACs in which the Fund invests will complete a Combination or that any Combination that is completed will be profitable. Unless and until a Combination is completed, a SPAC generally invests its assets in U.S. government securities, money market securities, and cash. Public stockholders of SPACs may not be afforded a meaningful opportunity to vote on a proposed initial Combination because certain stockholders, including stockholders affiliated with the management of the SPAC, may have sufficient voting power, and a financial incentive, to approve such a transaction without support from public stockholders. As a result, a SPAC may complete a Combination even though a majority of its public stockholders do not support such a Combination. Some SPACs may pursue Combinations only within certain industries or regions, which may increase the volatility of their prices. The Fund may invest in SPACs domiciled or listed outside of the U.S., including, but not limited to, Canada, the Cayman Islands, Bermuda and the Virgin Islands. Investments in SPACs domiciled or listed outside of the U.S. may involve risks not generally associated with investments in the securities of U.S. SPACs, such as risks relating to political, social, and economic developments abroad and differences between U.S. and foreign regulatory requirements and market practices. Further, tax treatment may differ from U.S. SPACs and securities may be subject of foreign withholding taxes. Smaller capitalization SPACs will have a more limited pool of companies with which they can pursue a business combination relative to larger capitalization companies. That may make it more difficult for a small capitalization SPAC to consummate a business combination.
Must be preceded or accompanied by a prospectus.
Distributor: Quasar Distributors, LLC.
Management’s Discussion of Fund Performance and Analysis
CrossingBridge Responsible Credit Fund
(Unaudited)
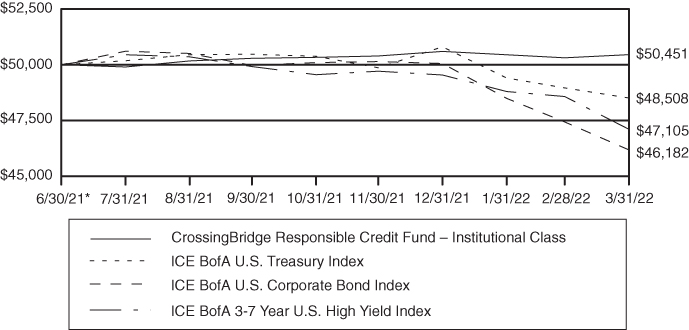
The 2021-2022 fiscal semi-annual period for the CrossingBridge Responsible Credit Fund (CBRDX; the “Fund”) covers the six-month period of October 1, 2021 through March 31, 2022. During this period, the Fund gained 0.33% on its Institutional Class shares while the ICE BofA U.S. High Yield Index lost -3.89%, the ICE BofA U.S. Corporate Index lost -7.58% and the ICE BofA 3-7 Year U.S. Treasury Index lost -5.63%.
Monthly investment results for the fiscal period ranged from -0.30% in January 2022 to 0.41% in December 2021. The Fund generated positive returns for four out of the six months during the fiscal period. The median monthly return for the period was 0.11% with an annualized standard deviation of 1.00%.
The total return for the period was higher. The Fund had positive contributions from interest income and had realized capital gains and unrealized losses during the period. The Fund’s NAV increased from $10.01 on September 30, 2021 to $9.88 on March 31, 2022, but the Fund distributed $0.16 during the period.
Opinions expressed are subject to change at any time, are not guaranteed and should not be considered investment advice.
Past performance does not guarantee future results.
The Fund is non-diversified under the 1940 Act, therefore allowing the Fund to be more concentrated than a diversified fund. Because the Fund is non-diversified it may invest a greater percentage of its assets in the securities of a single issuer or a smaller number of issuers than if it were a diversified fund. As a result, a decline in the value of an investment in a single issuer could cause the Fund’s overall value to decline to a greater degree than if the Fund held a more diversified portfolio. Current fund statistics may not be indicative of future positioning.
Fund holdings and sector allocation are subject to change at any time and should not be considered a recommendation to buy or sell any security. Please see the Schedule of Investments for complete Fund holdings.
Definitions: The ICE BofA U.S. High Yield Index (H0A0) tracks the performance of U.S. dollar denominated below investment grade corporate debt publicly issued in the U.S. domestic market. The ICE BofA U.S. Corporate Index (C0A0) tracks the performance of U.S. dollar denominated investment grade corporate debt publicly issued in the U.S. domestic market. The ICE BofA 3-7 Year U.S. Treasury Index (G30C) is a subset of ICE BofA U.S. Treasury Index including all securities with a remaining term to final maturity greater than or equal to 3 years and less than 7 years. Standard Deviation is a statistical measure of portfolio risk used to measure variability of total return around an average, over a specified period of time. The greater the standard deviation over the period, the wider the variability or range of returns and hence, the greater the fund’s volatility.
It is not possible to invest directly in an index.
Mutual fund investing involves risk. Principal loss is possible. Investments in foreign securities involve greater volatility and political, economic and currency risks and differences in accounting methods. Investments in debt securities typically decrease in value when interest rates rise. This risk is usually greater for longer-term debt securities. Investment in lower-rated and non-rated securities presents a greater risk of loss to principal and interest than higher-rated securities. The Fund may make short sales of securities, which involves the risk that losses may exceed the original amount invested. The Fund’s focus on sustainability considerations (ESG criteria) may limit the number of investment opportunities available to
the Fund, and as a result, at times, the Fund may underperform funds that are not subject to similar investment considerations. The Fund invests in equity securities of special purpose acquisition companies (“SPACs”), which raise assets to seek potential business combination opportunities. Unless and until a business combination is completed, a SPAC generally invests its assets in U.S. government securities, money market securities, and cash. Because SPACs have no operating history or ongoing business other than seeking a business combination, the value of their securities is particularly dependent on the ability of the entity’s management to identify and complete a profitable business combination. There is no guarantee that the SPACs in which the Fund invests will complete a business combination or that any business combination that is completed will be profitable. The Fund is non-diversified meaning it may concentrate its assets in fewer individual holdings than a diversified fund. The Fund invests in equity securities and warrants of SPACs. Pre-combination SPACs have no operating history or ongoing business other than seeking a merger, share exchange, asset acquisition, share purchase negotiation or similar business combination (a “Combination”), and the value of their securities is particularly dependent on the ability of the entity’s management to identify and complete a profitable Combination. There is no guarantee that the SPACs in which the Fund invests will complete a Combination or that any Combination that is completed will be profitable. Unless and until a Combination is completed, a SPAC generally invests its assets in U.S. government securities, money market securities, and cash. Public stockholders of SPACs may not be afforded a meaningful opportunity to vote on a proposed initial Combination because certain stockholders, including stockholders affiliated with the management of the SPAC, may have sufficient voting power, and a financial incentive, to approve such a transaction without support from public stockholders. As a result, a SPAC may complete a Combination even though a majority of its public stockholders do not support such a Combination. Some SPACs may pursue Combinations only within certain industries or regions, which may increase the volatility of their prices. The Fund may invest in SPACs domiciled or listed outside of the U.S., including, but not limited to, Canada, the Cayman Islands, Bermuda and the Virgin Islands. Investments in SPACs domiciled or listed outside of the U.S. may involve risks not generally associated with investments in the securities of U.S. SPACs, such as risks relating to political, social, and economic developments abroad and differences between U.S. and foreign regulatory requirements and market practices. Further, tax treatment may differ from U.S. SPACs and securities may be subject of foreign withholding taxes. Smaller capitalization SPACs will have a more limited pool of companies with which they can pursue a business combination relative to larger capitalization companies. That may make it more difficult for a small capitalization SPAC to consummate a business combination.
Must be preceded or accompanied by a prospectus.
Distributor: Quasar Distributors, LLC.
Management’s Discussion of Fund Performance and Analysis
CrossingBridge Ultra-Short Duration Fund
(Unaudited)
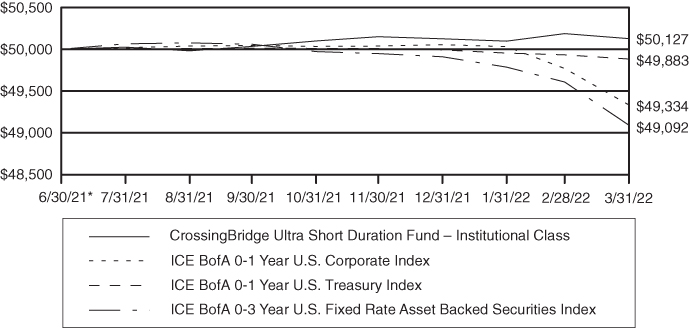
The 2021-2022 fiscal semi-annual period for the CrossingBridge Ultra-Short Duration Fund (CBUDX; the “Fund”) covers the six-month period of October 1, 2021 through March 31, 2022. During this period, the Fund gained 0.19% on its Institutional Class shares while the ICE BofA 0-1 Year U.S. Corporate Index lost -1.42%, the ICE BofA 0-1 Year U.S. Treasury Index lost -0.26% and the ICE BofA 0-3 Year U.S. Fixed Rate Asset Backed Securities Index lost -1.93%.
Monthly investment results for the fiscal period ranged from -0.12% in March 2022 to 0.18% in February 2022. The Fund generated positive returns for three out of the six months during the fiscal period. The median monthly return for the period was 0.05% with an annualized standard deviation of 0.42%.
The total return for the period was positive. The Fund had positive contributions from interest income and had realized gains and unrealized losses during the period. The Fund’s NAV decreased from $10.01 on September 30, 2021 to $9.99 on March 31, 2022, but the Fund distributed $0.035 during the period.
Opinions expressed are subject to change at any time, are not guaranteed and should not be considered investment advice.
Past performance does not guarantee future results.
Fund holdings and sector allocation are subject to change at any time and should not be considered a recommendation to buy or sell any security. Please see the Schedule of Investments for complete Fund holdings.
*Definitions: The ICE BofA 0-1 Year U.S. Corporate Index (H540) tracks the performance of short-maturity U.S. dollar denominated investment grade corporate debt publicly issued in the U.S. domestic market. The ICE BofA 0-1 Year U.S. Treasury Index (G0QA) tracks the performance of U.S. dollar denominated sovereign debt publicly issued by the U.S. government in its domestic market with maturities less than a year. The ICE BofA 0-3 Year U.S. Fixed Rate Asset Backed Securities Index (R1A0) is a subset of ICE BofA U.S. Fixed Rate Asset Backed Securities Index including all securities with an average life less than 3 years. Duration is the weighted average of the present value of the cash flows and is used as a measure of a bond price’s response to changes in yield. Rising interest rates mean falling bond prices, while declining interest rates mean rising bond prices. Standard Deviation is a statistical measure of portfolio risk used to measure variability of total return around an average, over a specified period of time. The greater the standard deviation over the period, the wider the variability or range of returns and hence, the greater the fund’s volatility.
It is not possible to invest directly in an index.
Mutual fund investing involves risk. Principal loss is possible. Investments in foreign securities involve greater volatility and political, economic and currency risks and differences in accounting methods. Investments in debt securities typically decrease in value when interest rates rise. This risk is usually greater for longer-term debt securities. Investment in lower-rated and non-rated securities presents a greater risk of loss to principal and interest than higher-rated securities. The Fund may make short sales of securities, which involves the risk that losses may exceed the original amount invested. The Fund invests in equity securities and warrants of special purpose acquisition companies (“SPACs”). Pre-combination SPACs have no operating history or ongoing business other than seeking a merger, share exchange, asset acquisition, share purchase negotiation or similar business combination (a “Combination”), and the value of their securities is particularly dependent on the ability of the entity’s management to identify and complete a profitable Combination. There is no guarantee
that the SPACs in which the Fund invests will complete a Combination or that any Combination that is completed will be profitable. Unless and until a Combination is completed, a SPAC generally invests its assets in U.S. government securities, money market securities, and cash. Public stockholders of SPACs may not be afforded a meaningful opportunity to vote on a proposed initial Combination because certain stockholders, including stockholders affiliated with the management of the SPAC, may have sufficient voting power, and a financial incentive, to approve such a transaction without support from public stockholders. As a result, a SPAC may complete a Combination even though a majority of its public stockholders do not support such a Combination. Some SPACs may pursue Combinations only within certain industries or regions, which may increase the volatility of their prices. The Fund may invest in SPACs domiciled or listed outside of the U.S., including, but not limited to, Canada, the Cayman Islands, Bermuda and the Virgin Islands. Investments in SPACs domiciled or listed outside of the U.S. may involve risks not generally associated with investments in the securities of U.S. SPACs, such as risks relating to political, social, and economic developments abroad and differences between U.S. and foreign regulatory requirements and market practices. Further, tax treatment may differ from U.S. SPACs and securities may be subject of foreign withholding taxes. Smaller capitalization SPACs will have a more limited pool of companies with which they can pursue a business combination relative to larger capitalization companies. That may make it more difficult for a small capitalization SPAC to consummate a business combination.
Must be preceded or accompanied by a prospectus.
Distributor: Quasar Distributors, LLC.
Management’s Discussion of Fund Performance and Analysis
CrossingBridge Pre-Merger SPAC ETF
(Unaudited)
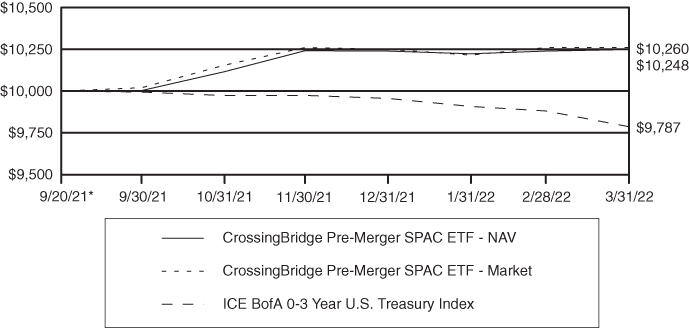
The 2021-2022 fiscal semi-annual period for the CrossingBridge Pre-Merger SPAC ETF (SPC; the “Fund”) covers the six-month period of October 1, 2021 through March 31, 2022. During this period, the Fund had a NAV return of 2.45% and a market return of 2.40%, while the ICE BofA 0-3 Year U.S. Treasury Index lost -2.07%.
Monthly share price investment results for the fiscal period ranged from -0.34% in January 2022 to 1.35% in October 2021. Monthly NAV investment results for the fiscal period ranged from -0.15% in January 2022 to 1.23% in November 2021. The Fund generated flat or positive returns for four out of the six months during the fiscal period. The median monthly price return for the period was 0.22% and the median monthly NAV return was 0.12%. The Fund’s share price had an annualized standard deviation of 2.36%. and the Fund’s NAV had an annualized standard deviation of 2.11%
The Fund had realized and unrealized gains during the period. The total return for the period was higher as the share price increased from $20.04 on September 30, 2021 to $20.52 on March 31, 2022 while the NAV increased from $20.01 to $20.50 for the period.
Opinions expressed are subject to change at any time, are not guaranteed and should not be considered investment advice.
Past performance does not guarantee future results.
Fund holdings and sector allocation are subject to change at any time and should not be considered a recommendation to buy or sell any security. Please see the Schedule of Investments for complete Fund holdings.
*Definitions: The ICE BofA 0-3 Year U.S. Treasury Index tracks the performance of U.S. dollar denominated sovereign debt publicly issued by the U.S. government in its domestic market with maturities less than three years. Standard Deviation is a statistical measure of portfolio risk used to measure variability of total return around an average, over a specified period of time. The greater the standard deviation over the period, the wider the variability or range of returns and hence, the greater the fund’s volatility.
It is not possible to invest directly in an index.
Investing involves risk; Principal loss is possible. The Fund invests in equity securities and warrants of SPACs. Pre-combination SPACs have no operating history or ongoing business other than seeking a merger, share exchange, asset acquisition, share purchase negotiation or similar business combination (a “Combination”), and the value of their securities is particularly dependent on the ability of the entity’s management to identify and complete a profitable Combination. There is no guarantee that the SPACs in which the Fund invests will complete a Combination or that any Combination that is completed will be profitable. Unless and until a Combination is completed, a SPAC generally invests its assets in U.S. government securities, money market securities, and cash. Public stockholders of SPACs may not be afforded a meaningful opportunity to vote on a proposed initial Combination because certain stockholders, including stockholders affiliated with the management of the SPAC, may have sufficient voting power, and a financial incentive, to approve such a transaction without support from public stockholders. As a result, a SPAC may complete a Combination even though a majority of its public stockholders do not support such a Combination. Some SPACs may pursue Combinations only within certain industries or regions, which may increase the volatility of their prices. The Fund may invest in SPACs domiciled or listed outside of the U.S.,
including, but not limited to, Canada, the Cayman Islands, Bermuda and the Virgin Islands. Investments in SPACs domiciled or listed outside of the U.S. may involve risks not generally associated with investments in the securities of U.S. SPACs, such as risks relating to political, social, and economic developments abroad and differences between U.S. and foreign regulatory requirements and market practices. Further, tax treatment may differ from U.S. SPACs and securities may be subject of foreign withholding taxes. Smaller capitalization SPACs will have a more limited pool of companies with which they can pursue a business combination relative to larger capitalization companies. That may make it more difficult for a small capitalization SPAC to consummate a business combination. Because the Fund is non-diversified it may invest a greater percentage of its assets in the securities of a single issuer or a smaller number of issuers than if it were a diversified fund. As a result, a decline in the value of an investment in a single issuer could cause the Fund’s overall value to decline to a greater degree than if the Fund held a more diversified portfolio.
Must be preceded or accompanied by a prospectus.
Distributor: Foreside Fund Services, LLC.
CROSSINGBRIDGE FUNDS
Expense Example
(Unaudited)
As a shareholder of the CrossingBridge Low Duration High Yield Fund, CrossingBridge Responsible Credit Fund and CrossingBridge Ultra-Short Duration Fund, you incur two types of costs: (1) transaction costs and (2) ongoing costs, including management fees, shareholder servicing plan fees and other Fund expenses. As a shareholder of the CrossingBridge Pre-Merger SPAC ETF, you incur two types of costs: (1) transaction costs, including brokerage commissions paid on purchases and sales of the Fund’s shares, and (2) ongoing costs, including management fees of the Fund. The Example is intended to help you understand your ongoing costs (in dollars) of investing in the Funds and to compare these costs with the ongoing costs of investing in other funds. The Example is based on an investment of $1,000 invested at the beginning of the respective period disclosed in the following table and held for the entire respective period disclosed in the following table.
Actual Expenses
The first line under each Fund in the following table provides information about actual account values and actual expenses for each Fund. You may use the information in this line, together with the amount you invested, to estimate the expenses that you paid over the period. Simply divide your account value by $1,000 (for example, an $8,600 account value divided by $1,000 = 8.6), then multiply the result by the number in the first line under the heading entitled “Expenses Paid During Period” to estimate the expenses you paid on your account during this period.
Hypothetical Example for Comparison Purposes
The second line under each Fund in the following table provides information about hypothetical account values and hypothetical expenses based on each Fund’s actual expense ratio and an assumed rate of return of 5% per year before expenses, which is not the Fund’s actual return. The hypothetical account values and expenses may not be used to estimate the actual ending account balance or expenses you paid for the period. You may use this information to compare the ongoing costs of investing in the Funds and other funds. To do so, compare this 5% hypothetical example with the 5% hypothetical examples that appear in the shareholder reports of other funds. Please note that the expenses shown in the table are meant to highlight your ongoing costs only and do not reflect any transactional costs, such as sales charges (loads), redemption fees or exchange fees. Therefore, the second line of the table is useful in comparing ongoing costs only, and will not help you determine the relative total costs of owning different funds. In addition, if these transactional costs were included, your costs would have been higher.
CROSSINGBRIDGE FUNDS
Expense Example (Continued)
(Unaudited)
| | | Beginning | Ending | |
| | Annualized | Account Value | Account Value | Expenses |
| | Expense | October 1, | March 31, | Paid During |
| | Ratio | 2021 | 2022 | Period* |
| CrossingBridge Low | | | | |
| Duration High Yield Fund | | | | |
| Institutional Class | | | | |
| Based on actual fund return | 0.90% | $1,000.00
| $1,007.30
| $4.50
|
| Based on hypothetical 5% return | 0.90% | 1,000.00 | 1,020.44 | 4.53 |
| | | | | |
| CrossingBridge | | | | |
| Responsible Credit Fund | | | | |
| Institutional Class | | | | |
| Based on actual fund return | 0.90% | 1,000.00 | 1,003.30 | 4.50 |
| Based on hypothetical 5% return | 0.90% | 1,000.00 | 1,020.44 | 4.53 |
| | | | | |
| CrossingBridge | | | | |
| Ultra-Short Duration Fund | | | | |
| Institutional Class | | | | |
| Based on actual fund return | 0.90% | 1,000.00 | 1,001.90 | 4.49 |
| Based on hypothetical 5% return | 0.90% | 1,000.00 | 1,020.44 | 4.53 |
| | | | | |
| CrossingBridge | | | | |
| Pre-Merger SPAC ETF | | | | |
| Based on actual fund return | 0.82% | 1,000.00 | 1,024.50 | 4.14 |
| Based on hypothetical 5% return | 0.82% | 1,000.00 | 1,020.84 | 4.13 |
| * | Expenses are calculated using the Fund’s annualized expense ratio, multiplied by the average account value over the period, multiplied by the number of days in the period (182 days), divided by 365 days to reflect the six month period ended March 31, 2022. |
CROSSINGBRIDGE LOW DURATION HIGH YIELD FUND
Investment Highlights
(Unaudited)
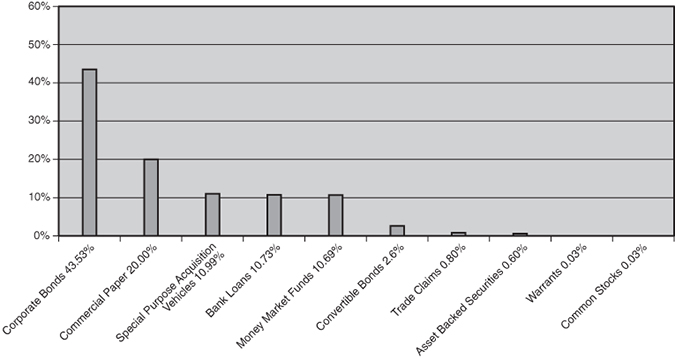
The Fund seeks high current income and capital appreciation consistent with the preservation of capital using a low duration mandate. The allocation of portfolio holdings as of March 31, 2022 is as follows:
Allocation of Portfolio Holdings
(% of Investments)
Average Annual Total Returns as of March 31, 20221
| | Six | One | Three | Since |
| | Month | Year | Years | February 1, 20182 |
| Institutional Class Shares | 0.73% | 3.92% | 4.37% | 3.90% |
| ICE BofA 0-3 Year U.S. High Yield | | | | |
| Excluding Financials Index | -1.44% | 1.48% | 3.59% | 3.81% |
| ICE BofA 0-3 Year U.S. Treasury Index | -2.07% | -2.04% | 0.90% | 1.31% |
| ICE BofA 1-3 Year U.S. Corporate | | | | |
| Bond Index | -3.69% | -3.18% | 1.45% | 1.92% |
1 Six month returns are not annualized.
2 Commencement of investment operations.
Performance data quoted represents past performance and does not guarantee future results. The investment return and principal value of an investment will fluctuate so that an investor’s shares, when redeemed, may be worth more or less than their original cost. Current performance of the Fund may be lower or higher than the performance quoted. Performance data current to the most recent month-end may be obtained by calling 1-888-898-2780.
Investment performance reflects fee waivers in effect. In the absence of such waivers, total returns would be reduced.
CROSSINGBRIDGE LOW DURATION HIGH YIELD FUND
Investment Highlights (Continued)
(Unaudited)
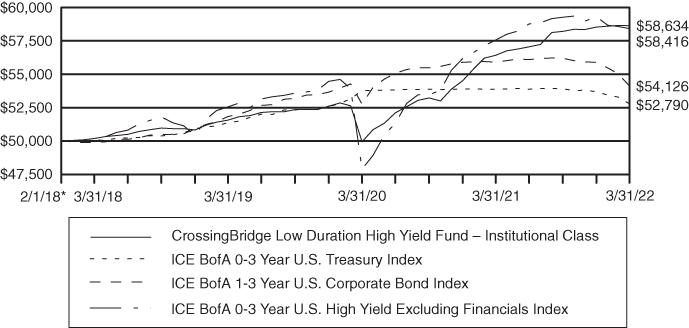
The returns shown assume reinvestment of Fund distributions and do not reflect the deduction of taxes that a shareholder would pay on Fund distributions or the redemption of Fund shares. The following graph illustrates performance of a hypothetical investment made in the Fund and the Fund’s primary benchmark index, the ICE BofA 0-3 Year U.S. High Yield Excluding Financials Index, as well as other broad-based securities indices on the Fund’s inception date. The graph does not reflect any future performance. ICE BofA 0-3 Year U.S. High Yield Excluding Financials Index is a subset of ICE BofA 0-3 Year U.S. High Yield Index excluding sector level 2 Financial issuers. ICE BofA 0-3 Year U.S. Treasury Index tracks the performance of U.S. dollar denominated sovereign debt publicly issued by the U.S. government in its domestic market with maturities less than three years. Qualifying securities must have at least 18 months to maturity at point of issuance, at least one month and less than three years remaining term to final maturity, a fixed coupon schedule and minimum amount outstanding of $1 billion. ICE BofA 1-3 Year U.S. Corporate Bond Index is a subset of ICE BofA U.S. Corporate Bond Index including all securities with a remaining term to final maturity less than 3 years. It is not possible to invest directly in an index.
Growth of $50,000 Investment
* Commencement of investment operations.
CROSSINGBRIDGE RESPONSIBLE CREDIT FUND
Investment Highlights
(Unaudited)
The Fund seeks high current income and capital appreciation consistent with the preservation of capital by investing in fixed income securities that meet the responsible investing criteria of the Fund’s investment adviser. The allocation of portfolio holdings as of March 31, 2022 is as follows:
Allocation of Portfolio Holdings
(% of Investments)
* Less than 0.005%.
Total Returns as of March 31, 2022
| | Six | Since |
| | Month | June 30, 20211 |
| Institutional Class Shares | 0.33% | 0.90% |
| ICE BofA U.S. High Yield Index | -3.89% | -2.98% |
| ICE BofA 3-7 Year U.S. Treasury Index | -5.63% | -5.79% |
| ICE BofA U.S. Corporate Index | -7.58% | -7.64% |
1 Commencement of investment operations.
Performance data quoted represents past performance and does not guarantee future results. The investment return and principal value of an investment will fluctuate so that an investor’s shares, when redeemed, may be worth more or less than their original cost. Current performance of the Fund may be lower or higher than the performance quoted. Performance data current to the most recent month end may be obtained by calling 1-888-898-2780.
Investment performance reflects fee waivers in effect. In the absence of such waivers, total returns would be reduced.
CROSSINGBRIDGE RESPONSIBLE CREDIT FUND
Investment Highlights (Continued)
(Unaudited)
The returns shown assume reinvestment of Fund distributions and do not reflect the deduction of taxes that a shareholder would pay on Fund distributions or the redemption of Fund shares. The following graph illustrates performance of a hypothetical investment made in the Fund and the Fund’s primary benchmark index, the ICE BofA U.S. High Yield Index, as well as other broad-based securities indices on the Fund’s inception date. ICE BofA 3-7 Year U.S. Treasury Index measures the performance of public obligations of the U.S. Treasury that have a remaining maturity of greater than 3 years and less than or equal to 7 years. ICE BofA U.S. Corporate Index is an unmanaged index comprised of U.S. dollar denominated investment grade, fixed rate corporate debt securities publicly issued in the U.S. domestic market with at least one year remaining term to final maturity and at least $250 million outstanding. ICE BofA U.S. High Yield Index is an unmanaged index that tracks the performance of U.S. dollar denominated, below investment-grade rated corporate debt publicly issued in the U.S. domestic market. It is not possible to invest directly in an index.
Growth of $50,000 Investment
* Commencement of investment operations.
CROSSINGBRIDGE ULTRA-SHORT DURATION FUND
Investment Highlights
(Unaudited)
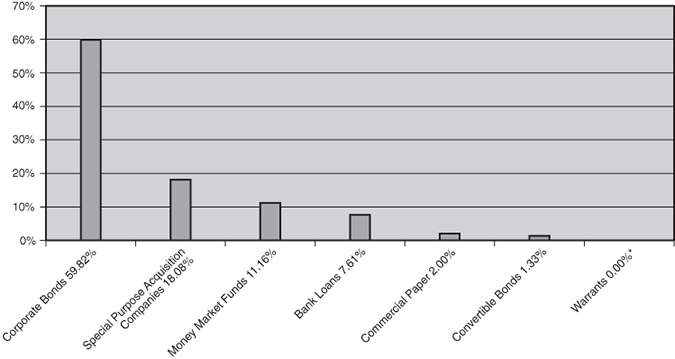
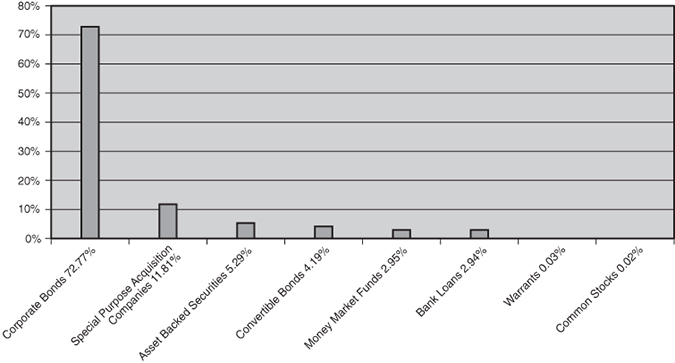
The Fund seeks to offer a higher yield than cash instruments while maintaining a low duration. The allocation of portfolio holdings as of March 31, 2022 is as follows:
Allocation of Portfolio Holdings
(% of Investments)
Total Returns as of March 31, 2022
| | Six | Since |
| | Month | June 30, 20211 |
| Institutional Class Shares | 0.19% | 0.25% |
| ICE BofA 0-1 Year U.S. Corporate Index | -1.42% | -1.33% |
| ICE BofA 0-1 Year U.S. Treasury Index | -0.26% | -0.23% |
| ICE BofA 0-3 Year U.S. Fixed Rate | | |
| Asset Backed Securities Index | -1.93% | -1.82% |
1 Commencement of investment operations.
Performance data quoted represents past performance and does not guarantee future results. The investment return and principal value of an investment will fluctuate so that an investor’s shares, when redeemed, may be worth more or less than their original cost. Current performance of the Fund may be lower or higher than the performance quoted. Performance data current to the most recent month end may be obtained by calling 1-888-898-2780.
Investment performance reflects fee waivers in effect. In the absence of such waivers, total returns would be reduced.
CROSSINGBRIDGE ULTRA-SHORT DURATION FUND
Investment Highlights (Continued)
(Unaudited)
The returns shown assume reinvestment of Fund distributions and do not reflect the deduction of taxes that a shareholder would pay on Fund distributions or the redemption of Fund shares. The following graph illustrates performance of a hypothetical investment made in the Fund and the Fund’s primary benchmark index, ICE BofA 0-1 Year U.S. Corporate Index, as well as other broad-based securities indices on the Fund’s inception date. ICE BofA 0-1 Year U.S. Corporate Index is a subset of ICE BofA U.S. Corporate Bond Index including all securities with a remaining term to final maturity less than 1 year. ICE BofA 0-1 Year U.S. Treasury Index tracks the performance of U.S. dollar denominated sovereign debt publicly issued by the U.S. government in its domestic market with maturities less than one year. ICE BofA 0-3 Year U.S. Fixed Rate Asset Backed Securities Index is a subset of ICE BofA U.S. Fixed Rate Asset Backed Securities Index including all securities with a remaining term to final maturity less than three years. It is not possible to invest directly in an index.
Growth of $50,000 Investment
* Commencement of investment operations.
CROSSINGBRIDGE PRE-MERGER SPAC ETF
Investment Highlights
(Unaudited)
The Fund seeks to provide total returns consistent with the preservation of capital. The allocation of portfolio holdings as of March 31, 2022 is as follows:
Allocation of Portfolio Holdings
(% of Investments)
Total Returns as of March 31, 2022
| | Six | Since |
| | Month | September 20, 20211 |
| Net Asset Value | 2.45% | 2.48% |
| Market Value | 2.40% | 2.60% |
| ICE BofA 0-3 Year U.S. Treasury Index | -2.07%
| -2.13%
|
1 Commencement of investment operations.
Performance data quoted represents past performance and does not guarantee future results. The investment return and principal value of an investment will fluctuate so that an investor’s shares, when redeemed, may be worth more or less than their original cost. Current performance of the Fund may be lower or higher than the performance quoted. Performance data current to the most recent month end may be obtained by calling 1-888-898-2780.
The returns shown assume reinvestment of Fund distributions and do not reflect the deduction of taxes that a shareholder would pay on Fund distributions or the redemption of Fund shares. The following graph illustrates performance of a hypothetical investment made in the Fund and broad-based securities indices on the Fund’s inception date. The graph does not reflect any future performance. ICE BofA 0-3 Year U.S. Treasury Index tracks the performance of U.S. dollar denominated sovereign debt publicly issued by the
CROSSINGBRIDGE PRE-MERGER SPAC ETF
Investment Highlights (Continued)
(Unaudited)
U.S. government in its domestic market with maturities less than three years. Qualifying securities must have at least 18 months to maturity at point of issuance, at least one month and less than three years remaining term to final maturity, a fixed coupon schedule and minimum amount outstanding of $1 billion. It is not possible to invest directly in an index.
Growth of $10,000 Investment
* Commencement of investment operations.
CROSSINGBRIDGE LOW DURATION HIGH YIELD FUND
March 31, 2022 (Unaudited)
| | | Face | | | | |
| | | Amount† | | | Value | |
| ASSET BACKED SECURITIES – 0.62% | | | | | | |
| | | | | | | |
| Finance and Insurance – 0.17% | | | | | | |
| HTS Fund I LLC | | | | | | |
| 2021-1, 1.410%, 08/25/2036 (a) | | | 1,000,000 | | | $ | 985,867 | |
| | | | | | | | | |
| Transportation and Warehousing – 0.45% | | | | | | | | |
| Hawaiian Airlines 2013-1 Class A Pass Through Certificates | | | | | | | | |
| 2013-1, 3.900%, 01/15/2026 | | | 2,842,118 | | | | 2,673,348 | |
| TOTAL ASSET BACKED SECURITIES (Cost $3,817,233) | | | | | | | 3,659,215 | |
| | | | | | | | | |
| BANK LOANS – 10.99% | | | | | | | | |
| | | | | | | | | |
| Arts, Entertainment, and Recreation – 0.34% | | | | | | | | |
| Golden Nugget | | | | | | | | |
| 13.000% (3 Month LIBOR + 12.000%), 10/04/2023 (b) | | | 1,884,938 | | | | 2,016,884 | |
| | | | | | | | | |
| Construction – 0.19% | | | | | | | | |
| Lealand Finance (McDermott) | | | | | | | | |
| 3.209% (1 Month Base Rate + 3.000%), 06/30/2024 (b)(d) | | | 1,750,984 | | | | 1,094,365 | |
| | | | | | | | | |
| Finance and Insurance – 0.41% | | | | | | | | |
| MoneyGram International, Inc. | | | | | | | | |
| 5.000% (3 Month LIBOR + 4.500%), 07/21/2026 (b) | | | 2,401,729 | | | | 2,401,129 | |
| | | | | | | | | |
| Information – 2.54% | | | | | | | | |
| Avast Software, Inc. | | | | | | | | |
| 2.756% (3 Month LIBOR + 2.000%), 03/22/2028 (b) | | | 7,237,538 | | | | 7,198,311 | |
| Intelsat Jackson Holdings SA | | | | | | | | |
| 8.000% (3 Month LIBOR + 3.750%), 11/27/2023 (b)(d) | | | 4,503,000 | | | | 4,503,000 | |
| 8.625%, 01/02/2024 (d) | | | 3,301,000 | | | | 3,301,000 | |
| 8.750% (3 Month LIBOR + 4.500%), 01/02/2024 (b)(d) | | | 7,333 | | | | 7,333 | |
| | | | | | | | 15,009,644 | |
| Manufacturing – 6.43% | | | | | | | | |
| K&N Parent, Inc. | | | | | | | | |
| 5.756% (3 Month LIBOR + 4.750%), 10/20/2023 (b) | | | 4,377,969 | | | | 3,986,141 | |
| Mallinckrodt International | | | | | | | | |
| 4.488% (3 Month LIBOR + 2.250%), 02/28/2023 (b) | | | 31,970,560 | | | | 31,800,796 | |
| Pixelle Specialty Solutions | | | | | | | | |
| 7.500% (1 Month LIBOR + 6.500%), 10/31/2024 (b) | | | 2,199,000 | | | | 2,162,585 | |
| | | | | | | | 37,949,522 | |
| Mining, Quarrying, and Oil and Gas Extraction – 0.75% | | | | | | | | |
| Quarternorth Energy Holding, Inc. | | | | | | | | |
| 9.000% (Base Rate + 8.000%), 08/27/2026 (b) | | | 4,419,985 | | | | 4,454,969 | |
The accompanying notes are an integral part of these financial statements.
CROSSINGBRIDGE LOW DURATION HIGH YIELD FUND
| Schedule of Investments (Continued) |
March 31, 2022 (Unaudited)
| | | Face | | | | |
| | | Amount† | | | Value | |
| BANK LOANS – 10.99% (CONTINUED) | | | | | | |
| Transportation and Warehousing – 0.33% | | | | | | |
| Access CIG LLC | | | | | | |
| 4.207% (1 Month LIBOR + 3.750%), 02/27/2025 (b) | | | 1,971,598 | | | $ | 1,945,454 | |
| Total Bank Loans (Cost $65,700,766) | | | | | | | 64,871,967 | |
| | | | | | | | | |
| COMMERCIAL PAPER – 20.49% | | | | | | | | |
| | | | | | | | | |
| Finance and Insurance – 1.89% | | | | | | | | |
| Humana, Inc. | | | | | | | | |
| 1.037%, 04/11/2022 (c) | | | 11,181,000 | | | | 11,179,343 | |
| | | | | | | | | |
| Information – 3.35% | | | | | | | | |
| AT&T, Inc. | | | | | | | | |
| 0.548%, 04/11/2022 (c) | | | 11,794,000 | | | | 11,791,784 | |
| Verizon Communications, Inc. | | | | | | | | |
| 0.687%, 04/06/2022 (c) | | | 7,986,000 | | | | 7,985,257 | |
| | | | | | | | 19,777,041 | |
| Manufacturing – 15.25% | | | | | | | | |
| Albemarle Corp. | | | | | | | | |
| 1.071%, 04/12/2022 (c) | | | 12,754,000 | | | | 12,751,458 | |
| Campbell Soup Co. | | | | | | | | |
| 0.698%, 04/13/2022 (c) | | | 5,438,000 | | | | 5,436,714 | |
| Cintas Corp. | | | | | | | | |
| 0.988%, 04/19/2022 (c) | | | 9,183,000 | | | | 9,180,843 | |
| Fortune Brands Home & Security, Inc. | | | | | | | | |
| 0.939%, 04/11/2022 (c) | | | 7,986,000 | | | | 7,984,609 | |
| General Motors Financial Co, Inc. | | | | | | | | |
| 0.569%, 04/07/2022 (c) | | | 5,965,000 | | | | 5,964,217 | |
| HP, Inc. | | | | | | | | |
| 1.185%, 04/27/2022 (c) | | | 10,796,000 | | | | 10,788,915 | |
| Jabil, Inc. | | | | | | | | |
| 0.693%, 04/06/2022 (c) | | | 11,141,000 | | | | 11,139,381 | |
| Nutrien Ltd. | | | | | | | | |
| 0.548%, 04/08/2022 (c) | | | 5,732,000 | | | | 5,731,242 | |
| Parker-Hannifin Corp. | | | | | | | | |
| 0.600%, 04/20/2022 (c) | | | 12,000,000 | | | | 11,996,667 | |
| Viatris, Inc. | | | | | | | | |
| 0.977%, 04/07/2022 (c) | | | 9,051,000 | | | | 9,049,742 | |
| | | | | | | | 90,023,788 | |
| TOTAL COMMERCIAL PAPER (Cost $120,971,966) | | | | | | | 120,980,172 | |
The accompanying notes are an integral part of these financial statements.
CROSSINGBRIDGE LOW DURATION HIGH YIELD FUND
| Schedule of Investments (Continued) |
March 31, 2022 (Unaudited)
| | | Number | | | | |
| | | of Shares | | | Value | |
| COMMON STOCKS – 0.03% | | | | | | |
| | | | | | | |
| Information – 0.01% | | | | | | |
| Leafly Holdings, Inc. | | | 9,056 | | | $ | 74,984 | |
| | | | | | | | | |
| Mining, Quarrying, and Oil and Gas Extraction – 0.02% | | | | | | | | |
| Superior Energy Services, Inc. | | | 1,616 | | | | 80,800 | |
| TOTAL COMMON STOCKS (Cost $2,117) | | | | | | | 155,784 | |
| | | | | | | | | |
| | | Face | | | | | |
| | | Amount† | | | | | |
| CONVERTIBLE BONDS – 2.66% | | | | | | | | |
| | | | | | | | | |
| Information – 2.66% | | | | | | | | |
| BuzzFeed, Inc. | | | | | | | | |
| 8.500%, 12/03/2026 (a) | | | 4,900,000 | | | | 4,838,750 | |
| Leafly Holdings, Inc. | | | | | | | | |
| 8.000%, 01/31/2025 (k)(l) | | | 7,245,000 | | | | 7,245,000 | |
| UpHealth, Inc. | | | | | | | | |
| 6.250%, 06/15/2026 (a) | | | 4,636,000 | | | | 3,636,447 | |
| TOTAL CONVERTIBLE BONDS (Cost $16,646,514) | | | | | | | 15,720,197 | |
| | | | | | | | | |
| CORPORATE BONDS – 44.58% | | | | | | | | |
| | | | | | | | | |
| Accommodation and Food Services – 0.22% | | | | | | | | |
| Nathan’s Famous, Inc. | | | | | | | | |
| 6.625%, 11/01/2025 (a) | | | 1,321,000 | | | | 1,320,135 | |
| | | | | | | | | |
| Agriculture, Forestry, Fishing and Hunting – 0.27% | | | | | | | | |
| Cooks Venture, Inc. | | | | | | | | |
| 5.500%, 01/15/2025 (a) | | | 1,595,000 | | | | 1,576,658 | |
| | | | | | | | | |
| Arts, Entertainment, and Recreation – 0.09% | | | | | | | | |
| Gaming Innovation Group PLC | | | | | | | | |
| 8.500% (3 Month STIBOR + 8.500%), 06/11/2024 (b)(d)(e) | | SEK 5,250,000 | | | | 559,764 | |
| | | | | | | | | |
| Educational Services – 0.08% | | | | | | | | |
| Hercules Achievement Inc / Varsity Brands Holding Co, Inc. | | | | | | | | |
| 9.000% (3 Month LIBOR + 8.000%), 12/22/2024 (a)(b) | | | 473,000 | | | | 476,883 | |
| | | | | | | | | |
| Finance and Insurance – 3.04% | | | | | | | | |
| MHH Holding BV | | | | | | | | |
| 7.366% (3 Month LIBOR + 7.000%), 02/10/2025 (b)(d) | | | 4,501,000 | | | | 4,557,262 | |
| Nordic Capital Partners II AS | | | | | | | | |
| 7.670% (3 Month NIBOR + 6.250%), 06/30/2024 (b)(d)(f) | | NOK 10,200,000 | | | | 1,155,039 | |
The accompanying notes are an integral part of these financial statements.
CROSSINGBRIDGE LOW DURATION HIGH YIELD FUND
| Schedule of Investments (Continued) |
March 31, 2022 (Unaudited)
| | | Face | | | | |
| | | Amount† | | | Value | |
| CORPORATE BONDS – 44.58% (CONTINUED) | | | | | | |
| Stockwik Forvaltning AB | | | | | | |
| 7.000% (3 Month STIBOR + 7.000%), 09/03/2023 (b)(d)(e) | | SEK 7,500,000 | | | $ | 789,692 | |
| StoneX Group, Inc. | | | | | | | |
| 8.625%, 06/15/2025 (a) | | | 11,000,000 | | | | 11,472,890 | |
| | | | | | | | 17,974,883 | |
| Health Care and Social Assistance – 0.75% | | | | | | | | |
| ADDvise Group AB | | | | | | | | |
| 7.250% (3 Month STIBOR + 7.250%), 05/21/2024 (b)(d)(e) | | SEK 16,380,000 | | | | 1,755,174 | |
| Surgery Center Holdings, Inc. | | | | | | | | |
| 6.750%, 07/01/2025 (a) | | | 2,656,000 | | | | 2,649,188 | |
| | | | | | | | 4,404,362 | |
| Information – 10.23% | | | | | | | | |
| Azerion Holding BV | | | | | | | | |
| 7.250%, 04/28/2024 (d)(g) | | EUR 3,199,000 | | | | 3,505,611 | |
| Cengage Learning, Inc. | | | | | | | | |
| 9.500%, 06/15/2024 (a) | | | 8,486,000 | | | | 8,478,320 | |
| CentralNic Group PLC | | | | | | | | |
| 7.000% (3 Month EURIBOR + 7.000%), 07/03/2023 (b)(d)(g) | | EUR 943,000 | | | | 1,051,023 | |
| DISH DBS Corp. | | | | | | | | |
| 5.875%, 07/15/2022 | | | 8,033,000 | | | | 8,083,126 | |
| Impala Group Plc | | | | | | | | |
| 9.000% (3 Month STIBOR + 9.000%), 10/20/2024 (b)(d)(e) | | SEK 11,250,000 | | | | 1,185,765 | |
| INNOVATE Corp. | | | | | | | | |
| 8.500%, 02/01/2026 (a) | | | 6,874,000 | | | | 6,737,792 | |
| Level 3 Financing, Inc. | | | | | | | | |
| 5.250%, 03/15/2026 | | | 10,517,000 | | | | 10,544,831 | |
| Linkem S.p.A. | | | | | | | | |
| 6.000% (3 Month EURIBOR + 6.000%), 08/09/2022 (b)(d)(g) | | EUR 13,789,000 | | | | 15,254,162 | |
| N0r5ke Viking I AS | | | | | | | | |
| 9.130% (3 Month NIBOR + 8.000%), 05/03/2024 (b)(d)(f) | | NOK 14,800,000 | | | | 1,681,083 | |
| NortonLifeLock, Inc. | | | | | | | | |
| 5.000%, 04/15/2025 (a) | | | 1,820,000 | | | | 1,822,402 | |
| Tigo Energy, Inc. | | | | | | | | |
| 5.500%, 01/15/2025 (a) | | | 2,110,000 | | | | 2,085,735 | |
| | | | | | | | 60,429,850 | |
| Manufacturing – 10.28% | | | | | | | | |
| Anagram International Inc / Anagram Holdings LLC | | | | | | | | |
| 15.000%, 08/15/2025 (a) | | | 3,822,775 | | | | 4,092,032 | |
| Blast Motion, Inc. | | | | | | | | |
| 5.500%, 02/15/2025 (a) | | | 2,000,000 | | | | 1,964,800 | |
The accompanying notes are an integral part of these financial statements.
CROSSINGBRIDGE LOW DURATION HIGH YIELD FUND
| Schedule of Investments (Continued) |
March 31, 2022 (Unaudited)
| | | Face | | | | |
| | | Amount† | | | Value | |
| CORPORATE BONDS – 44.58% (CONTINUED) | | | | | | |
| | | | | | | |
| Manufacturing – 10.28% (Continued) | | | | | | |
| Chobani LLC / Chobani Finance Corp, Inc. | | | | | | |
| 7.500%, 04/15/2025 (a) | | | 11,233,000 | | | $ | 10,878,711 | |
| Columbia Care, Inc. | | | | | | | | |
| 9.500%, 02/03/2026 (d) | | | 9,000,000 | | | | 9,055,350 | |
| Del Monte Foods, Inc. | | | | | | | | |
| 11.875%, 05/15/2025 (a) | | | 6,192,000 | | | | 6,796,246 | |
| Fiven ASA | | | | | | | | |
| 6.850% (3 Month EURIBOR + 6.850%), 06/21/2024 (b)(d)(g) | | EUR 3,160,000 | | | | 3,591,902 | |
| Ford Motor Credit Co. LLC | | | | | | | | |
| 2.979%, 08/03/2022 | | | 6,833,000 | | | | 6,844,001 | |
| FXI Holdings, Inc. | | | | | | | | |
| 7.875%, 11/01/2024 (a) | | | 5,897,000 | | | | 5,882,670 | |
| Georg Jensen A/S | | | | | | | | |
| 6.000% (3 Month EURIBOR + 6.000%), 05/15/2023 (b)(d)(g) | | EUR 100,000 | | | | 109,243 | |
| G-III Apparel Group Ltd. | | | | | | | | |
| 7.875%, 08/15/2025 (a) | | | 3,215,000 | | | | 3,380,412 | |
| LR Global Holding GmbH | | | | | | | | |
| 7.250% (3 Month EURIBOR + 7.250%), 02/03/2025 (b)(d)(g) | | EUR 3,609,000 | | | | 3,942,572 | |
| Scientific Games International, Inc. | | | | | | | | |
| 5.000%, 10/15/2025 (a) | | | 4,060,000 | | | | 4,161,500 | |
| | | | | | | | 60,699,439 | |
| Mining, Quarrying, and Oil and Gas Extraction – 5.34% | | | | | | | | |
| Cleveland-Cliffs, Inc. | | | | | | | | |
| 9.875%, 10/17/2025 (a) | | | 15,703,000 | | | | 17,518,659 | |
| Copper Mountain Mining Corp. | | | | | | | | |
| 8.000%, 04/09/2026 (d) | | | 5,385,980 | | | | 5,520,630 | |
| Greenfire Resources, Inc. | | | | | | | | |
| 12.000%, 08/15/2025 (a)(d) | | | 2,660,000 | | | | 2,825,239 | |
| Tacora Resources, Inc. | | | | | | | | |
| 8.250%, 05/15/2026 (a)(d) | | | 5,848,000 | | | | 5,672,765 | |
| | | | | | | | 31,537,293 | |
| Professional, Scientific, and Technical Services – 2.58% | | | | | | | | |
| C3 Nano, Inc. | | | | | | | | |
| 6.500%, 02/15/2024 (a) | | | 600,000 | | | | 595,530 | |
| Desenio Holding AB | | | | | | | | |
| 5.546% (3 Month STIBOR + 5.500%), 12/16/2024 (b)(d)(e) | | SEK 2,500,000 | | | | 228,665 | |
| Diebold Nixdorf, Inc. | | | | | | | | |
| 8.500%, 04/15/2024 | | | 6,448,000 | | | | 6,189,758 | |
The accompanying notes are an integral part of these financial statements.
CROSSINGBRIDGE LOW DURATION HIGH YIELD FUND
| Schedule of Investments (Continued) |
March 31, 2022 (Unaudited)
| | | Face | | | | |
| | | Amount† | | | Value | |
| CORPORATE BONDS – 44.58% (CONTINUED) | | | | | | |
| | | | | | | |
| Professional, Scientific, and | | | | | | |
| Technical Services – 2.58% (Continued) | | | | | | |
| Getty Images, Inc. | | | | | | |
| 9.750%, 03/01/2027 (a) | | | 7,949,000 | | | $ | 8,239,377 | |
| | | | | | | | 15,253,330 | |
| Real Estate and Rental and Leasing – 0.25% | | | | | | | | |
| REX – Real Estate Exchange, Inc. | | | | | | | | |
| 6.000%, 03/15/2025 (a) | | | 1,500,000 | | | | 1,494,150 | |
| | | | | | | | | |
| Retail Trade – 4.38% | | | | | | | | |
| Sally Holdings LLC / Sally Capital, Inc. | | | | | | | | |
| 8.750%, 04/30/2025 (a) | | | 5,474,000 | | | | 5,727,227 | |
| The Fresh Market, Inc. | | | | | | | | |
| 9.750%, 05/01/2023 (a) | | | 20,478,000 | | | | 20,119,635 | |
| | | | | | | | 25,846,862 | |
| Transportation and Warehousing – 6.61% | | | | | | | | |
| Altera Shuttle Tankers LLC | | | | | | | | |
| 7.125%, 08/15/2022 (d) | | | 1,000,000 | | | | 974,500 | |
| Golar LNG Ltd. | | | | | | | | |
| 7.000%, 10/20/2025 (d) | | | 11,547,000 | | | | 11,547,000 | |
| Rockpoint Gas Storage Canada Ltd. | | | | | | | | |
| 7.000%, 03/31/2023 (a)(d) | | | 11,875,000 | | | | 11,884,559 | |
| Stolt-Nielsen Ltd. | | | | | | | | |
| 6.375%, 09/21/2022 (d) | | | 10,800,000 | | | | 10,921,520 | |
| Western Midstream Operating LP | | | | | | | | |
| 4.000%, 07/01/2022 | | | 3,680,000 | | | | 3,680,000 | |
| | | | | | | | 39,007,579 | |
| Wholesale Trade – 0.46% | | | | | | | | |
| Martin Midstream Partners LP / Martin Midstream Finance Corp. | | | | | | | | |
| 10.000%, 02/29/2024 (a) | | | 2,656,079 | | | | 2,700,130 | |
| TOTAL CORPORATE BONDS (Cost $266,585,534) | | | | | | | 263,281,318 | |
| | | | | | | | | |
| | | Number | | | | | |
| | | of Shares | | | | | |
| SPECIAL PURPOSE ACQUISITION COMPANIES – 11.25% | | | | | | | | |
| Adit EdTech Acquisition Corp. (i) | | | 10,070 | | | | 99,492 | |
| Alpha Partners Technology | | | | | | | | |
| Merger Corp. Founder Shares (i)(k)(l) | | | 9,341 | | | | 3,036 | |
The accompanying notes are an integral part of these financial statements.
CROSSINGBRIDGE LOW DURATION HIGH YIELD FUND
| Schedule of Investments (Continued) |
March 31, 2022 (Unaudited)
| | | Number | | | | |
| | | of Shares | | | Value | |
| SPECIAL PURPOSE ACQUISITION | | | | | | |
| COMPANIES – 11.25% (CONTINUED) | | | | | | |
| Aries I Acquisition Corp. (d)(i) | | | 8,186 | | | $ | 82,433 | |
| Athlon Acquisition Corp. (i) | | | 12,435 | | | | 121,863 | |
| Atlantic Avenue Acquisition Corp. (i) | | | 90,259 | | | | 889,954 | |
| Authentic Equity Acquisition Corp. (d)(i) | | | 12,435 | | | | 121,863 | |
| AxonPrime Infrastructure | | | | | | | | |
| Acquisition Corp. Founder Shares (i)(k)(l) | | | 5,000 | | | | 2,250 | |
| Benessere Capital Acquisition Corp. (i) | | | 200,000 | | | | 2,050,000 | |
| Berenson Acquisition Corp. Founder Shares (i)(k)(l) | | | 19,099 | | | | 5,157 | |
| Berenson Acquisition Corp. I (i) | | | 108,118 | | | | 1,054,150 | |
| BGP Acquisition Corp. (d)(i) | | | 167,419 | | | | 1,615,593 | |
| Bite Acquisition Corp. (i) | | | 15,849 | | | | 155,162 | |
| Blockchain Moon Acquisition Corp. (i) | | | 90,668 | | | | 893,986 | |
| Brigade-M3 European Acquisition Corp. (d)(i) | | | 220,621 | | | | 2,162,086 | |
| Bull Horn Holdings Corp. (d)(i) | | | 71,429 | | | | 720,719 | |
| Bullpen Parlay Acquisition Co. (d)(i) | | | 44,011 | | | | 439,890 | |
| Carney Technology Acquisition Corp. II (i) | | | 235,993 | | | | 2,317,451 | |
| Cartesian Growth Corp. (d)(i) | | | 32,969 | | | | 325,404 | |
| Cascade Acquisition Corp. (i) | | | 75,736 | | | | 763,419 | |
| Chavant Capital Acquisition Corp. (d)(i) | | | 141,515 | | | | 1,403,829 | |
| Clarim Acquisition Corp. (i) | | | 19,291 | | | | 188,859 | |
| Cohn Robbins Holdings Corp. (d)(i) | | | 14,295 | | | | 142,092 | |
| COVA Acquisition Corp. (d)(i) | | | 12,435 | | | | 121,863 | |
| Crescera Capital Acquisition Corp. (d)(i) | | | 33,736 | | | | 338,035 | |
| DHB Capital Corp. (i) | | | 4,520 | | | | 44,115 | |
| Disruptive Acquisition Corp. I (d)(i) | | | 20,811 | | | | 203,532 | |
| DTRT Health Acquisition Corp. (i) | | | 56,825 | | | | 569,955 | |
| Duddell Street Acquisition Corp. (d)(i) | | | 6,717 | | | | 66,700 | |
| EJF Acquisition Corp. (d)(i) | | | 11,439 | | | | 112,788 | |
| Elliott Opportunity II Corp. (d)(i) | | | 41,338 | | | | 404,286 | |
| Empowerment & Inclusion Capital I Corp. (i) | | | 21,858 | | | | 214,427 | |
| Enterprise 4.0 Technology Acquisition Corp. (d)(i) | | | 19,880 | | | | 197,607 | |
| Equity Distribution Acquisition Corp. (i) | | | 27,989 | | | | 276,786 | |
| Everest Consolidator Acquisition Corp. (i) | | | 9,415 | | | | 94,338 | |
| Executive Network Partnering Corp. (i) | | | 189,519 | | | | 1,866,762 | |
| Fat Projects Acquisition Corp. (d)(i) | | | 28,536 | | | | 281,650 | |
| FG Merger Corp. (i) | | | 140,039 | | | | 1,407,392 | |
| Fintech Evolution Acquisition Group (d)(i) | | | 1,217 | | | | 11,927 | |
| Forum Merger IV Corp. (i) | | | 30,394 | | | | 296,949 | |
| FutureTech II Acquisition Corp. (i) | | | 125,000 | | | | 1,252,500 | |
| G&P Acquisition Corp. (i) | | | 256,448 | | | | 2,545,246 | |
| G3 VRM Acquisition Corp. (i) | | | 103,004 | | | | 1,046,521 | |
| Global Consumer Acquisition Corp. (i) | | | 103,808 | | | | 1,037,042 | |
The accompanying notes are an integral part of these financial statements.
CROSSINGBRIDGE LOW DURATION HIGH YIELD FUND
| Schedule of Investments (Continued) |
March 31, 2022 (Unaudited)
| | | Number | | | | |
| | | of Shares | | | Value | |
| SPECIAL PURPOSE ACQUISITION | | | | | | |
| COMPANIES – 11.25% (CONTINUED) | | | | | | |
| Global Partner Acquisition Corp. II (d)(i) | | | 12,977 | | | $ | 127,175 | |
| Global SPAC Partners Co. (d)(i) | | | 134,584 | | | | 1,359,298 | |
| Global Synergy Acquisition Corp. (d)(i) | | | 42,223 | | | | 419,697 | |
| Golden Falcon Acquisition Corp. (i) | | | 46,683 | | | | 457,960 | |
| GP Bullhound Acquisition I SE (d)(g)(i) | | | 108,609 | | | | 1,190,680 | |
| GSR II Meteora Acquisition Corp. (i) | | | 155,177 | | | | 1,569,615 | |
| Hambro Perks Acquisition Co. Ltd. (d)(h)(i) | | | 217,802 | | | | 2,846,842 | |
| Hamilton Lane Alliance Holdings I, Inc. (i) | | | 24,449 | | | | 239,600 | |
| Healthcare Services Acquisition Corp. (i) | | | 12,435 | | | | 121,863 | |
| Heartland Media Acquisition Corp. (i) | | | 83,637 | | | | 833,024 | |
| Hiro Metaverse Acquisitions I SA (d)(h)(i) | | | 135,163 | | | | 1,775,564 | |
| HNR Acquisition Corp. (i) | | | 200,000 | | | | 2,008,000 | |
| Iconic Sports Acquisition Corp. (d)(i) | | | 345,215 | | | | 3,452,150 | |
| Ignyte Acquisition Corp. (i) | | | 12,435 | | | | 122,609 | |
| Isleworth Healthcare Acquisition Corp. (i) | | | 26,494 | | | | 262,291 | |
| Itiquira Acquisition Corp. (d)(i) | | | 12,435 | | | | 121,987 | |
| JOFF Fintech Acquisition Corp. (i) | | | 86,850 | | | | 848,524 | |
| KnightSwan Acquisition Corp. (i) | | | 76,559 | | | | 766,356 | |
| LAVA Medtech Acquisition Corp. (i) | | | 43,085 | | | | 436,020 | |
| Mason Industrial Technology, Inc. (i) | | | 206,515 | | | | 2,017,651 | |
| Mercury Ecommerce Acquisition Corp. (i) | | | 350,000 | | | | 3,437,000 | |
| New Providence Acquisition Corp. II (i) | | | 49,017 | | | | 492,621 | |
| Oaktree Acquisition Corp. II (d)(i) | | | 26,901 | | | | 267,665 | |
| Omnichannel Acquisition Corp. (i) | | | 63,103 | | | | 629,137 | |
| OmniLit Acquisition Corp. (i) | | | 12,822 | | | | 127,835 | |
| One Equity Partners Open Water I Corp. (i) | | | 19,319 | | | | 188,940 | |
| OTR Acquisition Corp. (i) | | | 33,414 | | | | 341,157 | |
| Oyster Enterprises Acquisition Corp. (i) | | | 12,435 | | | | 121,739 | |
| Peridot Acquisition Corp. II (d)(i) | | | 20,358 | | | | 199,101 | |
| Pontem Corp. (d)(i) | | | 2,939 | | | | 28,832 | |
| PowerUp Acquisition Corp. (d)(i) | | | 25,212 | | | | 253,381 | |
| PWP Forward Acquisition Corp. I (i) | | | 6,639 | | | | 64,863 | |
| Pyrophyte Acquisition Corp. (d)(i) | | | 22,753 | | | | 230,374 | |
| Relativity Acquisition Corp. (i) | | | 169,970 | | | | 1,711,598 | |
| Revelstone Capital Acquisition Corp. (i) | | | 90,000 | | | | 889,200 | |
| Revelstone Capital Acquisition Corp. Founder Shares (i)(k)(l) | | | 10,125 | | | | 2,328 | |
| RMG Acquisition Corp. III (d)(i) | | | 31,887 | | | | 312,493 | |
| ShoulderUp Technology Acquisition Corp. (i) | | | 6,440 | | | | 65,044 | |
| Signal Hill Acquisition Corp. (i) | | | 270,000 | | | | 2,705,400 | |
| Silver Crest Acquisition Corp. (d)(i) | | | 12,435 | | | | 122,236 | |
| Silver Spike III Acquisition Corp. (d)(i) | | | 279,885 | | | | 2,798,850 | |
| SportsMap Tech Acquisition Corp. (i) | | | 13,234 | | | | 131,281 | |
The accompanying notes are an integral part of these financial statements.
CROSSINGBRIDGE LOW DURATION HIGH YIELD FUND
| Schedule of Investments (Continued) |
March 31, 2022 (Unaudited)
| | | Number | | | | |
| | | of Shares | | | Value | |
| SPECIAL PURPOSE ACQUISITION | | | | | | |
| COMPANIES – 11.25% (CONTINUED) | | | | | | |
| ST Energy Transition I Ltd. (d)(i) | | | 12,659 | | | $ | 126,906 | |
| Tailwind International Acquisition Corp. (d)(i) | | | 30,005 | | | | 293,749 | |
| Tech and Energy Transition Corp. (i) | | | 13,307 | | | | 129,943 | |
| Tekkorp Digital Acquisition Corp. (d)(i) | | | 59,086 | | | | 582,588 | |
| Tishman Speyer Innovation Corp. II (i) | | | 44,553 | | | | 436,619 | |
| Vector Acquisition Corp. II (d)(i) | | | 72,577 | | | | 707,626 | |
| Zanite Acquisition Corp. (i) | | | 13,073 | | | | 134,129 | |
| TOTAL SPECIAL PURPOSE ACQUISITION COMPANIES | | | | | | | | |
| (Cost $66,096,797) | | | | | | | 66,458,650 | |
| | | | | | | | | |
| TRADE CLAIMS – 0.82% | | | | | | | | |
| | | | | | | | | |
| Utilities – 0.82% | | | | | | | | |
| Brazos Electric Power Cooperative, Inc. | | | 5,397,407 | | | | 4,857,666 | |
| TOTAL TRADE CLAIMS (Cost $4,891,400) | | | | | | | 4,857,666 | |
| | | | | | | | | |
| WARRANTS – 0.03% | | | | | | | | |
| Berenson Acquisition Corp. I (i) | | | | | | | | |
| Expiration: 08/01/2026, Exercise Price: $11.50 | | | 54,059 | | | | 14,596 | |
| Brigade-M3 European Acquisition Corp. (d)(i) | | | | | | | | |
| Expiration: 01/17/2027, Exercise Price: $11.50 | | | 110,311 | | | | 22,062 | |
| DHB Capital Corp. (i) | | | | | | | | |
| Expiration: 03/31/2028, Exercise Price: $11.50 | | | 1,506 | | | | 497 | |
| GP Bullhound Acquisition I SE (d)(g)(i) | | | | | | | | |
| Expiration: 03/11/2027, Exercise Price: $11.50 | | | 54,305 | | | | 16,521 | |
| Hambro Perks Acquisition Corp. (d)(h)(i) | | | | | | | | |
| Expiration: 01/07/2026, Exercise Price: $11.50 | | | 108,901 | | | | 15,021 | |
| Hiro Metaverse Acquisitions I SA (d)(h)(i) | | | | | | | | |
| Expiration: 12/21/2026, Exercise Price: $11.50 | | | 67,582 | | | | 26,633 | |
| Leafly Holdings, Inc. (i) | | | | | | | | |
| Expiration: 11/07/2026, Exercise Price: $11.50 | | | 72,450 | | | | 94,185 | |
| OmniLit Acquisition Corp. (i) | | | | | | | | |
| Expiration: 11/08/2026, Exercise Price: $11.50 | | | 6,411 | | | | 1,513 | |
| TOTAL WARRANTS (Cost $115,796) | | | | | | | 191,028 | |
The accompanying notes are an integral part of these financial statements.
CROSSINGBRIDGE LOW DURATION HIGH YIELD FUND
| Schedule of Investments (Continued) |
March 31, 2022 (Unaudited)
| | | Number | | | | |
| | | of Shares | | | Value | |
| MONEY MARKET FUNDS – 10.95% | | | | | | |
| First American Government Obligations | | | | | | |
| Fund – Class X, 0.191% (j) | | | 32,341,792 | | | $ | 32,341,792 | |
| First American Treasury Obligations Fund – Class X, 0.235% (j) | | | 32,341,792 | | | | 32,341,792 | |
| TOTAL MONEY MARKET FUNDS (Cost $64,683,584) | | | | | | | 64,683,584 | |
Total Investments (Cost $609,511,707) – 102.42% | | | | | | | 604,859,581 | |
| Liabilities in Excess of Other Assets – (2.42)% | | | | | | | (14,307,843 | ) |
| Total Net Assets – 100.00% | | | | | | $ | 590,551,738 | |
Percentages are stated as a percent of net assets.
| † | Face amount in U.S. Dollar unless otherwise indicated. |
| (a) | Securities issued pursuant to Rule 144A under the Securities Act of 1933 and Regulation S under the Securities Act of 1933. Aggregate value of these securities is $160,014,710 or 27.10% of Fund’s net assets. |
| (b) | Variable rate security. The rate shown represents the rate at March 31, 2022. |
| (c) | The rate shown is the effective yield. |
| (d) | Foreign issued security. |
| (e) | Principal amount denominated in Swedish Krona. |
| (f) | Principal amount denominated in Norwegian Krone. |
| (g) | Principal amount denominated in Euros. |
| (h) | Holding denominated in British Pound. |
| (i) | Non-income producing security. |
| (j) | Seven day yield as of March 31, 2022. |
| (k) | Illiquid security. |
| (l) | Security valued using unobservable inputs. |
Definitions:
EURIBOR – Euro-Interbank Offer Rate is a reference rate expressing the average interest rate at which eurozone banks offer unsecured short-term lending on the interbank market.
LIBOR – London Interbank Offer Rate is a benchmark rate at which banks offer to lend funds to one another in the international interbank market for short-term loans.
NIBOR – Norwegian Interbank Offer Rate is a collective term for Norwegian money market rates at different maturities. It is intended to reflect the interest rate level a bank require for unsecured money market lending in Norwegian Krone to another bank.
STIBOR – Stockholm Interbank Offer Rate is a reference rate that shows the average interest rate at which a number of active banks on the Swedish money market are willing to lend to one another, without collateral, at different maturities.
The accompanying notes are an integral part of these financial statements.
CROSSINGBRIDGE LOW DURATION HIGH YIELD FUND
| Schedule of Forward Currency Exchange Contracts |
March 31, 2022 (Unaudited)
| | | | | Currency | | USD Value at | | | Currency | | USD Value at | | | Unrealized | |
| Settlement | | Counter- | | to be | | March 31, | | | to be | | March 31, | | | Appreciation/ | |
| Date | | party | | Delivered | | 2022 | | | Received | | 2022 | | | (Depreciation) | |
| 4/14/22 | | U.S. Bank | | 25,855,000 | | EUR | | $ | 28,613,648 | | | 28,510,567 | | USD | | $ | 28,510,567 | | | $ | (103,081 | ) |
| 4/14/22 | | U.S. Bank | | 3,531,000 | | GBP | | | 4,638,004 | | | 4,630,236 | | USD | | | 4,630,236 | | | | (7,768 | ) |
| 4/13/22 | | U.S. Bank | | 28,362,000 | | NOK | | | 3,221,043 | | | 3,167,558 | | USD | | | 3,167,558 | | | | (53,485 | ) |
| 4/14/22 | | U.S. Bank | | 42,248,000 | | SEK | | | 4,494,429 | | | 4,376,126 | | USD | | | 4,376,126 | | | | (118,303 | ) |
| 4/13/22 | | U.S. Bank | | 399,676 | | USD | | | 399,676 | | | 3,457,000 | | SEK | | | 392,608 | | | | (7,068 | ) |
| | | | | | | | | $ | 41,366,800 | | | | | | | $ | 41,077,095 | | | $ | (289,705 | ) |
EUR – Euro
GBP – British Pound
NOK – Norwegian Krone
SEK – Swedish Krona
USD – U.S. Dollars
The accompanying notes are an integral part of these financial statements.
CROSSINGBRIDGE RESPONSIBLE CREDIT FUND
March 31, 2022 (Unaudited)
| | | Face | | | | |
| | | Amount† | | | Value | |
| BANK LOANS – 7.25% | | | | | | |
| | | | | | | |
| Information – 4.45% | | | | | | |
| Intelsat Jackson Holdings SA | | | | | | |
| 8.000% (3 Month LIBOR + 3.750%), 11/27/2023 (a)(b) | | | 750,000 | | | $ | 750,000 | |
| | | | | | | | | |
| Retail Trade – 2.80% | | | | | | | | |
| West Marine, Inc. | | | | | | | | |
| 9.000% (1 Month LIBOR + 8.250%), 06/01/2029 (a) | | | 500,000 | | | | 471,250 | |
| TOTAL BANK LOANS (Cost $1,256,374) | | | | | | | 1,221,250 | |
| | | | | | | | | |
| COMMERCIAL PAPER – 1.90% | | | | | | | | |
| | | | | | | | | |
| Manufacturing – 1.90% | | | | | | | | |
| Jabil, Inc. | | | | | | | | |
| 0.693%, 04/06/2022 (c) | | | 321,000 | | | | 320,953 | |
| TOTAL COMMERCIAL PAPER (Cost $320,969) | | | | | | | 320,953 | |
| | | | | | | | | |
| CONVERTIBLE BONDS – 1.27% | | | | | | | | |
| | | | | | | | | |
| Manufacturing – 1.27% | | | | | | | | |
| Danimer Scientific, Inc. | | | | | | | | |
| 3.250%, 12/15/2026 (d) | | | 260,000 | | | | 213,850 | |
| TOTAL CONVERTIBLE BONDS (Cost $258,960) | | | | | | | 213,850 | |
| | | | | | | | | |
| CORPORATE BONDS – 57.03% | | | | | | | | |
| | | | | | | | | |
| Agriculture, Forestry, Fishing and Hunting – 5.87% | | | | | | | | |
| Cooks Venture, Inc. | | | | | | | | |
| 5.500%, 01/15/2025 (d) | | | 1,000,000 | | | | 988,500 | |
| | | | | | | | | |
| Finance and Insurance – 4.01% | | | | | | | | |
| StoneX Group, Inc. | | | | | | | | |
| 8.625%, 06/15/2025 (d) | | | 648,000 | | | | 675,858 | |
| | | | | | | | | |
| Information – 17.63% | | | | | | | | |
| Calligo UK Ltd. | | | | | | | | |
| 8.500% (3 Month EURIBOR + 8.500%), 12/29/2024 (a)(b)(e) | | EUR 100,000 | | | | 108,921 | |
| Cengage Learning, Inc. | | | | | | | | |
| 9.500%, 06/15/2024 (d) | | | 308,000 | | | | 307,721 | |
| INNOVATE Corp. | | | | | | | | |
| 8.500%, 02/01/2026 (d) | | | 460,000 | | | | 450,885 | |
| Linkem S.p.A. | | | | | | | | |
| 6.000% (3 Month EURIBOR + 6.000%), 08/09/2022 (a)(b)(e) | | EUR 1,250,000 | | | | 1,382,820 | |
The accompanying notes are an integral part of these financial statements.
CROSSINGBRIDGE RESPONSIBLE CREDIT FUND
| Schedule of Investments (Continued) |
March 31, 2022 (Unaudited)
| | | Face | | | | |
| | | Amount† | | | Value | |
| CORPORATE BONDS – 57.03% (CONTINUED) | | | | | | |
| | | | | | | |
| Information – 17.63% (Continued) | | | | | | |
| MicroStrategy, Inc. | | | | | | |
| 6.125%, 06/15/2028 (d) | | | 316,000 | | | $ | 307,868 | |
| NortonLifeLock, Inc. | | | | | | | | |
| 5.000%, 04/15/2025 (d) | | | 311,000 | | | | 311,411 | |
| Tigo Energy, Inc. | | | | | | | | |
| 5.500%, 01/15/2025 (d) | | | 100,000 | | | | 98,850 | |
| | | | | | | | 2,968,476 | |
| Manufacturing – 5.11% | | | | | | | | |
| Chobani LLC / Chobani Finance Corp, Inc. | | | | | | | | |
| 7.500%, 04/15/2025 (d) | | | 550,000 | | | | 532,653 | |
| LR Global Holding GmbH | | | | | | | | |
| 7.250% (3 Month EURIBOR + 7.250%), 02/03/2025 (a)(b)(e) | | EUR 300,000 | | | | 327,728 | |
| | | | | | | | 860,381 | |
| Mining, Quarrying, and Oil and Gas Extraction – 2.07% | | | | | | | | |
| Copper Mountain Mining Corp. | | | | | | | | |
| 8.000%, 04/09/2026 (b) | | | 340,060 | | | | 348,562 | |
| | | | | | | | | |
| Professional, Scientific, and Technical Services – 6.98% | | | | | | | | |
| Diebold Nixdorf, Inc. | | | | | | | | |
| 8.500%, 04/15/2024 | | | 577,000 | | | | 553,891 | |
| Getty Images, Inc. | | | | | | | | |
| 9.750%, 03/01/2027 (d) | | | 600,000 | | | | 621,918 | |
| | | | | | | | 1,175,809 | |
| Retail Trade – 3.38% | | | | | | | | |
| The Fresh Market, Inc. | | | | | | | | |
| 9.750%, 05/01/2023 (d) | | | 578,954 | | | | 568,822 | |
| | | | | | | | | |
| Transportation and Warehousing – 5.82% | | | | | | | | |
| Golar LNG Ltd. | | | | | | | | |
| 7.000%, 10/20/2025 (b) | | | 330,000 | | | | 330,000 | |
| Rockpoint Gas Storage Canada Ltd. | | | | | | | | |
| 7.000%, 03/31/2023 (b)(d) | | | 650,000 | | | | 650,523 | |
| | | | | | | | 980,523 | |
| Utilities – 6.16% | | | | | | | | |
| IEA Energy Services LLC | | | | | | | | |
| 6.625%, 08/15/2029 (d) | | | 1,100,000 | | | | 1,036,750 | |
| TOTAL CORPORATE BONDS (Cost $9,888,580) | | | | | | | 9,603,681 | |
The accompanying notes are an integral part of these financial statements.
CROSSINGBRIDGE RESPONSIBLE CREDIT FUND
| Schedule of Investments (Continued) |
March 31, 2022 (Unaudited)
| | | Number | | | | |
| | | of Shares | | | Value | |
| SPECIAL PURPOSE ACQUISITION COMPANIES – 17.24% | | | | | | |
| AltEnergy Acquisition Corp. (f) | | | 1,341 | | | $ | 13,289 | |
| Arbor Rapha Capital Bioholdings Corp. I (f) | | | 31,047 | | | | 312,643 | |
| Athlon Acquisition Corp. (f) | | | 31,000 | | | | 303,800 | |
| Atlantic Avenue Acquisition Corp. (f) | | | 26,630 | | | | 262,572 | |
| Authentic Equity Acquisition Corp. (b)(f) | | | 31,000 | | | | 303,800 | |
| AxonPrime Infrastructure | | | | | | | | |
| Acquisition Corp. Founder Shares (f)(g)(h) | | | 1,000 | | | | 450 | |
| Carney Technology Acquisition Corp. II (f) | | | 11,082 | | | | 108,825 | |
| Cohn Robbins Holdings Corp. (b)(f) | | | 7,200 | | | | 71,568 | |
| COVA Acquisition Corp. (b)(f) | | | 16,671 | | | | 163,376 | |
| Empowerment & Inclusion Capital I Corp. (f) | | | 22,322 | | | | 218,979 | |
| Enterprise 4.0 Technology Acquisition Corp. (b)(f) | | | 1,351 | | | | 13,429 | |
| Executive Network Partnering Corp. (f) | | | 5,353 | | | | 52,727 | |
| Global Consumer Acquisition Corp. (f) | | | 3,687 | | | | 36,833 | |
| Global Technology Acquisition Corp. I (b)(f) | | | 242 | | | | 2,441 | |
| Goldenstone Acquisition Ltd. (f) | | | 8,333 | | | | 83,163 | |
| Healthcare Services Acquisition Corp. (f) | | | 31,000 | | | | 303,800 | |
| Iconic Sports Acquisition Corp. (b)(f) | | | 7,573 | | | | 75,730 | |
| Ignyte Acquisition Corp. (f) | | | 22,737 | | | | 224,187 | |
| Legato Merger Corp. II (f) | | | 4,502 | | | | 45,335 | |
| Omnichannel Acquisition Corp. (f) | | | 30,000 | | | | 299,100 | |
| SportsMap Tech Acquisition Corp. (f) | | | 675 | | | | 6,696 | |
| TOTAL SPECIAL PURPOSE ACQUISITION COMPANIES | | | | | | | | |
| (Cost $2,874,667) | | | | | | | 2,902,743 | |
| | | | | | | | | |
| WARRANTS – 0.00% | | | | | | | | |
| SportsMap Tech Acquisition Corp. (f) | | | | | | | | |
| Expiration: 09/01/2027, Exercise Price: $11.50 | | | 1,013 | | | | 251 | |
| TOTAL WARRANTS (Cost $475) | | | | | | | 251 | |
The accompanying notes are an integral part of these financial statements.
CROSSINGBRIDGE RESPONSIBLE CREDIT FUND
| Schedule of Investments (Continued) |
March 31, 2022 (Unaudited)
| | | Number | | | | |
| | | of Shares | | | Value | |
| MONEY MARKET FUNDS – 10.64% | | | | | | |
| First American Government Obligations | | | | | | |
| Fund – Class X, 0.191% (i) | | | 895,570 | | | $ | 895,570 | |
| First American Treasury Obligations Fund – Class X, 0.235% (i) | | | 895,570 | | | | 895,570 | |
| TOTAL MONEY MARKET FUNDS (Cost $1,791,140) | | | | | | | 1,791,140 | |
Total Investments (Cost $16,391,165) – 95.33% | | | | | | | 16,053,868 | |
| Other Assets in Excess of Liabilities – 4.67% | | | | | | | 786,786 | |
| Total Net Assets – 100.00% | | | | | | $ | 16,840,654 | |
Percentages are stated as a percent of net assets.
| † | Face amount in U.S. Dollar unless otherwise indicated. |
| (a) | Variable rate security. The rate shown represents the rate at March 31, 2022. |
| (b) | Foreign issued security. |
| (c) | The rate shown is the effective yield. |
| (d) | Securities issued pursuant to Rule 144A under the Securities Act of 1933 and Regulation S under the Securities Act of 1933. Aggregate value of these securities is $6,765,609 or 40.17% of Fund’s net assets. |
| (e) | Principal amount denominated in Euros. |
| (f) | Non-income producing security. |
| (g) | Illiquid security. |
| (h) | Security valued using unobservable inputs. |
| (i) | Seven day yield as of March 31, 2022. |
Definitions:
EURIBOR – Euro-Interbank Offer Rate is a reference rate expressing the average interest rate at which eurozone banks offer unsecured short-term lending on the interbank market.
LIBOR – London Interbank Offer Rate is a benchmark rate at which banks offer to lend funds to one another in the international interbank market for short-term loans.
The accompanying notes are an integral part of these financial statements.
CROSSINGBRIDGE RESPONSIBLE CREDIT FUND
| Schedule of Forward Currency Exchange Contracts |
March 31, 2022 (Unaudited)
| | | | | Currency | | USD Value at | | | Currency | | USD Value at | | | Unrealized | |
| Settlement | | Counter- | | to be | | March 31, | | | to be | | March 31, | | | Appreciation/ | |
| Date | | party | | Delivered | | 2022 | | | Received | | 2022 | | | (Depreciation) | |
| 4/14/22 | | U.S. Bank | | 1,650,000 | | EUR | | $ | 1,826,050 | | | 1,819,472 | | USD | | $ | 1,819,472 | | | $ | (6,578 | ) |
EUR – Euro
USD – U.S. Dollars
The accompanying notes are an integral part of these financial statements.
CROSSINGBRIDGE ULTRA-SHORT DURATION FUND
March 31, 2022 (Unaudited)
| | | Face | | | | |
| | | Amount† | | | Value | |
| ASSET BACKED SECURITIES – 5.40% | | | | | | |
| | | | | | | |
| Finance and Insurance – 3.91% | | | | | | |
| LendingPoint 2021-A Asset Securitization Trust | | | | | | |
| A, 1.000%, 12/15/2028 (a) | | | 21,602 | | | $ | 21,561 | |
| LendingPoint 2021-B Asset Securitization Trust | | | | | | | | |
| A, 1.110%, 02/15/2029 (a) | | | 565,864 | | | | 562,333 | |
| LendingPoint 2022-A Asset Securitization Trust | | | | | | | | |
| A, 1.680%, 06/15/2029 (a) | | | 1,906,225 | | | | 1,862,159 | |
| | | | | | | | 2,446,053 | |
| Information – 0.19% | | | | | | | | |
| SBA Tower Trust | | | | | | | | |
| 2018-1, 3.448%, 03/15/2048 (a) | | | 120,000 | | | | 120,068 | |
| | | | | | | | | |
| Transportation and Warehousing – 1.30% | | | | | | | | |
| Continental Airlines 2007-1 Class A Pass Through Trust | | | | | | | | |
| 2007-1, 5.983%, 10/19/2023 | | | 277,130 | | | | 277,532 | |
| Santander Consumer Auto Receivables Trust 2021-B | | | | | | | | |
| B, 1.450%, 10/15/2028 (a) | | | 528,445 | | | | 520,323 | |
| Southwest Airlines Co 2007-1 Pass Through Trust | | | | | | | | |
| 2007-1, 6.650%, 08/01/2022 | | | 19,327 | | | | 19,325 | |
| | | | | | | | 817,180 | |
| TOTAL ASSET BACKED SECURITIES (Cost $3,446,289) | | | | | | | 3,383,301 | |
| | | | | | | | | |
| BANK LOANS – 3.01% | | | | | | | | |
| | | | | | | | | |
| Information – 0.74% | | | | | | | | |
| Intelsat Jackson Holdings SA | | | | | | | | |
| 8.000% (3 Month LIBOR + 3.750%), 11/27/2023 (b)(c) | | | 457,000 | | | | 457,000 | |
| 8.750% (3 Month LIBOR + 4.500%), 01/02/2024 (b)(c) | | | 3,441 | | | | 3,441 | |
| | | | | | | | 460,441 | |
| Manufacturing – 2.27% | | | | | | | | |
| Mallinckrodt International | | | | | | | | |
| 4.488% (3 Month LIBOR + 2.250%), 02/28/2023 (b) | | | 1,431,606 | | | | 1,424,004 | |
| TOTAL BANK LOANS (Cost $1,895,278) | | | | | | | 1,884,445 | |
| | | | | | | | | |
| | | Number | | | | | |
| | | of Shares | | | | | |
| COMMON STOCKS – 0.02% | | | | | | | | |
| | | | | | | | | |
| Information – 0.02% | | | | | | | | |
| Leafly Holdings, Inc. | | | 1,361 | | | | 11,269 | |
| TOTAL COMMON STOCKS (Cost $0) | | | | | | | 11,269 | |
The accompanying notes are an integral part of these financial statements.
CROSSINGBRIDGE ULTRA-SHORT DURATION FUND
| Schedule of Investments (Continued) |
March 31, 2022 (Unaudited)
| | | Face | | | | |
| | | Amount† | | | Value | |
| CONVERTIBLE BONDS – 4.28% | | | | | | |
| | | | | | | |
| Finance and Insurance – 2.54% | | | | | | |
| Goldman Sachs BDC, Inc. | | | | | | |
| 4.500%, 04/01/2022 | | | 743,000 | | | $ | 744,857 | |
| Prospect Capital Corp. | | | | | | | | |
| 4.950%, 07/15/2022 | | | 835,000 | | | | 844,394 | |
| | | | | | | | 1,589,251 | |
| Information – 1.74% | | | | | | | | |
| Leafly Holdings, Inc. | | | | | | | | |
| 8.000%, 01/31/2025 (d)(e) | | | 1,089,000 | | | | 1,089,000 | |
| TOTAL CONVERTIBLE BONDS (Cost $2,674,532) | | | | | | | 2,678,251 | |
| | | | | | | | | |
| CORPORATE BONDS – 74.35% | | | | | | | | |
| | | | | | | | | |
| Agriculture, Forestry, Fishing and Hunting – 3.37% | | | | | | | | |
| Cooks Venture, Inc. | | | | | | | | |
| 5.500%, 01/15/2025 (a) | | | 600,000 | | | | 593,100 | |
| Land O’ Lakes, Inc. | | | | | | | | |
| 6.000%, 11/15/2022 (a) | | | 1,500,000 | | | | 1,520,730 | |
| | | | | | | | 2,113,830 | |
| Construction – 2.43% | | | | | | | | |
| Lennar Corp. | | | | | | | | |
| 4.750%, 11/15/2022 | | | 1,508,000 | | | | 1,523,502 | |
| | | | | | | | | |
| Educational Services – 3.20% | | | | | | | | |
| Pearson Funding Four Ltd. | | | | | | | | |
| 3.750%, 05/08/2022 (a)(c) | | | 2,000,000 | | | | 2,002,413 | |
| | | | | | | | | |
| Finance and Insurance – 5.50% | | | | | | | | |
| FS KKR Capital Corp. | | | | | | | | |
| 4.750%, 05/15/2022 | | | 797,000 | | | | 797,523 | |
| Main Street Capital Corp. | | | | | | | | |
| 4.500%, 12/01/2022 | | | 725,000 | | | | 735,500 | |
| MHH Holding BV | | | | | | | | |
| 7.366% (3 Month LIBOR + 7.000%), 02/10/2025 (b)(c) | | | 615,000 | | | | 622,688 | |
| Nasdaq, Inc. | | | | | | | | |
| 0.445%, 12/21/2022 | | | 1,300,000 | | | | 1,285,816 | |
| | | | | | | | 3,441,527 | |
The accompanying notes are an integral part of these financial statements.
CROSSINGBRIDGE ULTRA-SHORT DURATION FUND
| Schedule of Investments (Continued) |
March 31, 2022 (Unaudited)
| | | Face | | | | |
| | | Amount† | | | Value | |
| CORPORATE BONDS – 74.35% (CONTINUED) | | | | | | |
| | | | | | | |
| Information – 13.01% | | | | | | |
| AT&T, Inc. | | | | | | |
| 0.000%, 11/27/2022 | | | 2,000,000 | | | $ | 1,968,435 | |
| Calligo UK Ltd. | | | | | | | | |
| 8.500% (3 Month EURIBOR + 8.500%), 12/29/2024 (b)(c)(f) | | EUR 400,000 | | | | 435,684 | |
| Linkem S.p.A. | | | | | | | | |
| 6.000% (3 Month EURIBOR + 6.000%), 08/09/2022 (b)(c)(f) | | EUR 1,721,000 | | | | 1,903,866 | |
| Oracle Corp. | | | | | | | | |
| 2.500%, 05/15/2022 | | | 1,750,000 | | | | 1,751,102 | |
| Tigo Energy, Inc. | | | | | | | | |
| 5.500%, 01/15/2025 (a) | | | 315,000 | | | | 311,378 | |
| Verisk Analytics, Inc. | | | | | | | | |
| 4.125%, 09/12/2022 | | | 1,758,000 | | | | 1,775,396 | |
| | | | | | | | 8,145,861 | |
| Manufacturing – 27.80% | | | | | | | | |
| Advanced Micro Devices, Inc. | | | | | | | | |
| 7.500%, 08/15/2022 | | | 750,000 | | | | 766,650 | |
| Bayer US Finance II LLC | | | | | | | | |
| 2.200%, 07/15/2022 (a) | | | 740,000 | | | | 739,999 | |
| Blast Motion, Inc. | | | | | | | | |
| 5.500%, 02/15/2025 (a) | | | 1,000,000 | | | | 982,400 | |
| Cabot Corp. | | | | | | | | |
| 3.700%, 07/15/2022 | | | 916,000 | | | | 921,292 | |
| Carlisle Companies, Inc. | | | | | | | | |
| 3.750%, 11/15/2022 | | | 1,704,000 | | | | 1,713,891 | |
| Cintas Corp. No 2 | | | | | | | | |
| 3.250%, 06/01/2022 | | | 600,000 | | | | 600,872 | |
| Eastman Chemical Co. | | | | | | | | |
| 3.600%, 08/15/2022 | | | 1,000,000 | | | | 1,002,677 | |
| General Electric Co. | | | | | | | | |
| 3.100%, 01/09/2023 | | | 856,000 | | | | 862,167 | |
| General Motors Financial Co, Inc. | | | | | | | | |
| 2.306% (3 Month LIBOR + 1.310%), 06/30/2022 (b) | | | 1,200,000 | | | | 1,202,513 | |
| Hewlett Packard Enterprise Co. | | | | | | | | |
| 4.400%, 10/15/2022 | | | 1,631,000 | | | | 1,647,808 | |
| Jabil, Inc. | | | | | | | | |
| 4.700%, 09/15/2022 | | | 1,100,000 | | | | 1,112,551 | |
| Leggett & Platt, Inc. | | | | | | | | |
| 3.400%, 08/15/2022 | | | 750,000 | | | | 751,746 | |
| Microchip Technology, Inc. | | | | | | | | |
| 4.333%, 06/01/2023 | | | 1,000,000 | | | | 1,016,718 | |
The accompanying notes are an integral part of these financial statements.
CROSSINGBRIDGE ULTRA-SHORT DURATION FUND
| Schedule of Investments (Continued) |
March 31, 2022 (Unaudited)
| | | Face | | | | |
| | | Amount† | | | Value | |
| CORPORATE BONDS – 74.35% (CONTINUED) | | | | | | |
| | | | | | | |
| Manufacturing – 27.80% (Continued) | | | | | | |
| Parker-Hannifin Corp. | | �� | | | | |
| 3.500%, 09/15/2022 | | | 1,000,000 | | | $ | 1,007,856 | |
| Roper Technologies, Inc. | | | | | | | | |
| 0.450%, 08/15/2022 | | | 750,000 | | | | 746,895 | |
| Tapestry, Inc. | | | | | | | | |
| 3.000%, 07/15/2022 | | | 1,000,000 | | | | 1,001,022 | |
| Viatris, Inc. | | | | | | | | |
| 1.125%, 06/22/2022 | | | 550,000 | | | | 550,029 | |
| Westlake Corp. | | | | | | | | |
| 3.600%, 07/15/2022 | | | 778,000 | | | | 779,309 | |
| | | | | | | | 17,406,395 | |
| Mining, Quarrying, and Oil and Gas Extraction – 1.62% | | | | | | | | |
| Glencore Funding LLC | | | | | | | | |
| 4.125%, 05/30/2023 (a) | | | 1,000,000 | | | | 1,017,760 | |
| | | | | | | | | |
| Professional, Scientific, and Technical Services – 1.37% | | | | | | | | |
| Getty Images, Inc. | | | | | | | | |
| 9.750%, 03/01/2027 (a) | | | 827,000 | | | | 857,210 | |
| | | | | | | | | |
| Real Estate and Rental and Leasing – 2.39% | | | | | | | | |
| REX – Real Estate Exchange, Inc. | | | | | | | | |
| 6.000%, 03/15/2025 (a) | | | 1,500,000 | | | | 1,494,150 | |
| | | | | | | | | |
| Retail Trade – 9.22% | | | | | | | | |
| CVS Health Corp. | | | | | | | | |
| 3.500%, 07/20/2022 | | | 1,973,000 | | | | 1,978,298 | |
| eBay, Inc. | | | | | | | | |
| 2.600%, 07/15/2022 | | | 983,000 | | | | 983,194 | |
| The Fresh Market, Inc. | | | | | | | | |
| 9.750%, 05/01/2023 (a) | | | 2,085,000 | | | | 2,048,512 | |
| The Kroger Co. | | | | | | | | |
| 2.800%, 08/01/2022 | | | 763,000 | | | | 764,735 | |
| | | | | | | | 5,774,739 | |
| Transportation and Warehousing – 4.22% | | | | | | | | |
| Delta Air Lines, Inc. | | | | | | | | |
| 7.000%, 05/01/2025 (a) | | | 30,000 | | | | 32,272 | |
| Golar LNG Ltd. | | | | | | | | |
| 7.000%, 10/20/2025 (c) | | | 902,000 | | | | 902,000 | |
The accompanying notes are an integral part of these financial statements.
CROSSINGBRIDGE ULTRA-SHORT DURATION FUND
| Schedule of Investments (Continued) |
March 31, 2022 (Unaudited)
| | | Face | | | | |
| | | Amount† | | | Value | |
| CORPORATE BONDS – 74.35% (CONTINUED) | | | | | | |
| | | | | | | |
| Transportation and Warehousing – 4.22% (Continued) | | | | | | |
| Kinder Morgan Energy Partners LP | | | | | | |
| 3.950%, 09/01/2022 | | | 500,000 | | | $ | 501,880 | |
| Rockpoint Gas Storage Canada Ltd. | | | | | | | | |
| 7.000%, 03/31/2023 (a)(c) | | | 1,203,000 | | | | 1,203,968 | |
| | | | | | | | 2,640,120 | |
| Wholesale Trade – 0.22% | | | | | | | | |
| Avnet, Inc. | | | | | | | | |
| 4.875%, 12/01/2022 | | | 135,000 | | | | 137,632 | |
| TOTAL CORPORATE BONDS (Cost $46,790,046) | | | | | | | 46,555,139 | |
| | | | | | | | | |
| | | Number of | | | | | |
| | | Shares | | | | | |
| SPECIAL PURPOSE ACQUISITION COMPANIES – 12.06% | | | | | | | | |
| Arbor Rapha Capital Bioholdings Corp. I (g) | | | 53,037 | | | | 534,083 | |
| Berenson Acquisition Corp. Founder Shares (d)(e)(g) | | | 1,827 | | | | 493 | |
| BGP Acquisition Corp. (c)(g) | | | 50,000 | | | | 482,500 | |
| Bull Horn Holdings Corp. (c)(g) | | | 28,571 | | | | 288,281 | |
| Carney Technology Acquisition Corp. II (g) | | | 27,045 | | | | 265,582 | |
| Chavant Capital Acquisition Corp. (c)(g) | | | 76,149 | | | | 755,398 | |
| Fortune Rise Acquisition Corp. (g) | | | 116,790 | | | | 1,184,251 | |
| Global Consumer Acquisition Corp. (g) | | | 65,000 | | | | 649,350 | |
| Global SPAC Partners Co. (c)(g) | | | 62,875 | | | | 635,038 | |
| Goldenstone Acquisition Ltd. (g) | | | 8,333 | | | | 83,163 | |
| InFinT Acquisition Corp. (c)(g) | | | 23,880 | | | | 238,800 | |
| L&F Acquisition Corp. (c)(g) | | | 59,627 | | | | 603,425 | |
| Tishman Speyer Innovation Corp. II (g) | | | 90,000 | | | | 882,000 | |
| Zanite Acquisition Corp. (g) | | | 92,647 | | | | 950,558 | |
| TOTAL SPECIAL PURPOSE ACQUISITION COMPANIES | | | | | | | | |
| (Cost $7,464,801) | | | | | | | 7,552,922 | |
| | | | | | | | | |
| WARRANTS – 0.03% | | | | | | | | |
| Berenson Acquisition Corp. I (g) | | | | | | | | |
| Expiration: 08/01/2026, Exercise Price: $11.50 | | | 9,044 | | | | 2,442 | |
| InFinT Acquisition Corp. (c)(g) | | | | | | | | |
| Expiration: 05/19/2027, Exercise Price: $11.50 | | | 11,940 | | | | 2,029 | |
| Leafly Holdings, Inc. (g) | | | | | | | | |
| Expiration: 11/07/2026, Exercise Price: $11.50 | | | 10,890 | | | | 14,157 | |
| TOTAL WARRANTS (Cost $6,739) | | | | | | | 18,628 | |
The accompanying notes are an integral part of these financial statements.
CROSSINGBRIDGE ULTRA-SHORT DURATION FUND
| Schedule of Investments (Continued) |
March 31, 2022 (Unaudited)
| | | Number of | | | | |
| | | Shares | | | Value | |
| MONEY MARKET FUNDS – 3.02% | | | | | | |
| First American Treasury Obligations | | | | | | |
| Fund – Class X, 0.235% (h) | | | 1,889,162 | | | $ | 1,889,162 | |
| TOTAL MONEY MARKET FUNDS (Cost $1,889,162) | | | | | | | 1,889,162 | |
Total Investments (Cost $64,166,847) – 102.17% | | | | | | | 63,973,117 | |
| Liabilities in Excess of Other Assets – (2.17)% | | | | | | | (1,356,456 | ) |
| Total Net Assets – 100.00% | | | | | | $ | 62,616,661 | |
Percentages are stated as a percent of net assets.
| † | Face amount in U.S. Dollar unless otherwise indicated. |
| (a) | Securities issued pursuant to Rule 144A under the Securities Act of 1933 and Regulation S under the Securities Act of 1933. Aggregate value of these securities is $15,890,337 or 25.38% of Fund’s net assets. |
| (b) | Variable rate security. The rate shown represents the rate at March 31, 2022. |
| (c) | Foreign issued security. |
| (d) | Illiquid security. |
| (e) | Security valued using unobservable inputs. |
| (f) | Principal amount denominated in Euros. |
| (g) | Non-income producing security. |
| (h) | Seven day yield as of March 31, 2022. |
Definitions:
EURIBOR – Euro-Interbank Offer Rate is a reference rate expressing the average interest rate at which eurozone banks offer unsecured short-term lending on the interbank market.
LIBOR – London Interbank Offer Rate is a benchmark rate at which banks offer to lend funds to one another in the international interbank market for short-term loans.
The accompanying notes are an integral part of these financial statements.
CROSSINGBRIDGE ULTRA-SHORT DURATION FUND
| Schedule of Forward Currency Exchange Contracts |
March 31, 2022 (Unaudited)
| | | | | Currency | | USD Value at | | | Currency | | USD Value at | | | Unrealized | |
| Settlement | | Counter- | | to be | | March 31, | | | to be | | March 31, | | | Appreciation/ | |
| Date | | party | | Delivered | | 2022 | | | Received | | 2022 | | | (Depreciation) | |
| 4/14/22 | | U.S. Bank | | 2,141,400 | | EUR | | $ | 2,369,881 | | | 2,361,343 | | USD | | $ | 2,361,343 | | | $ | (8,538 | ) |
EUR – Euro
USD – U.S. Dollars
The accompanying notes are an integral part of these financial statements.
CROSSINGBRIDGE PRE-MERGER SPAC ETF
March 31, 2022 (Unaudited)
| | | Number of | | | | |
| | | Shares | | | Value | |
| SPECIAL PURPOSE ACQUISITION COMPANIES – 99.32% | | | | | | |
| 10X Capital Venture Acquisition Corp. II (a)(b) | | | 3,931 | | | $ | 38,681 | |
| 10X Capital Venture Acquisition Corp. III (a)(b) | | | 51,667 | | | | 518,737 | |
| 26 Capital Acquisition Corp. (b) | | | 8,484 | | | | 83,822 | |
| A SPAC I Acquisition Corp. (a)(b) | | | 100,000 | | | | 1,001,000 | |
| Accelerate Acquisition Corp. (b) | | | 2,550 | | | | 24,888 | |
| Acropolis Infrastructure Acquisition Corp. (b) | | | 682 | | | | 6,622 | |
| Adara Acquisition Corp. (b) | | | 209 | | | | 2,065 | |
| Aequi Acquisition Corp. (b) | | | 2,550 | | | | 25,079 | |
| African Gold Acquisition Corp. (a)(b) | | | 7,550 | | | | 74,066 | |
| Ahren Acquisition Corp. (a)(b) | | | 5,000 | | | | 49,600 | |
| Alpha Partners Technology Merger Corp. (a)(b) | | | 2,550 | | | | 24,684 | |
| Alpine Acquisition Corp. (b) | | | 2,550 | | | | 25,729 | |
| AltEnergy Acquisition Corp. (b) | | | 12,550 | | | | 124,370 | |
| Anthemis Digital Acquisitions I Corp. (a)(b) | | | 12,550 | | | | 126,379 | |
| Anzu Special Acquisition Corp. I (b) | | | 2,550 | | | | 24,952 | |
| AP Acquisition Corp. (a)(b) | | | 36,429 | | | | 364,654 | |
| Apeiron Capital Investment Corp. (b) | | | 12,000 | | | | 119,760 | |
| Apollo Strategic Growth Capital (a)(b) | | | 2,550 | | | | 25,372 | |
| Apollo Strategic Growth Capital II (b) | | | 100,000 | | | | 980,000 | |
| APx Acquisition Corp. I (a)(b) | | | 19,272 | | | | 192,142 | |
| Arbor Rapha Capital Bioholdings Corp. I (b) | | | 17,550 | | | | 176,728 | |
| Archimedes Tech SPAC Partners Co. (b) | | | 2,880 | | | | 28,598 | |
| Arena Fortify Acquisition Corp. (b) | | | 15,000 | | | | 151,125 | |
| Athlon Acquisition Corp. (b) | | | 500 | | | | 4,900 | |
| Atlantic Avenue Acquisition Corp. (b) | | | 15,600 | | | | 153,816 | |
| Atlantic Coastal Acquisition Corp. II (b) | | | 75,000 | | | | 749,250 | |
| Atlas Crest Investment Corp. II (b) | | | 2,550 | | | | 25,041 | |
| Ault Disruptive Technologies Corp. (b) | | | 45,000 | | | | 448,650 | |
| Austerlitz Acquisition Corp. I (a)(b) | | | 20,000 | | | | 196,400 | |
| Austerlitz Acquisition Corp. II (a)(b) | | | 2,550 | | | | 24,939 | |
| Avalon Acquisition, Inc. (b) | | | 50,500 | | | | 502,980 | |
| B Riley Principal 250 Merger Corp. (b) | | | 2,063 | | | | 20,114 | |
| Banner Acquisition Corp. (b) | | | 8,597 | | | | 84,680 | |
| Banyan Acquisition Corp. (b) | | | 75,000 | | | | 750,750 | |
| Battery Future Acquisition Corp. (a)(b) | | | 10,000 | | | | 100,500 | |
| Beard Energy Transition Acquisition Corp. (b) | | | 12,500 | | | | 126,500 | |
| Belong Acquisition Corp. (b) | | | 5,000 | | | | 48,925 | |
| Berenson Acquisition Corp. Founder Shares (b)(c)(d) | | | 922 | | | | 249 | |
| Berenson Acquisition Corp. I (b) | | | 450 | | | | 4,387 | |
| BGP Acquisition Corp. (a)(b) | | | 100,000 | | | | 965,000 | |
| BioPlus Acquisition Corp. (a)(b) | | | 20,000 | | | | 199,800 | |
| Blockchain Moon Acquisition Corp. (b) | | | 25,848 | | | | 254,861 | |
| Bluescape Opportunities Acquisition Corp. (a)(b) | | | 105,000 | | | | 1,035,300 | |
The accompanying notes are an integral part of these financial statements.
CROSSINGBRIDGE PRE-MERGER SPAC ETF
| Schedule of Investments (Continued) |
March 31, 2022 (Unaudited)
| | | Number of | | | | |
| | | Shares | | | Value | |
| SPECIAL PURPOSE ACQUISITION | | | | | | |
| COMPANIES – 99.32% (CONTINUED) | | | | | | |
| Bridgetown Holdings Ltd. (a)(b) | | | 1,129 | | | $ | 11,132 | |
| Brigade-M3 European Acquisition Corp. (a)(b) | | | 76,250 | | | | 747,250 | |
| Broad Capital Acquisition Corp. (b) | | | 100,000 | | | | 991,500 | |
| Bullpen Parlay Acquisition Co. (a)(b) | | | 36,323 | | | | 363,048 | |
| C5 Acquisition Corp. (b) | | | 75,000 | | | | 743,257 | |
| Cactus Acquisition Corp. 1 Ltd. (a)(b) | | | 10,450 | | | | 105,441 | |
| Canna-Global Acquisition Corp. (b) | | | 28,909 | | | | 288,512 | |
| Carney Technology Acquisition Corp. II (b) | | | 31,831 | | | | 312,580 | |
| Cartesian Growth Corp. (a)(b) | | | 15,000 | | | | 148,050 | |
| Cartica Acquisition Corp. (a)(b) | | | 50,000 | | | | 505,000 | |
| Cascadia Acquisition Corp. (b) | | | 2,550 | | | | 24,901 | |
| Catcha Investment Corp. (a)(b) | | | 2,550 | | | | 24,977 | |
| CC Neuberger Principal Holdings II (a)(b) | | | 9,628 | | | | 95,510 | |
| CENAQ Energy Corp. (b) | | | 2,550 | | | | 25,538 | |
| Chain Bridge I (a)(b) | | | 6,290 | | | | 62,460 | |
| Churchill Capital Corp. V (b) | | | 10,000 | | | | 98,300 | |
| Churchill Capital Corp. VII (b) | | | 25,000 | | | | 244,750 | |
| Clarim Acquisition Corp. (b) | | | 41,600 | | | | 407,264 | |
| CleanTech Acquisition Corp. (b) | | | 50,000 | | | | 501,500 | |
| Cohn Robbins Holdings Corp. (a)(b) | | | 18,875 | | | | 187,618 | |
| Colicity, Inc. (b) | | | 5,914 | | | | 57,780 | |
| Coliseum Acquisition Corp. (a)(b) | | | 2,669 | | | | 25,889 | |
| Colombier Acquisition Corp. (b) | | | 1,275 | | | | 12,329 | |
| Compass Digital Acquisition Corp. (a)(b) | | | 2,550 | | | | 24,735 | |
| Compute Health Acquisition Corp. (b) | | | 9,628 | | | | 94,162 | |
| Conx Corp. (b) | | | 2,550 | | | | 25,117 | |
| Corner Growth Acquisition Corp. (a)(b) | | | 25,000 | | | | 245,500 | |
| Corsair Partnering Corp. (a)(b) | | | 2,550 | | | | 24,761 | |
| COVA Acquisition Corp. (a)(b) | | | 16,325 | | | | 159,985 | |
| Crescera Capital Acquisition Corp. (a)(b) | | | 15,000 | | | | 150,300 | |
| Crixus BH3 Acquisition Co. (b) | | | 2,550 | | | | 25,487 | |
| Crypto 1 Acquisition Corp. (a)(b) | | | 25,000 | | | | 247,500 | |
| Decarbonization Plus Acquisition Corp. IV (a)(b) | | | 7,550 | | | | 75,047 | |
| DP Cap Acquisition Corp. I (a)(b) | | | 15,000 | | | | 149,100 | |
| DTRT Health Acquisition Corp. (b) | | | 50,000 | | | | 501,500 | |
| Dune Acquisition Corp. (b) | | | 5,000 | | | | 49,700 | |
| E.Merge Technology Acquisition Corp. (b) | | | 50,000 | | | | 495,000 | |
| East Resources Acquisition Co. (b) | | | 2,550 | | | | 25,296 | |
| EdtechX Holdings Acquisition Corp. II (b) | | | 200 | | | | 2,020 | |
| EG Acquisition Corp. (b) | | | 1,059 | | | | 10,315 | |
| Elliott Opportunity II Corp. (a)(b) | | | 60,000 | | | | 586,800 | |
| Empowerment & Inclusion Capital I Corp. (b) | | | 6,625 | | | | 64,991 | |
The accompanying notes are an integral part of these financial statements.
CROSSINGBRIDGE PRE-MERGER SPAC ETF
| Schedule of Investments (Continued) |
March 31, 2022 (Unaudited)
| | | Number of | | | | |
| | | Shares | | | Value | |
| SPECIAL PURPOSE ACQUISITION | | | | | | |
| COMPANIES – 99.32% (CONTINUED) | | | | | | |
| Enphys Acquisition Corp. (a)(b) | | | 2,545 | | | $ | 24,954 | |
| Enterprise 4.0 Technology Acquisition Corp. (a)(b) | | | 17,550 | | | | 174,447 | |
| Epiphany Technology Acquisition Corp. (b) | | | 2,550 | | | | 25,041 | |
| Equity Distribution Acquisition Corp. (b) | | | 7,550 | | | | 74,663 | |
| ESGEN Acquisition Corp. (a)(b) | | | 5,650 | | | | 57,178 | |
| ESM Acquisition Corp. (a)(b) | | | 2,550 | | | | 24,914 | |
| Eucrates Biomedical Acquisition Corp. (a)(b) | | | 2,550 | | | | 25,143 | |
| EVe Mobility Acquisition Corp. (a)(b) | | | 13,895 | | | | 137,699 | |
| Everest Consolidator Acquisition Corp. (b) | | | 20,000 | | | | 200,400 | |
| Executive Network Partnering Corp. (b) | | | 25,000 | | | | 246,250 | |
| Finnovate Acquisition Corp. (a)(b) | | | 17,550 | | | | 177,431 | |
| First Light Acquisition Group, Inc. (b) | | | 2,550 | | | | 25,219 | |
| Flame Acquisition Corp. (b) | | | 6,131 | | | | 59,777 | |
| Focus Impact Acquisition Corp. (b) | | | 8,550 | | | | 85,671 | |
| Forest Road Acquisition Corp. II (b) | | | 2,550 | | | | 24,914 | |
| Fortistar Sustainable Solutions Corp. (b) | | | 2,550 | | | | 24,977 | |
| Frazier Lifesciences Acquisition Corp. (a)(b) | | | 1,217 | | | | 11,975 | |
| FTAC Hera Acquisition Corp. (a)(b) | | | 4,460 | | | | 43,663 | |
| FTAC Parnassus Acquisition Corp.(b) | | | 2,550 | | | | 24,913 | |
| Future Health ESG Corp. (b) | | | 450 | | | | 4,500 | |
| FutureTech II Acquisition Corp. (b) | | | 25,000 | | | | 250,500 | |
| G Squared Ascend I, Inc. (a)(b) | | | 11,792 | | | | 116,151 | |
| G&P Acquisition Corp. (b) | | | 16,494 | | | | 163,703 | |
| G3 VRM Acquisition Corp. (b) | | | 2,550 | | | | 25,908 | |
| Games & Esports Experience Acquisition Corp. (a)(b) | | | 15,000 | | | | 151,650 | |
| GigInternational1, Inc. (b) | | | 5,000 | | | | 49,950 | |
| Gladstone Acquisition Corp. (b) | | | 54,052 | | | | 542,682 | |
| Glenfarne Merger Corp. (b) | | | 2,550 | | | | 24,888 | |
| Global Consumer Acquisition Corp. (b) | | | 15,600 | | | | 155,844 | |
| Global SPAC Partners Co. (a)(b) | | | 101,410 | | | | 1,024,241 | |
| Global Synergy Acquisition Corp. (a)(b) | | | 2,550 | | | | 25,347 | |
| Global Technology Acquisition Corp. I (a)(b) | | | 12,550 | | | | 126,567 | |
| Globis Acquisition Corp. (b) | | | 15,000 | | | | 153,600 | |
| GO Acquisition Corp. (b) | | | 20,000 | | | | 198,000 | |
| Goal Acquisitions Corp. (b) | | | 5,510 | | | | 53,778 | |
| GoGreen Investments Corp. (a)(b) | | | 4,550 | | | | 46,001 | |
| GP Bullhound Acquisition I SE (a)(b)(e) | | | 75,000 | | | | 822,225 | |
| Group Nine Acquisition Corp. (b) | | | 7,550 | | | | 73,990 | |
| GSR II Meteora Acquisition Corp. (b) | | | 39,575 | | | | 400,301 | |
| Hambro Perks Acquisition Co Ltd. (a)(b)(f) | | | 75,000 | | | | 980,308 | |
| Hamilton Lane Alliance Holdings I, Inc. (b) | | | 65,000 | | | | 637,000 | |
| HCM Acquisition Corp. (a)(b) | | | 45,000 | | | | 449,550 | |
The accompanying notes are an integral part of these financial statements.
CROSSINGBRIDGE PRE-MERGER SPAC ETF
| Schedule of Investments (Continued) |
March 31, 2022 (Unaudited)
| | | Number of | | | | |
| | | Shares | | | Value | |
| SPECIAL PURPOSE ACQUISITION | | | | | | |
| COMPANIES – 99.32% (CONTINUED) | | | | | | |
| Health Assurance Acquisition Corp. (b) | | | 9,628 | | | $ | 94,836 | |
| Health Sciences Acquisitions Corp. 2 (a)(b) | | | 10,000 | | | | 99,100 | |
| Healthcare Services Acquisition Corp. (b) | | | 16,325 | | | | 159,985 | |
| Heartland Media Acquisition Corp. (b) | | | 75,000 | | | | 747,000 | |
| HH&L Acquisition Co. (a)(b) | | | 2,550 | | | | 24,965 | |
| HIG Acquisition Corp. (a)(b) | | | 2,550 | | | | 25,118 | |
| Highland Transcend Partners I Corp. (a)(b) | | | 30,000 | | | | 294,900 | |
| Hiro Metaverse Acquisitions I SA (a)(b)(f) | | | 45,000 | | | | 591,141 | |
| HPX Corp. (a)(b) | | | 900 | | | | 8,928 | |
| Hudson Executive Investment Corp. II (b) | | | 2,550 | | | | 24,965 | |
| Hudson Executive Investment Corp. III (b) | | | 9,238 | | | | 90,255 | |
| Hunt Cos Acquisition Corp. I (a)(b) | | | 9,002 | | | | 91,145 | |
| Iconic Sports Acquisition Corp. (a)(b) | | | 50,000 | | | | 500,000 | |
| IG Acquisition Corp. (b) | | | 3,140 | | | | 30,960 | |
| Ignyte Acquisition Corp. (b) | | | 10,000 | | | | 98,600 | |
| Independence Holdings Corp. (a)(b) | | | 57,550 | | | | 563,414 | |
| Infinite Acquisition Corp. (a)(b) | | | 28,000 | | | | 280,420 | |
| InFinT Acquisition Corp. (a)(b) | | | 20,000 | | | | 200,000 | |
| Inflection Point Acquisition Corp. (a)(b) | | | 18 | | | | 180 | |
| Innovative International Acquisition Corp. (a)(b) | | | 10,358 | | | | 103,580 | |
| Insight Acquisition Corp. (b) | | | 2,550 | | | | 24,990 | |
| Integral Acquisition Corp. 1 (b) | | | 2,550 | | | | 25,576 | |
| Integrated Rail and Resources Acquisition Corp. (b) | | | 7,000 | | | | 69,510 | |
| International Media Acquisition Corp. (b) | | | 7,821 | | | | 77,506 | |
| InterPrivate II Acquisition Corp. (b) | | | 2,550 | | | | 24,914 | |
| Investcorp Europe Acquisition Corp. I (a)(b) | | | 60,000 | | | | 598,800 | |
| Iron Spark I, Inc. (b) | | | 5,000 | | | | 49,950 | |
| Isleworth Healthcare Acquisition Corp. (b) | | | 16,325 | | | | 161,618 | |
| ITHAX Acquisition Corp. (a)(b) | | | 4,867 | | | | 48,135 | |
| Itiquira Acquisition Corp. (a)(b) | | | 22,091 | | | | 216,713 | |
| IX Acquisition Corp. (a)(b) | | | 2,550 | | | | 25,118 | |
| Jackson Acquisition Co. (b) | | | 30,000 | | | | 296,400 | |
| Jaguar Global Growth Corp. I (a)(b) | | | 50,000 | | | | 502,250 | |
| Jaws Mustang Acquisition Corp. (a)(b) | | | 2,550 | | | | 25,016 | |
| JOFF Fintech Acquisition Corp. (b) | | | 2,330 | | | | 22,764 | |
| Juniper II Corp. (b) | | | 400 | | | | 3,980 | |
| Jupiter Acquisition Corp. (b) | | | 2,550 | | | | 24,556 | |
| Kensington Capital Acquisition Corp. V (a)(b) | | | 2,550 | | | | 25,322 | |
| Kingswood Acquisition Corp. (b) | | | 1,500 | | | | 15,315 | |
| KINS Technology Group, Inc. (b) | | | 25,000 | | | | 251,750 | |
| Kismet Acquisition Two Corp. (a)(b) | | | 7,550 | | | | 73,915 | |
| KL Acquisition Corp. (b) | | | 1,108 | | | | 10,869 | |
The accompanying notes are an integral part of these financial statements.
CROSSINGBRIDGE PRE-MERGER SPAC ETF
| Schedule of Investments (Continued) |
March 31, 2022 (Unaudited)
| | | Number of | | | | |
| | | Shares | | | Value | |
| SPECIAL PURPOSE ACQUISITION | | | | | | |
| COMPANIES – 99.32% (CONTINUED) | | | | | | |
| KludeIn I Acquisition Corp. (b) | | | 451 | | | $ | 4,478 | |
| KnightSwan Acquisition Corp. (b) | | | 52,500 | | | | 525,525 | |
| L Catterton Asia Acquisition Corp. (a)(b) | | | 2,550 | | | | 24,888 | |
| L&F Acquisition Corp. (a)(b) | | | 100,000 | | | | 1,012,000 | |
| Landcadia Holdings IV, Inc. (b) | | | 2,550 | | | | 25,041 | |
| LAVA Medtech Acquisition Corp. (b) | | | 12,550 | | | | 127,006 | |
| Lead Edge Growth Opportunities Ltd. (a)(b) | | | 25,000 | | | | 244,250 | |
| Lefteris Acquisition Corp. (b) | | | 7,550 | | | | 74,367 | |
| Legato Merger Corp. II (b) | | | 30,000 | | | | 302,100 | |
| Leo Holdings Corp. II (a)(b) | | | 5,000 | | | | 49,000 | |
| LF Capital Acquisition Corp. II (b) | | | 10,000 | | | | 100,550 | |
| LightJump Acquisition Corp. (b) | | | 5,966 | | | | 59,183 | |
| Lionheart III Corp. (b) | | | 2,550 | | | | 25,551 | |
| Live Oak Crestview Climate Acquisition Corp. (b) | | | 20,000 | | | | 194,000 | |
| Live Oak Mobility Acquisition Corp. (b) | | | 2,550 | | | | 25,015 | |
| LMF Acquisition Opportunities, Inc. (b) | | | 398 | | | | 4,028 | |
| M3-Brigade Acquisition II Corp. (b) | | | 7,626 | | | | 74,506 | |
| M3-Brigade Acquisition III Corp. (b) | | | 12,550 | | | | 124,998 | |
| Macondray Capital Acquisition Corp. I (a)(b) | | | 9,628 | | | | 95,221 | |
| Maquia Capital Acquisition Corp. (b) | | | 2,550 | | | | 25,857 | |
| Mason Industrial Technology, Inc. (b) | | | 16,325 | | | | 159,495 | |
| McLaren Technology Acquisition Corp. (b) | | | 2,550 | | | | 25,602 | |
| MedTech Acquisition Corp. (b) | | | 50,000 | | | | 490,000 | |
| Mercato Partners Acquisition Corp. (b) | | | 15,850 | | | | 157,311 | |
| Mercury Ecommerce Acquisition Corp. (b) | | | 50,000 | | | | 491,000 | |
| Minority Equality Opportunities Acquisition, Inc. (b) | | | 2,550 | | | | 25,576 | |
| Mission Advancement Corp. (b) | | | 2,550 | | | | 24,964 | |
| Monterey Bio Acquisition Corp. (b) | | | 10,000 | | | | 99,650 | |
| Mudrick Capital Acquisition Corp. II (b) | | | 35,014 | | | | 351,015 | |
| Nabors Energy Transition Corp. (b) | | | 4,999 | | | | 49,890 | |
| Natural Order Acquisition Corp. (b) | | | 700 | | | | 6,881 | |
| New Vista Acquisition Corp. (a)(b) | | | 2,550 | | | | 24,965 | |
| Newcourt Acquisition Corp. (a)(b) | | | 1,273 | | | | 12,825 | |
| NightDragon Acquisition Corp. (b) | | | 6,630 | | | | 64,775 | |
| Nocturne Acquisition Corp. (a)(b) | | | 6,924 | | | | 69,794 | |
| North Atlantic Acquisition Corp. (a)(b) | | | 16,050 | | | | 158,414 | |
| North Mountain Merger Corp. (b) | | | 1,500 | | | | 14,835 | |
| Northern Star Investment Corp. III (b) | | | 2,550 | | | | 24,964 | |
| Oaktree Acquisition Corp. II (a)(b) | | | 50,413 | | | | 501,609 | |
| OceanTech Acquisitions I Corp. (b) | | | 2,545 | | | | 25,628 | |
| OmniLit Acquisition Corp. (b) | | | 11,429 | | | | 113,947 | |
| One Equity Partners Open Water I Corp. (b) | | | 15,997 | | | | 156,451 | |
The accompanying notes are an integral part of these financial statements.
CROSSINGBRIDGE PRE-MERGER SPAC ETF
| Schedule of Investments (Continued) |
March 31, 2022 (Unaudited)
| | | Number of | | | | |
| | | Shares | | | Value | |
| SPECIAL PURPOSE ACQUISITION | | | | | | |
| COMPANIES – 99.32% (CONTINUED) | | | | | | |
| Onyx Acquisition Co. I (a)(b) | | | 12,550 | | | $ | 125,249 | |
| OPY Acquisition Corp. I (b) | | | 400 | | | | 3,998 | |
| Orion Acquisition Corp. (b) | | | 2,550 | | | | 24,913 | |
| Oxbridge Acquisition Corp. (a)(b) | | | 2,550 | | | | 25,500 | |
| Oxus Acquisition Corp. (a)(b) | | | 7,550 | | | | 75,425 | |
| Oyster Enterprises Acquisition Corp. (b) | | | 16,086 | | | | 157,482 | |
| Pacifico Acquisition Corp. (b) | | | 10,000 | | | | 99,750 | |
| Papaya Growth Opportunity Corp. I (b) | | | 75,000 | | | | 750,750 | |
| Parabellum Acquisition Corp. Founder Shares (b)(c)(d) | | | 2,299 | | | | 529 | |
| Pathfinder Acquisition Corp. (a)(b) | | | 7,785 | | | | 76,137 | |
| Pearl Holdings Acquisition Corp. (a)(b) | | | 15,462 | | | | 152,610 | |
| PepperLime Health Acquisition Corp. (a)(b) | | | 2,550 | | | | 25,934 | |
| Perception Capital Corp. II (a)(b) | | | 8,135 | | | | 82,123 | |
| Peridot Acquisition Corp. II (a)(b) | | | 18,875 | | | | 184,598 | |
| Pioneer Merger Corp. (a)(b) | | | 8,484 | | | | 83,143 | |
| Pivotal Investment Corp. III (b) | | | 2,150 | | | | 21,027 | |
| Plum Acquisition Corp. I (a)(b) | | | 2,550 | | | | 24,939 | |
| PMV Consumer Acquisition Corp. (b) | | | 2,550 | | | | 25,194 | |
| Pontem Corp. (a)(b) | | | 25,000 | | | | 245,250 | |
| Population Health Investment Co, Inc. (a)(b) | | | 18,901 | | | | 186,175 | |
| PowerUp Acquisition Corp. (a)(b) | | | 12,155 | | | | 122,158 | |
| Primavera Capital Acquisition Corp. (a)(b) | | | 6,906 | | | | 67,886 | |
| Prime Impact Acquisition I (a)(b) | | | 5,000 | | | | 49,450 | |
| Progress Acquisition Corp. (b) | | | 2,550 | | | | 25,117 | |
| Project Energy Reimagined Acquisition Corp. (a)(b) | | | 400 | | | | 3,892 | |
| PROOF Acquisition Corp. I (b) | | | 9,877 | | | | 97,782 | |
| Property Solutions Acquisition Corp. II (b) | | | 2,550 | | | | 24,939 | |
| PropTech Investment Corp. II (b) | | | 3,495 | | | | 34,356 | |
| Pyrophyte Acquisition Corp. (a)(b) | | | 2,000 | | | | 19,930 | |
| Pyrophyte Acquisition Corp. (a)(b) | | | 9,030 | | | | 91,429 | |
| RCF Acquisition Corp. (a)(b) | | | 10,000 | | | | 101,000 | |
| Recharge Acquisition Corp. (b) | | | 2,618 | | | | 26,101 | |
| Redwoods Acquisition Corp. (b) | | | 18,750 | | | | 188,062 | |
| Relativity Acquisition Corp. (b) | | | 59,489 | | | | 599,054 | |
| Revelstone Capital Acquisition Corp. (b) | | | 53,333 | | | | 526,930 | |
| Revelstone Capital Acquisition Corp. Founder Shares (b)(c)(d) | | | 6,000 | | | | 1,380 | |
| Revolution Healthcare Acquisition Corp. (b) | | | 400 | | | | 3,924 | |
| RMG Acquisition Corp. III (a)(b) | | | 22,575 | | | | 221,235 | |
| ROC Energy Acquisition Corp. (b) | | | 6,249 | | | | 63,490 | |
| Rocket Internet Growth Opportunities Corp. (a)(b) | | | 2,550 | | | | 24,965 | |
| Rose Hill Acquisition Corp. (a)(b) | | | 17,550 | | | | 177,606 | |
| RXR Acquisition Corp. (b) | | | 1,382 | | | | 13,481 | |
The accompanying notes are an integral part of these financial statements.
CROSSINGBRIDGE PRE-MERGER SPAC ETF
| Schedule of Investments (Continued) |
March 31, 2022 (Unaudited)
| | | Number of | | | | |
| | | Shares | | | Value | |
| SPECIAL PURPOSE ACQUISITION | | | | | | |
| COMPANIES – 99.32% (CONTINUED) | | | | | | |
| Schultze Special Purpose Acquisition Corp. II (b) | | | 2,381 | | | $ | 24,000 | |
| ScION Tech Growth I (a)(b) | | | 7,550 | | | | 74,141 | |
| ScION Tech Growth II (a)(b) | | | 2,550 | | | | 24,990 | |
| Seaport Calibre Materials Acquisition Corp. (b) | | | 400 | | | | 4,020 | |
| Seaport Global Acquisition II Corp. (b) | | | 25,000 | | | | 247,750 | |
| Semper Paratus Acquisition Corp. (a)(b) | | | 17,550 | | | | 175,325 | |
| Senior Connect Acquisition Corp. I (b) | | | 2,550 | | | | 25,015 | |
| ShoulderUp Technology Acquisition Corp. (b) | | | 15,000 | | | | 151,500 | |
| Silver Crest Acquisition Corp. (a)(b) | | | 8,484 | | | | 83,398 | |
| Silver Spike Acquisition Corp. II (a)(b) | | | 4,750 | | | | 46,503 | |
| Silver Spike III Acquisition Corp. (a)(b) | | | 100,100 | | | | 1,001,000 | |
| SILVERspac, Inc. (a)(b) | | | 2,550 | | | | 24,646 | |
| Simon Property Group Acquisition Holdings, Inc. (b) | | | 2,550 | | | | 24,939 | |
| Sizzle Acquisition Corp. (b) | | | 17,550 | | | | 176,114 | |
| Slam Corp. (a)(b) | | | 2,550 | | | | 24,914 | |
| Spindletop Health Acquisition Corp. (b) | | | 12,558 | | | | 125,957 | |
| SportsMap Tech Acquisition Corp. (b) | | | 2,712 | | | | 26,903 | |
| SportsTek Acquisition Corp. (b) | | | 5,000 | | | | 48,850 | |
| Spree Acquisition Corp. 1 Ltd. (a)(b) | | | 50,000 | | | | 497,500 | |
| Springwater Special Situations Corp. (b) | | | 2,550 | | | | 25,118 | |
| ST Energy Transition I Ltd. (a)(b) | | | 20,000 | | | | 200,500 | |
| Supernova Partners Acquisition Co. III Ltd. (a)(b) | | | 2,550 | | | | 24,939 | |
| Sustainable Development Acquisition I Corp. (b) | | | 2,550 | | | | 24,965 | |
| SVF Investment Corp. (a)(b) | | | 31,941 | | | | 313,022 | |
| Tailwind Acquisition Corp. (b) | | | 18,875 | | | | 186,768 | |
| Tailwind International Acquisition Corp. (a)(b) | | | 22,091 | | | | 216,271 | |
| Talon 1 Acquisition Corp. (a)(b) | | | 17,550 | | | | 176,729 | |
| Target Global Acquisition I Corp. (a)(b) | | | 25,000 | | | | 248,000 | |
| Tastemaker Acquisition Corp. (b) | | | 4,900 | | | | 48,461 | |
| TCW Special Purpose Acquisition Corp. (b) | | | 25,000 | | | | 243,750 | |
| Tech and Energy Transition Corp. (b) | | | 2,550 | | | | 24,901 | |
| Thrive Acquisition Corp. (a)(b) | | | 12,550 | | | | 126,630 | |
| Thunder Bridge Capital Partners III, Inc. (b) | | | 2,550 | | | | 25,041 | |
| Tio Tech A (a)(b) | | | 6,532 | | | | 63,948 | |
| Tishman Speyer Innovation Corp. II (b) | | | 106,459 | | | | 1,043,298 | |
| TKB Critical Technologies 1 (a)(b) | | | 12,550 | | | | 127,383 | |
| Trepont Acquisition Corp. I (a)(b) | | | 2,550 | | | | 25,640 | |
| Trine II Acquisition Corp. (a)(b) | | | 17,550 | | | | 174,623 | |
| Tuatara Capital Acquisition Corp. (a)(b) | | | 200 | | | | 1,978 | |
| Turmeric Acquisition Corp. (a)(b) | | | 1,504 | | | | 14,844 | |
| Ventoux CCM Acquisition Corp. (b) | | | 5,000 | | | | 50,525 | |
| Vickers Vantage Corp. I (a)(b) | | | 900 | | | | 9,162 | |
The accompanying notes are an integral part of these financial statements.
CROSSINGBRIDGE PRE-MERGER SPAC ETF
| Schedule of Investments (Continued) |
March 31, 2022 (Unaudited)
| | | Number of | | | | |
| | | Shares | | | Value | |
| SPECIAL PURPOSE ACQUISITION | | | | | | |
| COMPANIES – 99.32% (CONTINUED) | | | | | | |
| Virgin Group Acquisition Corp. II (a)(b) | | | 50,000 | | | $ | 493,000 | |
| Viveon Health Acquisition Corp. (b) | | | 13,890 | | | | 140,289 | |
| VMG Consumer Acquisition Corp. (b) | | | 5,225 | | | | 51,780 | |
| Vy Global Growth (a)(b) | | | 2,550 | | | | 25,245 | |
| Warburg Pincus Capital Corp. I-A (a)(b) | | | 57,334 | | | | 563,593 | |
| Warrior Technologies Acquisition Co. (b) | | | 10,000 | | | | 98,900 | |
| Western Acquisition Ventures Corp. (b) | | | 42,857 | | | | 428,999 | |
| Williams Rowland Acquisition Corp. (b) | | | 5,100 | | | | 50,847 | |
| Worldwide Webb Acquisition Corp. (a)(b) | | | 2,550 | | | | 25,385 | |
| Worldwide Webb Acquisition Corp. A (a)(b) | | | 23,711 | | | | 233,553 | |
| Zanite Acquisition Corp. (b) | | | 100,000 | | | | 1,026,000 | |
| TOTAL SPECIAL PURPOSE ACQUISITION COMPANIES | | | | | | | | |
| (Cost $53,530,641) | | | | | | | 53,741,969 | |
| | | | | | | | | |
| WARRANTS – 0.14% | | | | | | | | |
| Ahren Acquisition Corp. (a)(b) | | | | | | | | |
| Expiration: 12/09/2026, Exercise Price: $11.50 | | | 2,500 | | | | 750 | |
| AP Acquisition Corp. (a)(b) | | | | | | | | |
| Expiration: 12/07/2026, Exercise Price: $11.50 | | | 18,214 | | | | 4,736 | |
| Apeiron Capital Investment Corp. (b) | | | | | | | | |
| Expiration: 04/02/2026, Exercise Price: $11.50 | | | 6,000 | | | | 1,020 | |
| APx Acquisition Corp. I (a)(b) | | | | | | | | |
| Expiration: 11/30/2026, Exercise Price: $11.50 | | | 9,636 | | | | 2,312 | |
| Ault Disruptive Technologies Corp. (b) | | | | | | | | |
| Expiration: 06/20/2023, Exercise Price: $11.50 | | | 33,750 | | | | 5,636 | |
| Berenson Acquisition Corp. I (b) | | | | | | | | |
| Expiration: 08/01/2026, Exercise Price: $11.50 | | | 225 | | | | 61 | |
| Brigade-M3 European Acquisition Corp. (a)(b) | | | | | | | | |
| Expiration: 01/17/2027, Exercise Price: $11.50 | | | 38,125 | | | | 7,625 | |
| Canna-Global Acquisition Corp. (b) | | | | | | | | |
| Expiration: 11/30/2026, Exercise Price: $11.50 | | | 28,909 | | | | 4,088 | |
| EVe Mobility Acquisition Corp. (a)(b) | | | | | | | | |
| Expiration: 12/31/2028, Exercise Price: $11.50 | | | 6,947 | | | | 1,724 | |
| GP Bullhound Acquisition I SE (a)(b)(e) | | | | | | | | |
| Expiration: 03/11/2027, Exercise Price: $11.50 | | | 37,500 | | | | 11,408 | |
| Hambro Perks Acquisition Corp. (a)(b)(f) | | | | | | | | |
| Expiration: 01/07/2026, Exercise Price: $11.50 | | | 37,500 | | | | 5,172 | |
| Hiro Metaverse Acquisitions I SA (a)(b)(f) | | | | | | | | |
| Expiration: 12/21/2026, Exercise Price: $11.50 | | | 22,500 | | | | 8,867 | |
| InFinT Acquisition Corp. (a)(b) | | | | | | | | |
| Expiration: 05/19/2027, Exercise Price: $11.50 | | | 10,000 | | | | 1,699 | |
The accompanying notes are an integral part of these financial statements.
CROSSINGBRIDGE PRE-MERGER SPAC ETF
| Schedule of Investments (Continued) |
March 31, 2022 (Unaudited)
| | | Number of | | | | |
| | | Shares | | | Value | |
| WARRANTS – 0.14% (CONTINUED) | | | | | | |
| Innovative International Acquisition Corp. (a)(b) | | | | | | |
| Expiration: 07/01/2028, Exercise Price: $11.50 | | | 5,179 | | | $ | 984 | |
| M3-Brigade Acquisition III Corp. (b) | | | | | | | | |
| Expiration: 07/31/2028, Exercise Price: $11.50 | | | 4,183 | | | | 1,041 | |
| OmniLit Acquisition Corp. (b) | | | | | | | | |
| Expiration: 11/08/2026, Exercise Price: $11.50 | | | 5,714 | | | | 1,348 | |
| Onyx Acquisition Co. I (a)(b) | | | | | | | | |
| Expiration: 11/30/2028, Exercise Price: $11.50 | | | 6,275 | | | | 2,133 | |
| Pearl Holdings Acquisition Corp. (a)(b) | | | | | | | | |
| Expiration: 12/15/2026, Exercise Price: $11.50 | | | 7,731 | | | | 2,165 | |
| PROOF Acquisition Corp. I (b) | | | | | | | | |
| Expiration: 12/03/2023, Exercise Price: $11.50 | | | 4,938 | | | | 1,358 | |
| Spree Acquisition Corp. 1 Ltd. (a)(b) | | | | | | | | |
| Expiration: 12/22/2028, Exercise Price: $11.50 | | | 25,000 | | | | 5,161 | |
| Talon 1 Acquisition Corp. (a)(b) | | | | | | | | |
| Expiration: 07/30/2026, Exercise Price: $11.50 | | | 8,775 | | | | 2,077 | |
| Target Global Acquisition I Corp. (a)(b) | | | | | | | | |
| Expiration: 12/08/2026, Exercise Price: $11.50 | | | 8,333 | | | | 2,250 | |
| TOTAL WARRANTS (Cost $79,605) | | | | | | | 73,615 | |
| | | | | | | | | |
| RIGHTS – 0.03% | | | | | | | | |
| Broad Capital Acquisition Corp. | | | 100,000 | | | | 16,250 | |
| TOTAL RIGHTS (Cost $19,822) | | | | | | | 16,250 | |
| | | | | | | | | |
| MONEY MARKET FUNDS – 1.84% | | | | | | | | |
| First American Treasury Obligations | | | | | | | | |
| Fund – Class X, 0.235% (g) | | | 998,006 | | | | 998,006 | |
| TOTAL MONEY MARKET FUNDS (Cost $998,006) | | | | | | | 998,006 | |
Total Investments (Cost $54,628,074) – 101.33% | | | | | | | 54,829,840 | |
| Liabilities in Excess of Other Assets – (1.33)% | | | | | | | (718,848 | ) |
| Total Net Assets – 100.00% | | | | | | $ | 54,110,992 | |
Percentages are stated as a percent of net assets.
| (a) | Foreign issued security. |
| (b) | Non-income producing security. |
| (c) | Illiquid security. |
| (d) | Security valued using unobservable inputs. |
| (e) | Holding denominated in Euros. |
| (f) | Holding denominated in British Pounds. |
| (g) | Seven day yield as of March 31, 2022. |
The accompanying notes are an integral part of these financial statements.
CROSSINGBRIDGE FUNDS
| Statements of Assets and Liabilities |
March 31, 2022
| | | CrossingBridge | | | CrossingBridge | |
| | | Low Duration High | | | Responsible | |
| | | Yield Fund | | | Credit Fund | |
| ASSETS | | | | | | |
| Investments, at value | | | | | | |
| (cost $609,511,707 and $16,391,165) | | $ | 604,859,581 | | | $ | 16,053,868 | |
| Cash | | | 12,399,613 | | | | 1,349,925 | |
| Cash held in foreign currency, at value | | | | | | | | |
| (cost $230,688 and $23,246) | | | 228,827 | | | | 23,093 | |
| Dividends and interest receivable | | | 6,898,087 | | | | 184,885 | |
| Receivable for investment securities sold | | | 4,725,022 | | | | 23,703 | |
| Receivable for Fund shares sold | | | 1,616,581 | | | | 3,450 | |
| Prepaid expenses and other assets | | | 30,672 | | | | 14,510 | |
| Receivable from Adviser | | | — | | | | 5,188 | |
| TOTAL ASSETS | | | 630,758,383 | | | | 17,658,622 | |
| LIABILITIES | | | | | | | | |
| Payable for investments purchased | | | 39,135,015 | | | | 759,375 | |
| Payable to Adviser | | | 351,634 | | | | — | |
| Payable to affiliates | | | 61,716 | | | | 23,892 | |
| Payable for Fund shares redeemed | | | 234,332 | | | | 7,514 | |
| Shareholder servicing fees payable | | | 117,726 | | | | 2,481 | |
| Unrealized depreciation of forward | | | | | | | | |
| currency exchange contracts | | | 289,705 | | | | 6,578 | |
| Accrued expenses and other liabilities | | | 16,517 | | | | 18,128 | |
| TOTAL LIABILITIES | | | 40,206,645 | | | | 817,968 | |
| NET ASSETS | | $ | 590,551,738 | | | $ | 16,840,654 | |
| Net assets consist of: | | | | | | | | |
| Paid-in capital | | $ | 593,474,268 | | | $ | 17,007,219 | |
| Total distributable earnings/(losses) | | $ | (2,922,530 | ) | | $ | (166,565 | ) |
| NET ASSETS | | $ | 590,551,738 | | | $ | 16,840,654 | |
| | | | | | | | | |
| INSTITUTIONAL CLASS | | | | | | | | |
| Shares of beneficial interest outstanding (unlimited | | | | | | | | |
| number of shares authorized, $0.001 par value) | | | 58,325,982 | | | | 1,704,065 | |
| Net asset value, offering, and | | | | | | | | |
| redemption price per share | | $ | 10.13 | | | $ | 9.88 | |
The accompanying notes are an integral part of these financial statements.
CROSSINGBRIDGE FUNDS
| Statements of Assets and Liabilities (Continued) |
March 31, 2022
| | | CrossingBridge | | | CrossingBridge | |
| | | Ultra-Short | | | Pre-Merger | |
| | | Duration Fund | | | SPAC ETF | |
| ASSETS | | | | | | |
| Investments, at value | | | | | | |
| (cost $64,166,847 and $54,628,074) | | $ | 63,973,117 | | | $ | 54,829,840 | |
| Cash held in foreign currency, at value | | | | | | | | |
| (cost $38,130 and $—) | | | 37,961 | | | | — | |
| Dividends and interest receivable | | | 547,456 | | | | 231 | |
| Receivable for investment securities sold | | | — | | | | 473,079 | |
| Receivable for Fund shares sold | | | 5,240 | | | | — | |
| Prepaid expenses and other assets | | | 16,405 | | | | — | |
| TOTAL ASSETS | | | 64,580,179 | | | | 55,303,150 | |
| LIABILITIES | | | | | | | | |
| Payable for investments purchased | | | 1,879,502 | | | | 1,159,400 | |
| Payable to Adviser | | | 24,381 | | | | 32,758 | |
| Payable to affiliates | | | 22,610 | | | | — | |
| Shareholder servicing fees payable | | | 10,212 | | | | — | |
| Unrealized depreciation of forward | | | | | | | | |
| currency exchange contracts | | | 8,538 | | | | — | |
| Payable for Fund shares redeemed | | | 30 | | | | — | |
| Accrued expenses and other liabilities | | | 18,245 | | | | — | |
| TOTAL LIABILITIES | | | 1,963,518 | | | | 1,192,158 | |
| NET ASSETS | | $ | 62,616,661 | | | $ | 54,110,992 | |
| Net assets consist of: | | | | | | | | |
| Paid-in capital | | $ | 62,701,861 | | | $ | 53,737,786 | |
| Total distributable earnings/(losses) | | $ | (85,200 | ) | | $ | 373,206 | |
| NET ASSETS | | $ | 62,616,661 | | | $ | 54,110,992 | |
| | | | | | | | | |
| NAV | | | | | | | | |
| Shares of beneficial interest outstanding (unlimited | | | | | | | | |
| number of shares authorized, $0.001 par value) | | | | | | | 2,640,000 | |
| Net asset value, offering, and | | | | | | | | |
| redemption price per share | | | | | | $ | 20.50 | |
| | | | | | | | | |
| INSTITUTIONAL CLASS | | | | | | | | |
| Shares of beneficial interest outstanding (unlimited | | | | | | | | |
| number of shares authorized, $0.001 par value) | | | 6,267,704 | | | | | |
| Net asset value, offering, and | | | | | | | | |
| redemption price per share | | $ | 9.99 | | | | | |
The accompanying notes are an integral part of these financial statements.
CROSSINGBRIDGE FUNDS
For the Six Months Ended March 31, 2022
| | | CrossingBridge | | | CrossingBridge | |
| | | Low Duration High | | | Responsible | |
| | | Yield Fund | | | Credit Fund | |
| INVESTMENT INCOME | | | | | | |
| Interest income (net foreign tax withholding | | | | | | |
| of $26,700 and $7, respectively) | | $ | 7,563,918 | | | $ | 303,303 | |
| Dividend income | | | 15,278 | | | | — | |
| TOTAL INVESTMENT INCOME | | | 7,579,196 | | | | 303,303 | |
| EXPENSES | | | | | | | | |
| Management fees (Note 4) | | | 1,385,765 | | | | 53,877 | |
| Shareholder servicing fees – Institutional Class (Note 5) | | | 213,195 | | | | 8,289 | |
| Administration and accounting fees (Note 6) | | | 99,295 | | | | 34,887 | |
| Expense recoupment by Adviser (Note 4) | | | 80,411 | | | | — | |
| Federal and state registration fees | | | 40,166 | | | | 16,194 | |
| Transfer agent fees and expenses (Note 6) | | | 32,556 | | | | 9,933 | |
| Custody fees (Note 6) | | | 16,184 | | | | 8,392 | |
| Legal fees | | | 13,316 | | | | 8,190 | |
| Audit and tax fees | | | 10,100 | | | | 8,554 | |
| Pricing fees (Note 6) | | | 8,282 | | | | 3,298 | |
| Chief Compliance Officer fees (Note 6) | | | 5,828 | | | | 5,828 | |
| Reports to shareholders | | | 5,098 | | | | 2,390 | |
| Trustees’ fees | | | 4,366 | | | | 4,366 | |
| Insurance fees | | | 2,366 | | | | 1,366 | |
| Other expenses | | | 2,370 | | | | 910 | |
| TOTAL EXPENSES | | | 1,919,298 | | | | 166,474 | |
| Less waivers and reimbursement by Adviser (Note 4) | | | — | | | | (91,691 | ) |
| NET EXPENSES | | | 1,919,298 | | | | 74,783 | |
| NET INVESTMENT INCOME | | | 5,659,898 | | | | 228,520 | |
| REALIZED AND UNREALIZED | | | | | | | | |
| GAIN (LOSS) ON INVESTMENTS | | | | | | | | |
| Net realized gain (loss) on: | | | | | | | | |
| Investments | | | 72,535 | | | | 89,966 | |
| Foreign currency exchange contracts | | | 2,515,045 | | | | 134,088 | |
| Foreign currency transactions | | | (83,665 | ) | | | (1,516 | ) |
| | | | 2,503,915 | | | | 222,538 | |
| Net change in unrealized appreciation (depreciation) on: | | | | | | | | |
| Investments | | | (4,691,364 | ) | | | (345,158 | ) |
| Foreign currency exchange contracts | | | (748,424 | ) | | | (51,314 | ) |
| Foreign currency translation | | | (416 | ) | | | (94 | ) |
| | | | (5,440,204 | ) | | | (396,566 | ) |
| NET REALIZED AND UNREALIZED | | | | | | | | |
| LOSS ON INVESTMENTS | | | (2,936,289 | ) | | | (174,028 | ) |
| NET INCREASE IN NET | | | | | | | | |
| ASSETS FROM OPERATIONS | | $ | 2,723,609 | | | $ | 54,492 | |
The accompanying notes are an integral part of these financial statements.
CROSSINGBRIDGE FUNDS
| Statements of Operations (Continued) |
For the Six Months Ended March 31, 2022
| | | CrossingBridge | | | CrossingBridge | |
| | | Ultra-Short | | | Pre-Merger | |
| | | Duration Fund | | | SPAC ETF | |
| INVESTMENT INCOME | | | | | | |
| Interest income | | $ | 372,660 | | | $ | 433 | |
| Dividend income | | | — | | | | 250 | |
| TOTAL INVESTMENT INCOME | | | 372,660 | | | | 683 | |
| EXPENSES | | | | | | | | |
| Management fees (Note 4) | | | 167,113 | | | | 130,713 | |
| Administration and accounting fees (Note 6) | | | 35,067 | | | | — | |
| Shareholder servicing fees – Institutional Class (Note 5) | | | 25,710 | | | | — | |
| Federal and state registration fees | | | 18,202 | | | | — | |
| Transfer agent fees and expenses (Note 6) | | | 11,945 | | | | — | |
| Legal fees | | | 9,100 | | | | — | |
| Audit and tax fees | | | 8,644 | | | | — | |
| Custody fees (Note 6) | | | 7,402 | | | | — | |
| Chief Compliance Officer fees (Note 6) | | | 5,828 | | | | — | |
| Pricing fees (Note 6) | | | 4,646 | | | | — | |
| Trustees’ fees | | | 4,366 | | | | — | |
| Excise tax | | | — | | | | 2,754 | |
| Reports to shareholders | | | 2,390 | | | | — | |
| Insurance fees | | | 1,366 | | | | — | |
| Other expenses | | | 726 | | | | — | |
| TOTAL EXPENSES | | | 302,505 | | | | 133,467 | |
| Less waivers and reimbursement by Adviser (Note 4) | | | (71,118 | ) | | | — | |
| NET EXPENSES | | | 231,387 | | | | 133,467 | |
| NET INVESTMENT INCOME (LOSS) | | | 141,273 | | | | (132,784 | ) |
| REALIZED AND UNREALIZED | | | | | | | | |
| GAIN (LOSS) ON INVESTMENTS | | | | | | | | |
| Net realized gain (loss) on: | | | | | | | | |
| Investments | | | 113,524 | | | | 306,462 | |
| Foreign currency exchange contracts | | | 72,258 | | | | — | |
| Foreign currency transactions | | | (21,946 | ) | | | (2,022 | ) |
| | | | 163,836 | | | | 304,440 | |
| Net change in unrealized appreciation (depreciation) on: | | | | | | | | |
| Investments | | | (221,573 | ) | | | 203,559 | |
| Foreign currency exchange contracts | | | (8,538 | ) | | | — | |
| Foreign currency transactions | | | (172 | ) | | | — | |
| | | | (230,283 | ) | | | 203,559 | |
| NET REALIZED AND UNREALIZED | | | | | | | | |
| GAIN (LOSS) ON INVESTMENTS | | | (66,447 | ) | | | 507,999 | |
| NET INCREASE IN NET | | | | | | | | |
| ASSETS FROM OPERATIONS | | $ | 74,826 | | | $ | 375,215 | |
The accompanying notes are an integral part of these financial statements.
CROSSINGBRIDGE LOW DURATION HIGH YIELD FUND
| Statements of Changes in Net Assets |
| | | For the Six | | | | |
| | | Months Ended | | | | |
| | | March 31, 2022 | | | Year Ended | |
| | | (Unaudited) | | | September 30, 2021 | |
| FROM OPERATIONS | | | | | | |
| Net investment income | | $ | 5,659,898 | | | $ | 6,561,556 | |
| Net realized gain (loss) on: | | | | | | | | |
| Investments | | | 72,535 | | | | 7,132,312 | |
| Forward currency exchange contracts | | | 2,515,045 | | | | 274,815 | |
| Written options | | | — | | | | 57,400 | |
| Foreign currency transactions | | | (83,665 | ) | | | 12,907 | |
| Net change in unrealized | | | | | | | | |
| appreciation (depreciation) on: | | | | | | | | |
| Investments | | | (4,691,364 | ) | | | 2,551,056 | |
| Forward currency exchange contracts | | | (748,424 | ) | | | 307,539 | |
| Foreign currency translation | | | (416 | ) | | | (1,282 | ) |
| Net increase in net assets from operations | | | 2,723,609 | | | | 16,896,303 | |
| | | | | | | | | |
| FROM DISTRIBUTIONS | | | | | | | | |
| Distributions to shareholders | | | (12,215,126 | ) | | | (7,308,862 | ) |
| Net decrease in net assets | | | | | | | | |
| resulting from distributions paid | | | (12,215,126 | ) | | | (7,308,862 | ) |
| | | | | | | | | |
| FROM CAPITAL SHARE TRANSACTIONS | | | | | | | | |
| Proceeds from sales of shares – | | | | | | | | |
| Institutional Class | | | 353,200,808 | | | | 257,858,317 | |
| Net asset value of shares issued to shareholders | | | | | | | | |
| in payment of distributions declared – | | | | | | | | |
| Institutional Class | | | 8,770,284 | | | | 5,795,404 | |
| Payments for shares redeemed – | | | | | | | | |
| Institutional Class | | | (88,411,471 | ) | | | (90,881,724 | ) |
| Net increase in net assets | | | | | | | | |
| from capital share transactions | | | 273,559,621 | | | | 172,771,997 | |
| TOTAL INCREASE IN NET ASSETS | | | 264,068,104 | | | | 182,359,438 | |
| | | | | | | | | |
| NET ASSETS: | | | | | | | | |
| Beginning of Period/Year | | | 326,483,634 | | | | 144,124,196 | |
| End of Period/Year | | $ | 590,551,738 | | | $ | 326,483,634 | |
The accompanying notes are an integral part of these financial statements.
CROSSINGBRIDGE RESPONSIBLE CREDIT FUND
| Statements of Changes in Net Assets (Continued) |
| | | For the Six | | | Period From | |
| | | Months Ended | | | June 30, 2021(1) | |
| | | March 31, 2022 | | | through | |
| | | (Unaudited) | | | September 30, 2021 | |
| FROM OPERATIONS | | | | | | |
| Net investment income | | $ | 228,520 | | | $ | 73,835 | |
| Net realized gain (loss) on: | | | | | | | | |
| Investments | | | 89,966 | | | | 1,480 | |
| Forward currency exchange contracts | | | 134,088 | | | | (8,861 | ) |
| Foreign currency transactions | | | (1,516 | ) | | | 3,209 | |
| Net change in unrealized | | | | | | | | |
| appreciation (depreciation) on: | | | | | | | | |
| Investments | | | (345,158 | ) | | | 7,861 | |
| Forward currency exchange contracts | | | (51,314 | ) | | | 44,736 | |
| Foreign currency translation | | | (94 | ) | | | (53 | ) |
| Net increase in net assets from operations | | | 54,492 | | | | 122,207 | |
| | | | | | | | | |
| FROM DISTRIBUTIONS | | | | | | | | |
| Distributions to shareholders | | | (271,744 | ) | | | (71,520 | ) |
| Net decrease in net assets | | | | | | | | |
| resulting from distributions paid | | | (271,744 | ) | | | (71,520 | ) |
| | | | | | | | | |
| FROM CAPITAL SHARE TRANSACTIONS | | | | | | | | |
| Proceeds from sales of shares – | | | | | | | | |
| Institutional Class | | | 1,762,134 | | | | 17,033,340 | |
| Net asset value of shares issued to shareholders | | | | | | | | |
| in payment of distributions declared – | | | | | | | | |
| Institutional Class | | | 265,242 | | | | 71,520 | |
| Payments for shares redeemed – | | | | | | | | |
| Institutional Class | | | (1,858,893 | ) | | | (266,124 | ) |
| Net increase in net assets | | | | | | | | |
| from capital share transactions | | | 168,483 | | | | 16,838,736 | |
| TOTAL INCREASE (DECREASE) | | | | | | | | |
| IN NET ASSETS | | | (48,769 | ) | | | 16,889,423 | |
| | | | | | | | | |
| NET ASSETS: | | | | | | | | |
| Beginning of Period | | | 16,889,423 | | | | — | |
| End of Period | | $ | 16,840,654 | | | $ | 16,889,423 | |
(1) | Commencement of operations. |
The accompanying notes are an integral part of these financial statements.
CROSSINGBRIDGE ULTRA-SHORT DURATION FUND
| Statements of Changes in Net Assets (Continued) |
| | | For the Six | | | Period From | |
| | | Months Ended | | | June 30, 2021(1) | |
| | | March 31, 2022 | | | through | |
| | | (Unaudited) | | | September 30, 2021 | |
| FROM OPERATIONS | | | | | | |
| Net investment income (loss) | | $ | 141,273 | | | $ | (9,365 | ) |
| Net realized gain (loss) on: | | | | | | | | |
| Investments | | | 113,524 | | | | 5,227 | |
| Forward currency exchange contracts | | | 72,258 | | | | — | |
| Foreign currency transactions | | | (21,946 | ) | | | 7,242 | |
| Net change in unrealized | | | | | | | | |
| appreciation (depreciation) on: | | | | | | | | |
| Investments | | | (221,573 | ) | | | 27,843 | |
| Forward currency exchange contracts | | | (8,538 | ) | | | — | |
| Foreign currency transactions | | | (172 | ) | | | — | |
| Net increase in net assets from operations | | | 74,826 | | | | 30,947 | |
| | | | | | | | | |
| FROM DISTRIBUTIONS | | | | | | | | |
| Distributions to shareholders | | | (190,973 | ) | | | — | |
| Net decrease in net assets | | | | | | | | |
| resulting from distributions paid | | | (190,973 | ) | | | — | |
| | | | | | | | | |
| FROM CAPITAL SHARE TRANSACTIONS | | | | | | | | |
| Proceeds from sales of shares – | | | | | | | | |
| Institutional Class | | | 28,946,278 | | | | 37,029,820 | |
| Net asset value of shares issued to shareholders | | | | | | | | |
| in payment of distributions declared – | | | | | | | | |
| Institutional Class | | | 20,470 | | | | — | |
| Payments for shares redeemed – | | | | | | | | |
| Institutional Class | | | (3,294,677 | ) | | | (30 | ) |
| Net increase in net assets | | | | | | | | |
| from capital share transactions | | | 25,672,071 | | | | 37,029,790 | |
| TOTAL INCREASE IN NET ASSETS | | | 25,555,924 | | | | 37,060,737 | |
| | | | | | | | | |
| NET ASSETS: | | | | | | | | |
| Beginning of Period | | | 37,060,737 | | | | — | |
| End of Period | | $ | 62,616,661 | | | $ | 37,060,737 | |
(1) | Commencement of operations. |
The accompanying notes are an integral part of these financial statements.
CROSSINGBRIDGE PRE-MERGER SPAC ETF
| Statements of Changes in Net Assets (Continued) |
| | | For the Six | | | Period From | |
| | | Months Ended | | | September 20, 2021(1) | |
| | | March 31, 2022 | | | through | |
| | | (Unaudited) | | | September 30, 2021 | |
| FROM OPERATIONS | | | | | | |
| Net investment loss | | $ | (132,784 | ) | | $ | (907 | ) |
| Net realized gain (loss) on: | | | | | | | | |
| Investments | | | 306,462 | | | | 691 | |
| Foreign currency transactions | | | (2,022 | ) | | | — | |
| Net change in unrealized | | | | | | | | |
| appreciation (depreciation) on: | | | | | | | | |
| Investments | | | 203,559 | | | | (1,793 | ) |
| Net increase (decrease) in | | | | | | | | |
| net assets from operations | | | 375,215 | | | | (2,009 | ) |
| | | | | | | | | |
| FROM DISTRIBUTIONS | | | | | | | | |
| Distributions to shareholders | | | — | | | | — | |
| Net decrease in net assets | | | | | | | | |
| resulting from distributions paid | | | — | | | | — | |
| | | | | | | | | |
| FROM CAPITAL SHARE TRANSACTIONS | | | | | | | | |
| Proceeds from sales of shares | | | 48,741,966 | | | | 5,803,792 | |
| Payments for shares redeemed | | | (807,972 | ) | | | — | |
| Net increase in net assets | | | | | | | | |
| from capital share transactions | | | 47,933,994 | | | | 5,803,792 | |
| TOTAL INCREASE IN NET ASSETS | | | 48,309,209 | | | | 5,801,783 | |
| | | | | | | | | |
| NET ASSETS: | | | | | | | | |
| Beginning of Period | | | 5,801,783 | | | | — | |
| End of Period | | $ | 54,110,992 | | | $ | 5,801,783 | |
(1) | Commencement of operations. |
The accompanying notes are an integral part of these financial statements.
(This Page Intentionally Left Blank.)
CROSSINGBRIDGE LOW DURATION HIGH YIELD FUND
Institutional Class
| | | For the Six | |
| | | Months Ended | |
| | | March 31, 2022 | |
| | | (Unaudited) | |
| Net Asset Value, Beginning of Period/Year | | $ | 10.36 | |
| | | | | |
| Income from investment operations: | | | | |
Net investment income(2) | | | 0.14 | |
Net realized and unrealized gain (loss) on investments(3) | | | (0.06 | ) |
| Total from investment operations | | | 0.08 | |
| | | | | |
| Less distributions paid: | | | | |
| From net investment income | | | (0.15 | ) |
| From net realized gains | | | (0.16 | ) |
| Total distributions paid | | | (0.31 | ) |
| | | | | |
| Net Asset Value, End of Period/Year | | $ | 10.13 | |
Total return(5) | | | 0.73 | % |
| | | | | |
| Supplemental Data and Ratios: | | | | |
| Net assets, end of period/year (000’s) | | $ | 590,552 | |
| | | | | |
| Ratio of expenses to average net assets: | | | | |
Before waivers and reimbursements of expenses(6)(7) | | | 0.90 | % |
After waivers and reimbursement of expenses(6)(7) | | | 0.90 | % |
| Ratio of net investment income to average net assets: | | | | |
Before waivers and reimbursements of expenses(6) | | | 2.65 | % |
After waivers and reimbursements of expenses(6) | | | 2.65 | % |
Portfolio turnover rate(8) | | | 65.88 | % |
(1) | Commencement of investment operations. |
(2) | Per share net investment income was calculated using average shares outstanding method. |
(3) | Net realized and unrealized gain (loss) per share in the caption are balancing amounts necessary to reconcile the change in net asset value per share for the period and may not reconcile with the aggregate gains and losses in the Statement of Operations. |
(4) | Less than $0.005 per share. |
(5) | Total return represents the rate that investor would have earned or lost on an investment in the Fund, assuming reinvestment of dividends. Total return for a period of less than one year is not annualized. |
(6) | Annualized for periods of less than one year. |
(7) | This ratio includes previous expense reimbursements recouped by the Adviser. If the recoupment was excluded, this ratio would be 0.86% for the six months ended March 31, 2022 and unchanged for all other periods presented. |
(8) | Portfolio turnover not annualized for periods less than one year. Short-term securities with maturities less than or equal to 365 days are excluded from the portfolio turnover calculation. |
The accompanying notes are an integral part of these financial statements.
CROSSINGBRIDGE LOW DURATION HIGH YIELD FUND
| Financial Highlights (Continued) |
Per Share Data for a Share Outstanding Throughout Each Period/Year
| | | | | | | | | | Period from | |
| | | | | | | | | | February 1, 2018(1) | |
| Year Ended | | | Year Ended | | | Year Ended | | | through | |
| September 30, 2021 | | | September 30, 2020 | | | September 30, 2019 | | | September 30, 2018 | |
| $ | 9.86 | | | $ | 10.04 | | | $ | 10.06 | | | $ | 10.00 | |
| | | | | | | | | | | | | | | |
| | | | | | | | | | | | | | | |
| | 0.34 | | | | 0.35 | | | | 0.29 | | | | 0.17 | |
| | 0.54 | | | | (0.18 | ) | | | (0.02 | ) | | | 0.02 | |
| | 0.88 | | | | 0.17 | | | | 0.27 | | | | 0.19 | |
| | | | | | | | | | | | | | | |
| | | | | | | | | | | | | | | |
| | (0.38 | ) | | | (0.35 | ) | | | (0.29 | ) | | | (0.13 | ) |
| | — | | | | — | | | | (0.00 | )(4) | | | — | |
| | (0.38 | ) | | | (0.35 | ) | | | (0.29 | ) | | | (0.13 | ) |
| | | | | | | | | | | | | | | |
| $ | 10.36 | | | $ | 9.86 | | | $ | 10.04 | | | $ | 10.06 | |
| | 9.13 | % | | | 1.80 | % | | | 2.71 | % | | | 1.95 | % |
| | | | | | | | | | | | | | | |
| | | | | | | | | | | | | | | |
| $ | 326,484 | | | $ | 144,124 | | | $ | 129,019 | | | $ | 45,827 | |
| | | | | | | | | | | | | | | |
| | | | | | | | | | | | | | | |
| | 0.91 | % | | | 0.96 | % | | | 1.08 | % | | | 1.90 | % |
| | 0.88 | % | | | 0.90 | % | | | 0.96 | % | | | 1.00 | % |
| | | | | | | | | | | | | | | |
| | 3.34 | % | | | 3.35 | % | | | 2.83 | % | | | 1.64 | % |
| | 3.37 | % | | | 3.41 | % | | | 2.95 | % | | | 2.54 | % |
| | 169.73 | % | | | 224.86 | % | | | 198.63 | % | | | 76.70 | % |
The accompanying notes are an integral part of these financial statements.
CROSSINGBRIDGE RESPONSIBLE CREDIT FUND
Per Share Data for a Share Outstanding Throughout Each Period
Institutional Class
| | | For the Six | | | Period from | |
| | | Months Ended | | | June 30, 2021(1) | |
| | | March 31, 2022 | | | through | |
| | | (Unaudited) | | | September 30, 2021 | |
| Net Asset Value, Beginning of Period | | $ | 10.01 | | | $ | 10.00 | |
| | | | | | | | | |
| Income from investment operations: | | | | | | | | |
Net investment income(2) | | | 0.14 | | | | 0.06 | |
Net realized and unrealized loss on investments(3) | | | (0.11 | ) | | | (0.01 | ) |
| Total from investment operations | | | 0.03 | | | | 0.05 | |
| | | | | | | | | |
| Less distributions paid: | | | | | | | | |
| From net investment income | | | (0.14 | ) | | | (0.04 | ) |
| From net realized gains | | | (0.02 | ) | | | — | |
| Total distributions paid | | | (0.16 | ) | | | (0.04 | ) |
| | | | | | | | | |
| Net Asset Value, End of Period | | $ | 9.88 | | | $ | 10.01 | |
Total return(4) | | | 0.33 | % | | | 0.57 | % |
| | | | | | | | | |
| Supplemental Data and Ratios: | | | | | | | | |
| Net assets, end of period (000’s) | | $ | 16,841 | | | $ | 16,889 | |
| | | | | | | | | |
| Ratio of expenses to average net assets: | | | | | | | | |
Before waivers and reimbursements of expenses(5) | | | 2.01 | % | | | 2.77 | % |
After waivers and reimbursement of expenses(5) | | | 0.90 | % | | | 0.91 | %(6) |
| Ratio of net investment income (loss) | | | | | | | | |
| to average net assets: | | | | | | | | |
Before waivers and reimbursements of expenses(5) | | | 1.65 | % | | | 0.50 | % |
After waivers and reimbursements of expenses(5) | | | 2.76 | % | | | 2.36 | % |
Portfolio turnover rate(7) | | | 82.75 | % | | | 39.47 | % |
(1) | Commencement of investment operations. |
(2) | Per share net investment income was calculated using average shares outstanding method. |
(3) | Net realized and unrealized loss per share in the caption are balancing amounts necessary to reconcile the change in net asset value per share for the period and may not reconcile with the aggregate gains and losses in the Statement of Operations. |
(4) | Total return represents the rate that investor would have earned or lost on an investment in the Fund, assuming reinvestment of dividends. Total return for a period of less than one year is not annualized. |
(5) | Annualized for periods less than one year. |
(6) | The ratio of expenses to average net assets after waivers and reimbursement of expenses includes bank loan service charges. Excluding these charges, the ratio was 0.90%. |
(7) | Portfolio turnover not annualized for periods less than one year. Short-term securities with maturities less than or equal to 365 days are excluded from the portfolio turnover calculation. |
The accompanying notes are an integral part of these financial statements.
CROSSINGBRIDGE ULTRA-SHORT DURATION FUND
Per Share Data for a Share Outstanding Throughout Each Period
Institutional Class
| | | For the Six | | | Period from | |
| | | Months Ended | | | June 30, 2021(1) | |
| | | March 31, 2022 | | | through | |
| | | (Unaudited) | | | September 30, 2021 | |
| Net Asset Value, Beginning of Period | | $ | 10.01 | | | $ | 10.00 | |
| | | | | | | | | |
| Income from investment operations: | | | | | | | | |
Net investment income (loss)(2) | | | 0.03 | | | | (0.01 | ) |
| Net realized and unrealized | | | | | | | | |
gain (loss) on investments(3) | | | (0.01 | ) | | | 0.02 | |
| Total from investment operations | | | 0.02 | | | | 0.01 | |
| | | | | | | | | |
| Less distributions paid: | | | | | | | | |
| From net investment income | | | (0.03 | ) | | | — | |
| From net realized gains | | | (0.01 | ) | | | — | |
| Total distributions paid | | | (0.04 | ) | | | — | |
| | | | | | | | | |
| Net Asset Value, End of Period | | $ | 9.99 | | | $ | 10.01 | |
Total return(4) | | | 0.19 | % | | | 0.07 | % |
| | | | | | | | | |
| Supplemental Data and Ratios: | | | | | | | | |
| Net assets, end of period (000’s) | | $ | 62,617 | | | $ | 37,061 | |
| | | | | | | | | |
| Ratio of expenses to average net assets: | | | | | | | | |
Before waivers and reimbursements of expenses(5) | | | 1.18 | % | | | 2.68 | % |
After waivers and reimbursement of expenses(5) | | | 0.90 | % | | | 0.90 | % |
| Ratio of net investment income (loss) | | | | | | | | |
| to average net assets: | | | | | | | | |
Before waivers and reimbursements of expenses(5) | | | 0.27 | % | | | (2.06 | %) |
After waivers and reimbursements of expenses(5) | | | 0.55 | % | | | (0.28 | %) |
Portfolio turnover rate(6) | | | 116.14 | % | | | 41.74 | % |
(1) | Commencement of investment operations. |
(2) | Per share net investment income (loss) was calculated using average shares outstanding method. |
(3) | Net realized and unrealized gain (loss) per share in the caption are balancing amounts necessary to reconcile the change in net asset value per share for the period and may not reconcile with the aggregate gains and losses in the Statement of Operations. |
(4) | Total return represents the rate that investor would have earned or lost on an investment in the Fund, assuming reinvestment of dividends. Total return for a period of less than one year is not annualized. |
(5) | Annualized for periods less than one year. |
(6) | Portfolio turnover not annualized for periods less than one year. Short-term securities with maturities less than or equal to 365 days are excluded from the portfolio turnover calculation. |
The accompanying notes are an integral part of these financial statements.
CROSSINGBRIDGE PRE-MERGER SPAC ETF
Per Share Data for a Share Outstanding Throughout Each Period
NAV
| | | For the Six | | | Period from | |
| | | Months Ended | | | September 20, 2021(1) | |
| | | March 31, 2022 | | | through | |
| | | (Unaudited) | | | September 30, 2021 | |
| Net Asset Value, Beginning of Period | | $ | 20.01 | | | $ | 20.00 | |
| | | | | | | | | |
| Income from investment operations: | | | | | | | | |
Net investment loss(2) | | | (0.08 | ) | | | (0.00 | )(3) |
Net realized and unrealized gain on investments(4) | | | 0.57 | | | | 0.01 | |
| Total from investment operations | | | 0.49 | | | | 0.01 | |
| | | | | | | | | |
| Less distributions paid: | | | | | | | | |
| From net investment income | | | — | | | | — | |
| From net realized gains | | | — | | | | — | |
| Total distributions paid | | | — | | | | — | |
| | | | | | | | | |
| Net Asset Value, End of Period | | $ | 20.50 | | | $ | 20.01 | |
Total return(5) | | | 2.45 | % | | | 0.03 | % |
| | | | | | | | | |
| Supplemental Data and Ratios: | | | | | | | | |
| Net assets, end of period (000’s) | | $ | 54,111 | | | $ | 5,802 | |
| | | | | | | | | |
Ratio of expenses to average net assets(6) | | | 0.82 | % | | | 0.80 | % |
Ratio of net investment loss to average net assets(6) | | | (0.81 | )% | | | (0.80 | )% |
Portfolio turnover rate(7)(8) | | | 192.86 | % | | | 4.29 | % |
(1) | Commencement of investment operations. |
(2) | Per share net investment loss was calculated using average shares outstanding method. |
(3) | Amount between $(0.005) and $0.00 per share. |
(4) | Net realized and unrealized gain per share in the caption are balancing amounts necessary to reconcile the change in net asset value per share for the period and may not reconcile with the aggregate gains and losses in the Statement of Operations. |
(5) | Total return represents the rate that investor would have earned or lost on an investment in the Fund, assuming reinvestment of dividends. Total return for a period of less than one year is not annualized. |
(6) | Annualized for periods less than one year. |
(7) | Portfolio turnover not annualized for periods less than one year. Short-term securities with maturities less than or equal to 365 days are excluded from the portfolio turnover calculation. |
(8) | Excludes in-kind transactions associated with creations and redemptions of the Fund. |
The accompanying notes are an integral part of these financial statements.
CROSSINGBRIDGE FUNDS
Notes to Financial Statements
March 31, 2022 (Unaudited)
| (1) | Organization |
| | |
| | Trust for Professional Managers (the “Trust”) was organized as a Delaware statutory trust under a Declaration of Trust dated May 29, 2001. The Trust is registered under the Investment Company Act of 1940, as amended (the “1940 Act”), as an open-end management investment company. The CrossingBridge Funds (the “Funds”) are comprised of the CrossingBridge Low Duration High Yield Fund, the CrossingBridge Responsible Credit Fund, the CrossingBridge Ultra-Short Duration Fund (collectively, the “Mutual Funds”) and the CrossingBridge Pre-Merger SPAC ETF (the “ETF”), each representing a distinct diversified series with its own investment objective and policies within the Trust. |
| | |
| | The investment objective of the CrossingBridge Low Duration High Yield Fund is to seek high current income and capital appreciation consistent with the preservation of capital. The investment objective of the CrossingBridge Responsible Credit Fund is to seek high current income and capital appreciation consistent with the preservation of capital. The investment objective of the CrossingBridge Ultra-Short Duration Fund is to offer a higher yield than cash instruments while maintaining a low duration. |
| | |
| | The CrossingBridge Low Duration High Yield Fund commenced investment operations on February 1, 2018. The Fund has registered both an Investor Class and Institutional Class of shares. During the period ended March 31, 2022, only the Institutional Class was operational. Both the CrossingBridge Responsible Credit Fund and CrossingBridge Ultra-Short Duration Fund commenced investment operations on June 30, 2021. Both Funds registered only an Institutional Class of shares. |
| | |
| | The investment objective of the CrossingBridge Pre-Merger SPAC ETF is to provide total returns consistent with the preservation of capital. The ETF commenced investment operations on September 20, 2021. |
| | |
| | Costs incurred by the Funds in connection with the organization, registration and the initial public offering of shares were paid by CrossingBridge Advisors, LLC (“the Adviser”), the Funds’ investment adviser. The Trust may issue an unlimited number of shares of beneficial interest at $0.001 par value. The Funds are investment companies and accordingly follow the investment company accounting and reporting guidance of the Financial Accounting Standards Board (“FASB”) Accounting Standards Codification Topic 946 “Financial Services – Investment Companies.” |
| | |
| (2) | Significant Accounting Policies |
| | |
| | The following is a summary of significant accounting policies consistently followed by the Funds in the preparation of the financial statements. These policies are in conformity with generally accepted accounting principles in the United States of America (“GAAP”). |
| | |
| | (a) Investment Valuation |
| | |
| | Each security owned by a Fund that is listed on a securities exchange, including Special Purpose Acquisition Companies (“SPACs”), is valued at its last sale price on that exchange on the date as of which assets are valued. Bank loans are valued at prices supplied by an approved independent pricing service (“Pricing Service”), if available, and otherwise will be valued at the most recent bid quotations or evaluated prices, as applicable, based on quotations or prices obtained from one or more broker-dealers known to follow the issue. |
CROSSINGBRIDGE FUNDS
Notes to Financial Statements (Continued)
March 31, 2022 (Unaudited)
| | If the security is listed on more than one exchange, a Fund will use the price of the exchange that the Fund generally considers to be the principal exchange on which the security is traded. Portfolio securities listed on NASDAQ will be valued at the NASDAQ Official Closing Price, which may not necessarily represent the last sale price. If there has been no sale on such exchange or on NASDAQ on such day, the security is valued at the mean between the most recent bid and asked prices on such day or the security shall be valued at the latest sales price on the “composite market” for the day such security is being valued. The composite market is defined as a consolidation of the trade information provided by national securities and foreign exchanges and over-the-counter markets as published by a Pricing Service. |
| | |
| | Foreign securities will be priced in their local currencies as of the close of their primary exchange or market or as of the time a Fund calculates its net asset value (“NAV”), whichever is earlier. Foreign securities, currencies and other assets denominated in foreign currencies are then translated into U.S. dollars at the exchange rate of such currencies against the U.S. dollar, as provided by an approved Pricing Service or reporting agency. All assets denominated in foreign currencies will be converted into U.S. dollars using the applicable currency exchange rates as of the close of the New York Stock Exchange (“NYSE”), generally 4:00 p.m. Eastern Time. |
| | |
| | Debt securities, including corporate bonds, bank loans, commercial paper, and short-term debt instruments having a maturity of 60 days or less, are valued at the mean in accordance with prices supplied by an approved Pricing Service. Pricing Services may use various valuation methodologies such as the mean between the bid and the asked prices, matrix pricing and other analytical pricing models as well as market transactions and dealer quotations. If a price is not available from a Pricing Service, the most recent quotation obtained from one or more broker-dealers known to follow the issue will be obtained. Quotations will be valued at the mean between the bid and the offer. Any discount or premium is accreted or amortized using the constant yield method until maturity. |
| | |
| | Money market funds are valued at cost. If cost does not represent current market value, the securities will be priced at fair value. |
| | |
| | Redeemable securities issued by open-end, registered investment companies are valued at the NAVs of such companies for purchase and/or redemption orders placed on that day. All exchange-traded funds are valued at the last reported sale price on the exchange on which the security is principally traded. |
| | |
| | If market quotations are not readily available, a security or other asset will be valued at its fair value as determined under fair value pricing procedures approved by the Board of Trustees. These fair value pricing procedures will also be used to price a security when corporate events, events in the securities market and/or world events cause the Adviser to believe that a security’s last sale price may not reflect its actual fair market value. The intended effect of using fair value pricing procedures is to ensure that a Fund is accurately priced. The Board of Trustees will regularly evaluate whether the Funds’ fair value pricing procedures continue to be appropriate in light of the specific circumstances of the Funds and the quality of prices obtained through the application of such procedures by the Trust’s valuation committee. |
CROSSINGBRIDGE FUNDS
Notes to Financial Statements (Continued)
March 31, 2022 (Unaudited)
| | FASB Accounting Standards Codification, “Fair Value Measurements and Disclosures” Topic 820 (“ASC 820”), establishes an authoritative definition of fair value and sets out a hierarchy for measuring fair value. ASC 820 requires an entity to evaluate certain factors to determine whether there has been a significant decrease in volume and level of activity for the security such that recent transactions and quoted prices may not be determinative of fair value and further analysis and adjustment may be necessary to estimate fair value. ASC 820 also requires enhanced disclosure regarding the inputs and valuation techniques used to measure fair value in those instances as well as expanded disclosure of valuation levels for major security types. These inputs are summarized in the three broad levels listed below: |
| | Level 1 – | Unadjusted quoted prices in active markets for identical securities. |
| | | |
| | Level 2 – | Other significant observable inputs (including quoted prices for similar securities, interest rates, prepayment speeds, credit risk, etc.). |
| | | |
| | Level 3 – | Significant unobservable inputs (including the Funds’ own assumptions in determining the fair value of investments). |
| | The inputs or methodology used for valuing securities are not necessarily an indication of the risk associated with investing in those securities. The following is a summary of the inputs used to value the Funds’ investments carried at fair value as of March 31, 2022: |
| | |
| | CrossingBridge Low Duration High Yield Fund |
| |
| | | | | | | | | | | Total | |
| | Assets(1): | | | | | | | | | | | | |
| | Asset Backed Securities | | $ | — | | | $ | 3,659,215 | | | $ | — | | | $ | 3,659,215 | |
| | Bank Loans | | | — | | | | 64,871,967 | | | | — | | | | 64,871,967 | |
| | Commercial Paper | | | — | | | | 120,980,172 | | | | — | | | | 120,980,172 | |
| | Common Stocks | | | 74,984 | | | | 80,800 | | | | — | | | | 155,784 | |
| | Convertible Bonds | | | — | | | | 8,475,197 | | | | 7,245,000 | | | | 15,720,197 | |
| | Corporate Bonds | | | — | | | | 263,281,318 | | | | — | | | | 263,281,318 | |
| | Special Purpose | | | | | | | | | | | | | | | | |
| | Acquisition Companies | | | 50,673,751 | | | | 15,772,128 | | | | 12,771 | | | | 66,458,650 | |
| | Trade Claims | | | — | | | | 4,857,666 | | | | — | | | | 4,857,666 | |
| | Warrants | | | 152,445 | | | | 38,583 | | | | — | | | | 191,028 | |
| | Money Market Funds | | | 64,683,584 | | | | — | | | | — | | | | 64,683,584 | |
| | Total Assets | | $ | 115,584,764 | | | $ | 482,017,046 | | | $ | 7,257,771 | | | $ | 604,859,581 | |
| | Other Financial Instruments(2) | | | | | | | | | | | | | | | | |
| | Forward Currency | | | | | | | | | | | | | | | | |
| | Exchange Contracts | | $ | — | | | $ | (289,705 | ) | | $ | — | | | $ | (289,705 | ) |
| | Total Other | | | | | | | | | | | | | | | | |
| | Financial Instruments | | $ | — | | | $ | (289,705 | ) | | $ | — | | | $ | (289,705 | ) |
| | (1) | See the Schedule of Investments for industry classifications. |
| | (2) | Other financial instruments are forward currency exchange contracts not included in the Schedule of Investments, which are reflected at the net unrealized appreciation (depreciation) on the instrument. |
CROSSINGBRIDGE FUNDS
Notes to Financial Statements (Continued)
March 31, 2022 (Unaudited)
| | CrossingBridge Responsible Credit Fund |
| |
| | | | | | | | | | | Total | |
| | Assets(1): | | | | | | | | | | | | |
| | Bank Loans | | $ | — | | | $ | 1,221,250 | | | $ | — | | | $ | 1,221,250 | |
| | Commercial Paper | | | — | | | | 320,953 | | | | — | | | | 320,953 | |
| | Convertible Bonds | | | — | | | | 213,850 | | | | — | | | | 213,850 | |
| | Corporate Bonds | | | — | | | | 9,603,681 | | | | — | | | | 9,603,681 | |
| | Special Purpose | | | | | | | | | | | | | | | | |
| | Acquisition Companies | | | 2,512,291 | | | | 390,002 | | | | 450 | | | | 2,902,743 | |
| | Warrants | | | 251 | | | | — | | | | — | | | | 251 | |
| | Money Market Funds | | | 1,791,140 | | | | — | | | | — | | | | 1,791,140 | |
| | Total Assets | | $ | 4,303,682 | | | $ | 11,749,736 | | | $ | 450 | | | $ | 16,053,868 | |
| | Other Financial Instruments(2) | | | | | | | | | | | | | | | | |
| | Forward Currency | | | | | | | | | | | | | | | | |
| | Exchange Contracts | | $ | — | | | $ | (6,578 | ) | | $ | — | | | $ | (6,578 | ) |
| | Total Other | | | | | | | | | | | | | | | | |
| | Financial Instruments | | $ | — | | | $ | (6,578 | ) | | $ | — | | | $ | (6,578 | ) |
| | (1) | See the Schedule of Investments for industry classifications. |
| | (2) | Other financial instruments are forward currency exchange contracts not included in the Schedule of Investments, which are reflected at the net unrealized appreciation (depreciation) on the instrument. |
| | CrossingBridge Ultra-Short Duration Fund |
| |
| | | | | | | | | | | Total | |
| | Assets(1): | | | | | | | | | | | | |
| | Asset Backed Securities | | $ | — | | | $ | 3,383,301 | | | $ | — | | | $ | 3,383,301 | |
| | Bank Loans | | | — | | | | 1,884,445 | | | | — | | | | 1,884,445 | |
| | Common Stocks | | | 11,269 | | | | — | | | | — | | | | 11,269 | |
| | Convertible Bonds | | | — | | | | 1,589,251 | | | | 1,089,000 | | | | 2,678,251 | |
| | Corporate Bonds | | | — | | | | 46,555,139 | | | | — | | | | 46,555,139 | |
| | Special Purpose | | | | | | | | | | | | | | | | |
| | Acquisition Companies | | | 6,314,531 | | | | 1,237,898 | | | | 493 | | | | 7,552,922 | |
| | Warrants | | | 18,628 | | | | — | | | | — | | | | 18,628 | |
| | Money Market Funds | | | 1,889,162 | | | | — | | | | — | | | | 1,889,162 | |
| | Total Assets | | $ | 8,233,590 | | | $ | 54,650,034 | | | $ | 1,089,493 | | | $ | 63,973,117 | |
| | Other Financial Instruments(2) | | | | | | | | | | | | | | | | |
| | Forward Currency | | | | | | | | | | | | | | | | |
| | Exchange Contracts | | $ | — | | | $ | (8,538 | ) | | $ | — | | | $ | (8,538 | ) |
| | Total Other | | | | | | | | | | | | | | | | |
| | Financial Instruments | | $ | — | | | $ | (8,538 | ) | | $ | — | | | $ | (8,538 | ) |
| | (1) | See the Schedule of Investments for industry classifications. |
| | (2) | Other financial instruments are forward currency exchange contracts not included in the Schedule of Investments, which are reflected at the net unrealized appreciation (depreciation) on the instrument. |
CROSSINGBRIDGE FUNDS
Notes to Financial Statements (Continued)
March 31, 2022 (Unaudited)
| | CrossingBridge Pre-Merger SPAC ETF |
| | | | Level 1 | | | Level 2 | | | Level 3 | | | Total | |
| | Assets(1): | | | | | | | | | | | | |
| | Special Purpose | | | | | | | | | | | | |
| | Acquisition Companies | | $ | 42,974,809 | | | $ | 10,765,002 | | | $ | 2,158 | | | $ | 53,741,969 | |
| | Warrants | | | 41,903 | | | | 31,712 | | | | — | | | | 73,615 | |
| | Rights | | | 16,250 | | | | — | | | | — | | | | 16,250 | |
| | Money Market Funds | | | 998,006 | | | | — | | | | — | | | | 998,006 | |
| | Total Assets | | $ | 44,030,968 | | | $ | 10,796,714 | | | $ | 2,158 | | | $ | 54,829,840 | |
| | (1) | See the Schedule of Investments for industry classifications. |
| | The following is a reconciliation of Level 3 assets in the Funds for which significant unobservable inputs were used to determine fair value: |
| | |
| | CrossingBridge Low Duration High Yield Fund |
| | | | | | | Convertible | | | Special Purpose | |
| | | | Bank Loans | | | Bonds | | | Acquisition Companies | |
| | Beginning Balance – October 1, 2021 | | $ | 4,293,369 | | | $ | — | | | $ | — | |
| | Purchases | | | 90,634 | | | | 7,245,000 | | | | 68 | |
| | Sales | | | (4,384,003 | ) | | | — | | | | — | |
| | Realized gains | | | — | | | | — | | | | — | |
| | Realized losses | | | — | | | | — | | | | — | |
| | Change in unrealized | | | | | | | | | | | | |
| | appreciation (depreciation) | | | — | | | | — | | | | 12,703 | |
| | Transfer in/(out) of Level 3 | | | — | | | | — | | | | — | |
| | Ending Balance – March 31, 2022 | | $ | — | | | $ | 7,245,000 | | | $ | 12,771 | |
| | CrossingBridge Responsible Credit Fund |
| | | | Special Purpose | |
| | | | Acquisition Companies | |
| | Beginning Balance – October 1, 2021 | | $ | — | |
| | Purchases | | | — | |
| | Sales | | | — | |
| | Realized gains | | | — | |
| | Realized losses | | | — | |
| | Change in unrealized | | | | |
| | appreciation (depreciation) | | | 450 | |
| | Transfer in/(out) of Level 3 | | | — | |
| | Ending Balance – March 31, 2022 | | $ | 450 | |
CROSSINGBRIDGE FUNDS
Notes to Financial Statements (Continued)
March 31, 2022 (Unaudited)
| | CrossingBridge Ultra-Short Duration Fund |
| | | | Convertible | | | Special Purpose | |
| | | | Bonds | | | Acquisition Companies | |
| | Beginning Balance – October 1, 2021 | | $ | — | | | $ | — | |
| | Purchases | | | 1,089,000 | | | | — | |
| | Sales | | | — | | | | — | |
| | Realized gains | | | — | | | | — | |
| | Realized losses | | | — | | | | — | |
| | Change in unrealized appreciation (depreciation) | | | — | | | | 493 | |
| | Transfer in/(out) of Level 3 | | | — | | | | — | |
| | Ending Balance – March 31, 2022 | | $ | 1,089,000 | | | $ | 493 | |
| | CrossingBridge Pre-Merger SPAC ETF |
| | | | Special Purpose | |
| | | | Acquisition Companies | |
| | Beginning Balance – October 1, 2021 | | $ | — | |
| | Purchases | | | 40 | |
| | Sales | | | — | |
| | Realized gains | | | — | |
| | Realized losses | | | — | |
| | Change in unrealized appreciation (depreciation) | | | 2,118 | |
| | Transfer in/(out) of Level 3 | | | — | |
| | Ending Balance – March 31, 2022 | | $ | 2,158 | |
| | The following table represents additional information about valuation methodologies and inputs used for investments that are measured at fair value and categorized within Level 3 as of March 31, 2022: |
| | |
| | CrossingBridge Low Duration High Yield Fund |
| | | | | | Range/Weighted |
| | | | | | Average of |
| | | Fair Value | Valuation | Unobservable | Unobservable |
| | Description | March 31, 2022 | Methodologies | Input | Input* |
| | Convertible Bonds* | $7,245,000 | Company-specific | Market | $100.00 |
| | | | information | assessment | |
| | Special Purpose | $ 12,771 | Company-specific | Market | |
| | Acquisition Companies | | information | assessment | |
| | * | Table presents information for one security, which has been valued at $100.00 throughout the period. |
| | CrossingBridge Responsible Credit Fund |
| | | | | | Range/Weighted |
| | | | | | Average of |
| | | Fair Value | Valuation | Unobservable | Unobservable |
| | Description | March 31, 2022 | Methodologies | Input | Input* |
| | Special Purpose | $ 450 | Company-specific | Market | $0.45/ $0.45 |
| | Acquisition Companies | | information | assessment | |
CROSSINGBRIDGE FUNDS
Notes to Financial Statements (Continued)
March 31, 2022 (Unaudited)
| | CrossingBridge Ultra-Short Duration Fund |
| | | | | | Range/Weighted |
| | | | | | Average of |
| | | Fair Value | Valuation | Unobservable | Unobservable |
| | Description | March 31, 2022 | Methodologies | Input | Input* |
| | Convertible Bonds* | $1,089,000 | Company-specific | Market | $100.00 |
| | | | information | assessment | |
| | Special Purpose | $ 493 | Company-specific | Market | $0.27/ $0.27 |
| | Acquisition Companies | | information | assessment | |
| | CrossingBridge Pre-Merger SPAC ETF |
| | | | | | Range/Weighted |
| | | | | | Average of |
| | | Fair Value | Valuation | Unobservable | Unobservable |
| | Description | March 31, 2022 | Methodologies | Input | Input* |
| | Special Purpose | $ 2,158 | Company-specific | Market | $0.23-$0.27/ |
| | Acquisition Companies | | information | assessment | $0.23 |
| | (b) Foreign Securities and Currency Transactions |
| | |
| | Investment securities and other assets and liabilities denominated in foreign currencies are translated into U.S. dollar amounts at the date of valuation. Purchases and sales of investment securities and income and expense items denominated in foreign currencies are translated into U.S. dollar amounts on the respective dates of such transactions. |
| | |
| | The Funds do not isolate the portion of the results of operations from changes in foreign exchange rates on investments from the fluctuations arising from changes in market prices of securities held. Realized foreign exchange gains or losses arising from sales of portfolio securities and sales and maturities of short-term securities are reported within realized gain (loss) on investments. Net unrealized foreign exchange gains and losses arising from changes in the values of investments in securities from fluctuations in exchange rates are reported within unrealized gain (loss) on investments. |
| | |
| | Investments in foreign securities entail certain risks. There may be a possibility of nationalization or expropriation of assets, confiscatory taxation, political or financial instability, and diplomatic developments that could affect the value of a Fund’s investments in certain foreign countries. Since foreign securities normally are denominated and traded in foreign currencies, the value of a Fund’s assets may be affected favorably or unfavorably by currency exchange rates, currency exchange control regulations, foreign withholding taxes, and restrictions or prohibitions on the repatriation of foreign currencies. There may be less information publicly available about a foreign issuer than about a U.S. issuer, and foreign issuers are not generally subject to accounting, auditing, and financial reporting standards and practices comparable to those in the United States. The securities of some foreign issuers are less liquid and at times more volatile than securities of comparable U.S. issuers. |
CROSSINGBRIDGE FUNDS
Notes to Financial Statements (Continued)
March 31, 2022 (Unaudited)
| | (c) Federal Income Taxes |
| | |
| | The Funds intend to comply with the requirements of Subchapter M of the Internal Revenue Code of 1986, as amended (the “Code”), necessary to qualify as a regulated investment company and to make the requisite distributions of income and capital gains to its shareholders sufficient to relieve it from all or substantially all federal income taxes. Therefore, no federal income tax provision has been provided. |
| | |
| | As of and during the period ended March 31, 2022, the Funds did not have liabilities for any unrecognized tax benefits. The Funds recognize interest and penalties, if any, related to unrecognized tax benefits as income tax expense in the Statements of Operations. During the period ended March 31, 2022, the Funds did not incur any interest or penalties. The Funds are subject to examination by U.S. taxing authorities for the tax periods since the commencement of operations. |
| | |
| | (d) Distributions to Shareholders |
| | |
| | In general, the Mutual Funds will distribute any net investment income monthly and any net realized capital gains at least annually. The ETF will distribute any net investment income annually and any net realized capital gains at least annually. The Funds may make additional distributions if deemed to be desirable during the year. Distributions from net realized gains for book purposes may include short-term capital gains. All short-term capital gains are included in ordinary income for tax purposes. Distributions to shareholders are recorded on the ex-dividend date. The Funds may also pay a special distribution at the end of the calendar year to comply with federal tax requirements. |
| | |
| | Treatment of income and capital gain distributions for federal income tax purposes may differ from GAAP, primarily due to timing differences in the recognition of income and gains and losses by the Funds. To the extent that these differences are attributable to permanent book and tax accounting differences, they are reclassified in the components of net assets. |
| | |
| | (e) Use of Estimates |
| | |
| | The preparation of financial statements in conformity with GAAP requires management to make estimates and assumptions that affect the reported amounts of assets and liabilities and disclosure of contingent assets and liabilities at the date of the financial statements and the reported amounts of revenues and expenses during the reporting period. Actual results could differ from those estimates. |
| | |
| | (f) Share Valuation |
| | |
| | The NAV per share of a Fund is calculated by dividing the sum of the value of the securities held by the Fund, plus cash or other assets, minus all liabilities (including estimated accrued expenses) by the total number of shares outstanding for the Fund, rounded to the nearest cent. The Funds’ shares will not be priced on the days on which the NYSE is closed for trading. |
| | |
| | (g) Allocation of Income, Expenses and Gains/Losses |
| | |
| | Income, expenses (other than those deemed attributable to a specific share class), and gains and losses of a Fund are allocated daily to each class of shares based |
CROSSINGBRIDGE FUNDS
Notes to Financial Statements (Continued)
March 31, 2022 (Unaudited)
| | upon the ratio of net assets represented by each class as a percentage of the net assets of the Fund. Expenses deemed directly attributable to a class of shares are recorded by the specific class. Most Fund expenses are allocated by class based on relative net assets. Shareholder servicing fees are currently expensed up to 0.10% of average daily net assets of each Mutual Fund’s Institutional Class shares. Expenses associated with a specific fund in the Trust are charged to that fund. Common Trust expenses are typically allocated evenly between the funds of the Trust, or by other equitable means. |
| | |
| | (h) Other |
| | |
| | Investment transactions are recorded on the trade date. The Funds determine the gain or loss from investment transactions using the specific identification method for the best tax relief order by comparing the original cost of the security lot sold with the net sale proceeds. Interest income is recognized on an accrual basis. Withholding taxes on foreign interest, net of any reclaims, have been provided for in accordance with the Funds’ understanding of the applicable country’s tax rules and rates. Any discount or premium on securities purchased are accreted or amortized over the expected life of the respective securities using the constant yield method. |
| | |
| | (i) Loan Participation |
| | |
| | When purchasing participation interests in a loan, a Fund generally has no right to enforce compliance with the terms of the loan agreement with the borrower. As a result, a Fund may be subject to the credit risk of both the borrower and the lender that is selling the loan agreement. A Fund may enter into unfunded loan commitments, which are contractual obligations for future funding. Unfunded loan commitments represent a future obligation in full, even though a percentage of the notional loan amounts may not be utilized by the borrower. When investing in a loan participation agreement, a Fund has the right to receive payments of principal, interest and any fees to which it is entitled only from the lender selling the loan agreement and only upon receipt of payments by the lender from the borrower. A Fund may receive a commitment fee based on the undrawn portion of the underlying line of credit portion of a floating rate loan. In certain circumstances, a Fund may receive a penalty fee upon the prepayment of a floating rate loan by a borrower. Fees earned are recorded as a component of interest income or interest expense, respectively, on the Statements of Operations. |
| | |
| | (j) Derivatives |
| | |
| | The Funds may utilize derivative instruments such as options, swaps, futures, forward contracts and other instruments with similar characteristics to the extent that they are consistent with the Funds’ investment objectives and limitations. The use of derivatives may involve additional investment risks, including counterparty credit risk, i.e., the risk that a Fund may experience delay in obtaining financial recovery in the event a counterparty experiences financial difficulty. To mitigate this risk, the Adviser will seek to effect derivative transactions with only counterparties that they believe are creditworthy. |
| | |
| | The Funds have adopted authoritative standards regarding disclosure about derivatives and hedging activities and how they affect the Funds’ Statements of Assets |
CROSSINGBRIDGE FUNDS
Notes to Financial Statements (Continued)
March 31, 2022 (Unaudited)
| | and Liabilities and Statements of Operations. For the period ended March 31, 2022, the monthly average quantity and notional value of derivatives are described below: |
| | CrossingBridge Low Duration High Yield Fund | | | | | | |
| | | | Monthly Average | | | Monthly Average | |
| | | | Contracts | | | Notional Value | |
| | Forward Currency Exchange Contracts | | | 4 | | | $ | 31,082,966 | |
| | Warrants | | | 161,739 | | | | 51,358 | |
| | | | | | | | | | |
| | CrossingBridge Responsible Credit Fund | | | | | | | | |
| | | | Monthly Average | | | Monthly Average | |
| | | | Contracts | | | Notional Value | |
| | Forward Currency Exchange Contracts | | | 1 | | | $ | 1,955,618 | |
| | Warrants | | | 677 | | | | 325 | |
| | | | | | | | | | |
| | CrossingBridge Ultra-Short Duration Fund | | | | | | | | |
| | | | Monthly Average | | | Monthly Average | |
| | | | Contracts | | | Notional Value | |
| | Forward Currency Exchange Contracts | | | 1 | | | $ | 816,078 | |
| | Warrants | | | 9,985 | | | | 2,986 | |
| | | | | | | | | | |
| | CrossingBridge Pre-Merger SPAC ETF | | | | | | | | |
| | | | Monthly Average | | | Monthly Average | |
| | | | Contracts | | | Notional Value | |
| | Warrants | | | 88,188 | | | $ | 28,049 | |
| | Statement of Assets and Liabilities |
| | |
| | Fair value of derivative instruments as of March 31, 2022 are described below: |
| | CrossingBridge Low Duration High Yield Fund | | | | |
| | | Asset Derivatives | |
| | | Statement of Assets | | | |
| | | and Liabilities Location | | Fair Value | |
| | Warrants | Investments, at value | | $ | 191,028 | |
| | | Liability Derivatives | |
| | | Statement of Assets | | | | |
| | | and Liabilities Location | | Fair Value | |
| | Forward Currency Exchange Contracts | Payable | | $ | 289,705 | |
| | | | | | | |
| | CrossingBridge Responsible Credit Fund | | | | | |
| | | Asset Derivatives | |
| | | Statement of Assets | | | | |
| | | and Liabilities Location | | Fair Value | |
| | Warrants | Investments, at value | | $ | 251 | |
| | | Liability Derivatives | |
| | | Statement of Assets | | | | |
| | | and Liabilities Location | | Fair Value | |
| | Forward Currency Exchange Contracts | Payable | | $ | 6,578 | |
CROSSINGBRIDGE FUNDS
Notes to Financial Statements (Continued)
March 31, 2022 (Unaudited)
| | CrossingBridge Ultra-Short Duration Fund | | | | |
| | | Asset Derivatives | |
| | | Statement of Assets | | | |
| | | and Liabilities Location | | Fair Value | |
| | Warrants | Investments, at value | | $ | 18,628 | |
| | | | | | | |
| | | Liability Derivatives | |
| | | Statement of Assets | | | | |
| | | and Liabilities Location | | Fair Value | |
| | Forward Currency Exchange Contracts | Payable | | $ | 8,538 | |
| | | | | | | |
| | CrossingBridge Pre-Merger SPAC ETF | | | | | |
| | | Asset Derivatives | |
| | | Statement of Assets | | | | |
| | | and Liabilities Location | | Fair Value | |
| | Warrants | Investments, at value | | $ | 73,615 | |
| | Statement of Operations |
| | |
| | The effect of derivative instruments on the Statement of Operations for the year ended March 31, 2022 are described below: |
| | CrossingBridge Low Duration High Yield Fund | | | |
| | | | Amount of Realized | |
| | | | Gain (Loss) on Derivatives | |
| | Forward Currency Exchange Contracts | | $ | 2,515,045 | |
| | Warrants | | | 21,334 | |
| | | | | |
| | | | Change in Unrealized Appreciation | |
| | | | (Depreciation) on Derivatives | |
| | Forward Currency Exchange Contracts | | $ | (748,424 | ) |
| | Warrants | | | 75,253 | |
| | | | | | |
| | CrossingBridge Responsible Credit Fund | | | | |
| | | | Amount of Realized | |
| | | | Gain (Loss) on Derivatives | |
| | Forward Currency Exchange Contracts | | $ | 134,088 | |
| | Warrants | | | (360 | ) |
| | | | | |
| | | | Change in Unrealized Appreciation | |
| | | | (Depreciation) on Derivatives | |
| | Forward Currency Exchange Contracts | | $ | (51,314 | ) |
| | Warrants | | | (224 | ) |
CROSSINGBRIDGE FUNDS
Notes to Financial Statements (Continued)
March 31, 2022 (Unaudited)
| | CrossingBridge Ultra-Short Duration Fund | | | |
| | | | Amount of Realized | |
| | | | Gain (Loss) on Derivatives | |
| | Forward Currency Exchange Contracts | | $ | 72,258 | |
| | | | | | |
| | | | Change in Unrealized Appreciation | |
| | | | (Depreciation) on Derivatives | |
| | Forward Currency Exchange Contracts | | $ | (8,538 | ) |
| | Warrants | | | 11,889 | |
| | | | | | |
| | CrossingBridge Pre-Merger SPAC ETF | | | | |
| | | | Amount of Realized | |
| | | | Gain (Loss) on Derivatives | |
| | Warrants | | $ | (10,183 | ) |
| | | | | | |
| | | | Change in Unrealized Appreciation | |
| | | | (Depreciation) on Derivatives | |
| | Warrants | | $ | (5,990 | ) |
| | (k) LIBOR |
| | |
| | The London Interbank Offered Rate (“LIBOR”) is an interest-rate average calculated from estimates submitted by the leading banks in London. LIBOR represents the rate which banks may obtain short-term borrowings from each other. It is the primary interest rate benchmark for short-term interest rates around the world. The regulator of the LIBOR administrator phased out the use of LIBOR on December 31, 2021 such that the one-week and 2-month USD LIBOR settings will cease to be published or will no longer be representative. The remaining USD LIBOR settings will cease to be published or will no longer be representative after June 30, 2023. Because the usefulness of LIBOR as a reference rate could deteriorate during the transition from LIBOR to an alternative reference rate, these effects could occur prior to June 30, 2023. |
| | |
| | The expected discontinuation of LIBOR could have a significant impact on the financial markets, and may present a risk for certain market participants, including the risk that the transition from LIBOR to alternative interest rate benchmarks will not be orderly, will occur over various time periods or will have unintended consequences. |
| | |
| (3) | Federal Tax Matters |
| | |
| | The tax character of distributions paid during the fiscal years or periods ended March 31, 2022 and September 30, 2021 were as follows: |
| | |
| | CrossingBridge Low Duration High Yield Fund |
| | | | Period Ended | | | Year Ended | |
| | | | March 31, 2022 | | | September 30, 2021 | |
| | Ordinary Income | | $ | 12,215,126 | | | $ | 7,308,862 | |
| | Long Term Capital Gain | | | — | | | | — | |
CROSSINGBRIDGE FUNDS
Notes to Financial Statements (Continued)
March 31, 2022 (Unaudited)
| | CrossingBridge Responsible Credit Fund(1) | | | | | | |
| | | | | | | | |
| | | | Period Ended | | | Period Ended | |
| | | | March 31, 2022 | | | September 30, 2021 | |
| | Ordinary Income | | $ | 250,219 | | | $ | 71,520 | |
| | Long Term Capital Gain | | | 21,525 | | | | — | |
| | | | | | | | | | |
| | CrossingBridge Ultra-Short Duration Fund(1) | | | | | | | | |
| | | | Period Ended | | | Period Ended | |
| | | | March 31, 2022 | | | September 30, 2021 | |
| | Ordinary Income | | $ | 190,973 | | | $ | — | |
| | Long Term Capital Gain | | | — | | | | — | |
| | (1) | Fund commenced investment operations on June 30, 2021. |
| | The CrossingBridge Pre-Merger SPAC ETF did not make any distributions to shareholders during the periods ended March 31, 2022 or September 30, 2021. |
| | |
| | The Funds designated as long-term capital gain dividend, pursuant to Section 852(b)(3) of the Code, the amount necessary to reduce the earnings and profits of the Fund related to net capital gain to zero for the tax year ended September 30, 2021. |
| | |
| | As of September 30, 2021, the components of accumulated earnings on a tax basis were as follows: |
| | | | CrossingBridge | | | CrossingBridge | |
| | | | Low Duration | | | Responsible | |
| | | | High Yield Fund | | | Credit Fund | |
| | Cost basis of investments for | | | | | | |
| | federal income tax purposes | | $ | 327,804,846 | | | $ | 16,659,846 | |
| | Gross tax unrealized appreciation | | $ | 2,269,336 | | | $ | 96,388 | |
| | Gross tax unrealized depreciation | | | (1,910,129 | ) | | | (45,664 | ) |
| | Total net tax unrealized appreciation | | | | | | | | |
| | (depreciation) on investments | | | 359,207 | | | | 50,724 | |
| | Undistributed ordinary income | | | 6,668,499 | | | | 23,174 | |
| | Undistributed long-term capital gain | | | — | | | | 21,525 | |
| | Other accumulated earnings (losses) | | | (458,719 | ) | | | (44,736 | ) |
| | Total distributable earnings (accumulated losses) | | $ | 6,568,987 | | | $ | 50,687 | |
| | | | | | | | | | |
| | | | CrossingBridge | | | CrossingBridge | |
| | | | Ultra-Short | | | Pre-Merger | |
| | | | Duration Fund | | | SPAC ETF | |
| | Cost basis of investments for | | | | | | | | |
| | federal income tax purposes | | $ | 40,774,290 | | | $ | 5,394,535 | |
| | Gross tax unrealized appreciation | | $ | 57,293 | | | $ | 6,955 | |
| | Gross tax unrealized depreciation | | | (54,349 | ) | | | (12,850 | ) |
| | Total net tax unrealized appreciation | | | | | | | | |
| | (depreciation) on investments | | | 2,944 | | | | (5,895 | ) |
| | Undistributed ordinary income | | | 28,003 | | | | 3,886 | |
| | Undistributed long-term capital gain | | | — | | | | — | |
| | Other accumulated earnings (losses) | | | — | | | | — | |
| | Total distributable earnings (accumulated losses) | | $ | 30,947 | | | $ | (2,009 | ) |
CROSSINGBRIDGE FUNDS
Notes to Financial Statements (Continued)
March 31, 2022 (Unaudited)
| | The difference between book-basis and tax-basis unrealized appreciation (depreciation) is attributable primarily to the tax deferral of losses on wash sale adjustments and tax treatment of Passive Foreign Investment Companies. |
| | |
| | At September 30, 2021, the Funds had no capital loss carryovers to be carried forward to offset future realized capital gains. |
| | |
| | GAAP requires that certain components of net assets relating to permanent differences be reclassified between financial and tax reporting. These reclassifications have no effect on net assets or net asset value per share. For the year or period ended September 30, 2021, no reclassifications were made for permanent tax differences on the Statements of Assets and Liabilities. |
| | |
| (4) | Investment Adviser |
| | |
| | The Trust has an investment advisory agreement with the Adviser to furnish investment advisory services to the Mutual Funds. Under the terms of this agreement, the Trust, on behalf of the Mutual Funds, compensates the Adviser for its investment advisory services at the annual rate of 0.65% of each Mutual Fund’s respective average daily net assets. |
| | |
| | In addition, pursuant to a separate investment advisory agreement between the Trust, on behalf of the ETF, and the Adviser, the Adviser is responsible for managing the ETF in accordance with its investment objectives. For the services it provides the ETF, the ETF pays the Adviser a unitary management fee, which is calculated daily and paid monthly, at an annual rate of 0.80% of the ETF’s average daily net assets. Under this agreement, the Adviser has agreed to pay all expenses of the ETF except interest charges on any borrowings, dividends, and other expenses on securities sold short, taxes, brokerage commissions and other expenses incurred in placing orders for the purchase and sale of securities and other investment instruments, acquired fund fees and expenses, accrued deferred tax liability, extraordinary expenses, distribution fees and expenses paid by the ETF under any distribution plan adopted pursuant to Rule 12b-1 under the 1940 Act, and the unified management fee payable to the Adviser. |
| | |
| | With respect to the Mutual Funds, the Adviser has contractually agreed to waive its management fee and/or reimburse a Fund’s other expenses at least through June 30, 2023 (January 31, 2023 for the CrossingBridge Low Duration High Yield Fund) to the extent necessary to ensure that a Fund’s total operating expenses (exclusive of front-end or contingent deferred sales loads, distribution (12b-1) fees, shareholder servicing plan fees, taxes, leverage (i.e., any expense incurred in connection with borrowings made by a Fund), interest, brokerage commissions, expenses incurred in connection with any merger or reorganization, dividends or interest expenses on short positions, acquired fund fees and expenses and extraordinary items) (the “Expense Limitation Cap”) does not exceed 0.80% of each Mutual Fund’s respective average daily net assets. |
| | |
| | Any such waiver or reimbursement is subject to later adjustment to allow the Adviser to recoup amounts waived or reimbursed within three years from the date such amount was waived or reimbursed, subject to the operating expense limitation |
CROSSINGBRIDGE FUNDS
Notes to Financial Statements (Continued)
March 31, 2022 (Unaudited)
| | agreement, if such reimbursement will not cause a Mutual Fund’s expense ratio, after recoupment has been taken into account, to exceed the lesser of: (1) the Expense Limitation Cap in place at the time of the waiver and/or expense payment; or (2) the Expense Limitation Cap in place at the time of the recoupment. During the six months ended March 31, 2022, the Adviser recouped $80,411 of previously waived expenses in the CrossingBridge Low Duration High Yield Fund. The following table shows the remaining waiver or reimbursed expenses for the Mutual Funds subject to potential recovery expiring: |
| | | | Expiring: | |
| | | | 9/30/22 | | | 9/30/23 | | | 9/30/24 | | | 3/31/25 | |
| | CrossingBridge Low Duration High Yield Fund | | $ | — | | | $ | 89,655 | | | $ | 75,455 | | | $ | — | |
| | CrossingBridge Responsible Credit Fund | | | — | | | | — | | | | 58,237 | | | | 91,691 | |
| | CrossingBridge Ultra-Short Duration Fund | | | — | | | | — | | | | 58,690 | | | | 71,118 | |
| (5) | Distribution and Shareholder Servicing Plans |
| | |
| | The Trust has adopted a plan pursuant to Rule 12b-1 under the 1940 Act (the “12b-1 Plan”), on behalf of the CrossingBridge Low Duration High Yield Fund, which authorizes the Fund to pay Quasar Distributors, LLC (the “Distributor”) a distribution fee of 0.25% of the Fund’s average daily net assets of the Fund’s Investor Class shares for services to prospective Fund shareholders and distribution of Fund shares. The Fund incurred no fees pursuant to the 12b-1 Plan during the year ended September 30, 2021 as the Investor Class was not operational during the year. |
| | |
| | The Mutual Funds have adopted a Shareholder Servicing Plan to pay for shareholder support services from the applicable Fund’s assets pursuant to a Shareholder Servicing Agreement in an amount not to exceed 0.15% of the applicable Fund’s average daily net assets. Currently, the shareholder servicing fee authorized for each Mutual Fund is up to 0.10%; however, the fee may be increased up to 0.15% of a Fund’s daily net assets, at any time. Each Mutual Fund is responsible for paying a portion of shareholder servicing fees to each of the shareholder servicing agents who have written shareholder servicing agreements with the Fund, and perform shareholder servicing functions and maintenance of shareholder accounts on behalf of shareholders. The following table details the fees incurred for Institutional Class shares for the Mutual Funds pursuant to the Shareholder Servicing Plan during the six months ended March 31, 2022, as well as the fees owed as of March 31, 2022. |
| | | | Fees incurred | | | Fees owed | |
| | CrossingBridge Low Duration High Yield Fund | | $ | 213,195 | | | $ | 117,726 | |
| | CrossingBridge Responsible Credit Fund | | | 8,289 | | | | 2,481 | |
| | CrossingBridge Ultra-Short Duration Fund | | | 25,710 | | | | 10,212 | |
| (6) | Related Party Transactions |
| | |
| | U.S. Bancorp Fund Services, LLC, doing business as U.S. Bank Global Fund Services (“Fund Services” or “Administrator”), acts as the Funds’ Administrator under an Administration Agreement. The Administrator prepares various federal and state regulatory filings, reports and returns for the Funds; prepares reports and materials to |
CROSSINGBRIDGE FUNDS
Notes to Financial Statements (Continued)
March 31, 2022 (Unaudited)
| | be supplied to the Trustees; monitors the activities of the Funds’ custodian, transfer agent and accountants; coordinates the preparation and payment of the Funds’ expenses and reviews the Funds’ expense accruals. Fund Services also serves as the transfer agent to the Funds and provides pricing services to the Funds. U.S. Bank, N.A. (“U.S. Bank”), an affiliate of Fund Services, serves as the Funds’ custodian. Fees incurred for the six months ended March 31, 2022, and owed as of March 31, 2022, are as follows: |
| | Fund Administration, Accounting and Pricing | | Fees incurred | | | Fees owed | |
| | CrossingBridge Low Duration High Yield Fund | | $ | 107,577 | | | $ | 42,174 | |
| | CrossingBridge Responsible Credit Fund | | | 38,185 | | | | 12,286 | |
| | CrossingBridge Ultra-Short Duration Fund | | | 39,713 | | | | 11,234 | |
| | | | | | | | |
| | Transfer Agency | | Fees incurred | | | Fees owed | |
| | CrossingBridge Low Duration High Yield Fund | | $ | 32,556 | | | $ | 13,288 | |
| | CrossingBridge Responsible Credit Fund | | | 9,933 | | | | 4,031 | |
| | CrossingBridge Ultra-Short Duration Fund | | | 11,945 | | | | 4,955 | |
| | | | | | | | |
| | Custody | | Fees incurred | | | Fees owed | |
| | CrossingBridge Low Duration High Yield Fund | | $ | 16,184 | | | $ | 4,315 | |
| | CrossingBridge Responsible Credit Fund | | | 8,392 | | | | 5,636 | |
| | CrossingBridge Ultra-Short Duration Fund | | | 7,402 | | | | 4,482 | |
| | Under the terms of a Fund Servicing Agreement, the Adviser pays the fund administration and accounting, transfer agency and custody fees for the ETF. |
| | |
| | Certain officers of the Funds are also employees of Fund Services. A Trustee of the Trust is affiliated with Fund Services and U.S. Bank. |
| | |
| | The Trust’s Chief Compliance Officer is also an employee of Fund Services. The Mutual Funds’ allocation of the Trust’s Chief Compliance Officer fees incurred for the six months ended March 31, 2022, and owed as of March 31, 2022, is as follows: |
| | | | Fees incurred | | | Fees owed | |
| | CrossingBridge Low Duration High Yield Fund | | $ | 5,828 | | | $ | 1,939 | |
| | CrossingBridge Responsible Credit Fund | | | 5,828 | | | | 1,939 | |
| | CrossingBridge Ultra-Short Duration Fund | | | 5,828 | | | | 1,939 | |
| | Under the terms of a Fund Servicing Agreement, the Adviser pays the Chief Compliance Officer fees for the ETF. |
| | |
| | The CrossingBridge Low Duration High Yield Fund also has a line of credit with U.S. Bank (See Note 11). |
CROSSINGBRIDGE FUNDS
Notes to Financial Statements (Continued)
March 31, 2022 (Unaudited)
| (7) | Capital Share Transactions |
| | |
| | Transactions in shares of the Funds were as follows: |
| | |
| | CrossingBridge Low Duration High Yield Fund |
| | | | Six months ended | | | Year ended | |
| | | | March 31, 2022 | | | September 30, 2021 | |
| | Shares sold | | | 34,633,596 | | | | 25,189,279 | |
| | Shares reinvested | | | 861,580 | | | | 571,682 | |
| | Shares redeemed | | | (8,670,683 | ) | | | (8,883,494 | ) |
| | Net Increase | | | 26,824,493 | | | | 16,877,467 | |
| | | | | | | | | | |
| | CrossingBridge Responsible Credit Fund | | | | | | | | |
| | | | | | | | Period from | |
| | | | | | | | June 30, 2021(1) | |
| | | | Six months ended | | | through | |
| | | | March 31, 2022 | | | September 30, 2021 | |
| | Shares sold | | | 176,971 | | | | 1,706,239 | |
| | Shares reinvested | | | 26,691 | | | | 7,151 | |
| | Shares redeemed | | | (186,403 | ) | | | (26,584 | ) |
| | Net Increase | | | 17,259 | | | | 1,686,806 | |
| | | | | | | | | | |
| | CrossingBridge Ultra-Short Duration Fund | | | | | | | | |
| | | | | | | | Period from | |
| | | | | | | | June 30, 2021(1) | |
| | | | Six months ended | | | through | |
| | | | March 31, 2022 | | | September 30, 2021 | |
| | Shares sold | | | 2,891,360 | | | | 3,703,466 | |
| | Shares reinvested | | | 2,046 | | | | — | |
| | Shares redeemed | | | (329,165 | ) | | | (3 | ) |
| | Net Increase | | | 2,564,241 | | | | 3,703,463 | |
| | | | | | | | | | |
| | CrossingBridge Pre-Merger SPAC ETF | | | | | | | | |
| | | | | | | | Period from | |
| | | | | | | | June 30, 2021(1) | |
| | | | Six months ended | | | through | |
| | | | March 31, 2022 | | | September 30, 2021 | |
| | Shares sold | | | 2,390,000 | | | | 290,000 | |
| | Shares reinvested | | | — | | | | — | |
| | Shares redeemed | | | (40,000 | ) | | | — | |
| | Net Increase | | | 2,350,000 | | | | 290,000 | |
| | (1) | Commencement of operations. |
| (8) | Creation and Redemption Transactions |
| | |
| | Shares of the CrossingBridge Pre-Merger SPAC ETF are listed and traded on the NASDAQ Stock Market, LLC (the “Exchange”). The ETF issues and redeems shares |
CROSSINGBRIDGE FUNDS
Notes to Financial Statements (Continued)
March 31, 2022 (Unaudited)
| | on a continuous basis at NAV only in large blocks of shares called “Creation Units.” Creation Units are to be issued and redeemed principally in kind for a basket of securities and a balancing cash amount. Shares generally will trade in the secondary market in amounts less than a Creation Unit at market prices that change throughout the day. Market prices for the shares may be different from their NAV. The NAV is determined as of the close of trading (generally, 4:00 p.m. Eastern Time) on each day the NYSE is open for trading. The NAV of the shares of the Fund will be equal to the ETF’s total assets minus the ETF’s total liabilities divided by the total number of shares outstanding. The NAV that is published will be rounded to the nearest cent; however, for purposes of determining the price of Creation Units, the NAV will be calculated to five decimal places. |
| | |
| | Only “Authorized Participants” may purchase or redeem shares directly from the ETF. An Authorized Participant is either (i) a broker-dealer or other participant in the clearing process through the Continuous Net Settlement System of National Securities Clearing Corporation or (ii) a DTC participant and, in each case, must have executed a Participant Agreement with the Distributor. Most retail investors will not qualify as Authorized Participants or have the resources to buy and sell whole Creation Units. Therefore, they will be unable to purchase or redeem the shares directly from the ETF. Rather, most retail investors will purchase shares in the secondary market with the assistance of a broker and will be subject to customary brokerage commissions or fees. Securities received or delivered in connection with in-kind creates and redeems are valued as of the close of business on the effective date of the creation or redemption. |
| | |
| | Creation Unit Transaction Fee |
| | Authorized Participants will be required to pay to the Custodian a fixed transaction fee (the “Creation Transaction Fee”) in connection with the issuance of Creation Units. The standard Creation Transaction Fee will be the same regardless of the number of Creation Units purchased by an investor on the applicable Business Day. The Creation Transaction Fee for the ETF is $300. |
| | |
| | An additional variable fee of up to a maximum of 2% of the value of the Creation Units subject to the transaction may be imposed for cash purchases, nonstandard orders, or partial purchase of Creation Units. For orders comprised entirely of cash, a variable fee of 0.03% of the value of the order will be charged by the ETF. The variable charge is primarily designed to cover additional costs (e.g., brokerage, taxes) involved with buying the securities with cash. The ETF may determine to not charge a variable fee on certain orders when the Adviser has determined that doing so is in the best interests of ETF shareholders. |
| | |
| | A creation unit will generally not be issued until the transfer of good title of the deposit securities to the ETF and the payment of any cash amounts have been completed. To the extent contemplated by the applicable participant agreement, Creation Units of the ETF will be issued to such authorized participant notwithstanding the fact that the ETF’s deposits have not been received in part or in whole, in reliance on the undertaking of the authorized participant to deliver the missing deposit securities as |
CROSSINGBRIDGE FUNDS
Notes to Financial Statements (Continued)
March 31, 2022 (Unaudited)
| | soon as possible. If the ETF or its agents do not receive all of the deposit securities, or the required cash amounts, by such time, then the order may be deemed rejected and the authorized participant shall be liable to the ETF for losses, if any. |
| | |
| (9) | Investment Transactions |
| | |
| | The aggregate purchases and sales of securities, excluding short-term investments, for the six months ended March 31, 2022 are summarized below: |
| | | | Purchases | | | Sales | |
| | CrossingBridge Low Duration High Yield Fund | | $ | 364,997,358 | | | $ | 195,079,147 | |
| | CrossingBridge Responsible Credit Fund | | | 12,988,001 | | | | 11,609,599 | |
| | CrossingBridge Ultra-Short Duration Fund | | | 39,369,312 | | | | 25,384,738 | |
| | CrossingBridge Pre-Merger SPAC ETF | | | 109,521,254 | | | | 58,393,000 | |
| | The above purchases and sales exclude any in-kind transactions associated with creations and redemptions. During the six months ended March 31, 2022, the CrossingBridge Pre-Merger SPAC had $10,669,262 of creations in-kind and $2,645,261 of redemptions in-kind. |
| | |
| | There were no purchases or sales of U.S. government securities in the Funds. |
| | |
| (10) | Beneficial Ownership |
| | |
| | The beneficial ownership, either directly or indirectly, of more than 25% of the voting securities of a Fund creates a presumption of control of the Fund, under Section 2(a)(9) of the 1940 Act. At March 31, 2022, Charles Schwab & Co., Inc. held 43.45% and 83.38% of the CrossingBridge Low Duration High Yield Fund and CrossingBridge Responsible Credit Fund, respectively. National Financial Services LLC held 91.86% of the CrossingBridge Ultra-Short Duration Fund at March 31, 2022. There were no beneficial shareholders in the CrossingBridge Pre-Merger SPAC ETF at March 31, 2022. |
| | |
| (11) | Line of Credit |
| | |
| | At March 31, 2022, the CrossingBridge Low Duration High Yield Fund had a line of credit in the amount of the lesser of $15,000,000 or 33 1/3% of the fair value of unencumbered assets of the Fund, as defined, which matures on August 6, 2022. The unsecured line of credit is intended to provide short-term financing, if necessary, subject to certain restrictions, in connection with shareholder redemptions. The credit facility is with the Funds’ custodian, U.S. Bank, N.A. Interest will be accrued at the prime rate (3.50% as of March 31, 2022). During the six months ended March 31, 2022, the CrossingBridge Low Duration High Yield Fund did not utilize the line of credit. |
| | |
| (12) | Subsequent Events |
| | |
| | In preparing these financial statements, the Funds have evaluated events and transactions for potential recognition or disclosure through the date the financial statements were issued. |
CROSSINGBRIDGE FUNDS
Notes to Financial Statements (Continued)
March 31, 2022 (Unaudited)
| | On April 28, 2022, the CrossingBridge Low Duration High Yield Fund, CrossingBridge Responsible Credit Fund and CrossingBridge Ultra-Short Duration Fund declared and paid an income distribution of $1,047,208, $44,609 and $59,624, respectively, to their Institutional Class shareholders of record on April 27, 2022. |
| | |
| | On May 27, 2022, the CrossingBridge Low Duration High Yield Fund, CrossingBridge Responsible Credit Fund and CrossingBridge Ultra-Short Duration Fund declared and paid income distributions to their Institutional Class shareholders of record on May 26, 2022. The amounts were not finalized as of the date of this report being released. |
| | |
| (13) | Recent Market Events |
| | |
| | U.S. and international markets have experienced significant periods of volatility in recent years and months due to a number of economic, political and global macro factors including the impact of COVID-19 as a global pandemic and related public health crisis, growth concerns in the U.S. and overseas, uncertainties regarding interest rates, rising inflation, trade tensions, and the threat of tariffs imposed by the U.S. and other countries. In particular, the global spread of COVID-19 has resulted in disruptions to business operations and supply chains, stress on the global healthcare system, growth concerns in the U.S. and overseas, staffing shortages and the inability to meet consumer demand, and widespread concern and uncertainty. The global recovery from COVID-19 is proceeding at slower than expected rates due to the emergence of variant strains and may last for an extended period of time. Health crises and related political, social and economic disruptions caused by the spread of COVID-19 may also exacerbate other pre-existing political, social and economic risks in certain countries. As a result of continuing political tensions and armed conflicts, including the war between Ukraine and Russia, the U.S. and the European Union imposed sanctions on certain Russian individuals and companies, including certain financial institutions, and have limited certain exports and imports to and from Russia. The war has contributed to recent market volatility and may continue to do so. These developments, as well as other events, could result in further market volatility and negatively affect financial asset prices, the liquidity of certain securities and the normal operations of securities exchanges and other markets, despite government efforts to address market disruptions. Continuing market volatility as a result of recent market conditions or other events may have adverse effects on your account. |
CROSSINGBRIDGE FUNDS
Additional Information
(Unaudited)
Results of Shareholder Meeting
A Special Joint Meeting of Shareholders (the “Meeting”) took place on April 6, 2022. The Meeting was held for all series in the Trust. All Trust shareholders of record, in the aggregate across all series of the Trust, were entitled to attend or submit proxies. As of the record date, February 7, 2022, the Trust had 534,673,511 shares outstanding. The results of the voting for the proposals were as follows:
Proposal 1: To approve the election of four Trustees to the Board of Trustees of the Trust to serve until his or her successor is elected and qualified.
| | For Votes | Votes Withheld | Broker Non-Vote |
| Vincent P. Lyles | 465,453,094 | 2,962,687 | 15,025,189 |
| Erik K. Olstein | 465,703,874 | 2,711,906 | 15,025,189 |
| Lisa Zúñiga Ramírez | 465,728,682 | 2,662,552 | 15,025,189 |
| Gregory M. Wesley | 465,394,219 | 2,984,741 | 15,025,189 |
Accordingly, effective April 6, 2022, the Board of Trustees of Trust for Professional Managers consists of the following individuals, each of whom have been elected by shareholders:
Michael D. Akers, Independent Trustee
Gary A. Drska, Independent Trustee
Vincent P. Lyles, Independent Trustee
Erik K. Olstein, Independent Trustee
Lisa Zúñiga Ramírez, Independent Trustee
Gregory M. Wesley, Independent Trustee
Joseph C. Neuberger, Interested Trustee
Proposal 2: To approve one or more adjournments of the Special Meeting to a later date to solicit additional proxies.
| | For Votes | Votes Against | Votes Abstained |
| | 476,848,750 | 2,932,139 | 3,647,484 |
Tax Information
For the fiscal year or period ended September 30, 2021, 0% of the Funds’ taxable ordinary income distributions were designated as short-term capital gain distributions under Section 871(k) of the Code.
For the fiscal year or period ended September 30, 2021, certain dividends paid by the Funds may be subject to a maximum tax rate of 20%, as provided for by the Jobs and Growth Tax Relief Reconciliation Act of 2003. The percentage of dividends declared from ordinary income designated as qualified dividend income was 0.38% for the CrossingBridge Low Duration High Yield Fund and 0% for the other Funds.
For corporate shareholders, the percent of ordinary income distributions qualifying for the corporate dividends received deduction for the fiscal year or period ended September 30, 2021, was 0.38% for the CrossingBridge Low Duration High Yield Fund and 0% for the other Funds.
CROSSINGBRIDGE FUNDS
Additional Information (Continued)
(Unaudited)
Indemnifications
Under the Trust’s organizational documents, its Officers and Trustees are indemnified against certain liabilities arising out of the performance of their duties to the Funds. In addition, in the normal course of business, the Funds enter into contracts that provide general indemnifications to other parties. A Fund’s maximum exposure under these arrangements is unknown as this would involve future claims that may be made against the Funds that have not yet occurred. However, the Funds have not had prior claims or losses pursuant to these contracts and expects the risk of loss to be remote.
Information about Trustees
The business and affairs of the Trust are managed under the direction of the Board of Trustees. Information pertaining to the Trustees of the Trust is set forth below. The Statement of Additional Information includes additional information about the Trustees and is available, without charge, upon request by calling 1-888-898-2780.
| | | | | | Other |
| | | | | | Directorships |
| | | | Number of | | Held by |
| | | Term of | Portfolios | Principal | Trustee |
| Name, | Position(s) | Office and | in the Trust | Occupation(s) | During |
| Address and | Held with | Length of | Overseen | During the Past | the Past |
Year of Birth | the Trust | Time Served | by Trustee | Five Years | Five Years |
| Independent Trustees | | | | | |
| | | | | | |
| Michael D. | Trustee | Indefinite | 23 | Professor | Independent |
| Akers, Ph.D. | | Term; Since | | Emeritus, | Trustee, USA |
| 615 E. Michigan St. | | August 22, | | Department of | MUTUALS |
| Milwaukee, WI 53202 | | 2001 | | Accounting | (an open-end |
| Year of Birth: 1955 | | | | (June 2019- | investment |
| | | | | present); | company |
| | | | | Professor, | (2001-2021). |
| | | | | Department of | |
| | | | | Accounting | |
| | | | | (2004-2019); | |
| | | | | Chair, | |
| | | | | Department | |
| | | | | of Accounting | |
| | | | | (2004-2017), | |
| | | | | Marquette | |
| | | | | University. | |
| | | | | | |
| Gary A. Drska | Trustee | Indefinite | 23 | Retired; | Independent |
| 615 E. Michigan St. | | Term; Since | | Former Pilot, | Trustee, USA |
| Milwaukee, WI 53202 | | August 22, | | Frontier/Midwest | MUTUALS |
| Year of Birth: 1956 | | 2001 | | Airlines, Inc. | (an open-end |
| | | | | (airline company) | investment |
| | | | | (1986–2021). | company |
| | | | | | (2001-2021). |
CROSSINGBRIDGE FUNDS
Additional Information (Continued)
(Unaudited)
| | | | | | Other |
| | | | | | Directorships |
| | | | Number of | | Held by |
| | | Term of | Portfolios | Principal | Trustee |
| Name, | Position(s) | Office and | in the Trust | Occupation(s) | During |
| Address and | Held with | Length of | Overseen | During the Past | the Past |
Year of Birth | the Trust | Time Served | by Trustee | Five Years | Five Years |
| Interested Trustee and Officers | | | | | |
| | | | | | |
| Joseph C. Neuberger* | Chairperson | Indefinite | 23 | President | Trustee, Buffalo |
| 615 E. Michigan St. | and | Term; Since | | (2017–present), | Funds (an |
| Milwaukee, WI 53202 | Trustee | August 22, | | Chief | open-end |
| Year of Birth: 1962 | | 2001 | | Operating | investment |
| | | | | Officer | company) |
| | | | | (2016–2020), | (2003-2017); |
| | | | | Executive Vice | Trustee, USA |
| | | | | President | MUTUALS |
| | | | | (1994–2017), | (an open-end |
| | | | | U.S. Bancorp | investment |
| | | | | Fund Services, | company) |
| | | | | LLC. | (2001-2018). |
| | | | | | |
| John P. Buckel | President | Indefinite | N/A | Vice President, | N/A |
| 615 E. Michigan St. | and | Term; Since | | U.S. Bancorp | |
| Milwaukee, WI 53202 | Principal | January 24, | | Fund Services, | |
| Year of Birth: 1957 | Executive | 2013 | | LLC (2004– | |
| | Officer | | | present). | |
| | | | | | |
| Jennifer A. Lima | Vice | Indefinite | N/A | Vice President, | N/A |
| 615 E. Michigan St. | President, | Term; Since | | U.S. Bancorp | |
| Milwaukee, WI 53202 | Treasurer | January 24, | | Fund Services, | |
| Year of Birth: 1974 | and | 2013 | | LLC (2002– | |
| | Principal | | | present). | |
| | Financial | | | | |
| | and | | | | |
| | Accounting | | | | |
| | Officer | | | | |
| * | Mr. Neuberger is deemed to be an “interested person” of the Trust as defined by the 1940 Act due to his position and material business relationship with the Trust. |
CROSSINGBRIDGE FUNDS
Additional Information (Continued)
(Unaudited)
| | | | | | Other |
| | | | | | Directorships |
| | | | Number of | | Held by |
| | | Term of | Portfolios | Principal | Trustee |
| Name, | Position(s) | Office and | in the Trust | Occupation(s) | During |
| Address and | Held with | Length of | Overseen | During the Past | the Past |
Year of Birth | the Trust | Time Served | by Trustee | Five Years | Five Years |
| Deanna B. Marotz | Chief | Indefinite | N/A | Senior Vice | N/A |
| 615 E. Michigan St. | Compliance | Term; Since | | President, U.S. | |
| Milwaukee, WI 53202 | Officer, | October 21, | | Bancorp Fund | |
| Year of Birth: 1965 | Vice | 2021 | | Services, LLC | |
| | President | | | (2021 – present); | |
| | and Anti- | | | Chief Compliance | |
| | Money | | | Officer of Keeley- | |
| | Laundering | | | Teton Advisors, | |
| | Officer | | | LLC and Teton | |
| | | | | Advisors, Inc. | |
| | | | | (since 2017); | |
| | | | | Chief Compliance | |
| | | | | Officer of Keeley | |
| | | | | Asset Management | |
| | | | | Corp. (2015-2017). | |
| | | | | | |
| Jay S. Fitton | Secretary | Indefinite | N/A | Assistant Vice | N/A |
| 615 E. Michigan St. | | Term; Since | | President, U.S. | |
| Milwaukee, WI 53202 | | July 22, | | Bancorp Fund | |
| Year of Birth: 1970 | | 2019 | | Services, LLC | |
| | | | | (2019-present); | |
| | | | | Partner, Practus, | |
| | | | | LLP (2018-2019); | |
| | | | | Counsel, Drinker | |
| | | | | Biddle & Reath LLP | |
| | | | | (2016-2018). | |
| | | | | | |
| Kelly A. Strauss | Assistant | Indefinite | N/A | Assistant Vice | N/A |
| 615 E. Michigan St. | Treasurer | Term; Since | | President, U.S. | |
| Milwaukee, WI 53202 | | April 23, | | Bancorp Fund | |
| Year of Birth: 1987 | | 2015 | | Services, LLC | |
| | | | | (2011–present). | |
| | | | | | |
| Melissa Aguinaga | Assistant | Indefinite | N/A | Assistant Vice | N/A |
| 615 E. Michigan St. | Treasurer | Term; Since | | President, U.S. | |
| Milwaukee, WI 53202 | | July 1, | | Bancorp Fund | |
| Year of Birth: 1987 | | 2015 | | Services, LLC | |
| | | | | (2010–present). | |
| | | | | | |
| Laura Carroll | Assistant | Indefinite | N/A | Assistant Vice | N/A |
| 615 E. Michigan St. | Treasurer | Term; Since | | President, U.S. | |
| Milwaukee, WI 53202 | | August 20, | | Bancorp Fund | |
| Year of Birth: 1985 | | 2018 | | Services, LLC | |
| | | | | (2007–present). | |
A NOTE ON FORWARD LOOKING STATEMENTS (Unaudited)
Except for historical information contained in this report for the Funds, the matters discussed in this report may constitute forward-looking statements made pursuant to the safe-harbor provisions of the Private Securities Litigation Reform Act of 1995. These include any adviser or portfolio manager predictions, assessments, analyses or outlooks for individual securities, industries, market sectors and/or markets. These statements involve risks and uncertainties. In addition to the general risks described for the Funds in the current Prospectus, other factors bearing on this report include the accuracy of the adviser’s or portfolio managers’ forecasts and predictions, and the appropriateness of the investment programs designed by the adviser or portfolio managers to implement their strategies efficiently and effectively. Any one or more of these factors, as well as other risks affecting the securities markets and investment instruments generally, could cause the actual results of a Fund to differ materially as compared to benchmarks associated with the Fund.
ADDITIONAL INFORMATION (Unaudited)
The Funds have adopted proxy voting policies and procedures that delegate to the Adviser the authority to vote proxies. A description of the Funds’ proxy voting policies and procedures is available without charge, upon request, by calling the Funds’ toll free at 1-888-898-2780. A description of these policies and procedures is also included in a Fund’s Statement of Additional Information, which is available on the SEC’s website at http://www.sec.gov.
A Fund’s proxy voting record for the most recent 12-month period ended June 30 (as applicable) is available without charge, upon request, by calling, toll free, 1-888-898-2780, or by accessing the SEC’s website at http://www.sec.gov.
The Funds file their complete schedules of portfolio holdings with the SEC for the first and third quarters of each fiscal year on Part F of Form N-PORT. Shareholders may view a Fund’s filings (as applicable) on the SEC’s website at www.sec.gov.
HOUSEHOLDING (Unaudited)
In an effort to decrease costs, the Funds intend to reduce the number of duplicate prospectuses and certain other shareholder documents you receive by sending only one copy of each to those addresses shared by two or more accounts and to shareholders the Funds reasonably believes are from the same family or household. Once implemented, if you would like to discontinue householding for your accounts, please call toll-free at 1-888-898-2780 to request individual copies of these documents. Once a Fund receives notice to stop householding, the Fund will begin sending individual copies 30 days after receiving your request. This policy does not apply to account statements.
FREQUENCY DISTRIBUTION OF PREMIUMS AND DISCOUNTS (Unaudited)
Information regarding how often shares of the CrossingBridge Pre-Merger SPAC ETF trade on an exchange at a price above (i.e., at a premium) or below (i.e., at a discount) the NAV of the ETF is available without charge, on the ETF’s website at www.crossingbridgefunds.com.
CROSSINGBRIDGE FUNDS
| Investment Adviser | CrossingBridge Advisors, LLC |
| | 427 Bedford Road |
| | Suite 220 |
| | Pleasantville, New York 10570 |
| | |
| Legal Counsel | Godfrey & Kahn, S.C. |
| | 833 East Michigan Street, Suite 1800 |
| | Milwaukee, Wisconsin 53202 |
| | |
| Independent Registered Public | Cohen & Company, Ltd. |
| Accounting Firm | 342 North Water Street, Suite 830 |
| | Milwaukee, Wisconsin 53202 |
| | |
| Transfer Agent, Fund Accountant and | U.S. Bancorp Fund Services, LLC |
| Fund Administrator | 615 East Michigan Street |
| | Milwaukee, Wisconsin 53202 |
| | |
| Custodian | U.S. Bank, N.A. |
| | Custody Operations |
| | 1555 North River Center Drive |
| | Milwaukee, Wisconsin 53212 |
| | |
| Distributors | Quasar Distributors, LLC |
| | 111 East Kilbourn Avenue, Suite 1250 |
| | Milwaukee, Wisconsin 53202 |
| | |
| | Foreside Fund Services, LLC |
| | Three Canal Plaza, Suite 100 |
| | Portland, Maine 04101 |
This report is intended for shareholders of the Funds and may not be used as sales literature unless preceded or accompanied by a current prospectus.
(b) Not applicable.
Item 2. Code of Ethics.
Not applicable for semi-annual reports.
Item 3. Audit Committee Financial Expert.
Not applicable for semi-annual reports.
Item 4. Principal Accountant Fees and Services.
Not applicable for semi-annual reports.
Item 5. Audit Committee of Listed Registrants.
Not applicable to registrants who are not listed issuers (as defined in Rule 10A-3 under the Securities Exchange Act of 1934).
Item 6. Investments.
(a) | Schedule of Investments is included as part of the report to shareholders filed under Item 1 of this Form. |
Item 7. Disclosure of Proxy Voting Policies and Procedures for Closed-End Management Investment Companies.
Not applicable to open-end investment companies.
Item 8. Portfolio Managers of Closed-End Management Investment Companies.
Not applicable to open-end investment companies.
Item 9. Purchases of Equity Securities by Closed‑End Management Investment Company and Affiliated Purchasers.
Not applicable to open-end investment companies.
Item 10. Submission of Matters to a Vote of Security Holders.
There have been no material changes to the procedures by which shareholders may recommend nominees to the registrant’s board of trustees.
Item 11. Controls and Procedures.
(a) | The Registrant’s President and Treasurer have reviewed the Registrant's disclosure controls and procedures (as defined in Rule 30a-3(c) under the Investment Company Act of 1940 (the “Act”)) as of a date within 90 days of the filing of this report, as required by Rule 30a-3(b) under the Act and Rules 13a-15(b) or 15d‑15(b) under the Securities Exchange Act of 1934. Based on their review, such officers have concluded that the disclosure controls and procedures are effective in ensuring that information required to be disclosed in this report is appropriately recorded, processed, summarized and reported and made known to them by others within the Registrant and by the Registrant’s service provider. |
(b) | There were no changes in the Registrant's internal control over financial reporting (as defined in Rule 30a-3(d) under the Act) that occurred during the last fiscal half-year of the period covered by this report that has materially affected, or is reasonably likely to materially affect, the Registrant's internal control over financial reporting. |
Item 12. Disclosure of Securities Lending Activities for Closed-End Management Investment Companies
Not applicable to open-end investment companies.
Item 13. Exhibits.
(a) | (1) Any code of ethics or amendment thereto, that is the subject of the disclosure required by Item 2, to the extent that the registrant intends to satisfy Item 2 requirements through filing an exhibit. Not applicable. |
(3) Any written solicitation to purchase securities under Rule 23c‑1 under the Act sent or given during the period covered by the report by or on behalf of the registrant to 10 or more persons. Not applicable to open-end investment companies.
(4) Change in the registrant’s independent public accountant. There was no change in the registrant’s independent public accountant for the period covered by this report.
SIGNATURES
Pursuant to the requirements of the Securities Exchange Act of 1934 and the Investment Company Act of 1940, the registrant has duly caused this report to be signed on its behalf by the undersigned, thereunto duly authorized.
(Registrant) Trust for Professional Managers
By (Signature and Title)* /s/ John Buckel
John Buckel, President
Date: 6/1/2022
Pursuant to the requirements of the Securities Exchange Act of 1934 and the Investment Company Act of 1940, this report has been signed below by the following persons on behalf of the registrant and in the capacities and on the dates indicated.
By (Signature and Title)* /s/ John Buckel
John Buckel, President
Date: 6/1/2022
By (Signature and Title)* /s/ Jennifer Lima
Jennifer Lima, Treasurer
Date: 6/1/2022
* Print the name and title of each signing officer under his or her signature.