Semi-Annual Report | February 28, 2022
Performance Trust Strategic Bond Fund
(Symbols: PTIAX, PTAOX, PTCOX),
Performance Trust Municipal Bond Fund
(Symbols: PTIMX, PTRMX) and
Performance Trust Credit Fund
(Symbol: PTCRX)
© 2022 PT Asset Management, LLC. All Rights Reserved.
LETTER FROM THE INVESTMENT ADVISER
Dear Fellow Shareholders:
Institutional Class of Performance Trust Strategic Bond Fund (PTIAX)
Semi-Annual Management Discussion and Analysis
For the six-month period ended February 28, 2022, the Institutional Class of Performance Trust Strategic Bond Fund (“PTIAX” or the “Fund”) posted a return of -3.03%, assuming all dividends were reinvested into the Fund. The Bloomberg U.S. Aggregate Bond Index (“Index”) returned -4.07%, and the Morningstar Intermediate Core-Plus Bond Fund category returned -4.10% over the same period.
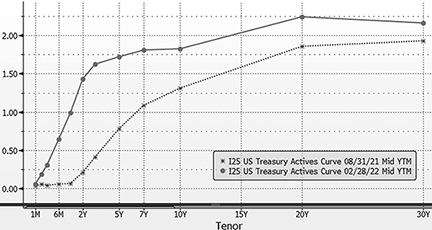
Interest rates rose significantly during the period with Treasury yield increases accelerating during the final two months in January and February. The Treasury selloff was most intense at the front end of the curve with 2-year Treasuries up 122 basis points (1.22%) while 10-year Treasuries were up 52 basis points (0.52%). The rise in interest rates coincided with weak performance in equity markets and significantly wider credit spreads. Risk markets became increasing concerned with rising inflation, the impending rate hike cycle, and Russia’s invasion of Ukraine.
The graph below shows the Treasury yield curve at the beginning and ends of the period.
Breaking down the performance within the Fund, our structured credit sectors were the best performing asset classes. Collateralized Loan Obligations (CLOs) and Non-Agency Residential Mortgage Backed Securities (RMBS) both produced slightly positive total returns during the period. Commercial Mortgage Backed Securities (CMBS) delivered negative returns, but contributed meaningfully to the Fund’s outperformance of the Index. These sectors tend to have less interest rate sensitivity as a result of having lower duration or, in the case of most CLOs and some RMBS and CMBS, having floating rate coupons. Tax-Exempt Municipal bonds contributed negative returns, but also contributed to the Fund’s outperformance of the Index.
Our other larger allocations to Taxable Municipal, Corporate, and Treasury bonds were relatively in line with the Index, detracting slightly from the Fund’s relative performance. The combination of Tax-Exempt Municipal bonds outperforming other long duration sectors within the Index and strong relative performance from the Fund’s structured credit sectors resulted in meaningful outperformance relative to the Index.
The Fund reduced its allocation to CLOs and RMBS during the period. While these less interest rate-sensitive sectors performed admirably during the period, by the end of the period, interest rates had risen and credit spreads had widened significantly within CMBS, Investment Grade (IG), and High Yield (HY) bonds. This prompted a shift into these three sectors at valuations that we believed were much more attractive going forward.
LETTER FROM THE INVESTMENT ADVISER
After a strong performance in fiscal 2021, Tax-Exempt Municipal bonds’ continued strong performance relative to taxable alternatives during the period has further diminished their relative attractiveness in our opinion. As such, we continued to favor Taxable Municipal, IG Corporates, US Treasuries, and highly rated CMBS to Tax-Exempt Municipal bonds when taking interest rate risk.
| | SECTOR | 8/31/2021 | 2/28/2022 | |
| | Non-Agency RMBS | 12.0% | 10.4% | |
| | CLOs | 9.8% | 7.1% | |
| | CMBS | 22.0% | 25.6% | |
| | ABS | 0.5% | 0.4% | |
| | Sub-total Structured Credit | 44.3%
| 43.5%
| |
| | Cash | 2.5% | 1.4% | |
| | Government Security & Agency Issue | 3.4% | 2.7% | |
| | Investment Grade Corporates | 14.0% | 18.2% | |
| | High Yield | 2.9% | 5.7% | |
| | Taxable Municipals | 21.1% | 22.3% | |
| | Tax-Exempt Municipals | 11.8% | 6.2% | |
Looking Forward
When interest rate moves are as pronounced and rapid as what we saw during the period, it often takes the market time to adjust. Not only are rates higher, credit spreads are sharply wider, and yield curves are much flatter. Guided by our methodology, we will steer the more interest rate-sensitive portion of the portfolio into those sectors that offer the best total returns across a spectrum of potential interest rate environments. We believe Taxable Municipals, IG corporates, U.S. Treasuries, and highly rated CMBS will likely be favored relative to Tax-Exempt Municipals unless the relative value landscape changes meaningfully. We will also continue to prudently add higher yielding structured credit and corporate securities to take advantage of widening spreads and, in our opinion, much stronger total return prospects.
LETTER FROM THE INVESTMENT ADVISER
Institutional Class of Performance Trust Municipal Bond Fund (PTIMX)
Semi-Annual Management Discussion of Fund Performance
Over the six-month period ended February 28, 2022, Performance Trust Municipal Bond Fund – Institutional Class (“PTIMX” or the “Fund”) returned -3.14%, modestly underperforming the Bloomberg Municipal Bond Index (“Index”) return of -3.09%. Interest rates rose aggressively during the period resulting in negative returns for both the Fund and the Index. While we hate to report underperformance, we have stated many times in these commentaries that PTIMX tends to carry more duration than the Index making the Fund a little more sensitive to movements in interest rates. We regard it as something of a victory to have nearly tied the Index into such an aggressive short-term increase in rates. The 10-year spot on the municipal bond yield curve increased more than 60 basis points (0.60%), while yields on the longer end of the curve rose by around 45 basis points (0.45%).
Among the reasons that we are comfortable carrying more duration than the Index is that we are confident in the stability of that duration, which we regard as equally important as the absolute number at any given time. We have stayed very disciplined in our coupon preference (mostly 5.0% coupons), which helps to protect the Fund’s portfolio from extension risk as interest rates rise. The duration of bonds can, in fact, change if optionality is involved. Lower coupon bonds are much more likely to experience increasing durations, and thus increasing interest rate risk, as rates rise. While this phenomenon only had modest impact during this most recent period, we have reached an absolute level of rates that makes extension risk much more likely if rates should rise further. Many 3.0% and even 4.0% coupon bonds could extend meaningfully.
The Fund grew by roughly $66.0 million over the six-month period, from $875.0 million in assets to $941.0 million. Most of those inflows were invested in high credit quality bonds, often essential purpose revenue bonds, pricing in steeper parts of the yield curve. We have also begun to target some assets that have bounced back particularly well from the worst of the Covid-19 pandemic, such as airports. Some of our largest purchases during the period, for example, were in large hub airports including Salt Lake City, Tampa, Hawaii, and San Diego.
Over the past six months we have seen a general strengthening in municipal credits. Much of this is certainly a normalizing of the economy as we have emerged from Covid-19, but also much of the federal stimulus money that has flowed has found its way onto the balance sheets of municipalities. Much of the money from the CARES Act passed in 2020 ($2.0+ trillion), and the American Rescue Plan (ARPA) in March of 2021 (just under $2.0 trillion), was specifically intended for state and local governments, hospitals and airports. All of this has been a credit positive even for the municipal market. During 2021, credit upgrades outpaced downgrades 73.0% to 27.0% according to Moody’s Investor Service. Of course, the invasion of Ukraine in late February has caused tremendous volatility in all financial markets, and while the municipal market was not immune, it remains an island of relative stability and we believe that fundamental credit quality across most municipal sectors is very strong.
As rates have risen PTIMX has taken the opportunity to shore up call protection to more completely lock in higher yields. We have swapped out of many bonds, for example, with calls that have deteriorated into the six-to-eight-year range, and back into bonds with a full ten years of call protection. While we don’t speculate on the direction or magnitude of rate changes, when rates rise by some amount, we know we are that much closer to peak levels of rates. This is something we typically do into rising rate events, and we see no reason not to do so this time as well.
As we look ahead, we expect many of our portfolio strategies to remain consistent: extending into higher rates (shortening into lower rates), adding taxable exposure as justified, taking advantage of wider pre-pandemic spreads in the high yield sector, focus on higher coupons to mitigate extension risk, and position ourselves on the 20-25-year portion of the yield curve to take advantage of return that occurs over the course of a medium-term horizon. As we enter a more challenging rate environment, we continue to stress the importance of a target horizon. Our Shape Management process evaluates total return outcomes over various interest rate scenarios. Shape Management also emphasizes forms of return that require the passage of time, such as, income, spread widening, and rolling the yield curve. This methodology provides a stable, systematic approach even when markets become volatile.
LETTER FROM THE INVESTMENT ADVISER
Institutional Class of Performance Trust Credit Fund (PTCRX)
Semi-Annual Management Discussion and Analysis
For the six-month period ended February 28, 2022, the Institutional Class of Performance Trust Credit Fund (“PTCRX” or the “Fund”) posted a return of -2.57%, assuming all dividends were reinvested into the Fund. The Bloomberg
U.S. Aggregate Bond Index (“Index”) returned -4.07% over the same time, and the Morningstar Multisector U.S. Bond category returned -3.38%.
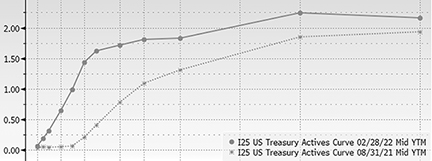
Interest rates rose significantly during the period. The shorter end of the curve was more impacted with the 2-year Treasury rising 122 basis points (1.22%) while the 10-year and 30-year Treasuries rose 52 basis points (0.52%) and 23 basis points (0.23%), respectively. These interest rate moves have caused the curve to flatten significantly with the spread between the 10-year and 2-year Treasuries now at 40 basis points (0.40%). Credit spreads were also wider during the period as the impact of the latest COVID-19 variant, anticipated Fed action due to persistently high inflation, and geopolitical risks weighed on markets.
The graph below shows the Treasury yield curve at the beginning and end of the period.
Source: Bloomberg
Collateralized Loan Obligations (CLOs) and Non-Agency Residential Mortgage-Backed Securities (RMBS) were the best performing sectors during the period, delivering positive total returns. CLOs benefited from strong carry and, as uncapped floating rate securities, were relatively unimpacted by the large interest rate moves. Additionally, CLOs, and other floating-rate instruments in general, saw strong investor demand as the market began pricing in additional Fed hikes. Non-Agency RMBS benefited from modest spread widening along with the amortizing nature of the sector. Taxable Municipals were roughly unchanged as tighter spreads offset the move in interest rates. Commercial Mortgage-Backed Securities (CMBS), Treasuries, Investment Grade Corporates (IG Corporates), High Yield Corporates (HY Corporates), and Tax-Exempt Municipals all detracted from performance during the period as a result of higher interest rates and wider credit spreads.
The combination of positive total returns from portions of the Fund’s structured credit sectors, resilience to interest rate moves in our Municipal and CMBS sectors, along with lower weightings to Treasuries and IG Corporates compared to the Index resulted in the Fund’s significant outperformance of the Index.
LETTER FROM THE INVESTMENT ADVISER
A flatter interest rate curve makes it less efficient to take interest rate risk. This coupled with wider credit spreads, has led the Fund to increase its allocation to credit risk, specifically in HY Corporates and CMBS. HY Corporate spreads have widened the most compared to other sectors and are now pricing at meaningful discounts to par which has created a more balanced risk/reward profile. This allocation has largely replaced the Fund’s exposure to Municipals which have performed relatively well over the past six months. Within structured credit, CMBS allocations have replaced CLOs and Non-Agency RMBS as the latter have outperformed and forward looking returns look relatively less attractive.
| | SECTOR | 8/31/2021 | 2/28/2022 | |
| | Non-Agency RMBS | 16.3% | 5.8% | |
| | CLOs | 14.8% | 9.3% | |
| | Non-Agency CMBS | 12.6% | 24.3% | |
| | Agency CMBS | 2.1% | 3.2% | |
| | Sub-totals Structured Credit | 45.8%
| 42.6%
| |
| | Cash | 0.6% | -0.5% | |
| | Treasuries | 0.0% | 2.7% | |
| | IG Corporate | 18.5% | 17.2% | |
| | HY Corporate | 14.0% | 27.9% | |
| | Taxable Municipals | 8.6% | 4.0% | |
| | Tax-Exempt Municipals | 12.5% | 6.3% | |
| | | 53.6% | 55.3% | |
Looking Forward
A flatter interest rate curve and higher credit spreads lead us to believe it is more efficient to take a little more credit risk at this time. However, the portfolio management team also recognizes that while credit spreads are wide relative to the last 12 months, they are more fairly valued when compared over a longer horizon. In addition, inflation and the subsequent Fed action, lingering effects of the pandemic, and geopolitical risk all create a highly uncertain future. We will continue to prudently add higher yielding structured credit and corporate securities that are not exposed, in our opinion, to excessive credit risk or structural leverage.
GROWTH OF PERFORMANCE TRUST STRATEGIC BOND FUND (PTIAX)
Performance Trust Strategic Bond Fund – Institutional Class (Unaudited)
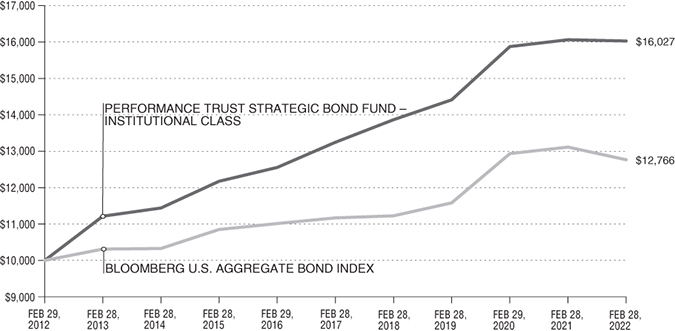
Total Return vs. Bloomberg U.S. Aggregate Bond Index
Average Annual Returns—For the Periods Ended February 28, 2022 (Unaudited)
| | | | | | ANNUALIZED |
| | ONE | THREE | FIVE | TEN | SINCE INCEPTION |
| | YEAR | YEAR | YEAR | YEAR | (AUGUST 31, 2010)(1) |
| Performance Trust Strategic | | | | | |
| Bond Fund – Institutional Class | -0.22% | 3.61% | 3.89% | 4.83% | 5.51% |
| Bloomberg U.S. Aggregate Bond Index | -2.64% | 3.30% | 2.71% | 2.47% | 2.79% |
(1) | The Performance Trust Strategic Bond Fund (the “Fund”) commenced investment operations on September 1, 2010. |
The Bloomberg U.S. Aggregate Bond Index is a broad-based benchmark that measures the investment grade, Bloomberg Capital dollar denominated, fixed-rate taxable bond market, including Treasuries, government-related and corporate securities, Mortgage-Backed Securities (agency fixed-rate and hybrid Adjustable-Rate Mortgage Passthroughs), Asset-Backed Securities, and Commercial Mortgage-Backed Securities. The Bloomberg U.S. Aggregate Bond Index was created in 1986, with index history backfilled to January 1, 1976. The chart at the top of the page assumes an initial gross investment of $10,000 made on February 29, 2012 for Institutional Class shares of the Performance Trust Strategic Bond Fund (the “Fund”).
Returns shown do not reflect the deduction of taxes that a shareholder would pay on Fund distributions or the redemption of Fund shares. Returns shown include the reinvestment of all Fund distributions. Investment performance reflects fee waivers in effect. In the absence of such waivers, total returns would be reduced.
For a period of time following the Fund’s inception when the Fund’s asset levels were lower than current asset levels, the Fund’s investments in certain fixed-income instruments purchased in odd lot-sized transactions contributed positively to the Fund’s performance. As Fund asset levels increased, similar odd lot-sized transactions, if any, did not have the same relative impact on the Fund’s performance and are not anticipated to have the same relative impact on the Fund’s future performance.
Performance data shown represents past performance. Past performance does not guarantee future results. The investment return and principal value of an investment will fluctuate so that an investor’s shares, when redeemed, may be worth more or less than their original cost. Current performance of the Fund may be lower or higher than the performance shown. Performance data current to the most recent month end may be obtained by calling 1 (877) 738-9095 or by visiting www.PTAM.com.
The expense ratio for Institutional Class shares is 0.76% per the prospectus dated December 29, 2021. Please see the Financial Highlights in this report for the most recent expense ratio.
GROWTH OF PERFORMANCE TRUST STRATEGIC BOND FUND (PTAOX)
Performance Trust Strategic Bond Fund – Class A (Unaudited)
Total Return vs. Bloomberg U.S. Aggregate Bond Index
(1) | Reflects 2.25% initial sales load. |
Average Annual Returns—For the Periods Ended February 28, 2022 (Unaudited)
| | | | ANNUALIZED |
| | ONE | THREE | SINCE INCEPTION |
| | YEAR | YEAR | (JANUARY 2, 2019) |
| Performance Trust Strategic Bond Fund – Class A (with sales charge) | -2.72% | 2.59% | 2.77% |
| Performance Trust Strategic Bond Fund – Class A (without sales charge) | -0.47% | 3.37% | 3.51% |
| Bloomberg U.S. Aggregate Bond Index | -2.64% | 3.30% | 3.42% |
The Bloomberg U.S. Aggregate Bond Index is a broad-based benchmark that measures the investment grade, Bloomberg Capital dollar denominated, fixed-rate taxable bond market, including Treasuries, government-related and corporate securities, Mortgage-Backed Securities (agency fixed-rate and hybrid Adjustable-Rate Mortgage Passthroughs), Asset-Backed Securities, and Commercial Mortgage-Backed Securities. The Bloomberg U.S. Aggregate Bond Index was created in 1986, with index history backfilled to January 1, 1976. The chart at the top of the page assumes an initial gross investment of $10,000 made on January 2, 2019, the inception date for Class A shares of the Performance Trust Strategic Bond Fund (the “Fund”).
Returns shown do not reflect the deduction of taxes that a shareholder would pay on Fund distributions or the redemption of Fund shares. Returns shown include the reinvestment of all Fund distributions. Investment performance reflects fee waivers in effect. In the absence of such waivers, total returns would be reduced.
Performance data shown represents past performance. Past performance does not guarantee future results. The investment return and principal value of an investment will fluctuate so that an investor’s shares, when redeemed, may be worth more or less than their original cost. Current performance of the Fund may be lower or higher than the performance shown. Performance data current to the most recent month end may be obtained by calling 1 (877) 738-9095 or by visiting www.PTAM.com.
The expense ratio for Class A shares is 1.01% per the prospectus dated December 29, 2021. Please see the Financial Highlights in this report for the most recent expense ratio.
GROWTH OF PERFORMANCE TRUST STRATEGIC BOND FUND (PTCOX)
Performance Trust Strategic Bond Fund – Class C (Unaudited)
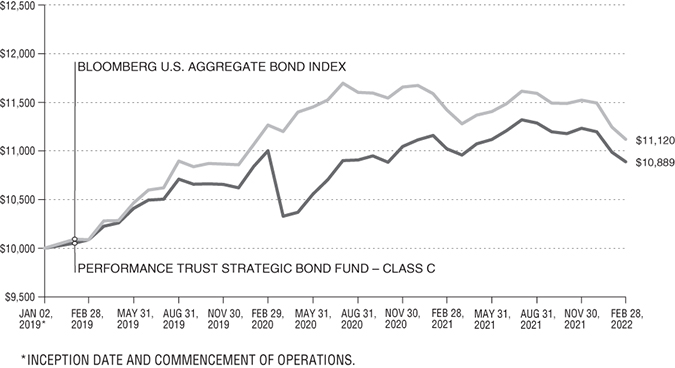
Total Return vs. Bloomberg U.S. Aggregate Bond Index
Average Annual Returns—For the Periods Ended February 28, 2022 (Unaudited)
| | | | ANNUALIZED |
| | ONE | THREE | SINCE INCEPTION |
| | YEAR | YEAR | (JANUARY 2, 2019) |
| Performance Trust Strategic Bond Fund – Class C | -1.21% | 2.58% | 2.73% |
| Bloomberg U.S. Aggregate Bond Index | -2.64% | 3.30% | 3.42% |
The Bloomberg U.S. Aggregate Bond Index is a broad-based benchmark that measures the investment grade, Bloomberg Capital dollar denominated, fixed-rate taxable bond market, including Treasuries, government-related and corporate securities, Mortgage-Backed Securities (agency fixed-rate and hybrid Adjustable-Rate Mortgage Passthroughs), Asset-Backed Securities, and Commercial Mortgage-Backed Securities. The Bloomberg U.S. Aggregate Bond Index was created in 1986, with index history backfilled to January 1, 1976. The chart at the top of the page assumes an initial gross investment of $10,000 made on January 2, 2019, the inception date for Class C shares of the Performance Trust Strategic Bond Fund (the “Fund”).
Returns shown do not reflect the deduction of taxes that a shareholder would pay on Fund distributions or the redemption of Fund shares. Returns shown include the reinvestment of all Fund distributions. Investment performance reflects fee waivers in effect. In the absence of such waivers, total returns would be reduced.
Performance data shown represents past performance. Past performance does not guarantee future results. The investment return and principal value of an investment will fluctuate so that an investor’s shares, when redeemed, may be worth more or less than their original cost. Current performance of the Fund may be lower or higher than the performance shown. Performance data current to the most recent month end may be obtained by calling 1 (877) 738-9095 or by visiting www.PTAM.com.
The expense ratio for Class C shares is 1.76% per the prospectus dated December 29, 2021. Please see the Financial Highlights in this report for the most recent expense ratio.
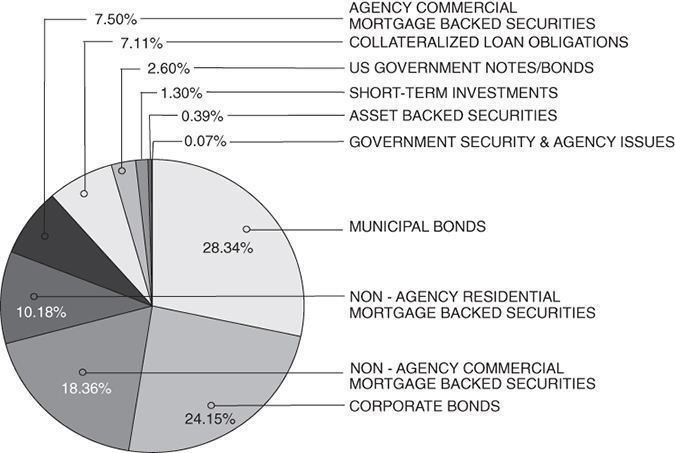
PERFORMANCE TRUST STRATEGIC BOND FUND (PTIAX, PTAOX, PTCOX)
Allocation of Portfolio Holdings (% of Investments) (Unaudited)
As of February 28, 2022
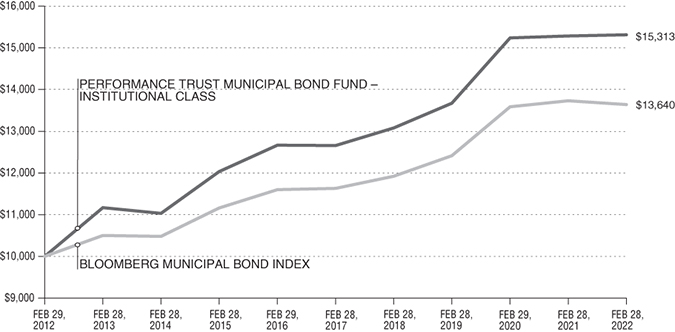
GROWTH OF PERFORMANCE TRUST MUNICIPAL BOND FUND (PTIMX)
Performance Trust Municipal Bond Fund – Institutional Class (Unaudited)
Total Return vs. Bloomberg Municipal Bond Index
Average Annual Returns—For the Periods Ended February 28, 2022 (Unaudited)
| | | | | | ANNUALIZED |
| | ONE | THREE | FIVE | TEN | SINCE INCEPTION |
| | YEAR | YEAR | YEAR | YEAR | (JUNE 30, 2011) |
| Performance Trust Municipal | | | | | |
| Bond Fund – Institutional Class | 0.18% | 3.85% | 3.88% | 4.35% | 5.08% |
| Bloomberg Municipal Bond Index | -0.66% | 3.19% | 3.24% | 3.15% | 3.75% |
The Bloomberg Municipal Bond Index is a rules based, market-value-weighted index engineered for the long-term tax-exempt bond market. The index tracks general obligation bonds, revenue bonds, insured bonds, and pre-refunded bonds rated Baa3/ BBB or higher by at least two of the ratings agencies: Moody’s, S&P and Fitch. The Bloomberg Municipal Bond Index was created in 1986, with index history backfilled to January 1, 1976. The chart at the top of the page assumes an initial gross investment of $10,000 made on February 29, 2012 for the Institutional Class shares of the Performance Trust Municipal Bond Fund (the “Fund”).
Returns shown do not reflect the deduction of taxes that a shareholder would pay on Fund distributions or the redemption of Fund shares. Returns shown include the reinvestment of all Fund distributions. Investment performance reflects fee waivers in effect. In the absence of such waivers, total returns would be reduced.
For a period of time following the Fund’s inception when the Fund’s asset levels were lower than current asset levels, the Fund’s investments in certain fixed-income instruments purchased in odd lot-sized transactions contributed positively to the Fund’s performance. As Fund asset levels increased, similar odd lot-sized transactions, if any, did not have the same relative impact on the Fund’s performance and are not anticipated to have the same relative impact on the Fund’s future performance.
Performance data shown represents past performance. Past performance does not guarantee future results. The investment return and principal value of an investment will fluctuate so that an investor’s shares, when redeemed, may be worth more or less than their original cost. Current performance of the Fund may be lower or higher than the performance shown. Performance data current to the most recent month end may be obtained by calling 1 (877) 738-9095 or by visiting www.PTAM.com.
The expense ratio for Institutional Class shares is 0.49% per the prospectus dated December 29, 2021. Please see the Financial Highlights in this report for the most recent expense ratio.
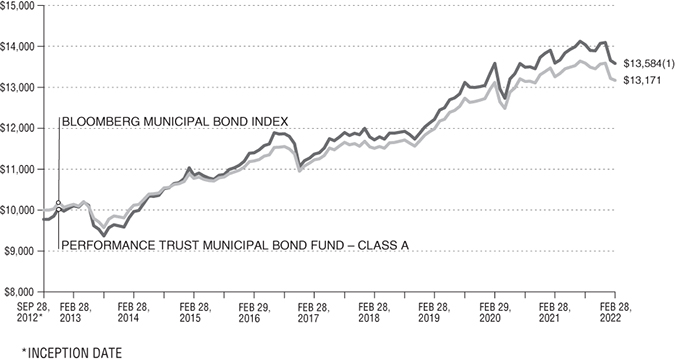
GROWTH OF PERFORMANCE TRUST MUNICIPAL BOND FUND (PTRMX)
Performance Trust Municipal Bond Fund – Class A (Unaudited)
Total Return vs. Bloomberg Municipal Bond Index
(1) | Reflects 2.25% initial sales load. |
Average Annual Returns—For the Periods Ended February 28, 2022 (Unaudited)
| | | | | ANNUALIZED |
| | ONE | THREE | FIVE | SINCE INCEPTION |
| | YEAR | YEAR | YEAR | (SEPTEMBER 28, 2012) |
| Performance Trust Municipal Bond Fund – Class A | | | | |
| (with sales charge) | -2.30% | 2.82% | 3.16% | 3.31% |
| Performance Trust Municipal Bond Fund – Class A | | | | |
| (without sales charge) | -0.07% | 3.60% | 3.63% | 3.56% |
| Bloomberg Municipal Bond Index | -0.66% | 3.19% | 3.24% | 2.97% |
The Bloomberg Municipal Bond Index is a rules based, market-value-weighted index engineered for the long-term tax-exempt bond market. The index tracks general obligation bonds, revenue bonds, insured bonds, and pre-refunded bonds rated Baa3/ BBB or higher by at least two of the ratings agencies: Moody’s, S&P and Fitch. The Bloomberg Municipal Bond Index was created in 1986, with index history backfilled to January 1, 1976. The chart at the top of the page assumes an initial gross investment of $10,000 made on September 28, 2012, the inception date for the Class A shares of the Performance Trust Municipal Bond Fund (the “Fund”).
Returns shown do not reflect the deduction of taxes that a shareholder would pay on Fund distributions or the redemption of Fund shares. Returns shown include the reinvestment of all Fund distributions. Investment performance reflects fee waivers in effect. In the absence of such waivers, total returns would be reduced.
Performance data shown represents past performance. Past performance does not guarantee future results. The investment return and principal value of an investment will fluctuate so that an investor’s shares, when redeemed, may be worth more or less than their original cost. Current performance of the Fund may be lower or higher than the performance shown. Performance data current to the most recent month end may be obtained by calling 1 (877) 738-9095 or by visiting www.PTAM.com.
The expense ratio for Class A shares is 0.74% per the prospectus dated December 29, 2021. Please see the Financial Highlights in this report for the most recent expense ratio.
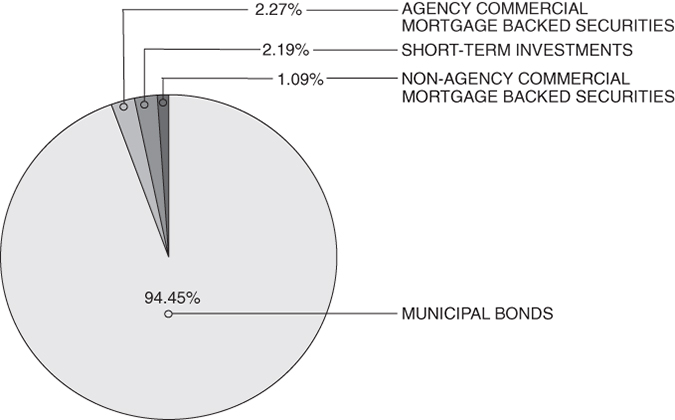
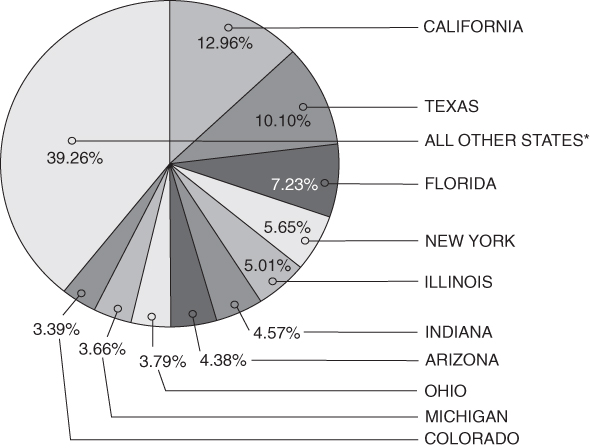
PERFORMANCE TRUST MUNICIPAL BOND FUND (PTIMX, PTRMX)
Allocation of Portfolio Holdings (% of Investments) (Unaudited)
As of February 28, 2022
| * | For additional details on allocation of portfolio assets by state, please see the Schedule of Investments. |
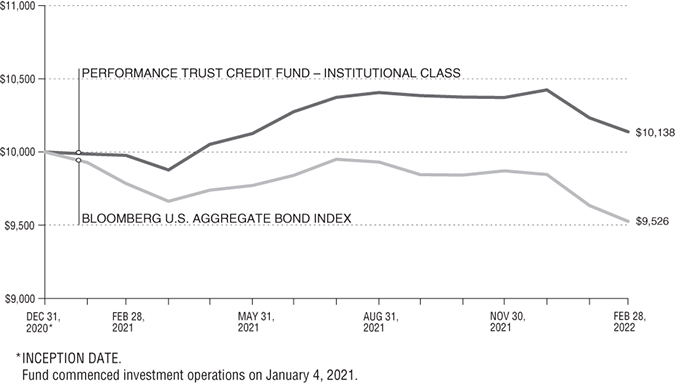
GROWTH OF PERFORMANCE TRUST CREDIT FUND (PTCRX)
Performance Trust Credit Fund – Institutional Class (Unaudited)
Total Return vs. Bloomberg U.S. Aggregate Bond Index
Returns—For the Periods Ended February 28, 2022 (Unaudited)
| | | ANNUALIZED |
| | ONE | SINCE INCEPTION |
| | YEAR | (DECEMBER 31, 2020)(1) |
| Performance Trust Credit Fund – Institutional Class | 1.62% | 1.19% |
| Bloomberg U.S. Aggregate Bond Index | -2.64% | -4.09% |
(1) | The Performance Trust Credit Fund (the “Fund”) commenced investment operations on January 4, 2021. |
The Bloomberg U.S. Aggregate Bond Index is a broad-based benchmark that measures the investment grade, Capital dollar denominated, fixed-rate taxable bond market, including Treasuries, government-related and corporate securities, Mortgage-Backed Securities (agency fixed-rate and hybrid Adjustable-Rate Mortgage Passthroughs), Asset-Backed Securities, and Commercial Mortgage-Backed Securities. The Bloomberg U.S. Aggregate Bond Index was created in 1986, with index history backfilled to January 1, 1976. The chart at the top of the page assumes an initial gross investment of $10,000 made on December 31, 2020, the inception date for Institutional Class shares of the Performance Trust Credit Fund (the “Fund”).
Returns shown do not reflect the deduction of taxes that a shareholder would pay on Fund distributions or the redemption of Fund shares. Returns shown include the reinvestment of all Fund distributions. Investment performance reflects fee waivers in effect. In the absence of such waivers, total returns would be reduced.
Performance data shown represents past performance. Past performance does not guarantee future results. The investment return and principal value of an investment will fluctuate so that an investor’s shares, when redeemed, may be worth more or less than their original cost. Current performance of the Fund may be lower or higher than the performance shown. Performance data current to the most recent month end may be obtained by calling 1 (877) 738-9095 or by visiting www.PTAM.com.
The Fund’s investment adviser, PT Asset Management, LLC, has contractually agreed to waive its fees and/or pay for operating expenses of the Fund to ensure that total annual fund operating expenses (excluding any front-end or contingent deferred loads, Rule 12b-1 plan fees, shareholder servicing plan fees, taxes, leverage, interest, brokerage commissions and other transactional expenses, expenses incurred in connection with any merger or reorganization, dividends or interest on short positions, acquired fund fees and expenses or extraordinary expenses such as litigation expenses) do not exceed 0.99% of the average daily net assets of the Fund. This agreement is effective at least through December 31, 2023.
The net expense ratio for Institutional Class shares is 0.99% per the prospectus dated December 29, 2021. Please see the Financial Highlights in this report for the most recent expense ratio.
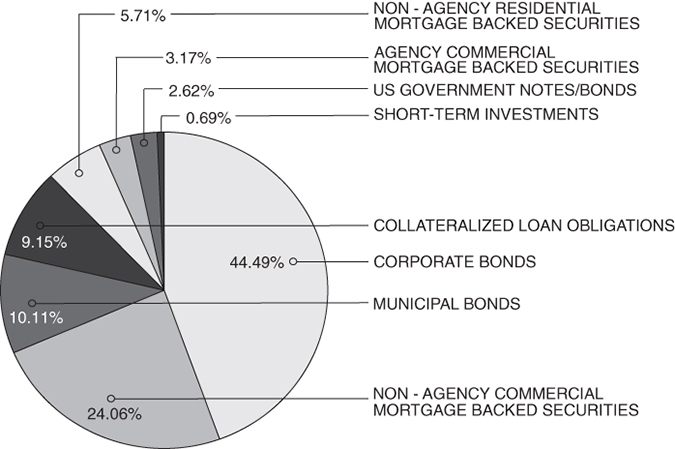
PERFORMANCE TRUST CREDIT FUND (PTCRX)
Allocation of Portfolio Holdings (% of Investments) (Unaudited)
As of February 28, 2022
(This Page Intentionally Left Blank.)
STATEMENTS OF ASSETS AND LIABILITIES
February 28, 2022 (Unaudited)
| | | Performance Trust | | | Performance Trust | | | | |
| | | Strategic | | | Municipal | | | Performance Trust | |
| | | Bond Fund | | | Bond Fund | | | Credit Fund | |
| Assets | | | | | | | | | |
| Investments, at value (cost $6,894,157,417, | | | | | | | | | |
| $944,471,840 and $34,510,168, respectively) | | $ | 6,663,923,492 | | | $ | 945,521,898 | | | $ | 33,174,695 | |
| Cash | | | 341,704 | | | | — | | | | — | |
| Dividend and interest receivable | | | 49,156,872 | | | | 9,430,911 | | | | 1,741,308 | |
| Receivable for investments sold | | | 72,164,550 | | | | 12,894,378 | | | | 11,500 | |
| Receivable for Fund shares sold | | | 16,738,043 | | | | 3,177,647 | | | | 6,000 | |
| Other assets | | | 141,489 | | | | 33,264 | | | | 23,566 | |
| Total Assets | | | 6,802,466,150 | | | | 971,058,098 | | | | 34,957,069 | |
| | | | | | | | | | | | | |
| Liabilities | | | | | | | | | | | | |
| Payable for investments purchased | | | 62,774,966 | | | | 28,863,239 | | | | 1,899,616 | |
| Payable for Fund shares redeemed | | | 12,939,734 | | | | 436,622 | | | | — | |
| Payable to Adviser | | | 2,140,732 | | | | 183,761 | | | | 7,969 | |
| Payable to affiliates | | | 567,000 | | | | 85,343 | | | | 14,597 | |
| Payable for distribution fees | | | 40,250 | | | | 11,081 | | | | — | |
| Payable for shareholder servicing fees | | | 22,154 | | | | — | | | | — | |
| Accrued expenses and other liabilities | | | 335,316 | | | | 29,491 | | | | 17,268 | |
| Total Liabilities | | | 78,820,152 | | | | 29,609,537 | | | | 1,939,450 | |
| | | | | | | | | | | | | |
| Net Assets | | | 6,723,645,998 | | | | 941,448,561 | | | | 33,017,619 | |
| | | | | | | | | | | | | |
| Net Assets Consist Of: | | | | | | | | | | | | |
| Paid-in capital | | $ | 6,951,283,570 | | | $ | 942,267,185 | | | $ | 34,287,796 | |
| Accumulated deficit | | | (227,637,572 | ) | | | (818,624 | ) | | | (1,270,177 | ) |
| Net Assets | | $ | 6,723,645,998 | | | $ | 941,448,561 | | | $ | 33,017,619 | |
The accompanying notes are an integral part of these financial statements.
STATEMENTS OF ASSETS AND LIABILITIES (CONT.)
February 28, 2022 (Unaudited)
| | | Performance Trust | | | Performance Trust | | | | |
| | | Strategic | | | Municipal | | | Performance Trust | |
| | | Bond Fund | | | Bond Fund | | | Credit Fund | |
| Strategic Bond Fund, Municipal Bond Fund | | | | | | | | | |
| and Credit Fund Shares – Institutional Class | | | | | | | | | |
| Net assets | | $ | 6,629,359,432 | | | $ | 883,410,168 | | | $ | 33,017,619 | |
| Shares of beneficial interest outstanding (unlimited | | | | | | | | | | | | |
| number of shares authorized, $0.001 par value) | | | 300,516,724 | | | | 35,492,338 | | | | 3,447,621 | |
| Net asset value, redemption | | | | | | | | | | | | |
| and offering price per share | | $ | 22.06 | | | $ | 24.89 | | | $ | 9.58 | |
| | | | | | | | | | | | | |
| Strategic Bond Fund and Municipal | | | | | | | | | | | | |
| Bond Fund Shares – Class A | | | | | | | | | | | | |
| Net assets | | $ | 36,962,836 | | | $ | 58,038,393 | | | | | |
| Shares of beneficial interest outstanding (unlimited | | | | | | | | | | | | |
| number of shares authorized, $0.001 par value) | | | 1,675,450 | | | | 2,330,118 | | | | | |
| Net asset value, redemption | | | | | | | | | | | | |
| and offering price per share | | $ | 22.06 | | | $ | 24.91 | | | | | |
| Maximum offering price per share | | | | | | | | | | | | |
(Net asset value per share divided by 0.9775)(1) | | $ | 22.57 | | | $ | 25.48 | | | | | |
| | | | | | | | | | | | | |
| Strategic Bond Fund Shares – Class C | | | | | | | | | | | | |
| Net assets | | $ | 57,323,730 | | | | | | | | | |
| Shares of beneficial interest outstanding (unlimited | | | | | | | | | | | | |
| number of shares authorized, $0.001 par value) | | | 2,607,322 | | | | | | | | | |
| Net asset value, redemption | | | | | | | | | | | | |
| and offering price per share | | $ | 21.99 | | | | | | | | | |
| (1) | Reflects a maximum sales charge of 2.25%. |
The accompanying notes are an integral part of these financial statements.
PERFORMANCE TRUST STRATEGIC BOND FUND — SCHEDULE OF INVESTMENTS
February 28, 2022 (Unaudited)
| | | PRINCIPAL | | | | |
| | | AMOUNT | | | VALUE | |
| | | | | | | |
| ASSET BACKED SECURITIES – 0.39% | | | | | | |
| First Investors Auto Owner Trust | | | | | | |
| 2021-1A, 1.170%, 03/15/2027 (a) | | $ | 1,795,000 | | | $ | 1,750,082 | |
| 2022-1A, 3.130%, 05/15/2028 (a) | | | 5,000,000 | | | | 5,022,656 | |
| | | | | | | | | |
| GLS Auto Receivables | | | | | | | | |
| Issuer Trust | | | | | | | | |
| 2020-1A, 2.170%, 02/15/2024 (a) | | | 159,238 | | | | 159,357 | |
| 2020-2A, 3.160%, 06/16/2025 (a) | | | 4,500,000 | | | | 4,556,943 | |
| 2021-4A, 1.940%, 10/15/2027 (a) | | | 8,500,000 | | | | 8,361,290 | |
| | | | | | | | | |
| New Residential Advance | | | | | | | | |
| Receivables Trust | | | | | | | | |
| 2020-T1, 2.269%, 08/15/2053 (a) | | | 1,700,000 | | | | 1,679,595 | |
| 2020-T1, 3.011%, 08/15/2053 (a) | | | 4,400,000 | | | | 4,349,904 | |
| | | | | | | | | |
| SoFi Consumer Loan | | | | | | | | |
| Program Trust | | | | | | | | |
| 2020-1, 2.020%, 01/25/2029 (a) | | | 192,478 | | | | 192,904 | |
| TOTAL ASSET BACKED | | | | | | | | |
| SECURITIES (Cost $26,222,428) | | | | | | | 26,072,731 | |
| | | | | | | | | |
| COLLATERALIZED LOAN | | | | | | | | |
| OBLIGATIONS – 7.05% | | | | | | | | |
| | | | | | | | | |
| Apidos CLO XI | | | | | | | | |
2012-11A, 3.991% (3 Month LIBOR USD + 3.750%), | | | | | | | | |
| | | | | | | | |
| 04/17/2034 (a)(b)(c) | | | 1,500,000 | | | | 1,509,012 | |
| | | | | | | | | |
| Apidos CLO XII | | | | | | | | |
2013-12A, 5.641% (3 Month LIBOR USD + 5.400%), | | | | | | | | |
| | | | | | | | |
| 04/15/2031 (a)(b)(c) | | | 6,150,000 | | | | 5,545,160 | |
| | | | | | | | | |
| Apidos CLO XV | | | | | | | | |
2013-15A, 1.804% (3 Month LIBOR USD + 1.550%), | | | | | | | | |
| | | | | | | | |
| 04/20/2031 (a)(b)(c) | | | 4,000,000 | | | | 3,977,020 | |
2013-15A, 2.104% (3 Month LIBOR USD + 1.850%), | | | | | | | | |
| | | | | | | | |
| 04/20/2031 (a)(b)(c) | | | 5,000,000 | | | | 4,936,595 | |
2013-15A, 5.954% (3 Month LIBOR USD + 5.700%), | | | | | | | | |
| | | | | | | | |
| 04/20/2031 (a)(b)(c) | | | 3,843,000 | | | | 3,575,024 | |
| | | | | | | | | |
| Apidos CLO XX | | | | | | | | |
2015-20A, 1.791% (3 Month LIBOR USD + 1.550%), | | | | | | | | |
| | | | | | | | |
| 07/16/2031 (a)(b)(c) | | | 10,000,000 | | | | 9,940,550 | |
2015-20A, 2.191% (3 Month LIBOR USD + 1.950%), | | | | | | | | |
| | | | | | | | |
| 07/16/2031 (a)(b)(c) | | | 1,250,000 | | | | 1,240,314 | |
| | | | | | | | | |
| Apidos CLO XXIII | | | | | | | | |
2015-23A, 1.841% (3 Month LIBOR USD + 1.600%), | | | | | | | | |
| | | | | | | | |
| 04/15/2033 (a)(b)(c) | | | 6,500,000 | | | | 6,461,988 | |
| | | | | | | | | |
| Apidos CLO XXIV | | | | | | | | |
2016-24A, 6.054% (3 Month LIBOR USD + 5.800%), | | | | | | | | |
| | | | | | | | |
| 10/20/2030 (a)(b)(c) | | | 2,550,000 | | | | 2,370,411 | |
| | | | | | | | | |
| Apidos CLO XXIX | | | | | | | | |
2018-29A, 1.808% (3 Month LIBOR USD + 1.550%), | | | | | | | | |
| | | | | | | | |
| 07/25/2030 (a)(b)(c) | | | 4,250,000 | | | | 4,220,450 | |
2018-29A, 2.158% (3 Month LIBOR USD + 1.900%), | | | | | | | | |
| | | | | | | | |
| 07/25/2030 (a)(b)(c) | | | 7,600,000 | | | | 7,508,823 | |
2018-29A, 3.008% (3 Month LIBOR USD + 2.750%), | | | | | | | | |
| | | | | | | | |
| 07/25/2030 (a)(b)(c) | | | 6,250,000 | | | | 6,083,006 | |
| | | | | | | | | |
| Apidos CLO XXVI | | | | | | | | |
2017-26A, 1.741% (3 Month LIBOR USD + 1.500%), | | | | | | | | |
| | | | | | | | |
| 07/18/2029 (a)(b)(c) | | | 11,200,000 | | | | 11,135,869 | |
| | | | | | | | | |
| Apidos CLO XXVIII | | | | | | | | |
2017-28A, 1.404% (3 Month LIBOR USD + 1.150%), | | | | | | | | |
| | | | | | | | |
| 01/20/2031 (a)(b)(c) | | | 2,000,000 | | | | 1,982,772 | |
| | | | | | | | | |
| Apidos CLO XXX | | | | | | | | |
XXXA, 2.241% (3 Month LIBOR USD + 2.000%), | | | | | | | | |
| | | | | | | | |
| 10/18/2031 (a)(b)(c) | | | 3,100,000 | | | | 3,083,362 | |
| | | | | | | | | |
| Ares LI CLO Ltd. | | | | | | | | |
2019-51A, 1.991% (3 Month LIBOR USD + 1.750%), | | | | | | | | |
| | | | | | | | |
| 07/15/2034 (a)(b)(c) | | | 5,000,000 | | | | 4,976,960 | |
| | | | | | | | | |
| Ares XLVI CLO Ltd. | | | | | | | | |
2017-46A, 1.941% (3 Month LIBOR USD + 1.700%), | | | | | | | | |
| | | | | | | | |
| 01/15/2030 (a)(b)(c) | | | 1,436,843 | | | | 1,417,217 | |
2017-46A, 3.570%, 01/15/2030 (a)(c) | | | | | | | | |
| | | 3,600,000 | | | | 3,593,232 | |
| | | | | | | | | |
| Ares XXVII CLO Ltd. | | | | | | | | |
2013-2A, 1.928% (3 Month LIBOR USD + 1.650%), | | | | | | | | |
| | | | | | | | |
| 10/28/2034 (a)(b)(c) | | | 10,000,000 | | | | 9,918,620 | |
| | | | | | | | | |
| Ares XXXIR CLO Ltd. | | | | | | | | |
2014-31RA, 2.088% (3 Month LIBOR USD + 1.600%), | | | | | | | | |
| | | | | | | | |
| 05/24/2030 (a)(b)(c) | | | 3,000,000 | | | | 2,971,464 | |
| | | | | | | | | |
| Ares XXXVIII CLO Ltd. | | | | | | | | |
2015-38A, 2.754% (3 Month LIBOR USD + 2.500%), | | | | | | | | |
| | | | | | | | |
| 04/20/2030 (a)(b)(c) | | | 7,200,000 | | | | 7,026,084 | |
| | | | | | | | | |
| BCRED MML CLO, LLC | | | | | | | | |
| 2022-1A, 0.000% (TSFR3M + 2.750%), | | | | | | | | |
| 04/20/2035 (a)(b)(d) | | | 2,000,000 | | | | 1,986,956 | |
Percentages are stated as a percent of net assets.
The accompanying notes are an integral part of these financial statements.
PERFORMANCE TRUST STRATEGIC BOND FUND — SCHEDULE OF INVESTMENTS (CONT.)
February 28, 2022 (Unaudited)
| | | PRINCIPAL | | | | |
| | | AMOUNT | | | VALUE | |
| | | | | | | |
| Betony CLO 2 Ltd. | | | | | | |
2018-1A, 2.149% (3 Month LIBOR USD + 1.850%), | | | | | | |
| | | | | | |
| 04/30/2031 (a)(b)(c) | | $ | 1,200,000 | | | $ | 1,189,346 | |
| | | | | | | | | |
| BlueMountain CLO Ltd. | | | | | | | | |
2018-1A, 1.999% (3 Month LIBOR USD + 1.700%), | | | | | | | | |
| | | | | | | | |
| 07/30/2030 (a)(b)(c) | | | 6,996,770 | | | | 6,930,364 | |
2014-2A, 2.004% (3 Month LIBOR USD + 1.750%), | | | | | | | | |
| | | | | | | | |
| 10/20/2030 (a)(b)(c) | | | 5,500,000 | | | | 5,459,377 | |
2013-2A, 1.859% (3 Month LIBOR USD + 1.600%), | | | | | | | | |
| | | | | | | | |
| 10/22/2030 (a)(b)(c) | | | 2,750,000 | | | | 2,738,942 | |
2018-2A, 2.206% (3 Month LIBOR USD + 1.700%), | | | | | | | | |
| | | | | | | | |
| 08/15/2031 (a)(b)(c) | | | 8,500,000 | | | | 8,452,689 | |
| | | | | | | | | |
| Burnham Park CLO Ltd. | | | | | | | | |
2016-1A, 2.404% (3 Month LIBOR USD + 2.150%), | | | | | | | | |
| | | | | | | | |
| 10/20/2029 (a)(b)(c) | | | 5,250,000 | | | | 5,227,593 | |
| | | | | | | | | |
| Catskill Park CLO Ltd. | | | | | | | | |
2017-1A, 3.954% (3 Month LIBOR USD + 3.700%), | | | | | | | | |
| | | | | | | | |
| 04/20/2029 (a)(b)(c) | | | 3,500,000 | | | | 3,495,100 | |
| | | | | | | | | |
| Chenango Park CLO Ltd. | | | | | | | | |
2018-1A, 1.791% (3 Month LIBOR USD + 1.550%), | | | | | | | | |
| | | | | | | | |
| 04/15/2030 (a)(b)(c) | | | 7,000,000 | | | | 6,952,750 | |
2018-1A, 2.091% (3 Month LIBOR USD + 1.850%), | | | | | | | | |
| | | | | | | | |
| 04/15/2030 (a)(b)(c) | | | 5,500,000 | | | | 5,455,103 | |
2018-1A, 3.241% (3 Month LIBOR USD + 3.000%), | | | | | | | | |
| | | | | | | | |
| 04/15/2030 (a)(b)(c) | | | 1,000,000 | | | | 994,689 | |
| | | | | | | | | |
| CIFC Funding Ltd. | | | | | | | | |
2017-3A, 2.054% (3 Month LIBOR USD + 1.800%), | | | | | | | | |
| | | | | | | | |
| 07/20/2030 (a)(b)(c) | | | 2,100,000 | | | | 2,093,497 | |
2018-1A, 1.991% (3 Month LIBOR USD + 1.750%), | | | | | | | | |
| | | | | | | | |
| 04/18/2031 (a)(b)(c) | | | 3,750,000 | | | | 3,707,111 | |
| | | | | | | | | |
| Dryden 77 CLO Ltd. | | | | | | | | |
2020-77A, 2.130% (3 Month LIBOR USD + 1.650%), | | | | | | | | |
| | | | | | | | |
| 05/20/2034 (a)(b)(c) | | | 8,000,000 | | | | 7,953,240 | |
| | | | | | | | | |
| Gilbert Park CLO Ltd. | | | | | | | | |
2017-1A, 3.191% (3 Month LIBOR USD + 2.950%), | | | | | | | | |
| | | | | | | | |
| 10/15/2030 (a)(b)(c) | | | 8,475,000 | | | | 8,428,032 | |
| | | | | | | | | |
| Goldentree Loan Management | | | | | | | | |
| US CLO 2 Ltd. | | | | | | | | |
2017-2A, 4.954% (3 Month LIBOR USD + 4.700%), | | | | | | | | |
| | | | | | | | |
| 11/28/2030 (a)(b)(c) | | | 4,475,000 | | | | 4,183,445 | |
| | | | | | | | | |
| Goldentree Loan Management | | | | | | | | |
| US CLO 3 Ltd. | | | | | | | | |
2018-3A, 1.804% (3 Month LIBOR USD + 1.550%), | | | | | | | | |
| | | | | | | | |
| 04/20/2030 (a)(b)(c) | | | 7,865,000 | | | | 7,864,961 | |
| | | | | | | | | |
| Goldentree Loan Management | | | | | | | | |
| US CLO 4 Ltd. | | | | | | | | |
2019-4A, 5.009% (3 Month LIBOR USD + 4.750%), | | | | | | | | |
| | | | | | | | |
| 04/24/2031 (a)(b)(c) | | | 8,150,000 | | | | 7,583,396 | |
| | | | | | | | | |
| Goldentree Loan Management | | | | | | | | |
| US CLO 5 Ltd. | | | | | | | | |
2019-5A, 5.104% (3 Month LIBOR USD + 4.850%), | | | | | | | | |
| | | | | | | | |
| 10/20/2032 (a)(b)(c) | | | 7,500,000 | | | | 6,972,120 | |
| | | | | | | | | |
| Goldentree Loan Management | | | | | | | | |
| US CLO 7 Ltd. | | | | | | | | |
2020-7A, 1.954% (3 Month LIBOR USD + 1.700%), | | | | | | | | |
| | | | | | | | |
| 04/20/2034 (a)(b)(c) | | | 5,750,000 | | | | 5,716,696 | |
| | | | | | | | | |
| Goldentree Loan | | | | | | | | |
| Opportunities X Ltd. | | | | | | | | |
2015-10A, 1.704% (3 Month LIBOR USD + 1.450%), | | | | | | | | |
| | | | | | | | |
| 07/20/2031 (a)(b)(c) | | | 3,250,000 | | | | 3,240,809 | |
| | | | | | | | | |
| Goldentree Loan | | | | | | | | |
| Opportunities XI Ltd. | | | | | | | | |
2015-11A, 2.641% (3 Month LIBOR USD + 2.400%), | | | | | | | | |
| | | | | | | | |
| 01/18/2031 (a)(b)(c) | | | 2,250,000 | | | | 2,203,036 | |
2015-11A, 5.641% (3 Month LIBOR USD + 5.400%), | | | | | | | | |
| | | | | | | | |
| 01/18/2031 (a)(b)(c) | | | 3,750,000 | | | | 3,552,720 | |
| | | | | | | | | |
| GoldentTree Loan Management | | | | | | | | |
| US CLO 1 Ltd. | | | | | | | | |
2021-9A, 5.004% (3 Month LIBOR USD + 4.750%), | | | | | | | | |
| | | | | | | | |
| 01/20/2033 (a)(b)(c) | | | 6,500,000 | | | | 6,045,494 | |
| | | | | | | | | |
| Golub Capital BDC 3 CLO 1, LLC | | | | | | | | |
2021-1A, 3.041% (3 Month LIBOR USD + 2.800%), | | | | | | | | |
| | | | | | | | |
| 04/15/2033 (a)(b)(c) | | | 7,000,000 | | | | 6,919,500 | |
| | | | | | | | | |
| Golub Capital Partners CLO 47M Ltd. | | | | | | | | |
2020-47A, 1.995% (3 Month LIBOR USD + 1.680%), | | | | | | | | |
| | | | | | | | |
| 05/05/2032 (a)(b)(c) | | | 15,000,000 | | | | 14,967,585 | |
Percentages are stated as a percent of net assets.
The accompanying notes are an integral part of these financial statements.
PERFORMANCE TRUST STRATEGIC BOND FUND — SCHEDULE OF INVESTMENTS (CONT.)
February 28, 2022 (Unaudited)
| | | PRINCIPAL | | | | |
| | | AMOUNT | | | VALUE | |
| | | | | | | |
| Greenwood Park CLO Ltd. | | | | | | |
2018-1A, 5.191% (3 Month LIBOR USD + 4.950%), | | | | | | |
| | | | | | |
| 04/15/2031 (a)(b)(c) | | $ | 3,250,000 | | | $ | 3,056,063 | |
| | | | | | | | | |
| Grippen Park CLO Ltd. | | | | | | | | |
2017-1A, 1.904% (3 Month LIBOR USD + 1.650%), | | | | | | | | |
| | | | | | | | |
| 01/20/2030 (a)(b)(c) | | | 3,000,000 | | | | 2,989,023 | |
2017-1A, 3.554% (3 Month LIBOR USD + 3.300%), | | | | | | | | |
| | | | | | | | |
| 01/20/2030 (a)(b)(c) | | | 7,350,000 | | | | 7,333,249 | |
2017-1A, 5.954% (3 Month LIBOR USD + 5.700%), | | | | | | | | |
| | | | | | | | |
| 01/20/2030 (a)(b)(c) | | | 1,150,000 | | | | 1,125,923 | |
| | | | | | | | | |
| Jay Park CLO Ltd. | | | | | | | | |
2016-1A, 2.904% (3 Month LIBOR USD + 2.650%), | | | | | | | | |
| | | | | | | | |
| 10/20/2027 (a)(b)(c) | | | 1,124,000 | | | | 1,113,075 | |
| | | | | | | | | |
| LCM 26 Ltd. | | | | | | | | |
26A, 2.754% (3 Month LIBOR USD + 2.500%), | | | | | | | | |
| | | | | | | | |
| 01/20/2031 (a)(b)(c) | | | 1,000,000 | | | | 945,473 | |
26A, 5.554% (3 Month LIBOR USD + 5.300%), | | | | | | | | |
| | | | | | | | |
| 01/20/2031 (a)(b)(c) | | | 4,000,000 | | | | 3,565,756 | |
| | | | | | | | | |
| LCM 28 Ltd. | | | | | | | | |
28A, 1.854% (3 Month LIBOR USD + 1.600%), | | | | | | | | |
| | | | | | | | |
| 10/20/2030 (a)(b)(c) | | | 4,000,000 | | | | 3,968,040 | |
| | | | | | | | | |
| LCM 29 Ltd. | | | | | | | | |
29A, 1.841% (3 Month LIBOR USD + 1.600%), | | | | | | | | |
| | | | | | | | |
| 04/15/2031 (a)(b)(c) | | | 7,750,000 | | | | 7,672,167 | |
| | | | | | | | | |
| LCM 34 Ltd. | | | | | | | | |
34A, 6.794% (3 Month LIBOR USD + 6.540%), | | | | | | | | |
| | | | | | | | |
| 10/20/2034 (a)(b)(c) | | | 3,250,000 | | | | 3,110,305 | |
| | | | | | | | | |
| LCM 35 Ltd. | | | | | | | | |
35A, 3.920% (3 Month LIBOR USD + 6.610%), | | | | | | | | |
| | | | | | | | |
| 10/15/2034 (a)(b)(c) | | | 4,750,000 | | | | 4,558,033 | |
| | | | | | | | | |
| LCM 36 Ltd. | | | | | | | | |
36A, 6.958% (3 Month LIBOR USD + 6.710%), | | | | | | | | |
| | | | | | | | |
| 01/15/2034 (a)(b)(c) | | | 4,500,000 | | | | 4,342,500 | |
| | | | | | | | | |
| LCM Loan Income Fund I | | | | | | | | |
| Income Note Issuer Ltd. | | | | | | | | |
27A, 2.191% (3 Month LIBOR USD + 1.950%), | | | | | | | | |
| | | | | | | | |
| 07/16/2031 (a)(b)(c) | | | 2,700,000 | | | | 2,652,153 | |
27A, 3.191% (3 Month LIBOR USD + 2.950%), | | | | | | | | |
| | | | | | | | |
| 07/16/2031 (a)(b)(c) | | | 4,000,000 | | | | 3,874,064 | |
27A, 5.841% (3 Month LIBOR USD + 5.600%), | | | | | | | | |
| | | | | | | | |
| 07/16/2031 (a)(b)(c) | | | 2,000,000 | | | | 1,806,002 | |
| | | | | | | | | |
| LCM XIV LP | | | | | | | | |
14A, 1.834% (3 Month LIBOR USD + 1.580%), | | | | | | | | |
| | | | | | | | |
| 07/20/2031 (a)(b)(c) | | | 10,800,000 | | | | 10,695,283 | |
14A, 2.104% (3 Month LIBOR USD + 1.850%), | | | | | | | | |
| | | | | | | | |
| 07/20/2031 (a)(b)(c) | | | 6,000,000 | | | | 5,916,000 | |
14A, 5.754% (3 Month LIBOR USD + 5.500%), | | | | | | | | |
| | | | | | | | |
| 07/20/2031 (a)(b)(c) | | | 1,000,000 | | | | 888,826 | |
| | | | | | | | | |
| LCM XV LP | | | | | | | | |
15A, 3.954% (3 Month LIBOR USD + 3.700%), | | | | | | | | |
| | | | | | | | |
| 07/20/2030 (a)(b)(c) | | | 9,000,000 | | | | 8,942,040 | |
| | | | | | | | | |
| LCM XVI LP | | | | | | | | |
16A, 1.991% (3 Month LIBOR USD + 1.750%), | | | | | | | | |
| | | | | | | | |
| 10/15/2031 (a)(b)(c) | | | 4,000,000 | | | | 3,981,376 | |
16A, 2.391% (3 Month LIBOR USD + 2.150%), | | | | | | | | |
| | | | | | | | |
| 10/15/2031 (a)(b)(c) | | | 5,100,000 | | | | 5,043,212 | |
16A, 6.621% (3 Month LIBOR USD + 6.380%), | | | | | | | | |
| | | | | | | | |
| 10/15/2031 (a)(b)(c) | | | 1,600,000 | | | | 1,481,779 | |
| | | | | | | | | |
| LCM XVII LP | | | | | | | | |
17A, 6.241% (3 Month LIBOR USD + 6.000%), | | | | | | | | |
| | | | | | | | |
| 10/15/2031 (a)(b)(c) | | | 1,000,000 | | | | 900,816 | |
| | | | | | | | | |
| LCM XVIII LP | | | | | | | | |
19A, 1.991% (3 Month LIBOR USD + 1.750%), | | | | | | | | |
| | | | | | | | |
| 07/15/2027 (a)(b)(c) | | | 2,500,000 | | | | 2,501,668 | |
19A, 2.941% (3 Month LIBOR USD + 2.700%), | | | | | | | | |
| | | | | | | | |
| 07/15/2027 (a)(b)(c) | | | 4,000,000 | | | | 4,002,052 | |
| 18A, 6.204% | | | | | | | | |
| (3 Month LIBOR USD + 5.950%), | | | | | | | | |
| 04/20/2031 (a)(b)(c) | | | 5,300,000 | | | | 4,842,424 | |
| | | | | | | | | |
| LCM XXII Ltd. | | | | | | | | |
22A, 1.704% (3 Month LIBOR USD + 1.450%), | | | | | | | | |
| | | | | | | | |
| 10/20/2028 (a)(b)(c) | | | 5,000,000 | | | | 4,958,145 | |
Percentages are stated as a percent of net assets.
The accompanying notes are an integral part of these financial statements.
PERFORMANCE TRUST STRATEGIC BOND FUND — SCHEDULE OF INVESTMENTS (CONT.)
February 28, 2022 (Unaudited)
| | | PRINCIPAL | | | | |
| | | AMOUNT | | | VALUE | |
| | | | | | | |
| LCM XXII Ltd. (Cont.) | | | | | | |
22A, 3.054% (3 Month LIBOR USD + 2.800%), | | | | | | |
| | | | | | |
| 10/20/2028 (a)(b)(c) | | $ | 2,000,000 | | | $ | 1,971,286 | |
| | | | | | | | | |
| LCM XXV Ltd. | | | | | | | | |
25A, 3.704% (3 Month LIBOR USD + 3.450%), | | | | | | | | |
| | | | | | | | |
| 07/20/2030 (a)(b)(c) | | | 4,000,000 | | | | 3,901,608 | |
| | | | | | | | | |
| Long Point Park CLO Ltd. | | | | | | | | |
2017-1A, 2.641% (3 Month LIBOR USD + 2.400%), | | | | | | | | |
| | | | | | | | |
| 01/17/2030 (a)(b)(c) | | | 4,000,000 | | | | 3,853,904 | |
2017-1A, 5.841% (3 Month LIBOR USD + 5.600%), | | | | | | | | |
| | | | | | | | |
| 01/17/2030 (a)(b)(c) | | | 2,000,000 | | | | 1,893,382 | |
| | | | | | | | | |
| Magnetite VIII Ltd. | | | | | | | | |
2014-8A, 3.141% (3 Month LIBOR USD + 2.900%), | | | | | | | | |
| | | | | | | | |
| 04/15/2031 (a)(b)(c) | | | 10,150,000 | | | | 10,104,031 | |
| | | | | | | | | |
| Magnetite XII Ltd. | | | | | | | | |
2015-12A, 5.921% (3 Month LIBOR USD + 5.680%), | | | | | | | | |
| | | | | | | | |
| 10/15/2031 (a)(b)(c) | | | 8,923,000 | | | | 8,584,934 | |
| | | | | | | | | |
| Magnetite XIV-R Ltd. | | | | | | | | |
2018-14A, 3.091% (3 Month LIBOR USD + 2.850%), | | | | | | | | |
| | | | | | | | |
| 10/18/2031 (a)(b)(c) | | | 1,500,000 | | | | 1,495,903 | |
| | | | | | | | | |
| Magnetite XV Ltd. | | | | | | | | |
2015-15A, 3.008% (3 Month LIBOR USD + 2.750%), | | | | | | | | |
| | | | | | | | |
| 07/25/2031 (a)(b)(c) | | | 2,000,000 | | | | 1,990,414 | |
| Magnetite XVIII Ltd. | | | | | | | | |
2016-18A, 3.206% (3 Month LIBOR USD + 2.700%), | | | | | | | | |
| | | | | | | | |
| 11/15/2028 (a)(b)(c) | | | 9,315,000 | | | | 9,294,731 | |
| | | | | | | | | |
| Magnetite XXII Ltd. | | | | | | | | |
2019-22A, 3.341% (3 Month LIBOR USD + 3.100%), | | | | | | | | |
| | | | | | | | |
| 04/15/2031 (a)(b)(c) | | | 2,000,000 | | | | 1,999,000 | |
| | | | | | | | | |
| Magnetite XXIII Ltd. | | | | | | | | |
2019-23A, 6.421% (3 Month LIBOR USD + 6.300%), | | | | | | | | |
| | | | | | | | |
| 01/25/2035 (a)(b)(c) | | | 2,750,000 | | | | 2,677,064 | |
| | | | | | | | | |
| Magnetite XXVII Ltd. | | | | | | | | |
2020-27A, 6.254% (3 Month LIBOR USD + 6.000%), | | | | | | | | |
| | | | | | | | |
| 10/20/2034 (a)(b)(c) | | | 5,250,000 | | | | 5,123,002 | |
| | | | | | | | | |
| Magnetite XXVIII Ltd. | | | | | | | | |
2020-28A, 6.380% (3 Month LIBOR USD + 6.150%), | | | | | | | | |
| | | | | | | | |
| 01/20/2035 (a)(b)(c) | | | 2,250,000 | | | | 2,197,660 | |
| | | | | | | | | |
| Magnetite XXX Ltd. | | | | | | | | |
2021-30A, 6.332% (3 Month LIBOR USD + 6.200%), | | | | | | | | |
| | | | | | | | |
| 10/25/2034 (a)(b)(c) | | | 4,100,000 | | | | 4,047,930 | |
| | | | | | | | | |
| Mountain View CLO XV Ltd. | | | | | | | | |
2019-2A, 2.141% (3 Month LIBOR USD + 1.900%), | | | | | | | | |
| | | | | | | | |
| 01/15/2033 (a)(b)(c) | | | 3,000,000 | | | | 2,992,008 | |
| | | | | | | | | |
| Neuberger Berman Loan | | | | | | | | |
| Advisers CLO 35 Ltd. | | | | | | | | |
2019-35A, 3.948% (3 Month LIBOR USD + 3.700%), | | | | | | | | |
| | | | | | | | |
| 01/19/2033 (a)(b)(c) | | | 5,000,000 | | | | 4,970,415 | |
| | | | | | | | | |
| Neuberger Berman Loan | | | | | | | | |
| Advisers CLO 38 Ltd. | | | | | | | | |
2020-38A, 1.904% (3 Month LIBOR USD + 1.650%), | | | | | | | | |
| | | | | | | | |
| 10/20/2035 (a)(b)(c) | | | 7,000,000 | | | | 6,952,603 | |
| | | | | | | | | |
| Niagara Park CLO Ltd. | | | | | | | | |
2019-1A, 6.191% (3 Month LIBOR USD + 5.950%), | | | | | | | | |
| | | | | | | | |
| 07/17/2032 (a)(b)(c) | | | 2,000,000 | | | | 1,957,570 | |
| | | | | | | | | |
| Octagon Investment | | | | | | | | |
| Partners 26 Ltd. | | | | | | | | |
2016-1A, 2.041% (3 Month LIBOR USD + 1.800%), | | | | | | | | |
| | | | | | | | |
| 07/15/2030 (a)(b)(c) | | | 6,220,000 | | | | 6,116,630 | |
| | | | | | | | | |
| Octagon Investment | | | | | | | | |
| Partners 41 Ltd. | | | | | | | | |
2019-2A, 1.941% (3 Month LIBOR USD + 1.700%), | | | | | | | | |
| | | | | | | | |
| 10/15/2033 (a)(b)(c) | | | 10,000,000 | | | | 9,938,500 | |
| | | | | | | | | |
| Octagon Investment | | | | | | | | |
| Partners 49 Ltd. | | | | | | | | |
2020-5A, 1.791% (3 Month LIBOR USD + 1.550%), | | | | | | | | |
| | | | | | | | |
| 01/15/2033 (a)(b)(c) | | | 1,750,000 | | | | 1,736,541 | |
| | | | | | | | | |
| OHA Credit XIII Ltd. | | | | | | | | |
2016-13A, 1.955% (3 Month LIBOR USD + 1.700%), | | | | | | | | |
| | | | | | | | |
| 10/25/2034 (a)(b)(c) | | | 5,000,000 | | | | 4,969,465 | |
| | | | | | | | | |
| RR Ltd. | | | | | | | | |
2021-17A, 1.891% (3 Month LIBOR USD + 1.650%), | | | | | | | | |
| | | | | | | | |
| 07/15/2034 (a)(b)(c) | | | 5,000,000 | | | | 4,977,260 | |
| | | | | | | | | |
| Treman Park CLO Ltd. | | | | | | | | |
2015-1A, 7.664% (3 Month LIBOR USD + 7.410%), | | | | | | | | |
| | | | | | | | |
| 10/20/2028 (a)(b)(c) | | | 1,750,000 | | | | 1,721,723 | |
Percentages are stated as a percent of net assets.
The accompanying notes are an integral part of these financial statements.
PERFORMANCE TRUST STRATEGIC BOND FUND — SCHEDULE OF INVESTMENTS (CONT.)
February 28, 2022 (Unaudited)
| | | PRINCIPAL | | | | |
| | | AMOUNT | | | VALUE | |
| | | | | | | |
| Verde CLO Ltd. | | | | | | |
2019-1A, 1.841% (3 Month LIBOR USD + 1.600%), | | | | | | |
| | | | | | |
| 04/15/2032 (a)(b)(c) | | $ | 2,000,000 | | | $ | 1,984,142 | |
| | | | | | | | | |
| Webster Park CLO Ltd. | | | | | | | | |
2015-1A, 2.054% (3 Month LIBOR USD + 1.800%), | | | | | | | | |
| | | | | | | | |
| 07/20/2030 (a)(b)(c) | | | 10,300,000 | | | | 10,179,861 | |
2015-1A, 3.154% (3 Month LIBOR USD + 2.900%), | | | | | | | | |
| | | | | | | | |
| 07/20/2030 (a)(b)(c) | | | 4,800,000 | | | | 4,748,203 | |
| | | | | | | | | |
| Whetstone Park CLO Ltd. | | | | | | | | |
2021-1A, 2.790%, 01/20/2035 (a)(c) | | | | | | | | |
| | | 1,400,000 | | | | 1,373,050 | |
| TOTAL COLLATERALIZED LOAN | | | | | | | | |
| OBLIGATIONS (Cost $475,134,922) | | | | | | | 473,806,751 | |
| | | | | | | | | |
| CORPORATE BONDS – 23.93% | | | | | | | | |
| | | | | | | | | |
| Accommodation – 0.05% | | | | | | | | |
| | | | | | | | | |
| Station Casinos, LLC | | | | | | | | |
| 4.625%, 12/01/2031 (a) | | | 3,250,000 | | | | 3,066,960 | |
| | | | | | | | | |
| Administrative and | | | | | | | | |
| Support Services – 1.15% | | | | | | | | |
| | | | | | | | | |
| ADT Security Corp. | | | | | | | | |
| 4.125%, 08/01/2029 (a) | | | 9,650,000 | | | | 9,114,956 | |
| | | | | | | | | |
| Central Storage | | | | | | | | |
| Safety Project Trust | | | | | | | | |
| 4.823%, 02/01/2038 (a) | | | 6,587,840 | | | | 7,363,620 | |
| | | | | | | | | |
| Equifax, Inc. | | | | | | | | |
| 2.350%, 09/15/2031 | | | 5,000,000 | | | | 4,596,397 | |
| | | | | | | | | |
| ERAC USA Finance, LLC | | | | | | | | |
| 7.000%, 10/15/2037 (a) | | | 7,957,000 | | | | 11,197,366 | |
| | | | | | | | | |
| MSCI, Inc. | | | | | | | | |
| 4.000%, 11/15/2029 (a) | | | 5,000,000 | | | | 5,035,150 | |
| 3.625%, 11/01/2031 (a) | | | 5,000,000 | | | | 4,919,100 | |
| 3.250%, 08/15/2033 (a) | | | 4,310,000 | | | | 4,079,372 | |
| | | | | | | | | |
| Northwell Healthcare, Inc. | | | | | | | | |
| 3.391%, 11/01/2027 | | | 4,652,000 | | | | 4,759,019 | |
| | | | | | | | | |
| Scotts Miracle-Gro Co. | | | | | | | | |
| 4.000%, 04/01/2031 | | | 2,425,000 | | | | 2,228,672 | |
| 4.375%, 02/01/2032 | | | 9,878,000 | | | | 9,134,187 | |
| | | | | | | | | |
| Visa, Inc. | | | | | | | | |
| 4.150%, 12/14/2035 | | | 7,450,000 | | | | 8,392,977 | |
| | | | | | | | | |
| Wildflower Improvement | | | | | | | | |
| Association | | | | | | | | |
| 6.625%, 03/01/2031 (a)(e) | | | 6,682,236 | | | | 6,686,809 | |
| | | | | | | | | |
| Air Transportation – 0.25% | | | | | | | | |
| | | | | | | | | |
| Delta Air Lines, Inc. | | | | | | | | |
| 7.000%, 05/01/2025 (a) | | | 6,190,000 | | | | 6,885,368 | |
| | | | | | | | | |
| Southwest Airlines Co. | | | | | | | | |
| 5.125%, 06/15/2027 | | | 8,780,000 | | | | 9,749,355 | |
| | | | | | | | | |
| Ambulatory Health | | | | | | | | |
| Care Services – 0.43% | | | | | | | | |
| | | | | | | | | |
| Ascension Health | | | | | | | | |
| 3.106%, 11/15/2039 | | | 15,000,000 | | | | 14,785,639 | |
| | | | | | | | | |
| Piedmont Healthcare, Inc. | | | | | | | | |
| 2.044%, 01/01/2032 | | | 5,000,000 | | | | 4,610,702 | |
| | | | | | | | | |
| Toledo Hospital | | | | | | | | |
| 6.015%, 11/15/2048 | | | 6,980,000 | | | | 9,686,722 | |
| | | | | | | | | |
| Amusement, Gambling, and | | | | | | | | |
| Recreation Industries – 0.08% | | | | | | | | |
| | | | | | | | | |
| YMCA of Greater New York | | | | | | | | |
| 2.303%, 08/01/2026 | | | 5,730,000 | | | | 5,677,774 | |
| | | | | | | | | |
| Beverage and Tobacco | | | | | | | | |
| Product Manufacturing – 0.27% | | | | | | | | |
| | | | | | | | | |
| Coca-Cola Co. | | | | | | | | |
| 2.000%, 03/05/2031 | | | 10,000,000 | | | | 9,480,800 | |
| | | | | | | | | |
| Keurig Dr. Pepper, Inc. | | | | | | | | |
| 4.597%, 05/25/2028 | | | 7,974,000 | | | | 8,717,914 | |
| | | | | | | | | |
| Broadcasting | | | | | | | | |
| (except Internet) – 0.35% | | | | | | | | |
| | | | | | | | | |
| CCO Holdings Capital Corp. | | | | | | | | |
| 4.750%, 02/01/2032 (a) | | | 2,000,000 | | | | 1,944,430 | |
| 4.250%, 01/15/2034 (a) | | | 11,250,000 | | | | 10,320,948 | |
| | | | | | | | | |
| Sirius XM Radio, Inc. | | | | | | | | |
| 3.125%, 09/01/2026 (a) | | | 5,500,000 | | | | 5,259,981 | |
| 3.875%, 09/01/2031 (a) | | | 6,500,000 | | | | 5,998,297 | |
| | | | | | | | | |
| Building Material and | | | | | | | | |
| Garden Equipment and | | | | | | | | |
| Supplies Dealers – 0.48% | | | | | | | | |
| | | | | | | | | |
| Home Depot, Inc. | | | | | | | | |
| 1.375%, 03/15/2031 | | | 10,000,000 | | | | 8,961,415 | |
| 5.875%, 12/16/2036 | | | 5,000,000 | | | | 6,613,345 | |
| 5.400%, 09/15/2040 | | | 5,000,000 | | | | 6,254,549 | |
| | | | | | | | | |
| Lowe’s Companies, Inc. | | | | | | | | |
| 1.700%, 09/15/2028 | | | 10,846,000 | | | | 10,200,737 | |
| | | | | | | | | |
| Chemical Manufacturing – 0.70% | | | | | | | | |
| | | | | | | | | |
| Axalta Coating Systems, LLC | | | | | | | | |
| 3.375%, 02/15/2029 (a) | | | 14,105,000 | | | | 12,891,124 | |
| | | | | | | | | |
| Bristol-Myers Squibb Co. | | | | | | | | |
| 4.125%, 06/15/2039 | | | 8,734,000 | | | | 9,570,416 | |
| | | | | | | | | |
| Roche Holdings, Inc. | | | | | | | | |
| 1.930%, 12/13/2028 (a) | | | 7,000,000 | | | | 6,734,614 | |
| | | | | | | | | |
| Wyeth LLC | | | | | | | | |
| 5.950%, 04/01/2037 | | | 13,738,000 | | | | 18,027,218 | |
Percentages are stated as a percent of net assets.
The accompanying notes are an integral part of these financial statements.
PERFORMANCE TRUST STRATEGIC BOND FUND — SCHEDULE OF INVESTMENTS (CONT.)
February 28, 2022 (Unaudited)
| | | PRINCIPAL | | | | |
| | | AMOUNT | | | VALUE | |
| | | | | | | |
| Computer and Electronic | | | | | | |
| Product Manufacturing – 0.96% | | | | | | |
| | | | | | | |
| Apple, Inc. | | | | | | |
| 1.650%, 02/08/2031 | | $ | 20,000,000 | | | $ | 18,602,738 | |
| 2.375%, 02/08/2041 | | | 10,000,000 | | | | 8,895,086 | |
| | | | | | | | | |
| Ciena Corp. | | | | | | | | |
| 4.000%, 01/31/2030 (a) | | | 1,000,000 | | | | 986,160 | |
| | | | | | | | | |
| Dell International, LLC | | | | | | | | |
| 5.300%, 10/01/2029 | | | 10,100,000 | | | | 11,292,228 | |
| | | | | | | | | |
| Intel Corp. | | | | | | | | |
| 3.900%, 03/25/2030 | | | 10,000,000 | | | | 10,779,720 | |
| | | | | | | | | |
| NVIDIA Corp. | | | | | | | | |
| 2.000%, 06/15/2031 | | | 5,000,000 | | | | 4,705,660 | |
| | | | | | | | | |
| Siemens | | | | | | | | |
| Financieringsmaatschappij NV | | | | | | | | |
| 2.150%, 03/11/2031 (a)(c) | | | 9,650,000 | | | | 9,185,834 | |
| | | | | | | | | |
| Construction of Buildings – 0.35% | | | | | | | | |
| | | | | | | | | |
| Ashton Woods USA, LLC | | | | | | | | |
| 4.625%, 04/01/2030 (a) | | | 2,600,000 | | | | 2,453,711 | |
| | | | | | | | | |
| Century Communities, Inc. | | | | | | | | |
| 3.875%, 08/15/2029 (a) | | | 3,925,000 | | | | 3,646,521 | |
| | | | | | | | | |
| KB Home | | | | | | | | |
| 4.800%, 11/15/2029 | | | 6,197,000 | | | | 6,203,972 | |
| 4.000%, 06/15/2031 | | | 483,000 | | | | 462,195 | |
| | | | | | | | | |
| LGI Homes, Inc. | | | | | | | | |
| 4.000%, 07/15/2029 (a) | | | 7,000,000 | | | | 6,542,900 | |
| | | | | | | | | |
| M/I Homes, Inc. | | | | | | | | |
| 3.950%, 02/15/2030 | | | 5,000,000 | | | | 4,555,375 | |
| | | | | | | | | |
| Credit Intermediation and | | | | | | | | |
| Related Activities – 7.10% | | | | | | | | |
| | | | | | | | | |
| JPMorgan Chase & Co. | | | | | | | | |
| 2.963% (SOFR + 1.260%), | | | | | | | | |
| 01/25/2033 (b) | | | 10,000,000 | | | | 9,896,494 | |
| | | | | | | | | |
| National Australia Bank Ltd. | | | | | | | | |
| 3.347% (5 Year CMT | | | | | | | | |
| Rate + 1.700%), | | | | | | | | |
| 01/12/2037 (a)(b)(c) | | | 9,500,000 | | | | 9,074,559 | |
| | | | | | | | | |
| American AGcredit FLCA | | | | | | | | |
| 3.375% to 06/15/2031 then | | | | | | | | |
| SOFR + 2.120%, | | | | | | | | |
| 06/15/2036 (a)(b) | | | 10,000,000 | | | | 9,852,847 | |
| | | | | | | | | |
| Atlantic Union Bankshares Corp. | | | | | | | | |
| 2.875% to 12/15/2026 then | | | | | | | | |
| SOFR + 1.860%, 12/15/2031 (b) | | | 9,500,000 | | | | 9,301,002 | |
| | | | | | | | | |
| Bank of America Corp. | | | | | | | | |
| 2.087% to 05/14/2029 then | | | | | | | | |
| SOFR + 1.060%, 06/14/2029 (b) | | | 12,000,000 | | | | 11,369,770 | |
| 2.651% to 03/11/31 then | | | | | | | | |
| SOFR + 1.220%, 03/11/2032 (b) | | | 10,000,000 | | | | 9,570,785 | |
| | | | | | | | | |
| Bank of Montreal | | | | | | | | |
| 3.088% (5 Year CMT | | | | | | | | |
| Rate + 1.400%), | | | | | | | | |
| 01/10/2037 (b)(c) | | | 15,000,000 | | | | 14,318,079 | |
| | | | | | | | | |
| Bank of Nova Scotia | | | | | | | | |
| 2.450%, 02/02/2032 (c) | | | 15,000,000 | | | | 14,240,890 | |
| | | | | | | | | |
| Bank of NT Butterfield & Son Ltd. | | | | | | | | |
| 5.250% to 06/01/2023 then | | | | | | | | |
| 3 Month LIBOR USD + 2.255%, | | | | | | | | |
| 06/01/2028 (b)(c) | | | 3,000,000 | | | | 3,083,401 | |
| 5.250% to 06/15/2025 then | | | | | | | | |
| SOFR + 5.060%, | | | | | | | | |
| 06/15/2030 (b)(c) | | | 5,000,000 | | | | 5,364,522 | |
| | | | | | | | | |
| Bank OZK | | | | | | | | |
| 2.750% to 10/01/2026 then | | | | | | | | |
| SOFR + 2.090%, 10/01/2031 (b) | | | 15,175,000 | | | | 15,199,170 | |
| | | | | | | | | |
| Banner Corp. | | | | | | | | |
| 5.000% to 06/30/2025 then | | | | | | | | |
| SOFR + 4.890%, 06/30/2030 (b) | | | 5,000,000 | | | | 5,241,775 | |
| | | | | | | | | |
| Barclays PLC | | | | | | | | |
| 6.125% to 12/15/2025, then 5 Year | | | | | | | | |
| CMT Rate + 5.867% (b)(c)(i)(k) | | | 12,050,000 | | | | 12,501,875 | |
| | | | | | | | | |
| BlueHub Loan Fund, Inc. | | | | | | | | |
| 3.099%, 01/01/2030 | | | 3,040,000 | | | | 3,085,236 | |
| | | | | | | | | |
| Bryn Mawr Bank Corp. | | | | | | | | |
| 4.250% to 12/15/2022 then | | | | | | | | |
| 3 Month LIBOR USD + 2.050%, | | | | | | | | |
| 12/15/2027 (b) | | | 3,500,000 | | | | 3,530,896 | |
| | | | | | | | | |
| Citigroup, Inc. | | | | | | | | |
| 3.980% to 03/20/2029 then | | | | | | | | |
| 3 Month LIBOR USD + 1.338%, | | | | | | | | |
| 03/20/2030 (b) | | | 8,679,000 | | | | 9,139,452 | |
| | | | | | | | | |
| CNB Financial Corp. | | | | | | | | |
| 3.250% to 6/15/2026 then | | | | | | | | |
| SOFR + 2.580%, | | | | | | | | |
| 06/15/2031 (a)(b) | | | 8,000,000 | | | | 7,922,736 | |
| | | | | | | | | |
| Compeer Financial FLCA | | | | | | | | |
| 2.750% to 06/01/2026 then | | | | | | | | |
| SOFR + 2.030%, | | | | | | | | |
| 06/01/2031 (a)(b) | | | 5,000,000 | | | | 4,886,565 | |
| 3.375% to 06/01/2031 then | | | | | | | | |
| SOFR + 1.965%, | | | | | | | | |
| 06/01/2036 (a)(b) | | | 4,750,000 | | | | 4,689,564 | |
| | | | | | | | | |
| First Busey Corp. | | | | | | | | |
| 5.250% to 06/01/2025 then | | | | | | | | |
| SOFR + 5.110%, 06/01/2030 (b) | | | 4,000,000 | | | | 4,187,634 | |
| | | | | | | | | |
| First Citizens BancShares, Inc. | | | | | | | | |
| 3.375% to 03/15/2025 then | | | | | | | | |
| SOFR + 2.465%, 03/15/2030 (b) | | | 7,500,000 | | | | 7,498,713 | |
Percentages are stated as a percent of net assets.
The accompanying notes are an integral part of these financial statements.
PERFORMANCE TRUST STRATEGIC BOND FUND — SCHEDULE OF INVESTMENTS (CONT.)
February 28, 2022 (Unaudited)
| | | PRINCIPAL | | | | |
| | | AMOUNT | | | VALUE | |
| | | | | | | |
| First Financial Bancorp | | | | | | |
| 5.250% to 05/15/2025 then | | | | | | |
| SOFR + 5.090%, 05/15/2030 (b) | | $ | 4,000,000 | | | $ | 4,200,088 | |
| | | | | | | | | |
| First Foundation, Inc. | | | | | | | | |
| 3.500% to 02/01/2027 then | | | | | | | | |
| SOFR + 2.040%, 02/01/2032 (b) | | | 9,500,000 | | | | 9,495,787 | |
| | | | | | | | | |
| First Mid Bancshares, Inc. | | | | | | | | |
| 3.950% to 10/15/2025 then | | | | | | | | |
| SOFR + 3.830%, 10/15/2030 (b) | | | 5,300,000 | | | | 5,381,340 | |
| | | | | | | | | |
| First Midwest Bancorp, Inc. | | | | | | | | |
| 5.875%, 09/29/2026 | | | 8,500,000 | | | | 9,587,463 | |
| | | | | | | | | |
| Firstbank | | | | | | | | |
| 4.500% to 09/01/2025 then | | | | | | | | |
| SOFR + 4.390%, 09/01/2030 (b) | | | 5,000,000 | | | | 5,147,635 | |
| | | | | | | | | |
| First-Citizens Bank & Trust Co. | | | | | | | | |
| 6.125%, 03/09/2028 | | | 6,406,000 | | | | 7,337,904 | |
| | | | | | | | | |
| Flushing Financial Corp. | | | | | | | | |
| 3.125% to 12/01/2026 then | | | | | | | | |
| SOFR + 2.035%, 12/01/2031 (b) | | | 5,000,000 | | | | 4,940,912 | |
| | | | | | | | | |
| Great Southern Bank | | | | | | | | |
| 5.500% to 06/15/2025 then | | | | | | | | |
| SOFR + 5.325%, 06/15/2030 (b) | | | 4,750,000 | | | | 5,020,511 | |
| | | | | | | | | |
| Heartland Financial USA, Inc. | | | | | | | | |
| 2.750% to 09/15/2026 then | | | | | | | | |
| SOFR + 2.100%, 09/15/2031 (b) | | | 6,000,000 | | | | 5,892,916 | |
| | | | | | | | | |
| Heritage Commerce Corp. | | | | | | | | |
| 5.250% to 06/01/2022 then | | | | | | | | |
| 3 Month LIBOR USD + 3.365%, | | | | | | | | |
| 06/01/2027 (b) | | | 3,935,000 | | | | 3,940,852 | |
| | | | | | | | | |
| Hilltop Holdings, Inc. | | | | | | | | |
| 6.125% to 05/15/2030 then | | | | | | | | |
| SOFR + 5.800%, 05/15/2035 (b) | | | 9,000,000 | | | | 9,951,510 | |
| | | | | | | | | |
| HomeStreet, Inc. | | | | | | | | |
| 3.500% to 01/30/2027 then | | | | | | | | |
| SOFR + 2.150%, 01/30/2032 (b) | | | 6,500,000 | | | | 6,473,124 | |
| | | | | | | | | |
| Huntington National Bank | | | | | | | | |
| 5.500% to 05/06/2025 then | | | | | | | | |
| 3 Month LIBOR USD + 5.090%, | | | | | | | | |
| 05/06/2030 (b) | | | 2,000,000 | | | | 2,152,295 | |
| | | | | | | | | |
| Independent Bank Group, Inc. | | | | | | | | |
| 4.000% to 09/15/2025 then | | | | | | | | |
| SOFR + 3.885%, 09/15/2030 (b) | | | 7,000,000 | | | | 7,221,296 | |
| | | | | | | | | |
| John Deere Capital Corp. | | | | | | | | |
| 2.000%, 06/17/2031 | | | 10,000,000 | | | | 9,522,556 | |
| | | | | | | | | |
| JPMorgan Chase & Co. | | | | | | | | |
| 2.069% to 06/01/2028 then | | | | | | | | |
| SOFR + 1.015%, 06/01/2029 (b) | | | 5,000,000 | | | | 4,744,076 | |
| | | | | | | | | |
| Mercantile Bank Corp. | | | | | | | | |
| 3.250% to 01/30/2032 then | | | | | | | | |
| SOFR + 2.120%, | | | | | | | | |
| 01/30/2032 (a)(b) | | | 7,000,000 | | | | 6,860,525 | |
| | | | | | | | | |
| NBT Bancorp, Inc. | | | | | | | | |
| 5.000% to 07/01/2025 then | | | | | | | | |
| SOFR + 4.850%, 07/01/2030 (b) | | | 7,500,000 | | | | 7,920,698 | |
| | | | | | | | | |
| NexBank Capital, Inc. | | | | | | | | |
| 4.000% to 08/15/2026 then | | | | | | | | |
| SOFR + 3.390%, | | | | | | | | |
| 08/15/2031 (a)(b) | | | 6,500,000 | | | | 6,580,615 | |
| | | | | | | | | |
| OceanFirst Financial Corp. | | | | | | | | |
| 5.250% to 05/15/2025 then | | | | | | | | |
| SOFR + 5.095%, 05/15/2030 (b) | | | 5,000,000 | | | | 5,285,868 | |
| | | | | | | | | |
| OneMain Finance Corp. | | | | | | | | |
| 3.500%, 01/15/2027 | | | 5,000,000 | | | | 4,737,300 | |
| 5.375%, 11/15/2029 | | | 10,003,000 | | | | 10,078,022 | |
| | | | | | | | | |
| Oxford Finance Co-Issuer II, Inc. | | | | | | | | |
| 6.375%, 02/01/2027 (a) | | | 750,000 | | | | 768,510 | |
| | | | | | | | | |
| Pacific Life Global Funding II | | | | | | | | |
| 2.450%, 01/11/2032 (a) | | | 14,000,000 | | | | 13,629,240 | |
| | | | | | | | | |
| Pacific Premier Bancorp, Inc. | | | | | | | | |
| 4.875% to 05/15/2024 then | | | | | | | | |
| 3 Month LIBOR USD + 2.500%, | | | | | | | | |
| 05/15/2029 (b) | | | 4,000,000 | | | | 4,094,590 | |
| 5.375% to 06/15/2025 then | | | | | | | | |
| SOFR + 5.170%, 06/15/2030 (b) | | | 5,000,000 | | | | 5,353,238 | |
| | | | | | | | | |
| Park National Corp. | | | | | | | | |
| 4.500% to 09/01/2025 then | | | | | | | | |
| SOFR + 4.390%, 09/01/2030 (b) | | | 5,100,000 | | | | 5,265,595 | |
| | | | | | | | | |
| Peapack-Gladstone Financial Corp. | | | | | | | | |
| 3.500% to 12/30/2025 then | | | | | | | | |
| SOFR + 3.260%, 12/30/2030 (b) | | | 7,500,000 | | | | 7,500,931 | |
| | | | | | | | | |
| Pinnacle Financial Partners, Inc. | | | | | | | | |
| 4.125% to 09/15/2024 then | | | | | | | | |
| 3 Month LIBOR USD + 2.775%, | | | | | | | | |
| 09/15/2029 (b) | | | 6,000,000 | | | | 6,166,403 | |
| | | | | | | | | |
| RBB Bancorp | | | | | | | | |
| 4.000% to 04/01/2026 then | | | | | | | | |
| SOFR + 3.290%, 04/01/2031 (b) | | | 5,450,000 | | | | 5,524,809 | |
| | | | | | | | | |
| Sandy Spring Bancorp, Inc. | | | | | | | | |
| 4.250% to 11/15/2024 then | | | | | | | | |
| SOFR + 2.882%, 11/15/2029 (b) | | | 5,500,000 | | | | 5,706,724 | |
| | | | | | | | | |
| Signature Bank | | | | | | | | |
| 4.125% to 11/01/2024 then | | | | | | | | |
| 3 Month LIBOR USD + 2.559%, | | | | | | | | |
| 11/01/2029 (b) | | | 5,000,000 | | | | 5,140,237 | |
| | | | | | | | | |
| Southside Bancshares, Inc. | | | | | | | | |
| 3.875% to 11/15/2025 then | | | | | | | | |
| SOFR + 3.660%, 11/15/2030 (b) | | | 7,000,000 | | | | 7,091,357 | |
| | | | | | | | | |
| Summit Financial Group, Inc. | | | | | | | | |
| 3.250% to 12/01/2026 then | | | | | | | | |
| SOFR + 2.300%, | | | | | | | | |
| 12/01/2031 (a)(b) | | | 4,000,000 | | | | 3,932,100 | |
Percentages are stated as a percent of net assets.
The accompanying notes are an integral part of these financial statements.
PERFORMANCE TRUST STRATEGIC BOND FUND — SCHEDULE OF INVESTMENTS (CONT.)
February 28, 2022 (Unaudited)
| | | PRINCIPAL | | | | |
| | | AMOUNT | | | VALUE | |
| | | | | | | |
| Texas Capital Bancshares, Inc. | | | | | | |
| 4.000% (5 Year CMT Rate + | | | | | | |
| 3.150%), 05/06/2031 (b) | | $ | 10,942,000 | | | $ | 11,035,342 | |
| | | | | | | | | |
| Texas Capital Bank, NA | | | | | | | | |
| 5.250%, 01/31/2026 | | | 5,000,000 | | | | 5,312,339 | |
| | | | | | | | | |
| Toronto-Dominion Bank | | | | | | | | |
| 2.000%, 09/10/2031 (c) | | | 10,000,000 | | | | 9,296,117 | |
| 2.450%, 01/12/2032 (c) | | | 6,000,000 | | | | 5,776,422 | |
| | | | | | | | | |
| Towne Bank | | | | | | | | |
| 3.125% to 02/15/2027 then | | | | | | | | |
| SOFR + 1.680%, 02/15/2032 (b) | | | 7,000,000 | | | | 6,981,321 | |
| 4.500% to 07/30/2022 then | | | | | | | | |
| 3 Month LIBOR USD + 2.550%, | | | | | | | | |
| 07/30/2027 (b) | | | 4,000,000 | | | | 4,033,325 | |
| | | | | | | | | |
| Toyota Motor Credit Corp. | | | | | | | | |
| 1.900%, 09/12/2031 | | | 5,000,000 | | | | 4,625,569 | |
| | | | | | | | | |
| Trustmark Corp. | | | | | | | | |
| 3.625% to 12/01/2025 then | | | | | | | | |
| SOFR + 3.387%, 12/01/2030 (b) | | | 6,500,000 | | | | 6,555,662 | |
| | | | | | | | | |
| UBS Group AG | | | | | | | | |
| 2.746% (1 Year CMT | | | | | | | | |
| Rate + 1.100%), | | | | | | | | |
| 02/11/2033 (a)(b)(c) | | | 10,000,000 | | | | 9,539,459 | |
| | | | | | | | | |
| UMB Financial Corp. | | | | | | | | |
| 3.700% (5 Year CMT | | | | | | | | |
| Rate + 3.437%), 09/17/2030 (b) | | | 5,000,000 | | | | 5,045,244 | |
| | | | | | | | | |
| Valley National Bancorp | | | | | | | | |
| 3.000% to 06/15/2026 then | | | | | | | | |
| SOFR + 2.360%, 06/15/2031 (b) | | | 7,300,000 | | | | 7,255,977 | |
| | | | | | | | | |
| Western Alliance Bancorp | | | | | | | | |
| 3.000% to 06/15/2026 then | | | | | | | | |
| SOFR + 2.250%, 06/15/2031 (b) | | | 5,900,000 | | | | 5,873,992 | |
| | | | | | | | | |
| Western Alliance Bank | | | | | | | | |
| 5.250% to 06/01/2025 then | | | | | | | | |
| SOFR + 5.120%, 06/01/2030 (b) | | | 5,000,000 | | | | 5,296,047 | |
| | | | | | | | | |
| WSFS Financial Corp. | | | | | | | | |
| 2.750% to 12/15/2025 then | | | | | | | | |
| SOFR + 2.485%, 12/15/2030 (b) | | | 4,470,000 | | | | 4,406,455 | |
| | | | | | | | | |
| Educational Services – 0.27% | | | | | | | | |
| | | | | | | | | |
| Austin Achieve Public | | | | | | | | |
| Schools, Inc. | | | | | | | | |
| 5.750%, 06/15/2026 | | | 1,710,000 | | | | 1,712,138 | |
| | | | | | | | | |
| Liberty University, Inc. | | | | | | | | |
| 3.338%, 03/01/2034 | | | 16,000,000 | | | | 16,122,545 | |
| | | | | | | | | |
| Fabricated Metal Product | | | | | | | | |
| Manufacturing – 0.28% | | | | | | | | |
| | | | | | | | | |
| Ball Corp. | | | | | | | | |
| 2.875%, 08/15/2030 | | | 15,475,000 | | | | 14,170,690 | |
| 3.125%, 09/15/2031 | | | 5,000,000 | | | | 4,589,600 | |
| | | | | | | | | |
| Food Manufacturing – 0.31% | | | | | | | | |
| | | | | | | | | |
| Archer-Daniels-Midland Co. | | | | | | | | |
| 3.250%, 03/27/2030 | | | 10,900,000 | | | | 11,314,083 | |
| | | | | | | | | |
| Hormel Foods Corp. | | | | | | | | |
| 1.700%, 06/03/2028 | | | 10,000,000 | | | | 9,568,584 | |
| | | | | | | | | |
| Food Services and | | | | | | | | |
| Drinking Places – 0.24% | | | | | | | | |
| | | | | | | | | |
| Papa John’s International, Inc. | | | | | | | | |
| 3.875%, 09/15/2029 (a) | | | 10,274,000 | | | | 9,569,203 | |
| | | | | | | | | |
| Yum! Brands, Inc. | | | | | | | | |
| 4.750%, 01/15/2030 (a) | | | 2,100,000 | | | | 2,135,301 | |
| 3.625%, 03/15/2031 | | | 4,467,000 | | | | 4,180,956 | |
| | | | | | | | | |
| Funds, Trusts, and Other | | | | | | | | |
| Financial Vehicles – 0.65% | | | | | | | | |
| | | | | | | | | |
| Ares Capital Corp. | | | | | | | | |
| 3.200%, 11/15/2031 | | | 15,000,000 | | | | 13,565,646 | |
| | | | | | | | | |
| New York Life Global Funding | | | | | | | | |
| 1.850%, 08/01/2031 (a) | | | 25,000,000 | | | | 22,740,957 | |
| | | | | | | | | |
| RGA Global Funding | | | | | | | | |
| 2.700%, 01/18/2029 (a) | | | 7,750,000 | | | | 7,630,846 | |
| | | | | | | | | |
| Furniture and Related | | | | | | | | |
| Product Manufacturing – 0.16% | | | | | | | | |
| | | | | | | | | |
| Tempur Sealy International, Inc. | | | | | | | | |
| 3.875%, 10/15/2031 (a) | | | 11,701,000 | | | | 10,530,900 | |
| | | | | | | | | |
| Hospitals – 1.27% | | | | | | | | |
| | | | | | | | | |
| Advocate Health & | | | | | | | | |
| Hospitals Corp. | | | | | | | | |
| 3.829%, 08/15/2028 | | | 15,000,000 | | | | 16,071,228 | |
| | | | | | | | | |
| Cedars-Sinai Health System | | | | | | | | |
| 2.288%, 08/15/2031 | | | 10,000,000 | | | | 9,463,532 | |
| | | | | | | | | |
| CHRISTUS Health | | | | | | | | |
| 4.341%, 07/01/2028 | | | 20,145,000 | | | | 21,884,863 | |
| | | | | | | | | |
| CommonSpirit Health | | | | | | | | |
| 2.782%, 10/01/2030 | | | 10,000,000 | | | | 9,765,726 | |
| 3.817%, 10/01/2049 | | | 1,800,000 | | | | 1,818,529 | |
| | | | | | | | | |
| Hackensack Meridian Health, Inc. | | | | | | | | |
| 2.675%, 09/01/2041 | | | 9,920,000 | | | | 8,919,089 | |
| | | | | | | | | |
| Memorial Health Services | | | | | | | | |
| 3.496%, 05/01/2022 | | | 575,000 | | | | 576,418 | |
| 3.447%, 11/01/2049 | | | 4,820,000 | | | | 4,777,811 | |
| | | | | | | | | |
| Orlando Health Obligated Group | | | | | | | | |
| 2.891%, 10/01/2035 | | | 1,000,000 | | | | 951,712 | |
| | | | | | | | | |
| Sutter Health | | | | | | | | |
| 3.695%, 08/15/2028 | | | 10,225,000 | | | | 10,821,637 | |
| | | | | | | | | |
| Insurance Carriers and | | | | | | | | |
| Related Activities – 0.88% | | | | | | | | |
| | | | | | | | | |
| Centene Corp. | | | | | | | | |
| 2.450%, 07/15/2028 | | | 13,441,000 | | | | 12,681,852 | |
| 3.000%, 10/15/2030 | | | 5,965,000 | | | | 5,695,060 | |
Percentages are stated as a percent of net assets.
The accompanying notes are an integral part of these financial statements.
PERFORMANCE TRUST STRATEGIC BOND FUND — SCHEDULE OF INVESTMENTS (CONT.)
February 28, 2022 (Unaudited)
| | | PRINCIPAL | | | | |
| | | AMOUNT | | | VALUE | |
| | | | | | | |
| Chubb INA Holdings, Inc. | | | | | | |
| 1.375%, 09/15/2030 | | $ | 12,483,000 | | | $ | 11,182,192 | |
| | | | | | | | | |
| Metropolitan Life | | | | | | | | |
| Global Funding I | | | | | | | | |
| 2.400%, 01/11/2032 (a) | | | 20,000,000 | | | | 19,286,909 | |
| | | | | | | | | |
| Renasant Corp. | | | | | | | | |
| 3.000% to 12/01/2026 then | | | | | | | | |
| SOFR + 1.910%, 12/01/2031 (b) | | | 5,000,000 | | | | 4,913,723 | |
| 4.500% to 09/15/2030 then | | | | | | | | |
| SOFR + 4.025%, 09/15/2035 (b) | | | 5,000,000 | | | | 5,344,124 | |
| | | | | | | | | |
| Management of Companies | | | | | | | | |
| and Enterprises – 0.38% | | | | | | | | |
| | | | | | | | | |
| Central Pacific Financial Corp. | | | | | | | | |
| 4.750% to 11/01/2025 then | | | | | | | | |
| SOFR + 4.560%, 11/01/2030 (b) | | | 5,000,000 | | | | 5,143,825 | |
| | | | | | | | | |
| First Interstate BancSystem, Inc. | | | | | | | | |
| 5.250% to 05/15/2025 then | | | | | | | | |
| SOFR + 5.180%, 05/15/2030 (b) | | | 5,000,000 | | | | 5,204,944 | |
| | | | | | | | | |
| Home BancShares, Inc. | | | | | | | | |
| 3.125% to 01/30/2027 then | | | | | | | | |
| SOFR + 1.820%, 01/30/2032 (b) | | | 9,000,000 | | | | 9,011,361 | |
| | | | | | | | | |
| New Red Finance, Inc. | | | | | | | | |
| 3.875%, 01/15/2028 (a)(c) | | | 4,000,000 | | | | 3,896,400 | |
| 3.500%, 02/15/2029 (a)(c) | | | 2,400,000 | | | | 2,266,428 | |
| | | | | | | | | |
| Merchant Wholesalers, | | | | | | | | |
| Durable Goods – 0.25% | | | | | | | | |
| | | | | | | | | |
| CDW Finance Corp. | | | | | | | | |
| 3.276%, 12/01/2028 | | | 1,650,000 | | | | 1,620,490 | |
| 3.250%, 02/15/2029 | | | 4,915,000 | | | | 4,587,956 | |
| 3.569%, 12/01/2031 | | | 800,000 | | | | 778,012 | |
| | | | | | | | | |
| Genuine Parts Co. | | | | | | | | |
| 2.750%, 02/01/2032 | | | 10,000,000 | | | | 9,575,374 | |
| | | | | | | | | |
| Merchant Wholesalers, | | | | | | | | |
| Nondurable Goods – 0.36% | | | | | | | | |
| | | | | | | | | |
| Cargill, Inc. | | | | | | | | |
| 2.125%, 04/23/2030 (a) | | | 5,632,000 | | | | 5,362,347 | |
| 2.125%, 11/10/2031 (a) | | | 20,000,000 | | | | 18,863,607 | |
| | | | | | | | | |
| Miscellaneous | | | | | | | | |
| Manufacturing – 0.16% | | | | | | | | |
| | | | | | | | | |
| Johnson & Johnson | | | | | | | | |
| 5.850%, 07/15/2038 | | | 8,180,000 | | | | 10,947,857 | |
| | | | | | | | | |
| Motor Vehicle and | | | | | | | | |
| Parts Dealers – 0.78% | | | | | | | | |
| | | | | | | | | |
| Asbury Automotive Group, Inc. | | | | | | | | |
| 5.000%, 02/15/2032 (a) | | | 5,800,000 | | | | 5,638,876 | |
| | | | | | | | | |
| AutoNation, Inc. | | | | | | | | |
| 3.850%, 03/01/2032 | | | 5,000,000 | | | | 5,050,134 | |
| | | | | | | | | |
| Group 1 Automotive, Inc. | | | | | | | | |
| 4.000%, 08/15/2028 (a) | | | 13,117,000 | | | | 12,664,136 | |
| | | | | | | | | |
| Lithia Motors, Inc. | | | | | | | | |
| 4.625%, 12/15/2027 (a) | | | 5,000,000 | | | | 5,118,425 | |
| 3.875%, 06/01/2029 (a) | | | 4,750,000 | | | | 4,687,157 | |
| 4.375%, 01/15/2031 (a) | | | 3,000,000 | | | | 3,027,420 | |
| | | | | | | | | |
| Penske Automotive Group, Inc. | | | | | | | | |
| 3.750%, 06/15/2029 | | | 6,450,000 | | | | 6,034,136 | |
| | | | | | | | | |
| Volkswagen Group of | | | | | | | | |
| America Finance, LLC | | | | | | | | |
| 3.750%, 05/13/2030 (a) | | | 10,000,000 | | | | 10,438,282 | |
| | | | | | | | | |
| Nonmetallic Mineral Product | | | | | | | | |
| Manufacturing – 0.10% | | | | | | | | |
| | | | | | | | | |
| Corning, Inc. | | | | | | | | |
| 5.750%, 08/15/2040 | | | 5,107,000 | | | | 6,418,959 | |
| | | | | | | | | |
| Nursing and Residential | | | | | | | | |
| Care Facilities – 0.10% | | | | | | | | |
| | | | | | | | | |
| HumanGood California | | | | | | | | |
| Obligated Group | | | | | | | | |
| 3.000%, 10/01/2028 | | | 6,880,000 | | | | 6,772,543 | |
| | | | | | | | | |
| Paper Manufacturing – 0.40% | | | | | | | | |
| | | | | | | | | |
| Georgia-Pacific, LLC | | | | | | | | |
| 2.300%, 04/30/2030 (a) | | | 10,000,000 | | | | 9,645,646 | |
| | | | | | | | | |
| Graphic Packaging | | | | | | | | |
| International, LLC | | | | | | | | |
| 4.750%, 07/15/2027 (a) | | | 1,700,000 | | | | 1,745,424 | |
| 3.500%, 03/15/2028 (a) | | | 9,888,000 | | | | 9,407,394 | |
| 3.750%, 02/01/2030 (a) | | | 6,575,000 | | | | 6,274,457 | |
| | | | | | | | | |
| Personal and Laundry | | | | | | | | |
| Services – 0.29% | | | | | | | | |
| | | | | | | | | |
| Service Corp. International | | | | | | | | |
| 5.125%, 06/01/2029 | | | 5,250,000 | | | | 5,390,962 | |
| 3.375%, 08/15/2030 | | | 7,535,000 | | | | 6,937,512 | |
| 4.000%, 05/15/2031 | | | 7,475,000 | | | | 7,094,635 | |
| | | | | | | | | |
| Primary Metal | | | | | | | | |
| Manufacturing – 0.29% | | | | | | | | |
| | | | | | | | | |
| Howmet Aerospace, Inc. | | | | | | | | |
| 5.900%, 02/01/2027 | | | 6,826,000 | | | | 7,425,971 | |
| 3.000%, 01/15/2029 | | | 12,937,000 | | | | 12,295,972 | |
| | | | | | | | | |
| Professional, Scientific, and | | | | | | | | |
| Technical Services – 0.76% | | | | | | | | |
| | | | | | | | | |
| AECOM | | | | | | | | |
| 5.125%, 03/15/2027 | | | 20,000,000 | | | | 20,517,200 | |
| | | | | | | | | |
| Booz Allen Hamilton, Inc. | | | | | | | | |
| 3.875%, 09/01/2028 (a) | | | 9,324,000 | | | | 9,142,555 | |
| | | | | | | | | |
| Gartner, Inc. | | | | | | | | |
| 3.625%, 06/15/2029 (a) | | | 10,000,000 | | | | 9,719,900 | |
| | | | | | | | | |
| Open Text Corp. | | | | | | | | |
| 3.875%, 12/01/2029 (a)(c) | | | 8,830,000 | | | | 8,346,999 | |
| | | | | | | | | |
| Science Applications | | | | | | | | |
| International Corp. | | | | | | | | |
| 4.875%, 04/01/2028 (a) | | | 3,163,000 | | | | 3,090,884 | |
Percentages are stated as a percent of net assets.
The accompanying notes are an integral part of these financial statements.
PERFORMANCE TRUST STRATEGIC BOND FUND — SCHEDULE OF INVESTMENTS (CONT.)
February 28, 2022 (Unaudited)
| | | PRINCIPAL | | | | |
| | | AMOUNT | | | VALUE | |
| | | | | | | |
| Publishing Industries | | | | | | |
| (except Internet) – 0.66% | | | | | | |
| | | | | | | |
| Adobe, Inc. | | | | | | |
| 2.300%, 02/01/2030 | | $ | 7,000,000 | | | $ | 6,812,651 | |
| | | | | | | | | |
| Microsoft Corp. | | | | | | | | |
| 3.500%, 02/12/2035 | | | 6,076,000 | | | | 6,553,776 | |
| | | | | | | | | |
| News Corp. | | | | | | | | |
| 3.875%, 05/15/2029 (a) | | | 1,500,000 | | | | 1,438,875 | |
| | | | | | | | | |
| Open Text Holdings, Inc. | | | | | | | | |
| 4.125%, 12/01/2031 (a) | | | 6,250,000 | | | | 5,946,344 | |
| | | | | | | | | |
| Oracle Corp. | | | | | | | | |
| 2.300%, 03/25/2028 | | | 10,000,000 | | | | 9,544,619 | |
| 3.850%, 07/15/2036 | | | 10,000,000 | | | | 9,620,631 | |
| | | | | | | | | |
| Salesforce.com, Inc. | | | | | | | | |
| 1.950%, 07/15/2031 | | | 5,000,000 | | | | 4,728,233 | |
| | | | | | | | | |
| Real Estate – 0.64% | | | | | | | | |
| | | | | | | | | |
| American Finance Trust, Inc. | | | | | | | | |
| 4.500%, 09/30/2028 (a) | | | 10,000,000 | | | | 9,333,800 | |
| | | | | | | | | |
| Arbor Realty SR, Inc. | | | | | | | | |
| 5.000%, 12/30/2028 (a) | | | 5,000,000 | | | | 4,992,166 | |
| | | | | | | | | |
| Arbor Realty Trust, Inc. | | | | | | | | |
| 4.750%, 10/15/2024 (a) | | | 4,000,000 | | | | 3,960,253 | |
| 4.500%, 03/15/2027 (a) | | | 5,000,000 | | | | 4,894,446 | |
| | | | | | | | | |
| Enterprise Community | | | | | | | | |
| Loan Fund, Inc. | | | | | | | | |
| 3.685%, 11/01/2023 | | | 5,010,000 | | | | 5,125,995 | |
| 4.152%, 11/01/2028 | | | 5,000,000 | | | | 5,168,423 | |
| | | | | | | | | |
| Simon Property Group LP | | | | | | | | |
| 6.750%, 02/01/2040 | | | 6,738,000 | | | | 9,238,234 | |
| | | | | | | | | |
| Religious, Grantmaking, Civic, | | | | | | | | |
| Professional, and | | | | | | | | |
| Similar Organizations – 0.16% | | | | | | | | |
| | | | | | | | | |
| Nature Conservancy | | | | | | | | |
| 1.711%, 07/01/2031 | | | 1,250,000 | | | | 1,115,093 | |
| 1.811%, 07/01/2032 | | | 1,150,000 | | | | 1,016,733 | |
| 1.861%, 07/01/2033 | | | 532,000 | | | | 462,564 | |
| | | | | | | | | |
| Penn State Health | | | | | | | | |
| 3.806%, 11/01/2049 | | | 3,500,000 | | | | 3,675,061 | |
| | | | | | | | | |
| United Jewish Appeal-Federation | | | | | | | | |
| of Jewish Philanthropies | | | | | | | | |
| of New York, Inc. | | | | | | | | |
| 2.145%, 02/01/2031 | | | 4,565,000 | | | | 4,321,485 | |
| | | | | | | | | |
| Rental and Leasing | | | | | | | | |
| Services – 0.12% | | | | | | | | |
| | | | | | | | | |
| United Rentals | | | | | | | | |
| North America, Inc. | | | | | | | | |
| 3.750%, 01/15/2032 | | | 8,500,000 | | | | 8,108,702 | |
| | | | | | | | | |
| Repair and Maintenance – 0.27% | | | | | | | | |
| | | | | | | | | |
| Allison Transmission, Inc. | | | | | | | | |
| 3.750%, 01/30/2031 (a) | | | 11,415,000 | | | | 10,616,749 | |
| | | | | | | | | |
| Valvoline, Inc. | | | | | | | | |
| 3.625%, 06/15/2031 (a) | | | 8,734,000 | | | | 7,836,713 | |
| | | | | | | | | |
| Securities, Commodity Contracts, | | | | | | | | |
| and Other Financial Investments | | | | | | | | |
| and Related Activities – 0.56% | | | | | | | | |
| | | | | | | | | |
| Blackstone Holdings | | | | | | | | |
| Finance Co., LLC | | | | | | | | |
| 1.625%, 08/05/2028 (a) | | | 15,000,000 | | | | 13,900,599 | |
| | | | | | | | | |
| Brookfield Asset | | | | | | | | |
| Management, Inc. | | | | | | | | |
| 7.375%, 03/01/2033 (c) | | | 3,000,000 | | | | 3,976,812 | |
| | | | | | | | | |
| Charles Schwab Corp. | | | | | | | | |
| 2.300%, 05/13/2031 | | | 10,000,000 | | | | 9,569,882 | |
| | | | | | | | | |
| Northwestern Mutual | | | | | | | | |
| Global Funding | | | | | | | | |
| 1.700%, 06/01/2028 (a) | | | 10,000,000 | | | | 9,584,396 | |
| | | | | | | | | |
| Prime Security Services | | | | | | | | |
| Borrower, LLC | | | | | | | | |
| 3.375%, 08/31/2027 (a) | | | 1,000,000 | | | | 926,577 | |
| | | | | | | | | |
| Specialty Trade | | | | | | | | |
| Contractors – 0.09% | | | | | | | | |
| | | | | | | | | |
| TopBuild Corp. | | | | | | | | |
| 3.625%, 03/15/2029 (a) | | | 4,650,000 | | | | 4,369,000 | |
| 4.125%, 02/15/2032 (a) | | | 1,565,000 | | | | 1,490,702 | |
| | | | | | | | | |
| Telecommunications – 0.26% | | | | | | | | |
| | | | | | | | | |
| T-Mobile USA, Inc. | | | | | | | | |
| 2.625%, 02/15/2029 | | | 7,939,000 | | | | 7,459,048 | |
| | | | | | | | | |
| Verizon Communications, Inc. | | | | | | | | |
| 4.500%, 08/10/2033 | | | 9,180,000 | | | | 10,211,043 | |
| | | | | | | | | |
| Transportation Equipment | | | | | | | | |
| Manufacturing – 0.74% | | | | | | | | |
| | | | | | | | | |
| Dana, Inc. | | | | | | | | |
| 5.375%, 11/15/2027 | | | 5,000,000 | | | | 5,106,275 | |
| 4.250%, 09/01/2030 | | | 5,000,000 | | | | 4,757,725 | |
| 4.500%, 02/15/2032 | | | 5,000,000 | | | | 4,695,375 | |
| | | | | | | | | |
| General Dynamics Corp. | | | | | | | | |
| 3.625%, 04/01/2030 | | | 5,000,000 | | | | 5,312,500 | |
| | | | | | | | | |
| Sensata Technologies, Inc. | | | | | | | | |
| 4.375%, 02/15/2030 (a) | | | 8,593,000 | | | | 8,371,172 | |
| 3.750%, 02/15/2031 (a) | | | 6,355,000 | | | | 5,920,381 | |
| | | | | | | | | |
| Thor Industries, Inc. | | | | | | | | |
| 4.000%, 10/15/2029 (a) | | | 5,340,000 | | | | 4,879,425 | |
| | | | | | | | | |
| TransDigm, Inc. | | | | | | | | |
| 8.000%, 12/15/2025 (a) | | | 9,110,000 | | | | 9,523,230 | |
Percentages are stated as a percent of net assets.
The accompanying notes are an integral part of these financial statements.
PERFORMANCE TRUST STRATEGIC BOND FUND — SCHEDULE OF INVESTMENTS (CONT.)
February 28, 2022 (Unaudited)
| | | PRINCIPAL | | | | |
| | | AMOUNT | | | VALUE | |
| | | | | | | |
| Winnebago Industries, Inc. | | | | | | |
| 6.250%, 07/15/2028 (a) | | $ | 1,000,000 | | | $ | 1,033,760 | |
| | | | | | | | | |
| Utilities – 0.11% | | | | | | | | |
| | | | | | | | | |
| Oglethorpe Power Corp. | | | | | | | | |
| 6.191%, 01/01/2031 (a) | | | 6,445,000 | | | | 7,483,225 | |
| | | | | | | | | |
| Wood Product | | | | | | | | |
| Manufacturing – 0.22% | | | | | | | | |
| | | | | | | | | |
| Builders FirstSource, Inc. | | | | | | | | |
| 4.250%, 02/01/2032 (a) | | | 5,750,000 | | | | 5,516,464 | |
| | | | | | | | | |
| Masonite International Corp. | | | | | | | | |
| 3.500%, 02/15/2030 (a)(c) | | | 10,000,000 | | | | 9,291,950 | |
| TOTAL CORPORATE BONDS | | | | | | | | |
| (Cost $1,652,925,867) | | | | | | | 1,608,915,417 | |
| | | | | | | | | |
| NON-AGENCY RESIDENTIAL | | | | | | | | |
| MORTGAGE BACKED SECURITIES – 10.09% | | | | | | | | |
| | | | | | | | | |
| Adjustable Rate Mortgage Trust | | | | | | | | |
| 2005-3, 2.887%, 07/25/2035 (f) | | | 320,027 | | | | 329,507 | |
| 2005-10, 2.652%, 01/25/2036 (f) | | | 5,976,097 | | | | 5,346,129 | |
| 2006-2, 3.135%, 05/25/2036 (f) | | | 946,725 | | | | 922,508 | |
| | | | | | | | | |
| Alternative Loan Trust | | | | | | | | |
| 2004-28CB, 5.000%, 01/25/2020 (g) | | | 127,195 | | | | 101,326 | |
| 2006-J3, 5.750%, 05/25/2026 | | | 557,579 | | | | 551,734 | |
| 2004-27CB, 6.000%, 12/25/2034 | | | 1,098,626 | | | | 1,095,082 | |
| 2004-28CB, 6.000%, 01/25/2035 | | | 342,974 | | | | 345,154 | |
| 2005-6CB, 5.750%, 04/25/2035 | | | 2,184,502 | | | | 2,125,648 | |
| 2005-6CB, 7.500%, 04/25/2035 | | | 256,155 | | | | 254,541 | |
2005-13CB, 0.687% (1 Month LIBOR USD + 0.500%), | | | | | | | | |
| | | | | | | | |
| 05/25/2035 (b) | | | 1,069,549 | | | | 952,946 | |
2005-9CB, 0.687% (1 Month LIBOR USD + 0.500%), | | | | | | | | |
| | | | | | | | |
| 05/25/2035 (b) | | | 2,335,485 | | | | 2,193,322 | |
| 2005-9CB, 6.000%, 05/25/2035 | | | 8,045,867 | | | | 5,511,644 | |
| 2005-21CB, 5.250%, 06/25/2035 | | | 3,092,321 | | | | 2,847,882 | |
| 2005-21CB, 6.000%, 06/25/2035 | | | 1,866,153 | | | | 1,773,191 | |
2005-J6, 0.687% (1 Month LIBOR USD + 0.500%), | | | | | | | | |
| | | | | | | | |
| 07/25/2035 (b) | | | 3,554,989 | | | | 3,063,118 | |
| 2005-20CB, 5.500%, 07/25/2035 | | | 1,174,389 | | | | 1,075,786 | |
| 2005-43, 3.363%, 09/25/2035 (f) | | | 191,481 | | | | 183,560 | |
| 2005-63, 2.797%, 11/25/2035 (f) | | | 990,704 | | | | 957,018 | |
| 2005-54CB, 5.500%, 11/25/2035 | | | 609,202 | | | | 446,806 | |
| 2005-J13, 5.500%, 11/25/2035 | | | 549,667 | | | | 465,628 | |
2005-65CB, 0.000%, 12/25/2035 (d)(e) | | | | | | | | |
| | | 821,801 | | | | 452,768 | |
| 2005-65CB, 5.500%, 01/25/2036 | | | 118,308 | | | | 100,506 | |
| 2005-75CB, 5.500%, 01/25/2036 | | | 1,473,761 | | | | 1,266,126 | |
| 2005-73CB, 5.750%, 01/25/2036 | | | 379,973 | | | | 271,252 | |
| 2005-86CB, 5.500%, 02/25/2036 | | | 141,431 | | | | 108,119 | |
| 2005-86CB, 5.500%, 02/25/2036 | | | 1,020,605 | | | | 780,216 | |
| 2005-80CB, 6.000%, 02/25/2036 | | | 4,763,133 | | | | 4,791,610 | |
| 2006-6CB, 5.500%, 05/25/2036 | | | 110,562 | | | | 105,402 | |
2006-12CB, 5.750% (1 Month LIBOR USD + 5.750%), 05/25/2036 (b) | | | | | | | | |
| | | | | | | | |
| | | 586,038 | | | | 407,422 | |
| 2006-14CB, 6.000%, 06/25/2036 | | | 2,613,726 | | | | 1,900,765 | |
| 2006-16CB, 6.000%, 06/25/2036 | | | 910,187 | | | | 679,210 | |
| 2006-16CB, 6.000%, 06/25/2036 | | | 1,048,405 | | | | 782,387 | |
| 2006-16CB, 6.000%, 06/25/2036 | | | 399,985 | | | | 298,494 | |
2006-19CB, 0.587% (1 Month LIBOR USD + 0.400%), 08/25/2036 (b) | | | | | | | | |
| | | | | | | | |
| | | 708,791 | | | | 348,690 | |
| 2006-24CB, 5.750%, 08/25/2036 | | | 2,683,690 | | | | 1,973,513 | |
| 2006-24CB, 5.750%, 08/25/2036 | | | 4,326,172 | | | | 3,181,348 | |
| 2006-19CB, 6.000%, 08/25/2036 | | | 4,129,518 | | | | 3,153,554 | |
| 2006-19CB, 6.000%, 08/25/2036 | | | 239,265 | | | | 182,589 | |
2006-19CB, 6.000% (1 Month LIBOR USD + 1.000%), 08/25/2036 (b) | | | | | | | | |
| | | | | | | | |
| | | 2,702,322 | | | | 2,063,116 | |
2006-19CB, 6.000% (1 Month LIBOR USD + 1.000%), 08/25/2036 (b) | | | | | | | | |
| | | | | | | | |
| | | 1,065,458 | | | | 813,366 | |
| 2006-23CB, 6.000%, 08/25/2036 | | | 705,205 | | | | 717,544 | |
| 2006-23CB, 6.500%, 08/25/2036 | | | 5,849,069 | | | | 2,856,559 | |
| 2006-J6, 6.000%, 09/25/2036 | | | 3,050,568 | | | | 2,169,057 | |
| 2006-J6, 6.000%, 09/25/2036 | | | 2,264,664 | | | | 1,610,253 | |
| 2006-26CB, 6.250%, 09/25/2036 | | | 5,623,414 | | | | 3,806,667 | |
| 2006-J5, 6.500%, 09/25/2036 | | | 2,096,311 | | | | 1,605,592 | |
| 2006-J5, 6.500%, 09/25/2036 | | | 10,148,422 | | | | 7,772,806 | |
| 2006-31CB, 5.750%, 11/25/2036 | | | 2,060,657 | | | | 1,532,373 | |
| 2006-31CB, 6.000%, 11/25/2036 | | | 228,443 | | | | 173,582 | |
| 2006-30T1, 6.500%, 11/25/2036 | | | 8,340,836 | | | | 3,503,904 | |
| 2006-39CB, 6.000%, 01/25/2037 | | | 2,625,585 | | | | 2,595,868 | |
| 2006-41CB, 6.000%, 01/25/2037 | | | 559,471 | | | | 408,431 | |
| 2007-2CB, 5.750%, 03/25/2037 | | | 6,026,256 | | | | 4,238,186 | |
| 2007-4CB, 5.750%, 04/25/2037 | | | 1,287,855 | | | | 1,265,889 | |
| 2007-4CB, 5.750%, 04/25/2037 | | | 1,712,113 | | | | 1,682,911 | |
| 2007-8CB, 5.500%, 05/25/2037 | | | 6,261,859 | | | | 4,550,266 | |
| 2007-8CB, 6.000%, 05/25/2037 | | | 846,091 | | | | 638,598 | |
| 2007-J2, 6.000%, 07/25/2037 | | | 6,004,513 | | | | 5,863,576 | |
| 2008-2R, 6.000%, 08/25/2037 (f) | | | 7,365,450 | | | | 5,018,447 | |
| 2007-23CB, 6.000%, 09/25/2037 | | | 4,599,285 | | | | 3,264,131 | |
| 2007-13, 6.000%, 06/25/2047 | | | 2,637,466 | | | | 1,853,868 | |
| | | | | | | | | |
| American Home Mortgage | | | | | | | | |
| Investment Trust | | | | | | | | |
| 2006-2, 6.750%, 06/25/2036 (h) | | | 2,756,123 | | | | 618,698 | |
| | | | | | | | | |
| Banc of America Alternative | | | | | | | | |
| Loan Trust | | | | | | | | |
| 2005-11, 5.750%, 12/25/2035 | | | 780,080 | | | | 763,002 | |
| 2005-11, 5.750%, 12/25/2035 | | | 127,173 | | | | 124,389 | |
Percentages are stated as a percent of net assets.
The accompanying notes are an integral part of these financial statements.
PERFORMANCE TRUST STRATEGIC BOND FUND — SCHEDULE OF INVESTMENTS (CONT.)
February 28, 2022 (Unaudited)
| | | PRINCIPAL | | | | |
| | | AMOUNT | | | VALUE | |
| | | | | | | |
| Banc of America Alternative | | | | | | |
| Loan Trust (Cont.) | | | | | | |
2006-9, 0.587% (1 Month LIBOR USD + 0.400%), 01/25/2037 (b) | | | | | | |
| | | | | | |
| | $ | 1,038,829 | | | $ | 816,132 | |
| 2006-9, 6.000%, 01/25/2037 | | | 214,633 | | | | 208,752 | |
| 2006-4, 6.000%, 05/25/2046 | | | 1,068,632 | | | | 1,050,921 | |
| 2006-4, 6.500%, 05/25/2046 | | | 757,275 | | | | 745,058 | |
| 2006-4, 6.500%, 05/25/2046 | | | 1,240,496 | | | | 1,211,071 | |
| 2006-5, 6.000%, 06/25/2046 | | | 318,747 | | | | 312,960 | |
| 2006-6, 6.000%, 07/25/2046 | | | 1,257,712 | | | | 1,201,689 | |
| | | | | | | | | |
| Banc of America Funding Trust | | | | | | | | |
| 2003-3, 5.500%, 10/25/2033 | | | 261,747 | | | | 264,358 | |
| 2004-1, 6.000%, 02/25/2034 | | | 657,224 | | | | 704,021 | |
| 2004-1, 6.000%, 03/25/2034 | | | 3,992,239 | | | | 4,307,937 | |
| 2004-B, 2.398%, 11/20/2034 (f) | | | 2,112,833 | | | | 2,156,871 | |
| 2007-4, 5.500%, 11/25/2034 | | | 342,728 | | | | 339,947 | |
| 2005-3, 5.500%, 06/25/2035 | | | 85,451 | | | | 87,791 | |
2014-R3, 2.378%, 06/26/2035 (a)(f) | | | | | | | | |
| | | 1,615,478 | | | | 1,610,851 | |
2014-R3, 2.429%, 06/26/2035 (a)(f) | | | | | | | | |
| | | 3,424,684 | | | | 3,353,537 | |
| 2005-4, 5.500%, 08/25/2035 | | | 37,717 | | | | 39,417 | |
| 2005-5, 5.500%, 09/25/2035 | | | 233,259 | | | | 237,498 | |
| 2005-5, 5.500%, 09/25/2035 | | | 1,902,073 | | | | 1,975,670 | |
| 2005-7, 5.500%, 11/25/2035 | | | 3,598,660 | | | | 3,554,921 | |
| 2005-7, 5.750%, 11/25/2035 | | | 8,586 | | | | 8,985 | |
| 2005-7, 6.000%, 11/25/2035 | | | 42,709 | | | | 44,096 | |
| 2005-8, 5.750%, 01/25/2036 | | | 2,428,113 | | | | 2,389,441 | |
| 2006-B, 2.385%, 03/20/2036 (f) | | | 648,921 | | | | 586,348 | |
| 2006-F, 2.766%, 07/20/2036 (f) | | | 6,804,499 | | | | 6,452,735 | |
| 2006-5, 5.750%, 09/25/2036 | | | 404,963 | | | | 409,666 | |
| 2006-7, 6.000%, 09/25/2036 | | | 547,705 | | | | 532,495 | |
| 2006-I, 1.877%, 12/20/2036 (f) | | | 534,641 | | | | 524,385 | |
| 2006-I, 1.877%, 12/20/2036 (f) | | | 3,073,613 | | | | 3,070,313 | |
| 2006-I, 2.110%, 12/20/2036 (f) | | | 734,406 | | | | 758,160 | |
| 2007-1, 6.689%, 01/25/2037 (h) | | | 810,684 | | | | 806,734 | |
2007-2, 0.247% (1 Month LIBOR USD + 0.060%), 03/25/2037 (b) | | | | | | | | |
| | | | | | | | |
| | | 429,590 | | | | 416,591 | |
2007-3, 1.047% (1 Month LIBOR USD + 0.860%), 04/25/2037 (b) | | | | | | | | |
| | | | | | | | |
| | | 1,039,671 | | | | 1,023,272 | |
2007-6, 0.467% (1 Month LIBOR USD + 0.280%), 07/25/2037 (b) | | | | | | | | |
| | | | | | | | |
| | | 4,871,031 | | | | 4,794,523 | |
2007-6, 0.477% (1 Month LIBOR USD + 0.290%), 07/25/2037 (b) | | | | | | | | |
| | | | | | | | |
| | | 1,180,181 | | | | 1,162,236 | |
| 2007-5, 5.500%, 07/25/2037 | | | 1,495,598 | | | | 1,489,793 | |
| 2010-R3, 6.000%, 09/26/2037 (a)(f) | | | 7,064,108 | | | | 7,076,591 | |
| 2006-J, 3.443%, 01/20/2047 (f) | | | 149,905 | | | | 145,506 | |
| | | | | | | | | |
| Banc of America Mortgage Trust | | | | | | | | |
| 2005-A, 2.575%, 02/25/2035 (f) | | | 1,701,395 | | | | 1,762,965 | |
| 2005-F, 2.689%, 07/25/2035 (f) | | | 871,348 | | | | 869,815 | |
| 2007-1, 6.000%, 03/25/2037 | | | 1,765,710 | | | | 1,652,895 | |
| 2006-B, 2.529%, 10/20/2046 (f) | | | 577,066 | | | | 560,080 | |
| | | | | | | | | |
| BCAP LLC Trust | | | | | | | | |
| 2007-AA2, 7.500%, 04/25/2037 (i) | | | 312,909 | | | | 219,743 | |
| | | | | | | | | |
| Bear Stearns ALT-A Trust | | | | | | | | |
| 2006-6, 3.185%, 11/25/2036 (f) | | | 830,723 | | | | 536,798 | |
| | | | | | | | | |
| Bear Stearns ARM Trust | | | | | | | | |
| 2004-12, 2.865%, 02/25/2035 (f) | | | 48,434 | | | | 48,691 | |
| | | | | | | | | |
| Bear Stearns Asset Backed | | | | | | | | |
| Securities I Trust | | | | | | | | |
| 2005-AC5, 1.187% (1 Month | | | | | | | | |
LIBOR USD + 1.000%), 08/25/2035 (b) | | | | | | | | |
| | | 559,634 | | | | 408,735 | |
| 2006-AC4, 0.437% (1 Month | | | | | | | | |
LIBOR USD + 0.250%), 07/25/2036 (b) | | | | | | | | |
| | | 3,492,573 | | | | 3,177,954 | |
| 2006-AC4, 33.583% (1 Month | | | | | | | | |
LIBOR USD + 36.250%), 07/25/2036 (b)(e)(i) | | | | | | | | |
| | | 807,079 | | | | 1,013,702 | |
| | | | | | | | | |
| Charlie Mac Trust | | | | | | | | |
| 2004-2, 6.000%, 10/25/2034 | | | 38,216 | | | | 38,268 | |
| | | | | | | | | |
| Chase Funding Trust | | | | | | | | |
| 2004-1, 0.937% (1 Month LIBOR | | | | | | | | |
| USD + 0.750%), 09/25/2033 (b) | | | 160,231 | | | | 159,966 | |
| | | | | | | | | |
| Chase Mortgage Finance Trust | | | | | | | | |
| 2005-S2, 5.500%, 10/25/2035 | | | 698,786 | | | | 707,927 | |
| 2005-S3, 5.500%, 11/25/2035 | | | 6,168,380 | | | | 5,604,851 | |
| 2005-A1, 2.939%, 12/25/2035 (f) | | | 906,719 | | | | 906,609 | |
| 2005-A1, 2.939%, 12/25/2035 (f) | | | 945,293 | | | | 945,178 | |
| 2006-S3, 6.000%, 11/25/2036 | | | 7,043,529 | | | | 4,287,889 | |
| 2006-S4, 6.000%, 12/25/2036 | | | 1,070,484 | | | | 673,932 | |
| 2006-S4, 6.000%, 12/25/2036 | | | 4,053,844 | | | | 2,552,132 | |
| 2007-S1, 6.000%, 02/25/2037 | | | 4,087,834 | | | | 2,226,538 | |
| 2007-S3, 5.750%, 05/25/2037 | | | 709,214 | | | | 437,286 | |
| 2007-S3, 6.000%, 05/25/2037 | | | 2,160,973 | | | | 1,356,973 | |
| 2007-A2, 2.758%, 07/25/2037 (f) | | | 969,519 | | | | 917,984 | |
| | | | | | | | | |
| ChaseFlex Trust | | | | | | | | |
| 2005-1, 5.500%, 02/25/2035 | | | 361,381 | | | | 316,416 | |
| 2006-2, 4.478%, 09/25/2036 (f) | | | 2,682,626 | | | | 2,633,236 | |
| 2007-M1, 4.161%, 08/25/2037 (h) | | | 1,585,866 | | | | 1,519,352 | |
| | | | | | | | | |
| CHL Mortgage Pass-Through Trust | | | | | | | | |
| 2005-20, 5.250%, 12/25/2027 | | | 23,645 | | | | 18,931 | |
| 2003-42, 2.249%, 10/25/2033 (f) | | | 951,010 | | | | 949,472 | |
| 2003-44, 5.000%, 10/25/2033 | | | 290,000 | | | | 292,758 | |
| 2004-4, 5.500%, 05/25/2034 | | | 497,511 | | | | 492,566 | |
| 2004-14, 2.739%, 08/25/2034 (f) | | | 2,634,769 | | | | 2,659,637 | |
| 2004-21, 4.000%, 11/25/2034 | | | 577,833 | | | | 581,593 | |
| 2004-24, 5.500%, 12/25/2034 | | | 2,705,022 | | | | 2,745,762 | |
Percentages are stated as a percent of net assets.
The accompanying notes are an integral part of these financial statements.
PERFORMANCE TRUST STRATEGIC BOND FUND — SCHEDULE OF INVESTMENTS (CONT.)
February 28, 2022 (Unaudited)
| | | PRINCIPAL | | | | |
| | | AMOUNT | | | VALUE | |
| | | | | | | |
| CHL Mortgage | | | | | | |
| Pass-Through Trust (Cont.) | | | | | | |
| 2004-J9, 5.500%, 01/25/2035 | | $ | 571,422 | | | $ | 576,025 | |
2004-HYB5, 2.617%, 04/20/2035 (f) | | | | | | | | |
| | | 770,382 | | | | 818,280 | |
2005-HYB2, 2.819%, 05/20/2035 (f) | | | | | | | | |
| | | 829,143 | | | | 860,879 | |
| 2005-13, 5.500%, 06/25/2035 | | | 1,734,425 | | | | 1,302,351 | |
| 2005-J3, 5.500%, 09/25/2035 | | | 71,901 | | | | 70,062 | |
| 2005-27, 5.500%, 12/25/2035 | | | 588,742 | | | | 364,865 | |
| 2005-27, 5.500%, 12/25/2035 | | | 1,125,041 | | | | 1,018,160 | |
| 2005-31, 2.754%, 01/25/2036 (f) | | | 1,088,197 | | | | 1,035,565 | |
| 2005-30, 5.500%, 01/25/2036 | | | 71,087 | | | | 55,943 | |
2005-HY10, 3.058%, 02/20/2036 (f) | | | | | | | | |
| | | 117,809 | | | | 102,482 | |
2005-HY10, 3.115%, 02/20/2036 (f) | | | | | | | | |
| | | 59,639 | | | | 49,929 | |
2005-HY10, 3.269%, 02/20/2036 (f) | | | | | | | | |
| | | 1,681,990 | | | | 1,699,116 | |
| 2006-6, 6.000%, 04/25/2036 | | | 662,723 | | | | 457,643 | |
| 2006-9, 6.000%, 05/25/2036 | | | 1,196,214 | | | | 793,503 | |
| 2006-J4, 6.250%, 09/25/2036 | | | 101,499 | | | | 54,130 | |
| 2006-16, 6.500%, 11/25/2036 | | | 558,556 | | | | 302,162 | |
2006-17, 6.000% (1 Month LIBOR USD + 0.550%), | | | | | | | | |
| | | | | | | | |
| 12/25/2036 (b) | | | 3,150,759 | | | | 1,878,630 | |
| 2006-17, 6.000%, 12/25/2036 | | | 2,329,635 | | | | 1,377,728 | |
| 2006-18, 6.000%, 12/25/2036 | | | 279,398 | | | | 203,292 | |
| 2006-21, 5.750%, 02/25/2037 | | | 1,381,652 | | | | 919,334 | |
| 2006-21, 6.000%, 02/25/2037 | | | 3,190,423 | | | | 2,177,307 | |
| 2006-21, 6.000%, 02/25/2037 | | | 728,445 | | | | 497,128 | |
| 2007-1, 6.000%, 03/25/2037 | | | 2,146,768 | | | | 1,476,269 | |
| 2007-5, 5.500%, 05/25/2037 | | | 829,124 | | | | 558,775 | |
| 2007-5, 5.750%, 05/25/2037 | | | 5,902,142 | | | | 4,078,920 | |
| 2007-5, 5.750%, 05/25/2037 | | | 901,222 | | | | 622,827 | |
| 2007-5, 5.750%, 05/25/2037 | | | 1,739,037 | | | | 1,201,833 | |
| 2007-10, 6.000%, 07/25/2037 | | | 1,997,379 | | | | 1,325,778 | |
| 2007-J2, 6.000%, 07/25/2037 | | | 3,003,307 | | | | 1,588,687 | |
| 2007-J2, 6.000%, 07/25/2037 | | | 193,966 | | | | 102,604 | |
| 2007-HY5, 3.011%, 09/25/2037 (f) | | | 2,234,028 | | | | 2,205,446 | |
| 2007-HY6, 3.217%, 11/25/2037 (f) | | | 276,831 | | | | 264,626 | |
| 2007-HY5, 3.434%, 09/25/2047 (f) | | | 6,308,469 | | | | 5,927,449 | |
| | | | | | | | | |
| Citicorp Mortgage | | | | | | | | |
| Securities Trust | | | | | | | | |
| 2006-3, 5.500%, 06/25/2021 (g) | | | 50,926 | | | | 41,474 | |
| 2006-1, 6.000%, 02/25/2036 | | | 113,382 | | | | 115,017 | |
| 2006-3, 5.750%, 06/25/2036 | | | 428,327 | | | | 425,984 | |
| 2006-3, 6.000%, 06/25/2036 | | | 1,502,328 | | | | 1,506,996 | |
| 2006-3, 6.250%, 06/25/2036 | | | 940,583 | | | | 951,572 | |
| 2006-7, 6.000%, 12/25/2036 | | | 3,233,846 | | | | 3,168,186 | |
| 2007-3, 5.500%, 04/25/2037 | | | 39,401 | | | | 40,923 | |
| 2007-3, 6.000%, 04/25/2037 | | | 560,273 | | | | 559,506 | |
| | | | | | | | | |
| Citigroup Mortgage Loan Trust | | | | | | | | |
| 2004-2, 9.250%, 08/25/2033 (a) | | | 25,942 | | | | 26,696 | |
2004-HYB3, 2.835%, 09/25/2034 (f) | | | | | | | | |
| | | 492,205 | | | | 500,571 | |
2005-WF1, 5.330%, 11/25/2034 (h) | | | | | | | | |
| | | 2,742,380 | | | | 2,824,780 | |
| 2005-1, 2.381%, 04/25/2035 (f) | | | 396,519 | | | | 398,536 | |
| 2005-2, 2.541%, 05/25/2035 (f) | | | 508,527 | | | | 513,446 | |
| 2005-5, 6.000%, 08/25/2035 | | | 2,174,398 | | | | 2,191,780 | |
| 2005-7, 2.238%, 09/25/2035 (f) | | | 485,863 | | | | 465,568 | |
| 2005-10, 2.667%, 12/25/2035 (f) | | | 1,254,886 | | | | 942,069 | |
2006-WF1, 5.080%, 03/25/2036 (h) | | | | | | | | |
| | | 28,143,361 | | | | 17,582,978 | |
2006-AR7, 2.722%, 11/25/2036 (f) | | | | | | | | |
| | | 1,640,890 | | | | 1,613,606 | |
2007-AR4, 3.165%, 03/25/2037 (f) | | | | | | | | |
| | | 1,176,881 | | | | 1,170,509 | |
| | | | | | | | | |
| CitiMortgage Alternative | | | | | | | | |
| Loan Trust | | | | | | | | |
| 2006-A2, 0.787% (1 Month LIBOR | | | | | | | | |
| USD + 0.600%), 05/25/2036 (b) | | | 486,654 | | | | 428,417 | |
| 2006-A4, 6.000%, 09/25/2036 | | | 1,127,735 | | | | 1,089,447 | |
| 2007-A1, 6.000%, 01/25/2037 | | | 1,645,116 | | | | 1,632,918 | |
| 2007-A1, 6.000%, 01/25/2037 | | | 2,643,841 | | | | 2,624,238 | |
| | | | | | | | | |
| Credit Suisse First Boston | | | | | | | | |
| Mortgage Securities Corp. | | | | | | | | |
| 2005-8, 7.000%, 09/25/2035 | | | 2,797,543 | | | | 1,770,274 | |
| | | | | | | | | |
| CSFB Mortgage-Backed | | | | | | | | |
| Pass-Through Certificates | | | | | | | | |
| 2004-8, 5.500%, 12/25/2034 | | | 150,080 | | | | 150,577 | |
| 2005-3, 5.500%, 07/25/2035 | | | 781,591 | | | | 798,422 | |
| 2005-9, 5.500%, 10/25/2035 | | | 677,404 | | | | 473,891 | |
| 2005-10, 5.500%, 11/25/2035 | | | 468,282 | | | | 421,817 | |
| 2005-10, 5.500%, 11/25/2035 | | | 1,845,663 | | | | 1,662,692 | |
| 2005-10, 6.000%, 11/25/2035 | | | 837,399 | | | | 309,596 | |
| | | | | | | | | |
| CSMC Mortgage-Backed Trust | | | | | | | | |
| 2006-CF1, 5.500%, | | | | | | | | |
| 11/25/2035 (a)(h) | | | 2,565,000 | | | | 2,535,082 | |
| 2006-1, 5.500%, 02/25/2036 | | | 343,293 | | | | 339,394 | |
| 2006-1, 5.500%, 02/25/2036 | | | 38,556 | | | | 38,330 | |
| 2006-2, 5.750%, 03/25/2036 | | | 564,903 | | | | 455,260 | |
| 2006-2, 6.000%, 03/25/2036 | | | 4,347,196 | | | | 2,562,302 | |
| 2006-4, 6.000%, 05/25/2036 | | | 566,119 | | | | 432,726 | |
| 2006-4, 7.000%, 05/25/2036 | | | 547,437 | | | | 151,519 | |
2011-12R, 2.338%, 07/27/2036 (a)(f) | | | | | | | | |
| | | 1,313,042 | | | | 1,338,349 | |
| 2006-7, 6.000%, 08/25/2036 | | | 813,540 | | | | 769,521 | |
| 2007-2, 5.500%, 03/25/2037 | | | 1,419,785 | | | | 983,358 | |
| 2007-3, 5.500%, 04/25/2037 | | | 361,019 | | | | 338,630 | |
| 2007-3, 5.500%, 04/25/2037 | | | 505,070 | | | | 473,748 | |
2013-2R, 3.033%, 05/27/2037 (a)(f) | | | | | | | | |
| | | 2,182,741 | | | | 1,577,347 | |
Percentages are stated as a percent of net assets.
The accompanying notes are an integral part of these financial statements.
PERFORMANCE TRUST STRATEGIC BOND FUND — SCHEDULE OF INVESTMENTS (CONT.)
February 28, 2022 (Unaudited)
| | | PRINCIPAL | | | | |
| | | AMOUNT | | | VALUE | |
| | | | | | | |
| Deutsche Alt-A Securities, Inc. | | | | | | |
| Mortgage Loan Trust | | | | | | |
2005-3, 0.687% (1 Month LIBOR USD + 0.500%), | | | | | | |
| | | | | | |
| 05/25/2035 (b) | | $ | 1,390,292 | | | $ | 1,335,169 | |
| 2005-6, 5.500%, 12/25/2035 | | | 1,613,633 | | | | 1,567,034 | |
| | | | | | | | | |
| Deutsche Alt-B Securities, Inc. | | | | | | | | |
| Mortgage Loan Trust | | | | | | | | |
2006-AB4, 0.287% (1 Month LIBOR USD + 0.100%), | | | | | | | | |
| | | | | | | | |
| 10/25/2036 (b) | | | 522,893 | | | | 434,065 | |
| | | | | | | | | |
| DFC HEL Trust | | | | | | | | |
| 2001-1, 1.841% (1 Month LIBOR | | | | | | | | |
| USD + 1.650%), 08/15/2031 (b) | | | 1,565,739 | | | | 1,647,093 | |
| | | | | | | | | |
| Equity One Mortgage | | | | | | | | |
| Pass-Through Trust | | | | | | | | |
| 2003-1, 4.860%, 08/25/2033 (f) | | | 780,147 | | | | 781,639 | |
| 2003-3, 4.868%, 12/25/2033 (f) | | | 1,318,929 | | | | 1,300,429 | |
| | | | | | | | | |
| Fannie Mae Connecticut | | | | | | | | |
| Avenue Securities | | | | | | | | |
2015-C03, 5.187% (1 Month LIBOR USD + 5.000%), | | | | | | | | |
| | | | | | | | |
| 07/25/2025 (b) | | | 3,396,981 | | | | 3,488,778 | |
2016-C01, 7.137% (1 Month LIBOR USD + 6.950%), | | | | | | | | |
| | | | | | | | |
| 08/25/2028 (b) | | | 2,051,120 | | | | 2,168,276 | |
2016-C05, 4.637% (1 Month LIBOR USD + 4.450%), | | | | | | | | |
| | | | | | | | |
| 01/25/2029 (b) | | | 2,338,130 | | | | 2,418,311 | |
2016-C07, 4.537% (1 Month LIBOR USD + 4.350%), | | | | | | | | |
| | | | | | | | |
| 05/25/2029 (b) | | | 2,874,251 | | | | 2,995,286 | |
2017-C01, 3.737% (1 Month LIBOR USD + 3.550%), | | | | | | | | |
| | | | | | | | |
| 07/25/2029 (b) | | | 3,153,520 | | | | 3,237,298 | |
2017-C05, 3.787% (1 Month LIBOR USD + 3.600%), | | | | | | | | |
| | | | | | | | |
| 01/25/2030 (b) | | | 6,599,636 | | | | 6,682,680 | |
2018-C03, 3.937% (1 Month LIBOR USD + 3.750%), | | | | | | | | |
| | | | | | | | |
| 10/25/2030 (b) | | | 5,000,000 | | | | 5,052,328 | |
| 2021-R02, 2.049% (SOFR30A | | | | | | | | |
| + 2.000%), 11/25/2041 (a)(b) | | | 2,250,000 | | | | 2,155,452 | |
| | | | | | | | | |
| First Horizon Alternative | | | | | | | | |
| Mortgage Securities Trust | | | | | | | | |
| 2005-FA11, 5.250%, 02/25/2021 (g) | | | 698 | | | | — | |
| 2006-FA6, 5.750%, 11/25/2021 (g) | | | 909 | | | | 690 | |
| 2004-AA6, 2.292%, 01/25/2035 (f) | | | 316,814 | | | | 326,319 | |
| 2004-AA7, 2.294%, 02/25/2035 (f) | | | 982,505 | | | | 998,796 | |
| 2005-AA5, 2.412%, 07/25/2035 (f) | | | 1,591,948 | | | | 1,558,601 | |
| 2005-AA7, 2.428%, 09/25/2035 (f) | | | 1,706,260 | | | | 1,661,700 | |
| 2005-FA8, 5.500%, 11/25/2035 | | | 1,321,802 | | | | 921,615 | |
| 2006-FA1, 5.750%, 04/25/2036 | | | 2,067,468 | | | | 1,337,769 | |
| 2006-FA2, 6.000%, 05/25/2036 | | | 2,469,696 | | | | 1,522,632 | |
| 2006-FA2, 6.000%, 05/25/2036 | | | 1,567,645 | | | | 966,494 | |
| 2006-FA6, 6.000%, 11/25/2036 | | | 1,021,725 | | | | 487,137 | |
| 2006-FA6, 6.250%, 11/25/2036 | | | 1,295,099 | | | | 635,904 | |
| 2006-FA6, 6.250%, 11/25/2036 | | | 6,598,260 | | | | 4,128,451 | |
| 2007-AA1, 2.642%, 05/25/2037 (f) | | | 2,696,694 | | | | 2,173,139 | |
| 2007-FA4, 6.250%, 08/25/2037 | | | 2,029,094 | | | | 1,248,002 | |
| | | | | | | | | |
| First Horizon Mortgage | | | | | | | | |
| Pass-Through Trust | | | | | | | | |
| 2005-AR3, 2.569%, 08/25/2035 (f) | | | 1,430,516 | | | | 1,458,896 | |
| 2006-AR4, 2.920%, 01/25/2037 (f) | | | 2,913,391 | | | | 2,241,299 | |
| 2006-4, 5.750%, 02/25/2037 | | | 1,071,485 | | | | 508,594 | |
| 2006-4, 6.000%, 02/25/2037 | | | 648,822 | | | | 318,861 | |
| 2007-AR1, 2.842%, 05/25/2037 (f) | | | 565,936 | | | | 306,188 | |
| 2007-AR2, 2.590%, 08/25/2037 (f) | | | 2,416,639 | | | | 1,123,423 | |
| | | | | | | | | |
| Freddie Mac Structured Agency | | | | | | | | |
| Credit Risk Debt Notes | | | | | | | | |
2018-DNA2, 3.887% (1 Month LIBOR USD + 3.700%), | | | | | | | | |
| | | | | | | | |
| 12/25/2030 (a)(b) | | | 5,000,000 | | | | 5,055,935 | |
| 2021-DNA7, 1.849% (SOFR30A | | | | | | | | |
| + 1.800%), 11/25/2041 (a)(b) | | | 7,750,000 | | | | 7,488,300 | |
| 2022-DNA1, 1.900% (SOFR30A | | | | | | | | |
| + 1.850%), 01/25/2042 (a)(b) | | | 6,800,000 | | | | 6,704,062 | |
| 2022-DNA1, 2.550% (SOFR30A | | | | | | | | |
| + 2.500%), 01/25/2042 (a)(b) | | | 9,000,000 | | | | 8,437,055 | |
2018-HRP2, 4.387% (1 Month LIBOR USD + 4.200%), | | | | | | | | |
| | | | | | | | |
| 02/25/2047 (a)(b) | | | 10,000,000 | | | | 10,307,657 | |
| 2020-DNA5, 4.849% (SOFR30A | | | | | | | | |
| + 4.800%), 10/25/2050 (a)(b) | | | 10,606,000 | | | | 10,901,173 | |
| | | | | | | | | |
| GSAA Home Equity Trust | | | | | | | | |
| 2005-1, 6.260%, 11/25/2034 (h) | | | 2,050,000 | | | | 2,076,030 | |
| 2006-15, 6.692%, 09/25/2036 (h) | | | 2,172,441 | | | | 807,996 | |
| 2006-18, 6.182%, 11/25/2036 (h) | | | 1,777,176 | | | | 627,214 | |
2007-7, 0.547% (1 Month LIBOR USD + 0.360%), | | | | | | | | |
| | | | | | | | |
| 07/25/2037 (b) | | | 984,736 | | | | 980,008 | |
| | | | | | | | | |
| GSR Mortgage Loan Trust | | | | | | | | |
| 2005-4F, 6.500%, 04/25/2020 (g) | | | 48,363 | | | | 48,208 | |
| 2003-5F, 3.000%, 08/25/2032 | | | 1,131,432 | | | | 1,121,344 | |
| 2004-15F, 6.000%, 12/25/2034 | | | 1,258,616 | | | | 1,289,931 | |
| 2005-1F, 6.000%, 01/25/2035 | | | 14,681 | | | | 14,487 | |
| 2005-AR4, 3.041%, 07/25/2035 (f) | | | 173,011 | | | | 163,375 | |
| 2005-6F, 5.250%, 07/25/2035 | | | 92,814 | | | | 93,634 | |
| 2005-7F, 6.000%, 09/25/2035 | | | 22,737 | | | | 23,152 | |
| 2005-AR5, 3.079%, 10/25/2035 (f) | | | 340,334 | | | | 339,462 | |
| 2005-AR7, 2.646%, 11/25/2035 (f) | | | 578,016 | | | | 580,231 | |
| 2006-2F, 5.750%, 02/25/2036 | | | 547,205 | | | | 546,354 | |
Percentages are stated as a percent of net assets.
The accompanying notes are an integral part of these financial statements.
PERFORMANCE TRUST STRATEGIC BOND FUND — SCHEDULE OF INVESTMENTS (CONT.)
February 28, 2022 (Unaudited)
| | | PRINCIPAL | | | | |
| | | AMOUNT | | | VALUE | |
| | | | | | | |
| HarborView Mortgage Loan Trust | | | | | | |
| 2006-6, 2.928%, 08/19/2036 (f) | | $ | 2,588,613 | | | $ | 2,528,350 | |
| Home Partners of America Trust | | | | | | | | |
| 2019-1, 2.908%, 09/17/2039 (a) | | | 2,585,294 | | | | 2,565,848 | |
| 2019-2, 2.703%, 10/19/2039 (a) | | | 3,388,100 | | | | 3,361,569 | |
| | | | | | | | | |
| Impac CMB Trust | | | | | | | | |
2005-5, 0.687% (1 Month LIBOR USD + 0.250%), | | | | | | | | |
| | | | | | | | |
| 08/25/2035 (b) | | | 489,171 | | | | 475,163 | |
| | | | | | | | | |
| Impac Secured Assets | | | | | | | | |
| CMN Owner Trust | | | | | | | | |
| 2002-2, 6.500%, 04/25/2033 | | | 1,064,258 | | | | 1,086,465 | |
| 2004-2, 4.868%, 08/25/2034 (h) | | | 332,784 | | | | 336,235 | |
| | | | | | | | | |
| IndyMac IMSC Mortgage | | | | | | | | |
| Loan Trust | | | | | | | | |
| 2007-AR1, 2.864%, 06/25/2037 (f) | | | 402,457 | | | | 319,823 | |
| | | | | | | | | |
| IndyMac INDA Mortgage | | | | | | | | |
| Loan Trust | | | | | | | | |
| 2007-AR1, 3.005%, 03/25/2037 (f) | | | 409,676 | | | | 381,739 | |
| | | | | | | | | |
| IndyMac INDX | | | | | | | | |
| Mortgage Loan Trust | | | | | | | | |
| 2004-AR4, 2.897%, 08/25/2034 (f) | | | 2,570,778 | | | | 2,629,119 | |
| 2004-AR11, 2.528%, 12/25/2034 (f) | | | 1,027,418 | | | | 1,036,743 | |
| 2005-AR3, 2.724%, 04/25/2035 (f) | | | 928,218 | | | | 924,867 | |
| 2005-AR9, 3.313%, 07/25/2035 (f) | | | 3,064,862 | | | | 2,165,590 | |
| 2005-AR23, 2.518%, 11/25/2035 (f) | | | 637,748 | | | | 619,318 | |
| 2005-AR23, 2.823%, 11/25/2035 (f) | | | 1,123,266 | | | | 1,098,438 | |
| 2005-AR25, 2.934%, 12/25/2035 (f) | | | 2,069,813 | | | | 1,558,925 | |
| 2005-AR35, 2.928%, 02/25/2036 (f) | | | 1,260,794 | | | | 1,183,763 | |
| 2006-AR3, 2.899%, 03/25/2036 (f) | | | 5,721,040 | | | | 4,953,959 | |
| 2006-AR9, 2.938%, 06/25/2036 (f) | | | 1,688,793 | | | | 1,673,660 | |
| 2006-AR25, 2.912%, 09/25/2036 (f) | | | 1,372,843 | | | | 1,375,163 | |
| 2006-AR25, 3.085%, 09/25/2036 (f) | | | 2,093,426 | | | | 1,638,211 | |
| 2006-AR31, 3.063%, 11/25/2036 (f) | | | 4,445,536 | | | | 4,411,965 | |
| | | | | | | | | |
| Jefferies Resecuritization Trust | | | | | | | | |
| 2009-R1, 2.643%, 11/26/2035 (a)(f) | | | 795,296 | | | | 788,905 | |
| | | | | | | | | |
| JP Morgan Alternative Loan Trust | | | | | | | | |
| 2006-S4, 6.460%, 12/25/2036 (h) | | | 655,335 | | | | 649,794 | |
| 2008-R4, 6.000%, 12/27/2036 (a) | | | 6,683,737 | | | | 4,458,996 | |
| | | | | | | | | |
| JP Morgan Mortgage Trust | | | | | | | | |
| 2005-S3, 5.750%, 01/25/2036 | | | 47,917 | | | | 29,965 | |
| 2007-A3, 2.616%, 05/25/2037 (f) | | | 2,977,755 | | | | 2,587,517 | |
| | | | | | | | | |
| JP Morgan Resecuritization Trust | | | | | | | | |
| 2009-7, 6.009%, 07/27/2037 (a)(f) | | | 70,105 | | | | 70,264 | |
| | | | | | | | | |
| Lehman Mortgage Trust | | | | | | | | |
| 2005-2, 5.500%, 12/25/2035 | | | 1,583,341 | | | | 1,104,368 | |
| 2005-2, 5.750%, 12/25/2035 | | | 546,038 | | | | 397,174 | |
2005-3, 0.687% (1 Month LIBOR USD + 0.500%), | | | | | | | | |
| | | | | | | | |
| 01/25/2036 (b) | | | 938,977 | | | | 469,971 | |
2005-3, 4.563% (1 Month LIBOR USD + 4.750%), | | | | | | | | |
| | | | | | | | |
| 01/25/2036 (b)(e)(i)(j) | | | 938,977 | | | | 183,301 | |
| 2005-3, 5.500%, 01/25/2036 | | | 236,008 | | | | 170,822 | |
| 2006-1, 5.500%, 02/25/2036 | | | 396,802 | | | | 287,848 | |
| 2006-3, 6.000%, 07/25/2036 | | | 3,492,708 | | | | 2,370,199 | |
| 2006-3, 6.000%, 07/25/2036 | | | 7,736,291 | | | | 5,240,534 | |
| 2007-4, 5.750%, 05/25/2037 | | | 1,066,587 | | | | 752,351 | |
| 2007-4, 5.750%, 05/25/2037 | | | 2,330,494 | | | | 1,643,888 | |
| 2007-5, 5.750%, 06/25/2037 | | | 1,876,918 | | | | 1,890,519 | |
| 2007-5, 6.000%, 06/25/2037 | | | 2,376,799 | | | | 946,800 | |
| 2007-5, 6.000%, 06/25/2037 | | | 6,491,750 | | | | 2,585,995 | |
| | | | | | | | | |
| MASTR Adjustable Rate | | | | | | | | |
| Mortgages Trust | | | | | | | | |
| 2004-4, 1.945%, 05/25/2034 (f) | | | 97,527 | | | | 95,253 | |
| 2005-1, 2.483%, 02/25/2035 (f) | | | 130,210 | | | | 133,001 | |
| | | | | | | | | |
| MASTR Alternative Loan Trust | | | | | | | | |
| 2003-5, 5.932%, 08/25/2033 (f) | | | 735,930 | | | | 624,789 | |
| 2003-7, 6.250%, 11/25/2033 | | | 71,849 | | | | 74,051 | |
| 2004-6, 5.500%, 07/25/2034 | | | 194,788 | | | | 198,847 | |
| 2004-6, 6.000%, 07/25/2034 | | | 171,225 | | | | 177,664 | |
| 2004-11, 6.500%, 10/25/2034 | | | 510,979 | | | | 539,069 | |
| 2005-2, 5.500%, 03/25/2035 | | | 2,000,000 | | | | 2,192,993 | |
| 2005-6, 5.500%, 12/25/2035 | | | 360,905 | | | | 310,753 | |
| | | | | | | | | |
| MASTR Asset Securitization Trust | | | | | | | | |
| 2002-NC1, 2.287% (1 Month LIBOR | | | | | | | | |
| USD + 3.150%), 10/25/2032 (b) | | | 269,740 | | | | 270,120 | |
| 2006-1, 0.637% (1 Month LIBOR | | | | | | | | |
| USD + 0.450%), 05/25/2036 (b) | | | 642,910 | | | | 112,906 | |
| 2006-2, 6.000% (1 Month LIBOR | | | | | | | | |
| USD + 6.000%), 06/25/2036 (b) | | | 1,286,138 | | | | 1,057,794 | |
| | | | | | | | | |
| Merrill Lynch Mortgage | | | | | | | | |
| Investors Trust | | | | | | | | |
| 2006-F1, 6.000%, 04/25/2036 | | | 2,283,650 | | | | 1,498,842 | |
| | | | | | | | | |
| Merrill Lynch Mortgage | | | | | | | | |
| Investors Trust MLCC | | | | | | | | |
| 2004-D, 1.546% (6 Month LIBOR | | | | | | | | |
| USD + 0.720%), 09/25/2029 (b) | | | 601,578 | | | | 586,312 | |
| | | | | | | | | |
| Merrill Lynch Mortgage | | | | | | | | |
| Investors Trust MLMI | | | | | | | | |
| 2005-A5, 2.999%, 06/25/2035 (f) | | | 337,573 | | | | 343,393 | |
| 2005-A7, 2.899%, 09/25/2035 (f) | | | 4,294,554 | | | | 3,858,064 | |
| | | | | | | | | |
| Morgan Stanley | | | | | | | | |
| Mortgage Loan Trust | | | | | | | | |
| 2005-7, 5.500%, 11/25/2035 | | | 921,084 | | | | 931,977 | |
| 2005-7, 5.500%, 11/25/2035 | | | 345,800 | | | | 335,365 | |
| 2006-2, 5.490%, 02/25/2036 (f) | | | 802,052 | | | | 625,738 | |
| 2006-2, 6.500%, 02/25/2036 | | | 903,281 | | | | 555,022 | |
| 2006-11, 6.000%, 08/25/2036 | | | 2,024,149 | | | | 1,237,325 | |
| 2006-11, 6.000%, 08/25/2036 | | | 1,576,971 | | | | 1,365,133 | |
| 2007-8XS, 6.000%, 04/25/2037 (f) | | | 1,364,873 | | | | 641,537 | |
| 2007-3XS, 5.763%, 01/25/2047 (h) | | | 6,842,677 | | | | 2,837,400 | |
Percentages are stated as a percent of net assets.
The accompanying notes are an integral part of these financial statements.
PERFORMANCE TRUST STRATEGIC BOND FUND — SCHEDULE OF INVESTMENTS (CONT.)
February 28, 2022 (Unaudited)
| | | PRINCIPAL | | | | |
| | | AMOUNT | | | VALUE | |
| | | | | | | |
| Morgan Stanley Reremic Trust | | | | | | |
2012-R3, 2.552%, 11/26/2036 (a)(f) | | | | | | |
| | $ | 1,016,787 | | | $ | 981,813 | |
| | | | | | | | | |
| Nomura Asset Acceptance | | | | | | | | |
| Corp. Alternative Loan Trust | | | | | | | | |
| 2005-WF1, 5.659%, 03/25/2035 (h) | | | 39,180 | | | | 39,328 | |
| 2005-AR3, 5.688%, 07/25/2035 (f) | | | 484,886 | | | | 495,441 | |
| 2007-1, 5.669%, 03/25/2047 (h) | | | 962,699 | | | | 950,959 | |
| 2007-1, 5.995%, 03/25/2047 (h) | | | 1,770,232 | | | | 1,754,966 | |
| | | | | | | | | |
| Nomura Resecuritization Trust | | | | | | | | |
2011-4RA, 2.768%, 12/26/2036 (a)(f) | | | | | | | | |
| | | 6,150,328 | | | | 6,068,626 | |
| | | | | | | | | |
| Opteum Mortgage Acceptance | | | | | | | | |
| Corp. Asset Backed | | | | | | | | |
| Pass-Through Certificates | | | | | | | | |
| 2005-5, 5.850%, 12/25/2035 (f) | | | 168,763 | | | | 169,470 | |
| | | | | | | | | |
| RAAC Trust | | | | | | | | |
| 2005-SP1, 6.000%, 09/25/2034 | | | 2,788 | | | | 2,715 | |
| | | | | | | | | |
| RALI Trust | | | | | | | | |
| 2006-QA1, 5.329%, 01/25/2036 (f) | | | 202,815 | | | | 194,959 | |
| 2006-QS1, 5.750%, 01/25/2036 | | | 219,788 | | | | 214,975 | |
| 2006-QS6, 6.000%, 06/25/2036 | | | 906,900 | | | | 880,783 | |
| 2006-QS6, 6.000%, 06/25/2036 | | | 465,816 | | | | 452,401 | |
2006-QS9, 0.887% (1 Month LIBOR USD + 0.700%), | | | | | | | | |
| | | | | | | | |
| 07/25/2036 (b) | | | 1,576,487 | | | | 1,148,664 | |
| 2006-QS13, 6.000%, 09/25/2036 | | | 2,533,840 | | | | 2,365,165 | |
2006-QS17, 0.537% (1 Month LIBOR USD + 0.350%), | | | | | | | | |
| | | | | | | | |
| 12/25/2036 (b) | | | 871,471 | | | | 688,643 | |
| 2006-QS17, 6.000%, 12/25/2036 | | | 345,666 | | | | 329,169 | |
| 2007-QS1, 5.750%, 01/25/2037 | | | 421,093 | | | | 390,223 | |
| 2007-QS1, 6.000%, 01/25/2037 | | | 1,306,769 | | | | 1,222,375 | |
| 2007-QS6, 6.000%, 04/25/2037 | | | 2,995,715 | | | | 2,913,776 | |
| 2007-QS10, 6.500%, 09/25/2037 | | | 342,455 | | | | 331,725 | |
| | | | | | | | | |
| RBSSP Resecuritization Trust | | | | | | | | |
| 2009-7, 6.000%, 03/26/2036 (a)(f) | | | 3,900,109 | | | | 2,762,667 | |
| | | | | | | | | |
| Renaissance Home | | | | | | | | |
| Equity Loan Trust | | | | | | | | |
| 2005-1, 5.516%, 05/25/2035 (h) | | | 229,377 | | | | 231,940 | |
| | | | | | | | | |
| Resecuritization | | | | | | | | |
| Pass-Through Trust | | | | | | | | |
| 2005-8R, 6.000%, 10/25/2034 | | | 1,817,526 | | | | 1,861,368 | |
| | | | | | | | | |
| Residential Asset | | | | | | | | |
| Securitization Trust | | | | | | | | |
| 2003-A9, 4.000%, 08/25/2033 | | | 1,115,992 | | | | 1,126,001 | |
| 2004-R2, 5.500%, 08/25/2034 | | | 1,840,726 | | | | 1,870,855 | |
| 2005-A5, 5.500%, 05/25/2035 | | | 1,125,147 | | | | 956,708 | |
| 2005-A11, 4.850%, 10/25/2035 | | | 3,585,050 | | | | 2,102,362 | |
| 2005-A11, 5.500%, 10/25/2035 | | | 265,613 | | | | 227,358 | |
| 2005-A11, 6.000%, 10/25/2035 | | | 408,179 | | | | 278,855 | |
| 2005-A15, 5.750%, 02/25/2036 | | | 3,536,251 | | | | 1,979,533 | |
| 2006-A5CB, 6.000%, 06/25/2036 | | | 2,310,874 | | | | 1,303,679 | |
2006-A10, 0.837% (1 Month LIBOR USD + 0.650%), | | | | | | | | |
| | | | | | | | |
| 09/25/2036 (b) | | | 10,488,641 | | | | 2,682,807 | |
2006-A10, 5.663% (1 Month LIBOR USD + 5.850%), | | | | | | | | |
| | | | | | | | |
| 09/25/2036 (b)(e)(i)(j) | | | 10,488,641 | | | | 2,796,001 | |
2006-A15, 0.787% (1 Month LIBOR USD + 0.600%), | | | | | | | | |
| | | | | | | | |
| 01/25/2037 (b) | | | 16,674,797 | | | | 4,216,831 | |
2006-A15, 5.463% (1 Month LIBOR USD + 5.650%), | | | | | | | | |
| | | | | | | | |
| 01/25/2037 (b)(e)(i)(j) | | | 16,674,797 | | | | 4,209,746 | |
| | | | | | | | | |
| RFMSI Trust | | | | | | | | |
| 2005-SA4, 2.970%, 09/25/2035 (f) | | | 1,739,518 | | | | 1,256,552 | |
| 2005-SA4, 3.162%, 09/25/2035 (f) | | | 1,498,062 | | | | 1,144,686 | |
| 2005-SA4, 3.258%, 09/25/2035 (f) | | | 127,592 | | | | 122,783 | |
| 2006-S3, 5.500%, 03/25/2036 | | | 2,127,131 | | | | 1,987,213 | |
| 2006-S4, 6.000%, 04/25/2036 | | | 1,975,801 | | | | 1,860,982 | |
| 2006-S5, 6.000%, 06/25/2036 | | | 203,387 | | | | 195,864 | |
| 2006-S5, 6.000%, 06/25/2036 | | | 418,682 | | | | 403,196 | |
| 2006-S5, 6.000%, 06/25/2036 | | | 1,754,602 | | | | 1,689,704 | |
| 2006-S5, 6.000%, 06/25/2036 | | | 218,066 | | | | 207,571 | |
| 2006-S6, 6.000%, 07/25/2036 | | | 115,320 | | | | 111,602 | |
| 2006-S6, 6.000%, 07/25/2036 | | | 593,694 | | | | 574,550 | |
| 2006-S7, 6.250%, 08/25/2036 | | | 1,220,849 | | | | 1,187,756 | |
| 2006-S7, 6.500%, 08/25/2036 | | | 729,898 | | | | 711,077 | |
| 2006-S9, 5.750%, 09/25/2036 | | | 1,628,811 | | | | 1,516,274 | |
| 2007-S1, 6.000%, 01/25/2037 | | | 503,468 | | | | 485,005 | |
| 2007-S7, 6.000%, 07/25/2037 | | | 1,679,683 | | | | 1,582,963 | |
| | | | | | | | | |
| Specialty Underwriting & | | | | | | | | |
| Residential Finance Trust | | | | | | | | |
| 2006-BC2, 3.684%, 02/25/2037 (h) | | | 840,759 | | | | 410,360 | |
| | | | | | | | | |
| STARM Mortgage Loan Trust | | | | | | | | |
| 2007-S1, 2.379%, 01/25/2037 (f) | | | 401,784 | | | | 343,452 | |
| 2007-1, 2.295%, 02/25/2037 (f) | | | 5,262,682 | | | | 4,871,828 | |
| 2007-2, 2.182%, 04/25/2037 (f) | | | 500,707 | | | | 269,724 | |
| | | | | | | | | |
| Structured Adjustable | | | | | | | | |
| Rate Mortgage Loan Trust | | | | | | | | |
| 2004-18, 2.414%, 12/25/2034 (f) | | | 539,548 | | | | 537,200 | |
| 2005-12, 2.661%, 06/25/2035 (f) | | | 698,098 | | | | 597,579 | |
| 2005-21, 3.323%, 11/25/2035 (f) | | | 3,512,904 | | | | 2,787,908 | |
| 2005-21, 3.477%, 11/25/2035 (f) | | | 179,439 | | | | 171,513 | |
| 2006-1, 2.827%, 02/25/2036 (f) | | | 352,809 | | | | 335,237 | |
| 2006-1, 2.875%, 02/25/2036 (f) | | | 1,266,479 | | | | 1,152,695 | |
| 2006-4, 3.230%, 05/25/2036 (f) | | | 648,579 | | | | 506,166 | |
| 2006-12, 3.732%, 01/25/2037 (f) | | | 617,002 | | | | 552,815 | |
2007-5, 0.627% (1 Month LIBOR USD + 0.440%), | | | | | | | | |
| | | | | | | | |
| 06/25/2037 (b) | | | 1,843,414 | | | | 1,777,709 | |
Percentages are stated as a percent of net assets.
The accompanying notes are an integral part of these financial statements.
PERFORMANCE TRUST STRATEGIC BOND FUND — SCHEDULE OF INVESTMENTS (CONT.)
February 28, 2022 (Unaudited)
| | | PRINCIPAL | | | | |
| | | AMOUNT | | | VALUE | |
| | | | | | | |
| Structured Adjustable | | | | | | |
| Rate Mortgage Loan Trust (Cont.) | | | | | | |
| 2007-6, 0.567% (1 Month LIBOR | | | | | | |
| USD + 0.380%), 07/25/2037 (b) | | $ | 5,259,854 | | | $ | 5,189,758 | |
| 2007-9, 2.034% (6 Month LIBOR | | | | | | | | |
| USD + 1.500%), 10/25/2037 (b) | | | 1,012,400 | | | | 1,039,318 | |
| | | | | | | | | |
| Suntrust Alternative Loan Trust | | | | | | | | |
| 2005-1F, 5.750%, 12/25/2035 | | | 1,022,522 | | | | 1,003,138 | |
| 2005-1F, 6.000%, 12/25/2035 | | | 2,361,225 | | | | 2,334,239 | |
| 2005-1F, 6.500%, 12/25/2035 | | | 2,423,029 | | | | 2,410,837 | |
| | | | | | | | | |
| TBW Mortgage-Backed Trust | | | | | | | | |
| 2006-2, 5.500%, 07/25/2036 (e) | | | 80,771 | | | | 4,700 | |
| | | | | | | | | |
| Volt LLC | | | | | | | | |
2021-NPL4, 4.949%, 03/27/2051 (a)(h) | | | | | | | | |
| | | 1,650,000 | | | | 1,612,384 | |
| | | | | | | | | |
| WaMu Mortgage Pass-Through | | | | | | | | |
| Certificates Trust | | | | | | | | |
| 2003-S4, 5.649%, 06/25/2033 (f) | | | 1,987,601 | | | | 2,029,389 | |
| 2003-AR10, 2.494%, | | | | | | | | |
| 10/25/2033 (f) | | | 8,294,106 | | | | 8,367,262 | |
| 2004-S2, 6.000%, 06/25/2034 | | | 48,654 | | | | 49,229 | |
| 2005-AR14, 2.829%, 12/25/2035 (f) | | | 5,295,249 | | | | 5,370,741 | |
| 2006-AR10, 2.738%, 09/25/2036 (f) | | | 1,051,495 | | | | 1,014,250 | |
| 2006-AR16, 2.716%, 12/25/2036 (f) | | | 1,154,389 | | | | 1,136,970 | |
| 2007-HY2, 3.008%, 12/25/2036 (f) | | | 14,709,907 | | | | 14,662,025 | |
| 2007-HY3, 2.856%, 03/25/2037 (f) | | | 2,580,961 | | | | 2,543,981 | |
| 2007-HY5, 2.882%, 05/25/2037 (f) | | | 1,275,451 | | | | 1,268,905 | |
| 2007-HY7, 3.009%, 07/25/2037 (f) | | | 244,198 | | | | 200,019 | |
| 2006-AR8, 2.839%, 08/25/2046 (f) | | | 1,693,906 | | | | 1,685,027 | |
| | | | | | | | | |
| Washington Mutual | | | | | | | | |
| Mortgage Pass-Through | | | | | | | | |
| Certificates WMALT Trust | | | | | | | | |
| 2005-1, 6.000%, 03/25/2035 | | | 1,168,271 | | | | 1,153,327 | |
| 2005-4, 5.500%, 06/25/2035 | | | 1,107,677 | | | | 1,091,013 | |
| 2005-5, 5.500%, 07/25/2035 | | | 1,195,532 | | | | 1,179,298 | |
| 2005-6, 5.500%, 08/25/2035 | | | 2,989,519 | | | | 2,899,492 | |
| 2005-6, 5.500%, 08/25/2035 | | | 653,548 | | | | 633,867 | |
| 2005-6, 5.500%, 08/25/2035 | | | 1,317,226 | | | | 1,279,712 | |
| 2005-6, 6.500%, 08/25/2035 | | | 360,320 | | | | 350,742 | |
| 2005-9, 5.500%, 11/25/2035 | | | 454,847 | | | | 446,803 | |
| 2006-8, 4.201%, 10/25/2036 (h) | | | 2,435,528 | | | | 1,177,986 | |
2007-HY1, 0.507% (1 Month LIBOR USD + 0.160%), | | | | | | | | |
| | | | | | | | |
| 02/25/2037 (b) | | | 2,049,058 | | | | 1,863,758 | |
| 2007-HY2, 3.493%, 04/25/2037 (f) | | | 1,249,813 | | | | 769,950 | |
2007-OC2, 0.497% (1 Month LIBOR USD + 0.310%), | | | | | | | | |
| | | | | | | | |
| 06/25/2037 (b) | | | 3,435,680 | | | | 3,385,674 | |
2007-OC1, 0.427% (1 Month LIBOR USD + 0.240%), | | | | | | | | |
| | | | | | | | |
| 01/25/2047 (b) | | | 4,068,160 | | | | 4,169,184 | |
| | | | | | | | | |
| Wells Fargo Alternative Loan Trust | | | | | | | | |
| 2007-PA1, 6.000%, 03/25/2037 | | | 991,672 | | | | 964,407 | |
| 2007-PA6, 2.774%, 12/28/2037 (f) | | | 4,554,719 | | | | 4,487,258 | |
| | | | | | | | | |
| Wells Fargo Mortgage | | | | | | | | |
| Backed Securities Trust | | | | | | | | |
| 2004-J, 2.596%, 07/25/2034 (f) | | | 4,535,240 | | | | 4,527,195 | |
| 2005-AR14, 2.623%, 08/25/2035 (f) | | | 667,169 | | | | 674,965 | |
| 2006-AR1, 2.649%, 03/25/2036 (f) | | | 1,697,388 | | | | 1,709,201 | |
| 2006-AR5, 2.614%, 04/25/2036 (f) | | | 3,014,338 | | | | 2,996,259 | |
| 2006-AR5, 2.640%, 04/25/2036 (f) | | | 1,714,617 | | | | 1,700,295 | |
| 2006-AR19, 2.727%, 12/25/2036 (f) | | | 2,035,764 | | | | 2,028,845 | |
| 2007-AR3, 2.694%, 04/25/2037 (f) | | | 875,475 | | | | 820,453 | |
| TOTAL NON-AGENCY RESIDENTIAL | | | | | | | | |
| MORTGAGE BACKED SECURITIES | | | | | | | | |
| (Cost $741,592,836) | | | | | | | 678,489,401 | |
| | | | | | | | | |
| NON-AGENCY COMMERCIAL | | | | | | | | |
| MORTGAGE BACKED SECURITIES – 18.20% | | | | | | | | |
| | | | | | | | | |
| 225 Liberty Street Trust | | | | | | | | |
2016-225L, 4.649%, 02/10/2036 (a)(f) | | | | | | | | |
| | | 5,000,000 | | | | 4,990,522 | |
2016-225L, 4.649%, 02/10/2036 (a)(f) | | | | | | | | |
| | | 4,500,000 | | | | 4,421,012 | |
| | | | | | | | | |
| Arbor Multifamily Mortgage Securities Trust | | | | | | | | |
2022-MF4, 3.293%, 12/15/2054 (a)(f) | | | | | | | | |
| | | 7,852,000 | | | | 7,821,471 | |
2022-MF4, 1.293%, 12/15/2054 | | | | | | | | |
| | | 19,700,000 | | | | 2,163,040 | |
| | | | | | | | | |
| BANK | | | | | | | | |
2021-BNK35, 1.052%, 06/15/2064 (j) | | | | | | | | |
| | | 48,791,353 | | | | 3,645,787 | |
2019-BNK16, 0.944%, 02/15/2052 (f)(j) | | | | | | | | |
| | | 78,830,434 | | | | 4,241,842 | |
2019-BNK17, 0.567%, 04/15/2052 (f)(j) | | | | | | | | |
| | | 123,653,000 | | | | 4,827,042 | |
2019-BNK17, 1.595%, 04/15/2052 (a)(f)(j) | | | | | | | | |
| | | 11,541,000 | | | | 1,149,407 | |
2019-BNK21, 1.112%, 10/17/2052 (a)(f)(j) | | | | | | | | |
| | | 18,699,333 | | | | 1,388,207 | |
2019-BNK21, 2.808%, 10/17/2052 | | | | | | | | |
| | | 11,582,000 | | | | 11,772,651 | |
2019-BNK23, 0.176%, 12/15/2052 (f)(j) | | | | | | | | |
| | | 238,421,000 | | | | 3,480,923 | |
2019-BNK23, 0.695%, 12/15/2052 (j) | | | | | | | | |
| | | 85,280,802 | | | | 4,016,990 | |
2020-BNK29, 0.654%, 11/15/2053 (f)(j) | | | | | | | | |
| | | 132,417,000 | | | | 6,784,690 | |
2020-BNK29, 2.500%, 11/15/2053 (a) | | | | | | | | |
| | | 1,250,000 | | | | 1,036,868 | |
2020-BNK29, 3.028%, 11/15/2053 (f) | | | | | | | | |
| | | 1,170,000 | | | | 1,102,761 | |
Percentages are stated as a percent of net assets.
The accompanying notes are an integral part of these financial statements.
PERFORMANCE TRUST STRATEGIC BOND FUND — SCHEDULE OF INVESTMENTS (CONT.)
February 28, 2022 (Unaudited)
| | | PRINCIPAL | | | | |
| | | AMOUNT | | | VALUE | |
| | | | | | | |
| BANK (Cont.) | | | | | | |
2020-BNK30, 2.500%, 12/15/2053 (a)(f) | | | | | | |
| | $ | 5,550,000 | | | $ | 4,596,860 | |
2020-BNK30, 2.757%, 12/15/2053 (f) | | | | | | | | |
| | | 2,450,000 | | | | 2,236,458 | |
2021-BNK31, 1.739%, 02/15/2054 | | | | | | | | |
| | | 7,250,000 | | | | 6,920,160 | |
2021-BNK32, 2.332%, 04/15/2054 | | | | | | | | |
| | | 10,727,500 | | | | 10,557,632 | |
2021-BNK32, 2.500%, 04/15/2054 (a) | | | | | | | | |
| | | 5,000,000 | | | | 4,164,616 | |
2019-BNK20, 2.933%, 09/15/2062 | | | | | | | | |
| | | 2,100,000 | | | | 2,141,923 | |
2019-BNK24, 0.186%, 11/15/2062 (f)(j) | | | | | | | | |
| | | 174,693,000 | | | | 2,867,411 | |
2020-BNK25, 0.885%, 01/15/2063 (f)(j) | | | | | | | | |
| | | 108,994,649 | | | | 6,380,623 | |
2020-BNK26, 0.600%, 03/15/2063 (f)(j) | | | | | | | | |
| | | 226,593,000 | | | | 10,149,848 | |
2020-BNK28, 0.972%, 03/15/2063 (f)(j) | | | | | | | | |
| | | 29,969,467 | | | | 2,252,811 | |
2020-BNK26, 2.041%, 03/15/2063 | | | | | | | | |
| | | 5,200,000 | | | | 5,042,337 | |
2021-BNK34, 0.979%, 06/15/2063 (j) | | | | | | | | |
| | | 95,786,855 | | | | 6,745,531 | |
2021-BNK34, 2.754%, 06/15/2063 (f) | | | | | | | | |
| | | 8,000,000 | | | | 7,611,177 | |
2022-BNK40, 2.500%, 03/15/2064 | | | | | | | | |
| | | 2,470,000 | | | | 1,957,201 | |
2022-BNK40, 3.507%, 03/15/2064 | | | | | | | | |
| | | 5,000,000 | | | | 4,999,135 | |
2021-BNK33, 2.218%, 05/15/2064 | | | | | | | | |
| | | 12,599,000 | | | | 12,354,884 | |
2021-BNK35, 2.067%, 06/15/2064 | | | | | | | | |
| | | 10,400,000 | | | | 10,052,760 | |
2021-BNK36, 0.918%, 09/15/2064 (j) | | | | | | | | |
| | | 94,115,689 | | | | 5,678,809 | |
2021-BNK36, 2.283%, 09/15/2064 | | | | | | | | |
| | | 12,250,000 | | | | 11,980,284 | |
2021-BNK37, 2.487%, 11/15/2064 | | | | | | | | |
| | | 14,400,000 | | | | 14,259,954 | |
| | | | | | | | | |
| Barclays Commercial | | | | | | | | |
| Mortgage Trust | | | | | | | | |
2019-C3, 0.774%, 05/15/2052 (f)(j) | | | | | | | | |
| | | 56,340,000 | | | | 2,992,629 | |
2019-C4, 1.144%, 08/15/2052 (f)(j) | | | | | | | | |
| | | 43,170,000 | | | | 3,223,832 | |
2019-C5, 0.372%, 11/15/2052 (f)(j) | | | | | | | | |
| | | 174,774,000 | | | | 4,281,613 | |
2019-C5, 1.351%, 11/15/2052 (a)(f)(j) | | | | | | | | |
| | | 12,996,000 | | | | 1,124,349 | |
| | | | | | | | | |
| BBCMS Mortgage Trust | | | | | | | | |
2020-C6, 0.677%, 02/15/2053 (f)(j) | | | | | | | | |
| | | 59,000,000 | | | | 2,999,094 | |
2020-C6, 1.054%, 02/15/2053 (f)(j) | | | | | | | | |
| | | 93,389,761 | | | | 6,190,938 | |
2020-C7, 0.987%, 04/15/2053 (f)(j) | | | | | | | | |
| | | 17,140,000 | | | | 1,268,302 | |
2020-C7, 1.627%, 04/15/2053 (f)(j) | | | | | | | | |
| | | 22,065,278 | | | | 2,058,344 | |
2021-C9, 0.995%, 02/15/2054 (f)(j) | | | | | | | | |
| | | 68,467,000 | | | | 5,380,479 | |
| 2021-C9, 1.960%, 02/15/2054 | | | 10,000,000 | | | | 9,656,864 | |
| 2021-C9, 2.534%, 02/15/2054 | | | 8,500,000 | | | | 8,070,583 | |
| 2021-C10, 2.268%, 07/15/2054 | | | 10,000,000 | | | | 9,785,809 | |
| 2021-C10, 1.022%, 07/15/2054 (j) | | | 73,112,500 | | | | 6,092,735 | |
| 2021-C10, 1.306%, 07/15/2054 (j) | | | 65,559,583 | | | | 5,972,295 | |
| 2021-C11, 0.967%, 09/15/2054 (j) | | | 29,540,000 | | | | 2,459,382 | |
| 2021-C11, 2.108%, 09/15/2054 | | | 29,000,000 | | | | 27,979,896 | |
| 2021-C12, 0.595%, 11/15/2054 (j) | | | 59,992,000 | | | | 3,243,893 | |
| 2021-C12, 0.959%, 11/15/2054 (j) | | | 101,906,195 | | | | 7,193,650 | |
| 2021-C12, 2.500%, 11/15/2054 (a) | | | 4,750,000 | | | | 3,812,140 | |
| 2021-C12, 2.542%, 11/15/2054 | | | 12,000,000 | | | | 11,913,666 | |
| 2021-C12, 2.758%, 11/15/2054 | | | 9,000,000 | | | | 8,466,482 | |
2022-C14, 0.256%, 02/15/2055 (f)(j) | | | | | | | | |
| | | 166,823,000 | | | | 4,900,809 | |
2022-C14, 0.740%, 02/15/2055 (f)(j) | | | | | | | | |
| | | 100,757,000 | | | | 5,504,637 | |
| 2022-C14, 3.350%, 02/15/2055 | | | 10,000,000 | | | | 10,090,127 | |
| | | | | | | | | |
| Benchmark Mortgage Trust | | | | | | | | |
| 2021-B28, 1.290%, 08/15/2054 (j) | | | 86,479,655 | | | | 7,891,234 | |
2019-B9, 1.038%, 03/15/2052 (f)(j) | | | | | | | | |
| | | 29,725,135 | | | | 1,773,051 | |
2019-B9, 2.001%, 03/15/2052 (a)(f)(j) | | | | | | | | |
| | | 11,513,000 | | | | 1,390,416 | |
2019-B12, 0.416%, 08/15/2052 (a)(f)(j) | | | | | | | | |
| | | 93,260,000 | | | | 2,688,425 | |
2020-B16, 0.240%, 02/15/2053 (a)(f)(j) | | | | | | | | |
| | | 70,467,000 | | | | 1,278,053 | |
2020-B16, 0.927%, 02/15/2053 (f)(j) | | | | | | | | |
| | | 102,946,938 | | | | 6,319,192 | |
2020-B20, 0.582%, 10/15/2053 (f)(j) | | | | | | | | |
| | | 79,394,000 | | | | 3,436,466 | |
| 2020-B21, 1.798%, 12/17/2053 | | | 5,966,000 | | | | 5,727,444 | |
| 2020-B22, 1.731%, 01/15/2054 | | | 2,490,000 | | | | 2,364,418 | |
2021-B23, 0.905%, 02/15/2054 (a)(f)(j) | | | | | | | | |
| | | 105,441,000 | | | | 7,787,240 | |
2021-B23, 1.276%, 02/15/2054 (f)(j) | | | | | | | | |
| | | 119,031,821 | | | | 10,289,968 | |
| 2021-B23, 1.766%, 02/15/2054 | | | 5,000,000 | | | | 4,786,776 | |
2021-B24, 0.591%, 03/15/2054 (f)(j) | | | | | | | | |
| | | 99,123,000 | | | | 5,068,407 | |
2021-B24, 1.154%, 03/15/2054 (f)(j) | | | | | | | | |
| | | 66,665,201 | | | | 5,225,925 | |
Percentages are stated as a percent of net assets.
The accompanying notes are an integral part of these financial statements.
PERFORMANCE TRUST STRATEGIC BOND FUND — SCHEDULE OF INVESTMENTS (CONT.)
February 28, 2022 (Unaudited)
| | | PRINCIPAL | | | | |
| | | AMOUNT | | | VALUE | |
| | | | | | | |
| Benchmark Mortgage Trust (Cont.) | | | | | | |
| 2021-B24, 2.256%, 03/15/2054 | | $ | 5,400,000 | | | $ | 5,314,657 | |
| 2021-B25, 0.661%, 04/15/2054 (j) | | | 93,350,000 | | | | 5,239,866 | |
| 2021-B25, 1.109%, 04/15/2054 (j) | | | 79,524,908 | | | | 6,289,681 | |
| 2021-B26, 1.369%, 06/15/2054 (j) | | | 10,836,000 | | | | 1,211,712 | |
| 2021-B26, 2.000%, 06/15/2054 (a) | | | 2,250,000 | | | | 1,773,451 | |
| 2021-B26, 2.688%, 06/15/2054 (f) | | | 6,000,000 | | | | 5,598,451 | |
| 2021-B27, 1.271%, 07/15/2054 (j) | | | 100,852,083 | | | | 9,076,445 | |
| 2021-B27, 1.488%, 07/15/2054 (j) | | | 21,507,000 | | | | 2,639,195 | |
| 2021-B27, 2.000%, 07/15/2054 (a) | | | 5,000,000 | | | | 3,931,026 | |
| 2021-B27, 2.355%, 07/15/2054 | | | 6,000,000 | | | | 5,457,108 | |
| 2021-B27, 2.703%, 07/15/2054 | | | 2,000,000 | | | | 1,823,308 | |
| 2021-B28, 0.955%, 08/15/2054 (j) | | | 32,491,000 | | | | 2,634,984 | |
| 2021-B28, 1.980%, 08/15/2054 | | | 10,000,000 | | | | 9,615,098 | |
| 2021-B29, 1.308%, 09/15/2054 (j) | | | 27,615,000 | | | | 2,941,831 | |
| 2021-B29, 2.000%, 09/15/2054 (a) | | | 8,953,000 | | | | 6,432,606 | |
| 2021-B29, 2.205%, 09/15/2054 | | | 24,171,000 | | | | 23,533,151 | |
2021-B30, 0.594%, 11/15/2054 (a)(f)(j) | | | | | | | | |
| | | 83,683,000 | | | | 4,063,496 | |
2021-B30, 1.301%, 11/15/2054 (a)(f)(j) | | | | | | | | |
| | | 18,582,000 | | | | 1,960,377 | |
| 2021-B30, 2.000%, 11/15/2054 (a) | | | 2,250,000 | | | | 1,601,325 | |
| 2021-B30, 2.000%, 11/15/2054 (a) | | | 1,500,000 | | | | 1,168,686 | |
| 2021-B30, 2.431%, 11/15/2054 | | | 5,250,000 | | | | 5,185,692 | |
| 2021-B30, 2.881%, 11/15/2054 (f) | | | 7,250,000 | | | | 6,717,275 | |
| 2021-B31, 0.427%, 12/15/2054 | | | 124,409,000 | | | | 5,059,851 | |
| 2021-B31, 0.776%, 12/15/2054 | | | 143,951,519 | | | | 8,764,963 | |
| 2021-B31, 1.142%, 12/15/2054 | | | 31,991,000 | | | | 3,019,480 | |
| 2021-B31, 2.250%, 12/15/2054 (a) | | | 3,000,000 | | | | 2,369,126 | |
| 2021-B31, 2.615%, 12/15/2054 | | | 10,000,000 | | | | 9,939,725 | |
| 2021-B31, 3.195%, 12/15/2054 (f) | | | 5,000,000 | | | | 4,745,792 | |
2022-B32, 1.522%, 01/15/2055 (a)(f)(j) | | | | | | | | |
| | | 39,202,000 | | | | 4,652,074 | |
| 2022-B32, 2.000%, 01/15/2055 (a) | | | 10,000,000 | | | | 7,440,960 | |
| 2022-B32, 3.411%, 01/15/2055 (f) | | | 10,000,000 | | | | 10,063,923 | |
| 2022-B33, 0.000%, 03/17/2055 (d) | | | 21,919,000 | | | | 2,739,020 | |
2019-B13, 0.404%, 08/15/2057 (a)(f)(j) | | | | | | | | |
| | | 82,774,000 | | | | 2,314,469 | |
2019-B13, 1.505%, 08/15/2057 (a)(f)(j) | | | | | | | | |
| | | 12,071,000 | | | | 1,189,834 | |
| | | | | | | | | |
| BMO Mortgage Trust | | | | | | | | |
2022-C1, 1.767%, 02/15/2055 (a)(f)(j) | | | | | | | | |
| | | 30,550,000 | | | | 4,420,310 | |
| 2022-C1, 3.468%, 02/15/2055 | | | 10,000,000 | | | | 10,049,842 | |
| | | | | | | | | |
| California Housing Finance Agency | | | | | | | | |
| 2021-2, 0.816%, 03/25/2035 (j) | | | 32,371,583 | | | | 2,065,955 | |
| 2021-1, 0.796%, 11/20/2035 (j) | | | 28,653,555 | | | | 1,832,681 | |
| 2021-3, 0.764%, 08/20/2036 (j) | | | 26,202,898 | | | | 1,812,192 | |
| | | | | | | | | |
| Cantor Commercial | | | | | | | | |
| Real Estate Lending | | | | | | | | |
2019-CF2, 0.653%, 11/15/2052 (f)(j) | | | | | | | | |
| | | 134,736,000 | | | | 5,779,811 | |
| | | | | | | | | |
| CCUBS Commercial | | | | | | | | |
| Mortgage Trust | | | | | | | | |
2017-C1, 0.289%, 11/15/2050 (f)(j) | | | | | | | | |
| | | 40,062,667 | | | | 690,684 | |
| | | | | | | | | |
| CD Mortgage Trust | | | | | | | | |
2017-CD3, 0.570%, 02/10/2050 (f)(j) | | | | | | | | |
| | | 61,857,000 | | | | 1,727,753 | |
| 2018-CD7, 4.213%, 08/15/2051 | | | 3,236,000 | | | | 3,432,874 | |
| | | | | | | | | |
| CGMS Commercial | | | | | | | | |
| Mortgage Trust | | | | | | | | |
2017-B1, 0.206%, 08/15/2050 (f)(j) | | | | | | | | |
| | | 38,016,000 | | | | 408,634 | |
| | | | | | | | | |
| Citigroup Commercial | | | | | | | | |
| Mortgage Trust | | | | | | | | |
2013-GC17, 5.102%, 11/10/2046 (f) | | | | | | | | |
| | | 5,000,000 | | | | 5,048,338 | |
2014-GC19, 4.805%, 03/10/2047 (f) | | | | | | | | |
| | | 3,030,000 | | | | 3,134,476 | |
2014-GC19, 5.091%, 03/10/2047 (f) | | | | | | | | |
| | | 2,757,579 | | | | 2,835,269 | |
| 2016-C1, 4.117%, 05/10/2049 | | | 3,000,000 | | | | 3,081,036 | |
| 2016-C1, 4.943%, 05/10/2049 (f) | | | 6,840,000 | | | | 7,143,004 | |
| 2016-P6, 4.167%, 12/10/2049 (f) | | | 6,835,000 | | | | 7,040,349 | |
| 2017-P7, 0.557%, 04/14/2050 (f)(j) | | | 45,124,000 | | | | 1,300,708 | |
| 2017-P8, 4.192%, 09/15/2050 | | | 4,160,000 | | | | 4,339,246 | |
| 2017-P8, 4.265%, 09/15/2050 (f) | | | 5,000,000 | | | | 5,106,350 | |
| 2017-C4, 0.305%, 10/12/2050 (f)(j) | | | 42,746,500 | | | | 653,902 | |
| 2017-C4, 1.081%, 10/12/2050 (f)(j) | | | 31,834,248 | | | | 1,328,268 | |
| 2018-B2, 0.391%, 03/10/2051 (f)(j) | | | 49,202,000 | | | | 1,147,150 | |
2018-C5, 0.176%, 06/10/2051 (a)(f)(j) | | | | | | | | |
| | | 28,400,000 | | | | 599,462 | |
| 2018-C6, 4.343%, 11/10/2051 | | | 5,000,000 | | | | 5,368,390 | |
| 2018-C6, 4.412%, 11/10/2051 | | | 3,000,000 | | | | 3,279,728 | |
2020-GC46, 0.319%, 02/15/2053 (a)(f)(j) | | | | | | | | |
| | | 92,457,000 | | | | 2,453,800 | |
2020-GC46, 0.985%, 02/15/2053 (f)(j) | | | | | | | | |
| | | 89,627,391 | | | | 5,665,948 | |
2019-GC41, 1.056%, 08/10/2056 (f)(j) | | | | | | | | |
| | | 53,332,274 | | | | 3,202,043 | |
| 2019-GC41, 3.018%, 08/10/2056 | | | 10,339,000 | | | | 10,325,920 | |
2019-C7, 0.285%, 12/15/2072 (a)(f)(j) | | | | | | | | |
| | | 50,711,000 | | | | 1,118,031 | |
2019-C7, 0.873%, 12/15/2072 (f)(j) | | | | | | | | |
| | | 76,287,876 | | | | 4,270,000 | |
2019-C7, 1.202%, 12/15/2072 (a)(f)(j) | | | | | | | | |
| | | 39,933,000 | | | | 3,329,785 | |
| 2019-C7, 3.667%, 12/15/2072 (f) | | | 10,000,000 | | | | 10,123,786 | |
| | | | | | | | | |
| COMM Mortgage Trust | | | | | | | | |
2014-CR18, 4.456%, 07/15/2047 (f) | | | | | | | | |
| | | 4,550,700 | | | | 4,659,412 | |
2013-CR11, 0.907%, 08/10/2050 (f)(j) | | | | | | | | |
| | | 49,545,979 | | | | 563,466 | |
Percentages are stated as a percent of net assets.
The accompanying notes are an integral part of these financial statements.
PERFORMANCE TRUST STRATEGIC BOND FUND — SCHEDULE OF INVESTMENTS (CONT.)
February 28, 2022 (Unaudited)
| | | PRINCIPAL | | | | |
| | | AMOUNT | | | VALUE | |
| | | | | | | |
| COMM Mortgage Trust (Cont.) | | | | | | |
2019-GC44, 1.027%, 08/15/2057 (a)(f)(j) | | | | | | |
| | $ | 19,460,000 | | | $ | 1,392,758 | |
| | | | | | | | | |
| Connecticut Avenue | | | | | | | | |
| Securities Trust | | | | | | | | |
| 2021-R03, 2.799% (SOFR30A | | | | | | | | |
| + 2.750%), 12/25/2041 (a)(b) | | | 5,685,000 | | | | 5,288,820 | |
| 2022-R02, 3.049% (SOFR30A | | | | | | | | |
| + 3.000%), 01/25/2042 (a)(b) | | | 10,000,000 | | | | 9,858,348 | |
| | | | | | | | | |
| CSAIL Commercial | | | | | | | | |
| Mortgage Trust | | | | | | | | |
2016-C5, 1.000%, 11/15/2048 (a)(f)(j) | | | | | | | | |
| | | 46,821,000 | | | | 1,475,831 | |
2015-C1, 0.500%, 04/15/2050 (a)(f)(j) | | | | | | | | |
| | | 62,192,000 | | | | 768,183 | |
2017-C8, 0.383%, 06/15/2050 (f)(j) | | | | | | | | |
| | | 74,773,000 | | | | 1,356,607 | |
2019-C17, 1.360%, 09/15/2052 (f)(j) | | | | | | | | |
| | | 85,356,379 | | | | 6,563,666 | |
2019-C18, 1.069%, 12/15/2052 (f)(j) | | | | | | | | |
| | | 92,708,484 | | | | 5,458,073 | |
| | | | | | | | | |
| Freddie Mac Multifamily | | | | | | | | |
| Structured Credit Risk | | | | | | | | |
| 2021-MN3, 4.049% (SOFR30A | | | | | | | | |
| + 4.000%), 11/25/2051 (a)(b) | | | 7,000,000 | | | | 6,711,242 | |
| | | | | | | | | |
| FREMF Mortgage Trust | | | | | | | | |
2019-KF62, 2.157% (1 Month LIBOR USD + 2.050%), | | | | | | | | |
| | | | | | | | |
| 04/25/2026 (a)(b) | | | 2,802,772 | | | | 2,790,681 | |
2019-K735, 4.019%, 05/25/2026 (a)(f) | | | | | | | | |
| | | 6,000,000 | | | | 6,303,051 | |
2018-KF48, 2.157% (1 Month LIBOR USD + 2.050%), | | | | | | | | |
| | | | | | | | |
| 06/25/2028 (a)(b) | | | 4,459,116 | | | | 4,398,071 | |
2018-KF50, 2.007% (1 Month LIBOR USD + 1.900%), | | | | | | | | |
| | | | | | | | |
| 07/25/2028 (a)(b) | | | 2,916,178 | | | | 2,886,438 | |
2019-K734, 4.051%, 02/25/2051 (a)(f) | | | | | | | | |
| | | 5,000,000 | | | | 5,211,831 | |
2019-K101, 3.527%, 10/25/2052 (a)(f) | | | | | | | | |
| | | 10,000,000 | | | | 10,144,622 | |
| | | | | | | | | |
| GS Mortgage Securities Corp. II | | | | | | | | |
2012-BWTR, 3.255%, 11/05/2034 (a) | | | | | | | | |
| | | 6,608,000 | | | | 6,565,622 | |
2018-GS10, 1.409%, 07/10/2051 (a)(f)(j) | | | | | | | | |
| | | 24,049,000 | | | | 2,014,500 | |
| | | | | | | | | |
| GS Mortgage Securities Trust | | | | | | | | |
2015-GC32, 4.412%, 07/10/2048 (f) | | | | | | | | |
| | | 5,100,000 | | | | 5,275,771 | |
2016-GS3, 3.395%, 10/10/2049 (f) | | | | | | | | |
| | | 10,417,000 | | | | 10,277,865 | |
2015-GC30, 4.028%, 05/10/2050 (f) | | | | | | | | |
| | | 2,960,000 | | | | 3,024,362 | |
2017-GS8, 0.382%, 11/10/2050 (f)(j) | | | | | | | | |
| | | 44,642,000 | | | | 946,312 | |
2019-GC38, 1.834%, 02/10/2052 (a)(f)(j) | | | | | | | | |
| | | 20,916,000 | | | | 2,408,193 | |
2019-GC39, 0.636%, 05/10/2052 (f)(j) | | | | | | | | |
| | | 69,588,000 | | | | 3,017,746 | |
2019-GC39, 1.623%, 05/10/2052 (a)(f)(j) | | | | | | | | |
| | | 8,215,000 | | | | 847,637 | |
2019-GC40, 1.158%, 07/10/2052 (a)(f)(j) | | | | | | | | |
| | | 5,920,000 | | | | 479,469 | |
| 2019-GC42, 3.212%, 09/01/2052 | | | 6,775,000 | | | | 6,787,872 | |
2019-GSA1, 0.826%, 11/10/2052 (f)(j) | | | | | | | | |
| | | 72,661,531 | | | | 3,921,528 | |
2020-GSA2, 0.940%, 12/12/2053 (a)(f)(j) | | | | | | | | |
| | | 73,324,000 | | | | 5,423,417 | |
| | | | | | | | | |
| JP Morgan Chase Commercial | | | | | | | | |
| Mortgage Securities Trust | | | | | | | | |
| 2012-CBX, 4.775%, 06/15/2045 (f) | | | 6,680,000 | | | | 6,500,701 | |
| 2015-JP1, 4.719%, 01/15/2049 (f) | | | 7,485,000 | | | | 7,692,718 | |
2007-CB20, 0.000%, 02/12/2051 (a)(d)(e)(f)(j) | | | | | | | | |
| | | 288,528 | | | | — | |
| | | | | | | | | |
| JPMBB Commercial | | | | | | | | |
| Mortgage Securities Trust | | | | | | | | |
| 2015-C30, 4.263%, 07/15/2048 (f) | | | 2,985,000 | | | | 3,018,128 | |
| 2015-C28, 3.532%, 10/15/2048 | | | 5,000,000 | | | | 5,015,048 | |
2015-C32, 0.500%, 11/15/2048 (a)(f)(j) | | | | | | | | |
| | | 23,066,000 | | | | 351,664 | |
| | | | | | | | | |
| JPMCC Commercial | | | | | | | | |
| Mortgage Securities Trust | | | | | | | | |
2017-JP6, 0.655%, 07/15/2050 (f)(j) | | | | | | | | |
| | | 68,830,000 | | | | 2,219,375 | |
| | | | | | | | | |
| JPMDB Commercial | | | | | | | | |
| Mortgage Securities Trust | | | | | | | | |
| 2016-C4, 3.638%, 12/15/2049 (f) | | | 5,500,000 | | | | 5,455,392 | |
| | | | | | | | | |
| Morgan Stanley Bank of | | | | | | | | |
| America Merrill Lynch Trust | | | | | | | | |
| 2013-C12, 4.482%, 10/15/2046 (f) | | | 5,000,000 | | | | 5,131,575 | |
| 2015-C27, 4.503%, 12/15/2047 (f) | | | 3,000,000 | | | | 3,098,749 | |
| 2015-C25, 4.526%, 10/15/2048 (f) | | | 5,195,000 | | | | 5,268,967 | |
2016-C31, 1.274%, 11/15/2049 (a)(f)(j) | | | | | | | | |
| | | 21,212,500 | | | | 1,057,982 | |
| 2015-C23, 4.143%, 07/15/2050 (f) | | | 3,845,000 | | | | 3,989,163 | |
| 2017-C34, 2.700%, 11/15/2052 (a) | | | 3,310,000 | | | | 2,734,429 | |
| 2017-C34, 4.111%, 11/15/2052 (f) | | | 5,054,000 | | | | 5,217,892 | |
| | | | | | | | | |
| Morgan Stanley Capital I Trust | | | | | | | | |
2016-BNK2, 0.532%, 11/15/2049 (f)(j) | | | | | | | | |
| | | 58,680,000 | | | | 1,405,151 | |
| 2017-H1, 2.161%, 06/15/2050 | | | 8,725,000 | | | | 868,018 | |
Percentages are stated as a percent of net assets.
The accompanying notes are an integral part of these financial statements.
PERFORMANCE TRUST STRATEGIC BOND FUND — SCHEDULE OF INVESTMENTS (CONT.)
February 28, 2022 (Unaudited)
| | | PRINCIPAL | | | | |
| | | AMOUNT | | | VALUE | |
| | | | | | | |
| Morgan Stanley | | | | | | |
| Capital I Trust (Cont.) | | | | | | |
| 2017-H1, 4.281%, 06/15/2050 (f) | | $ | 2,880,000 | | | $ | 2,855,138 | |
2018-H3, 0.372%, 07/15/2051 (f)(j) | | | | | | | | |
| | | 135,712,000 | | | | 3,157,340 | |
2018-H3, 1.864%, 07/15/2051 (a)(f)(j) | | | | | | | | |
| | | 15,363,500 | | | | 1,536,278 | |
| 2018-H3, 4.120%, 07/15/2051 | | | 5,000,000 | | | | 5,295,431 | |
2019-L2, 0.624%, 03/15/2052 (f)(j) | | | | | | | | |
| | | 127,093,000 | | | | 5,265,298 | |
2019-H7, 0.660%, 07/15/2052 (f)(j) | | | | | | | | |
| | | 130,723,000 | | | | 5,846,952 | |
| 2021-L5, 0.714%, 05/15/2031 (j) | | | 70,387,500 | | | | 4,316,408 | |
| 2021-L5, 2.500%, 05/15/2054 (a) | | | 3,500,000 | | | | 2,850,202 | |
| 2021-L5, 3.102%, 05/15/2054 | | | 6,627,000 | | | | 6,418,158 | |
| 2021-L6, 2.250%, 06/15/2054 (f) | | | 11,900,000 | | | | 11,628,216 | |
| 2021-L6, 2.951%, 06/15/2054 (f) | | | 7,500,000 | | | | 7,170,740 | |
| 2021-L7, 0.412%, 10/15/2031 | | | 143,080,000 | | | | 5,504,531 | |
| 2021-L7, 2.336%, 10/15/2054 | | | 15,100,000 | | | | 14,797,689 | |
| | | | | | | | | |
| RBS Commercial | | | | | | | | |
| Funding, Inc. Trust | | | | | | | | |
2013-SMV, 3.584%, 03/11/2031 (a)(f) | | | | | | | | |
| | | 6,100,000 | | | | 6,064,675 | |
| | | | | | | | | |
| UBS Commercial Mortgage Trust | | | | | | | | |
2017-C1, 0.944%, 06/15/2050 (f)(j) | | | | | | | | |
| | | 13,000,000 | | | | 606,196 | |
2017-C6, 0.355%, 12/15/2050 (f)(j) | | | | | | | | |
| | | 63,420,500 | | | | 1,742,015 | |
2017-C7, 0.360%, 12/15/2050 (f)(j) | | | | | | | | |
| | | 170,396,000 | | | | 3,427,993 | |
2018-C12, 0.227%, 08/15/2051 (f)(j) | | | | | | | | |
| | | 139,858,000 | | | | 2,802,377 | |
2018-C12, 0.807%, 08/15/2051 (f)(j) | | | | | | | | |
| | | 48,595,274 | | | | 2,051,828 | |
2018-C13, 0.252%, 10/15/2051 (f)(j) | | | | | | | | |
| | | 128,678,000 | | | | 2,855,159 | |
2018-C13, 1.975%, 10/15/2051 (a)(f)(j) | | | | | | | | |
| | | 16,442,000 | | | | 1,942,070 | |
| 2018-C13, 4.241%, 10/15/2051 | | | 3,274,000 | | | | 3,462,679 | |
2018-C14, 0.300%, 12/15/2051 (f)(j) | | | | | | | | |
| | | 114,392,000 | | | | 2,620,892 | |
2019-C17, 0.852%, 10/15/2052 (f)(j) | | | | | | | | |
| | | 128,213,000 | | | | 7,460,061 | |
| 2019-C18, 2.987%, 12/15/2052 | | | 4,500,000 | | | | 4,601,273 | |
| 2019-C18, 3.378%, 12/15/2052 (f) | | | 9,000,000 | | | | 9,011,945 | |
| | | | | | | | | |
| UBS-Barclays Commercial | | | | | | | | |
| Mortgage Trust | | | | | | | | |
2012-C3, 4.365%, 08/10/2049 (a)(f) | | | | | | | | |
| | | 6,000,000 | | | | 6,044,374 | |
| | | | | | | | | |
| Washington State Housing | | | | | | | | |
| Finance Commission | | | | | | | | |
| 2021-1, 0.725%, 12/20/2035 (j) | | | 21,050,384 | | | | 1,217,344 | |
| | | | | | | | | |
| Wells Fargo Commercial | | | | | | | | |
| Mortgage Trust | | | | | | | | |
2015-NXS1, 3.658%, 05/15/2048 (f) | | | | | | | | |
| | | 1,320,000 | | | | 1,334,885 | |
2016-LC24, 0.979%, 10/15/2049 (f)(j) | | | | | | | | |
| | | 66,264,075 | | | | 2,703,077 | |
2017-RB1, 0.695%, 03/15/2050 (f)(j) | | | | | | | | |
| | | 69,254,209 | | | | 2,420,040 | |
2017-C42, 0.324%, 12/15/2050 (f)(j) | | | | | | | | |
| | | 116,750,000 | | | | 2,352,956 | |
2018-C48, 0.254%, 01/15/2052 (f)(j) | | | | | | | | |
| | | 138,642,000 | | | | 2,646,135 | |
| 2018-C48, 4.245%, 01/15/2052 | | | 7,000,000 | | | | 7,470,459 | |
2019-C49, 0.602%, 03/15/2052 (f)(j) | | | | | | | | |
| | | 125,812,000 | | | | 5,183,568 | |
| 2019-C49, 3.933%, 03/15/2052 | | | 5,000,000 | | | | 5,300,944 | |
| 2019-C49, 4.546%, 03/15/2052 | | | 4,647,000 | | | | 4,934,260 | |
2019-C50, 0.864%, 05/15/2052 (f)(j) | | | | | | | | |
| | | 36,427,311 | | | | 2,066,310 | |
2019-C51, 0.676%, 06/15/2052 (f)(j) | | | | | | | | |
| | | 130,394,000 | | | | 5,818,624 | |
2019-C52, 1.094%, 08/15/2052 (f)(j) | | | | | | | | |
| | | 113,763,146 | | | | 8,185,338 | |
2019-C52, 1.591%, 08/15/2052 (f)(j) | | | | | | | | |
| | | 59,008,815 | | | | 5,315,550 | |
2019-C53, 0.452%, 10/15/2052 (f)(j) | | | | | | | | |
| | | 105,325,000 | | | | 3,682,762 | |
| 2019-C53, 3.514%, 10/15/2052 (f) | | | 5,200,000 | | | | 5,194,482 | |
2020-C55, 0.816%, 02/15/2053 (f)(j) | | | | | | | | |
| | | 58,030,370 | | | | 3,378,696 | |
2020-C56, 0.314%, 06/15/2053 (f)(j) | | | | | | | | |
| | | 127,035,000 | | | | 2,968,236 | |
| 2020-C56, 2.422%, 06/15/2053 | | | 2,250,000 | | | | 2,242,922 | |
2020-C58, 1.128%, 07/15/2053 (f)(j) | | | | | | | | |
| | | 109,974,000 | | | | 9,532,106 | |
2020-C57, 0.733%, 08/15/2053 (f)(j) | | | | | | | | |
| | | 74,972,000 | | | | 4,156,448 | |
| 2020-C57, 1.914%, 08/15/2053 | | | 7,250,000 | | | | 6,950,106 | |
| 2021-C59, 0.908%, 04/15/2054 (j) | | | 65,782,000 | | | | 4,832,931 | |
2017-NPL5, 1.451%, 04/15/2054 (j) | | | | | | | | |
| | | 40,274,000 | | | | 4,563,709 | |
| 2021-C59, 3.284%, 04/15/2054 | | | 7,648,000 | | | | 7,335,825 | |
| 2021-C60, 1.101%, 08/15/2054 | | | 40,551,000 | | | | 3,784,455 | |
| 2021-C60, 1.556%, 08/15/2054 | | | 41,488,438 | | | | 4,628,931 | |
| 2021-C60, 2.130%, 08/15/2054 | | | 5,658,000 | | | | 5,490,396 | |
| 2021-C60, 2.730%, 08/15/2054 | | | 6,814,678 | | | | 6,456,689 | |
| 2021-C60, 2.738%, 08/15/2054 | | | 3,000,000 | | | | 2,749,457 | |
| 2021-C61, 1.391%, 11/15/2054 | | | 9,132,000 | | | | 1,029,734 | |
| 2021-C61, 2.525%, 11/15/2054 | | | 15,000,000 | | | | 14,854,893 | |
| 2021-C61, 3.113%, 11/15/2054 | | | 4,221,000 | | | | 4,103,523 | |
| 2015-C30, 4.067%, 09/15/2058 (f) | | | 10,000,000 | | | | 10,341,840 | |
| 2015-C30, 4.400%, 09/15/2058 (f) | | | 5,800,000 | | | | 5,947,042 | |
Percentages are stated as a percent of net assets.
The accompanying notes are an integral part of these financial statements.
PERFORMANCE TRUST STRATEGIC BOND FUND — SCHEDULE OF INVESTMENTS (CONT.)
February 28, 2022 (Unaudited)
| | | PRINCIPAL | | | | |
| | | AMOUNT | | | VALUE | |
| | | | | | | |
| Wells Fargo Commercial | | | | | | |
| Mortgage Trust (Cont.) | | | | | | |
2018-C47, 0.156%, 09/15/2061 (f)(j) | | | | | | |
| | $ | 164,144,000 | | | $ | 1,939,624 | |
2018-C47, 4.673%, 09/15/2061 (f) | | | | | | | | |
| | | 8,000,000 | | | | 8,667,041 | |
| | | | | | | | | |
| WFRBS Commercial | | | | | | | | |
| Mortgage Trust | | | | | | | | |
2013-UBS1, 5.039%, 03/15/2046 (f) | | | | | | | | |
| | | 7,500,000 | | | | 7,723,610 | |
| TOTAL NON-AGENCY | | | | | | | | |
| COMMERCIAL MORTGAGE | | | | | | | | |
| BACKED SECURITIES | | | | | | | | |
| (Cost $1,312,770,491) | | | | | | | 1,223,794,765 | |
| | | | | | | | | |
| AGENCY COMMERCIAL MORTGAGE | | | | | | | | |
| BACKED SECURITIES – 7.43% | | | | | | | | |
| | | | | | | | | |
| FHMR | | | | | | | | |
2021-RR17, 2.038%, 08/27/2027 (f)(j) | | | | | | | | |
| | | 70,015,000 | | | | 6,246,199 | |
2020-RR09, 2.676%, 08/27/2029 (f)(j) | | | | | | | | |
| | | 42,360,000 | | | | 6,154,226 | |
| | | | | | | | | |
| Freddie Mac Multifamily | | | | | | | | |
| ML Certificates | | | | | | | | |
2020-ML07, 2.021%, 10/25/2036 (a)(f)(j) | | | | | | | | |
| | | 25,252,973 | | | | 4,609,425 | |
2019-ML06, 1.132%, 06/25/2037 (f)(j) | | | | | | | | |
| | | 10,884,195 | | | | 1,080,910 | |
2021-ML08, 1.846%, 07/25/2037 (f)(j) | | | | | | | | |
| | | 33,460,379 | | | | 5,667,519 | |
2021-ML10, 2.056%, 01/25/2038 (f)(j) | | | | | | | | |
| | | 14,414,586 | | | | 2,862,737 | |
2021-ML11, 0.667%, 03/25/2038 (f)(j) | | | | | | | | |
| | | 34,705,308 | | | | 2,277,015 | |
2021-ML10, 1.518%, 06/25/2038 (f)(j) | | | | | | | | |
| | | 15,322,106 | | | | 2,240,245 | |
2021-ML09, 1.489%, 02/25/2040 (f)(j) | | | | | | | | |
| | | 44,391,844 | | | | 6,672,538 | |
2021-ML12, 1.220%, 07/25/2041 (f)(j) | | | | | | | | |
| | | 18,251,056 | | | | 2,291,055 | |
| | | | | | | | | |
| Freddie Mac Multifamily Structured | | | | | | | | |
| Pass Through Certificates | | | | | | | | |
| K021, 1.375%, 06/25/2022 (f)(j) | | | 58,456,387 | | | | 6,722 | |
| K723, 0.912%, 08/25/2023 (f)(j) | | | 63,643,092 | | | | 703,161 | |
| K723, 0.839%, 09/25/2023 (f)(j) | | | 61,645,000 | | | | 755,971 | |
| K728, 0.385%, 08/25/2024 (f)(j) | | | 57,838,577 | | | | 497,418 | |
| K729, 0.343%, 10/25/2024 (f)(j) | | | 47,953,299 | | | | 364,786 | |
| K042, 1.029%, 12/25/2024 (f)(j) | | | 114,585,264 | | | | 2,868,333 | |
| K046, 0.351%, 03/25/2025 (f)(j) | | | 447,021,869 | | | | 4,508,171 | |
| K049, 0.584%, 07/25/2025 (f)(j) | | | 90,922,804 | | | | 1,550,743 | |
| K734, 0.647%, 02/25/2026 (f)(j) | | | 64,674,589 | | | | 1,419,083 | |
| K735, 0.957%, 05/25/2026 (f)(j) | | | 59,206,683 | | | | 2,078,125 | |
| K735, 1.364%, 05/25/2026 (f)(j) | | | 70,547,000 | | | | 3,766,137 | |
| K737, 1.004%, 10/25/2026 (f)(j) | | | 20,050,000 | | | | 871,387 | |
| K061, 0.049%, 11/25/2026 (f)(j) | | | 72,512,000 | | | | 337,957 | |
| K062, 0.175%, 12/25/2026 (f)(j) | | | 79,423,000 | | | | 790,410 | |
| K063, 0.286%, 01/25/2027 (f)(j) | | | 374,905,250 | | | | 4,673,944 | |
| K064, 0.605%, 03/25/2027 (f)(j) | | | 125,815,836 | | | | 3,407,596 | |
| K738, 1.368%, 03/25/2027 (f)(j) | | | 24,099,000 | | | | 1,517,119 | |
| K065, 0.548%, 05/25/2027 (f)(j) | | | 57,193,000 | | | | 1,598,630 | |
| K066, 0.750%, 06/25/2027 (f)(j) | | | 31,566,060 | | | | 1,089,458 | |
| KW03, 0.835%, 06/25/2027 (f)(j) | | | 15,654,009 | | | | 505,518 | |
| K067, 0.577%, 07/25/2027 (f)(j) | | | 40,472,603 | | | | 1,126,850 | |
| K068, 0.429%, 08/25/2027 (f)(j) | | | 103,444,014 | | | | 2,222,681 | |
| K069, 0.362%, 09/25/2027 (f)(j) | | | 28,987,673 | | | | 534,101 | |
| K739, 1.611%, 09/25/2027 (f)(j) | | | 32,621,072 | | | | 2,549,591 | |
| K070, 0.326%, 11/25/2027 (f)(j) | | | 276,954,820 | | | | 4,846,848 | |
| K072, 0.368%, 12/25/2027 (f)(j) | | | 60,770,965 | | | | 1,182,567 | |
| K073, 0.202%, 01/25/2028 (f)(j) | | | 54,203,000 | | | | 733,605 | |
| K073, 0.302%, 01/25/2028 (f)(j) | | | 155,930,221 | | | | 2,752,745 | |
| K742, 0.926%, 04/25/2028 (f)(j) | | | 89,849,000 | | | | 4,774,019 | |
| K743, 1.290%, 05/25/2028 (f)(j) | | | 99,488,000 | | | | 7,392,187 | |
| KW06, 0.100%, 06/25/2028 (f)(j) | | | 584,302,010 | | | | 4,984,739 | |
| K080, 0.120%, 07/25/2028 (f)(j) | | | 429,078,549 | | | | 4,072,084 | |
| K081, 0.073%, 08/25/2028 (f)(j) | | | 154,434,284 | | | | 1,043,667 | |
| K084, 0.204%, 10/25/2028 (f)(j) | | | 338,111,315 | | | | 4,683,315 | |
| K747, 0.398%, 12/25/2028 (f)(j) | | | 160,000,000 | | | | 4,117,661 | |
| K748, 0.000%, 01/25/2029 (f)(j) | | | 175,000,000 | | | | 6,166,650 | |
| K089, 0.454%, 01/25/2029 (f)(j) | | | 53,965,000 | | | | 1,696,007 | |
| K088, 0.509%, 01/25/2029 (f)(j) | | | 149,604,720 | | | | 4,929,221 | |
| K090, 0.705%, 02/25/2029 (f)(j) | | | 77,821,800 | | | | 3,533,623 | |
| K091, 0.487%, 03/25/2029 (f)(j) | | | 53,659,000 | | | | 1,815,305 | |
| K090, 0.621%, 03/25/2029 (f)(j) | | | 50,517,000 | | | | 2,132,701 | |
| KW09, 0.802%, 05/25/2029 (f)(j) | | | 63,288,843 | | | | 3,013,751 | |
| K093, 0.952%, 05/25/2029 (f)(j) | | | 54,516,185 | | | | 3,252,610 | |
| K094, 0.880%, 06/25/2029 (f)(j) | | | 194,776,325 | | | | 11,032,852 | |
| K097, 1.090%, 07/25/2029 (f)(j) | | | 72,857,314 | | | | 5,151,005 | |
| KG02, 1.023%, 08/25/2029 (f)(j) | | | 33,000,000 | | | | 2,087,649 | |
| K098, 1.144%, 08/25/2029 (f)(j) | | | 62,017,393 | | | | 4,600,407 | |
| K098, 1.391%, 08/25/2029 (f)(j) | | | 14,661,000 | | | | 1,387,454 | |
| K099, 0.885%, 09/25/2029 (f)(j) | | | 210,843,035 | | | | 12,283,399 | |
| K100, 0.913%, 09/25/2029 (f)(j) | | | 62,086,000 | | | | 3,950,209 | |
| K102, 0.825%, 10/25/2029 (f)(j) | | | 165,682,419 | | | | 9,182,617 | |
| K101, 1.093%, 10/25/2029 (f)(j) | | | 65,686,000 | | | | 4,989,154 | |
| K103, 0.638%, 11/25/2029 (f)(j) | | | 125,298,300 | | | | 5,509,955 | |
| K107, 1.549%, 02/25/2030 (f)(j) | | | 118,898,000 | | | | 13,161,188 | |
| K108, 1.660%, 03/25/2030 (f)(j) | | | 70,601,000 | | | | 8,498,355 | |
| K108, 1.690%, 03/25/2030 (f)(j) | | | 16,047,582 | | | | 1,880,934 | |
| K110, 1.697%, 04/25/2030 (f)(j) | | | 29,931,278 | | | | 3,420,412 | |
| K112, 1.432%, 05/25/2030 (f)(j) | | | 96,495,025 | | | | 9,736,724 | |
| K111, 1.572%, 05/25/2030 (f)(j) | | | 108,974,737 | | | | 11,938,444 | |
Percentages are stated as a percent of net assets.
The accompanying notes are an integral part of these financial statements.
PERFORMANCE TRUST STRATEGIC BOND FUND — SCHEDULE OF INVESTMENTS (CONT.)
February 28, 2022 (Unaudited)
| | | PRINCIPAL | | | | |
| | | AMOUNT | | | VALUE | |
| | | | | | | |
| Freddie Mac Multifamily Structured | | | | | | |
| Pass Through Certificates (Cont.) | | | | | | |
| K112, 1.663%, 05/25/2030 (f)(j) | | $ | 44,272,000 | | | $ | 5,401,627 | |
| K114, 1.118%, 06/25/2030 (f)(j) | | | 58,852,146 | | | | 4,708,966 | |
| K115, 1.327%, 06/25/2030 (f)(j) | | | 54,142,100 | | | | 5,091,761 | |
| K114, 1.342%, 06/25/2030 (f)(j) | | | 42,500,000 | | | | 4,246,579 | |
| KG03, 1.381%, 06/25/2030 (f)(j) | | | 15,600,000 | | | | 1,487,316 | |
| K113, 1.387%, 06/25/2030 (f)(j) | | | 91,756,392 | | | | 8,944,753 | |
| K115, 1.547%, 07/25/2030 (f)(j) | | | 22,290,414 | | | | 2,566,117 | |
| K118, 0.960%, 09/25/2030 (f)(j) | | | 120,824,684 | | | | 8,422,761 | |
| K118, 1.170%, 09/25/2030 (f)(j) | | | 35,916,184 | | | | 3,213,830 | |
| K116, 1.600%, 09/25/2030 (f)(j) | | | 23,000,000 | | | | 2,771,219 | |
| K121, 1.028%, 10/25/2030 (f)(j) | | | 48,953,558 | | | | 3,597,152 | |
| K119, 1.134%, 10/25/2030 (f)(j) | | | 51,000,000 | | | | 4,430,982 | |
| KG04, 0.853%, 11/25/2030 (f)(j) | | | 111,132,729 | | | | 6,908,110 | |
| K122, 0.883%, 11/25/2030 (f)(j) | | | 111,997,059 | | | | 7,269,863 | |
| K122, 1.081%, 11/25/2030 (f)(j) | | | 35,211,000 | | | | 2,978,851 | |
| K121, 1.195%, 11/25/2030 (f)(j) | | | 49,550,000 | | | | 4,598,181 | |
| K123, 0.977%, 12/25/2030 (f)(j) | | | 50,000,000 | | | | 3,856,965 | |
| K125, 0.585%, 01/25/2031 (f)(j) | | | 179,613,167 | | | | 8,011,609 | |
| K125, 0.782%, 01/25/2031 (f)(j) | | | 52,600,000 | | | | 3,321,706 | |
| K124, 0.936%, 01/25/2031 (f)(j) | | | 54,248,000 | | | | 4,039,556 | |
| K152, 0.956%, 01/25/2031 (f)(j) | | | 30,070,494 | | | | 1,995,517 | |
| K127, 0.503%, 02/25/2031 (f)(j) | | | 186,332,000 | | | | 7,693,928 | |
| K128, 0.529%, 03/25/2031 (f)(j) | | | 154,863,061 | | | | 6,321,913 | |
| K128, 0.740%, 03/25/2031 (f)(j) | | | 37,700,000 | | | | 2,292,220 | |
| K129, 1.050%, 05/25/2031 (f)(j) | | | 71,534,757 | | | | 5,650,015 | |
| K129, 1.225%, 05/25/2031 (f)(j) | | | 31,700,000 | | | | 3,158,154 | |
| K130, 1.037%, 06/25/2031 (f)(j) | | | 122,804,002 | | | | 10,130,053 | |
| K131, 0.729%, 07/25/2031 (f)(j) | | | 135,712,994 | | | | 8,120,781 | |
| K130, 1.214%, 07/25/2031 (f)(j) | | | 43,372,188 | | | | 4,410,266 | |
| K138, 0.691%, 01/25/2032 (f)(j) | | | 195,000,000 | | | | 12,009,211 | |
| K155, 0.113%, 04/25/2033 (f)(j) | | | 245,667,384 | | | | 3,610,205 | |
| K1511, 0.777%, 03/25/2034 (f)(j) | | | 132,176,852 | | | | 9,424,593 | |
| K1512, 0.910%, 04/25/2034 (f)(j) | | | 47,561,510 | | | | 3,901,314 | |
| K1513, 0.860%, 08/25/2034 (f)(j) | | | 76,011,643 | | | | 6,085,234 | |
| K1514, 0.579%, 10/25/2034 (f)(j) | | | 81,397,997 | | | | 4,780,244 | |
| K1515, 1.512%, 02/25/2035 (f)(j) | | | 78,782,909 | | | | 11,485,233 | |
| K1516, 1.512%, 05/25/2035 (f)(j) | | | 41,831,705 | | | | 6,615,835 | |
| K1517, 1.331%, 07/25/2035 (f)(j) | | | 81,886,215 | | | | 11,399,126 | |
| K1521, 0.981%, 08/25/2036 (f)(j) | | | 113,361,959 | | | | 11,954,053 | |
| K097, 1.349%, 09/25/2051 (f)(j) | | | 66,115,000 | | | | 6,006,039 | |
| K105, 1.767%, 03/25/2053 (f)(j) | | | 64,122,000 | | | | 8,029,382 | |
| | | | | | | | | |
| FREMF Mortgage Trust | | | | | | | | |
2018-K82, 4.131%, 09/25/2028 (a)(f) | | | | | | | | |
| | | 3,065,000 | | | | 3,254,432 | |
| TOTAL AGENCY COMMERCIAL | | | | | | | | |
| MORTGAGE BACKED SECURITIES | | | | | | | | |
| (Cost $492,900,036) | | | | | | | 499,975,476 | |
| | | | | | | | | |
| MUNICIPAL BONDS – 28.08% | | | | | | | | |
| | | | | | | | | |
| Alabama – 0.43% | | | | | | | | |
| | | | | | | | | |
| Alabama Federal Aid Highway | | | | | | | | |
| Finance Authority | | | | | | | | |
| 1.727%, 09/01/2028 | | | 29,500,000 | | | | 28,756,815 | |
| | | | | | | | | |
| Alaska – 0.31% | | | | | | | | |
| | | | | | | | | |
| Alaska Municipal Bond | | | | | | | | |
| Bank Authority | | | | | | | | |
| 2.022%, 12/01/2030 | | | 5,020,000 | | | | 4,814,583 | |
| 2.122%, 12/01/2031 | | | 3,500,000 | | | | 3,347,004 | |
| | | | | | | | | |
| Municipality of Anchorage, AK | | | | | | | | |
| 1.896%, 09/01/2028 | | | 1,685,000 | | | | 1,661,931 | |
| 1.896%, 09/01/2028 | | | 1,525,000 | | | | 1,504,202 | |
| 5.000%, 12/01/2050 | | | 8,000,000 | | | | 9,188,262 | |
| | | | | | | | 20,515,982 | |
| Arizona – 0.29% | | | | | | | | |
| | | | | | | | | |
| City of Tucson, AZ | | | | | | | | |
| 2.232%, 07/01/2034 | | | 11,605,000 | | | | 11,152,672 | |
| | | | | | | | | |
| Glendale Municipal Property Corp. | | | | | | | | |
| 6.157%, 07/01/2033 | | | 3,000,000 | | | | 3,754,538 | |
| | | | | | | | | |
| Industrial Development Authority | | | | | | | | |
| of the City of Phoenix | | | | | | | | |
| 5.000%, 07/01/2045 (a) | | | 4,285,000 | | | | 4,602,412 | |
| | | | | | | | 19,509,622 | |
| California – 6.13% | | | | | | | | |
| | | | | | | | | |
| Alvord Unified School District | | | | | | | | |
| 0.000%, 08/01/2046 (d) | | | 1,975,000 | | | | 2,509,772 | |
| | | | | | | | | |
| California Pollution Control | | | | | | | | |
| Financing Authority | | | | | | | | |
| 4.000%, 11/01/2023 (a)(e) | | | 7,000,000 | | | | 6,886,760 | |
| | | | | | | | | |
| Chaffey Joint Union | | | | | | | | |
| High School District | | | | | | | | |
| 3.143%, 08/01/2043 | | | 2,620,000 | | | | 2,626,063 | |
| | | | | | | | | |
| City of Chula Vista, CA | | | | | | | | |
| 1.728%, 06/01/2030 | | | 2,235,000 | | | | 2,081,959 | |
| 1.828%, 06/01/2031 | | | 2,000,000 | | | | 1,849,635 | |
| | | | | | | | | |
| City of Corona, CA | | | | | | | | |
| 1.863%, 05/01/2028 | | | 4,515,000 | | | | 4,392,189 | |
| | | | | | | | | |
| City of Huntington Beach, CA | | | | | | | | |
| 2.453%, 06/15/2031 | | | 4,000,000 | | | | 3,895,385 | |
| | | | | | | | | |
| City of Industry, CA | | | | | | | | |
| 4.000%, 01/01/2028 | | | 2,885,000 | | | | 3,098,538 | |
| | | | | | | | | |
| City of Los Angeles | | | | | | | | |
| Department of Airports | | | | | | | | |
| 1.876%, 05/15/2030 | | | 2,000,000 | | | | 1,885,400 | |
| 5.000%, 05/15/2046 | | | 6,000,000 | | | | 7,244,198 | |
| 5.000%, 05/15/2045 | | | 15,000,000 | | | | 18,277,032 | |
| 6.582%, 05/15/2039 | | | 5,300,000 | | | | 6,887,263 | |
Percentages are stated as a percent of net assets.
The accompanying notes are an integral part of these financial statements.
PERFORMANCE TRUST STRATEGIC BOND FUND — SCHEDULE OF INVESTMENTS (CONT.)
February 28, 2022 (Unaudited)
| | | PRINCIPAL | | | | |
| | | AMOUNT | | | VALUE | |
| | | | | | | |
| California – 6.13% (Cont.) | | | | | | |
| | | | | | | |
| City of Los Angeles, CA | | | | | | |
| 3.550%, 09/01/2031 | | $ | 3,000,000 | | | $ | 3,242,160 | |
| | | | | | | | | |
| City of Ontario | | | | | | | | |
| 3.779%, 06/01/2038 | | | 3,000,000 | | | | 3,223,232 | |
| | | | | | | | | |
| City of Orange, CA | | | | | | | | |
| 2.220%, 06/01/2030 | | | 7,500,000 | | | | 7,433,911 | |
| 2.270%, 06/01/2031 | | | 12,370,000 | | | | 12,222,626 | |
| | | | | | | | | |
| City of Sacramento, CA Transient | | | | | | | | |
| Occupancy Tax Revenue | | | | | | | | |
| 3.858%, 06/01/2025 | | | 3,320,000 | | | | 3,357,785 | |
| | | | | | | | | |
| City of San Francisco, CA | | | | | | | | |
| Public Utilities Commission | | | | | | | | |
| Water Revenue | | | | | | | | |
| 2.845%, 11/01/2041 | | | 2,000,000 | | | | 1,901,195 | |
| | | | | | | | | |
| City of Santa Ana, CA | | | | | | | | |
| 1.665%, 08/01/2028 | | | 5,500,000 | | | | 5,257,557 | |
| 1.869%, 08/01/2029 | | | 3,180,000 | | | | 3,038,279 | |
| 2.089%, 08/01/2030 | | | 1,800,000 | | | | 1,723,258 | |
| | | | | | | | | |
| City of South Lake Tahoe, CA | | | | | | | | |
| 4.000%, 06/01/2027 | | | 1,600,000 | | | | 1,718,999 | |
| | | | | | | | | |
| City of Union City, CA | | | | | | | | |
| 0.000%, 07/01/2025 (d) | | | 2,105,000 | | | | 1,920,782 | |
| | | | | | | | | |
| City of Whittier, CA | | | | | | | | |
| 1.566%, 06/01/2028 | | | 1,085,000 | | | | 1,033,194 | |
| 1.724%, 06/01/2029 | | | 1,685,000 | | | | 1,598,920 | |
| | | | | | | | | |
| Coachella Valley | | | | | | | | |
| Unified School District | | | | | | | | |
| 0.000%, 08/01/2034 (d) | | | 1,100,000 | | | | 799,258 | |
| | | | | | | | | |
| Coast Community | | | | | | | | |
| College District | | | | | | | | |
| 2.957%, 08/01/2038 | | | 15,000,000 | | | | 14,934,462 | |
| | | | | | | | | |
| County of San Diego, CA | | | | | | | | |
| 6.029%, 08/15/2026 | | | 645,000 | | | | 727,742 | |
| | | | | | | | | |
| County of Santa Cruz, CA | | | | | | | | |
| 1.444%, 06/01/2028 | | | 3,385,000 | | | | 3,228,084 | |
| 1.661%, 06/01/2029 | | | 2,965,000 | | | | 2,824,044 | |
| 1.811%, 06/01/2030 | | | 3,900,000 | | | | 3,704,209 | |
| | | | | | | | | |
| East Side Union | | | | | | | | |
| High School District | | | | | | | | |
| 5.320%, 04/01/2036 | | | 7,000,000 | | | | 8,145,385 | |
| | | | | | | | | |
| Fullerton Public | | | | | | | | |
| Financing Authority | | | | | | | | |
| 7.750%, 05/01/2031 | | | 1,380,000 | | | | 1,699,050 | |
| | | | | | | | | |
| Gateway Unified | | | | | | | | |
| School District, CA | | | | | | | | |
| 0.000%, 08/01/2033 (d) | | | 2,315,000 | | | | 1,724,774 | |
| 0.000%, 08/01/2035 (d) | | | 2,315,000 | | | | 1,618,981 | |
| 0.000%, 08/01/2036 (d) | | | 2,315,000 | | | | 1,566,517 | |
| | | | | | | | | |
| Golden State Tobacco | | | | | | | | |
| Securitization Corp. | | | | | | | | |
| 2.332%, 06/01/2027 | | | 17,795,000 | | | | 17,377,300 | |
| 3.000%, 06/01/2046 | | | 10,000,000 | | | | 10,140,288 | |
| | | | | | | | | |
| Hayward Unified School District | | | | | | | | |
| 4.000%, 08/01/2030 | | | 2,400,000 | | | | 2,708,952 | |
| | | | | | | | | |
| Inland Empire Tobacco | | | | | | | | |
| Securitization Corp. | | | | | | | | |
| 3.678%, 06/01/2038 | | | 16,720,000 | | | | 17,259,126 | |
| | | | | | | | | |
| Los Angeles County Metropolitan | | | | | | | | |
| Transportation Authority | | | | | | | | |
| 5.735%, 06/01/2039 | | | 12,775,000 | | | | 16,329,880 | |
| | | | | | | | | |
| Los Angeles Housing Authority | | | | | | | | |
| 5.000%, 06/01/2044 | | | 6,510,000 | | | | 7,376,757 | |
| | | | | | | | | |
| Los Angeles Unified | | | | | | | | |
| School District, CA | | | | | | | | |
| 5.750%, 07/01/2034 | | | 12,605,000 | | | | 15,862,471 | |
| | | | | | | | | |
| Monrovia School Facilities | | | | | | | | |
| Grant Financing Authority | | | | | | | | |
| 7.000%, 06/01/2027 | | | 2,800,000 | | | | 3,464,684 | |
| | | | | | | | | |
| Northern California | | | | | | | | |
| Power Agency | | | | | | | | |
| 5.679%, 06/01/2035 | | | 9,400,000 | | | | 11,251,219 | |
| | | | | | | | | |
| Norwalk-La Mirada | | | | | | | | |
| Unified School District | | | | | | | | |
| 0.000%, 08/01/2038 (d) | | | 4,400,000 | | | | 2,648,804 | |
| | | | | | | | | |
| Palmdale Elementary | | | | | | | | |
| School District | | | | | | | | |
| 0.000%, 08/01/2029 (d) | | | 540,000 | | | | 454,627 | |
| | | | | | | | | |
| Pasadena Unified School District | | | | | | | | |
| 2.881%, 05/01/2037 | | | 6,030,000 | | | | 5,957,448 | |
| | | | | | | | | |
| Peralta Community | | | | | | | | |
| College District | | | | | | | | |
| 0.000%, 08/05/2031 (d) | | | 12,350,000 | | | | 11,503,593 | |
| | | | | | | | | |
| Placentia-Yorba Linda | | | | | | | | |
| Unified School District | | | | | | | | |
| 0.000%, 08/01/2035 (d) | | | 7,600,000 | | | | 5,407,291 | |
| | | | | | | | | |
| Port of Oakland | | | | | | | | |
| 1.667%, 05/01/2027 | | | 4,145,000 | | | | 4,039,189 | |
| 1.949%, 05/01/2028 | | | 2,765,000 | | | | 2,701,806 | |
| 2.049%, 05/01/2029 | | | 3,935,000 | | | | 3,817,451 | |
| | | | | | | | | |
| San Diego Community | | | | | | | | |
| College District | | | | | | | | |
| 1.883%, 08/01/2029 | | | 24,000,000 | | | | 23,430,468 | |
| | | | | | | | | |
| San Diego County Regional | | | | | | | | |
| Airport Authority | | | | | | | | |
| 5.000%, 07/01/2046 | | | 20,250,000 | | | | 24,011,089 | |
| | | | | | | | | |
| San Diego Unified School District | | | | | | | | |
| 0.000%, 07/01/2036 (d) | | | 7,895,000 | | | | 5,478,082 | |
Percentages are stated as a percent of net assets.
The accompanying notes are an integral part of these financial statements.
PERFORMANCE TRUST STRATEGIC BOND FUND — SCHEDULE OF INVESTMENTS (CONT.)
February 28, 2022 (Unaudited)
| | | PRINCIPAL | | | | |
| | | AMOUNT | | | VALUE | |
| | | | | | | |
| San Francisco City & County | | | | | | |
| Redevelopment Agency | | | | | | |
| Successor Agency | | | | | | |
| 2.221%, 08/01/2028 | | $ | 5,000,000 | | | $ | 4,917,528 | |
| | | | | | | | | |
| San Francisco City & County | | | | | | | | |
| Redevelopment Financing Authority | | | | | | | | |
| 0.000%, 08/01/2036 (d) | | | 5,225,000 | | | | 3,312,998 | |
| 5.750%, 08/01/2037 | | | 19,400,000 | | | | 24,394,493 | |
| 8.406%, 08/01/2039 | | | 4,515,000 | | | | 7,025,620 | |
| | | | | | | | | |
| San Joaquin Hills | | | | | | | | |
| Transportation Corridor Agency | | | | | | | | |
| 2.303%, 01/15/2028 | | | 9,980,000 | | | | 9,881,100 | |
| | | | | | | | | |
| Santa Ana Unified School District | | | | | | | | |
| 0.000%, 08/01/2037 (d) | | | 3,955,000 | | | | 2,604,954 | |
| | | | | | | | | |
| State of California | | | | | | | | |
| 1.650%, 10/01/2028 | | | 4,165,000 | | | | 3,986,233 | |
| | | | | | | | | |
| West Contra Costa | | | | | | | | |
| Unified School District | | | | | | | | |
| 0.000%, 08/01/2036 (d) | | | 5,000,000 | | | | 3,388,220 | |
| | | | | | | | | |
| West Sonoma County Union | | | | | | | | |
| High School District | | | | | | | | |
| 0.000%, 08/01/2037 (d) | | | 1,840,000 | | | | 1,253,165 | |
| | | | | | | | | |
| William S. Hart Union | | | | | | | | |
| High School District | | | | | | | | |
| 0.000%, 08/01/2034 (d) | | | 2,380,000 | | | | 1,774,411 | |
| 0.000%, 08/01/2036 (d) | | | 1,000,000 | | | | 700,187 | |
| | | | | | | | | |
| Yosemite Community | | | | | | | | |
| College District | | | | | | | | |
| 0.000%, 08/01/2038 (d) | | | 6,110,000 | | | | 4,081,263 | |
| | | | | | | | | |
| Yuba Community College District | | | | | | | | |
| 0.000%, 08/01/2038 (d) | | | 5,055,000 | | | | 3,284,802 | |
| | | | | | | | 412,104,097 | |
| Colorado – 0.55% | | | | | | | | |
| | | | | | | | | |
| Board of Governors of Colorado | | | | | | | | |
| State University System | | | | | | | | |
| 2.594%, 03/01/2033 | | | 4,560,000 | | | | 4,500,315 | |
| 2.644%, 03/01/2034 | | | 6,275,000 | | | | 6,130,623 | |
| | | | | | | | | |
| City of Fruita, CO | | | | | | | | |
| Healthcare Revenue | | | | | | | | |
| 5.000%, 01/01/2028 | | | 2,650,000 | | | | 2,679,778 | |
| | | | | | | | | |
| Colorado Health | | | | | | | | |
| Facilities Authority | | | | | | | | |
| 3.796%, 11/01/2044 | | | 10,815,000 | | | | 11,633,434 | |
| | | | | | | | | |
| Ebert Metropolitan District | | | | | | | | |
| 5.000%, 12/01/2043 | | | 10,000,000 | | | | 11,834,818 | |
| | | | | | | | 36,778,968 | |
| | | | | | | | | |
| District of Columbia – 0.26% | | | | | | | | |
| | | | | | | | | |
| Metropolitan Washington | | | | | | | | |
| Airports Authority Dulles | | | | | | | | |
| Toll Road Revenue | | | | | | | | |
| 8.000%, 10/01/2047 | | | 10,260,000 | | | | 17,202,990 | |
| | | | | | | | | |
| Florida – 2.10% | | | | | | | | |
| | | | | | | | | |
| City of Fort Lauderdale, FL | | | | | | | | |
| 1.600%, 01/01/2029 | | | 5,000,000 | | | | 4,864,287 | |
| 1.700%, 01/01/2030 | | | 15,085,000 | | | | 14,537,970 | |
| | | | | | | | | |
| City of Gainesville, FL | | | | | | | | |
| 0.000%, 10/01/2027 (d) | | | 4,610,000 | | | | 3,953,679 | |
| 0.000%, 10/01/2028 (d) | | | 1,400,000 | | | | 1,160,778 | |
| | | | | | | | | |
| County of Lee, FL | | | | | | | | |
| Airport Revenue | | | | | | | | |
| 5.000%, 10/01/2046 | | | 4,260,000 | | | | 5,081,742 | |
| | | | | | | | | |
| County of Miami-Dade, FL | | | | | | | | |
| 6.875%, 10/01/2034 | | | 1,550,000 | | | | 2,120,591 | |
| | | | | | | | | |
| County of Miami-Dade, FL | | | | | | | | |
| Aviation Revenue | | | | | | | | |
| 3.275%, 10/01/2029 | | | 5,380,000 | | | | 5,570,384 | |
| 3.712%, 10/01/2027 | | | 4,500,000 | | | | 4,784,523 | |
| | | | | | | | | |
| County of Miami-Dade, FL | | | | | | | | |
| Seaport Department | | | | | | | | |
| 1.862%, 10/01/2029 | | | 11,500,000 | | | | 11,039,071 | |
| 2.012%, 10/01/2031 | | | 6,940,000 | | | | 6,576,920 | |
| | | | | | | | | |
| County of Miami-Dade, FL | | | | | | | | |
| Transit System | | | | | | | | |
| 1.650%, 07/01/2030 | | | 16,095,000 | | | | 15,296,582 | |
| | | | | | | | | |
| Florida Development | | | | | | | | |
| Finance Corp. | | | | | | | | |
| 7.375%, 01/01/2049 (a) | | | 7,000,000 | | | | 7,547,575 | |
| | | | | | | | | |
| Hillsborough County | | | | | | | | |
| Aviation Authority | | | | | | | | |
| 5.000%, 10/01/2047 | | | 9,500,000 | | | | 11,429,618 | |
| | | | | | | | | |
| Reedy Creek Improvement District | | | | | | | | |
| 2.497%, 06/01/2034 | | | 4,500,000 | | | | 4,400,333 | |
| 2.547%, 06/01/2035 | | | 4,500,000 | | | | 4,369,667 | |
| 2.731%, 06/01/2038 | | | 18,500,000 | | | | 17,974,541 | |
| | | | | | | | | |
| State Board of Administration | | | | | | | | |
| Finance Corp. | | | | | | | | |
| 2.154%, 07/01/2030 | | | 9,500,000 | | | | 9,227,602 | |
| | | | | | | | | |
| Tampa-Hillsborough County | | | | | | | | |
| Expressway Authority | | | | | | | | |
| 1.792%, 07/01/2028 | | | 3,900,000 | | | | 3,742,096 | |
| 1.892%, 07/01/2029 | | | 4,750,000 | | | | 4,529,715 | |
| 1.942%, 07/01/2030 | | | 3,345,000 | | | | 3,162,257 | |
| | | | | | | | 141,369,931 | |
Percentages are stated as a percent of net assets.
The accompanying notes are an integral part of these financial statements.
PERFORMANCE TRUST STRATEGIC BOND FUND — SCHEDULE OF INVESTMENTS (CONT.)
February 28, 2022 (Unaudited)
| | | PRINCIPAL | | | | |
| | | AMOUNT | | | VALUE | |
| | | | | | | |
| Georgia – 0.21% | | | | | | |
| | | | | | | |
| Municipal Electric | | | | | | |
| Authority of Georgia | | | | | | |
| 2.497%, 01/01/2031 | | $ | 10,355,000 | | | $ | 10,050,488 | |
| | | | | | | | | |
| Valdosta & Lowndes | | | | | | | | |
| County Hospital Authority | | | | | | | | |
| 2.604%, 10/01/2030 | | | 2,000,000 | | | | 2,039,642 | |
| 3.000%, 10/01/2029 | | | 2,000,000 | | | | 2,107,648 | |
| | | | | | | | 14,197,778 | |
| Hawaii – 0.56% | | | | | | | | |
| | | | | | | | | |
| State of Hawaii Airports | | | | | | | | |
| System Revenue | | | | | | | | |
| 5.000%, 07/01/2043 | | | 11,450,000 | | | | 13,187,234 | |
| 5.000%, 07/01/2047 | | | 20,000,000 | | | | 24,145,974 | |
| | | | | | | | 37,333,208 | |
| Illinois – 0.37% | | | | | | | | |
| | | | | | | | | |
| Chicago O’Hare | | | | | | | | |
| International Airport | | | | | | | | |
| 2.316%, 01/01/2029 | | | 10,000,000 | | | | 9,830,916 | |
| | | | | | | | | |
| County of Cook, IL | | | | | | | | |
| 1.941%, 11/15/2027 | | | 4,485,000 | | | | 4,407,104 | |
| | | | | | | | | |
| Illinois Finance Authority | | | | | | | | |
| 3.510%, 05/15/2041 | | | 7,000,000 | | | | 6,856,674 | |
| | | | | | | | | |
| State of Illinois | | | | | | | | |
| 5.750%, 01/01/2037 | | | 3,000,000 | | | | 3,677,629 | |
| | | | | | | | 24,772,323 | |
| Indiana – 0.19% | | | | | | | | |
| | | | | | | | | |
| GCS School Building Corp. | | | | | | | | |
| 5.000%, 01/15/2040 | | | 2,100,000 | | | | 2,530,809 | |
| | | | | | | | | |
| Indiana Finance Authority | | | | | | | | |
| 4.807%, 07/15/2035 | | | 3,000,000 | | | | 3,642,369 | |
| | | | | | | | | |
| Indianapolis Local Public | | | | | | | | |
| Improvement Bond Bank | | | | | | | | |
| 2.473%, 01/01/2040 | | | 4,500,000 | | | | 4,393,810 | |
| 5.854%, 01/15/2030 | | | 1,810,000 | | | | 2,078,048 | |
| | | | | | | | 12,645,036 | |
| Kansas – 0.06% | | | | | | | | |
| | | | | | | | | |
| State of Kansas Department | | | | | | | | |
| of Transportation | | | | | | | | |
| 4.596%, 09/01/2035 | | | 3,480,000 | | | | 4,126,950 | |
| | | | | | | | | |
| Kentucky – 0.57% | | | | | | | | |
| | | | | | | | | |
| County of Warren, KY | | | | | | | | |
| 3.921%, 12/01/2031 | | | 825,000 | | | | 912,048 | |
| 4.397%, 12/01/2038 | | | 1,540,000 | | | | 1,843,848 | |
| | | | | | | | | |
| Kentucky Higher Education | | | | | | | | |
| Student Loan Corp. | | | | | | | | |
| 3.860%, 06/01/2025 | | | 2,000,000 | | | | 2,092,367 | |
| | | | | | | | | |
| Kentucky State Property & | | | | | | | | |
| Building Commission | | | | | | | | |
| 2.023%, 09/01/2029 | | | 6,310,000 | | | | 6,176,058 | |
| 2.123%, 09/01/2030 | | | 2,755,000 | | | | 2,699,258 | |
| 2.223%, 09/01/2031 | | | 3,350,000 | | | | 3,282,150 | |
| | | | | | | | | |
| Kentucky Turnpike Authority | | | | | | | | |
| 1.668%, 07/01/2028 | | | 4,250,000 | | | | 4,115,309 | |
| 1.768%, 07/01/2029 | | | 12,765,000 | | | | 12,275,217 | |
| 1.968%, 07/01/2031 | | | 5,335,000 | | | | 5,081,119 | |
| | | | | | | | 38,477,374 | |
| Louisiana – 0.84% | | | | | | | | |
| | | | | | | | | |
| City of New Orleans, LA | | | | | | | | |
| 2.220%, 09/01/2029 | | | 6,400,000 | | | | 6,281,081 | |
| | | | | | | | | |
| City of New Orleans, LA | | | | | | | | |
| Sewerage Service Revenue | | | | | | | | |
| 1.791%, 06/01/2030 | | | 1,000,000 | | | | 949,756 | |
| 1.891%, 06/01/2031 | | | 1,575,000 | | | | 1,489,413 | |
| | | | | | | | | |
| City of New Orleans, LA | | | | | | | | |
| Water System Revenue | | | | | | | | |
| 1.691%, 12/01/2029 | | | 1,800,000 | | | | 1,700,919 | |
| 1.841%, 12/01/2030 | | | 3,120,000 | | | | 2,945,946 | |
| 1.941%, 12/01/2031 | | | 1,635,000 | | | | 1,538,236 | |
| | | | | | | | | |
| East Baton Rouge | | | | | | | | |
| Sewerage Commission | | | | | | | | |
| 2.437%, 02/01/2039 | | | 2,500,000 | | | | 2,318,405 | |
| | | | | | | | | |
| Parish of East Baton Rouge | | | | | | | | |
| Capital Improvements District | | | | | | | | |
| 5.000%, 08/01/2048 | | | 10,000,000 | | | | 11,881,618 | |
| | | | | | | | | |
| State of Louisiana | | | | | | | | |
| 1.742%, 06/15/2032 | | | 2,520,000 | | | | 2,313,898 | |
| 1.792%, 06/15/2033 | | | 1,900,000 | | | | 1,722,260 | |
| | | | | | | | | |
| State of Louisiana Gasoline | | | | | | | | |
| & Fuels Tax Revenue | | | | | | | | |
| 2.230%, 05/01/2036 | | | 8,000,000 | | | | 7,395,648 | |
| 2.530%, 05/01/2041 | | | 8,995,000 | | | | 8,270,194 | |
| 2.830%, 05/01/2043 | | | 8,000,000 | | | | 7,494,698 | |
| | | | | | | | 56,302,072 | |
| Maine – 0.21% | | | | | | | | |
| | | | | | | | | |
| Maine Health & Higher | | | | | | | | |
| Educational Facilities Authority | | | | | | | | |
| 3.118%, 07/01/2043 | | | 14,250,000 | | | | 14,035,482 | |
| | | | | | | | | |
| Maryland – 0.27% | | | | | | | | |
| | | | | | | | | |
| Maryland Stadium Authority | | | | | | | | |
| 2.805%, 05/01/2040 | | | 7,000,000 | | | | 6,767,949 | |
| 5.000%, 05/01/2050 | | | 7,000,000 | | | | 9,580,500 | |
| | | | | | | | | |
| State of Maryland | | | | | | | | |
| Department of Transportation | | | | | | | | |
| 1.686%, 08/01/2030 | | | 2,110,000 | | | | 1,993,080 | |
| | | | | | | | 18,341,529 | |
Percentages are stated as a percent of net assets.
The accompanying notes are an integral part of these financial statements.
PERFORMANCE TRUST STRATEGIC BOND FUND — SCHEDULE OF INVESTMENTS (CONT.)
February 28, 2022 (Unaudited)
| | | PRINCIPAL | | | | |
| | | AMOUNT | | | VALUE | |
| | | | | | | |
| Massachusetts – 0.58% | | | | | | |
| | | | | | | |
| City of Quincy, MA | | | | | | |
| 1.789%, 12/15/2027 | | $ | 10,570,000 | | | $ | 10,295,020 | |
| | | | | | | | | |
| City of Worcester, MA | | | | | | | | |
| 6.250%, 01/01/2028 | | | 2,585,000 | | | | 2,960,797 | |
| | | | | | | | | |
| Commonwealth of Massachusetts | | | | | | | | |
| Transportation Fund Revenue | | | | | | | | |
| 5.631%, 06/01/2030 | | | 1,050,000 | | | | 1,258,567 | |
| | | | | | | | | |
| Massachusetts Bay | | | | | | | | |
| Transportation Authority | | | | | | | | |
| Sales Tax Revenue | | | | | | | | |
| 2.235%, 07/01/2031 | | | 8,795,000 | | | | 8,847,385 | |
| | | | | | | | | |
| Massachusetts Educational | | | | | | | | |
| Financing Authority | | | | | | | | |
| 3.455%, 07/01/2028 | | | 2,000,000 | | | | 2,107,905 | |
| 3.831%, 07/01/2024 | | | 450,000 | | | | 468,786 | |
| | | | | | | | | |
| Massachusetts Port Authority | | | | | | | | |
| 5.000%, 07/01/2046 | | | 10,000,000 | | | | 12,012,400 | |
| | | | | | | | | |
| Massachusetts State College | | | | | | | | |
| Building Authority | | | | | | | | |
| 5.932%, 05/01/2040 | | | 550,000 | | | | 737,723 | |
| | | | | | | | 38,688,583 | |
| Michigan – 1.18% | | | | | | | | |
| | | | | | | | | |
| Brandon School District | | | | | | | | |
| 2.469%, 05/01/2030 | | | 2,430,000 | | | | 2,451,718 | |
| | | | | | | | | |
| City of Detroit, MI | | | | | | | | |
| 4.000%, 04/01/2044 | | | 8,700,000 | | | | 7,949,810 | |
| | | | | | | | | |
| Detroit City School District | | | | | | | | |
| 7.747%, 05/01/2039 | | | 9,955,000 | | | | 14,555,970 | |
| | | | | | | | | |
| Great Lakes Water Authority | | | | | | | | |
| Sewage Disposal System Revenue | | | | | | | | |
| 2.365%, 07/01/2032 | | | 3,500,000 | | | | 3,420,832 | |
| 2.615%, 07/01/2036 | | | 1,000,000 | | | | 990,341 | |
| 3.056%, 07/01/2039 | | | 12,365,000 | | | | 12,309,965 | |
| | | | | | | | | |
| Michigan Finance Authority | | | | | | | | |
| 2.610%, 11/01/2025 | | | 2,180,000 | | | | 2,223,734 | |
| 2.710%, 11/01/2026 | | | 7,145,000 | | | | 7,329,650 | |
| 3.084%, 12/01/2034 | | | 5,095,000 | | | | 5,272,667 | |
| 3.267%, 06/01/2039 | | | 19,000,000 | | | | 19,591,249 | |
| 3.610%, 11/01/2032 | | | 3,000,000 | | | | 3,184,957 | |
| | | | | | | | 79,280,893 | |
| Minnesota – 0.27% | | | | | | | | |
| | | | | | | | | |
| Western Minnesota Municipal | | | | | | | | |
| Power Agency | | | | | | | | |
| 3.156%, 01/01/2039 (e) | | | 17,500,000 | | | | 18,243,713 | |
| | | | | | | | | |
| Mississippi – 0.10% | | | | | | | | |
| | | | | | | | | |
| Mississippi Development Bank | | | | | | | | |
| 5.460%, 10/01/2036 | | | 5,505,000 | | | | 6,661,877 | |
| | | | | | | | | |
| Missouri – 0.46% | | | | | | | | |
| | | | | | | | | |
| Kansas City Industrial | | | | | | | | |
| Development Authority | | | | | | | | |
| 5.000%, 03/01/2049 | | | 15,585,000 | | | | 17,864,975 | |
| | | | | | | | | |
| Kansas City Land Clearance | | | | | | | | |
| Redevelopment Authority | | | | | | | | |
| 6.400%, 10/15/2040 (a) | | | 7,985,000 | | | | 8,320,893 | |
| | | | | | | | | |
| St. Louis School District | | | | | | | | |
| 6.450%, 04/01/2028 | | | 3,800,000 | | | | 4,614,175 | |
| | | | | | | | 30,800,043 | |
| Nebraska – 0.04% | | | | | | | | |
| | | | | | | | | |
| District Energy Corp. | | | | | | | | |
| 2.390%, 07/01/2036 | | | 2,830,000 | | | | 2,835,497 | |
| | | | | | | | | |
| Nevada – 0.34% | | | | | | | | |
| | | | | | | | | |
| City of North Las Vegas, NV | | | | | | | | |
| 6.572%, 06/01/2040 | | | 11,960,000 | | | | 16,040,221 | |
| | | | | | | | | |
| Clark County School District | | | | | | | | |
| 5.510%, 06/15/2024 | | | 6,510,000 | | | | 6,790,260 | |
| | | | | | | | 22,830,481 | |
| New Hampshire – 0.07% | | | | | | | | |
| | | | | | | | | |
| New Hampshire Business | | | | | | | | |
| Finance Authority | | | | | | | | |
| 3.278%, 10/01/2037 | | | 4,940,000 | | | | 4,588,025 | |
| | | | | | | | | |
| New Jersey – 1.05% | | | | | | | | |
| | | | | | | | | |
| City of Newark, NJ | | | | | | | | |
| 4.100%, 11/01/2028 | | | 2,830,000 | | | | 3,096,955 | |
| | | | | | | | | |
| Mercer County | | | | | | | | |
| Improvement Authority | | | | | | | | |
| 8.270%, 12/01/2034 | | | 14,455,000 | | | | 20,227,087 | |
| | | | | | | | | |
| New Jersey Economic | | | | | | | | |
| Development Authority | | | | | | | | |
| 0.000%, 02/15/2025 (d) | | | 20,133,000 | | | | 18,912,970 | |
| 7.425%, 02/15/2029 | | | 10,000,000 | | | | 12,232,026 | |
| | | | | | | | | |
| New Jersey Institute | | | | | | | | |
| of Technology | | | | | | | | |
| 3.323%, 07/01/2024 | | | 1,540,000 | | | | 1,575,683 | |
| 3.415%, 07/01/2042 | | | 3,500,000 | | | | 3,550,395 | |
| | | | | | | | | |
| New Jersey Turnpike Authority | | | | | | | | |
| 1.863%, 01/01/2031 | | | 11,500,000 | | | | 10,882,002 | |
| | | | | | | | 70,477,118 | |
| New York – 1.23% | | | | | | | | |
| | | | | | | | | |
| City of New York, NY | | | | | | | | |
| 5.000%, 08/01/2043 | | | 5,000,000 | | | | 5,955,968 | |
| | | | | | | | | |
| Dutchess County Local | | | | | | | | |
| Development Corp. | | | | | | | | |
| 4.550%, 07/01/2022 | | | 1,055,000 | | | | 1,066,280 | |
| | | | | | | | | |
| New York City Industrial | | | | | | | | |
| Development Agency | | | | | | | | |
| 2.436%, 01/01/2036 | | | 5,850,000 | | | | 5,300,087 | |
| | | | | | | | | |
Percentages are stated as a percent of net assets.
The accompanying notes are an integral part of these financial statements.
PERFORMANCE TRUST STRATEGIC BOND FUND — SCHEDULE OF INVESTMENTS (CONT.)
February 28, 2022 (Unaudited)
| | | PRINCIPAL | | | | |
| | | AMOUNT | | | VALUE | |
| | | | | | | |
| New York State | | | | | | |
| Dormitory Authority | | | | | | |
| 1.748%, 03/15/2028 | | $ | 19,835,000 | | | $ | 19,195,817 | |
| 2.152%, 03/15/2031 | | | 20,000,000 | | | | 19,352,806 | |
| 2.746%, 07/01/2030 | | | 6,430,000 | | | | 6,505,649 | |
| 5.096%, 08/01/2034 | | | 3,125,000 | | | | 3,501,446 | |
| | | | | | | | | |
| New York State | | | | | | | | |
| Thruway Authority | | | | | | | | |
| 2.900%, 01/01/2035 | | | 10,420,000 | | | | 10,497,095 | |
| | | | | | | | | |
| New York State Urban | | | | | | | | |
| Development Corp. | | | | | | | | |
| 1.750%, 03/15/2028 | | | 10,000,000 | | | | 9,700,900 | |
| | | | | | | | | |
| Western Nassau County | | | | | | | | |
| Water Authority | | | | | | | | |
| 2.958%, 04/01/2041 | | | 1,500,000 | | | | 1,495,224 | |
| | | | | | | | 82,571,272 | |
| Ohio – 1.25% | | | | | | | | |
| | | | | | | | | |
| American Municipal Power, Inc. | | | | | | | | |
| 7.499%, 02/15/2050 | | | 3,270,000 | | | | 5,152,353 | |
| 7.834%, 02/15/2041 | | | 3,795,000 | | | | 6,023,497 | |
| | | | | | | | | |
| County of Hamilton, OH | | | | | | | | |
| 3.374%, 06/01/2034 | | | 285,000 | | | | 295,540 | |
| 3.756%, 06/01/2042 | | | 8,000,000 | | | | 8,404,635 | |
| | | | | | | | | |
| Franklin County Convention | | | | | | | | |
| Facilities Authority | | | | | | | | |
| 2.022%, 12/01/2030 | | | 5,485,000 | | | | 5,294,101 | |
| 2.472%, 12/01/2034 | | | 22,100,000 | | | | 21,514,175 | |
| | | | | | | | | |
| JobsOhio Beverage System | | | | | | | | |
| 2.833%, 01/01/2038 | | | 7,225,000 | | | | 7,074,767 | |
| 4.532%, 01/01/2035 | | | 20,170,000 | | | | 23,301,191 | |
| | | | | | | | | |
| Ohio Higher Educational | | | | | | | | |
| Facility Commission | | | | | | | | |
| 4.500%, 12/01/2026 | | | 4,025,000 | | | | 4,159,269 | |
| | | | | | | | | |
| South-Western City } | | | | | | | | |
| School District | | | | | | | | |
| 0.000%, 12/01/2028 (d) | | | 2,735,000 | | | | 2,316,841 | |
| | | | | | | | | |
| Sycamore Community | | | | | | | | |
| City School District | | | | | | | | |
| 5.850%, 12/01/2028 | | | 605,000 | | | | 732,420 | |
| | | | | | | | 84,268,789 | |
| Oklahoma – 0.56% | | | | | | | | |
| | | | | | | | | |
| Oklahoma City Economic | | | | | | | | |
| Development Trust | | | | | | | | |
| 1.471%, 03/01/2028 | | | 1,700,000 | | | | 1,625,053 | |
| 1.691%, 03/01/2029 | | | 1,600,000 | | | | 1,532,079 | |
| 1.791%, 03/01/2030 | | | 1,455,000 | | | | 1,389,077 | |
| 1.891%, 03/01/2031 | | | 1,545,000 | | | | 1,474,982 | |
| | | | | | | | | |
| Oklahoma Development | | | | | | | | |
| Finance Authority | | | | | | | | |
| 5.450%, 08/15/2028 | | | 4,120,000 | | | | 4,513,900 | |
| | | | | | | | | |
| Oklahoma Municipal | | | | | | | | |
| Power Authority | | | | | | | | |
| 2.431%, 01/01/2034 | | | 3,870,000 | | | | 3,766,247 | |
| 2.501%, 01/01/2035 | | | 3,475,000 | | | | 3,373,588 | |
| 2.551%, 01/01/2036 | | | 2,390,000 | | | | 2,304,191 | |
| 2.803%, 01/01/2041 | | | 15,500,000 | | | | 14,811,453 | |
| | | | | | | | | |
| Oklahoma Turnpike Authority | | | | | | | | |
| 1.722%, 01/01/2030 | | | 3,260,000 | | | | 3,065,748 | |
| | | | | | | | 37,856,318 | |
| Oregon – 0.05% | | | | | | | | |
| | | | | | | | | |
| Hospital Facilities Authority of | | | | | | | | |
| Multnomah County Oregon | | | | | | | | |
| 1.250%, 06/01/2026 | | | 2,610,000 | | | | 2,541,646 | |
| | | | | | | | | |
| Oregon Health & | | | | | | | | |
| Science University | | | | | | | | |
| 2.850%, 07/01/2030 | | | 1,000,000 | | | | 1,027,079 | |
| | | | | | | | 3,568,725 | |
| Pennsylvania – 0.74% | | | | | | | | |
| | | | | | | | | |
| Berks County Industrial | | | | | | | | |
| Development Authority | | | | | | | | |
| 3.950%, 05/15/2024 | | | 720,000 | | | | 727,579 | |
| 4.450%, 05/15/2027 | | | 800,000 | | | | 823,761 | |
| | | | | | | | | |
| City of Philadelphia, PA | | | | | | | | |
| 1.492%, 07/15/2028 | | | 3,725,000 | | | | 3,547,841 | |
| 1.618%, 07/15/2029 | | | 2,505,000 | | | | 2,378,091 | |
| 1.738%, 07/15/2030 | | | 2,250,000 | | | | 2,134,717 | |
| | | | | | | | | |
| Commonwealth | | | | | | | | |
| Financing Authority | | | | | | | | |
| 2.758%, 06/01/2030 | | | 4,500,000 | | | | 4,579,920 | |
| 2.758%, 06/01/2030 | | | 1,040,000 | | | | 1,058,470 | |
| 3.657%, 06/01/2038 | | | 5,820,000 | | | | 6,233,347 | |
| 3.807%, 06/01/2041 | | | 6,110,000 | | | | 6,647,811 | |
| 4.014%, 06/01/2033 | | | 3,775,000 | | | | 4,234,582 | |
| | | | | | | | | |
| Montgomery County | | | | | | | | |
| Industrial Development Authority | | | | | | | | |
| 3.150%, 11/15/2028 | | | 10,000,000 | | | | 10,010,024 | |
| | | | | | | | | |
| Pennsylvania Economic | | | | | | | | |
| Development Financing Authority | | | | | | | | |
| 2.502%, 06/15/2032 | | | 6,000,000 | | | | 5,864,322 | |
| | | | | | | | | |
| Union County Hospital Authority | | | | | | | | |
| 3.800%, 08/01/2023 | | | 570,000 | | | | 578,418 | |
| 4.400%, 08/01/2028 | | | 1,060,000 | | | | 1,128,934 | |
| | | | | | | | 49,947,817 | |
Percentages are stated as a percent of net assets.
The accompanying notes are an integral part of these financial statements.
PERFORMANCE TRUST STRATEGIC BOND FUND — SCHEDULE OF INVESTMENTS (CONT.)
February 28, 2022 (Unaudited)
| | | PRINCIPAL | | | | |
| | | AMOUNT | | | VALUE | |
| | | | | | | |
| Puerto Rico – 0.42% | | | | | | |
| | | | | | | |
| Children’s Trust Fund | | | | | | |
| 5.375%, 05/15/2033 | | $ | 1,870,000 | | | $ | 1,919,420 | |
| | | | | | | | | |
| Commonwealth of Puerto Rico | | | | | | | | |
| 3.650%, 07/01/2016 (g) | | | 2,400,000 | | | | 2,178,000 | |
| 4.000%, 07/01/2021 (g) | | | 6,395,000 | | | | 5,835,437 | |
| 4.400%, 07/01/2020 (g) | | | 3,240,000 | | | | 2,956,500 | |
| | | | | | | | | |
| GDB Debt Recovery | | | | | | | | |
| Authority of Puerto Rico | | | | | | | | |
| 7.500%, 08/20/2040 | | | 10,710,299 | | | | 10,067,681 | |
| | | | | | | | | |
| Puerto Rico Highway & | | | | | | | | |
| Transportation Authority | | | | | | | | |
| 0.000%, 07/01/2026 (d)(e) | | | 7,000,000 | | | | 5,367,276 | |
| | | | | | | | 28,324,314 | |
| South Carolina – 0.18% | | | | | | | | |
| | | | | | | | | |
| Charleston Educational | | | | | | | | |
| Excellence Finance Corp. | | | | | | | | |
| 1.919%, 12/01/2030 | | | 5,000,000 | | | | 4,816,341 | |
| | | | | | | | | |
| Commission of Public | | | | | | | | |
| Works, City of Greer | | | | | | | | |
| 5.500%, 09/01/2032 | | | 2,000,000 | | | | 2,570,412 | |
| | | | | | | | | |
| South Carolina Jobs-Economic | | | | | | | | |
| Development Authority | | | | | | | | |
| 2.729%, 07/01/2030 | | | 5,015,000 | | | | 5,025,865 | |
| | | | | | | | 12,412,618 | |
| Tennessee – 0.35% | | | | | | | | |
| | | | | | | | | |
| Memphis-Shelby County | | | | | | | | |
| Airport Authority | | | | | | | | |
| 5.000%, 07/01/2045 | | | 8,500,000 | | | | 10,123,008 | |
| | | | | | | | | |
| Tennessee State School | | | | | | | | |
| Bond Authority | | | | | | | | |
| 4.848%, 09/15/2027 | | | 12,000,000 | | | | 13,587,992 | |
| | | | | | | | 23,711,000 | |
| Texas – 4.11% | | | | | | | | |
| | | | | | | | | |
| Board of Regents of the | | | | | | | | |
| University of Texas System | | | | | | | | |
| 5.134%, 08/15/2042 | | | 2,500,000 | | | | 3,190,550 | |
| | | | | | | | | |
| City of Austin, TX Electric | | | | | | | | |
| Utility Revenue | | | | | | | | |
| 5.000%, 11/15/2049 | | | 11,285,000 | | | | 13,634,739 | |
| | | | | | | | | |
| City of Dallas, TX | | | | | | | | |
| 0.000%, 02/15/2031 (d) | | | 10,000,000 | | | | 7,882,384 | |
| 0.000%, 02/15/2032 (d) | | | 15,000,000 | | | | 11,414,423 | |
| | | | | | | | | |
| City of Dallas, TX Waterworks | | | | | | | | |
| & Sewer System Revenue | | | | | | | | |
| 5.000%, 10/01/2045 | | | 21,635,000 | | | | 26,740,996 | |
| | | | | | | | | |
| City of El Paso, TX | | | | | | | | |
| 6.018%, 08/15/2035 | | | 3,000,000 | | | | 3,949,813 | |
| | | | | | | | | |
| City of Houston, TX | | | | | | | | |
| 5.508%, 03/01/2036 | | | 4,900,000 | | | | 6,270,271 | |
| 5.538%, 03/01/2037 | | | 4,100,000 | | | | 5,292,246 | |
| 6.290%, 03/01/2032 | | | 920,000 | | | | 1,137,181 | |
| | | | | | | | | |
| City of Houston, TX | | | | | | | | |
| Airport System Revenue | | | | | | | | |
| 1.816%, 07/01/2027 | | | 3,250,000 | | | | 3,157,192 | |
| 2.085%, 07/01/2028 | | | 10,000,000 | | | | 9,765,741 | |
| 2.385%, 07/01/2031 | | | 15,000,000 | | | | 14,522,929 | |
| 6.880%, 01/01/2028 | | | 1,910,000 | | | | 2,153,795 | |
| | | | | | | | | |
| City of Irving, TX | | | | | | | | |
| 7.375%, 08/15/2044 | | | 3,500,000 | | | | 3,656,016 | |
| | | | | | | | | |
| City of San Antonio, TX | | | | | | | | |
| Electric & Gas Systems Revenue | | | | | | | | |
| 5.718%, 02/01/2041 | | | 5,645,000 | | | | 7,477,333 | |
| 5.985%, 02/01/2039 | | | 13,020,000 | | | | 17,684,813 | |
| | | | | | | | | |
| Colony Economic | | | | | | | | |
| Development Corp. | | | | | | | | |
| 7.250%, 10/01/2042 | | | 5,000,000 | | | | 5,294,539 | |
| | | | | | | | | |
| Dallas Fort Worth | | | | | | | | |
| International Airport | | | | | | | | |
| 2.454%, 11/01/2029 | | | 4,500,000 | | | | 4,455,996 | |
| 2.994%, 11/01/2038 | | | 15,100,000 | | | | 15,453,600 | |
| | | | | | | | | |
| Lower Colorado River Authority | | | | | | | | |
| 5.000%, 05/15/2045 | | | 7,160,000 | | | | 8,460,367 | |
| 5.000%, 05/15/2050 | | | 10,310,000 | | | | 12,086,638 | |
| | | | | | | | | |
| Metropolitan Transit Authority | | | | | | | | |
| of Harris County Sales | | | | | | | | |
| & Use Tax Revenue | | | | | | | | |
| 2.599%, 11/01/2037 | | | 17,015,000 | | | | 16,466,911 | |
| | | | | | | | | |
| New Hope Cultural | | | | | | | | |
| Education Facilities Corp. | | | | | | | | |
| 4.000%, 08/01/2020 (e)(g) | | | 220,000 | | | | 66,000 | |
| | | | | | | | | |
| North Texas Tollway Authority | | | | | | | | |
| 1.727%, 01/01/2028 | | | 3,250,000 | | | | 3,137,953 | |
| 8.410%, 02/01/2030 | | | 5,090,000 | | | | 6,559,631 | |
| | | | | | | | | |
| Port of Beaumont Industrial | | | | | | | | |
| Development Authority | | | | | | | | |
| 4.100%, 01/01/2028 (a) | | | 6,000,000 | | | | 5,682,641 | |
| | | | | | | | | |
| Stafford Municipal | | | | | | | | |
| School District | | | | | | | | |
| 3.084%, 08/15/2041 | | | 1,000,000 | | | | 1,016,555 | |
| | | | | | | | | |
| Tarrant Regional Water District | | | | | | | | |
| 1.550%, 09/01/2030 | | | 6,720,000 | | | | 6,334,251 | |
| | | | | | | | | |
| Texas Public Finance Authority | | | | | | | | |
| 8.250%, 07/01/2024 | | | 23,340,000 | | | | 23,590,277 | |
Percentages are stated as a percent of net assets.
The accompanying notes are an integral part of these financial statements.
PERFORMANCE TRUST STRATEGIC BOND FUND — SCHEDULE OF INVESTMENTS (CONT.)
February 28, 2022 (Unaudited)
| | | PRINCIPAL | | | | |
| | | AMOUNT | | | VALUE | |
| | | | | | | |
| Texas – 4.11% (Cont.) | | | | | | |
| | | | | | | |
| Texas Transportation | | | | | | |
| Commission | | | | | | |
| 2.013%, 10/01/2037 | | $ | 6,295,000 | | | $ | 5,477,649 | |
| 2.063%, 10/01/2038 | | | 6,445,000 | | | | 5,559,607 | |
| | | | | | | | | |
| Texas Water | | | | | | | | |
| Development Board | | | | | | | | |
| 5.000%, 04/15/2049 | | | 15,000,000 | | | | 17,805,165 | |
| | | | | | | | | |
| White Settlement | | | | | | | | |
| Independent School District | | | | | | | | |
| 0.000%, 08/15/2030 (d) | | | 1,420,000 | | | | 1,149,143 | |
| | | | | | | | 276,527,345 | |
| Utah – 0.43% | | | | | | | | |
| | | | | | | | | |
| County of Salt Lake, UT | | | | | | | | |
| Convention Hotel Revenue | | | | | | | | |
| 5.750%, 10/01/2047 (a) | | | 5,000,000 | | | | 5,183,410 | |
| | | | | | | | | |
| Salt Lake City Corp. | | | | | | | | |
| Airport Revenue | | | | | | | | |
| 5.000%, 07/01/2046 | | | 20,000,000 | | | | 23,750,904 | |
| | | | | | | | 28,934,314 | |
| Virginia – 0.46% | | | | | | | | |
| | | | | | | | | |
| County of Botetourt, VA | | | | | | | | |
| 6.000%, 07/01/2044 | | | 4,485,000 | | | | 4,826,427 | |
| | | | | | | | | |
| Hampton Roads Transportation | | | | | | | | |
| Accountability Commission | | | | | | | | |
| 5.000%, 07/01/2045 | | | 17,770,000 | | | | 21,622,909 | |
| | | | | | | | | |
| Virginia Commonwealth | | | | | | | | |
| Transportation Board | | | | | | | | |
| 5.350%, 05/15/2035 | | | 3,755,000 | | | | 4,508,169 | |
| | | | | | | | 30,957,505 | |
| Washington – 0.62% | | | | | | | | |
| | | | | | | | | |
| NJB Properties | | | | | | | | |
| 5.510%, 12/01/2036 | | | 7,665,000 | | | | 9,558,535 | |
| | | | | | | | | |
| Pierce County School | | | | | | | | |
| District No. 10 Tacoma | | | | | | | | |
| 2.357%, 12/01/2039 | | | 14,560,000 | | | | 13,810,269 | |
| | | | | | | | | |
| Port of Seattle, WA | | | | | | | | |
| 5.000%, 08/01/2046 | | | 12,365,000 | | | | 14,736,349 | |
| | | | | | | | | |
| Spokane Public | | | | | | | | |
| Facilities District | | | | | | | | |
| 1.826%, 12/01/2029 | | | 2,000,000 | | | | 1,928,068 | |
| 1.996%, 12/01/2030 | | | 1,950,000 | | | | 1,887,155 | |
| | | | | | | | 41,920,376 | |
| | | | | | | | | |
| West Virginia – 0.07% | | | | | | | | |
| | | | | | | | | |
| Tobacco Settlement | | | | | | | | |
| Finance Authority | | | | | | | | |
| 2.701%, 06/01/2030 | | | 4,770,000 | | | | 4,694,538 | |
| | | | | | | | | |
| Wisconsin – 0.17% | | | | | | | | |
| | | | | | | | | |
| Milwaukee Redevelopment | | | | | | | | |
| Authority | | | | | | | | |
| 0.000%, 04/01/2039 (d) | | | 1,000,000 | | | | 554,927 | |
| | | | | | | | | |
| Public Finance Authority | | | | | | | | |
| 4.153%, 05/15/2031 | | | 3,635,000 | | | | 4,057,468 | |
| 5.000%, 05/15/2032 (a) | | | 1,275,000 | | | | 1,346,041 | |
| 9.000%, 06/01/2029 (a)(e) | | | 5,750,000 | | | | 5,733,644 | |
| | | | | | | | 11,692,080 | |
| TOTAL MUNICIPAL BONDS | | | | | | | | |
| (Cost $1,922,137,875) | | | | | | | 1,888,263,398 | |
| | | | | | | | | |
| GOVERNMENT SECURITIES | | | | | | | | |
| & AGENCY ISSUES – 0.07% | | | | | | | | |
| United States International | | | | | | | | |
| Development Finance Corp. | | | | | | | | |
| 1.320%, 03/15/2035 | | | 5,000,000 | | | | 4,655,926 | |
| TOTAL GOVERNMENT | | | | | | | | |
| SECURITIES & AGENCY ISSUES | | | | | | | | |
| (Cost $5,000,000) | | | | | | | 4,655,926 | |
| | | | | | | | | |
| US GOVERNMENT NOTES/BONDS – 2.58% | | | | | | | | |
| United States Treasury | | | | | | | | |
| Notes/Bonds | | | | | | | | |
| 1.250%, 04/30/2028 | | | 100,000,000 | | | | 96,824,219 | |
| 2.875%, 05/15/2028 | | | 50,000,000 | | | | 53,138,672 | |
| 1.875%, 02/15/2041 | | | 25,000,000 | | | | 23,458,008 | |
| TOTAL US GOVERNMENT | | | | | | | | |
| NOTES/BONDS | | | | | | | | |
| (Cost $178,944,234) | | | | | | | 173,420,899 | |
Percentages are stated as a percent of net assets.
The accompanying notes are an integral part of these financial statements.
PERFORMANCE TRUST STRATEGIC BOND FUND — SCHEDULE OF INVESTMENTS (CONT.)
February 28, 2022 (Unaudited)
| | | PRINCIPAL | | | | |
| | | AMOUNT | | | VALUE | |
| | | | | | | |
| SHORT-TERM INVESTMENTS – 1.29% | | | | | | |
| First American Government | | | | | | |
| Obligations Fund – | | | | | | |
| Class X, 0.026% (l) | | $ | 86,528,728 | | | $ | 86,528,728 | |
| TOTAL SHORT-TERM | | | | | | | | |
| INVESTMENTS | | | | | | | | |
| (Cost $86,528,728) | | | | | | | 86,528,728 | |
| | | | | | | | | |
| Total Investments | | | | | | | | |
| (Cost $6,894,157,417) – 99.11% | | | | | | | 6,663,923,492 | |
| | | | | | | | | |
| Other Assets in Excess | | | | | | | | |
| of Liabilities – 0.89% | | | | | | | 59,722,506 | |
| | | | | | | | | |
| TOTAL NET ASSETS – 100.00% | | | | | | $ | 6,723,645,998 | |
Percentages are stated as a percent of net assets.
| (a) | Securities issued pursuant to Rule 144A under the Securities Act of 1933. |
| (b) | Variable rate security; the rate shown represents the rate at February 28, 2022. |
| (c) | Foreign issued security. |
| (d) | Represents a principal-only security that entitles holders to receive only principal payments on underlying mortgages. |
| (e) | Represents an illiquid security. The total market value of these securities were $51,644,420, representing 0.77% of net assets as of February 28, 2022. |
| (f) | Variable rate security; the rate shown represents the rate at February 28, 2022. The coupon is based on an underlying pool of loans. |
| (g) | Default or other conditions exist at February 28, 2022. |
| (h) | Step-up bond; the rate shown represents the rate at February 28, 2022. |
| (i) | Inverse floating rate security whose interest rate moves in opposite direction of reference interest rates. Reference interest rates are typically based on a negative multiplier slope. |
| (j) | Represents an interest-only security that entitles holders to receive only interest payments on underlying mortgages. |
| (k) | Perpetual maturity. The date referenced is the next call date. |
| (l) | Seven day yield at February 28, 2022. |
| Abbreviations: |
| NV | Naamloze Vennootschap is a Dutch term for publicly traded companies. |
| PLC | Public Limited Company. |
The accompanying notes are an integral part of these financial statements.
PERFORMANCE TRUST MUNICIPAL BOND FUND — SCHEDULE OF INVESTMENTS
February 28, 2022 (Unaudited)
| | | PRINCIPAL | | | | |
| | | AMOUNT | | | VALUE | |
| | | | | | | |
| AGENCY COMMERCIAL MORTGAGE | | | | | | |
| BACKED SECURITIES – 2.28% | | | | | | |
| | | | | | | |
| Freddie Mac Multifamily ML Certificates | | | | | | |
2019-ML05, 0.247%, 11/25/2033 (a)(b) | | | | | | |
| | $ | 47,140,216 | | | $ | 939,505 | |
2020-ML07, 0.000%, 10/25/2036 (a)(b)(c)(d) | | | | | | | | |
| | | 15,507,834 | | | | 2,830,645 | |
2019-ML06, 1.132%, 06/25/2037 (a)(b) | | | | | | | | |
| | | 10,883,218 | | | | 1,080,812 | |
2021-ML08, 1.846%, 07/25/2037 (a)(b) | | | | | | | | |
| | | 18,336,355 | | | | 3,105,812 | |
2021-ML10, 2.055%, 01/25/2038 (a)(b) | | | | | | | | |
| | | 14,414,586 | | | | 2,862,737 | |
2021-ML11, 0.769%, 03/25/2038 (a)(b) | | | | | | | | |
| | | 34,705,309 | | | | 2,277,015 | |
2021-ML10, 1.517%, 06/25/2038 (a)(b) | | | | | | | | |
| | | 15,322,106 | | | | 2,240,245 | |
2021-ML09, 0.000%, 02/25/2040 (a)(b)(d) | | | | | | | | |
| | | 25,421,151 | | | | 3,821,053 | |
2021-ML12, 1.219%, 01/25/2041 (a)(b) | | | | | | | | |
| | | 18,251,056 | | | | 2,291,055 | |
| TOTAL AGENCY COMMERCIAL | | | | | | | | |
| MORTGAGE BACKED SECURITIES | | | | | | | | |
| (Cost $21,157,745) | | | | | | | 21,448,879 | |
| | | | | | | | | |
| NON-AGENCY COMMERCIAL | | | | | | | | |
| MORTGAGE BACKED | | | | | | | | |
| SECURITIES – 1.09% | | | | | | | | |
| | | | | | | | | |
| California Housing Finance Agency | | | | | | | | |
| 2021-2, 0.816%, 03/25/2035 (b) | | | 32,371,583 | | | | 2,065,955 | |
| 2021-1, 0.796%, 11/20/2035 (b) | | | 43,073,659 | | | | 2,754,991 | |
| 2021-3, 0.764%, 08/20/2036 (b) | | | 26,202,898 | | | | 1,812,193 | |
| | | | | | | | | |
| Washington State Housing | | | | | | | | |
| Finance Commission | | | | | | | | |
| 2021-1, 0.725%, 12/20/2035 (b) | | | 63,151,151 | | | | 3,652,031 | |
| TOTAL NON-AGENCY COMMERCIAL | | | | | | | | |
| MORTGAGE BACKED SECURITIES | | | | | | | | |
| (Cost $10,481,077) | | | | | | | 10,285,170 | |
| | | | | | | | | |
| MUNICIPAL BONDS – 94.85% | | | | | | | | |
| | | | | | | | | |
| Alabama – 1.62% | | | | | | | | |
| | | | | | | | | |
| Alabama Highway Finance Corp. | | | | | | | | |
| 5.000%, 08/01/2038 | | | 2,025,000 | | | | 2,508,555 | |
| 5.000%, 08/01/2039 | | | 525,000 | | | | 649,191 | |
| 5.000%, 08/01/2040 | | | 1,060,000 | | | | 1,308,637 | |
| | | | | | | | | |
| Alabama Public School | | | | | | | | |
| and College Authority | | | | | | | | |
| 5.000%, 11/01/2039 | | | 4,000,000 | | | | 4,936,105 | |
| | | | | | | | | |
| Huntsville Public Building Authority | | | | | | | | |
| 5.000%, 02/01/2047 | | | 3,715,000 | | | | 4,588,957 | |
| | | | | | | | | |
| Lower Alabama Gas District | | | | | | | | |
| 5.000%, 09/01/2031 | | | 1,005,000 | | | | 1,215,308 | |
| | | | | | | | 15,206,753 | |
| Alaska – 0.66% | | | | | | | | |
| | | | | | | | | |
| Alaska Housing Finance Corp. | | | | | | | | |
| 5.000%, 12/01/2031 | | | 1,145,000 | | | | 1,355,519 | |
| | | | | | | | | |
| Alaska Industrial Development | | | | | | | | |
| & Export Authority | | | | | | | | |
| 5.250%, 06/01/2045 | | | 2,735,000 | | | | 3,020,759 | |
| | | | | | | | | |
| CIVIC Ventures, AK | | | | | | | | |
| 5.000%, 09/01/2033 | | | 1,750,000 | | | | 1,845,393 | |
| | | | | | | | 6,221,671 | |
| Arizona – 4.16% | | | | | | | | |
| | | | | | | | | |
| Arizona Industrial | | | | | | | | |
| Development Authority | | | | | | | | |
| 1.400%, 07/01/2022 | | | 150,000 | | | | 149,675 | |
| 1.500%, 07/01/2023 | | | 150,000 | | | | 148,881 | |
| 1.800%, 07/01/2024 | | | 175,000 | | | | 172,342 | |
| 3.250%, 07/01/2031 | | | 2,000,000 | | | | 1,972,248 | |
| 4.000%, 02/01/2040 | | | 850,000 | | | | 963,571 | |
| 4.000%, 11/01/2045 | | | 2,000,000 | | | | 2,195,760 | |
| 4.000%, 11/01/2050 | | | 2,500,000 | | | | 2,726,936 | |
| 5.000%, 02/01/2037 | | | 1,500,000 | | | | 1,874,148 | |
| | | | | | | | | |
| City of Phoenix Civic | | | | | | | | |
| Improvement Corp. | | | | | | | | |
| 5.000%, 07/01/2044 | | | 2,500,000 | | | | 2,900,624 | |
| 5.000%, 07/01/2044 | | | 2,335,000 | | | | 2,846,861 | |
| 5.500%, 07/01/2038 | | | 2,000,000 | | | | 2,802,466 | |
| 5.500%, 07/01/2042 | | | 1,545,000 | | | | 2,236,752 | |
| | | | | | | | | |
| Florence Town, Inc. Industrial | | | | | | | | |
| Development Authority | | | | | | | | |
| 5.000%, 07/01/2023 | | | 175,000 | | | | 180,573 | |
| | | | | | | | | |
| Industrial Development | | | | | | | | |
| Authority of the City of Phoenix | | | | | | | | |
| 4.000%, 07/01/2026 (c) | | | 2,925,000 | | | | 3,058,209 | |
| 5.000%, 07/01/2045 (c) | | | 4,000,000 | | | | 4,296,301 | |
| 6.750%, 07/01/2044 (c) | | | 3,000,000 | | | | 3,338,072 | |
| | | | | | | | | |
| Park Central Community | | | | | | | | |
| Facilities District | | | | | | | | |
| 4.375%, 07/01/2024 | | | 1,205,000 | | | | 1,230,020 | |
| | | | | | | | | |
| Salt River Project Agricultural | | | | | | | | |
| Improvement & Power District | | | | | | | | |
| 5.000%, 01/01/2047 | | | 5,000,000 | | | | 6,034,575 | |
| | | | | | | | 39,128,014 | |
| Arkansas – 0.04% | | | | | | | | |
| | | | | | | | | |
| County of Saline, AR | | | | | | | | |
| 3.550%, 06/01/2042 | | | 350,000 | | | | 356,190 | |
Percentages are stated as a percent of net assets.
The accompanying notes are an integral part of these financial statements.
PERFORMANCE TRUST MUNICIPAL BOND FUND — SCHEDULE OF INVESTMENTS (CONT.)
February 28, 2022 (Unaudited)
| | | PRINCIPAL | | | | |
| | | AMOUNT | | | VALUE | |
| | | | | | | |
| California – 12.29% | | | | | | |
| | | | | | | |
| Adventist Health System | | | | | | |
| 2.952%, 03/01/2029 | | $ | 4,175,000 | | | $ | 4,211,397 | |
| | | | | | | | | |
| California County Tobacco | | | | | | | | |
| Securitization Agency | | | | | | | | |
| 1.750%, 06/01/2030 | | | 75,000 | | | | 75,065 | |
| 5.000%, 06/01/2033 | | | 1,950,000 | | | | 2,310,119 | |
| | | | | | | | | |
| California Educational | | | | | | | | |
| Facilities Authority | | | | | | | | |
| 5.000%, 03/15/2039 | | | 1,015,000 | | | | 1,385,800 | |
| 5.000%, 06/01/2046 | | | 3,500,000 | | | | 4,987,031 | |
| | | | | | | | | |
| California Municipal | | | | | | | | |
| Finance Authority | | | | | | | | |
| 4.000%, 12/01/2026 (c) | | | 1,750,000 | | | | 1,769,182 | |
| 5.000%, 12/01/2054 (c) | | | 1,000,000 | | | | 1,124,838 | |
| 5.000%, 12/01/2046 (c) | | | 750,000 | | | | 847,303 | |
| | | | | | | | | |
| California Pollution Control | | | | | | | | |
| Financing Authority | | | | | | | | |
| 4.000%, 11/01/2023 (c)(e) | | | 3,000,000 | | | | 2,951,468 | |
| | | | | | | | | |
| California Public Finance Authority | | | | | | | | |
| 2.125%, 11/15/2027 (c) | | | 3,000,000 | | | | 3,000,846 | |
| 2.875%, 05/15/2027 (c) | | | 1,125,000 | | | | 1,126,044 | |
| | | | | | | | | |
| California State Public Works Board | | | | | | | | |
| 5.000%, 11/01/2046 | | | 1,250,000 | | | | 1,538,355 | |
| | | | | | | | | |
| California Statewide Communities | | | | | | | | |
| Development Authority | | | | | | | | |
| 6.400%, 06/01/2039 | | | 2,415,000 | | | | 3,151,261 | |
| | | | | | | | | |
| City of Los Angeles | | | | | | | | |
| Department of Airports | | | | | | | | |
| 5.000%, 05/15/2046 | | | 3,000,000 | | | | 3,593,664 | |
| 5.000%, 05/15/2046 | | | 3,075,000 | | | | 3,712,651 | |
| 5.000%, 05/15/2045 | | | 5,000,000 | | | | 6,092,344 | |
| | | | | | | | | |
| City of San Diego, CA Tobacco | | | | | | | | |
| Settlement Revenue Funding Corp. | | | | | | | | |
| 4.000%, 06/01/2032 | | | 1,520,000 | | | | 1,611,287 | |
| | | | | | | | | |
| Clovis Unified School District | | | | | | | | |
| 0.000%, 08/01/2028 (d) | | | 2,175,000 | | | | 1,913,460 | |
| | | | | | | | | |
| Coachella Valley Unified | | | | | | | | |
| School District | | | | | | | | |
| 0.000%, 08/01/2034 (d) | | | 1,145,000 | | | | 831,955 | |
| | | | | | | | | |
| El Camino Healthcare District | | | | | | | | |
| 0.000%, 08/01/2028 (d) | | | 1,935,000 | | | | 1,706,650 | |
| | | | | | | | | |
| Encinitas Union School District | | | | | | | | |
| 0.000%, 08/01/2035 (d) | | | 1,070,000 | | | | 1,485,948 | |
| | | | | | | | | |
| Golden State Tobacco | | | | | | | | |
| Securitization Corp. | | | | | | | | |
| 3.000%, 06/01/2046 | | | 3,750,000 | | | | 3,802,608 | |
| | | | | | | | | |
| Inland Empire Tobacco | | | | | | | | |
| Securitization Corp. | | | | | | | | |
| 3.678%, 06/01/2038 | | | 3,415,000 | | | | 3,525,115 | |
| | | | | | | | | |
| Los Angeles County Public | | | | | | | | |
| Works Financing Authority | | | | | | | | |
| 5.000%, 12/01/2042 | | | 2,750,000 | | | | 3,377,661 | |
| | | | | | | | | |
| Los Angeles Department | | | | | | | | |
| of Water & Power | | | | | | | | |
| 5.000%, 07/01/2046 | | | 5,520,000 | | | | 6,743,702 | |
| | | | | | | | | |
| Los Angeles Housing Authority | | | | | | | | |
| 5.000%, 06/01/2044 | | | 2,200,000 | | | | 2,492,913 | |
| | | | | | | | | |
| Low Income Investment Fund | | | | | | | | |
| 3.711%, 07/01/2029 | | | 1,000,000 | | | | 1,055,423 | |
| | | | | | | | | |
| Manteca Redevelopment | | | | | | | | |
| Agency Successor Agency | | | | | | | | |
| 2.393%, 10/01/2030 | | | 500,000 | | | | 482,441 | |
| | | | | | | | | |
| Mesa Water District | | | | | | | | |
| 5.000%, 03/15/2050 | | | 4,875,000 | | | | 5,934,775 | |
| | | | | | | | | |
| Mountain View Shoreline | | | | | | | | |
| Regional Park Community | | | | | | | | |
| 5.000%, 08/01/2043 | | | 3,145,000 | | | | 3,678,952 | |
| | | | | | | | | |
| M-S-R Energy Authority | | | | | | | | |
| 6.500%, 11/01/2039 | | | 2,350,000 | | | | 3,471,640 | |
| 7.000%, 11/01/2034 | | | 1,160,000 | | | | 1,655,927 | |
| | | | | | | | | |
| Palmdale Elementary School District | | | | | | | | |
| 0.000%, 08/01/2028 (d) | | | 500,000 | | | | 434,052 | |
| | | | | | | | | |
| Ravenswood City School District | | | | | | | | |
| 5.000%, 08/01/2038 | | | 1,360,000 | | | | 1,550,472 | |
| | | | | | | | | |
| Rialto Redevelopment Agency | | | | | | | | |
| 5.000%, 09/01/2037 | | | 1,000,000 | | | | 1,184,780 | |
| | | | | | | | | |
| Riverside County Redevelopment | | | | | | | | |
| Successor Agency | | | | | | | | |
| 5.000%, 10/01/2031 | | | 840,000 | | | | 965,949 | |
| | | | | | | | | |
| San Diego County Regional | | | | | | | | |
| Transportation Commission | | | | | | | | |
| 5.000%, 04/01/2048 | | | 2,200,000 | | | | 2,708,177 | |
| | | | | | | | | |
| San Diego Unified School District | | | | | | | | |
| 0.000%, 07/01/2041 (d) | | | 2,005,000 | | | | 2,238,959 | |
| | | | | | | | | |
| San Leandro Unified School District | | | | | | | | |
| 0.000%, 08/01/2039 (d) | | | 2,175,000 | | | | 2,110,043 | |
| | | | | | | | | |
| San Mateo Foster City | | | | | | | | |
| Public Financing Authority | | | | | | | | |
| 5.000%, 08/01/2049 | | | 2,000,000 | | | | 2,431,130 | |
| | | | | | | | | |
| San Mateo Union | | | | | | | | |
| High School District | | | | | | | | |
| 0.000%, 09/01/2041 (d) | | | 1,285,000 | | | | 1,442,669 | |
| | | | | | | | | |
| Santa Barbara Secondary | | | | | | | | |
| High School District | | | | | | | | |
| 0.000%, 08/01/2040 (d) | | | 1,000,000 | | | | 578,764 | |
| | | | | | | | | |
| St. Helena Unified School District | | | | | | | | |
| 0.000%, 06/01/2036 (d) | | | 2,805,000 | | | | 3,497,392 | |
Percentages are stated as a percent of net assets.
The accompanying notes are an integral part of these financial statements.
PERFORMANCE TRUST MUNICIPAL BOND FUND — SCHEDULE OF INVESTMENTS (CONT.)
February 28, 2022 (Unaudited)
| | | PRINCIPAL | | | | |
| | | AMOUNT | | | VALUE | |
| | | | | | | |
| California – 12.29% (Cont.) | | | | | | |
| | | | | | | |
| State of California | | | | | | |
| 5.000%, 09/01/2041 | | $ | 4,000,000 | | | $ | 5,064,068 | |
| | | | | | | | | |
| University of California | | | | | | | | |
| 5.500%, 05/15/2058 | | | 3,720,000 | | | | 4,516,592 | |
| | | | | | | | | |
| West Contra Costa Unified | | | | | | | | |
| School District | | | | | | | | |
| 0.000%, 08/01/2036 (d) | | | 2,020,000 | | | | 1,368,841 | |
| | | | | | | | 115,739,713 | |
| Colorado – 3.21% | | | | | | | | |
| | | | | | | | | |
| City & County of Denver, CO | | | | | | | | |
| Airport System Revenue | | | | | | | | |
| 5.000%, 12/01/2034 | | | 2,500,000 | | | | 3,208,606 | |
| | | | | | | | | |
| City of Fruita, CO | | | | | | | | |
| Healthcare Revenue | | | | | | | | |
| 5.000%, 01/01/2028 | | | 800,000 | | | | 808,990 | |
| | | | | | | | | |
| Colorado Health Facilities Authority | | | | | | | | |
| 5.000%, 08/01/2044 | | | 2,410,000 | | | | 2,798,456 | |
| | | | | | | | | |
| CommonSpirit Health | | | | | | | | |
| 2.950%, 11/01/2022 | | | 1,725,000 | | | | 1,744,332 | |
| | | | | | | | | |
| El Paso County School | | | | | | | | |
| District No. 49 | | | | | | | | |
| 5.000%, 12/15/2031 | | | 1,500,000 | | | | 1,678,653 | |
| | | | | | | | | |
| Public Authority for | | | | | | | | |
| Colorado Energy | | | | | | | | |
| 6.500%, 11/15/2038 | | | 3,845,000 | | | | 5,543,205 | |
| | | | | | | | | |
| Pueblo City Schools | | | | | | | | |
| 5.000%, 12/15/2039 | | | 2,000,000 | | | | 2,459,852 | |
| | | | | | | | | |
| Regional Transportation District | | | | | | | | |
| 4.000%, 07/15/2039 | | | 3,535,000 | | | | 4,201,711 | |
| | | | | | | | | |
| Vauxmont Metropolitan District | | | | | | | | |
| 5.000%, 12/01/2050 | | | 3,450,000 | | | | 4,120,476 | |
| | | | | | | | | |
| Weld County School | | | | | | | | |
| District No. RE-2 | | | | | | | | |
| 5.000%, 12/01/2044 | | | 3,015,000 | | | | 3,686,344 | |
| | | | | | | | 30,250,625 | |
| Connecticut – 1.84% | | | | | | | | |
| | | | | | | | | |
| Connecticut State Health & | | | | | | | | |
| Educational Facilities Authority | | | | | | | | |
| 4.000%, 07/01/2041 | | | 2,250,000 | | | | 2,448,635 | |
| 4.000%, 07/01/2042 | | | 1,500,000 | | | | 1,628,618 | |
| State of Connecticut | | | | | | | | |
| 5.000%, 06/01/2041 | | | 1,625,000 | | | �� | 2,020,361 | |
| 5.000%, 07/15/2030 | | | 6,000,000 | | | | 7,501,047 | |
| | | | | | | | | |
| State of Connecticut | | | | | | | | |
| Special Tax Revenue | | | | | | | | |
| 5.000%, 05/01/2041 | | | 3,000,000 | | | | 3,723,938 | |
| | | | | | | | 17,322,599 | |
| Delaware – 0.44% | | | | | | | | |
| | | | | | | | | |
| University of Delaware | | | | | | | | |
| 5.000%, 11/01/2038 | | | 1,595,000 | | | | 2,132,150 | |
| 5.000%, 11/01/2039 | | | 1,510,000 | | | | 2,028,516 | |
| | | | | | | | 4,160,666 | |
| District of Columbia – 1.62% | | | | | | | | |
| | | | | | | | | |
| District of Columbia | | | | | | | | |
| 5.000%, 03/01/2044 | | | 3,460,000 | | | | 4,185,873 | |
| 5.000%, 06/01/2055 | | | 2,000,000 | | | | 2,228,111 | |
| 5.000%, 10/01/2047 | | | 2,000,000 | | | | 2,501,602 | |
| | | | | | | | | |
| Metropolitan Washington Airports | | | | | | | | |
| Authority Aviation Revenue | | | | | | | | |
| 5.000%, 10/01/2032 | | | 2,360,000 | | | | 2,669,059 | |
| | | | | | | | | |
| Washington Metropolitan | | | | | | | | |
| Area Transit Authority | | | | | | | | |
| 5.000%, 07/15/2046 | | | 3,000,000 | | | | 3,713,059 | |
| | | | | | | | 15,297,704 | |
| Florida – 6.86% | | | | | | | | |
| | | | | | | | | |
| Broward County, FL Water | | | | | | | | |
| & Sewer Utility Revenue | | | | | | | | |
| 5.000%, 10/01/2038 | | | 1,915,000 | | | | 2,339,262 | |
| | | | | | | | | |
| Capital Trust Agency, Inc. | | | | | | | | |
| 5.000%, 08/01/2040 | | | 300,000 | | | | 343,311 | |
| 5.000%, 08/01/2055 | | | 800,000 | | | | 899,084 | |
| | | | | | | | | |
| City of Belle Isle, FL | | | | | | | | |
| 5.500%, 10/01/2022 | | | 120,000 | | | | 122,648 | |
| | | | | | | | | |
| City of Orlando, FL Tourist | | | | | | | | |
| Development Tax Revenue | | | | | | | | |
| 5.000%, 11/01/2038 | | | 1,000,000 | | | | 1,162,742 | |
| | | | | | | | | |
| City of Tampa, FL | | | | | | | | |
| 5.000%, 07/01/2050 | | | 3,500,000 | | | | 4,104,874 | |
| | | | | | | | | |
| County of Lake, FL | | | | | | | | |
| 3.375%, 08/15/2026 | | | 1,400,000 | | | | 1,405,523 | |
| 5.000%, 08/15/2025 | | | 4,810,000 | | | | 4,811,281 | |
| | | | | | | | | |
| County of Miami-Dade, FL | | | | | | | | |
| 5.000%, 07/01/2043 | | | 2,000,000 | | | | 2,447,667 | |
| 5.000%, 07/01/2043 | | | 1,500,000 | | | | 1,695,164 | |
| 5.000%, 07/01/2043 | | | 3,500,000 | | | | 4,246,677 | |
| | | | | | | | | |
| County of Miami-Dade, FL | | | | | | | | |
| Aviation Revenue | | | | | | | | |
| 5.000%, 10/01/2038 | | | 3,250,000 | | | | 3,563,819 | |
| | | | | | | | | |
| County of Miami-Dade, FL | | | | | | | | |
| Seaport Revenue | | | | | | | | |
| 5.750%, 10/01/2028 | | | 545,000 | | | | 585,191 | |
| | | | | | | | | |
| County of Miami-Dade, FL | | | | | | | | |
| Water & Sewer System Revenue | | | | | | | | |
| 5.000%, 10/01/2046 | | | 5,500,000 | | | | 6,743,155 | |
Percentages are stated as a percent of net assets.
The accompanying notes are an integral part of these financial statements.
PERFORMANCE TRUST MUNICIPAL BOND FUND — SCHEDULE OF INVESTMENTS (CONT.)
February 28, 2022 (Unaudited)
| | | PRINCIPAL | | | | |
| | | AMOUNT | | | VALUE | |
| | | | | | | |
| Florida – 6.86% (Cont.) | | | | | | |
| | | | | | | |
| County of Sarasota, FL | | | | | | |
| Utility System Revenue | | | | | | |
| 5.000%, 10/01/2039 | | $ | 2,055,000 | | | $ | 2,484,358 | |
| | | | | | | | | |
| Dade County, FL | | | | | | | | |
| Professional Sports Franchise | | | | | | | | |
| Facilities Tax Revenue | | | | | | | | |
| 5.250%, 10/01/2030 | | | 1,040,000 | | | | 1,309,864 | |
| | | | | | | | | |
| Florida Development Finance Corp. | | | | | | | | |
| 5.000%, 09/15/2040 (c) | | | 2,050,000 | | | | 2,218,525 | |
| 5.500%, 09/15/2025 (c) | | | 1,420,000 | | | | 1,447,796 | |
| 6.500%, 01/01/2049 (c) | | | 2,735,000 | | | | 2,760,634 | |
| 7.375%, 01/01/2049 (c) | | | 3,000,000 | | | | 3,234,675 | |
| | | | | | | | | |
| Greater Orlando Aviation Authority | | | | | | | | |
| 5.000%, 10/01/2046 | | | 1,500,000 | | | | 1,698,038 | |
| | | | | | | | | |
| Hillsborough County | | | | | | | | |
| Aviation Authority | | | | | | | | |
| 5.000%, 10/01/2047 | | | 7,500,000 | | | | 9,023,383 | |
| | | | | | | | | |
| School Board of Miami-Dade County | | | | | | | | |
| 5.000%, 03/15/2039 | | | 2,645,000 | | | | 2,967,370 | |
| | | | | | | | | |
| School District of Broward County | | | | | | | | |
| 5.000%, 07/01/2040 | | | 2,500,000 | | | | 2,946,760 | |
| | | | | | | | | |
| Venetian Community | | | | | | | | |
| Development District | | | | | | | | |
| 5.000%, 05/01/2023 | | | 55,000 | | | | 55,401 | |
| | | | | | | | 64,617,202 | |
| Georgia – 2.00% | | | | | | | | |
| | | | | | | | | |
| Americus & Sumter | | | | | | | | |
| County Hospital Authority | | | | | | | | |
| 5.125%, 05/15/2023 | | | 170,000 | | | | 173,570 | |
| | | | | | | | | |
| Brookhaven Development Authority | | | | | | | | |
| 5.000%, 07/01/2039 | | | 875,000 | | | | 1,057,835 | |
| | | | | | | | | |
| City of Atlanta, GA Water | | | | | | | | |
| & Wastewater Revenue | | | | | | | | |
| 5.500%, 11/01/2027 | | | 1,550,000 | | | | 1,781,806 | |
| | | | | | | | | |
| City of Conyers, GA | | | | | | | | |
| 4.300%, 03/01/2031 (e) | | | 1,185,000 | | | | 1,100,674 | |
| | | | | | | | | |
| Cobb County Kennestone | | | | | | | | |
| Hospital Authority | | | | | | | | |
| 4.000%, 04/01/2041 | | | 225,000 | | | | 249,514 | |
| 5.000%, 04/01/2050 | | | 5,000,000 | | | | 5,892,634 | |
| 5.000%, 04/01/2037 | | | 175,000 | | | | 210,266 | |
| 5.000%, 04/01/2038 | | | 550,000 | | | | 659,663 | |
| | | | | | | | | |
| Georgia Municipal Association, Inc. | | | | | | | | |
| 5.000%, 12/01/2037 | | | 500,000 | | | | 585,858 | |
| | | | | | | | | |
| Macon-Bibb County | | | | | | | | |
| Housing Authority | | | | | | | | |
| 1.400%, 11/01/2024 | | | 1,200,000 | | | | 1,200,265 | |
| 1.625%, 10/01/2024 | | | 3,250,000 | | | | 3,250,979 | |
| | | | | | | | | |
| Main Street Natural Gas, Inc. | | | | | | | | |
| 5.000%, 05/15/2029 | | | 1,250,000 | | | | 1,472,630 | |
| | | | | | | | | |
| Municipal Electric | | | | | | | | |
| Authority of Georgia | | | | | | | | |
| 5.000%, 01/01/2045 | | | 1,000,000 | | | | 1,194,889 | |
| | | | | | | | 18,830,583 | |
| Hawaii – 1.00% | | | | | | | | |
| | | | | | | | | |
| City & County of Honolulu, HI | | | | | | | | |
| 5.000%, 07/01/2035 | | | 900,000 | | | | 1,122,420 | |
| | | | | | | | | |
| State of Hawaii | | | | | | | | |
| 5.000%, 01/01/2038 | | | 1,885,000 | | | | 2,223,862 | |
| | | | | | | | | |
| State of Hawaii Airports | | | | | | | | |
| System Revenue | | | | | | | | |
| 5.000%, 07/01/2047 | | | 5,000,000 | | | | 6,036,494 | |
| | | | | | | | 9,382,776 | |
| Illinois – 4.75% | | | | | | | | |
| | | | | | | | | |
| Boone & Winnebago | | | | | | | | |
| Counties Community Unit | | | | | | | | |
| School District No. 200 | | | | | | | | |
| 0.000%, 01/01/2024 (d) | | | 815,000 | | | | 794,082 | |
| | | | | | | | | |
| Boone Mchenry & Dekalb | | | | | | | | |
| Counties Community Unit | | | | | | | | |
| School District No. 100 | | | | | | | | |
| 0.000%, 12/01/2023 (d) | | | 520,000 | | | | 507,994 | |
| 0.000%, 12/01/2023 (d) | | | 615,000 | | | | 601,531 | |
| 0.000%, 12/01/2024 (d) | | | 365,000 | | | | 350,157 | |
| | | | | | | | | |
| Chicago Board of Education | | | | | | | | |
| 0.000%, 12/01/2022 (d) | | | 840,000 | | | | 833,429 | |
| | | | | | | | | |
| Chicago O’Hare | | | | | | | | |
| International Airport | | | | | | | | |
| 5.000%, 01/01/2037 | | | 2,000,000 | | | | 2,258,431 | |
| 5.000%, 01/01/2042 | | | 510,000 | | | | 572,853 | |
| | | | | | | | | |
| Chicago Transit Authority | | | | | | | | |
| 5.000%, 06/01/2024 | | | 750,000 | | | | 809,562 | |
| | | | | | | | | |
| Cook County School District No. 103 | | | | | | | | |
| 0.000%, 12/01/2022 (d) | | | 850,000 | | | | 842,786 | |
| | | | | | | | | |
| County of Cook, IL | | | | | | | | |
| Sales Tax Revenue | | | | | | | | |
| 4.000%, 11/15/2040 | | | 1,905,000 | | | | 2,134,801 | |
| 4.000%, 11/15/2041 | | | 3,500,000 | | | | 3,913,407 | |
| | | | | | | | | |
| Illinois Finance Authority | | | | | | | | |
| 5.000%, 01/01/2034 | | | 500,000 | | | | 567,572 | |
| 5.000%, 07/01/2037 | | | 4,810,000 | | | | 5,837,673 | |
| | | | | | | | | |
| Illinois State Toll Highway Authority | | | | | | | | |
| 5.000%, 01/01/2046 | | | 5,000,000 | | | | 6,136,609 | |
| | | | | | | | | |
| Macon County School District No. 61 | | | | | | | | |
| 5.000%, 12/01/2040 | | | 1,580,000 | | | | 1,869,867 | |
Percentages are stated as a percent of net assets.
The accompanying notes are an integral part of these financial statements.
PERFORMANCE TRUST MUNICIPAL BOND FUND — SCHEDULE OF INVESTMENTS (CONT.)
February 28, 2022 (Unaudited)
| | | PRINCIPAL | | | | |
| | | AMOUNT | | | VALUE | |
| | | | | | | |
| Illinois – 4.75% (Cont.) | | | | | | |
| | | | | | | |
| Metropolitan Pier & | | | | | | |
| Exposition Authority | | | | | | |
| 0.000%, 06/15/2026 (d) | | $ | 2,455,000 | | | $ | 2,229,926 | |
| | | | | | | | | |
| Metropolitan Water Reclamation | | | | | | | | |
| District of Greater Chicago | | | | | | | | |
| 5.000%, 12/01/2041 | | | 3,500,000 | | | | 3,991,555 | |
| | | | | | | | | |
| Railsplitter Tobacco | | | | | | | | |
| Settlement Authority | | | | | | | | |
| 5.000%, 06/01/2027 | | | 1,375,000 | | | | 1,538,148 | |
| | | | | | | | | |
| Regional Transportation Authority | | | | | | | | |
| 5.750%, 06/01/2034 | | | 3,000,000 | | | | 3,959,358 | |
| | | | | | | | | |
| Sales Tax Securitization Corp. | | | | | | | | |
| 5.000%, 01/01/2027 | | | 1,700,000 | | | | 1,955,934 | |
| | | | | | | | | |
| State of Illinois | | | | | | | | |
| 5.000%, 03/01/2046 | | | 1,000,000 | | | | 1,156,861 | |
| | | | | | | | | |
| State of Illinois Sales Tax Revenue | | | | | | | | |
| 6.000%, 06/15/2026 | | | 1,575,000 | | | | 1,852,800 | |
| | | | | | | | 44,715,336 | |
| Indiana – 4.34% | | | | | | | | |
| | | | | | | | | |
| Avon Community School | | | | | | | | |
| Building Corp. | | | | | | | | |
| 5.000%, 01/15/2041 | | | 3,550,000 | | | | 4,424,079 | |
| | | | | | | | | |
| City of Valparaiso, IN | | | | | | | | |
| 6.750%, 01/01/2034 | | | 500,000 | | | | 541,143 | |
| | | | | | | | | |
| Crown Point Multi-School | | | | | | | | |
| Building Corp. | | | | | | | | |
| 5.000%, 01/15/2040 | | | 7,000,000 | | | | 8,627,197 | |
| | | | | | | | | |
| Hammond Multi-School | | | | | | | | |
| Building Corp. | | | | | | | | |
| 5.000%, 07/15/2034 | | | 2,000,000 | | | | 2,356,303 | |
| | | | | | | | | |
| Indiana Finance Authority | | | | | | | | |
| 5.000%, 10/01/2044 | | | 5,000,000 | | | | 6,047,939 | |
| 5.000%, 09/01/2036 | | | 1,000,000 | | | | 1,133,577 | |
| | | | | | | | | |
| Indiana Health Facility | | | | | | | | |
| Financing Authority | | | | | | | | |
| 5.000%, 11/15/2034 | | | 1,350,000 | | | | 1,508,678 | |
| | | | | | | | | |
| Indiana Municipal Power Agency | | | | | | | | |
| 5.000%, 01/01/2042 | | | 3,850,000 | | | | 4,327,005 | |
| | | | | | | | | |
| Indianapolis Local Public | | | | | | | | |
| Improvement Bond Bank | | | | | | | | |
| 5.000%, 01/01/2038 | | | 1,715,000 | | | | 2,076,808 | |
| 5.000%, 01/01/2039 | | | 2,500,000 | | | | 3,051,956 | |
| 5.250%, 02/01/2039 | | | 2,155,000 | | | | 2,616,097 | |
| | | | | | | | | |
| Northern Indiana Commuter | | | | | | | | |
| Transportation District | | | | | | | | |
| 5.000%, 07/01/2033 | | | 1,130,000 | | | | 1,286,623 | |
| | | | | | | | | |
| Purdue University | | | | | | | | |
| 5.000%, 07/01/2035 | | | 700,000 | | | | 874,836 | |
| 5.000%, 07/01/2036 | | | 1,500,000 | | | | 1,872,824 | |
| 5.000%, 07/01/2037 | | | 100,000 | | | | 124,673 | |
| | | | | | | | 40,869,738 | |
| Iowa – 0.45% | | | | | | | | |
| | | | | | | | | |
| Iowa Tobacco Settlement Authority | | | | | | | | |
| 4.000%, 06/01/2049 | | | 4,000,000 | | | | 4,254,243 | |
| | | | | | | | | |
| Kentucky – 1.26% | | | | | | | | |
| | | | | | | | | |
| County of Trimble, KY | | | | | | | | |
| 1.300%, 09/01/2044 | | | 3,500,000 | | | | 3,427,611 | |
| | | | | | | | | |
| Grant County School | | | | | | | | |
| District Finance Corp. | | | | | | | | |
| 1.400%, 08/01/2022 | | | 85,000 | | | | 85,220 | |
| | | | | | | | | |
| Kentucky Bond Development Corp. | | | | | | | | |
| 5.000%, 09/01/2049 | | | 3,000,000 | | | | 3,607,510 | |
| | | | | | | | | |
| Kentucky Economic Development | | | | | | | | |
| Finance Authority | | | | | | | | |
| 5.000%, 05/15/2026 | | | 1,000,000 | | | | 1,064,654 | |
| | | | | | | | | |
| Kentucky Public Energy Authority | | | | | | | | |
| 4.000%, 02/01/2050 | | | 3,370,000 | | | | 3,718,034 | |
| | | | | | | | 11,903,029 | |
| Louisiana – 1.18% | | | | | | | | |
| | | | | | | | | |
| City of New Orleans, LA | | | | | | | | |
| 5.000%, 12/01/2040 | | | 5,000,000 | | | | 6,111,897 | |
| | | | | | | | | |
| Louisiana Energy & Power Authority | | | | | | | | |
| 5.250%, 06/01/2028 | | | 410,000 | | | | 431,343 | |
| | | | | | | | | |
| Louisiana Local Government | | | | | | | | |
| Environmental Facilities & | | | | | | | | |
| Community Development Authority | | | | | | | | |
| 5.000%, 11/01/2032 | | | 1,200,000 | | | | 1,347,017 | |
| 5.000%, 12/01/2037 | | | 1,685,000 | | | | 2,029,963 | |
| | | | | | | | | |
| Tobacco Settlement Financing Corp. | | | | | | | | |
| 5.000%, 05/15/2022 | | | 400,000 | | | | 403,165 | |
| 5.250%, 05/15/2033 | | | 745,000 | | | | 751,585 | |
| | | | | | | | 11,074,970 | |
| Maine – 0.26% | | | | | | | | |
| | | | | | | | | |
| Maine Governmental | | | | | | | | |
| Facilities Authority | | | | | | | | |
| 5.000%, 10/01/2038 | | | 2,010,000 | | | | 2,425,316 | |
| | | | | | | | | |
| Maryland – 1.58% | | | | | | | | |
| | | | | | | | | |
| City of Baltimore, MD | | | | | | | | |
| 5.000%, 07/01/2050 | | | 2,550,000 | | | | 3,096,806 | |
| | | | | | | | | |
| County of Anne Arundel, MD | | | | | | | | |
| 5.000%, 10/01/2046 | | | 3,000,000 | | | | 3,665,234 | |
Percentages are stated as a percent of net assets.
The accompanying notes are an integral part of these financial statements.
PERFORMANCE TRUST MUNICIPAL BOND FUND — SCHEDULE OF INVESTMENTS (CONT.)
February 28, 2022 (Unaudited)
| | | PRINCIPAL | | | | |
| | | AMOUNT | | | VALUE | |
| | | | | | | |
| Maryland – 1.58% (Cont.) | | | | | | |
| | | | | | | |
| Maryland Stadium Authority | | | | | | |
| 5.000%, 05/01/2050 | | $ | 4,000,000 | | | $ | 5,474,571 | |
| | | | | | | | | |
| State of Maryland Department | | | | | | | | |
| of Transportation | | | | | | | | |
| 5.000%, 12/01/2029 | | | 2,250,000 | | | | 2,664,825 | |
| | | | | | | | 14,901,436 | |
| Massachusetts – 2.25% | | | | | | | | |
| | | | | | | | | |
| Commonwealth of Massachusetts | | | | | | | | |
| 5.000%, 11/01/2045 | | | 4,000,000 | | | | 4,898,889 | |
| 5.250%, 09/01/2043 | | | 2,000,000 | | | | 2,407,482 | |
| | | | | | | | | |
| Commonwealth of Massachusetts | | | | | | | | |
| Transportation Fund Revenue | | | | | | | | |
| 5.000%, 06/01/2049 | | | 5,000,000 | | | | 5,932,169 | |
| | | | | | | | | |
| Massachusetts Educational | | | | | | | | |
| Financing Authority | | | | | | | | |
| 5.000%, 07/01/2028 | | | 2,250,000 | | | | 2,620,119 | |
| | | | | | | | | |
| Massachusetts Port Authority | | | | | | | | |
| 5.000%, 07/01/2039 | | | 1,000,000 | | | | 1,254,252 | |
| 5.000%, 07/01/2040 | | | 875,000 | | | | 1,095,543 | |
| | | | | | | | | |
| Massachusetts School | | | | | | | | |
| Building Authority | | | | | | | | |
| 5.000%, 02/15/2044 | | | 2,500,000 | | | | 3,008,715 | |
| | | | | | | | 21,217,169 | |
| Michigan – 3.47% | | | | | | | | |
| | | | | | | | | |
| Battle Creek School District | | | | | | | | |
| 5.000%, 05/01/2037 | | | 775,000 | | | | 874,074 | |
| | | | | | | | | |
| Bedford Public School District | | | | | | | | |
| 5.000%, 05/01/2037 | | | 1,150,000 | | | | 1,392,195 | |
| | | | | | | | | |
| Charter Township of Commerce, MI | | | | | | | | |
| 5.000%, 12/01/2038 | | | 1,000,000 | | | | 1,119,955 | |
| | | | | | | | | |
| City of Detroit, MI | | | | | | | | |
| 4.000%, 04/01/2044 | | | 3,000,000 | | | | 2,741,313 | |
| 5.000%, 04/01/2046 | | | 1,850,000 | | | | 2,148,368 | |
| | | | | | | | | |
| Detroit City School District | | | | | | | | |
| 5.250%, 05/01/2027 | | | 715,000 | | | | 848,520 | |
| | | | | | | | | |
| Grand Rapids Public Schools | | | | | | | | |
| 5.000%, 11/01/2040 | | | 1,000,000 | | | | 1,196,187 | |
| | | | | | | | | |
| Kalamazoo Economic | | | | | | | | |
| Development Corp. | | | | | | | | |
| 2.625%, 05/15/2025 | | | 1,150,000 | | | | 1,150,240 | |
| | | | | | | | | |
| Michigan Finance Authority | | | | | | | | |
| 1.250%, 06/01/2030 | | | 115,000 | | | | 115,000 | |
| 3.267%, 06/01/2039 | | | 6,000,000 | | | | 6,186,710 | |
| 3.875%, 10/01/2023 | | | 250,000 | | | | 256,139 | |
| 5.000%, 12/01/2041 | | | 1,990,000 | | | | 2,371,999 | |
| | | | | | | | | |
| Michigan Strategic Fund | | | | | | | | |
| 4.000%, 10/01/2061 | | | 2,250,000 | | | | 2,419,418 | |
| | | | | | | | | |
| Schoolcraft Community Schools | | | | | | | | |
| 5.000%, 05/01/2046 | | | 2,000,000 | | | | 2,424,467 | |
| | | | | | | | | |
| Thornapple Kellogg School District | | | | | | | | |
| 5.000%, 05/01/2043 | | | 2,360,000 | | | | 2,850,951 | |
| | | | | | | | | |
| Walled Lake Consolidated | | | | | | | | |
| School District | | | | | | | | |
| 5.000%, 05/01/2045 | | | 2,300,000 | | | | 2,774,255 | |
| | | | | | | | | |
| Western Michigan University | | | | | | | | |
| 5.000%, 11/15/2046 | | | 1,500,000 | | | | 1,832,593 | |
| | | | | | | | 32,702,384 | |
| Minnesota – 0.49% | | | | | | | | |
| | | | | | | | | |
| City of Minneapolis, MN | | | | | | | | |
| 5.000%, 03/01/2029 | | | 450,000 | | | | 464,168 | |
| 5.750%, 07/01/2055 | | | 2,000,000 | | | | 2,243,783 | |
| | | | | | | | | |
| City of St. Anthony, MN | | | | | | | | |
| 6.000%, 12/01/2030 | | | 1,000,000 | | | | 1,051,472 | |
| | | | | | | | | |
| Minneapolis-St. Paul Metropolitan | | | | | | | | |
| Airports Commission | | | | | | | | |
| 5.000%, 01/01/2041 | | | 750,000 | | | | 860,087 | |
| | | | | | | | 4,619,510 | |
| Missouri – 1.68% | | | | | | | | |
| | | | | | | | | |
| Jackson County School District | | | | | | | | |
| 5.500%, 03/01/2035 | | | 1,015,000 | | | | 1,276,163 | |
| 5.500%, 03/01/2037 | | | 990,000 | | | | 1,244,071 | |
| | | | | | | | | |
| Kansas City Industrial | | | | | | | | |
| Development Authority | | | | | | | | |
| 5.000%, 03/01/2057 | | | 3,250,000 | | | | 3,753,688 | |
| | | | | | | | | |
| Missouri Joint Municipal | | | | | | | | |
| Electric Utility Commission | | | | | | | | |
| 5.000%, 12/01/2040 | | | 2,000,000 | | | | 2,261,931 | |
| | | | | | | | | |
| Platte County Reorganized | | | | | | | | |
| School District | | | | | | | | |
| 5.250%, 03/01/2040 | | | 4,600,000 | | | | 5,927,796 | |
| | | | | | | | | |
| St. Louis County Industrial | | | | | | | | |
| Development Authority | | | | | | | | |
| 5.125%, 09/01/2048 | | | 1,250,000 | | | | 1,359,519 | |
| | | | | | | | 15,823,168 | |
| Nebraska – 1.17% | | | | | | | | |
| | | | | | | | | |
| Central Plains Energy Project | | | | | | | | |
| 5.000%, 09/01/2034 | | | 2,000,000 | | | | 2,487,415 | |
| | | | | | | | | |
| Omaha Public Power District | | | | | | | | |
| 5.000%, 02/01/2046 | | | 7,000,000 | | | | 8,551,346 | |
| | | | | | | | 11,038,761 | |
| Nevada – 0.66% | | | | | | | | |
| | | | | | | | | |
| City of Las Vegas, NV | | | | | | | | |
| 5.000%, 09/01/2031 | | | 1,150,000 | | | | 1,295,126 | |
Percentages are stated as a percent of net assets.
The accompanying notes are an integral part of these financial statements.
PERFORMANCE TRUST MUNICIPAL BOND FUND — SCHEDULE OF INVESTMENTS (CONT.)
February 28, 2022 (Unaudited)
| | | PRINCIPAL | | | | |
| | | AMOUNT | | | VALUE | |
| | | | | | | |
| Nevada – 0.66% (Cont.) | | | | | | |
| | | | | | | |
| County of Clark, NV | | | | | | |
| Department of Aviation | | | | | | |
| 5.000%, 07/01/2041 | | $ | 2,500,000 | | | $ | 2,987,849 | |
| 5.000%, 07/01/2036 | | | 1,535,000 | | | | 1,924,162 | |
| | | | | | | | 6,207,137 | |
| New Hampshire – 0.26% | | | | | | | | |
| | | | | | | | | |
| New Hampshire Health and | | | | | | | | |
| Education Facilities Authority Act | | | | | | | | |
| 5.000%, 07/01/2041 | | | 2,065,000 | | | | 2,412,685 | |
| | | | | | | | | |
| New Jersey – 0.86% | | | | | | | | |
| | | | | | | | | |
| Garden State Preservation Trust | | | | | | | | |
| 5.750%, 11/01/2028 | | | 965,000 | | | | 1,137,106 | |
| | | | | | | | | |
| New Jersey Economic | | | | | | | | |
| Development Authority | | | | | | | | |
| 3.375%, 07/01/2030 | | | 1,000,000 | | | | 1,024,838 | |
| 5.500%, 01/01/2027 | | | 300,000 | | | | 322,057 | |
| | | | | | | | | |
| New Jersey Higher Education | | | | | | | | |
| Student Assistance Authority | | | | | | | | |
| 5.000%, 12/01/2027 | | | 765,000 | | | | 888,662 | |
| | | | | | | | | |
| New Jersey Transportation | | | | | | | | |
| Trust Fund Authority | | | | | | | | |
| 0.000%, 12/15/2027 (d) | | | 2,210,000 | | | | 1,975,212 | |
| 0.000%, 12/15/2030 (d) | | | 1,870,000 | | | | 1,538,544 | |
| | | | | | | | | |
| Tobacco Settlement Financing Corp. | | | | | | | | |
| 5.000%, 06/01/2033 | | | 1,035,000 | | | | 1,186,540 | |
| | | | | | | | 8,072,959 | |
| New Mexico – 0.08% | | | | | | | | |
| | | | | | | | | |
| City of Santa Fe, NM | | | | | | | | |
| 2.250%, 05/15/2024 | | | 710,000 | | | | 710,190 | |
| | | | | | | | | |
| New York – 5.36% | | | | | | | | |
| | | | | | | | | |
| Build NYC Resource Corp. | | | | | | | | |
| 4.000%, 06/15/2031 | | | 600,000 | | | | 639,786 | |
| 4.000%, 06/15/2041 | | | 1,350,000 | | | | 1,420,581 | |
| | | | | | | | | |
| City of New York, NY | | | | | | | | |
| 5.000%, 12/01/2037 | | | 2,000,000 | | | | 2,389,785 | |
| | | | | | | | | |
| New York City Industrial | | | | | | | | |
| Development Agency | | | | | | | | |
| 0.000%, 03/01/2031 (d) | | | 2,520,000 | | | | 1,984,289 | |
| | | | | | | | | |
| New York City Transitional | | | | | | | | |
| Finance Authority Future | | | | | | | | |
| Tax Secured Revenue | | | | | | | | |
| 5.000%, 08/01/2040 | | | 5,000,000 | | | | 5,907,908 | |
| | | | | | | | | |
| New York City Water | | | | | | | | |
| & Sewer System | | | | | | | | |
| 5.000%, 06/15/2040 | | | 2,040,000 | | | | 2,420,707 | |
| 5.000%, 06/15/2050 | | | 3,260,000 | | | | 3,970,471 | |
| | | | | | | | | |
| New York State Dormitory Authority | | | | | | | | |
| 2.692%, 07/01/2035 | | | 1,000,000 | | | | 964,865 | |
| 2.742%, 07/01/2036 | | | 1,205,000 | | | | 1,159,201 | |
| 2.792%, 07/01/2037 | | | 1,200,000 | | | | 1,143,271 | |
| 2.842%, 07/01/2038 | | | 1,100,000 | | | | 1,043,734 | |
| 4.000%, 08/01/2043 | | | 4,700,000 | | | | 5,182,458 | |
| 5.000%, 03/15/2041 | | | 2,435,000 | | | | 2,899,839 | |
| | | | | | | | | |
| New York State Urban | | | | | | | | |
| Development Corp. | | | | | | | | |
| 5.000%, 03/15/2044 | | | 5,615,000 | | | | 6,819,950 | |
| | | | | | | | | |
| New York Transportation | | | | | | | | |
| Development Corp. | | | | | | | | |
| 5.000%, 12/01/2037 | | | 1,280,000 | | | | 1,490,879 | |
| | | | | | | | | |
| Port Authority of | | | | | | | | |
| New York & New Jersey | | | | | | | | |
| 5.000%, 09/01/2032 | | | 1,525,000 | | | | 1,642,404 | |
| 5.000%, 10/15/2040 | | | 3,165,000 | | | | 3,849,234 | |
| 5.000%, 10/15/2041 | | | 2,500,000 | | | | 3,035,637 | |
| | | | | | | | | |
| Triborough Bridge & | | | | | | | | |
| Tunnel Authority | | | | | | | | |
| 5.000%, 05/15/2047 | | | 2,000,000 | | | | 2,472,512 | |
| | | | | | | | 50,437,511 | |
| North Carolina – 0.69% | | | | | | | | |
| | | | | | | | | |
| Durham Housing Authority | | | | | | | | |
| 2.000%, 09/01/2024 | | | 1,000,000 | | | | 999,394 | |
| | | | | | | | | |
| North Carolina Medical | | | | | | | | |
| Care Commission | | | | | | | | |
| 2.500%, 10/01/2024 | | | 740,000 | | | | 740,117 | |
| | | | | | | | | |
| University of North Carolina | | | | | | | | |
| at Chapel Hill | | | | | | | | |
| 5.000%, 12/01/2038 | | | 1,500,000 | | | | 1,926,770 | |
| 5.000%, 12/01/2039 | | | 1,475,000 | | | | 1,890,775 | |
| 5.000%, 12/01/2040 | | | 700,000 | | | | 895,679 | |
| | | | | | | | 6,452,735 | |
| North Dakota – 0.25% | | | | | | | | |
| | | | | | | | | |
| City of Larimore, ND | | | | | | | | |
| 0.850%, 05/01/2024 | | | 2,000,000 | | | | 1,946,495 | |
| | | | | | | | | |
| City of Mandan, ND | | | | | | | | |
| 2.750%, 09/01/2041 | | | 395,000 | | | | 395,033 | |
| | | | | | | | 2,341,528 | |
| Ohio – 3.59% | | | | | | | | |
| | | | | | | | | |
| City of Columbus, OH | | | | | | | | |
| 5.000%, 04/01/2040 | | | 3,000,000 | | | | 3,740,643 | |
| 5.000%, 04/01/2041 | | | 2,400,000 | | | | 2,988,158 | |
| | | | | | | | | |
| County of Cuyahoga, OH | | | | | | | | |
| 5.500%, 02/15/2052 | | | 1,300,000 | | | | 1,519,430 | |
Percentages are stated as a percent of net assets.
The accompanying notes are an integral part of these financial statements.
PERFORMANCE TRUST MUNICIPAL BOND FUND — SCHEDULE OF INVESTMENTS (CONT.)
February 28, 2022 (Unaudited)
| | | PRINCIPAL | | | | |
| | | AMOUNT | | | VALUE | |
| | | | | | | |
| Ohio – 3.59% (Cont.) | | | | | | |
| | | | | | | |
| County of Hamilton, OH | | | | | | |
| 3.374%, 06/01/2034 | | $ | 3,020,000 | | | $ | 3,131,683 | |
| | | | | | | | | |
| Franklin County Convention | | | | | | | | |
| Facilities Authority | | | | | | | | |
| 5.000%, 12/01/2046 | | | 3,000,000 | | | | 3,559,736 | |
| | | | | | | | | |
| Licking Heights Local | | | | | | | | |
| School District | | | | | | | | |
| 5.000%, 10/01/2042 | | | 1,000,000 | | | | 1,157,434 | |
| | | | | | | | | |
| Ohio Higher Educational | | | | | | | | |
| Facility Commission | | | | | | | | |
| 3.750%, 12/01/2023 | | | 1,215,000 | | | | 1,224,209 | |
| | | | | | | | | |
| Ohio Water Development Authority | | | | | | | | |
| Water Pollution Control Loan Fund | | | | | | | | |
| 5.000%, 12/01/2050 | | | 5,230,000 | | | | 6,380,946 | |
| | | | | | | | | |
| State of Ohio | | | | | | | | |
| 5.000%, 05/01/2040 | | | 5,275,000 | | | | 6,607,996 | |
| 5.000%, 01/01/2033 | | | 1,000,000 | | | | 1,183,792 | |
| 5.000%, 01/01/2037 | | | 500,000 | | | | 631,344 | |
| 5.000%, 01/01/2038 | | | 430,000 | | | | 540,943 | |
| 5.000%, 01/01/2039 | | | 920,000 | | | | 1,153,131 | |
| | | | | | | | 33,819,445 | |
| Oklahoma – 0.98% | | | | | | | | |
| | | | | | | | | |
| University of Oklahoma | | | | | | | | |
| 5.000%, 07/01/2046 | | | 7,450,000 | | | | 9,192,858 | |
| | | | | | | | | |
| Oregon – 1.05% | | | | | | | | |
| | | | | | | | | |
| Benton & Linn Counties | | | | | | | | |
| Consolidated School District | | | | | | | | |
| No. 509J & 509A | | | | | | | | |
| 5.000%, 06/15/2038 | | | 1,455,000 | | | | 1,740,691 | |
| | | | | | | | | |
| Clackamas County Hospital | | | | | | | | |
| Facility Authority | | | | | | | | |
| 2.750%, 11/15/2025 | | | 500,000 | | | | 500,215 | |
| 5.375%, 11/15/2055 | | | 500,000 | | | | 536,172 | |
| | | | | | | | | |
| Hospital Facilities Authority | | | | | | | | |
| of Multnomah County Oregon | | | | | | | | |
| 0.950%, 06/01/2027 | | | 1,000,000 | | | | 933,149 | |
| | | | | | | | | |
| Medford Hospital Facilities Authority | | | | | | | | |
| 5.000%, 10/01/2024 | | | 450,000 | | | | 474,067 | |
| 5.000%, 08/15/2045 | | | 2,420,000 | | | | 2,881,686 | |
| | | | | | | | | |
| Port of Portland, OR | | | | | | | | |
| Airport Revenue | | | | | | | | |
| 5.000%, 07/01/2042 | | | 2,485,000 | | | | 2,815,580 | |
| | | | | | | | 9,881,560 | |
| Pennsylvania – 3.17% | | | | | | | | |
| | | | | | | | | |
| Commonwealth Financing Authority | | | | | | | | |
| 5.000%, 06/01/2034 | | | 1,750,000 | | | | 2,049,339 | |
| 5.000%, 06/01/2035 | | | 730,000 | | | | 854,168 | |
| | | | | | | | | |
| Delaware Valley Regional | | | | | | | | |
| Finance Authority | | | | | | | | |
| 0.951%, 09/01/2048 | | | 1,000,000 | | | | 1,009,098 | |
| | | | | | | | | |
| Geisinger Authority | | | | | | | | |
| 5.000%, 04/01/2050 | | | 4,080,000 | | | | 4,877,480 | |
| | | | | | | | | |
| Hopewell Area School District | | | | | | | | |
| 0.000%, 09/01/2026 (d) | | | 900,000 | | | | 817,915 | |
| | | | | | | | | |
| Montour School District | | | | | | | | |
| 5.000%, 04/01/2035 | | | 1,825,000 | | | | 2,028,528 | |
| | | | | | | | | |
| Pennsylvania Economic | | | | | | | | |
| Development Financing Authority | | | | | | | | |
| 5.000%, 06/30/2028 | | | 750,000 | | | | 836,496 | |
| | | | | | | | | |
| Pennsylvania Turnpike Commission | | | | | | | | |
| 5.000%, 12/01/2046 | | | 6,000,000 | | | | 7,477,721 | |
| 5.000%, 12/01/2045 | | | 2,500,000 | | | | 3,007,023 | |
| 5.000%, 12/01/2046 | | | 2,500,000 | | | | 3,054,281 | |
| 6.000%, 12/01/2030 | | | 625,000 | | | | 779,013 | |
| 6.375%, 12/01/2038 | | | 2,000,000 | | | | 2,508,908 | |
| | | | | | | | | |
| Scranton School District | | | | | | | | |
| 5.000%, 12/01/2035 | | | 500,000 | | | | 577,008 | |
| | | | | | | | 29,876,978 | |
| Puerto Rico – 1.51% | | | | | | | | |
| | | | | | | | | |
| Children’s Trust Fund | | | | | | | | |
| 5.375%, 05/15/2033 | | | 760,000 | | | | 780,085 | |
| | | | | | | | | |
| Commonwealth of Puerto Rico | | | | | | | | |
| 3.650%, 07/01/2016 (f) | | | 600,000 | | | | 544,500 | |
| 4.000%, 07/01/2021 (f) | | | 1,820,000 | | | | 1,660,750 | |
| 4.400%, 07/01/2020 (f) | | | 950,000 | | | | 866,875 | |
| 8.000%, 07/01/2035 (f) | | | 500,000 | | | | 450,625 | |
| | | | | | | | | |
| GDB Debt Recovery | | | | | | | | |
| Authority of Puerto Rico | | | | | | | | |
| 7.500%, 08/20/2040 | | | 3,572,803 | | | | 3,358,435 | |
| | | | | | | | | |
| Puerto Rico Convention | | | | | | | | |
| Center District Authority | | | | | | | | |
| 4.500%, 07/01/2036 | | | 1,900,000 | | | | 1,926,784 | |
| | | | | | | | | |
| Puerto Rico Highway & | | | | | | | | |
| Transportation Authority | | | | | | | | |
| 5.850%, 03/01/2027 | | | 1,395,000 | | | | 1,400,231 | |
| | | | | | | | | |
| Puerto Rico Sales Tax Financing | | | | | | | | |
| Corp. Sales Tax Revenue | | | | | | | | |
| 0.000%, 07/01/2024 (d) | | | 2,000,000 | | | | 1,903,420 | |
| 0.000%, 07/01/2029 (d) | | | 1,589,000 | | | | 1,331,196 | |
| | | | | | | | 14,222,901 | |
| Rhode Island – 0.57% | | | | | | | | |
| | | | | | | | | |
| City of Cranston, RI | | | | | | | | |
| 5.000%, 08/01/2039 | | | 1,950,000 | | | | 2,375,329 | |
Percentages are stated as a percent of net assets.
The accompanying notes are an integral part of these financial statements.
PERFORMANCE TRUST MUNICIPAL BOND FUND — SCHEDULE OF INVESTMENTS (CONT.)
February 28, 2022 (Unaudited)
| | | PRINCIPAL | | | | |
| | | AMOUNT | | | VALUE | |
| | | | | | | |
| Rhode Island – 0.57% (Cont.) | | | | | | |
| | | | | | | |
| Rhode Island Student Loan Authority | | | | | | |
| 5.000%, 12/01/2023 | | $ | 905,000 | | | $ | 960,998 | |
| 5.000%, 12/01/2025 | | | 525,000 | | | | 586,760 | |
| 5.000%, 12/01/2030 | | | 1,175,000 | | | | 1,424,954 | |
| | | | | | | | | |
| Tobacco Settlement Financing Corp. | | | | | | | | |
| 2.250%, 06/01/2041 | | | 45,000 | | | | 46,413 | |
| | | | | | | | 5,394,454 | |
| South Carolina – 0.14% | | | | | | | | |
| | | | | | | | | |
| Commission of Public Works, | | | | | | | | |
| City of Greer | | | | | | | | |
| 5.500%, 09/01/2032 | | | 1,000,000 | | | | 1,285,206 | |
| | | | | | | | | |
| Tennessee – 0.75% | | | | | | | | |
| | | | | | | | | |
| City of Memphis, TN Sanitary | | | | | | | | |
| Sewerage System Revenue | | | | | | | | |
| 5.000%, 10/01/2045 | | | 1,000,000 | | | | 1,224,520 | |
| | | | | | | | | |
| Memphis-Shelby County | | | | | | | | |
| Airport Authority | | | | | | | | |
| 5.000%, 07/01/2045 | | | 3,000,000 | | | | 3,572,826 | |
| | | | | | | | | |
| New Memphis Arena Public | | | | | | | | |
| Building Authority | | | | | | | | |
| 0.000%, 04/01/2030 (d) | | | 750,000 | | | | 740,686 | |
| 0.000%, 04/01/2031 (d) | | | 1,500,000 | | | | 1,501,462 | |
| | | | | | | | 7,039,494 | |
| Texas – 9.58% | | | | | | | | |
| | | | | | | | | |
| Alamo Regional Mobility Authority | | | | | | | | |
| 5.000%, 06/15/2039 | | | 1,335,000 | | | | 1,470,617 | |
| | | | | | | | | |
| Arlington Higher Education | | | | | | | | |
| Finance Corp. | | | | | | | | |
| 5.000%, 02/15/2030 | | | 1,000,000 | | | | 1,090,468 | |
| 5.000%, 08/15/2033 | | | 610,000 | | | | 758,862 | |
| 5.000%, 08/15/2034 | | | 525,000 | | | | 652,457 | |
| | | | | | | | | |
| Austin Achieve Public Schools, Inc. | | | | | | | | |
| 5.750%, 06/15/2026 | | | 1,000,000 | | | | 1,001,250 | |
| | | | | | | | | |
| Bexar County Hospital District | | | | | | | | |
| 5.000%, 02/15/2038 | | | 2,135,000 | | | | 2,522,501 | |
| | | | | | | | | |
| City of Austin, TX Water & | | | | | | | | |
| Wastewater System Revenue | | | | | | | | |
| 5.000%, 11/15/2046 | | | 2,500,000 | | | | 3,110,723 | |
| | | | | | | | | |
| City of Fort Worth, TX | | | | | | | | |
| 5.250%, 03/01/2036 | | | 1,800,000 | | | | 1,940,805 | |
| | | | | | | | | |
| City of Houston, TX Combined | | | | | | | | |
| Utility System Revenue | | | | | | | | |
| 5.000%, 11/15/2042 | | | 2,000,000 | | | | 2,355,559 | |
| | | | | | | | | |
| City of San Antonio, TX Electric | | | | | | | | |
| & Gas Systems Revenue | | | | | | | | |
| 5.000%, 02/01/2044 | | | 1,015,000 | | | | 1,210,285 | |
| | | | | | | | | |
| Clifton Higher Education | | | | | | | | |
| Finance Corp. | | | | | | | | |
| 6.000%, 03/01/2029 | | | 2,915,000 | | | | 3,124,361 | |
| | | | | | | | | |
| Colony Economic | | | | | | | | |
| Development Corp. | | | | | | | | |
| 7.250%, 10/01/2042 | | | 1,500,000 | | | | 1,588,362 | |
| | | | | | | | | |
| Colony Local Development Corp. | | | | | | | | |
| 7.250%, 10/01/2033 | | | 700,000 | | | | 744,301 | |
| | | | | | | | | |
| County of Bexar, TX | | | | | | | | |
| 5.000%, 06/15/2039 | | | 1,265,000 | | | | 1,477,940 | |
| | | | | | | | | |
| County of Fort Bend, TX | | | | | | | | |
| 5.000%, 03/01/2041 | | | 1,500,000 | | | | 1,849,475 | |
| | | | | | | | | |
| County of Harris, TX | | | | | | | | |
| 1.009%, 08/15/2035 | | | 1,020,000 | | | | 989,486 | |
| 5.000%, 08/15/2034 | | | 1,000,000 | | | | 1,144,840 | |
| | | | | | | | | |
| Dallas Area Rapid Transit | | | | | | | | |
| 5.000%, 12/01/2047 | | | 2,000,000 | | | | 2,456,167 | |
| 5.250%, 12/01/2031 | | | 800,000 | | | | 1,043,404 | |
| | | | | | | | | |
| El Paso Independent School District | | | | | | | | |
| 5.000%, 08/15/2037 | | | 1,250,000 | | | | 1,418,951 | |
| | | | | | | | | |
| Grand Parkway Transportation Corp. | | | | | | | | |
| 5.000%, 10/01/2038 | | | 2,000,000 | | | | 2,352,708 | |
| | | | | | | | | |
| Lower Colorado River Authority | | | | | | | | |
| 5.000%, 05/15/2051 | | | 3,925,000 | | | | 4,673,651 | |
| | | | | | | | | |
| New Hope Cultural Education | | | | | | | | |
| Facilities Finance Corp. | | | | | | | | |
| 10.000%, 12/01/2025 (c)(e) | | | 1,000,000 | | | | 1,096,300 | |
| | | | | | | | | |
| North East Independent | | | | | | | | |
| School District | | | | | | | | |
| 5.250%, 02/01/2030 | | | 1,025,000 | | | | 1,294,631 | |
| | | | | | | | | |
| Port Authority of Houston | | | | | | | | |
| of Harris County Texas | | | | | | | | |
| 4.000%, 10/01/2046 | | | 5,000,000 | | | | 5,697,521 | |
| 5.000%, 10/01/2041 | | | 5,000,000 | | | | 6,372,530 | |
| | | | | | | | | |
| Port of Beaumont Industrial | | | | | | | | |
| Development Authority | | | | | | | | |
| 4.100%, 01/01/2028 (c) | | | 3,000,000 | | | | 2,841,321 | |
| | | | | | | | | |
| Pottsboro Higher Education | | | | | | | | |
| Finance Corp. | | | | | | | | |
| 2.000%, 08/15/2040 | | | 775,000 | | | | 676,210 | |
| | | | | | | | | |
| San Antonio Water System | | | | | | | | |
| 5.000%, 05/15/2050 | | | 3,010,000 | | | | 3,633,827 | |
| 5.000%, 05/15/2042 | | | 3,000,000 | | | | 3,801,547 | |
| | | | | | | | | |
| State of Texas | | | | | | | | |
| 4.000%, 08/01/2033 | | | 1,315,000 | | | | 1,563,672 | |
| 4.000%, 08/01/2034 | | | 1,350,000 | | | | 1,614,417 | |
| 5.500%, 08/01/2033 | | | 1,000,000 | | | | 1,170,991 | |
Percentages are stated as a percent of net assets.
The accompanying notes are an integral part of these financial statements.
PERFORMANCE TRUST MUNICIPAL BOND FUND — SCHEDULE OF INVESTMENTS (CONT.)
February 28, 2022 (Unaudited)
| | | PRINCIPAL | | | | |
| | | AMOUNT | | | VALUE | |
| | | | | | | |
| Texas – 9.58% (Cont.) | | | | | | |
| | | | | | | |
| Tarrant County Cultural Education | | | | | | |
| Facilities Finance Corp. | | | | | | |
| 3.000%, 11/15/2026 | | $ | 1,000,000 | | | $ | 1,001,473 | |
| 5.000%, 10/01/2040 | | | 1,350,000 | | | | 1,689,792 | |
| 5.000%, 07/01/2036 | | | 1,500,000 | | | | 1,791,569 | |
| 5.250%, 11/15/2025 | | | 2,070,000 | | | | 2,069,896 | |
| | | | | | | | | |
| Texas Municipal Gas | | | | | | | | |
| Acquisition & Supply Corp. I | | | | | | | | |
| 6.250%, 12/15/2026 | | | 1,505,000 | | | | 1,693,638 | |
| | | | | | | | | |
| Texas Municipal Gas | | | | | | | | |
| Acquisition & Supply Corp. III | | | | | | | | |
| 5.000%, 12/15/2032 | | | 2,175,000 | | | | 2,689,258 | |
| | | | | | | | | |
| Texas Public Finance Authority | | | | | | | | |
| 8.250%, 07/01/2024 | | | 1,500,000 | | | | 1,516,085 | |
| | | | | | | | | |
| Texas Water Development Board | | | | | | | | |
| 5.000%, 04/15/2049 | | | 4,825,000 | | | | 5,727,328 | |
| | | | | | | | | |
| University of Texas System | | | | | | | | |
| 5.000%, 08/15/2039 | | | 2,645,000 | | | | 3,247,494 | |
| | | | | | | | 90,166,673 | |
| Utah – 2.71% | | | | | | | | |
| | | | | | | | | |
| County of Utah, UT | | | | | | | | |
| 5.000%, 05/15/2041 | | | 1,500,000 | | | | 1,687,497 | |
| 5.000%, 05/15/2043 | | | 3,405,000 | | | | 4,142,074 | |
| | | | | | | | | |
| Salt Lake City Corp. | | | | | | | | |
| Airport Revenue | | | | | | | | |
| 5.000%, 07/01/2042 | | | 3,000,000 | | | | 3,381,644 | |
| 5.000%, 07/01/2043 | | | 1,000,000 | | | | 1,147,294 | |
| | | | | | | | | |
| University of Utah | | | | | | | | |
| 5.000%, 08/01/2040 | | | 1,560,000 | | | | 1,931,376 | |
| 5.000%, 08/01/2046 | | | 4,000,000 | | | | 4,958,681 | |
| | | | | | | | | |
| Utah Associated | | | | | | | | |
| Municipal Power Systems | | | | | | | | |
| 5.000%, 09/01/2037 | | | 2,030,000 | | | | 2,357,937 | |
| | | | | | | | | |
| Utah Charter School | | | | | | | | |
| Finance Authority | | | | | | | | |
| 5.000%, 10/15/2035 | | | 1,500,000 | | | | 1,636,347 | |
| 5.000%, 04/15/2039 | | | 700,000 | | | | 817,484 | |
| | | | | | | | | |
| Wildflower | | | | | | | | |
| Improvement Association | | | | | | | | |
| 6.625%, 03/01/2031 (c)(e) | | | 3,500,219 | | | | 3,502,614 | |
| | | | | | | | 25,562,948 | |
| Virginia – 0.29% | | | | | | | | |
| | | | | | | | | |
| Arlington County Industrial | | | | | | | | |
| Development Authority | | | | | | | | |
| 5.000%, 07/01/2037 | | | 500,000 | | | | 613,812 | |
| County of Botetourt, VA | | | | | | | | |
| 6.000%, 07/01/2044 | | | 2,000,000 | | | | 2,152,253 | |
| | | | | | | | 2,766,065 | |
| Washington – 2.08% | | | | | | | | |
| | | | | | | | | |
| Chelan County Public | | | | | | | | |
| Utility District No. 1 | | | | | | | | |
| 0.000%, 06/01/2026 (d) | | | 450,000 | | | | 419,598 | |
| | | | | | | | | |
| City of Bellingham, WA | | | | | | | | |
| Water & Sewer Revenue | | | | | | | | |
| 5.000%, 08/01/2039 | | | 1,100,000 | | | | 1,393,835 | |
| 5.000%, 08/01/2041 | | | 1,225,000 | | | | 1,547,037 | |
| | | | | | | | | |
| City of Seattle, WA Municipal | | | | | | | | |
| Light & Power Revenue | | | | | | | | |
| 5.000%, 04/01/2042 | | | 3,000,000 | | | | 3,626,666 | |
| | | | | | | | | |
| Port of Seattle, WA | | | | | | | | |
| 5.000%, 04/01/2034 | | | 1,500,000 | | | | 1,615,347 | |
| | | | | | | | | |
| Spokane County School | | | | | | | | |
| District No. 81 | | | | | | | | |
| 5.000%, 12/01/2036 | | | 2,000,000 | | | | 2,438,510 | |
| | | | | | | | | |
| State of Washington | | | | | | | | |
| 5.000%, 02/01/2043 | | | 5,000,000 | | | | 5,871,758 | |
| | | | | | | | | |
| Washington Health Care | | | | | | | | |
| Facilities Authority | | | | | | | | |
| 5.000%, 10/01/2038 | | | 1,555,000 | | | | 1,707,012 | |
| | | | | | | | | |
| Washington State Housing | | | | | | | | |
| Finance Commission | | | | | | | | |
| 2.375%, 01/01/2026 (c) | | | 450,000 | | | | 445,189 | |
| 5.000%, 01/01/2055 (c) | | | 500,000 | | | | 522,738 | |
| | | | | | | | 19,587,690 | |
| West Virginia – 0.59% | | | | | | | | |
| | | | | | | | | |
| State of West Virginia | | | | | | | | |
| 5.000%, 06/01/2041 | | | 2,510,000 | | | | 3,045,362 | |
| 5.000%, 12/01/2043 | | | 2,110,000 | | | | 2,550,584 | |
| | | | | | | | 5,595,946 | |
| Wisconsin – 1.06% | | | | | | | | |
| | | | | | | | | |
| County of Milwaukee, WI | | | | | | | | |
| Airport Revenue | | | | | | | | |
| 5.000%, 12/01/2028 | | | 1,000,000 | | | | 1,132,697 | |
| | | | | | | | | |
| Plateville Redevelopment Authority | | | | | | | | |
| 5.000%, 07/01/2022 | | | 170,000 | | | | 172,064 | |
| | | | | | | | | |
| Public Finance Authority | | | | | | | | |
| 5.000%, 10/01/2044 | | | 1,000,000 | | | | 1,173,644 | |
| 5.000%, 07/01/2038 | | | 2,000,000 | | | | 2,382,103 | |
| 5.250%, 05/15/2037 (c) | | | 510,000 | | | | 541,912 | |
| 9.000%, 06/01/2029 (c)(e) | | | 2,000,000 | | | | 1,994,311 | |
| | | | | | | | | |
| Wisconsin Center District, WI | | | | | | | | |
| Tax Revenue | | | | | | | | |
| 0.000%, 12/15/2027 (d) | | | 410,000 | | | | 359,172 | |
| 0.000%, 12/15/2028 (d) | | | 255,000 | | | | 216,822 | |
| 0.000%, 12/15/2029 (d) | | | 260,000 | | | | 214,310 | |
| 0.000%, 12/15/2030 (d) | | | 460,000 | | | | 367,138 | |
Percentages are stated as a percent of net assets.
The accompanying notes are an integral part of these financial statements.
PERFORMANCE TRUST MUNICIPAL BOND FUND — SCHEDULE OF INVESTMENTS (CONT.)
February 28, 2022 (Unaudited)
| | | PRINCIPAL | | | | |
| | | AMOUNT | | | VALUE | |
| | | | | | | |
| Wisconsin – 1.06% (Cont.) | | | | | | |
| | | | | | | |
| Wisconsin Health & Educational | | | | | | |
| Facilities Authority | | | | | | |
| 5.000%, 08/15/2034 | | $ | 1,180,000 | | | $ | 1,379,711 | |
| | | | | | | | 9,933,884 | |
| TOTAL MUNICIPAL BONDS | | | | | | | | |
| (Cost $892,065,572) | | | | | | | 893,020,403 | |
| | | | | | | | | |
| SHORT-TERM INVESTMENTS – 2.21% | | | | | | | | |
| First American Government | | | | | | | | |
| Obligations Fund – | | | | | | | | |
| Class X, 0.026% (g) | | | 20,767,446 | | | | 20,767,446 | |
| TOTAL SHORT-TERM | | | | | | | | |
| INVESTMENTS | | | | | | | | |
| (Cost $20,767,446) | | | | | | | 20,767,446 | |
| | | | | | | | | |
| Total Investments | | | | | | | | |
| (Cost $944,471,840) – 100.43% | | | | | | | 945,521,898 | |
| | | | | | | | | |
| Liabilities in Excess | | | | | | | | |
| of Other Assets – (0.43)% | | | | | | | (4,073,337 | ) |
| | | | | | | | | |
| TOTAL NET ASSETS – 100.00% | | | | | | $ | 941,448,561 | |
Percentages are stated as a percent of net assets.
| (a) | Variable rate security; the rate shown represents the rate at February 28, 2022. The coupon is based on an underlying pool of loans. |
| (b) | Represents an interest-only security that entitles holders to receive only interest payments on underlying mortgages. |
| (c) | Securities issued pursuant to Rule 144A under the Securities Act of 1933. |
| (d) | Represents a principal-only security that entitles holders to receive only principal payments on underlying mortgages. |
| (e) | Represents an illiquid security. The total market value of these securities were $10,645,367, representing 1.13% of net assets as of February 28, 2022. |
| (f) | Default or other conditions exist at February 28, 2022. |
| (g) | Seven day yield at February 28, 2022. |
The accompanying notes are an integral part of these financial statements.
PERFORMANCE TRUST CREDIT FUND — SCHEDULE OF INVESTMENTS
February 28, 2022 (Unaudited)
| | | PRINCIPAL | | | | |
| | | AMOUNT | | | VALUE | |
| | | | | | | |
| COLLATERALIZED LOAN | | | | | | |
| OBLIGATIONS – 9.20% | | | | | | |
| | | | | | | |
| Apidos CLO XI | | | | | | |
2012-11A, 3.991% (3 Month LIBOR USD + 3.750%), | | | | | | |
| | | | | | |
| 04/17/2034 (a)(b)(c) | | $ | 500,000 | | | $ | 501,504 | |
| | | | | | | | | |
| Apidos CLO XII | | | | | | | | |
2013-12A, 5.641% (3 Month LIBOR USD + 5.400%), | | | | | | | | |
| | | | | | | | |
| 04/15/2031 (a)(b)(c) | | | 350,000 | | | | 313,828 | |
| | | | | | | | | |
| Apidos CLO XXXII | | | | | | | | |
2019-32A, 7.004% (3 Month LIBOR USD + 6.750%), | | | | | | | | |
| | | | | | | | |
| 01/20/2033 (a)(b)(c) | | | 500,000 | | | | 485,691 | |
| | | | | | | | | |
| Goldentree Loan | | | | | | | | |
| Management US CLO 2 Ltd. | | | | | | | | |
2017-2A, 4.954% (3 Month LIBOR USD + 4.700%), | | | | | | | | |
| | | | | | | | |
| 11/28/2030 (a)(b)(c) | | | 400,000 | | | | 371,939 | |
| | | | | | | | | |
| Goldentree Loan | | | | | | | | |
| Management US CLO 4 Ltd. | | | | | | | | |
2019-4A, 5.009% (3 Month LIBOR USD + 4.750%), | | | | | | | | |
| | | | | | | | |
| 04/24/2031 (a)(b)(c) | | | 350,000 | | | | 323,917 | |
| | | | | | | | | |
| LCM Loan Income Fund I | | | | | | | | |
| Income Note Issuer Ltd. | | | | | | | | |
27A, 5.841% (3 Month LIBOR USD + 5.600%), | | | | | | | | |
| | | | | | | | |
| 07/16/2031 (a)(b)(c) | | | 500,000 | | | | 449,001 | |
| | | | | | | | | |
| LCM XVIII LP | | | | | | | | |
18A, 6.204% (3 Month LIBOR USD + 5.950%), | | | | | | | | |
| | | | | | | | |
| 04/20/2031 (a)(b)(c) | | | 650,000 | | | | 590,632 | |
| TOTAL COLLATERALIZED | | | | | | | | |
| LOAN OBLIGATIONS | | | | | | | | |
| (Cost $3,120,499) | | | | | | | 3,036,512 | |
| | | | | | | | | |
| CORPORATE BONDS – 44.69% | | | | | | | | |
| | | | | | | | | |
| Administrative and | | | | | | | | |
| Support Services – 4.00% | | | | | | | | |
| | | | | | | | | |
| ADT Security Corp. | | | | | | | | |
| 4.125%, 08/01/2029 (a) | | | 350,000 | | | | 329,408 | |
| | | | | | | | | |
| ERAC USA Finance, LLC | | | | | | | | |
| 7.000%, 10/15/2037 (a) | | | 210,000 | | | | 294,594 | |
| | | | | | | | | |
| MSCI, Inc. | | | | | | | | |
| 3.250%, 08/15/2033 (a) | | | 250,000 | | | | 235,878 | |
| | | | | | | | | |
| Scotts Miracle-Gro Co. | | | | | | | | |
| 4.375%, 02/01/2032 | | | 500,000 | | | | 460,750 | |
| | | | | | | | | |
| Chemical Manufacturing – 1.10% | | | | | | | | |
| | | | | | | | | |
| Axalta Coating Systems, LLC | | | | | | | | |
| 3.375%, 02/15/2029 (a) | | | 400,000 | | | | 364,424 | |
| | | | | | | | | |
| Construction of Buildings – 1.41% | | | | | | | | |
| | | | | | | | | |
| LGI Homes, Inc. | | | | | | | | |
| 4.000%, 07/15/2029 (a) | | | 500,000 | | | | 465,825 | |
| | | | | | | | | |
| Credit Intermediation and | | | | | | | | |
| Related Activities – 12.27% | | | | | | | | |
| | | | | | | | | |
| Atlantic Union Bankshares Corp. | | | | | | | | |
| 2.875% to 12/15/2026 then | | | | | | | | |
| SOFR + 1.860%, 12/15/2031 (b)(d) | | | 500,000 | | | | 488,588 | |
| | | | | | | | | |
| Barclays PLC | | | | | | | | |
| 6.125% to 12/15/2025, then 5 Year | | | | | | | | |
| CMT Rate + 5.867% (b)(c)(i) | | | 250,000 | | | | 258,750 | |
| | | | | | | | | |
| Compeer Financial FLCA | | | | | | | | |
| 3.375% to 06/01/2031 then | | | | | | | | |
| SOFR + 1.965%, 06/01/2036 (a)(b)(d) | | | 250,000 | | | | 244,881 | |
| | | | | | | | | |
| First Foundation, Inc. | | | | | | | | |
| 3.500% to 02/01/2027 then | | | | | | | | |
| SOFR + 2.040%, 02/01/2032 (b)(d) | | | 500,000 | | | | 499,297 | |
| | | | | | | | | |
| HomeStreet, Inc. | | | | | | | | |
| 3.500% to 01/30/2027 then | | | | | | | | |
| SOFR + 2.150%, 01/30/2032 (b)(d) | | | 500,000 | | | | 496,971 | |
| | | | | | | | | |
| National Australia Bank Ltd. | | | | | | | | |
| 3.347% (5 Year CMT Rate + 1.700%), | | | | | | | | |
| 01/12/2037 (a)(b)(c) | | | 500,000 | | | | 476,554 | |
| | | | | | | | | |
| OneMain Finance Corp. | | | | | | | | |
| 5.375%, 11/15/2029 | | | 600,000 | | | | 602,532 | |
| | | | | | | | | |
| Oxford Finance, LLC | | | | | | | | |
| 6.375%, 02/01/2027 (a) | | | 250,000 | | | | 255,550 | |
| | | | | | | | | |
| Texas Capital Bancshares, Inc. | | | | | | | | |
| 4.000% (5 Year CMT Rate + 3.150%), | | | | | | | | |
| 05/06/2031 (b) | | | 725,000 | | | | 729,922 | |
| | | | | | | | | |
| Fabricated Metal | | | | | | | | |
| Product Manufacturing – 1.94% | | | | | | | | |
| | | | | | | | | |
| Ball Corp. | | | | | | | | |
| 2.875%, 08/15/2030 | | | 700,000 | | | | 638,782 | |
| | | | | | | | | |
| Food Services and | | | | | | | | |
| Drinking Places – 1.27% | | | | | | | | |
| | | | | | | | | |
| Papa John’s International, Inc. | | | | | | | | |
| 3.875%, 09/15/2029 (a) | | | 450,000 | | | | 417,870 | |
| | | | | | | | | |
| Funds, Trusts, and Other | | | | | | | | |
| Financial Vehicles – 1.37% | | | | | | | | |
| | | | | | | | | |
| Ares Capital Corp. | | | | | | | | |
| 3.200%, 11/15/2031 | | | 500,000 | | | | 451,307 | |
Percentages are stated as a percent of net assets.
The accompanying notes are an integral part of these financial statements.
PERFORMANCE TRUST CREDIT FUND — SCHEDULE OF INVESTMENTS
February 28, 2022 (Unaudited)
| | | PRINCIPAL | | | | |
| | | AMOUNT | | | VALUE | |
| | | | | | | |
| Insurance Carriers and | | | | | | |
| Related Activities – 2.23% | | | | | | |
| | | | | | | |
| Renasant Corp. | | | | | | |
| 3.000% to 12/01/2026 then | | | | | | |
| SOFR + 1.910%, 12/01/2031 (b)(d) | | $ | 750,000 | | | $ | 735,641 | |
| | | | | | | | | |
| Merchant Wholesalers, | | | | | | | | |
| Durable Goods – 0.72% | | | | | | | | |
| | | | | | | | | |
| Genuine Parts Co. | | | | | | | | |
| 2.750%, 02/01/2032 | | | 250,000 | | | | 238,921 | |
| | | | | | | | | |
| Motor Vehicle and | | | | | | | | |
| Parts Dealers – 4.74% | | | | | | | | |
| | | | | | | | | |
| Asbury Automotive Group, Inc. | | | | | | | | |
| 5.000%, 02/15/2032 (a) | | | 600,000 | | | | 581,496 | |
| | | | | | | | | |
| Group 1 Automotive, Inc. | | | | | | | | |
| 4.000%, 08/15/2028 (a) | | | 500,000 | | | | 481,013 | |
| | | | | | | | | |
| Lithia Motors, Inc. | | | | | | | | |
| 4.375%, 01/15/2031 (a) | | | 500,000 | | | | 502,930 | |
| | | | | | | | | |
| Paper Manufacturing – 1.84% | | | | | | | | |
| | | | | | | | | |
| Graphic Packaging | | | | | | | | |
| International, LLC | | | | | | | | |
| 4.750%, 07/15/2027 (a) | | | 200,000 | | | | 204,656 | |
| 3.750%, 02/01/2030 (a) | | | 425,000 | | | | 404,371 | |
| | | | | | | | | |
| Primary Metal | | | | | | | | |
| Manufacturing – 1.43% | | | | | | | | |
| | | | | | | | | |
| Howmet Aerospace, Inc. | | | | | | | | |
| 3.000%, 01/15/2029 | | | 500,000 | | | | 473,525 | |
| | | | | | | | | |
| Professional, Scientific, and | | | | | | | | |
| Technical Services – 1.55% | | | | | | | | |
| | | | | | | | | |
| AECOM | | | | | | | | |
| 5.125%, 03/15/2027 | | | 500,000 | | | | 511,290 | |
| | | | | | | | | |
| Publishing Industries | | | | | | | | |
| (except Internet) – 2.15% | | | | | | | | |
| | | | | | | | | |
| Open Text Holdings, Inc. | | | | | | | | |
| 4.125%, 12/01/2031 (a) | | | 750,000 | | | | 711,439 | |
| | | | | | | | | |
| Real Estate – 1.41% | | | | | | | | |
| | | | | | | | | |
| American Finance Trust, Inc. | | | | | | | | |
| 4.500%, 09/30/2028 (a) | | | 500,000 | | | | 465,060 | |
| | | | | | | | | |
| Repair and Maintenance – 1.40% | | | | | | | | |
| | | | | | | | | |
| Allison Transmission, Inc. | | | | | | | | |
| 3.750%, 01/30/2031 (a) | | | 500,000 | | | | 463,715 | |
| | | | | | | | | |
| Securities, Commodity Contracts, | | | | | | | | |
| and Other Financial Investments | | | | | | | | |
| and Related Activities – 0.56% | | | | | | | | |
| | | | | | | | | |
| Prime Security Services | | | | | | | | |
| Borrower, LLC | | | | | | | | |
| 3.375%, 08/31/2027 (a) | | | 200,000 | | | | 184,661 | |
| | | | | | | | | |
| Transportation Equipment | | | | | | | | |
| Manufacturing – 2.60% | | | | | | | | |
| | | | | | | | | |
| Dana, Inc. | | | | | | | | |
| 4.500%, 02/15/2032 | | | 500,000 | | | | 467,962 | |
| | | | | | | | | |
| Sensata Technologies, Inc. | | | | | | | | |
| 4.375%, 02/15/2030 (a) | | | 400,000 | | | | 388,326 | |
| | | | | | | | | |
| Wood Product | | | | | | | | |
| Manufacturing – 0.70% | | | | | | | | |
| | | | | | | | | |
| Masonite International Corp. | | | | | | | | |
| 3.500%, 02/15/2030 (a)(c) | | | 250,000 | | | | 231,451 | |
| TOTAL CORPORATE BONDS | | | | | | | | |
| (Cost $15,371,708) | | | | | | | 14,758,340 | |
| | | | | | | | | |
| NON-AGENCY RESIDENTIAL | | | | | | | | |
| MORTGAGE BACKED | | | | | | | | |
| SECURITIES – 5.74% | | | | | | | | |
| | | | | | | | | |
| Alternative Loan Trust | | | | | | | | |
| 2006-J5, 6.500%, 09/25/2036 | | | 265,542 | | | | 200,735 | |
| 2006-31CB, 6.000%, 11/25/2036 | | | 223,732 | | | | 167,814 | |
| | | | | | | | | |
| CHL Mortgage Pass-Through Trust | | | | | | | | |
2006-17, 6.000% (1 Month LIBOR USD + 0.550%), | | | | | | | | |
| | | | | | | | |
| 12/25/2036 (b) | | | 383,469 | | | | 224,311 | |
| 2007-HY5, 3.011%, 09/25/2037 (d) | | | 272,139 | | | | 267,783 | |
| | | | | | | | | |
| Citicorp Mortgage Securities Trust | | | | | | | | |
| 2006-3, 6.000%, 06/25/2036 | | | 289,410 | | | | 289,730 | |
| | | | | | | | | |
| Credit Suisse First Boston | | | | | | | | |
| Mortgage Securities Corp. | | | | | | | | |
| 2005-11, 5.500%, 12/25/2035 | | | 378,969 | | | | 238,326 | |
| | | | | | | | | |
| First Horizon Alternative | | | | | | | | |
| Mortgage Securities Trust | | | | | | | | |
| 2005-FA11, 5.750%, 02/25/2036 | | | 263,239 | | | | 165,387 | |
| | | | | | | | | |
| Volt, LLC | | | | | | | | |
2021-NPL4, 4.949%, 03/27/2051 (a)(e) | | | | | | | | |
| | | 350,000 | | | | 340,394 | |
| TOTAL NON-AGENCY RESIDENTIAL | | | | | | | | |
| MORTGAGE BACKED SECURITIES | | | | | | | | |
| (Cost $2,131,604) | | | | | | | 1,894,480 | |
| | | | | | | | | |
| NON-AGENCY COMMERCIAL | | | | | | | | |
| MORTGAGE BACKED | | | | | | | | |
| SECURITIES – 24.17% | | | | | | | | |
| | | | | | | | | |
| 225 Liberty Street Trust | | | | | | | | |
2016-225L, 4.649%, 02/10/2036 (a)(d) | | | | | | | | |
| | | 500,000 | | | | 488,256 | |
| | | | | | | | | |
| BANK | | | | | | | | |
| 2020-BNK29, 2.500%, 11/15/2053 (a) | | | 850,000 | | | | 696,949 | |
| 2022-BNK40, 2.500%, 03/15/2064 | | | 500,000 | | | | 396,195 | |
Percentages are stated as a percent of net assets.
The accompanying notes are an integral part of these financial statements.
PERFORMANCE TRUST CREDIT FUND — SCHEDULE OF INVESTMENTS
February 28, 2022 (Unaudited)
| | | PRINCIPAL | | | | |
| | | AMOUNT | | | VALUE | |
| | | | | | | |
| BBCMS Mortgage Trust | | | | | | |
| 2021-C11, 0.967%, 09/15/2054 (f) | | $ | 4,500,000 | | | $ | 373,776 | |
| 2021-C12, 2.500%, 11/15/2054 (a) | | | 750,000 | | | | 593,973 | |
| | | | | | | | | |
| Benchmark Mortgage Trust | | | | | | | | |
| 2021-B26, 1.369%, 06/15/2054 (f) | | | 2,300,000 | | | | 256,272 | |
| 2021-B27, 1.271%, 07/15/2054 (f) | | | 3,242,944 | | | | 291,128 | |
| 2021-B29, 1.308%, 09/15/2054 (f) | | | 3,000,000 | | | | 318,400 | |
2021-B30, 1.301%, 11/15/2054 (a)(d)(f) | | | | | | | | |
| | | 4,600,000 | | | | 482,964 | |
| | | | | | | | | |
| BMO Mortgage Trust | | | | | | | | |
2022-C1, 1.767%, 02/15/2055 (a)(d)(f) | | | | | | | | |
| | | 5,000,000 | | | | 719,844 | |
| | | | | | | | | |
| Citigroup Commercial | | | | | | | | |
| Mortgage Trust | | | | | | | | |
| 2016-C1, 4.943%, 05/10/2049 (d) | | | 534,000 | | | | 555,447 | |
| | | | | | | | | |
| Freddie Mac Multifamily | | | | | | | | |
| Structured Credit Risk | | | | | | | | |
2021-MN3, 4.049% (SOFR30A + 4.000%), | | | | | | | | |
| | | | | | | | |
| 11/25/2051 (a)(b) | | | 500,000 | | | | 474,488 | |
| | | | | | | | | |
| GS Mortgage Securities Corp. II | | | | | | | | |
| 2012-BWTR, 3.255%, 11/05/2034 (a) | | | 298,000 | | | | 295,765 | |
| | | | | | | | | |
| GS Mortgage Securities Trust | | | | | | | | |
| 2019-GC42, 2.800%, 09/1/2052 (a) | | | 450,000 | | | | 376,671 | |
| | | | | | | | | |
| Morgan Stanley Capital I Trust | | | | | | | | |
| 2017-H1, 4.281%, 06/15/2050 (d) | | | 500,000 | | | | 492,652 | |
| | | | | | | | | |
| RBS Commercial Funding, Inc. Trust | | | | | | | | |
| 2013-SMV, 3.584%, 03/11/2031 (a)(d) | | | 300,000 | | | | 297,835 | |
| | | | | | | | | |
| Wells Fargo Commercial | | | | | | | | |
| Mortgage Trust | | | | | | | | |
| 2019-C52, 1.094%, 08/15/2052 (d)(f) | | | 7,000,000 | | | | 502,466 | |
| 2021-C59, 1.451%, 04/15/2054 (f) | | | 3,250,000 | | | | 366,932 | |
| TOTAL NON-AGENCY COMMERCIAL | | | | | | | | |
| MORTGAGE BACKED SECURITIES | | | | | | | | |
| (Cost $8,343,867) | | | | | | | 7,980,013 | |
| | | | | | | | | |
| AGENCY COMMERCIAL MORTGAGE | | | | | | | | |
| BACKED SECURITIES – 3.19% | | | | | | | | |
| | | | | | | | | |
| Freddie Mac Multifamily Structured | | | | | | | | |
| Pass Through Certificates | | | | | | | | |
| K098, 1.391%, 08/25/2029 (d)(f) | | | 3,000,000 | | | | 283,530 | |
| K118, 0.960%, 09/25/2030 (d)(f) | | | 6,981,592 | | | | 485,837 | |
| K1521, 0.981%, 08/25/2036 (d)(f) | | | 2,697,541 | | | | 283,033 | |
| TOTAL AGENCY COMMERCIAL | | | | | | | | |
| MORTGAGE BACKED SECURITIES | | | | | | | | |
| (Cost $1,059,796) | | | | | | | 1,052,400 | |
| | | | | | | | | |
| MUNICIPAL BONDS – 10.16% | | | | | | | | |
| | | | | | | | | |
| California – 5.55% | | | | | | | | |
| | | | | | | | | |
| California Public Finance Authority | | | | | | | | |
| 2.875%, 05/15/2027 (a) | | | 300,000 | | | | 300,067 | |
| | | | | | | | | |
| City of Santa Ana, CA | | | | | | | | |
| 1.869%, 08/01/2029 | | | 300,000 | | | | 286,237 | |
| | | | | | | | | |
| Golden State Tobacco | | | | | | | | |
| Securitization Corp. | | | | | | | | |
| 3.000%, 06/01/2046 | | | 500,000 | | | | 505,742 | |
| | | | | | | | | |
| Newport Mesa Unified | | | | | | | | |
| School District | | | | | | | | |
| 6.300%, 08/01/2042 | | | 200,000 | | | | 272,640 | |
| | | | | | | | | |
| Peralta Community College District | | | | | | | | |
| 0.000%, 08/05/2031 (g) | | | 500,000 | | | | 464,786 | |
| | | | | | | | 1,829,472 | |
| Florida – 0.82% | | | | | | | | |
| | | | | | | | | |
| Florida Development Finance Corp. | | | | | | | | |
| 7.375%, 01/01/2049 (a) | | | 250,000 | | | | 269,556 | |
| | | | | | | | | |
| Missouri – 1.73% | | | | | | | | |
| | | | | | | | | |
| Kansas City Industrial | | | | | | | | |
| Development Authority | | | | | | | | |
| 5.000%, 03/01/2049 | | | 500,000 | | | | 572,460 | |
| | | | | | | | | |
| Puerto Rico – 0.76% | | | | | | | | |
| | | | | | | | | |
| GDB Debt Recovery | | | | | | | | |
| Authority of Puerto Rico | | | | | | | | |
| 7.500%, 08/20/2040 | | | 267,784 | | | | 251,717 | |
| | | | | | | | | |
| Texas – 0.55% | | | | | | | | |
| | | | | | | | | |
| Clifton Higher Education | | | | | | | | |
| Finance Corp. | | | | | | | | |
| 6.125%, 08/15/2048 | | | 165,000 | | | | 182,991 | |
| | | | | | | | | |
| Wisconsin – 0.75% | | | | | | | | |
| Public Finance Authority | | | | | | | | |
| 9.000%, 06/01/2029 (a)(h) | | | 250,000 | | | | 249,240 | |
| TOTAL MUNICIPAL BONDS | | | | | | | | |
| (Cost $3,350,855) | | | | | | | 3,355,436 | |
| | | | | | | | | |
| US GOVERNMENT NOTES/BONDS – 2.63% | | | | | | | | |
| United States Treasury Notes/Bonds | | | | | | | | |
| 1.250%, 09/30/2028 | | | 425,000 | | | | 410,025 | |
| 1.750%, 08/15/2041 | | | 500,000 | | | | 457,500 | |
| TOTAL US GOVERNMENT | | | | | | | | |
| NOTES/BONDS (Cost $901,850) | | | | | | | 867,525 | |
Percentages are stated as a percent of net assets.
The accompanying notes are an integral part of these financial statements.
PERFORMANCE TRUST CREDIT FUND — SCHEDULE OF INVESTMENTS
February 28, 2022 (Unaudited)
| | | PRINCIPAL | | | | |
| | | AMOUNT | | | VALUE | |
| | | | | | | |
| SHORT-TERM INVESTMENTS – 0.70% | | | | | | |
| First American Government | | | | | | |
| Obligations Fund – | | | | | | |
| Class X, 0.026% (j) | | $ | 229,989 | | | $ | 229,989 | |
| TOTAL SHORT-TERM | | | | | | | | |
| INVESTMENTS | | | | | | | | |
| (Cost $229,989) | | | | | | | 229,989 | |
| | | | | | | | | |
| Total Investments | | | | | | | | |
| (Cost $34,510,168) – 100.48% | | | | | | | 33,174,695 | |
| | | | | | | | | |
| Liabilities in Excess | | | | | | | | |
| of Other Assets – (0.48)% | | | | | | | (157,076 | ) |
| | | | | | | | | |
| TOTAL NET ASSETS – 100.00% | | | | | | $ | 33,017,619 | |
Percentages are stated as a percent of net assets.
| (a) | Securities issued pursuant to Rule 144A under the Securities Act of 1933. |
| (b) | Variable rate security; the rate shown represents the rate at February 28, 2022. |
| (c) | Foreign issued security. |
| (d) | Variable rate security; the rate shown represents the rate at February 28, 2022. The coupon is based on an underlying pool of loans. |
| (e) | Step-up bond; the rate shown represents the rate at February 28, 2022. |
| (f) | Represents an interest-only security that entitles holders to receive only interest payments on underlying mortgages. |
| (g) | Represents a principal-only security that entitles holders to receive only principal payments on underlying mortgages. |
| (h) | Represents an illiquid security. The total market value of these securities were $249,240, representing 0.75% of net assets as of February 28, 2022. |
| (i) | Perpetual maturity. The date referenced is the next call date. |
| (j) | Seven day yield at February 28, 2022. |
The accompanying notes are an integral part of these financial statements.
STATEMENTS OF OPERATIONS
For the Six Months Ended February 28, 2022 (Unaudited)
| | | Performance Trust | | | Performance Trust | | | | |
| | | Strategic | | | Municipal | | | Performance Trust | |
| | | Bond Fund | | | Bond Fund | | | Credit Fund | |
| Investment Income | | | | | | | | | |
| Interest income | | $ | 121,495,818 | | | $ | 10,775,871 | | | $ | 652,137 | |
| Dividend income | | | 3,750 | | | | — | | | | — | |
| Total Investment Income | | | 121,499,568 | | | | 10,775,871 | | | | 652,137 | |
| | | | | | | | | | | | | |
| Expenses | | | | | | | | | | | | |
| Advisory fees | | | 19,710,902 | | | | 1,838,588 | | | | 101,066 | |
| Transfer agent fees and expenses | | | 3,059,711 | | | | 52,720 | | | | 6,632 | |
| Administration and accounting fees | | | 1,133,464 | | | | 171,394 | | | | 12,371 | |
| Distribution fees – Class C | | | 220,667 | | | | — | | | | — | |
| Federal and state registration fees | | | 179,617 | | | | 48,939 | | | | 21,691 | |
| Custody fees | | | 144,426 | | | | 19,095 | | | | 2,830 | |
| Reports to shareholders | | | 101,734 | | | | 13,290 | | | | 920 | |
| Service fees – Class C | | | 73,555 | | | | — | | | | — | |
| Distribution fees – Class A | | | 41,556 | | | | 72,001 | | | | — | |
| Audit and tax fees | | | 20,278 | | | | 10,501 | | | | 10,584 | |
| Insurance expense | | | 17,420 | | | | 3,430 | | | | 1,555 | |
| Legal fees | | | 11,411 | | | | 6,384 | | | | 6,268 | |
| Chief Compliance Officer fees | | | 5,792 | | | | 5,792 | | | | 5,792 | |
| Trustees’ fees | | | 5,761 | | | | 5,761 | | | | 5,115 | |
| Other expenses | | | 16,628 | | | | 3,439 | | | | 1,418 | |
| Total Expenses | | | 24,742,922 | | | | 2,251,334 | | | | 176,242 | |
| Reimbursement by Adviser | | | — | | | | — | | | | (51,172 | ) |
| Net Expenses | | | 24,742,922 | | | | 2,251,334 | | | | 125,070 | |
| | | | | | | | | | | | | |
| Net Investment Income | | | 96,756,646 | | | | 8,524,537 | | | | 527,067 | |
| | | | | | | | | | | | | |
| Realized and Unrealized Gain (Loss) on Investments | | | | | | | | | | | | |
| Net realized gain (loss) from: | | | | | | | | | | | | |
| Investments | | | 6,824,140 | | | | (1,450,896 | ) | | | 248 | |
| Change in net unrealized depreciation from investments | | | (311,716,964 | ) | | | (37,891,492 | ) | | | (1,343,088 | ) |
| Net Realized and Unrealized Loss on Investments | | | (304,892,824 | ) | | | (39,342,388 | ) | | | (1,342,840 | ) |
| | | | | | | | | | | | | |
| Net Decrease in Net Assets from Operations | | $ | (208,136,178 | ) | | $ | (30,817,851 | ) | | $ | (815,773 | ) |
The accompanying notes are an integral part of these financial statements.
STATEMENTS OF CHANGES IN NET ASSETS
Performance Trust Strategic Bond Fund
| | | Six Months Ended | | | | |
| | | February 28, 2022 | | | Year Ended | |
| | | (Unaudited) | | | August 31, 2021 | |
| From Operations | | | | | | |
| Net investment income | | $ | 96,756,646 | | | $ | 178,890,831 | |
| Net realized gain from investments | | | 6,824,140 | | | | 25,835,812 | |
| Change in net unrealized appreciation (depreciation) from investments | | | (311,716,964 | ) | | | 29,142,563 | |
| Net increase (decrease) in net assets from operations | | | (208,136,178 | ) | | | 233,869,206 | |
| | | | | | | | | |
| From Distributions | | | | | | | | |
| Net dividends and distributions – Institutional Class | | | (119,334,611 | ) | | | (185,602,038 | ) |
| Net dividends and distributions – Class A | | | (574,351 | ) | | | (952,554 | ) |
| Net dividends and distributions – Class C | | | (790,843 | ) | | | (1,139,603 | ) |
| Net decrease in net assets resulting from distributions paid | | | (120,699,805 | ) | | | (187,694,195 | ) |
| | | | | | | | | |
| From Capital Share Transactions | | | | | | | | |
| Proceeds from shares sold – Institutional Class | | | 1,493,599,636 | | | | 3,055,779,908 | |
| Proceeds from shares sold – Class A | | | 13,074,962 | | | | 24,607,234 | |
| Proceeds from shares sold – Class C | | | 10,122,157 | | | | 32,976,293 | |
| Shares issued in reinvestment of distributions declared – | | | | | | | | |
| Institutional Class | | | 105,749,276 | | | | 162,114,245 | |
| Shares issued in reinvestment of distributions declared – Class A | | | 569,070 | | | | 949,912 | |
| Shares issued in reinvestment of distributions declared – Class C | | | 789,510 | | | | 1,137,047 | |
| Cost for shares redeemed – Institutional Class | | | (973,520,460 | ) | | | (1,200,615,875 | ) |
| Cost for shares redeemed – Class A | | | (7,837,412 | ) | | | (12,222,134 | ) |
| Cost for shares redeemed – Class C | | | (7,289,155 | ) | | | (9,003,791 | ) |
| Net increase in net assets from capital share transactions | | | 635,257,584 | | | | 2,055,722,839 | |
| | | | | | | | | |
| Total Increase in Net Assets | | | 306,421,601 | | | | 2,101,897,850 | |
| | | | | | | | | |
| Net Assets | | | | | | | | |
| Beginning of period | | | 6,417,224,397 | | | | 4,315,326,547 | |
| End of period | | $ | 6,723,645,998 | | | $ | 6,417,224,397 | |
The accompanying notes are an integral part of these financial statements.
STATEMENTS OF CHANGES IN NET ASSETS
Performance Trust Municipal Bond Fund
| | | Six Months Ended | | | | |
| | | February 28, 2022 | | | Year Ended | |
| | | (Unaudited) | | | August 31, 2021 | |
| From Operations | | | | | | |
| Net investment income | | $ | 8,524,537 | | | $ | 13,558,043 | |
| Net realized gain (loss) from investments | | | (1,450,896 | ) | | | 2,284,058 | |
| Change in net unrealized appreciation (depreciation) from investments | | | (37,891,492 | ) | | | 13,396,446 | |
| Net increase (decrease) in net assets from operations | | | (30,817,851 | ) | | | 29,238,547 | |
| | | | | | | | | |
| From Distributions | | | | | | | | |
| Net dividends and distributions – Institutional Class | | | (8,113,882 | ) | | | (15,224,038 | ) |
| Return of capital – Institutional Class | | | — | | | | (2,045,478 | ) |
| Net dividends and distributions – Class A | | | (470,491 | ) | | | (1,101,862 | ) |
| Return of capital – Class A | | | — | | | | (146,419 | ) |
| Net decrease in net assets resulting from distributions paid | | | (8,584,373 | ) | | | (18,517,797 | ) |
| | | | | | | | | |
| From Capital Share Transactions | | | | | | | | |
| Proceeds from shares sold – Institutional Class | | | 202,106,634 | | | | 412,357,191 | |
| Proceeds from shares sold – Class A | | | 16,296,027 | | | | 31,022,237 | |
| Shares issued in reinvestment of distributions declared – | | | | | | | | |
| Institutional Class | | | 7,254,649 | | | | 15,363,740 | |
| Shares issued in reinvestment of distributions declared – Class A | | | 441,640 | | | | 1,152,135 | |
| Cost for shares redeemed – Institutional Class | | | (107,790,797 | ) | | | (118,952,857 | ) |
| Cost for shares redeemed – Class A | | | (12,200,740 | ) | | | (19,646,947 | ) |
| Net increase in net assets from capital share transactions | | | 106,107,413 | | | | 321,295,499 | |
| | | | | | | | | |
| Total Increase in Net Assets | | | 66,705,189 | | | | 332,016,249 | |
| | | | | | | | | |
| Net Assets | | | | | | | | |
| Beginning of period | | | 874,743,372 | | | | 542,727,123 | |
| End of period | | $ | 941,448,561 | | | $ | 874,743,372 | |
The accompanying notes are an integral part of these financial statements.
STATEMENT OF CHANGES IN NET ASSETS
Performance Trust Credit Fund
| | | Six Months Ended | | | | |
| | | February 28, 2022 | | | Year Ended | |
| | | (Unaudited) | | | August 31, 2021(1) | |
| From Operations | | | | | | |
| Net investment income | | $ | 527,067 | | | $ | 403,221 | |
| Net realized gain from investments | | | 248 | | | | 50,384 | |
| Change in net unrealized appreciation (depreciation) from investments | | | (1,343,088 | ) | | | 7,615 | |
| Net increase (decrease) in net assets from operations | | | (815,773 | ) | | | 461,220 | |
| | | | | | | | | |
| From Distributions | | | | | | | | |
| Net dividends and distributions – Institutional Class | | | (555,027 | ) | | | (360,597 | ) |
| Net decrease in net assets resulting from distributions paid | | | (555,027 | ) | | | (360,597 | ) |
| | | | | | | | | |
| From Capital Share Transactions | | | | | | | | |
| Proceeds from shares sold – Institutional Class | | | 22,356,690 | | | | 12,771,622 | |
| Shares issued in reinvestment of distributions declared – | | | | | | | | |
| Institutional Class | | | 554,689 | | | | 355,596 | |
| Cost for shares redeemed – Institutional Class | | | (1,548,058 | ) | | | (202,743 | ) |
| Net increase in net assets from capital share transactions | | | 21,363,321 | | | | 12,924,475 | |
| | | | | | | | | |
| Total Increase in Net Assets | | | 19,992,521 | | | | 13,025,098 | |
| | | | | | | | | |
| Net Assets | | | | | | | | |
| Beginning of period | | | 13,025,098 | | | | — | |
| End of period | | $ | 33,017,619 | | | $ | 13,025,098 | |
| (1) | The inception date for the Fund was December 31, 2020 and investment operations commenced January 4, 2021. |
The accompanying notes are an integral part of these financial statements.
PERFORMANCE TRUST STRATEGIC BOND FUND — FINANCIAL HIGHLIGHTS
Per Share Data for a Share Outstanding Throughout Each Period
| | | Six Months | | | Year | | | Year | | | Year | | | Year | | | Year | |
| | | Ended | | | Ended | | | Ended | | | Ended | | | Ended | | | Ended | |
| | February 28, 2022 | | | August 31, | | | August 31, | | | August 31, | | | August 31, | | | August 31, | |
| | | (Unaudited) | | | 2021 | | | 2020 | | | 2019 | | | 2018 | | | 2017 | |
| Institutional Class Shares | | | | | | | | | | | | | | | | | | |
| | | | | | | | | | | | | | | | | | | |
| Net Asset Value, | | | | | | | | | | | | | | | | | | |
| Beginning of Period | | $ | 23.17 | | | $ | 22.99 | | | $ | 23.22 | | | $ | 22.21 | | | $ | 22.84 | | | $ | 22.98 | |
| | | | | | | | | | | | | | | | | | | | | | | | | |
| Income (loss) from | | | | | | | | | | | | | | | | | | | | | | | | |
| investment operations: | | | | | | | | | | | | | | | | | | | | | | | | |
Net investment income(1) | | | 0.34 | | | | 0.78 | | | | 0.82 | | | | 0.83 | | | | 0.94 | | | | 1.09 | |
| Net realized and unrealized | | | | | | | | | | | | | | | | | | | | | | | | |
gain (loss) on investments(2) | | | (1.03 | ) | | | 0.23 | | | | (0.18 | ) | | | 1.07 | | | | (0.50 | ) | | | 0.05 | |
| Total from investment operations | | | (0.69 | ) | | | 1.01 | | | | 0.64 | | | | 1.90 | | | | 0.44 | | | | 1.14 | |
| | | | | | | | | | | | | | | | | | | | | | | | | |
| Less distributions paid: | | | | | | | | | | | | | | | | | | | | | | | | |
| From net investment income | | | (0.34 | ) | | | (0.83 | ) | | | (0.87 | ) | | | (0.89 | ) | | | (1.07 | ) | | | (1.28 | ) |
| From net realized gain on investments | | | (0.08 | ) | | | — | | | | — | | | | — | | | | — | | | | — | |
| Total distributions paid | | | (0.42 | ) | | | (0.83 | ) | | | (0.87 | ) | | | (0.89 | ) | | | (1.07 | ) | | | (1.28 | ) |
| | | | | | | | | | | | | | | | | | | | | | | | | |
| Paid-in capital from | | | | | | | | | | | | | | | | | | | | | | | | |
| redemption fees (Note 2) | | | — | | | | — | | | | 0.00 | (3) | | | 0.00 | (3) | | | 0.00 | (3) | | | 0.00 | (3) |
| | | | | | | | | | | | | | | | | | | | | | | | | |
| Net Asset Value, End of Period | | $ | 22.06 | | | $ | 23.17 | | | $ | 22.99 | | | $ | 23.22 | | | $ | 22.21 | | | $ | 22.84 | |
| | | | | | | | | | | | | | | | | | | | | | | | | |
Total Return(4) | | | -3.03 | % | | | 4.49 | % | | | 2.87 | % | | | 8.79 | % | | | 2.00 | % | | | 5.20 | % |
| | | | | | | | | | | | | | | | | | | | | | | | | |
| Supplemental Data and Ratios: | | | | | | | | | | | | | | | | | | | | | | | | |
| Net assets at end of Period (000’s) | | $ | 6,629,359 | | | $ | 6,327,797 | | | $ | 4,264,846 | | | $ | 2,836,855 | | | $ | 1,559,737 | | | $ | 1,057,374 | |
| | | | | | | | | | | | | | | | | | | | | | | | | |
| Ratio of expenses to | | | | | | | | | | | | | | | | | | | | | | | | |
average net assets(5) | | | 0.74 | % | | | 0.76 | % | | | 0.78 | % | | | 0.80 | % | | | 0.81 | % | | | 0.76 | % |
| | | | | | | | | | | | | | | | | | | | | | | | | |
| Ratio of net investment income | | | | | | | | | | | | | | | | | | | | | | | | |
to average net assets(5) | | | 2.96 | % | | | 3.39 | % | | | 3.64 | % | | | 3.68 | % | | | 4.19 | % | | | 4.83 | % |
| | | | | | | | | | | | | | | | | | | | | | | | | |
Portfolio turnover rate(4) | | | 22.71 | % | | | 30.80 | % | | | 41.75 | % | | | 40.59 | % | | | 37.99 | % | | | 78.53 | % |
| (1) | Per share net investment income was calculated using the average shares outstanding method. |
| (2) | Realized gains and losses per share in the caption are balancing amounts necessary to reconcile the change in net asset value per share for the period, and may not reconcile with the aggregate gains and losses in the Statement of Operations due to share transactions for the period. |
| (3) | Rounds to less than 0.5 cent per share. |
| (4) | Not annualized for periods less than one year. |
| (5) | Annualized for periods less than one year. |
The accompanying notes are an integral part of these financial statements.
PERFORMANCE TRUST STRATEGIC BOND FUND — FINANCIAL HIGHLIGHTS
Per Share Data for a Share Outstanding Throughout Each Period
| | | Six Months | | | Year | | | Year | | | Period | |
| | | Ended | | | Ended | | | Ended | | | Ended | |
| | | February 28, 2022 | | | August 31, | | | August 31, | | | August 31, | |
| | | (Unaudited) | | | 2021 | | | 2020 | | | 2019(1) | |
| Class A Shares | | | | | | | | | | | | |
| | | | | | | | | | | | | |
| Net Asset Value, Beginning of Period | | $ | 23.18 | | | $ | 22.99 | | | $ | 23.23 | | | $ | 22.13 | |
| | | | | | | | | | | | | | | | | |
| Income from investment operations: | | | | | | | | | | | | | | | | |
Net investment income(2) | | | 0.31 | | | | 0.72 | | | | 0.76 | | | | 0.58 | |
| Net realized and unrealized | | | | | | | | | | | | | | | | |
gain (loss) on investments(3) | | | (1.04 | ) | | | 0.24 | | | | (0.18 | ) | | | 1.08 | |
| Total from investment operations | | | (0.73 | ) | | | 0.96 | | | | 0.58 | | | | 1.66 | |
| | | | | | | | | | | | | | | | | |
| Less distributions paid: | | | | | | | | | | | | | | | | |
| From net investment income | | | (0.31 | ) | | | (0.77 | ) | | | (0.82 | ) | | | (0.57 | ) |
| From net realized gain on investments | | | (0.08 | ) | | | — | | | | — | | | | — | |
| Total distributions paid | | | (0.39 | ) | | | (0.77 | ) | | | (0.82 | ) | | | (0.57 | ) |
| | | | | | | | | | | | | | | | | |
| Paid-in capital from redemption fees (Note 2) | | | — | | | | — | | | | 0.00 | (4) | | | 0.01 | |
| | | | | | | | | | | | | | | | | |
| Net Asset Value, End of Period | | $ | 22.06 | | | $ | 23.18 | | | $ | 22.99 | | | $ | 23.23 | |
| | | | | | | | | | | | | | | | | |
Total Return(5)(6) | | | -3.20 | % | | | 4.28 | % | | | 2.60 | % | | | 7.67 | % |
| | | | | | | | | | | | | | | | | |
| Supplemental Data and Ratios: | | | | | | | | | | | | | | | | |
| Net assets at end of Period (000’s) | | $ | 36,963 | | | $ | 32,802 | | | $ | 19,297 | | | $ | 7,549 | |
| | | | | | | | | | | | | | | | | |
Ratio of expenses to average net assets(7) | | | 0.99 | % | | | 1.01 | % | | | 1.03 | % | | | 1.05 | % |
| | | | | | | | | | | | | | | | | |
| Ratio of net investment income | | | | | | | | | | | | | | | | |
to average net assets(7) | | | 2.77 | % | | | 3.12 | % | | | 3.40 | % | | | 3.80 | % |
| | | | | | | | | | | | | | | | | |
Portfolio turnover rate(6)(8) | | | 22.71 | % | | | 30.80 | % | | | 41.75 | % | | | 40.59 | % |
| (1) | The Class A shares commenced operations on January 2, 2019. |
| (2) | Per share net investment income was calculated using the average shares outstanding method. |
| (3) | Realized gains and losses per share in the caption are balancing amounts necessary to reconcile the change in net asset value per share for the period, and may not reconcile with the aggregate gains and losses in the Statement of Operations due to share transactions for the period. |
| (4) | Rounds to less than 0.5 cent per share. |
| (5) | Based on net asset value, which does not reflect sales charge. |
| (6) | Not annualized for periods less than one year. |
| (7) | Annualized for periods less than one year. |
| (8) | Portfolio turnover rates are calculated at the Fund level (not by individual share class). |
The accompanying notes are an integral part of these financial statements.
PERFORMANCE TRUST STRATEGIC BOND FUND — FINANCIAL HIGHLIGHTS
Per Share Data for a Share Outstanding Throughout Each Period
| | | Six Months | | | Year | | | Year | | | Period | |
| | | Ended | | | Ended | | | Ended | | | Ended | |
| | | February 28, 2022 | | | August 31, | | | August 31, | | | August 31, | |
| | | (Unaudited) | | | 2021 | | | 2020 | | | 2019(1) | |
| Class C Shares | | | | | | | | | | | | |
| | | | | | | | | | | | | |
| Net Asset Value, Beginning of Period | | $ | 23.10 | | | $ | 22.92 | | | $ | 23.18 | | | $ | 22.13 | |
| | | | | | | | | | | | | | | | | |
| Income (loss) from investment operations: | | | | | | | | | | | | | | | | |
Net investment income(2) | | | 0.22 | | | | 0.55 | | | | 0.59 | | | | 0.46 | |
| Net realized and unrealized | | | | | | | | | | | | | | | | |
gain (loss) on investments(3) | | | (1.03 | ) | | | 0.24 | | | | (0.18 | ) | | | 1.09 | |
| Total from investment operations | | | (0.81 | ) | | | 0.79 | | | | 0.41 | | | | 1.55 | |
| | | | | | | | | | | | | | | | | |
| Less distributions paid: | | | | | | | | | | | | | | | | |
| From net investment income | | | (0.22 | ) | | | (0.61 | ) | | | (0.67 | ) | | | (0.50 | ) |
| From net realized gain on investments | | | (0.08 | ) | | | — | | | | — | | | | — | |
| Total distributions paid | | | (0.30 | ) | | | (0.61 | ) | | | (0.67 | ) | | | (0.50 | ) |
| | | | | | | | | | | | | | | | | |
| Paid-in capital from redemption fees (Note 2) | | | — | | | | — | | | | 0.00 | (4) | | | 0.00 | (4) |
| | | | | | | | | | | | | | | | | |
| Net Asset Value, End of Period | | $ | 21.99 | | | $ | 23.10 | | | $ | 22.92 | | | $ | 23.18 | |
| | | | | | | | | | | | | | | | | |
Total Return(5) | | | -3.53 | % | | | 3.49 | % | | | 1.83 | % | | | 7.10 | % |
| | | | | | | | | | | | | | | | | |
| Supplemental Data and Ratios: | | | | | | | | | | | | | | | | |
| Net assets at end of Period (000’s) | | $ | 57,324 | | | $ | 56,625 | | | $ | 31,184 | | | $ | 7,418 | |
| | | | | | | | | | | | | | | | | |
Ratio of expenses to average net assets(6) | | | 1.74 | % | | | 1.76 | % | | | 1.78 | % | | | 1.80 | % |
| | | | | | | | | | | | | | | | | |
| Ratio of net investment income | | | | | | | | | | | | | | | | |
to average net assets(6) | | | 1.95 | % | | | 2.37 | % | | | 2.66 | % | | | 3.04 | % |
| | | | | | | | | | | | | | | | | |
Portfolio turnover rate(5)(7) | | | 22.71 | % | | | 30.80 | % | | | 41.75 | % | | | 40.59 | % |
| (1) | The Class C shares commenced operations on January 2, 2019. |
| (2) | Per share net investment income was calculated using the average shares outstanding method. |
| (3) | Realized gains and losses per share in the caption are balancing amounts necessary to reconcile the change in net asset value per share for the period, and may not reconcile with the aggregate gains and losses in the Statement of Operations due to share transactions for the period. |
| (4) | Rounds to less than 0.5 cent per share. |
| (5) | Not annualized for periods less than one year. |
| (6) | Annualized for periods less than one year. |
| (7) | Portfolio turnover rates are calculated at the Fund level (not by individual share class). |
The accompanying notes are an integral part of these financial statements.
PERFORMANCE TRUST MUNICIPAL BOND FUND — FINANCIAL HIGHLIGHTS
Per Share Data for a Share Outstanding Throughout Each Period
| | | Six Months | | | Year | | | Year | | | Year | | | Year | | | Year | |
| | | Ended | | | Ended | | | Ended | | | Ended | | | Ended | | | Ended | |
| | February 28, 2022 | | | August 31, | | | August 31, | | | August 31, | | | August 31, | | | August 31, | |
| | | (Unaudited) | | | 2021 | | | 2020 | | | 2019 | | | 2018 | | | 2017 | |
| Institutional Class Shares | | | | | | | | | | | | | | | | | | |
| | | | | | | | | | | | | | | | | | | |
| Net Asset Value, | | | | | | | | | | | | | | | | | | |
| Beginning of Period | | $ | 25.94 | | | $ | 25.52 | | | $ | 25.49 | | | $ | 23.79 | | | $ | 24.34 | | | $ | 24.87 | |
| | | | | | | | | | | | | | | | | | | | | | | | | |
| Income (loss) from | | | | | | | | | | | | | | | | | | | | | | | | |
| investment operations: | | | | | | | | | | | | | | | | | | | | | | | | |
Net investment income(1) | | | 0.24 | | | | 0.49 | | | | 0.54 | | | | 0.72 | | | | 0.67 | | | | 0.62 | |
| Net realized and unrealized | | | | | | | | | | | | | | | | | | | | | | | | |
| gain (loss) on investments | | | (1.05 | ) | | | 0.61 | | | | 0.22 | | | | 1.69 | | | | (0.55 | ) | | | (0.53 | ) |
| Total from investment operations | | | (0.81 | ) | | | 1.10 | | | | 0.76 | | | | 2.41 | | | | 0.12 | | | | 0.09 | |
| | | | | | | | | | | | | | | | | | | | | | | | | |
| Less distributions paid: | | | | | | | | | | | | | | | | | | | | | | | | |
| From net investment income | | | (0.24 | ) | | | (0.58 | ) | | | (0.66 | ) | | | (0.71 | ) | | | (0.67 | ) | | | (0.61 | ) |
| From return of capital | | | — | | | | (0.06 | ) | | | — | | | | — | | | | — | | | | — | |
| From net realized gain on investments | | | — | | | | (0.04 | ) | | | (0.07 | ) | | | — | | | | — | | | | (0.01 | ) |
| Total distributions paid | | | (0.24 | ) | | | (0.68 | ) | | | (0.73 | ) | | | (0.71 | ) | | | (0.67 | ) | | | (0.62 | ) |
| | | | | | | | | | | | | | | | | | | | | | | | | |
| Paid-in capital from | | | | | | | | | | | | | | | | | | | | | | | | |
| redemption fees (Note 2) | | | — | | | | — | | | | 0.00 | (2) | | | 0.00 | (2) | | | 0.00 | (2) | | | 0.00 | (2) |
| | | | | | | | | | | | | | | | | | | | | | | | | |
| Net Asset Value, End of Period | | | 24.89 | | | | 25.94 | | | $ | 25.52 | | | $ | 25.49 | | | $ | 23.79 | | | $ | 24.34 | |
| | | | | | | | | | | | | | | | | | | | | | | | | |
Total Return(3) | | | -3.14 | % | | | 4.35 | % | | | 3.07 | % | | | 10.31 | % | | | 0.46 | % | | | 0.50 | % |
| | | | | | | | | | | | | | | | | | | | | | | | | |
| Supplemental Data and Ratios: | | | | | | | | | | | | | | | | | | | | | | | | |
| Net assets at end of Period (000’s) | | $ | 883,410 | | | $ | 818,825 | | | $ | 500,176 | | | $ | 307,384 | | | $ | 208,325 | | | $ | 172,201 | |
| | | | | | | | | | | | | | | | | | | | | | | | | |
| Ratio of expenses to | | | | | | | | | | | | | | | | | | | | | | | | |
| average net assets: | | | | | | | | | | | | | | | | | | | | | | | | |
| Before waiver, expense | | | | | | | | | | | | | | | | | | | | | | | | |
reimbursements and recoupments(4) | | | 0.47 | % | | | 0.49 | % | | | 0.53 | % | | | 0.57 | % | | | 0.60 | % | | | 0.66 | % |
| After waiver, expense | | | | | | | | | | | | | | | | | | | | | | | | |
reimbursements and recoupments(4) | | | 0.47 | % | | | 0.50 | % | | | 0.55 | % | | | 0.55 | % | | | 0.55 | % | | | 0.55 | % |
| | | | | | | | | | | | | | | | | | | | | | | | | |
| Ratio of net investment income | | | | | | | | | | | | | | | | | | | | | | | | |
| to average net assets: | | | | | | | | | | | | | | | | | | | | | | | | |
| Before waiver, expense | | | | | | | | | | | | | | | | | | | | | | | | |
reimbursements and recoupments(4) | | | 1.87 | % | | | 1.92 | % | | | 2.19 | % | | | 2.94 | % | | | 2.76 | % | | | 2.50 | % |
| After waiver, expense | | | | | | | | | | | | | | | | | | | | | | | | |
reimbursements and recoupments(4) | | | 1.87 | % | | | 1.91 | % | | | 2.17 | % | | | 2.96 | % | | | 2.81 | % | | | 2.61 | % |
| | | | | | | | | | | | | | | | | | | | | | | | | |
Portfolio turnover rate(3) | | | 6.99 | % | | | 15.91 | % | | | 27.12 | % | | | 35.29 | % | | | 28.49 | % | | | 42.53 | % |
| (1) | Per share net investment income was calculated using the average shares outstanding method. |
| (2) | Rounds to less than 0.5 cent per share. |
| (3) | Not annualized for periods less than one year. |
| (4) | Annualized for periods less than one year. |
The accompanying notes are an integral part of these financial statements.
PERFORMANCE TRUST MUNICIPAL BOND FUND — FINANCIAL HIGHLIGHTS
Per Share Data for a Share Outstanding Throughout Each Period
| | | Six Months | | | Year | | | Year | | | Year | | | Year | | | Year | |
| | | Ended | | | Ended | | | Ended | | | Ended | | | Ended | | | Ended | |
| | February 28, 2022 | | | August 31, | | | August 31, | | | August 31, | | | August 31, | | | August 31, | |
| | | (Unaudited) | | | 2021 | | | 2020 | | | 2019 | | | 2018 | | | 2017 | |
| Class A Shares | | | | | | | | | | | | | | | | | | |
| | | | | | | | | | | | | | | | | | | |
| Net Asset Value, | | | | | | | | | | | | | | | | | | |
| Beginning of Period | | $ | 25.96 | | | $ | 25.54 | | | $ | 25.51 | | | $ | 23.81 | | | $ | 24.36 | | | $ | 24.91 | |
| | | | | | | | | | | | | | | | | | | | | | | | | |
| Income (loss) from | | | | | | | | | | | | | | | | | | | | | | | | |
| investment operations: | | | | | | | | | | | | | | | | | | | | | | | | |
Net investment income(1) | | | 0.21 | | | | 0.42 | | | | 0.48 | | | | 0.66 | | | | 0.61 | | | | 0.56 | |
| Net realized and unrealized | | | | | | | | | | | | | | | | | | | | | | | | |
| gain (loss) on investments | | | (1.05 | ) | | | 0.61 | | | | 0.22 | | | | 1.69 | | | | (0.55 | ) | | | (0.53 | ) |
| Total from investment operations | | | (0.84 | ) | | | 1.03 | | | | 0.70 | | | | 2.35 | | | | 0.06 | | | | 0.03 | |
| | | | | | | | | | | | | | | | | | | | | | | | | |
| Less distributions paid: | | | | | | | | | | | | | | | | | | | | | | | | |
| From net investment income | | | (0.21 | ) | | | (0.50 | ) | | | (0.60 | ) | | | (0.65 | ) | | | (0.61 | ) | | | (0.57 | ) |
| From return of capital | | | — | | | | (0.07 | ) | | | — | | | | — | | | | — | | | | — | |
| From net realized gain on investments | | | — | | | | (0.04 | ) | | | (0.07 | ) | | | — | | | | — | | | | (0.01 | ) |
| Total distributions paid | | | (0.21 | ) | | | (0.61 | ) | | | (0.67 | ) | | | (0.65 | ) | | | (0.61 | ) | | | (0.58 | ) |
| | | | | | | | | | | | | | | | | | | | | | | | | |
| Paid-in capital from | | | | | | | | | | | | | | | | | | | | | | | | |
| redemption fees (Note 2) | | | — | | | | — | | | | 0.00 | (2) | | | 0.00 | (2) | | | 0.00 | (2) | | | 0.00 | (2) |
| | | | | | | | | | | | | | | | | | | | | | | | | |
| Net Asset Value, End of Period | | $ | 24.91 | | | $ | 25.96 | | | $ | 25.54 | | | $ | 25.51 | | | $ | 23.81 | | | $ | 24.36 | |
| | | | | | | | | | | | | | | | | | | | | | | | | |
Total Return(3)(4) | | | -3.26 | % | | | 4.09 | % | | | 2.83 | % | | | 10.02 | % | | | 0.25 | % | | | 0.24 | % |
| | | | | | | | | | | | | | | | | | | | | | | | | |
| Supplemental Data and Ratios: | | | | | | | | | | | | | | | | | | | | | | | | |
| Net assets at end of Period (000’s) | | $ | 58,038 | | | $ | 55,918 | | | $ | 42,552 | | | $ | 22,141 | | | $ | 22,807 | | | $ | 25,495 | |
| | | | | | | | | | | | | | | | | | | | | | | | | |
| Ratio of expenses to | | | | | | | | | | | | | | | | | | | | | | | | |
| average net assets: | | | | | | | | | | | | | | | | | | | | | | | | |
| Before waiver, expense | | | | | | | | | | | | | | | | | | | | | | | | |
reimbursements and recoupments(5) | | | 0.72 | % | | | 0.74 | % | | | 0.78 | % | | | 0.82 | % | | | 0.85 | % | | | 0.80 | % |
| After waiver, expense | | | | | | | | | | | | | | | | | | | | | | | | |
reimbursements and recoupments(5) | | | 0.72 | % | | | 0.77 | % | | | 0.80 | % | | | 0.80 | % | | | 0.80 | % | | | 0.80 | % |
| | | | | | | | | | | | | | | | | | | | | | | | | |
| Ratio of net investment income | | | | | | | | | | | | | | | | | | | | | | | | |
| to average net assets: | | | | | | | | | | | | | | | | | | | | | | | | |
| Before waiver, expense | | | | | | | | | | | | | | | | | | | | | | | | |
reimbursements and recoupments(5) | | | 1.63 | % | | | 1.67 | % | | | 1.93 | % | | | 2.69 | % | | | 2.50 | % | | | 2.34 | % |
| After waiver, expense | | | | | | | | | | | | | | | | | | | | | | | | |
reimbursements and recoupments(5) | | | 1.63 | % | | | 1.64 | % | | | 1.91 | % | | | 2.71 | % | | | 2.55 | % | | | 2.34 | % |
| | | | | | | | | | | | | | | | | | | | | | | | | |
Portfolio turnover rate(4) | | | 6.99 | % | | | 15.91 | % | | | 27.12 | % | | | 35.29 | % | | | 28.49 | % | | | 42.53 | % |
| (1) | Per share net investment income was calculated using the average shares outstanding method. |
| (2) | Rounds to less than 0.5 cent per share. |
| (3) | Based on net asset value, which does not reflect sales charge. |
| (4) | Not annualized for periods less than one year. |
| (5) | Annualized for periods less than one year. |
The accompanying notes are an integral part of these financial statements.
PERFORMANCE TRUST CREDIT FUND — FINANCIAL HIGHLIGHTS
Per Share Data for a Share Outstanding Throughout Each Period
| | | Six Months | | | Period | |
| | | Ended | | | Ended | |
| | | February 28, 2022 | | | August 31, | |
| | | (Unaudited) | | | 2021(1) | |
| Institutional Class Shares | | | | | | |
| | | | | | | |
| Net Asset Value, Beginning of Period | | $ | 10.07 | | | $ | 10.00 | |
| | | | | | | | | |
| Income (loss) from investment operations: | | | | | | | | |
Net investment income(2) | | | 0.20 | | | | 0.39 | |
Net realized and unrealized gain (loss) on investments(3) | | | (0.46 | ) | | | 0.01 | |
| Total from investment operations | | | (0.26 | ) | | | 0.40 | |
| | | | | | | | | |
| Less distributions paid: | | | | | | | | |
| From net investment income | | | (0.22 | ) | | | (0.33 | ) |
| From net realized gain on investments | | | (0.01 | ) | | | — | |
| Total distributions paid | | | (0.23 | ) | | | (0.33 | ) |
| | | | | | | | | |
| Paid-in capital from redemption fees (Note 2) | | | — | | | | — | |
| | | | | | | | | |
| Net Asset Value, End of Period | | $ | 9.58 | | | $ | 10.07 | |
| | | | | | | | | |
Total Return(4) | | | -2.57 | % | | | 4.06 | % |
| | | | | | | | | |
| Supplemental Data and Ratios: | | | | | | | | |
| Net assets at end of Period (000’s) | | $ | 33,018 | | | $ | 13,025 | |
| | | | | | | | | |
| Ratio of expenses to average net assets: | | | | | | | | |
Before waiver and expense reimbursement(5) | | | 1.40 | % | | | 2.47 | % |
After waiver and expense reimbursement(5) | | | 0.99 | % | | | 0.99 | % |
| | | | | | | | | |
| Ratio of net investment income to average net assets: | | | | | | | | |
Before waiver and expense reimbursement(5) | | | 3.76 | % | | | 4.34 | % |
After waiver and expense reimbursement(5) | | | 4.17 | % | | | 5.82 | % |
| | | | | | | | | |
Portfolio turnover rate(4) | | | 33.96 | % | | | 109.25 | % |
| (1) | The inception date for the Fund was December 31, 2020 and investment operations commenced January 4, 2021. |
| (2) | Per share net investment income was calculated using the average shares outstanding method. |
| (3) | Realized gains and losses per share in the caption are balancing amounts necessary to reconcile the change in net asset value per share for the period, and may not reconcile with the aggregate gains and losses in the Statement of Operations due to share transactions for the period. |
| (4) | Not annualized for periods less than one year. |
| (5) | Annualized for periods less than one year. |
The accompanying notes are an integral part of these financial statements.
PERFORMANCE TRUST MUTUAL FUNDS – NOTES TO FINANCIAL STATEMENTS
February 28, 2022 (Unaudited)
| 1. | Organization |
| | Trust for Professional Managers (the “Trust”) was organized as a Delaware statutory trust under a Declaration of Trust dated May 29, 2001. The Trust is registered under the Investment Company Act of 1940, as amended (the “1940 Act”), as an open-end management investment company. The Performance Trust Mutual Funds (the “Funds”) are comprised of the Performance Trust Strategic Bond Fund (the “Strategic Bond Fund”), the Performance Trust Municipal Bond Fund (the “Municipal Bond Fund”), and the Performance Trust Credit Fund (the “Credit Fund”), each representing a distinct diversified series with its own investment objective and policies within the Trust. The investment objective of the Strategic Bond Fund is to purchase undervalued fixed-income assets and achieve investment returns through interest income and potential capital appreciation. The investment objective of the Municipal Bond Fund is to provide a high level of current interest income that is substantially exempt from regular federal income taxes and is consistent with preservation of capital. The investment objective of the Credit Fund is to achieve long-term investment returns primarily by investing in a portfolio of income producing securities that may have the potential for capital appreciation. The Trust may issue an unlimited number of shares of beneficial interest at $0.001 par value. The assets of the Funds are segregated, and a shareholder’s interest is limited to the Fund in which shares are held. The Institutional Class shares of the Strategic Bond Fund commenced investment operations on September 1, 2010. The Class A and Class C shares of the Strategic Bond Fund commenced investment operations on January 2, 2019. The Municipal Bond Fund commenced investment operations on June 30, 2011 and September 28, 2012 for the Institutional Class and Class A shares, respectively. The Institutional Class shares of the Credit Fund commenced investment operations on January 4, 2021. Effective January 2, 2019, the Retail Class shares of the Municipal Bond Fund were redesignated as Class A shares. Class A shares are subject to an initial maximum sales charge of 2.25% imposed at the time of purchase. The sales charge declines as the amount purchased increases in accordance with the Funds’ current prospectus. Class A shares are subject to a 0.25% Rule 12b-1 distribution and service fee. Class C shares are subject to a 1.00% Rule 12b-1 distribution and service fee. Each class of shares has identical rights and privileges except with respect to distribution fees, and voting rights on matters affecting a single class of shares. Costs incurred by the Funds in connection with the organization and the initial public offering of shares were paid by PT Asset Management, LLC (the “Adviser”), the Funds’ investment adviser. The Funds are investment companies and accordingly follow the investment company accounting and reporting guidance of the Financial Accounting Standards Board (“FASB”) Accounting Standard Codification Topic 946 Financial Services—Investment Companies. |
| | |
| 2. | Significant Accounting Policies |
| | The following is a summary of significant accounting policies consistently followed by the Funds in the preparation of the financial statements. These policies are in conformity with generally accepted accounting principles in the United States of America (“GAAP”). |
| | |
| a. | Investment Valuation |
| | Each equity security owned by a Fund that is listed on a securities exchange, except securities listed on the NASDAQ Stock Market, LLC (“NASDAQ”), is valued at its last sale price at the close of that exchange on the date as of which assets are valued. If the security is listed on more than one exchange, a Fund will use the price of the exchange that the Fund generally considers to be the principal exchange on which the security is traded. Portfolio securities listed on NASDAQ will be valued at the NASDAQ Official Closing Price, which may not necessarily represent the last sale price. If there has been no sale on such exchange or on NASDAQ on such day, the security is valued at the mean between the most recent quoted bid and asked prices on such day or the security shall be valued at the latest sales price on the “composite market” for the day such security is being valued. The composite market is defined as a consolidation of the trade information provided by national securities and foreign exchanges and over-the-counter markets as published by an approved independent pricing service (a “Pricing Service”). |
| | |
| | Debt securities, such as U.S. government securities, corporate securities, municipal securities and asset-backed and mortgage-backed securities, including short-term debt instruments having a maturity of 60 days or less, are valued at the mean in accordance with prices supplied by a Pricing Service. Pricing Services may use various valuation methodologies such as the mean between the bid and the asked prices, matrix pricing and other analytical pricing models as well as market transactions and dealer quotations. If a price is not available from a Pricing Service, the most recent quotation obtained from one or more broker-dealers known to follow the issue will be obtained. Quotations will be valued at the mean between the bid and the offer. In the absence of available quotations, the securities will be priced at fair value. Any discount or premium is accreted or amortized over the expected life of the respective security using the constant yield to maturity method. Pricing Services generally value debt securities assuming orderly transactions of an institutional round lot size, but such securities may be held or transactions may be conducted in such securities in smaller, odd lot sizes. Odd lots often trade at lower prices than institutional round lots. |
| | |
| | Money market funds, demand notes and repurchase agreements are valued at cost. If cost does not represent current market value the securities will be priced at fair value. |
| | |
| | Redeemable securities issued by open-end, registered investment companies are valued at the net asset value (“NAV”) of such companies for purchase and/or redemption orders placed on that day. If, on a particular day, a share of an investment company is not listed on NASDAQ, such security’s fair value will be determined. All exchange-traded funds are valued at the last reported sale price on the exchange on which the security is principally traded. In the event market quotations are not readily available, such security will be valued at its fair value, discussed below. |
| | |
| | If market quotations are not readily available, a security or other asset will be valued at its fair value as determined under fair value pricing procedures approved by the Board of Trustees. These fair value pricing procedures will also be used to price a security when corporate events, events in the securities market and/or world events cause the Adviser to believe that a security’s last sale price may not reflect its actual market value. The intended effect of using fair value pricing procedures is to ensure that the Funds are accurately priced. The Board of Trustees will regularly evaluate whether the Funds’ fair value pricing procedures continue to be appropriate in light of the specific circumstances of the Funds and the quality of prices obtained through the application of such procedures by the Trust’s valuation committee. |
| | |
| | FASB Accounting Standards Codification, Fair Value Measurements and Disclosures Topic 820 (“ASC 820”), establishes an authoritative definition of fair value and sets out a hierarchy for measuring fair value. ASC 820 requires an entity to evaluate certain factors to determine whether there has been a significant decrease in volume and level of activity for the security such that recent transactions and quoted |
PERFORMANCE TRUST MUTUAL FUNDS – NOTES TO FINANCIAL STATEMENTS (CONT.)
February 28, 2022 (Unaudited)
| | prices may not be determinative of fair value and further analysis and adjustment may be necessary to estimate fair value. ASC 820 also requires enhanced disclosure regarding the inputs and valuation techniques used to measure fair value as well as expanded disclosure of valuation levels for each class of investments. These inputs are summarized in the three broad levels listed below: |
| | » | Level 1: Quoted prices in active markets for identical securities. |
| | » | Level 2: Other significant observable inputs (including quoted prices for similar securities, interest rates, prepayment speeds, credit risk, etc.). |
| | » | Level 3: Significant unobservable inputs (including a Fund’s own assumptions in determining the fair value of investments). |
| | The inputs or methodology used for valuing securities are not necessarily an indication of the risk associated with investing in those securities. The following is a summary of the inputs used to value the Funds’ investments carried at fair value as of February 28, 2022: |
| | Performance Trust Strategic Bond Fund | | | | | | | | | | | | |
| | | | Level 1 | | | Level 2 | | | Level 3 | | | Total | |
| | Fixed Income: | | | | | | | | | | | | |
| | Asset Backed | | | | | | | | | | | | |
| | Securities | | $ | — | | | $ | 26,072,731 | | | $ | — | | | $ | 26,072,731 | |
| | Collateralized | | | | | | | | | | | | | | | | |
| | Loan | | | | | | | | | | | | | | | | |
| | Obligations | | | — | | | | 473,806,751 | | | | — | | | | 473,806,751 | |
| | Corporate | | | | | | | | | | | | | | | | |
| | Bonds | | | — | | | | 1,608,915,417 | | | | — | | | | 1,608,915,417 | |
| | Non – | | | | | | | | | | | | | | | | |
| | Agency | | | | | | | | | | | | | | | | |
| | Residential | | | | | | | | | | | | | | | | |
| | Mortgage | | | | | | | | | | | | | | | | |
| | Backed | | | | | | | | | | | | | | | | |
| | Securities | | | — | | | | 678,489,401 | | | | — | | | | 678,489,401 | |
| | Non – | | | | | | | | | | | | | | | | |
| | Agency | | | | | | | | | | | | | | | | |
| | Commercial | | | | | | | | | | | | | | | | |
| | Mortgage | | | | | | | | | | | | | | | | |
| | Backed | | | | | | | | | | | | | | | | |
| | Securities | | | — | | | | 1,223,794,765 | | | | — | | | | 1,223,794,765 | |
| | Agency | | | | | | | | | | | | | | | | |
| | Commercial | | | | | | | | | | | | | | | | |
| | Mortgage | | | | | | | | | | | | | | | | |
| | Backed | | | | | | | | | | | | | | | | |
| | Securities | | | — | | | | 499,975,476 | | | | — | | | | 499,975,476 | |
| | Municipal | | | | | | | | | | | | | | | | |
| | Bonds | | | — | | | | 1,888,263,398 | | | | — | | | | 1,888,263,398 | |
| | Government | | | | | | | | | | | | | | | | |
| | Security & | | | | | | | | | | | | | | | | |
| | Agency | | | | | | | | | | | | | | | | |
| | Issues | | | — | | | | 4,655,926 | | | | — | | | | 4,655,926 | |
| | US | | | | | | | | | | | | | | | | |
| | Government | | | | | | | | | | | | | | | | |
| | Notes/Bonds | | | — | | | | 173,420,899 | | | | — | | | | 173,420,899 | |
| | Total Fixed | | | | | | | | | | | | | | | | |
| | Income: | | | — | | | | 6,577,394,764 | | | | — | | | | 6,577,394,764 | |
| | Equity: | | | | | | | | | | | | | | | | |
| | Short-Term | | | | | | | | | | | | | | | | |
| | Investments | | | 86,528,728 | | | | — | | | | — | | | | 86,528,728 | |
| | Total | | | | | | | | | | | | | | | | |
| | Short-Term | | | | | | | | | | | | | | | | |
| | Investments | | | 86,528,728 | | | | — | | | | — | | | | 86,528,728 | |
| | Total | | | | | | | | | | | | | | | | |
| | Investments | | | | | | | | | | | | | | | | |
| | in Securities | | $ | 86,528,728 | | | $ | 6,577,394,764 | | | $ | — | | | $ | 6,663,923,492 | |
| | | | | | | | | | | | | | | | | | |
| | Performance Trust Municipal Bond Fund | | | | | | | | | | | | | | | | |
| | | | Level 1 | | | Level 2 | | | Level 3 | | | Total | |
| | Fixed Income: | | | | | | | | | | | | | | | | |
| | Agency | | | | | | | | | | | | | | | | |
| | Commercial | | | | | | | | | | | | | | | | |
| | Mortgage | | | | | | | | | | | | | | | | |
| | Backed | | | | | | | | | | | | | | | | |
| | Securities | | $ | — | | | $ | 21,448,879 | | | $ | — | | | $ | 21,448,879 | |
| | Non-Agency | | | | | | | | | | | | | | | | |
| | Commercial | | | | | | | | | | | | | | | | |
| | Mortgage | | | | | | | | | | | | | | | | |
| | Backed | | | | | | | | | | | | | | | | |
| | Securities | | | — | | | | 10,285,170 | | | | — | | | | 10,285,170 | |
| | Municipal | | | | | | | | | | | | | | | | |
| | Bonds | | | — | | | | 893,020,403 | | | | — | | | | 893,020,403 | |
| | Total Fixed | | | | | | | | | | | | | | | | |
| | Income: | | | — | | | | 924,754,452 | | | | — | | | | 924,754,452 | |
| | Short-Term | | | | | | | | | | | | | | | | |
| | Investments | | | 20,767,446 | | | | — | | | | — | | | | 20,767,446 | |
| | Total | | | | | | | | | | | | | | | | |
| | Short-Term | | | | | | | | | | | | | | | | |
| | Investments | | | 20,767,446 | | | | — | | | | — | | | | 20,767,446 | |
| | Total | | | | | | | | | | | | | | | | |
| | Investments | | | | | | | | | | | | | | | | |
| | in Securities | | $ | 20,767,446 | | | $ | 924,754,452 | | | $ | — | | | $ | 945,521,898 | |
| | | | | | | | | | | | | | | | | | |
| | Performance Trust Credit Fund | | | | | | | | | | | | | | | | |
| | | | Level 1 | | | Level 2 | | | Level 3 | | | Total | |
| | Fixed Income: | | | | | | | | | | | | | | | | |
| | Collateralized | | | | | | | | | | | | | | | | |
| | Loan | | | | | | | | | | | | | | | | |
| | Obligations | | $ | — | | | $ | 3,036,512 | | | $ | — | | | $ | 3,036,512 | |
| | Corporate | | | | | | | | | | | | | | | | |
| | Bonds | | | — | | | | 14,758,340 | | | | — | | | | 14,758,340 | |
| | Non – Agency | | | | | | | | | | | | | | | | |
| | Residential | | | | | | | | | | | | | | | | |
| | Mortgage | | | | | | | | | | | | | | | | |
| | Backed | | | | | | | | | | | | | | | | |
| | Securities | | | — | | | | 1,894,480 | | | | — | | | | 1,894,480 | |
| | Non – Agency | | | | | | | | | | | | | | | | |
| | Commercial | | | | | | | | | | | | | | | | |
| | Mortgage | | | | | | | | | | | | | | | | |
| | Backed | | | | | | | | | | | | | | | | |
| | Securities | | | — | | | | 7,980,013 | | | | — | | | | 7,980,013 | |
| | Agency | | | | | | | | | | | | | | | | |
| | Commercial | | | | | | | | | | | | | | | | |
| | Mortgage | | | | | | | | | | | | | | | | |
| | Backed | | | | | | | | | | | | | | | | |
| | Securities | | | — | | | | 1,052,400 | | | | — | | | | 1,052,400 | |
| | Municipal | | | | | | | | | | | | | | | | |
| | Bonds | | | — | | | | 3,355,436 | | | | — | | | | 3,355,436 | |
| | US | | | | | | | | | | | | | | | | |
| | Government | | | | | | | | | | | | | | | | |
| | Notes/Bonds | | | — | | | | 867,525 | | | | — | | | | 867,525 | |
| | Total Fixed | | | | | | | | | | | | | | | | |
| | Income: | | | — | | | | 32,944,706 | | | | — | | | | 32,944,706 | |
| | Short-Term | | | | | | | | | | | | | | | | |
| | Investments | | | 229,989 | | | | — | | | | — | | | | 229,989 | |
| | Total | | | | | | | | | | | | | | | | |
| | Short-Term | | | | | | | | | | | | | | | | |
| | Investments | | | 229,989 | | | | — | | | | — | | | | 229,989 | |
| | Total | | | | | | | | | | | | | | | | |
| | Investments | | | | | | | | | | | | | | | | |
| | in Securities | | $ | 229,989 | | | $ | 32,944,706 | | | $ | — | | | $ | 33,174,695 | |
| | The Funds did not hold any Level 3 securities during the six months ended February 28, 2022. |
| | |
| | The Funds did not hold any financial derivative instruments during the six months ended February 28, 2022. |
PERFORMANCE TRUST MUTUAL FUNDS – NOTES TO FINANCIAL STATEMENTS (CONT.)
February 28, 2022 (Unaudited)
| b. | Short Positions |
| | The Funds may sell a security they do not own in anticipation of a decline in the fair value of that security. When a Fund sells a security short, it must borrow the security sold short and deliver it to the broker-dealer through which it made the short sale. A gain, limited to the price at which a Fund sold the security short, or a loss, unlimited in size, will be recognized upon the termination of a short sale. The Funds are liable for any dividends or interest payable on securities while those securities are in a short position. Such amounts are recorded on the ex-dividend date as a dividend expense. As collateral for its short positions, the Funds are required under the 1940 Act to maintain segregated assets consisting of cash, cash equivalents or liquid securities. The segregated assets are valued consistent with Note 2a above. The amount of segregated assets are required to be adjusted daily to reflect changes in the fair value of the securities sold short. As of February 28, 2022, the Funds did not have any open short positions and accordingly did not have securities or cash held as collateral. |
| | |
| c. | Federal Income Taxes |
| | The Funds intend to comply with the requirements of Subchapter M of the Internal Revenue Code of 1986, as amended (the “Code”) necessary to qualify as a regulated investment company and to make the requisite distributions of income and capital gains to their shareholders sufficient to relieve them from all or substantially all federal income taxes. Therefore, no federal income tax provision has been provided. |
| | As of and during the six months ended February 28, 2022, the Funds did not have a liability for any unrecognized tax benefits. The Funds recognize interest and penalties, if any, related to uncertain tax benefits as income tax expense in the Statements of Operations. During the six months ended February 28, 2022, the Funds did not incur any interest or penalties. The Funds are not subject to examination by U.S. taxing authorities for the tax periods prior to the year ended August 31, 2018. |
| | |
| d. | Distributions to Shareholders |
| | The Funds will distribute any net investment income monthly. The Funds will distribute any net realized long- or short-term capital gains at least annually. Distributions from net realized gains for book purposes may include short-term capital gains. All short-term capital gains are included in ordinary income for tax purposes. Distributions to shareholders are recorded on the ex-dividend date. The Funds may also pay a special distribution at the end of the calendar year to comply with federal tax requirements. Income and capital gain distributions may differ from GAAP, primarily due to timing differences in the recognition of income, gains and losses by the Funds. To the extent that these differences are attributable to permanent book and tax accounting differences, the components of net assets have been adjusted. |
| | |
| e. | Use of Estimates |
| | The preparation of financial statements in conformity with GAAP requires management to make estimates and assumptions that affect the reported amounts of assets and liabilities and disclosure of contingent assets and liabilities at the date of the financial statements and the reported amounts of revenues and expenses during the reporting period. Actual results could differ from those estimates. |
| | |
| f. | Share Valuation |
| | The NAV per share of a Fund is calculated by dividing the sum of the value of the securities held by the Fund, plus cash or other assets, minus all liabilities (including estimated accrued expenses) by the total number of shares outstanding for the Fund, rounded to the nearest cent. The Funds’ shares will not be priced on the days on which the New York Stock Exchange (“NYSE”) is closed for trading. The Strategic Bond Fund and the Municipal Bond Fund charged a 2.00% redemption fee on shares redeemed within sixty days of purchase through December 28, 2019. These fees were deducted from the redemption proceeds otherwise payable to the shareholder. Effective December 29, 2019, the Strategic Bond Fund and the Municipal Bond Fund eliminated the redemption fees. |
| | |
| g. | Allocation of Income, Expenses and Gains/Losses |
| | Income, expenses (other than those deemed attributable to a specific share class), and gains and losses of each Fund are allocated daily to each class of shares based upon the ratio of net assets represented by each class as a percentage of the net assets of the Fund. Expenses deemed directly attributable to a class of shares are recorded by the specific class. Most expenses are allocated by class based on relative net assets. Distribution and service (Rule 12b-1) fees are expensed at 0.25% of average daily net assets of the Class A shares of the Strategic Bond Fund and the Municipal Bond Fund and 0.75% of average daily net assets of the Class C shares of the Strategic Bond Fund. Shareholder servicing fees are expensed at 0.25% of average daily net assets of Class C shares of the Strategic Bond Fund. Expenses associated with a specific fund in the Trust are charged to that fund. Common expenses of the Trust are typically allocated evenly between the funds of the Trust, or by other equitable means. |
| | |
| h. | Other |
| | Investment transactions are recorded on the trade date. The Funds determine the gain or loss from investment transactions on an identified cost basis by comparing the original cost of the security lot sold with the net sale proceeds. Dividend income, less foreign withholding tax, is recognized on the ex-dividend date and interest income is recognized on an accrual basis. Discounts, premiums and interest only strips are accreted or amortized over the expected life of the respective securities using the constant yield method. Gains and losses on principal payments and short-falls of mortgage backed securities (paydown gains and losses) are included as an adjustment to interest income in the Statements of Operations. |
| | |
| 3. | Federal Tax Matters |
| | The tax character of distributions paid during the years ended August 31, 2021 and August 31, 2020 was as follows: |
| | |
| | PERFORMANCE TRUST STRATEGIC BOND FUND |
| | | | YEAR ENDED | | | YEAR ENDED | |
| | | | AUGUST 31, 2021 | | | AUGUST 31, 2020 | |
| | Ordinary Income | | $ | 187,694,195 | | | $ | 133,781,747 | |
| | Tax-Exempt Income | | | — | | | | — | |
| | Long-Term Capital Gain | | | — | | | | — | |
| | Return of Capital | | | — | | | | — | |
| | | | | | | | | | |
| | PERFORMANCE TRUST MUNICIPAL BOND FUND | | | | | | | | |
| | | | YEAR ENDED | | | YEAR ENDED | |
| | | | AUGUST 31, 2021 | | | AUGUST 31, 2020 | |
| | Ordinary Income | | $ | 3,035,732 | | | $ | 1,467,792 | |
| | Tax-Exempt Income | | | 11,352,033 | | | | 7,749,897 | |
| | Long-Term Capital Gain | | | 1,938,135 | | | | 2,490,218 | |
| | Return of Capital | | | 2,191,897 | | | | — | |
PERFORMANCE TRUST MUTUAL FUNDS – NOTES TO FINANCIAL STATEMENTS (CONT.)
February 28, 2022 (Unaudited)
| | PERFORMANCE TRUST CREDIT FUND | | | | | | |
| | | | YEAR ENDED | | | YEAR ENDED | |
| | | | AUGUST 31, 2021 | | | AUGUST 31, 2020 | |
| | Ordinary Income | | $ | 360,597 | | | | N/A | |
| | Tax-Exempt Income | | | — | | | | N/A | |
| | Long-Term Capital Gain | | | — | | | | N/A | |
| | Return of Capital | | | — | | | | N/A | |
| | As of August 31, 2021, the components of distributable earnings (accumulated losses) on a tax basis were as follows: |
| | PERFORMANCE TRUST STRATEGIC BOND FUND | | | |
| | Cost basis of investments for federal | | | |
| | income tax purposes | | $ | 6,336,655,473 | |
| | Gross tax unrealized appreciation | | $ | 190,168,950 | |
| | Gross tax unrealized depreciation | | | (109,040,235 | ) |
| | Net tax unrealized appreciation | | | 81,128,715 | |
| | Undistributed ordinary income | | | 6,045,973 | |
| | Undistributed long-term capital gain | | | 14,023,723 | |
| | Total distributable earnings | | | 20,069,696 | |
| | Other accumulated losses | | | — | |
| | Total accumulated gains | | $ | 101,198,411 | |
| | | | | | |
| | PERFORMANCE TRUST MUNICIPAL BOND FUND | | | | |
| | Cost basis of investments for federal | | | | |
| | income tax purposes | | $ | 842,317,436 | |
| | Gross tax unrealized appreciation | | $ | 40,639,431 | |
| | Gross tax unrealized depreciation | | | (1,857,979 | ) |
| | Net tax unrealized appreciation | | | 38,781,452 | |
| | Undistributed ordinary income | | | — | |
| | Undistributed long-term capital gain | | | — | |
| | Total distributable earnings | | | — | |
| | Other accumulated losses | | | (197,852 | ) |
| | Total accumulated gains | | $ | 38,583,600 | |
| | | | | | |
| | PERFORMANCE TRUST CREDIT BOND FUND | | | | |
| | Cost basis of investments for federal | | | | |
| | income tax purposes | | $ | 1,405,209 | |
| | Gross tax unrealized appreciation | | $ | 158,043 | |
| | Gross tax unrealized depreciation | | | (150,428 | ) |
| | Net tax unrealized appreciation | | | 7,615 | |
| | Undistributed ordinary income | | | 93,008 | |
| | Undistributed long-term capital gain | | | — | |
| | Total distributable earnings | | | 93,008 | |
| | Other accumulated losses | | | — | |
| | Total accumulated gains | | $ | 100,623 | |
| | The difference between book-basis and tax-basis unrealized appreciation (depreciation) is attributable primarily to the tax deferral of losses on wash sale adjustments and non-REIT return of capital. |
| | |
| | During the year ended August 31, 2021, short-term capital loss carryovers of $1,195,149 were utilized by the Strategic Bond Fund. |
| | |
| | At August 31, 2021, the Municipal Bond Fund deferred, on tax basis, post October losses of $197,852. |
| | |
| | GAAP requires that certain components of net assets relating to permanent differences be reclassified between financial and tax reporting. These reclassifications are due to equalization and book versus tax treatment of callable bonds and have no effect on net assets or NAV per share. For the year ended August 31, 2021, the following reclassifications were made for permanent tax differences on the Statements of Assets and Liabilities: |
| | | | STRATEGIC | | | MUNICIPAL | | | CREDIT | |
| | | | BOND FUND | | | BOND FUND | | | FUND | |
| | Total | | | | | | | | | |
| | distributable | | | | | | | | | |
| | earnings | | $ | (1,074,033 | ) | | $ | — | | | $ | — | |
| | Paid-in capital | | $ | 1,074,033 | | | $ | — | | | $ | — | |
| 4. | Investment Adviser |
| | The Trust has an Investment Advisory Agreement (the “Agreement”) with the Adviser to furnish investment advisory services to the Funds. Under the terms of the Agreement, the Funds compensate the Adviser for its management services at the annual rate of 0.60% for the Strategic Bond Fund, 0.40% for the Municipal Bond Fund, and 0.80% for the Credit Fund of the respective Fund’s average daily net assets. |
| | |
| | The Adviser has contractually agreed to waive its management fee and/or reimburse Fund expenses at the discretion of the Adviser and the Board of Trustees, to the extent necessary to ensure that the total annual Fund operating expenses (exclusive of front-end or contingent deferred sales loads, Rule 12b-1 plan fees, shareholder servicing plan fees, taxes, leverage (i.e., any expenses incurred in connection with borrowings made by a Fund), interest (including interest incurred in connection with bank and custody overdrafts), brokerage commissions and other transactional expenses, expenses incurred in connection with any merger or reorganization, dividends or interest expense on short positions, acquired fund fees and expenses and extraordinary expenses such as litigation) do not exceed 0.95%, 0.55%, and 0.99% (the “Expense Limitation Cap”) of the average daily net assets of the Strategic Bond Fund, Municipal Bond Fund, and Credit Fund, respectively. The operating expense limitation agreement is in place at least through December 29, 2022 for the Strategic Bond Fund and Municipal Bond Fund and at least through December 31, 2023 for the Credit Fund. Any such waiver or reimbursement is subject to later adjustment to allow the Adviser to recover amounts waived or reimbursed to the extent actual fees and expenses for a fiscal period do not exceed the lesser of: (1) the Expense Limitation Cap in place at the time of the waiver and/or reimbursement; or (2) the Expense Limitation Cap in place at the time of recovery; provided, however, that the Adviser shall only be entitled to recover such amounts for a period of up to three years from the date such amount was waived or reimbursed. |
| | |
| | The following table shows the remaining waived or reimbursed expenses subject to potential recovery expiring by: |
| | | | STRATEGIC | | | MUNICIPAL | | | CREDIT | |
| | | | BOND FUND | | | BOND FUND | | | FUND | |
| | August 31, 2022 | | $ | — | | | $ | — | | | $ | — | |
| | August 31, 2023 | | $ | — | | | $ | — | | | $ | — | |
| | August 31, 2024 | | $ | — | | | $ | — | | | $ | 102,789 | |
| | February 28, 2025 | | $ | — | | | $ | — | | | $ | 51,172 | |
| 5. | Distribution and Shareholder Servicing Plan |
| | The Trust has adopted a plan pursuant to Rule 12b-1 under the 1940 Act (the “12b-1 Plan”) on behalf of the Strategic Bond Fund and the Municipal Bond Fund, which authorize the Funds to pay Foreside Fund Services, LLC (the “Distributor”) a distribution fee of 0.25% of each Fund’s average daily net assets of Class A shares and 0.75% of the Strategic Bond Fund’s average daily net assets for Class C shares, for services to prospective Fund shareholders and distribution of Fund shares, and 0.25% of the Strategic Bond Fund’s average daily |
PERFORMANCE TRUST MUTUAL FUNDS – NOTES TO FINANCIAL STATEMENTS (CONT.)
February 28, 2022 (Unaudited)
| | net assets of Class C shares for shareholder servicing, as applicable. During the six months ended February 28, 2022, the Funds accrued expenses pursuant to the 12b-1 Plan as follows: |
| | | | | | | Shareholder | |
| | | | 12b-1 Fees | | | Servicing Fees | |
| | Strategic Bond Fund | | | | | | |
| | Class A | | $ | 41,556 | | | | N/A | |
| | Class C | | $ | 220,667 | | | $ | 73,555 | |
| | Municipal Bond Fund | | | | | | | | |
| | Class A | | $ | 72,001 | | | | N/A | |
| 6. | Related Party Transactions |
| | U.S. Bancorp Fund Services, LLC (doing business as U.S. Bank Global Fund Services (“Fund Services”)) acts as the Funds’ administrator and fund accountant under an Administration Agreement. Fund Services performs various administrative and accounting services including: preparing various federal and state regulatory filings, reports and returns for the Funds; preparing reports and materials to be supplied to the Trustees; monitoring the activities of the Funds’ custodian, transfer agent and accountants; coordinating the preparation and payment of the Funds’ expenses; and reviewing the Funds’ expense accruals. Fund Services also serves as the transfer agent to the Funds. U.S. Bank, N.A. (“U.S. Bank”), an affiliate of Fund Services, serves as each Fund’s custodian. Fees incurred for the six months ended February 28, 2022, and owed as of February 28, 2022, are as follows: |
| | Administration | | | | | | |
| | and Accounting | | Incurred | | | Owed | |
| | Strategic Bond Fund | | $ | 1,133,464 | | | $ | 393,272 | |
| | Municipal Bond Fund | | | 171,394 | | | | 59,378 | |
| | Credit Fund | | | 12,371 | | | | 7,763 | |
| | | | | | | | | | |
| | Transfer Agency | | Incurred | | | Owed | |
| | Strategic Bond Fund | | $ | 352,271 | (1) | | $ | 122,057 | (1) |
| | Municipal Bond Fund | | | 52,720 | | | | 17,163 | |
| | Credit Fund | | | 6,632 | | | | 4,157 | |
| | | | | | | | | | |
| | (1) This amount does not include sub-transfer agency fees. | | | | | | | | |
| | | | | | | | | | |
| | Custody | | Incurred | | | Owed | |
| | Strategic Bond Fund | | $ | 144,426 | | | $ | 49,765 | |
| | Municipal Bond Fund | | | 19,095 | | | | 6,896 | |
| | Credit Fund | | | 2,830 | | | | 776 | |
| | The Funds each have a line of credit with US Bank (see Note 10). |
| | |
| | Certain officers of the Funds are also employees of Fund Services. A Trustee of the Trust is affiliated with Fund Services and U.S. Bank. |
| | |
| | The Trust’s Chief Compliance Officer is also an employee of Fund Services. Each Fund’s allocation of the Trust’s Chief Compliance Officer fee incurred for the six months ended February 28, 2022, and owed as of February 28, 2022, are as follows: |
| | | | Incurred | | | Owed | |
| | Strategic Bond Fund | | $ | 5,792 | | | $ | 1,906 | |
| | Municipal Bond Fund | | | 5,792 | | | | 1,906 | |
| | Credit Fund | | | 5,792 | | | | 1,901 | |
| 7. | Capital Share Transactions |
| | Transactions in shares of the Funds were as follows: |
| | |
| | STRATEGIC BOND FUND – INSTITUTIONAL CLASS |
| | | | SIX MONTHS ENDED | | | YEAR ENDED | |
| | | | FEBRUARY 28, 2022 | | | AUGUST 31, 2021 | |
| | Shares sold | | | 65,888,637 | | | | 132,683,016 | |
| | Shares issued | | | | | | | | |
| | to holders in | | | | | | | | |
| | reinvestment | | | | | | | | |
| | of distributions | | | 4,661,099 | | | | 7,046,695 | |
| | Shares redeemed | | | (43,083,336 | ) | | | (52,194,718 | ) |
| | Net increase | | | 27,466,400 | | | | 87,534,993 | |
| | | | | | | | | | |
| | STRATEGIC BOND FUND – CLASS A | | | | | | | | |
| | | | SIX MONTHS ENDED | | | YEAR ENDED | |
| | | | FEBRUARY 28, 2022 | | | AUGUST 31, 2021 | |
| | Shares sold | | | 580,532 | | | | 1,066,414 | |
| | Shares issued | | | | | | | | |
| | to holders in | | | | | | | | |
| | reinvestment | | | | | | | | |
| | of distributions | | | 25,090 | | | | 41,290 | |
| | Shares redeemed | | | (345,563 | ) | | | (531,640 | ) |
| | Net increase | | | 260,059 | | | | 576,064 | |
| | | | | | | | | | |
| | STRATEGIC BOND FUND – CLASS C | | | | | | | | |
| | | | SIX MONTHS ENDED | | | YEAR ENDED | |
| | | | FEBRUARY 28, 2022 | | | AUGUST 31, 2021 | |
| | Shares sold | | | 443,940 | | | | 1,434,889 | |
| | Shares issued | | | | | | | | |
| | to holders in | | | | | | | | |
| | reinvestment | | | | | | | | |
| | of distributions | | | 34,871 | | | | 49,565 | |
| | Shares redeemed | | | (323,247 | ) | | | (393,333 | ) |
| | Net increase | | | 155,564 | | | | 1,091,121 | |
| | | | | | | | | | |
| | MUNICIPAL BOND FUND – INSTITUTIONAL CLASS | | | | | | | | |
| | | | SIX MONTHS ENDED | | | YEAR ENDED | |
| | | | FEBRUARY 28, 2022 | | | AUGUST 31, 2021 | |
| | Shares sold | | | 7,883,203 | | | | 15,992,833 | |
| | Shares issued | | | | | | | | |
| | to holders in | | | | | | | | |
| | reinvestment | | | | | | | | |
| | of distributions | | | 284,020 | | | | 595,759 | |
| | Shares redeemed | | | (4,236,647 | ) | | | (4,622,606 | ) |
| | Net increase | | | 3,930,576 | | | | 11,965,986 | |
| | | | | | | | | | |
| | MUNICIPAL BOND FUND – CLASS A | | | | | | | | |
| | | | SIX MONTHS ENDED | | | YEAR ENDED | |
| | | | FEBRUARY 28, 2022 | | | AUGUST 31, 2021 | |
| | Shares sold | | | 633,717 | | | | 1,203,433 | |
| | Shares issued | | | | | | | | |
| | to holders in | | | | | | | | |
| | reinvestment | | | | | | | | |
| | of distributions | | | 17,276 | | | | 44,651 | |
| | Shares redeemed | | | (474,772 | ) | | | (759,937 | ) |
| | Net increase | | | 176,221 | | | | 488,147 | |
PERFORMANCE TRUST MUTUAL FUNDS – NOTES TO FINANCIAL STATEMENTS (CONT.)
February 28, 2022 (Unaudited)
| | CREDIT FUND – INSTITUTIONAL CLASS | | | | | | |
| | | | SIX MONTHS ENDED | | | PERIOD ENDED | |
| | | | FEBRUARY 28, 2022 | | | AUGUST 31, 2021(1) | |
| | Shares sold | | | 2,254,611 | | | | 1,277,485 | |
| | Shares issued | | | | | | | | |
| | to holders in | | | | | | | | |
| | reinvestment | | | | | | | | |
| | of distributions | | | 56,447 | | | | 35,675 | |
| | Shares redeemed | | | (156,504 | ) | | | (20,093 | ) |
| | Net increase | | | 2,154,554 | | | | 1,293,067 | |
| | (1) | The inception date for the Fund was December 31, 2020 and investment operations commenced January 4, 2021. |
| 8. | Investment Transactions |
| | The aggregate purchases and sales of securities, excluding short-term investments, for the Funds for the six months ended February 28, 2022, are summarized below. |
| | | | STRATEGIC | | | MUNICIPAL | | | CREDIT | |
| | | | BOND FUND | | | BOND FUND | | | FUND | |
| | Purchases | | | | | | | | | |
| | U.S. Government | | $ | 178,454,896 | | | $ | — | | | $ | 2,847,060 | |
| | Other | | | 2,016,200,228 | | | | 184,371,818 | | | | 26,986,698 | |
| | Sales | | | | | | | | | | | | |
| | U.S. Government | | $ | 64,767,846 | | | $ | — | | | $ | 586,546 | |
| | Other | | | 1,410,062,541 | | | | 62,942,225 | | | | 7,784,669 | |
| 9. | Beneficial Ownership |
| | The beneficial ownership, either directly or indirectly, of more than 25% of the voting securities of a fund creates a presumption of control of a fund, under Section 2(a)(9) of the 1940 Act. At February 28, 2022, Raymond James and Morgan Stanley Smith Barney, LLC held 40.40% and 34.02%, respectively, of the Strategic Bond Fund’s outstanding Class A shares for the benefit of their customers. At February 28, 2022, Morgan Stanley Smith Barney, LLC and Raymond James held 44.91% and 35.15%, respectively, of the Strategic Bond Fund’s outstanding Class C shares for the benefit of their customers. At February 28, 2022, Charles Schwab & Company, Inc. held 27.31% of the Strategic Bond Fund’s outstanding Institutional Class shares for the benefit of its customers. At February 28, 2022, Charles Schwab & Company, Inc. held 26.67% of the Municipal Bond Fund’s outstanding Institutional Class shares for the benefit of its customers. At February 28, 2022, Charles Schwab & Company, Inc. held 63.18% of the Municipal Bond Fund’s outstanding Class A shares for the benefit of its customers. At February 28, 2022, Charles Schwab & Company, Inc held 49.45% of the Credit Fund’s outstanding Institutional Class shares for the benefit of its customers,. |
| | |
| 10. | Line of Credit |
| | At February 28, 2022, the Strategic Bond Fund and the Municipal Bond Fund each had an unsecured line of credit which matures on August 6, 2022 with a maximum borrowing equal to the lesser of $250,000,000 and $35,000,000, respectively, or 20% and 33.33% respectively, of gross market value of unencumbered assets of each Fund. The Credit Fund has a secured line of credit which matures on August 6, 2022 with a maximum borrowing equal to the lesser of $4,000,000 or 20% of gross market value of unencumbered assets of the Fund. These lines of credit are intended to provide short-term financing, if necessary, subject to certain restrictions, in connection with shareholder redemptions. The credit facility is with the Funds’ custodian, U.S. Bank. Interest will be accrued at the prime rate (3.25% as of February 28, 2022). The Funds did not utilize their lines of credit during the six months ended February 28, 2022. The Funds did not have any outstanding balances on the lines of credit at February 28, 2022. |
| | |
| 11. | Recent Market Events |
| | U.S. and international markets have experienced significant periods of volatility in recent years and months due to a number of economic, political and global macro factors including the impact of COVID-19 as a global pandemic and related public health crisis, growth concerns in the U.S. and overseas, uncertainties regarding interest rates, rising inflation, trade tensions, and the threat of tariffs imposed by the U.S. and other countries. In particular, the global spread of COVID-19 has resulted in disruptions to business operations and supply chains, stress on the global healthcare system, growth concerns in the U.S. and overseas, staffing shortages and the inability to meet consumer demand, and widespread concern and uncertainty. The global recovery from COVID-19 is proceeding at slower than expected rates due to the emergence of variant strains and may last for an extended period of time. Health crises and related political, social and economic disruptions caused by the spread of COVID-19 may also exacerbate other pre-existing political, social and economic risks in certain countries. As a result of continuing political tensions and armed conflicts, including the war between Ukraine and Russia, the U.S. and the European Union imposed sanctions on certain Russian individuals and companies, including certain financial institutions, and have limited certain exports and imports to and from Russia. The war has contributed to recent market volatility and may continue to do so. These developments, as well as other events, could result in further market volatility and negatively affect financial asset prices, the liquidity of certain securities and the normal operations of securities exchanges and other markets, despite government efforts to address market disruptions. Continuing market volatility as a result of recent market conditions or other events may have adverse effects on your account. |
| | |
| 12. | LIBOR |
| | The London Interbank Offered Rate (“LIBOR”) is an interest-rate average calculated from estimates submitted by the leading banks in London. LIBOR represents the rate which banks may obtain short-term borrowings from each other. It is the primary interest rate benchmark for short-term interest rates around the world. The regulator of the LIBOR administrator phased out the use of LIBOR on December 30, 2021 such that the one-week and 2-month USD LIBOR settings ceased to be published or will no longer be representative. The remaining USD LIBOR settings will cease to be published or will no longer be representative after June 30, 2023. Because the usefulness of LIBOR as a reference rate could deteriorate during the transition from LIBOR to an alternative reference rate, these effects could occur prior to June 30, 2023. The expected discontinuation of |
PERFORMANCE TRUST MUTUAL FUNDS – NOTES TO FINANCIAL STATEMENTS (CONT.)
February 28, 2022 (Unaudited)
| | LIBOR could have a significant impact on the financial markets, and may present a risk for certain market participants, including the risk that the transition from LIBOR to an alternative interest rate will not be orderly, will occur over various time periods or will have unintended consequences. |
| | |
| 13. | Subsequent Events |
| | On March 15, 2022, the Funds declared and paid distributions from ordinary income to shareholders of record as of March 14, 2022, as follows: |
| | | | Ordinary | |
| | | | Income | |
| | Strategic Bond Fund | | | |
| | Institutional Class | | $ | 10,118,575 | |
| | Class A | | $ | 49,777 | |
| | Class C | | $ | 41,445 | |
| | Municipal Bond Fund | | | | |
| | Institutional Class | | $ | 1,275,187 | |
| | Class A | | $ | 72,241 | |
| | Credit Fund | | | | |
| | Institutional Class | | $ | 128,230 | |
NOTICE OF PRIVACY POLICY & PRACTICES
We collect non-public personal information about you from the following sources:
» information we receive about you on applications or other forms;
» information you give us orally; and
» information about your transactions with us or others.
We do not disclose any non-public personal information about our shareholders or former shareholders without the shareholder’s authorization, except as permitted by law or in response to inquiries from governmental authorities. We may share information with affiliated parties and unaffiliated third parties with whom we have contracts for servicing the Funds. We will provide unaffiliated third parties with only the information necessary to carry out their assigned responsibility. All shareholder records will be disposed of in accordance with applicable law. We maintain physical, electronic and procedural safeguards to protect your non-public personal information and require third parties to treat your nonpublic personal information with the same high degree of confidentiality.
In the event that you hold shares of the Funds through a financial intermediary, including, but not limited to, a broker-dealer, bank or trust company, the privacy policy of your financial intermediary would govern how your non-public personal information would be shared with unaffiliated third parties.
EXPENSE EXAMPLE
Period Ended February 28, 2022 (Unaudited)
As a shareholder of the Funds, you incur two types of costs: (1) transaction costs, including sales charge (loads) on purchase payments (Class A shares only) and (2) ongoing costs, including management fees, distribution 12b-1 and service fees (Class A and Class C shares only) and other Fund expenses. This example is intended to help you understand your ongoing costs (in dollars) of investing in the Funds and to compare these costs with the ongoing costs of investing in other mutual funds.
The Example is based on an investment of $1,000 invested at the beginning of the period and held for the entire period (9/1/21 – 2/28/22).
Actual Expenses
The first line of the following tables provides information about actual account values and actual expenses for each Fund. If you purchase Class A shares of a Fund you will pay an initial sales charge of 2.25% when you invest. The tables do not include shareholder specific fees, such as the $15.00 fee charged to IRA accounts, or the $15.00 fee charged for wire redemptions. The tables also do not include portfolio trading commissions and related trading costs. You may use the information in this line, together with the amount you invested, to estimate the expenses that you paid over the period. Simply divide your account value by $1,000 (for example, an $8,600 account value divided by $1,000 = 8.6), then multiply the result by the number in the first line under the heading entitled “Expenses Paid During Period” to estimate the expenses you paid on your account during this period.
Hypothetical Example for Comparison Purposes
The second line of the following tables provides information about hypothetical account values and hypothetical expenses based on the actual expense ratios for each Fund and an assumed rate of return of 5% per year before expenses, which is not the Fund’s actual return. The hypothetical account values and expenses may not be used to estimate the actual ending account balance or expenses you paid for the period. You may use this information to compare the ongoing costs of investing in the Funds and other funds. To do so, compare this 5% hypothetical example with the 5% hypothetical examples that appear in the shareholder reports of the other funds.
Please note that the expenses shown in the tables are meant to highlight your ongoing costs only and do not reflect any transactional costs, such as sales charges (loads), redemption fees, or exchange fees. Therefore, the second line of each of the tables is useful in comparing ongoing costs only, and will not help you determine the relative total cost of owning different funds. In addition, if these transactional costs were included, your costs would have been higher.
| | | | EXPENSES PAID |
| PERFORMANCE TRUST | | | DURING PERIOD |
| STRATEGIC BOND FUND – | BEGINNING ACCOUNT VALUE | ENDING ACCOUNT VALUE | SEPTEMBER 1, 2021 – |
| INSTITUTIONAL CLASS | SEPTEMBER 1, 2021 | FEBRUARY 28, 2022 | FEBRUARY 28, 2022* |
| Actual | $1,000.00 | $ 969.70 | $3.63 |
| Hypothetical | | | |
| (5% annual return before expenses) | $1,000.00 | $1,021.11 | $3.72 |
| * | Expenses are equal to the Fund’s annualized expense ratio of 0.74%, multiplied by the average account value over the period, multiplied by 181/365 to reflect the one-half year period. |
| | | | EXPENSES PAID |
| PERFORMANCE TRUST | | | DURING PERIOD |
| STRATEGIC BOND FUND – | BEGINNING ACCOUNT VALUE | ENDING ACCOUNT VALUE | SEPTEMBER 1, 2021 – |
| CLASS A | SEPTEMBER 1, 2021 | FEBRUARY 28, 2022 | FEBRUARY 28, 2022* |
| Actual | $1,000.00 | $ 968.00 | $4.85 |
| Hypothetical | | | |
| (5% annual return before expenses) | $1,000.00 | $1,019.87 | $4.98 |
| * | Expenses are equal to the Fund’s annualized expense ratio of 0.99%, multiplied by the average account value over the period, multiplied by 181/365 to reflect the one-half year period. |
| | | | EXPENSES PAID |
| PERFORMANCE TRUST | | | DURING PERIOD |
| STRATEGIC BOND FUND – | BEGINNING ACCOUNT VALUE | ENDING ACCOUNT VALUE | SEPTEMBER 1, 2021 – |
| CLASS C | SEPTEMBER 1, 2021 | FEBRUARY 28, 2022 | FEBRUARY 28, 2022* |
| Actual | $1,000.00 | $ 964.70 | $8.49 |
| Hypothetical | | | |
| (5% annual return before expenses) | $1,000.00 | $1,016.15 | $8.71 |
| * | Expenses are equal to the Fund’s annualized expense ratio of 1.74%, multiplied by the average account value over the period, multiplied by 181/365 to reflect the one-half year period. |
EXPENSE EXAMPLE (CONT.)
Period Ended February 28, 2022 (Unaudited)
| | | | EXPENSES PAID |
| PERFORMANCE TRUST | | | DURING PERIOD |
| MUNICIPAL BOND FUND – | BEGINNING ACCOUNT VALUE | ENDING ACCOUNT VALUE | SEPTEMBER 1, 2021 – |
| INSTITUTIONAL CLASS | SEPTEMBER 1, 2021 | FEBRUARY 28, 2022 | FEBRUARY 28, 2022* |
| Actual | $1,000.00 | $ 968.60 | $2.31 |
| Hypothetical | | | |
| (5% annual return before expenses) | $1,000.00 | $1,022.44 | $2.38 |
| * | Expenses are equal to the Fund’s annualized expense ratio of 0.47%, multiplied by the average account value over the period, multiplied by 181/365 to reflect the one-half year period. |
| | | | EXPENSES PAID |
| PERFORMANCE TRUST | | | DURING PERIOD |
| MUNICIPAL BOND FUND – | BEGINNING ACCOUNT VALUE | ENDING ACCOUNT VALUE | SEPTEMBER 1, 2021 – |
| CLASS A | SEPTEMBER 1, 2021 | FEBRUARY 28, 2022 | FEBRUARY 28, 2022* |
| Actual | $1,000.00 | $ 967.40 | $3.53 |
| Hypothetical | | | |
| (5% annual return before expenses) | $1,000.00 | $1,021.20 | $3.63 |
| * | Expenses are equal to the Fund’s annualized expense ratio of 0.72%, multiplied by the average account value over the period, multiplied by 181/365 to reflect the one-half year period. |
| | | | EXPENSES PAID |
| PERFORMANCE TRUST | | | DURING PERIOD |
| CREDIT FUND – | BEGINNING ACCOUNT VALUE | ENDING ACCOUNT VALUE | SEPTEMBER 1, 2021 – |
| INSTITUTIONAL CLASS | SEPTEMBER 1, 2021 | FEBRUARY 28, 2022 | FEBRUARY 28, 2022* |
| Actual | $1,000.00 | $ 974.30 | $4.85 |
| Hypothetical | | | |
| (5% annual return before expenses) | $1,000.00 | $1,019.89 | $4.96 |
| * | Expenses are equal to the Fund’s annualized expense ratio of 0.99%, multiplied by the average account value over the period, multiplied by 181/365 to reflect the period. |
ADDITIONAL INFORMATION
(Unaudited)
Results of Shareholder Meeting
A Special Joint Meeting of Shareholders (the “Meeting”) took place on April 6, 2022. The Meeting was held for all series in the Trust. All Trust shareholders of record, in the aggregate across all series of the Trust, were entitled to attend or submit proxies. As of the record date, February 7, 2022, the Trust had 534,673,511 shares outstanding. The results of the voting for the proposals were as follows:
Proposal 1: To approve the election of four Trustees to the Board of Trustees of the Trust to serve until his or her successor is elected and qualified.
| | | For | Votes | Broker |
| | | Votes | Withheld | Non-Vote |
| | Vincent P. Lyles | 465,453,094 | 2,962,687 | 15,025,189 |
| | Erik K. Olstein | 465,703,874 | 2,711,906 | 15,025,189 |
| | Lisa Zúñiga Ramírez | 465,728,682 | 2,662,552 | 15,025,189 |
| | Gregory M. Wesley | 465,394,219 | 2,984,741 | 15,025,189 |
Accordingly, effective April 6, 2022, the Board of Trustees of Trust for Professional Managers consists of the following individuals, each of whom have been elected by shareholders:
Michael D. Akers, Independent Trustee
Gary A. Drska, Independent Trustee
Vincent P. Lyles, Independent Trustee
Erik K. Olstein, Independent Trustee
Lisa Zúñiga Ramírez, Independent Trustee
Gregory M. Wesley, Independent Trustee
Joseph C. Neuberger, Interested Trustee
Proposal 2: To approve one or more adjournments of the Meeting to a later date to solicit additional proxies.
For Votes | Votes Against | Votes Abstained |
| 476,848,750 | 2,932,139 | 3,647,484 |
Tax Information
For the year ended August 31, 2021, taxable ordinary income distributions are designed as short-term capital gain distributions under Section 871(k)(2)(c) of the Code for the Funds as follows:
| Municipal Bond Fund | 19.65% |
Availability of Proxy Voting Information
The Funds have adopted proxy voting policies and procedures that delegate to the Adviser the authority to vote proxies. A description of the Funds’ proxy voting policies and procedures is available without charge, upon request, by calling the Funds toll free at 1 (877) 738-9095. A description of these policies and procedures is also included in the Funds’ Statement of Additional Information, which is available on the SEC’s website at http://www.sec.gov.
The Funds’ proxy voting record for the most recent 12-month period ended June 30 is available without charge, upon request, by calling toll free, 1 (877) 738-9095, or by accessing the SEC’s website at http://www.sec.gov.
Portfolio Holdings
The Funds file a complete schedule of portfolio holdings with the U.S. Securities and Exchange Commission (the “SEC”) for the first and third quarters of each fiscal year on Part F of Form N-PORT. The Funds’ Form N-PORT filings are available on the SEC’s website at www.sec.gov.
Householding
In an effort to decrease costs, the Funds intend to reduce the number of duplicate prospectuses and certain other shareholder documents you receive by sending only one copy of each to those addresses shared by two or more accounts and to shareholders the Funds reasonably believe are from the same family or household. Once implemented, if you would like to discontinue householding for your accounts, please call toll-free at 1 (877) 738-9095 to request individual copies of these documents. Once the Funds receive notice to stop householding, the Funds will begin sending individual copies 30 days after receiving your request. This policy does not apply to account statements.
Forward Looking Statements
Except for historical information contained in this report for the Funds, the matters discussed in this report may constitute forward-looking statements made pursuant to the safe-harbor provisions of the Private Securities Litigation Reform Act of 1995. These include any Adviser or portfolio manager predictions, assessments, analyses or outlooks for individual securities, industries, market sectors and/or markets. These statements involve risks and uncertainties. In addition to the general risks described for the Funds in the most recent prospectus, other factors bearing on this report include the accuracy of the Adviser’s or portfolio manager’s data, forecasts and predictions, and the appropriateness of the investment programs designed by the Adviser or portfolio manager to implement their strategies efficiently and effectively. Any one or more of these factors, as well as other risks affecting the securities markets and investment instruments generally, could cause the actual results of the Funds to differ materially as compared to benchmarks associated with the Funds.
Indemnification
Under the Trust’s organizational documents, its officers and Trustees are indemnified against certain liabilities arising out of the performance of their duties to the Funds. In addition, in the normal course of business, the Funds enter into contracts that provide general indemnification to other parties. The Funds’ maximum exposure under these arrangements is unknown as this would involve future claims that may be made against the Funds that have not yet occurred. However, the Funds have not had prior claims or losses pursuant to these contracts and expect the risk of loss to be remote.
Information About Trustees
The business and affairs of the Trust are managed under the direction of the Trust’s Board of Trustees. Information pertaining to the Trustees of the Trust is set forth below. The Funds’ Statement of Additional Information includes additional information about the Trustees and is available, without charge, upon request by calling 1 (877) 738-9095.
INDEPENDENT TRUSTEES
(Unaudited)
| | | | NUMBER OF | | OTHER |
| | | | PORTFOLIOS | PRINCIPAL | DIRECTORSHIPS |
| NAME, | POSITION(S) | TERM OF OFFICE | IN THE TRUST | OCCUPATION(S) | HELD BY TRUSTEE |
| ADDRESS, AND | HELD WITH | AND LENGTH OF | OVERSEEN BY | DURING THE | DURING THE PAST |
| YEAR OF BIRTH | THE TRUST | TIME SERVED | THE TRUSTEE | PAST FIVE YEARS | FIVE YEARS |
| Independent Trustees | | | | | |
| | | | | | |
| Michael D. Akers, Ph.D. | Trustee | Indefinite Term; | 24 | Professor Emeritus, | Independent |
| 615 E. Michigan St. | | Since August 22, | | Department of Accounting | Trustee, USA |
| Milwaukee, WI 53202 | | 2001 | | (June 2019-present), | MUTUALS |
| Year of Birth: 1955 | | | | Professor, Department of | (an open-end |
| | | | | Accounting (2004-2019), | investment |
| | | | | Chair, Department of | company) |
| | | | | Accounting (2004-2017), | (2001-2021). |
| | | | | Marquette University. | |
| | | | | | |
| Gary A. Drska | Trustee | Indefinite Term; | 24 | Retired; Pilot, | Independent |
| 615 E. Michigan St. | | Since August 22, | | Frontier/Midwest Airlines, | Trustee, USA |
| Milwaukee, WI 53202 | | 2001 | | Inc. (airline company) | MUTUALS |
| Year of Birth: 1956 | | | | (1986-2021). | (an open-end |
| | | | | | investment |
| | | | | | company) |
| | | | | | (2001-2021). |
INTERESTED TRUSTEE AND OFFICERS
(Unaudited)
| | | | NUMBER OF | | OTHER |
| | | | PORTFOLIOS | PRINCIPAL | DIRECTORSHIPS |
| NAME, | POSITION(S) | TERM OF OFFICE | IN THE TRUST | OCCUPATION(S) | HELD BY TRUSTEE |
| ADDRESS, AND | HELD WITH | AND LENGTH OF | OVERSEEN BY | DURING THE | DURING THE PAST |
| YEAR OF BIRTH | THE TRUST | TIME SERVED | THE TRUSTEE | PAST FIVE YEARS | FIVE YEARS |
| Interested Trustee and Officers | | | | | |
| | | | | | |
| Joseph C. Neuberger* | Chairperson | Indefinite Term; | 24 | President (2017-present), | Trustee, Buffalo |
| 615 E. Michigan St. | and Trustee | Since August 22, | | Chief Operating Officer | Funds (an open-end |
| Milwaukee, WI 53202 | | 2001 | | (2016-2020), Executive | investment |
| Year of Birth: 1962 | | | | Vice President (1994-2017), | company) (2003- |
| | | | | U.S. Bancorp Fund | 2017); Trustee, |
| | | | | Services, LLC. | USA MUTUALS |
| | | | | | (an open-end |
| | | | | | investment |
| | | | | | company) |
| | | | | | (2001-2018). |
| | | | | | |
| John P. Buckel | President | Indefinite Term; | N/A | Vice President,U.S. Bancorp | N/A |
| 615 E. Michigan St. | and Principal | Since January 24, | | Fund Services, LLC | |
| Milwaukee, WI 53202 | Executive | 2013 | | (2004-present). | |
| Year of Birth: 1957 | Officer | | | | |
| | | | | | |
| Jennifer A. Lima | Vice | Indefinite Term; | N/A | Vice President, U.S. Bancorp | N/A |
| 615 E. Michigan St. | President, | Since January 24, | | Fund Services, LLC | |
| Milwaukee, WI 53202 | Treasurer | 2013 | | (2002-present). | |
| Year of Birth: 1974 | and Principal | | | | |
| | Financial and | | | | |
| | Accounting | | | | |
| | Officer | | | | |
| | | | | | |
| Deanna B. Marotz | Chief | Indefinite Term; | N/A | Senior Vice President, | N/A |
| 615 E. Michigan St. | Compliance | Since October 21, | | U.S. Bancorp Fund Services, | |
| Milwaukee, WI 53202 | Officer, Vice | 2021 | | LLC (2021-present); Chief | |
| Year of Birth: 1965 | President | | | Compliance Officer of | |
| | and Anti- | | | Keeley-Teton Advisors, LLC | |
| | Money | | | and Teton Advisors, Inc. | |
| | Laundering | | | (2017-2021); Chief | |
| | Officer | | | Compliance Officer of | |
| | | | | Keeley Asset Management | |
| | | | | Corp. (2015-2017). | |
| | | | | | |
| Jay S. Fitton | Secretary | Indefinite Term; | N/A | Assistant Vice President, | N/A |
| 615 E. Michigan St. | | Since July 22, | | U.S. Bancorp Fund | |
| Milwaukee, WI 53202 | | 2019 | | Services, LLC | |
| Year of Birth: 1970 | | | | (2019-present); Partner, | |
| | | | | Practus, LLP (2018-2019); | |
| | | | | Counsel, Drinker Biddle & | |
| | | | | Reath (2016-2018). | |
| * | Mr. Neuberger is deemed to be an “interested person” of the Trust as defined by the 1940 Act due to his position and material business relationship with the Trust. |
INTERESTED TRUSTEE AND OFFICERS
(Unaudited)
| | | | NUMBER OF | | OTHER |
| | | | PORTFOLIOS | PRINCIPAL | DIRECTORSHIPS |
| NAME, | POSITION(S) | TERM OF OFFICE | IN THE TRUST | OCCUPATION(S) | HELD BY TRUSTEE |
| ADDRESS, AND | HELD WITH | AND LENGTH OF | OVERSEEN BY | DURING THE | DURING THE PAST |
| YEAR OF BIRTH | THE TRUST | TIME SERVED | THE TRUSTEE | PAST FIVE YEARS | FIVE YEARS |
| Officers | | | | | |
| | | | | | |
| Kelly A. Strauss | Assistant | Indefinite Term; | N/A | Assistant Vice President, | N/A |
| 615 E. Michigan St. | Treasurer | Since April 23, | | U.S. Bancorp Fund | |
| Milwaukee, WI 53202 | | 2015 | | Services, LLC | |
| Year of Birth: 1987 | | | | (2011-present). | |
| | | | | | |
| | | | | | |
| Melissa Aguinaga | Assistant | Indefinite Term; | N/A | Assistant Vice President, | N/A |
| 615 E. Michigan St. | Treasurer | Since July 1, | | U.S. Bancorp Fund | |
| Milwaukee, WI 53202 | | 2015 | | Services, LLC | |
| Year of Birth: 1987 | | | | (2010-present). | |
| | | | | | |
| Laura A. Carroll | Assistant | Indefinite Term; | N/A | Assistant Vice President, | N/A |
| 615 E. Michigan St. | Treasurer | Since August 20, | | U.S. Bancorp Fund | |
| Milwaukee, WI 53202 | | 2018 | | Services, LLC | |
| Year of Birth: 1985 | | | | (2007-present). | |
(This Page Intentionally Left Blank.)
Investment Adviser
PT Asset Management, LLC
500 W. Madison, Suite 470
Chicago, IL 60661
888.282.3220
www.PTAM.com
Fund Administrator, Transfer Agent,
and Fund Accountant
U.S. Bancorp Fund Services, LLC
615 East Michigan Street
Milwaukee, WI 53202
Custodian
U.S. Bank, N.A.
Custody Operations
1555 N. RiverCenter Drive, Suite 302
Milwaukee, WI 53212
Legal Counsel
Godfrey & Kahn, S.C.
833 East Michigan Street, Suite 1800
Milwaukee, WI 53202
Independent Registered
Public Accounting Firm
Cohen & Company, Ltd.
1350 Euclid Avenue, Suite 800
Cleveland, OH 44115
Distributor
Foreside Fund Services, LLC
3 Canal Plaza, Suite 100
Portland, ME 04101
This report has been prepared for shareholders
and may be distributed to others only if preceded
or accompanied by a current prospectus.
The Performance Trust Mutual Funds are distributed
by Foreside Fund Services, LLC

| (b) | Not applicable for this Registrant. |
Item 2. Code of Ethics.
Not applicable for semi-annual reports.
Item 3. Audit Committee Financial Expert.
Not applicable for semi-annual reports.
Item 4. Principal Accountant Fees and Services.
Not applicable for semi-annual reports.
Item 5. Audit Committee of Listed Registrants.
Not applicable to registrants who are not listed issuers (as defined in Rule 10A-3 under the Securities Exchange Act of 1934).
Item 6. Investments.
(a) | Schedule of Investments is included as part of the report to shareholders filed under Item 1 of this Form. |
Item 7. Disclosure of Proxy Voting Policies and Procedures for Closed-End Management Investment Companies.
Not applicable to open-end investment companies.
Item 8. Portfolio Managers of Closed-End Management Investment Companies.
Not applicable to open-end investment companies.
Item 9. Purchases of Equity Securities by Closed‑End Management Investment Company and Affiliated Purchasers.
Not applicable to open-end investment companies.
Item 10. Submission of Matters to a Vote of Security Holders.
There have been no material changes to the procedures by which shareholders may recommend nominees to the registrant’s board of trustees.
Item 11. Controls and Procedures.
(a) | The Registrant’s President and Treasurer have reviewed the Registrant's disclosure controls and procedures (as defined in Rule 30a-3(c) under the Investment Company Act of 1940 (the “Act”)) as of a date within 90 days of the filing of this report, as required by Rule 30a-3(b) under the Act and Rules 13a-15(b) or 15d‑15(b) under the Securities Exchange Act of 1934. Based on their review, such officers have concluded that the disclosure controls and procedures are effective in ensuring that information required to be disclosed in this report is appropriately recorded, processed, summarized and reported and made known to them by others within the Registrant and by the Registrant’s service provider. |
(b) | There were no changes in the Registrant's internal control over financial reporting (as defined in Rule 30a-3(d) under the Act) that occurred during the last fiscal half-year of the period covered by this report that has materially affected, or is reasonably likely to materially affect, the Registrant's internal control over financial reporting. |
Item 12. Disclosure of Securities Lending Activities for Closed-End Management Investment Companies
Not applicable to open-end investment companies.
Item 13. Exhibits.
(a) | (1) Any code of ethics or amendment thereto, that is the subject of the disclosure required by Item 2, to the extent that the registrant intends to satisfy Item 2 requirements through filing an exhibit. Not Applicable. |
(3) Any written solicitation to purchase securities under Rule 23c‑1 under the Act sent or given during the period covered by the report by or on behalf of the registrant to 10 or more persons. Not applicable to open-end investment companies.
(4) Change in the registrant’s independent public accountant. There was no change in the registrant’s independent public accountant for the period covered by this report.
SIGNATURES
Pursuant to the requirements of the Securities Exchange Act of 1934 and the Investment Company Act of 1940, the registrant has duly caused this report to be signed on its behalf by the undersigned, thereunto duly authorized.
(Registrant) Trust for Professional Managers
By (Signature and Title)* /s/ John Buckel
John Buckel, President
Date: 4/28/2022
Pursuant to the requirements of the Securities Exchange Act of 1934 and the Investment Company Act of 1940, this report has been signed below by the following persons on behalf of the registrant and in the capacities and on the dates indicated.
By (Signature and Title)*
/s/ John BuckelJohn Buckel, President
Date: 4/28/2022
By (Signature and Title)* /s/ Jennifer Lima
Jennifer Lima, Treasurer
Date: 4/28/2022
* Print the name and title of each signing officer under his or her signature.