UNITED STATES
SECURITIES AND EXCHANGE COMMISSION
Washington, D.C. 20549
FORM N-CSR
CERTIFIED SHAREHOLDER REPORT OF REGISTERED
MANAGEMENT INVESTMENT COMPANIES
Investment Company Act file number 811-10401
Trust for Professional Managers
(Exact name of registrant as specified in charter)
615 East Michigan Street
Milwaukee, WI 53202
(Address of principal executive offices) (Zip code)
Jay S. Fitton
U.S. Bancorp Fund Services, LLC
615 East Michigan Street
Milwaukee, WI 53202
(Name and address of agent for service)
(513)-629-8104
Registrant’s telephone number, including area code
Date of fiscal year end: August 31, 2022
Date of reporting period: February 28, 2022
EX.99.CODE ETH
Item 1. Reports to Stockholders.
PMC Funds
PMC Core Fixed Income Fund
Advisor Class Shares: (PMFIX)
Institutional Class Shares: (PMFQX)
PMC Diversified Equity Fund
Advisor Class Shares: (PMDEX)
Institutional Class Shares: (PMDQX)
Semi-Annual Report
February 28, 2022
Table of Contents
PMC Funds
Letter to Shareholders
To our Shareholders:
We are pleased to present you with the Semi-Annual Report for the PMC Funds mutual fund family. This report covers the six-month period ended February 28, 2022 as well as the period since the inception for the PMC Funds. The table below presents the standardized performance of the two PMC Funds relative to their respective benchmarks.
The six-month period ended February 28, 2022 was one in which investors experienced many dfferent equity and bond market conditions. Supply chain bottlenecks continued to wreak havoc on product availability across many industries, but economic growth remained strong. During the fourth quarter of 2021, real gross domestic product (GDP) in the U.S. rose 7.0%, in line with consensus expectations. The Omicron variant of COVID-19 arose too late in the quarter to have any considerable adverse effects, but the drag resulting from the Delta variant earlier in the year demonstrates the impact increased infections can have on growth. In addition to the economy delivering overall robust economic results, the employment situation continued to make strong gains. Employers added 678,000 jobs in February, far exceeding expectations. In addition, the unemployment rate dropped to a new cycle low of 3.8%, close to its pre-pandemic low of 3.5%. As a result of this growth and the ongoing supply chain issues, inflation surged and interest rates climbed steadily in response. In February, the Consumer Price Index (CPI), which is a measure of the average change over time in the prices paid by urban consumers for a market basket of consumer goods and services, was up 7.9% over the past year, the largest advance in 40 years. The yield on the 10-year U.S. Treasury rose precipitously over the six-month period, from 1.31% on August 31, 2021 to 1.83% on February 28, 2022, very near its high for the period.
In terms of monetary policy, the U.S. Federal Open Market Committee (FOMC) maintained a very aggressive stance, leaving in place the 0%-0.25% target range for the federal funds rate. However, it is widely expected the FOMC will begin raising interest rates in March in an effort to cool inflation. The expected rate increase is anticipated to be the first of many to come over the next several quarters.
Overall, equity markets were lower over the past six months, with the MSCI World Index Net Return (global all-capitalization) generating a return of -4.7%. Stock prices rose for much of the fall into year-end, but the weight of heightened inflation, rising interest rates and geopolitical tensions created volatility and a drop in prices for the first part of 2022. For the first two months of the year, the MSCI World Index Net Return declined -7.7%. In the fixed income asset class, the rise in interest rates meant bond prices were mostly lower, with prices of corporate bonds declining relative to U.S. government securities as investors anticipated a cooling in the economy. As such, the Bloomberg U.S. Aggregate Bond Index, a broad-based index of fixed-income securities, delivered a negative total return of -4.1% over the six months ended February 28, 2022.
3
Total Returns as of February 28, 2022*
*Periods of Less than One Year Are Unannualized
| | | | | | | | | | | | | | | | | | | | | | | | | | | | | | | | |
Fund
| | Three
Months
| | | Six
Months
| | | One
Year
| | | Five
Year
| | | Ten
Year
| | | Since
Inception
| | | Inception
Date
| | | Gross
Expense
Ratio
| |
PMC Diversified Equity Fund (Advisor Class) | | | -2.89 | % | | | -4.46 | % | | | 7.16 | % | | | 9.13 | % | | | 9.04 | % | | | 9.66 | % | | | 8-26-09 | | | | 0.97 | % |
PMC Diversified Equity Fund (Inst. Class) | | | -2.86 | % | | | -4.38 | % | | | 7.42 | % | | | N/A | | | | N/A | | | | 11.14 | %* | | | 7-1-19 | | | | 0.68 | % |
MSCI World Index Net Return** | | | -3.74 | % | | | -4.65 | % | | | 10.74 | % | | | 12.05 | % | | | 10.73 | % | | | 10.49 | % | | | | | | | | |
| | | | | | | | |
PMC Core Fixed Income Fund (Advisor Class) | | | -3.64 | % | | | -4.67 | % | | | -2.81 | % | | | 2.81 | % | | | 2.40 | % | | | 4.20 | % | | | 9-28-07 | | | | 1.21 | % |
PMC Core Fixed Income Fund (Inst. Class) | | | -3.62 | % | | | -4.55 | % | | | -2.56 | % | | | N/A | | | | N/A | | | | 2.64 | %* | | | 7-1-19 | | | | 0.95 | % |
Bloomberg U.S. Aggregate Bond Index*** | | | -3.49 | % | | | -4.07 | % | | | -2.64 | % | | | 2.71 | % | | | 2.47 | % | | | 3.74 | % | | | | | | | | |
| * | | Performance shown as of Institutional class inception date of 7-1-19. |
| ** | | MSCI World Index Net Return is a broad global equity index that represents large and mid-cap equity performance across 23 developed markets countries. |
| *** | | Bloomberg U.S. Aggregate Bond Index is a broad based fixed income index that consists of securities that are investment grade quality or better, have at least one year to maturity and have an outstanding par value of at least $100 million. |
Past performance is no guarantee of future returns. Current performance may be higher or lower than the performance data shown. Investment return and principal value will fluctuate so that an investor’s shares, when redeemed, may be worth more or less than original cost. For the most recent month-end performance, please visit the Funds’ website at http://www.investpmc.com/solutions/portfolios or by calling 866-762-7338. Performance results reflect contractual expense subsidies and waivers in effect until December 29, 2022; without these waivers, returns would have been less favorable.
PMC Diversified Equity Fund
The PMC Diversified Equity Fund (the “Fund”) was launched on August 26, 2009, and provides broad equity asset class exposure, diversified globally. The Fund’s investment objective is long-term capital appreciation.
One of the primary drivers of the Fund’s performance is its exposure to the well-known value, momentum and quality asset pricing factors. Stocks with positive exposures to these factors contributed positively to performance during the past six months. Many analysts believe that now that the FOMC is going to be reversing its aggressive monetary policy there will be a greater distinction in performance among stocks. Such positive factor performance was a primary contributor to the Fund’s relative performance, as it outperformed the benchmark over the six-month period ending February 28, 2022. Over that period the Fund (Advisor Class) generated a total return of -4.46%, slightly outpacing the -4.65% return of the benchmark MSCI World Index Net Return. The primary driver of the Fund’s performance during the period was the strong aggregate performance of the asset pricing factors toward which the portfolio is tilted. In particular, the Fund’s orientation toward value stocks was a key driver of the outperformance relative to the benchmark. Performance was also positively impacted by having an exposure to stocks exhibiting positive momentum, as well as to those having higher quality characteristics. The Fund’s modestly lower weighted average market capitalization than the benchmark index had a negative impact on performance during the period, as stocks of smaller companies underperformed those of larger companies. Relative performance was also advantaged during the twelve-month period from underweights to the consumer discretionary and industrials sectors. Among the detractors to performance during the period were modest underweights to the communications services and energy sectors, and security selection in the communications services sector. As is typically the case, the strategy’s factor orientation resulted in over- or underweights to specific stocks that had a meaningful impact on performance. Over the past six months underweights to well-known companies such as PayPal Holdings, Inc. (PYPL), Meta Platforms, Inc. (FB) and Amazon.com, Inc. (AMZN) benefited performance. However, an underweight to Apple, Inc. (AAPL), and overweights to Garmin, Ltd. (GRMN) and Zebra Technologies Corp. (ZBRA) resulted in underperformance.
In addition to the risk that the investment strategy employed in the Fund will underperform the benchmark index generally, the primary risks continue to primarily involve systematic risk. Because the Fund’s investment adviser
4
controls the risk of the portfolio relative to the benchmark, the overall portfolio should track the Fund’s benchmark fairly closely on a relative basis. However, in general market declines the Fund’s fully invested strategy would incur a setback commensurate with the decline in the benchmark.
PMC Core Fixed Income Fund
The PMC Core Fixed Income Fund (the “Fund”) provides broad exposure to the core segments of the domestic fixed income market. The Fund’s investment objective is to provide current income consistent with low volatility of principal, and in addition to the Fund’s investment adviser, one sub-adviser manages a portion of the Fund’s assets: Neuberger Berman Investment Advisers LLC.
Over the past six months the environment for fixed income securities has been one of a continued rise in bond yields—and drop in bond prices—resulting from a number of factors, including improving economic growth, a surge in inflation, and elevated geopolitical tensions. Against this backdrop, the Fund (Advisor Class) generated a negative return of -4.67% for the six-month period ending February 28, 2022, modestly lagging the performance of the Bloomberg U.S. Aggregate Bond Index return of -4.07%. The primary factors negatively impacting performance over the past six-month period were an underweight to U.S. Treasury bonds and an overweight to industrial and financial institutions bonds. The Fund’s aggregate overweight to corporate bonds was a key detractor during the period, as was security selection within the government-related segment.
The primary risks to the strategies employed by the Fund’s portfolio management teams remain in place, and exist at both the macro level and in individual security selection. Due to the Fund’s aggregate overweight exposure to credit securities, the Fund remains likely to underperform the benchmark somewhat if the Federal Reserve makes a policy misstep, and Treasury securities consequently rise relative to credits. In addition, if the general level of interest rates rises rapidly, the Fund will not be immune to losses. Similarly, if certain of the individual credits currently owned by the Fund are adversely affected by economic events, the Fund itself will also be affected.
Remarks
As always, we appreciate your continued trust and confidence in the PMC Funds. We will continue to do all we can to ensure that such trust and confidence are well placed and will manage the PMC Funds with that goal clearly in mind.

Brandon R. Thomas
Co-Founder and Chief Investment Officer
Envestnet, Inc.
5
Envestnet Asset Management
The views in this report were those of the Funds’ investment adviser and the Core Fixed Income Fund’s sub-adviser, as applicable, as of the date of this report, and may not reflect their views on the date the report is first published or anytime thereafter. These views are intended to assist the shareholders of the Funds in understanding their investments in the Funds and do not constitute investment advice. Holdings are subject to change without notice and are not a recommendation to buy or sell any security.
Diversification does not assure a profit, nor protect against loss in a declining market. Investments in smaller companies carry greater risk than is customarily associated with larger companies for various reasons such as volatility of earnings and prospects, higher failure rates, and limited markets, product lines or financial resources. Investing overseas involves special risks, including the volatility of currency exchange rates and, in some cases, limited geographic focus, political and economic instability, and relatively illiquid markets. Income (bond) funds are subject to interest rate risk, which is the risk that debt securities in a fund’s portfolio will decline in value because of increases in market interest rates. Please see the prospectus (https://www.investpmc.com/sites/default/files/documents/PMC%20Statutory%20Prospectus%20%28public%29.pdf) for a complete description of the risks associated with investing in the PMC Funds.
PMC Funds are distributed by Foreside Fund Services, LLC
6
PMC FUNDS
Expense Examples
(Unaudited)
As a shareholder of the PMC Core Fixed Income Fund or the PMC Diversified Equity Fund (each a “Fund”, and together the “Funds”), you incur two types of costs: (1) transaction costs and (2) ongoing costs, including management fees, distribution (12b-1) fees (Advisor Class shares only) and other Fund expenses. This Example is intended to help you understand your ongoing costs (in dollars) of investing in the Funds, and to compare these costs with the ongoing costs of investing in other mutual funds. The Example is based on an investment of $1,000 invested at the beginning of the period and held for the entire period (September 1, 2021 - February 28, 2022).
The first lines of the following tables provide information about actual account values and actual expenses. Although the Funds do not charge a sales load, you will be assessed fees for outgoing wire transfers, returned checks and stop payment orders at prevailing rates charged by U.S. Bancorp Fund Services, LLC, the Funds’ transfer agent. Individual Retirement Accounts (“IRA”) will be charged a $15.00 annual maintenance fee. To the extent the Funds invest in shares of exchange-traded funds or other investment companies as part of their investment strategy, you will indirectly bear your proportionate share of any fees and expenses charged by the underlying funds in which the Funds invest in addition to the direct expenses of the Funds. Actual expenses of the underlying funds are expected to vary among the various underlying funds. These expenses are not included in the Example. The Example includes, but is not limited to, management fees, distribution (12b-1) fees, fund administration and accounting, custody and transfer agent fees. You may use the information in this line, together with the amount you invested, to estimate the expenses that you paid over the period. Simply divide your account value by $1,000 (for example, an $8,600 account value divided by $1,000 = 8.6), then multiply the result by the number in the first line under the heading entitled “Expenses Paid During Period” to estimate the expenses you paid on your account during this period.
| | Hypothetical | | Example for Comparison Purposes |
The second lines of the following tables provide information about hypothetical account values and hypothetical expenses based on the Funds’ actual expense ratio and an assumed rate of return of 5% per year before expenses, which is not the Funds’ actual returns. The hypothetical account values and expenses may not be used to estimate the actual ending account balance or expenses you paid for the period. You may use this information to compare the ongoing costs of investing in the Funds and other funds. To do so, compare this 5% hypothetical example with the 5% hypothetical examples that appear in the shareholder reports of other funds. Please note that the expenses shown in the table are meant to highlight your ongoing costs only and do not reflect any transactional costs, such as sales charges (loads), or exchange fees. Therefore, the second lines of the tables are useful in comparing ongoing costs only, and will not help you determine the relative total costs of owning different funds. In addition, if these transactional costs were included, your costs would have been higher.
| | | | | | | | | | | | |
| | | Beginning
Account Value
9/1/21
| | | Ending
Account Value
2/28/22
| | | Expenses Paid
During Period
9/1/21-2/28/22*
| |
PMC Core Fixed Income Fund–Advisor Class | | | | | | | | | | | | |
Actual | | $ | 1,000.00 | | | $ | 953.30 | | | $ | 4.12 | |
Hypothetical (5% return before expenses) | | | 1,000.00 | | | | 1,020.58 | | | | 4.26 | |
| * | | Expenses are equal to the Fund’s annualized expense ratio of 0.85%, multiplied by the average account value over the period, multiplied by 181/365 to reflect the one-half year period. |
| | | | | | | | | | | | |
| | | Beginning
Account Value
9/1/21
| | | Ending
Account Value
2/28/22
| | | Expenses Paid
During Period
9/1/21-2/28/22*
| |
PMC Core Fixed Income Fund–Institutional Class | | | | | | | | | | | | |
Actual | | $ | 1,000.00 | | | $ | 954.50 | | | $ | 2.91 | |
Hypothetical (5% return before expenses) | | | 1,000.00 | | | | 1,021.82 | | | | 3.01 | |
| * | | Expenses are equal to the Fund’s annualized expense ratio of 0.60%, multiplied by the average account value over the period, multiplied by 181/365 to reflect the one-half year period. |
7
| | | | | | | | | | | | |
| | | Beginning
Account Value
9/1/21
| | | Ending
Account Value
2/28/22
| | | Expenses Paid
During Period
9/1/21-2/28/22*
| |
PMC Diversified Equity Fund–Advisor Class | | | | | | | | | | | | |
Actual | | $ | 1,000.00 | | | $ | 955.40 | | | $ | 4.46 | |
Hypothetical (5% return before expenses) | | | 1,000.00 | | | | 1,020.23 | | | | 4.61 | |
| * | | Expenses are equal to the Fund’s annualized expense ratio of 0.92%, multiplied by the average account value over the period, multiplied by 181/365 to reflect the one-half year period. |
| | | | | | | | | | | | |
| | | Beginning
Account Value
9/1/21
| | | Ending
Account Value
2/28/22
| | | Expenses Paid
During Period
9/1/21-2/28/22*
| |
PMC Diversified Equity Fund–Institutional Class | | | | | | | | | | | | |
Actual | | $ | 1,000.00 | | | $ | 956.20 | | | $ | 3.25 | |
Hypothetical (5% return before expenses) | | | 1,000.00 | | | | 1,021.47 | | | | 3.36 | |
| * | | Expenses are equal to the Fund’s annualized expense ratio of 0.67%, multiplied by the average account value over the period, multiplied by 181/365 to reflect the one-half year period. |
8
PMC CORE FIXED INCOME FUND (PMFIX, PMFQX)
Investment Highlights (Unaudited)
The investment objective of the Fund is to provide current income consistent with low volatility of principal. The Fund’s allocation of portfolio holdings as of February 28, 2022 is shown below.
Allocation of Portfolio Holdings
% of Net assets
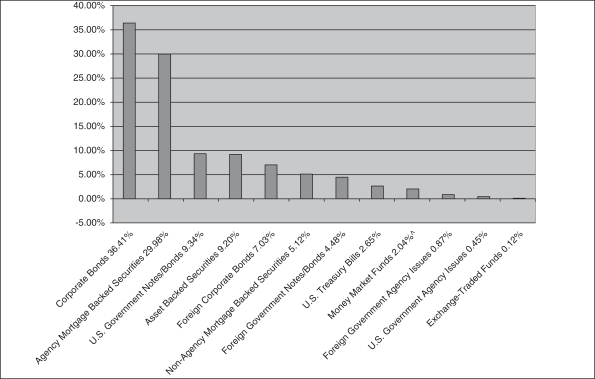
| ^ | | Excludes securities lending collateral. |
9
PMC CORE FIXED INCOME FUND–ADVISOR CLASS (PMFIX)
Investment Highlights (Unaudited) (Continued)
Average Annual Returns as of February 28, 2022
| | | | | | | | |
| | | PMC Core
Fixed Income
Fund–Advisor
Class
| | | Bloomberg U.S.
Aggregate Bond
Index
| |
One Year | | | -2.81 | % | | | -2.64 | % |
Five Year | | | 2.81 | % | | | 2.71 | % |
Ten Year | | | 2.40 | % | | | 2.47 | % |
Since Inception (9/28/07) | | | 4.20 | % | | | 3.74 | % |
| | |
|
|
| |
|
|
|
Performance data quoted represents past performance and does not guarantee future results. The investment return and principal value of an investment will fluctuate so that an investor’s shares, when redeemed, may be worth more or less than their original cost. Current performance of the Fund may be lower or higher than the performance quoted. Performance data current to the most recent month end may be obtained by calling the Fund (toll free) at (866) PMC-7338.
Short-term performance, in particular, is not a good indication of the Fund’s future performance, and an investment should not be made based solely on historical returns.
Investment performance reflects fee waivers in effect. In the absence of such waivers, total return would be reduced.
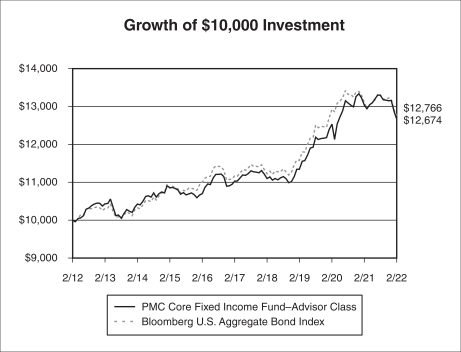
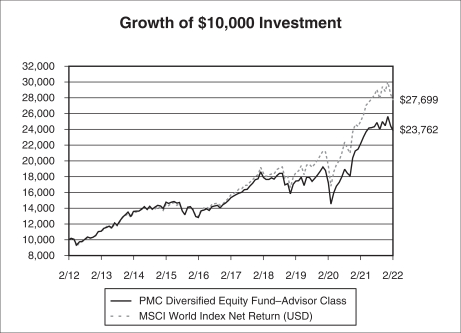
The returns shown assume reinvestment of Fund distributions and do not reflect the deduction of taxes that a shareholder would pay on Fund distributions or the redemption of Fund shares. The graph illustrates performance of a hypothetical investment made in the Fund and a broad-based securities index on February 29, 2012. The graph does not reflect any future performance.
The Bloomberg U.S. Aggregate Bond Index is an index composed of U.S. securities in Treasury, Government-Related, Corporate and Securitized Sectors. It includes securities that are of investment-grade quality or better, have at least one year to maturity and have an outstanding par value of at least $250 million.
One cannot invest directly in an index.
10
PMC CORE FIXED INCOME FUND–INSTITUTIONAL CLASS (PMFQX)
Investment Highlights (Unaudited) (Continued)
Average Annual Returns as of February 28, 2022
| | | | | | | | |
| | | PMC Core
Fixed Income
Fund–Institutional
Class
| | | Bloomberg U.S.
Aggregate Bond
Index
| |
One Year | | | -2.56 | % | | | -2.64 | % |
Since Inception (7/1/19) | | | 2.64 | % | | | 1.87 | % |
| | |
|
|
| |
|
|
|
Performance data quoted represents past performance and does not guarantee future results. The investment return and principal value of an investment will fluctuate so that an investor’s shares, when redeemed, may be worth more or less than their original cost. Current performance of the Fund may be lower or higher than the performance quoted. Performance data current to the most recent month end may be obtained by calling the Fund (toll free) at (866) PMC-7338.
Short-term performance, in particular, is not a good indication of the Fund’s future performance, and an investment should not be made based solely on historical returns.
Investment performance reflects fee waivers in effect. In the absence of such waivers, total return would be reduced.
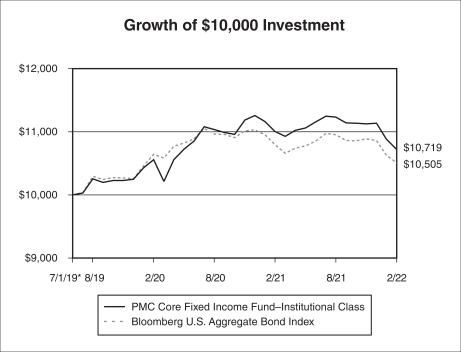
The returns shown assume reinvestment of Fund distributions and do not reflect the deduction of taxes that a shareholder would pay on Fund distributions or the redemption of Fund shares. The graph illustrates performance of a hypothetical investment made in the Fund and a broad-based securities index on July 1, 2019, the inception date of the Institutional Class. The graph does not reflect any future performance.
The Bloomberg U.S. Aggregate Bond Index is an index composed of U.S. securities in Treasury, Government-Related, Corporate and Securitized Sectors. It includes securities that are of investment-grade quality or better, have at least one year to maturity and have an outstanding par value of at least $250 million.
One cannot invest directly in an index.
11
PMC DIVERSIFIED EQUITY FUND (PMDEX, PMDQX)
Investment Highlights (Unaudited)
The investment objective of the Fund is long-term capital appreciation. The Fund’s allocation of portfolio holdings as of February 28, 2022 is shown below.
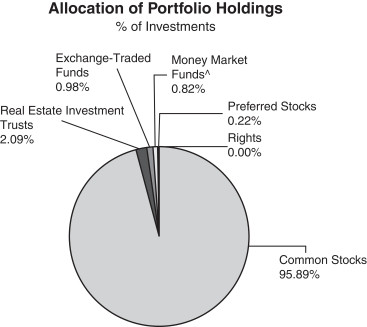
| | ^ | | Excludes securities lending collateral. |
12
PMC DIVERSIFIED EQUITY FUND–ADVISOR CLASS (PMDEX)
Investment Highlights (Unaudited) (Continued)
Average Annual Returns as of February 28, 2022
| | | | | | | | |
| | | PMC Diversified
Equity Fund–
Advisor Class
| | | MSCI
World Index
Net Return
| |
One Year | | | 7.16 | % | | | 10.74 | % |
Five Year | | | 9.13 | % | | | 12.05 | % |
Ten Year | | | 9.04 | % | | | 10.73 | % |
Since Inception (8/26/09) | | | 9.66 | % | | | 10.49 | % |
| | |
|
|
| |
|
|
|
On May 25, 2018, Envestnet Asset Management, Inc. (the “Adviser”), the Fund’s investment adviser, assumed all responsibilities for selecting investments in the Fund’s portfolio in connection with a change to the Fund’s investment strategies. The Fund’s performance prior to this date reflects the Fund’s returns achieved when the Adviser actively managed a portion of the Fund’s portfolio and used a “manager of managers” investment strategy by engaging sub-advisers to manage other portions of the Fund’s portfolio.
Performance data quoted represents past performance and does not guarantee future results. The investment return and principal value of an investment will fluctuate so that an investor’s shares, when redeemed, may be worth more or less than their original cost. Current performance of the Fund may be lower or higher than the performance quoted. Performance data current to the most recent month end may be obtained by calling the Fund (toll free) at (866) PMC-7338.
Short-term performance, in particular, is not a good indication of the Fund’s future performance, and an investment should not be made based solely on historical returns.
Investment performance reflects fee waivers in effect. In the absence of such waivers, total return would be reduced.
The returns shown assume reinvestment of Fund distributions and do not reflect the deduction of taxes that a shareholder would pay on Fund distributions or the redemption of Fund shares. The graph illustrates performance of a hypothetical investment made in the Fund and a broad-based securities index on February 29, 2012. The graph does not reflect any future performance.
The MSCI World Index Net Return is a free float-adjusted market capitalization weighted index that is designed to measure the equity market performance of developed markets. Net return indices reinvest dividends after the deduction of taxes, using a tax rate applicable to non-resident investors who do not benefit from table taxation treaties. The MSCI World Index consists of the following 23 developed market country indices: Australia, Austria, Belgium, Canada, Denmark, Finland, France, Germany, Hong Kong, Ireland, Israel, Italy, Japan, Netherlands, New Zealand, Norway, Portugal, Singapore, Spain, Sweden, Switzerland, the United Kingdom, and the United States.
One cannot invest directly in an index.
Continued
13
PMC DIVERSIFIED EQUITY FUND–ADVISOR CLASS (PMDEX)
Investment Highlights (Unaudited) (Continued)
14
PMC DIVERSIFIED EQUITY FUND–INSTITUTIONAL CLASS (PMDQX)
Investment Highlights (Unaudited) (Continued)
Average Annual Returns as of February 28, 2022
| | | | | | | | |
| | | PMC Diversified
Equity Fund–
Institutional Class
| | | MSCI
World Index
Net Return
| |
One Year | | | 7.42 | % | | | 10.74 | % |
Since Inception (7/1/19) | | | 11.14 | % | | | 13.88 | % |
| | |
|
|
| |
|
|
|
Performance data quoted represents past performance and does not guarantee future results. The investment return and principal value of an investment will fluctuate so that an investor’s shares, when redeemed, may be worth more or less than their original cost. Current performance of the Fund may be lower or higher than the performance quoted. Performance data current to the most recent month end may be obtained by calling the Fund (toll free) at (866) PMC-7338.
Short-term performance, in particular, is not a good indication of the Fund’s future performance, and an investment should not be made based solely on historical returns.
Investment performance reflects fee waivers in effect. In the absence of such waivers, total return would be reduced.
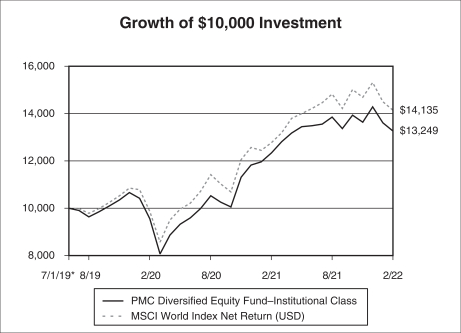
The returns shown assume reinvestment of Fund distributions and do not reflect the deduction of taxes that a shareholder would pay on Fund distributions or the redemption of Fund shares. The graph illustrates performance of a hypothetical investment made in the Fund and a broad-based securities index on July 1, 2019, the inception date of the Institutional Class. The graph does not reflect any future performance.
The MSCI World Index Net Return is a free float-adjusted market capitalization weighted index that is designed to measure the equity market performance of developed markets. Net return indices reinvest dividends after the deduction of taxes, using a tax rate applicable to non-resident investors who do not benefit from table taxation treaties. The MSCI World Index consists of the following 23 developed market country indices: Australia, Austria, Belgium, Canada, Denmark, Finland, France, Germany, Hong Kong, Ireland, Israel, Italy, Japan, Netherlands, New Zealand, Norway, Portugal, Singapore, Spain, Sweden, Switzerland, the United Kingdom, and the United States.
One cannot invest directly in an index.
15
PMC CORE FIXED INCOME FUND | Schedule of Investments |
February 28, 2022 (Unaudited)
| | | | | | | | |
| | |
| | | Principal
Amount
| | | Value
| |
| ASSET BACKED SECURITIES—9.20% | | | | | | | | |
37 Capital CLO I | | | | | | | | |
2021-1A, 1.403% (3 Month LIBOR USD + 1.200%), 10/15/2034(b)(c) | | $ | 1,000,000 | | | $ | 999,447 | |
AM Capital Funding LLC | | | | | | | | |
2018-1, 4.980%, 12/15/2023(b) | | | 560,000 | | | | 569,995 | |
Angel Oak Mortgage Trust | | | | | | | | |
2021-3, 1.068%, 05/25/2066(b)(d) | | | 868,326 | | | | 856,291 | |
Aqua Finance Trust | | | | | | | | |
2021-A, 1.540%, 07/17/2046(b) | | | 713,203 | | | | 696,064 | |
Avis Budget Rental Car Funding AESOP LLC | | | | | | | | |
2021-2A A, 1.660%, 02/20/2028(b) | | | 2,191,000 | | | | 2,129,960 | |
2021-2A B, 1.900%, 02/20/2028(b) | | | 495,000 | | | | 475,864 | |
Beacon Container Finance II LLC | | | | | | | | |
2021-1A, 2.250%, 10/22/2046(b) | | | 1,026,600 | | | | 996,810 | |
BlueMountain CLO Ltd. | | | | | | | | |
2013-2A, 1.439% (3 Month LIBOR USD + 1.180%), 10/22/2030(b)(c) | | | 362,743 | | | | 362,120 | |
Cedar Funding VI CLO Ltd. | | | | | | | | |
2016-6A, 1.304% (3 Month LIBOR USD + 1.050%), 04/20/2034(b)(c) | | | 1,480,000 | | | | 1,464,235 | |
Crown Castle Towers LLC | | | | | | | | |
2018-1, 4.241%, 07/15/2048(b) | | | 439,000 | | | | 464,966 | |
Dryden 75 CLO Ltd. | | | | | | | | |
2019-75R2, 1.281% (3 Month LIBOR USD + 1.040%), 04/15/2034(b)(c) | | | 850,000 | | | | 842,562 | |
Fort Washington CLO Ltd. | | | | | | | | |
2021-2A, 1.336% (3 Month LIBOR USD + 1.220%), 10/20/2034(b)(c) | | | 2,000,000 | | | | 1,995,006 | |
GCAT Trust | | | | | | | | |
2019-NQM3, 2.686%, 11/25/2059(b)(d) | | | 171,930 | | | | 172,153 | |
2021-NQM5, 1.262%, 07/25/2066(b)(d) | | | 1,083,586 | | | | 1,050,197 | |
JPMorgan Chase Bank NA—CACLN | | | | | | | | |
2021-3, 0.760%, 02/26/2029(b) | | | 1,623,694 | | | | 1,600,459 | |
Madison Park Funding XXVI Ltd. | | | | | | | | |
2007-26, 1.499% (3 Month LIBOR USD + 1.200%), 07/29/2030(b)(c) | | | 2,295,000 | | | | 2,292,556 | |
Magnetite XXIII Ltd. | | | | | | | | |
2019-23R, 1.251% (3 Month LIBOR USD + 1.130%), 01/25/2035(b)(c) | | | 1,000,000 | | | | 993,473 | |
MVW LLC | | | | | | | | |
2021-2A A, 1.430%, 05/20/2039(b) | | | 1,003,903 | �� | | | 971,868 | |
2021-2A B, 1.830%, 05/20/2039(b) | | | 819,072 | | | | 797,584 | |
2021-1W, 1.440%, 01/22/2041(b) | | | 473,591 | | | | 459,581 | |
Navient Private Education Refi Loan Trust | | | | | | | | |
2021-B, 0.940%, 07/15/2069(b) | | | 1,129,804 | | | | 1,094,081 | |
2021-C, 1.060%, 10/15/2069(b) | | | 717,924 | | | | 696,182 | |
2021-E, 0.970%, 12/16/2069(b) | | | 1,664,362 | | | | 1,605,987 | |
Navient Student Loan Trust | | | | | | | | |
2019-7, 0.687% (1 Month LIBOR USD + 0.500%), 01/25/2068(b)(c) | | | 445,122 | | | | 444,178 | |
PFS Financing Corp. | | | | | | | | |
2021-B, 0.770%, 08/15/2026(b) | | | 1,890,000 | | | | 1,832,293 | |
Prestige Auto Receivables Trust | | | | | | | | |
2021-1, 1.530%, 02/15/2028(b) | | | 599,000 | | | | 585,499 | |
RASC Trust | | | | | | | | |
2005-KS12, 0.877% (1 Month LIBOR USD + 0.460%), 01/25/2036(c) | | | 168,412 | | | | 168,405 | |
SBA Tower Trust | | | | | | | | |
2020-1-2, 2.328%, 01/15/2028(b) | | | 618,000 | | | | 604,584 | |
2021-3, 2.593%, 10/15/2056(b) | | | 1,243,000 | | | | 1,232,542 | |
Sierra Timeshare Receivables Funding LLC | | | | | | | | |
2019-2, 2.590%, 05/20/2036(b) | | | 491,485 | | | | 490,168 | |
The accompanying notes are an integral part of these financial statements.
16
PMC CORE FIXED INCOME FUND | Schedule of Investments |
February 28, 2022 (Unaudited) (Continued)
| | | | | | | | |
| | |
| | | Principal
Amount
| | | Value
| |
2020-2, 3.510%, 07/20/2037(b) | | $ | 583,050 | | | $ | 586,067 | |
2021-2, 1.350%, 09/20/2038(b) | | | 487,555 | | | | 474,321 | |
Starwood Mortgage Residential Trust | | | | | | | | |
2021-3, 1.127%, 06/25/2056(b)(d) | | | 749,759 | | | | 729,009 | |
2021-6, 1.920%, 11/25/2066(b)(d) | | | 1,021,060 | | | | 999,620 | |
Taco Bell Funding LLC | | | | | | | | |
2021-1, 1.946%, 08/25/2051(b) | | | 1,394,505 | | | | 1,340,439 | |
Thayer Park CLO Ltd. | | | | | | | | |
2017-1A, 1.294% (3 Month LIBOR USD + 1.040%), 04/20/2034(b)(c) | | | 500,000 | | | | 496,503 | |
Towd Point Mortgage Trust | | | | | | | | |
2016-2, 2.750%, 08/25/2055(b)(d) | | | 3,610 | | | | 3,616 | |
2017-5, 0.787% (1 Month LIBOR USD + 0.600%), 02/25/2057(b)(c) | | | 275,114 | | | | 274,859 | |
2017-2, 2.750%, 04/25/2057(b)(d) | | | 24,835 | | | | 24,969 | |
2017-4, 2.750%, 06/25/2057(b)(d) | | | 138,517 | | | | 139,155 | |
2017-3, 2.750%, 07/25/2057(b)(d) | | | 190,155 | | | | 191,518 | |
TRESTLES CLO Ltd. | | | | | | | | |
2017-1, 1.248% (3 Month LIBOR USD + 0.990%), 04/25/2032(b)(c) | | | 500,000 | | | | 496,971 | |
TRESTLES CLO V Ltd. | | | | | | | | |
2021-5, 1.301% (3 Month LIBOR USD + 1.170%), 10/20/2034(b)(c) | | | 1,000,000 | | | | 996,188 | |
United Airlines Pass Through Trust | | | | | | | | |
2020-1, 5.875%, 10/15/2027 | | | 1,185,721 | | | | 1,254,621 | |
Vantage Data Centers Issuer LLC | | | | | | | | |
2019-1, 3.188%, 07/15/2044(b) | | | 1,283,100 | | | | 1,294,167 | |
2021-1, 2.165%, 10/15/2046(b) | | | 1,078,000 | | | | 1,041,489 | |
Verus Securitization Trust | | | | | | | | |
2021-3, 1.046%, 06/25/2066(b)(d) | | | 941,578 | | | | 919,287 | |
2021-6, 1.630%, 10/25/2066(b)(d) | | | 1,399,806 | | | | 1,374,098 | |
Voya CLO Ltd. | | | | | | | | |
2014-2A, 1.261% (3 Month LIBOR USD + 1.020%), 04/17/2030(b)(c) | | | 1,739,040 | | | | 1,738,277 | |
| | | | | | |
|
|
|
TOTAL ASSET BACKED SECURITIES (Cost $44,023,463) | | | | | | | 43,320,284 | |
| | | | | | |
|
|
|
| CORPORATE BONDS—36.41% | | | | | | | | |
Accommodation—0.20% | | | | | | | | |
Wyndham Hotels & Resorts, Inc. | | | | | | | | |
4.375%, 08/15/2028(b)(f) | | | 410,000 | | | | 406,660 | |
Wynn Las Vegas LLC | | | | | | | | |
5.500%, 03/01/2025(b)(f) | | | 415,000 | | | | 421,349 | |
5.250%, 05/15/2027(b)(f) | | | 132,000 | | | | 130,837 | |
| | | | | | |
|
|
|
| | | | | | | | 958,846 | |
| | | | | | |
|
|
|
Administrative and Support Services—2.33% | | | | | | | | |
ASGN, Inc. | | | | | | | | |
4.625%, 05/15/2028(b) | | | 595,000 | | | | 588,586 | |
Booking Holdings, Inc. | | | | | | | | |
3.550%, 03/15/2028 | | | 1,048,000 | | | | 1,113,724 | |
Imola Merger Corp. | | | | | | | | |
4.750%, 05/15/2029(b)(f) | | | 250,000 | | | | 242,865 | |
Korn Ferry | | | | | | | | |
4.625%, 12/15/2027(b) | | | 390,000 | | | | 384,805 | |
Live Nation Entertainment, Inc. | | | | | | | | |
4.750%, 10/15/2027(b) | | | 475,000 | | | | 467,286 | |
PayPal Holdings, Inc. | | | | | | | | |
2.400%, 10/01/2024 | | | 1,117,000 | | | | 1,127,599 | |
The accompanying notes are an integral part of these financial statements.
17
PMC CORE FIXED INCOME FUND | Schedule of Investments |
February 28, 2022 (Unaudited) (Continued)
| | | | | | | | |
| | |
| | | Principal
Amount
| | | Value
| |
Verizon Communications, Inc. | | | | | | | | |
4.329%, 09/21/2028(f) | | $ | 2,509,000 | | | $ | 2,738,062 | |
4.016%, 12/03/2029 | | | 400,000 | | | | 429,730 | |
2.355%, 03/15/2032(b)(f) | | | 2,360,000 | | | | 2,204,736 | |
Visa, Inc. | | | | | | | | |
2.800%, 12/14/2022 | | | 1,649,000 | | | | 1,667,608 | |
| | | | | | |
|
|
|
| | | | | | | | 10,965,001 | |
| | | | | | |
|
|
|
Air Transportation—0.35% | | | | | | | | |
Mileage Plus Holdings LLC / Mileage Plus Intellectual Property Assets Ltd. | | | | | | | | |
6.500%, 06/20/2027(b) | | | 570,000 | | | | 601,994 | |
Southwest Airlines Co. | | | | | | | | |
5.250%, 05/04/2025 | | | 800,000 | | | | 863,559 | |
United Airlines Holdings, Inc. | | | | | | | | |
4.875%, 01/15/2025(f) | | | 205,000 | | | | 204,214 | |
| | | | | | |
|
|
|
| | | | | | | | 1,669,767 | |
| | | | | | |
|
|
|
Ambulatory Health Care Services—0.20% | | | | | | | | |
Acadia Healthcare Co, Inc. | | | | | | | | |
5.000%, 04/15/2029(b) | | | 335,000 | | | | 331,236 | |
DaVita, Inc. | | | | | | | | |
4.625%, 06/01/2030(b)(f) | | | 625,000 | | | | 601,028 | |
| | | | | | |
|
|
|
| | | | | | | | 932,264 | |
| | | | | | |
|
|
|
Beverage and Tobacco Product Manufacturing—1.83% | | | | | | | | |
Anheuser-Busch InBev Worldwide, Inc. | | | | | | | | |
4.350%, 06/01/2040(f) | | | 1,006,000 | | | | 1,071,353 | |
4.600%, 04/15/2048 | | | 720,000 | | | | 789,183 | |
4.750%, 04/15/2058(f) | | | 510,000 | | | | 563,597 | |
5.800%, 01/23/2059 | | | 400,000 | | | | 512,627 | |
PepsiCo, Inc. | | | | | | | | |
3.100%, 07/17/2022 | | | 2,904,000 | | | | 2,917,174 | |
Philip Morris International, Inc. | | | | | | | | |
3.125%, 08/17/2027 | | | 2,669,000 | | | | 2,759,441 | |
| | | | | | |
|
|
|
| | | | | | | | 8,613,375 | |
| | | | | | |
|
|
|
Broadcasting (except Internet)—2.18% | | | | | | | | |
CCO Holdings LLC / CCO Holdings Capital Corp. | | | | | | | | |
4.250%, 02/01/2031(b)(f) | | | 1,078,000 | | | | 1,011,832 | |
Charter Communications Operating LLC / Charter Communications Operating Capital | | | | | | | | |
4.800%, 03/01/2050(f) | | | 2,270,000 | | | | 2,222,538 | |
Comcast Corp. | | | | | | | | |
3.150%, 02/15/2028 | | | 405,000 | | | | 415,940 | |
4.150%, 10/15/2028 | | | 1,549,000 | | | | 1,677,966 | |
CSC Holdings LLC | | | | | | | | |
5.500%, 04/15/2027(b) | | | 380,000 | | | | 379,510 | |
4.625%, 12/01/2030(b)(f) | | | 435,000 | | | | 363,002 | |
3.375%, 02/15/2031(b) | | | 264,000 | | | | 225,259 | |
Discovery Communications LLC | | | | | | | | |
2.950%, 03/20/2023(f) | | | 566,000 | | | | 572,282 | |
DISH DBS Corp. | | | | | | | | |
5.875%, 11/15/2024 | | | 185,000 | | | | 185,185 | |
Fox Corp. | | | | | | | | |
5.576%, 01/25/2049(f) | | | 770,000 | | | | 926,136 | |
The accompanying notes are an integral part of these financial statements.
18
PMC CORE FIXED INCOME FUND | Schedule of Investments |
February 28, 2022 (Unaudited) (Continued)
| | | | | | | | |
| | |
| | | Principal
Amount
| | | Value
| |
Paramount Global | | | | | | | | |
4.950%, 01/15/2031(f) | | $ | 410,000 | | | $ | 454,810 | |
4.200%, 05/19/2032(f) | | | 970,000 | | | | 1,013,168 | |
Sirius XM Radio, Inc. | | | | | | | | |
4.125%, 07/01/2030(b)(f) | | | 840,000 | | | | 795,291 | |
| | | | | | |
|
|
|
| | | | | | | | 10,242,919 | |
| | | | | | |
|
|
|
Building Material and Garden Equipment and Supplies Dealers—0.26% | | | | | | | | |
Home Depot, Inc. | | | | | | | | |
2.700%, 04/01/2023 | | | 1,209,000 | | | | 1,223,039 | |
| | | | | | |
|
|
|
Chemical Manufacturing—1.92% | | | | | | | | |
Abbott Laboratories | | | | | | | | |
3.400%, 11/30/2023 | | | 1,135,000 | | | | 1,168,370 | |
AbbVie, Inc. | | | | | | | | |
4.050%, 11/21/2039 | | | 270,000 | | | | 283,248 | |
4.700%, 05/14/2045 | | | 710,000 | | | | 786,846 | |
4.250%, 11/21/2049(f) | | | 485,000 | | | | 515,285 | |
Amgen, Inc. | | | | | | | | |
3.000%, 02/22/2029 | | | 405,000 | | | | 409,805 | |
Biogen, Inc. | | | | | | | | |
2.250%, 05/01/2030(f) | | | 2,908,000 | | | | 2,663,583 | |
Bristol-Myers Squibb Co. | | | | | | | | |
2.950%, 03/15/2032 | | | 785,000 | | | | 796,733 | |
3.550%, 03/15/2042 | | | 300,000 | | | | 305,926 | |
Merck & Co, Inc. | | | | | | | | |
2.750%, 12/10/2051 | | | 615,000 | | | | 547,583 | |
Roche Holdings, Inc. | | | | | | | | |
2.607%, 12/13/2051(b) | | | 615,000 | | | | 543,644 | |
Viatris, Inc. | | | | | | | | |
4.000%, 06/22/2050(f) | | | 1,140,000 | | | | 1,006,907 | |
| | | | | | |
|
|
|
| | | | | | | | 9,027,930 | |
| | | | | | |
|
|
|
Computer and Electronic Product Manufacturing—2.45% | | | | | | | | |
Apple, Inc. | | | | | | | | |
1.800%, 09/11/2024(f) | | | 2,834,000 | | | | 2,836,194 | |
Broadcom, Inc. | | | | | | | | |
5.000%, 04/15/2030 | | | 701,000 | | | | 774,778 | |
4.150%, 11/15/2030 | | | 1,350,000 | | | | 1,417,305 | |
3.419%, 04/15/2033(b) | | | 1,700,000 | | | | 1,659,640 | |
3.500%, 02/15/2041(b) | | | 1,170,000 | | | | 1,071,428 | |
Dell International LLC / EMC Corp. | | | | | | | | |
5.450%, 06/15/2023 | | | 289,000 | | | | 301,041 | |
6.200%, 07/15/2030 | | | 1,140,000 | | | | 1,350,070 | |
Intel Corp. | | | | | | | | |
3.750%, 03/25/2027(f) | | | 1,036,000 | | | | 1,101,591 | |
Microchip Technology, Inc. | | | | | | | | |
4.333%, 06/01/2023 | | | 690,000 | | | | 711,280 | |
ON Semiconductor Corp. | | | | | | | | |
3.875%, 09/01/2028(b) | | | 330,000 | | | | 327,588 | |
| | | | | | |
|
|
|
| | | | | | | | 11,550,915 | |
| | | | | | |
|
|
|
Construction of Buildings—0.05% | | | | | | | | |
Shea Homes LP / Shea Homes Funding Corp. | | | | | | | | |
4.750%, 02/15/2028(b) | | | 255,000 | | | | 245,135 | |
| | | | | | |
|
|
|
The accompanying notes are an integral part of these financial statements.
19
PMC CORE FIXED INCOME FUND | Schedule of Investments |
February 28, 2022 (Unaudited) (Continued)
| | | | | | | | |
| | |
| | | Principal
Amount
| | | Value
| |
Credit Intermediation and Related Activities—4.89% | | | | | | | | |
Bank of America Corp. | | | | | | | | |
3.875%, 08/01/2025(f) | | $ | 1,632,000 | | | $ | 1,710,304 | |
3.559% to 04/23/2026, then 3 Month LIBOR USD + 1.060%, 04/23/2027(a) | | | 1,610,000 | | | | 1,654,944 | |
3.705% to 04/24/2027, then 3 Month LIBOR USD + 1.512%, 04/24/2028(a) | | | 660,000 | | | | 684,871 | |
3.970% to 03/05/2028, then 3 Month LIBOR USD + 1.070%, 03/05/2029(a) | | | 630,000 | | | | 659,902 | |
2.884% to 10/22/2029, then 3 Month LIBOR USD + 1.190%, 10/22/2030(a) | | | 743,000 | | | | 729,085 | |
2.496% to 02/13/2030, then 3 Month LIBOR USD + 0.990%, 02/13/2031(a) | | | 785,000 | | | | 748,051 | |
Citigroup, Inc. | | | | | | | | |
3.200%, 10/21/2026 | | | 1,157,000 | | | | 1,181,469 | |
4.300%, 11/20/2026(f) | | | 890,000 | | | | 948,053 | |
1.122% to 01/28/2026, then SOFR + 0.765%, 01/28/2027(a)(f) | | | 1,610,000 | | | | 1,517,933 | |
3.887% to 01/10/2027, then 3 Month LIBOR USD + 1.563%, 01/10/2028(a) | | | 835,000 | | | | 873,779 | |
3.520% to 10/27/2027, then 3 Month LIBOR USD + 1.151%, 10/27/2028(a) | | | 455,000 | | | | 468,454 | |
2.976% to 11/05/2029, then SOFR + 1.422%, 11/05/2030(a) | | | 495,000 | | | | 488,802 | |
Ford Motor Credit Co. LLC | | | | | | | | |
5.113%, 05/03/2029(f) | | | 310,000 | | | | 327,312 | |
General Motors Financial Co., Inc. | | | | | | | | |
5.100%, 01/17/2024 | | | 370,000 | | | | 388,482 | |
3.600%, 06/21/2030(f) | | | 700,000 | | | | 702,891 | |
JPMorgan Chase & Co. | | | | | | | | |
2.700%, 05/18/2023(f) | | | 480,000 | | | | 485,718 | |
2.950%, 10/01/2026(f) | | | 1,667,000 | | | | 1,697,417 | |
2.580% to 04/22/2031, then SOFR + 1.250%, 04/22/2032(a) | | | 1,535,000 | | | | 1,465,328 | |
OneMain Finance Corp. | | | | | | | | |
3.500%, 01/15/2027(f) | | | 435,000 | | | | 412,145 | |
Synchrony Financial | | | | | | | | |
2.875%, 10/28/2031 | | | 920,000 | | | | 854,988 | |
Wells Fargo & Co. | | | | | | | | |
2.406% to 10/30/2024, then SOFR + 1.087%, 10/30/2025(a) | | | 900,000 | | | | 897,628 | |
2.393% to 06/02/2027, then SOFR + 2.100%, 06/02/2028(a) | | | 1,020,000 | | | | 998,827 | |
4.150%, 01/24/2029(f) | | | 1,572,000 | | | | 1,677,897 | |
2.572% to 02/11/2030, then SOFR + 1.262%, 02/11/2031(a) | | | 1,045,000 | | | | 1,004,307 | |
5.013% to 04/04/2050, then SOFR + 4.502%, 04/04/2051(a) | | | 365,000 | | | | 449,524 | |
| | | | | | |
|
|
|
| | | | | | | | 23,028,111 | |
| | | | | | |
|
|
|
Electrical Equipment, Appliance, and Component Manufacturing—0.08% | | | | | | | | |
Energizer Holdings, Inc. | | | | | | | | |
4.375%, 03/31/2029(b)(f) | | | 430,000 | | | | 388,612 | |
| | | | | | |
|
|
|
Electronics and Appliance Stores—0.03% | | | | | | | | |
AMC Networks, Inc. | | | | | | | | |
4.250%, 02/15/2029(f) | | | 175,000 | | | | 164,118 | |
| | | | | | |
|
|
|
Food Manufacturing—0.15% | | | | | | | | |
Post Holdings, Inc. | | | | | | | | |
4.625%, 04/15/2030(b)(f) | | | 745,000 | | | | 703,016 | |
| | | | | | |
|
|
|
Food Services and Drinking Places—0.62% | | | | | | | | |
Aramark Services, Inc. | | | | | | | | |
5.000%, 02/01/2028(b)(f) | | | 745,000 | | | | 747,153 | |
McDonald’s Corp. | | | | | | | | |
3.500%, 07/01/2027 | | | 1,631,000 | | | | 1,711,808 | |
Starbucks Corp. | | | | | | | | |
3.000%, 02/14/2032 | | | 470,000 | | | | 466,802 | |
| | | | | | |
|
|
|
| | | | | | | | 2,925,763 | |
| | | | | | |
|
|
|
The accompanying notes are an integral part of these financial statements.
20
PMC CORE FIXED INCOME FUND | Schedule of Investments |
February 28, 2022 (Unaudited) (Continued)
| | | | | | | | |
| | |
| | | Principal
Amount
| | | Value
| |
General Merchandise Stores—0.25% | | | | | | | | |
Walmart, Inc. | | | | | | | | |
2.350%, 12/15/2022 | | $ | 1,149,000 | | | $ | 1,161,562 | |
| | | | | | |
|
|
|
Health and Personal Care Stores—0.28% | | | | | | | | |
CVS Health Corp. | | | | | | | | |
4.125%, 04/01/2040 | | | 560,000 | | | | 576,885 | |
5.050%, 03/25/2048(f) | | | 650,000 | | | | 756,691 | |
| | | | | | |
|
|
|
| | | | | | | | 1,333,576 | |
| | | | | | |
|
|
|
Hospitals—0.36% | | | | | | | | |
HCA, Inc. | | | | | | | | |
5.250%, 06/15/2049(f) | | | 870,000 | | | | 989,177 | |
Tenet Healthcare Corp. | | | | | | | | |
4.625%, 06/15/2028(b) | | | 170,000 | | | | 166,403 | |
6.125%, 10/01/2028(b)(f) | | | 540,000 | | | | 543,521 | |
| | | | | | |
|
|
|
| | | | | | | | 1,699,101 | |
| | | | | | |
|
|
|
Insurance Carriers and Related Activities—1.20% | | | | | | | | |
Berkshire Hathaway, Inc. | | | | | | | | |
2.750%, 03/15/2023 | | | 1,136,000 | | | | 1,150,947 | |
Cigna Corp. | | | | | | | | |
3.200%, 03/15/2040 | | | 690,000 | | | | 636,980 | |
Equitable Holdings, Inc. | | | | | | | | |
5.000%, 04/20/2048 | | | 545,000 | | | | 605,525 | |
MetLife, Inc. | | | | | | | | |
6.500%, 12/15/2032 | | | 2,063,000 | | | | 2,704,835 | |
UnitedHealth Group, Inc. | | | | | | | | |
3.250%, 05/15/2051 | | | 590,000 | | | | 572,626 | |
| | | | | | |
|
|
|
| | | | | | | | 5,670,913 | |
| | | | | | |
|
|
|
Machinery Manufacturing—0.23% | | | | | | | | |
Deere & Co. | | | | | | | | |
5.375%, 10/16/2029 | | | 916,000 | | | | 1,093,368 | |
| | | | | | |
|
|
|
Management of Companies and Enterprises—0.12% | | | | | | | | |
Park Intermediate Holdings LLC / PK Domestic Property LLC / PK Finance Co-Issuer | | | | | | | | |
5.875%, 10/01/2028(b) | | | 570,000 | | | | 579,237 | |
| | | | | | |
|
|
|
Merchant Wholesalers, Durable Goods—0.45% | | | | | | | | |
CDW LLC / CDW Finance Corp. | | | | | | | | |
3.276%, 12/01/2028(f) | | | 1,915,000 | | | | 1,880,750 | |
3.569%, 12/01/2031 | | | 265,000 | | | | 257,717 | |
| | | | | | |
|
|
|
| | | | | | | | 2,138,467 | |
| | | | | | |
|
|
|
Merchant Wholesalers, Nondurable Goods—0.37% | | | | | | | | |
Performance Food Group, Inc. | | | | | | | | |
5.500%, 10/15/2027(b)(f) | | | 155,000 | | | | 157,919 | |
Sysco Corp. | | | | | | | | |
6.600%, 04/01/2050 | | | 764,000 | | | | 1,062,774 | |
Univar Solutions USA, Inc. | | | | | | | | |
5.125%, 12/01/2027(b) | | | 510,000 | | | | 519,866 | |
| | | | | | |
|
|
|
| | | | | | | | 1,740,559 | |
| | | | | | |
|
|
|
Mining (except Oil and Gas)—0.19% | | | | | | | | |
Freeport-McMoRan, Inc. | | | | | | | | |
5.450%, 03/15/2043 | | | 760,000 | | | | 874,456 | |
| | | | | | |
|
|
|
The accompanying notes are an integral part of these financial statements.
21
PMC CORE FIXED INCOME FUND | Schedule of Investments |
February 28, 2022 (Unaudited) (Continued)
| | | | | | | | |
| | |
| | | Principal
Amount
| | | Value
| |
Motor Vehicle and Parts Dealers—0.15% | | | | | | | | |
Volkswagen Group of America Finance LLC | | | | | | | | |
3.350%, 05/13/2025(b) | | $ | 675,000 | | | $ | 690,246 | |
| | | | | | |
|
|
|
Nonstore Retailers—0.71% | | | | | | | | |
Amazon.com, Inc. | | | | | | | | |
3.800%, 12/05/2024(f) | | | 1,646,000 | | | | 1,724,889 | |
eBay, Inc. | | | | | | | | |
2.600%, 05/10/2031 | | | 1,690,000 | | | | 1,607,072 | |
| | | | | | |
|
|
|
| | | | | | | | 3,331,961 | |
| | | | | | |
|
|
|
Oil and Gas Extraction—1.32% | | | | | | | | |
Continental Resources, Inc. | | | | | | | | |
2.268%, 11/15/2026(b) | | | 3,050,000 | | | | 2,911,057 | |
CQP Holdco LP / BIP-V Chinook Holdco LLC | | | | | | | | |
5.500%, 06/15/2031(b) | | | 565,000 | | | | 562,881 | |
Occidental Petroleum Corp. | | | | | | | | |
3.200%, 08/15/2026(f) | | | 700,000 | | | | 701,036 | |
4.300%, 08/15/2039 | | | 260,000 | | | | 246,129 | |
PDC Energy, Inc. | | | | | | | | |
5.750%, 05/15/2026(f) | | | 205,000 | | | | 208,339 | |
Phillips 66 | | | | | | | | |
1.300%, 02/15/2026 | | | 1,290,000 | | | | 1,229,177 | |
Venture Global Calcasieu Pass LLC | | | | | | | | |
3.875%, 08/15/2029(b)(f) | | | 340,000 | | | | 333,446 | |
| | | | | | |
|
|
|
| | | | | | | | 6,192,065 | |
| | | | | | |
|
|
|
Performing Arts, Spectator Sports, and Related Industries—0.05% | | | | | | | | |
Churchill Downs, Inc. | | | | | | | | |
5.500%, 04/01/2027(b) | | | 235,000 | | | | 238,801 | |
| | | | | | |
|
|
|
Petroleum and Coal Products Manufacturing—0.17% | | | | | | | | |
Marathon Petroleum Corp. | | | | | | | | |
4.700%, 05/01/2025 | | | 775,000 | | | | 824,093 | |
| | | | | | |
|
|
|
Pipeline Transportation—1.18% | | | | | | | | |
Antero Midstream Partners LP / Antero Midstream Finance Corp. | | | | | | | | |
5.375%, 06/15/2029(b)(f) | | | 385,000 | | | | 387,420 | |
Buckeye Partners LP | | | | | | | | |
3.950%, 12/01/2026(f) | | | 130,000 | | | | 125,650 | |
DT Midstream, Inc. | | | | | | | | |
4.125%, 06/15/2029(b)(f) | | | 425,000 | | | | 411,933 | |
Energy Transfer LP | | | | | | | | |
3.600%, 02/01/2023 | | | 600,000 | | | | 606,689 | |
6.625% to 02/15/2028, then 3 Month LIBOR USD + 4.155%(a)(h) | | | 785,000 | | | | 711,406 | |
7.125% to 05/15/2030, then 5 Year CMT Rate + 5.306%(a)(h) | | | 1,055,000 | | | | 1,036,538 | |
EQM Midstream Partners LP | | | | | | | | |
5.500%, 07/15/2028 | | | 600,000 | | | | 591,486 | |
MPLX LP | | | | | | | | |
4.700%, 04/15/2048(f) | | | 815,000 | | | | 841,921 | |
Plains All American Pipeline LP / PAA Finance Corp. | | | | | | | | |
4.650%, 10/15/2025(f) | | | 780,000 | | | | 827,012 | |
| | | | | | |
|
|
|
| | | | | | | | 5,540,055 | |
| | | | | | |
|
|
|
The accompanying notes are an integral part of these financial statements.
22
PMC CORE FIXED INCOME FUND | Schedule of Investments |
February 28, 2022 (Unaudited) (Continued)
| | | | | | | | |
| | |
| | | Principal
Amount
| | | Value
| |
Plastics and Rubber Products Manufacturing—0.07% | | | | | | | | |
Goodyear Tire & Rubber Co. | | | | | | | | |
5.250%, 04/30/2031(f) | | $ | 325,000 | | | $ | 316,438 | |
| | | | | | |
|
|
|
Professional, Scientific, and Technical Services—0.49% | | | | | | | | |
Nielsen Finance LLC / Nielsen Finance Co. | | | | | | | | |
5.625%, 10/01/2028(b) | | | 115,000 | | | | 110,314 | |
5.875%, 10/01/2030(b)(f) | | | 545,000 | | | | 524,241 | |
ServiceNow, Inc. | | | | | | | | |
1.400%, 09/01/2030 | | | 1,906,000 | | | | 1,686,965 | |
| | | | | | |
|
|
|
| | | | | | | | 2,321,520 | |
| | | | | | |
|
|
|
Publishing Industries (except Internet)—0.93% | | | | | | | | |
Microsoft Corp. | | | | | | | | |
3.125%, 11/03/2025 | | | 2,692,000 | | | | 2,807,447 | |
Oracle Corp. | | | | | | | | |
2.875%, 03/25/2031 | | | 1,045,000 | | | | 998,546 | |
4.000%, 07/15/2046 | | | 615,000 | | | | 564,743 | |
| | | | | | |
|
|
|
| | | | | | | | 4,370,736 | |
| | | | | | |
|
|
|
Real Estate—0.45% | | | | | | | | |
Public Storage | | | | | | | | |
2.300%, 05/01/2031 | | | 1,381,000 | | | | 1,331,044 | |
RHP Hotel Properties LP / RHP Finance Corp. | | | | | | | | |
4.750%, 10/15/2027 | | | 240,000 | | | | 235,379 | |
Uniti Group LP / Uniti Fiber Holdings Inc / CSL Capital LLC | | | | | | | | |
7.875%, 02/15/2025(b) | | | 515,000 | | | | 536,514 | |
| | | | | | |
|
|
|
| | | | | | | | 2,102,937 | |
| | | | | | |
|
|
|
Rental and Leasing Services—0.14% | | | | | | | | |
Air Lease Corp. | | | | | | | | |
2.300%, 02/01/2025 | | | 655,000 | | | | 650,040 | |
| | | | | | |
|
|
|
Securities, Commodity Contracts, and Other Financial Investments and Related Activities—4.05% | | | | | | | | |
BAT Capital Corp. | | | | | | | | |
3.222%, 08/15/2024 | | | 222,000 | | | | 224,971 | |
3.557%, 08/15/2027 | | | 220,000 | | | | 222,275 | |
3.734%, 09/25/2040 | | | 665,000 | | | | 573,144 | |
Charles Schwab Corp. | | | | | | | | |
2.300%, 05/13/2031 | | | 1,736,000 | | | | 1,661,332 | |
CME Group, Inc. | | | | | | | | |
3.000%, 03/15/2025 | | | 1,092,000 | | | | 1,121,754 | |
CommScope, Inc. | | | | | | | | |
8.250%, 03/01/2027(b)(f) | | | 642,000 | | | | 639,923 | |
Goldman Sachs Group, Inc. | | | | | | | | |
3.850%, 01/26/2027 | | | 1,375,000 | | | | 1,434,335 | |
3.800%, 03/15/2030 | | | 1,110,000 | | | | 1,156,722 | |
2.615% to 04/22/2031, then SOFR + 1.281%, 04/22/2032(a) | | | 1,040,000 | | | | 983,906 | |
2.383% to 07/21/2031, then SOFR + 1.248%, 07/21/2032(a) | | | 1,315,000 | | | | 1,219,633 | |
4.017% to 10/31/2037, then 3 Month LIBOR USD + 1.373%, 10/31/2038(a) | | | 250,000 | | | | 263,970 | |
Morgan Stanley | | | | | | | | |
0.791% to 01/22/2024, then SOFR + 0.509%, 01/22/2025(a)(f) | | | 1,300,000 | | | | 1,264,399 | |
6.250%, 08/09/2026 | | | 2,279,000 | | | | 2,621,501 | |
3.950%, 04/23/2027(f) | | | 935,000 | | | | 988,054 | |
The accompanying notes are an integral part of these financial statements.
23
PMC CORE FIXED INCOME FUND | Schedule of Investments |
February 28, 2022 (Unaudited) (Continued)
| | | | | | | | |
| | |
| | | Principal
Amount
| | | Value
| |
3.591% to 07/22/2027, then 3 Month LIBOR USD + 1.340%, 07/22/2028(a) | | $ | 1,625,000 | | | $ | 1,680,829 | |
3.772% to 01/24/2028, then 3 Month LIBOR USD + 1.140%, 01/24/2029(a)(f) | | | 875,000 | | | | 910,058 | |
2.699% to 01/22/2030, then SOFR + 1.143%, 01/22/2031(a) | | | 1,190,000 | | | | 1,152,132 | |
MPH Acquisition Holdings LLC | | | | | | | | |
5.500%, 09/01/2028(b) | | | 350,000 | | | | 340,118 | |
Prime Security Services Borrower LLC / Prime Finance, Inc. | | | | | | | | |
5.750%, 04/15/2026(b) | | | 585,000 | | | | 601,067 | |
| | | | | | |
|
|
|
| | | | | | | | 19,060,123 | |
| | | | | | |
|
|
|
Support Activities for Mining—0.17% | | | | | | | | |
ConocoPhillips | | | | | | | | |
4.875%, 10/01/2047(b) | | | 295,000 | | | | 353,299 | |
Hilcorp Energy I LP / Hilcorp Finance Co. | | | | | | | | |
6.250%, 11/01/2028(b)(f) | | | 435,000 | | | | 444,209 | |
| | | | | | |
|
|
|
| | | | | | | | 797,508 | |
| | | | | | |
|
|
|
Telecommunications—1.87% | | | | | | | | |
AT&T, Inc. | | | | | | | | |
2.550%, 12/01/2033(f) | | | 1,100,000 | | | | 1,020,809 | |
3.650%, 06/01/2051(f) | | | 845,000 | | | | 796,733 | |
3.500%, 09/15/2053(f) | | | 915,000 | | | | 836,592 | |
3.550%, 09/15/2055 | | | 184,000 | | | | 166,387 | |
3.650%, 09/15/2059 | | | 1,018,000 | | | | 922,349 | |
Frontier Communications Holdings LLC | | | | | | | | |
5.875%, 10/15/2027(b) | | | 400,000 | | | | 406,078 | |
5.000%, 05/01/2028(b)(f) | | | 363,000 | | | | 352,927 | |
Lumen Technologies, Inc. | | | | | | | | |
4.500%, 01/15/2029(b) | | | 360,000 | | | | 301,217 | |
T-Mobile USA, Inc. | | | | | | | | |
2.875%, 02/15/2031(f) | | | 215,000 | | | | 202,051 | |
4.375%, 04/15/2040 | | | 550,000 | | | | 568,619 | |
3.000%, 02/15/2041 | | | 1,186,000 | | | | 1,027,069 | |
4.500%, 04/15/2050 | | | 645,000 | | | | 671,941 | |
3.300%, 02/15/2051 | | | 350,000 | | | | 301,923 | |
3.400%, 10/15/2052(b)(f) | | | 920,000 | | | | 813,115 | |
Ziff Davis, Inc. | | | | | | | | |
4.625%, 10/15/2030(b) | | | 435,000 | | | | 419,120 | |
| | | | | | |
|
|
|
| | | | | | | | 8,806,930 | |
| | | | | | |
|
|
|
Transportation Equipment Manufacturing—1.96% | | | | | | | | |
Boeing Co. | | | | | | | | |
4.875%, 05/01/2025(f) | | | 1,371,000 | | | | 1,459,224 | |
3.900%, 05/01/2049 | | | 185,000 | | | | 169,159 | |
5.805%, 05/01/2050 | | | 1,750,000 | | | | 2,080,067 | |
Ford Motor Co. | | | | | | | | |
9.625%, 04/22/2030(f) | | | 305,000 | | | | 419,633 | |
4.750%, 01/15/2043 | | | 150,000 | | | | 145,270 | |
General Motors Co. | | | | | | | | |
6.125%, 10/01/2025 | | | 1,448,000 | | | | 1,604,341 | |
Raytheon Technologies Corp. | | | | | | | | |
7.500%, 09/15/2029 | | | 2,091,000 | | | | 2,734,655 | |
Spirit AeroSystems, Inc. | | | | | | | | |
5.500%, 01/15/2025(b) | | | 115,000 | | | | 118,321 | |
The accompanying notes are an integral part of these financial statements.
24
PMC CORE FIXED INCOME FUND | Schedule of Investments |
February 28, 2022 (Unaudited) (Continued)
| | | | | | | | |
| | |
| | | Principal
Amount
| | | Value
| |
TransDigm, Inc. | | | | | | | | |
6.250%, 03/15/2026(b) | | $ | 470,000 | | | $ | 485,179 | |
| | | | | | |
|
|
|
| | | | | | | | 9,215,849 | |
| | | | | | |
|
|
|
Utilities—1.48% | | | | | | | | |
Calpine Corp. | | | | | | | | |
4.500%, 02/15/2028(b) | | | 530,000 | | | | 517,617 | |
DTE Energy Co. | | | | | | | | |
3.400%, 06/15/2029 | | | 607,000 | | | | 618,928 | |
Exelon Corp. | | | | | | | | |
4.700%, 04/15/2050 | | | 475,000 | | | | 538,269 | |
Kinder Morgan Energy Partners LP | | | | | | | | |
4.150%, 02/01/2024(f) | | | 755,000 | | | | 780,249 | |
Kinder Morgan, Inc. | | | | | | | | |
5.550%, 06/01/2045(f) | | | 1,745,000 | | | | 1,995,975 | |
New Fortress Energy, Inc. | | | | | | | | |
6.500%, 09/30/2026(b)(f) | | | 295,000 | | | | 282,812 | |
Pacific Gas and Electric Co. | | | | | | | | |
2.500%, 02/01/2031 | | | 1,405,000 | | | | 1,252,040 | |
Southern Co. | | | | | | | | |
2.950%, 07/01/2023(f) | | | 313,000 | | | | 317,074 | |
Vistra Operations Co. LLC | | | | | | | | |
5.000%, 07/31/2027(b)(f) | | | 200,000 | | | | 201,718 | |
4.375%, 05/01/2029(b)(f) | | | 455,000 | | | | 441,700 | |
| | | | | | |
|
|
|
| | | | | | | | 6,946,382 | |
| | | | | | |
|
|
|
Warehousing and Storage—0.23% | | | | | | | | |
Iron Mountain, Inc. | | | | | | | | |
5.250%, 03/15/2028(b) | | | 420,000 | | | | 420,840 | |
4.875%, 09/15/2029(b) | | | 410,000 | | | | 396,294 | |
5.250%, 07/15/2030(b)(f) | | | 260,000 | | | | 257,781 | |
| | | | | | |
|
|
|
| | | | | | | | 1,074,915 | |
| | | | | | |
|
|
|
Total Corporate Bonds (Cost $177,518,958) | | | | | | | 171,410,649 | |
| | | | | | |
|
|
|
| Foreign Corporate Bonds—7.03% | | | | | | | | |
Administrative and Support Services—0.04% | | | | | | | | |
Intelligent Packaging Ltd Finco, Inc. / Intelligent Packaging Ltd Co-Issuer LLC | | | | | | | | |
6.000%, 09/15/2028(b) | | | 200,000 | | | | 194,500 | |
| | | | | | |
|
|
|
Air Transportation—0.76% | | | | | | | | |
Delta Air Lines, Inc. / SkyMiles IP Ltd. | | | | | | | | |
4.500%, 10/20/2025(b) | | | 3,500,000 | | | | 3,596,302 | |
| | | | | | |
|
|
|
Chemical Manufacturing—0.09% | | | | | | | | |
NOVA Chemicals Corp. | | | | | | | | |
4.875%, 06/01/2024(b)(f) | | | 205,000 | | | | 207,813 | |
5.250%, 06/01/2027(b) | | | 230,000 | | | | 230,973 | |
| | | | | | |
|
|
|
| | | | | | | | 438,786 | |
| | | | | | |
|
|
|
Computer and Electronic Product Manufacturing—0.18% | | | | | | | | |
AerCap Ireland Capital DAC / AerCap Global Aviation Trust | | | | | | | | |
4.450%, 10/01/2025 | | | 800,000 | | | | 832,021 | |
| | | | | | |
|
|
|
Credit Intermediation and Related Activities—3.13% | | | | | | | | |
ABN AMRO Bank NV | | | | | | | | |
3.324% to 03/13/2032, then 5 Year CMT Rate + 1.900%, 03/13/2037(a)(b)(f) | | | 600,000 | | | | 560,897 | |
The accompanying notes are an integral part of these financial statements.
25
PMC CORE FIXED INCOME FUND | Schedule of Investments |
February 28, 2022 (Unaudited) (Continued)
| | | | | | | | |
| | |
| | | Principal
Amount
| | | Value
| |
AerCap Ireland Capital DAC / AerCap Global Aviation Trust | | | | | | | | |
3.300%, 01/30/2032(f) | | $ | 880,000 | | | $ | 836,257 | |
Banco Santander SA | | | | | | | | |
1.849%, 03/25/2026 | | | 1,600,000 | | | | 1,536,400 | |
3.490%, 05/28/2030 | | | 400,000 | | | | 400,742 | |
Barclays PLC | | | | | | | | |
2.852% to 05/07/2025, then SOFR + 2.714%, 05/07/2026(a)(f) | | | 2,145,000 | | | | 2,146,831 | |
3.564% to 09/23/2030, then 5 Year CMT Rate + 2.900%, 09/23/2035(a) | | | 1,000,000 | | | | 956,452 | |
BAT International Finance PLC | | | | | | | | |
1.668%, 03/25/2026(f) | | | 1,590,000 | | | | 1,511,907 | |
BNP Paribas SA | | | | | | | | |
2.219% to 06/09/2025, then SOFR + 2.074%, 06/09/2026(a)(b)(f) | | | 1,015,000 | | | | 995,663 | |
3.052% to 01/13/2030, then SOFR + 1.507%, 01/13/2031(a)(b) | | | 615,000 | | | | 598,915 | |
HSBC Holdings PLC | | | | | | | | |
2.633% to 11/07/2024, then SOFR + 1.402%, 11/07/2025(a)(f) | | | 1,417,000 | | | | 1,417,965 | |
2.099% to 06/04/2025, then SOFR + 1.929%, 06/04/2026(a)(f) | | | 200,000 | | | | 195,224 | |
4.950%, 03/31/2030 | | | 285,000 | | | | 315,582 | |
6.000% to 05/22/2027, then 5 Year Mid Swap Rate USD + 3.746%(a)(h) | | | 910,000 | | | | 935,025 | |
Natwest Group PLC | | | | | | | | |
3.032% to 11/28/2030, then 5 Year CMT Rate + 2.350%, 11/28/2035(a)(f) | | | 2,170,000 | | | | 2,012,465 | |
Virgin Media Vendor Financing Notes IV DAC | | | | | | | | |
5.000%, 07/15/2028(b) | | | 350,000 | | | | 332,899 | |
| | | | | | |
|
|
|
| | | | | | | | 14,753,224 | |
| | | | | | |
|
|
|
Food Manufacturing—0.17% | | | | | | | | |
Grupo Bimbo SAB de CV | | | | | | | | |
4.700%, 11/10/2047(b) | | | 730,000 | | | | 798,082 | |
| | | | | | |
|
|
|
Management of Companies and Enterprises—1.40% | | | | | | | | |
Altice France SA | | | | | | | | |
5.500%, 01/15/2028(b) | | | 760,000 | | | | 711,520 | |
Carnival Corp. | | | | | | | | |
10.500%, 02/01/2026(b) | | | 160,000 | | | | 179,806 | |
7.625%, 03/01/2026(b) | | | 580,000 | | | | 596,817 | |
Credit Suisse Group AG | | | | | | | | |
2.997% to 12/14/2022, then 3 Month LIBOR USD + 1.200%, 12/14/2023(a)(b) | | | 1,145,000 | | | | 1,155,316 | |
3.869% to 01/12/2028, then 3 Month LIBOR USD + 1.410%, 01/12/2029(a)(b) | | | 250,000 | | | | 253,655 | |
4.194% to 04/01/2030, then SOFR + 3.730%, 04/01/2031(a)(b) | | | 560,000 | | | | 582,115 | |
3.091% to 05/14/2031, then SOFR + 1.730%, 05/14/2032(a)(b)(f) | | | 830,000 | | | | 787,363 | |
Lloyds Banking Group PLC | | | | | | | | |
1.627% to 05/11/2026, then 1 Year CMT Rate + 0.850%, 05/11/2027(a)(f) | | | 1,610,000 | | | | 1,529,346 | |
3.369% to 12/14/2041, then 5 Year CMT Rate + 1.500%, 12/14/2046(a)(f) | | | 920,000 | | | | 809,317 | |
| | | | | | |
|
|
|
| | | | | | | | 6,605,255 | |
| | | | | | |
|
|
|
Mining (except Oil and Gas)—0.12% | | | | | | | | |
Corp Nacional del Cobre de Chile | | | | | | | | |
3.150%, 01/14/2030 | | | 300,000 | | | | 291,158 | |
Hudbay Minerals, Inc. | | | | | | | | |
6.125%, 04/01/2029(b)(f) | | | 260,000 | | | | 266,210 | |
| | | | | | |
|
|
|
| | | | | | | | 557,368 | |
| | | | | | |
|
|
|
Oil and Gas Extraction—0.22% | | | | | | | | |
Canadian Natural Resources Ltd. | | | | | | | | |
6.250%, 03/15/2038 | | | 850,000 | | | | 1,040,032 | |
| | | | | | |
|
|
|
The accompanying notes are an integral part of these financial statements.
26
PMC CORE FIXED INCOME FUND | Schedule of Investments |
February 28, 2022 (Unaudited) (Continued)
| | | | | | | | |
| | |
| | | Principal
Amount
| | | Value
| |
Paper Manufacturing—0.06% | | | | | | | | |
Intertape Polymer Group, Inc. | | | | | | | | |
4.375%, 06/15/2029(b) | | $ | 285,000 | | | $ | 270,608 | |
| | | | | | |
|
|
|
Securities, Commodity Contracts, and Other Financial Investments and Related Activities—0.55% | | | | | | | | |
Credit Suisse Group AG | | | | | | | | |
3.800%, 06/09/2023 | | | 860,000 | | | | 879,685 | |
KazMunayGas National Co. JSC | | | | | | | | |
5.375%, 04/24/2030(b) | | | 705,000 | | | | 749,943 | |
Societe Generale SA | | | | | | | | |
3.337% to 01/21/2032, then 1 Year CMT Rate + 1.600%, 01/21/2033(a)(b)(f) | | | 975,000 | | | | 938,587 | |
| | | | | | |
|
|
|
| | | | | | | | 2,568,215 | |
| | | | | | |
|
|
|
Support Activities for Transportation—0.09% | | | | | | | | |
American Airlines Inc/AAdvantage Loyalty IP Ltd.(b) | | | | | | | | |
5.500%, 04/20/2026 | | | 405,000 | | | | 415,125 | |
| | | | | | |
|
|
|
Telecommunications—0.12% | | | | | | | | |
Vodafone Group PLC | | | | | | | | |
4.875%, 06/19/2049(f) | | | 500,000 | | | | 554,959 | |
| | | | | | |
|
|
|
Water Transportation—0.10% | | | | | | | | |
Royal Caribbean Cruises Ltd. | | | | | | | | |
5.500%, 04/01/2028(b)(f) | | | 460,000 | | | | 451,396 | |
| | | | | | |
|
|
|
Total Foreign Corporate Bonds (Cost $34,151,282) | | | | | | | 33,075,873 | |
| | | | | | |
|
|
|
| Foreign Government Agency Issues—0.87% | | | | | | | | |
Asian Development Bank | | | | | | | | |
1.500%, 01/20/2027 | | | 845,000 | | | | 833,122 | |
Development Bank of Japan, Inc. | | | | | | | | |
1.000%, 08/27/2030(b) | | | 260,000 | | | | 236,952 | |
European Investment Bank | | | | | | | | |
1.375%, 03/15/2027 | | | 330,000 | | | | 324,216 | |
0.625%, 10/21/2027(f) | | | 165,000 | | | | 154,006 | |
Inter-American Development Bank | | | | | | | | |
1.500%, 01/13/2027 | | | 1,370,000 | | | | 1,354,356 | |
Province of Ontario Canada | | | | | | | | |
2.125%, 01/21/2032 | | | 865,000 | | | | 851,403 | |
Southern Gas Corridor CJSC | | | | | | | | |
6.875%, 03/24/2026(b) | | | 300,000 | | | | 336,285 | |
| | | | | | |
|
|
|
Total Foreign Government Agency Issues (Cost $4,167,943) | | | | | | | 4,090,340 | |
| | | | | | |
|
|
|
| Foreign Government Notes/Bonds—4.48% | | | | | | | | |
Abu Dhabi Government International Bond | | | | | | | | |
4.125%, 10/11/2047(b) | | | 600,000 | | | | 668,870 | |
Brazilian Government International Bond | | | | | | | | |
5.625%, 02/21/2047 | | | 800,000 | | | | 757,936 | |
Colombia Government International Bond | | | | | | | | |
4.000%, 02/26/2024 | | | 590,000 | | | | 600,121 | |
3.875%, 04/25/2027 | | | 150,000 | | | | 144,646 | |
3.000%, 01/30/2030 | | | 570,000 | | | | 491,890 | |
Croatia Government International Bond | | | | | | | | |
6.000%, 01/26/2024(b) | | | 545,000 | | | | 581,881 | |
Dominican Republic International Bond | | | | | | | | |
6.875%, 01/29/2026(b) | | | 330,000 | | | | 360,528 | |
6.850%, 01/27/2045(b) | | | 560,000 | | | | 550,416 | |
The accompanying notes are an integral part of these financial statements.
27
PMC CORE FIXED INCOME FUND | Schedule of Investments |
February 28, 2022 (Unaudited) (Continued)
| | | | | | | | |
| | |
| | | Principal
Amount
| | | Value
| |
Hungary Government International Bond | | | | | | | | |
7.625%, 03/29/2041 | | $ | 560,000 | | | $ | 819,079 | |
Indonesia Government International Bond | | | | | | | | |
4.350%, 01/08/2027(b) | | | 550,000 | | | | 588,505 | |
5.250%, 01/17/2042(b) | | | 410,000 | | | | 461,218 | |
Kazakhstan Government International Bond | | | | | | | | |
5.125%, 07/21/2025(b) | | | 550,000 | | | | 590,555 | |
Mexico Government International Bond | | | | | | | | |
4.150%, 03/28/2027(f) | | | 200,000 | | | | 213,377 | |
4.350%, 01/15/2047(f) | | | 940,000 | | | | 876,456 | |
Morocco Government International Bond | | | | | | | | |
4.250%, 12/11/2022(b) | | | 200,000 | | | | 203,420 | |
5.500%, 12/11/2042(b) | | | 150,000 | | | | 149,119 | |
Namibia International Bonds | | | | | | | | |
5.250%, 10/29/2025(b) | | | 550,000 | | | | 561,787 | |
Nigeria Government International Bond | | | | | | | | |
7.875%, 02/16/2032(b) | | | 535,000 | | | | 493,762 | |
Oman Government International Bond | | | | | | | | |
5.375%, 03/08/2027(b) | | | 1,280,000 | | | | 1,302,259 | |
Panama Government International Bond | | | | | | | | |
3.750%, 03/16/2025 | | | 800,000 | | | | 822,520 | |
Paraguay Government International Bond | | | | | | | | |
4.700%, 03/27/2027(b) | | | 715,000 | | | | 745,216 | |
Peruvian Government International Bond | | | | | | | | |
2.392%, 01/23/2026 | | | 480,000 | | | | 471,715 | |
8.750%, 11/21/2033 | | | 380,000 | | | | 555,754 | |
Philippine Government International Bond | | | | | | | | |
3.950%, 01/20/2040 | | | 640,000 | | | | 632,670 | |
Qatar Government International Bond | | | | | | | | |
4.625%, 06/02/2046(b) | | | 780,000 | | | | 917,631 | |
Republic of Azerbaijan International Bond | | | | | | | | |
4.750%, 03/18/2024(b) | | | 720,000 | | | | 745,988 | |
Republic of South Africa Government International Bond | | | | | | | | |
4.875%, 04/14/2026(f) | | | 200,000 | | | | 205,737 | |
4.850%, 09/27/2027(f) | | | 893,000 | | | | 900,885 | |
4.300%, 10/12/2028 | | | 150,000 | | | | 144,390 | |
5.000%, 10/12/2046 | | | 150,000 | | | | 122,700 | |
Romanian Government International Bond | | | | | | | | |
6.125%, 01/22/2044(b) | | | 975,000 | | | | 1,115,263 | |
Saudi Government International Bond | | | | | | | | |
4.500%, 10/26/2046(b) | | | 755,000 | | | | 818,927 | |
Sri Lanka Government International Bond | | | | | | | | |
6.750%, 04/18/2028(b) | | | 295,000 | | | | 131,909 | |
Trinidad & Tobago Government International Bond | | | | | | | | |
4.500%, 08/04/2026(b) | | | 800,000 | | | | 808,008 | |
Turkey Government International Bond | | | | | | | | |
6.000%, 01/14/2041 | | | 515,000 | | | | 396,895 | |
Ukraine Government International Bond | | | | | | | | |
7.253%, 03/15/2033(b) | | | 690,000 | | | | 241,673 | |
Uruguay Government International Bond | | | | | | | | |
4.375%, 01/23/2031(f) | | | 505,000 | | | | 555,126 | |
5.100%, 06/18/2050 | | | 305,000 | | | | 365,294 | |
| | | | | | |
|
|
|
Total Foreign Government Notes/Bonds (Cost $22,679,374) | | | | | | | 21,114,126 | |
| | | | | | |
|
|
|
The accompanying notes are an integral part of these financial statements.
28
PMC CORE FIXED INCOME FUND | Schedule of Investments |
February 28, 2022 (Unaudited) (Continued)
| | | | | | | | |
| | |
| | | Principal
Amount
| | | Value
| |
| Non-Agency Mortgage Backed Securities—5.12% | | | | | | | | |
Angel Oak Mortgage Trust | | | | | | | | |
2019-6, 2.620%, 11/25/2059(b)(d) | | $ | 135,180 | | | $ | 135,140 | |
Bank | | | | | | | | |
2021-BNK31, 1.739%, 02/15/2054 | | | 454,000 | | | | 433,345 | |
BBCMS Mortgage Trust | | | | | | | | |
2021-C11, 1.390%, 09/15/2054(d)(e) | | | 7,994,304 | | | | 779,971 | |
BB-UBS Trust | | | | | | | | |
2012-SHOW, 3.430%, 11/05/2036(b) | | | 1,646,000 | | | | 1,662,447 | |
Benchmark Mortgage Trust | | | | | | | | |
2021-B23, 1.766%, 02/15/2054 | | | 612,000 | | | | 585,901 | |
2021-B26, 0.999%, 06/15/2054(d)(e) | | | 9,541,144 | | | | 591,289 | |
2021-B31 D, 2.250%, 12/15/2054(b) | | | 278,000 | | | | 219,539 | |
2021-B31 C, 3.195%, 12/15/2054(d) | | | 415,000 | | | | 393,901 | |
BX Commercial Mortgage Trust | | | | | | | | |
2021-VOLT, 1.841% (1 Month LIBOR USD + 1.650%), 09/15/2036(b)(c) | | | 1,085,000 | | | | 1,047,642 | |
BX Trust | | | | | | | | |
2021-SDMF, 1.778% (1 Month LIBOR USD + 1.587%), 09/15/2034(b)(c) | | | 653,000 | | | | 624,711 | |
2019-OC11, 3.202%, 12/09/2041(b) | | | 971,000 | | | | 973,321 | |
Citigroup Commercial Mortgage Trust | | | | | | | | |
2013-GCJ11, 3.732%, 04/10/2046(d) | | | 455,000 | | | | 458,911 | |
2013-GC17, 5.095%, 11/10/2046(d) | | | 145,000 | | | | 148,192 | |
2014-GC25, 0.958%, 10/10/2047(d)(e) | | | 1,359,282 | | | | 28,001 | |
2015-GC27, 1.330%, 02/10/2048(d)(e) | | | 995,956 | | | | 32,063 | |
2018-C6, 4.412%, 11/10/2051 | | | 445,000 | | | | 486,493 | |
COMM Mortgage Trust | | | | | | | | |
2012-CCRE4, 3.251%, 10/15/2045 | | | 476,000 | | | | 474,982 | |
2014-UBS2, 3.472%, 03/10/2047 | | | 310,314 | | | | 315,302 | |
2014-CR16, 0.949%, 04/10/2047(d)(e) | | | 1,250,634 | | | | 21,877 | |
2014-LC15, 1.060%, 04/10/2047(d)(e) | | | 1,223,170 | | | | 21,280 | |
2014-CR17, 0.957%, 05/10/2047(d)(e) | | | 1,051,908 | | | | 17,981 | |
2014-UBS3, 1.064%, 06/10/2047(d)(e) | | | 876,718 | | | | 16,798 | |
2014-UBS6, 0.855%, 12/10/2047(d)(e) | | | 1,494,405 | | | | 29,532 | |
2014-CCRE21, 3.987%, 12/10/2047 | | | 281,514 | | | | 287,189 | |
2015-LC21, 3.708%, 07/10/2048 | | | 100,000 | | | | 103,158 | |
2015-CCRE25, 3.759%, 08/10/2048 | | | 340,000 | | | | 353,317 | |
Connecticut Avenue Securities Trust | | | | | | | | |
2021-R01, 1.600% (SOFR30A + 1.550%), 10/25/2041(b)(c) | | | 480,000 | | | | 471,984 | |
2022-R01, 1.950% (SOFR30A + 1.900%), 12/25/2041(b)(c) | | | 1,070,000 | | | | 1,048,225 | |
CSAIL Commercial Mortgage Trust | | | | | | | | |
2019-C17, 3.016%, 09/15/2029 | | | 850,000 | | | | 857,230 | |
2016-C7, 3.502%, 11/15/2049 | | | 275,000 | | | | 283,293 | |
2015-C1, 4.044%, 04/15/2050(d) | | | 450,000 | | | | 447,014 | |
2015-C2, 0.742%, 06/15/2057(d)(e) | | | 1,506,309 | | | | 28,508 | |
GS Mortgage Securities Trust | | | | | | | | |
2012-GCJ7, 4.740%, 05/10/2045 | | | 405,000 | | | | 405,292 | |
2012-GCJ9, 3.747%, 11/10/2045(b) | | | 345,000 | | | | 347,635 | |
2014-GC18, 1.039%, 01/10/2047(d)(e) | | | 3,319,073 | | | | 53,305 | |
2014-GC26, 0.956%, 11/10/2047(d)(e) | | | 1,956,943 | | | | 43,140 | |
2015-GC34, 3.278%, 10/10/2048 | | | 105,697 | | | | 107,334 | |
Hilton USA Trust | | | | | | | | |
2016-HHV, 3.719%, 11/05/2038(b) | | | 283,000 | | | | 292,888 | |
Hudson Yards Mortgage Trust | | | | | | | | |
2019-55HY, 2.943%, 12/10/2041(b)(d) | | | 865,000 | | | | 862,239 | |
The accompanying notes are an integral part of these financial statements.
29
PMC CORE FIXED INCOME FUND | Schedule of Investments |
February 28, 2022 (Unaudited) (Continued)
| | | | | | | | |
| | |
| | | Principal
Amount
| | | Value
| |
J.P. Morgan Chase Commercial Mortgage Securities Trust | | | | | | | | |
2012-HSBC B, 3.722%, 07/05/2032(b) | | $ | 805,000 | | | $ | 807,541 | |
2012-HSBC C, 4.021%, 07/05/2032(b) | | | 631,000 | | | | 633,168 | |
2022-OPO, 3.377%, 01/05/2039(b) | | | 501,000 | | | | 492,937 | |
JPMBB Commercial Mortgage Securities Trust | | | | | | | | |
2015-C31, 3.801%, 08/15/2048 | | | 312,741 | | | | 323,438 | |
Morgan Stanley Bank of America Merrill Lynch Trust | | | | | | | | |
2013-C9, 2.657%, 05/15/2046 | | | 160,602 | | | | 161,219 | |
Morgan Stanley Capital I Trust | | | | | | | | |
2015-MS1, 3.779%, 05/15/2048(d) | | | 200,000 | | | | 207,254 | |
2018-L1, 4.721%, 10/15/2051(d) | | | 325,000 | | | | 346,843 | |
New Residential Mortgage Loan Trust | | | | | | | | |
2019-NQM5, 2.710%, 11/25/2059(b)(d) | | | 202,865 | | | | 203,636 | |
OBX Trust | | | | | | | | |
2019-EXP3, 1.008% (1 Month LIBOR USD + 0.900%), 10/25/2059(b)(c) | | | 9,052 | | | | 9,075 | |
2021-NQM3, 1.054%, 07/25/2061(b)(d) | | | 918,150 | | | | 889,162 | |
Starwood Mortgage Residential Trust | | | | | | | | |
2019-INV1, 2.610%, 09/27/2049(b)(d) | | | 64,472 | | | | 64,788 | |
UBS Commercial Mortgage Trust | | | | | | | | |
2017-C2, 3.487%, 08/15/2050 | | | 1,025,000 | | | | 1,059,314 | |
2017-C4 A4, 3.563%, 10/15/2050 | | | 460,500 | | | | 476,891 | |
2017-C4 AS, 3.836%, 10/15/2050(d) | | | 200,000 | | | | 205,603 | |
2018-C14, 3.379%, 12/15/2051 | | | 367,624 | | | | 371,108 | |
UBS-Barclays Commercial Mortgage Trust | | | | | | | | |
2013-C6, 2.788%, 04/10/2046 | | | 64,537 | | | | 64,800 | |
Verus Securitization Trust | | | | | | | | |
2019-4, 2.642%, 11/25/2059(b) | | | 75,549 | | | | 75,756 | |
Wells Fargo Commercial Mortgage Trust | | | | | | | | |
2015-C29, 3.637%, 06/15/2048 | | | 130,000 | | | | 133,974 | |
2016-LC24, 2.942%, 10/15/2049 | | | 280,000 | | | | 282,695 | |
2017-C39, 3.418%, 09/15/2050 | | | 260,000 | | | | 269,087 | |
2017-C40, 2.110%, 10/15/2050 | | | 11,912 | | | | 11,909 | |
2018-C46, 4.152%, 08/15/2051 | | | 160,000 | | | | 171,991 | |
2018-C48, 4.302%, 01/15/2052 | | | 625,000 | | | | 679,068 | |
2016-LC25, 3.640%, 12/15/2059 | | | 315,000 | | | | 327,541 | |
WFRBS Commercial Mortgage Trust | | | | | | | | |
2014-LC14, 1.246%, 03/15/2047(d)(e) | | | 730,051 | | | | 13,856 | |
2014-C22, 0.790%, 09/15/2057(d)(e) | | | 3,042,777 | | | | 48,559 | |
2014-C22, 4.069%, 09/15/2057(d) | | | 290,000 | | | | 298,531 | |
| | | | | | |
|
|
|
Total Non-Agency Mortgage Backed Securities (Cost $25,673,356) | | | | | | | 24,120,114 | |
| | | | | | |
|
|
|
| Agency Mortgage Backed Securities—29.98% | | | | | | | | |
Fannie Mae Connecticut Avenue Securities | | | | | | | | |
2017-C03, 3.187% (1 Month LIBOR USD + 3.000%), 10/25/2029(c) | | | 1,348,651 | | | | 1,378,108 | |
2017-C04, 3.037% (1 Month LIBOR USD + 2.850%), 11/25/2029(c) | | | 301,691 | | | | 307,933 | |
2017-C05, 2.387% (1 Month LIBOR USD + 2.200%), 01/25/2030(c) | | | 667,892 | | | | 678,426 | |
2017-C06, 2.987% (1 Month LIBOR USD + 2.800%), 02/25/2030(c) | | | 1,404,400 | | | | 1,434,862 | |
2017-C07 1M2, 2.587% (1 Month LIBOR USD + 2.400%), 05/25/2030(c) | | | 709,954 | | | | 719,663 | |
2017-C07 2M2, 2.687% (1 Month LIBOR USD + 2.500%), 05/25/2030(c) | | | 607,564 | | | | 615,004 | |
2018-C01, 2.437% (1 Month LIBOR USD + 2.250%), 07/25/2030(c) | | | 1,610,699 | | | | 1,627,056 | |
2018-C02, 2.387% (1 Month LIBOR USD + 2.200%), 08/25/2030(c) | | | 1,461,750 | | | | 1,469,201 | |
2018-C03, 2.337% (1 Month LIBOR USD + 2.150%), 10/25/2030(c) | | | 1,065,893 | | | | 1,081,002 | |
2018-C04, 2.737% (1 Month LIBOR USD + 2.550%), 12/25/2030(c) | | | 1,913,722 | | | | 1,942,058 | |
Fannie Mae Interest Strip | | | | | | | | |
4.000%, 08/25/2043(e) | | | 1,483,764 | | | | 243,598 | |
The accompanying notes are an integral part of these financial statements.
30
PMC CORE FIXED INCOME FUND | Schedule of Investments |
February 28, 2022 (Unaudited) (Continued)
| | | | | | | | |
| | |
| | | Principal
Amount
| | | Value
| |
Fannie Mae Pool | | | | | | | | |
MA0096, 4.500%, 06/01/2029 | | $ | 3,619 | | | $ | 3,826 | |
AB3000, 4.500%, 05/01/2031 | | | 9,596 | | | | 10,184 | |
BT1825, 2.000%, 06/01/2036 | | | 163,053 | | | | 162,134 | |
AB1389, 4.500%, 08/01/2040 | | | 28,351 | | | | 30,641 | |
MA0510, 4.500%, 09/01/2040 | | | 330 | | | | 357 | |
AE8714, 3.500%, 11/01/2040 | | | 10,902 | | | | 11,468 | |
890310, 4.500%, 12/01/2040 | | | 6,774 | | | | 7,357 | |
AH3952, 4.000%, 01/01/2041 | | | 83,081 | | | | 88,782 | |
AL0791, 4.000%, 02/01/2041 | | | 30,846 | | | | 33,092 | |
AE0954, 4.500%, 02/01/2041 | | | 23,959 | | | | 26,024 | |
AS7001, 3.000%, 04/01/2041 | | | 600,027 | | | | 618,213 | |
AL0245, 4.000%, 04/01/2041 | | | 6,343 | | | | 6,805 | |
AL0065, 4.500%, 04/01/2041 | | | 11,482 | | | | 12,473 | |
AB3194, 4.500%, 06/01/2041 | | | 8,092 | | | | 8,796 | |
AH7395, 4.500%, 06/01/2041 | | | 2,969 | | | | 3,151 | |
FM0040, 3.000%, 10/01/2041 | | | 103,046 | | | | 106,147 | |
AL1547, 4.500%, 11/01/2041 | | | 4,777 | | | | 5,164 | |
AJ9278, 3.500%, 12/01/2041 | | | 5,690 | | | | 5,977 | |
AJ6346, 3.500%, 12/01/2041 | | | 18,486 | | | | 19,447 | |
AK6744, 4.000%, 03/01/2042 | | | 36,520 | | | | 39,083 | |
AO1214, 3.500%, 04/01/2042 | | | 63,308 | | | | 66,604 | |
AK9393, 3.500%, 04/01/2042 | | | 11,354 | | | | 11,926 | |
AK6568, 3.500%, 04/01/2042 | | | 23,726 | | | | 24,971 | |
AL4029, 4.500%, 04/01/2042 | | | 34,003 | | | | 36,936 | |
AL7306, 4.500%, 09/01/2042 | | | 19,489 | | | | 20,984 | |
AP8743, 3.500%, 10/01/2042 | | | 172,310 | | | | 181,250 | |
AL3714, 3.500%, 01/01/2043 | | | 16,197 | | | | 17,022 | |
AL2897, 3.500%, 01/01/2043 | | | 25,418 | | | | 26,749 | |
AQ9330, 3.500%, 01/01/2043 | | | 22,549 | | | | 23,618 | |
AB7965, 3.500%, 02/01/2043 | | | 14,220 | | | | 14,960 | |
AT1001, 3.500%, 04/01/2043 | | | 17,115 | | | | 18,010 | |
AT2021, 3.500%, 04/01/2043 | | | 15,368 | | | | 16,137 | |
AB9046, 3.500%, 04/01/2043 | | | 43,952 | | | | 46,259 | |
AB9260, 3.500%, 05/01/2043 | | | 44,210 | | | | 46,512 | |
AU0949, 3.500%, 08/01/2043 | | | 37,705 | | | | 39,730 | |
AS0212, 3.500%, 08/01/2043 | | | 37,687 | | | | 39,658 | |
AU3751, 4.000%, 08/01/2043 | | | 74,537 | | | | 79,800 | |
AS0531, 4.000%, 09/01/2043 | | | 34,130 | | | | 36,633 | |
AU6857, 4.000%, 09/01/2043 | | | 35,308 | | | | 37,693 | |
AU4658, 4.500%, 09/01/2043 | | | 5,717 | | | | 6,082 | |
MA1600, 3.500%, 10/01/2043 | | | 17,090 | | | | 17,977 | |
AS1042, 4.000%, 11/01/2043 | | | 28,738 | | | | 30,767 | |
AL4450, 4.500%, 12/01/2043 | | | 14,481 | | | | 15,773 | |
AS1333, 4.500%, 12/01/2043 | | | 12,804 | | | | 13,793 | |
AS1559, 4.000%, 01/01/2044 | | | 18,699 | | | | 20,104 | |
AS2516, 4.500%, 05/01/2044 | | | 14,641 | | | | 15,883 | |
MA1926, 4.500%, 06/01/2044 | | | 16,353 | | | | 17,784 | |
AS2751, 4.500%, 06/01/2044 | | | 17,116 | | | | 18,509 | |
AL6223, 4.500%, 08/01/2044 | | | 16,113 | | | | 17,529 | |
AX0118, 4.000%, 09/01/2044 | | | 131,351 | | | | 139,761 | |
AX2491, 4.000%, 10/01/2044 | | | 9,184 | | | | 9,770 | |
AS3467, 4.000%, 10/01/2044 | | | 11,619 | | | | 12,384 | |
AL6432, 4.000%, 01/01/2045 | | | 27,423 | | | | 29,408 | |
The accompanying notes are an integral part of these financial statements.
31
PMC CORE FIXED INCOME FUND | Schedule of Investments |
February 28, 2022 (Unaudited) (Continued)
| | | | | | | | |
| | |
| | | Principal
Amount
| | | Value
| |
AL6520, 4.000%, 02/01/2045 | | $ | 102,858 | | | $ | 110,022 | |
AZ0814, 3.500%, 07/01/2045 | | | 30,852 | | | | 32,325 | |
AZ0862, 3.500%, 07/01/2045 | | | 51,179 | | | | 53,572 | |
BM1953, 3.500%, 08/01/2045 | | | 64,196 | | | | 67,532 | |
AZ4775, 3.500%, 10/01/2045 | | | 13,050 | | | | 13,616 | |
AZ4788, 4.000%, 10/01/2045 | | | 280,471 | | | | 297,867 | |
AS6311, 3.500%, 12/01/2045 | | | 18,926 | | | | 19,799 | |
CA2929, 3.500%, 12/01/2045 | | | 117,912 | | | | 123,728 | |
AS6405, 4.000%, 12/01/2045 | | | 229,716 | | | | 244,677 | |
AS6464, 3.500%, 01/01/2046 | | | 24,384 | | | | 25,592 | |
BC4114, 3.500%, 02/01/2046 | | | 138,521 | | | | 144,590 | |
AL8219, 4.000%, 02/01/2046 | | | 251,904 | | | | 268,886 | |
AS6795, 4.000%, 03/01/2046 | | | 57,486 | | | | 60,897 | |
AL8387, 4.000%, 03/01/2046 | | | 570,647 | | | | 609,832 | |
BC0305, 4.000%, 03/01/2046 | | | 55,093 | | | | 58,503 | |
FM1370, 3.000%, 04/01/2046 | | | 36,977 | | | | 37,961 | |
BC0793, 3.500%, 04/01/2046 | | | 128,330 | | | | 134,124 | |
BC0835, 4.000%, 04/01/2046 | | | 120,913 | | | | 128,741 | |
AS7248, 4.000%, 05/01/2046 | | | 62,195 | | | | 66,318 | |
AS7200, 4.500%, 05/01/2046 | | | 6,553 | | | | 6,944 | |
AS7388, 3.500%, 06/01/2046 | | | 559,498 | | | | 586,475 | |
AL9282, 4.000%, 06/01/2046 | | | 89,901 | | | | 95,623 | |
AL8735, 4.000%, 06/01/2046 | | | 131,806 | | | | 140,717 | |
AS7401, 4.000%, 06/01/2046 | | | 49,992 | | | | 53,254 | |
AS7580, 3.000%, 07/01/2046 | | | 119,468 | | | | 122,480 | |
AS7492, 4.000%, 07/01/2046 | | | 26,129 | | | | 27,666 | |
AS7801, 3.500%, 08/01/2046 | | | 118,803 | | | | 123,817 | |
MA2737, 3.000%, 09/01/2046 | | | 661,609 | | | | 678,001 | |
MA2771, 3.000%, 10/01/2046 | | | 100,550 | | | | 102,640 | |
AS8056, 3.000%, 10/01/2046 | | | 64,699 | | | | 66,279 | |
BM3932, 3.500%, 10/01/2046 | | | 97,224 | | | | 101,417 | |
AS8269, 3.000%, 11/01/2046 | | | 83,310 | | | | 85,326 | |
BE2975, 4.000%, 01/01/2047 | | | 115,907 | | | | 122,322 | |
AS8699, 4.000%, 01/01/2047 | | | 25,203 | | | | 26,609 | |
AS8661, 4.000%, 01/01/2047 | | | 84,973 | | | | 89,931 | |
AS8659, 4.000%, 01/01/2047 | | | 32,788 | | | | 34,657 | |
MA2872, 4.500%, 01/01/2047 | | | 75,679 | | | | 81,006 | |
AS8700, 4.500%, 01/01/2047 | | | 30,839 | | | | 33,011 | |
BE5475, 3.500%, 02/01/2047 | | | 42,068 | | | | 43,654 | |
AL9879, 3.500%, 02/01/2047 | | | 1,550,907 | | | | 1,623,772 | |
AL9916, 4.000%, 02/01/2047 | | | 130,178 | | | | 138,455 | |
FM4894, 4.000%, 03/01/2047 | | | 494,650 | | | | 525,246 | |
AS8966, 4.000%, 03/01/2047 | | | 24,562 | | | | 25,904 | |
AS8982, 4.500%, 03/01/2047 | | | 10,500 | | | | 11,202 | |
CA5843, 3.000%, 04/01/2047 | | | 126,304 | | | | 128,259 | |
FM1000, 3.000%, 04/01/2047 | | | 236,854 | | | | 241,585 | |
MA2959, 3.500%, 04/01/2047 | | | 92,253 | | | | 96,594 | |
BM5784, 3.500%, 05/01/2047 | | | 119,787 | | | | 125,114 | |
BM5347, 3.500%, 05/01/2047 | | | 104,965 | | | | 109,571 | |
BM5348, 3.500%, 05/01/2047 | | | 54,539 | | | | 56,957 | |
AS9536, 3.500%, 05/01/2047 | | | 47,324 | | | | 49,292 | |
BE3619, 4.000%, 05/01/2047 | | | 105,504 | | | | 111,456 | |
MA3008, 4.500%, 05/01/2047 | | | 21,781 | | | | 23,134 | |
AS9829, 3.500%, 06/01/2047 | | | 43,651 | | | | 45,408 | |
The accompanying notes are an integral part of these financial statements.
32
PMC CORE FIXED INCOME FUND | Schedule of Investments |
February 28, 2022 (Unaudited) (Continued)
| | | | | | | | |
| | |
| | | Principal
Amount
| | | Value
| |
BE3702, 4.000%, 06/01/2047 | | $ | 57,187 | | | $ | 60,319 | |
AS9831, 4.000%, 06/01/2047 | | | 64,370 | | | | 68,042 | |
AS9664, 4.000%, 06/01/2047 | | | 27,943 | | | | 29,499 | |
BM5179, 3.000%, 07/01/2047 | | | 74,954 | | | | 76,912 | |
BE3767, 3.500%, 07/01/2047 | | | 54,105 | | | | 56,312 | |
CA0062, 4.000%, 07/01/2047 | | | 54,600 | | | | 57,487 | |
MA3121, 4.000%, 09/01/2047 | | | 617,243 | | | | 650,198 | |
FM4019, 3.500%, 10/01/2047 | | | 499,667 | | | | 519,168 | |
CA0559, 4.500%, 10/01/2047 | | | 63,895 | | | | 68,050 | |
FM1467, 3.000%, 12/01/2047 | | | 74,304 | | | | 76,572 | |
MA3210, 3.500%, 12/01/2047 | | | 127,057 | | | | 132,028 | |
BH7058, 3.500%, 12/01/2047 | | | 138,567 | | | | 143,444 | |
FM2897, 3.000%, 02/01/2048 | | | 235,915 | | | | 241,529 | |
CA4140, 3.000%, 02/01/2048 | | | 75,143 | | | | 76,747 | |
CA1535, 3.500%, 02/01/2048 | | | 26,970 | | | | 27,982 | |
BJ8783, 3.500%, 02/01/2048 | | | 85,258 | | | | 88,606 | |
MA3278, 4.500%, 02/01/2048 | | | 282,810 | | | | 300,392 | |
CA1218, 4.500%, 02/01/2048 | | | 49,458 | | | | 52,350 | |
BM3590, 3.500%, 03/01/2048 | | | 113,753 | | | | 118,173 | |
FM5923, 3.500%, 03/01/2048 | | | 683,440 | | | | 709,430 | |
BJ0648, 3.500%, 03/01/2048 | | | 54,721 | | | | 56,703 | |
BJ0650, 3.500%, 03/01/2048 | | | 56,603 | | | | 58,673 | |
BM3900, 4.000%, 04/01/2048 | | | 107,481 | | | | 113,125 | |
CA1710, 4.500%, 05/01/2048 | | | 79,851 | | | | 84,676 | |
FM1572, 3.000%, 09/01/2048 | | | 232,473 | | | | 238,394 | |
FM2385, 3.000%, 09/01/2048 | | | 144,523 | | | | 147,208 | |
FM2915, 3.000%, 11/01/2048 | | | 516,229 | | | | 531,737 | |
BM5024, 3.000%, 11/01/2048 | | | 63,518 | | | | 64,608 | |
FM5108, 3.500%, 11/01/2048 | | | 705,205 | | | | 735,700 | |
FM1239, 3.500%, 11/01/2048 | | | 84,953 | | | | 87,954 | |
CA2922, 3.000%, 12/01/2048 | | | 211,256 | | | | 214,219 | |
FM2239, 3.000%, 12/01/2048 | | | 127,341 | | | | 130,309 | |
FM1051, 4.500%, 05/01/2049 | | | 203,276 | | | | 215,323 | |
FM4895, 4.000%, 06/01/2049 | | | 468,672 | | | | 492,727 | |
CA3683, 4.500%, 06/01/2049 | | | 78,479 | | | | 83,157 | |
BO2201, 3.000%, 09/01/2049 | | | 181,467 | | | | 183,507 | |
CA4571, 4.000%, 11/01/2049 | | | 471,315 | | | | 492,672 | |
BO6164, 3.000%, 01/01/2050 | | | 78,651 | | | | 79,757 | |
BO8947, 3.000%, 01/01/2050 | | | 103,159 | | | | 104,274 | |
FM3619, 4.500%, 01/01/2050 | | | 135,247 | | | | 142,979 | |
BP2099, 3.000%, 02/01/2050 | | | 433,361 | | | | 439,430 | |
BP1424, 3.000%, 03/01/2050 | | | 148,335 | | | | 149,932 | |
FM7592, 3.500%, 03/01/2050 | | | 713,273 | | | | 736,865 | |
FM4334, 3.000%, 04/01/2050 | | | 211,124 | | | | 214,130 | |
CA5519, 3.000%, 04/01/2050 | | | 88,748 | | | | 89,876 | |
MA3992, 3.500%, 04/01/2050 | | | 180,868 | | | | 186,887 | |
CA5559, 3.500%, 04/01/2050 | | | 731,468 | | | | 755,520 | |
CA5668, 3.000%, 05/01/2050 | | | 337,021 | | | | 341,245 | |
CA5670, 3.000%, 05/01/2050 | | | 142,120 | | | | 143,652 | |
CA6086, 3.000%, 06/01/2050 | | | 1,420,496 | | | | 1,435,465 | |
BP6466, 3.000%, 07/01/2050 | | | 213,396 | | | | 216,011 | |
CA6291, 3.000%, 07/01/2050 | | | 106,030 | | | | 107,368 | |
BP6481, 4.500%, 07/01/2050 | | | 37,786 | | | | 40,061 | |
BQ0239, 2.500%, 08/01/2050 | | | 213,750 | | | | 211,786 | |
The accompanying notes are an integral part of these financial statements.
33
PMC CORE FIXED INCOME FUND | Schedule of Investments |
February 28, 2022 (Unaudited) (Continued)
| | | | | | | | |
| | |
| | | Principal
Amount
| | | Value
| |
BQ0188, 3.000%, 08/01/2050 | | $ | 116,501 | | | $ | 117,882 | |
BK3044, 2.500%, 09/01/2050 | | | 357,300 | | | | 353,814 | |
BP6716, 2.500%, 09/01/2050 | | | 372,409 | | | | 368,289 | |
MA4121, 3.000%, 09/01/2050 | | | 653,474 | | | | 661,219 | |
FM9143, 4.500%, 09/01/2050 | | | 179,740 | | | | 189,966 | |
MA4160, 3.000%, 10/01/2050 | | | 547,922 | | | | 553,846 | |
MA4170, 4.500%, 10/01/2050 | | | 470,324 | | | | 496,435 | |
FM7475, 4.500%, 10/01/2050 | | | 30,039 | | | | 31,722 | |
MA4208, 2.000%, 12/01/2050 | | | 2,599,260 | | | | 2,500,706 | |
FM5316, 2.000%, 12/01/2050 | | | 209,626 | | | | 201,663 | |
MA4237, 2.000%, 01/01/2051 | | | 218,111 | | | | 209,835 | |
BR1269, 2.500%, 01/01/2051 | | | 843,792 | | | | 833,731 | |
MA4256, 2.500%, 02/01/2051 | | | 758,772 | | | | 749,794 | |
FM6289, 3.000%, 02/01/2051 | | | 612,479 | | | | 619,821 | |
MA4282, 2.500%, 03/01/2051 | | | 482,865 | | | | 477,769 | |
BR7795, 2.500%, 04/01/2051 | | | 749,543 | | | | 741,263 | |
MA4306, 2.500%, 04/01/2051 | | | 305,785 | | | | 302,398 | |
MA4307, 3.000%, 04/01/2051 | | | 943,778 | | | | 954,910 | |
MA4325, 2.000%, 05/01/2051 | | | 747,775 | | | | 717,985 | |
FM7189, 2.500%, 05/01/2051 | | | 537,719 | | | | 531,790 | |
BT2488, 2.500%, 05/01/2051 | | | 481,830 | | | | 476,369 | |
MA4326, 2.500%, 05/01/2051 | | | 504,633 | | | | 498,619 | |
BT0417, 2.500%, 06/01/2051 | | | 325,242 | | | | 321,658 | |
MA4356, 2.500%, 06/01/2051 | | | 993,539 | | | | 982,564 | |
FM7738, 2.500%, 06/01/2051 | | | 540,381 | | | | 534,250 | |
MA4357, 3.000%, 06/01/2051 | | | 746,484 | | | | 754,585 | |
MA4378, 2.000%, 07/01/2051 | | | 700,202 | | | | 672,790 | |
CB1027, 2.500%, 07/01/2051 | | | 276,127 | | | | 273,033 | |
MA4379, 2.500%, 07/01/2051 | | | 393,569 | | | | 388,876 | |
CB1038, 2.500%, 07/01/2051 | | | 353,171 | | | | 349,279 | |
BT1339, 2.500%, 07/01/2051 | | | 800,603 | | | | 791,423 | |
FM8178, 2.500%, 07/01/2051 | | | 833,960 | | | | 824,550 | |
MA4380, 3.000%, 07/01/2051 | | | 1,040,093 | | | | 1,052,355 | |
MA4399, 2.500%, 08/01/2051 | | | 1,786,705 | | | | 1,766,482 | |
BT3273, 2.500%, 08/01/2051 | | | 839,893 | | | | 830,397 | |
FM8360, 2.500%, 08/01/2051 | | | 391,697 | | | | 387,998 | |
MA4401, 3.500%, 08/01/2051 | | | 288,242 | | | | 297,248 | |
MA4437, 2.000%, 10/01/2051 | | | 660,630 | | | | 634,473 | |
MA4493, 2.500%, 12/01/2051 | | | 468,446 | | | | 462,860 | |
FS0121, 2.000%, 01/01/2052 | | | 819,216 | | | | 786,735 | |
Fannie Mae REMICS | | | | | | | | |
2012-70, 5.892% (1 Month LIBOR USD + 6.000%), 07/25/2042(c)(e) | | | 1,080,020 | | | | 196,427 | |
2012-68, 5.942% (1 Month LIBOR USD + 6.050%), 07/25/2042(c)(e) | | | 1,812,517 | | | | 353,384 | |
2013-6, 5.992% (1 Month LIBOR USD + 6.100%), 02/25/2043(c)(e) | | | 1,161,613 | | | | 216,907 | |
2013-18, 5.992% (1 Month LIBOR USD + 6.100%), 03/25/2043(c)(e) | | | 1,172,113 | | | | 203,994 | |
2014-90, 6.042% (1 Month LIBOR USD + 6.150%), 01/25/2045(c)(e) | | | 1,749,281 | | | | 300,454 | |
2015-32, 6.092% (1 Month LIBOR USD + 6.200%), 05/25/2045(c)(e) | | | 1,140,945 | | | | 234,457 | |
2016-03, 4.000%, 02/25/2046(e) | | | 520,515 | | | | 83,558 | |
2016-40, 5.742% (1 Month LIBOR USD + 5.850%), 07/25/2046(c)(e) | | | 717,474 | | | | 120,760 | |
2018-07, 4.000%, 02/25/2048(e) | | | 1,450,525 | | | | 216,556 | |
2020-52, 4.500%, 08/25/2050(e) | | | 1,304,971 | | | | 256,715 | |
Freddie Mac Gold Pool | | | | | | | | |
G1-3122, 5.000%, 04/01/2023 | | | 96 | | | | 98 | |
G1-4953, 3.500%, 01/01/2029 | | | 19,287 | | | | 20,036 | |
The accompanying notes are an integral part of these financial statements.
34
PMC CORE FIXED INCOME FUND | Schedule of Investments |
February 28, 2022 (Unaudited) (Continued)
| | | | | | | | |
| | |
| | | Principal
Amount
| | | Value
| |
A8-6315, 4.500%, 05/01/2039 | | $ | 16,399 | | | $ | 17,794 | |
A8-6521, 4.500%, 05/01/2039 | | | 30,618 | | | | 33,309 | |
A9-3617, 4.500%, 08/01/2040 | | | 2,493 | | | | 2,686 | |
Q0-0285, 4.500%, 04/01/2041 | | | 4,367 | | | | 4,750 | |
Q0-0876, 4.500%, 05/01/2041 | | | 26,944 | | | | 29,097 | |
Q0-2173, 4.500%, 07/01/2041 | | | 17,950 | | | | 19,511 | |
Q0-3705, 4.000%, 10/01/2041 | | | 17,352 | | | | 18,182 | |
C0-3795, 3.500%, 04/01/2042 | | | 136,210 | | | | 143,409 | |
Q0-9004, 3.500%, 06/01/2042 | | | 12,274 | | | | 12,899 | |
C0-9004, 3.500%, 07/01/2042 | | | 12,928 | | | | 13,614 | |
Q0-9896, 3.500%, 08/01/2042 | | | 16,642 | | | | 17,525 | |
Q1-1348, 3.500%, 09/01/2042 | | | 35,634 | | | | 37,513 | |
Q1-8305, 3.500%, 05/01/2043 | | | 13,895 | | | | 14,602 | |
Q1-9475, 3.500%, 06/01/2043 | | | 24,732 | | | | 25,967 | |
G6-0030, 3.500%, 07/01/2043 | | | 77,196 | | | | 81,342 | |
Q2-0780, 3.500%, 08/01/2043 | | | 29,294 | | | | 30,834 | |
Q2-0857, 3.500%, 08/01/2043 | | | 19,082 | | | | 20,091 | |
G0-7459, 3.500%, 08/01/2043 | | | 15,186 | | | | 15,990 | |
G0-8541, 3.500%, 08/01/2043 | | | 26,933 | | | | 28,361 | |
V8-0509, 4.000%, 10/01/2043 | | | 16,182 | | | | 17,379 | |
G0-8558, 4.000%, 11/01/2043 | | | 18,443 | | | | 19,782 | |
Q2-6367, 4.000%, 05/01/2044 | | | 4,959 | | | | 5,312 | |
Q2-6513, 4.500%, 06/01/2044 | | | 12,260 | | | | 12,978 | |
Q2-9916, 4.000%, 11/01/2044 | | | 21,447 | | | | 22,963 | |
Q4-5219, 3.500%, 01/01/2045 | | | 88,016 | | | | 92,468 | |
G0-7961, 3.500%, 03/01/2045 | | | 20,831 | | | | 21,891 | |
G0-8633, 4.000%, 03/01/2045 | | | 41,683 | | | | 44,734 | |
G0-8636, 3.500%, 04/01/2045 | | | 24,889 | | | | 26,068 | |
G0-8637, 4.000%, 04/01/2045 | | | 21,329 | | | | 22,804 | |
Q3-3869, 4.000%, 06/01/2045 | | | 14,265 | | | | 15,279 | |
Q3-5225, 3.500%, 08/01/2045 | | | 12,413 | | | | 12,978 | |
G0-8659, 3.500%, 08/01/2045 | | | 68,533 | | | | 71,772 | |
G0-8660, 4.000%, 08/01/2045 | | | 82,600 | | | | 88,295 | |
V8-1873, 4.000%, 08/01/2045 | | | 18,966 | | | | 20,275 | |
G0-8672, 4.000%, 10/01/2045 | | | 13,940 | | | | 14,869 | |
V8-1992, 4.000%, 10/01/2045 | | | 260,406 | | | | 278,062 | |
G0-8676, 3.500%, 11/01/2045 | | | 29,478 | | | | 30,842 | |
G6-0480, 4.500%, 11/01/2045 | | | 12,768 | | | | 13,807 | |
G0-8681, 3.500%, 12/01/2045 | | | 21,985 | | | | 23,024 | |
G0-8682, 4.000%, 12/01/2045 | | | 27,804 | | | | 29,670 | |
Q3-8473, 4.000%, 01/01/2046 | | | 28,812 | | | | 30,612 | |
Q3-8470, 4.000%, 01/01/2046 | | | 16,588 | | | | 17,695 | |
G0-8694, 4.000%, 02/01/2046 | | | 16,459 | | | | 17,560 | |
Q3-9644, 3.500%, 03/01/2046 | | | 95,534 | | | | 99,882 | |
G0-8693, 3.500%, 03/01/2046 | | | 4,973 | | | | 5,208 | |
Q3-9434, 3.500%, 03/01/2046 | | | 4,613 | | | | 4,830 | |
Q3-9438, 4.000%, 03/01/2046 | | | 88,170 | | | | 93,769 | |
G0-8699, 4.000%, 03/01/2046 | | | 43,491 | | | | 46,241 | |
G0-8702, 3.500%, 04/01/2046 | | | 51,788 | | | | 54,140 | |
Q4-0718, 3.500%, 05/01/2046 | | | 142,053 | | | | 148,714 | |
G0-8706, 3.500%, 05/01/2046 | | | 23,611 | | | | 24,861 | |
Q4-0375, 3.500%, 05/01/2046 | | | 31,199 | | | | 32,615 | |
G0-8708, 4.500%, 05/01/2046 | | | 35,938 | | | | 38,648 | |
Q4-1208, 3.500%, 06/01/2046 | | | 72,247 | | | | 75,614 | |
The accompanying notes are an integral part of these financial statements.
35
PMC CORE FIXED INCOME FUND | Schedule of Investments |
February 28, 2022 (Unaudited) (Continued)
| | | | | | | | |
| | |
| | | Principal
Amount
| | | Value
| |
Q4-5458, 4.000%, 08/01/2046 | | $ | 69,932 | | | $ | 74,344 | |
G0-8721, 3.000%, 09/01/2046 | | | 48,393 | | | | 49,629 | |
G0-8735, 4.500%, 10/01/2046 | | | 51,477 | | | | 55,378 | |
G0-8741, 3.000%, 01/01/2047 | | | 874,040 | | | | 895,102 | |
G0-8743, 4.000%, 01/01/2047 | | | 42,269 | | | | 44,865 | |
Q4-6279, 3.500%, 02/01/2047 | | | 60,991 | | | | 63,560 | |
Q4-6283, 4.000%, 02/01/2047 | | | 51,924 | | | | 54,802 | |
G0-8752, 4.000%, 03/01/2047 | | | 20,484 | | | | 21,841 | |
Q4-6539, 4.500%, 03/01/2047 | | | 3,511 | | | | 3,714 | |
G0-8757, 3.500%, 04/01/2047 | | | 9,352 | | | | 9,761 | |
G0-8759, 4.500%, 04/01/2047 | | | 16,627 | | | | 17,783 | |
V8-3204, 4.500%, 05/01/2047 | | | 38,621 | | | | 41,042 | |
Q4-9100, 4.000%, 07/01/2047 | | | 107,222 | | | | 113,013 | |
Q4-9394, 4.500%, 07/01/2047 | | | 75,438 | | | | 80,643 | |
Q4-9888, 3.500%, 08/01/2047 | | | 47,668 | | | | 49,658 | |
Q5-0109, 3.500%, 08/01/2047 | | | 11,601 | | | | 12,080 | |
Q5-0035, 3.500%, 08/01/2047 | | | 72,767 | | | | 75,832 | |
G6-1228, 4.000%, 08/01/2047 | | | 138,992 | | | | 146,855 | |
G0-8779, 3.500%, 09/01/2047 | | | 203,869 | | | | 211,978 | |
G0-8785, 4.000%, 10/01/2047 | | | 106,754 | | | | 112,139 | |
Q5-2319, 3.500%, 11/01/2047 | | | 153,039 | | | | 158,958 | |
G6-1631, 3.500%, 11/01/2047 | | | 179,235 | | | | 187,139 | |
G6-1467, 4.000%, 11/01/2047 | | | 139,321 | | | | 146,492 | |
G6-1281, 3.500%, 01/01/2048 | | | 85,251 | | | | 88,706 | |
G0-8800, 3.500%, 02/01/2048 | | | 120,941 | | | | 125,373 | |
Q5-4463, 4.000%, 02/01/2048 | | | 74,890 | | | | 79,299 | |
G6-7710, 3.500%, 03/01/2048 | | | 162,295 | | | | 169,141 | |
Freddie Mac Multifamily Structured Pass Through Certificates | | | | | | | | |
K-098, 1.391%, 08/25/2029(d)(e) | | | 1,985,000 | | | | 187,852 | |
Freddie Mac Pool | | | | | | | | |
SB-0525, 2.000%, 05/01/2036 | | | 441,355 | | | | 438,869 | |
RC-1914, 2.000%, 06/01/2036 | | | 463,750 | | | | 461,137 | |
ZS-9972, 3.000%, 03/01/2042 | | | 820,361 | | | | 844,661 | |
ZM-0630, 4.000%, 01/01/2046 | | | 609,208 | | | | 650,372 | |
ZT-0390, 4.000%, 03/01/2046 | | | 104,182 | | | | 111,792 | |
ZM-1590, 3.000%, 08/01/2046 | | | 624,543 | | | | 639,036 | |
SD-0035, 3.000%, 04/01/2047 | | | 527,980 | | | | 542,981 | |
ZM-4908, 3.500%, 11/01/2047 | | | 244,862 | | | | 254,176 | |
ZA-5250, 4.000%, 01/01/2048 | | | 226,043 | | | | 237,957 | |
ZS-4759, 3.500%, 03/01/2048 | | | 153,047 | | | | 158,681 | |
ZM-6197, 4.000%, 04/01/2048 | | | 564,464 | | | | 594,359 | |
SD-0298, 3.000%, 11/01/2048 | | | 369,400 | | | | 377,682 | |
ZN-2103, 4.500%, 12/01/2048 | | | 45,885 | | | | 48,622 | |
ZA-7141, 3.000%, 06/01/2049 | | | 75,265 | | | | 76,352 | |
SD-8005, 3.500%, 08/01/2049 | | | 734,104 | | | | 758,688 | |
SD-8013, 4.500%, 09/01/2049 | | | 115,273 | | | | 122,053 | |
SI-2009, 3.000%, 10/01/2049 | | | 448,584 | | | | 456,112 | |
QA-5549, 3.000%, 12/01/2049 | | | 274,737 | | | | 278,409 | |
QA-7325, 3.000%, 02/01/2050 | | | 194,883 | | | | 197,718 | |
QA-6750, 3.000%, 02/01/2050 | | | 150,251 | | | | 152,323 | |
QA-8311, 3.000%, 03/01/2050 | | | 215,910 | | | | 219,753 | |
SD-8068, 3.000%, 06/01/2050 | | | 621,916 | | | | 628,996 | |
RA-2970, 2.500%, 07/01/2050 | | | 201,840 | | | | 200,397 | |
SD-8074, 3.000%, 07/01/2050 | | | 92,803 | | | | 93,803 | |
The accompanying notes are an integral part of these financial statements.
36
PMC CORE FIXED INCOME FUND | Schedule of Investments |
February 28, 2022 (Unaudited) (Continued)
| | | | | | | | |
| | |
| | | Principal
Amount
| | | Value
| |
SD-8075, 3.500%, 07/01/2050 | | $ | 552,011 | | | $ | 570,290 | |
QB-2682, 2.500%, 08/01/2050 | | | 150,261 | | | | 148,759 | |
SD-8084, 3.000%, 08/01/2050 | | | 268,924 | | | | 271,824 | |
SD-8086, 4.000%, 08/01/2050 | | | 237,720 | | | | 248,508 | |
RA-3484, 3.000%, 09/01/2050 | | | 321,015 | | | | 324,479 | |
SD-8098, 2.000%, 10/01/2050 | | | 2,522,427 | | | | 2,426,674 | |
QB-4785, 2.500%, 10/01/2050 | | | 211,566 | | | | 209,367 | |
QB-6037, 2.500%, 11/01/2050 | | | 155,650 | | | | 153,987 | |
SD-8122, 2.500%, 01/01/2051 | | | 453,564 | | | | 448,720 | |
SD-8123, 3.000%, 01/01/2051 | | | 646,865 | | | | 654,446 | |
RA-4527, 2.500%, 02/01/2051 | | | 312,890 | | | | 309,414 | |
SD-8129, 2.500%, 02/01/2051 | | | 614,644 | | | | 609,188 | |
SD-8135, 2.500%, 03/01/2051 | | | 219,756 | | | | 217,607 | |
QC-0945, 2.500%, 04/01/2051 | | | 885,899 | | | | 876,090 | |
SD-8147, 2.500%, 05/01/2051 | | | 504,661 | | | | 498,646 | |
QC-2565, 2.000%, 06/01/2051 | | | 567,971 | | | | 545,760 | |
QC-3907, 2.500%, 07/01/2051 | | | 486,122 | | | | 480,764 | |
QC-4235, 2.500%, 07/01/2051 | | | 795,173 | | | | 785,691 | |
SD-8156, 2.500%, 07/01/2051 | | | 462,687 | | | | 457,582 | |
SD-8160, 2.000%, 08/01/2051 | | | 865,506 | | | | 831,458 | |
QC-5978, 2.500%, 08/01/2051 | | | 675,876 | | | | 668,436 | |
QC-6209, 2.500%, 08/01/2051 | | | 413,754 | | | | 408,820 | |
RA-5855, 2.500%, 09/01/2051 | | | 770,843 | | | | 762,367 | |
SD-8169, 3.500%, 09/01/2051 | | | 130,858 | | | | 134,907 | |
SD-8184, 3.000%, 12/01/2051 | | | 221,179 | | | | 223,579 | |
SD-8189, 2.500%, 01/01/2052 | | | 1,164,987 | | | | 1,151,095 | |
Freddie Mac REMICS | | | | | | | | |
4122, 4.000%, 10/15/2042(e) | | | 1,154,328 | | | | 179,492 | |
4121, 6.009% (1 Month LIBOR USD + 6.200%), 10/15/2042(c)(e) | | | 1,084,312 | | | | 208,451 | |
4159, 5.959% (1 Month LIBOR USD + 6.150%), 01/15/2043(c)(e) | | | 1,484,571 | | | | 302,334 | |
4459, 4.000%, 08/15/2043(e) | | | 2,232,930 | | | | 339,609 | |
4385, 4.500%, 09/15/2044(e) | | | 225,744 | | | | 35,289 | |
4572, 5.859% (1 Month LIBOR USD + 6.050%), 04/15/2046(c)(e) | | | 494,468 | | | | 89,212 | |
4583, 5.809% (1 Month LIBOR USD + 6.000%), 05/15/2046(c)(e) | | | 517,406 | | | | 86,152 | |
4616, 5.809% (1 Month LIBOR USD + 6.000%), 09/15/2046(c)(e) | | | 1,263,116 | | | | 227,078 | |
4623, 5.809% (1 Month LIBOR USD + 6.000%), 10/15/2046(c)(e) | | | 1,096,376 | | | | 233,453 | |
4648, 5.809% (1 Month LIBOR USD + 6.000%), 01/15/2047(c)(e) | | | 486,906 | | | | 85,053 | |
Freddie Mac Structured Agency Credit Risk Debt Notes | | | | | | | | |
2017-HQA3, 2.458% (1 Month LIBOR USD + 2.350%), 04/25/2030(c) | | | 872,499 | | | | 884,022 | |
2018-DNA1, 1.908% (1 Month LIBOR USD + 1.800%), 07/25/2030(c) | | | 409,501 | | | | 411,851 | |
2018-HQA1, 2.408% (1 Month LIBOR USD + 2.300%), 09/25/2030(c) | | | 736,146 | | | | 743,158 | |
2019-CS03, 0.108% (1 Month LIBOR USD + 0.000%), 10/25/2032(b)(c) | | | 938,477 | | | | 938,579 | |
2021-DNA7, 0.900% (SOFR30A + 0.850%), 11/25/2041(b)(c) | | | 1,987,000 | | | | 1,964,464 | |
2022-DNA2, 2.449% (SOFR30A + 2.400%), 02/25/2042(b)(c) | | | 1,650,000 | | | | 1,643,287 | |
Ginnie Mae | | | | | | | | |
#TBA, 3.000%, 03/15/2043 | | | 9,515,000 | | | | 9,671,896 | |
#TBA, 3.500%, 03/15/2045 | | | 300,000 | | | | 309,574 | |
#TBA, 2.500%, 03/20/2050 | | | 1,480,000 | | | | 1,479,027 | |
Ginnie Mae II Pool | | | | | | | | |
MA0699M, 3.500%, 01/20/2043 | | | 27,912 | | | | 29,320 | |
MA0783M, 3.500%, 02/20/2043 | | | 38,012 | | | | 40,406 | |
MA0934M, 3.500%, 04/20/2043 | | | 26,897 | | | | 28,594 | |
MA3663M, 3.500%, 05/20/2046 | | | 48,664 | | | | 50,892 | |
MA3803M, 3.500%, 07/20/2046 | | | 18,995 | | | | 19,880 | |
The accompanying notes are an integral part of these financial statements.
37
PMC CORE FIXED INCOME FUND | Schedule of Investments |
February 28, 2022 (Unaudited) (Continued)
| | | | | | | | |
| | |
| | | Principal
Amount
| | | Value
| |
MA4510M, 3.500%, 06/20/2047 | | $ | 77,968 | | | $ | 81,266 | |
MA4586M, 3.500%, 07/20/2047 | | | 107,272 | | | | 111,797 | |
MA4652M, 3.500%, 08/20/2047 | | | 72,272 | | | | 75,404 | |
MA4900M, 3.500%, 12/20/2047 | | | 54,557 | | | | 56,915 | |
MA6542M, 3.500%, 03/20/2050 | | | 307,412 | | | | 317,869 | |
MA6600M, 3.500%, 04/20/2050 | | | 22,284 | | | | 23,059 | |
MA6601M, 4.000%, 04/20/2050 | | | 102,583 | | | | 107,286 | |
MA7138M, 3.500%, 01/20/2051 | | | 273,059 | | | | 282,347 | |
MA7192M, 2.000%, 02/20/2051 | | | 329,651 | | | | 323,766 | |
MA7193M, 2.500%, 02/20/2051 | | | 340,881 | | | | 341,400 | |
MA7254M, 2.000%, 03/20/2051 | | | 335,714 | | | | 329,280 | |
MA7255M, 2.500%, 03/20/2051 | | | 838,073 | | | | 839,008 | |
MA7311M, 2.000%, 04/20/2051 | | | 954,202 | | | | 936,774 | |
MA7312M, 2.500%, 04/20/2051 | | | 918,133 | | | | 919,157 | |
MA7367M, 2.500%, 05/20/2051 | | | 336,150 | | | | 336,524 | |
MA7418M, 2.500%, 06/20/2051 | | | 701,423 | | | | 702,206 | |
MA7472M, 2.500%, 07/20/2051 | | | 453,744 | | | | 454,251 | |
MA7589M, 2.500%, 09/20/2051 | | | 1,071,558 | | | | 1,072,755 | |
MA7648M, 2.000%, 10/20/2051 | | | 320,188 | | | | 313,716 | |
MA7766M, 2.000%, 12/20/2051 | | | 521,969 | | | | 511,391 | |
MA7767M, 2.500%, 12/20/2051 | | | 248,122 | | | | 248,400 | |
Government National Mortgage Association | | | | | | | | |
2013-23, 3.500%, 02/20/2043(e) | | | 669,835 | | | | 118,991 | |
2015-162, 6.646% (1 Month LIBOR USD + 6.750%), 11/20/2045(c)(e) | | | 1,018,902 | | | | 206,678 | |
2018-007, 6.096% (1 Month LIBOR USD + 6.200%), 01/20/2048(c)(e) | | | 1,176,108 | | | | 187,308 | |
2021-116, 2.500%, 06/20/2051(e) | | | 2,882,565 | | | | 360,878 | |
Uniform Mortgage Backed Securities | | | | | | | | |
#TBA, 3.500%, 03/15/2041 | | | 2,370,000 | | | | 2,441,193 | |
#TBA, 3.000%, 03/15/2043 | | | 9,320,000 | | | | 9,408,149 | |
#TBA, 2.500%, 03/15/2047 | | | 8,430,000 | | | | 8,317,437 | |
#TBA, 2.000%, 05/25/2050 | | | 1,345,000 | | | | 1,289,423 | |
| | | | | | |
|
|
|
Total Agency Mortgage Backed Securities (Cost $143,059,331) | | | | | | | 141,162,450 | |
| | | | | | |
|
|
|
| U.S. Government Agency Issues—0.45% | | | | | | | | |
Federal Home Loan Mortgage Corp. | | | | | | | | |
0.375%, 09/23/2025 | | | 225,000 | | | | 214,487 | |
Federal National Mortgage Association | | | | | | | | |
0.500%, 11/07/2025 | | | 255,000 | | | | 243,595 | |
0.750%, 10/08/2027 | | | 745,000 | | | | 701,190 | |
0.875%, 08/05/2030 | | | 575,000 | | | | 521,466 | |
Tennessee Valley Authority | | | | | | | | |
5.250%, 09/15/2039 | | | 320,000 | | | | 428,866 | |
| | | | | | |
|
|
|
Total U.S. Government Agency Issues (Cost $2,182,726) | | | | | | | 2,109,604 | |
| | | | | | |
|
|
|
| U.S. Government Notes/Bonds—9.34% | | | | | | | | |
United States Treasury Note/Bond | | | | | | | | |
1.500%, 01/15/2023 | | | 2,120,000 | | | | 2,129,285 | |
0.250%, 04/15/2023 | | | 6,425,000 | | | | 6,362,130 | |
2.750%, 04/30/2023 | | | 6,670,000 | | | | 6,792,327 | |
0.625%, 07/31/2026 | | | 855,000 | | | | 814,788 | |
1.250%, 12/31/2026 | | | 395,000 | | | | 386,205 | |
1.875%, 02/15/2032 | | | 2,265,000 | | | | 2,272,964 | |
3.125%, 02/15/2042 | | | 730,000 | | | | 831,373 | |
3.125%, 02/15/2043 | | | 640,000 | | | | 727,150 | |
The accompanying notes are an integral part of these financial statements.
38
PMC CORE FIXED INCOME FUND | Schedule of Investments |
February 28, 2022 (Unaudited) (Continued)
| | | | | | | | |
| | |
| | | Principal
Amount
| | | Value
| |
3.625%, 02/15/2044 | | $ | 3,395,000 | | | $ | 4,161,925 | |
3.125%, 08/15/2044 | | | 1,255,000 | | | | 1,432,024 | |
3.000%, 11/15/2044 | | | 1,813,300 | | | | 2,030,825 | |
3.000%, 05/15/2045 | | | 1,290,000 | | | | 1,446,664 | |
2.250%, 08/15/2046 | | | 2,130,000 | | | | 2,102,543 | |
3.000%, 05/15/2047 | | | 2,420,000 | | | | 2,748,780 | |
2.750%, 08/15/2047 | | | 740,000 | | | | 808,248 | |
3.000%, 02/15/2048 | | | 1,175,000 | | | | 1,348,450 | |
2.375%, 05/15/2051 | | | 4,980,000 | | | | 5,177,449 | |
1.875%, 11/15/2051 | | | 2,565,000 | | | | 2,385,851 | |
| | | | | | |
|
|
|
Total U.S. Government Notes/Bonds (Cost $44,940,356) | | | | | | | 43,958,981 | |
| | | | | | |
|
|
|
| U.S. Treasury Bills—2.65% | | | | | | | | |
United States Treasury Bill | | | | | | | | |
0.301%, 05/19/2022(i) | | | 1,265,000 | | | | 1,264,177 | |
0.355%, 06/16/2022(i) | | | 6,230,000 | | | | 6,222,635 | |
0.579%, 09/08/2022(i) | | | 5,000,000 | | | | 4,982,717 | |
| | | | | | |
|
|
|
Total U.S. Treasury Bills (Cost $12,472,490) | | | | | | | 12,469,529 | |
| | | | | | |
|
|
|
| | |
| | | Shares
| | | | |
| Exchange Traded Funds—0.12% | | | | | | | | |
iShares Core U.S. Aggregate Bond ETF | | | 5,148 | | | | 568,133 | |
| | | | | | |
|
|
|
Total Exchange Traded Funds (Cost $593,629) | | | | | | | 568,133 | |
| | | | | | |
|
|
|
| Investments Purchased With Collateral From Securities Lending—13.36% | | | | | | | | |
Money Market Fund—13.36% | | | | | | | | |
Mount Vernon Liquid Assets Portfolio, LLC, 0.120%(g) | | | 62,887,790 | | | | 62,887,790 | |
| | | | | | |
|
|
|
Total Investments Purchased With Collateral From Securities Lending
(Cost $62,887,790) | | | | | | | 62,887,790 | |
| | | | | | |
|
|
|
| Short-Term Investments—2.04% | | | | | | | | |
First American Government Obligations Fund, Class X, 0.026%(g) | | | 9,584,953 | | | | 9,584,953 | |
| | | | | | |
|
|
|
Total Short-Term Investments (Cost $9,584,953) | | | | | | | 9,584,953 | |
| | | | | | |
|
|
|
| Total Investments (Cost $583,935,651)—121.05% | | | | | | | 569,872,826 | |
Liabilities in Excess of Other Assets—(21.05)% | | | | | | | (99,109,063 | ) |
| | | | | | |
|
|
|
| Total Net Assets—100.00% | | | | | | $ | 470,763,763 | |
| | | | | | |
|
|
|
Percentages are stated as a percent of net assets.
| (a) | | Variable rate security; the rate shown represents the rate at February 28, 2022. |
| (b) | | Securities issued under Rule 144A under the Securities Act of 1933. Such securities are deemed to be liquid. |
| (c) | | Floating rate security; the rate shown represents the rate at February 28, 2022. The coupon is based on an underlying pool of loans and other conditions at the time the loans are securitized. |
| (d) | | Variable rate security; the rate shown represents the rate at February 28, 2022. The coupon is based on an underlying pool of loans and other conditions at the time the loans are securitized. |
| (e) | | Represents an interest-only security that entitles holders to receive only interest payments on underlying mortgages. |
| (f) | | All or portion of this security is out on loan as of February 28, 2022. Total value of securities out on loan is $62,124,037. |
| (g) | | The rate shown represents the seven day yield at February 28, 2022. |
| (h) | | Perpetual maturity. The date referenced is the next call date. |
| (i) | | Rate shown is the effective yield based on purchase price. The calculation assumes the security is held to maturity. |
Abbreviations
| # | | TBA Pool number to be announced |
The accompanying notes are an integral part of these financial statements.
39
PMC DIVERSIFIED EQUITY FUND | Schedule of Investments |
February 28, 2022 (Unaudited)
| | | | | | | | |
| | |
| | | Shares
| | | Value
| |
| Common Stocks—95.73% | | | | | | | | |
Accommodation—0.14% | | | | | | | | |
Caesars Entertainment, Inc.(a)(c) | | | 5,883 | | | $ | 495,290 | |
GreenTree Hospitality Group Ltd.—ADR | | | 1,760 | | | | 9,997 | |
Huazhu Group Ltd.—ADR(a) | | | 1,461 | | | | 60,427 | |
MGM Resorts International | | | 20,190 | | | | 894,215 | |
Vail Resorts, Inc. | | | 193 | | | | 50,286 | |
| | | | | | |
|
|
|
| | | | | | | | 1,510,215 | |
| | | | | | |
|
|
|
Administration of Human Resource Programs—0.01% | | | | | | | | |
Hailiang Education Group, Inc.—ADR(a) | | | 4,740 | | | | 65,080 | |
| | | | | | |
|
|
|
Administrative and Support Services—1.70% | | | | | | | | |
9F, Inc.—ADR(a) | | | 28,478 | | | | 33,604 | |
ABM Industries, Inc. | | | 6,173 | | | | 276,736 | |
Alibaba Group Holding Ltd.—ADR(a) | | | 24,410 | | | | 2,567,688 | |
Alliance Data Systems Corp.(c) | | | 748 | | | | 50,453 | |
AMN Healthcare Services, Inc.(a)(c) | | | 3,103 | | | | 329,352 | |
ASGN, Inc.(a)(c) | | | 2,866 | | | | 317,524 | |
Atlas Copco AB—Class A—ADR | | | 31,217 | | | | 1,580,517 | |
Atlas Copco AB—Class B—ADR | | | 22,868 | | | | 1,029,060 | |
Baker Hughes Co.(c) | | | 5,630 | | | | 165,409 | |
Bilibili, Inc.—ADR(a)(c) | | | 3,228 | | | | 102,037 | |
Broadridge Financial Solutions, Inc.(c) | | | 1,949 | | | | 284,963 | |
Cloudflare, Inc.—Class A(a) | | | 7,949 | | | | 925,423 | |
Conduent, Inc.(a)(c) | | | 34,726 | | | | 169,116 | |
Criteo SA—ADR(a) | | | 26,893 | | | | 894,461 | |
Deutsche Post AG—ADR | | | 45,317 | | | | 2,260,865 | |
Evolent Health, Inc.—Class A(a) | | | 5,742 | | | | 153,024 | |
Expedia Group, Inc.(a) | | | 467 | | | | 91,583 | |
Fortum OYJ—ADR | | | 182,288 | | | | 754,672 | |
Genetron Holdings Ltd.—ADR(a) | | | 2,414 | | | | 8,087 | |
HeadHunter Group PLC—ADR | | | 3,254 | | | | 40,838 | |
Hillenbrand, Inc. | | | 7,163 | | | | 341,747 | |
Jiayin Group, Inc.—ADR(a) | | | 11,742 | | | | 24,071 | |
Kforce, Inc. | | | 8,370 | | | | 629,256 | |
Korn Ferry | | | 4,260 | | | | 282,268 | |
ManpowerGroup, Inc. | | | 5,688 | | | | 604,521 | |
MasTec, Inc.(a)(c) | | | 6,050 | | | | 476,498 | |
QIWI PLC—ADR(c) | | | 29,317 | | | | 147,904 | |
Robert Half International, Inc.(c) | | | 2,854 | | | | 343,308 | |
Secom Co. Ltd.—ADR | | | 46,020 | | | | 845,295 | |
Teleperformance—ADR | | | 912 | | | | 167,917 | |
TrueBlue, Inc.(a) | | | 8,722 | | | | 237,238 | |
TTEC Holdings, Inc.(c) | | | 4,901 | | | | 389,630 | |
Tuniu Corp.—ADR(a)(c) | | | 13,367 | | | | 14,035 | |
Verizon Communications, Inc. | | | 31,983 | | | | 1,716,528 | |
| | | | | | |
|
|
|
| | | | | | | | 18,255,628 | |
| | | | | | |
|
|
|
Air Transportation—0.05% | | | | | | | | |
Atlas Air Worldwide Holdings, Inc.(a)(c) | | | 4,001 | | | | 313,518 | |
Controladora Vuela Cia de Aviacion SAB de CV—ADR(a) | | | 8,674 | | | | 165,587 | |
Swire Pacific Ltd.—Class A—ADR | | | 9,942 | | | | 55,332 | |
| | | | | | |
|
|
|
| | | | | | | | 534,437 | |
| | | | | | |
|
|
|
The accompanying notes are an integral part of these financial statements.
40
PMC DIVERSIFIED EQUITY FUND | Schedule of Investments |
February 28, 2022 (Unaudited) (Continued)
| | | | | | | | |
| | |
| | | Shares
| | | Value
| |
Ambulatory Health Care Services—0.75% | | | | | | | | |
Acadia Healthcare Co., Inc.(a) | | | 4,520 | | | $ | 256,329 | |
Accustem Sciences Ltd.—ADR(a) | | | 54,218 | | | | 6,506 | |
Aesthetic Medical International Holdings Group Ltd.—ADR(a) | | | 1,724 | | | | 5,379 | |
Amedisys, Inc.(a)(c) | | | 1,476 | | | | 236,514 | |
Apollo Medical Holdings, Inc.(a)(c) | | | 1,976 | | | | 95,085 | |
CareDx, Inc.(a)(c) | | | 2,247 | | | | 86,240 | |
Laboratory Corp. of America Holdings(a) | | | 6,841 | | | | 1,855,689 | |
MEDNAX, Inc.(a) | | | 6,060 | | | | 142,228 | |
Medpace Holdings, Inc.(a) | | | 2,731 | | | | 417,761 | |
Molina Healthcare, Inc.(a) | | | 2,292 | | | | 703,346 | |
Novocure Ltd.(a)(b) | | | 2,225 | | | | 182,139 | |
Option Care Health, Inc.(a)(c) | | | 8,677 | | | | 222,999 | |
Progyny, Inc.(a)(c) | | | 3,341 | | | | 131,502 | |
Quest Diagnostics, Inc.(c) | | | 12,604 | | | | 1,654,527 | |
Sonic Healthcare Ltd.—ADR | | | 79,231 | | | | 2,012,468 | |
| | | | | | |
|
|
|
| | | | | | | | 8,008,712 | |
| | | | | | |
|
|
|
Animal Production and Aquaculture—0.06% | | | | | | | | |
Cresud SACIF y A—ADR(a) | | | 46,245 | | | | 301,980 | |
Mowi ASA—ADR | | | 11,567 | | | | 297,711 | |
| | | | | | |
|
|
|
| | | | | | | | 599,691 | |
| | | | | | |
|
|
|
Apparel Manufacturing—0.09% | | | | | | | | |
ANTA Sports Products Ltd.—ADR(c) | | | 1,423 | | | | 545,991 | |
Deckers Outdoor Corp.(a)(c) | | | 984 | | | | 284,022 | |
Shenzhou International Group Holdings Ltd.—ADR(c) | | | 9,675 | | | | 162,347 | |
| | | | | | |
|
|
|
| | | | | | | | 992,360 | |
| | | | | | |
|
|
|
Beverage and Tobacco Product Manufacturing—1.34% | | | | | | | | |
Altria Group, Inc. | | | 46,119 | | | | 2,365,444 | |
Cia Cervecerias Unidas SA—ADR | | | 8,418 | | | | 134,520 | |
Coca-Cola Consolidated, Inc. | | | 599 | | | | 297,661 | |
Coca-Cola Femsa SAB de CV—ADR | | | 10,110 | | | | 556,657 | |
Diageo PLC—ADR | | | 9,601 | | | | 1,917,223 | |
Embotelladora Andina SA—Class A—ADR | | | 5,829 | | | | 61,729 | |
Embotelladora Andina SA—Class B—ADR | | | 7,036 | | | | 91,468 | |
Japan Tobacco, Inc.—ADR | | | 173,052 | | | | 1,583,426 | |
Keurig Dr Pepper, Inc. | | | 24,851 | | | | 960,988 | |
Kirin Holdings Co. Ltd.—ADR | | | 34,440 | | | | 578,248 | |
Monster Beverage Corp.(a) | | | 5,747 | | | | 485,047 | |
Philip Morris International, Inc. | | | 40,044 | | | | 4,047,247 | |
Swedish Match AB—ADR(c) | | | 132,422 | | | | 958,735 | |
Vector Group Ltd.(c) | | | 24,177 | | | | 271,024 | |
| | | | | | |
|
|
|
| | | | | | | | 14,309,417 | |
| | | | | | |
|
|
|
Broadcasting (except Internet)—1.26% | | | | | | | | |
Altice USA, Inc.—Class A(a)(c) | | | 64,783 | | | | 748,891 | |
Comcast Corp.—Class A | | | 53,913 | | | | 2,520,973 | |
Discovery, Inc.—Class A(a)(c) | | | 31,909 | | | | 895,047 | |
Discovery, Inc.—Class C(a)(c) | | | 42,631 | | | | 1,192,389 | |
DISH Network Corp.—Class A(a)(c) | | | 46,363 | | | | 1,481,761 | |
EW Scripps Co.—Class A(a)(c) | | | 8,631 | | | | 192,126 | |
Fox Corp.—Class A(c) | | | 40,374 | | | | 1,688,844 | |
Fox Corp.—Class B | | | 28,973 | | | | 1,108,507 | |
The accompanying notes are an integral part of these financial statements.
41
PMC DIVERSIFIED EQUITY FUND | Schedule of Investments |
February 28, 2022 (Unaudited) (Continued)
| | | | | | | | |
| | |
| | | Shares
| | | Value
| |
Grupo Televisa SAB—ADR | | | 35,988 | | | $ | 383,992 | |
Nexstar Media Group, Inc.—Class A(c) | | | 3,535 | | | | 654,152 | |
Paramount Global—Class A(c) | | | 19,630 | | | | 668,402 | |
Paramount Global—Class B(c) | | | 41,276 | | | | 1,263,458 | |
ProSiebenSat.1 Media SE—ADR | | | 128,469 | | | | 431,656 | |
Roku, Inc.(a)(c) | | | 657 | | | | 91,671 | |
WideOpenWest, Inc.(a) | | | 10,933 | | | | 185,752 | |
| | | | | | |
|
|
|
| | | | | | | | 13,507,621 | |
| | | | | | |
|
|
|
Building Material and Garden Equipment and Supplies Dealers—0.66% | | | | | | | | |
Home Depot, Inc. | | | 5,850 | | | | 1,847,606 | |
Lowe’s Companies, Inc. | | | 13,903 | | | | 3,073,396 | |
Snap-on, Inc.(c) | | | 9,993 | | | | 2,100,329 | |
| | | | | | |
|
|
|
| | | | | | | | 7,021,331 | |
| | | | | | |
|
|
|
Chemical Manufacturing—7.14% | | | | | | | | |
Abbott Laboratories | | | 11,542 | | | | 1,392,196 | |
AbbVie, Inc. | | | 14,167 | | | | 2,093,458 | |
Albemarle Corp.(c) | | | 300 | | | | 58,767 | |
Alkermes PLC(a)(b) | | | 13,203 | | | | 328,227 | |
Alterity Therapeutics Ltd.—ADR(a)(c) | | | 82,386 | | | | 70,028 | |
Arkema SA—ADR | | | 8,071 | | | | 1,063,031 | |
Asahi Kasei Corp.—ADR | | | 11,172 | | | | 210,480 | |
Astellas Pharma, Inc.—ADR | | | 55,713 | | | | 929,293 | |
AstraZeneca PLC—ADR | | | 29,072 | | | | 1,769,903 | |
Bicycle Therapeutics PLC—ADR(a) | | | 1,906 | | | | 90,535 | |
BioLine RX Ltd.—ADR(a)(c) | | | 19,489 | | | | 29,623 | |
Biondvax Pharmaceuticals Ltd.—ADR(a) | | | 50,005 | | | | 63,506 | |
Bio-Techne Corp. | | | 1,298 | | | | 544,394 | |
Blueprint Medicines Corp.(a)(c) | | | 429 | | | | 25,976 | |
Celanese Corp. | | | 2,499 | | | | 348,061 | |
Cellectis SA—ADR(a) | | | 9,406 | | | | 42,609 | |
CF Industries Holdings, Inc. | | | 11,797 | | | | 957,798 | |
Chugai Pharmaceutical Co. Ltd.—ADR | | | 57,934 | | | | 964,022 | |
Clinuvel Pharmaceuticals Ltd.—ADR(c) | | | 21,124 | | | | 313,691 | |
Corcept Therapeutics, Inc.(a)(c) | | | 7,399 | | | | 164,924 | |
CSL Ltd.—ADR | | | 3,734 | | | | 354,394 | |
Daiichi Sankyo Co. Ltd.—ADR | | | 44,545 | | | | 1,087,789 | |
Denali Therapeutics, Inc.(a)(c) | | | 7,508 | | | | 244,460 | |
Dow, Inc.(c) | | | 3,323 | | | | 195,924 | |
Dr Reddy’s Laboratories Ltd.—ADR | | | 9,780 | | | | 522,448 | |
DuPont de Nemours, Inc. | | | 24,188 | | | | 1,871,426 | |
Editas Medicine, Inc.(a) | | | 3,930 | | | | 67,282 | |
Eisai Co. Ltd.—ADR(c) | | | 7,916 | | | | 395,483 | |
Eli Lilly & Co. | | | 9,710 | | | | 2,427,015 | |
Emergent BioSolutions, Inc.(a) | | | 3,458 | | | | 143,092 | |
Fate Therapeutics, Inc.(a) | | | 2,116 | | | | 73,108 | |
Gilead Sciences, Inc. | | | 27,602 | | | | 1,667,161 | |
Givaudan SA—ADR | | | 828 | | | | 68,972 | |
GlaxoSmithKline PLC—ADR | | | 80,744 | | | | 3,379,944 | |
H Lundbeck A/S—ADR | | | 7,039 | | | | 175,412 | |
Halozyme Therapeutics, Inc.(a)(c) | | | 8,752 | | | | 310,433 | |
Horizon Therapeutics PLC(a)(b) | | | 5,763 | | | | 525,413 | |
Innoviva, Inc.(a)(c) | | | 17,143 | | | | 329,317 | |
Intellia Therapeutics, Inc.(a)(c) | | | 2,124 | | | | 209,957 | |
The accompanying notes are an integral part of these financial statements.
42
PMC DIVERSIFIED EQUITY FUND | Schedule of Investments |
February 28, 2022 (Unaudited) (Continued)
| | | | | | | | |
| | |
| | | Shares
| | | Value
| |
Inter Parfums, Inc. | | | 2,269 | | | $ | 210,745 | |
Ipsen SA—ADR | | | 14,944 | | | | 446,078 | |
Ironwood Pharmaceuticals, Inc.(a)(c) | | | 26,687 | | | | 287,152 | |
Kao Corp.—ADR | | | 103,520 | | | | 959,630 | |
Kazia Therapeutics Ltd.—ADR(a) | | | 26,411 | | | | 179,859 | |
Kose Corp.—ADR(c) | | | 33,747 | | | | 775,844 | |
Kronos Worldwide, Inc. | | | 1,476 | | | | 21,741 | |
Kuraray Co. Ltd.—ADR | | | 2,743 | | | | 76,886 | |
LyondellBasell Industries NV—Class A(b) | | | 9,150 | | | | 889,655 | |
Maravai LifeSciences Holdings, Inc.—Class A(a)(c) | | | 9,864 | | | | 385,386 | |
Merck & Co., Inc. | | | 14,870 | | | | 1,138,745 | |
Merck KGaA—ADR | | | 34,616 | | | | 1,367,678 | |
Meridian Bioscience, Inc.(a) | | | 5,981 | | | | 151,319 | |
Moderna, Inc.(a) | | | 7,755 | | | | 1,191,168 | |
Mosaic Co.(c) | | | 17,662 | | | | 926,019 | |
Myriad Genetics, Inc.(a)(c) | | | 6,464 | | | | 157,592 | |
Neurocrine Biosciences, Inc.(a) | | | 2,461 | | | | 221,170 | |
Novartis AG—ADR | | | 71,060 | | | | 6,214,908 | |
Novavax, Inc.(a)(c) | | | 1,324 | | | | 110,382 | |
Novo Nordisk A/S—ADR | | | 73,227 | | | | 7,538,720 | |
Novozymes A/S—ADR | | | 7,102 | | | | 462,411 | |
Nu Skin Enterprises, Inc.—Class A(c) | | | 3,322 | | | | 154,108 | |
Olin Corp. | | | 7,026 | | | | 361,909 | |
Ono Pharmaceutical Co. Ltd.—ADR | | | 118,074 | | | | 978,833 | |
OPKO Health, Inc.(a)(c) | | | 57,505 | | | | 179,991 | |
Otsuka Holdings Co. Ltd.—ADR | | | 45,063 | | | | 779,139 | |
Pacira BioSciences, Inc.(a)(c) | | | 1,941 | | | | 129,445 | |
Pfizer, Inc. | | | 91,608 | | | | 4,300,080 | |
Prestige Consumer Healthcare, Inc.(a) | | | 6,616 | | | | 393,850 | |
Procter & Gamble Co. | | | 7,895 | | | | 1,230,751 | |
Quidel Corp.(a)(c) | | | 1,823 | | | | 192,855 | |
Regeneron Pharmaceuticals, Inc.(a) | | | 3,845 | | | | 2,377,594 | |
Repligen Corp.(a) | | | 2,513 | | | | 494,307 | |
Sage Therapeutics, Inc.(a)(c) | | | 6,644 | | | | 241,642 | |
Sanofi—ADR | | | 70,579 | | | | 3,701,869 | |
Santen Pharmaceutical Co. Ltd.—ADR | | | 19,039 | | | | 215,712 | |
Shin-Etsu Chemical Co. Ltd.—ADR | | | 65,294 | | | | 2,549,079 | |
Shionogi & Co Ltd.—ADR | | | 53,993 | | | | 900,333 | |
Sika AG—ADR | | | 17,727 | | | | 584,636 | |
Sumitomo Chemical Co. Ltd.—ADR(c) | | | 24,198 | | | | 579,058 | |
Supernus Pharmaceuticals, Inc.(a)(c) | | | 9,425 | | | | 301,129 | |
Sysmex Corp.—ADR | | | 23,678 | | | | 941,911 | |
Takeda Pharmaceutical Co. Ltd.—ADR | | | 81,734 | | | | 1,242,357 | |
Trinity Biotech PLC—ADR(a) | | | 105,078 | | | | 106,129 | |
Tronox Holdings PLC—Class A(b) | | | 13,230 | | | | 268,569 | |
Twist Bioscience Corp.(a)(c) | | | 1,562 | | | | 87,378 | |
United Therapeutics Corp.(a) | | | 3,879 | | | | 644,690 | |
West Pharmaceutical Services, Inc. | | | 5,028 | | | | 1,946,238 | |
Westlake Corp.(c) | | | 1,135 | | | | 125,202 | |
XTL Biopharmaceuticals Ltd.—ADR(a) | | | 5,461 | | | | 12,997 | |
Yara International ASA—ADR | | | 37,263 | | | | 960,640 | |
Zoetis, Inc. | | | 1,509 | | | | 292,218 | |
| | | | | | |
|
|
|
| | | | | | | | 76,497,289 | |
| | | | | | |
|
|
|
The accompanying notes are an integral part of these financial statements.
43
PMC DIVERSIFIED EQUITY FUND | Schedule of Investments |
February 28, 2022 (Unaudited) (Continued)
| | | | | | | | |
| | |
| | | Shares
| | | Value
| |
Clothing and Clothing Accessories Stores—0.67% | | | | | | | | |
Abercrombie & Fitch Co.—Class A(a)(c) | | | 10,422 | | | $ | 396,870 | |
Academy Sports & Outdoors, Inc.(a)(c) | | | 9,790 | | | | 316,902 | |
American Eagle Outfitters, Inc.(c) | | | 11,404 | | | | 240,396 | |
ASOS PLC—ADR(a) | | | 1,655 | | | | 42,964 | |
Bath & Body Works, Inc.(a)(c) | | | 36,513 | | | | 1,948,699 | |
Buckle, Inc.(c) | | | 8,625 | | | | 310,500 | |
Burberry Group PLC—ADR | | | 1,038 | | | | 26,749 | |
Foot Locker, Inc.(c) | | | 7,403 | | | | 234,083 | |
Genesco, Inc.(a)(c) | | | 5,209 | | | | 334,157 | |
KKR & Co, Inc. | | | 30,651 | | | | 1,842,738 | |
Pandora A/S—ADR(c) | | | 39,297 | | | | 1,006,003 | |
Signet Jewelers Ltd.(b) | | | 3,655 | | | | 257,678 | |
Zumiez, Inc.(a)(c) | | | 6,045 | | | | 268,942 | |
| | | | | | |
|
|
|
| | | | | | | | 7,226,681 | |
| | | | | | |
|
|
|
Computer and Electronic Product Manufacturing—14.39% | | | | | | | | |
ABIOMED, Inc.(a) | | | 26 | | | | 8,079 | |
ADTRAN, Inc. | | | 577 | | | | 11,880 | |
Advanced Micro Devices, Inc.(a) | | | 15,666 | | | | 1,932,244 | |
Advantest Corp.—ADR | | | 17,729 | | | | 1,407,505 | |
Agilent Technologies, Inc. | | | 12,539 | | | | 1,634,584 | |
Alphabet, Inc.—Class A(a) | | | 3,833 | | | | 10,353,469 | |
Alphabet, Inc.—Class C(a) | | | 3,541 | | | | 9,552,981 | |
Amkor Technology, Inc.(c) | | | 18,526 | | | | 419,984 | |
Amphenol Corp.—Class A | | | 17,790 | | | | 1,352,218 | |
Analog Devices, Inc. | | | 537 | | | | 86,076 | |
Apple, Inc. | | | 146,347 | | | | 24,164,817 | |
Arista Networks, Inc.(a) | | | 7,949 | | | | 975,581 | |
ASE Technology Holding Co Ltd.—ADR(c) | | | 120,396 | | | | 870,463 | |
AU Optronics Corp.—ADR | | | 33,995 | | | | 251,563 | |
Avanos Medical, Inc.(a) | | | 3,393 | | | | 120,078 | |
Avaya Holdings Corp.(a) | | | 8,758 | | | | 120,598 | |
Bio-Rad Laboratories, Inc.—Class A(a) | | | 1,967 | | | | 1,231,263 | |
Bloom Energy Corp.—Class A(a)(c) | | | 2,839 | | | | 63,026 | |
Brainsway Ltd.—ADR(a) | | | 6,027 | | | | 46,227 | |
Broadcom, Inc. | | | 5,922 | | | | 3,478,820 | |
Bruker Corp.(c) | | | 6,144 | | | | 432,353 | |
Calix, Inc.(a)(c) | | | 4,777 | | | | 259,582 | |
Casio Computer Co. Ltd.—ADR | | | 1,200 | | | | 140,100 | |
ChipMOS Technologies, Inc.—ADR | | | 28,588 | | | | 1,070,049 | |
Ciena Corp.(a) | | | 8,156 | | | | 558,034 | |
Cirrus Logic, Inc.(a) | | | 4,899 | | | | 425,576 | |
Cisco Systems, Inc. | | | 87,241 | | | | 4,865,431 | |
Corsair Gaming, Inc.(a)(c) | | | 8,757 | | | | 202,112 | |
Danaher Corp. | | | 10,667 | | | | 2,927,132 | |
Dell Technologies, Inc.—Class C(a) | | | 37,164 | | | | 1,893,877 | |
Diodes, Inc.(a) | | | 4,695 | | | | 420,625 | |
Dolby Laboratories, Inc.—Class A | | | 4,586 | | | | 344,409 | |
Enphase Energy, Inc.(a) | | | 1,082 | | | | 180,369 | |
FormFactor, Inc.(a) | | | 8,116 | | | | 328,617 | |
Fortinet, Inc.(a) | | | 5,999 | | | | 2,066,775 | |
Himax Technologies, Inc.—ADR(c) | | | 43,916 | | | | 487,907 | |
Hologic, Inc.(a) | | | 16,464 | | | | 1,171,743 | |
HP, Inc. | | | 67,545 | | | | 2,320,846 | |
The accompanying notes are an integral part of these financial statements.
44
PMC DIVERSIFIED EQUITY FUND | Schedule of Investments |
February 28, 2022 (Unaudited) (Continued)
| | | | | | | | |
| | |
| | | Shares
| | | Value
| |
IDEXX Laboratories, Inc.(a) | | | 1,053 | | | $ | 560,565 | |
Intel Corp. | | | 47,661 | | | | 2,273,430 | |
Jabil, Inc. | | | 12,796 | | | | 739,737 | |
JinkoSolar Holding Co. Ltd.—ADR(a) | | | 4,473 | | | | 226,379 | |
Juniper Networks, Inc.(c) | | | 42,660 | | | | 1,441,481 | |
Keysight Technologies, Inc.(a) | | | 16,687 | | | | 2,626,033 | |
Kyocera Corp.—ADR | | | 9,919 | | | | 576,393 | |
L3Harris Technologies, Inc. | | | 3,107 | | | | 783,927 | |
Lam Research Corp.(c) | | | 3,451 | | | | 1,937,219 | |
Lasertec Corp.—ADR | | | 17,447 | | | | 630,709 | |
Lattice Semiconductor Corp.(a)(c) | | | 6,376 | | | | 399,265 | |
LG Display Co. Ltd.—ADR(a) | | | 30,172 | | | | 236,548 | |
Lumentum Holdings, Inc.(a)(c) | | | 2,434 | | | | 240,625 | |
MACOM Technology Solutions Holdings, Inc.(a)(c) | | | 2,752 | | | | 165,395 | |
MaxLinear, Inc.(a)(c) | | | 1,841 | | | | 112,945 | |
Medtronic PLC(b) | | | 10,140 | | | | 1,064,598 | |
Methode Electronics, Inc.(c) | | | 8,393 | | | | 383,057 | |
Micron Technology, Inc. | | | 23,346 | | | | 2,074,526 | |
MKS Instruments, Inc.(c) | | | 3,042 | | | | 458,125 | |
Monolithic Power Systems, Inc.(c) | | | 939 | | | | 430,719 | |
Motorola Solutions, Inc. | | | 9,759 | | | | 2,151,176 | |
Nano Dimension Ltd.—ADR(a)(c) | | | 15,138 | | | | 53,589 | |
Natus Medical, Inc.(a) | | | 4,872 | | | | 135,539 | |
NetApp, Inc. | | | 17,697 | | | | 1,387,091 | |
NETGEAR, Inc.(a) | | | 8,761 | | | | 233,130 | |
Nidec Corp.—ADR | | | 69,672 | | | | 1,513,276 | |
Nitto Denko Corp.—ADR(c) | | | 37,839 | | | | 1,376,204 | |
Northrop Grumman Corp.(c) | | | 3,652 | | | | 1,614,695 | |
NVIDIA Corp. | | | 23,425 | | | | 5,712,186 | |
O2Micro International Ltd.—ADR(a) | | | 31,953 | | | | 130,688 | |
Omnicell, Inc.(a)(c) | | | 1,949 | | | | 251,967 | |
Omron Corp.—ADR | | | 14,903 | | | | 1,008,337 | |
ON Semiconductor Corp.(a) | | | 35,255 | | | | 2,207,316 | |
Onto Innovation, Inc.(a)(c) | | | 5,170 | | | | 445,706 | |
OSI Systems, Inc.(a)(c) | | | 1,066 | | | | 85,994 | |
Otis Worldwide Corp. | | | 5,760 | | | | 451,181 | |
PerkinElmer, Inc.(c) | | | 4,507 | | | | 809,502 | |
Plantronics, Inc.(a) | | | 2,728 | | | | 76,848 | |
Power Integrations, Inc.(c) | | | 5,042 | | | | 453,780 | |
Qorvo, Inc.(a) | | | 13,913 | | | | 1,903,020 | |
QUALCOMM, Inc. | | | 15,951 | | | | 2,743,412 | |
ReneSola Ltd.—ADR(a) | | | 5,775 | | | | 34,708 | |
Rohm Co. Ltd.—ADR(c) | | | 17,025 | | | | 672,402 | |
Sanmina Corp.(a) | | | 14,008 | | | | 557,238 | |
Seagate Technology Holdings PLC(b) | | | 16,955 | | | | 1,749,078 | |
Seiko Epson Corp.—ADR(c) | | | 109,371 | | | | 838,876 | |
Semtech Corp.(a) | | | 3,761 | | | | 260,938 | |
Sharp Corp.—ADR | | | 80,529 | | | | 184,444 | |
Silicon Laboratories, Inc.(a)(c) | | | 2,558 | | | | 393,190 | |
Silicon Motion Technology Corp.—ADR | | | 3,426 | | | | 248,522 | |
SiTime Corp.(a)(c) | | | 732 | | | | 147,966 | |
Skyworks Solutions, Inc. | | | 9,107 | | | | 1,258,314 | |
Sonos, Inc.(a)(c) | | | 7,140 | | | | 195,565 | |
Sony Group Corp.—ADR | | | 31,822 | | | | 3,262,709 | |
The accompanying notes are an integral part of these financial statements.
45
PMC DIVERSIFIED EQUITY FUND | Schedule of Investments |
February 28, 2022 (Unaudited) (Continued)
| | | | | | | | |
| | |
| | | Shares
| | | Value
| |
STMicroelectronics NV(b) | | | 19,286 | | | $ | 816,184 | |
Sumitomo Electric Industries Ltd.—ADR | | | 35,132 | | | | 460,932 | |
SunPower Corp.(a)(c) | | | 5,154 | | | | 92,411 | |
Super Micro Computer, Inc.(a) | | | 7,597 | | | | 298,486 | |
Synaptics, Inc.(a)(c) | | | 1,875 | | | | 428,306 | |
Taiwan Semiconductor Manufacturing Co. Ltd.—ADR | | | 39,303 | | | | 4,205,814 | |
TDK Corp.—ADR(c) | | | 19,758 | | | | 797,433 | |
Teradata Corp.(a)(c) | | | 6,162 | | | | 308,038 | |
Teradyne, Inc.(c) | | | 16,540 | | | | 1,950,397 | |
Texas Instruments, Inc. | | | 12,520 | | | | 2,128,275 | |
Thermo Fisher Scientific, Inc. | | | 7,388 | | | | 4,019,073 | |
Trane Technologies PLC(b) | | | 2,358 | | | | 362,967 | |
Trimble, Inc.(a) | | | 19,929 | | | | 1,390,048 | |
United Microelectronics Corp.—ADR | | | 102,970 | | | | 955,562 | |
Varex Imaging Corp.(a)(c) | | | 7,155 | | | | 169,144 | |
Vishay Intertechnology, Inc. | | | 15,240 | | | | 292,456 | |
VTech Holdings Ltd.—ADR(c) | | | 37,455 | | | | 306,569 | |
Waters Corp.(a)(c) | | | 4,111 | | | | 1,302,077 | |
Western Digital Corp.(a) | | | 20,886 | | | | 1,063,933 | |
Xperi Holding Corp. | | | 16,385 | | | | 283,788 | |
Zebra Technologies Corp.—Class A(a) | | | 5,725 | | | | 2,366,372 | |
| | | | | | |
|
|
|
| | | | | | | | 154,085,521 | |
| | | | | | |
|
|
|
Construction of Buildings—0.90% | | | | | | | | |
Avantor, Inc.(a)(c) | | | 7,224 | | | | 250,601 | |
Barratt Developments PLC—ADR | | | 14,147 | | | | 231,162 | |
Daito Trust Construction Co. Ltd.—ADR | | | 23,492 | | | | 647,674 | |
DR Horton, Inc. | | | 20,532 | | | | 1,753,433 | |
KB Home(c) | | | 2,697 | | | | 104,131 | |
Lennar Corp.—Class A(c) | | | 18,770 | | | | 1,687,048 | |
Lennar Corp.—Class B | | | 24,649 | | | | 1,860,999 | |
LGI Homes, Inc.(a)(c) | | | 2,220 | | | | 280,009 | |
MDC Holdings, Inc.(c) | | | 7,427 | | | | 329,313 | |
Mitie Group PLC—ADR | | | 113,343 | | | | 342,863 | |
NVR, Inc.(a) | | | 69 | | | | 342,132 | |
PulteGroup, Inc.(c) | | | 23,743 | | | | 1,179,077 | |
Toll Brothers, Inc. | | | 3,846 | | | | 208,684 | |
Tri Pointe Homes, Inc.(a) | | | 13,361 | | | | 298,886 | |
Tutor Perini Corp.(a)(c) | | | 9,878 | | | | 96,804 | |
| | | | | | |
|
|
|
| | | | | | | | 9,612,816 | |
| | | | | | |
|
|
|
Couriers and Messengers—0.10% | | | | | | | | |
FedEx Corp.(c) | | | 3,457 | | | | 768,387 | |
United Parcel Service, Inc.—Class B | | | 1,681 | | | | 353,716 | |
| | | | | | |
|
|
|
| | | | | | | | 1,122,103 | |
| | | | | | |
|
|
|
Credit Intermediation and Related Activities—3.80% | | | | | | | | |
Affirm Holdings, Inc.(a) | | | 1,061 | | | | 44,392 | |
Akso Health Group—ADR(a) | | | 64 | | | | 90 | |
Ally Financial, Inc.(c) | | | 11,910 | | | | 594,309 | |
American Express Co. | | | 1,290 | | | | 250,957 | |
Associated Banc-Corp | | | 9,559 | | | | 233,144 | |
Australia & New Zealand Banking Group Ltd.—ADR | | | 49,699 | | | | 946,766 | |
B&M European Value Retail SA—ADR | | | 9,295 | | | | 300,600 | |
Banco BBVA Argentina SA—ADR(a) | | | 56,497 | | | | 182,485 | |
The accompanying notes are an integral part of these financial statements.
46
PMC DIVERSIFIED EQUITY FUND | Schedule of Investments |
February 28, 2022 (Unaudited) (Continued)
| | | | | | | | |
| | |
| | | Shares
| | | Value
| |
Banco Bilbao Vizcaya Argentaria SA—ADR | | | 124,584 | | | $ | 732,554 | |
Banco de Chile—ADR | | | 12,822 | | | | 271,955 | |
Banco Macro SA—ADR(a) | | | 481 | | | | 6,941 | |
Banco Santander Chile—ADR | | | 28,736 | | | | 560,927 | |
Banco Santander Mexico SA Institucion de Banca Multiple Grupo Financiero Santand—ADR | | | 45,917 | | | | 256,676 | |
Banco Santander SA—ADR | | | 83,841 | | | | 281,706 | |
Bank Hapoalim BM—ADR(c) | | | 2,468 | | | | 128,965 | |
Bank Mandiri Persero Tbk PT—ADR | | | 68,394 | | | | 739,681 | |
Bank of East Asia Ltd.—ADR | | | 123,974 | | | | 206,417 | |
Bank OZK(c) | | | 5,421 | | | | 254,895 | |
Bank Rakyat Indonesia Persero Tbk PT—ADR | | | 62,891 | | | | 1,010,344 | |
Barclays PLC—ADR | | | 206,768 | | | | 2,047,003 | |
BNP Paribas SA—ADR | | | 121,904 | | | | 3,535,215 | |
BOC Hong Kong Holdings Ltd.—ADR | | | 9,643 | | | | 695,839 | |
China Merchants Bank Co. Ltd.—ADR | | | 7,118 | | | | 300,380 | |
Citigroup, Inc. | | | 27,035 | | | | 1,601,283 | |
Commercial International Bank Egypt SAE—ADR(a) | | | 7,650 | | | | 22,721 | |
Danske Bank A/S—ADR | | | 65,809 | | | | 557,336 | |
DBS Group Holdings Ltd.—ADR | | | 17,044 | | | | 1,716,672 | |
Deutsche Bank AG(a)(b) | | | 40,314 | | | | 501,103 | |
Discover Financial Services | | | 4,236 | | | | 522,892 | |
DNB Bank ASA—ADR(c) | | | 63,572 | | | | 1,426,556 | |
Encore Capital Group, Inc.(a)(c) | | | 3,070 | | | | 202,589 | |
Erste Group Bank AG—ADR | | | 16,524 | | | | 294,458 | |
Fifth Third Bancorp(c) | | | 503 | | | | 24,064 | |
FinVolution Group—ADR(c) | | | 64,229 | | | | 261,412 | |
Grupo Financiero Banorte SAB de CV—ADR | | | 7,788 | | | | 262,689 | |
Grupo Financiero Galicia SA—ADR(c) | | | 16,875 | | | | 159,806 | |
Hachijuni Bank Ltd.—ADR | | | 10,025 | | | | 379,847 | |
Hilltop Holdings, Inc. | | | 15,391 | | | | 475,890 | |
HSBC Holdings PLC—ADR | | | 10,440 | | | | 360,598 | |
ICICI Bank Ltd.—ADR | | | 84,474 | | | | 1,644,709 | |
JPMorgan Chase & Co. | | | 4,390 | | | | 622,502 | |
Kasikornbank PCL—ADR | | | 1,327 | | | | 26,281 | |
Malayan Banking Bhd—ADR | | | 100 | | | | 484 | |
Mr Cooper Group, Inc.(a) | | | 7,100 | | | | 360,893 | |
National Australia Bank Ltd.—ADR | | | 38,559 | | | | 409,111 | |
Nelnet, Inc.—Class A(c) | | | 4,543 | | | | 365,939 | |
New York Community Bancorp, Inc.(c) | | | 29,289 | | | | 337,995 | |
OneMain Holdings, Inc. | | | 8,618 | | | | 439,345 | |
Oversea-Chinese Banking Corp. Ltd.—ADR | | | 13,376 | | | | 232,475 | |
PennyMac Financial Services, Inc.(c) | | | 4,718 | | | | 272,465 | |
Popular, Inc.(b) | | | 5,796 | | | | 532,363 | |
Rocket Cos, Inc.—Class A(c) | | | 75,707 | | | | 977,377 | |
Sberbank of Russia PJSC—ADR | | | 119,989 | | | | 149,986 | |
Smith & Wesson Brands, Inc.(c) | | | 13,712 | | | | 241,743 | |
Sumitomo Mitsui Trust Holdings, Inc.—ADR | | | 43,557 | | | | 158,547 | |
Svenska Handelsbanken AB—ADR | | | 210,397 | | | | 989,918 | |
Swedbank AB—ADR | | | 116,664 | | | | 1,853,791 | |
Synchrony Financial(c) | | | 18,740 | | | | 801,697 | |
UBS Group AG(b) | | | 202,792 | | | | 3,678,646 | |
UniCredit SpA—ADR | | | 70,257 | | | | 437,701 | |
UWM Holdings Corp.(c) | | | 80,347 | | | | 348,706 | |
The accompanying notes are an integral part of these financial statements.
47
PMC DIVERSIFIED EQUITY FUND | Schedule of Investments |
February 28, 2022 (Unaudited) (Continued)
| | | | | | | | |
| | |
| | | Shares
| | | Value
| |
Wells Fargo & Co. | | | 45,435 | | | $ | 2,424,865 | |
Western Union Co.(c) | | | 13,105 | | | | 238,249 | |
World Acceptance Corp.(a)(c) | | | 116 | | | | 22,791 | |
Zions Bancorp NA | | | 10,730 | | | | 760,650 | |
| | | | | | |
|
|
|
| | | | | | | | 40,681,386 | |
| | | | | | |
|
|
|
Data Processing, Hosting and Related Services—0.11% | | | | | | | | |
CSG Systems International, Inc. | | | 6,009 | | | | 370,875 | |
Mercury Fintech Holding, Inc.—ADR(a)(c) | | | 19,600 | | | | 45,864 | |
Sciplay Corp.—Class A(a) | | | 22,100 | | | | 288,184 | |
Shutterstock, Inc. | | | 3,524 | | | | 319,028 | |
Sify Technologies Ltd.—ADR(a)(c) | | | 43,421 | | | | 136,776 | |
| | | | | | |
|
|
|
| | | | | | | | 1,160,727 | |
| | | | | | |
|
|
|
Educational Services—0.02% | | | | | | | | |
Bright Scholar Education Holdings Ltd.—ADR | | | 7,820 | | | | 8,289 | |
China Online Education Group—ADR(a) | | | 857 | | | | 1,191 | |
Laureate Education, Inc.—Class A | | | 17,303 | | | | 187,564 | |
New Oriental Education & Technology Group, Inc.—ADR(a) | | | 8,710 | | | | 13,153 | |
TAL Education Group—ADR(a) | | | 1,374 | | | | 3,902 | |
| | | | | | |
|
|
|
| | | | | | | | 214,099 | |
| | | | | | |
|
|
|
Electrical Equipment, Appliance, and Component Manufacturing—1.39% | | | | | | | | |
ABB Ltd.—ADR | | | 14,921 | | | | 502,539 | |
Acuity Brands, Inc. | | | 1,373 | | | | 250,394 | |
Arcelik AS—ADR | | | 50,548 | | | | 1,004,389 | |
AZZ, Inc. | | | 4,363 | | | | 214,790 | |
Generac Holdings, Inc.(a)(c) | | | 556 | | | | 175,401 | |
GrafTech International Ltd.(c) | | | 22,784 | | | | 229,663 | |
Hitachi Ltd.—ADR | | | 25,102 | | | | 2,482,589 | |
iRobot Corp.(a)(c) | | | 976 | | | | 60,668 | |
Mitsubishi Electric Corp.—ADR | | | 42,676 | | | | 1,034,466 | |
Murata Manufacturing Co. Ltd.—ADR | | | 126,843 | | | | 2,143,647 | |
Panasonic Corp.—ADR | | | 116,735 | | | | 1,226,885 | |
Plug Power, Inc.(a)(c) | | | 7,070 | | | | 178,800 | |
Regal Rexnord Corp. | | | 2,512 | | | | 402,799 | |
Resideo Technologies, Inc.(a) | | | 11,478 | | | | 295,444 | |
Schneider Electric SE—ADR | | | 45,009 | | | | 1,382,676 | |
Siemens AG—ADR | | | 20,701 | | | | 1,446,586 | |
Taiyo Yuden Co Ltd.—ADR | | | 826 | | | | 148,194 | |
Viomi Technology Co. Ltd.—ADR(a) | | | 43,692 | | | | 84,762 | |
Whirlpool Corp.(c) | | | 6,148 | | | | 1,237,408 | |
Yaskawa Electric Corp.—ADR(c) | | | 5,414 | | | | 432,849 | |
| | | | | | |
|
|
|
| | | | | | | | 14,934,949 | |
| | | | | | |
|
|
|
Electronics and Appliance Stores—0.13% | | | | | | | | |
AMC Networks, Inc.—Class A(a)(c) | | | 3,524 | | | | 146,070 | |
Best Buy Co., Inc.(c) | | | 9,779 | | | | 945,042 | |
Sega Sammy Holdings, Inc.—ADR | | | 73,164 | | | | 331,433 | |
| | | | | | |
|
|
|
| | | | | | | | 1,422,545 | |
| | | | | | |
|
|
|
Fabricated Metal Product Manufacturing—1.29% | | | | | | | | |
Alfa Laval AB—ADR | | | 52,466 | | | | 1,692,553 | |
Assa Abloy AB—ADR | | | 100,302 | | | | 1,309,944 | |
Atkore, Inc.(a)(c) | | | 4,845 | | | | 492,785 | |
The accompanying notes are an integral part of these financial statements.
48
PMC DIVERSIFIED EQUITY FUND | Schedule of Investments |
February 28, 2022 (Unaudited) (Continued)
| | | | | | | | |
| | |
| | | Shares
| | | Value
| |
Emerson Electric Co. | | | 16,314 | | | $ | 1,515,897 | |
LVMH Moet Hennessy Louis Vuitton SE—ADR | | | 21,052 | | | | 3,068,328 | |
Mueller Industries, Inc.(c) | | | 5,151 | | | | 293,865 | |
Nucor Corp.(c) | | | 23,838 | | | | 3,137,558 | |
POSCO—ADR | | | 11,843 | | | | 702,526 | |
Stanley Black & Decker, Inc. | | | 6,255 | | | | 1,017,689 | |
Valmont Industries, Inc. | | | 1,071 | | | | 231,818 | |
Vista Outdoor, Inc.(a)(c) | | | 8,279 | | | | 301,770 | |
| | | | | | |
|
|
|
| | | | | | | | 13,764,733 | |
| | | | | | |
|
|
|
Food and Beverage Stores—0.97% | | | | | | | | |
Carrefour SA—ADR | | | 429,246 | | | | 1,728,574 | |
J Sainsbury PLC—ADR | | | 54,756 | | | | 809,841 | |
Jeronimo Martins SGPS SA—ADR(c) | | | 1,000 | | | | 43,814 | |
Koninklijke Ahold Delhaize NV—ADR | | | 70,188 | | | | 2,154,070 | |
Kroger Co. | | | 35,867 | | | | 1,678,576 | |
Shoprite Holdings Ltd.—ADR | | | 51,712 | | | | 765,338 | |
Sprouts Farmers Market, Inc.(a)(c) | | | 8,873 | | | | 252,703 | |
Tesco PLC—ADR | | | 211,441 | | | | 2,451,129 | |
Weis Markets, Inc. | | | 8,721 | | | | 537,824 | |
| | | | | | |
|
|
|
| | | | | | | | 10,421,869 | |
| | | | | | |
|
|
|
Food Manufacturing—2.23% | | | | | | | | |
Ajinomoto Co., Inc.—ADR(c) | | | 100,976 | | | | 2,943,450 | |
Archer-Daniels-Midland Co.(c) | | | 57,118 | | | | 4,480,907 | |
Bunge Ltd.—ADR(b) | | | 7,146 | | | | 747,114 | |
Conagra Foods, Inc.(c) | | | 9,219 | | | | 322,388 | |
Darling Ingredients, Inc.(a) | | | 4,729 | | | | 342,758 | |
General Mills, Inc.(c) | | | 6,062 | | | | 408,761 | |
Hershey Co. | | | 3,798 | | | | 768,184 | |
Industrias Bachoco SAB de CV—ADR | | | 655 | | | | 26,469 | |
JBS SA—ADR(c) | | | 13,666 | | | | 190,504 | |
JM Smucker Co.(c) | | | 12,174 | | | | 1,640,447 | |
Kraft Heinz Co. | | | 27,982 | | | | 1,097,454 | |
Marfrig Global Foods SA—ADR | | | 2,682 | | | | 11,828 | |
Medifast, Inc. | | | 837 | | | | 155,682 | |
Mondelez International, Inc.—Class A | | | 9,040 | | | | 591,939 | |
Nestle SA—ADR | | | 45,137 | | | | 5,869,164 | |
Premier Foods PLC—ADR | | | 197,218 | | | | 1,454,483 | |
Tate & Lyle PLC—ADR | | | 11,419 | | | | 460,642 | |
Tiger Brands Ltd.—ADR | | | 5,821 | | | | 63,187 | |
Tyson Foods, Inc.—Class A | | | 25,379 | | | | 2,351,617 | |
| | | | | | |
|
|
|
| | | | | | | | 23,926,978 | |
| | | | | | |
|
|
|
Food Services and Drinking Places—0.22% | | | | | | | | |
Bloomin’ Brands, Inc.(a)(c) | | | 1,007 | | | | 24,782 | |
Chipotle Mexican Grill, Inc.(a) | | | 363 | | | | 552,976 | |
Darden Restaurants, Inc.(c) | | | 5,119 | | | | 743,380 | |
Domino’s Pizza, Inc.(c) | | | 417 | | | | 180,232 | |
Texas Roadhouse, Inc. | | | 12 | | | | 1,139 | |
Yelp, Inc.(a) | | | 8,474 | | | | 287,184 | |
Yum! Brands, Inc. | | | 5,003 | | | | 613,268 | |
| | | | | | |
|
|
|
| | | | | | | | 2,402,961 | |
| | | | | | |
|
|
|
The accompanying notes are an integral part of these financial statements.
49
PMC DIVERSIFIED EQUITY FUND | Schedule of Investments |
February 28, 2022 (Unaudited) (Continued)
| | | | | | | | |
| | |
| | | Shares
| | | Value
| |
Funds, Trusts, and Other Financial Vehicles—1.79% | | | | | | | | |
Absa Group Ltd.—ADR | | | 8,708 | | | $ | 198,194 | |
Aeon Co. Ltd.—ADR | | | 42,070 | | | | 930,588 | |
Carlyle Group, Inc.(c) | | | 17,153 | | | | 803,961 | |
Coca-Cola Bottlers Japan Holdings, Inc.—ADR | | | 626 | | | | 4,075 | |
Coca-Cola HBC AG—ADR | | | 746 | | | | 18,859 | |
Daiwa Securities Group, Inc.—ADR | | | 151,379 | | | | 874,971 | |
Fast Retailing Co. Ltd.—ADR | | | 17,057 | | �� | | 915,961 | |
FUJIFILM Holdings Corp.—ADR(c) | | | 30,192 | | | | 1,920,513 | |
Garmin Ltd.(b) | | | 19,495 | | | | 2,153,028 | |
Geberit AG—ADR(c) | | | 5,974 | | | | 392,459 | |
Lonza Group AG—ADR | | | 7,325 | | | | 504,766 | |
Mitsubishi UFJ Financial Group, Inc.—ADR | | | 737,961 | | | | 4,545,841 | |
Mizuho Financial Group, Inc.—ADR | | | 532,231 | | | | 1,410,412 | |
Nitori Holdings Co. Ltd.—ADR | | | 19,911 | | | | 304,439 | |
Nomura Holdings, Inc.—ADR | | | 161,773 | | | | 740,920 | |
Seven & i Holdings Co. Ltd.—ADR | | | 101,239 | | | | 2,469,219 | |
Straumann Holding AG—ADR | | | 4,079 | | | | 326,442 | |
Sumitomo Mitsui Financial Group, Inc.—ADR | | | 19,333 | | | | 137,844 | |
Up Fintech Holding Ltd.—ADR(a)(c) | | | 11,925 | | | | 53,782 | |
Woolworths Holdings Ltd.(b) | | | 156,425 | | | | 510,728 | |
| | | | | | |
|
|
|
| | | | | | | | 19,217,002 | |
| | | | | | |
|
|
|
Furniture and Home Furnishings Stores—0.05% | | | | | | | | |
Ryohin Keikaku Co. Ltd.—ADR(c) | | | 8,074 | | | | 118,769 | |
Williams-Sonoma, Inc.(c) | | | 3,107 | | | | 450,080 | |
| | | | | | |
|
|
|
| | | | | | | | 568,849 | |
| | | | | | |
|
|
|
Furniture and Related Product Manufacturing—0.03% | | | | | | | | |
HNI Corp.(c) | | | 2,500 | | | | 101,725 | |
Natuzzi SpA—ADR(a) | | | 3,179 | | | | 34,365 | |
Sleep Number Corp.(a)(c) | | | 2,144 | | | | 140,861 | |
| | | | | | |
|
|
|
| | | | | | | | 276,951 | |
| | | | | | |
|
|
|
Gasoline Stations—0.37% | | | | | | | | |
Cango, Inc.—ADR(c) | | | 64,906 | | | | 220,031 | |
Chevron Corp.(c) | | | 22,871 | | | | 3,293,425 | |
Magnolia Oil & Gas Corp.—Class A(c) | | | 21,372 | | | | 477,664 | |
| | | | | | |
|
|
|
| | | | | | | | 3,991,120 | |
| | | | | | |
|
|
|
General Merchandise Stores—1.39% | | | | | | | | |
Big Lots, Inc.(c) | | | 3,212 | | | | 111,649 | |
BJ’s Wholesale Club Holdings, Inc.(a)(c) | | | 6,612 | | | | 415,696 | |
Costco Wholesale Corp. | | | 7,166 | | | | 3,720,947 | |
Dillard’s, Inc.—Class A(c) | | | 1,431 | | | | 358,766 | |
Dollar General Corp.(c) | | | 8,716 | | | | 1,728,731 | |
Dollar Tree, Inc.(a) | | | 7,407 | | | | 1,052,387 | |
Etablissements Franz Colruyt NV—ADR | | | 3,071 | | | | 30,526 | |
Kohl’s Corp.(c) | | | 7,236 | | | | 402,466 | |
Macy’s, Inc.(c) | | | 16,808 | | | | 435,663 | |
Marks & Spencer Group PLC—ADR(a) | | | 5,838 | | | | 27,263 | |
Pan Pacific International Holdings Corp.—ADR | | | 37,359 | | | | 612,463 | |
PriceSmart, Inc. | | | 2,098 | | | | 152,567 | |
Target Corp. | | | 17,678 | | | | 3,531,534 | |
Walmart, Inc. | | | 16,775 | | | | 2,267,310 | |
| | | | | | |
|
|
|
| | | | | | | | 14,847,968 | |
| | | | | | |
|
|
|
The accompanying notes are an integral part of these financial statements.
50
PMC DIVERSIFIED EQUITY FUND | Schedule of Investments |
February 28, 2022 (Unaudited) (Continued)
| | | | | | | | |
| | |
| | | Shares
| | | Value
| |
Health and Personal Care Stores—0.57% | | | | | | | | |
Aspen Pharmacare Holdings Ltd.—ADR | | | 9,354 | | | $ | 122,350 | |
CVS Health Corp. | | | 34,437 | | | | 3,569,396 | |
Forward Pharma A/S—ADR(a) | | | 1,274 | | | | 7,096 | |
Rite Aid Corp.(a)(c) | | | 3,663 | | | | 33,553 | |
Ulta Beauty, Inc.(a) | | | 2,900 | | | | 1,086,050 | |
Walgreens Boots Alliance, Inc. | | | 28,524 | | | | 1,314,671 | |
| | | | | | |
|
|
|
| | | | | | | | 6,133,116 | |
| | | | | | |
|
|
|
Heavy and Civil Engineering Construction—0.11% | | | | | | | | |
Granite Construction, Inc.(c) | | | 5,963 | | | | 180,500 | |
Primoris Services Corp.(c) | | | 8,368 | | | | 220,664 | |
Skanska AB—ADR(c) | | | 36,454 | | | | 817,299 | |
| | | | | | |
|
|
|
| | | | | | | | 1,218,463 | |
| | | | | | |
|
|
|
Hospitals—0.27% | | | | | | | | |
HCA Healthcare, Inc. | | | 10,044 | | | | 2,514,114 | |
Tenet Healthcare Corp.(a)(c) | | | 4,901 | | | | 421,437 | |
| | | | | | |
|
|
|
| | | | | | | | 2,935,551 | |
| | | | | | |
|
|
|
Insurance Carriers and Related Activities—6.09% | | | | | | | | |
Admiral Group PLC—ADR | | | 12,383 | | | | 487,643 | |
Aegon NV(b) | | | 248,518 | | | | 1,235,134 | |
Aflac, Inc. | | | 25,646 | | | | 1,566,714 | |
Alleghany Corp.(a) | | | 338 | | | | 223,729 | |
Allstate Corp. | | | 5,278 | | | | 645,816 | |
American Financial Group, Inc. | | | 4,114 | | | | 556,994 | |
American International Group, Inc. | | | 7,188 | | | | 440,193 | |
American National Group, Inc. | | | 844 | | | | 159,541 | |
Anthem, Inc. | | | 5,749 | | | | 2,597,686 | |
Arch Capital Group Ltd.(a)(b) | | | 6,758 | | | | 318,369 | |
Assurant, Inc.(c) | | | 1,771 | | | | 300,556 | |
Aviva PLC—ADR | | | 145,436 | | | | 1,621,611 | |
AXA SA—ADR | | | 125,087 | | | | 3,367,342 | |
Axis Capital Holdings Ltd.—ADR(b) | | | 5,381 | | | | 293,910 | |
Berkshire Hathaway, Inc.—Class A(a) | | | 14 | | | | 6,666,871 | |
Berkshire Hathaway, Inc.—Class B(a) | | | 41,900 | | | | 13,468,756 | |
Centene Corp.(a) | | | 1,622 | | | | 134,010 | |
Chubb Ltd.(b) | | | 2,592 | | | | 527,835 | |
Cigna Corp. | | | 2,652 | | | | 630,593 | |
Cincinnati Financial Corp. | | | 18,479 | | | | 2,269,036 | |
CNO Financial Group, Inc. | | | 22,189 | | | | 536,308 | |
Direct Line Insurance Group PLC—ADR(c) | | | 25,862 | | | | 416,895 | |
eHealth, Inc.(a) | | | 18 | | | | 280 | |
Employers Holdings, Inc. | | | 5,387 | | | | 209,339 | |
Everest Re Group Ltd.(b) | | | 2,406 | | | | 717,517 | |
Fidelity National Financial, Inc.(c) | | | 22,127 | | | | 1,054,130 | |
First American Financial Corp. | | | 7,683 | | | | 515,068 | |
Genworth Financial, Inc.—Class A(a) | | | 59,480 | | | | 241,489 | |
Gjensidige Forsikring ASA—ADR | | | 44,197 | | | | 1,125,123 | |
Hanover Insurance Group, Inc. | | | 4,334 | | | | 604,636 | |
Hartford Financial Services Group, Inc. | | | 23,019 | | | | 1,599,360 | |
Horace Mann Educators Corp. | | | 448 | | | | 18,632 | |
Lincoln National Corp.(c) | | | 5,986 | | | | 403,576 | |
Markel Corp.(a) | | | 225 | | | | 279,655 | |
The accompanying notes are an integral part of these financial statements.
51
PMC DIVERSIFIED EQUITY FUND | Schedule of Investments |
February 28, 2022 (Unaudited) (Continued)
| | | | | | | | |
| | |
| | | Shares
| | | Value
| |
Marsh & McLennan Companies, Inc. | | | 1,552 | | | $ | 241,196 | |
Mercury General Corp. | | | 6,551 | | | | 360,305 | |
MS&AD Insurance Group Holdings, Inc.—ADR | | | 83,320 | | | | 1,420,606 | |
National Western Life Group, Inc.—Class A | | | 261 | | | | 55,684 | |
NN Group NV—ADR(c) | | | 128,911 | | | | 3,059,059 | |
Old Republic International Corp. | | | 23,260 | | | | 612,901 | |
Prudential Financial, Inc.(c) | | | 8,374 | | | | 935,041 | |
Safety Insurance Group, Inc. | | | 909 | | | | 75,847 | |
Selective Insurance Group, Inc. | | | 6,706 | | | | 557,872 | |
SiriusPoint Ltd.(a)(b) | | | 16,788 | | | | 124,063 | |
Suncorp Group Ltd.—ADR(c) | | | 63,680 | | | | 494,157 | |
T&D Holdings, Inc.—ADR | | | 275,881 | | | | 1,955,996 | |
Tivity Health, Inc.(a)(c) | | | 3,294 | | | | 89,860 | |
Tokio Marine Holdings, Inc.—ADR | | | 39,902 | | | | 2,305,538 | |
Topdanmark AS—ADR | | | 17,568 | | | | 98,996 | |
UnitedHealth Group, Inc. | | | 16,067 | | | | 7,645,804 | |
| | | | | | |
|
|
|
| | | | | | | | 65,267,272 | |
| | | | | | |
|
|
|
Leather and Allied Product Manufacturing—0.10% | | | | | | | | |
Crocs, Inc.(a) | | | 2,501 | | | | 209,409 | |
Skechers U.S.A., Inc.—Class A(a) | | | 5,739 | | | | 263,879 | |
Tapestry, Inc.(c) | | | 14,152 | | | | 578,817 | |
| | | | | | |
|
|
|
| | | | | | | | 1,052,105 | |
| | | | | | |
|
|
|
Lessors of Nonfinancial Intangible Assets (except Copyrighted Works)—0.34% | | | | | | | | |
Cie Generale des Etablissements Michelin SCA—ADR | | | 34,480 | | | | 946,821 | |
L’Oreal SA—ADR | | | 32,553 | | | | 2,573,314 | |
Marathon Digital Holdings, Inc.(a)(c) | | | 2,762 | | | | 70,017 | |
| | | | | | |
|
|
|
| | | | | | | | 3,590,152 | |
| | | | | | |
|
|
|
Machinery Manufacturing—3.50% | | | | | | | | |
AGCO Corp. | | | 2,977 | | | | 357,716 | |
Applied Materials, Inc. | | | 27,775 | | | | 3,727,405 | |
ASML Holding NV(b) | | | 7,006 | | | | 4,669,569 | |
Azenta, Inc.(c) | | | 3,309 | | | | 289,604 | |
Canon, Inc.—ADR | | | 105,468 | | | | 2,492,209 | |
Carrier Global Corp.(c) | | | 20,896 | | | | 937,812 | |
Caterpillar, Inc. | | | 3,127 | | | | 586,563 | |
Cummins, Inc. | | | 1,027 | | | | 209,631 | |
Daikin Industries Ltd.—ADR | | | 98,328 | | | | 1,807,269 | |
Deere & Co. | | | 2,894 | | | | 1,041,898 | |
Dover Corp.(c) | | | 9,848 | | | | 1,544,757 | |
Fabrinet(a)(b) | | | 6,501 | | | | 650,945 | |
FANUC Corp.—ADR | | | 14,935 | | | | 274,356 | |
General Electric Co.(c) | | | 5,276 | | | | 503,910 | |
Hexagon AB—ADR | | | 40,348 | | | | 539,049 | |
Hoya Corp.—ADR(c) | | | 17,008 | | | | 2,210,530 | |
Husqvarna AB—ADR(c) | | | 35,723 | | | | 851,994 | |
II-VI, Inc.(a)(c) | | | 5,761 | | | | 400,159 | |
KLA Corp. | | | 6,161 | | | | 2,147,109 | |
Komatsu Ltd.—ADR | | | 28,285 | | | | 652,535 | |
Konica Minolta, Inc.—ADR | | | 28,004 | | | | 236,309 | |
Makita Corp.—ADR | | | 25,567 | | | | 917,089 | |
Mettler-Toledo International, Inc.(a) | | | 336 | | | | 473,337 | |
Nikon Corp.—ADR | | | 25,841 | | | | 270,038 | |
The accompanying notes are an integral part of these financial statements.
52
PMC DIVERSIFIED EQUITY FUND | Schedule of Investments |
February 28, 2022 (Unaudited) (Continued)
| | | | | | | | |
| | |
| | | Shares
| | | Value
| |
NSK Ltd.—ADR | | | 6,607 | | | $ | 83,116 | |
Olympus Corp.—ADR | | | 59,194 | | | | 1,208,741 | |
Parker Hannifin Corp. | | | 7,103 | | | | 2,105,257 | |
Ricoh Co Ltd.—ADR | | | 54,500 | | | | 470,335 | |
Rolls-Royce Holdings PLC—ADR(a) | | | 135,891 | | | | 187,530 | |
SMC Corp.—ADR | | | 54,206 | | | | 1,623,470 | |
Sunny Optical Technology Group Co. Ltd.—ADR | | | 161 | | | | 38,593 | |
Tokyo Electron Ltd.—ADR | | | 31,665 | | | | 3,865,980 | |
Weichai Power Co. Ltd.—ADR | | | 6,389 | | | | 85,613 | |
| | | | | | |
|
|
|
| | | | | | | | 37,460,428 | |
| | | | | | |
|
|
|
Management of Companies and Enterprises—1.86% | | | | | | | | |
Allianz SE—ADR | | | 31,685 | | | | 716,398 | |
America Movil SAB de CV—Class A—ADR | | | 2,541 | | | | 46,424 | |
America Movil SAB de CV—Class L—ADR | | | 62,523 | | | | 1,132,917 | |
Capital One Financial Corp. | | | 15,476 | | | | 2,372,006 | |
Cie Financiere Richemont SA—ADR | | | 155,123 | | | | 2,086,404 | |
Citizens Financial Group, Inc.(c) | | | 1,487 | | | | 77,949 | |
Enstar Group Ltd.(a)(b) | | | 1,036 | | | | 295,291 | |
Four Seasons Education Cayman, Inc.—ADR(a) | | | 5,798 | | | | 3,479 | |
Hawaiian Electric Industries, Inc. | | | 4,521 | | | | 185,271 | |
Henderson Land Development Co. Ltd.—ADR | | | 93,199 | | | | 391,436 | |
ING Groep NV—ADR | | | 52,205 | | | | 607,666 | |
JGC Holdings Corp.—ADR | | | 19,180 | | | | 393,190 | |
Jupai Holdings Ltd.—ADR(a) | | | 33,900 | | | | 22,713 | |
K+S AG—ADR(a) | | | 118,243 | | | | 1,509,372 | |
KB Financial Group, Inc.—ADR | | | 21,089 | | | | 1,037,579 | |
Kering SA—ADR(c) | | | 14,030 | | | | 985,187 | |
KOC Holding AS—ADR | | | 17,077 | | | | 188,103 | |
Kuehne + Nagel International AG—ADR(c) | | | 11,087 | | | | 602,246 | |
Purple Biotech Ltd.—ADR(a) | | | 6,497 | | | | 19,036 | |
Puxin Ltd.—ADR(a) | | | 387 | | | | 906 | |
Qudian, Inc.—ADR(a) | | | 21,074 | | | | 17,344 | |
Recruit Holdings Co. Ltd.—ADR | | | 209,986 | | | | 1,761,783 | |
Shinhan Financial Group Co. Ltd.—ADR | | | 23,705 | | | | 768,516 | |
SoftBank Group Corp.—ADR | | | 25,933 | | | | 582,196 | |
Sonova Holding AG—ADR | | | 11,709 | | | | 903,349 | |
Telefonica SA—ADR | | | 174,501 | | | | 820,155 | |
thyssenkrupp AG—ADR(a)(c) | | | 27,851 | | | | 296,056 | |
Vivendi SE—ADR | | | 118,359 | | | | 1,486,589 | |
Woori Financial Group, Inc.—ADR | | | 16,534 | | | | 571,084 | |
| | | | | | |
|
|
|
| | | | | | | | 19,880,645 | |
| | | | | | |
|
|
|
Merchant Wholesalers, Durable Goods—2.61% | | | | | | | | |
Arrow Electronics, Inc.(a) | | | 5,634 | | | | 686,672 | |
Avnet, Inc.(c) | | | 11,866 | | | | 499,203 | |
Cars.com, Inc.(a)(c) | | | 6,581 | | | | 106,481 | |
CD Projekt SA—ADR | | | 145 | | | | 1,452 | |
CECONOMY AG—ADR | | | 8,008 | | | | 6,189 | |
Cie de Saint-Gobain—ADR | | | 161,672 | | | | 2,006,349 | |
Coloplast A/S—ADR | | | 67,914 | | | | 1,016,673 | |
Electrolux AB—Class B—ADR | | | 7,313 | | | | 259,758 | |
Elekta AB—ADR | | | 17,541 | | | | 149,642 | |
Geely Automobile Holdings Ltd.—ADR | | | 10,280 | | | | 386,425 | |
Genuine Parts Co. | | | 3,030 | | | | 370,145 | |
The accompanying notes are an integral part of these financial statements.
53
PMC DIVERSIFIED EQUITY FUND | Schedule of Investments |
February 28, 2022 (Unaudited) (Continued)
| | | | | | | | |
| | |
| | | Shares
| | | Value
| |
Glencore PLC—ADR | | | 151,757 | | | $ | 1,778,592 | |
Global Industrial Co. | | | 2,311 | | | | 73,444 | |
GMS, Inc.(a) | | | 6,168 | | | | 334,614 | |
Henry Schein, Inc.(a) | | | 5,844 | | | | 504,805 | |
ITOCHU Corp.—ADR | | | 47,907 | | | | 3,134,076 | |
Johnson Controls International PLC(b) | | | 44,377 | | | | 2,882,730 | |
Lenovo Group Ltd.—ADR | | | 7,642 | | | | 171,181 | |
LKQ Corp.(c) | | | 39,909 | | | | 1,873,727 | |
Mitsui & Co. Ltd.—ADR | | | 5,545 | | | | 2,773,997 | |
ODP Corp.(a)(c) | | | 4,111 | | | | 180,884 | |
Owens & Minor, Inc.(c) | | | 4,372 | | | | 193,024 | |
Pool Corp. | | | 1,488 | | | | 682,367 | |
Reliance Steel & Aluminum Co. | | | 5,694 | | | | 1,086,814 | |
Rexel SA—ADR | | | 21,606 | | | | 489,376 | |
Rush Enterprises, Inc.—Class A(c) | | | 10,785 | | | | 560,173 | |
Rush Enterprises, Inc.—Class B | | | 1,868 | | | | 91,551 | |
ScanSource, Inc.(a) | | | 2,016 | | | | 63,665 | |
Schnitzer Steel Industries, Inc.—Class A | | | 8,725 | | | | 424,471 | |
Sims Ltd.—ADR | | | 63,330 | | | | 820,124 | |
TD SYNNEX Corp. | | | 4,331 | | | | 441,026 | |
TE Connectivity Ltd.(b) | | | 7,246 | | | | 1,032,048 | |
Techtronic Industries Co. Ltd.—ADR(c) | | | 1,752 | | | | 147,588 | |
Unicharm Corp.—ADR | | | 231,086 | | | | 1,730,833 | |
Volkswagen AG—ADR | | | 26,312 | | | | 678,586 | |
WESCO International, Inc.(a) | | | 2,677 | | | | 325,871 | |
| | | | | | |
|
|
|
| | | | | | | | 27,964,556 | |
| | | | | | |
|
|
|
Merchant Wholesalers, Nondurable Goods—1.93% | | | | | | | | |
Amneal Pharmaceuticals, Inc.(a) | | | 27,279 | | | | 123,574 | |
Atea Pharmaceuticals, Inc.(a) | | | 14,397 | | | | 91,277 | |
Biofrontera AG—ADR(a) | | | 2,646 | | | | 8,004 | |
Brenntag SE—ADR | | | 29,319 | | | | 484,936 | |
Capri Holdings Ltd.(a)(b) | | | 5,142 | | | | 348,319 | |
Cardinal Health, Inc. | | | 2,411 | | | | 130,218 | |
CSPC Pharmaceutical Group Ltd.—ADR | | | 70,782 | | | | 332,675 | |
Endo International PLC(a)(b) | | | 30,269 | | | | 94,137 | |
ENN Energy Holdings Ltd.—ADR | | | 24,869 | | | | 1,439,418 | |
Gazprom Neft PJSC—ADR(c) | | | 6,793 | | | | 116,160 | |
Imperial Brands PLC—ADR(c) | | | 74,911 | | | | 1,671,264 | |
Koppers Holdings, Inc.(a) | | | 6,844 | | | | 195,944 | |
Kunlun Energy Co. Ltd.—ADR | | | 27,909 | | | | 284,951 | |
LUKOIL PJSC—ADR(c) | | | 10,626 | | | | 255,555 | |
Marubeni Corp.—ADR | | | 18,106 | | | | 1,897,871 | |
McKesson Corp. | | | 1,231 | | | | 338,476 | |
Orkla ASA—ADR | | | 171,509 | | | | 1,637,911 | |
Roche Holding AG—ADR | | | 158,194 | | | | 7,471,503 | |
Suntory Beverage & Food Ltd.—ADR | | | 45,282 | | | | 906,093 | |
UCB SA—ADR | | | 15,325 | | | | 830,155 | |
United Natural Foods, Inc.(a) | | | 6,641 | | | | 267,167 | |
Univar Solutions, Inc.(a) | | | 14,291 | | | | 438,877 | |
Universal Corp. | | | 4,894 | | | | 264,814 | |
Vibra Energia SA—ADR | | | 65,778 | | | | 632,784 | |
World Fuel Services Corp. | | | 13,805 | | | | 391,234 | |
| | | | | | |
|
|
|
| | | | | | | | 20,653,317 | |
| | | | | | |
|
|
|
The accompanying notes are an integral part of these financial statements.
54
PMC DIVERSIFIED EQUITY FUND | Schedule of Investments |
February 28, 2022 (Unaudited) (Continued)
| | | | | | | | |
| | |
| | | Shares
| | | Value
| |
Mining (except Oil and Gas)—0.65% | | | | | | | | |
Anglo American Platinum Ltd.—ADR | | | 4,353 | | | $ | 114,440 | |
Anglo American PLC—ADR | | | 126,901 | | | | 3,256,280 | |
Cia de Minas Buenaventura SAA—ADR(a) | | | 52 | | | | 515 | |
CNX Resources Corp.(a)(c) | | | 5,824 | | | | 95,164 | |
DRDGOLD Ltd.—ADR | | | 13,739 | | | | 125,574 | |
Freeport-McMoRan, Inc. | | | 32,017 | | | | 1,503,199 | |
Gold Fields Ltd.—ADR | | | 1,894 | | | | 26,554 | |
Harmony Gold Mining Co. Ltd.—ADR | | | 28,546 | | | | 121,321 | |
Kumba Iron Ore Ltd.—ADR | | | 276 | | | | 3,712 | |
Lynas Rare Earths Ltd.—ADR(a) | | | 97,718 | | | | 728,976 | |
Newmont Corp. | | | 11,151 | | | | 738,196 | |
South32 Ltd.—ADR | | | 15,615 | | | | 271,389 | |
Summit Materials, Inc.—Class A(a) | | | 384 | | | | 11,988 | |
| | | | | | |
|
|
|
| | | | | | | | 6,997,308 | |
| | | | | | |
|
|
|
Miscellaneous Manufacturing—1.64% | | | | | | | | |
Acushnet Holdings Corp.(c) | | | 11,358 | | | | 497,480 | |
Align Technology, Inc.(a)(c) | | | 173 | | | | 88,483 | |
Argenx SE—ADR(a) | | | 469 | | | | 134,936 | |
Chow Tai Fook Jewellery Group Ltd.—ADR | | | 59,427 | | | | 1,229,040 | |
Cooper Cos., Inc.(c) | | | 3,745 | | | | 1,531,780 | |
DENTSPLY SIRONA, Inc. | | | 4,336 | | | | 234,751 | |
DexCom, Inc.(a) | | | 928 | | | | 384,108 | |
Edwards Lifesciences Corp.(a) | | | 7,333 | | | | 824,009 | |
Envista Holdings Corp.(a)(c) | | | 10,743 | | | | 515,664 | |
EssilorLuxottica SA—ADR | | | 6,036 | | | | 522,537 | |
Getinge AB—ADR(c) | | | 33,672 | | | | 1,295,025 | |
Inogen, Inc.(a) | | | 1,142 | | | | 39,844 | |
Integra LifeSciences Holdings Corp.(a)(c) | | | 6,084 | | | | 407,993 | |
Johnson & Johnson | | | 29,322 | | | | 4,825,522 | |
Mattel, Inc.(a)(c) | | | 15,252 | | | | 380,995 | |
Medigus Ltd.—ADR(a) | | | 53,015 | | | | 57,256 | |
Merit Medical Systems, Inc.(a)(c) | | | 3,997 | | | | 259,925 | |
Nintendo Co., Ltd.—ADR | | | 30,586 | | | | 1,944,352 | |
Peloton Interactive, Inc.—Class A(a)(c) | | | 845 | | | | 24,556 | |
Quoin Pharmaceuticals Ltd.—ADR(a) | | | 1,550 | | | | 1,721 | |
Shockwave Medical, Inc.(a) | | | 968 | | | | 171,559 | |
Siemens Healthineers AG—ADR | | | 17,326 | | | | 552,526 | |
STAAR Surgical Co.(a) | | | 2,220 | | | | 176,090 | |
Terumo Corp.—ADR | | | 25,405 | | | | 821,852 | |
Top Glove Corp. Bhd—ADR | | | 40,456 | | | | 73,225 | |
Yamaha Corp.—ADR (c0 | | | 12,609 | | | | 595,397 | |
| | | | | | |
|
|
|
| | | | | | | | 17,590,626 | |
| | | | | | |
|
|
|
Miscellaneous Store Retailers—0.19% | | | | | | | | |
Mr Price Group Ltd.—ADR | | | 30,720 | | | | 420,557 | |
Tractor Supply Co. | | | 7,836 | | | | 1,596,898 | |
| | | | | | |
|
|
|
| | | | | | | | 2,017,455 | |
| | | | | | |
|
|
|
Motion Picture and Sound Recording Industries—0.06% | | | | | | | | |
AMC Entertainment Holdings, Inc.(a)(c) | | | 10,004 | | | | 188,675 | |
Lions Gate Entertainment Corp.—Class A(a)(b)(c) | | | 14,177 | | | | 217,759 | |
Lions Gate Entertainment Corp.—Class B(a)(b) | | | 13,540 | | | | 192,945 | |
| | | | | | |
|
|
|
| | | | | | | | 599,379 | |
| | | | | | |
|
|
|
The accompanying notes are an integral part of these financial statements.
55
PMC DIVERSIFIED EQUITY FUND | Schedule of Investments |
February 28, 2022 (Unaudited) (Continued)
| | | | | | | | |
| | |
| | | Shares
| | | Value
| |
Motor Vehicle and Parts Dealers—0.68% | | | | | | | | |
Advance Auto Parts, Inc. | | | 5,191 | | | $ | 1,061,456 | |
Asbury Automotive Group, Inc.(a)(c) | | | 2,216 | | | | 430,148 | |
AutoNation, Inc.(a)(c) | | | 6,370 | | | | 730,384 | |
AutoZone, Inc.(a) | | | 705 | | | | 1,313,689 | |
CarMax, Inc.(a)(c) | | | 5,614 | | | | 613,779 | |
Carvana Co.(a)(c) | | | 661 | | | | 99,461 | |
Group 1 Automotive, Inc.(c) | | | 2,953 | | | | 537,239 | |
Lithia Motors, Inc.—Class A(c) | | | 1,511 | | | | 514,979 | |
O’Reilly Automotive, Inc.(a) | | | 1,916 | | | | 1,243,944 | |
Penske Automotive Group, Inc.(c) | | | 5,932 | | | | 583,056 | |
Sonic Automotive, Inc.—Class A | | | 3,116 | | | | 167,360 | |
| | | | | | |
|
|
|
| | | | | | | | 7,295,495 | |
| | | | | | |
|
|
|
National Security and International Affairs—0.06% | | | | | | | | |
Leidos Holdings, Inc. | | | 5,985 | | | | 609,513 | |
| | | | | | |
|
|
|
Nonmetallic Mineral Product Manufacturing—0.50% | | | | | | | | |
3M Co. | | | 9,241 | | | | 1,373,675 | |
AGC, Inc.—ADR | | | 91,528 | | | | 804,440 | |
Corning, Inc.(c) | | | 27,676 | | | | 1,118,110 | |
Loma Negra Cia Industrial Argentina SA—ADR(a) | | | 35,311 | | | | 200,213 | |
Mohawk Industries, Inc.(a) | | | 7,236 | | | | 1,018,685 | |
Quanex Building Products Corp.(c) | | | 11,715 | | | | 267,805 | |
TOTO Ltd.—ADR | | | 12,135 | | | | 509,973 | |
Wienerberger AG—ADR | | | 16,807 | | | | 101,682 | |
| | | | | | |
|
|
|
| | | | | | | | 5,394,583 | |
| | | | | | |
|
|
|
Nonstore Retailers—0.76% | | | | | | | | |
Amazon.com, Inc.(a) | | | 487 | | | | 1,495,704 | |
Baozun, Inc.—ADR(a)(c) | | | 17,065 | | | | 179,694 | |
eBay, Inc. | | | 32,750 | | | | 1,787,822 | |
Etsy, Inc.(a)(c) | | | 5,472 | | | | 847,558 | |
Grupo Aval Acciones y Valores SA—ADR | | | 79,882 | | | | 428,966 | |
JD.com, Inc.—ADR(a) | | | 23,443 | | | | 1,679,221 | |
Jumia Technologies AG—ADR(a)(c) | | | 5,400 | | | | 50,814 | |
Lands’ End, Inc.(a) | | | 6,537 | | | | 110,868 | |
MonotaRO Co. Ltd.—ADR | | | 17,423 | | | | 327,727 | |
Overstock.com, Inc.(a)(c) | | | 6,004 | | | | 341,628 | |
Pinduoduo, Inc.—ADR(a) | | | 2,939 | | | | 152,417 | |
Yunji, Inc.—ADR(a) | | | 3,662 | | | | 3,617 | |
ZOZO, Inc.—ADR(c) | | | 123,032 | | | | 706,757 | |
| | | | | | |
|
|
|
| | | | | | | | 8,112,793 | |
| | | | | | |
|
|
|
Nursing and Residential Care Facilities—0.06% | | | | | | | | |
Brookdale Senior Living, Inc.(a) | | | 21,343 | | | | 146,840 | |
Ensign Group, Inc.(c) | | | 3,787 | | | | 318,259 | |
National HealthCare Corp. | | | 2,337 | | | | 151,952 | |
| | | | | | |
|
|
|
| | | | | | | | 617,051 | |
| | | | | | |
|
|
|
Oil and Gas Extraction—2.23% | | | | | | | | |
AP Moeller—Maersk A/S—ADR(c) | | | 116,780 | | | | 1,853,299 | |
APA Corp. | | | 18,347 | | | | 653,704 | |
Continental Resources, Inc.(c) | | | 7,935 | | | | 439,837 | |
Devon Energy Corp.(c) | | | 23,356 | | | | 1,390,850 | |
Eni SpA—ADR | | | 71,974 | | | | 2,229,035 | |
The accompanying notes are an integral part of these financial statements.
56
PMC DIVERSIFIED EQUITY FUND | Schedule of Investments |
February 28, 2022 (Unaudited) (Continued)
| | | | | | | | |
| | |
| | | Shares
| | | Value
| |
EOG Resources, Inc. | | | 21,282 | | | $ | 2,445,727 | |
Gazprom PJSC—ADR(c) | | | 186,205 | | | | 571,649 | |
Marathon Oil Corp. | | | 43,249 | | | | 975,697 | |
Matador Resources Co.(c) | | | 9,507 | | | | 471,547 | |
Murphy Oil Corp.(c) | | | 11,224 | | | | 389,136 | |
Occidental Petroleum Corp. | | | 16,529 | | | | 722,813 | |
Ovintiv, Inc. | | | 8,282 | | | | 379,730 | |
Pampa Energia SA—ADR(a) | | | 8,675 | | | | 181,741 | |
PDC Energy, Inc. | | | 5,797 | | | | 374,022 | |
Petroleo Brasileiro SA—ADR(c) | | | 26,732 | | | | 382,000 | |
Repsol SA—ADR | | | 109,668 | | | | 1,432,264 | |
Shell PLC—ADR | | | 107,043 | | | | 5,607,984 | |
Surgutneftegas PJSC—ADR(c) | | | 15,549 | | | | 29,854 | |
TotalEnergies SE—ADR | | | 66,792 | | | | 3,374,999 | |
| | | | | | |
|
|
|
| | | | | | | | 23,905,888 | |
| | | | | | |
|
|
|
Other Information Services—0.39% | | | | | | | | |
Meta Platforms, Inc.—Class A(a) | | | 19,121 | | | | 4,035,105 | |
Phoenix New Media Ltd.—ADR(a)(c) | | | 205,982 | | | | 158,194 | |
| | | | | | |
|
|
|
| | | | | | | | 4,193,299 | |
| | | | | | |
|
|
|
Paper Manufacturing—0.21% | | | | | | | | |
Avery Dennison Corp. | | | 4,689 | | | | 826,202 | |
Boise Cascade Co. | | | 6,793 | | | | 543,032 | |
International Paper Co. | | | 11,532 | | | | 501,988 | |
WestRock Co. | | | 9,525 | | | | 431,197 | |
| | | | | | |
|
|
|
| | | | | | | | 2,302,419 | |
| | | | | | |
|
|
|
Performing Arts, Spectator Sports, and Related Industries—0.06% | | | | | | | | |
Entain PLC—ADR(a) | | | 2,491 | | | | 55,375 | |
MultiChoice Group—ADR | | | 16,457 | | | | 134,125 | |
OPAP SA—ADR | | | 24,579 | | | | 180,410 | |
TEGNA, Inc. | | | 12,425 | | | | 284,780 | |
| | | | | | |
|
|
|
| | | | | | | | 654,690 | |
| | | | | | |
|
|
|
Personal and Laundry Services—0.09% | | | | | | | | |
IAC/InterActiveCorp(a) | | | 592 | | | | 67,938 | |
Kingfisher PLC—ADR | | | 106,088 | | | | 861,435 | |
| | | | | | |
|
|
|
| | | | | | | | 929,373 | |
| | | | | | |
|
|
|
Petroleum and Coal Products Manufacturing—0.95% | | | | | | | | |
BP PLC—ADR | | | 71,766 | | | | 2,096,285 | |
Equinor ASA—ADR | | | 20,781 | | | | 653,770 | |
Exxon Mobil Corp. | | | 46,801 | | | | 3,670,135 | |
James Hardie Industries PLC—ADR | | | 28,997 | | | | 942,982 | |
Marathon Petroleum Corp.(c) | | | 19,639 | | | | 1,529,289 | |
OMV AG—ADR(c) | | | 26,933 | | | | 1,269,891 | |
| | | | | | |
|
|
|
| | | | | | | | 10,162,352 | |
| | | | | | |
|
|
|
Pipeline Transportation—0.02% | | | | | | | | |
Naturgy Energy Group SA—ADR | | | 3,766 | | | | 19,977 | |
Orsted AS—ADR | | | 3,383 | | | | 146,686 | |
Transportadora de Gas del Sur SA—Class B—ADR(a) | | | 6,263 | | | | 35,073 | |
| | | | | | |
|
|
|
| | | | | | | | 201,736 | |
| | | | | | |
|
|
|
The accompanying notes are an integral part of these financial statements.
57
PMC DIVERSIFIED EQUITY FUND | Schedule of Investments |
February 28, 2022 (Unaudited) (Continued)
| | | | | | | | |
| | |
| | | Shares
| | | Value
| |
Plastics and Rubber Products Manufacturing—0.25% | | | | | | | | |
Berry Global Group, Inc.(a) | | | 4,930 | | | $ | 299,005 | |
Bridgestone Corp.—ADR | | | 67,667 | | | | 1,395,970 | |
Entegris, Inc.(c) | | | 5,132 | | | | 669,623 | |
Goodyear Tire & Rubber Co.(a)(c) | | | 17,224 | | | | 266,800 | |
| | | | | | |
|
|
|
| | | | | | | | 2,631,398 | |
| | | | | | |
|
|
|
Postal Service—0.06% | | | | | | | | |
Royal Mail PLC—ADR | | | 64,195 | | | | 683,677 | |
| | | | | | |
|
|
|
Primary Metal Manufacturing—1.29% | | | | | | | | |
Alcoa Corp.(c) | | | 8,429 | | | | 635,041 | |
Aluminum Corp. of China Ltd.—ADR(a) | | | 88 | | | | 1,545 | |
APERAM SA(b) | | | 21,364 | | | | 1,180,147 | |
ArcelorMittal SA(b) | | | 48,974 | | | | 1,515,256 | |
Cia Siderurgica Nacional SA—ADR | | | 17,453 | | | | 84,647 | |
Commercial Metals Co. | | | 18,177 | | | | 700,723 | |
Encore Wire Corp.(c) | | | 6,431 | | | | 748,697 | |
Grupo Simec SAB de CV—ADR(a) | | | 1,237 | | | | 33,956 | |
Kubota Corp.—ADR | | | 14,504 | | | | 1,293,756 | |
Matthews International Corp.—Class A | | | 5,085 | | | | 168,720 | |
Mechel PJSC—ADR(a) | | | 59,509 | | | | 133,895 | |
Nippon Steel Corp.—ADR(c) | | | 66,009 | | | | 1,236,349 | |
Norsk Hydro ASA—ADR(c) | | | 303,078 | | | | 2,850,449 | |
Steel Dynamics, Inc.(c) | | | 11,413 | | | | 805,530 | |
Sumitomo Metal Mining Co. Ltd.—ADR | | | 76,645 | | | | 967,260 | |
Tenaris SA—ADR | | | 3,671 | | | | 95,189 | |
Ternium SA—ADR | | | 13,922 | | | | 546,856 | |
United States Steel Corp.(c) | | | 17,304 | | | | 470,842 | |
Usinas Siderurgicas de Minas Gerais SA Usiminas—ADR | | | 13,517 | | | | 41,903 | |
Worthington Industries, Inc. | | | 4,439 | | | | 253,112 | |
| | | | | | |
|
|
|
| | | | | | | | 13,763,873 | |
| | | | | | |
|
|
|
Printing and Related Support Activities—0.16% | | | | | | | | |
Dai Nippon Printing Co. Ltd.—ADR | | | 50,408 | | | | 666,394 | |
TOPPAN, Inc.—ADR | | | 53,359 | | | | 520,250 | |
Warner Music Group Corp.—Class A(c) | | | 13,586 | | | | 492,085 | |
| | | | | | |
|
|
|
| | | | | | | | 1,678,729 | |
| | | | | | |
|
|
|
Professional, Scientific, and Technical Services—3.66% | | | | | | | | |
Accenture PLC—Class A(b) | | | 19,861 | | | | 6,276,472 | |
AirNet Technology, Inc.—ADR(a) | | | 417 | | | | 575 | |
Allscripts Healthcare Solutions, Inc.(a)(c) | | | 7,881 | | | | 153,364 | |
Baidu, Inc.—ADR(a) | | | 4,973 | | | | 758,084 | |
BioNTech SE—ADR(a)(c) | | | 4,382 | | | | 660,849 | |
CACI International, Inc.—Class A(a) | | | 2,090 | | | | 584,761 | |
Capgemini SE—ADR | | | 27,925 | | | | 1,158,050 | |
Carlsberg AS—ADR | | | 78,235 | | | | 2,233,610 | |
CDW Corp. | | | 16,305 | | | | 2,811,960 | |
CGG SA—ADR(a) | | | 285,561 | | | | 247,581 | |
Charles River Labratories International, Inc.(a) | | | 591 | | | | 172,076 | |
Cheetah Mobile, Inc.—ADR(a) | | | 11,024 | | | | 14,111 | |
China Finance Online Co Ltd.—ADR(a) | | | 564 | | | | 733 | |
Clear Channel Outdoor Holdings, Inc.(a) | | | 27,483 | | | | 102,786 | |
Cognizant Technology Solutions Corp.—Class A | | | 23,850 | | | | 2,054,201 | |
Concentrix Corp. | | | 2,326 | | | | 464,944 | |
The accompanying notes are an integral part of these financial statements.
58
PMC DIVERSIFIED EQUITY FUND | Schedule of Investments |
February 28, 2022 (Unaudited) (Continued)
| | | | | | | | |
| | |
| | | Shares
| | | Value
| |
Dentsu Group, Inc.—ADR(c) | | | 1,794 | | | $ | 71,231 | |
Digital Turbine, Inc.(a)(c) | | | 3,304 | | | | 160,178 | |
DXC Technology Co.(a) | | | 11,550 | | | | 393,047 | |
Ebix, Inc.(c) | | | 1,368 | | | | 40,370 | |
Endava PLC—ADR(a) | | | 25 | | | | 3,330 | |
EPAM Systems, Inc.(a) | | | 1,849 | | | | 384,130 | |
Evolution AB—ADR | | | 726 | | | | 83,207 | |
F5, Inc.(a) | | | 2,006 | | | | 402,905 | |
FTI Consulting, Inc.(a) | | | 2,124 | | | | 310,104 | |
Gartner, Inc.(a) | | | 5,263 | | | | 1,475,850 | |
Genmab A/S—ADR(a) | | | 40,041 | | | | 1,339,772 | |
Gravity Co. Ltd.—ADR(a) | | | 6,904 | | | | 356,523 | |
Immutep Ltd.—ADR(a)(c) | | | 65,834 | | | | 159,318 | |
Indra Sistemas SA—ADR(a) | | | 47,797 | | | | 269,575 | |
Infosys Ltd.—ADR | | | 28,565 | | | | 641,570 | |
Insight Enterprises, Inc.(a)(c) | | | 6,480 | | | | 673,920 | |
Interpublic Group of Companies, Inc.(c) | | | 54,337 | | | | 1,999,602 | |
Jacobs Engineering Group, Inc. | | | 13,115 | | | | 1,613,145 | |
Maxar Technologies, Inc.(c) | | | 5,285 | | | | 171,445 | |
Maximus, Inc.(c) | | | 5,943 | | | | 468,665 | |
Meggitt PLC—ADR(a) | | | 2,041 | | | | 41,473 | |
Nielsen Holdings PLC(b) | | | 23,262 | | | | 405,224 | |
Omnicom Group, Inc. | | | 19,475 | | | | 1,633,758 | |
Palo Alto Networks, Inc.(a)(c) | | | 61 | | | | 36,249 | |
Pintec Technology Holdings Ltd.—ADR(a) | | | 4,980 | | | | 2,216 | |
Publicis Groupe SA—ADR | | | 74,855 | | | | 1,246,336 | |
PubMatic, Inc.—Class A(a) | | | 5,468 | | | | 167,321 | |
Riot Blockchain, Inc.(a)(c) | | | 6,544 | | | | 112,753 | |
Sage Group PLC—ADR | | | 2,414 | | | | 90,766 | |
Sandvik AB—ADR | | | 33,907 | | | | 725,949 | |
SAP SE—ADR | | | 11,161 | | | | 1,256,505 | |
Snap, Inc.—Class A(a)(c) | | | 5,281 | | | | 210,923 | |
Sumitomo Corp.—ADR | | | 2,831 | | | | 46,145 | |
Swatch Group AG—ADR | | | 23,060 | | | | 354,202 | |
Syneos Health, Inc.(a)(c) | | | 4,906 | | | | 388,555 | |
Trade Desk, Inc.—Class A(a)(c) | | | 1,629 | | | | 138,986 | |
Unity Software, Inc.(a)(c) | | | 1,396 | | | | 148,604 | |
Verint Systems, Inc.(a)(c) | | | 9,359 | | | | 470,103 | |
Virtu Financial, Inc.—Class A | | | 11,922 | | | | 418,224 | |
VMware, Inc.—Class A | | | 3,674 | | | | 431,034 | |
Wipro Ltd.—ADR | | | 139,527 | | | | 1,017,152 | |
Wuxi Biologics Cayman, Inc.—ADR(a) | | | 24,396 | | | | 403,998 | |
Xunlei Ltd.—ADR(a) | | | 31,268 | | | | 53,468 | |
Yiren Digital Ltd.—ADR(a) | | | 14,631 | | | | 38,041 | |
Zscaler, Inc.(a)(c) | | | 2,501 | | | | 598,114 | |
| | | | | | |
|
|
|
| | | | | | | | 39,148,143 | |
| | | | | | |
|
|
|
Publishing Industries (except Internet)—4.19% | | | | | | | | |
3D Systems Corp.(a)(c) | | | 10,986 | | | | 195,771 | |
Activision Blizzard, Inc. | | | 3,087 | | | | 251,591 | |
Adobe, Inc.(a) | | | 3,462 | | | | 1,619,108 | |
Akamai Technologies, Inc.(a)(c) | | | 9,208 | | | | 996,858 | |
Bill.com Holdings, Inc.(a)(c) | | | 2,319 | | | | 551,644 | |
Block, Inc.(a)(c) | | | 430 | | | | 54,825 | |
Cadence Design System, Inc.(a) | | | 2,309 | | | | 349,652 | |
The accompanying notes are an integral part of these financial statements.
59
PMC DIVERSIFIED EQUITY FUND | Schedule of Investments |
February 28, 2022 (Unaudited) (Continued)
| | | | | | | | |
| | |
| | | Shares
| | | Value
| |
CommVault Systems, Inc.(a) | | | 4,460 | | | $ | 280,579 | |
Crowdstrike Holdings, Inc.—Class A(a) | | | 207 | | | | 40,408 | |
Dassault Systemes SE—ADR | | | 7,343 | | | | 356,136 | |
Datadog, Inc.—Class A(a)(c) | | | 5,611 | | | | 903,988 | |
Dynatrace, Inc.(a) | | | 7,109 | | | | 315,782 | |
Fujitsu Ltd.—ADR | | | 57,672 | | | | 1,674,218 | |
Gaotu Techedu, Inc.—ADR(a) | | | 626 | | | | 1,096 | |
Hello Group, Inc.—ADR(c) | | | 2,387 | | | | 22,748 | |
Hewlett Packard Enterprise Co.(c) | | | 98,249 | | | | 1,564,124 | |
HubSpot, Inc.(a)(c) | | | 914 | | | | 479,850 | |
Intuit, Inc. | | | 1,958 | | | | 928,816 | |
Microsoft Corp. | | | 72,164 | | | | 21,561,881 | |
MongoDB, Inc.(a)(c) | | | 1,823 | | | | 696,368 | |
News Corp.—Class A | | | 63,002 | | | | 1,406,205 | |
News Corp.—Class B(c) | | | 74,322 | | | | 1,667,042 | |
Oracle Corp. | | | 37,416 | | | | 2,842,493 | |
PTC, Inc.(a) | | | 2,585 | | | | 287,659 | |
SPS Commerce, Inc.(a) | | | 1,675 | | | | 217,499 | |
SS&C Technologies Holdings, Inc. | | | 18,711 | | | | 1,402,764 | |
Synopsys, Inc.(a) | | | 9,412 | | | | 2,940,214 | |
Tarena International, Inc.—ADR(a) | | | 3,807 | | | | 9,518 | |
Trend Micro, Inc.—ADR(a) | | | 11,436 | | | | 645,562 | |
Vipshop Holdings Ltd.—ADR(a) | | | 18,805 | | | | 163,039 | |
Vnet Group, Inc.—ADR(a) | | | 251 | | | | 1,975 | |
Youdao, Inc.—ADR(a) | | | 11,082 | | | | 131,433 | |
ZoomInfo Technologies, Inc.(a)(c) | | | 5,172 | | | | 282,857 | |
| | | | | | |
|
|
|
| | | | | | | | 44,843,703 | |
| | | | | | |
|
|
|
Rail Transportation—0.04% | | | | | | | | |
CSX Corp. | | | 12,198 | | | | 413,634 | |
| | | | | | |
|
|
|
Real Estate—0.91% | | | | | | | | |
CBRE Group, Inc.—Class A(a) | | | 21,577 | | | | 2,089,733 | |
Daiwa House Industry Co. Ltd.—ADR | | | 25,232 | | | | 721,131 | |
eXp World Holdings, Inc.(c) | | | 4,564 | | | | 122,041 | |
Forestar Group, Inc.(a) | | | 9,637 | | | | 176,453 | |
Gafisa SA—ADR | | | 200 | | | | 147 | |
IRSA Inversiones y Representaciones SA—ADR(a) | | | 18,703 | | | | 88,839 | |
Jefferies Financial Group, Inc. | | | 24,138 | | | | 857,865 | |
Jones Lang LaSalle, Inc.(a) | | | 4,074 | | | | 1,003,101 | |
KE Holdings, Inc.—ADR(a) | | | 881 | | | | 17,100 | |
Marcus & Millichap, Inc.(a) | | | 13,696 | | | | 681,102 | |
Mitsubishi Estate Co. Ltd.—ADR | | | 42,478 | | | | 651,655 | |
Newmark Group, Inc.—Class A(c) | | | 20,799 | | | | 367,726 | |
Realogy Holdings Corp.(a)(c) | | | 18,455 | | | | 335,512 | |
RMR Group, Inc.—Class A | | | 7,651 | | | | 222,950 | |
Sekisui House Ltd.—ADR | | | 57,037 | | | | 1,172,111 | |
Sun Hung Kai Properties Ltd.—ADR | | | 62,675 | | | | 728,910 | |
Vonovia SE—ADR(c) | | | 8,805 | | | | 231,105 | |
Walker & Dunlop, Inc. | | | 1,915 | | | | 264,940 | |
| | | | | | |
|
|
|
| | | | | | | | 9,732,421 | |
| | | | | | |
|
|
|
Rental and Leasing Services—0.82% | | | | | | | | |
AMERCO | | | 729 | | | | 421,078 | |
Ashtead Group PLC—ADR(c) | | | 3,300 | | | | 853,545 | |
The accompanying notes are an integral part of these financial statements.
60
PMC DIVERSIFIED EQUITY FUND | Schedule of Investments |
February 28, 2022 (Unaudited) (Continued)
| | | | | | | | |
| | |
| | | Shares
| | | Value
| |
Avis Budget Group, Inc.(a)(c) | | | 926 | | | $ | 169,865 | |
Cerence, Inc.(a) | | | 1,981 | | | | 71,534 | |
Navient Corp.(c) | | | 24,083 | | | | 424,102 | |
Netflix, Inc.(a)(c) | | | 4,235 | | | | 1,670,792 | |
ORIX Corp.—ADR | | | 30,784 | | | | 3,034,994 | |
Rent-A-Center, Inc.(c) | | | 5,246 | | | | 149,039 | |
Ryder System, Inc. | | | 4,841 | | | | 381,664 | |
Triton International Ltd.(b) | | | 12,462 | | | | 818,504 | |
United Rentals, Inc.(a) | | | 2,568 | | | | 825,920 | |
| | | | | | |
|
|
|
| | | | | | | | 8,821,037 | |
| | | | | | |
|
|
|
Repair and Maintenance—0.05% | | | | | | | | |
SKF AB—ADR | | | 20,897 | | | | 381,161 | |
Valvoline, Inc.(c) | | | 6,060 | | | | 195,920 | |
| | | | | | |
|
|
|
| | | | | | | | 577,081 | |
| | | | | | |
|
|
|
Securities, Commodity Contracts, and Other Financial Investments and Related Activities—2.63% | | | | | |
360 DigiTech, Inc.—ADR | | | 11,859 | | | | 222,356 | |
Affiliated Managers Group, Inc. | | | 2,038 | | | | 281,978 | |
Amarin Corp. PLC—ADR(a)(c) | | | 17,904 | | | | 59,262 | |
Apollo Global Management, Inc.(c) | | | 8,516 | | | | 555,754 | |
Ares Management Corp.—Class A | | | 2,357 | | | | 191,129 | |
Artisan Partners Asset Management, Inc.—Class A(c) | | | 7,919 | | | | 301,793 | |
Astra International, Tbk PT—ADR | | | 59,907 | | | | 495,431 | |
Bidvest Group Ltd.—ADR | | | 4,463 | | | | 123,447 | |
Blackstone, Inc. | | | 13,242 | | | | 1,687,957 | |
Cerevel Therapeutics Holdings, Inc.(a) | | | 2,494 | | | | 66,016 | |
Chemed Corp.(c) | | | 436 | | | | 208,534 | |
CK Hutchison Holdings Ltd.—ADR | | | 1,730 | | | | 12,145 | |
Daqo New Energy Corp.—ADR(a) | | | 4,345 | | | | 208,386 | |
Douglas Elliman, Inc.(a) | | | 426 | | | | 3,212 | |
EDAP TMS SA—ADR(a) | | | 6,791 | | | | 49,642 | |
Evercore, Inc.—Class A | | | 3,363 | | | | 427,135 | |
First Pacific Co. Ltd.—ADR | | | 325,616 | | | | 651,232 | |
Franklin Resources, Inc.(c) | | | 18,296 | | | | 543,940 | |
Futu Holdings Ltd.—ADR(a)(c) | | | 20,533 | | | | 877,786 | |
Genting Bhd—ADR | | | 2,358 | | | | 14,313 | |
Goldman Sachs Group, Inc. | | | 9,666 | | | | 3,298,908 | |
Hong Kong Exchanges & Clearing Ltd.—ADR | | | 8,950 | | | | 434,881 | |
Houlihan Lokey, Inc.(c) | | | 3,539 | | | | 364,022 | |
Indivior PLC—ADR(a) | | | 8,797 | | | | 163,816 | |
Invesco Ltd.(b) | | | 21,133 | | | | 448,865 | |
Janus Henderson Group PLC(b) | | | 14,188 | | | | 476,291 | |
Japan Exchange Group, Inc.—ADR | | | 51,987 | | | | 487,768 | |
Leju Holdings Ltd.—ADR(a) | | | 40,726 | | | | 24,016 | |
Lixil Corp.—ADR | | | 21,438 | | | | 950,347 | |
LPL Financial Holdings, Inc. | | | 12 | | | | 2,171 | |
Lucid Group, Inc.(a)(c) | | | 14,632 | | | | 424,035 | |
Macquarie Group Ltd.—ADR | | | 7,710 | | | | 1,021,190 | |
Moelis & Co.—Class A | | | 8,000 | | | | 385,680 | |
Morgan Stanley(c) | | | 21,837 | | | | 1,981,489 | |
NASDAQ, Inc.(c) | | | 3,359 | | | | 574,893 | |
NIO, Inc.—ADR(a) | | | 12,747 | | | | 291,141 | |
Nordea Bank Abp—ADR | | | 56,702 | | | | 629,959 | |
Piper Jaffray Cos. | | | 3,005 | | | | 444,770 | |
The accompanying notes are an integral part of these financial statements.
61
PMC DIVERSIFIED EQUITY FUND | Schedule of Investments |
February 28, 2022 (Unaudited) (Continued)
| | | | | | | | |
| | |
| | | Shares
| | | Value
| |
Randstad NV—ADR(c) | | | 4,546 | | | $ | 155,019 | |
Raymond James Financial, Inc.(c) | | | 13,878 | | | | 1,521,722 | |
S&P Global, Inc.(c) | | | 770 | | | | 289,289 | |
Sea Ltd.—ADR(a) | | | 2,356 | | | | 343,034 | |
Secoo Holding Ltd.—ADR(a) | | | 8,288 | | | | 3,314 | |
Sibanye Stillwater Ltd.—ADR | | | 18,870 | | | | 360,794 | |
SLM Corp. | | | 33,796 | | | | 665,781 | |
Societe Generale SA—ADR | | | 310,159 | | | | 1,764,804 | |
SOFI Technologies, Inc.(a)(c) | | | 13,033 | | | | 149,228 | |
StepStone Group, Inc.—Class A | | | 8,881 | | | | 306,661 | |
Stifel Financial Corp.(c) | | | 16,405 | | | | 1,205,768 | |
T Rowe Price Group, Inc.(c) | | | 2,753 | | | | 397,974 | |
TechnoPro Holdings, Inc.—ADR | | | 150,810 | | | | 872,436 | |
Tradeweb Markets, Inc.—Class A | | | 3,401 | | | | 287,316 | |
Uxin Ltd.—ADR(a) | | | 90,757 | | | | 93,480 | |
Virtus Investment Partners, Inc. | | | 1,340 | | | | 322,431 | |
| | | | | | |
|
|
|
| | | | | | | | 28,124,741 | |
| | | | | | |
|
|
|
Specialty Trade Contractors—0.22% | | | | | | | | |
Comfort Systems USA, Inc.(c) | | | 6,566 | | | | 564,545 | |
EMCOR Group, Inc. | | | 7,314 | | | | 845,059 | |
NetEase, Inc.—ADR | | | 2,342 | | | | 223,286 | |
Quanta Services, Inc. | | | 5,373 | | | | 585,335 | |
QuantumScape Corp.(a)(c) | | | 6,990 | | | | 112,819 | |
| | | | | | |
|
|
|
| | | | | | | | 2,331,044 | |
| | | | | | |
|
|
|
Sporting Goods, Hobby, Musical Instrument, and Book Stores—0.07% | | | | | | | | |
Camping World Holdings, Inc.—Class A(c) | | | 4,235 | | | | 130,057 | |
Dick’s Sporting Goods, Inc.(c) | | | 5,676 | | | | 595,980 | |
| | | | | | |
|
|
|
| | | | | | | | 726,037 | |
| | | | | | |
|
|
|
Support Activities for Agriculture and Forestry—0.15% | | | | | | | | |
Andersons, Inc. | | | 8,508 | | | | 387,965 | |
Corteva, Inc. | | | 22,842 | | | | 1,188,469 | |
VEON Ltd.—ADR(a) | | | 39,233 | | | | 20,217 | |
| | | | | | |
|
|
|
| | | | | | | | 1,596,651 | |
| | | | | | |
|
|
|
Support Activities for Mining—1.11% | | | | | | | | |
BHP Group Ltd.—ADR | | | 12,911 | | | | 875,237 | |
California Resources Corp. | | | 6,638 | | | | 273,685 | |
Cleveland-Cliffs, Inc.(a)(c) | | | 20,022 | | | | 447,692 | |
ConocoPhillips | | | 27,825 | | | | 2,639,480 | |
Diamondback Energy, Inc. | | | 2,646 | | | | 365,413 | |
Epiroc AB—ADR(c) | | | 45,519 | | | | 848,019 | |
Fortescue Metals Group Ltd.—ADR | | | 43,296 | | | | 1,146,478 | |
Hess Corp. | | | 1,689 | | | | 170,690 | |
Impala Platinum Holdings Ltd.—ADR | | | 32,357 | | | | 610,091 | |
Inpex Corp.—ADR | | | 105,361 | | | | 1,074,682 | |
Rio Tinto PLC—ADR | | | 30,643 | | | | 2,407,927 | |
Targa Resources Corp. | | | 11,505 | | | | 752,082 | |
Transocean Ltd.(a)(b) | | | 51,745 | | | | 183,177 | |
Tullow Oil PLC—ADR(a) | | | 50,158 | | | | 16,477 | |
Weir Group PLC—ADR | | | 5,739 | | | | 60,891 | |
| | | | | | |
|
|
|
| | | | | | | | 11,872,021 | |
| | | | | | |
|
|
|
The accompanying notes are an integral part of these financial statements.
62
PMC DIVERSIFIED EQUITY FUND | Schedule of Investments |
February 28, 2022 (Unaudited) (Continued)
| | | | | | | | |
| | |
| | | Shares
| | | Value
| |
Support Activities for Transportation—0.55% | | | | | | | | |
CH Robinson Worldwide, Inc.(c) | | | 4,432 | | | $ | 428,486 | |
DSV A/S—ADR | | | 9,999 | | | | 916,308 | |
Expeditors International of Washington, Inc. | | | 19,872 | | | | 2,053,970 | |
Grupo Aeroportuario del Sureste SAB de CV—ADR | | | 753 | | | | 162,603 | |
Hub Group, Inc.—Class A (a) | | | 4,471 | | | | 377,352 | |
JB Hunt Transport Services, Inc.(c) | | | 4,753 | | | | 964,526 | |
Matson, Inc. | | | 7,110 | | | | 787,575 | |
XPO Logistics, Inc.(a) | | | 2,945 | | | | 214,043 | |
| | | | | | |
|
|
|
| | | | | | | | 5,904,863 | |
| | | | | | |
|
|
|
Telecommunications—2.37% | | | | | | | | |
Adyen NV—ADR(a) | | | 39,293 | | | | 813,758 | |
Bezeq The Israeli Telecommunication Corp. Ltd.—ADR(a) | | | 158,113 | | | | 1,299,752 | |
Chunghwa Telecom Co. Ltd.—ADR | | | 16,669 | | | | 743,604 | |
Deutsche Telekom AG—ADR | | | 84,647 | | | | 1,515,182 | |
Eutelsat Communications SA—ADR | | | 118,126 | | | | 336,659 | |
Hellenic Telecommunications Organization SA—ADR | | | 6,723 | | | | 68,776 | |
JOYY, Inc.—ADR(c) | | | 15 | | | | 694 | |
KDDI Corp.—ADR | | | 137,812 | | | | 2,233,243 | |
Koninklijke KPN NV—ADR | | | 163,420 | | | | 550,725 | |
KT Corp.—ADR(a) | | | 111,181 | | | | 1,466,477 | |
Lumen Technologies, Inc.(c) | | | 83,923 | | | | 869,442 | |
Magyar Telekom Telecommunications PLC—ADR | | | 35,539 | | | | 221,230 | |
Meituan—ADR(a) | | | 9,254 | | | | 411,063 | |
Mobile TeleSystems PJSC—ADR | | | 46,068 | | | | 253,374 | |
MTN Group Ltd.—ADR(a) | | | 115,840 | | | | 1,451,475 | |
Nippon Telegraph & Telephone Corp.—ADR | | | 99,918 | | | | 2,888,630 | |
Nokia Oyj—ADR(a) | | | 238,462 | | | | 1,275,772 | |
Oxford Industries, Inc. | | | 2,896 | | | | 255,977 | |
Partner Communications Co. Ltd.—ADR(a) | | | 6,178 | | | | 48,250 | |
PLDT, Inc.—ADR(c) | | | 13,435 | | | | 472,778 | |
Renren, Inc.—ADR(a)(c) | | | 7,443 | | | | 168,956 | |
ResMed, Inc. | | | 2,535 | | | | 625,511 | |
Rostelecom PJSC—ADR(c) | | | 24,510 | | | | 108,212 | |
SK Telecom Co. Ltd.—ADR(c) | | | 27,281 | | | | 683,935 | |
SoftBank Corp.—ADR(c) | | | 62,684 | | | | 790,452 | |
Tele2 AB—ADR | | | 45,405 | | | | 299,673 | |
Telecom Italia SpA/Milano—ADR | | | 140,563 | | | | 591,770 | |
Telecom Italia SpA/Milano—ADR | | | 160,092 | | | | 653,175 | |
Telefonaktiebolaget LM Ericsson—ADR | | | 39,173 | | | | 363,525 | |
Telenor ASA—ADR | | | 50,838 | | | | 753,928 | |
Telephone and Data Systems, Inc. | | | 6,930 | | | | 120,236 | |
Telkom Indonesia Persero Tbk PT—ADR | | | 48,933 | | | | 1,453,799 | |
The9 Ltd.—ADR(a)(c) | | | 16,790 | | | | 66,321 | |
Vodacom Group Ltd.—ADR | | | 22,400 | | | | 219,072 | |
XL Axiata Tbk PT—ADR | | | 85,559 | | | | 347,370 | |
Z Holdings Corp.—ADR(c) | | | 11,454 | | | | 110,875 | |
Ziff Davis, Inc.(a)(c) | | | 4,730 | | | | 475,838 | |
Zoom Video Communications, Inc.—Class A(a) | | | 2,629 | | | | 348,605 | |
| | | | | | |
|
|
|
| | | | | | | | 25,358,114 | |
| | | | | | |
|
|
|
Textile Mills—0.03% | | | | | | | | |
Dunxin Financial Holdings Ltd.—ADR(a)(c) | | | 19,549 | | | | 11,972 | |
National Presto Industries, Inc.(c) | | | 1,024 | | | | 81,408 | |
The accompanying notes are an integral part of these financial statements.
63
PMC DIVERSIFIED EQUITY FUND | Schedule of Investments |
February 28, 2022 (Unaudited) (Continued)
| | | | | | | | |
| | |
| | | Shares
| | | Value
| |
Teijin Ltd.—ADR | | | 17,098 | | | $ | 205,261 | |
| | | | | | |
|
|
|
| | | | | | | | 298,641 | |
| | | | | | |
|
|
|
Textile Product Mills—0.07% | | | | | | | | |
Hermes International—ADR | | | 3,244 | | | | 447,186 | |
Interface, Inc. | | | 12,319 | | | | 160,763 | |
Kontoor Brands, Inc. | | | 4,021 | | | | 199,200 | |
| | | | | | |
|
|
|
| | | | | | | | 807,149 | |
| | | | | | |
|
|
|
Transit and Ground Passenger Transportation—0.01% | | | | | | | | |
Uber Technologies, Inc.(a) | | | 756 | | | | 27,239 | |
Yalla Group Ltd.—ADR(a) | | | 9,202 | | | | 55,948 | |
| | | | | | |
|
|
|
| | | | | | | | 83,187 | |
| | | | | | |
|
|
|
Transportation Equipment Manufacturing—4.56% | | | | | | | | |
Airbus SE—ADR(a) | | | 36,666 | | | | 1,161,946 | |
Aisin Corp.—ADR | | | 10,786 | | | | 391,586 | |
Aptiv PLC(a)(b) | | | 201 | | | | 26,017 | |
BAE Systems PLC—ADR | | | 40,282 | | | | 1,563,344 | |
Bayerische Motoren Werke AG—ADR | | | 33,363 | | | | 1,063,612 | |
BorgWarner, Inc.(c) | | | 22,464 | | | | 921,249 | |
Brilliance China Automotive Holdings Ltd.—ADR(a)(e) | | | 37,772 | | | | 173,751 | |
BYD Co. Ltd.—ADR | | | 6,658 | | | | 413,062 | |
Denso Corp.—ADR | | | 48,910 | | | | 1,709,405 | |
Embraer SA—ADR(a) | | | 1,351 | | | | 18,617 | |
Ford Motor Co. | | | 126,172 | | | | 2,215,580 | |
General Dynamics Corp. | | | 10,670 | | | | 2,501,581 | |
General Motors Co.(a) | | | 27,286 | | | | 1,274,802 | |
Great Wall Motor Co. Ltd.—ADR | | | 14,975 | | | | 309,683 | |
Honda Motor Co. Ltd.—ADR | | | 97,739 | | | | 2,986,904 | |
Huntington Ingalls Industries, Inc.(c) | | | 2,158 | | | | 441,095 | |
Isuzu Motors Ltd.—ADR(c) | | | 54,712 | | | | 741,895 | |
Kawasaki Heavy Industries Ltd.—ADR(c) | | | 26,219 | | | | 198,137 | |
Lear Corp.(c) | | | 7,306 | | | | 1,149,526 | |
Leonardo SpA—ADR(a) | | | 51,847 | | | | 228,645 | |
Lockheed Martin Corp.(c) | | | 1,175 | | | | 509,715 | |
Mazda Motor Corp.—ADR(a) | | | 3,382 | | | | 12,480 | |
Mercedes-Benz Group AG—ADR | | | 147,511 | | | | 2,864,663 | |
Nikola Corp.(a)(c) | | | 4,660 | | | | 36,814 | |
Niu Technologies—ADR(a) | | | 20,778 | | | | 258,478 | |
Oshkosh Corp.(c) | | | 5,332 | | | | 592,065 | |
Raytheon Technologies Corp. | | | 17,925 | | | | 1,840,898 | |
REV Group, Inc.(c) | | | 11,990 | | | | 162,105 | |
Shimano, Inc.—ADR | | | 57,437 | | | | 1,335,985 | |
Subaru Corp.—ADR | | | 21,529 | | | | 176,538 | |
Suzuki Motor Corp.—ADR | | | 1,293 | | | | 205,199 | |
Tata Motors Ltd.—ADR(a) | | | 30,262 | | | | 916,636 | |
Tesla, Inc.(a) | | | 6,888 | | | | 5,995,522 | |
Textron, Inc. | | | 24,142 | | | | 1,765,504 | |
Toyota Industries Corp.—ADR | | | 13,441 | | | | 1,032,874 | |
Toyota Motor Corp.—ADR | | | 54,706 | | | | 10,008,462 | |
Vitesco Technologies Group AG—ADR(a) | | | 286 | | | | 2,531 | |
Volvo AB—ADR | | | 58,615 | | | | 1,118,960 | |
Westinghouse Air Brake Technologies Corp. | | | 5,685 | | | | 527,682 | |
| | | | | | |
|
|
|
| | | | | | | | 48,853,548 | |
| | | | | | |
|
|
|
The accompanying notes are an integral part of these financial statements.
64
PMC DIVERSIFIED EQUITY FUND | Schedule of Investments |
February 28, 2022 (Unaudited) (Continued)
| | | | | | | | |
| | |
| | | Shares
| | | Value
| |
Truck Transportation—0.29% | | | | | | | | |
ArcBest Corp.(c) | | | 4,621 | | | $ | 428,274 | |
Knight-Swift Transportation Holdings, Inc. | | | 10,022 | | | | 545,999 | |
Old Dominion Freight Lines, Inc. | | | 2,472 | | | | 776,282 | |
Saia, Inc.(a)(c) | | | 1,012 | | | | 290,677 | |
Schneider National, Inc.—Class B(c) | | | 18,739 | | | | 489,463 | |
Werner Enterprises, Inc. | | | 13,211 | | | | 574,150 | |
| | | | | | |
|
|
|
| | | | | | | | 3,104,845 | |
| | | | | | |
|
|
|
Utilities—2.33% | | | | | | | | |
AES Corp. | | | 20,430 | | | | 433,729 | |
American Electric Power Co., Inc. | | | 1,725 | | | | 156,371 | |
Avista Corp.(c) | | | 7,541 | | | | 336,555 | |
CenterPoint Energy, Inc.(c) | | | 22,620 | | | | 618,657 | |
Centrica PLC—ADR (a) | | | 291,867 | | | | 1,187,899 | |
Cia Energetica de Minas Gerais—ADR(c) | | | 15,046 | | | | 49,501 | |
CLP Holdings Ltd.—ADR | | | 161,768 | | | | 1,654,887 | |
Consolidated Edison, Inc. | | | 7,862 | | | | 674,324 | |
Constellation Energy Corp.(c) | | | 10,334 | | | | 475,157 | |
DTE Energy Co. | | | 11,598 | | | | 1,410,201 | |
Duke Energy Corp. | | | 5,777 | | | | 580,069 | |
E.ON SE—ADR | | | 162,764 | | | | 2,203,824 | |
Électricité de France SA—ADR | | | 206,689 | | | | 361,706 | |
Empresa Distribuidora Y Comercializadora Norte—ADR(a) | | | 401 | | | | 2,635 | |
Entergy Corp. | | | 1,170 | | | | 123,096 | |
Evergy, Inc. | | | 29,261 | | | | 1,826,179 | |
Exelon Corp. | | | 31,004 | | | | 1,319,530 | |
First Solar, Inc.(a) | | | 3,582 | | | | 269,689 | |
FirstEnergy Corp. | | | 53,987 | | | | 2,259,355 | |
Hong Kong & China Gas Co. Ltd.—ADR | | | 521,923 | | | | 788,104 | |
Kinder Morgan, Inc.(c) | | | 9,031 | | | | 157,139 | |
MDU Resources Group, Inc. | | | 23,652 | | | | 633,164 | |
National Fuel Gas Co.(c) | | | 8,558 | | | | 532,650 | |
NiSource, Inc. | | | 24,734 | | | | 715,555 | |
NRG Energy, Inc.(c) | | | 11,240 | | | | 425,322 | |
ONEOK, Inc.(c) | | | 8,357 | | | | 545,712 | |
PG&E Corp.(a) | | | 23,306 | | | | 264,989 | |
Portland General Electric Co. | | | 9,016 | | | | 457,742 | |
Power Assets Holdings Ltd.—ADR | | | 40,850 | | | | 255,721 | |
PPL Corp. | | | 4,614 | | | | 120,748 | |
Red Electrica Corp. SA—ADR | | | 35,218 | | | | 349,010 | |
Southern Co. | | | 13,504 | | | | 874,654 | |
SSE PLC—ADR | | | 16,805 | | | | 387,187 | |
Tokyo Gas Co. Ltd.—ADR | | | 65,161 | | | | 663,665 | |
UGI Corp.(c) | | | 21,055 | | | | 809,354 | |
Vale SA—ADR | | | 54,491 | | | | 1,007,539 | |
| | | | | | |
|
|
|
| | | | | | | | 24,931,619 | |
| | | | | | |
|
|
|
Waste Management and Remediation Services—0.35% | | | | | | | | |
Republic Sevices, Inc. | | | 15,261 | | | | 1,835,593 | |
Veolia Environnement SA—ADR | | | 39,446 | | | | 1,364,240 | |
Waste Management, Inc. | | | 3,787 | | | | 546,843 | |
| | | | | | |
|
|
|
| | | | | | | | 3,746,676 | |
| | | | | | |
|
|
|
The accompanying notes are an integral part of these financial statements.
65
PMC DIVERSIFIED EQUITY FUND | Schedule of Investments |
February 28, 2022 (Unaudited) (Continued)
| | | | | | | | |
| | |
| | | Shares
| | | Value
| |
Water Transportation—0.25% | | | | | | | | |
Nippon Yusen KK—ADR(c) | | | 143,041 | | | $ | 2,703,475 | |
| | | | | | |
|
|
|
Wood Product Manufacturing—0.33% | | | | | | | | |
Builders FirstSource, Inc.(a) | | | 12,049 | | | | 896,686 | |
Greif, Inc.—Class A(c) | | | 6,611 | | | | 380,067 | |
Greif, Inc.—Class B | | | 2,222 | | | | 126,476 | |
Louisiana-Pacific Corp.(c) | | | 7,870 | | | | 566,247 | |
Owens Corning(c) | | | 5,867 | | | | 546,746 | |
Skyline Champion Corp.(a)(c) | | | 3,090 | | | | 207,772 | |
Trex Co., Inc.(a)(c) | | | 1,760 | | | | 161,638 | |
UFP Industries, Inc. | | | 8,145 | | | | 698,434 | |
| | | | | | |
|
|
|
| | | | | | | | 3,584,066 | |
| | | | | | |
|
|
|
Total Common Stocks (Cost $829,148,492) | | | | | | | 1,025,240,977 | |
| | | | | | |
|
|
|
| Preferred Stocks—0.22% | | | | | | | | |
Credit Intermediation and Related Activities—0.01% | | | | | | | | |
Bancolombia SA—ADR, 0.689%(d) | | | 4,276 | | | | 154,919 | |
| | | | | | |
|
|
|
Management of Companies and Enterprises—0.05% | | | | | | | | |
Porsche Automobil Holding SE—ADR, 2.536%(d) | | | 51,700 | | | | 512,864 | |
| | | | | | |
|
|
|
Merchant Wholesalers, Durable Goods—0.11% | | | | | | | | |
Volkswagen AG—ADR, 2.729%(c)(d) | | | 57,038 | | | | 1,120,796 | |
| | | | | | |
|
|
|
Oil and Gas Extraction—0.03% | | | | | | | | |
Petroleo Brasileiro SA—ADR, 15.513%(d) | | | 11,571 | | | | 151,465 | |
Surgutneftegas PJSC—ADR, 26.431%(d) | | | 47,748 | | | | 140,379 | |
| | | | | | |
|
|
|
| | | | | | | | 291,844 | |
| | | | | | |
|
|
|
Utilities—0.02% | | | | | | | | |
Cia Energetica de Minas Gerais—ADR, 8.384%(d) | | | 97,821 | | | | 246,509 | |
Cia Paranaense de Energia—ADR, 17.838%(d) | | | 1,319 | | | | 8,653 | |
| | | | | | |
|
|
|
| | | | | | | | 255,162 | |
| | | | | | |
|
|
|
Total Preferred Stocks (Cost $2,613,663) | | | | | | | 2,335,585 | |
| | | | | | |
|
|
|
| Exchange-Traded Funds—0.98% | | | | | | | | |
iShares MSCI EAFE ETF(c) | | | 51,894 | | | | 3,799,679 | |
Vanguard FTSE Emerging Markets ETF(c) | | | 12,336 | | | | 589,908 | |
Vanguard Large-Cap ETF(c) | | | 23,999 | | | | 4,838,917 | |
Vanguard Small-Cap ETF | | | 6,163 | | | | 1,294,292 | |
| | | | | | |
|
|
|
Total Exchange-Traded Funds (Cost $10,384,362) | | | | | | | 10,522,796 | |
| | | | | | |
|
|
|
| Real Estate Investment Trusts—2.08% | | | | | | | | |
Funds, Trusts, and Other Financial Vehicles—0.01% | | | | | | | | |
Apollo Commercial Real Estate Finance, Inc. | | | 8,628 | | | | 112,595 | |
| | | | | | |
|
|
|
Heavy and Civil Engineering Construction—0.06% | | | | | | | | |
Cyrela Brazil Realty SA Empreendimentos e Participacoes—ADR | | | 38,112 | | | | 109,610 | |
Paramount Group, Inc. | | | 50,462 | | | | 564,670 | |
| | | | | | |
|
|
|
| | | | | | | | 674,280 | |
| | | | | | |
|
|
|
Professional, Scientific, and Technical Services—0.04% | | | | | | | | |
Extra Space Storage, Inc. | | | 2,388 | | | | 449,302 | |
| | | | | | |
|
|
|
Real Estate—1.70% | | | | | | | | |
AGNC Investment Corp.(c) | | | 16,814 | | | | 217,069 | |
Annaly Capital Mangement, Inc.(c) | | | 80,357 | | | | 559,285 | |
The accompanying notes are an integral part of these financial statements.
66
PMC DIVERSIFIED EQUITY FUND | Schedule of Investments |
February 28, 2022 (Unaudited) (Continued)
| | | | | | | | |
| | |
| | | Shares
| | | Value
| |
AvalonBay Communities, Inc. | | | 741 | | | $ | 176,795 | |
Brandywine Realty Trust(c) | | | 26,399 | | | | 351,899 | |
Brixmor Property Group, Inc. | | | 23,482 | | | | 589,868 | |
Broadstone Net Lease, Inc.(c) | | | 23,581 | | | | 510,764 | |
Chimera Investment Corp. | | | 26,011 | | | | 316,554 | |
Cousins Properties, Inc.(c) | | | 10,734 | | | | 414,654 | |
Empire State Realty Trust, Inc.—Class A | | | 10,617 | | | | 100,437 | |
Equity Residential | | | 12,704 | | | | 1,083,651 | |
Franklin Street Properties Corp.(c) | | | 36,164 | | | | 209,028 | |
Gaming and Leisure Properties, Inc. | | | 10,921 | | | | 495,923 | |
Highwoods Properties, Inc.(c) | | | 9,495 | | | | 413,982 | |
Industrial Logistics Properties Trust | | | 11,061 | | | | 247,435 | |
iStar, Inc.(c) | | | 10,787 | | | | 270,969 | |
Kimco Realty Corp.(c) | | | 27,626 | | | | 650,040 | |
LXP Industrial Trust(c) | | | 26,846 | | | | 415,039 | |
MFA Financial, Inc. | | | 48,477 | | | | 196,817 | |
Mid-America Apartment Communities, Inc. | | | 9,307 | | | | 1,904,304 | |
Necessity Retail REIT, Inc. | | | 20,358 | | | | 143,320 | |
Office Properties Income Trust(c) | | | 15,819 | | | | 396,266 | |
PotlatchDeltic Corp.(c) | | | 9,223 | | | | 506,343 | |
Public Storage | | | 507 | | | | 179,995 | |
Rayonier, Inc. | | | 13,465 | | | | 534,561 | |
Redwood Trust, Inc. | | | 16,725 | | | | 173,773 | |
Regency Centers Corp. | | | 27,267 | | | | 1,796,622 | |
RPT Realty | | | 19,252 | | | | 249,313 | |
Simon Property Group, Inc. | | | 11,053 | | | | 1,520,451 | |
SITE Centers Corp. | | | 23,250 | | | | 361,538 | |
SL Green Realty Corp. | | | 6,601 | | | | 524,907 | |
Tanger Factory Outlet Centers, Inc.(c) | | | 12,371 | | | | 206,348 | |
Two Harbors Investment Corp.(c) | | | 22,478 | | | | 113,739 | |
Urstadt Biddle Properties, Inc.—Class A | | | 13,741 | | | | 258,743 | |
VICI Properties, Inc. | | | 24,821 | | | | 693,995 | |
Welltower, Inc.(c) | | | 5,204 | | | | 433,441 | |
WP Carey, Inc. | | | 12,661 | | | | 979,961 | |
| | | | | | |
|
|
|
| | | | | | | | 18,197,829 | |
| | | | | | |
|
|
|
Telecommunications—0.03% | | | | | | | | |
Uniti Group, Inc. | | | 27,937 | | | | 362,343 | |
| | | | | | |
|
|
|
Warehousing and Storage—0.12% | | | | | | | | |
Iron Mountain, Inc.(c) | | | 24,945 | | | | 1,226,795 | |
| | | | | | |
|
|
|
Wood Product Manufacturing—0.12% | | | | | | | | |
Weyerhaeuser Co. | | | 32,535 | | | | 1,264,961 | |
| | | | | | |
|
|
|
Total Real Estate Investment Trusts (Cost $20,378,289) | | | | | | | 22,288,105 | |
| | | | | | |
|
|
|
| Rights—0.00% | | | | | | | | |
Chemical Manufacturing—0.00% | | | | | | | | |
Cellect Biotechnology CVR(a)(e) | | | 620,000 | | | | 0 | |
| | | | | | |
|
|
|
Total Rights (Cost $0) | | | | | | | 0 | |
| | | | | | |
|
|
|
| Investments Purchased With Collateral From Securities Lending—21.05% | | | | | | | | |
Money Market Fund—21.05% | | | | | | | | |
Mount Vernon Liquid Assets Portfolio, LLC, 0.120%(f) | | | 225,434,942 | | | | 225,434,942 | |
| | | | | | |
|
|
|
Total Investments Purchased With Collateral From Securities Lending (Cost $225,434,942) | | | | | | | 225,434,942 | |
| | | | | | |
|
|
|
The accompanying notes are an integral part of these financial statements.
67
PMC DIVERSIFIED EQUITY FUND | Schedule of Investments |
February 28, 2022 (Unaudited) (Continued)
| | | | | | | | |
| | |
| | | Shares
| | | Value
| |
| Short-Term Investments—0.82% | | | | | | | | |
First American Government Obligations Fund, Class X, 0.026%(f) | | | 8,749,274 | | | $ | 8,749,274 | |
| | | | | | |
|
|
|
Total Short-Term Investments (Cost $8,749,274) | | | | | | | 8,749,274 | |
| | | | | | |
|
|
|
| Total Investments (Cost $1,096,709,022)—120.88% | | | | | | | 1,294,571,679 | |
Liabilities in Excess of Other Assets—(20.88)% | | | | | | | (223,620,715 | ) |
| | | | | | |
|
|
|
| Total Net Assets—100.00% | | | | | | $ | 1,070,950,964 | |
| | | | | | |
|
|
|
Percentages are stated as a percent of net assets.
| (a) | | Non-income producing security. |
| (b) | | Foreign issued security. |
| (c) | | All or portion of this security is out on loan as of February 28, 2022. Total value of securities out on loan is $217,568,994. |
| (d) | | Perpetual preferred stock with no stated maturity. |
| (e) | | Represents an illiquid security. The total market value of these securities were $173,751, representing 0.02% of net assets. |
| (f) | | The rate shown represents the seven day yield at February 28, 2022. |
| | |
| | | Abbreviations |
| AB | | Aktiebolag is a Swedish term for a stock company. |
| ADR | | American Depositary Receipt |
| AG | | Aktiengesellschaft is a German term that refers to a corporation that is limited by shares, i.e. owned by shareholders. |
| A/S | | An abbreviation used by many countries to signify a stock company whereby shareholders have limited liability. |
| ASA | | Allmennaksjeselskap is a Norwegian term for a stock company. |
| KGaA | | Kommanditgesellschaft auf Aktien is a German term that refers to a Limited Partnership that has shares. |
| NV | | Naamloze Vennootschap is a Dutch term for publicly traded companies. |
| OYJ | | Julkinen osakeyhtio is a Finnish term for publicly-traded companies. |
| PJSC | | An abbreviation used by many countries to signify an open joint-stock company. |
| PLC | | Public Limited Company is a publicly traded company which signifies that shareholders have limited liability. |
| SA | | An abbreviation used by many countries to signify a publicly traded company. |
| SAB de CV | | Sociedad Anonima de Capital Variable is a Spanish term for an SA with variable capital. |
| SE | | Societas Europea is a term for a European Public Limited Liability Company. |
| SpA | | Soicieta per Azioni is an Italian term for limited share company. |
The accompanying notes are an integral part of these financial statements.
68
PMC Funds
February 28, 2022 (Unaudited)
| | | | | | | | |
| Statements of Assets and Liabilities | |
| | |
| | | Core Fixed
Income Fund
| | | Diversified
Equity Fund
| |
| Assets | | | | | | | | |
Investments, at value(1)(2) | | $ | 569,872,826 | | | $ | 1,294,571,679 | |
Receivables: | | | | | | | | |
Investments sold | | | 2,016,482 | | | | — | |
Dividends and interest | | | 3,591,535 | | | | 1,918,507 | |
Fund shares sold | | | 687,171 | | | | 2,015,639 | |
Securities lending | | | 4,085 | | | | 118,161 | |
Other Assets | | | 24,212 | | | | 23,744 | |
| | |
|
|
| |
|
|
|
Total Assets | | | 576,196,311 | | | | 1,298,647,730 | |
| | |
|
|
| |
|
|
|
| Liabilities | | | | | | | | |
Payables: | | | | | | | | |
Investments purchased | | | 41,427,984 | | | | — | |
Fund shares redeemed | | | 782,709 | | | | 1,510,082 | |
Collateral on securities loaned | | | 62,887,790 | | | | 225,434,942 | |
Affiliates | | | 134,739 | | | | 223,386 | |
Adviser | | | 137,310 | | | | 443,187 | |
Distributor | | | 11,185 | | | | 27,067 | |
Accrued expenses and other liabilities | | | 50,831 | | | | 58,102 | |
| | |
|
|
| |
|
|
|
Total Liabilities | | | 105,432,548 | | | | 227,696,766 | |
| | |
|
|
| |
|
|
|
| Net Assets | | $ | 470,763,763 | | | $ | 1,070,950,964 | |
| | |
|
|
| |
|
|
|
| Net assets consist of: | | | | | | | | |
Paid-in capital | | $ | 484,859,154 | | | $ | 851,931,548 | |
Total distributable earnings | | | (14,095,391 | ) | | | 219,019,416 | |
| | |
|
|
| |
|
|
|
| Net assets | | $ | 470,763,763 | | | $ | 1,070,950,964 | |
| | |
|
|
| |
|
|
|
| Advisor Class Shares | | | | | | | | |
Net assets | | | 58,027,347 | | | | 137,950,386 | |
Shares of beneficial interest outstanding (unlimited shares of $0.001 par value authorized) | | | 3,519,937 | | | | 4,733,050 | |
Net asset value and redemption price per share | | $ | 16.49 | | | $ | 29.15 | |
| | |
|
|
| |
|
|
|
| Institutional Class Shares | | | | | | | | |
Net assets | | | 412,736,416 | | | | 933,000,578 | |
Shares of beneficial interest outstanding (unlimited shares of $0.001 par value authorized) | | | 25,173,570 | | | | 32,155,964 | |
Net asset value and redemption price per share | | $ | 16.40 | | | $ | 29.01 | |
| | |
|
|
| |
|
|
|
(1) Cost of investments | | $ | 583,935,651 | | | $ | 1,096,709,022 | |
(2) Includes loaned securities with a value of | | $ | 62,124,037 | | | $ | 217,568,994 | |
The accompanying notes are an integral part of these financial statements.
69
PMC Funds
For the Six Months Ended February 28, 2022 (Unaudited)
| | | | | | | | |
| Statements of Operations | |
| | |
| | | Core Fixed
Income Fund
| | | Diversified
Equity Fund
| |
| Investment Income: | | | | | | | | |
Interest | | $ | 4,941,289 | | | $ | 1,570 | |
Dividends | | | 4,851 | | | | 9,490,237 | (1) |
Securities lending | | | 22,888 | | | | 747,535 | |
| | |
|
|
| |
|
|
|
| | | | 4,969,028 | | | | 10,239,342 | |
| | |
|
|
| |
|
|
|
| Expenses: | | | | | | | | |
Investment management fees | | | 1,551,140 | | | | 2,916,011 | |
Transfer agent fees and expenses | | | 167,555 | | | | 231,131 | |
Fund accounting fees | | | 112,400 | | | | 137,355 | |
Fund administration fees | | | 104,681 | | | | 233,957 | |
Distribution fees—Advisor Class | | | 75,632 | | | | 184,725 | |
Custody fees | | | 38,613 | | | | 56,864 | |
Federal and state registration fees | | | 28,153 | | | | 32,942 | |
Audit and tax fees | | | 20,551 | | | | 19,730 | |
Reports to shareholders | | | 17,736 | | | | 22,642 | |
Legal fees | | | 9,347 | | | | 10,662 | |
Chief Compliance Officer fees | | | 8,688 | | | | 6,154 | |
Trustees’ fees | | | 4,132 | | | | 4,132 | |
Insurance fees | | | 2,781 | | | | 4,261 | |
Other expenses | | | 1,960 | | | | 6,239 | |
| | |
|
|
| |
|
|
|
Total expenses before waiver or recoupment | | | 2,143,369 | | | | 3,866,805 | |
Recoupment or (waivers) by Adviser (Note 4) | | | (635,915 | ) | | | — | |
| | |
|
|
| |
|
|
|
Net expenses | | | 1,507,454 | | | | 3,866,805 | |
| | |
|
|
| |
|
|
|
| Net Investment Income | | | 3,461,574 | | | | 6,372,537 | |
| | |
|
|
| |
|
|
|
| Realized and Unrealized Gain (Loss): | | | | | | | | |
Net realized gain (loss) on: | | | | | | | | |
Investments | | | (6,582,319 | ) | | | (44,776,175 | ) |
Foreign currency translations | | | — | | | | 14 | |
| | |
|
|
| |
|
|
|
| | | | (6,582,319 | ) | | | (44,776,161 | ) |
| | |
|
|
| |
|
|
|
Net change in unrealized appreciation (depreciation) on: | | | | | | | | |
Investments | | | (24,929,844 | ) | | | (85,328,840 | ) |
Foreign currency translations | | | — | | | | 15 | |
| | |
|
|
| |
|
|
|
| | | | (24,929,844 | ) | | | (85,328,825 | ) |
| | |
|
|
| |
|
|
|
Net loss on investments and foreign currency | | | (31,512,163 | ) | | | (130,104,986 | ) |
| | |
|
|
| |
|
|
|
Net Decrease in Net Assets Resulting from Operations | | $ | (28,050,589 | ) | | $ | (123,732,449 | ) |
| | |
|
|
| |
|
|
|
| (1) | | Net of $794,617 in foreign withholding tax and ADR issuance fees. |
The accompanying notes are an integral part of these financial statements.
70
PMC Funds
| | | | | | | | |
| Statements of Changes in Net Assets | |
| |
| | | Core Fixed Income Fund
| |
| | |
| | | Six Months
Ended
February 28,
2022
(Unaudited)
| | | Year Ended
August 31,
2021
| |
| Operations: | | | | | | | | |
Net investment income | | $ | 3,461,574 | | | $ | 7,110,881 | |
Net realized gain (loss) on investments, futures and foreign currency | | | (6,582,319 | ) | | | 7,477,962 | |
Net change in unrealized depreciation | | | (24,929,844 | ) | | | (7,198,752 | ) |
| | |
|
|
| |
|
|
|
Net increase (decrease) in net assets resulting from operations | | | (28,050,589 | ) | | | 7,390,091 | |
| | |
| Dividends and distributions to shareholders: | | | | | | | | |
Net dividends and distributions—Advisor Class | | | (828,669 | ) | | | (4,064,480 | ) |
Net dividends and distributions—Institutional Class | | | (6,942,508 | ) | | | (20,452,703 | ) |
| | |
|
|
| |
|
|
|
Net decrease in net assets resulting from distributions paid | | | (7,771,177 | ) | | | (24,517,183 | ) |
| | |
|
|
| |
|
|
|
| Fund share transactions: | | | | | | | | |
Shares sold—Advisor Class | | | 3,272,223 | | | | 4,134,908 | |
Shares issued to holders in reinvestment of dividends—Advisor Class | | | 1,491,948 | | | | 3,818,627 | |
Shares redeemed—Advisor Class | | | (6,009,322 | ) | | | (62,391,307 | ) |
Shares sold—Institutional Class | | | 42,188,200 | | | | 179,959,869 | |
Shares issued to holders in reinvestment of dividends—Institutional Class | | | 12,049,084 | | | | 20,024,965 | |
Shares redeemed—Institutional Class | | | (27,633,055 | ) | | | (53,069,953 | ) |
| | |
|
|
| |
|
|
|
Net increase in net assets from share transactions | | | 25,359,078 | | | | 92,477,109 | |
| | |
|
|
| |
|
|
|
Net increase (decrease) in net assets | | | (10,462,688 | ) | | | 75,350,017 | |
| | |
| Net Assets: | | | | | | | | |
Beginning of period | | | 481,226,451 | | | | 405,876,434 | |
| | |
|
|
| |
|
|
|
End of period | | $ | 470,763,763 | | | $ | 481,226,451 | |
| | |
|
|
| |
|
|
|
| Change in shares outstanding: | | | | | | | | |
Shares sold—Advisor Class | | | 190,261 | | | | 234,017 | |
Shares issued to holders in reinvestment of dividends—Advisor Class | | | 87,096 | | | | 215,498 | |
Shares redeemed—Advisor Class | | | (347,659 | ) | | | (3,414,719 | ) |
Shares sold—Institutional Class | | | 2,454,732 | | | | 10,068,312 | |
Shares issued to holders in reinvestment of dividends—Institutional Class | | | 707,521 | | | | 1,136,491 | |
Shares redeemed—Institutional Class | | | (1,622,205 | ) | | | (2,983,602 | ) |
| | |
|
|
| |
|
|
|
Net increase | | | 1,469,746 | | | | 5,255,997 | |
| | |
|
|
| |
|
|
|
The accompanying notes are an integral part of these financial statements.
71
PMC Funds
| | | | | | | | |
| Statements of Changes in Net Assets | |
| |
| | | Diversified Equity Fund
| |
| | |
| | | Six Months
Ended
February 28,
2022
(Unaudited)
| | | Year Ended
August 31,
2021
| |
| Operations: | | | | | | | | |
Net investment income | | $ | 6,372,537 | | | $ | 13,959,216 | |
Net realized gain (loss) on investments and foreign currency | | | (44,776,161 | ) | | | 119,595,822 | |
Net change in unrealized appreciation (depreciation) | | | (85,328,825 | ) | | | 140,721,927 | |
| | |
|
|
| |
|
|
|
Net increase (decrease) in net assets resulting from operations | | | (123,732,449 | ) | | | 274,276,965 | |
| | |
| Dividends and distributions to shareholders: | | | | | | | | |
Net dividends and distributions—Advisor Class | | | (2,377,006 | ) | | | (1,540,826 | ) |
Net dividends and distributions—Institutional Class | | | (19,035,860 | ) | | | (10,631,418 | ) |
| | |
|
|
| |
|
|
|
Net decrease in net assets resulting from distributions paid | | | (21,412,866 | ) | | | (12,172,244 | ) |
| | |
|
|
| |
|
|
|
| Fund share transactions: | | | | | | | | |
Shares sold—Advisor Class | | | 4,555,859 | | | | 4,681,522 | |
Shares issued to holders in reinvestment of dividends—Advisor Class | | | 11,072,585 | | | | 1,380,271 | |
Shares redeemed—Advisor Class | | | (13,538,707 | ) | | | (125,342,856 | ) |
Shares sold—Institutional Class | | | 86,303,634 | | | | 231,207,438 | |
Shares issued to holders in reinvestment of dividends—Institutional Class | | | 81,786,080 | | | | 10,355,065 | |
Shares redeemed—Institutional Class | | | (56,846,815 | ) | | | (180,695,062 | ) |
| | |
|
|
| |
|
|
|
Net increase (decrease) in net assets from share transactions | | | 113,332,636 | | | | (58,413,622 | ) |
| | |
|
|
| |
|
|
|
Net increase (decrease) in net assets | | | (31,812,679 | ) | | | 203,691,099 | |
| | |
| Net Assets: | | | | | | | | |
Beginning of period | | | 1,102,763,643 | | | | 899,072,544 | |
| | |
|
|
| |
|
|
|
End of period | | $ | 1,070,950,964 | | | $ | 1,102,763,643 | |
| | |
|
|
| |
|
|
|
| Change in shares outstanding: | | | | | | | | |
Shares sold—Advisor Class | | | 141,459 | | | | 150,813 | |
Shares issued to holders in reinvestment of dividends—Advisor Class | | | 363,274 | | | | 48,842 | |
Shares redeemed—Advisor Class | | | (420,155 | ) | | | (4,727,688 | ) |
Shares sold—Institutional Class | | | 2,708,496 | | | | 8,270,058 | |
Shares issued to holders in reinvestment of dividends—Institutional Class | | | 2,696,541 | | | | 367,722 | |
Shares redeemed—Institutional Class | | | (1,788,574 | ) | | | (6,047,878 | ) |
| | |
|
|
| |
|
|
|
Net increase (decrease) | | | 3,701,041 | | | | (1,938,131 | ) |
| | |
|
|
| |
|
|
|
The accompanying notes are an integral part of these financial statements.
72
PMC Core Fixed Income Fund—Advisor Class
| | | | | | | | | | | | | | | | | | | | | | | | |
| Financial Highlights | | | | | | | | | | | | | | | | | | |
|
| Per Share Data for a Share Outstanding Throughout Each Year/Period | |
| | | | | | |
| | | Six Months
Ended
February 28,
2022
(Unaudited)
| | | Year
Ended
August 31,
2021
| | | Year
Ended
August 31,
2020
| | | Year
Ended
August 31,
2019
| | | Year
Ended
August 31,
2018
| | | Year
Ended
August 31,
2017
| |
Net asset value, beginning of year/period | | $ | 17.74 | | | $ | 18.50 | | | $ | 17.65 | | | $ | 16.53 | | | $ | 17.05 | | | $ | 17.32 | |
| | |
|
|
| |
|
|
| |
|
|
| |
|
|
| |
|
|
| |
|
|
|
| Income from investment operations: | | | | | | | | | | | | | | | | | | | | | | | | |
Net investment income(1) | | | 0.11 | | | | 0.27 | | | | 0.35 | | | | 0.42 | | | | 0.37 | | | | 0.27 | |
Net realized and unrealized gain (loss) | | | (0.90 | ) | | | 0.01 | | | | 0.92 | | | | 1.09 | | | | (0.61 | ) | | | (0.14 | ) |
| | |
|
|
| |
|
|
| |
|
|
| |
|
|
| |
|
|
| |
|
|
|
Total from investment operations | | | (0.79 | ) | | | 0.28 | | | | 1.27 | | | | 1.51 | | | | (0.24 | ) | | | 0.13 | |
| | |
|
|
| |
|
|
| |
|
|
| |
|
|
| |
|
|
| |
|
|
|
| Less distributions paid: | | | | | | | | | | | | | | | | | | | | | | | | |
Dividends from net investment income | | | (0.24 | ) | | | (0.33 | ) | | | (0.40 | ) | | | (0.39 | ) | | | (0.28 | ) | | | (0.30 | ) |
Distributions from net realized gains | | | (0.22 | ) | | | (0.71 | ) | | | (0.02 | ) | | | — | | | | 0.00 | (4) | | | (0.10 | ) |
| | |
|
|
| |
|
|
| |
|
|
| |
|
|
| |
|
|
| |
|
|
|
Total distributions paid | | | (0.46 | ) | | | (1.04 | ) | | | (0.42 | ) | | | (0.39 | ) | | | (0.28 | ) | | | (0.40 | ) |
| | |
|
|
| |
|
|
| |
|
|
| |
|
|
| |
|
|
| |
|
|
|
Net asset value, end of year/period | | $ | 16.49 | | | $ | 17.74 | | | $ | 18.50 | | | $ | 17.65 | | | $ | 16.53 | | | $ | 17.05 | |
| | |
|
|
| |
|
|
| |
|
|
| |
|
|
| |
|
|
| |
|
|
|
Total return(2) | | | -4.67 | % | | | 1.53 | % | | | 7.39 | % | | | 9.37 | % | | | -1.42 | % | | | 0.78 | % |
| | | | | | |
| Ratios / supplemental data | | | | | | | | | | | | | | | | | | | | | | | | |
Net assets, end of year/period (000’s) | | $ | 58,027 | | | $ | 63,678 | | | $ | 121,267 | | | $ | 399,389 | | | $ | 398,089 | | | $ | 332,426 | |
Ratio of expenses to average net assets before waiver and reimbursements(3) | | | 1.12 | % | | | 1.22 | % | | | 1.31 | % | | | 1.28 | % | | | 1.30 | % | | | 1.34 | % |
Ratio of expenses to average net assets after waiver and reimbursements(3) | | | 0.85 | % | | | 0.92 | %(6) | | | 1.00 | %(5) | | | 1.00 | %(5) | | | 1.00 | %(5) | | | 1.00 | %(5) |
Ratio of net investment income to average net assets before waiver and reimbursements(3) | | | 0.96 | % | | | 1.22 | % | | | 1.72 | % | | | 2.22 | % | | | 1.91 | % | | | 1.29 | % |
Ratio of net investment income to average net assets after waiver and reimbursements(3) | | | 1.23 | % | | | 1.52 | % | | | 2.03 | % | | | 2.50 | % | | | 2.21 | % | | | 1.63 | % |
Portfolio turnover rate(2) | | | 90.0 | % | | | 227.0 | % | | | 180.7 | % | | | 144.3 | % | | | 160.1 | % | | | 199.9 | % |
| (1) | | Per share net investment income was calculated using average shares outstanding. |
| (2) | | Not annualized for periods less than one year. |
| (3) | | Annualized for periods less than one year. |
| (4) | | Round to less than 0.5 cent per share. |
| (5) | | Reflects expense cap of 0.75% (plus Rule 12b-1 fees of 0.25%). |
| (6) | | Effective January 26, 2021, the expense limitation cap was reduced from 0.75% to 0.60% (plus Rule 12b-1 fees of 0.25%). |
The accompanying notes are an integral part of these financial statements.
73
PMC Core Fixed Income Fund—Institutional Class
| | | | | | | | | | | | | | | | |
| Financial Highlights | | | | | | | | | | | | |
|
| Per Share Data for a Share Outstanding Throughout Each Year/Period | |
| | | | |
| | | Six Months
Ended
February 28,
2022
(Unaudited)
| | | Year
Ended
August 31,
2021
| | | Year
Ended
August 31,
2020
| | | Period
Ended
August 31,
2019(1)
| |
Net asset value, beginning of year/period | | $ | 17.67 | | | $ | 18.47 | | | $ | 17.66 | | | $ | 17.23 | |
| | |
|
|
| |
|
|
| |
|
|
| |
|
|
|
| Income from investment operations: | | | | | | | | | | | | | | | | |
Net investment income(2) | | | 0.12 | | | | 0.30 | | | | 0.39 | | | | 0.07 | |
Net realized and unrealized gain | | | (0.89 | ) | | | 0.02 | | | | 0.92 | | | | 0.36 | |
| | |
|
|
| |
|
|
| |
|
|
| |
|
|
|
Total from investment operations | | | (0.77 | ) | | | 0.32 | | | | 1.31 | | | | 0.43 | |
| | |
|
|
| |
|
|
| |
|
|
| |
|
|
|
| Less distributions paid: | | | | | | | | | | | | | | | | |
Dividends from net investment income | | | (0.28 | ) | | | (0.41 | ) | | | (0.48 | ) | | | — | |
Distributions from net realized gains | | | (0.22 | ) | | | (0.71 | ) | | | (0.02 | ) | | | — | |
| | |
|
|
| |
|
|
| |
|
|
| |
|
|
|
Total distributions paid | | | (0.50 | ) | | | (1.12 | ) | | | (0.50 | ) | | | — | |
| | |
|
|
| |
|
|
| |
|
|
| |
|
|
|
Net asset value, end of year/period | | $ | 16.40 | | | $ | 17.67 | | | $ | 18.47 | | | $ | 17.66 | |
| | |
|
|
| |
|
|
| |
|
|
| |
|
|
|
Total return(3) | | | -4.55 | % | | | 1.77 | % | | | 7.65 | % | | | 2.50 | % |
| | | | |
| Ratios / supplemental data | | | | | | | | | | | | | | | | |
Net assets, end of year/period (000’s) | | $ | 412,736 | | | $ | 417,548 | | | $ | 284,610 | | | $ | 1 | |
Ratio of expenses to average net assets before waiver and reimbursements(4) | | | 0.87 | % | | | 0.96 | % | | | 1.06 | % | | | 0.75 | % |
Ratio of expenses to average net assets after waiver and reimbursements(4) | | | 0.60 | % | | | 0.66 | %(6) | | | 0.75 | % | | | 0.75 | % |
Ratio of net investment income to average net assets before waiver and reimbursements(4) | | | 1.21 | % | | | 1.42 | % | | | 1.87 | % | | | 2.33 | % |
Ratio of net investment income to average net assets after waiver and reimbursements(4) | | | 1.48 | % | | | 1.72 | % | | | 2.18 | % | | | 2.33 | % |
Portfolio turnover rate(3) | | | 90.0 | % | | | 227.0 | % | | | 180.7 | % | | | 144.3 | %(5) |
| (1) | | Institutional Class shares commenced operations on July 1, 2019. |
| (2) | | Per share net investment income was calculated using average shares outstanding. |
| (3) | | Not annualized for periods less than one year. |
| (4) | | Annualized for periods less than one year. |
| (5) | | Portfolio turnover rates are calculated at the Fund level (not by individual share class). |
| (6) | | Effective January 26, 2021, the expense limitation cap was reduced from 0.75% to 0.60%. |
The accompanying notes are an integral part of these financial statements.
74
PMC Diversified Equity Fund—Advisor Class
| | | | | | | | | | | | | | | | | | | | | | | | |
| Financial Highlights | |
|
| Per Share Data for a Share Outstanding Throughout Each Year/Period | |
| | | | | | |
| | | Six Months
Ended
February 28,
2022
(Unaudited)
| | | Year
Ended
August 31,
2021
| | | Year
Ended
August 31,
2020
| | | Year
Ended
August 31,
2019
| | | Year
Ended
August 31,
2018
| | | Year
Ended
August 31,
2017
| |
Net asset value, beginning of year/period | | $ | 33.27 | | | $ | 25.61 | | | $ | 23.77 | | | $ | 28.40 | | | $ | 26.68 | | | $ | 23.45 | |
| | |
|
|
| |
|
|
| |
|
|
| |
|
|
| |
|
|
| |
|
|
|
| Income (loss) from investment operations: | | | | | | | | | | | | | | | | | | | | | | | | |
Net investment income(1) | | | 0.15 | | | | 0.32 | | | | 0.29 | | | | 0.34 | | | | 0.19 | | | | 0.17 | |
Net realized and unrealized gain (loss) | | | (1.51 | ) | | | 7.61 | | | | 1.86 | | | | (2.21 | ) | | | 3.08 | | | | 3.22 | |
| | |
|
|
| |
|
|
| |
|
|
| |
|
|
| |
|
|
| |
|
|
|
Total from investment operations | | | (1.36 | ) | | | 7.93 | | | | 2.15 | | | | (1.87 | ) | | | 3.27 | | | | 3.39 | |
| | |
|
|
| |
|
|
| |
|
|
| |
|
|
| |
|
|
| |
|
|
|
| Less distributions paid: | | | | | | | | | | | | | | | | | | | | | | | | |
Dividends from net investment income | | | (0.53 | ) | | | (0.27 | ) | | | (0.31 | ) | | | (0.17 | ) | | | (0.17 | ) | | | (0.14 | ) |
Distributions from net realized gains | | | (2.23 | ) | | | — | | | | — | | | | (2.59 | ) | | | (1.38 | ) | | | (0.02 | ) |
| | |
|
|
| |
|
|
| |
|
|
| |
|
|
| |
|
|
| |
|
|
|
Total distributions paid | | | (2.76 | ) | | | (0.27 | ) | | | (0.31 | ) | | | (2.76 | ) | | | (1.55 | ) | | | (0.16 | ) |
| | |
|
|
| |
|
|
| |
|
|
| |
|
|
| |
|
|
| |
|
|
|
Net asset value, end of year/period | | $ | 29.15 | | | $ | 33.27 | | | $ | 25.61 | | | $ | 23.77 | | | $ | 28.40 | | | $ | 26.68 | |
| | |
|
|
| |
|
|
| |
|
|
| |
|
|
| |
|
|
| |
|
|
|
Total return(2) | | | -4.46 | % | | | 31.20 | % | | | 9.01 | % | | | -5.54 | % | | | 12.50 | % | | | 14.54 | % |
| | | | | | |
| Ratios / supplemental data | | | | | | | | | | | | | | | | | | | | | | | | |
Net assets, end of year/period (000’s) | | $ | 137,950 | | | $ | 154,671 | | | $ | 235,018 | | | $ | 818,269 | | | $ | 844,442 | | | $ | 650,190 | |
Ratio of expenses to average net assets before waiver, expense reimbursements or recoupment(3) | | | 0.92 | % | | | 0.93 | % | | | 0.95 | % | | | 0.94 | % | | | 1.26 | % | | | 1.41 | % |
Ratio of expenses to average net assets after waiver, expense reimbursements or recoupment(3) | | | 0.92 | % | | | 0.97 | %(4) | | | 0.98 | %(4) | | | 0.98 | %(4) | | | 1.25 | %(5) | | | 1.36 | %(6) |
Ratio of net investment income to average net assets before waiver, expense reimbursements or recoupment(3) | | | 0.95 | % | | | 1.14 | % | | | 1.21 | % | | | 1.42 | % | | | 0.67 | % | | | 0.64 | % |
Ratio of net investment income to average net assets after waiver, expense reimbursements or recoupment(3) | | | 0.95 | % | | | 1.10 | % | | | 1.18 | % | | | 1.38 | % | | | 0.68 | % | | | 0.69 | % |
Portfolio turnover rate(2) | | | 24.9 | % | | | 72.3 | % | | | 55.1 | % | | | 111.4 | % | | | 104.3 | % | | | 139.4 | % |
| (1) | | Per share net investment income was calculated using average shares outstanding. |
| (2) | | Not annualized for periods less than one year. |
| (3) | | Annualized for periods less than one year. |
| (4) | | Reflects expense cap of 0.73% (plus Rule 12b-1 fees of 0.25%). |
| (5) | | Effective June 1, 2018 the expense limitation cap was reduced from 1.35% to 0.98%. This reflects the expense limitation cap of 1.10% from September 1, 2017 through May 31, 2018 (plus Rule 12b-1 fees of 0.25%) and 0.73% from June 1, 2018 through August 31, 2018 (plus Rule 12b-1 fees of 0.25%). |
| (6) | | Effective November 1, 2016 the expense limitation cap was reduced from 1.40% to 1.35% (this includes Rule 12b-1 fees of 0.25%). |
The accompanying notes are an integral part of these financial statements.
75
PMC Diversified Equity Fund—Institutional Class
| | | | | | | | | | | | | | | | |
| Financial Highlights | |
|
| Per Share Data for a Share Outstanding Throughout Each Year/Period | |
| | | | |
| | | Six Months
Ended
February 28,
2022
(Unaudited)
| | | Year
Ended
August 31,
2021
| | | Year
Ended
August 31,
2020
| | | Period
Ended
August 31,
2019(1)
| |
Net asset value, beginning of year/period | | $ | 33.22 | | | $ | 25.59 | | | $ | 23.78 | | | $ | 24.69 | |
| | |
|
|
| |
|
|
| |
|
|
| |
|
|
|
| Income from investment operations: | | | | | | | | | | | | | | | | |
Net investment income(2) | | | 0.19 | | | | 0.42 | | | | 0.39 | | | | 0.06 | |
Net realized and unrealized gain (loss) | | | (1.51 | ) | | | 7.58 | | | | 1.84 | | | | (0.97 | ) |
| | |
|
|
| |
|
|
| |
|
|
| |
|
|
|
Total from investment operations | | | (1.32 | ) | | | 8.00 | | | | 2.23 | | | | (0.91 | ) |
| | |
|
|
| |
|
|
| |
|
|
| |
|
|
|
| Less distributions paid: | | | | | | | | | | | | | | | | |
Dividends from net investment income | | | (0.65 | ) | | | (0.37 | ) | | | (0.42 | ) | | | — | |
Distributions from net realized gains | | | (2.24 | ) | | | — | | | | — | | | | — | |
| | |
|
|
| |
|
|
| |
|
|
| |
|
|
|
Total distributions paid | | | (2.89 | ) | | | (0.37 | ) | | | (0.42 | ) | | | — | |
| | |
|
|
| |
|
|
| |
|
|
| |
|
|
|
Net asset value, end of year/period | | $ | 29.01 | | | $ | 33.22 | | | $ | 25.59 | | | $ | 23.78 | |
| | |
|
|
| |
|
|
| |
|
|
| |
|
|
|
Total return(3) | | | -4.38 | % | | | 31.56 | % | | | 9.36 | % | | | -3.69 | % |
| | | | |
| Ratios / supplemental data | | | | | | | | | | | | | | | | |
Net assets, end of year/period (000’s) | | $ | 933,001 | | | $ | 948,092 | | | $ | 664,055 | | | $ | 1 | |
Ratio of expenses to average net assets(4) | | | 0.67 | % | | | 0.68 | % | | | 0.71 | % | | | 0.73 | % |
Ratio of net investment income to average net assets(4) | | | 1.19 | % | | | 1.43 | % | | | 1.64 | % | | | 1.42 | % |
Portfolio turnover rate(3) | | | 24.9 | % | | | 72.3 | % | | | 55.1 | % | | | 111.4 | %(5) |
| (1) | | Institutional Class shares commenced operations on July 1, 2019. |
| (2) | | Per share net investment income was calculated using average shares outstanding. |
| (3) | | Not annualized for periods less than one year. |
| (4) | | Annualized for periods less than one year. |
| (5) | | Portfolio turnover rates are calculated at the Fund level (not by individual share class). |
The accompanying notes are an integral part of these financial statements.
76
PMC FUNDS
Notes to Financial Statements
February 28, 2022 (Unaudited)
Trust for Professional Managers (the “Trust”) was organized as a Delaware statutory trust under a Declaration of Trust dated May 29, 2001. The Trust is registered under the Investment Company Act of 1940, as amended (the “1940 Act”), as an open-end management investment company. Each of the PMC Funds (each, a “Fund” and together, the “Funds”) represents a distinct series with its own investment objective and policies within the Trust. The investment objective of the PMC Core Fixed Income Fund (the “Core Fixed Income Fund”) is to provide current income consistent with low volatility of principal. The investment objective of the PMC Diversified Equity Fund (the “Diversified Equity Fund”) is long-term capital appreciation. The Trust may issue an unlimited number of shares of beneficial interest at $0.001 par value. The Advisor Class of the Core Fixed Income Fund became effective and commenced operations on September 28, 2007. The Institutional Class of the Core Fixed Income Fund became effective and commenced operations on July 1, 2019. The Advisor Class of the Diversified Equity Fund became effective and commenced operations on August 26, 2009. The Institutional Class of the Diversified Equity Fund became effective and commenced operations on July 1, 2019. The Advisor Class shares are subject to a 0.25% Rule 12b-1 distribution fee. Each class of shares has identical rights and privileges except with respect to distribution fees and voting rights on matters affecting a single class of shares. Envestnet Asset Management, Inc. (the “Adviser”) serves as the Funds’ investment adviser. Neuberger Berman Investment Advisers LLC serves as the Core Fixed Income Fund’s sub-adviser.
The Funds are investment companies and accordingly follow the investment company accounting and reporting guidance of the Financial Accounting Standards Board (FASB) Accounting Standard Codification Topic 946 “Financial Services-Investment Companies”.
| (2) | | Significant Accounting Policies |
The following is a summary of significant accounting policies consistently followed by the Funds in the preparation of the financial statements. These policies are in conformity with accounting principles generally accepted in the United States of America (“GAAP”).
Each security owned by the Funds that is listed on a securities exchange, except for securities listed on the NASDAQ Stock Market, LLC (“NASDAQ”), is valued at its last sale price on that exchange on the date as of which assets are valued. If the security is listed on more than one exchange, the Funds will use the price of the exchange that the Funds generally consider to be the principal exchange on which the stock is traded.
Fund securities listed on the NASDAQ will be valued at the NASDAQ Official Closing Price, which may not necessarily represent the last sale price. If there has been no sale on such exchange or on NASDAQ on such day, the security is valued at the mean between the bid and asked prices on such day or at the latest sale price on the Composite Market (defined as the consolidation of the trade information provided by national securities and foreign exchanges and over-the-counter markets as published by an approved pricing service (“Pricing Service”)).
Debt securities, including short-term debt instruments having a maturity of 60 days or less, are valued at the mean in accordance with prices supplied by an approved Pricing Service. Pricing Services may use various valuation methodologies such as the mean between the bid and the asked prices, matrix pricing and other analytical pricing models as well as market transactions and dealer quotations. If a price is not available from a Pricing Service, the most recent quotation obtained from one or more broker-dealers know to follow the issue will be obtained. Quotations will be valued at the mean between the bid and the offer. Any discount or premium is accreted or amortized using the constant yield method over the life of the security, or where applicable, the first call date of the security.
Money market funds, demand notes and repurchase agreements are valued at cost. If cost does not represent current market value the securities will be priced at fair value.
Redeemable securities issued by open-end, registered investment companies are valued at the net asset values (“NAVs”) of such companies for purchase and/or redemption orders placed on that day. All exchange-traded funds are valued at the last reported sale price on the exchange on which the security is principally traded.
77
PMC FUNDS
Notes to Financial Statements, continued
February 28, 2022 (Unaudited)
Futures contracts are valued at the last settlement price at the close of trading on the relevant exchange or board of trade. Futures contracts for which reliable market quotations are not readily available shall each be valued at a price, supplied by a Pricing Service approved by the Trust’s Board of Trustees (the “Board”) which is in the opinion of such Pricing Service representative of the market value of such positions at the time of determination of the NAV, it being the opinion of the Board that the valuations supplied by such Pricing Service accurately reflect the fair value of such position.
Forward foreign currency contracts are valued at the mean between the bid and asked prices.
If market quotations are not readily available, any security or other financial instrument is valued at its fair value as determined under fair value pricing procedures approved by the Board. These fair value procedures will also be used to price a security when corporate events, events in the securities market and/or world events cause the Adviser to believe that a security’s last sale price may not reflect its actual market value. The intended effect of using fair value pricing procedures is to ensure that the Funds are accurately priced. The Board will regularly evaluate whether the Funds’ fair value pricing procedures continue to be appropriate in light of the specific circumstances of each Fund and the quality of prices obtained through application of such procedures by the Trust’s valuation committee.
FASB Accounting Standards Codification, “Fair Value Measurement” Topic 820 (“ASC 820”), establishes an authoritative definition of fair value and sets out a hierarchy for measuring fair value. ASC 820 requires an entity to evaluate certain factors to determine whether there has been a significant decrease in volume and level of activity for the security such that recent transactions and quoted prices may not be determinative of fair value and further analysis and adjustment may be necessary to estimate fair value. ASC 820 also requires enhanced disclosure regarding the inputs and valuation techniques used to measure fair value in those instances as well as expanded disclosure of valuation levels for major security types. These inputs are summarized in the three broad levels listed below:
| | • | | Level 1—Quoted prices in active markets for identical securities. |
| | • | | Level 2—Other significant observable inputs (including quoted prices for similar securities, interest rates, prepayment speeds, credit risk, etc.). |
| | • | | Level 3—Significant unobservable inputs (including the Funds’ own assumptions in determining the fair value of investments). |
The inputs or methodology used for valuing securities are not necessarily an indication of the risk associated with investing in those securities. The following is a summary of the inputs used to value the Funds’ investments carried at fair value as of February 28, 2022:
Core Fixed Income Fund
| | | | | | | | | | | | | | | | |
| | | Level 1
| | | Level 2
| | | Level 3
| | | Total
| |
| Fixed Income Securities | | | | | | | | | | | | | | | | |
Asset Backed Securities | | $ | — | | | $ | 43,320,284 | | | $ | — | | | $ | 43,320,284 | |
Corporate Bonds* | | | — | | | | 171,410,649 | | | | — | | | | 171,410,649 | |
Foreign Corporate Bonds* | | | — | | | | 33,075,873 | | | | — | | | | 33,075,873 | |
Foreign Government Agency Issues | | | — | | | | 4,090,340 | | | | — | | | | 4,090,340 | |
Foreign Government Notes/Bonds | | | — | | | | 21,114,126 | | | | — | | | | 21,114,126 | |
Non-Agency Mortgage Backed Securities | | | — | | | | 24,120,114 | | | | — | | | | 24,120,114 | |
Agency Mortgage Backed Securities | | | — | | | | 141,162,450 | | | | — | | | | 141,162,450 | |
U.S. Government Agency Issues | | | — | | | | 2,109,604 | | | | — | | | | 2,109,604 | |
U.S. Government Notes/Bonds | | | — | | | | 43,958,981 | | | | — | | | | 43,958,981 | |
U.S. Treasury Bills | | | — | | | | 12,469,529 | | | | — | | | | 12,469,529 | |
| | |
|
|
| |
|
|
| |
|
|
| |
|
|
|
| Total Fixed Income Securities | | | — | | | | 496,831,950 | | | | — | | | | 496,831,950 | |
78
PMC FUNDS
Notes to Financial Statements, continued
February 28, 2022 (Unaudited)
| | | | | | | | | | | | | | | | |
| | | Level 1
| | | Level 2
| | | Level 3
| | | Total
| |
| Exchange-Traded Funds | | $ | 568,133 | | | $ | — | | | $ | — | | | $ | 568,133 | |
| Money Market Funds | | | 72,472,743 | | | | — | | | | — | | | | 72,472,743 | |
| | |
|
|
| |
|
|
| |
|
|
| |
|
|
|
| Total Investments in Securities | | $ | 73,040,876 | | | $ | 496,831,950 | | | $ | — | | | $ | 569,872,826 | |
| | |
|
|
| |
|
|
| |
|
|
| |
|
|
|
| | * | | For further breakdown by industry, please refer to the Schedule of Investments. |
The Fund did not hold any Level 3 securities during the six months ended February 28, 2022.
Diversified Equity Fund
| | | | | | | | | | | | | | | | |
| | | Level 1
| | | Level 2
| | | Level 3
| | | Total
| |
| Equity | | | | | | | | | | | | | | | | |
Common Stocks* | | $ | 1,017,971,917 | | | $ | 7,269,060 | | | $ | — | | | $ | 1,025,240,977 | |
Preferred Stocks* | | | 2,335,585 | | | | — | | | | — | | | | 2,335,585 | |
Exchange-Traded Funds | | | 10,522,796 | | | | — | | | | — | | | | 10,522,796 | |
Real Estate Investment Trusts* | | | 22,288,105 | | | | — | | | | — | | | | 22,288,105 | |
Rights* | | | — | | | | 0 | | | | — | | | | 0 | |
| | |
|
|
| |
|
|
| |
|
|
| |
|
|
|
| Total Equity | | | 1,053,118,403 | | | | 7,269,060 | | | | — | | | | 1,060,387,463 | |
| Money Market Funds | | | 234,184,216 | | | | — | | | | — | | | | 234,184,216 | |
| | |
|
|
| |
|
|
| |
|
|
| |
|
|
|
| Total Investments in Securities | | $ | 1,287,302,619 | | | $ | 7,269,060 | | | $ | — | | | $ | 1,294,571,679 | |
| | |
|
|
| |
|
|
| |
|
|
| |
|
|
|
| | * | | For further breakdown by industry, please refer to the Schedule of Investments. |
The Fund did not hold any Level 3 securities during the six months ended February 28, 2022.
Foreign currencies and other assets denominated in foreign currencies are translated to U.S. dollars at the exchange rate of such currencies against the U.S. dollar using the applicable currency exchange rate as of the close of the New York Stock Exchange (“NYSE”), generally at 4:00 P.M., Eastern time.
The Funds may use certain options, futures and forward foreign currency contracts (collectively, “derivative instruments”) as a substitute for a comparable market position in the underlying security, to attempt to hedge or limit the exposure of a Fund’s position, to create a synthetic money market position, for certain tax-related purposes and to effect closing transactions.
Options and futures prices can diverge from the prices of their underlying instruments. Options and futures prices are affected by such factors as current and anticipated short-term interest rates, changes in volatility of the underlying instrument and the time remaining until expiration of the contract, which may not affect security prices the same way. Imperfect or no correlation also may result from differing levels of demand in the options and futures markets and the securities markets, from structural differences in how options and futures and securities are traded and from imposition of daily price fluctuation limits or trading halts.
The Funds did not hold derivative instruments during the six months ended February 28, 2022.
| | (b) | | Foreign Securities and Currency |
Investment securities and other assets and liabilities denominated in foreign currencies are translated into U.S. dollar amounts at the date of valuation. Purchases and sales of investment securities and income and expense items denominated in foreign currencies are translated into U.S. dollar amounts on the respective dates of such transactions.
The Funds isolate the portion of the results of operations from changes in foreign exchange rates on investments from those resulting from changes in market prices of securities held. Reported net realized
79
PMC FUNDS
Notes to Financial Statements, continued
February 28, 2022 (Unaudited)
foreign exchange gains or losses arise from sales of portfolio securities, sales and maturities of short-term securities, sales of foreign currencies, currency gains or losses realized between the trade and settlement dates on securities transactions, and the difference between the amounts of dividends, interest and foreign withholding taxes recorded on the Funds’ books, and the U.S. dollar equivalent of the amounts actually received or paid. Net unrealized foreign exchange gains and losses arise from changes in the values of assets and liabilities, including investments in securities at fiscal period end, resulting from changes in the exchange rate.
Investments in foreign securities entail certain risks. There may be a possibility of nationalization or expropriation of assets, confiscatory taxation, political or financial instability, and diplomatic developments that could affect the value of the Funds’ investments in certain foreign countries. Since foreign securities normally are denominated and traded in foreign currencies, the value of the Funds’ assets may be affected favorably or unfavorably by currency exchange rates, currency exchange control regulations, foreign withholding taxes, and restrictions or prohibitions on the repatriation of foreign currencies. There may be less information publicly available about a foreign issuer than about a U.S. issuer, and foreign issuers are not generally subject to accounting, auditing, and financial reporting standards and practices comparable to those in the United States. The securities of some foreign issuers are less liquid and at times more volatile than securities of comparable U.S. issuers.
The Funds may enter into futures contracts traded on domestic exchanges, including stock index futures contracts, as a substitute for a comparable market position in the underlying security, to attempt to hedge or limit the exposure of a Fund’s position, to create a synthetic money market position, for certain tax-related purposes and to effect closing transactions. Upon entering into a contract, the Funds deposit and maintain as collateral such initial margin as required by the exchange on which the transaction is effected. Pursuant to the contract, the Funds agree to receive from or pay to the broker an amount of cash equal to the daily fluctuation in value of the contract. Such receipts or payments are known as variation margin and are recorded by the Funds as unrealized gains and losses. When the contract is closed, the Funds record a realized gain or loss equal to the difference between the value of the contract at the time it was opened and the value at the time it was closed. A stock index futures contract does not involve the physical delivery of the underlying stocks in the index. As collateral for futures contracts, the Funds are required to maintain assets consisting of cash, cash equivalents or liquid securities. This collateral is required to be adjusted daily to reflect the market value of the purchase obligation for long futures contracts or the market value of the instrument underlying the contract, but not less than the market price at which the futures contract was established, for short futures contracts. The Funds did not enter into any futures contracts during the six months ended February 28, 2022.
The risks inherent in the use of futures contracts include 1) adverse changes in the value of such instruments and 2) the possible absence of a liquid secondary market for any particular instrument at any time. Futures contracts may also expose the Funds to counterparty credit risk. The Funds will not enter into these contracts unless they own either 1) an offsetting position in the securities or 2) the position provides cash and liquid assets with a value marked-to-market daily, sufficient to cover the counter-party’s potential obligations.
| | (d) | | Forward Foreign Currency Contracts |
The Core Fixed Income Fund might purchase a particular currency or enter into a forward foreign currency contract to preserve the U.S. dollar price of securities it intends to or has contracted to purchase. Alternatively, it might sell a particular currency on either a spot or forward basis to hedge against an anticipated decline in the dollar value of securities it intends to or has contracted to sell. Although this strategy could minimize the risk of loss due to a decline in the value of the hedged currency, it could also limit any potential gain from an increase in the value of the currency. When entering into a forward foreign
80
PMC FUNDS
Notes to Financial Statements, continued
February 28, 2022 (Unaudited)
currency contract, the Fund agrees to receive or deliver a fixed quantity of foreign currency for an agreed-upon price at a future date. The market value of the contract fluctuates with changes in currency exchange rates. The contract is marked-to-market daily and the change in market value is recorded by the Fund as an unrealized gain or loss. The Fund records a realized gain or loss equal to the difference between the value of the contract at the time it was opened and the value at the time it was closed. The risks inherent in the use of currency forward exchange contracts include adverse changes in the value of such instruments and exposure to counterparty credit risk. Forward contracts are subject to the risks that the counterparty to such contract will default on its obligations. Since a forward foreign currency exchange contract is not guaranteed by an exchange or clearing house, a default on the contract would deprive the Fund of unrealized profits, transaction costs or the benefits of a currency hedge or force the Fund to cover its purchase or sale commitments, if any, at the current market price. The Fund did not enter into any forward foreign currency contracts during the six months ended February 28, 2022.
The Core Fixed Income Fund may enter into written call options to hedge against changes in the value of equities. The writing of call options is intended to reduce the volatility of the portfolio and to earn premium income. Written call options expose the Fund to minimal counterparty credit risk since they are exchange traded and the exchange’s clearing house guarantees the options against default. The Fund may also purchase put options to provide protection against adverse price effects from anticipated changes in prices of securities. In addition, the Fund may enter into written put options to hedge against changes in the value of purchased put options.
The Fund may purchase and write call and put options on securities and indices and enter into related closing transactions.
When the Fund writes an option, an amount equal to the premium received by the Fund is recorded as a liability and is subsequently adjusted to the current fair value of the option written. Premiums received from writing options that expire unexercised are treated by the Fund on the expiration date as realized gains from options written. The difference between the premium and the amount paid on effecting a closing purchase transaction, including brokerage commissions, is also treated as a realized gain, or, if the premium is less than the amount paid for the closing purchase transaction, as a realized loss. If a call option is exercised, the premium is added to the proceeds from the sale of the underlying security or currency in determining whether the Fund has realized a gain or a loss. If a put option is exercised, the premium is deducted from the cost basis of the security purchased. The Fund, as writer of an option, bears the market risk of an unfavorable change in the price of the security underlying the written option.
When purchasing options, the Fund will recognize a realized loss equal to the premium paid to purchase the option, if the option expires unexercised. The difference between the proceeds received on effecting a closing sale transaction and the premium paid will be recognized as a realized gain or loss. If a put option is exercised, the premium paid is deducted from the proceeds on the sale of the underlying security in determining whether the Fund has a realized gain or loss.
When the Funds loan securities held in their portfolios, the Funds receive compensation in the form of fees, or retain a portion of the interest on the investment of any cash received as collateral. The loans are secured by collateral at least equal to: (i) 105% of the market value of the loaned securities that are foreign securities, or 102% of the market value of any other loaned securities, at the time the securities are loaned; and (ii) 100% of the market value of the loaned securities at all times. Gain or loss in the value of securities loaned that may occur during the term of the loan will be for the account of the Funds. The Funds have the right under the lending agreement to recover the securities from the borrower on demand.
81
PMC FUNDS
Notes to Financial Statements, continued
February 28, 2022 (Unaudited)
The Funds comply with the requirements of Subchapter M of the Internal Revenue Code of 1986, as amended (the “Code”), necessary to qualify as a regulated investment company and make the requisite distributions of income and capital gains to their shareholders sufficient to relieve them from all or substantially all federal income taxes. Therefore, no federal income tax provision has been provided.
| | (h) | | Distributions to Shareholders |
The Funds will distribute net investment income and net realized capital gains at least annually. Distributions from net realized gains for book purposes may include short-term capital gains. All short-term capital gains are included in ordinary income for tax purposes. Distributions to shareholders are recorded on the ex-dividend date. The Funds may also pay a special distribution at the end of the calendar year to comply with federal tax requirements.
The preparation of financial statements in conformity with GAAP requires management to make estimates and assumptions that affect the reported amounts of assets and liabilities and disclosure of contingent assets and liabilities at the date of the financial statements and the reported amounts of revenues and expenses during the reporting period. Actual results could differ from those estimates.
The NAV per share of a Fund is calculated by dividing the sum of the value of the securities held by the Fund, plus cash or other assets, minus all liabilities (including estimated accrued expenses) by the total number of shares outstanding for the Fund, rounded to the nearest cent. The Funds’ shares will not be priced on the days on which the NYSE is closed for trading. The Funds do not charge a redemption fee, therefore the offering and redemption price per share are equal to a Fund’s net asset value per share.
| | (k) | | Allocation of Income, Expenses and Gains/Losses |
Income, expenses (other than those deemed attributable to a specific share class), and gains and losses of each Fund are allocated daily to each class of shares based upon the ratio of net assets represented by each class as a percentage of the net assets of the Fund. Expenses deemed directly attributable to a class of shares are recorded by the specific class. Most expenses are allocated by class based on relative net assets. Distribution (Rule 12b-1) fees are expensed at 0.25% of average daily net assets of the Advisor Class shares of the Funds. Expenses associated with a specific fund in the Trust are charged to that fund. Common expenses are typically allocated evenly between the funds of the Trust or other equitable means.
Investment transactions are recorded on the trade date. The Funds determine the gain or loss from investment transactions on the identified cost basis by comparing the original cost of the security lot sold with the net sale proceeds. Dividend income is recognized on the ex-dividend date, and interest income is recognized on an accrual basis.
The London Interbank Offered Rate (“LIBOR”) is an interest-rate average calculated from estimates submitted by the leading banks in London. LIBOR represents the rate which banks may obtain short-term borrowings from each other. It is the primary interest rate benchmark for short-term interest rates around the world. The regulator of the LIBOR administrator phased out the use of LIBOR on December 30, 2021 such that the one-week and 2-month
82
PMC FUNDS
Notes to Financial Statements, continued
February 28, 2022 (Unaudited)
USD LIBOR settings ceased to be published or will no longer be representative. The remaining USD LIBOR settings will cease to be published or will no longer be representative after June 30, 2023. Because the usefulness of LIBOR as a reference rate could deteriorate during the transition from LIBOR to an alternative reference rate, these effects could occur prior to June 30, 2023. The expected discontinuation of LIBOR could have a significant impact on the financial markets, and may present a risk for certain market participants, including the risk that the transition from LIBOR to an alternative interest rate will not be orderly, will occur over various time periods or will have unintended consequences.
The tax character of distributions paid to shareholders were as follows:
| | | | | | | | |
Core Fixed Income Fund
| | Ordinary
Income
| | | Long-Term
Capital Gains
| |
Year Ended August 31, 2021 | | $ | 18,061,447 | | | $ | 6,455,736 | |
Year Ended August 31, 2020 | | | 10,530,638 | | | | — | |
| | | | | | | | |
Diversified Equity Fund
| | Ordinary
Income
| | | Long-Term
Capital Gains
| |
Year Ended August 31, 2021 | | $ | 12,172,244 | | | $ | — | |
Year Ended August 31, 2020 | | | 12,556,158 | | | | — | |
As of August 31, 2021, the components of accumulated earnings (losses) for income tax purposes were as follows:
| | | | | | | | |
| | | Core Fixed
Income
Fund
| | | Diversified
Equity Fund
| |
Cost basis of investments for federal income tax purposes | | $ | 576,402,694 | | | $ | 978,758,589 | |
| | |
|
|
| |
|
|
|
Gross tax unrealized appreciation | | $ | 13,165,408 | | | $ | 318,081,714 | |
Gross tax unrealized depreciation | | | (2,374,355 | ) | | | (36,918,824 | ) |
| | |
|
|
| |
|
|
|
Net tax unrealized appreciation | | $ | 10,791,053 | | | $ | 281,162,890 | |
| | |
|
|
| |
|
|
|
Undistributed ordinary income | | $ | 6,748,942 | | | $ | 14,551,542 | |
Undistributed long-term capital gain | | | 4,186,380 | | | | 69,775,731 | |
| | |
|
|
| |
|
|
|
Total distributable earnings | | $ | 10,935,322 | | | $ | 84,327,273 | |
Other accumulated loss | | | — | | | | (1,325,432 | ) |
| | |
|
|
| |
|
|
|
Total accumulated earnings | | $ | 21,726,375 | | | $ | 364,164,731 | |
| | |
|
|
| |
|
|
|
The difference between book-basis and tax-basis cost is attributable primarily to the tax deferral of losses on wash sale adjustments.
During the year ended August 31, 2021, short-term capital loss carryovers of $39,586,436 and long-term capital loss carryovers of $8,540,252 were utilized by the Diversified Equity Fund.
Additionally, GAAP requires that certain components of net assets relating to permanent differences be reclassified between financial and tax reporting. These reclassifications have no effect on net assets or net asset value per share. For the year ended August 31, 2021, the following table shows the reclassifications made:
| | | | | | | | |
| | | Core Fixed
Income
Fund
| | | Diversified
Equity
Fund
| |
Total distributable earnings | | $ | — | | | $ | (9,746 | ) |
Paid In Capital | | $ | — | | | $ | 9,746 | |
83
PMC FUNDS
Notes to Financial Statements, continued
February 28, 2022 (Unaudited)
The Funds had no material uncertain tax positions and have not recorded a liability for unrecognized tax benefits as of August 31, 2021. Also, the Funds recognized no interest and penalties related to uncertain tax benefits in fiscal year 2021. At August 31, 2021, the fiscal years 2018 through 2021 remain open to examination in the Funds’ major tax jurisdictions.
The Trust has entered into an Investment Advisory Agreement (the “Agreement”), on behalf of the Funds, with the Adviser to furnish investment advisory services to the Funds. Under terms of the Agreement, the Trust, on behalf of the Funds, the Adviser is entitled to receive from the Diversified Equity Fund a management fee equal to 0.530% of the Fund’s average daily net assets and is entitled to receive from the Core Fixed Income Fund a management fee equal to 0.65% of the Fund’s average daily net assets if the Fund’s net assets are less than $2,500,000,000; 0.625% if the Fund’s net assets are greater than $2,500,000,000 but less than $5,000,000,000; and 0.60% if the Fund’s assets are greater than $5,000,000,000.
The Adviser has contractually agreed to waive its management fees and/or reimburse other expenses of the Funds’ at least through December 29, 2022 to the extent necessary to ensure that the Funds’ total annual operating expenses (excluding front-end or contingent deferred sales loads, Rule 12b-1 plan fees, shareholder servicing plan fees, taxes, leverage, interest, brokerage commissions and other transactional expenses, expenses incurred in connections with any merger or reorganizations, dividends or interest on short positions, acquired fund fees and expenses, or extraordinary expenses such as litigation) do not exceed 0.60% for the Core Fixed Income Fund and 0.73% for the Diversified Equity Fund (the “Expense Limitation Cap”) of each Fund’s average daily net assets.
Any such waiver or reimbursement is subject to later adjustment to allow the Adviser to recoup amounts waived or reimbursed to the extent actual fees and expenses for a fiscal period do not exceed the lesser of: (1) the Expense Limitation Cap in place at the time of the waiver or reimbursement or (2) the Expense Limitation Cap in place at the time of recoupment; provided, however, that the Adviser shall only be entitled to recoup such amounts over the following three year period from the date of the waiver or reimbursement.
The following table shows the remaining waived or reimbursed expenses subject to potential recovery expiring by:
| | | | | | | | |
| | | Core Fixed
Income Fund
| | | Diversified
Equity Fund
| |
August 31, 2022 | | $ | 580,344 | | | $ | — | |
August 31, 2023 | | $ | 1,245,915 | | | $ | — | |
August 31, 2024 | | $ | 1,255,760 | | | $ | — | |
February 28, 2025 | | $ | 635,915 | | | $ | — | |
Sub-advisory services are provided to the Core Fixed Income Fund, pursuant to an agreement between the Adviser and Neuberger Berman Investment Advisers LLC (the “Sub-Adviser”). Under the terms of the sub-advisory agreement, the Adviser compensates the Sub-Adviser based on the Fund’s average daily net assets.
The Trust has adopted a Distribution Plan pursuant to Rule 12b-1 under the 1940 Act (the “12b-1 Plan”), on behalf of the Advisor Class shares of the Funds, which authorizes the Trust to pay Foreside Fund Services, LLC (the “Distributor”), the Funds’ principal distributor, a distribution fee of 0.25% of each Fund’s average
84
PMC FUNDS
Notes to Financial Statements, continued
February 28, 2022 (Unaudited)
daily net assets of Advisor Class shares. During the six months ended February 28, 2022, the Funds incurred fees pursuant to the 12b-1 Plan as follows:
| | | | |
Core Fixed Income Fund | | $ | 75,632 | |
Diversified Equity Fund | | $ | 184,725 | |
| (6) | | Related Party Transactions |
U.S. Bancorp Fund Services, LLC (doing business as U.S. Bank Global Fund Services (“Fund Services”)) acts as the Funds’ Administrator under an Administration Agreement. Fund Services prepares various federal and state regulatory filings, reports and returns for the Funds; prepares reports and materials to be supplied to the Trustees; monitors the activities of the Funds’ custodian, transfer agent and accountants; coordinates the preparation and payment of the Funds’ expenses and reviews the Funds’ expense accruals. Fees incurred for the six months ended February 28, 2022, and owed as of February 28, 2022, are as follows:
| | | | | | | | |
| | | Incurred
| | | Owed
| |
Core Fixed Income Fund | | $ | 104,681 | | | $ | 27,862 | |
Diversified Equity Fund | | $ | 233,957 | | | $ | 74,188 | |
Fund Services also serves as the fund accountant and transfer agent to the Funds. U.S. Bank, N.A. (“U.S. Bank”), an affiliate of Fund Services, serves as each Fund’s custodian. Fees incurred for the six months ended February 28, 2022, and owed as of February 28, 2022 are as follows:
| | | | | | | | |
Fund Accounting
| | Incurred
| | | Owed
| |
Core Fixed Income Fund | | $ | 112,400 | | | $ | 31,698 | |
Diversified Equity Fund | | $ | 137,355 | | | $ | 45,285 | |
| | | | | | | | |
Transfer Agency
| | Incurred
| | | Owed
| |
Core Fixed Income Fund | | $ | 167,555 | | | $ | 59,967 | |
Diversified Equity Fund | | $ | 231,131 | | | $ | 83,623 | |
| | | | | | | | |
Custody
| | Incurred
| | | Owed
| |
Core Fixed Income Fund | | $ | 38,613 | | | $ | 12,358 | |
Diversified Equity Fund | | $ | 56,864 | | | $ | 18,300 | |
The Funds each have an unsecured line of credit with U.S. Bank (see Note 8).
Certain officers of the Funds are also employees of Fund Services. A Trustee of the Trust is affiliated with Fund Services and U.S. Bank.
The Trust’s Chief Compliance Officer is also an employee of Fund Services. Each Fund’s allocation of the Trust’s Chief Compliance Officer fee incurred for the six months ended February 28, 2022, and owed as of February 28, 2022 is as follows:
| | | | | | | | |
| | | Incurred
| | | Owed
| |
Core Fixed Income Fund | | $ | 8,688 | | | $ | 2,854 | |
Diversified Equity Fund | | $ | 6,154 | | | $ | 1,990 | |
85
PMC FUNDS
Notes to Financial Statements, continued
February 28, 2022 (Unaudited)
| (7) | | Investment Transactions |
Purchases and sales of investment securities (excluding short-term instruments) for the six months ended February 28, 2022 are summarized below.
| | | | | | | | |
| | | Core Fixed
Income Fund
| | | Diversified
Equity Fund
| |
Purchases: | | | | | | | | |
U.S. Government | | $ | 171,131,684 | | | $ | — | |
Other | | | 282,564,178 | | | | 295,273,764 | |
| | |
|
|
| |
|
|
|
Total Purchases | | $ | 453,695,862 | | | $ | 295,273,764 | |
Sales | | | | | | | | |
U.S. Government | | $ | 176,283,143 | | | $ | — | |
Other | | | 272,473,509 | | | | 270,918,474 | |
| | |
|
|
| |
|
|
|
Total Sales | | $ | 448,756,652 | | | $ | 270,918,474 | |
At February 28, 2022, the Core Fixed Income Fund and Diversified Equity Fund had unsecured lines of credit in the lessor amount of $20,000,000 and $35,000,000, respectively, or 33.33% of the fair value of unencumbered assets of each Fund, as defined, which both mature August 6, 2022. These unsecured lines of credit are intended to provide short-term financing, if necessary, subject to certain restrictions, in connection with shareholder redemptions. The credit facility is with the Funds’ custodian, U.S. Bank. Interest was scheduled to be incurred at the bank’s prime rate of 3.25% from September 1, 2021 through February 28, 2022. During the six months ended February 28, 2022, the Funds did not utilize their respective lines of credit.
Pursuant to the terms of a securities lending agreement with U.S. Bank, each Fund may lend securities from its portfolio to brokers, dealers and financial institutions in order to increase the return on its portfolio, primarily through the receipt of borrowing fees and earnings on invested collateral. Any such loan must be continuously secured by collateral in cash or cash equivalents maintained on a current basis in an amount at least equal to the market value of the securities loaned by a Fund. During the time securities are on loan, the borrower will pay the applicable Fund any accrued income on those securities, and the Fund may invest the cash collateral and earn income or receive an agreed-upon fee from a borrower that has delivered cash-equivalent collateral. In determining whether or not to lend a security to a particular broker, dealer or financial institution, the Adviser considers all relevant facts and circumstances, including the size, creditworthiness and reputation of the broker, dealer or financial institution.
Securities lending involves the risk of a default or insolvency of the borrower. In either of these cases, a Fund could experience delays in recovering securities or collateral or could lose all or part of the value of the loaned securities. A Fund also could lose money in the event of a decline in the value of the collateral provided for loaned securities. Additionally, the loaned portfolio securities may not be available to a Fund on a timely basis and that Fund may therefore lose the opportunity to sell the securities at a desirable price. Any decline in the value of a security that occurs while the security is out on loan would continue to be borne by the applicable Fund.
As of February 28, 2022, the value of the securities on loan and value of collateral received for securities lending were as follows:
| | | | | | | | | | | | |
| | | Loaned Securities
Value
| | | Value of Cash Collateral
| | | % of Net Assets
| |
Core Fixed Income Fund | | $ | 62,124,037 | | | $ | 62,887,790 | | | | 13.20 | % |
Diversified Equity Fund | | $ | 217,568,994 | | | $ | 225,434,942 | | | | 20.32 | % |
86
PMC FUNDS
Notes to Financial Statements, continued
February 28, 2022 (Unaudited)
The Funds receive cash as collateral in return for securities lent as part of the securities lending program. The collateral is invested in the Mount Vernon Liquid Assets Portfolio, LLC. The Schedule of Investments for each Fund includes the particular cash collateral holding as of February 28, 2022. The remaining contractual maturity of all securities lending transactions is overnight and continuous.
The Funds are not subject to a master netting agreement with respect to securities lending; therefore, no additional disclosures regarding netting arrangements are required.
The fee and interest income earned by the Funds on investments of cash collateral received from borrowers for the securities loaned to them are reflected in the Funds’ Statements of Operations.
| (10) | | Recent Market Events |
U.S. and international markets have experienced significant periods of volatility in recent years and months due to a number of economic, political and global macro factors including the impact of COVID-19 as a global pandemic and related public health crisis, growth concerns in the U.S. and overseas, uncertainties regarding interest rates, rising inflation, trade tensions, and the threat of tariffs imposed by the U.S. and other countries. In particular, the global spread of COVID-19 has resulted in disruptions to business operations and supply chains, stress on the global healthcare system, growth concerns in the U.S. and overseas, staffing shortages and the inability to meet consumer demand, and widespread concern and uncertainty. The global recovery from COVID-19 is proceeding at slower than expected rates due to the emergence of variant strains and may last for an extended period of time. Health crises and related political, social and economic disruptions caused by the spread of COVID-19 may also exacerbate other pre-existing political, social and economic risks in certain countries. As a result of continuing political tensions and armed conflicts, including the war between Ukraine and Russia, the U.S. and the European Union imposed sanctions on certain Russian individuals and companies, including certain financial institutions, and have limited certain exports and imports to and from Russia. The war has contributed to recent market volatility and may continue to do so. These developments, as well as other events, could result in further market volatility and negatively affect financial asset prices, the liquidity of certain securities and the normal operations of securities exchanges and other markets, despite government efforts to address market disruptions. Continuing market volatility as a result of recent market conditions or other events may have adverse effects on your account.
The Funds have evaluated events and transactions that have occurred subsequent to February 28, 2022 and determined there were no subsequent events that would require recognition or disclosure in financial statements.
87
Notice of Privacy Policy & Practices
We collect non-public personal information about you from the following sources:
| | • | | information we receive about you on applications or other forms; |
| | • | | information you give us orally; and |
| | • | | information about your transactions with us or others. |
We do not disclose any non-public personal information about our shareholders or former shareholders without the shareholder’s authorization, except as permitted by law or in response to inquiries from governmental authorities. We may share information with affiliated parties and unaffiliated third parties with whom we have contracts for servicing the Funds. We will provide unaffiliated third parties with only the information necessary to carry out their assigned responsibility. All shareholder records will be disposed of in accordance with applicable law. We maintain physical, electronic and procedural safeguards to protect your non-public personal information and require third parties to treat your non-public personal information with the same high degree of confidentiality.
In the event that you hold shares of the Funds through a financial intermediary, including, but not limited to, a broker-dealer, bank or trust company, the privacy policy of your financial intermediary would govern how your non-public personal information would be shared with unaffiliated third parties.
88
PMC FUNDS
Additional Information
(Unaudited)
Tax Information
For the fiscal year ended August 31, 2021, certain dividends paid by the Funds may be subject to a maximum tax rate of 15%, as provided for by the Jobs and Growth Tax Relief Reconciliation Act of 2003. The percentage of dividends declared from ordinary income designated as qualified dividend income was as follows:
| | | | |
Core Fixed Income Fund | | | 0.00 | % |
Diversified Equity Fund | | | 100.00 | % |
For corporate shareholders, the percent of ordinary income distributions qualifying for the corporate dividends received deduction for the fiscal year ended August 31, 2021 was as follows:
| | | | |
Core Fixed Income Fund | | | 0.00 | % |
Diversified Equity Fund | | | 61.52 | % |
For the fiscal year ended August 31, 2021, taxable ordinary income distributions are designated as short-term capital gain distributions under Section 871(k)(2)(c) of the Code for the Funds as follows:
| | | | |
Core Fixed Income Fund | | | 51.76 | % |
Diversified Equity Fund | | | 0.00 | % |
Indemnification
Under the Trust’s organizational documents, its officers and Trustees are indemnified against certain liabilities arising out of the performance of their duties to the Funds. In addition, in the normal course of business, the Funds enter into contracts that provide general indemnifications to other parties. The Funds’ maximum exposure under these arrangements is unknown as this would involve future claims that may be made against the Funds that have not yet occurred. However, the Funds have not had prior claims or losses pursuant to these contracts and expect the risk of loss to be remote.
Information about Trustees
The business and affairs of the Trust are managed under the direction of the Trust’s Board of Trustees. Information pertaining to the Trustees of the Trust is set forth below. The Funds’ Statement of Additional Information includes additional information about the Trust’s Trustees and is available, without charge, upon request by calling (866) PMC-7338.
Results of Shareholder Meeting
A Special Joint Meeting of Shareholders (the “Meeting”) took place on April 6, 2022. The Meeting was held for all series in the Trust. All Trust shareholders of record, in the aggregate across all series of the Trust, were entitled to attend or submit proxies. As of the record date, February 7, 2022, the Trust had 534,673,511 shares outstanding. The results of the voting for the proposals were as follows:
Proposal 1: To approve the election of four Trustees to the Board of Trustees of the Trust to serve until his or her successor is elected and qualified.
| | | | | | | | | | | | |
| | | |
| | | For Votes
| | | Votes
Withheld
| | | Broker
Non-Vote
| |
Vincent P. Lyles | | | 465,453,094 | | | | 2,962,687 | | | | 15,025,189 | |
Erik K. Olstein | | | 465,703,874 | | | | 2,711,906 | | | | 15,025,189 | |
Lisa Zúñiga Ramĺrez | | | 465,728,682 | | | | 2,662,552 | | | | 15,025,189 | |
Gregory M. Wesley | | | 465,394,219 | | | | 2,984,741 | | | | 15,025,189 | |
89
PMC Funds
Additional Information (Continued)
(Unaudited)
Accordingly, effective April 6, 2022, the Board of Trustees of Trust for Professional Managers consists of the following individuals, each of whom have been elected by shareholders:
Michael D. Akers, Independent Trustee
Gary A. Drska, Independent Trustee
Vincent P. Lyles, Independent Trustee
Erik K. Olstein, Independent Trustee
Lisa Zúñiga Ramĺrez, Independent Trustee
Gregory M. Wesley, Independent Trustee
Joseph C. Neuberger, Interested Trustee
Proposal 2: To approve one or more adjournments of the Meeting to a later date to solicit additional proxies.
| | | | | | | | | | | | |
| | | |
| | | For Votes
| | | Votes
Against
| | | Votes
Abstained
| |
| | | | 476,848,750 | | | | 2,932,139 | | | | 3,647,484 | |
Independent Trustees
| | | | | | | | | | |
| | | | | | |
Name, Address and
Year of Birth
| | Position(s)
Held with
the Trust
| | Term of
Office and
Length of
Time Served
| | Number of
Portfolios
in the Trust
Overseen
by Trustee
| | Principal Occupation(s)
During the Past
Five Years
| | Other Directorships
Held by Trustee During
the Past Five Years
|
Michael D. Akers, Ph.D. 615 E. Michigan St. Milwaukee, WI 53202 Year of Birth: 1955 | | Trustee | | Indefinite Term; Since August 22, 2001 | | 24 | | Professor Emeritus, Department of Accounting (June 2019-present), Professor, Department of Accounting (2004-2019), Chair, Department of Accounting (2004-2017), Marquette University. | | Independent Trustee, USA MUTUALS (an open-end investment company (2001-2021). |
| | | | | |
Gary A. Drska 615 E. Michigan St. Milwaukee, WI 53202 Year of Birth: 1956 | | Trustee | | Indefinite Term; Since August 22, 2001 | | 24 | | Retired; Pilot, Frontier/Midwest Airlines, Inc. (airline company) (1986-2021). | | Independent Trustee, USA MUTUALS (an open-end investment company (2001-2021). |
|
Interested Trustee and Officers |
| | | | | |
Joseph C. Neuberger* 615 E. Michigan St. Milwaukee, WI 53202 Year of Birth: 1962 | | Chairperson and Trustee | | Indefinite Term; Since August 22, 2001 | | 24 | | President (2017-present), Chief Operating Officer (2016-2020), Executive Vice President (1994-2017), U.S. Bancorp Fund Services, LLC. | | Trustee, Buffalo Funds (an open-end investment company) (2003-2017); Trustee, USA MUTUALS (an open-end investment company) (2001-2018). |
| | | | | |
John P. Buckel 615 E. Michigan St. Milwaukee, WI 53202 Year of Birth: 1957 | | President and Principal Executive Officer | | Indefinite Term; Since January 24, 2013 | | N/A | | Vice President, U.S. Bancorp Fund Services, LLC (2004-present). | | N/A |
| | | | | |
Jennifer A. Lima 615 E. Michigan St. Milwaukee, WI 53202 Year of Birth: 1974 | | Vice President, Treasurer and Principal Financial and Accounting Officer | | Indefinite Term; Since January 24, 2013 | | N/A | | Vice President, U.S. Bancorp Fund Services, LLC (2002-present). | | N/A |
| * | | Mr. Neuberger is deemed to be an “interested person” of the Trust as defined by the 1940 Act due to his position and material business relationship with the Trust. |
90
PMC Funds
Additional Information (Continued)
(Unaudited)
| | | | | | | | | | |
| | | | | | |
Name, Address and
Year of Birth
| | Position(s)
Held with
the Trust
| | Term of
Office and
Length of
Time Served
| | Number of
Portfolios
in the Trust
Overseen
by Trustee
| | Principal Occupation(s)
During the Past
Five Years
| | Other Directorships
Held by Trustee During
the Past Five Years
|
Deanna B. Marotz 615 E. Michigan St. Milwaukee, WI 53202 Year of Birth: 1965 | | Chief Compliance Officer, Vice President and Anti-Money Laundering Officer | | Indefinite Term; Since October 21, 2021 | | N/A | | Senior Vice President, U.S. Bancorp Fund Services, LLC (2021-present); Chief Compliance Officer of Keeley-Teton Advisors, LLC and Teton Advisors, Inc. (2017-2021); Chief Compliance Officer of Keeley Asset Management Corp. (2015-2017). | | N/A |
| | | | | |
Jay S. Fitton 615 E. Michigan St. Milwaukee, WI 53202 Year of Birth: 1970 | | Secretary | | Indefinite Term; Since July 22, 2019 | | N/A | | Assistant Vice President, U.S. Bancorp Fund Services, LLC (2019-present); Partner, Practus, LLP (2018-2019); Counsel, Drinker Biddle & Reath LLP (2016-2018). | | N/A |
| | | | | |
Kelly A. Strauss 615 E. Michigan St. Milwaukee, WI 53202 Year of Birth: 1987 | | Assistant Treasurer | | Indefinite Term; Since April 23, 2015 | | N/A | | Assistant Vice President, U.S. Bancorp Fund Services, LLC (2011-present). | | N/A |
| | | | | |
Melissa Aguinaga 615 E. Michigan St. Milwaukee, WI 53202 Year of Birth: 1987 | | Assistant Treasurer | | Indefinite Term; Since July 1, 2015 | | N/A | | Assistant Vice President, U.S. Bancorp Fund Services, LLC (2010-present). | | N/A |
| | | | | |
Laura Carroll 615 E. Michigan St. Milwaukee, WI 53202 Year of Birth: 1985 | | Assistant Treasurer | | Indefinite Term; Since August 20, 2018 | | N/A | | Assistant Vice President, U.S. Bancorp Fund Services, LLC (2007-present). | | N/A |
91
A NOTE ON FORWARD LOOKING STATEMENTS
Except for historical information contained in this report for the Funds, the matters discussed in this report may constitute forward-looking statements made pursuant to the safe-harbor provisions of the Securities Litigation Reform Act of 1995. These include any Adviser, Sub-adviser or portfolio manager predictions, assessments, analyses or outlooks for individual securities, industries, market sectors and/or markets. These statements involve risks and uncertainties. In addition to the general risks described for the Funds in the current Prospectus, other factors bearing on this report include the accuracy of the Adviser’s, sub-adviser’s or portfolio manager’s forecasts and predictions, and the appropriateness of the investment programs designed by the Adviser, sub-adviser or portfolio manager to implement their strategies efficiently and effectively. Any one or more of these factors, as well as other risks affecting the securities markets and investment instruments generally, could cause the actual results of the Funds to differ materially as compared to benchmarks associated with the Funds.
ADDITIONAL INFORMATION
The Funds have adopted proxy voting policies and procedures that delegate to the Adviser the authority to vote proxies. A description of the Funds’ proxy voting policies and procedures is available without charge, upon request, by calling the Funds toll free at (866) PMC-7338. A description of these policies and procedures is also included in the Funds’ Statement of Additional Information, which is available on the SEC’s website at http://www.sec.gov.
The Funds’ proxy voting record for the most recent 12-month period ended June 30 is available without charge, either upon request by calling the Funds toll free at (866) PMC-7338 or by accessing the SEC’s website at http://www.sec.gov.
The Funds file their complete schedule of portfolio holdings with the SEC for the first and third quarters of each fiscal year on Part F of Form N-PORT. Shareholders may view the Funds’ filings on the SEC’s website at http://www.sec.gov.
HOUSEHOLDING
In an effort to decrease costs, the Funds intend to reduce the number of duplicate prospectuses and certain other shareholder documents you receive by sending only one copy of each to those addresses shared by two or more accounts and to shareholders we reasonably believe are from the same family or household. Once implemented, if you would like to discontinue householding for your accounts, please call toll-free at (866) PMC-7338 to request individual copies of these documents. Once the Funds receive notice to stop householding, we will begin sending individual copies 30 days after receiving your request. This policy does not apply to account statements.
PMC FUNDS
| | |
Investment Adviser | | Envestnet Asset Management, Inc. 35 E. Wacker Drive, Suite 2400 Chicago, IL 60601 |
| |
Legal Counsel | | Godfrey & Kahn, S.C. 833 East Michigan Street, Suite 1800 Milwaukee, Wisconsin 53202 |
| |
Independent Registered Public Accounting Firm | | Deloitte & Touche LLP 111 South Wacker Drive Chicago, Illinois 60606 |
| |
Transfer Agent, Fund Accountant and Fund Administrator | | U.S. Bancorp Fund Services, LLC 615 East Michigan Street Milwaukee, Wisconsin 53202 |
| |
Custodian | | U.S. Bank, N.A. Custody Operations 1555 North RiverCenter Drive Suite 302 Milwaukee, Wisconsin 53212 |
| |
Distributor | | Foreside Fund Services, LLC 3 Canal Plaza, Suite 100 Portland, Maine 04101 |
This report is intended for shareholders of the Funds and may not be used as sales literature unless preceded or accompanied by a current prospectus.
(b) Not applicable for this Registrant.
Item 2. Code of Ethics.
Not applicable for semi-annual reports.
Item 3. Audit Committee Financial Expert.
Not applicable for semi-annual reports.
Item 4. Principal Accountant Fees and Services.
Not applicable for semi-annual reports.
Item 5. Audit Committee of Listed Registrants.
Not applicable to registrants who are not listed issuers (as defined in Rule 10A-3 under the Securities Exchange Act of 1934).
Item 6. Investments.
| (a) | Schedule of Investments is included as part of the report to shareholders filed under Item 1 of this Form. |
Item 7. Disclosure of Proxy Voting Policies and Procedures for Closed-End Management Investment Companies.
Not applicable to open-end investment companies.
Item 8. Portfolio Managers of Closed-End Management Investment Companies.
Not applicable to open-end investment companies.
Item 9. Purchases of Equity Securities by Closed-End Management Investment Company and Affiliated Purchasers.
Not applicable to open-end investment companies.
Item 10. Submission of Matters to a Vote of Security Holders.
There have been no material changes to the procedures by which shareholders may recommend nominees to the registrant’s board of trustees.
Item 11. Controls and Procedures.
| (a) | The Registrant’s President and Treasurer have reviewed the Registrant’s disclosure controls and procedures (as defined in Rule 30a-3(c) under the Investment Company Act of 1940 (the “Act”)) as of a date within 90 days of the filing of this report, as required by Rule 30a-3(b) under the Act and Rules 13a-15(b) or 15d-15(b) under the Securities Exchange Act of 1934. Based on their review, such officers have concluded that the disclosure controls and procedures are effective in ensuring that information required to be disclosed in this report is appropriately recorded, processed, summarized and reported and made known to them by others within the Registrant and by the Registrant’s service provider. |
| (b) | There were no changes in the Registrant’s internal control over financial reporting (as defined in Rule 30a-3(d) under the Act) that occurred during the last fiscal half-year of the period covered by this report that has materially affected, or is reasonably likely to materially affect, the Registrant’s internal control over financial reporting. |
Item 12. Disclosure of Securities Lending Activities for Closed-End Management Investment Companies.
Not applicable to open-end investment companies.
Item 13. Exhibits.
(2) A separate certification for each principal executive and principal financial officer pursuant to Section 302 of the Sarbanes-Oxley Act of 2002. Filed herewith.
(3) Any written solicitation to purchase securities under Rule 23c-1 under the Act sent or given during the period covered by the report by or on behalf of the registrant to 10 or more persons. Not applicable to open-end investment companies.
(4) Change in the registrant’s independent public accountant. There was no change in the registrant’s independent public accountant for the period covered by this report.
2
SIGNATURES
Pursuant to the requirements of the Securities Exchange Act of 1934 and the Investment Company Act of 1940, the registrant has duly caused this report to be signed on its behalf by the undersigned, thereunto duly authorized.
| | | | |
| | | (Registrant) Trust for Professional Managers |
| | |
| | | By (Signature and Title) * | | /s/ John Buckel |
| | | | John Buckel, President |
| | |
| | Date 4/29/2022 | | |
Pursuant to the requirements of the Securities Exchange Act of 1934 and the Investment Company Act of 1940, this report has been signed below by the following persons on behalf of the registrant and in the capacities and on the dates indicated.
| | | | |
| | | By (Signature and Title)* | | /s/ John Buckel |
| | | | John Buckel, President |
| | |
| | Date 4/29/2022 | | |
| | | | |
| | | By (Signature and Title)* | | /s/ Jennifer Lima |
| | | | Jennifer Lima, Treasurer |
| | |
| | Date 4/29/2022 | | |
| * | Print the name and title of each signing officer under his or her signature. |
3