Exhibit 99.1 Completed Acquisition of Tribune Media Company Enhancing Nexstar’s Position as North America’s Leading Local Media Company S e p t e m b e r 2 0 , 2 0 1 9Exhibit 99.1 Completed Acquisition of Tribune Media Company Enhancing Nexstar’s Position as North America’s Leading Local Media Company S e p t e m b e r 2 0 , 2 0 1 9

Disclaimer Forward-Looking Statements This Presentation includes forward-looking statements. We have based these forward-looking statements on our current expectations and projections about future events. Forward-looking statements include information preceded by, followed by, or that includes the words guidance, believes, expects, anticipates, could, or similar expressions. For these statements, Nexstar claims the protection of the safe harbor for forward-looking statements contained in the Private Securities Litigation Reform Act of 1995. The forward-looking statements contained in this presentation, concerning, among other things, the benefits of the Tribune transaction, Nexstar’s future financial performance, including changes in net revenue, cash flow and operating expenses, involve risks and uncertainties, and are subject to change based on various important factors, including the impact of changes in national and regional economies, the ability to service and refinance our outstanding debt, Nexstar’s ability to successfully integrate acquired television stations and digital businesses, including Tribune Media (including its ability to realize acquisition synergies and cost reductions), pricing fluctuations in local and national advertising, future regulatory actions and conditions in Nexstar’s television stations' operating areas, competition from others in the broadcast television markets, volatility in programming costs, the effects of governmental regulation of broadcasting, industry consolidation, technological developments and major world news events. Nexstar undertakes no obligation to update or revise any forward-looking statements, whether as a result of new information, future events or otherwise. In light of these risks, uncertainties and assumptions, Nexstar’s actual results and financial condition may differ materially from that reflected by the forward-looking statements discussed in this presentation. You should not place undue reliance on these forward-looking statements, which speak only as of the date of this release. For more details on factors that could affect these expectations, please see Nexstar’s Annual Report for the year ended December 31, 2018, Tribune Media’s Annual Report for the year ended December 31, 2018 and each of Nexstar’s and Tribune Media’s subsequent public filings with the Securities and Exchange Commission. Pro Forma This presentation also includes certain unaudited pro forma financial information. Such unaudited pro forma financial information is presented for illustrative purposes only and does not purport to reflect the results we may achieve in future periods or the historical results that would have been obtained had the merger been completed on January 1, 2018, as of June 30, 2019 or any other date prior to the date of the closing of the merger, as the case maybe. 2Disclaimer Forward-Looking Statements This Presentation includes forward-looking statements. We have based these forward-looking statements on our current expectations and projections about future events. Forward-looking statements include information preceded by, followed by, or that includes the words guidance, believes, expects, anticipates, could, or similar expressions. For these statements, Nexstar claims the protection of the safe harbor for forward-looking statements contained in the Private Securities Litigation Reform Act of 1995. The forward-looking statements contained in this presentation, concerning, among other things, the benefits of the Tribune transaction, Nexstar’s future financial performance, including changes in net revenue, cash flow and operating expenses, involve risks and uncertainties, and are subject to change based on various important factors, including the impact of changes in national and regional economies, the ability to service and refinance our outstanding debt, Nexstar’s ability to successfully integrate acquired television stations and digital businesses, including Tribune Media (including its ability to realize acquisition synergies and cost reductions), pricing fluctuations in local and national advertising, future regulatory actions and conditions in Nexstar’s television stations' operating areas, competition from others in the broadcast television markets, volatility in programming costs, the effects of governmental regulation of broadcasting, industry consolidation, technological developments and major world news events. Nexstar undertakes no obligation to update or revise any forward-looking statements, whether as a result of new information, future events or otherwise. In light of these risks, uncertainties and assumptions, Nexstar’s actual results and financial condition may differ materially from that reflected by the forward-looking statements discussed in this presentation. You should not place undue reliance on these forward-looking statements, which speak only as of the date of this release. For more details on factors that could affect these expectations, please see Nexstar’s Annual Report for the year ended December 31, 2018, Tribune Media’s Annual Report for the year ended December 31, 2018 and each of Nexstar’s and Tribune Media’s subsequent public filings with the Securities and Exchange Commission. Pro Forma This presentation also includes certain unaudited pro forma financial information. Such unaudited pro forma financial information is presented for illustrative purposes only and does not purport to reflect the results we may achieve in future periods or the historical results that would have been obtained had the merger been completed on January 1, 2018, as of June 30, 2019 or any other date prior to the date of the closing of the merger, as the case maybe. 2
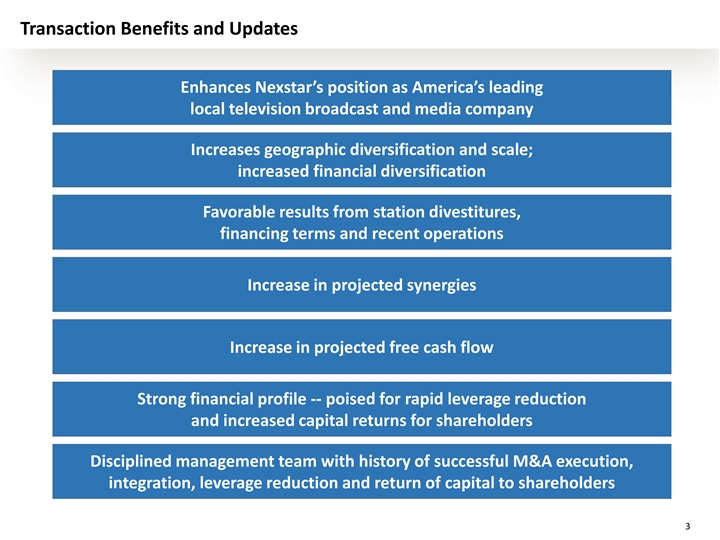
Transaction Benefits and Updates Enhances Nexstar’s position as America’s leading local television broadcast and media company Increases geographic diversification and scale; increased financial diversification Favorable results from station divestitures, financing terms and recent operations Increase in projected synergies Increase in projected free cash flow Strong financial profile -- poised for rapid leverage reduction and increased capital returns for shareholders Disciplined management team with history of successful M&A execution, integration, leverage reduction and return of capital to shareholders 3Transaction Benefits and Updates Enhances Nexstar’s position as America’s leading local television broadcast and media company Increases geographic diversification and scale; increased financial diversification Favorable results from station divestitures, financing terms and recent operations Increase in projected synergies Increase in projected free cash flow Strong financial profile -- poised for rapid leverage reduction and increased capital returns for shareholders Disciplined management team with history of successful M&A execution, integration, leverage reduction and return of capital to shareholders 3
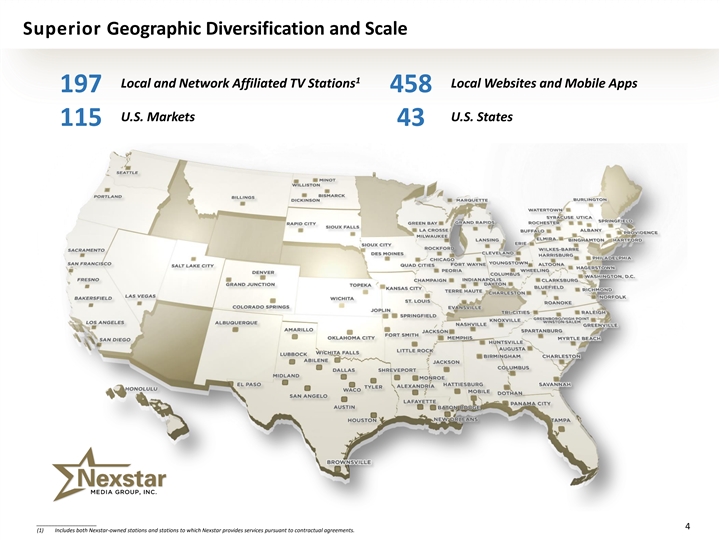
Superior Geographic Diversification and Scale 1 Local and Network Affiliated TV Stations Local Websites and Mobile Apps 197 458 U.S. Markets U.S. States 115 43 ____________________ 4 (1) Includes both Nexstar-owned stations and stations to which Nexstar provides services pursuant to contractual agreements.Superior Geographic Diversification and Scale 1 Local and Network Affiliated TV Stations Local Websites and Mobile Apps 197 458 U.S. Markets U.S. States 115 43 ____________________ 4 (1) Includes both Nexstar-owned stations and stations to which Nexstar provides services pursuant to contractual agreements.

Largest Local Broadcast Group by U.S. TV Household Reach #1 local broadcast TV station group and one of the largest producers and distributors of local news, lifestyle, sports and network programming % of U.S. Television Households Reached, Inclusive of UHF Discount 1 39% FCC Cap on National TV Ownership 39% 27% 25% 25% 24% 21% 20% 17% 13% 12% 7% 6% 4% ____________________ Source: Company filings and SNL Kagan. Pro forma for all transactions announced to date. (1) Includes both Nexstar-owned stations and stations to which Nexstar provides services pursuant to contractual agreements. 5Largest Local Broadcast Group by U.S. TV Household Reach #1 local broadcast TV station group and one of the largest producers and distributors of local news, lifestyle, sports and network programming % of U.S. Television Households Reached, Inclusive of UHF Discount 1 39% FCC Cap on National TV Ownership 39% 27% 25% 25% 24% 21% 20% 17% 13% 12% 7% 6% 4% ____________________ Source: Company filings and SNL Kagan. Pro forma for all transactions announced to date. (1) Includes both Nexstar-owned stations and stations to which Nexstar provides services pursuant to contractual agreements. 5

Top U.S. Broadcast Television Network Affiliate Partner 6Top U.S. Broadcast Television Network Affiliate Partner 6
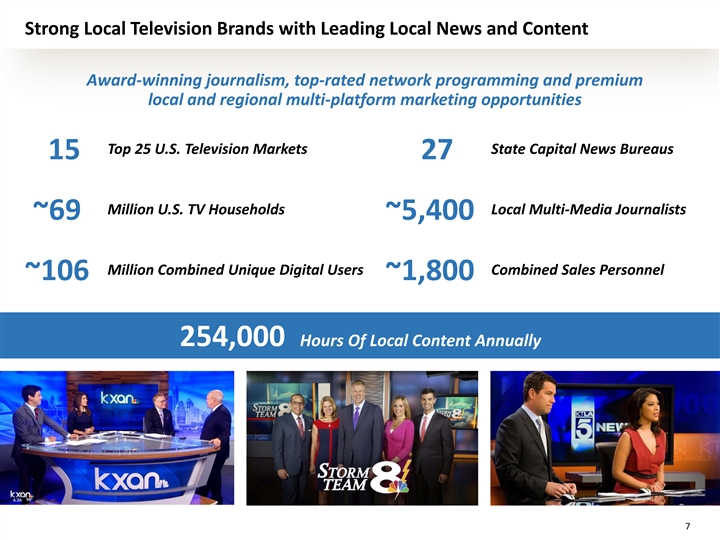
Strong Local Television Brands with Leading Local News and Content Award-winning journalism, top-rated network programming and premium local and regional multi-platform marketing opportunities Top 25 U.S. Television Markets State Capital News Bureaus 15 27 Million U.S. TV Households Local Multi-Media Journalists ~69 ~5,400 Million Combined Unique Digital Users Combined Sales Personnel ~106 ~1,800 254,000 Hours Of Local Content Annually 7Strong Local Television Brands with Leading Local News and Content Award-winning journalism, top-rated network programming and premium local and regional multi-platform marketing opportunities Top 25 U.S. Television Markets State Capital News Bureaus 15 27 Million U.S. TV Households Local Multi-Media Journalists ~69 ~5,400 Million Combined Unique Digital Users Combined Sales Personnel ~106 ~1,800 254,000 Hours Of Local Content Annually 7
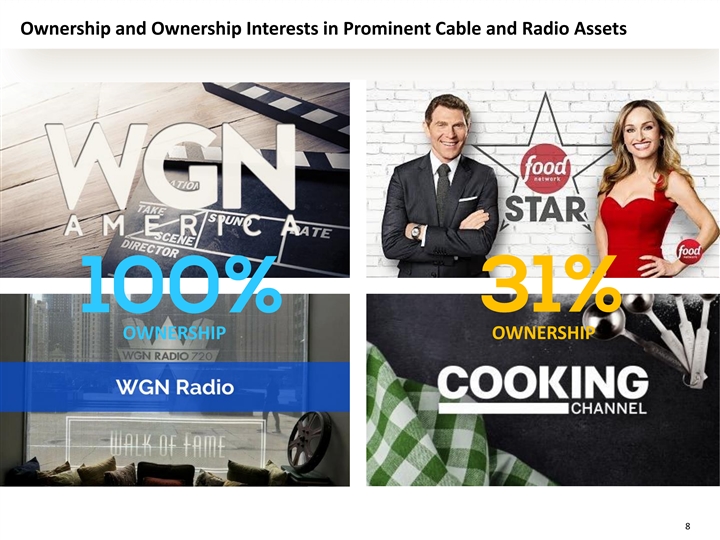
Ownership and Ownership Interests in Prominent Cable and Radio Assets OWNERSHIP OWNERSHIP 8Ownership and Ownership Interests in Prominent Cable and Radio Assets OWNERSHIP OWNERSHIP 8

Meaningful Realizable Synergies Total Expected Year 1 Synergy Realization of ~$185 million Prior Projection Current Projection Difference ($/%) Corporate +$10/+50% ~$20m ~$30m Overhead Expense ~$65m ~$70m +$5m/+8% Reduction Net Retransmission +$10m/+13% ~$75m ~$85m Revenue TOTAL ~$185m ~$160m +$25m/+16% 9Meaningful Realizable Synergies Total Expected Year 1 Synergy Realization of ~$185 million Prior Projection Current Projection Difference ($/%) Corporate +$10/+50% ~$20m ~$30m Overhead Expense ~$65m ~$70m +$5m/+8% Reduction Net Retransmission +$10m/+13% ~$75m ~$85m Revenue TOTAL ~$185m ~$160m +$25m/+16% 9

Strong Combined Company Financial Profile 2018/2019 Net Revenues ($ millions) $3,800 $4,200 (RSN Assets) Corporate $2,630 $2,190 Overhead $1,680 $3,050 (Legacy Sinclair) NXST PF SBGI TGNA GTN SSP (5) (2) (3) (4) (1) + 2018/2019 Adj. EBITDA ($ millions) $1,650 $1,680 (RSN Assets) $860 $760 $360 $840 (Legacy Sinclair) (5) (2) NXST PF TGNA (3) GTN (1)(6) (4) + ____________________ Source: Company filings and Wall Street research. Note: Numbers are rounded. 2018 figures are as reported unless otherwise noted. 2019 figures are based on Wall Street research and not pro forma for acquisitions unless otherwise noted. Adjusted EBITDA is Post-SBC. (1) Revenue includes $85mm of net retransmission synergies and EBITDA includes $185mm of total synergies. Pro forma for divestitures. (2) Pro forma for the acquisition of Fox RSNs. RSN metrics are CY 2018. RSN revenue based on Evercore equity research from May 6, 2019 and RSN EBITDA is based on Sinclair’s non-GAAP filing on May 6, 2019. (3) Pro forma for the acquisition of Dispatch and select Nexstar divested stations. (4) Pro forma for the acquisition of Raycom Media. (5) Pro forma for the acquisition of Cordillera and select Nexstar divested stations as well as Comcast retrans. Based on Stephens equity research from August 21, 2019. 10 (6) Includes the net impact broadcast rights payments greater than broadcast rights amortization of $34mm in 2018. Includes cash distributions from TV Food Network.Strong Combined Company Financial Profile 2018/2019 Net Revenues ($ millions) $3,800 $4,200 (RSN Assets) Corporate $2,630 $2,190 Overhead $1,680 $3,050 (Legacy Sinclair) NXST PF SBGI TGNA GTN SSP (5) (2) (3) (4) (1) + 2018/2019 Adj. EBITDA ($ millions) $1,650 $1,680 (RSN Assets) $860 $760 $360 $840 (Legacy Sinclair) (5) (2) NXST PF TGNA (3) GTN (1)(6) (4) + ____________________ Source: Company filings and Wall Street research. Note: Numbers are rounded. 2018 figures are as reported unless otherwise noted. 2019 figures are based on Wall Street research and not pro forma for acquisitions unless otherwise noted. Adjusted EBITDA is Post-SBC. (1) Revenue includes $85mm of net retransmission synergies and EBITDA includes $185mm of total synergies. Pro forma for divestitures. (2) Pro forma for the acquisition of Fox RSNs. RSN metrics are CY 2018. RSN revenue based on Evercore equity research from May 6, 2019 and RSN EBITDA is based on Sinclair’s non-GAAP filing on May 6, 2019. (3) Pro forma for the acquisition of Dispatch and select Nexstar divested stations. (4) Pro forma for the acquisition of Raycom Media. (5) Pro forma for the acquisition of Cordillera and select Nexstar divested stations as well as Comcast retrans. Based on Stephens equity research from August 21, 2019. 10 (6) Includes the net impact broadcast rights payments greater than broadcast rights amortization of $34mm in 2018. Includes cash distributions from TV Food Network.
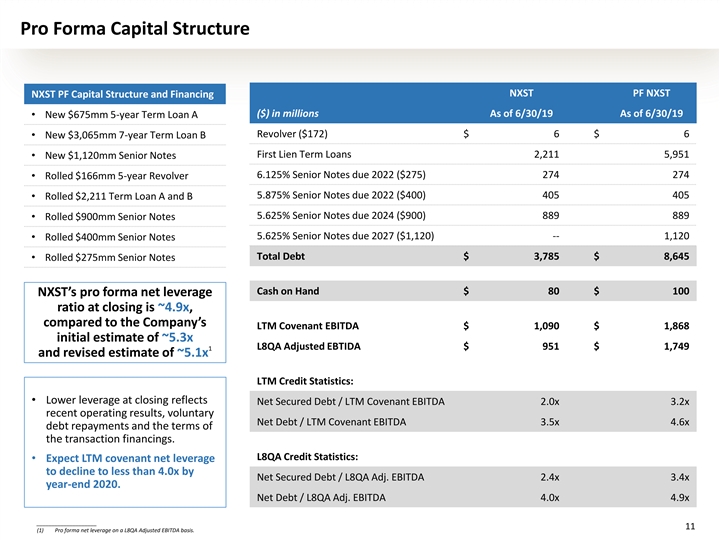
Pro Forma Capital Structure NXST PF NXST NXST PF Capital Structure and Financing ($) in millions As of 6/30/19 As of 6/30/19 • New $675mm 5-year Term Loan A Revolver ($172) $ 6 $ 6 • New $3,065mm 7-year Term Loan B First Lien Term Loans 2,211 5,951 • New $1,120mm Senior Notes 6.125% Senior Notes due 2022 ($275) 274 274 • Rolled $166mm 5-year Revolver 5.875% Senior Notes due 2022 ($400) 405 405 • Rolled $2,211 Term Loan A and B 5.625% Senior Notes due 2024 ($900) 889 889 • Rolled $900mm Senior Notes 5.625% Senior Notes due 2027 ($1,120) -- 1,120 • Rolled $400mm Senior Notes Total Debt $ 3,785 $ 8,645 • Rolled $275mm Senior Notes Cash on Hand $ 80 $ 100 NXST’s pro forma net leverage ratio at closing is ~4.9x, compared to the Company’s LTM Covenant EBITDA $ 1,090 $ 1,868 initial estimate of ~5.3x L8QA Adjusted EBTIDA $ 951 $ 1,749 1 and revised estimate of ~5.1x LTM Credit Statistics: • Lower leverage at closing reflects Net Secured Debt / LTM Covenant EBITDA 2.0x 3.2x recent operating results, voluntary Net Debt / LTM Covenant EBITDA 3.5x 4.6x debt repayments and the terms of the transaction financings. L8QA Credit Statistics: • Expect LTM covenant net leverage to decline to less than 4.0x by Net Secured Debt / L8QA Adj. EBITDA 2.4x 3.4x year-end 2020. Net Debt / L8QA Adj. EBITDA 4.0x 4.9x ____________________ 11 (1) Pro forma net leverage on a L8QA Adjusted EBITDA basis.Pro Forma Capital Structure NXST PF NXST NXST PF Capital Structure and Financing ($) in millions As of 6/30/19 As of 6/30/19 • New $675mm 5-year Term Loan A Revolver ($172) $ 6 $ 6 • New $3,065mm 7-year Term Loan B First Lien Term Loans 2,211 5,951 • New $1,120mm Senior Notes 6.125% Senior Notes due 2022 ($275) 274 274 • Rolled $166mm 5-year Revolver 5.875% Senior Notes due 2022 ($400) 405 405 • Rolled $2,211 Term Loan A and B 5.625% Senior Notes due 2024 ($900) 889 889 • Rolled $900mm Senior Notes 5.625% Senior Notes due 2027 ($1,120) -- 1,120 • Rolled $400mm Senior Notes Total Debt $ 3,785 $ 8,645 • Rolled $275mm Senior Notes Cash on Hand $ 80 $ 100 NXST’s pro forma net leverage ratio at closing is ~4.9x, compared to the Company’s LTM Covenant EBITDA $ 1,090 $ 1,868 initial estimate of ~5.3x L8QA Adjusted EBTIDA $ 951 $ 1,749 1 and revised estimate of ~5.1x LTM Credit Statistics: • Lower leverage at closing reflects Net Secured Debt / LTM Covenant EBITDA 2.0x 3.2x recent operating results, voluntary Net Debt / LTM Covenant EBITDA 3.5x 4.6x debt repayments and the terms of the transaction financings. L8QA Credit Statistics: • Expect LTM covenant net leverage to decline to less than 4.0x by Net Secured Debt / L8QA Adj. EBITDA 2.4x 3.4x year-end 2020. Net Debt / L8QA Adj. EBITDA 4.0x 4.9x ____________________ 11 (1) Pro forma net leverage on a L8QA Adjusted EBITDA basis.
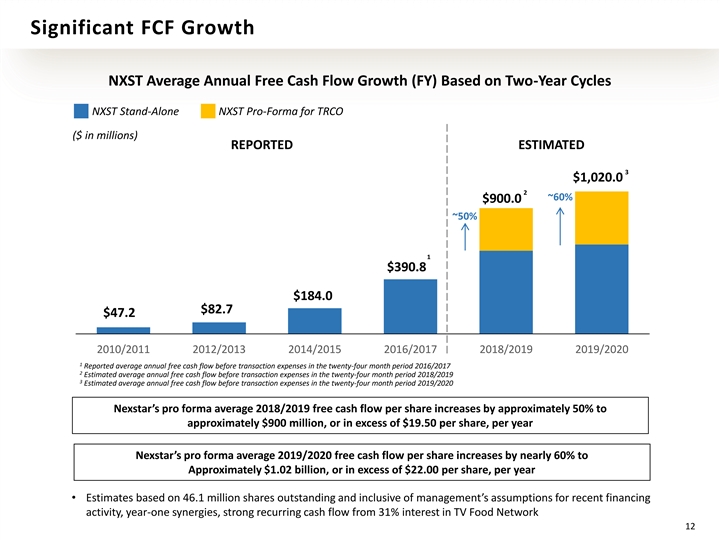
Significant FCF Growth NXST Average Annual Free Cash Flow Growth (FY) Based on Two-Year Cycles NXST Stand-Alone NXST Pro-Forma for TRCO ($ in millions) REPORTED ESTIMATED 3 $1,020.0 2 ~60% $900.0 ~50% 1 $390.8 $184.0 $82.7 $47.2 2010/2011 2012/2013 2014/2015 2016/2017 2018/2019 2019/2020 1 Reported average annual free cash flow before transaction expenses in the twenty-four month period 2016/2017 2 Estimated average annual free cash flow before transaction expenses in the twenty-four month period 2018/2019 3 Estimated average annual free cash flow before transaction expenses in the twenty-four month period 2019/2020 Nexstar’s pro forma average 2018/2019 free cash flow per share increases by approximately 50% to approximately $900 million, or in excess of $19.50 per share, per year Nexstar’s pro forma average 2019/2020 free cash flow per share increases by nearly 60% to Approximately $1.02 billion, or in excess of $22.00 per share, per year • Estimates based on 46.1 million shares outstanding and inclusive of management’s assumptions for recent financing activity, year-one synergies, strong recurring cash flow from 31% interest in TV Food Network 12Significant FCF Growth NXST Average Annual Free Cash Flow Growth (FY) Based on Two-Year Cycles NXST Stand-Alone NXST Pro-Forma for TRCO ($ in millions) REPORTED ESTIMATED 3 $1,020.0 2 ~60% $900.0 ~50% 1 $390.8 $184.0 $82.7 $47.2 2010/2011 2012/2013 2014/2015 2016/2017 2018/2019 2019/2020 1 Reported average annual free cash flow before transaction expenses in the twenty-four month period 2016/2017 2 Estimated average annual free cash flow before transaction expenses in the twenty-four month period 2018/2019 3 Estimated average annual free cash flow before transaction expenses in the twenty-four month period 2019/2020 Nexstar’s pro forma average 2018/2019 free cash flow per share increases by approximately 50% to approximately $900 million, or in excess of $19.50 per share, per year Nexstar’s pro forma average 2019/2020 free cash flow per share increases by nearly 60% to Approximately $1.02 billion, or in excess of $22.00 per share, per year • Estimates based on 46.1 million shares outstanding and inclusive of management’s assumptions for recent financing activity, year-one synergies, strong recurring cash flow from 31% interest in TV Food Network 12

Combined Company Expense Guidance Pro-Forma NXST Full-Year 2020 Estimate ($) in millions Cash Interest Expense ~$400 million Operating Cash Taxes (excl. cash income taxes paid on the gain from station divestitures) ~$350 million Capital Expenditures (excluding station repack costs) ~$140 million Estimated Corporate Expenses (run-rate, pre-transaction expenses) ~$120 million 13Combined Company Expense Guidance Pro-Forma NXST Full-Year 2020 Estimate ($) in millions Cash Interest Expense ~$400 million Operating Cash Taxes (excl. cash income taxes paid on the gain from station divestitures) ~$350 million Capital Expenditures (excluding station repack costs) ~$140 million Estimated Corporate Expenses (run-rate, pre-transaction expenses) ~$120 million 13

Nexstar with Tribune: A Powerful Combination A strategically, financially and operationally compelling combination ▪ Creates largest pure play broadcast television group with broad geographic reach and scale 1 – #1 US television broadcaster with 197 stations in 115 markets, with greatly expanded presence in top 50 DMAs – Further diversifies affiliation mix and increases Nexstar’s attractiveness as a network partner – Well positioned to benefit from growth in political advertising – Advances Nexstar’s growing digital opportunity ▪ Highly compelling financial transaction that delivers strong growth prospects for the combined company – Pro-forma annual revenue of approximately $4.2 billion (2018/2019 average, post-divestitures) – Upsized readily achievable year one synergies of $185 million – Strong recurring cash flow from 31% interest in TV Food Network – Increases Nexstar’s pro forma average 2018/2019 free cash flow per share by approximately 50% to ~$900 2 million, or in excess of $19.50 per share, per year – Increases Nexstar’s pro forma average 2019/2020 free cash flow per share by nearly 60% to ~$1.02 billion, or in 2 excess of $22.00 per share, per year ▪ More favorable than projected results from station divestitures, financing terms and recent operations – Pro forma net leverage ratio at closing is ~4.6x, compared to the company’s prior estimate of ~5.1x – Expect LTM covenant net leverage to decline to less than 4.0x by year-end 2020 ▪ Positioned for significant de-leveraging and increased return of capital to shareholders ▪ Led by experienced, industry-leading management team with proven acquisition track record – History of seamless integration and synergy realization – Long-term record of creating shareholder value through accretive M&A ____________________ (1) Includes both Nexstar-owned stations and stations to which Nexstar provides services pursuant to contractual agreements. 14 (2) Estimates based on 46.1 million shares outstanding and inclusive of management’s assumptions for recent financing activity, year-one synergies, strong recurring cash flow from 31% interest in TV Food NetworkNexstar with Tribune: A Powerful Combination A strategically, financially and operationally compelling combination ▪ Creates largest pure play broadcast television group with broad geographic reach and scale 1 – #1 US television broadcaster with 197 stations in 115 markets, with greatly expanded presence in top 50 DMAs – Further diversifies affiliation mix and increases Nexstar’s attractiveness as a network partner – Well positioned to benefit from growth in political advertising – Advances Nexstar’s growing digital opportunity ▪ Highly compelling financial transaction that delivers strong growth prospects for the combined company – Pro-forma annual revenue of approximately $4.2 billion (2018/2019 average, post-divestitures) – Upsized readily achievable year one synergies of $185 million – Strong recurring cash flow from 31% interest in TV Food Network – Increases Nexstar’s pro forma average 2018/2019 free cash flow per share by approximately 50% to ~$900 2 million, or in excess of $19.50 per share, per year – Increases Nexstar’s pro forma average 2019/2020 free cash flow per share by nearly 60% to ~$1.02 billion, or in 2 excess of $22.00 per share, per year ▪ More favorable than projected results from station divestitures, financing terms and recent operations – Pro forma net leverage ratio at closing is ~4.6x, compared to the company’s prior estimate of ~5.1x – Expect LTM covenant net leverage to decline to less than 4.0x by year-end 2020 ▪ Positioned for significant de-leveraging and increased return of capital to shareholders ▪ Led by experienced, industry-leading management team with proven acquisition track record – History of seamless integration and synergy realization – Long-term record of creating shareholder value through accretive M&A ____________________ (1) Includes both Nexstar-owned stations and stations to which Nexstar provides services pursuant to contractual agreements. 14 (2) Estimates based on 46.1 million shares outstanding and inclusive of management’s assumptions for recent financing activity, year-one synergies, strong recurring cash flow from 31% interest in TV Food Network

Completed Acquisition of Tribune Media Company Enhancing Nexstar’s Position as North America’s Leading Local Media Company S e p t e m b e r 2 0 , 2 0 1 9Completed Acquisition of Tribune Media Company Enhancing Nexstar’s Position as North America’s Leading Local Media Company S e p t e m b e r 2 0 , 2 0 1 9