Management’s Discussion and Analysis of Financial Condition and Results of Operations
Basis of Presentation of Financial Information
The amounts described below are based on the Company’s consolidated financial statements, which are prepared in accordance with Canadian GAAP. The significant differences between Canadian and United States GAAP are detailed in Note 23 to the consolidated financial statements. The following Management’s Discussion and Analysis should be read in conjunction with the consolidated financial statements, including “Significant Accounting Policies – Principles of Consolidation”. This Management’s Discussion and Analysis was prepared as of February 17, 2004.
Overview
The Company is a global full service supplier of automotive interior and closure components, systems and modules whose principal products include interior systems, such as seating systems, cockpit systems, sidewall systems, cargo management systems and overhead, floor and acoustic systems and related components; and closure systems, including latching systems, glass moving systems, power sliding doors and liftgates, wiper systems and door modules. The Company directly supplies most of the major automobile manufacturers in the world and employs approximately 24,000 employees at 71 manufacturing facilities, 17 product development, engineering and testing centres and 13 sales offices in North America, Europe, Brazil and Asia Pacific. The Company’s top five customers, based on consolidated 2003 sales, are DaimlerChrysler (27%), Ford (23%), General Motors (16%), BMW (9%) and Volkswagen (6%).
The Company’s operations consist of two business segments, the Interior and Closure businesses, which are generally aligned on a product basis with the corresponding purchasing and engineering groups of the Company’s customers. Effective January 2003, the Company’s Closure operations underwent an organizational structure change, effectively changing management’s reporting and assessment of operating results for resource allocation decisions and performance assessment to be on a global basis. Consistent with these changes in the Company’s business operations, the Closure Systems segment, beginning January 2003 is reported on a global basis. As a result, the Company has presented the Closure business as one reportable business segment to reflect the new global approach for segment wide growth. The Company’s Interior Systems segment continues to be segregated between North America and Europe. In 2003, the Company’s Interior Systems segment accounted for approximately 79% and 68% of the Company’s consolidated sales and operating income, and the Company’s Closure segment accounted for approximately 21% and 32% of the Company’s consolidated sales and operating income.
The following are highlights of the Company’s financial performance in 2003:
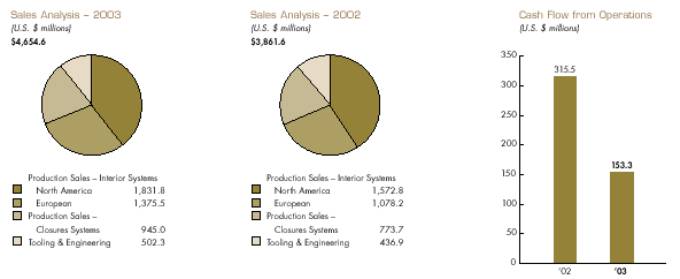
• Total sales increased $0.8 billion, or 21% to $4.7 billion compared to $3.9 billion in 2002;
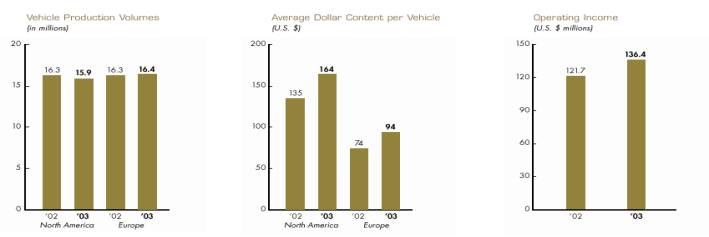
• Average dollar content on North American produced vehicles in 2003 increased by $29 to $164 as compared to $135 in 2002. In addition, Western European average dollar content per vehicle increased $20 to $94 during 2003 compared to $74 in 2002. The growth in content in both North America and Europe was attributable to increased market penetration and the positive impact of foreign exchange translation on sales;
1
• New products launched during 2003 included the complete seats for the Chrysler Pacifica, the complete seats, overhead system and interior trim for the Ford Freestar and the Mercury Monterey, the integration of the complete interior, excluding seats, for the Cadillac SRX, the seat mechanisms for the Honda Accord and Pilot, the door panels for the Chevrolet Malibu, the window regulators for DaimlerChrysler minivans and the cockpit module and seat tracks for the Chevrolet Colorado and the GMC Canyon in North America and the complete interior, excluding seats, for the BMW 6 Series, the cargo management system and other interior trim for the BMW X3 and the complete seats for the Volkswagen Caddy in Europe;
• Higher start-up costs were incurred at both new and existing facilities launching new products during 2003 and during 2004. In addition to the products launched during 2003, new products launching over the next 12 months include the complete seats, headliner and instrument panel for the Chevrolet Equinox, the second and third row STOW ‘N GOTM (a trademark of DaimlerChrysler Corporation) seats for DaimlerChrysler minivans, the interior integration, overhead system, instrument panel and door panels for the Cadillac STS and the complete seats for the Chevrolet Cobalt in North America and door panels for the BMW 1 Series, latches for Audi and the interior trim, carpet and cargo management for the Mercedes A-class in Europe;
• During 2003, the Company closed three under-performing facilities in Europe;
• North American light vehicle production of 15.9 million units during 2003 was 3% lower than production levels in 2002. 2003 Western European vehicle production was 16.4 million units, representing a 1% increase from 2002;
• The OEMs in both North America and Europe continue to offer various price and financing incentives to their customers. As a result, the Company’s pricing to its OEM customers has been under pressure resulting in higher price reductions in 2003 compared to the prior year; and
• Operating income increased by 12% to $136.4 million from $121.7 million in 2002.
INDUSTRY RISKS AND TRENDS
The following are some of the more significant risks and trends relating to the automotive industry that could affect the Company in achieving its results:
• An economic downturn could reduce or eliminate the Company’s profitability. The global automotive industry is cyclical and is sensitive to changes in economic conditions such as interest rates, consumer demand, oil and energy prices and international conflicts.
• Increasing price reduction pressures from the Company’s customers could reduce profit margins. In the past, the Company entered into, and will continue to enter into, long-term supply arrangements with automobile manufacturers, which provide for, among other things, price concessions over the supply term. To date, these concessions have been largely offset by cost reductions arising principally from product and process improvements and price reductions from the Company’s suppliers. However, the competitive automotive industry environment in both North America and Europe has caused these pricing pressures to intensify. A number of the Company’s customers continue to demand additional price reductions beyond existing
2
contractual commitments, which could have an adverse impact on the Company’s future profit margins. To the extent that these price reductions are not offset through cost reductions, the Company’s future profit margins would be adversely affected.
• The Company is under increasing pressure to absorb more costs related to product design and engineering and tooling as well as other items previously paid for directly by automobile manufacturers. In particular, some automobile manufacturers have requested that the Company pay for design and engineering and tooling costs that are incurred up to the start of production and recover these costs through increasing the unit price of the particular products. If estimated production volumes are not achieved, the design and engineering and tooling costs incurred by the Company may not be fully recovered.
• Although the Company supplies parts to most of the leading automobile manufacturers for a wide variety of vehicles produced in North America and Europe, the Company does not supply parts for all vehicles produced, nor is the number or value of parts evenly distributed among the vehicles for which the Company does supply parts. Shifts in market share among vehicles could have an adverse effect on the Company’s sales and profit margins. For example, the Company is affected by the sales mix between passenger cars, SUVs, minivans and other light trucks as the product content and profit margin vary among these types of vehicles.
• Although the Company’s financial results are reported in U.S. dollars, a significant portion of the Company’s sales and operating costs are realized in Canadian dollars, euros, British pounds and other currencies. The Company’s profitability is affected by movements of the U.S. dollar against the Canadian dollar, the British pound, the euro or other currencies in which the Company generates its revenues.
• In order to retain its global competitiveness with its customers, the Company is under increasing pressure to move operations to lower cost jurisdictions like Mexico, China and Eastern Europe. The impact to the Company could include higher costs associated with the impairment of redundant assets and labour in certain higher cost jurisdictions in which the Company currently carries on business, relocation and start-up costs, all of which would adversely impact profit in the short term. The Company could also be exposed to foreign exchange and liquidity risks in the long term.
• The Company’s customers are increasingly requesting that each of their suppliers bear the cost of the repair and replacement of defective products which are either covered under automobile manufacturer’s warranty or are the subject of a recall by the customer and which were improperly designed, manufactured or assembled by their suppliers. The obligation to repair or replace such parts could have a negative impact on the Company’s results. The Company is also subject to the risk of exposure to product liability claims in the event that the failure of the Company’s products results in bodily injury and/or property damage. The Company may experience material product liability losses in the future and may incur significant costs to defend such claims. Currently, the Company has product liability coverage under insurance policies. This coverage will continue until August 2004, subject to renewal on an annual basis. In addition, some of the Company’s European subsidiaries maintain product recall insurance, which is required by law in certain jurisdictions. A successful claim brought against the Company in excess of its available insurance coverage may have an adverse effect on the Company’s operations and financial condition.
Critical Accounting Policies
The Company’s discussion and analysis of its results of operations and financial position is based upon the consolidated financial statements, which have been prepared in accordance with Canadian GAAP. Note 23 to the Company’s consolidated financial statements sets out the material differences between Canadian and United States GAAP. The preparation of the consolidated financial statements requires management to make estimates and judgements that affect the reported amounts of assets, liabilities, revenues and expenses, and the related disclosure of contingent assets and liabilities. On an ongoing basis, the Company evaluates its estimates. The Company bases its estimates on historical experience and various other assumptions that are believed to be reasonable in the circumstances, the results of which form the basis for making judgements about the carrying value of assets and liabilities. Actual results may differ from these estimates under different assumptions or conditions.
The Company believes the following critical accounting policies affect its more significant judgements and estimates used in the preparation of its consolidated financial statements. Management has discussed the development and selection of the following critical accounting policies with the Audit Committee of the Board of Directors and the Audit Committee has reviewed the Company’s disclosure relating to critical accounting policies in this MD&A.
3
REVENUE RECOGNITION
Separately Priced Tooling Contracts With respect to its contracts with OEMs for particular vehicle programs, the Company performs multiple revenue-generating activities. The most common arrangement is where, in addition to contracting for the production and sale of parts, the Company also has a separately priced contract with the OEM for related tooling costs. Under these arrangements, the Company either constructs the tools at its in-house tool shop or contracts with third party tooling vendors to construct and supply tooling to be used by the Company in the production of parts for the OEM. On completion of tooling build, and upon acceptance of the tooling by the OEM, the Company sells the separately priced tooling to the OEM pursuant to a separate tooling purchase order.
Revenues and cost of sales from separately priced tooling contracts are presented on a gross basis in the consolidated statements of income when the Company is acting as principal and is subject to significant risks and rewards in connection with the process of bringing the tool to its final state and in the post-sale dealings with its customers. Otherwise, components of revenue and related costs are presented on a net basis. To date, revenues and cost of sales on separately priced tooling contracts have been reported on a gross basis.
Revenues from separately priced tooling contracts are recognized substantially on a completed contract basis. The completed contract method recognizes revenue and cost of sales only when the contract is completed and the tool is accepted by the customer. All costs net of customer advances are reported in tooling inventory in the Company’s consolidated balance sheet until that time.
Tooling contract prices are generally fixed; however, price changes, change orders and program cancellations may affect the ultimate amount of revenue recorded with respect to a contract. Contract costs are estimated at the time of signing the contract and are reviewed at each reporting date. Adjustments to the original estimates of total costs are often required as work progresses under the contract and as experience is gained, even though the scope of the work under the contract may not change. When the current estimates of total contract revenue and total contract costs indicate a loss, a provision for the entire loss on the contract is made. Factors that are considered in arriving at the forecasted loss on a contract include, among others, cost over-runs, non-reimbursable costs, change orders and potential price changes.
For United States GAAP purposes, the Company reports a United States GAAP difference with respect to separately priced tooling contracts manufactured at the Company’s in-house tooling division when such tools will be used by the Company to service a subsequent parts production program. Revenues from design and engineering services provided to customers under certain long-term contracts are recognized on a percentage of completion basis.
Given the potential for profit on tooling manufactured in-house and based on the detailed requirements of the United States Securities and Exchange Commission’s Staff Accounting Bulletin No.101, the Company concluded that revenues and cost of sales on such tooling should be deferred and amortized on a gross basis over the subsequent parts production program for United States GAAP purposes.
The Emerging Issues Task Force recently issued Abstract 00-21, “Accounting for Revenue Arrangements With Multiple Deliverables” (“EITF 00-21”). In addition, the CICA recently issued Emerging Issues Committee Abstract No.142, “Revenue Arrangements with Multiple Deliverables” (“EIC-142”). These Abstracts provide guidance on accounting by a vendor for arrangements involving multiple deliverables. They specifically address how a vendor determines whether an arrangement involving multiple deliverables contains more than one unit of accounting and they also address how consideration should be measured and allocated to the separate units of accounting in the arrangement. These Abstracts are effective for revenue arrangements entered into by the Company on or after January 1, 2004. The impact of these pronouncements on the Company’s consolidated financial statements has not been determined.
Integrator Contracts The Company acts as the vehicle interior integrator on various programs in which the Company manufactures a portion of the integrated products but also collects components from various sub-suppliers for assembly and sale of an integrated product to the customer. Judgement is required in assessing whether these integrator contracts should be reported on a gross (reporting sales and cost of sales gross) or net (netting cost of sales against sales) basis. Some of the factors the Company considers in arriving at its conclusion to record sales on a gross versus net basis include whether the Company has the primary responsibility for providing the integrated product to the customer, exposure to inventory risk on
4
sub-supplier parts, responsibility for design and specifications, latitude in establishing sub-supplier pricing, exposure to warranty and exposure to credit risk for sale of the integrated product to the customer. The method of revenue recognition is reviewed on a component by component basis. To date, all vehicle interior integrator supply contracts have been recorded on a gross basis.
AMORTIZED ENGINEERING AND CUSTOMER OWNED TOOLING ARRANGEMENTS
The Company incurs pre-production engineering, design, research and development (“ER&D”) costs related to the products it produces for its customers under long-term supply agreements. The Company expenses ER&D costs which are paid for as part of subsequent related parts production piece-price amounts as incurred unless a contractual guarantee for reimbursements exists, in which case the costs would be capitalized. In addition, the Company expenses all costs as incurred related to the design and development of moulds, dies and other tools that the Company will not own and that will be used in, and reimbursed as part of the piece-price amount for subsequent related parts production. Such costs are capitalized only when the supply agreement provides the Company with a contractual guarantee for reimbursement of costs or the non-cancellable right to use the moulds, dies and other tools during the supply agreement.
ER&D and customer owned tooling costs capitalized in “Other assets” are amortized on a units of production basis over the related parts production long-term supply agreement. As at December 31, 2003 and 2002, total net ER&D and customer owned tooling costs capitalized in other assets amounted to $10.7 million and $4.0 million, respectively. A change in the commercial arrangement affecting any of the Company’s significant programs that would require the Company to expense ER&D or customer owned tooling costs that are currently capitalized would have a negative impact on the Company’s reported results of operations.
GOODWILL AND LONG-LIVED ASSET IMPAIRMENT
Goodwill Effective January 1, 2002, the Company adopted new rules governing the accounting for goodwill for Canadian GAAP reporting purposes (see “Depreciation and Amortization” and “Other Charges”). Under the new rules, the Company’s goodwill is no longer amortized and is subject to an annual impairment test.
Goodwill impairment is assessed based on a comparison of the fair value of an individual reporting unit to the underlying carrying value of the reporting unit’s net assets including goodwill. When the carrying value of the reporting unit exceeds its fair value, the fair value of the reporting unit’s goodwill should be compared with its carrying value to measure the amount of the impairment loss, if any. The fair value of goodwill is determined using the estimated discounted future cash flows of the reporting unit.
The goodwill of a reporting unit must be tested for impairment on an annual basis or between the annual tests when an event or circumstance occurs that more likely than not reduces the fair value of a reporting unit below its carrying value.
The Company completed its annual goodwill impairment analysis in the fourth quarter of 2003 after the annual business plan process had been completed. The result of this analysis indicated no impairment of goodwill for 2003.
Long-Lived Assets Effective January 1, 2002, the Company adopted new rules governing the accounting for impairment of long-lived assets (see “Other Charges”). The Company evaluates long-lived assets for impairment whenever indicators of impairment exist. Indicators of impairment include prolonged operating losses, goodwill impairment or a decision to dispose of, or otherwise change the use of, an existing long-lived asset.
An impairment loss is recognized when the carrying value of an asset to be held and used exceeds the sum of the undiscounted cash flows expected from its use and eventual disposition. An impairment loss is measured as the amount by which the asset’s carrying value exceeds its fair value. Discounted cash flows are used to determine fair value.
The Company believes that accounting estimates related to both goodwill and long-lived asset impairment assessments are “critical accounting estimates” because (i) they are subject to significant measurement uncertainty and are susceptible to change as management is required to make forward looking assumptions regarding the impact of improvement plans on current operations, insourcing and other new business opportunities, program price and cost assumptions on current and future business, the timing of new program launches and future forecasted production volumes; and (ii) any resulting impairment loss could have a material impact on the Company’s consolidated net income and on the amount of goodwill and long-lived assets reported on the Company’s consolidated balance sheet.
5
FUTURE INCOME TAX ASSETS AND FUTURE INCOME TAX LIABILITIES
Under both Canadian and United States GAAP, the Company uses the liability method of tax allocation for accounting for income taxes. Under the liability method of tax allocation, future tax assets and liabilities are determined based on differences between the financial reporting carrying value and tax cost bases of assets and liabilities. Future tax assets are reduced by a valuation allowance if it is more likely than not that some or all of the future tax asset will not be realized.
At December 31, 2003 and 2002, the Company had recorded net future tax assets (net of related liabilities and valuation allowances) of $26.6 million and $37.5 million, respectively, consisting primarily of the benefit of loss carryforwards. Future tax assets at December 31, 2003 related primarily to the Company’s German and U.S. operations.
The Company evaluates quarterly the carrying value of its future tax assets by assessing its valuation allowance and by adjusting the amount of such allowance, if necessary. The factors used to assess the likelihood of realization are the Company’s forecast of future taxable income and available tax planning strategies that could be implemented to realize the future tax assets.
At December 31, 2003, the Company had income tax loss carryforwards of approximately $143 million, which relate primarily to operations in Europe, the tax benefits of which have not been recognized in the consolidated financial statements. Of the total tax loss carryforwards, $119 million expire between 2004 and 2018 and the remainder have no expiry dates. If operations improve to profitable levels in these jurisdictions, and such improvements are sustained for a prolonged period of time, the Company’s earnings will benefit from these tax loss carryforwards.
EMPLOYEE DEFINED BENEFIT PLANS
The Company has a number of arrangements in Canada, the United States, the United Kingdom and Europe which provide pension and post retirement benefits to its retired and current employees. Pension arrangements include statutory pension plans as well as similar arrangements, which provide pension benefits as required by statute.
The determination of the obligation and expense for defined benefit pension and other post retirement benefits, such as retiree health care and medical benefits, is dependent on the selection of certain assumptions used by actuaries in calculating such amounts. Those assumptions are included in Note 12 to the Company’s consolidated financial statements and include, among others, the discount rate, expected long-term rate of return on plan assets and rates of increase in compensation and health care costs. Actual results that differ from the assumptions used are accumulated and amortized over future periods and, therefore, impact the recognized expense and recorded obligation in future periods.
At December 31, 2003, the Company had obligations under its defined benefit pension plans and other statutory plans of $84.2 million. The defined benefit plans have assets of $40.4 million and unfunded unrecognized net actuarial losses of $18.3 million. All pension plans and similar arrangements are funded to the minimum legal funding requirement. In certain plans, there is no legal requirement to fund the obligation until such time as they are actually incurred, and as a result these arrangements are unfunded. In addition to the registered plan assets, certain subsidiaries hold $1.5 million of guaranteed securities with respect to their unfunded termination and long service obligations. In addition, the Company has obligations with respect to post retirement medical benefits of $18.7 million. The Company’s pension and post retirement medical benefit expense was $10.7 million, $6.5 million and $5.3 million in 2003, 2002 and 2001, respectively. Unfunded unrecognized net actuarial losses are amortized and charged to earnings over the average remaining service period of active employees. Where there are no active employees, unfunded unrecognized net actuarial losses are amortized and charged to earnings over the average remaining life expectancy of the plan participants.
FOREIGN EXCHANGE CONTRACTS
The Company uses foreign exchange contracts to manage foreign exchange risk from its underlying customer and supplier contracts. In particular, the Company uses foreign exchange forward contracts for the sole purpose of hedging certain of the Company’s future committed foreign currency outflows and inflows. These derivatives qualify for hedge accounting under Canadian GAAP. The Company does not enter into foreign exchange contracts for speculative purposes.
The Company determines the fair value of the derivatives based on market values provided by independent parties based on contracts with similar remaining terms to maturity. The values of the foreign exchange contracts will change over time as interest rates, currency rates and market conditions change.
6
While these contracts expose the Company to credit losses in the event of non-performance by counterparties to the agreements, the Company minimizes the risk of non-performance by only entering into contracts with financially sound counterparties and by limiting its exposure with any one financial institution.
The Company’s use of foreign exchange contracts is dependent on forecasted future foreign currency outflows and inflows. If such cash flows were no longer probable of occurring, the foreign exchange contracts would cease to be effective as a hedge. For example, if projected net foreign currency cash inflows or outflows declined significantly, previously unrecognized gains or losses pertaining to the portion of the hedging transactions in excess of projected foreign currency denominated cash flows would be recognized in income at the time this condition was identified. At December 31, 2003, the amount of losses not recognized in the Company’s reported net income related to significant derivative financial instrument contracts is approximately $12.2 million.
Under United States GAAP, effective January 1, 2002, the Company’s foreign exchange forward contracts qualify for hedge accounting. As of January 1, 2002, the Company implemented a new treasury management system that complies with documentation requirements that allow hedge accounting. Changes to fair value of the Company’s forward exchange contracts are recorded in other comprehensive income. Prior to January 1, 2002, for United States GAAP purposes, changes in the market value of the Company’s foreign exchange forward contracts were recorded in earnings. If the Company’s forward exchange contracts ceased to be effective as hedges, for example, if projected net foreign cash inflows declined significantly, previously unrecognized gains or losses pertaining to the portion of the hedging transactions in excess of projected foreign denominated cash flow would be recognized in income at the time this condition was identified.
WARRANTY, PRODUCT LIABILITY AND RECALL OBLIGATIONS
In certain circumstances, the Company is at risk for warranty costs, including product liability and recall costs. Product liability provisions are established based on the Company’s best estimate of the amounts necessary to settle existing claims on product default issues. Recall costs are costs incurred when the Company and/or the customer decide, either voluntarily or involuntarily, to recall a product due to a known or suspected performance issue. Costs typically include the cost of the product being replaced, customer cost of the recall and labour to remove and replace the defective part. When a decision to recall a product has been made or is probable, the Company’s estimated cost of the recall is recorded as a charge to net earnings in that period. In making this estimate, judgement is required as to the number of units that may be returned as a result of the recall, the total cost of the recall campaign, the ultimate negotiated sharing of the cost between the Company and the customer and, in some cases, the extent to which a supplier to the Company will share the recall cost. Due to the nature of the costs, the Company makes its best estimate of the expected future costs; however, the ultimate amount of such costs could be materially different.
Given the nature of the Company’s products, to date, the Company has not experienced significant warranty, including product liability and recall costs. However, the Company continues to experience increased customer pressure to assume greater warranty responsibility. Currently, the Company only accounts for existing or probable claims; however, a significant increase in warranty responsibility could require the Company to consider accounting for possible future claims.
CONTINGENCIES
In the ordinary course of business activities, the Company may be contingently liable for litigation and potential claims with customers, suppliers and former employees. In addition, the Company may be, or could become, liable to incur environmental remediation costs to bring environmental contamination levels back within acceptable legal limits. On an ongoing basis, the Company assesses the likelihood of any adverse judgements or outcomes to these matters as well as potential ranges of probable costs and losses. A determination of the provision required, if any, for these contingencies is made after analysis of each individual issue. The required provision may change in the future due to new developments in each matter or changes in approach such as a change in settlement strategy in dealing with these matters.
To date, contingent liabilities recognized in the Company’s consolidated financial statements are not significant.
7
STOCK-BASED COMPENSATION
Effective January 1, 2003, the Company prospectively adopted the fair value method for recognizing compensation expense for stock options granted under its Incentive Stock Option Plan (the “Option Plan”). Under the prospective method of adoption, compensation expense is recognized for fixed price stock options granted, modified, or settled after January 1, 2003, assuming compensation expense for the stock option plan had been determined based upon the fair value of the options at the grant date.
The fair value of stock options is estimated at the grant date using the Black-Scholes option pricing model. This model requires the input of a number of assumptions, including dividend yields, expected stock price volatility, expected time until exercise and risk free interest rates. Although the assumptions used reflect management’s best estimates, they involve inherent uncertainties based on market conditions generally outside of the control of the Company. If other assumptions are used, stock-based compensation expense could be significantly impacted.
Compensation expense is recognized over the vesting period of the options granted, and is recorded in selling, general and administrative expenses in the consolidated statement of income and contributed surplus in the consolidated balance sheet. The Company’s stock-based compensation expense was $0.6 million in 2003. On the exercise of stock options, the consideration received and the accumulated contributed surplus amount is credited to capital stock.
For stock option awards prior to January 1, 2003, no compensation expense was recognized. Pro forma net income and earnings per share disclosure showing the impact of fair value accounting for stock options granted prior to January 1, 2003 is included in Note 15 to the consolidated financial statements.
Results of Operations and Financial Position for the Year 2003 Compared to 2002
Years ended December 31 | | 2003 | | 2002 | | Change | |
| | | | | | | |
1 Canadian dollar equals U.S. dollars | | 0.7159 | | 0.6372 | | 12.4 | % |
1 Euro equals U.S. dollars | | 1.1320 | | 0.9456 | | 19.7 | % |
1 British pound equals U.S. dollars | | 1.6349 | | 1.5025 | | 8.8 | % |
The Company’s results are directly affected by the average exchange rate used to translate the results of its operations having a functional currency other than the U.S. dollar into U.S. dollars. The preceding table reflects the average foreign exchange rates between the primary currencies in which the Company conducts business and the Company’s U.S. dollar reporting currency. As a result of the significant strengthening in the functional currencies noted above, 2003 sales and operating income have increased by approximately $368 million and $5 million respectively from 2002. Throughout this MD&A, reference is made to the impact of foreign exchange on reported U.S. dollar amounts where relevant.
8
SALES
Years ended December 31
(in millions, except average dollar content per vehicle) | | 2003 | | 2002 | |
| | | | | |
Vehicle production volumes | | | | | |
North America | | 15.9 | | 16.3 | |
Europe | | 16.4 | | 16.3 | |
| | | | | |
Average dollar content per vehicle | | | | | |
North America | | $ | 164 | | $ | 135 | |
Europe | | $ | 94 | | $ | 74 | |
| | | | | |
Production sales – Interior Systems | | | | | |
North America | | $ | 1,831.8 | | $ | 1,572.8 | |
Europe | | 1,375.5 | | 1,078.2 | |
Production sales – Closure Systems | | 945.0 | | 773.7 | |
| | 4,152.3 | | 3,424.7 | |
Tooling and engineering sales | | 502.3 | | 436.9 | |
Total sales | | $ | 4,654.6 | | $ | 3,861.6 | |
PRODUCTION SALES – INTERIOR SYSTEMS
North America: North American production sales for the Interior business increased 16.5% to $1,831.8 million for 2003 compared to $1,572.8 million for 2002. This growth was primarily the result of an increase in average dollar content per vehicle and the strengthening of the Canadian dollar relative to the U.S. dollar. The increase in average dollar content per vehicle was attributable to new product launches during the second half of 2002 including the complete seats for the Saturn ION and new product launches during 2003 including the complete seats for the Chrysler Pacifica, the complete seats, overhead system and interior trim for the Ford Freestar and the Mercury Monterey, the integration of the complete interior, excluding seats, for the Cadillac SRX, the seat mechanisms for the Honda Accord and Pilot, the door panels for the Chevrolet Malibu and the cockpit module and seat tracks for the Chevrolet Colorado and the GMC Canyon. The increase in production sales was partially offset by a 3% decrease in North American light vehicle production volumes, including lower vehicle volumes on certain of the Company’s high content programs and by customer price reductions.
Europe: European production sales for the Interior business increased 27.6% to $1,375.5 million for 2003 compared to $1,078.2 million for 2002. This growth was primarily attributable to the strengthening of the euro and the British pound relative to the U.S. dollar and to an increase in average dollar content per vehicle, which was positively impacted by new product launches during the second half of 2002 including the instrument panel and door panels for the Jaguar XJ, the door panels for the Toyota Avensis and the cockpit module for the Nissan Micra and product launches during 2003 including the complete interior, excluding seats, for the BMW 6 Series, the cargo management system and other interior trim for the BMW X3 and the complete seats for the Volkswagen Caddy and also due to a 1% increase in Western European vehicle production volumes.
PRODUCTION SALES – CLOSURE SYSTEMS
Production sales for the Closure business increased 22.1% to $945.0 million for 2003 from $773.7 million for 2002. This growth was primarily due to the strengthening of the Canadian dollar and euro relative to the U.S. dollar and increased average dollar content per vehicle as a result of new products launched including window regulators for DaimlerChrysler minivans and other new products launched during 2003 and in late 2002. These increases were partially offset by a 3% decrease in North American vehicle production volumes including lower volumes on certain of the Company’s high content programs and by customer price reductions.
9
TOOLING AND ENGINEERING SALES
The Company’s consolidated tooling and engineering sales for 2003 increased 15.0% to $502.3 million from $436.9 million for 2002. Tooling and engineering sales increased by $56.3 million to $448.7 million in the Interior business and increased by $9.1 million to $53.6 million in the Closure business for 2003 compared to 2002. These increases in tooling and engineering sales are due to the Company’s increased involvement in new incremental programs and the strengthening of the Canadian dollar, euro and British pound relative to the U.S. dollar.
GROSS MARGIN
Years ended December 31 | | 2003 | | 2002 | |
| | | | | |
Gross margin | | $ | 536.8 | | $ | 486.7 | |
Gross margin as a percentage of total sales | | 11.5 | % | 12.6 | % |
| | | | | | | |
Gross margin as a percentage of sales decreased from 12.6% to 11.5% primarily as a result of customer price reductions, higher costs associated with new and existing facilities launching new products during 2003 and in early 2004, lower vehicle production volumes on certain of the Company’s high content programs, costs associated with the closure of divisions, the impact of labour strikes in eastern Germany in June 2003 and higher tooling sales. These decreases have been partially offset by sales from new products launched during 2003. In addition, in the fourth quarter of 2002, the Company recorded a $2.8 million charge relating to the downsizing of one of the Company’s under-performing divisions.
OPERATING INCOME
Years ended December 31 | | 2003 | | 2002 | |
| | | | | |
Gross margin | | $ | 536.8 | | $ | 486.7 | |
Less: | | | | | |
Depreciation and amortization | | 99.5 | | 88.5 | |
Selling, general and administrative | | 238.3 | | 197.6 | |
Affiliation and social fees | | 62.6 | | 55.3 | |
Other charges | | — | | 23.6 | |
Operating income | | $ | 136.4 | | $ | 121.7 | |
Depreciation and amortization as a percentage of total sales | | 2.1 | % | 2.3 | % |
Selling, general and administrative expenses as a percentage of total sales | | 5.1 | % | 5.1 | % |
Depreciation and amortization: Depreciation and amortization expense increased by $11.0 million to $99.5 million for 2003 from $88.5 million for 2002. The increase is attributable to additional depreciation expense as a result of the Company’s continuing investment in capital equipment to support new production programs and facilities, and the strengthening of the Canadian dollar, euro and British pound relative to the U.S. dollar which had the effect of increasing U.S. dollar reported depreciation and amortization expense in 2003 compared to 2002. These increases were partially offset by lower depreciation expense as a result of the impairment loss on long-lived assets recognized in the fourth quarter of 2002.
Selling, general and administrative: Selling, general and administrative (“SG&A”) costs increased by $40.7 million to $238.3 million for 2003 from $197.6 million for 2002. The increase in SG&A is primarily a result of the strengthening of the Canadian dollar, euro and British pound relative to the U.S. dollar which had the effect of increasing U.S. dollar reported SG&A expense, costs associated with start-up facilities in North America and Europe and the incremental costs associated with the increase in production sales. As a percentage of total sales, SG&A remained unchanged at 5.1%.
Affiliation and social fees: The Company pays fees to Magna International Inc. (“Magna”) for certain rights provided under the terms of the Company’s affiliation agreements and contributes a portion of its social commitment obligation under its Corporate Constitution pursuant to social commitment agreements with Magna. These fees and social commitment contributions are based on the Company’s sales and pre-tax profits. The fees and contributions to Magna expensed during 2003 were $62.6 million reflecting an increase of $7.3 million compared to the $55.3 million expensed in 2002. The increase in fees is reflective of the increase in sales and pre-tax profits in 2003 compared to 2002.
10
Other charges: The Company’s 2003 annual goodwill impairment test concluded that there was no goodwill impairment and no other charges during 2003. In 2002, the Company recognized a $3.5 million charge for impairment of goodwill relating to one reporting unit in its Interiors Europe reporting segment. There was no tax recovery recorded on this charge. In conjunction with the 2002 annual impairment test for goodwill, a long-lived assets recoverability test was also performed on the same reporting unit which resulted in recognition of additional impairment losses of $20.1 million, reducing the carrying value of machinery and equipment, leasehold improvements and buildings by $17.6 million, $1.4 million and $1.1 million respectively. Net tax assets of $1.5 million associated with these operations were charged to income tax expense in 2002.
OPERATING INCOME (LOSS)
Years ended December 31 | | 2003 | | 2002 | |
| | | | | |
Interior Systems | | | | | |
North America | | $ | 87.5 | | $ | 108.4 | |
Europe | | 5.0 | | (23.3 | ) |
Closure Systems | | 43.8 | | 34.4 | |
Corporate | | 0.1 | | 2.2 | |
Operating income | | $ | 136.4 | | $ | 121.7 | |
OPERATING INCOME – INTERIOR SYSTEMS
North America: Operating income for the North American Interior business decreased by $20.9 million to $87.5 million for 2003 from $108.4 million for 2002. The decrease in operating income was primarily a result of customer price reductions, higher costs associated with new and existing facilities launching new products during 2003 and in early 2004, a 3% decrease in North American light vehicle production volumes including lower volumes on certain of the Company’s high content programs, operating inefficiencies at one of the Company’s North American divisions, increased depreciation and amortization expense resulting from the Company’s continuing investment in capital equipment to support new production programs and facilities and increased SG&A costs and affiliation fees associated with the increase in sales. These decreases have been partially offset by increased production sales from new product launches and the strengthening of the Canadian dollar relative to the U.S. dollar.
Europe: Operating income for the European Interior business increased by $28.3 million from an operating loss of $23.3 million for 2002 to operating income of $5.0 million for 2003. Increased operating income in Europe results primarily from the 2002 recognition of a $3.5 million writedown of goodwill, a $20.1 million writedown of long-lived assets (see “Other Charges”) and a $2.8 million charge relating to the downsizing of one of the Company’s under-performing divisions. In addition, European operating income for 2003 was positively impacted by continuing operating efficiencies at certain divisions, the strengthening of the euro and British pound relative to the U.S. dollar which had the effect of increasing U.S. dollar reported operating income at certain divisions and a 1% increase in Western European vehicle production volumes. These positive impacts have been negatively affected by higher than expected costs associated with the launch of certain new products, costs associated with the closure of certain of the Company’s divisions, operating inefficiencies at one of the Company’s European facilities, the impact of labour strikes in eastern Germany in June 2003, increased depreciation and amortization expense resulting from the Company’s continuing investment in capital to support new production programs and facilities, increased SG&A costs and affiliation fees associated with the increase in sales and also by the strengthening of the euro relative to the U.S. dollar which magnified operating losses at certain European operations on the translation to the Company’s U.S. dollar reporting currency.
OPERATING INCOME – CLOSURE SYSTEMS
Operating income for the Closure business increased by $9.4 million to $43.8 million for 2003 from $34.4 million for 2002. Operating income was positively impacted by increased content from new product launches, the strengthening of the Canadian dollar and euro relative to the U.S. dollar and operating improvements at certain European operations. These increases were partially offset by a 3% decline in North American light vehicle volumes, including lower vehicle volumes on certain of the Company’s high content programs, customer price reductions, increased costs associated with the launch of new products during 2003, increased depreciation and amortization expense resulting from the Company’s continuing investment in capital to support new production programs and facilities, increased SG&A costs and affiliation fees associated with the increase in sales and the
11
strengthening of the euro relative to the U.S. dollar which magnified operating losses at certain European operations on the translation to the Company’s U.S. dollar reporting currency.
Operating income – Corporate: Operating income for Corporate for 2003 was $0.1 million compared to operating income of $2.2 million for 2002 as a result of additional corporate costs being charged to the Company’s operating segments.
OTHER ITEMS
Years ended December 31 | | 2003 | | 2002 | |
| | | | | |
Operating income | | $ | 136.4 | | $ | 121.7 | |
Interest expense (income), net | | 1.6 | | (1.5 | ) |
Amortization of discount on Convertible Series Preferred Shares | | 12.4 | | 11.6 | |
Equity income | | (0.4 | ) | (0.6 | ) |
Income before income taxes and minority interest | | 122.8 | | 112.2 | |
Income taxes | | 60.3 | | 64.5 | |
Minority interest | | 0.2 | | (0.9 | ) |
Net income | | 62.3 | | 48.6 | |
Financing charge on Convertible Series Preferred Shares | | 1.1 | | 1.9 | |
Net income attributable to Class A Subordinate Voting and Class B Shares | | $ | 61.2 | | $ | 46.7 | |
Interest expense (income), net: The Company’s interest expense, net of interest income, increased by $3.1 million to $1.6 million of interest expense for 2003 from $1.5 million interest income for 2002. The increase was a result of charges on bank indebtedness and long-term debt balances, lower interest earned on cash balances and interest income earned in 2002 on a tax refund and on other assets.
Amortization of discount on Convertible Series Preferred Shares: As part of the Reorganization of the Company in August 2001, $225 million of Convertible Series Preferred Shares were issued to Magna. As a result, a $12.4 million charge relating to the Company’s amortization of the discount on the Convertible Series Preferred Shares classified as debt was incurred during 2003 compared to $11.6 million in 2002.
Income taxes: The effective tax rate on income before income taxes and minority interest was 49.1% for 2003 as compared to 57.5% for 2002. Excluding the impact of tax losses not benefited, the non-deductible amortization of discount on Convertible Series Preferred Shares and the 2002 impact of “Other Charges”, the effective tax rate was 36% for 2003 compared to a rate of 35% for 2002.
Net income: Net income for 2003 was $62.3 million as compared to $48.6 million for 2002. The increased net income results primarily from the 2002 impairment charges for goodwill and long-lived assets of $23.6 million and the related tax impact of $1.5 million (see “Other Charges”). Excluding the impact of the impairment charges, net income for 2003 was $11.4 million lower than 2002 decreasing from $73.7 million in 2002 to $62.3 million in 2003. The decrease in net income was primarily attributable to lower operating income resulting from customer price reductions, higher costs associated with new and existing facilities launching new products during 2003 and in early 2004, a 3% reduction in North American light vehicle production volumes, including lower vehicle volumes on certain of the Company’s high content programs, operating inefficiencies at certain facilities, the impact of eastern Germany labour strikes in June 2003, costs associated with the closure of certain of the Company’s European divisions, the strengthening of the euro and British pound relative to the U.S. dollar which had the effect of increasing operating losses at certain European operations, increased depreciation and amortization expense resulting from the Company’s continuing investment in capital equipment to support new production programs and facilities, increased SG&A costs and affiliation fees associated with the increase in sales, higher interest expense and increased amortization of discount on Convertible Series Preferred Shares. These negative impacts were partially offset by increased sales from new product launches, improved operating efficiencies at certain divisions, lower tax expense and the strengthening of the Canadian dollar relative to the U.S. dollar which had the effect of increasing U.S. dollar reported net income. In addition, 2002 included a $2.8 million charge in the fourth quarter relating to the downsizing of one of the Company’s under-performing divisions.
12
Financing Charge: The deduction from net income of dividends declared and paid on the Convertible Series Preferred Shares (net of return of capital) was $1.1 million for 2003 compared to $1.9 million for 2002.
EARNINGS PER SHARE
Years ended December 31 | | 2003 | | 2002 | |
| | | | | |
Earnings per Class A Subordinate Voting or
Class B Share (U.S. $) | | | | | |
Basic | | $ | 1.26 | | $ | 0.97 | |
Diluted | | $ | 1.18 | | $ | 0.95 | |
Average number of Class A Subordinate Voting
and Class B Shares outstanding (in millions) | | | | | |
Basic | | 48.6 | | 48.2 | |
Diluted | | 63.5 | | 63.6 | |
Diluted earnings per Class A Subordinate Voting or Class B Share for 2003 was $1.18 compared to $0.95 for 2002. Diluted earnings per Class A Subordinate Voting or Class B Share for 2002 included a $0.39 loss per share associated with the “Other Charges” of $23.6 million and the related income tax charge of $1.5 million. Excluding the impact of $0.39 loss per share associated with “Other Charges”, Diluted earnings per Class A Subordinate Voting or Class B Share for 2003 is lower than 2002 Diluted earnings per Class A Subordinate Voting or Class B Share as a result of lower net income.
On August 25, 2003, Magna exercised its right to convert 39,500 Series 1 Convertible Preferred Shares into Class A Subordinate Voting Shares of the Company. The Convertible Series Preferred Shares are convertible by Magna at a fixed conversion price of U.S.$15.09 per Class A Subordinate Voting Share and accordingly, Magna received 261,762 Class A Subordinate Voting Shares of the Company. The conversion had no impact on the diluted earnings per Class A Subordinate Voting or Class B Share.
During the year ended December 31, 2003, the Company issued 681,108 Class A Subordinate Voting Shares to fund the Company’s Employee Equity and Profit Participation Program.
Summary of Quarterly Results
The following table summarizes certain unaudited consolidated financial data of the Company for the eight most recent quarters. The information has been extracted from the unaudited consolidated financial statements of the Company that have been prepared following the accounting policies as set out in the 2002 annual financial statements included in the Company’s 2002 Annual Report to shareholders. In the opinion of management, the unaudited interim consolidated financial statements reflect all adjustments, which consist only of normal and recurring adjustments, necessary to present fairly the financial data provided in the following table:
13
Three month period ended | | December 31,
2003 | | September 30,
2003 | | June 30,
2003 | | March 31,
2003 | |
| | | | | | | | | |
Operational data | | | | | | | | | |
Total sales | | $ | 1,421.7 | | $ | 1,069.1 | | $ | 1,132.2 | | $ | 1,031.6 | |
Net income | | $ | 20.5 | | $ | 8.3 | | $ | 19.7 | | $ | 13.8 | |
Basic earnings per share | | $ | 0.41 | | $ | 0.16 | | $ | 0.40 | | $ | 0.28 | |
Diluted earnings per share | | $ | 0.37 | | $ | 0.16 | | $ | 0.36 | | $ | 0.27 | |
| | | | | | | | | |
Financial Position | | | | | | | | | |
Total assets | | $ | 2,142.1 | | $ | 2,072.7 | | $ | 2,026.9 | | $ | 1,914.2 | |
Long-term financial liabilities (i) | | $ | 280.3 | | $ | 276.0 | | $ | 275.1 | | $ | 268.4 | |
Three month period ended | | December 31,
2002 | | September 30,
2002 | | June 30,
2002 | | March 31,
2002 | |
| | | | | | | | | |
Operational data | | | | | | | | | |
Total sales | | $ | 1,054.7 | | $ | 931.6 | | $ | 996.4 | | $ | 878.9 | |
Net (loss) income | | $ | (3.7 | ) | $ | 12.9 | | $ | 26.4 | | $ | 13.0 | |
Basic (loss) earnings per share | | $ | (0.09 | ) | $ | 0.26 | | $ | 0.54 | | $ | 0.26 | |
Diluted (loss) earnings per share | | $ | (0.09 | ) | $ | 0.25 | | $ | 0.46 | | $ | 0.25 | |
| | | | | | | | | |
Financial Position | | | | | | | | | |
Total assets | | $ | 1,781.8 | | $ | 1,806.8 | | $ | 1,747.0 | | $ | 1,620.1 | |
Long-term financial liabilities (i) | | $ | 263.6 | | $ | 260.8 | | $ | 258.9 | | $ | 251.5 | |
(i) Includes Long-term debt (excluding debt due within one year), liability portion of the Convertible Series Preferred Shares and Other long-term liabilities.
QUARTERLY INFORMATION
Sales increased $367.0 million to $1,421.7 million for the three month period ended December 31, 2003 compared to $1,054.7 million in the three month period ended December 31, 2002. Approximately $126 million or 34% of this increase is due to the positive impact of foreign exchange translation related to the strengthening Canadian dollar, euro and British pound relative to the U.S. dollar.
North American production sales grew to $795.8 million in the fourth quarter of 2003 compared to $551.5 million in the fourth quarter of 2002 as a result of the positive impact of higher North American average dollar content per vehicle and the strengthening of the Canadian dollar. North American light vehicle production volumes for the three month period ended December 31, 2003 were 3.9 million units, representing a 1% increase as compared to the three month period ended December 31, 2002. North American average dollar content per vehicle increased 43% to $204 for the fourth quarter of 2003 compared to $143 for the fourth quarter of 2002. New products that contributed to this increase included the cockpit module and seat tracks for the Chevrolet Colorado and the GMC Canyon, launched in the fourth quarter of 2003, the complete seats, overhead system and interior trim for the Ford Freestar and the Mercury Monterey, the integration of the complete interior, excluding seats, for the Cadillac SRX, the window regulators for DaimlerChrysler minivans, the seat mechanisms for the Honda Accord and Pilot, the door panels for the Chevrolet Malibu, launched in the third quarter of 2003 and the complete seats for the Chrysler Pacifica launched in the first quarter of 2003.
European production sales increased to $416.2 million for the fourth quarter of 2003 compared to $327.2 million for the fourth quarter of 2002 as a result of growth in the European average dollar content per vehicle and the positive impact related to the strengthening of the euro and British pound. Western European vehicle production volumes for the three month period ended December 31, 2003 were 4.2 million units representing a 1% decrease as compared to the three month period ended December 31, 2002. European average dollar content per vehicle increased 28% to $100 for the fourth quarter of 2003 compared to $78 for the fourth quarter of 2002. New products that contributed to this increase included the Company’s complete seats for the Volkswagen Caddy and the cargo management system and other interior trim for the BMW X3, launched in the fourth quarter of 2003, and the complete interior, excluding seats, for the BMW 6 Series launched in the third quarter of 2003.
14
Consolidated tooling and engineering sales for the three month period ended December 31, 2003 increased by 19% to $209.7 million from $176.0 million for the three month period ended December 31, 2002.
Operating income for the fourth quarter of 2003 increased to $46.3 million compared to $15.3 million for the fourth quarter of 2002. Fourth quarter 2002 operating income included a $23.6 million non-cash impairment charge. Excluding this impact, operating income increased by $7.4 million in 2003 compared to 2002 primarily due to increased sales from new product launches.
Cash generated from operations before changes in working capital during the fourth quarter of fiscal 2003 was $73.2 million. An additional $40.3 million of cash was generated from working capital resulting in total cash from operating activities of $113.5 million. Investment activities during the fourth quarter of 2003 were $42.9 million resulting in free cash before financing activities of $70.6 million for the quarter.
Diluted earnings per share was $0.37 for the three month period ended December 31, 2003, compared to diluted loss per share of $0.09 for the three month period ended December 31, 2002. Diluted loss per share for the three month period ended December 31, 2002 included a $0.47 loss per share related to the non-cash impairment charge of $23.6 million and the related $1.5 million income tax charge.
Financial Condition, Liquidity and Capital Resources
CASH FROM OPERATING ACTIVITIES
Years ended December 31 | | 2003 | | 2002 | |
| | | | | |
Net income | | $ | 62.3 | | $ | 48.6 | |
Items not involving current cash flows | | 150.0 | | 155.5 | |
| | 212.3 | | 204.1 | |
Change in non-cash working capital | | (59.0 | ) | 111.4 | |
| | $ | 153.3 | | $ | 315.5 | |
During 2003, cash from operations before changes in working capital increased by $8.2 million to $212.3 million from $204.1 million in 2002. The increase was a result of an increase in net income of $13.7 million offset by a decrease in non-cash items of $5.5 million representing lower future tax expense and the 2002 impairment charges for goodwill and long-lived assets offset by higher depreciation and amortization, higher pension and post retirement benefit expense and higher other non-cash charges. The $59.0 million of cash invested in working capital during 2003 is the result of a $148.2 million increase in accounts receivable, a $7.2 million increase in inventories and a $5.1 million increase in prepaids and other assets offset by a $101.5 million increase in accounts payable and accrued liabilities. The increase in accounts receivable and accounts payable and accrued liabilities is due to new programs launched during 2003.
INVESTMENT ACTIVITIES
Years ended December 31 | | 2003 | | 2002 | |
| | | | | |
Capital asset additions | | $ | (129.6 | ) | $ | (136.8 | ) |
Investments and other asset additions | | (11.6 | ) | (3.1 | ) |
Proceeds from disposition of capital assets and other | | 1.2 | | 4.8 | |
| | $ | (140.0 | ) | $ | (135.1 | ) |
15
Cash used for capital assets and investment and other asset spending was $141.2 million and $139.9 million for 2003 and 2002, respectively. This use of funds was partially offset by cash received from normal course fixed and other asset dispositions of $1.2 million and $4.8 million during 2003 and 2002, respectively.
FINANCING ACTIVITIES
Years ended December 31 | | 2003 | | 2002 | |
| | | | | |
(Decrease) increase in bank indebtedness | | $ | (26.1 | ) | $ | 0.6 | |
Repayments of long-term debt and other long-term liabilities | | (10.9 | ) | (4.6 | ) |
Issue of Class A Subordinate Voting Shares, net | | 10.2 | | 0.1 | |
Dividends on Class A Subordinate Voting and Class B Shares | | (17.3 | ) | (9.7 | ) |
Dividends on Convertible Series Preferred Shares | | (11.1 | ) | (8.4 | ) |
| | $ | (55.2 | ) | $ | (22.0 | ) |
Cash used for financing activities was $55.2 million in 2003 compared to $22.0 million in 2002. Cash used for financing activities in 2003 included net repayments of debt (including bank indebtedness and long-term debt and other long-term liabilities) of $37.0 million compared to net repayments of debt of $4.0 million in 2002. Dividends paid during 2003 were $0.35 per Class A Subordinate Voting and Class B Share totalling $17.3 million, compared to $0.20 per Class A Subordinate Voting and Class B Share during 2002, totalling $9.7 million. Dividends paid on Convertible Series Preferred Shares for 2003 were $11.1 million, compared to $8.4 million for 2002. In addition, 681,108 Class A Subordinate Voting Shares were issued for total proceeds of $10.1 million in respect of the Company’s Employee Equity and Profit Participation Program during 2003. The remainder of the proceeds from the issue of Class A Subordinate Voting Shares relates to the exercise of options granted under the Company’s Incentive Stock Option Plan.
CONSOLIDATED CAPITALIZATION
The Company’s net debt (including bank indebtedness, long-term debt including current portion, and the liability portion of the Convertible Series Preferred Shares, less cash and cash equivalents) to total capitalization (including net debt and shareholders’ equity), was 8% at December 31, 2003 compared to 7% at December 31, 2002.
The above net debt to total capitalization figures treat the liability portion ($214.7 million as at December 31, 2003) of the Convertible Series Preferred Shares as debt. The Series 1 Convertible Preferred Shares are retractable by Magna on or after December 31, 2003 and the Series 2 Convertible Preferred Shares are retractable by Magna after December 31, 2004. These instruments are also convertible into Intier Class A Subordinate Voting Shares at a fixed conversion price of $15.09.
UNUSED AND AVAILABLE FINANCING RESOURCES
Cash on hand decreased to $216.7 million at December 31, 2003 from $241.3 million at December 31, 2002. At December 31, 2003, the Company had credit facilities of $507.0 million, of which $423.0 million are unused and available. $353.3 million of the unused and available facilities represent the unused and available portion of the Company’s $385 million three year revolving credit facility which expires September 27, 2004. The credit facility includes customary commercial terms and bears interest at variable rates not exceeding the prime rate of interest. The credit facility contains negative and affirmative financial and operating convenants and events of default customary for credit facilities of this nature, including requirements that the Company maintain certain financial ratios and restrictions on its ability to incur or guarantee additional indebtedness or to dispose of assets as well as the right of the lenders to declare all outstanding indebtedness to be immediately due and payable upon the occurrence of an event of default. The primary purpose of the facility is to provide funding for general corporate purposes, including working capital and investments. The Company has plans to replace the three year revolving credit facility with a similar facility during 2004.
In addition to the above unused and available financing resources, the Company and certain of its North American subsidiaries sponsor a tooling finance program for tooling suppliers to finance tooling under construction. Under this program, the facility provider orders tooling from tooling suppliers and subsequently sells such tooling to the sponsor or its designee. The facility provider makes advances to tooling suppliers based on tool build milestones approved by the sponsor or its designee. On completion of the tooling, the facility provider sells the tooling to the sponsor or its designee for an amount equal to cumulative advances including carrying costs. In the event of tooling supplier default, the sponsor will purchase in progress tooling for an
16
amount approximating cumulative advances. A number of Magna affiliated companies are also sponsors under this facility. The maximum facility amount is $100 million and is available to individual sponsors on an uncommitted demand basis subject to individual sponsor sub-limits. The Company’s sub-limit is $100 million, subject to prior utilization of this facility by other Magna affiliated sponsors. As at December 31, 2003, $44.1 million compared to $29.3 million as at December 31, 2002, had been advanced to tooling suppliers under the Company’s portion of this facility. These amounts are included in accounts payable on the Company’s December 31, 2003 and 2002 consolidated balance sheets.
The Company typically receives a contract or production purchase order from an automobile manufacturer to produce a component, assembly, module or system for one or more vehicle model years. As part of these contracts, the Company may be required to absorb costs relating to product design and engineering and tooling costs and recover these costs by increasing the unit price of the related products. If estimated production volumes are not achieved, the Company may not fully recover these costs. In 2004, it is expected the Company will continue to incur increasing amounts of design and engineering and tooling costs, primarily related to newly awarded production contracts with production starting 2004 through to 2006.
Capital spending for existing businesses and projects is expected to range between $130 million and $150 million for 2004. The majority of capital spending in 2004 relates to the award of new production contracts and includes spending for new machinery and equipment, new production facilities, maintenance improvements and planned efficiency enhancements. Management believes the Company is in a position to meet all of its 2004 planned cash requirements from its cash balances on hand, existing credit facilities and cash provided from operations. A decrease in estimated vehicle production volumes or a change in customer or supplier payment terms could adversely impact cash provided from operating activities in 2004. Cash provided from operating activities totalled $153.3 million and $315.5 million for 2003 and 2002, respectively.
OFF BALANCE SHEET FINANCING
The Company’s off balance sheet financing arrangements are limited to operating lease contracts.
A number of the Company’s facilities are subject to operating leases with a related party, MI Developments Inc., (“MID”) and with third parties. As at December 31, 2003, operating lease commitments for facilities are $33.2 million for 2004, including $12.5 million under lease arrangements with MID. For 2008, operating lease commitments for facilities are $27.9 million, including $10.9 million under lease arrangements with MID.
The Company also has operating lease commitments for equipment. These leases are generally for shorter duration. As at December 31, 2003, operating lease commitments for equipment are $17.1 million for 2004. For 2008, operating lease commitments for equipment are $5.6 million.
Although the Company’s consolidated contractual annual lease commitments decline year by year, existing leases will either be renewed or replaced resulting in lease commitments being sustained at or increasing from current levels or the Company will incur capital expenditures to acquire equivalent capacity.
During the year ended December 31, 2003, the Company entered into an operating lease agreement for vehicle parts tooling (“tooling”). The lease facility provides for the funding of the tooling costs in tranches prior to December 31, 2003 with a commitment to fund up to approximately $39 million of tooling with lease payments being paid monthly over the lease term expiring in August 2008. The lease commenced when all tooling costs were funded which was prior to December 31, 2003.
17
The following table summarizes certain of the Company’s contractual obligations as at December 31, 2003:
| | Payments due by period | |
| | Total | | Less than 1 year | | 2 - 3 years | | 4 - 5 years | | After 5 years | |
| | | | | | | | | | | |
Bank indebtedness | | $ | 29.7 | | $ | 29.7 | | $ | — | | $ | — | | $ | — | |
Long-term debt | | 13.8 | | 3.2 | | 5.9 | | 4.7 | | — | |
Capital leases | | 35.8 | | 3.5 | | 7.0 | | 7.1 | | 18.2 | |
Operating leases | | 298.8 | | 50.3 | | 86.1 | | 73.2 | | 89.2 | |
Convertible Series Preferred Shares* | | 214.7 | | 108.6 | | 106.1 | | — | | — | |
| | $ | 592.8 | | $ | 195.3 | | $ | 205.1 | | $ | 85.0 | | $ | 107.4 | |
*These instruments are convertible into the Company’s Class A Subordinate Voting Shares at a fixed conversion price of $15.09.
GUARANTEES
The Company has guarantees to third parties that include future rent, utility costs, workers compensation claims under development, commitments linked to maintaining specific employment, customs duties and obligations linked to performance of specific vehicle programs. The amount of these guarantees is not individually or in aggregate significant.
QUANTITATIVE AND QUALITATIVE DISCLOSURES ABOUT MARKET RISK
The Company operates globally and as such is exposed to diverse regional factors that could have an adverse impact on its financial condition and liquidity. Such factors include, but are not limited to, fluctuations in foreign exchange rates, interest rates and general economic conditions.
The Company’s North American operations negotiate sales contracts with North American automobile manufacturers for payment in both U.S. and Canadian dollars. Materials and equipment are purchased in various currencies depending upon competitive factors, including relative currency values. The Company’s North American operations, material, equipment and labour are paid for in both U.S. and Canadian dollars.
The Company’s European operations negotiate sales contracts with European automobile manufacturers for payment principally in euros and British pounds. The Company’s European operations’ material, equipment and labour are paid for in the same currencies.
The Company’s manufacturing facilities sometimes make commitments to sell product for which the selling price has been determined in currencies different from the currency required to pay for the necessary labour, materials and equipment to perform the sale contracts. These commitments represent contractual obligations by the Company to deliver product over the life of the related program, which normally spans a number of years. In order to manage the foreign currency exposure which results from these activities, when necessary, the Company employs hedging programs which consist largely of purchasing foreign exchange forward contracts. Anticipated production volumes, program costs and the timing of product delivery schedules each impact the amount and timing of the forward contracts. Despite these measures, significant long-term fluctuations in relative currency values could affect the Company’s results of operations.
The Company has outstanding foreign exchange forward contracts representing commitments to buy and sell foreign currencies primarily in exchange for Canadian dollars. The table that follows provides information about the Company’s significant derivative financial instruments by functional currency and presents that information in U.S. dollar and euro equivalents. The table summarizes information on instruments and transactions that are sensitive to foreign currency exchange rates, including foreign currency forward exchange agreements. The table presents the notional amounts and weighted average exchange rates by expected maturity or transaction dates. These notional amounts generally are used to calculate the contractual payments to be exchanged under the contract.
18
FORWARD EXCHANGE AGREEMENTS
| | 2004 | | 2005 | | 2006 | | 2007 | | 2008 | | Total | | Fair Value | |
| | | | | | | | | | | | | | | |
(U.S.$ millions) | | | | | | | | | | | | | | | |
Buy U.S.$/Pay Cdn.$ | | | | | | | | | | | | | | | |
Contract amount | | 182.2 | | 113.8 | | 82.4 | | 49.0 | | 15.0 | | 442.4 | | 23.7 | |
Weighted average exchange rate | | 1.4587 | | 1.3831 | | 1.3827 | | 1.3618 | | 1.3699 | | | | | |
Sell U.S.$/Receive Cdn.$ | | | | | | | | | | | | | | | |
Contract amount | | 47.7 | | 85.6 | | 16.1 | | — | | — | | 149.4 | | (36.0 | ) |
Weighted average exchange rate | | 1.6265 | | 1.4717 | | 1.3862 | | — | | — | | | | | |
| | | | | | | | | | | | | | | |
(euro millions) | | | | | | | | | | | | | | | |
Buy euro/Pay Cdn.$ | | | | | | | | | | | | | | | |
Contract amount | | 7.7 | | 2.9 | | — | | — | | — | | 10.6 | | 1.6 | |
Weighted average exchange rate | | 1.4333 | | 1.4435 | | — | | — | | — | | | | | |
In addition to transactional foreign currency exposure, the Company’s reported results will be impacted by fluctuations in relative currency values, particularly those of the Canadian dollar, the euro and the British pound, on translation of local operating results into the Company’s reporting currency, the U.S. dollar.
CREDIT RISK
Financial assets that are exposed to credit risk consist primarily of cash and cash equivalents, accounts receivable and forward exchange contracts. Cash and cash equivalents, which consist of short-term investments, including commercial paper, are only invested in governments and corporations with an investment grade credit rating. Credit risk is further reduced by limiting the amount that is invested in any one government or corporation. In the normal course of business, the Company is exposed to credit risk from its customers, substantially all of which are in the automotive industry. The Company is also exposed to credit risk from the potential default by any of its counterparties on the Company’s foreign exchange forward contracts. The Company mitigates this credit risk by dealing with counterparties that are major financial institutions which it anticipates will satisfy their obligations under the contracts.
INTEREST RATE RISK
Where the maturity of monetary assets and liabilities are short term, the Company is not exposed to interest rate risk. In the case of monetary liabilities and operating lease commitments with longer-term maturities, the Company may enter into swap arrangements to manage this risk.
The following table summarizes the Company’s interest rate risk as at December 31, 2003:
| | Floating
rate | | Fixed
rate | | Non-interest
bearing | | Total | |
| | | | | | | | | |
Financial Assets: | | | | | | | | | |
Cash and cash equivalents | | $ | 216.7 | | $ | — | | $ | — | | $ | 216.7 | |
Accounts receivable | | — | | — | | 810.7 | | 810.7 | |
Financial liabilities: | | | | | | | | | |
Bank indebtedness | | (29.7 | ) | — | | — | | (29.7 | ) |
Accounts payable and all other accrued
liabilities and payables | | — | | — | | (1,010.0 | ) | (1,010.0 | ) |
Long-term debt due within one year | | — | | (4.4 | ) | — | | (4.4 | ) |
Long-term debt | | — | | (33.0 | ) | — | | (33.0 | ) |
Convertible Series Preferred Shares | | — | | (214.7 | ) | — | | (214.7 | ) |
Other long-term liabilities | | (32.6 | ) | — | | — | | (32.6 | ) |
| | $ | 154.4 | | $ | (252.1 | ) | $ | (199.3 | ) | $ | (297.0 | ) |
Average fixed rate of long-term debt | | | | 5.0 | % | | | | |
19
The Company has entered into interest rate swap contracts to manage interest rate risk on certain of its operating leases. These contracts swap floating interest rate payments to fixed interest rate payments or vice versa. Outstanding swap contracts have remaining terms equal to maturity of the operating leases that they are matched against.
The following table provides a summary of interest rate swap contracts and their aggregated weighted average rates at December 31:
| | 2003 | | 2002 | |
| | | | | |
Interest rate swap: | | | | | |
Notional amount | | $ | 39.7 | | $ | — | |
Average fixed rate paid | | 4.02 | % | — | |
Average floating rate received | | 2.77 | % | — | |
| | | | | | | |
ELECTRICITY SWAPS
The Company uses electricity swap contracts to manage the cash flow risk for a portion of its forecast electricity purchases in Ontario over the period to April 2005. Swaps outstanding at December 31, 2003 have an annual notional energy volume of 50,700 megawatt hours (“MWh”) under which it pays a weighted average fixed price of $54.53 per MWh and receives a floating average price per MWh based on the hourly Ontario energy price. The net settlements under the electricity swap contracts are recognized in the same period as, and as part of, the hedged transaction. The Company does not enter into electricity swap contracts for speculative purposes.
The Company estimates the fair value of these electricity contracts as at December 31, 2003 is $0.2 million, representing a financial benefit to the Company. In 2002, the Ontario government passed legislation, which fixes the electricity price for low volume and designated customers. Although the Company is not directly affected by the legislation, this has disrupted the forward market for Ontario electricity contracts and significantly reduced liquidity. The Company has estimated fair value based on available broker quotes but given the current illiquidity of the market, the fair value is subject to significant measurement uncertainty.
Transactions with Related Parties
Years ended December 31 | | 2003 | | 2002 | | 2001 | |
| | | | | | | |
Charges by Magna and other related parties | | | | | | | |
Interest expense, net | | $ | 1.5 | | $ | 2.1 | | $ | 17.7 | |
Amortization of discount on Convertible Series Preferred Shares | | $ | 12.4 | | $ | 11.6 | | $ | 4.8 | |
Financing charge on Convertible Series Preferred Shares | | $ | 1.1 | | $ | 1.9 | | $ | 0.9 | |
Management and administrative services | | $ | 3.6 | | $ | 1.9 | | $ | 4.7 | |
Affiliation and social fees | | $ | 62.6 | | $ | 55.3 | | $ | 48.8 | |
Rent | | $ | 12.5 | | $ | 10.8 | | $ | 6.1 | |
Depreciation of assets under capital lease | | $ | 1.6 | | $ | 1.8 | | $ | 1.7 | |
Sales of materials to Magna and other related parties | | $ | 14.5 | | $ | 13.9 | | $ | 13.7 | |
Purchases of materials from Magna and other related parties | | $ | 21.8 | | $ | 22.8 | | $ | 28.6 | |
On December 19, 2003, the Company entered into a purchase and sale agreement with Magna, whereby the Company agreed to acquire the capital assets for a new line of business for $2.1 million. In consideration of the Company purchasing the business and incurring costs in connection with the relocation of the acquired assets and revalidating the business, Magna agreed to pay the Company $7.4 million for these incremental costs.
20
During 2001, the Company entered into new or amended existing affiliation agreements with Magna that were effective January 1, 2001. The affiliation agreements provide for the payment by the Company to Magna of an affiliation fee. The affiliation agreements:
• provide the Company with the right to identify itself as part of the Magna group of companies by granting the Company a nonexclusive, worldwide licence to use trademarks which identify Magna and its goods, services and activities in order to identify the Company and its goods, services and activities as being affiliated with Magna;
• provide the Company with access to Magna’s core operating principles and to new policies and programs adopted by Magna from time to time;
• provide the Company with access to Magna’s senior management and make available to the Company details of any new management techniques and incentive programs as well as marketing materials to the extent they are made available generally to Magna’s other affiliates; and
• grant the Company a sole and exclusive worldwide licence (except as described in the next sentence) to use the Intier trade name and certain other trademarks. The Company may not sublicense such trade name and trademarks other than to its subsidiaries.
Pursuant to the Company’s affiliation agreements with Magna, the affiliation fees payable by the Company to Magna in respect of each fiscal year will be an aggregate amount equal to:
• 1.5% of the first $3 billion of consolidated net sales for that year;
• 1.0% of the next $3 billion of consolidated net sales for that year; and
• 0.75% of consolidated net sales exceeding $6 billion.
Sales from acquired businesses will not be subject to a fee until January 1 of the year following the date of acquisition, and will be subject to a fee equal to 50% of the fee with respect to the acquired business’ sales in the calendar year following the date of the acquisition, and to the full fee in the second calendar year following the date of the acquisition and thereafter.
The Company’s Corporate Constitution provides that a maximum of 2% of its pre-tax profits in each fiscal year shall be allocated to the promotion of social objectives. Of this maximum, the social commitment agreement the Company entered into with Magna during the year ended December 31, 2001, effective January 1, 2001, requires the Company to contribute 1.5% of its pre-tax profits in each fiscal year to social and charitable programs coordinated by Magna or other charitable or non-profit organizations on behalf of Magna and other related parties, including Intier.
Magna provides certain management and administrative services to the Company, including legal, environmental, immigration, administrative, tax, internal audit, treasury, information systems and employee relations’ services, in return for a specific amount negotiated between the Company and Magna.
Various land and buildings used in the Company’s operations are leased from MID under operating and capital lease agreements (see Note11 to the consolidated financial statements).
Transactions with Magna and other related parties are effected on normal commercial terms.
Contingencies
On August 16, 2002, the Company was served with a complaint issued in the United States District Court, District of Massachusetts by Stoneridge Control Devices, Inc. which was a supplier of adjunct actuators to the Company. After months of unsuccessful pricing negotiations, the Company advised Stoneridge that it would not be extending its long-term agreement which expired on July 31, 2002, and that such adjunct actuators would thereafter be manufactured by the Company. In this action Stoneridge is alleging that the Company:
• breached certain agreements with Stoneridge which obliged the Company to purchase all of its adjunct actuator requirements from Stoneridge for the life of certain customer programs;
• made certain misrepresentations to Stoneridge that it was not developing and producing adjunct actuators itself and that it intended to purchase Stoneridge’s adjunct actuator for the life of the programs;
21
• unlawfully used Stoneridge’s trade secrets and proprietary information; and
• violated Massachusetts General Laws c93A, the Massachusetts unfair business practices legislation.
Stoneridge’s Initial Disclosure dated November 17, 2003, claims that Stoneridge’s damages are over $25 million. The Company disputes the allegations contained in the complaint and does not believe it has any liability for these claims, although the Company cannot provide any assurance that this will be the case.
In the ordinary course of business activities, the Company may be contingently liable for litigation and claims with customers, suppliers and former employees and for environmental remediation costs. Management believes that adequate provisions have been recorded in the accounts where required. Although it is not possible to estimate the extent of potential costs and losses, if any, management believes, but can provide no assurance that the ultimate resolution of such contingencies would not have a material adverse effect on the financial position and results of operations of the Company. Please refer to Note 22 “Contingencies” in the 2003 audited consolidated financial statements included in the Company’s 2003 Annual Report.
The Company has a number of arrangements in Canada, the United States, the United Kingdom and Europe which provide pension and post retirement benefits to its retired and current employees. Pension arrangements include statutory pension plans as well as similar arrangements, which provide pension benefits as required by statute. The Company has obligations under its defined benefit pension plans and other statutory plans. Unfunded unrecognized net actuarial gains and losses are amortized and charged to earnings over the average remaining service period of active employees. All pension plans and similar arrangements are funded to the minimum legal funding requirement. In certain plans, there is no legal requirement to fund the obligation until such time as they are actually incurred and as a result these arrangements are unfunded. In the event that any of these plans are terminated or wound up, an immediate payment of unfunded amounts may be required and these amounts could materially exceed the current unfunded position.
Accounting Changes
In accordance with the Canadian Institute of Chartered Accountants (“CICA”) amended Handbook Section 3870 “Stock-Based Compensation and Other Stock-Based Payments” (“CICA 3870”), effective January 1, 2003, the Company prospectively adopted without restatement of any comparable period the fair value method for recognizing compensation expense for fixed price stock options. As a result, for the year ended December 31, 2003, the Company recognized compensation expense of $0.6 million. For awards granted prior to January 1, 2003, the Company continues to use the intrinsic value method.
New Accounting Pronouncements
CANADIAN GAAP STANDARDS
In 2003, the CICA issued Emerging Issues Committee Abstract No. 142, “Revenue Arrangements with Multiple Deliverables” (“EIC-142”), which provides guidance on accounting by a vendor for arrangements involving multiple deliverables. It specifically addresses how a vendor determines whether an arrangement involving multiple deliverables contains more than one unit of accounting and also addresses how consideration should be measured and allocated to the separate units of accounting in the arrangement. The guidance in EIC-142 is applicable for revenue arrangements with multiple deliverables entered into by the Company on or after January 1, 2004. Although the Company is currently reviewing EIC-142, the impact of this Abstract, if any, on the Company’s consolidated financial statements has not been determined.
In 2003, the CICA issued Handbook Section 3110, “Asset Retirement Obligations”, which establishes standards for the recognition, measurement and disclosure of asset retirement obligations and the related asset retirement costs. This new Section is effective for the Company’s 2004 fiscal year and harmonizes Canadian requirements with existing U.S. GAAP. The adoption of this Section on January 1, 2004 is expected to result in the cumulative effect of an accounting change of $4.1 million being recognized as a charge to opening retained earnings, the recognition of a liability of $10.0 million, the recognition of an other asset of $4.8 million and the recognition of a future tax asset of $1.1 million.
22
In 2003, the CICA issued Accounting Guideline AcG-15, “Consolidation of Variable Interest Entities” to provide guidance for applying the principles in Handbook Section 1590, “Subsidiaries”, to certain entities. Although the CICA is contemplating amendments to the Guideline, it is expected to be effective for the Company’s 2005 fiscal year. Although the Company is currently reviewing AcG-15, the impact of the Guideline, if any, on the Company’s consolidated financial statements has not been determined.
In 2003, the CICA finalized amendments to Accounting Guideline AcG-13, “Hedging Relationships”, that clarified certain of the requirements in AcG-13 and provided additional application guidance. AcG-13 is applicable for the Company’s 2004 fiscal year. The Company does not expect the adoption of this Guideline to have a material impact on its consolidated financial statements.
U.S. GAAP STANDARDS
In 2003, the Financial Accounting Standards Board (“FASB”) finalized Emerging Issues Task Force Abstract No. 00-21 (“EITF 00-21”), “Revenue Arrangements with Multiple Deliverables”. The guidance in this Abstract is consistent with the guidance in EIC-142, which was recently issued by CICA. The guidance in EITF 00-21 is applicable for revenue arrangements with multiple deliverables that the Company enters into on or after January 1, 2004.
In 2003, the FASB amended Interpretation No. 46, “Consolidation of Variable Interest Entities” (“FIN 46R”). FIN 46R requires that a variable interest entity (“VIE”) be consolidated by a company if that company is subject to a majority of the risk of loss from the VIE’s activities and/or is entitled to receive a majority of the VIE’s residual returns. For the Company, the requirements of FIN 46R apply in 2003 for all VIEs created after January 31, 2003. For VIEs created before January 31, 2003, the requirements of FIN 46 apply as of December 31, 2004 for a VIE that does not meet the definition of a special-purpose entity (“SPE”) and as of January 1, 2004 for a VIE that is an SPE.
Although the Company is currently reviewing EITF 00-21 and FIN 46R, the impact, if any, of these pronouncements on the Company’s consolidated financial statements has not been determined.
Subsequent Events
Subsequent to December 31, 2003, the Company sold one of its manufacturing facilities reported in the European Interior Systems segment. The impact to the Company will be a charge to operating income and net income of approximately $4 million and $6 million, respectively.
Maximum Number of Shares
The following table presents the maximum number of Class A Subordinate Voting and Class B Shares that would be outstanding if all of the outstanding options and Convertible Series Preferred Shares issued and outstanding as at January 31, 2004 were exercised or converted:
| | Number of Shares | |
| | | |
Class A Subordinate Voting Shares outstanding | | 6,444,961 | |
Class B Shares outstanding | | 42,751,938 | |
Options to purchase Class A Subordinate Voting Shares | | 3,545,600 | |
Convertible Series Preferred Shares, convertible at $15.09 per share | | 14,648,775 | |
| | 67,391,274 | |
23
Additional Information
Additional information relating to the Company, including the Company’s Annual Information Form is available on SEDAR at www.sedar.com.
Forward-Looking Statements
The previous discussion contains statements which, to the extent that they are not recitations of historical facts, constitute “forward-looking statements” within the meaning of Section 21E of the Securities Exchange Act of 1934. The words “estimate”, “anticipate”, “believe”, “expect”, and similar expressions are intended to identify forward-looking statements. Such forward-looking information involves important risks and uncertainties that could materially alter results in the future from those expressed in any forward-looking statements made by, or on behalf of the Company. These risks and uncertainties include, but are not limited to industry cyclicality, trade costs, dependence on certain vehicles and major OEM customers, program launch delays, foreign exchange rate and currency exposure, failure in implementing Company strategy, technological developments by the Company’s competitors, government and regulatory policies and changes in the competitive environment in which the Company operates. Persons reading this report are cautioned that such statements are only predictions and that actual events or results may differ materially. In evaluating such forward-looking statements readers should specifically consider the various factors which could cause actual events or results to differ materially from those indicated by such forward-looking statements. The Company expressly disclaims any intention and undertakes no obligation to update or revise any forward-looking statements contained in this report to reflect subsequent information, events or circumstances or otherwise.
24