SECURITIES AND EXCHANGE COMMISSION
x ANNUAL REPORT PURSUANT TO SECTION 13 OR 15(d) OF THE SECURITIES EXCHANGE ACT
OF 1934
For the fiscal year ended December 31, 2008
¨ TRANSITIONAL REPORT UNDER SECTION 13 OR 15(d) OF THE SECURITIES EXCHANGE
ACT OF 1934
For the transition period from _______ to _______.
COMMISSION FILE NUMBER 000-32985
WACCAMAW BANKSHARES, INC.
(Exact name of registrant as specified in its charter)
| NORTH CAROLINA | | 52-2329563 |
| (State or Other Jurisdiction of | | (I.R.S. Employer |
| Incorporation or Organization) | | Identification No.) |
110 NORTH J. K. POWELL BOULEVARD | | |
| WHITEVILLE, NORTH CAROLINA | | 28472 |
| (Address of Principal Executive Offices) | | (Zip Code) |
Registrant’s Telephone number, including area code: (910) 641-0044
Securities registered pursuant to Section 12(b) of the Act
NONE
Securities registered pursuant to Section 12(g) of the Act:
COMMON STOCK, NO PAR VALUE
Indicate by check mark if the registrant is a well-known seasoned issuer, as defined in Rule 405 of the Securities Act. ¨ Yes x No
Indicate by check mark if the registrant is not required to file reports pursuant to Section 13 or Section 15(d) of the Act. ¨ Yes x No
Note – Checking the box above will not relieve any registrant required to file reports pursuant to Section 13 or Section 15(d) of the Exchange Act from their obligations under those Sections.
Indicate by check mark whether the registrant (1) has filed all reports required to be filed by Section 13 or 15(d) of the Securities Exchange Act of 1934 during the preceding 12 months (or for such shorter period that the registrant was required to file such reports), and (2) has been subject to such filing requirements for the past 90 days.
x Yes ¨ No
Indicate by check mark if disclosure of delinquent filers pursuant to Item 405 of Regulation S-K is not contained herein, and will not be contained, to the best of the registrant’s knowledge, in definitive proxy or information statements incorporated by reference in Part III of this Form 10-K or any amendment to this Form 10-K x
Indicate by check mark whether the registrant is a large accelerated filer, an accelerated filer, or a non-accelerated filer. See definition of “accelerated filer and large accelerated filer” in Rule 12b-2 of the Exchange Act. (Check one):
| | Large accelerated filer ¨ | Accelerated filer ¨ |
| | | |
| | Non-accelerated filer (Do not check if | |
| | a smaller reporting company) ¨ | Smaller reporting company x |
Indicate by check mark whether the registrant is a shell company (as defined in Rule 12b-2 of the Act):
¨ Yes x No
The aggregate market value of the voting and non-voting common equity held by non-affiliates of the Registrant, based on the closing sales price of the Registrant’s Common Stock reported on the NASDAQ Global Select Market on June 30, 2008 was $42,488,115. Solely for purposes of this calculation, the term “affiliate” includes all directors and executive officers of the Registrant and all beneficial owners of more than 5% of the Registrant’s voting securities.
As of March 20, 2009, the Registrant had outstanding 5,523,549 shares of Common Stock.
Documents Incorporated by Reference.
The Registrant’s Annual Report to stockholders for the fiscal year ended December 31, 2008
Registrant’s Proxy Statement for the 2009 Annual Meeting of Stockholders
FORM 10-K CROSS-REFERENCE INDEX
| PART I | FORM 10-K | PROXY STATEMENT | ANNUAL REPORT |
| | | | |
| Item 1 – Business | 2 | | |
| Item 1A – Risk Factors | 7 | | |
| Item 1B – Unresolved Staff Comments | 7 | | |
| Item 2 – Properties | 7 | | |
| Item 3 – Legal Proceedings | 8 | | |
Item 4 – Submission of Matters to a Vote Of Security Holders | 8 | | |
| | | | |
| PART II | | | |
| | | | |
| Item 5–Market for Registrant’s Common Equity, Related Stockholder Matters and Issuer Purchases of Equity Securities | 9 | | |
| Item 6 – Selected Financial Data | 10 | | |
| Item 7 – Management’s Discussion and Analysis of Financial Condition and Results of Operations | | | 11 |
| Item 7A – Quantitative and Qualitative Disclosures About Market Risk | | | 11 |
| Item 8 – Financial Statements and Supplementary Data | | | 12 |
| Item 9 – Changes in and Disagreements with Accountants on Accounting and Financial Disclosures | 12 | | |
| Item 9A – Controls and Procedures | 12 | | |
| Item 9B – Other Information | 13 | | |
| | | | |
| PART III | | | |
| | | | |
| Item 10 – Directors, ExecutiveOfficers and Corporate Governance | 14 | 14 | |
| Item 11 – Executive Compensation | | 14 | |
| Item 12 – Security Ownership of Certain Beneficial Owners and Management and Related Stockholder Matters | | 14 | |
| Item 13 – Certain Relationships and Related Transactions, and Director Independence | | 14 | |
| Item 14 – Principal Accounting Fees and Services | | 14 | |
| | | | |
| PART IV | | | |
| | | | |
| Item 15 – Exhibits, Financial Statement Schedules | 15 | | |
PART 1
ITEM 1 – BUSINESS
General
Waccamaw Bankshares, Inc. (the “Company”) was formed during 2001 as a financial holding company chartered in the state of North Carolina. On July 1, 2001, the Company acquired all the outstanding shares of Waccamaw Bank (the “Bank”) in a tax-free exchange. To date, the only business activities of the Company consist of the activities of the Bank.
Waccamaw Bank was organized and incorporated under the laws of the State of North Carolina on August 28, 1997 and commenced operations on September 2, 1997. The Bank currently serves Columbus County, North Carolina and surrounding areas through three banking offices, Brunswick County through seven banking offices, New Hanover County through one banking office, Bladen County through one banking office, and Lancaster County, South Carolina through one banking office and Horry County through four banking offices. As a state chartered bank which is a member of the Federal Reserve, the Bank is subject to regulation by the Commissioner of Banks and the Federal Reserve.
Location and Service Area
The Company’s primary service area is Columbus, Brunswick, Bladen and New Hanover Counties of North Carolina and Lancaster and Horry Counties of South Carolina. The principal business of the Company is to provide comprehensive individual and corporate banking services through its main service area. These services include demand and time deposits as well as commercial, installment, mortgage and other consumer lending services that are traditionally available from community banks.
Columbus County is located in the southeastern portion of North Carolina near the South Carolina border. Whiteville, the largest city in the county is approximately 45 miles west of Wilmington, North Carolina, 150 miles southeast of Charlotte, North Carolina, and 45 miles north of Myrtle Beach, South Carolina. These cities all have national or regional airports.
Brunswick County is adjacent to Columbus County to the southeast and also borders South Carolina. Shallotte, the largest city in the county, is approximately 35 miles southwest of Wilmington and 35 miles northeast of Myrtle Beach.
New Hanover County is a coastal county and adjacent to Brunswick County to the north. Wilmington, the largest city in the county, has a diversified economy which includes shipping, manufacturing, medical and retail industries.
Bladen County is adjacent to Columbus County to the northeast. Elizabethtown, the largest city in the county is approximately 50 miles northwest of Wilmington and 80 miles northwest of Myrtle Beach.
Lancaster County is located near the mid part of the state near the North Carolina border and approximately 40 miles south of Charlotte, NC and fifty miles north of Columbia. These cities all have national or regional airports.
Horry County is located in the northeastern portion of South Carolina near the North Carolina border. Myrtle Beach, the largest city in the county, has a diversified economy which includes tourism, manufacturing, medical and retail industries.
The principle components of the economy are manufacturing, agriculture and tourism. Manufacturing employment is concentrated in the wood products and textile industries. The primary agriculture products are tobacco and hogs.
Competition
The primary business activity of the Company is commercial banking. This activity is conducted by the Bank which is the wholly-owned subsidiary of the Company.
Banking is a highly competitive industry. The principal areas and methods of competition in the banking industry are the services that are offered, the pricing of those services, the convenience and availability of the services and the degree of expertise and personal manner with which those services are offered. The Bank encounters strong competition from other commercial banks, including the largest North Carolina banks, operating in the Bank’s market area. There are 14 offices of 5 other commercial banks operating in Columbus County, 44 offices of 11 other commercial banks operating in Brunswick County, 77 offices of 17 other commercial banks operating in New Hanover County, 8 offices of 5 other commercial banks operating in Bladen County, 8 offices of 4 other commercial banks operating in Lancaster County and 104 offices of 18 other commercial banks operating in Horry County. In the conduct of certain aspects of its business, the Bank also competes with credit unions, money market mutual funds, and other non-bank financial institutions, some of which are not subject to the same degree of regulation as the Bank. Many of these competitors have substantially greater resources and lending abilities than the Company and offer certain services, such as investment banking, trust, interstate and international banking services, that the Company cannot or will not provide.
Supervision and Regulation
The Company and the Bank are subject to state and federal banking laws and regulations. These impose specific requirements and restrictions and provide for general regulatory oversight with respect to virtually all aspects of operations. These laws and regulations are generally intended to protect depositors, not Stockholders. To the extent that the following summary describes statutory or regulatory provisions, it is qualified in its entirety by reference to the particular statutory and regulatory provisions. Any change in applicable laws or regulations may have a material effect on the business and prospects of the Company. Beginning with the enactment of the Financial Institutions Reform, Recovery and Enforcement Act of 1989 ("FIRREA") and following with the Federal Deposit Insurance Corporation Improvement Act ("FDICIA"), enacted in 1991, numerous additional regulatory requirements have been placed on the banking industry in the past five years, and additional changes have been proposed. The operations of the Company and the Bank may be affected by legislative changes and the policies of various regulatory authorities. The Company is unable to predict the nature or the extent of the effect on its business and earnings that fiscal or monetary policies, economic control, or new federal or state legislation may have in the future.
Federal Bank Holding Company Regulation (Financial Holding Company Regulations)
The Company is a financial holding company within the meaning of the Gramm-Leach-Bliley Act of 1999 (the "GLB Act"). Under the GLB Act, which became effective on March 11, 2000, the types of activities in which a bank holding company may engage were significantly expanded. Subject to various limitations, the GLB Act generally permits a bank holding company to elect to become a "financial holding company". A financial holding company may affiliate with securities firms and insurance companies and engage in other activities that are "financial in nature." Among the activities that are deemed "financial in nature" are, in addition to traditional lending activities, securities underwriting, dealing in or making a market in securities, sponsoring mutual funds and investment companies, insurance underwriting and agency activities, certain merchant banking activities and activities that the Federal Reserve considers to be closely related to banking.
A bank holding company may become a financial holding company under the GLB Act if each of its subsidiary banks is "well capitalized" under the Federal Deposit Insurance Corporation Improvement Act prompt corrective action provisions, is well managed and has at least a satisfactory rating under the Community Reinvestment Act. In addition, the bank holding company must file a declaration with the Federal Reserve if it falls out of compliance with these requirements and may be required to cease engaging in some of its activities.
Under the GLB Act, the Federal Reserve serves as the primary "umbrella" regulator of financial holding companies, with supervisory authority over each parent company and limited authority over its subsidiaries. Expanded financial activities of financial holding companies generally will be regulated according to the type of such financial activity, banking activities by banking regulators, securities activities by securities regulators and insurance activities by insurance regulators. The GLB Act also imposes additional restrictions and heightened disclosure requirements regarding information collected by financial institutions.
The Company is also still subject to the Bank Holding Company Act (the "BHCA"). Under the BHCA, the Company is subject to periodic examination by the Federal Reserve and is required to file periodic reports of its operations and such other information as the Federal Reserve may require.
Investments, Control, and Activities. With certain limited exceptions, the BHCA requires every holding company to obtain the prior approval of the Federal Reserve before (i) acquiring substantially all the assets of any bank, (ii) acquiring direct or indirect ownership or control of any voting shares of any bank if after such an acquisition it would own or control more than 5% of the voting shares of such bank (unless it already owns or controls the majority of such shares), or (iii) merging or consolidating with another holding company.
In addition, and subject to certain exceptions, the BHCA and the Change in Bank Control Act, together with regulations there under, require Federal Reserve approval (or, depending on the circumstances, no notice of disapproval) prior to any person or company acquiring "control" of a holding company, such as the Company. Control is conclusively presumed to exist if an individual or company acquires 25% or more of any class of voting securities of the holding company. In the case of the Company, under Federal Reserve regulations control will be rebuttable presumed to exist if a person acquires at least 10% of the outstanding shares of any class of voting securities.
Source of Strength; Cross-Guarantee. In accordance with Federal Reserve policy, the Company is expected to act as a source of financial strength to the Bank and to commit resources to support the Bank in circumstances in which the Company might not otherwise do so. Under the BHCA, the Federal Reserve may require a holding company to terminate any activity or relinquish control of a nonbank subsidiary (other than a nonbank subsidiary of a bank) upon the Federal Reserve's determination that such activity or control constitutes a serious risk to the financial soundness or stability of any subsidiary depository institution of the bank holding company. Further, federal bank regulatory authorities have additional discretion to require a holding company to divest itself of any bank or nonbank subsidiary if the agency determines that divestiture may aid the depository institution's financial condition. The Bank may be required to indemnify, or cross-guarantee, the FDIC against losses it incurs with respect to any other bank which the Company controls, which in effect makes the Company's equity investments in healthy bank subsidiaries available to the FDIC to assist any failing or failed bank subsidiary of the Company. The Bank is the only bank currently controlled by the Company.
The Bank
The Company is the holding company for the Bank, which is a North Carolina banking corporation. Substantially all Company revenues are earned through the operations of the Bank. The Bank is subject to examination and supervision by the Federal Reserve and the North Carolina Commissioner of Banks (the “Commissioner”). The Federal Reserve monitors the Bank’s compliance with several federal statutes such as the Community Reinvestment Act of 1977 and the Interlocks Act. The Federal Reserve has broad enforcement authority to prevent the continuance or development of unsafe and unsound banking practices, including the issuance of cease and desist orders and the removal of officers and directors. The Federal Reserve must approve the establishment of branch offices, conversions, and mergers, assumptions of deposit liabilities between insured and uninsured institutions, and the acquisition or establishment of certain subsidiary corporations. The Federal Reserve can prevent capital or surplus diminution in such transactions where the deposit accounts of the resulting, continuing or assuring bank are federally insured.
The Bank is subject to capital requirements and limits on activities established by the Federal Reserve. Under the capital regulations, the Bank generally is required to maintain Tier 1 risk-based capital, in such terms as defined therein, of 4.0% and total risk-based capital of 8.0%. In addition, the Bank is required to provide a minimum leverage ratio Tier 1 capital to adjusted average quarterly assets (leverage ratio) equal to 3.0%, plus an additional cushion of one to two percent if the Bank has less than the highest regulatory rating. The Bank is not permitted to engage in any activity not permitted for a national bank unless (i) it is in compliance with its capital requirement and (ii) the FDIC determines that the activity would not pose a risk to the deposit insurance fund. With certain exceptions, the Bank also is not permitted to acquire equity investments of a type, or in an amount, not permitted for a national bank.
Federal banking law requires the federal banking agencies to take “prompt corrective action” in respect of insured depository institutions that do not meet minimum capital requirements. There are five tiers: “well capitalized”, “adequately capitalized”, “undercapitalized”, “significantly undercapitalized” and “critically undercapitalized”, as defined by regulations promulgated by the FDIC and the other federal depository institution regulatory agencies. A depository institution is well capitalized if it significantly exceeds the minimum level required by regulation for each relevant capital measure, adequately capitalized if it meets each such measure, undercapitalized if it fails to meet any such measure, significantly undercapitalized if it is below such measures, and critically undercapitalized if it fails to meet any critical capital level set forth in the regulations. The critical capital level must be a level of tangible equity capital equal to not more than 65.0% of the minimum leverage ratio prescribed by regulation. A depository institution may be deemed to be in a capitalization category that is lower than is indicated by its actual capital position if it receives an unsatisfactory examination rating.
The Bank is required to pay deposit insurance assessments set by the FDIC. Under the current assessment rate schedule, the Bank assessment will range from .05% to .43% of the Bank’s average deposit base, with the exact assessment determined by the Bank’s capital and the FDIC’s supervisory opinion of the Bank’s operations. The insurance assessments rate may change periodically. Changes in the assessment rate may have a material effect on the Bank’s operating results. The FDIC has the authority to terminate deposit insurance.
Under regulations effective January 1, 2007, the Federal Deposit Insurance Corporation adopted a new risk-based premium system that provides for quarterly assessments based on an insured institution’s ranking in one of four risk categories based upon supervisory and capital evaluations. Institutions are assessed at annual rates ranging from 5 to 43 basis points, respectively, depending on each institution’s risk of default as measured by regulatory capital ratios and other supervisory measures. Under a proposal announced by the Federal Deposit Insurance Corporation on October 7, 2008, the assessment rate schedule would be raised uniformly by seven basis points (annualized) beginning on January 1, 2009. Beginning with the second quarter of 2009, base assessment rates before adjustments would range from 10 to 45 basis points, and further changes would be made to the deposit insurance assessment system, including requiring riskier institutions to pay a larger share. The proposal would impose higher assessment rates on institutions with a significant reliance on secured liabilities and on institutions which rely significantly on brokered deposits (but, for well-managed and well-capitalized institutions, only when accompanied by rapid asset growth). The proposal would reduce assessment rates for institutions that hold long-term unsecured debt and, for smaller institutions, high levels of Tier 1 (defined below) capital.
On February 27, 2009 the FDIC voted to amend the restoration of the Deposit Insurance Fund. The Board took action by imposing a special assessment on insured institutions of 20 basis points, implementing changes to the risk- based assessment system, and increased regular premium rates for 2009, which banks must pay on top of the special assessment. The 20 basis point special assessment on the industry will be as of June 30, 2009, payable September 30, 2009. As a result of the special assessment and increased regular assessments the Company projects it will experience an increase in FDIC assessment by approximately $1.0 million from 2008 to 2009. The 20 basis point special assessment represents $928,000 of this increase.
On March 5, 2009, the FDIC Chairman announced that the FDIC intends to lower the special assessment from 20 basis points to 10 basis points. The approval of the cutback is contingent on whether Congress clears legislation that would expand the FDIC’s line of credit with the Treasury to $100 billion. Legislation to increase the FDIC’s borrowing authority on a permanent basis is also expected to advance to Congress, which should aid in reducing the burden on the industry. The assessment rates, including the special assessment, are subject to change at the discretion of the Board of Directors of the FDIC.
The earnings of the Bank are affected significantly by the policies of the Federal Reserve Board, a federal agency which regulates the money supply in order to mitigate recessionary and inflationary pressures. Among the techniques used to implement these objectives are open market transactions in United States government securities, changes in the rate paid by banks on bank borrowings, and changes in reserve requirement against bank deposits. These techniques are used in varying combinations to influence overall growth and distribution of bank loans, investments, and deposits, and their use may also affect interest rates charged on loans or paid on deposits.
The monetary policies of the Federal Reserve Board have had a significant effect on the operating results of commercial banks in the past and are expected to continue to do so in the future. In view of changing conditions in the national economy and money markets, as well as the effect of actions by monetary and fiscal authorities, no prediction can be made as to possible future changes in interest rates, deposit levels, loan demand or the business and earnings of the Bank.
The Bank is chartered by the State of North Carolina and is subject to extensive supervision and regulation by the Commissioner. The Commissioner enforces state laws that set specific requirements for bank capital, the payment of dividends, loans to officers and directors, record keeping, and types and amounts of loans and investments made by commercial banks. Among other things, the approval of the Commissioner is generally required before a North Carolina chartered commercial bank may establish branch offices. North Carolina banking law requires that any merger, liquidation or sale of substantially all of the assets of the Bank must be approved by the Commissioner and the holders of two-thirds of the Bank’s outstanding common stock.
Pursuant to North Carolina banking laws, no person may directly or indirectly purchase or acquire voting stock of the Bank which would result in the change of control of the Bank unless the Commissioner has approved the acquisition. A person will be deemed to have acquired “control” of the Bank if that person directly or indirectly (i) owns, controls or has power to vote 10% or more of the voting stock of the Bank, or (ii) otherwise possesses the power to direct or cause the direction of the management and policy of the Bank.
In its lending activities, the Bank is subject to North Carolina usury laws which generally limit or restrict the rates of interest, fees and charges and other terms and conditions in connection with various types of loans.
North Carolina banking law requires that bank holding companies register with the Commissioner. The Commissioner must also approve any acquisition of control of a state-chartered bank by a bank holding company.
In 1994, Congress adopted new legislation which generally permits an adequately capitalized and managed bank holding company to acquire control of a bank in any state, subject to certain state law requirements. North Carolina banking law has been amended to authorize banking organizations in any state to acquire North Carolina banking institutions on a reciprocal basis. North Carolina banking law authorizes North Carolina banks to establish branches in other states and permits out-of-state banks to establish branches in North Carolina on a reciprocal basis. The overall effect of this legislation will increase competition in the banking industry in North Carolina, however, the State of South Carolina does not allow North Carolina chartered banks to establish branches in South Carolina. As a result, North Carolina chartered banks may only establish offices within the State of South Carolina through acquisitions of existing South Carolina institutions effected in compliance with South Carolina banking law.
Material Customers
Deposits are derived from a broad base of customers in the Company’s trade area. No material portion of deposits has been obtained from a single person or a group of persons. Management does not believe the loss of any one customer would have a material adverse effect on the business of the Company.
The majority of loans and commitments to extend credit have been granted to customers in the Company’s market area. The majority of such customers are depositors. The Bank generally does not extend credit to any single borrower or group of related borrowers in excess of approximately $4.0 million.
Rights
No patents, trademarks, licenses, franchises or concessions held are of material significance to the Company.
Environmental Laws
Compliance with Federal, State, or Local provisions regulating the discharge of materials into the environment has not had, nor is it expected to have in the future, a material effect upon the Company’s capital expenditures, earnings or competitive position.
Employees
The Company had no compensated employees. The Bank presently has 148 full-time equivalent employees consisting of 140 full-time employees and 16 part-time employees.
ITEM 1A – RISK FACTORS
Not applicable due to smaller reporting company
ITEM 1B – UNRESOLVED STAFF COMMENTS
Not applicable
ITEM 2 - PROPERTIES
The Company purchased a 2.44 acre tract of real estate for $233,318 from a Company director to be used as a construction site for a banking facility. This transaction was effected at arm’s length and management believes that the purchase price was at or below fair market value. The construction was completed in April of 2001 at a cost of $1.8 million. The two story building has approximately 12,000 finished square feet. In addition to the tellers inside the building, the Bank utilizes 3 drive-up lanes and an ATM to service the need of customers.
The Bank has two additional branches in Columbus County located at 105 Hickman Road, Tabor City, North Carolina and 111 Strawberry Boulevard, Chadbourn, North Carolina. The Tabor City Branch is located in a 3,800 square foot building that includes two drive-up lanes and an ATM. The property is leased for $33,474 per year. The lease was assumed from the prior tenant and expires in 2011. The Bank has the option to extend the lease for four additional five year terms.
The Chadbourn branch is a one-story brick building with approximately 2,500 square feet of floor space that was leased following a Centura branch acquisition. The Bank has a five year lease with the option to renew for five additional terms of five years each. The branch also has drive-up facilities.
The Bank has seven branches located in Brunswick County, two in Shallotte, North Carolina, one in Holden Beach, North Carolina, two in Southport, North Carolina, one in Ocean Isle, North Carolina and one in Oak Island, North Carolina. The Shallotte Main Street branch is housed in a 2,521 square foot facility that includes two drive-up lanes and an ATM. The building is leased for a term of ten years beginning on February 1, 2000. The Bank has the option to renew the lease for three additional terms of five years.
The Shallotte Smith Street branch is housed in a 3,515 square foot facility that includes one drive-up lane and an ATM. The land and building was purchased at a cost of $2.2 million in September 2007 from BB&T.
The Holden Beach branch is housed in a 1,200 square foot facility that includes one drive-up lane and an ATM. The building is leased for a term of five years beginning on October 10, 2000. The Bank has the option to renew the lease for five additional terms of five years.
The Southport Howe Street branch is housed in a 1,860 square foot facility. The land and building are leased for a term of five years beginning on March 1, 2005. The Bank has the option to renew the lease for five additional terms of five years.
The Southport Supply Road branch is housed in a 3,858 square foot facility. The construction was completed in December 2006 at a cost of $1.2 million. The land is leased for a term of five years beginning on March 1, 2005. The Bank has the option to renew the lease for five additional terms of five years.
The Oak Island branch is housed in a 2,490 square foot facility. The land and building was purchased from BB&T at a cost of $1.5 million and has one drive-up lane and an ATM.
The Elizabethtown branch is housed in a 2,016 square foot facility. The land is leased for a term of five years beginning on November 7, 2005.
The Kerr Avenue branch in Wilmington is housed in a 3,000 square foot facility that includes two drive-up lanes and an ATM. The building is leased for a term of five years beginning on August 1, 2004. The Bank has a five year lease with the option to renew for five additional terms of five years.
The Heath Springs branch is housed in a 5,500 square foot facility. The building was purchased from The Bank of Heath Springs for $463,168.
The Ocean Isle branch is housed in a 2,982 square foot facility and has one drive-up lane and an ATM. The construction was completed in July 2007 at a cost of $921,000. The land is leased for a term of ten years beginning on March 1, 2007. The bank has the option to renew the lease for four additional terms of five years.
The Conway 16th Avenue branch is housed in a 1,350 square foot facility. The Bank has a five year lease beginning on September 1, 2006.
The Conway Medical Center branch is housed in a 1,508 square foot facility. The building was purchased for $600,000 from BB&T and has one drive-up lane and an ATM.
The Myrtle Beach branch is housed in a 2,400 square foot facility and has one drive-up lane and an ATM. The lease was assumed from BB&T and expires in 2010 with the option to renew the lease for an additional term of five years.
The Little River branch is housed in a 10,000 square foot facility and has three drive-up lanes and an ATM. The construction was completed in August 2008 at a cost of $2.7 million and the land was purchased for $990,000.
The bank has an operations center located on Madison Street in Whiteville which is housed in a 7,700 square foot facility. The building is leased for a term of seven years beginning on January 1, 2006. The Bank has the option to renew the lease for five additional terms of five years.
ITEM 3 – LEGAL PROCEEDINGS
On the normal course of business, Waccamaw Bankshares’ subsidiary, Waccamaw Bank, may be named as a party in legal disputes.
Currently, the Bank is a party to a legal proceeding arising out of a contract between Eastwood Homes Coastal Carolina, LLC, a home builder, and Landcraft Management, LLC, a developer. According to the lawsuit filed September 19, 2008, in the United States Bankruptcy Court for the Eastern District of North Carolina, Eastwood claims Landcraft did not act in a forthright manner and breached the terms of the contract. Therefore, Eastwood asserts that certain letters of credit it provided should be nullified and that it should be awarded both actual and punitive damages. The Bank has been named as a party to this suit due to a loan it provided to Landcraft. Although there is no assurance that this matter will be resolved favorably and that the Bank’s financial statements will not be adversely affected, management currently expects that there will be no material adverse effect on its financial condition or results of operations resulting from the resolution of this or any other pending legal proceeding.
ITEM 4 – SUBMISSION OF MATTERS TO A VOTE OF SECURITY HOLDERS
No matter was submitted to a vote of security holders during the fourth quarter of the fiscal year covered by this report.
PART II
ITEM 5 – MARKET FOR REGISTRANT’S COMMON EQUITY, RELATED STOCKHOLDER MATTERS AND ISSUER PURCHASES OF EQUITY SECURITIES
The Company’s articles of incorporation authorize it to issue up to 25,000,000 shares of common stock, no par value, of which 5,523,549 shares were issued and outstanding as of March 20, 2009. The stock is listed on the NASDAQ Global Market under the symbol “WBNK”.
The approximate number of holders of the Company’s shares of common stock as of March 20, 2009 is 1,900. There were 28,184 shares issued and outstanding of the Company’s Series A convertible preferred stock as of March 20, 2009.
The Board of Directors anticipates that all or substantially all of the Company’s earnings in the foreseeable future will be required for use in the development of the Company’s business. The payment of future cash dividends will be determined by the Board of Directors and is dependent upon the receipt of dividends from the Bank. To date, the Company has not paid any cash dividends.
The availability of dividends from the Bank is dependant on the Bank’s earnings, financial condition, business projections, and other pertinent factors. In addition, North Carolina banking law will prohibit the payment of cash dividends if the bank’s surplus is less than 50% of its paid-in capital. Also, under federal banking law, no cash dividend may be paid if the Bank is undercapitalized or insolvent or if payment of the cash dividend would render the Bank undercapitalized or insolvent and no cash dividend may be paid by the Bank if it is in default of any deposit insurance assessment due to the FDIC.
Set forth below are the approximate high and low (bid quotations/sales price), known to the management of the Bank, for each quarter in the last three fiscal years. These quotations reflect inter-dealer prices, without retail mark-up, mark-down, or commissions and may not represent actual transactions.
| | | 2008 | | | 2007 | | | 2006 | |
| | | High | | | Low | | | High | | | Low | | | High | | | Low | |
| First Quarter | | $ | 11.00 | | | $ | 9.25 | | | $ | 15.90 | | | $ | 14.00 | | | $ | 17.27 | | | $ | 15.91 | |
| Second Quarter | | | 9.99 | | | | 8.70 | | | | 14.75 | | | | 12.91 | | | | 16.12 | | | | 14.77 | |
| Third Quarter | | | 9.94 | | | | 6.11 | | | | 13.86 | | | | 11.69 | | | | 16.58 | | | | 13.81 | |
| Fourth Quarter | | | 9.08 | | | | 5.00 | | | | 14.00 | | | | 10.25 | | | | 16.36 | | | | 13.75 | |
See Item 12 of this report for disclosure regarding securities authorized for issuance and equity compensation plans required by Item 201(d) of Regulation S-K.
On December 20, 2006, the Company sold 65,111 units, each consisting of one share of the Company’s Series A Preferred Stock and one warrant to purchase one share of common stock at $21.82 per share (adjusted for 11 for 10 stock split in 2007). The units were sold for $17.00 each for an aggregate offering price of $1,006,264. The units were privately placed in accordance with, and in a transaction exempt from registration under the Securities Act of 1933 by, Section 4(2) of the Securities Act, Regulation D and Rule 506 hereunder. The units were sold to 20 individuals or entities, inclusive of accredited and non-accredited investors as those terms are defined by Regulation D.
The Series A Preferred Stock, issued in connection with the unit placement, are convertible to shares of common stock of the Company at the election of the holder of the Series A Preferred Stock on a date which is not before one year and one day after the units were first issued or at the election of the Company if the holders of the Preferred Stock would be afforded any voting rights under North Carolina law. The warrants may be converted into shares of common stock upon the payment by the holder of the exercise price of $21.82 per share (adjusted for 11 for 10 stock split in 2007). The warrants may be exercised at any time before 5:00 p.m., Eastern Standard Time, September 30, 2009.
ITEM 6 – SELECTED FINANCIAL DATA
| | | 2008 | | | 2007 | | | 2006 | | | 2005 | | | 2004 | |
| | | (thousands, except share data and ratios) | |
| Summary of Operations: | | | | | | | | | | | | | | | |
| Interest income | | $ | 30,485 | | | $ | 31,637 | | | $ | 25,379 | | | $ | 18,228 | | | $ | 11,450 | |
| Interest expense | | | 16,934 | | | | 16,296 | | | | 11,226 | | | | 7,536 | | | | 3,766 | |
| Net interest income | | | 13,551 | | | | 15,341 | | | | 14,153 | | | | 10,692 | | | | 7,684 | |
| Provision for loan losses | | | 2,990 | | | | 386 | | | | 1,450 | | | | 1,370 | | | | 819 | |
| Net interest income after provision | | | | | | | | | | | | | | | | | | | | |
| for loan losses | | | 10,561 | | | | 14,955 | | | | 12,703 | | | | 9,322 | | | | 6,865 | |
| Total non-interest income | | | 966 | | | | 3,443 | | | | 2,581 | | | | 2,269 | | | | 2,445 | |
| Total non-interest expense | | | 15,397 | | | | 12,440 | | | | 9,422 | | | | 6,967 | | | | 5,687 | |
| Income (loss) before income taxes | | | (3,870 | ) | | | 5,958 | | | | 5,862 | | | | 4,624 | | | | 3,623 | |
| Income tax (expense) benefit | | | 1,827 | | | | (2,049 | ) | | | (2,210 | ) | | | (1,589 | ) | | | (1,209 | ) |
| Net income (loss) | | $ | (2,043 | ) | | $ | 3,909 | | | $ | 3,652 | | | $ | 3,035 | | | $ | 2,414 | |
| | | | | | | | | | | | | | | | | | | | | |
Per Common Share Data: 1 | | | | | | | | | | | | | | | | | | | | |
| Basic income (loss) per share | | $ | (.37 | ) | | $ | .73 | | | $ | .71 | | | $ | .61 | | | $ | .49 | |
| Diluted income (loss) per share | | | (.37 | ) | | | .72 | | | | .69 | | | | .58 | | | | .47 | |
| Market Price | | | | | | | | | | | | | | | | | | | | |
| High | | | 11.00 | | | | 15.90 | | | | 17.27 | | | | 18.86 | | | | 24.68 | |
| Low | | | 5.00 | | | | 10.25 | | | | 13.75 | | | | 15.68 | | | | 9.85 | |
| Close | | | 5.01 | | | | 10.50 | | | | 14.88 | | | | 16.14 | | | | 16.36 | |
| Book value | | | 5.04 | | | | 6.44 | | | | 5.77 | | | | 4.48 | | | | 3.99 | |
| | | | | | | | | | | | | | | | | | | | | |
| Selected Average Balances: | | | | | | | | | | | | | | | | | | | | |
| Total assets | | $ | 539,468 | | | $ | 438,579 | | | $ | 356,675 | | | $ | 302,381 | | | $ | 217,035 | |
| Loans, net | | | 376,747 | | | | 332,451 | | | | 279,625 | | | | 238,579 | | | | 168,757 | |
| Securities | | | 105,819 | | | | 65,454 | | | | 46,561 | | | | 31,257 | | | | 29,068 | |
| Interest-earning assets | | | 490,883 | | | | 404,329 | | | | 331,713 | | | | 284,320 | | | | 200,982 | |
| Deposits | | | 415,711 | | | | 354,512 | | | | 298,324 | | | | 252,994 | | | | 169,162 | |
| Interest-bearing liabilities | | | 469,829 | | | | 366,266 | | | | 295,596 | | | | 256,492 | | | | 179,696 | |
| Stockholders’ equity | | | 33,460 | | | | 33,501 | | | | 25,945 | | | | 20,254 | | | | 17,941 | |
| | | | | | | | | | | | | | | | | | | | | |
| Selected Year-End Balance Sheet Data: | | | | | | | | | | | | | | | | | | | | |
| Total assets | | $ | 537,450 | | | $ | 508,368 | | | $ | 399,581 | | | $ | 322,792 | | | $ | 258,412 | |
| Loans, net | | | 378,883 | | | | 355,138 | | | | 312,253 | | | | 257,575 | | | | 206,666 | |
| Securities | | | 91,535 | | | | 102,644 | | | | 52,986 | | | | 35,214 | | | | 30,232 | |
| Interest-earning assets | | | 495,218 | | | | 458,695 | | | | 374,047 | | | | 306,987 | | | | 247,432 | |
| Deposits | | | 418,580 | | | | 378,179 | | | | 327,352 | | | | 271,035 | | | | 207,642 | |
| Interest-bearing liabilities | | | 471,122 | | | | 437,207 | | | | 315,346 | | | | 273,171 | | | | 218,592 | |
| Stockholders’ equity | | | 27,844 | | | | 35,023 | | | | 31,703 | | | | 22,499 | | | | 19,899 | |
| | | | | | | | | | | | | | | | | | | | | |
| Selected Performance Ratios: | | | | | | | | | | | | | | | | | | | | |
| Return on average assets | | | (.38 | ) % | | | .89 | % | | | 1.02 | % | | | 1.00 | % | | | 1.11 | % |
| Return on average equity | | | (6.11 | ) % | | | 11.67 | % | | | 14.07 | % | | | 14.98 | % | | | 13.46 | % |
| Net interest margin | | | 2.76 | % | | | 3.79 | % | | | 4.27 | % | | | 3.76 | % | | | 3.82 | % |
| | | | | | | | | | | | | | | | | | | | | |
| Asset Quality Ratios: | | | | | | | | | | | | | | | | | | | | |
| Nonperforming loans to period-end loans | | | 4.67 | % | | | 1.24 | % | | | .49 | % | | | 80 | % | | | 1.16 | % |
| Allowance for loan losses to period-end loans | | | 1.86 | % | | | 1.49 | % | | | 1.54 | % | | | 1.50 | % | | | 1.33 | % |
| Net loan charge-offs to average loans | | | .32 | % | | | (.03 | ) % | | | .20 | % | | | .09 | % | | | 0.15 | % |
| Capital Ratios: | | | | | | | | | | | | | | | | | | | | |
| Total risk-based capital | | | 11.68 | % | | | 10.88 | % | | | 11.82 | % | | | 12.36 | % | | | 13.64 | % |
| Tier 1 risk-based capital | | | 9.76 | % | | | 9.63 | % | | | 10.57 | % | | | 11.11 | % | | | 10.53 | % |
| Leverage ratio | | | 8.00 | % | | | 8.70 | % | | | 9.61 | % | | | 9.37 | % | | | 9.44 | % |
| Equity to assets ratio | | | 5.18 | % | | | 6.89 | % | | | 7.93 | % | | | 6.97 | % | | | 7.70 | % |
| | | | | | | | | | | | | | | | | | | | | |
| Capital Ratios: | | | | | | | | | | | | | | | | | | | | |
| | | 17 | | | | 16 | | | | 11 | | | | 8 | | | | 6 | |
| Number of full time equivalent employees | | | 148 | | | | 150 | | | | 109 | | | | 85 | | | | 73 | |
| 1 | Adjusted for the effects of 6 for 5 stock splits in 2004, 2 for 1 stock split in 2004 and 11 for 10 stock split in 2007. |
ITEM 7 – MANAGEMENT'S DISCUSSION AND ANALYSIS OF FINANCIAL CONDITION AND RESULTS OF OPERATION
The information required by this item is incorporated by reference to the Company’s 2008 annual report to stockholders.
ITEM 7A – QUANTITATIVE AND QUALITATIVE DISCLOSURES ABOUT MARKET RISK
The Company’s profitability is dependent to a large extent upon its net interest income, which is the difference between its interest income on interest-bearing assets, such as loans and investments, and its interest expense on interest-bearing liabilities, such as deposits and borrowings. The Company’s primary market risk is interest rate risk, which is the result of differing maturities or re-pricing intervals of interest-earning assets and interest-bearing liabilities with the goals of minimizing interest rate fluctuations in its net interest income. The Company does not maintain a trading account, nor is it subject to currency exchange risk or commodity price risk.
The Company’s Asset/Liability Committee (“ALCO”) meets on a monthly basis in order to assess interest rate risk, liquidity, capital and overall balance sheet management through rate shock analysis measuring various interest rate scenarios over the future 12 months. Through ALCO, the Company is able to determine fluctuations to net interest income from changes in the Prime lending rate of up to 300 basis points up or down during a 12-month period. ALCO also reviews policies and procedures related to funds management and interest rate risk based on local, national and global economic conditions along with funding strategies and balance sheet management to minimize the potential impact of earnings and liquidity from interest rate movements.
The following table presents information about the contractual maturities, average interest rates and estimated fair values of the Company’s financial instruments that are considered market risk sensitive.
Expected Maturities of Market Sensitive Instruments Held at December 31, 2008
($ in thousands)
| | | | | | | | | | | | | | | | | | Average | | | Estimated | |
| | | 1-3 | | | 4-12 | | | 13-60 | | | Over 60 | | | | | | Interest | | | Fair | |
| | | Months | | | Months | | | Months | | | Months | | | Total | | | Rate | | | Value | |
| Earning Assets: | | | | | | | | | | | | | | | | | | | | | | | | |
| Loans | | $ | 160,464 | | | $ | 47,818 | | | $ | 126,100 | | | $ | 51,689 | | | $ | 386,071 | | | | 6.39 | % | | $ | 388,586 | |
| Investments | | | 1,153 | | | | 2,030 | | | | 1,130 | | | | 87,222 | | | | 91,535 | | | | 5.98 | % | | | 91,535 | |
| Federal funds sold | | | 4,281 | | | | - | | | | - | | | | - | | | | 4,281 | | | | 1.11 | % | | | 4,281 | |
| Deposits with banks | | | 2,685 | | | | - | | | | - | | | | - | | | | 2,685 | | | | 1.60 | % | | | 2,685 | |
| Total | | | 168,583 | | | | 49,848 | | | | 127,230 | | | | 138,911 | | | | 484,572 | | | | 6.21 | % | | | 487,087 | |
| | | | | | | | | | | | | | | | | | | | | | | | | | | | | |
| Interest-bearing liabilities: | | | | | | | | | | | | | | | | | | | | | | | | | | | | |
| Demand accounts | | | 31,567 | | | | - | | | | - | | | | - | | | | 31,567 | | | | .61 | % | | | 31,567 | |
| Savings and money market | | | 82,459 | | | | - | | | | - | | | | - | | | | 82,459 | | | | 2.41 | % | | | 82,459 | |
| Time deposits | | | 90,235 | | | | 135,017 | | | | 40,818 | | | | 2,325 | | | | 268,395 | | | | 4.16 | % | | | 268,482 | |
| Repurchase agreements and Purchased funds | | | 3,830 | | | | - | | | | 20,000 | | | | - | | | | 23,830 | | | | 3.28 | % | | | 23,830 | |
| Short-term borrowings | | | 6,000 | | | | - | | | | - | | | | - | | | | 6,000 | | | | 4.33 | % | | | 6,000 | |
| Long-term debt | | | - | | | | - | | | | 33,500 | | | | 13,000 | | | | 46,500 | | | | 3.72 | % | | | 43,867 | |
| Subordinated debentures | | | 12,372 | | | | - | | | | - | | | | - | | | | 12,372 | | | | 6.31 | % | | | 7,793 | |
| Total | | $ | 226,463 | | | $ | 135,017 | | | $ | 94,318 | | | $ | 15,325 | | | $ | 471,123 | | | | 3.60 | % | | $ | 463,998 | |
ITEM 8 – FINANCIAL STATEMENTS AND SUPPLEMENTARY DATA
The following financial statements of the Company and the Report of independent registered public accounting firm set forth on pages 14 through 46 of the Company’s 2008 Annual Report to Stockholders are incorporated herein by reference:
| | 1. | Consolidated Balance Sheets as of December 31, 2008 and 2007 |
| | 2. | Consolidated Statements of Income for the years ended December 31, 2008, 2007 and 2006 |
| | 3. | Consolidated Statements of Stockholders’ Equity for the years ended December 31, 2008, 2007 and 2006 |
| | 4. | Consolidated Statements of Cash Flows for the years ended December 31, 2008, 2007 and 2006 |
| | 5. | Notes to Consolidated Financial Statements |
| | 6. | Report of Independent Registered Public Accounting Firm |
ITEM 9 – CHANGES IN AND DISAGREEMENTS WITH ACCOUNTANTS ON ACCOUNTING AND FINANCIAL DISCLOSURE
None.
| Item 9A(T). | Controls and Procedures |
Our management, under the supervision and with the participation of our Chief Executive Officer and Chief Financial Officer, has evaluated the effectiveness of the design and operation of our disclosure controls and procedures in accordance with Rule 13a-15 of the Securities Exchange Act of 1934 (the “Exchange Act”). Our management, including our Chief Executive Officer and Chief Financial Officer, identified a material weakness in our internal control over financial reporting that existed as of year-end 2008, as more fully described below in “Management’s Annual Report on Internal Control over Financial Reporting.” Solely as a result of the material weakness, our Chief Executive Officer and Chief Financial Officer concluded that, as of the end of the period covered by this report, our disclosure controls and procedures were not effective in enabling us to provide reasonable assurance that we are able to record, process, summarize and report in a timely manner the information required to be disclosed in reports we file under the Exchange Act. Nonetheless, this material weakness identified as of year end 2008 did not result in a material misstatement of any of the Company’s financial statements, including the annual and interim financial statements for 2008.
In connection with the above evaluation of our disclosure controls and procedures, no change in our internal control over financial reporting was identified that occurred during our fourth quarter of 2008 that has materially affected, or is reasonably likely to materially affect, our internal control over financial reporting. However, our management, including our Chief Executive Officer and Chief Financial Officer, is taking remedial measures to address this material weakness, as described below in “Management’s Annual Report on Internal Control over Financial Reporting.” We anticipate completion of our implementation of such remedial measures prior to the time of our next periodic filing.
MANAGEMENT’S ANNUAL REPORT
ON INTERNAL CONTROL OVER FINANCIAL REPORTING
The management of Waccamaw Bankshares, Inc. and Subsidiary (the “Company”) is responsible for establishing and maintaining adequate internal control over financial reporting. The Company’s internal control system was designed to provide reasonable assurance to the Company’s management and board of directors regarding the preparation and fair presentation of published financial statements.
All internal control systems, no matter how well designed, have inherent limitations. Therefore, even those systems determined to be effective can provide only reasonable assurance with respect to financial statement preparation and presentation. A material weakness is a deficiency, or combination of deficiencies, in internal control over financial reporting, such that there is a reasonable possibility that a material misstatement of the Company’s annual or interim financial statements will not be prevented or detected on a timely basis.
The Company’s management assessed the effectiveness of the Company’s internal control over financial reporting as of December 31, 2008. In making this assessment, it used the criteria set forth by the Committee of Sponsoring Organizations of the Treadway Commission (COSO) in Internal Control—Integrated Framework. As of December 31, 2008, the Company determined that its process for determining and reporting the fair value of certain investment securities available for sale, as well as its process for effectively analyzing certain securities for other than temporary impairment, resulted in a material weakness. This material weakness was the result of not identifying securities that were being carried at par rather than fair value, coupled with a lack of proper documentation and analysis in conjunction with our other than temporary impairment evaluation for certain securities. While the fair value of our investment securities and our conclusions as to other than temporary impairment are materially correct as reported at December 31, 2008, this material weakness, if not detected and corrected, could have impacted these determinations in the future periods.
The Company is taking steps to remediate the material weakness, including designing and implementing additional control procedures to ensure that the Company’s determination of investment fair value is performed as necessary and to properly document and evaluate other than temporary impairment as necessary.
This annual report does not include an attestation report of the Company’s registered public accounting firm regarding internal control over financial reporting. Management’s report was not subject to attestation by the Company’s registered public accounting firm pursuant to temporary rules of the Securities and Exchange Commission that permit the Company to provide only management’s report in this annual report.
ITEM 9B – OTHER INFORMATION
None.
PART III
ITEM 10 – DIRECTORS, EXECUTIVE OFFICERS AND CORPORATE GOVERNANCE
The information required by this item is incorporated by reference to the Company’s proxy statement for the 2009 Annual Meeting of Stockholders, pages 4-9, 13-14 and 19-20.
Code of Ethics
The Company’s Board of Directors has adopted a Code of Ethics that applies to its directors and to all of its executive officers, including without limitation its principal executive officer and principal financial officer. A copy of the Company’s Code of Ethics is provided at the Company’s website: www.waccamawbank.com.
ITEM 11 – EXECUTIVE COMPENSATION
The information required by this item is incorporated by reference to the Company’s proxy statement for the 2009 Annual Meeting of Stockholders, pages 10-18.
ITEM 12 – SECURITY OWNERSHIP OF CERTAIN BENEFICIAL OWNERS AND MANAGEMENT AND RELATED STOCKHOLDER MATTERS
Certain information required by this item is incorporated by reference to the Company’s proxy statement for the 2009 Annual Meeting of Stockholders, pages 3-4.
Set forth below is certain information regarding the Company’s various stock option plans.
| Plan Category | | Number of securities to be issued upon exercise of outstanding options, warrants, and rights (a) | | | Weighted-average exercise price of outstanding options, warrants, and rights (b) | | | Number of securities remaining available for future issuance under equity compensation plans (excluding securities reflected in column (a)) (c) | |
| | | | | | | | | | |
| Equity compensation plans approved by security holders | | | 329,489 | | | $ | 14.64 | | | | 679,473 | |
| | | | | | | | | | | | | |
| Equity compensation plans not approved by security holders | | None | | | None | | | None | |
| | | | | | | | | | | | | |
| Total | | | 329,489 | | | $ | 14.64 | | | | 679,473 | |
ITEM 13 – CERTAIN RELATIONSHIPS AND RELATED TRANSACTIONS, AND DIRECTOR INDEPENDENCE
The information required by this item is incorporated by reference to the Company’s proxy statement for the 2009 Annual Meeting of Stockholders, pages 6 and 9.
ITEM 14 – PRINCIPAL ACCOUNTING FEES AND SERVICES
The information required by this item is incorporated by reference to the Company’s proxy statement for the 2009 Annual Meeting of Stockholders, page 19.
PART IV
ITEM 15 – EXHIBITS, FINANCIAL STATEMENT SCHEDULES
| EXHIBIT | | |
| NUMBER | | DESCRIPTION OF EXHIBIT |
| | | |
| 3.1 | | Registrant’s Articles of Incorporation* |
| | | |
| 3.2 | | Registrant’s Bylaws* |
| | | |
| 4.1 | | Specimen Stock Certificate** |
| | | |
| 10.1 | | Employment Agreement of James G. Graham*** |
| | | |
| 10.2 | | Waccamaw Bank 1998 Incentive Stock Option Plan*** |
| | | |
| 10.3 | | Waccamaw Bank 1998 Nonstatutory Stock Option Plan*** |
| | | |
| 13 | | Annual Report to Stockholders (Filed herewith) |
| | | |
| 21 | | Subsidiaries of Registrant (Filed herewith) |
| | | |
| 23.1 | | Consent of Dixon Hughes PLLC |
| | | |
| 23.2 | | Consent of Elliott Davis, PLLC |
| | | |
| 31(i) | | Certification of Principal Executive Officer Pursuant to Section 302 of the Sarbanes Oxley Act (Filed herewith) |
| | | |
| 31(ii) | | Certification of Principal Accounting Officer Pursuant to Section 302 of the Sarbanes Oxley Act (Filed herewith) |
| | | |
| 32 | | Certification Pursuant to Section 906 of the Sarbanes Oxley Act (Filed herewith) |
| | | |
| 99 | | Registrant’s Definitive Proxy Statement**** |
| | * | Incorporated by reference from exhibits 3(i) and 3(ii) to Registrant’s Current Report on Form 8-K12g3, as filed with the Commission on July 1, 2001. |
| | ** | Incorporated by reference from exhibit 4.1 to Registrant’s Annual Report on Form 10-KSB for the year ended December 31, 2001. |
| | *** | Incorporated by reference from Exhibits 10.2, 10.3 and 10.4 to Annual Report on Form 10-KSB of Waccamaw Bank, as filed with the FDIC. |
| **** | Filed with the Commission pursuant to Rule 14a-6. |
SIGNATURES
In accordance with Section 13 or 15(d) of the Securities Exchange Act of 1934, the registrant caused this report to be signed on behalf by the undersigned, thereunto duly authorized
| | | WACCAMAW BANKSHARES, INC. |
| | | |
| March 31, 2009 | | /s/ James G. Graham |
| | | | |
| Date | | James G. Graham |
| | | President and Chief Executive Officer |
In accordance with the Exchange Act, this report has to be signed below by the following persons on behalf of the registrant and in the capacity and on the dates indicated.
| Signature | | Title | | Date |
| | | | | |
| /s/ James G. Graham | | | | |
| | | President and | | March 31, 2009 |
| James G. Graham | | Chief Executive Officer | | |
| | | | | |
| /s/ Neil C. Bender, II | | | | |
| | | Director | | March 31, 2009 |
| Neil C. Bender | | | | |
| | | | | |
| /s/ M. B. “Bo” Biggs | | | | |
| | | Director | | March 31, 2009 |
| M. B. “Bo” Biggs | | | | |
| | | | | |
| /s/ Dr. Maudie M. Davis | | | | |
| | | Director | | March 31, 2009 |
| Dr. Maudie M. Davis | | | | |
| | | | | |
| /s/ Monroe Enzor, III | | | | |
| | | Director | | March 31, 2009 |
| Monroe Enzor, III | | | | |
| | | | | |
| /s/ James E. Hill, Jr. | | | | |
| | | Director | | March 31, 2009 |
| James E. Hill, Jr. | | | | |
| | | | | |
| /s/ Alan W. Thompson | | | | |
| | | Director, Chairman | | March 31, 2009 |
| Alan W. Thompson | | of the Board | | |
| | | | | |
| /s/ Dale Ward | | | | |
| | | Director | | March 31, 2009 |
| Dale Ward | | | | |
| | | | | |
| /s/ J. Densil Worthington | | | | |
| | | Director | | March 31, 2009 |
| J. Densil Worthington | | | | |
| | | | | |
| /s/ Brian Campbell | | | | |
| | | Director | | March 31, 2009 |
| Brian Campbell | | | | |
EXHIBIT INDEX
| EXHIBIT | | |
| NUMBER | | DESCRIPTION OF EXHIBIT |
| | | |
| 3.1 | | Registrant’s Articles of Incorporation* |
| | | |
| 3.2 | | Registrant’s Bylaws* |
| | | |
| 4.1 | | Specimen Stock Certificate** |
| | | |
| 10.1 | | Employment Agreement of James G. Graham*** |
| | | |
| 10.2 | | Waccamaw Bank 1998 Incentive Stock Option Plan*** |
| | | |
| 10.3 | | Waccamaw Bank 1998 Nonstatutory Stock Option Plan*** |
| | | |
| 13 | | Annual Report to Stockholders (Filed herewith) |
| | | |
| 21 | | Subsidiaries of Registrant (Filed herewith) |
| | | |
| 23.1 | | Consent of Dixon Hughes PLLC |
| | | |
| 23.2 | | Consent of Elliott Davis, PLLC |
| | | |
| 31.1 | | Certification of Principal Executive Officer Pursuant to Section 302 of the Sarbanes Oxley Act (Filed herewith) |
| | | |
| 31.2 | | Certification of Principal Accounting Officer Pursuant to Section 302 of the Sarbanes Oxley Act (Filed herewith) |
| | | |
| 32.1 | | Certification Pursuant to Section 906 of the Sarbanes Oxley Act (Filed herewith) |
| | | |
| 99 | | Registrant’s Definitive Proxy Statement*** |
| | * | Incorporated by reference from exhibits 3(i) and 3(ii) to Registrant’s Current Report on Form 8-K12g3, as filed with the Commission on July 1, 2001. |
| | ** | Incorporated by reference from exhibit 4.1 to Registrant’s Annual Report on Form 10-KSB for the year ended December 31, 2001. |
| | *** | Incorporated by reference from Exhibits 10.2, 10.3 and 10.4 to Annual Report on Form 10-KSB of Waccamaw Bank, as filed with the FDIC. |
| **** | Filed with the Commission pursuant to Rule 14a-6. |
INTRODUCTION
Table of Contents
| Introduction | 1 |
| | |
| Statement of Mission | 2 |
| | |
| Significant Trends | 3 |
| | |
| Financial Highlights | 4 |
| | |
| Shareholder Letter | 5-6 |
| | |
| Consolidated Balance Sheets | 7 |
| | |
| Consolidated Statements of Income | 8 |
| | |
| Consolidated Statements of Changes in Stockholders' Equity | 9 |
| | |
| Consolidated Statements of Cash Flows | 10-11 |
| | |
| Notes to Consolidated Financial Statements | 12 |
| | |
| Report of Independent Registered Public Accounting Firms | 41-42 |
| | |
| Management’s Discussion and Analysis | 43 |
| | |
| Stockholder Information | 62 |
STATEMENT OF MISSION
Waccamaw Bank serves a principled mission:
• to be the strongest independent bank in the coastal Carolina region;
• to offer fairly priced products and services that meet the financial needs of our community;
• to operate in an efficient manner designed for customer convenience;
• to be a good corporate neighbor within our communities;
• to maintain safety, soundness and profitability;
• to care for a quality staff that supports this mission.
Significant Trends
Financial Highlights Summary1
| | | 2008 | | | 2007 | | | 2006 | | | 2005 | | | 2004 | |
| Summary of Operations | | | | | | | | | | | | | | | |
| | | | | | | | | | | | | | | | |
| Interest income | | $ | 30,485 | | | $ | 31,637 | | | $ | 25,379 | | | $ | 18,228 | | | $ | 11,450 | |
| Interest expense | | | (16,934 | ) | | | (16,296 | ) | | | (11,226 | ) | | | (7,536 | ) | | | (3,766 | ) |
| Net interest income | | | 13,551 | | | | 15,341 | | | | 14,153 | | | | 10,692 | | | | 7,684 | |
| | | | | | | | | | | | | | | | | | | | | |
| Provision for loan losses | | | (2,990 | ) | | | (386 | ) | | | (1,450 | ) | | | (1,370 | ) | | | (819 | ) |
| Other income | | | 966 | | | | 3,443 | | | | 2,581 | | | | 2,269 | | | | 2,445 | |
| Other expense | | | (15,397 | ) | | | (12,440 | ) | | | (9,422 | ) | | | (6,967 | ) | | | (5,687 | ) |
| Income tax (expense) benefit | | | 1,827 | | | | (2,049 | ) | | | (2,210 | ) | | | (1,589 | ) | | | (1,209 | ) |
| Net income (loss) | | $ | (2,043 | ) | | $ | 3,909 | | | $ | 3,652 | | | $ | 3,035 | | | $ | 2,414 | |
| | | | | | | | | | | | | | | | | | | | | |
Per Share Data2 | | | | | | | | | | | | | | | | | | | | |
| | | | | | | | | | | | | | | | | | | | | |
| Basic income (loss) per share | | $ | (.37 | ) | | $ | .73 | | | $ | .71 | | | $ | .61 | | | $ | .49 | |
| Diluted income (loss) per share | | | (.37 | ) | | | .72 | | | | .69 | | | | .58 | | | | .47 | |
| Book value | | | 5.04 | | | | 6.44 | | | | 5.77 | | | | 4.48 | | | | 3.99 | |
| | | | | | | | | | | | | | | | | | | | | |
| Average Balance Sheet Summary | | | | | | | | | | | | | | | | | | | | |
| | | | | | | | | | | | | | | | | | | | | |
| Loans, net | | $ | 376,747 | | | $ | 332,451 | | | $ | 279,625 | | | $ | 238,579 | | | $ | 168,757 | |
| Securities | | | 105,819 | | | | 65,454 | | | | 46,561 | | | | 31,257 | | | | 29,068 | |
| Total assets | | | 539,468 | | | | 438,579 | | | | 356,675 | | | | 302,381 | | | | 217,035 | |
| Deposits | | | 415,711 | | | | 354,512 | | | | 298,324 | | | | 252,994 | | | | 169,162 | |
| Stockholders’ equity | | | 33,460 | | | | 33,501 | | | | 25,945 | | | | 20,254 | | | | 17,941 | |
| | | | | | | | | | | | | | | | | | | | | |
| Selected Ratios | | | | | | | | | | | | | | | | | | | | |
| | | | | | | | | | | | | | | | | | | | | |
| Average equity to average assets | | | 6.20 | % | | | 7.64 | % | | | 7.27 | % | | | 6.70 | % | | | 8.27 | % |
| Return on average assets | | | (.38 | )% | | | .89 | % | | | 1.02 | % | | | 1.00 | % | | | 1.11 | % |
| Return on average equity | | | (6.11 | )% | | | 11.67 | % | | | 14.07 | % | | | 14.98 | % | | | 13.46 | % |
| 1 | In thousands of dollars, except per share data. |
| 2 | Adjusted for the effects of 6 for 5 stock split in 2004, 2 for 1 stock split in 2004 and 11 for 10 stock split in 2007. |
Shareholder Letter
Dear Shareholders, Clients, and Friends:
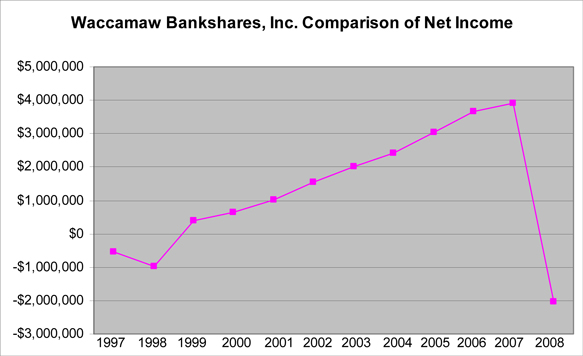
To state that the year of 2008 will long be remembered is certainly an understatement. This past year was as one of the most unprecedented years of economic turmoil in the lifetime of most active Americans. Our nation has witnessed economic events which would have been unthinkable only twelve months prior with some of the best known financial companies in America ceasing to exist as independent entities. Therefore, the financial results reported herein deviate from our nine year record of consecutive annual increases in profitability. While our financial results compare favorably to some banks in our trade area, Waccamaw Bankshares is reporting a net loss for the year. Despite these economic issues Waccamaw Bankshares, Inc., and its subsidiary Waccamaw Bank, remain quite sound and well capitalized as we look forward to putting the turmoil of 2008 behind us.
At year end, our total assets stood at $537 million and the Company is reporting an after tax net loss of $2,043,030. The Federal Government placed the Federal National Mortgage Association (Fannie Mae-FNMA), a Government Sponsored Enterprise (GSE), into conservatorship on September 7, 2008. Waccamaw owned $2 million of FNMA’s Securities, and therefore, the entire investment was considered impaired by accounting standards and was written off. Yet as of December 31, 2008, the Federal National Mortgage Association had not drawn upon one penny of the “rescue” line of credit established to “save” this Government Sponsored Enterprise. At year end another $1,383,688 of trust preferred investment securities was considered impaired due to the market value being lower than book value or Waccamaw Bank’s purchase price for a period of time and was written off as well. While recovery of all principle is possible, this action is the recognition of “Mark to Market Accounting” (MTM) standards and as a result, we will attempt to illustrate the impact of MTM for your understanding. For example, you decide to sell your house and set a price at the same time your neighbor decided to sell their home. After a period of time when no buyers were in the market, so under Mark to Market Accounting, the value of your home is zero. Does this seem logical? If you answered no, you now understand Mark to Market Accounting.
During the year, the bank expensed $2.9 million for provisional loan losses and believes the risks in the bank’s portfolio have been adequately addressed. We remain diligent in maintaining a strong credit quality as possible during these difficult times. During the year, America experienced historic interest rate reductions with prime rate falling from 7.25% to 3.25% during the year. Quite simply, our cost of funds could not be reduced quickly enough to maintain an adequate interest rate spread between the rates we charged on our loans and the cost of our deposits, therefore, the bank’s net interest margin suffered.
The five new offices which opened in 2007 and our newest office located in Little River, South Carolina which opened in 2008, are progressing toward profitability. However, profitability was not possible for any of these offices given the economic challenges of the year. Although these offices operated at a loss in 2008, we remained convinced that these offices will provide significant earnings performance in the years to come.
An expense reduction effort began in early 2008 and continued throughout the year reflecting the lower than anticipated business volume in our market. No incentive pay was received by any officer level staff as a result of 2008 performance, executive pay was reduced, and director fees were eliminated during the year just to mention a few of the expense reductions. Further this effort will continue into 2009 and significant results will be achieved.
Waccamaw is very pleased to report other meaningful issues that will be reflected in the 2009 performance. Obvious to all, interest rates are no longer falling and our cost of funds are improving daily as rates paid on interest bearing accounts fall and deposits are renewed at increasingly lower rates. Also many of our floating rate loans have now reached their minimum rate level and our net interest margin is now improving. One of the most significant events during the year was the results gained through the bank’s High Performance Checking (HPC) initiative which began in September of 2007. High Performance Checking has been a tremendous success since its inception with service charge income increasing nearly 60% as the bank increased the number of checking accounts by 22%. Waccamaw has gained a business relationship with nearly 3,500 households as a result. This initiative has created an opportunity to build long lasting relationships to benefit the bank for many years to come.
During the third quarter, Waccamaw Bank and Waccamaw Bankshares increased regulatory capital by $8 million through a series of non-dilutive capital offerings which provided an advantageous cost of capital to support the bank’s growth. Since these offerings were accomplished, the bank’s capital base is significantly stronger without selling additional shares of stock and diluting the earnings base of our shareholders. We have positioned the bank to withstand the current economic challenges and to take advantage of the opportunities that lie ahead as economic conditions improve.
Shareholder Letter
As mentioned earlier, the bank's seventeenth office was opened on U.S. 17 North in Little River, South Carolina during August with a robust welcome from the community. This office experienced one of the best openings our bank has enjoyed in many years and we are pleased with the initial response of the Little River community. Waccamaw now operates five South Carolina offices with four in fast growing Horry County and one in Lancaster County southeast of Charlotte. This new office provides a location to connect our seven office locations in Brunswick with our South Carolina offices while making our services more convenient for those clients in the Highway 90 and Highway 9 corridors connecting with Tabor City.
Our company has invested heavily in our branch structure and has built a franchise unlike any other of our community bank competitors. The strategic value of our expansion was not anticipated to result in increased profitability in the short term or in anticipation of the economic situation we now find ourselves. These new offices are located in some of the fastest growing areas of our nation and profits from these offices will benefit this bank for many years to come.
We look forward to 2009 with optimism as our new offices become stronger, the interest rate environment stabilizes, and our nation works though the current recession. Our staff is well positioned, well trained, and focused on delivering the highest quality service of any bank in our market. Our bank remains well capitalized and financially strong and is an active lender in the communities we serve. It is with these facts in mind, we look forward to presenting improved financial performance to you in the years to come.
Sincerely,
| James G. Graham | Alan W. Thompson |
| President and Chief Executive Officer | Chairman of the Board |
Consolidated Balance Sheets
December 31, 2008 and 2007
| | | 2008 | | | 2007 | |
| Assets | | | | | | |
| Cash and due from banks | | $ | 8,947,752 | | | $ | 11,809,251 | |
| Interest-bearing deposits with banks | | | 2,684,741 | | | | 912,195 | |
| Total cash and cash equivalents | | | 11,632,493 | | | | 12,721,446 | |
| | | | | | | | | |
| Federal funds sold | | | 4,281,000 | | | | - | |
| Investment securities, available for sale | | | 87,402,799 | | | | 99,302,322 | |
| Restricted equity securities | | | 4,131,906 | | | | 3,342,006 | |
| Loans, net of allowance for loan losses of $7,187,981 in 2008 and $5,385,782 in 2007 | | | 378,882,889 | | | | 355,138,167 | |
| Property and equipment, net | | | 17,597,502 | | | | 14,537,739 | |
| Goodwill | | | 2,727,152 | | | | 2,727,152 | |
| Intangible assets, net | | | 416,194 | | | | 673,374 | |
| Accrued income | | | 2,448,477 | | | | 2,939,264 | |
| Bank owned life insurance | | | 17,834,763 | | | | 11,777,361 | |
| Other assets | | | 10,095,259 | | | | 5,209,088 | |
| Total assets | | $ | 537,450,434 | | | $ | 508,367,919 | |
| | | | | | | | | |
| Liabilities and Stockholders' Equity | | | | | | | | |
| | | | | | | | | |
| Liabilities | | | | | | | | |
| Noninterest-bearing deposits | | $ | 36,159,809 | | | $ | 32,371,173 | |
| Interest-bearing deposits | | | 382,420,080 | | | | 345,808,162 | |
| Total deposits | | | 418,579,889 | | | | 378,179,335 | |
| | | | | | | | | |
| Securities sold under agreements to repurchase | | | 23,830,000 | | | | 29,222,000 | |
| Federal funds purchased | | | - | | | | 15,429,300 | |
| Other short-term borrowings | | | 10,000,000 | | | | 13,000,000 | |
| Long-term debt | | | 42,500,000 | | | | 25,500,000 | |
| Junior subordinated debentures | | | 12,372,000 | | | | 8,248,000 | |
| Accrued interest payable | | | 1,328,976 | | | | 2,125,673 | |
| Other liabilities | | | 995,414 | | | | 1,640,470 | |
| Total liabilities | | | 509,606,279 | | | | 473,344,778 | |
| | | | | | | | | |
| Commitments and contingencies | | | | | | | | |
| | | | | | | | | |
| Stockholders’ equity | | | | | | | | |
| Preferred stock, Series A, non-cumulative, non-voting, no par value; 1,000,000 shares authorized; | | | | | | | | |
| 28,184 and 48,178 issued and outstanding at December 31, 2008 and 2007, respectively | | | 464,476 | | | | 793,967 | |
| Common stock, no par; 25,000,000 shares authorized; | | | | | | | | |
| 5,523,549 and 5,434,770 shares issued and outstanding at December 31, 2008 and 2007, respectively | | | 24,591,884 | | | | 23,785,199 | |
| Retained earnings | | | 8,907,591 | | | | 11,124,589 | |
| Accumulated other comprehensive loss | | | (6,119,796 | ) | | | (680,614 | ) |
| Total stockholders’ equity | | | 27,844,155 | | | | 35,023,141 | |
| Total liabilities and stockholders’ equity | | $ | 537,450,434 | | | $ | 508,367,919 | |
See Notes to Consolidated Financial Statements
Consolidated Statements of Income
Years ended December 31, 2008, 2007, and 2006
| | | 2008 | | | 2007 | | | 2006 | |
| | | | | | | | | | |
| Interest income | | | | | | | | | |
| Loans and fees on loans | | $ | 24,056,784 | | | $ | 27,492,792 | | | $ | 22,584,611 | |
| Investment securities, taxable | | | 5,612,932 | | | | 3,231,060 | | | | 2,195,843 | |
| Investment securities, nontaxable | | | 714,011 | | | | 574,181 | | | | 330,656 | |
| Federal funds sold | | | 69,850 | | | | 289,740 | | | | 226,152 | |
| Deposits with banks | | | 31,745 | | | | 48,892 | | | | 42,205 | |
| Total interest income | | | 30,485,322 | | | | 31,636,665 | | | | 25,379,467 | |
| | | | | | | | | | | | | |
| Interest expense | | | | | | | | | | | | |
| Deposits | | | 13,502,304 | | | | 13,669,795 | | | | 9,488,101 | |
| Federal funds purchased and securities sold under agreements to repurchase | | | 1,103,935 | | | | 468,792 | | | | 225,725 | |
| Other borrowed funds | | | 2,328,430 | | | | 2,157,460 | | | | 1,512,314 | |
| Total interest expense | | | 16,934,669 | | | | 16,296,047 | | | | 11,226,140 | |
| Net interest income | | | 13,550,653 | | | | 15,340,618 | | | | 14,153,327 | |
| | | | | | | | | | | | | |
| Provision for loan losses | | | 2,990,096 | | | | 385,864 | | | | 1,450,000 | |
| Net interest income after provision for loan losses | | | 10,560,557 | | | | 14,954,754 | | | | 12,703,327 | |
| | | | | | | | | | | | | |
| Noninterest income | | | | | | | | | | | | |
| Service charges on deposit accounts | | | 2,115,172 | | | | 1,325,296 | | | | 1,100,378 | |
| ATM and check cashing fees | | | 755,029 | | | | 537,750 | | | | 438,538 | |
| Mortgage origination income | | | 352,929 | | | | 467,089 | | | | 373,726 | |
| Income from financial services | | | 264,201 | | | | 304,383 | | | | 289,958 | |
| Earnings on bank owned life insurance | | | 547,952 | | | | 390,160 | | | | 239,998 | |
| Net realized (losses) gains on sale or maturity of investment securities | | | 98,207 | | | | 246,128 | | | | (890 | ) |
| Impairment on investment securities available for sale | | | (3,348,460 | ) | | | - | | | | - | |
Net realized gains on sale of interest in mortgage banking investee | | | - | | | | - | | | | 44,094 | |
| Other operating income | | | 181,442 | | | | 172,344 | | | | 95,368 | |
| Total noninterest income | | | 966,472 | | | | 3,443,150 | | | | 2,581,170 | |
| | | | | | | | | | | | | |
| Noninterest expense | | | | | | | | | | | | |
| Salaries and employee benefits | | | 8,196,516 | | | | 6,856,453 | | | | 5,274,052 | |
| Occupancy and equipment | | | 2,012,137 | | | | 1,513,300 | | | | 1,105,461 | |
| Data processing | | | 1,306,998 | | | | 1,000,694 | | | | 809,187 | |
| Advertising | | | 705,462 | | | | 593,279 | | | | 308,423 | |
| Regulatory agency expense | | | 389,327 | | | | 264,869 | | | | 62,877 | |
| Professional services | | | 489,537 | | | | 315,358 | | | | 292,866 | |
| Other expense | | | 2,297,312 | | | | 1,896,262 | | | | 1,569,229 | |
| Total noninterest expense | | | 15,397,289 | | | | 12,440,215 | | | | 9,422,095 | |
| Income (loss) before income taxes | | | (3,870,260 | ) | | | 5,957,689 | | | | 5,862,402 | |
| | | | | | | | | | | | | |
| Income tax expense (benefit) | | | (1,827,230 | ) | | | 2,048,741 | | | | 2,210,386 | |
| Net income (loss) | | $ | (2,043,030 | ) | | $ | 3,908,948 | | | $ | 3,652,016 | |
| | | | | | | | | | | | | |
| Basic income (loss) per share | | $ | (.37 | ) | | $ | .73 | | | $ | .71 | |
| Diluted income (loss) per share | | $ | (.37 | ) | | $ | .72 | | | $ | .69 | |
| Weighted average common shares outstanding | | | 5,490,982 | | | | 5,365,617 | | | | 5,127,107 | |
| Weighted average dilutive common shares outstanding | | | 5,490,982 | | | | 5,463,633 | | | | 5,319,464 | |
See Notes to Consolidated Financial Statements
Consolidated Statements of Changes in Stockholders' Equity
Years ended December 31, 2008, 2007 and 2006
| | | | | | | | | | | | Accumulated | | | | |
| | | | | | | | | | | | Other | | | | |
| | | Preferred | | | Common | | | Retained | | | Comprehensive | | | | |
| | | Stock | | | Stock | | | Earnings | | | Income (Loss) | | | Total | |
| | | | | | | | | | | | | | | | |
| December 31, 2005 | | $ | - | | | $ | 13,256,961 | | | $ | 9,564,875 | | | $ | (323,192 | ) | | $ | 22,498,644 | |
| | | | | | | | | | | | | | | | | | | | | |
| Comprehensive income | | | | | | | | | | | | | | | | | | | | |
| Net income | | | - | | | | - | | | | 3,652,016 | | | | - | | | | 3,652,016 | |
| Net change in unrealized appreciation on investment securities available for sale, net of income taxes of $245,728 | | | - | | | | - | | | | - | | | | 477,001 | | | | 477,001 | |
| Reclassification adjustment, net of income taxes of $303 | | | - | | | | - | | | | - | | | | 587 | | | | 587 | |
| Total comprehensive income | | | | | | | | | | | | | | | | | | | 4,129,604 | |
| | | | | | | | | | | | | | | | | | | | | |
| Issuance of common stock | | | - | | | | 3,582,019 | | | | - | | | | - | | | | 3,582,019 | |
| Issuance of preferred stock | | | 1,006,264 | | | | - | | | | - | | | | - | | | | 1,006,264 | |
| Stock based compensation | | | - | | | | 88,063 | | | | - | | | | - | | | | 88,063 | |
| Exercise of stock options | | | - | | | | 255,654 | | | | - | | | | - | | | | 255,654 | |
| Excess tax benefits from stock-based compensation | �� | | - | | | | 201,151 | | | | - | | | | - | | | | 201,151 | |
| Stock issuance costs | | | (13,152 | ) | | | (45,617 | ) | | | - | | | | - | | | | (58,769 | ) |
| December 31, 2006 | | | 993,112 | | | | 17,338,231 | | | | 13,216,891 | | | | 154,396 | | | | 31,702,630 | |
| | | | | | | | | | | | | | | | | | | | | |
| Comprehensive income | | | | | | | | | | | | | | | | | | | | |
| Net income | | | - | | | | - | | | | 3,908,948 | | | | - | | | | 3,908,948 | |
| Net change in unrealized appreciation on investment securities available for sale, net of income taxes of ($346,473) | | | - | | | | - | | | | - | | | | (672,565 | ) | | | (672,565 | ) |
Reclassification adjustment, net of income taxes of ($83,683) | | | - | | | | - | | | | - | | | | (162,445 | ) | | | (162,445 | ) |
| Total comprehensive income | | | | | | | | | | | | | | | | | | | 3,073,938 | |
| | | | | | | | | | | | | | | | | | | | | |
| Effect of 10% common stock dividend | | | - | | | | 5,921,341 | | | | (5,921,341 | ) | | | - | | | | - | |
| Effect of 10% preferred stock dividend | | | 79,909 | | | | - | | | | (79,909 | ) | | | - | | | | - | |
| Stock based compensation | | | - | | | | 98,729 | | | | - | | | | - | | | | 98,729 | |
| Exercise of stock options | | | - | | | | 97,979 | | | | - | | | | - | | | | 97,979 | |
| Excess tax benefits from stock-based compensation | | | - | | | | 60,029 | | | | - | | | | - | | | | 60,029 | |
| Conversion of preferred stock to common stock | | | (279,054 | ) | | | 279,054 | | | | - | | | | - | | | | - | |
| Redemption of fractional shares | | | - | | | | (10,164 | ) | | | - | | | | - | | | | (10,164 | ) |
| December 31, 2007 | | | 793,967 | | | | 23,785,199 | | | | 11,124,589 | | | | (680,614 | ) | | | 35,023,141 | |
| Adoption of EITF 06-4 | | | - | | | | - | | | | (173,968 | ) | | | - | | | | (173,968 | ) |
| Comprehensive loss | | | | | | | | | | | | | | | | | | | | |
| Net loss | | | - | | | | - | | | | (2,043,030 | ) | | | - | | | | (2,043,030 | ) |
| Net change in unrealized loss on investment securities available for sale, net of income taxes of ($2,714,873) | | | - | | | | - | | | | - | | | | (7,438,637 | ) | | | (7,438,637 | ) |
| Reclassification adjustment of impairment in investments securities available for sale, net of income taxes of $1,290,965 | | | - | | | | - | | | | - | | | | 2,057,495 | | | | 2,057,495 | |
Reclassification adjustment of gain recognized in net of income taxes of ($40,167) | | | - | | | | - | | | | - | | | | (58,040 | ) | | | (58,040 | ) |
| Total comprehensive loss | | | | ) | | | | | | | | | | | | | | | (5,438,182 | ) |
| | | | | | | | | | | | | | | | | | | | | |
| Stock based compensation | | | - | | | | 127,409 | | | | - | | | | - | | | | 127,409 | |
| Exercise of stock options | | | - | | | | 165,774 | | | | - | | | | - | | | | 165,774 | |
| Excess tax benefits from stock-based compensation | | | - | | | | 184,011 | | | | - | | | | - | | | | 184,011 | |
| Conversion of preferred stock to common stock | | | (329,491 | ) | | | 329,491 | | | | - | | | | - | | | | - | |
| December 31, 2008 | | $ | 464,476 | | | $ | 24,591,884 | | | $ | 8,907,591 | | | $ | (6,119,796 | ) | | $ | 27,844,155 | |
See Notes to Consolidated Financial Statements
Consolidated Statements of Cash Flows
Years ended December 31, 2008, 2007 and 2006
| | | 2008 | | | 2007 | | | 2006 | |
| Cash flows from operating activities | | | | | | | | | |
| Net income (loss) | | $ | (2,043,030 | ) | | $ | 3,908,948 | | | $ | 3,652,016 | |
| Adjustments to reconcile net income (loss) to net cash provided by operations: | | | | | | | | | | | | |
| Depreciation and amortization | | | 1,011,671 | | | | 800,845 | | | | 630,247 | |
| Stock-based compensation | | | 127,409 | | | | 98,729 | | | | 88,063 | |
| Provision for loan losses | | | 2,990,096 | | | | 385,864 | | | | 1,450,000 | |
| Amortization of unearned (discounts) premiums on investments, net | | | (19,032 | ) | | | 31,555 | | | | 72,027 | |
| (Gain) loss on sale of investment securities | | | (98,207 | ) | | | (246,128 | ) | | | 890 | |
| Gain on sale of investment in mortgage banking investee | | | - | | | | - | | | | (44,094 | ) |
| Impairment of investment securities | | | 3,348,460 | | | | - | | | | - | |
| Income from bank owned life insurance | | | (547,952 | ) | | | (358,231 | ) | | | (210,201 | ) |
| Deferred taxes | | | (1,881,102 | ) | | | (215,944 | ) | | | (307,088 | ) |
| Changes in assets and liabilities: | | | | | | | | | | | | |
| Accrued income | | | 490,787 | | | | (312,244 | ) | | | (984,604 | ) |
| Other assets | | | 559,531 | | | | (1,195,987 | ) | | | (581,964 | ) |
| Accrued interest payable | | | (796,697 | ) | | | 713,373 | | | | 331,924 | |
| Other liabilities | | | (819,024 | ) | | | (316,126 | ) | | | 1,278,502 | |
| Net cash provided by operating activities | | | 2,322,910 | | | | 3,294,654 | | | | 5,375,718 | |
| | | | | | | | | | | | | |
| Cash flows from investing activities | | | | | | | | | | | | |
| Net (increase) decrease in federal funds sold | | | (4,281,000 | ) | | | 2,598,000 | | | | 5,683,000 | |
| Purchases of investment securities | | | (38,148,849 | ) | | | (73,818,059 | ) | | | (15,946,980 | ) |
| Maturities of investment securities | | | 2,927,227 | | | | 6,061,233 | | | | 5,877,244 | |
| Net increase in loans | | | (27,373,415 | ) | | | (43,270,841 | ) | | | (51,516,853 | ) |
| Proceeds from sales of investment securities | | | 34,858,839 | | | | 17,048,272 | | | | 1,155,000 | |
| Investment in bank owned life insurance | | | (5,509,450 | ) | | | (6,000,000 | ) | | | - | |
| Purchases of property and equipment | | | (3,814,254 | ) | | | (8,382,268 | ) | | | (3,359,954 | ) |
| Proceeds from sale of other real estate | | | - | | | | - | | | | 82,475 | |
| Acquisition of The Bank of Heath Springs | | | - | | | | - | | | | (1,627,132 | ) |
| Net cash used in investing activities | | | (41,340,902 | ) | | | (105,763,663 | ) | | | (59,653,200 | ) |
| | | | | | | | | | | | | |
| Cash flows from financing activities | | | | | | | | | | | | |
| Net increase (decrease) in noninterest-bearing deposits | | | 3,788,636 | | | | (16,792,124 | ) | | | 19,792,936 | |
| Net increase in interest-bearing deposits | | | 36,611,918 | | | | 67,619,692 | | | | 22,135,837 | |
| Net increase (decrease) in securities sold under agreements to repurchase | | | (5,392,000 | ) | | | 23,812,000 | | | | 2,674,000 | |
| Net increase (decrease) in federal funds purchased | | | (15,429,300 | ) | | | 15,429,300 | | | | - | |
| Net increase in junior subordinated debentures | | | 4,000,000 | | | | - | | | | - | |
| Net increase (decrease) in short-term borrowings | | | (7,000,000 | ) | | | 13,000,000 | | | | (10,000,000 | ) |
| Net proceeds from long-term debt | | | 21,000,000 | | | | 2,000,000 | | | | 17,000,000 | |
| Proceeds from issuance of common stock | | | 165,774 | | | | 97,979 | | | | 3,837,673 | |
| Proceeds from issuance of preferred stock | | | - | | | | - | | | | 1,006,264 | |
| Benefit of non-qualified stock option exercise | | | 184,011 | | | | 60,029 | | | | 201,151 | |
| Stock issuance costs and redemption of fractional shares | | | - | | | | (10,164 | ) | | | (58,769 | ) |
| Net cash provided by financing activities | | | 37,929,039 | | | | 105,216,712 | | | | 56,589,092 | |
| Increase (decrease) in cash and cash equivalents | | | (1,088,953 | ) | | | 2,747,703 | | | | 2,311,610 | |
| | | | | | | | | | | | | |
| Cash and cash equivalents, beginning | | | 12,721,446 | | | | 9,973,743 | | | | 7,662,133 | |
| Cash and cash equivalents, ending | | $ | 11,632,493 | | | $ | 12,721,446 | | | $ | 9,973,743 | |
| | | | | | | | | | | | | |
| Supplemental disclosure of cash flow information | | | | | | | | | | | | |
| Interest paid | | $ | 17,731,365 | | | $ | 15,582,674 | | | $ | 10,879,836 | |
| Taxes paid | | $ | 133,750 | | | $ | 2,099,800 | | | $ | 2,505,414 | |
| | | | | | | | | | | | | |
| Supplemental disclosure of noncash activities | | | | | | | | | | | | |
| Real estate acquired in settlement of loans | | $ | 638,597 | | | $ | 301,824 | | | $ | 68,146 | |
| Issuance of stock in exchange for exercised stock options and stock already outstanding | | $ | - | | | $ | 271,101 | | | $ | - | |
| 10% common stock dividend | | $ | - | | | $ | 5,921,341 | | | $ | - | |
| 10% preferred stock dividend | | $ | - | | | $ | 79,909 | | | $ | - | |
See Notes to Consolidated Financial Statements
Consolidated Statements of Cash Flow, continued
For the years ended December 31, 2008, 2007 and 2006
Schedule of noncash investing transactions related to acquisition
| | | 2008 | | | 2007 | | | 2006 | |
| | | | | | | | | | |
| Acquisition of The Bank of Heath Springs | | | | | | | | | |
| Assets acquired | | | | | | | | | |
| Investment securities | | $ | - | | | $ | - | | | $ | 8,206,775 | |
Loans, net of allowance for loan losses $45,942 | | | - | | | | - | | | | 4,516,371 | |
| Property and equipment, net | | | - | | | | - | | | | 302,351 | |
| Other assets | | | - | | | | - | | | | 37,939 | |
| Goodwill | | | - | | | | - | | | | 2,665,602 | |
| Core deposit intangible | | | - | | | | - | | | | 300,000 | |
| | | | - | | | | - | | | | 16,029,038 | |
| | | | | | | | | | | | | |
| Liabilities assumed | | | | | | | | | | | | |
| Deposits | | | - | | | | - | | | | 14,387,526 | |
| Other liabilities | | | - | | | | - | | | | 14,380 | |
| | | | - | | | | - | | | | 14,401,906 | |
| Net noncash assets acquired | | $ | - | | | $ | - | | | $ | 1,627,132 | |
| | | | | | | | | | | | | |
| Payment for net assets acquired | | | | | | | | | | | | |
| Cash paid at closing | | $ | - | | | $ | - | | | $ | 8,000,000 | |
| Less cash acquired at closing | | | - | | | | - | | | | 6,372,868 | |
| Net cash paid | | | - | | | | - | | | | 1,627,132 | |
| Notes issued to stockholders of acquired corporation | | | - | | | | - | | | | - | |
| Stock issued to stockholders of acquired corporation | | | - | | | | - | | | | - | |
| | | $ | - | | | $ | - | | | $ | 1,627,132 | |
See Notes to Consolidated Financial Statements
Notes to Consolidated Financial Statements
For the years ended December 31, 2008, 2007 and 2006
Note 1. Organization and Summary of Significant Accounting Policies
Organization
Waccamaw Bank (Bank) was organized and incorporated under the laws of the State of North Carolina on August 28, 1997 and commenced operations on September 2, 1997. The Bank currently serves Columbus, Brunswick, Bladen and New Hanover counties in North Carolina and Lancaster and Horry counties in South Carolina and surrounding areas through sixteen full service banking branches. As a state chartered bank which is a member of the Federal Reserve, the Bank is subject to regulation by the State of North Carolina Banking Commission and the Federal Reserve.
During 2001, Waccamaw Bankshares, Inc. (Company), a financial holding company chartered in North Carolina was formed. On June 30, 2001, Waccamaw Bankshares, Inc. acquired all the outstanding shares of Waccamaw Bank in a tax-free exchange. Waccamaw Financial Services, Inc. is a wholly owned subsidiary of Waccamaw Bank, the primary business activity of which is investment and insurance services.
The accounting and reporting policies of the Company, the Bank, and Waccamaw Financial Services follow generally accepted accounting principles and general practices within the financial services industry. Following is a summary of the more significant policies.
Critical Accounting Policies
We believe our policies with respect to the methodology for our determination of the allowance for loan losses, investment impairment charges, goodwill impairment and asset impairment judgments, including the recoverability of intangible assets, involve a higher degree of complexity and require management to make difficult and subjective judgments which often require assumptions or estimates about highly uncertain matters. Changes in these judgments, assumptions or estimates could cause reported results to differ materially. These critical policies and their application are periodically reviewed with the Audit Committee and our Board of Directors.
Principles of Consolidation
Our consolidated financial statements include the accounts of the Company and its subsidiaries. All significant intercompany transactions and balances have been eliminated in consolidation.
Business Segments
The Company reports its activities as a single business segment. In determining the appropriateness of segment definition, the Company considers components of the business about which financial information is available and regularly evaluated relative to resource allocation and performance assessment.
Use of Estimates
The preparation of financial statements in conformity with generally accepted accounting principles requires management to make estimates and assumptions that affect the reported amounts of assets and liabilities and disclosure of contingent assets and liabilities at the date of the financial statements and the reported amounts of revenues and expenses during the reporting period. Actual results could differ from those estimates.
Material estimates that are particularly susceptible to significant change relate to the determination of the allowance for loan losses, the determination of other than temporarily impairment on investment securities, the valuation of deferred tax assets and the valuation of real estate acquired in connection with foreclosures or in satisfaction of loans. In connection with the determination of the allowances for loan and foreclosed real estate losses, management obtains independent appraisals for significant properties.
Notes to Consolidated Financial Statements
For the years ended December 31, 2008, 2007 and 2006
Note 1. Organization and Summary of Significant Accounting Policies, continued
Use of Estimates, continued
The Bank’s loan portfolio consists primarily of loans in its market area. Accordingly, the ultimate collectability of a substantial portion of the Bank’s loan portfolio and the recovery of a substantial portion of the carrying amount of foreclosed real estate are susceptible to changes in local market conditions.
While management uses available information to recognize loan and foreclosed real estate losses, future additions to the allowances may be necessary based on changes in local economic conditions. In addition, regulatory agencies, as a part of their routine examination process, periodically review the Bank's allowances for loan and foreclosed real estate losses. Such agencies may require the Bank to recognize additions to the allowances based on their judgments about information available to them at the time of their examinations. Because of these factors, it is reasonably possible that the allowances for loan and foreclosed real estate losses may change materially in the near term.
Cash and Cash Equivalents
For the purpose of presentation in the statement of cash flows, cash and cash equivalents are defined as those amounts included in the balance sheet caption "cash and due from banks" and "interest-bearing deposits with banks".
Interest-Bearing Deposits with Banks
Interest-bearing deposits mature in one year or less and are carried at cost.
Trading Securities
The Bank does not hold securities for short-term resale and therefore does not maintain a trading securities portfolio.
Investment Securities
Debt securities that management has the positive intent and ability to hold to maturity are classified as “held to maturity” and recorded at amortized cost. Securities not classified as held to maturity or trading, including equity securities with readily determinable fair values, are classified as “available for sale” and recorded at fair value, with unrealized gains and losses excluded from earnings and reported in other comprehensive income.
Purchase premiums and discounts are recognized in interest income using the interest method over the terms of the securities. Declines in the fair value of held-to-maturity and available-for-sale securities below their cost that are deemed to be other than temporary are reflected in earnings as realized losses. In determining whether other-than-temporary impairment exists, management considers many factors including (1) the length of time and the extent to which the fair value has been less than cost, (2) the financial condition and near-term prospects of the issuer, and (3) the intent and ability of the Company to retain its investment in the issuer for a period of time sufficient to allow for any anticipated recovery in fair value. Gains and losses on the sale of securities are recorded on the trade date and are determined using the specific identification method.
Loans
Loans receivable that management has the intent and ability to hold for the foreseeable future or until maturity or pay-off are reported at their outstanding principal amount adjusted for any charge-offs, the allowance for loan losses, and any deferred fees or costs on originated loans and unamortized premiums or discounts on purchased loans.
Notes to Consolidated Financial Statements
For the years ended December 31, 2008, 2007 and 2006
Note 1. Organization and Summary of Significant Accounting Policies, continued
Loans, continued
Loan origination fees and certain direct origination costs are deferred and recognized as an adjustment of the yield of the related loan. Discounts and premiums on any purchased residential real estate loans are amortized to income using the interest method over the remaining period to contractual maturity, adjusted for anticipated prepayments. Discounts and premiums on any purchased consumer loans are recognized over the expected lives of the loans using methods that approximate the interest method.
Interest is accrued and credited to income based on the principal amount outstanding. The accrual of interest on impaired loans is discontinued when, in management’s opinion, the borrower may be unable to meet payments as they become due. When interest accrual is discontinued, all unpaid accrued interest is reversed. Interest income is subsequently recognized on the cash-basis or cost-recovery method, as appropriate. When facts and circumstances indicate the borrower has regained the ability to meet required payments, the loan is returned to accrual status. Past due status of loans is determined based on contractual terms.
Allowance for Loan Losses
The allowance for loan losses is established as losses are estimated to have occurred through a provision for loan losses charged to earnings. Loan losses are charged against the allowance when management believes the uncollectability of a loan balance is confirmed. Subsequent recoveries, if any, are credited to the allowance.
The allowance for loan losses is evaluated on a regular basis by management and is based upon management’s periodic review of the collectability of the loans in light of historical experience, the nature and volume of the loan portfolio, adverse situations that may affect the borrower’s ability to repay, estimated value of any underlying collateral and prevailing economic conditions. This evaluation is inherently subjective as it requires estimates that are susceptible to significant revision as more information becomes available.
The allowance consists of specific, general and unallocated components. The specific component relates to loans that are classified as impaired. For such loans, an allowance is established when the discounted cash flows (or collateral value or observable market price) of the impaired loan is lower than the carrying value of that loan. The general component covers non-impaired loans and is based on historical loss experience adjusted for qualitative factors. An unallocated component is maintained to cover uncertainties that could affect management’s estimate of probable losses. The unallocated component of the allowance reflects the margin of imprecision inherent in the underlying assumptions used in the methodologies for estimating losses in the portfolio.
A loan is considered impaired when, based on current information and events, it is probable that the Bank will be unable to collect the scheduled payments of principal or interest when due according to the contractual terms of the loan agreement. Factors considered by management in determining impairment include payment status, collateral value, and the probability of collecting scheduled principal and interest payments when due. Loans that experience insignificant payment delays and payment shortfalls generally are not classified as impaired. Management determines the significance of payment delays and payment shortfalls on a case-by-case basis, taking into consideration all of the circumstances surrounding the loan and the borrower, including the length of the delay, the reasons for the delay, the borrower’s prior payment record, and the amount of the shortfall in relation to the principal and interest owed. Impairment is measured on a loan by loan basis for commercial and construction loans by either the present value of expected future cash flows discounted at the loan’s effective interest rate, the loan’s obtainable market price, or the fair value of the collateral if the loan is collateral dependent.
Large groups of smaller balance homogeneous loans are collectively evaluated for impairment. Accordingly, the Bank does not separately identify individual consumer and residential loans for impairment.
Notes to Consolidated Financial Statements
For the years ended December 31, 2008, 2007 and 2006
Note 1. Organization and Summary of Significant Accounting Policies, continued
Property and Equipment
Land is carried at cost. Buildings, furniture and equipment, automobiles, and leasehold improvements are carried at cost, less accumulated depreciation and amortization computed principally by the straight-line method over the following estimated useful lives:
| | | Years | |
| | | | |
| Leasehold improvements | | | 5-30 | |
| Automobile | | | 5 | |
| Furniture and equipment | | | 3-10 | |
| Buildings | | | 10-40 | |
Goodwill
Goodwill represents the excess of the cost of an acquisition over the fair value of the net assets acquired. Goodwill is assessed at least annually for impairment. No impairment charges were necessary for the years presented.
Fair value of the reporting unit in 2008 was determined using a discounted cash flow model with estimated cash flows based on internal forecasts of net income. Our goodwill impairment testing for 2008, which was updated at December 31, 2008 as a result of the recent decline in our common stock price and net earnings, indicated that our goodwill was not impaired. As a result of the recent decline in our stock price and operating results, the excess of the fair value over carrying value narrowed in our assessment. If our stock price continues to decline, and if the Company does not produce anticipated cash flows, our goodwill may be impaired in the future.
Intangible Assets
Intangible assets consist primarily of purchased core deposit intangible assets and are accounted for in accordance with Statement of Financial Accounting Standard (“SFAS”) No. 142, Goodwill and Other Intangible Assets. The Company evaluates the remaining useful life of each intangible asset that is being amortized to determine whether events and circumstances warrant a revision to the remaining period of amortization. Intangible assets are currently being amortized over estimated useful lives of 10 years.
Foreclosed Assets
Assets acquired through, or in lieu of, loan foreclosure are held for sale and are initially recorded at fair value at the date of foreclosure, establishing a new cost basis. Subsequent to foreclosure, valuations are periodically performed by management and the assets are carried at fair value less cost to sell. Revenue and expenses from operations and changes in the valuation allowance are included in net expenses from foreclosed assets. Foreclosed assets are included in other assets on the balance sheet.
Transfers of Financial Assets
Transfers of financial assets are accounted for as sales, when control over the assets has been surrendered. Control over transferred assets is deemed to be surrendered when (1) the assets have been isolated from the Bank, (2) the transferee obtains the right (free of conditions that constrain it from taking advantage of that right) to pledge or exchange the transferred assets, and (3) the Bank does not maintain effective control over the transferred assets through an agreement to repurchase them before their maturity.
Notes to Consolidated Financial Statements
For the years ended December 31, 2008, 2007 and 2006
Note 1. Organization and Summary of Significant Accounting Policies, continued
Stock Compensation Plans
In December 2004, the Financial Accounting Standards Board ("FASB") issued SFAS No. 123 (revised 2004), Share-Based Payment. SFAS No. 123(R) requires that the compensation cost relating to share-based payment transactions be recognized in financial statements. That cost will be measured based on the fair value of the equity or liability instruments issued. SFAS No. 123(R) covers a wide range of share-based compensation arrangements including stock options, restricted share plans, performance-based awards, share appreciation rights, and employee share purchase plans. SFAS No. 123(R) is a replacement of SFAS No. 123, Accounting for Stock-Based Compensation, and supersedes Accounting Principles Board (“APB”) Opinion No. 25, Accounting for Stock Issued to Employees, and its related interpretive guidance. The effect of the Statement will be to require entities to measure the cost of employee services received in exchange for stock options based on the grant-date fair value of the award, and to recognize the cost over the period the employee is required to provide services for the award. SFAS No. 123(R) permits entities to use any option-pricing model that meets the fair value objective in the Statement.
The Company elected to adopt SFAS No. 123(R) on January 1, 2006 under the modified prospective method. Compensation cost has been measured using the fair value of an award on the grant date and is recognized over the service period, which is usually the vesting period. Compensation cost related to the non-vested portion of awards outstanding as of that date was based on the grant-date fair value of those awards as calculated under the original provisions of SFAS No. 123; that is, the Company was not required to re-measure the grant-date fair value estimate of the unvested portion of awards granted prior to the effective date of SFAS No. 123(R).
Advertising Expense
The Company expenses advertising costs as they are incurred. Advertising expense for the years ended December 31, 2008, 2007, and 2006 was approximately $705,000, $593,000 and $308,000, respectively.
Income Taxes
Provision for income taxes is based on amounts reported in the statements of income (after exclusion of non-taxable income such as interest on state and municipal securities) and consists of taxes currently due plus deferred taxes on temporary differences in the recognition of income and expense for tax and financial statement purposes. Deferred tax assets, net of a valuation allowance if appropriate, and liabilities are included in the financial statements at currently enacted income tax rates applicable to the period in which the deferred tax assets or liabilities are expected to be realized or settled. As changes in tax laws or rates are enacted, deferred tax assets and liabilities are adjusted through the provision for income taxes.
Deferred income tax liability relating to unrealized appreciation (or the deferred tax asset in the case of unrealized depreciation) on investment securities available for sale is recorded in other liabilities (assets). Such unrealized appreciation or depreciation is recorded as an adjustment to equity in the financial statements and not included in income determination until realized. Accordingly, the resulting deferred income tax liability or asset is also recorded as an adjustment to equity.
In 2006, the FASB issued Interpretation No. 48 (FIN 48), Accounting for Uncertainty in Income Taxes – an Interpretation of SFAS No. 109. FIN 48 clarifies the accounting for uncertainty in income taxes recognized in an enterprise’s financial statements in accordance with SFAS No. 109, “Accounting for Income Taxes.” FIN 48 also prescribes a recognition threshold and measurement of a tax position taken or expected to be taken in an enterprise’s tax return. FIN 48 is effective for fiscal years beginning after December 15, 2006. Accordingly, the Company adopted FIN 48 effective January 1, 2007. The adoption of FIN 48 did not have any impact on the Company’s consolidated financial position.
Notes to Consolidated Financial Statements
For the years ended December 31, 2008, 2007 and 2006
Note 1. Organization and Summary of Significant Accounting Policies, continued
Comprehensive Income
Annual comprehensive income reflects the change in the Company’s equity during the year arising from transactions and events other than investments by and distributions to stockholders. It consists of net income plus certain other changes in assets and liabilities that are currently reported as separate components of stockholders’ equity rather than as income or expense. The Company’s sole component of accumulated other comprehensive income is unrealized losses on investment securities available for sale.
Basic Earnings per Share
Basic earnings per share is computed by dividing income available to common stockholders by the weighted average number of common shares outstanding during the period, after giving retroactive effect to stock splits and dividends.
Diluted Earnings per Share
The computation of diluted earnings per share is similar to the computation of basic earnings per share except that the denominator is increased to include the number of additional common shares that would have been outstanding if dilutive potential common shares had been issued. The numerator is adjusted for any changes in income or loss that would result from the assumed conversion of those potential common stock equivalents. Potential common stock equivalents include the Company’s Series A convertible preferred stock and related outstanding warrants and shares associated with stock-based compensation. Due to the net loss in 2008, dilutive common stock equivalents have been excluded from the computation of dilutive earnings per share as the result would be anti-dilutive.
Financial Instruments
Derivatives that are used as part of the asset/liability management process are linked to specific assets or liabilities and have high correlation between the contract and the underlying item being hedged, both at inception and throughout the hedge period. In addition, forwards and option contracts must reduce the risk attributed to a particular exposure, and for hedges of anticipatory transactions, the significant terms and characteristics of the transaction must be identified and the transactions must be probable of occurring. All derivative financial instruments held or issued by the Company are held or issued for purposes other than trading. In December 2007, the Bank entered into to structured repo obligation with Barclays Capital, Inc. in the amount of $20 million. Within the structured repo are embedded derivatives which will not have a material effect on the results of operations.
In the ordinary course of business the Bank has entered into off-balance-sheet financial instruments consisting of commitments to extend credit and commercial and standby letters of credit. Such financial instruments are recorded in the financial statements when they are funded or related fees are incurred or received.
Reclassification
Certain reclassifications have been made to the prior years' financial statements to place them on a comparable basis with the current year. Net income and stockholders' equity previously reported were not affected by these reclassifications.
Recent Accounting Pronouncements
The following is a summary of recent authoritative pronouncements that could impact the accounting, reporting, and /or disclosure of financial information by the Company.
Notes to Consolidated Financial Statements
For the years ended December 31, 2008, 2007 and 2006
Note 1. Organization and Summary of Significant Accounting Policies, continued
Recent Accounting Pronouncements, continued
In March 2008, the FASB issued Statement of Financial Accounting Standards No. 161, Disclosures about Derivative Instruments and Hedging Activities (“SFAS 161”). SFAS 161 changes the disclosure requirements for derivative instruments and hedging activities. Entities are required to provide disclosures about (a) how and why an entity uses derivative instruments, (b) how derivative instruments and related hedged items are accounted for under FASB Statement No. 133, Accounting for Derivative Instruments and Hedging Activities, and its related interpretations, and (c) how derivative instruments and related hedged items affect an entity’s financial position, financial performance, and cash flows. SFAS 161 is effective for fiscal years and interim periods beginning after November 15, 2008 and requires comparative disclosures only for periods subsequent to initial adoption. The adoption of the provisions of SFAS 161 is not anticipated to materially impact the Company’s consolidated balance sheets and results of operations.
In June 2008, the FASB issued FASB Staff Position No. EITF 03-6-1, Determining Whether Instruments Granted in Share-Based Payment Transactions are Participating Securities, (“FSP EITF 03-6-1”). FSP EITF 03-6-1 provides that unvested share-based payment awards that contain nonforfeitable rights to dividends or dividend equivalents are participating securities and must be included in the earnings per share computation. FSP EITF 03-6-1 is effective for financial statements issued for fiscal years beginning after December 15, 2008, and interim periods within those years. All prior-period earnings per share data presented must be adjusted retrospectively. Early application is not permitted. The adoption of FSP EITF 03-6-1 is not expected to have an effect on the Company’s financial statements.
In October 2008, the FASB issued FASB Staff Position (“FSP”) Statement of Financial Accounting Standards (“SFAS”) No. 157-3, Determining the Fair Value of a Financial Asset When the Market for That Asset is Not Active (“FSP SFAS No. 157-3”). The new FSP clarifies the application of SFAS No. 157, Fair Value Measurements, in a market that is not active and provides an example to illustrate key considerations in determining the fair value of a financial asset when the market for that financial asset is not active. This FSP was effective upon issuance, including prior periods for which financial statements had not been issued. The adoption of FSP SFAS No. 157-3 did not have a material impact on the Company’s consolidated financial condition or results of operations.
In September 2006, the FASB ratified the consensuses reached by the FASB’s Emerging Issues Task Force (“EITF”) relating to EITF 06-4, Accounting for the Deferred Compensation and Postretirement Benefit Aspects of Endorsement Split-Dollar Life Insurance Arrangements. EITF 06-4 states that an employer accounting for endorsement split-dollar life insurance arrangements that provide a benefit to an employee that extends to postretirement periods should recognize a liability for future benefits in accordance with SFAS No. 106, Employers’ Accounting for Postretirement Benefits Other Than Pensions, or Accounting Principles Board (“APB”) Opinion No. 12, Omnibus Opinion—1967. The Company adopted EITF 06-4 on January 1, 2008, and in connection therewith recorded a liability of $173,968 as a reduction of retained earnings. Subsequent increases in this liability will be reflected as an expense in determining operating results.
In December 2007, FASB issued Statement of Financial Accounting Standard ("SFAS") No. 141(R), Business Combinations, ("SFAS 141(R)") which replaces SFAS 141. SFAS 141(R) establishes principles and requirements for how an acquirer in a business combination recognizes and measures in its financial statements the identifiable assets acquired, the liabilities assumed, and any controlling interest; recognizes and measures goodwill acquired in the business combination or a gain from a bargain purchase; and determines what information to disclose to enable users of the financial statements to evaluate the nature and financial effects of the business combination. SFAS 141(R) is effective for acquisitions by the Company taking place on or after January 1, 2009. Early adoption is prohibited. Accordingly, a calendar year-end company is required to record and disclose business combinations following existing accounting guidance until January 1, 2009. The Company will assess the impact of SFAS 141(R) if and when a future acquisition occurs.
Notes to Consolidated Financial Statements
For the years ended December 31, 2008, 2007 and 2006
Note 1. Organization and Summary of Significant Accounting Policies, continued
Recent Accounting Pronouncements, continued
FSP EITF 99-20-1, Amendments to the Impairment Guidance of EITF Issue No. 99-20, ("FSP EITF 99-20-1") was issued in January 2009. Prior to the Staff Position, other-than-temporary impairment (OTTI) was determined by using either EITF Issue No. 99-20, Recognition of Interest Income and Impairment on Purchased Beneficial Interests and Beneficial Interests that Continue to be Held by a Transferor in Securitized Financial Assets, ("EITF 99-20") or SFAS No. 115, Accounting for Certain Investments in Debt and Equity Securities, ("SFAS 115") depending on the type of security. EITF 99-20 required the use of market participant assumptions regarding future cash flows regarding the probability of collecting all cash flows previously projected. SFAS 115 determined impairment to be other than temporary if it was probable that the holder would be unable to collect all amounts due according to the contractual terms. To achieve a more consistent determination of OTTI, the Staff Position amends EITF 99-20 to determine any OTTI based on the guidance in SFAS 115, allowing management to use more judgment in determining any OTTI. The Staff Position is effective for interim and annual reporting periods ending after December 15, 2008 and shall be applied prospectively. Retroactive application is not permitted. Management has reviewed the Company's security portfolio and evaluated the portfolio for any OTTI as discussed in Note 4.
Other accounting standards that have been issued or proposed by the FASB or other standards-setting bodies are not expected to have a material impact on the Company’s financial position, results of operations or cash flows.
Note 2. Business Combinations
On April 28, 2006, the Company acquired The Bank of Heath Springs, paying $8,000,000 in exchange for all the outstanding shares of common stock of The Bank of Heath Springs. In conjunction with the acquisition, The Bank of Heath Springs was merged with and into the Company’s subsidiary, Waccamaw Bank.
The acquisition was accounted for as a purchase transaction and accordingly the results of operations attributable to the acquired company are included in our consolidated financial statements only from the date of acquisition. The excess of purchase price over fair value of net tangible and identified intangible assets acquired will be evaluated annually for impairment and written down as those values become impaired. Identified intangible assets will be amortized over their expected useful life. The acquisition is summarized as follows:
| | | The Bank of | |
| | | Heath Springs | |
| | | | |
| Purchase price | | $ | 8,000,000 | |
| | | | | |
| Loans, net | | | 4,516,371 | |
| Investment securities | | | 8,206,775 | |
| Cash | | | 6,372,868 | |
| Identified intangible assets | | | 300,000 | |
| Other assets | | | 340,290 | |
| Deposits | | | (14,387,526 | ) |
| Other liabilities | | | (14,380 | ) |
| Net tangible and identified intangible assets acquired (at fair market value) | | | 5,334,398 | |
| Excess of purchase price over net tangible and identified intangible assets acquired (at fair market value) | | $ | 2,665,602 | |
Notes to Consolidated Financial Statements
For the years ended December 31, 2008, 2007 and 2006
Note 3. Restrictions on Cash
To comply with banking regulation, the Bank is required to maintain certain average cash reserve balances. The daily average cash reserve requirement was approximately $3,127,000 and $2,343,000 for the period including December 31, 2008 and 2007, respectively.
Note 4. Investment Securities
Debt and equity securities have been classified in the balance sheet according to management’s intent. The amortized cost of securities (all available for sale) and their approximate fair values follow:
| | | Amortized | | | Unrealized | | | Unrealized | | | Fair | |
| | | Cost | | | Gains | | | Losses | | | Value | |
| 2008 | | | | | | | | | | | | |
| Government sponsored enterprises | | | | | | | | | | | | |
| (FHLB, FHLMC, FNMA and FFCB) | | $ | 10,500,000 | | | $ | 106,465 | | | $ | - | | | $ | 10,606,465 | |
| Mortgage backed securities | | | 40,090,699 | | | | 824,260 | | | | 4,582 | | | | 40,910,377 | |
| Corporate securities | | | 7,318,842 | | | | 19,675 | | | | 1,989,834 | | | | 5,348,683 | |
| Equity securities | | | 52,800 | | | | - | | | | - | | | | 52,800 | |
| Single issue trust preferred securities | | | 21,565,751 | | | | 165,199 | | | | 6,157,683 | | | | 15,573,267 | |
| Pooled trust preferred securities | | | 570,058 | | | | - | | | | 430,384 | | | | 139,674 | |
| Municipal securities | | | 16,577,067 | | | | 12,741 | | | | 1,818,275 | | | | 14,771,533 | |
| | | $ | 96,675,217 | | | $ | 1,128,340 | | | $ | 10,400,758 | | | $ | 87,402,799 | |
| | | Amortized | | | Unrealized | | | Unrealized | | | Fair | |
| | | Cost | | | Gains | | | Losses | | | Value | |
| 2007 | | | | | | | | | | | | |
| Government sponsored enterprises | | | | | | | | | | | | |
| (FHLB, FHLMC, FNMA and FFCB) | | $ | 15,448,159 | | | $ | 172,693 | | | $ | - | | | $ | 15,620,852 | |
| Mortgage backed securities | | | 40,691,655 | | | | 110,691 | | | | 187,341 | | | | 40,615,005 | |
| Corporate securities, single issues trust | | | | | | | | | | | | | | | | |
| preferred securities, pooled trust | | | | | | | | | | | | | | | | |
| preferred securities | | | 27,502,810 | | | | 287,451 | | | | 735,161 | | | | 27,055,100 | |
| Municipal securities | | | 16,690,931 | | | | 17,081 | | | | 696,647 | | | | 16,011,365 | |
| | | $ | 100,333,555 | | | $ | 587,916 | | | $ | 1,619,149 | | | $ | 99,302,322 | |
Restricted equity securities are carried at cost and consist of investments in stock of the Federal Home Loan Bank of Atlanta (FHLB), The Bankers Bank and The Federal Reserve Bank of Richmond (Federal Reserve). All of those entities are correspondents of the Bank. The FHLB requires financial institutions to make equity investments in the FHLB in order to borrow from it. The Bank is required to hold that stock so long as it borrows from the FHLB. The Federal Reserve requires banks to purchase stock as a condition of membership in the Federal Reserve system. The Bank’s stock in The Bankers Bank is restricted only in the fact that the stock may only be repurchased by the respective company.
Investment securities with market values of $48,947,717 and $54,160,471 at December 31, 2008 and 2007, respectively were pledged as collateral on public deposits and for other banking purposes as required or permitted by law. Gross realized gains and losses resulting from the sale of securities for the years ended December 31, 2008, 2007 and 2006 are as follows:
| | | 2008 | | | 2007 | | | 2006 | |
| | | | | | | | | | |
| Realized gains | | $ | 137,477 | | | $ | 269,709 | | | $ | - | |
| Realized losses | | | (39,270 | ) | | | (23,581 | ) | | | (890 | ) |
| | | $ | 98,207 | | | $ | 246,128 | | | $ | (890 | ) |
Notes to Consolidated Financial Statements
For the years ended December 31, 2008, 2007 and 2006
Note 4. Investment Securities, continued
The scheduled contractual maturities of securities (all available for sale) at December 31, 2008 are as follows:
| | | Amortized | | | Fair | |
| | | Cost | | | Value | |
| | | | | | | |
| Due in one year or less | | $ | 3,213,907 | | | $ | 3,183,493 | |
| Due in one through five years | | | 2,575,000 | | | | 1,130,068 | |
| Due in five through ten years | | | 4,502,600 | | | | 4,600,165 | |
| Due after ten years | | | 86,383,710 | | | | 78,489,073 | |
| | | $ | 96,675,217 | | | $ | 87,402,799 | |
The following tables detail unrealized losses and related fair values in the Bank’s held to maturity and available for sale investment securities portfolios. This information is aggregated by the length of time that individual securities have been in a continuous unrealized loss position as of December 31, 2008 and December 31, 2007.
| December 31, 2008 | | Less Than 12 Months | | | 12 Months or More | | | Total | |
| | | Fair | | | Unrealized | | | Fair | | | Unrealized | | | Fair | | | Unrealized | |
| | | Value | | | Losses | | | Value | | | Losses | | | Value | | | Losses | |
| | | | | | | | | | | | | | | | | | | |
| Government sponsored enterprises | | | | | | | | | | | | | | | | | | |
| (FHLB, FHLMC and FFCB) | | $ | - | | | $ | - | | | $ | - | | | $ | - | | | $ | - | | | $ | - | |
| Mortgage backed securities | | | 230,539 | | | | (3,626 | ) | | | 26,554 | | | | (956 | ) | | | 257,093 | | | | (4,582 | ) |
| Corporate securities | | | 3,268,382 | | | | (527,020 | ) | | | 1,037,069 | | | | (1,462,814 | ) | | | 4,305,451 | | | | (1,989,834 | ) |
| Single issue trust preferred securities | | | 12,424,063 | | | | (6,056,874 | ) | | | 904,060 | | | | (100,808 | ) | | | 13,328,123 | | | | (6,157,683 | ) |
| Pooled trust preferred securities | | | - | | | | - | | | | 139,674 | | | | (430,384 | ) | | | 139,674 | | | | (430,384 | ) |
| Municipal securities | | | 8,046,371 | | | | (625,298 | ) | | | 5,162,622 | | | | (1,192,977 | ) | | | 13,208,993 | | | | (1,818,275 | ) |
| Total temporarily impaired securities | | $ | 23,969,355 | | | $ | (7,212,818 | ) | | $ | 7,269,979 | | | $ | (3,187,939 | ) | | $ | 31,292,133 | | | $ | (10,400,758 | ) |
Management evaluates securities for other-than-temporary impairment at least on a quarterly basis, and more frequently when economic or market concerns warrant such evaluation. Consideration is given to (1) the length of time and the extent to which the fair value has been less than cost, (2) the financial condition and near-term prospects of the issuer, and (3) the intent and ability of the Company to retain its investment in the issuer for a period of time sufficient to allow any anticipated recovery in fair value. The changes in fair value in our available for sale portfolio reflect normal market conditions and vary; either positively or negatively, based primarily on changes in general levels of market interest rates relative to the yields of the portfolio. Additionally, changes in the fair value of securities available for sale do not affect our income nor does it affect the Bank’s regulatory capital requirements. The Bank has invested in trust preferred securities and management is closely monitoring these securities. Write-downs as of December 31, 2008 included a single issue trust preferred security of $339,013, a pooled trust preferred security of $1,044,675 and FNMA Preferred Stock of $1,964,772.
Unrealized losses associated with the investment securities portfolio total $10.4 million. Of that amount, $3.2 million has existed for a period of twelve consecutive months or longer. Unrealized losses that are related to the prevailing interest rate environment will decline over time and recover as these securities approach maturity. The unrealized losses in the municipal securities portfolio are due to widening credit spreads in the municipal securities market and are the result of concerns about the bond insurers associated with these securities. This portfolio segment is not experiencing any credit problems at December 31, 2008 as the Company believes that all contractual cash flows will be received on this portfolio.
Notes to Consolidated Financial Statements
For the years ended December 31, 2008, 2007 and 2006
Note 4. Investment Securities, continued
Prices in the two pooled trust preferred securities portfolio continue to decline due to illiquidity and reduced demand for these securities. After cash flow testing of these securities using default and loss assumptions derived from a third party credit source with expertise in bank credit quality, one security failed the model’s projected cash flow test. During 2008, the Company recognized that a pooled trust preferred security was other-than-temporarily impaired and, accordingly, this security has been written down to the fair value. The pooled trust preferred securities portfolio was written down by $1,044,000 during 2008. Additionally, there has been no primary issuance and little secondary market trading for these types of securities. At December 31, 2008, the Company believes that the credit quality of the remaining pooled trust preferred security remains adequate to absorb further economic declines as they are current as to interest and principal payments.
The single-issue securities are trust-preferred issuances from some of the largest banks in the nation and had a total market value of approximately $15.7 million as of December 31, 2008, compared with their adjusted cost basis of approximately $21.6 million. Management does not believe any individual unrealized loss as of December 31, 2008, represents other-than-temporary impairment. The Company has the ability to hold these securities until such time as the value recovers or the securities mature. Furthermore, the Company believes that portions of the change in value are attributable to changes in market interest rates and the current state of illiquidity within the market for securitized assets.
Note 5. Loans Receivable
The major components of loans in the balance sheets at December 31 are as follows:
| | | 2008 | | | 2007 | |
| | | In thousands | |
| | | | | | | |
| Commercial | | $ | 42,958 | | | $ | 43,617 | |
| Real estate: | | | | | | | | |
| Construction and land development | | | 125,878 | | | | 121,760 | |
| Residential, 1-4 families | | | 83,734 | | | | 75,671 | |
| Residential, 5 or more families | | | 11,802 | | | | 3,670 | |
| Farmland | | | 3,343 | | | | 3,806 | |
| Nonfarm, nonresidential | | | 98,438 | | | | 93,222 | |
| Agricultural | | | 654 | | | | 671 | |
| Consumer | | | 17,217 | | | | 13,950 | |
| Other | | | 2,432 | | | | 4,610 | |
| | | | 386,456 | | | | 360,977 | |
| | | | | | | | | |
| Deferred loan fees, net of costs | | | (385 | ) | | | (453 | ) |
| Allowance for loan losses | | | (7,188 | ) | | | (5,386 | ) |
| | | $ | 378,883 | | | $ | 355,138 | |
Approximately $30,000,000 in 1-4 family residential loans, $43,000,000 in commercial real estate loans and $23,000,000 in home equity line of credit loans were pledged as collateral securing Federal Home Loan Bank advances included in long-term debt at December 31, 2008.
Notes to Consolidated Financial Statements
For the years ended December 31, 2008, 2007 and 2006
Note 6. Allowance for Loan Losses
Changes in the allowance for loan losses are as follows:
| | | 2008 | | | 2007 | | | 2006 | |
| | | | | | | | | | |
| Balance, beginning | | $ | 5,385,782 | | | $ | 4,885,992 | | | $ | 3,939,002 | |
| | | | | | | | | | | | | |
| Provision charged to expense | | | 2,990,096 | | | | 385,864 | | | | 1,450,000 | |
| Allowance acquired in purchase transaction | | | - | | | | - | | | | 45,942 | |
| Recoveries of amounts charged off | | | 11,150 | | | | 401,717 | | | | 36,247 | |
| Amounts charged off | | | (1,199,047 | ) | | | (287,791 | ) | | | (585,199 | ) |
| Balance, ending | | $ | 7,187,981 | | | $ | 5,385,782 | | | $ | 4,885,992 | |
| | | 2008 | | | 2007 | |
| | | | | | | |
| Impaired loans without a valuation allowance | | $ | 2,384,963 | | | $ | 2,504,192 | |
| Impaired loans with a valuation allowance | | | 22,844,795 | | | | - | |
| Total impaired loans | | $ | 25,229,758 | | | $ | 2,504,192 | |
| | | | | | | | | |
| Valuation allowance related to impaired loans | | $ | 3,586,786 | | | $ | - | |
| | | | | | | | | |
| Total nonaccrual loans | | $ | 15,633,308 | | | $ | 1,534,208 | |
| Total loans past due ninety days or more and still accruing interest | | $ | 1,451,040 | | | $ | 2,608,432 | |
The average annual recorded investment in impaired loans and interest income recognized on impaired loans for the last three years (all approximate) is summarized below:
| | | 2008 | | | 2007 | | | 2006 | |
| | | | | | | | | | |
| Average investment in impaired loans | | $ | 7,356,217 | | | $ | 927,305 | | | $ | 1,016,932 | |
| Interest income recognized on impaired loans | | $ | 1,109,854 | | | $ | 206,057 | | | $ | 236,913 | |
| Interest income recognized on a cash basis on impaired loans | | $ | 531,367 | | | $ | 93,351 | | | $ | 40,384 | |
No additional funds are committed to be advanced in connection with impaired loans.
Note 7. Property and Equipment
Components of Property and Equipment
Property and equipment and total accumulated depreciation consisted of the following at December 31:
| | | 2008 | | | 2007 | |
| | | | | | | |
| Land | | $ | 3,374,095 | | | $ | 2,384,393 | |
| Buildings | | | 9,874,157 | | | | 7,021,830 | |
| Construction in progress | | | 2,367,319 | | | | 3,205,990 | |
| Leasehold improvements | | | 1,007,864 | | | | 908,454 | |
| Automobiles | | | 55,818 | | | | 55,818 | |
| Furniture and equipment | | | 3,902,459 | | | | 3,227,824 | |
| | | | 20,581,712 | | | | 16,804,309 | |
| | | | | | | | | |
| Less accumulated depreciation | | | 2,984,210 | | | | 2,266,570 | |
| | | $ | 17,597,502 | | | $ | 14,537,739 | |
Notes to Consolidated Financial StatementsFor the years ended December 31, 2008, 2007 and 2006
Note 7. Property and Equipment, continued
Components of Property and Equipment, continued Depreciation expense reported in net income was approximately $754,000, $544,000, and $383,000 for the years ended December 31, 2008, 2007 and 2006, respectively.
Leases
The Bank leases several banking facilities and its operations center under agreements accounted for as operating leases. Rent expense was approximately $412,000, $378,000, and $260,000 in 2008, 2007, and 2006, respectively. Future minimum lease payments under non-cancelable commitments are as follows.
| 2009 | | $ | 366,081 | |
| 2010 | | | 258,688 | |
| 2011 | | | 151,386 | |
| 2012 | | | 132,550 | |
| 2013 | | | 104,100 | |
| Thereafter | | | 147,150 | |
| | | $ | 1,159,955 | |
Note 8. Intangible Assets
The book value of purchased intangible assets at December 31, 2008 and 2007 was $416,194 and $673,374, respectively. Details are as follows:
| | | As of December 31, 2008 | | | As of December 31, 2007 | |
| | | Gross Carrying | | | Accumulated | | | Gross Carrying | | | Accumulated | |
| | | Amount | | | Amortization | | | Amount | | | Amortization | |
| | | | | | | | | | | | | |
| Amortized intangible assets | | | | | | | | | | | | |
| Deposit premium | | $ | 2,439,919 | | | $ | 2,050,390 | | | $ | 2,439,919 | | | $ | 1,813,210 | |
| Other | | | 200,000 | | | | 173,335 | | | | 200,000 | | | | 153,335 | |
| Total | | $ | 2,639,919 | | | $ | 2,223,725 | | | $ | 2,639,919 | | | $ | 1,966,545 | |
| | | | | | | | | | | | | | | | | |
| Unamortized intangible assets | | | | | | | | | | | | | | | | |
| Goodwill from The Bank of | | | | | | | | | | | | | | | | |
| Heath Springs merger | | $ | 2,727,152 | | | $ | n/a | | | $ | 2,727,152 | | | $ | n/a | |
Amortization expense is calculated on a straight-line basis over a period of ten years and was approximately $257,000, $257,000, and $247,000 in 2008, 2007, and 2006, respectively. Management expects amortization expense to be approximately $150,000 in each of the next two years.
Note 9. Deposits
Time deposits in denominations of $100,000 or more were $155.6 million and $142.5 million at December 31, 2008 and 2007, respectively. Interest expense on such deposits aggregated approximately $7.0 million and $6.3 million in 2008 and 2007, respectively. Time deposits in denominations of $100,000 or more, maturing subsequent to December 31, 2008 are as follows (amounts in thousands):
Notes to Consolidated Financial StatementsFor the years ended December 31, 2008, 2007 and 2006
Note 9. Deposits, continued
Large Time Deposit Maturities, (thousands)
| 2009 | | $ | 120,435 | |
| 2010 | | | 32,844 | |
| 2011 | | | 1,754 | |
| 2012 | | | 442 | |
| 2013 | | | 1,103 | |
| Total time deposits of $100,000 or more | | $ | 155,578 | |
Note 10. Borrowed Funds
Other short-term borrowings
Securities sold under agreements to repurchase and federal funds purchased generally mature within one day to 12 months from the transaction date. Also included in other short-term borrowings is one variable rate FHLB advance of $6,000,000 at December 31, 2008. There were three variable rate FHLB advances of $5,000,000, $2,000,000 and $6,000,000 at December 31, 2007. Also included in other short-term borrowings were a $1,000,000 line of credit at the Prime lending rate that will mature on July 1, 2010 and $3,000,000 of subordinated notes bearing interest at 3-month LIBOR plus 350 basis points that will mature on July 1, 2015, both of which are funded by Nexity Bank.
The Company’s loan agreement with Nexity Bank, for the two debt obligations noted above, includes financial covenants requiring the Bank to maintain a minimum weighted average return on assets of greater than 0.35% on an annualized basis, maintain total equity capital of $43,499,000 at all times and the percentage of non-performing loans to gross loans shall not exceed 4.00%. The Company did not meet these covenants in 2008, but obtained a waiver through December 31, 2008. As such, both debt obligations have been classified in other short-term borrowings due to the covenant violations.
Additional information is summarized below:
| | | 2008 | | | 2007 | |
| | | | | | | |
| Outstanding balance at December 31 | | $ | 10,000,000 | | | $ | 28,429,300 | |
| Year-end weighted average rate | | | 2.38 | % | | | 4.47 | % |
| Daily average outstanding during the period | | $ | 15,411,129 | | | $ | 4,958,775 | |
| Average rate for the year | | | 3.37 | % | | | 4.70 | % |
| Maximum outstanding at any month-end during the period | | $ | 35,015,000 | | | $ | 32,257,300 | |
Securities sold under agreements to repurchase
In December 2007, the Bank entered into to structured repo obligation with Barclays Capital, Inc. in the amount of $20 million. Additional information is summarized below:
| | | 2008 | | | 2007 | |
| | | | | | | |
| Outstanding balance at December 31 | | $ | 23,380,000 | | | $ | 29,222,000 | |
| Year-end weighted average rate | | | 3.63 | % | | | 3.82 | % |
| Daily average outstanding during the period | | $ | 27,232,822 | | | $ | 8,392,806 | |
| Average rate for the year | | | 3.86 | % | | | 3.82 | % |
| Maximum outstanding at any month-end during the period | | $ | 28,095,000 | | | $ | 25,394,000 | |
Securities sold under agreements to repurchase are reflected at the amount of cash received in connection with the transaction. The Company may be required to provide additional collateral based on the fair value of the underlying securities.
Notes to Consolidated Financial Statements
For the years ended December 31, 2008, 2007 and 2006
Note 10. Borrowed Funds, continued
Securities sold under agreements to repurchase, continued
Securities sold under agreements to repurchase (“repos”) include overnight and term agreements. The overnight securities sold under agreements to repurchase are collateralized financing transactions and are primarily executed with local Bank customers. Overnight repos totaled $3.8 million and $9.2 million at December 31, 2008 and 2007, respectively. We believe the decline in the volume of overnight repos was primarily a result of our reduction of the interest rates paid on these funds, as short-term market interest rates declined during 2008.
Our term repos totaled $20.0 million at both December 31, 2008 and 2007 and include embedded derivatives. These structured repos consist of $10.0 million with a fixed interest rate and a ten year term, $3.5 million with a fixed interest rate and a ten year term, $3.5 million with a fixed interest rate and a ten year term and $3.0 million with a fixed interest rate and a two year term. The Bank has the right to cancel the repurchase agreements totaling $13.5 million in 2009 and $3.5 million in 2010.
Unused lines of credit
The Bank has established credit facilities to provide additional liquidity if and as needed. These consist of unsecured lines of credit with correspondent banks for $20,500,000. In addition, the Bank has the ability to borrow up to ten percent of total bank assets from the Federal Home Loan Bank of Atlanta, subject to the pledging of specific bank assets as collateral. At December 31, 2008 there were no amounts outstanding under these credit facilities and at December 31, 2007 there was $15,429,300 outstanding.
Long-term debt
At December 31, 2008 and 2007, $42,500,000 and $25,500,000, respectively were outstanding under Federal Home Loan Bank advances. Approximately $30,000,000 in 1-4 family residential loans, $43,000,000 in commercial real estate loans $23,000,000 in home equity line of credit loans were pledged as collateral for the FHLB advances at December 31, 2008.
| Maturity Date | | Advance | | Rate |
| | | | | |
| 02/10/10 | | $ | 2,500,000 | | Fixed at 5.85 Convertible by FHLB quarterly at 3 Mo LIBOR - ARC |
| 09/02/11 | | | 5,000,000 | | Fixed at 3.76% |
| 07/12/12 | | | 9,000,000 | | 1 Month LIBOR - .50% |
| 09/04/12 | | | 6,000,000 | | Fixed at 4.00% |
| 09/03/13 | | | 6,000,000 | | Fixed at 4.15% |
| 12/02/13 | | | 5,000,000 | | 3 Month LIBOR - .50% |
| 09/29/15 | | | 4,000,000 | | Fixed at 4.06% Convertible by FHLB 9/29/09 at 3 Mo LIBOR - ARC |
| 04/22/19 | | | 5,000,000 | | 3 Month LIBOR - .50% Convertible 4/22/09 at 4.75% Fixed Rate |
| | | $ | 42,500,000 | | |
Note 11. Guaranteed Preferred Beneficial Interests in the Company’s Junior Subordinated Debentures
The Company has issued $12.4 million of Junior Subordinated debentures to its wholly owned capital trusts, Waccamaw Statutory Trust I and Waccamaw Statutory Trust II, to fully and unconditionally guarantee the preferred securities issued by the Trusts. These long term obligations, which currently qualify as Tier I capital for the Company, constitute a full and unconditional guarantee by the Company of the Trusts’ obligations under the Capital Trust Securities. In accordance with FIN 46R, the trusts are not consolidated in the Company’s financial statements.
Waccamaw Statutory Trust I, a statutory business trust (the Trust), was created by the Company on December 17, 2003, at which time the Trust issued $8,000,000 in aggregate liquidation amount of preferred capital trust securities which mature December 17, 2033. Distributions are payable on the securities at a floating rate indexed to the 3-month London
Notes to Consolidated Financial Statements
For the years ended December 31, 2008, 2007 and 2006
Note 11. Guaranteed Preferred Beneficial Interests in the Company’s Junior Subordinated Debentures, continued
Interbank Offered Rate (“LIBOR”), and the securities may be prepaid at par by the Trust at any time after December 17, 2008. The principal assets of the Trust are $8.2 million of the Company’s junior subordinated debentures which mature on December 17, 2033, and bear interest at a floating rate indexed to the 3-month LIBOR, and which are callable by the Company after December 17, 2008. All $248 thousand in aggregate liquidation amount of the Trust’s common securities are held by the Company.
Waccamaw Statutory Trust II, a statutory business trust (the Trust), was created by the Company on July 18, 2008, at which time the Trust issued $4,000,000 in aggregate liquidation amount of preferred capital trust securities which mature October 1, 2038. Distributions are payable on the securities at a floating rate indexed to the 3-month London Interbank Offered Rate (“LIBOR”), and the securities may be prepaid at par by the Trust at any time after July 18, 2013. The principal assets of the Trust are $4.1 million of the Company’s junior subordinated debentures which mature on October 1, 2038, and bear interest at a floating rate indexed to the 3-month LIBOR, and which are callable by the Company after July 18, 2013. All $124 thousand in aggregate liquidation amount of the Trust’s common securities are held by the Company.
The Trust’s preferred securities may be included in the Company’s Tier I capital for regulatory capital adequacy purposes to the extent that they do not exceed 33.3% of the Company’s total Tier I capital excluding these securities. Amounts in excess of this ratio will not be considered Tier I capital but may be included in the calculation of the Company’s total risk-based capital ratio. The Company’s obligations with respect to the issuance of the Trust’s preferred securities and common securities constitute a full and unconditional guarantee by the Company of the Trust’s obligations with respect to the preferred securities and common securities. Subject to certain exceptions and limitations, the Company may elect from time to time to defer interest payments on its junior subordinated debentures, which would result in a deferral of distribution payments on the Trust’s preferred trust securities and common securities.
Note 12. Fair Value of Financial Instruments
The Company adopted Statements of Financial Accounting Standards No. 157 Fair Value Measurements (“SFAS 157”), effective January 1, 2008. SFAS 157 defines fair value, establishes a framework for measuring fair value in GAAP, and expands disclosures about fair value measurements. The Company utilizes fair value measurements to record fair value adjustments to certain assets and liabilities and to determine fair value disclosures. Securities available-for-sale are recorded at fair value on a recurring basis. From time to time, the Company may be required to adjust at fair value other assets on a nonrecurring basis, such as loans held for sale and other certain assets. These nonrecurring fair value adjustments typically involve application of lower of cost or market accounting write-downs of individual assets.
The following is a description of valuation methodologies used for assets and liabilities recorded at fair value.
Investment Securities Available-for-Sale
Investment securities available-for-sale are recorded at fair value on a recurring basis. Fair value measurement is based upon quoted prices, if available. If quoted prices are not available, fair values are measured using independent pricing models or other model-based valuation techniques such as present value of future cash flows, adjusted for the security’s credit rating, prepayment assumptions and other factors such as credit loss assumptions. Level 1 securities include those traded on an active exchange, such as the New York Stock Exchange, U.S. Treasury securities that are traded by dealers or brokers in active over-the-counter markets and money market funds. Level 2 securities include mortgage-backed securities issued by government sponsored entities, municipal bonds and corporate debt securities. Securities classified as Level 3 include asset-backed securities in less liquid markets.
Loans
The Company does not record loans at fair value on a recurring basis. However, from time to time, a loan is considered impaired and an allowance for loan losses is established. Loans for which it is probable that payment of interest and principal will not be made in accordance with the contractual terms of the loan agreement are considered
Notes to Consolidated Financial Statements
For the years ended December 31, 2008, 2007 and 2006
Note 12. Fair Value of Financial Instruments, continued
impaired. Once a loan is identified as individually impaired, management measures impairment in accordance with SFAS 114, Accounting by Creditors for Impairment of Loans, (SFAS 114). The fair value of impaired loans is estimated using one of several methods, including collateral value, market value of similar debt, enterprise value, liquidation value, and discounted cash flows. Those impaired loans not requiring an allowance represent loans for which the fair value of the expected repayments or collateral exceed the recorded investments in such loans. As of December 31, 2008, the Bank identified $25.2 million in impaired loans. Of these impaired loans, $22.8 million were identified to have impairment of $3.6 million. The determination of impairment was based on the fair market value of collateral for each loan. In situations where management discounts appraised values in determining fair value of appraisals, these levels will be considered to be a Level 3 input.
The following table summarizes quantitative disclosures about the fair value measurement for each category of assets carried at fair value as of December 31, 2008.
| (Dollars in thousands) | | | | | Quoted Prices in | | | Significant Other | | | Significant | |
| | | | | | Active Markets for | | | Observable | | | Unobservable | |
| | | December 31, | | | Identical Assets | | | Inputs | | | Inputs | |
| Description | | 2008 | | | (Level 1) | | | (Level 2) | | | (Level 3) | |
| | | | | | | | | | | | | |
| Investment Securities | | | | | | | | | | | | |
| Available for Sale | | $ | 87,403 | | | | - | | | $ | 83,464 | | | $ | 3,939 | |
| Impaired Loans | | $ | 19,258 | | | | - | | | $ | - | | | $ | 19,258 | |
The following table presents additional information about financial assets and liabilities measured at fair value at December 31, 2008, on a recurring basis and for which Level 3 inputs are utilized to determine fair value:
| | | Available | |
| | | for Sale | |
| | | Securities | |
| | | (In thousands) | |
| | | | |
| Balance, January 1, 2008 | | $ | - | |
| Total gains or losses (realized/unrealized) | | | - | |
| Included in earnings (or changes in net assets) | | | | |
| Included in other comprehensive income | | | - | |
| Purchases, issuances, and settlements | | | - | |
| Transfers in and/or out of Level 3 | | | 3,939 | |
| Balance, December 31, 2008 | | $ | 3,939 | |
SFAS No. 107, Disclosures about Fair Value of Financial Instruments, requires disclosure of fair value information about financial instruments, whether or not recognized in the Statement of Condition, for which it is practicable to estimate that value. In cases where quoted market prices are not available, fair values are based on estimates using present value or other valuation techniques. Those techniques are significantly affected by the assumptions used, including the discount rate and estimates of future cash flows. In that regard, the derived fair value estimates cannot be substantiated by comparison to independent markets and, in many cases, could not be realized in immediate settlement of the instrument. The use of different market assumptions and/or estimation methodologies may have a material effect on the estimated fair value amounts. Also, the fair value estimates presented herein are based on pertinent information available to Management as of December 31, 2008 and 2007. Such amounts have not been comprehensively revalued for purposes of these financial statements since those dates, and, therefore, current estimates of fair value may differ significantly from the amounts presented herein.
Notes to Consolidated Financial Statements
For the years ended December 31, 2008, 2007 and 2006
The following methods and assumptions were used by the Company in estimating its fair value disclosures for financial instruments:
Note 12. Fair Value of Financial Instruments, continued
CASH AND DUE FROM BANKS, INTEREST-BEARING DEPOSITS WITH BANKS AND FEDERAL FUNDS SOLD — For those short-term instruments, the carrying amount is a reasonable estimate of fair value.
INVESTMENT SECURITIES — Fair values for securities available for sale are primarily based on quoted market prices. If a quoted market price is not available, fair value is estimated using market prices for similar securities.
RESTRICTED EQUITY SECURITIES — The carrying value of the restricted equity securities approximates fair value based on the redemption provisions of the respective issuer.
LOANS — For equity lines and other loans with short-term or variable rate characteristics, the carrying value reduced by an estimate for credit losses inherent in the portfolio is a reasonable estimate of fair value. The fair value of all other loans is estimated by discounting their future cash flows using interest rates currently being offered for loans with similar terms, reduced by an estimate of credit losses inherent in the portfolio. The discount rates used are commensurate with the interest rate and prepayment risks involved for the various types of loans.
DEPOSITS — The fair value disclosed for demand deposits (i.e., interest- and non-interest-bearing demand, savings and money market savings) is equal to the amounts payable on demand at the reporting date (i.e., their carrying amounts). Fair values for certificates of deposit are estimated using a discounted cash flow calculation that applies interest rates currently being offered on certificates of deposit to a schedule of aggregated monthly maturities.
SECURITIES SOLD UNDER AGREEMENTS TO REPURCHASE, FEDERAL FUNDS PURCHASED AND OTHER SHORT-TERM BORROWINGS — For these short-term liabilities, the carrying amount is a reasonable estimate of fair value.
FHLB ADVANCES, LONG-TERM DEBT AND JUNIOR SUBORDINATED DEBENTURES — The fair value of the Company’s fixed rate borrowings are estimated using discounted cash flows, based on the Company’s current incremental borrowing rates for similar types of borrowing arrangements. The carrying amount of the Company’s variable rate borrowings approximates their fair values.
COMMITMENTS TO EXTEND CREDIT AND STANDBY LETTERS OF CREDIT —As no significant credit exposure exists, and because such fee income is not material to the Company’s financial statements at December 31, 2008 and 2007, the fair value of these commitments is not presented.
The estimated fair values of the Company’s financial instruments are as follows (dollars in thousands):
| | | December 31, 2008 | | | December 31, 2007 | |
| | | Carrying | | | Fair | | | Carrying | | | Fair | |
| | | Amount | | | Value | | | Amount | | | Value | |
| Financial Assets | | | | | | | | | | | | |
| Cash and due from banks | | $ | 8,948 | | | $ | 8,948 | | | $ | 11,809 | | | $ | 11,809 | |
| Interest-bearing deposits with banks | | | 2,685 | | | | 2,685 | | | | 912 | | | | 912 | |
| Federal funds sold | | | 4,281 | | | | 4,281 | | | | - | | | | - | |
| Investment securities | | | 87,403 | | | | 87,403 | | | | 99,302 | | | | 99,302 | |
| Restricted equity securities | | | 4,132 | | | | 4,132 | | | | 3,342 | | | | 3,342 | |
| Loans, net of allowance for loan losses | | | 378,883 | | | | 381,398 | | | | 355,138 | | | | 355,661 | |
| | | | | | | | | | | | | | | | | |
| Financial Liabilities | | | | | | | | | | | | | | | | |
| Deposits | | | 418,580 | | | | 418,815 | | | | 378,179 | | | | 378,783 | |
| Securities sold under agreements to | | | | | | | | | | | | | | | | |
| repurchase and federal funds purchased | | | 23,830 | | | | 23,830 | | | | 44,651 | | | | 44,651 | |
| Other short-term borrowings | | | 10,000 | | | | 10,000 | | | | 13,000 | | | | 13,000 | |
| Long-term debt | | | 42,500 | | | | 40,375 | | | | 25,500 | | | | 24,698 | |
| Junior subordinated debentures | | | 12,372 | | | | 12,000 | | | | 8,248 | | | | 8,000 | |
Notes to Consolidated Financial Statements
For the years ended December 31, 2008, 2007 and 2006
Note 13. Earnings per Share
The following table details the computation of basic and diluted earnings per share:
| | | 2008 | | | 2007 | | | 2006 | |
| | | | | | | | | | |
| Net income (loss) | | $ | (2,043,030 | ) | | $ | 3,908,948 | | | $ | 3,652,016 | |
| | | | | | | | | | | | | |
| Weighted average common shares outstanding | | | 5,490,982 | | | | 5,365,617 | | | | 5,127,107 | |
| Effect of dilutive securities, options | | | - | | | | 33,719 | | | | 127,246 | |
| Effect of dilutive securities, preferred stock | | | - | | | | 64,297 | | | | 65,111 | |
| Weighted average common shares outstanding, diluted | | | 5,490,982 | | | | 5,463,633 | | | | 5,319,464 | |
| | | | | | | | | | | | | |
| Basic income (loss) per share | | $ | (.37 | ) | | $ | .73 | | | $ | .71 | |
| Diluted income (loss) per share | | $ | (.37 | ) | | $ | .72 | | | $ | .69 | |
At December 31, 2008, 296,899 warrants were outstanding with a $21.82 per share exercise price. These warrants may be used to purchase one share of the Company’s common stock at any time until September 30, 2009. Exercise of these warrants, the Company’s convertible preferred stock and 302,000 options are not assumed in computing 2008 diluted earnings per share due to the net loss of for the year ended December 31, 2008. The Company’s Series A convertible preferred stock and shares associated with stock-based compensation have been excluded from the computation of dilutive EPS as the result would be anti-dilutive.
Note 14. Employment Agreements
The Company has entered into employment agreements with certain key officers to ensure a stable and competent management base. In the event of a change in control of the Company, as defined in the agreements, the acquirer will be bound to the terms of the agreements.
Note 15. Benefit Plans
Defined Contribution Plan
The Bank maintains a profit sharing plan pursuant to Section 401(k) of the Internal Revenue Code. The plan covers substantially all employees at least 21 years of age who have completed at least one month of service. Participants may contribute a percentage of compensation, subject to a maximum allowed under the Code. The bank contributes up to 3% of an employee’s compensation who have completed at least twelve months of service which vests over a five-year period. The Bank’s aggregate contribution was $110,000, $48,000 and $48,750 for the years ended December 31, 2008, 2007 and 2006, respectively.
Supplemental Employment Retirement Plan
Supplemental benefits have been approved by the Board of Directors for the directors and certain executive officers of Waccamaw Bank. Certain funding is provided informally and indirectly by life insurance policies. The cash surrender value of the life insurance policies are recorded as a separate line item in the accompanying balance sheets of $17,834,763 and $11,777,361 at December 31, 2008 and 2007, respectively. Income earned on these policies is reflected as a separate line item in the Consolidated Statements of Income. The Company recorded expenses of $240,675 and a liability of $242,444 related to these benefits in 2008 and expenses and a liability of $71,264 in 2007.
Notes to Consolidated Financial Statements
For the years ended December 31, 2008, 2007 and 2006
Note 15. Benefit Plans, continued
Stock Option Plans
The Company’s Board of Directors has adopted the Waccamaw Bankshares, Inc. 2008 Omnibus Stock Ownership and Long Term Incentive Plan. In accordance with the Company’s plan, the Company may grant Incentive Stock Options, Non-Qualified Stock Options, Restricted Stock, Stock Appreciation Rights and/or Units and up to 705,973 shares of common stock may be issued (adjusted for stock dividends). Options granted under the plan expire no more than 10 years from date of grant. Option exercise price under the plan must be set by the Board of Directors at the date of grant and cannot be less than 100% of fair market value of the related stock at the date of the grant.
Under the plan, vesting is determined by the specific option agreements. It is the Company’s policy to issue new shares to satisfy option exercises. Both the 1998 Incentive Stock Option Plan (Incentive Plan) and the 1998 Nonstatutory Stock Option Plan (Nonstatutory Plan) expired in 2008, as the options not granted under these plans were terminated and the remaining options under these plans have a maximum term of ten years from the original grant date.
As described in Note 1, effective January 1, 2006, the Company adopted SFAS No. 123(R) using the modified prospective application. Under this application, the Company is required to record compensation expense for all rewards granted after the date of adoption and for the unvested portion of previously granted awards that remain outstanding at the date of adoption. Compensation cost charged to income was approximately $127,000, $99,000 and $88,000 for the years ended December 31, 2008, 2007 and 2006, respectively.
The weighted average fair value of each stock option grant is estimated on the date of grant using the Black-Scholes option-pricing model. The weighted average estimated fair values of stock options grants and the assumptions that were used in calculating such fair values were based on estimates at the date of grant as follows:
| | | 2008 | | | 2007 | | | 2006 | |
| | | | | | | | | | |
| Weighted average fair value of options granted | | | | | | | | | |
| during the year | | $ | 3.93 | | | $ | 5.02 | | | $ | 6.88 | |
| | | | | | | | | | | | | |
| Assumptions: | | | | | | | | | | | | |
| Average risk free interest rate | | | 3.80 | % | | | 4.76 | % | | | 6.25 | % |
| Average expected volatility | | | 40.02 | % | | | 25.00 | % | | | 9.10 | % |
| Expected dividend rate | | | - | % | | | - | % | | | - | % |
| Expected life in years | | | 10 | | | | 10 | | | | 10 | |
Cash received from option exercises under the plans for the year ended December 31, 2008 and 2007 was $165,774 and $97,979, respectively. The total intrinsic value of options exercised during year ended December 31, 2008 and 2007 was $449,900 and $1,105,751, respectively. During 2007, 19,956 shares of common stock with an average market value of approximately $13.58 per share were exchanged to exercise 89,395 options with an average exercise price of approximately $3.03 per option. No such exchanges were exercised during 2008.
In 2008, the shareholders approved an equity compensation plan (the “2008 Omnibus Stock Ownership and Long Term Incentive Plan (the “Omnibus Plan”)) providing for the issuance of up to 705,973 options to purchase shares of the Company’s stock to officers and directors which replaced the Company’s Employee Stock and Director Stock Option Plans (the “Previous Plans”). After the approval of the Omnibus Plan, no further options have been or will be issued under the Previous Plans. The term of the Omnibus Plan is indefinite, except that no incentive stock option award can be granted after the tenth anniversary of the plan. The Omnibus Plan provides that shares of common stock may be granted to certain key employees and outside director through non-qualified stock options, incentive stock options, stock available for rights, restricted stock, performance awards or any other award made under the terms of the plan. The Board of Directors determines the exercise price and all other terms of all grants.
Notes to Consolidated Financial Statements
For the years ended December 31, 2008, 2007 and 2006
Note 15. Benefit Plans, continued
Stock Option Plans, continued
Activity under the plan during the years ended December 31, 2008 is summarized below:
| | | 2008 Omnibus Stock Ownership | |
| | | and Long Term Incentive Plan | |
| | | Available | | | | |
| | | for Grant | | | Granted | |
| | | | | | | |
| Balance December 31, 2007 | | | - | | | | - | |
| | | | | | | | | |
| Authorization of options to purchase shares of | | | | | | | | |
| Company stock under Omnibus Plan | | | 705,973 | | | | - | |
| Forfeited | | | - | | | | - | |
| Granted | | | (26,500 | ) | | | 26,500 | |
| Exercised | | | - | | | | - | |
| Balance December 31, 2008 | | | 679,473 | | | | 26,500 | |
A summary of option activity under the plans as of and changes during the year ended December 31, 2008 is presented below:
| | | | | | Weighted | | | Average | | | | |
| | | | | | Average | | | Remaining | | | Aggregate | |
| | | Options | | | Exercise | | | Contractual | | | Intrinsic | |
| | | Outstanding | | | Price | | | Term | | | Value | |
| | | | | | | | | | | | | |
| Outstanding at December 31, 2007 | | | 367,656 | | | $ | 12.72 | | | | | | | | | |
| Granted | | | 44,500 | | | $ | 8.88 | | | | | | | | | |
| Forfeited | | | (4,752 | ) | | $ | 12.43 | | | | | | | | | |
| Exercised | | | (68,786 | ) | | $ | 2.41 | | | | | | | | | |
| Expired | | | (9,129 | ) | | $ | 2.41 | | | | | | | | | |
| Outstanding at December 31, 2008 | | | 329,489 | | | $ | 14.64 | | | 6.8 years | | | $ | 3,733 | |
| Exercisable at December 31, 2008 | | | 256,251 | | | $ | 15.57 | | | 6.3 years | | | $ | 3,733 | |
The total fair value of options that were contractually vested during 2008 and 2007 was $97,147 and $98,729, respectively.
As of December 31, 2008, the Company had unamortized compensation expense related to unvested stock options of $309,848, which is expected to be amortized over 5 years. Total unrecognized compensation cost related to outstanding non-vested stock options will be recognized over the following periods:
| | $ | 120,436 | |
| 2010 | | | 78,631 | |
| 2011 | | | 60,777 | |
| 2012 | | | 39,603 | |
| | | 10,401 | |
| Total | | $ | 309,848 | |
Notes to Consolidated Financial Statements
For the years ended December 31, 2008, 2007 and 2006
Note 16. Income Taxes
Current and Deferred Income Tax Components
The components of income tax expense are as follows:
| | | 2008 | | | 2007 | | | 2006 | |
| | | | | | | | | | |
| Current | | $ | 53,872 | | | $ | 2,264,685 | | | $ | 2,517,474 | |
| Deferred | | | (1,881,102 | ) | | | (215,944 | ) | | | (307,088 | ) |
| Income tax expense (benefit) | | $ | (1,827,230 | ) | | $ | 2,048,741 | | | $ | 2,210,386 | |
Rate Reconciliation
A reconciliation of income tax expense computed at the statutory federal income tax rate included in the statement of income follows:
| | | 2008 | | | 2007 | | | 2006 | |
| | | | | | | | | | |
| Tax at statutory federal rate | | $ | (1,315,888 | ) | | $ | 2,025,614 | | | $ | 1,993,217 | |
| Tax exempt interest | | | (213,861 | ) | | | (205,562 | ) | | | (123,480 | ) |
| Tax exempt income from bank owned life insurance | | | (186,304 | ) | | | (132,654 | ) | | | (81,599 | ) |
| State income tax, net of federal benefit | | | (184,509 | ) | | | 228,551 | | | | 276,276 | |
| Other | | | 73,332 | | | | 132,792 | | | | 145,972 | |
| Income tax expense (benefit) | | $ | (1,827,230 | ) | | $ | 2,048,741 | | | $ | 2,210,386 | |
Deferred Income Tax Analysis
The components of net deferred federal and state tax assets (included in other assets on the balance sheet) are summarized as follows:
| | | 2008 | | | 2007 | |
| Deferred tax assets | | | | | | |
| Allowance for loan losses | | $ | 2,625,492 | | | $ | 1,914,477 | |
| OTTI on investments | | | 1,290,965 | | | | - | |
| Employment benefit liability | | | 93,472 | | | | 32,468 | |
| Deposit premium amortization | | | 326,737 | | | | 285,977 | |
| Deferred loan fees | | | 148,482 | | | | 174,717 | |
| Other | | | 848 | | | | - | |
| Unrealized loss on securities available for sale | | | 3,152,622 | | | | 397,582 | |
| Deferred tax assets | | | 7,638,618 | | | | 2,805,221 | |
| | | | | | | | | |
| Deferred tax liabilities | | | | | | | | |
| Depreciation | | | (559,247 | ) | | | (382,880 | ) |
| Accretion of bond discount | | | (85,533 | ) | | | (64,645 | ) |
| | | | | | | | | |
| | | (644,780 | ) | | | (447,525 | ) |
| Net deferred tax asset | | $ | 6,993,838 | | | $ | 2,357,696 | |
The Company does not maintain a valuation allowance. Based on historical and budgeted earnings, management believes it is more likely than not the Company will realize the expense of its deferred tax asset.
The Company had analyzed the tax positions taken or expected to be taken in and its tax returns and concluded it has no liability related to uncertain tax positions in accordance with FIN 48 for year ending December 31, 2007. The Company’s federal and state income tax returns are open and subject to examination from the 2005 tax return year and forward.
Notes to Consolidated Financial Statements
For the years ended December 31, 2008, 2007 and 2006
Note 17. Commitments and Contingencies
Litigation
In the normal course of business the Bank is involved in various legal proceedings. After consultation with legal counsel, management believes that any liability resulting from such proceedings will not be material to the financial statements.
Financial Instruments with Off-Balance-Sheet Risk
To meet the financing needs of its customers, the Bank is party to financial instruments with off-balance-sheet risk in the normal course of business. These financial instruments include commitments to extend credit and standby letters of credit. These instruments involve, to varying degrees, credit risk in excess of the amount recognized in the balance sheet.
The Bank's exposure to credit loss in the event of nonperformance by the other party to the financial instrument for commitments to extend credit and standby letters of credit is represented by the contractual amount of those instruments. The Bank uses the same credit policies in making commitments and conditional obligations as for on-balance-sheet instruments. A summary of the Bank's commitments are as follows:
| | | 2008 | | | 2007 | |
| | | | | | | |
| Commitments to extend credit | | $ | 41,067,000 | | | $ | 48,600,000 | |
| Stand-by letters of credit | | | 3,194,000 | | | | 4,509,000 | |
| | | $ | 44,261,000 | | | $ | 53,109,000 | |
Commitments to extend credit are agreements to lend to a customer as long as there is no violation of any condition established in the contract. Commitments generally have fixed expiration dates or other termination clauses and may require payment of a fee. Since many of the commitments are expected to expire without being drawn upon, the total commitment amounts do not necessarily represent future cash requirements. The Bank evaluates each customer's creditworthiness on a case-by-case basis. The amount of collateral obtained, if deemed necessary by the Bank upon extension of credit, is based on management's credit evaluation of the party. Collateral held varies, but may include accounts receivable, inventory, property and equipment, residential real estate and income-producing commercial properties.
Standby letters of credit are conditional commitments issued by the Bank to guarantee the performance of a customer to
a third party. Those guarantees are primarily issued to support public and private borrowing arrangements. The credit risk involved in issuing letters of credit is essentially the same as that involved in extending loan facilities to customers. Collateral held varies as specified above and is required in instances which the Bank deems necessary.
Concentrations of Credit Risk
Substantially all of the Bank's loans and commitments to extend credit have been granted to customers in the Bank's market area and such customers are generally depositors of the Bank. The concentrations of credit by type of loan are set forth in Note 5. The distribution of commitments to extend credit approximates the distribution of loans outstanding. The Bank's primary focus is toward commercial, consumer and small business transactions, and accordingly, it does not have a significant number of credits to any single borrower or group of related borrowers in excess of $4,000,000.
The Bank from time to time has cash and cash equivalents on deposit with financial institutions which exceed federally-insured limits.
Notes to Consolidated Financial Statements
For the years ended December 31, 2008, 2007 and 2006
Note 18. Regulatory Restrictions
Dividends
The Company’s dividend payments will be made from dividends received from the Bank. The Bank, as a North Carolina banking corporation, may pay dividends only out of undivided profits (retained earnings) as determined pursuant to North Carolina General Statutes Section 53-87. However, regulatory authorities may limit payment of dividends by any bank when it is determined that such a limitation is in the public interest and is necessary to ensure financial soundness of the Bank.
Capital Requirements
The Company (on a consolidated basis) and the Bank are subject to various regulatory capital requirements administered by federal banking agencies. Failure to meet minimum capital requirements can initiate certain mandatory (and possibly additional discretionary) actions by regulators that, if undertaken, could have a direct material effect on the Company’s and the Bank’s financial statements. Under capital adequacy guidelines and the regulatory framework for prompt corrective action, the Company and the Bank must meet specific capital guidelines that involve quantitative measures of their assets, liabilities, and certain off-balance-sheet items as calculated under regulatory accounting practices. The capital amounts and classification are also subject to qualitative judgments by the regulators about components, risk weightings, and other factors.
Quantitative measures established by regulation to ensure capital adequacy require the Company and the Bank to maintain minimum amounts and ratios (set forth in the table below) of total and Tier I capital to risk-weighted assets, and of Tier I capital to average assets, as all those terms are defined in the regulations. Management believes, as of December 31, 2008 and 2007, that the Company and the Bank met all capital adequacy requirements to which they are subject.
As of December 31, 2008 and 2007, the most recent notification from the Federal Deposit Insurance Corporation categorized the Bank as well capitalized under the regulatory framework for prompt corrective action. To be categorized as well capitalized, an institution must maintain minimum total risk-based, Tier I risk-based, and Tier I leverage ratios as set forth in the following table. There are no conditions or events since the notification that management believes have changed the Bank’s category.
The Company’s and Bank’s actual capital amounts and ratios are also presented in the table (dollars in thousands).
| | | | | | | | | Minimum | |
| | | | | | | | | To Be Well | |
| | | | | | Minimum | | | Capitalized Under | |
| | | | | | Capital | | | Prompt Corrective | |
| | | Actual | | | Required | | | Action Provisions | |
| | | Amount | | | Ratio | | | Amount | | | Ratio | | | Amount | | | Ratio | |
| December 31, 2008 | | | | | | | | | | | | | | | | | | |
| Total capital to risk- weighted assets | | | | | | | | | | | | | | | | | | |
| Consolidated | | $ | 52,871 | | | | 11.68 | % | | $ | 36,224 | | | | 8.00 | % | | $ | n/a | | | | n/a | |
| Bank | | $ | 51,709 | | | | 11.44 | % | | $ | 36,136 | | | | 8.00 | % | | $ | 45,170 | | | | 10.00 | % |
| | | | | | | | | | | | | | | | | | | | | | | | | |
| Tier 1 capital to risk- weighted assets | | | | | | | | | | | | | | | | | | | | | | | | |
| Consolidated | | $ | 44,206 | | | | 9.76 | % | | $ | 18,112 | | | | 4.00 | % | | $ | n/a | | | | n/a | |
| Bank | | $ | 43,044 | | | | 9.53 | % | | $ | 18,068 | | | | 4.00 | % | | $ | 27,102 | | | | 6.00 | % |
| | | | | | | | | | | | | | | | | | | | | | | | | |
| Tier 1 capital to average assets | | | | | | | | | | | | | | | | | | | | | | | | |
| Consolidated | | $ | 44,206 | | | | 8.00 | % | | $ | 22,098 | | | | 4.00 | % | | $ | n/a | | | | n/a | |
| Bank | | $ | 43,044 | | | | 7.81 | % | | $ | 22,049 | | | | 4.00 | % | | $ | 27,561 | | | | 5.00 | % |
Notes to Consolidated Financial Statements
For the years ended December 31, 2008, 2007 and 2006
Note 18. Regulatory Restrictions, continued
Capital Requirements, continued
| | | | | | | | | Minimum | |
| | | | | | | | | To Be Well | |
| | | | | | Minimum | | | Capitalized Under | |
| | | | | | Capital | | | Prompt Corrective | |
| | | Actual | | | Required | | | Action Provisions | |
| | | Amount | | | Ratio | | | Amount | | | Ratio | | | Amount | | | Ratio | |
| | | | | | | | | | | | | | | | | | | |
| December 31, 2007 | | | | | | | | | | | | | | | | | | |
| Total capital to risk- weighted assets | | | | | | | | | | | | | | | | | | |
| Consolidated | | $ | 45,591 | | | | 10.88 | % | | $ | 33,509 | | | | 8.00 | % | | $ | n/a | | | | n/a | |
| Bank | | $ | 44,670 | | | | 10.67 | % | | $ | 33,585 | | | | 8.00 | % | | $ | 41,981 | | | | 10.00 | % |
| | | | | | | | | | | | | | | | | | | | | | | | | |
| Tier 1 capital to risk- weighted assets | | | | | | | | | | | | | | | | | | | | | | | | |
| Consolidated | | $ | 40,350 | | | | 9.63 | % | | $ | 16,755 | | | | 4.00 | % | | $ | n/a | | | | n/a | |
| Bank | | $ | 39,429 | | | | 9.42 | % | | $ | 16,792 | | | | 4.00 | % | | $ | 25,189 | | | | 6.00 | % |
| | | | | | | | | | | | | | | | | | | | | | | | | |
| Tier 1 capital to average assets | | | | | | | | | | | | | | | | | | | | | | | | |
| Consolidated | | $ | 40,350 | | | | 8.70 | % | | $ | 18,547 | | | | 4.00 | % | | $ | n/a | | | | n/a | |
| Bank | | $ | 39,429 | | | | 8.53 | % | | $ | 18,497 | | | | 4.00 | % | | $ | 23,121 | | | | 5.00 | % |
Intercompany transactions
Restrictions on loans by the Bank to the Company are imposed by Federal Reserve Act Sections 23A and 23B, and differ from legal lending limits on loans to external customers. Generally, a bank may lend up to 10% of its capital and surplus to its parent or other affiliate, if the loan is secured and so long as certain safety and soundness requirements and market terms requirements are met. If collateral is in the form of stocks, bonds, debentures or similar obligations, it must have a market value when the loan is made of at least 20% more than the amount of the loan, and if obligations of a state or political subdivision or agency thereof, it must have a market value of at least 10% more than the amount of the loan. If such loans are secured by obligations of the United States or agencies thereof, or by notes, drafts, bills of exchange or bankers' acceptances eligible for rediscount or purchase by a Federal Reserve Bank, requirements for collateral in excess of loan amount do not apply. Under this definition, the legal lending limit for the Bank on loans to the Company was approximately $2,900,000 at December 31, 2008. No 23A transactions existed at December 31, 2008 or 2007.
Note 19. Transactions with Related Parties
Loans
The Bank has entered into transactions with its directors, significant shareholders and their affiliates (related parties). Such transactions were made in the ordinary course of business on substantially the same terms and conditions, including interest rates and collateral, as those prevailing at the same time for comparable transactions with other customers, and did not, in the opinion of management, involve more than normal credit risk or present other unfavorable features. Aggregate loan transactions with related parties were as follows:
Notes to Consolidated Financial Statements
For the years ended December 31, 2008, 2007 and 2006
Note 19. Transactions with Related Parties
Loans, continued
| | | 2008 | | | 2007 | |
| | | | | | | |
| Balance, beginning | | $ | 2,634,705 | | | $ | 750,807 | |
| Change in relationships | | | - | | | | (351,277 | ) |
| New loans and advances | | | 2,872,453 | | | | 2,368,863 | |
| Repayments | | | (824,974 | ) | | | (133,688 | ) |
| Balance, ending | | $ | 4,682,184 | | | $ | 2,634,705 | |
Note 20. Parent Company Financial Information
Condensed financial information of Waccamaw Bankshares, Inc. is presented as follows:
Balance Sheets
December 31, 2008 and 2007
| | | 2008 | | | 2007 | |
| Assets | | | | | | |
| Cash and due from banks | | $ | 147,430 | | | $ | 95,302 | |
| Investment in subsidiary bank at equity | | | 40,065,993 | | | | 42,102,173 | |
| Investment securities, available for sale | | | - | | | | 227,735 | |
| Other assets | | | 1,101,130 | | | | 897,068 | |
| Total assets | | $ | 41,314,553 | | | $ | 43,322,278 | |
| | | | | | | | | |
| Liabilities | | | | | | | | |
| Short-term debt | | $ | 1,000,000 | | | $ | - | |
| Junior Subordinated debt | | | 12,372,000 | | | | 8,248,000 | |
| Other liabilities | | | 98,397 | | | | 51,137 | |
| Total liabilities | | | 13,470,397 | | | | 8,299,137 | |
| | | | | | | | | |
| Stockholders' equity | | | | | | | | |
| Preferred stock | | | 464,476 | | | | 793,967 | |
| Common stock | | | 24,591,885 | | | | 23,785,199 | |
| Retained earnings | | | 8,907,591 | | | | 11,124,589 | |
| Accumulated other comprehensive loss | | | (6,119,796 | ) | | | (680,614 | ) |
| Total stockholders' equity | | | 27,844,156 | | | | 35,023,141 | |
| Total liabilities and stockholders' equity | | $ | 41,314,553 | | | $ | 43,322,278 | |
Notes to Consolidated Financial Statements
For the years ended December 31, 2008, 2007 and 2006
Note 20. Parent Company Financial Information, continued
Statements of Operations
Years ended December 31, 2008 and 2007
| | | 2008 | | | 2007 | |
| | | | | | | |
| Income | | | | | | |
| Loans and fees on loans | | $ | 7,139 | | | $ | 14,037 | |
| Investment securities, taxable | | | 57,442 | | | | 40,208 | |
| Investment securities, non-taxable | | | 4,195 | | | | 5,000 | |
| Net realized gains on sale or maturity of investment securities | | | 56,600 | | | | 131,606 | |
| Total income | | | 125,376 | | | | 190,851 | |
| | | | | | | | | |
| Expenses | | | | | | | | |
| Salaries and employee benefits | | | 127,409 | | | | 98,729 | |
| Franchise tax | | | 52,535 | | | | 46,096 | |
| Interest expense | | | 701,520 | | | | 716,591 | |
| Other expenses | | | 1,672 | | | | 2,243 | |
| Total expenses | | | 883,136 | | | | 863,659 | |
| Loss before tax expense and equity in undistributed income of subsidiary | | | (757,760 | ) | | | (672,808 | ) |
| | | | | | | | | |
| Federal income tax benefit | | | 215,745 | | | | 154,643 | |
| State income tax expense | | | (31,043 | ) | | | (10,127 | ) |
| Total income tax benefit | | | 184,702 | | | | 144,516 | |
| Loss before equity in undistributed income of subsidiary | | | (573,058 | ) | | | (528,292 | ) |
| | | | | | | | | |
| Equity in undistributed income (loss) of subsidiary | | | (1,469,972 | ) | | | 4,437,240 | |
| Net income (loss) | | $ | (2,043,030 | ) | | $ | 3,908,948 | |
Notes to Consolidated Financial Statements
For the years ended December 31, 2008, 2007 and 2006
Note 20. Parent Company Financial Information, continued
Statements of Cash Flows
Years ended December 31, 2008 and 2007
| | | 2008 | | | 2007 | |
| Cash flows from operating activities | | | | | | |
| Net income (loss) | | $ | (2,043,030 | ) | | $ | 3,908,948 | |
| Adjustments: | | | | | | | | |
| Amortization | | | 25,583 | | | | 24,000 | |
| Stock-based compensation | | | 127,409 | | | | 98,729 | |
| Tax benefit of non-qualified stock option exercise | | | 184,011 | | | | 60,029 | |
| Accretion of discount on securities, net of amortization of premiums | | | - | | | | 638 | |
| (Gain) on sale of investment securities | | | (56,600 | ) | | | (131,606 | ) |
| Decrease (increase) in equity in undistributed (income) loss of subsidiary | | | 1,469,972 | | | | (4,437,240 | ) |
| (Increase) decrease in other assets | | | (229,645 | ) | | | 148,381 | |
| Increase (decrease) in other liabilities | | | 71,442 | | | | 501 | |
| Net cash used by operating activities | | | (450,858 | ) | | | (327,620 | ) |
| | | | | | | | | |
| Cash flows from investing activities | | | | | | | | |
| Sales of investment securities | | | 213,212 | | | | 206,372 | |
| Investment in subsidiary | | | (5,000,000 | ) | | | - | |
| Net cash provided (used) by investing activities | | | (4,786,788 | ) | | | 206,372 | |
| | | | | | | | | |
| Cash flows from financing activities | | | | | | | | |
| Proceeds of junior subordinated debt | | | 4,124,000 | | | | - | |
| Proceeds of short-term debt | | | 1,000,000 | | | | - | |
| Issuance of stock and redemption of fractional shares | | | 165,774 | | | | 87,815 | |
| Net cash provided by financing activities | | | 5,289,774 | | | | 87,815 | |
| Increase (decrease) in cash and due from banks | | | 52,128 | | | | (33,433 | ) |
| | | | | | | | | |
| Cash and cash equivalents, beginning | | | 95,302 | | | | 128,735 | |
| Cash and cash equivalents, ending | | $ | 147,430 | | | $ | 95,302 | |
Notes to Consolidated Financial Statements
For the years ended December 31, 2008, 2007 and 2006
Note 21. Quarterly Data (Unaudited)
| | | Years Ended December 31, | |
| | | 2008 | | | 2007 | |
| | | Fourth | | | Third | | | Second | | | First | | | Fourth | | | Third | | | Second | | | First | |
| | | Quarter | | | Quarter | | | Quarter | | | Quarter | | | Quarter | | | Quarter | | | Quarter | | | Quarter | |
| | | | | | | | | | | | | | | | | | | | | | | | | |
| Interest income | | $ | 7,180 | | | $ | 7,473 | | | $ | 7,695 | | | $ | 8,137 | | | $ | 8,166 | | | $ | 8,122 | | | $ | 7,907 | | | $ | 7,442 | |
| Interest expense | | | (4,085 | ) | | | (3,965 | ) | | | (4,196 | ) | | | (4,688 | ) | | | (4,499 | ) | | | (4,205 | ) | | | (3,919 | ) | | | (3,674 | ) |
| Net interest income | | | 3,095 | | | | 3,508 | | | | 3,499 | | | | 3,449 | | | | 3,667 | | | | 3,917 | | | | 3,988 | | | | 3,768 | |
| | | | | | | | | | | | | | | | | | | | | | | | | | | | | | | | | |
| Provision for loan losses | | | (2,356 | ) | | | (528 | ) | | | (106 | ) | | | - | | | | - | | | | (8 | ) | | | (2 | ) | | | (375 | ) |
| Net interest income, after provision for loan losses | | | 739 | | | | 2,980 | | | | 3,393 | | | | 3,449 | | | | 3,667 | | | | 3,909 | | | | 3,986 | | | | 3,393 | |
| Non interest income | | | (384 | ) | | | (757 | ) | | | 1,024 | | | | 1,083 | | | | 882 | | | | 833 | | | | 721 | | | | 1,007 | |
| Non interest expenses | | | (3,880 | ) | | | (3,883 | ) | | | (3,771 | ) | | | (3,863 | ) | | | (3,484 | ) | | | (3,062 | ) | | | (3,083 | ) | | | (2,811 | ) |
| Income (loss) before income taxes | | | (3,525 | ) | | | (1,660 | ) | | | 646 | | | | 669 | | | | 1,065 | | | | 1,680 | | | | 1,624 | | | | 1,589 | |
| | | | | | | | | | | | | | | | | | | | | | | | | | | | | | | | | |
| Income tax (expense) benefit | | | 1,418 | | | | 744 | | | | (176 | ) | | | (159 | ) | | | (352 | ) | | | (559 | ) | | | (543 | ) | | | (595 | ) |
| Net income (loss) | | $ | (2,107 | ) | | $ | (916 | ) | | $ | 470 | | | $ | 510 | | | $ | 713 | | | $ | 1,121 | | | $ | 1,081 | | | $ | 994 | |
| | | | | | | | | | | | | | | | | | | | | | | | | | | | | | | | | |
| Earnings per common share: | | | | | | | | | | | | | | | | | | | | | | | | | | | | | | | | |
| Basic income (loss) per share | | $ | (.38 | ) | | $ | (.17 | ) | | $ | .09 | | | $ | .09 | | | $ | .13 | | | $ | .21 | | | $ | .20 | | | $ | .19 | |
| Diluted income (loss) per share | | $ | (.38 | ) | | $ | (.17 | ) | | $ | .09 | | | $ | .09 | | | $ | .13 | | | $ | .20 | | | $ | .20 | | | $ | .18 | |
Report of Independent Registered Public Accounting Firm
To the Board of Directors and Shareholders
Waccamaw Bankshares, Inc. and Subsidiary
Whiteville, North Carolina
We have audited the accompanying consolidated balance sheet of Waccamaw Bankshares, Inc. and Subsidiary (hereinafter referred to as the “Company”) as of December 31, 2008, and the related consolidated statements of income, changes in stockholders’ equity and cash flows for the year then ended. These consolidated financial statements are the responsibility of the Company’s management. Our responsibility is to express an opinion on these consolidated financial statements based on our audit.
We conducted our audit in accordance with the standards of the Public Company Accounting Oversight Board (United States). Those standards require that we plan and perform the audit to obtain reasonable assurance about whether the financial statements are free of material misstatement. We were not engaged to perform an audit of the Company’s internal control over financial reporting. Our audit included consideration of internal control over financial reporting as a basis for designing audit procedures that are appropriate in the circumstances, but not for the purpose of expressing an opinion on the effectiveness of the Company’s internal control over financial reporting. Accordingly, we express no such opinion. An audit also includes examining, on a test basis, evidence supporting the amounts and disclosures in the financial statements, assessing the accounting principles used and significant estimates made by management, as well as evaluating the overall financial statement presentation. We believe that our audit provides a reasonable basis for our opinion.
In our opinion, the consolidated financial statements referred to above present fairly, in all material respects, the financial position of Waccamaw Bankshares, Inc. and Subsidiary as of December 31, 2008, and the results of their operations and their cash flows for the year then ended, in conformity with accounting principles generally accepted in the United States of America.
As discussed in Note 1 to the consolidated financial statements, effective January 1, 2008 the Company adopted Emerging Issues Task Force Issue 06-4, Accounting for Deferred Compensation and Postretirement Benefit Aspects of Endorsement Split-Dollar Life Insurance Arrangements.
Raleigh, North Carolina
March 31, 2009
Report of Independent Registered Public Accounting Firm
Board of Directors and Stockholders
Waccamaw Bankshares, Inc.
Whiteville, North Carolina
We have audited the consolidated balance sheets of Waccamaw Bankshares, Inc. and subsidiary as of December 31, 2007 and 2006 and the related consolidated statements of income, changes in stockholders’ equity and cash flows for each of the two years in the period ended December 31, 2007. These consolidated financial statements are the responsibility of the Company’s management. Our responsibility is to express an opinion on these financial statements based on our audits.
We conducted our audits in accordance with the standards of the Public Company Accounting Oversight Board (United States). Those standards require that we plan and perform the audit to obtain reasonable assurance about whether the financial statements are free of material misstatement. An audit includes examining, on a test basis, evidence supporting amounts and disclosures in the financial statements. An audit also includes assessing the accounting principles used and significant estimates made by management, as well as evaluating the overall financial statement presentation. We believe that our audits provide a reasonable basis for our opinion.
In our opinion, the consolidated financial statements referred to above present fairly, in all material respects, the financial position of Waccamaw Bankshares, Inc. and subsidiary at December 31, 2007 and 2006, and the results of its operations and its cash flows for each of the two years in the period ended December 31, 2007, in conformity with accounting principles generally accepted in the United States of America.
Galax, Virginia
March 27, 2008
Management’s Discussion and AnalysisMANAGEMENT’S DISCUSSION AND ANALYSIS OF
FINANCIAL CONDITION AND RESULTS OF OPERATIONS
The following presents management’s discussion and analysis of the financial condition and results of operations of the Company as of December 31, 2008 and 2007 and the years then ended. This discussion should be read in conjunction with the Company’s Financial Statements and the Notes thereto.
There are no current recommendations by regulatory authorities which, if implemented, would have a material effect on its liquidity, capital resources or results of operations. There are no agreements between the Bank and either the North Carolina Banking Commission or the Federal Reserve Bank, nor has either regulatory agency made any recommendations concerning the operations of the Bank that could have a material effect on its liquidity, capital resources or results of operations.
Waccamaw Bank (the Bank) began operations on September 2, 1997. The Bank operates by attracting deposits from the general public and using such deposit funds to make commercial, consumer, and residential construction and permanent mortgage real estate loans. Revenues are derived principally from interest on loans and investments. Changes in the volume and mix of these assets and liabilities, as well as changes in the yields earned and rates paid, determine changes in net interest income. Waccamaw Bankshares, Inc. (the Company) was formed during 2001 and acquired all the outstanding shares of the Bank on June 30, 2001.
The Company’s total assets were $537.5 million at December 31, 2008 as compared to $508.4 million at December 31, 2007. Total deposits at December 31, 2008 increased 10.7% to $418.6 million. Total deposits were $378.2 million at December 31, 2007. The Bank used these resources primarily to fund new loans and purchase investment securities. The Bank’s net loans increased to $378.9 million at the end of 2008, an increase of $23.7 million over the 2007 amount of $355.1 million. Investment securities were $87.4 million and $99.3 million at December 31, 2008 and 2007, respectively.
In the third quarter of 2008, the Company completed construction of a branch in Little River, SC.
Critical Accounting Policies
The Company’s financial statements are prepared in accordance with accounting principles generally accepted in the United States (GAAP). The notes to the audited consolidated financial statements included in the Company’s Annual Report on Form 10-K for the year ended December 31, 2008 contain a summary of its significant accounting policies. Management believes the Company’s policies with respect to the methodology for the determination of the allowance for loan losses, investment impairment charges, goodwill impairment and asset impairment judgments, such as the recoverability of intangible assets, involve a higher degree of complexity and require management to make difficult and subjective judgments that often require assumptions or estimates about highly uncertain matters. Accordingly, the Company considers the policies related to those areas to be critical.
The allowance for loan losses is an estimate of the losses that may be sustained in the Company’s loan portfolio. The allowance is based on two basic principles of accounting: (i) Statement of Financial Accounting Standards (“SFAS”) No. 5, Accounting for Contingencies, which requires that losses be accrued when they are probable of occurring and estimable, and (ii) SFAS No. 114, Accounting by Creditors for Impairment of a Loan, which requires that losses be accrued based on the differences between the value of collateral, present value of future cash flows or values that are observable in the secondary market, and the loan balance.
Management’s Discussion and Analysis
The allowance consists of specific, general and unallocated components. The specific component relates to loans that are classified as impaired. For such loans, an allowance is established when the discounted cash flows (or collateral value or observable market price) of the impaired loan is lower than the carrying value of that loan. The general component covers non-impaired loans and is based on historical loss experience adjusted for qualitative factors. An unallocated component is maintained to cover uncertainties that could affect management’s estimate of probable losses. The unallocated component of the allowance reflects the margin of imprecision inherent in the underlying assumptions used in the methodologies for estimating losses in the portfolio.
Accounting for intangible assets is as prescribed by SFAS No. 142, Goodwill and Other Intangible Assets. The Company accounts for recognized intangible assets based on their estimated useful lives. Intangible assets with finite useful lives are amortized while intangible assets with an indefinite useful life are not amortized. Currently, the Company’s recognized intangible assets consist primarily of purchased core deposit intangible assets, having estimated useful lives of 10 years, and is being amortized. The useful life is the period over which the assets are expected to contribute directly or indirectly to future cash flows. Estimated useful lives of intangible assets are based on an analysis of pertinent factors, including (as applicable):
| · | the expected use of the asset; |
| · | the expected useful life of another asset or group of assets to which the useful life of the intangible asset may relate; |
| · | any legal, regulatory, or contractual provisions that may limit the useful life; |
| · | any legal, regulatory, or contractual provisions that enable renewal and extension of the asset’s legal or contractual life without substantial cost; |
| · | the effects of obsolescence, demand, competition, and other economic factors; and |
| · | the level of maintenance expenditures required to obtain the expected future cash flows from the asset. |
Straight-line amortization is used to expense recognized amortizable intangible assets since a method that more closely reflects the pattern in which the economic benefits of the intangible assets are consumed cannot readily be determined. Intangible assets are not written off in the period of acquisition unless they become impaired during that period.
The Company evaluates the remaining useful life of each intangible asset that is being amortized each reporting period to determine whether events and circumstances warrant a revision to the remaining period of amortization. If the estimate of the intangible asset’s remaining useful life is changed, the remaining carrying amount of the intangible asset shall be amortized prospectively over that revised remaining useful life.
If an intangible asset that is being amortized is subsequently determined to have an indefinite useful life, the asset will be tested for impairment. That intangible asset will no longer be amortized and will be accounted for in the same manner as intangible assets that are not subject to amortization.
Intangible assets that are not subject to amortization are reviewed for impairment in accordance with SFAS No. 144 and tested annually, or more frequently if events or changes in circumstances indicate that the asset might be impaired. The impairment test consists of a comparison of the fair value of the intangible asset with its carrying amount. If the carrying amount of the intangible asset exceeds its fair value, an impairment loss is recognized in an amount equal to that excess. After an impairment loss is recognized, the adjusted carrying amount of the intangible asset becomes its new accounting basis. Subsequent reversal of a previously recognized impairment loss is not allowed. Based on the aforementioned testing, the Company has determined that its recorded intangible assets are not impaired.
Management’s Discussion and Analysis
Net Interest Income and Average Balances (thousands)
| | | Periods Ended December 31, | |
| | | 2008 | | | 2007 | | | 2006 | |
| | | | | | Interest | | | | | | | | | Interest | | | | | | | | | Interest | | | | |
| | | Average | | | Income/ | | | Yield/ | | | Average | | | Income/ | | | Yield/ | | | Average | | | Income/ | | | Yield/ | |
| | | Balance | | | Expenses | | | Cost | | | Balance | | | Expenses | | | Cost | | | Balances | | | Expenses | | | Cost | |
| | | | | | | | | | | | | | | | | | | | | | | | | | | | |
| Interest-earning assets: | | | | | | | | | | | | | | | | | | | | | | | | | | | |
| Investment securities | | $ | 105,819 | | | $ | 6,327 | | | | 5.98 | % | | $ | 65,454 | | | $ | 3,805 | | | | 5.81 | % | | $ | 46,561 | | | $ | 2,526 | | | | 5.43 | % |
| Federal funds sold | | | 6,318 | | | | 70 | | | | 1.11 | % | | | 5,481 | | | | 290 | | | | 5.29 | % | | | 4,630 | | | | 226 | | | | 4.88 | % |
| Deposits with banks | | | 1,999 | | | | 32 | | | | 1.60 | % | | | 943 | | | | 49 | | | | 5.19 | % | | | 897 | | | | 42 | | | | 4.68 | % |
Loans, net1,2 | | | 376,747 | | | | 24,056 | | | | 6.39 | % | | | 332,451 | | | | 27,493 | | | | 8.27 | % | | | 279,625 | | | | 22,585 | | | | 8.08 | % |
| Total interest-earning assets | | | 490,883 | | | | 30,485 | | | | | | | | 404,329 | | | | 31,637 | | | | | | | | 331,713 | | | | 25,379 | | | | | |
| | | | | | | | | | | | | | | | | | | | | | | | | | | | | | | | | | | | | |
| Yield on average interest- earning assets | | | | | | | | | | | 6.21 | % | | | | | | | | | | | 7.82 | % | | | | | | | | | | | 7.65 | % |
| | | | | | | | | | | | | | | | | | | | | | | | | | | | | | | | | | | | | |
| Noninterest-earning assets: | | | | | | | | | | | | | | | | | | | | | | | | | | | | | | | | | | | | |
| Cash | | | 8,181 | | | | | | | | | | | | 8,204 | | | | | | | | | | | | 6,687 | | | | | | | | | |
| Premises and equipment | | | 17,093 | | | | | | | | | | | | 8,475 | | | | | | | | | | | | 5,395 | | | | | | | | | |
| Interest receivable and other | | | 23,311 | | | | | | | | | | | | 17,571 | | | | | | | | | | | | 12,880 | | | | | | | | | |
| Total noninterest-earning assets | | | 48,585 | | | | | | | | | | | | 34,250 | | | | | | | | | | | | 24,962 | | | | | | | | | |
| Total assets | | $ | 539,468 | | | | | | | | | | | $ | 438,579 | | | | | | | | | | | $ | 356,675 | | | | | | | | | |
| | | | | | | | | | | | | | | | | | | | | | | | | | | | | | | | | | | | | |
| Interest-bearing liabilities: | | | | | | | | | | | | | | | | | | | | | | | | | | | | | | | | | | | | |
| Demand deposits | | $ | 29,399 | | | | 179 | | | | .61 | % | | $ | 26,714 | | | | 167 | | | | .62 | % | | $ | 27,404 | | | | 206 | | | | .75 | % |
| Savings deposits | | | 76,580 | | | | 1,843 | | | | 2.41 | % | | | 72,620 | | | | 2,436 | | | | 3.35 | % | | | 69,129 | | | | 2,093 | | | | 3.03 | % |
| Time deposits | | | 275,956 | | | | 11,481 | | | | 4.16 | % | | | 218,997 | | | | 11,067 | | | | 5.05 | % | | | 168,532 | | | | 7,189 | | | | 4.27 | % |
| Other short-term borrowings | | | 22,644 | | | | 764 | | | | 3.37 | % | | | 10,513 | | | | 469 | | | | 4.46 | % | | | 5,142 | | | | 226 | | | | 4.40 | % |
| Long-term debt | | | 65,250 | | | | 2,667 | | | | 4.09 | % | | | 37,422 | | | | 2,157 | | | | 5.77 | % | | | 25,389 | | | | 1,512 | | | | 5.96 | % |
| Total interest-bearing liabilities | | | 469,829 | | | | 16,934 | | | | | | | | 366,266 | | | | 16,296 | | | | | | | | 295,596 | | | | 11,226 | | | | | |
| Cost of average interest- bearing liabilities | | | | | | | | | | | 3.60 | % | | | | | | | | | | | 4.45 | % | | | | | | | | | | | 3.80 | % |
| | | | | | | | | | | | | | | | | | | | | | | | | | | | | | | | | | | | | |
| Noninterest-bearing liabilities: | | | | | | | | | | | | | | | | | | | | | | | | | | | | | | | | | | | | |
| Demand deposits | | | 33,775 | | | | | | | | | | | | 36,181 | | | | | | | | | | | | 33,259 | | | | | | | | | |
| Interest payable and other | | | 2,404 | | | | | | | | | | | | 2,631 | | | | | | | | | | | | 1,875 | | | | | | | | | |
| Total noninterest- bearing liabilities | | | 36,179 | | | | | | | | | | | | 38,812 | | | | | | | | | | | | 35,134 | | | | | | | | | |
| Total liabilities | | | 506,008 | | | | | | | | | | | | 405,078 | | | | | | | | | | | | 330,730 | | | | | | | | | |
| | | | | | | | | | | | | | | | | | | | | | | | | | | | | | | | | | | | | |
Stockholders' equity | | | 33,460 | | | | | | | | | | | | 33,501 | | | | | | | | | | | | 25,945 | | | | | | | | | |
| Total liabilities and stockholders' equity | | $ | 539,468 | | | | | | | | | | | $ | 438,579 | | | | | | | | | | | $ | 356,675 | | | | | | | | | |
| | | | | | | | | | | | | | | | | | | | | | | | | | | | | | | | | | | | | |
| Net interest income | | | | | | $ | 13,551 | | | | | | | | | | | $ | 15,341 | | | | | | | | | | | $ | 14,153 | | | | | |
| | | | | | | | | | | | | | | | | | | | | | | | | | | | | | | | | | | | | |
| Net yield on interest-earning assets | | | | | | | | | | | 2.76 | % | | | | | | | | | | | 3.79 | % | | | | | | | | | | | 4.27 | % |
1 Average loan balances include nonaccrual loans.
2 Deferred loan fees are included in interest income.
Management’s Discussion and Analysis
Net Interest Income
Net interest income, the principal source of income for the Bank, is the amount of income generated by earning assets (primarily loans and investment securities) less the interest expense incurred on interest-bearing liabilities (primarily deposits used to fund earning assets). Changes in the volume and mix of interest-earning assets and interest-bearing liabilities, as well as their respective yields and rates, have a significant impact on the level of net interest income. The preceding table presents the average balances of total interest-earning assets and total interest-bearing liabilities for the periods indicated, showing the average distribution of assets, liabilities and stockholders’ equity, and the related income, expense, and corresponding weighted average yields and costs. The average balances used for the purposes of this table and other statistical disclosures were calculated by using the daily average balances.
Interest income during 2008 was $30.5 million, a decrease of 3.6% from the 2007 total of $31.6 million. Interest income for 2006 was $25.4 million. The decreases in 2008 can primarily be attributed to the decrease of 450 basis points in the Prime lending rate, as a result of which the majority of the Company’s loans re-priced immediately. Average earning assets were $490.9 million during 2008, an increase of 21.4% over 2007. Average earning assets increased 21.9% to $404.3 million during 2007 over the 2006 balance of $331.7 million. Yields on interest-earning assets during 2008, 2007, and 2006 were 6.2%, 7.8%, and 7.7%, respectively.
Interest rates charged on loans vary with the degree of risk, maturity and amount of the loan. Competitive pressures, money market rates, availability of funds, and government regulation also influence interest rates. On average, loans yielded 6.4%, 8.3% and 8.1% during 2008, 2007, and 2006, respectively. Yields on loans decreased in 2008 primarily as a result of the declining rate environment.
Interest expense was $16.9 million during 2008, an increase of 3.9% over 2007. Interest expense in 2007 was $16.3 million, an increase of 45.2% over 2006. The increases in 2008 and 2007 are due to the increase in the level of average interest bearing liabilities. The average rate paid on interest-bearing liabilities during 2008, 2007, and 2006 was 3.6%, 4.5%, and 3.8%, respectively.
Net interest income was $13.6 million during 2008, a decrease of 11.7% from 2007. During 2007 net interest income increased to $15.3 million. Net interest income was $14.2 million in 2006. The decrease in net interest income in 2008 can primarily be attributed to the decrease of 450 basis points in the Prime lending rate, as a result of which the majority of the Company’s loans re-priced immediately, and the higher relative cost of funding loans, due to the fact that the Company’s deposits were not able to re-price as quickly as the loans. The increase in 2007 is due to increased levels of average earning assets and liabilities complemented by increased yields and rates. Net interest margin during 2008, 2007, and 2006 was 2.8%, 3.8%, and 4.3%, respectively.
Management’s Discussion and Analysis
The effects of changes in volumes and rates on net interest income for 2008, 2007 and 2006 are shown in the table below.
Rate/Volume Variance Analysis (thousands)
| | | 2008 Compared to 2007 | | | 2007 Compared to 2006 | |
| | | Interest | | | | | | | | | Interest | | | | | | | |
| | | Income/ | | | Variance | | | Income/ | | | Variance | |
| | | Expense | | | Attributable to | | | Expense | | | Attributable to | |
| | | Variance | | | Rate | | | Volume | | | Variance | | | Rate | | | Volume | |
| Interest-earning assets: | | | | | | | | | | | | | | | | | | |
| Loans | | $ | (3,436 | ) | | $ | (8,274 | ) | | $ | 4,838 | | | $ | 4,908 | | | $ | 551 | | | $ | 4,357 | |
| Investment securities | | | 2,522 | | | | 111 | | | | 2,411 | | | | 1,279 | | | | 192 | | | | 1,087 | |
| Deposits with banks | | | (17 | ) | | | 28 | | | | (45 | ) | | | 7 | | | | 5 | | | | 2 | |
| Federal funds sold | | | (220 | ) | | | (273 | ) | | | 53 | | | | 64 | | | | 20 | | | | 44 | |
| Total | | | (1,151 | ) | | | (8,408 | ) | | | 7,257 | | | | 6,258 | | | | 768 | | | | 5,490 | |
| | | | | | | | | | | | | | | | | | | | | | | | | |
| Interest-bearing liabilities: | | | | | | | | | | | | | | | | | | | | | | | | |
| Demand deposits | | | 12 | | | | - | | | | 12 | | | | (39 | ) | | | (34 | ) | | | (5 | ) |
| Savings deposits | | | (858 | ) | | | (133 | ) | | | (725 | ) | | | 343 | | | | 234 | | | | 109 | |
| Time deposits | | | 413 | | | | (19 | ) | | | 432 | | | | 3,878 | | | | 1,479 | | | | 2,399 | |
| Short-term borrowings | | | 162 | | | | (5 | ) | | | 167 | | | | 243 | | | | 3 | | | | 240 | |
| Long-term debt | | | 644 | | | | (24 | ) | | | 668 | | | | 645 | | | | (47 | ) | | | 692 | |
| Total | | | 373 | | | | (181 | ) | | | 554 | | | | 5,070 | | | | 1,635 | | | | 3,435 | |
| Net interest income | | $ | (1,524 | ) | | $ | (8,227 | ) | | $ | 6,703 | | | $ | 1,188 | | | $ | (867 | ) | | $ | 2,055 | |
| | 1. | The variance in interest attributable to both volume and rate has been allocated to variance attributed to volume and variance attributed to rate in proportion to the absolute value of the change in each. |
| | 2. | Balances of nonaccrual loans have been included for computational purposes. |
Provision for Loan Losses
The provision for loan losses is charged to income in an amount necessary to maintain an allowance for loan losses adequate to provide for expected losses in the Bank’s loan portfolio. The allowance consists of specific, general and unallocated components. The specific component relates to loans that are classified as impaired. For such loans, an allowance is established when the discounted cash flows (or collateral value or observable market price) of the impaired loan is lower than the carrying value of that loan. The general component covers non-impaired loans and is based on historical loss experience adjusted for qualitative factors. An unallocated component is maintained to cover uncertainties that could affect management’s estimate of probable losses. The unallocated component of the allowance reflects the margin of imprecision inherent in the underlying assumptions used in the methodologies for estimating losses in the portfolio.
The provision for loan loss expense was $2,990,096, $385,864, and $1,450,000 during 2008, 2007, and 2006 respectively. The Bank's allowance for loan losses as a percentage of gross loans was 1.86%, 1.49% and 1.54% at the end of 2008, 2007, and 2006, respectively. Additional information regarding loan loss provisions is discussed in “Nonperforming and Problem Assets.”
Management’s Discussion and Analysis
Noninterest Income
Noninterest income consists of revenues generated from a variety of financial services and activities. The majority of noninterest income is a result of service charges on deposit accounts including charges for insufficient funds and fees charged for non-deposit services. Noninterest income also includes fees charged for various bank services such as safe deposit box rental fees and letter of credit fees. A portion of noninterest income can be from gain on the sale of investment securities. Although the Bank generally follows a buy and hold philosophy with respect to investment securities, occasionally the need to sell some investment securities is created by changes in market rate conditions or by efforts to restructure the portfolio to improve the Bank's liquidity or interest rate risk positions.
Noninterest income totaled $966,000, $3.4 million, and $2.6 million for the years ended December 31, 2008, 2007, and 2006, respectively. Noninterest income decreased in 2008 primarily due to the Company investment write-downs of a single issue trust preferred security of $339,013, a pooled trust preferred security of $1,044,675 and FNMA Preferred Stock of $1,964,772. Service charges on deposit accounts were 49.0% of total noninterest income excluding the write-downs of investment securities for 2008. Service charges will most likely increase as the number of deposit accounts increase. The Bank's fee structure is reviewed annually to determine if adjustments to fees are warranted.
Mortgage origination fees decreased 24.4% to $353,000 from 2008 to 2007 due to weak housing demand in the existing market areas. The Bank purchased life insurance for certain number of its key employees in December, 2004, March 2007, December 2007, June 2008 and December 2008 providing $548,000, $390,000 and $240,000 of noninterest income for the years ended December 31, 2008, 2007 and 2006, respectively.
The sources of noninterest income for the past three years are summarized in the following table.
Sources of Noninterest Income (thousands)
| | | 2008 | | | 2007 | | | 2006 | |
| | | | | | | | | | |
| Service charges on deposit accounts | | $ | 2,115 | | | $ | 1,325 | | | $ | 1,100 | |
| ATM and check cashing fees | | | 755 | | | | 538 | | | | 439 | |
| Gain on sale of investment securities | | | 98 | | | | 246 | | | | (1 | ) |
| Gain on sale of investment in mortgage banking investee | | | - | | | | - | | | | 44 | |
| Mortgage origination | | | 353 | | | | 467 | | | | 374 | |
| Insurance commission | | | 15 | | | | 14 | | | | 17 | |
| Income from financial services | | | 264 | | | | 305 | | | | 290 | |
| Earnings on bank owned life insurance | | | 548 | | | | 390 | | | | 240 | |
| Impairment of investment securities | | | (3,348 | ) | | | - | | | | - | |
| Other | | | 166 | | | | 158 | | | | 78 | |
| Total noninterest income | | $ | 966 | | | $ | 3,443 | | | $ | 2,581 | |
Noninterest Expense
Noninterest expense for 2008, 2007, and 2006 was $15.4 million, $12.4 million and $9.4 million, respectively. The majority of the increase in noninterest expense for 2008 can be attributed to personnel and occupancy costs related to opening a new branch in Little River, South Carolina and full year expenses for branches opened in 2007.
Management’s Discussion and Analysis
Total personnel expenses, the largest component of noninterest expense, were $8.2 million, $6.9 million and $5.3 million during 2008, 2007 and 2006, respectively. Personnel expenses increased 19.5% during 2008 and 30.0% during 2007. This was due to Bank growth and the addition of senior management. Management expects these costs to continue to increase as the Company grows.
Combined occupancy and furniture and equipment expense was $2.0 million, $1.5 million and $1.1 million, or 13.1%, 12.2% and 11.7% of noninterest expense during 2008, 2007 and 2006, respectively. Professional services expense, fees paid to attorneys, independent auditors, consultants and state examiners was $490,000, $315,000, and $293,000 in 2008, 2007 and 2006, respectively. The increase in 2008 can be mostly attributed to legal fees related to collections of various loans.
Advertising and public relations expense increased to $705,000 in 2008 from $593,000 in 2007 as these expenses will continue to increase with Bank growth. Data processing and credit card processing fees was $1.3 million, $1.0 million and $809,000 during 2008, 2007 and 2006, respectively. These fees relate directly to the number of accounts serviced and transactions processed.
The overhead ratio of noninterest expense to adjusted total revenues (net interest income plus noninterest income excluding securities transactions) was 111%, 66% and 56% in 2008, 2007, and 2006, respectively. Total noninterest expense will most likely continue to increase as the Company grows. However, as the Company becomes more mature, growth in net interest income should outpace growth in noninterest expense resulting in improved overhead ratios. The primary elements of noninterest expense for the past three years are summarized in the following table.
Sources of Noninterest Expense (thousands)
| | | 2008 | | | 2007 | | | 2006 | |
| | | | | | | | | | | | | |
| Salaries and wages | | $ | 6,838 | | | $ | 5,862 | | | $ | 4,440 | |
| Employee benefits | | | 1,359 | | | | 994 | | | | 834 | |
| Total personnel expense | | | 8,197 | | | | 6,856 | | | | 5,274 | |
| | | | | | | | | | | | | |
| Occupancy expense | | | 1,435 | | | | 1,074 | | | | 776 | |
| Furniture and equipment | | | 577 | | | | 439 | | | | 329 | |
| Printing and supplies | | | 157 | | | | 164 | | | | 129 | |
| Professional services | | | 490 | | | | 315 | | | | 293 | |
| Postage and office supplies | | | 153 | | | | 116 | | | | 98 | |
| Telephone | | | 180 | | | | 139 | | | | 106 | |
| Dues and subscriptions | | | 61 | | | | 63 | | | | 39 | |
| Education and seminars | | | 92 | | | | 71 | | | | 47 | |
| Franchise and local taxes | | | 117 | | | | 92 | | | | 83 | |
| Regulatory agency expense | | | 389 | | | | 265 | | | | 95 | |
| Director fees | | | 133 | | | | 170 | | | | 156 | |
| Data processing services | | | 1,307 | | | | 1,001 | | | | 809 | |
| Amortization of deposit premium | | | 286 | | | | 282 | | | | 273 | |
| Other operating expense | | | 1,118 | | | | 800 | | | | 607 | |
| Total noninterest expenses | | $ | 15,397 | | | $ | 12,440 | | | $ | 9,422 | |
Management’s Discussion and Analysis
Income Taxes
Income tax expense and benefit is based on amounts reported in the statements of income (after adjustments for non-taxable income and non-deductible expenses) and consists of taxes currently due plus deferred taxes on temporary differences in the recognition of income and expense for tax and financial statement purposes. The deferred tax assets and liabilities represent the future Federal and state income tax consequences of those differences, which will either be taxable or deductible when the assets and liabilities are recovered or settled.
Income tax (benefit) and expense was $(1,827,000), $2,049,000 and $2,210,000 for 2008, 2007 and 2006, respectively. Net deferred income tax assets of approximately $6,994,000 and $2,358,000 at December 31, 2008 and 2007, respectively, were included in other assets. At December 31, 2008, $3,153,000 of the total deferred tax asset is applicable to unrealized losses on investment securities available for sale.
The Bank’s deferred income tax benefits and liabilities are the result of temporary differences in provisions for loan losses, depreciation, amortization of deposit premiums, deferred income, impairment of equity securities and investment security discount accretion.
Earning Assets
Average earning assets were $490.9 million during 2008, an increase of 21.4% over 2007. Average earning assets were $404.3 million in 2007, an increase of 21.9% over the $331.7 million balance for 2006. Total average earning assets represented 91.0%, 92.2%, and 93.0% of total average assets during the years ended December 31, 2008, 2007 and 2006, respectively. A summary of average assets is shown in the following table.
Average Asset Mix (dollars in thousands)
| | | 2008 | | | 2007 | | | 2006 | |
| | | Average | | | | | | Average | | | | | | Average | | | | |
| | | Balance | | | Percent | | | Balance | | | Percent | | | Balance | | | Percent | |
| Earnings assets: | | | | | | | | | | | | | | | | | | |
| Loans, net | | $ | 376,747 | | | | 69.84 | % | | $ | 332,451 | | | | 75.80 | % | | $ | 279,625 | | | | 78.40 | % |
| Investment securities | | | 105,819 | | | | 19.61 | % | | | 65,454 | | | | 14.92 | % | | | 46,561 | | | | 13.05 | % |
| Federal funds sold | | | 6,318 | | | | 1.17 | % | | | 5,481 | | | | 1.25 | % | | | 4,630 | | | | 1.30 | % |
| Deposits with banks | | | 1,999 | | | | .37 | % | | | 943 | | | | .21 | % | | | 897 | | | | .25 | % |
| Total earning assets | | | 490,883 | | | | 90.99 | % | | | 404,329 | | | | 92.18 | % | | | 331,713 | | | | 93.00 | % |
| | | | | | | | | | | | | | | | | | | | | | | | | |
| Nonearning assets: | | | | | | | | | | | | | | | | | | | | | | | | |
| Cash and due from banks | | | 8,181 | | | | 1.52 | % | | | 8,204 | | | | 1.88 | % | | | 6,687 | | | | 1.88 | % |
| Premises and equipment | | | 17,093 | | | | 3.17 | % | | | 8,475 | | | | 1.93 | % | | | 5,395 | | | | 1.51 | % |
| Other assets | | | 23,321 | | | | 4.32 | % | | | 17,571 | | | | 4.01 | % | | | 12,880 | | | | 3.61 | % |
| Total nonearning assets | | | 48,595 | | | | 9.01 | % | | | 34,250 | | | | 7.82 | % | | | 24,962 | | | | 7.00 | % |
| Total assets | | $ | 539,468 | | | | 100.00 | % | | $ | 438,579 | | | | 100.00 | % | | $ | 356,675 | | | | 100.00 | % |
Loans
The Bank makes both consumer and commercial loans to borrowers in all neighborhoods within its market area, including low- and moderate-income areas. The Bank’s market area is generally defined to be all of Columbus, Brunswick, Bladen and New Hanover counties of North Carolina and Lancaster and Horry counties of South Carolina, which management feels helps diversify market risk. The Bank emphasizes consumer based installment loans, commercial loans to small and medium sized businesses and real estate loans.
A significant portion of the loan portfolio is made up of loans secured by various types of real estate. Real estate loans represented 83.6%, 82.6%, and 79.7% of total loans at December 31, 2008, 2007, and 2006, respectively. Total loans secured by one-to-four family residential properties represented 21.7%, 21.0% and 20.3% of total loans at the end of 2008, 2007 and 2006, respectively. Loans for commercial and business purposes were $43.0 million, $43.6 million and $48.9 million, or 11.1%, 12.1% and 15.4% of total loans outstanding at December 31, 2008, 2007 and 2006, respectively.
Management’s Discussion and Analysis
The amounts of gross loans outstanding by type at December 31, 2008 through December 31, 2004 are shown in the following table.
Loan Portfolio Summary (thousands)
| | | 2008 | | | 2007 | | | 2006 | | | 2005 | | | 2004 | |
| | | | | | | | | | | | | | | | |
| Construction and development | | $ | 125,878 | | | $ | 121,760 | | | $ | 109,036 | | | $ | 83,575 | | | $ | 37,529 | |
| Farmland | | | 3,343 | | | | 3,806 | | | | 2,412 | | | | 2,545 | | | | 2,119 | |
| 1-4 family residential | | | 83,734 | | | | 75,671 | | | | 64,475 | | | | 62,796 | | | | 58,484 | |
| Multifamily residential | | | 11,802 | | | | 3,670 | | | | 3,650 | | | | 4,495 | | | | 3,600 | |
| Nonfarm, nonresidential | | | 98,438 | | | | 93,222 | | | | 73,529 | | | | 67,199 | | | | 65,156 | |
| Total real estate | | | 323,195 | | | | 298,129 | | | | 253,102 | | | | 220,610 | | | | 166,888 | |
| | | | | | | | | | | | | | | | | | | | | |
| Agricultural | | | 654 | | | | 671 | | | | 675 | | | | 388 | | | | 1,976 | |
| Commercial and industrial | | | 42,958 | | | | 43,617 | | | | 48,858 | | | | 29,036 | | | | 30,928 | |
| Consumer | | | 17,217 | | | | 13,950 | | | | 13,172 | | | | 10,544 | | | | 8,564 | |
| Other | | | 2,432 | | | | 4,610 | | | | 1,783 | | | | 1,327 | | | | 1,471 | |
| Total | | $ | 386,456 | | | $ | 360,977 | | | $ | 317,590 | | | $ | 261,905 | | | $ | 209,827 | |
The maturity/re-pricing distributions of loans as of December 31, 2008 are set forth in the following table.
Maturity Schedule of Loans (dollars in thousands)
| | | Commercial | | | Construction | | | | | | | | | | |
| | | and | | | and | | | | | | Total | | | | |
| | | Industrial | | | Development | | | Others | | | Amount | | | Percent | |
| | | | | | | | | | | | | | | | |
| Three months or less | | $ | 19,131 | | | $ | 56,060 | | | $ | 85,273 | | | $ | 160,464 | | | | 41.52 | % |
| Over three months to twelve months | | | 6,736 | | | | 19,737 | | | | 21,345 | | | | 47,818 | | | | 12.37 | % |
| Over one year to five years | | | 14,273 | | | | 41,824 | | | | 70,003 | | | | 126,100 | | | | 32.63 | % |
| Over five years | | | 2,818 | | | | 8,257 | | | | 40,999 | | | | 52,074 | | | | 13.48 | % |
| Total loans | | $ | 42,958 | | | $ | 125,878 | | | $ | 217,620 | | | $ | 386,456 | | | | 100.00 | % |
Investment Securities
The Bank uses its investment portfolio to provide liquidity for unexpected deposit decreases, to fund loans, to meet the Bank's interest rate sensitivity goals and to generate income.
Securities are classified as securities held to maturity when management has the intent and the Bank has the ability at the time of purchase to hold the securities to maturity. Securities held to maturity are carried at cost adjusted for amortization of premiums and accretion of discounts. Securities to be held for indefinite periods of time are classified as securities available for sale. Unrealized gains and losses on securities available for sale are recognized as direct increases or decreases in stockholders’ equity. Securities available for sale include securities that may be sold in response to changes in market interest rates, changes in the security’s prepayment risk, increases in loan demand, general liquidity needs and other similar factors. The entire securities portfolio is classified as available for sale.
Management of the investment portfolio is conservative with virtually all investments taking the form of purchases of Government sponsored enterprises, Corporate securities, municipal securities, and mortgage-backed securities. Management views the investment portfolio as a source of income, and purchases securities with that in mind. However, adjustments are necessary in the portfolio to provide an adequate source of liquidity which can be used to meet funding requirements for loan demand and deposit fluctuations and to control interest rate risk. Therefore, management may sell certain securities prior to their maturity.
Management’s Discussion and Analysis
The following table presents the investment portfolio by major types of investments and maturity ranges. Maturities may differ from scheduled maturities in mortgage-backed securities because the mortgages underlying the securities may be called or repaid prior to the scheduled maturity date. Maturities on all other securities are based on the contractual maturity.
Investment Securities (dollars in thousands)
| | | December 31, 2008 | |
| | | Amortized Cost Due | | | | | | | |
| | | | | | After One | | | After Five | | | | | | | | | | |
| | | In One Yr. | | | Through | | | Through | | | After Ten | | | | | | Fair | |
| | | Or Less | | | Five Years | | | Ten Years | | | Years | | | Total | | | Value | |
| Investment securities | | | | | | | | | | | | | | | | | | |
Government sponsored enterprises (FHLB, FFCB and FHLMC) | | $ | - | | | $ | - | | | $ | 3,500 | | | $ | 7,000 | | | $ | 10,500 | | | $ | 10,606 | |
| Equity securities | | | 53 | | | | 53 | | | | 53 | | | | | | | | | | | | | |
| Municipal securities | | | 255 | | | | 575 | | | | - | | | | 15,747 | | | | 16,577 | | | | 14,772 | |
| Corporate securities | | | 2,959 | | | | 2,000 | | | | - | | | | 2,360 | | | | 7,319 | | | | 5,173 | |
| Single issue trust preferred securities | | | - | | | | - | | | | 1,003 | | | | 20,563 | | | | 21,565 | | | | 15,749 | |
| Pool trust preferred | | | | | | | | | | | | | | | | | | | | | | | | |
| securities | | | - | | | | - | | | | - | | | | 570 | | | | 570 | | | | 140 | |
| Mortgage-backed | | | | | | | | | | | | | | | | | | | | | | | | |
| securities | | | - | | | | - | | | | - | | | | 40,091 | | | | 40,091 | | | | 40,910 | |
| Total | | $ | 3,214 | | | $ | 2,575 | | | $ | 4,503 | | | $ | 86,384 | | | $ | 96,675 | | | $ | 87,403 | |
| | | | | | | | | | | | | | | | | | | | | | | | | |
| Weighted average yields | | | | | | | | | | | | | | | | | | | | | | | | |
| Government sponsored enterprises (FHLB and FHLMC) | | | - | % | | | - | % | | | 5.87 | % | | | 5.99 | % | | | | | | | 5.95 | % |
| Equity securities | | | - | % | | | - | % | | | - | % | | | 6.57 | % | | | | | | | 6.57 | % |
| Municipal securities | | | 2.72 | % | | | 4.00 | % | | | - | % | | | 4.29 | % | | | | | | | 4.26 | % |
| Corporate securities | | | 10.30 | % | | | 2.21 | % | | | - | % | | | 7.67 | % | | | | | | | 6.65 | % |
| Single issue trust preferred securities | | | - | % | | | - | % | | | 6.75 | % | | | 6.88 | % | | | | | | | 6.88 | % |
| Pooled trust preferred securities | | | - | % | | | - | % | | | - | % | | | 5.51 | % | | | | | | | 5.51 | % |
| Mortgage-backed securities | | | - | % | | | - | % | | | - | % | | | 5.73 | % | | | | | | | 5.73 | % |
| Consolidated | | | 6.98 | % | | | 2.61 | % | | | 6.06 | % | | | 5.82 | % | | | | | | | 5.78 | % |
| | | 2007 | |
| | | Book | | | Fair | |
| | | Value | | | Value | |
| Investment securities | | | | | | |
Government sponsored enterprises (FHLB, FFCB and FHLMC | | $ | 15,448 | | | $ | 15,621 | |
| Municipal securities | | | 16,691 | | | | 16,011 | |
| Corporate securities, single issue trust preferred securities, pooled trust preferred securities | | | 27,503 | | | | 27,055 | |
| Mortgage-backed securities | | | 40,692 | | | | 40,615 | |
| Total | | $ | 100,334 | | | $ | 99,302 | |
Management’s Discussion and Analysis
The interest rate environment and the need for liquidity resulted in an annualized average yield on the investment portfolio of 6.0%, 5.8%, and 5.4% during 2008, 2007 and 2006, respectively. At December 31, 2008, 2007 and 2006, the market value of the investment portfolio was $87.4 million, $99.3 million, and $50.5 million, respectively. Amortized cost was $96.7 million, $100.3 million, and $50.3 million.
Federal Funds Sold
Federal funds represent the most liquid portion of the Bank's invested funds and generally the lowest yielding portion of earning assets. However, because of the flat yield curve and the need to maintain liquidity, management maintained a significant amount of Federal funds during the past three years. Average Federal funds sold totaled $6.3 million, $5.5 million, and $4.6 million in 2008, 2007, and 2006, respectively. Federal funds sold were $4.2 million at December 31, 2008 and no Federal funds sold at December 31, 2007.
Deposits
The Bank relies on deposits generated in its market area to provide the majority of funds needed to support lending activities and for investments in liquid assets. More specifically, core deposits (total deposits less time deposits in denominations of $100,000 or more) are the primary funding source.
The Bank's balance sheet growth is largely determined by the availability of deposits in its market, the cost of attracting the deposits, and the prospects of profitably utilizing the available deposits by increasing the loan or investment portfolios. Market conditions have resulted in depositors shopping for better deposit rates more than in the past. An increased customer awareness of interest rates adds to the importance of rate management. The Bank's management must continuously monitor market pricing, competitor's rates, and internal interest rate spreads to maintain the Bank’s growth and achieve profitability. The Bank attempts to structure rates so as to promote deposit and asset growth while at the same time increasing the overall profitability of the Bank.
Average total deposits were $415.7 million during 2008. This is an increase of 17.3% over 2007. Average total deposits were $354.5 million for the year ended December 31, 2007, an increase of 18.8% over 2006. The majority of those deposits were core deposits. The percentage of the Bank's average deposits that were interest bearing in 2008 was 91.9% and 89.8% during 2007 and 88.9% during 2006. Average demand deposits which earn no interest were $33.8 million, $36.1 million and $33.3 million for the periods ended December 31, 2008, 2007 and 2006, respectively.
Management’s strategy has been to support loan and investment growth with core deposits and not to aggressively solicit the more volatile, large denomination certificates of deposit. Large denomination certificates of deposit are particularly sensitive to changes in interest rates. Management considers these deposits to be volatile and, in order to minimize liquidity and interest rate risks, invests these funds in short-term investments.
Average deposits and related average rates paid for the periods ended December 31, 2008, 2007, and 2006 are summarized in the following table.
Average Deposit Mix (dollars in thousands)
| | | 2008 | | | 2007 | | | 2006 | |
| | | Amount | | | Rate | | | Amount | | | Rate | | | Amount | | | Rate | |
| Interest bearing deposits: | | | | | | | | | | | | | | | | | | |
| Demand accounts | | $ | 29,399 | | | | .61 | % | | $ | 26,714 | | | | .62 | % | | $ | 27,404 | | | | .75 | % |
| Money market | | | 67,749 | | | | 2.57 | | | | 66,482 | | | | 3.58 | | | | 62,472 | | | | 2.37 | |
| Savings | | | 8,831 | | | | 1.12 | | | | 6,138 | | | | .89 | | | | 6,657 | | | | .67 | |
| Time deposit | | | 275,956 | | | | 4.16 | | | | 218,997 | | | | 5.05 | | | | 168,532 | | | | 4.27 | |
| Total interest bearing deposits | | | 381,935 | | | | 3.54 | | | | 318,331 | | | | 4.29 | | | | 265,065 | | | | 3.58 | |
| | | | | | | | | | | | | | | | | | | | | | | | | |
| Noninterest bearing demand deposits | | | 33,775 | | | | | | | | 36,181 | | | | | | | | 33,259 | | | | | |
| Total deposits | | $ | 415,710 | | | | | | | $ | 354,512 | | | | | | | $ | 298,324 | | | | | |
Management’s Discussion and Analysis
The following table provides maturity information relating to time deposits of $100,000 or more at December 31, 2008.
Large Time Deposit Maturities, (thousands)
| Remaining maturity of three months or less | | $ | 49,943 | |
| Remaining maturity over three through twelve months | | | 70,492 | |
| Remaining maturity over twelve months | | | 35,143 | |
| Total time deposits of $100,000 or more | | $ | 155,578 | |
Securities Sold Under Agreements to Repurchase
Other borrowed funds consisting of securities sold under agreements to repurchase and Federal funds purchased were $23.8 million, $29.2 million and $5.4 million at December 31, 2008, 2007 and 2006, respectively. The increase from 2006 to 2007 included $20,000,000 of reverse repurchase agreements at favorable rates used to purchase $20,000,000 of investments at a favorable spread. Average short-term debt was $20.5 million, $10.5 million and $5.1 million during 2008, 2007 and 2006, respectively. The related interest expense was $630,905, $468,792 and $225,725 during 2008, 2007 and 2006, respectively.
Other short-term Borrowings
There was one variable rate FHLB advance of $6,000,000 at December 31, 2008 and were three variable rate FHLB advances of $2,000,000, $6,000,000 and $5,000,000 at December 31, 2007. Also included in other short-term borrowings were $1,000,000 which is funded by Nexity Bank that will mature on July 1, 2020 at the Prime lending rate. Also included in other short-term borrowings is $3,000,000 of subordinated notes that will mature on July 1, 2015 and bears interest at 3 month LIBOR plus 350 basis points.
Long-term Debt
As a member of the Federal Home Loan Bank of Atlanta, the Bank has the ability to borrow up to 10% of total assets in the form of FHLB advances. At December 31, 2008 and 2007 advances of $42.5 million and $25.5 million, respectively were outstanding. The average amount outstanding during 2008 and 2007 was $34.9 million and $26.4 million, respectively. Approximately $30,000,000 in 1-4 family residential loans, $43,000,000 in commercial real estate loans and 23,000,000 in home equity line of credit loans were pledged as collateral for the FHLB advances at December 31, 2008. $1,000,000 is funded by Nexity Bank that will mature on July 1, 2020 at the Prime lending rate. On June 27, 2008, Waccamaw Bank, sold in a private placement to qualified institutional investors, an aggregate of $3,000,000 of subordinated notes that will mature on July 1, 2015 at 3 month LIBOR plus 350 basis points.
| | Advance | | Rate | | | |
| | | | | | | | |
| 02/10/10 | | $ | 2,500,000 | | Fixed at 5.85% | | Convertible by FHLB quarterly at 3 Mo LIBOR - ARC | |
| 09/02/11 | | | 5,000,000 | | Fixed at 3.76% | | | |
| 07/12/12 | | | 9,000,000 | | 1 Month LIBOR - | | .50% |
| 09/04/12 | | | 6,000,000 | | Fixed at 4.00% | | | | |
| 09/03/13 | | | 6,000,000 | | Fixed at 4.15% | | |
| 12/02/13 | | | 5,000,000 | | 3 Month LIBOR - | | .50% | |
| | | 4,000,000 | | Fixed at 4.06% - | | Convertible by FHLB quarterly at 3 Mo LIBOR-ARC | |
| 04/22/19 | | | 5,000,000 | | 3 Month LIBOR | | .50% Convertible 4/22/09 at 4.75% Fixed Rate | |
| | | $ | 42,500,000 | | | | | | |
Management’s Discussion and Analysis
Capital Adequacy
Stockholders’ equity was $27.8 million at December 31, 2008. This was a 20.5% decrease from the $35.0 million at the end of 2007. Average stockholders' equity as a percentage of average total assets was 6.2%, 7.9% and 7.3% for 2008, 2007, and 2006, respectively.
The Company completed a unit offering on August 31, 2006 consisting of one share of common stock and one warrant to purchase a share of the Company’s common stock at a price per share of $21.82 at any time until September 30, 2009. The units were offered for sale to the holders of record of the Company’s common stock at the close of business on July 12, 2006. The offering raised $3,582,000 less expenses of $46,000 of additional capital through the sale of 231,778 units (adjusted for stock dividends).
The Company also completed a private offering on October 31, 2006 consisting of one share of Series A convertible preferred stock and one detachable warrant to purchase one share of the Company’s common stock at a price per share of $21.82 at any time until September 30, 2009. The private offering raised $1,006,000 less expenses of $13,000 of additional capital through the sale of 65,111 units. Each share of preferred stock may be converted at the election of its holder to one share of common stock after November 1, 2007 (adjusted for stock dividends).
The Company completed its first issuance of Trust Preferred securities in December 2003 in the amount of $8 million and completed its second issuance of Trust Preferred securities in July 2008 in the amount of $4 million. The Trust Preferred securities are accounted for as long-term debt in the accompanying financial statements, however, for regulatory capital purposes, these issuances are considered Tier 1 capital.
These capital transactions are being utilized to capitalize the continued growth of the Company and the Bank.
Regulatory guidelines relating to capital adequacy provide minimum risk-based ratios which assess capital adequacy while encompassing all credit risks, including those related to off-balance sheet activities. Capital ratios under these guidelines are computed by weighing the relative risk of each asset category to derive risk-adjusted assets. For the Company, risk-based capital guidelines require minimum ratios of core (Tier 1) capital (common stockholders’ equity) to risk-weighted assets of 4.0% and total regulatory capital (core capital plus allowance for loan losses up to 1.25% of risk-weighted assets) to risk-weighted assets of 8.0%. As of December 31, 2008, the Company’s Tier 1 risk-weighted capital ratio and total capital ratio were 9.8% and 11.7%, respectively.
The Bank also has capital ratio constraints with which to comply. These ratios are slightly different than those required at the parent company level. At December 31, 2008, the Bank’s capital ratios were as follows: Tier 1 leverage ratio, 7.8%, Tier 1 risk-based capital ratio, 9.5% and total risk-based ratio, 11.4%. These capital ratios were sufficient at December 31, 2008 to classify the Bank as “well capitalized” in accordance with the FDIC’s regulatory capital rules. The Company’s and Bank’s actual capital amounts and ratios are presented in the following table.
Management’s Discussion and Analysis
Capital Requirements (dollars in thousands)
Waccamaw Bankshares, Inc.
| | | | | | | | | Risk-based Capital | |
| | | Leverage Capital | | | Tier I Capital | | | Total Capital | |
| | | Amount | | | Percentage(1) | | | Amount | | | Percentage(2) | | | Amount | | | Percentage(2) | |
| | | | | | | | | | | | | | | | | | | |
| Actual | | $ | 44,206 | | | | 8.00 | % | | $ | 44,206 | | | | 9.76 | % | | $ | 52,871 | | | | 11.68 | % |
| Well Capitalized | | | 27,616 | | | | 5.00 | % | | | 27,168 | | | | 6.00 | % | | | 45,280 | | | | 10.00 | % |
Waccamaw Bank
| | | | | | | | | Risk-based Capital | |
| | | Leverage Capital | | | Tier I Capital | | | Total Capital | |
| | | Amount | | | Percentage(1) | | | Amount | | | Percentage(2) | | | Amount | | | Percentage(2) | |
| | | | | | | | | | | | | | | | | | | |
| Actual | | $ | 43,044 | | | | 7.81 | % | | $ | 43,044 | | | | 9.53 | % | | $ | 51,709 | | | | 11.44 | % |
| Well Capitalized | | | 27,561 | | | | 5.00 | % | | | 27,102 | | | | 6.00 | % | | | 45,170 | | | | 10.00 | % |
| (1) | Percentage of total adjusted average assets. The Federal Reserve Board (“FRB”) minimum leverage ratio requirement is 3 percent to 5 percent, depending on the institution’s composite rating as determined by its regulators. The FRB has not advised the Company of any specific requirements applicable to it. |
| (2) | Percentage of risk-weighted assets. |
Nonperforming and Problem Assets
Certain credit risks are inherent in making loans, particularly commercial and consumer loans. Management prudently assesses these risks and attempts to manage them effectively. The Bank also attempts to reduce repayment risks by adhering to internal credit policies and procedures. These policies and procedures include officer and customer limits, periodic loan documentation review and follow up on exceptions to credit policies.
The allowance for loan losses is maintained at a level adequate to absorb probable losses. Some of the factors which management considers in determining the appropriate level of the allowance for credit losses are: past loss experience, an evaluation of the current loan portfolio, identified loan problems, the loan volume outstanding, the present and expected economic conditions in general, regulatory policies, and in particular, how such conditions relate to the market areas that the Bank serves. Bank regulators also periodically review the Bank's loans and other assets to assess their quality. Loans deemed uncollectible are charged to the allowance. Provisions for loan losses and recoveries on loans previously charged off are added to the allowance.
The accrual of interest on loans is discontinued on a loan when, in the opinion of management, there is an indication that the borrower may be unable to meet payments as they become due. Upon such discontinuance, all unpaid accrued interest is reversed.
The provision for loan losses, net charge-offs and the activity in the allowance for loan losses is detailed in the following table.
Management’s Discussion and Analysis
Allowance for Loan Losses (dollars in thousands)
| | | 2008 | | | 2007 | | | 2006 | | | 2005 | | | 2004 | |
| | | | | | | | | | | | | | | | |
| Balance at beginning of period | | $ | 5,386 | | | $ | 4,886 | | | $ | 3,939 | | | $ | 2,791 | | | $ | 2,218 | |
| Charge-offs: | | | | | | | | | | | | | | | | | | | | |
| Construction loans | | | (492 | ) | | | (86 | ) | | | - | | | | - | | | | - | |
| Commercial and industrial loans | | | (231 | ) | | | (1 | ) | | | (500 | ) | | | (86 | ) | | | (63 | ) |
| Consumer and other | | | (476 | ) | | | (201 | ) | | | (85 | ) | | | (184 | ) | | | (210 | ) |
| Total charge-offs | | | (1,199 | ) | | | (288 | ) | | | (585 | ) | | | (270 | ) | | | (273 | ) |
| | | | | | | | | | | | | | | | | | | | | |
| Recoveries | | | | | | | | | | | | | | | | | | | | |
| Construction loans | | | - | | | | 379 | | | | - | | | | - | | | | - | |
| Commercial and industrial loans | | | 4 | | | | - | | | | - | | | | 34 | | | | 17 | |
| Consumer and other | | | 7 | | | | 23 | | | | 36 | | | | 14 | | | | 10 | |
| Total recoveries | | | 11 | | | | 402 | | | | 36 | | | | 48 | | | | 27 | |
| | | | | | | | | | | | | | | | | | | | | |
| Net charge-offs | | | (1,188 | ) | | | 114 | | | | (549 | ) | | | (222 | ) | | | (246 | ) |
| | | | | | | | | | | | | | | | | | | | | |
| Allowance purchased from The Bank | | | | | | | | | | | | | | | | | | | | |
| of Heath Springs | | | - | | | | - | | | | 46 | | | | - | | | | - | |
| | | | | | | | | | | | | | | | | | | | | |
| Provision for loan losses | | | 2,990 | | | | 386 | | | | 1,450 | | | | 1,370 | | | | 819 | |
| | | | | | | | | | | | | | | | | | | | | |
| Balance at the end of the year | | $ | 7,188 | | | $ | 5,386 | | | $ | 4,886 | | | $ | 3,939 | | | $ | 2,791 | |
| | | | | | | | | | | | | | | | | | | | | |
| Total loans outstanding at year-end | | $ | 386,456 | | | $ | 360,977 | | | $ | 317,590 | | | $ | 261,905 | | | $ | 209,827 | |
| | | | | | | | | | | | | | | | | | | | | |
| Average net loans outstanding for the year | | $ | 376,747 | | | $ | 332,451 | | | $ | 279,625 | | | $ | 238,579 | | | $ | 168,757 | |
| | | | | | | | | | | | | | | | | | | | | |
| Allowance for loan losses to | | | | | | | | | | | | | | | | | | | | |
| loans outstanding | | | 1.86 | % | | | 1.49 | % | | | 1.54 | % | | | 1.50 | % | | | 1.33 | % |
| Ratio of net loan charge-offs to | | | | | | | | | | | | | | | | | | | | |
| average loans outstanding | | | .32 | % | | | (0.03 | )% | | | 0.20 | % | | | 0.09 | % | | | 0.15 | % |
The following table sets forth information about the Bank’s allowance for loan losses by asset category at the dates indicated. The allocation of the allowance to each category is not necessarily indicative of future losses and does not restrict the use of the allowance to absorb losses in any category.
Allowance for Loan Losses by Category (dollars in thousands)
| | | 2008 | | | 2007 | | | 2006 | | | 2005 | | | 2004 | |
| | | Amount | | | | %(1) | | | Amount | | | | %(1) | | | Amount | | | | %(1) | | | Amount | | | | %(1) | | | Amount | | | %(1) | |
| | | | | | | | | | | | | | | | | | | | | | | | | | | | | | | | | | | |
| Construction and development | | $ | 2,341 | | | | 32.57 | | | $ | 1,936 | | | | 33.73 | | | $ | 1,766 | | | | 34.33 | | | $ | 1,320 | | | | 31.91 | | | $ | 253 | | | | 17.89 | |
| Farmland | | | 62 | | | | 0.86 | | | | 61 | | | | 1.05 | | | | 39 | | | | .76 | | | | 33 | | | | 0.97 | | | | 28 | | | | 1.01 | |
| 1-4 family residential | | | 1,557 | | | | 21.67 | | | | 1,059 | | | | 20.96 | | | | 954 | | | | 20.30 | | | | 911 | | | | 23.98 | | | | 702 | | | | 27.87 | |
| Multifamily residential | | | 220 | | | | 3.05 | | | | 42 | | | | 1.02 | | | | 42 | | | | 1.15 | | | | 49 | | | | 1.71 | | | | 39 | | | | 1.72 | |
| Nonfarm, nonresidential | | | 1,831 | | | | 25.47 | | | | 1,399 | | | | 25.82 | | | | 1,176 | | | | 23.15 | | | | 1,048 | | | | 25.66 | | | | 358 | | | | 31.05 | |
| Total real estate | | | 6,011 | | | | 83.62 | | | | 4,497 | | | | 82.58 | | | | 3,977 | | | | 79.69 | | | | 3,361 | | | | 84.23 | | | | 1,380 | | | | 79.54 | |
| | | | | | | | | | | | | | | | | | | | | | | | | | | | | | | | | | | | | | | | | |
| Agricultural | | | 12 | | | | 0.17 | | | | 10 | | | | 0.19 | | | | 10 | | | | .22 | | | | 5 | | | | 0.14 | | | | 28 | | | | 0.94 | |
| Commercial and industrial | | | 800 | | | | 11.13 | | | | 593 | | | | 12.09 | | | | 664 | | | | 15.38 | | | | 389 | | | | 11.09 | | | | 1,241 | | | | 14.74 | |
| Consumer | | | 320 | | | | 4.45 | | | | 226 | | | | 3.86 | | | | 212 | | | | 4.15 | | | | 168 | | | | 4.03 | | | | 124 | | | | 4.08 | |
| Other | | | 45 | | | | 0.63 | | | | 60 | | | | 1.28 | | | | 23 | | | | .56 | | | | 16 | | | | 0.51 | | | | 18 | | | | 0.70 | |
| Total | | $ | 7,188 | | | | 100.00 | | | $ | 5,386 | | | | 100.00 | | | $ | 4,886 | | | | 100.00 | | | $ | 3,939 | | | | 100.00 | | | $ | 2,791 | | | | 100.00 | |
(1) Represents the percentage of loans in each category to total loans outstanding.
Management realizes that general economic trends greatly affect loan losses and no assurances can be made about future losses. Management does, however consider the allowance for loan losses to be adequate at December 31, 2008.
Management’s Discussion and Analysis
The following table sets forth information about the Bank’s nonperforming assets.
Nonperforming Assets (dollars in thousands)
| | | 2008 | | | 2007 | | | 2006 | | | 2005 | | | 2004 | |
| | | | | | | | | | | | | | | | |
| Nonaccrual loans | | $ | 15,633 | | | $ | 1,534 | | | $ | 1,181 | | | $ | 1,711 | | | $ | 1,723 | |
| Loans past due 90 days or more | | | | | | | | | | | | | | | | | | | | |
| and still accruing interest | | | 1,451 | | | | 2,608 | | | | 340 | | | | 250 | | | | 628 | |
| Total nonperforming loans | | | 17,084 | | | | 4,142 | | | | 1,521 | | | | 1,961 | | | | 2,351 | |
| | | | | | | | | | | | | | | | | | | | | |
| Other real estate and repossessed | | | | | | | | | | | | | | | | | | | | |
| personal property | | | 963 | | | | 340 | | | | 32 | | | | 140 | | | | 82 | |
| Total nonperforming assets | | $ | 18,047 | | | $ | 4,482 | | | $ | 1,553 | | | $ | 2,101 | | | $ | 2,433 | |
| | | | | | | | | | | | | | | | | | | | | |
| Nonperforming assets as a | | | | | | | | | | | | | | | | | | | | |
| percentage of: | | | | | | | | | | | | | | | | | | | | |
| Total assets | | | 3.36 | % | | | .88 | % | | | .39 | % | | | .65 | % | | | .94 | % |
| Total loans | | | 4.67 | % | | | 1.24 | % | | | .49 | % | | | .80 | % | | | 1.16 | % |
Asset Quality
During 2008, management refined its allowance for loan losses methodology taking into account existing Securities and Exchange Commission (SEC) and regulatory guidance. The refinement in methodology focused on revised loss factors that are more indicative of actual loss experience in recent years and current borrower analysis. The results of the allowance for loan loss model indicated that a $2,990,096 provision was needed for the year ended December 31, 2008. The increase in the provision as compared to 2007 is the result of an increase in non performing loans along with loans identified as impaired under SFAS 114 as discussed under “Fair Value”.
The allowance for loan losses at December 31, 2008, was $7.2 million or 1.86% of period end loans compared to an allowance for loan losses of $5.4 million or 1.49% of period end loans at December 31, 2007. At December 31, 2008 the Bank had $15.6 million of loans in nonaccrual status as compared to $1.5 million at December 31, 2007. The increase in non accrual loans includes increases in various non-performing commercial real estate loans totaling $11.3 million as the largest nonaccrual loan relationship totaled $4.1 million. At December 31, 2008 there was $1.2 million in net charge-offs compared to $288,000 at December 31, 2007, as the increase in charge-offs can be attributed to eight loans relating to commercial and residential real estate. At December 31, 2008 there was $6,681 in repossessed assets and no repossessed assets at December 31, 2007. At December 31, 2008 there was $956,831 in other real estate owned compared to $318,234 at December 31, 2007, as the increase in other real estate owned can be attributed to ten properties totaling $638,597 acquired by the Bank in 2008.
In addition to the impact on our allowance for loan losses resulting from our loan portfolio rebalancing efforts, which have effectively reduced our concentrations in construction and development sector loans, our refined allowance for loan losses methodology, as previously discussed, has resulted in an overall increase in the allowance for loan losses as a percent of total loans. In management’s judgment, an adequate allowance for estimated losses has been established; however, there can be no assurance that actual losses will not exceed the estimated amounts in the future.
The level of the allowance for loan losses is established based upon management’s evaluation of portfolio composition, current and projected national and local economic conditions and results of independent reviews of the loan portfolio by internal and external examination. Management recognizes the inherent risk associated with commercial and consumer lending, including whether or not a borrower’s actual results of operations will correspond to those projected by the borrower when the loan was funded, economic factors such as the number of housing starts and fluctuations in interest rates, etc., depression of collateral values, and completion of projects within the original cost and time estimates. As a result, management continues to actively monitor the Bank’s asset quality and lending policies. Management believes that its loan portfolio is diversified so that it is unlikely that a downturn in a particular market or industry will have a significant impact on the loan portfolio or the Bank’s financial condition.
Management’s Discussion and Analysis
Liquidity and Sensitivity
The principal goals of the Bank's asset and liability management strategy are the maintenance of adequate liquidity and the management of interest rate risk. Liquidity is the ability to convert assets to cash in order to fund depositors' withdrawals or borrowers' loans without significant loss. Interest rate risk management balances the effects of interest rate changes on assets that earn interest against liabilities on which interest is paid, to protect the Bank from wide fluctuations in its net interest income which could result from interest rate changes.
Management must ensure that adequate funds are available at all times to meet the needs of its customers. On the asset side of the balance sheet, maturing investments, loan payments, maturing loans, federal funds sold, and unpledged investment securities are principal sources of liquidity. On the liability side of the balance sheet, liquidity sources include core deposits, the ability to increase large denomination certificates of deposit, Federal funds lines from correspondent banks, borrowings from the Federal Home Loan Bank, as well as the ability to generate funds through the issuance of long-term debt and equity.
Interest rate risk is the effect that changes in interest rates would have on interest income and interest expense as interest-sensitive assets and interest-sensitive liabilities either re-price or mature. Management attempts to maintain the portfolios of earning assets and interest-bearing liabilities with maturities or re-pricing opportunities at levels that will afford protection from erosion of net interest margin, to the extent practical, from changes in interest rates.
At December 31, 2008, the Bank was cumulatively asset-sensitive (earning assets subject to interest rate changes exceeded interest-bearing liabilities subject to changes in interest rates). Demand, savings and money market accounts re-pricing within three months totaled $114.1 million. Historically, these short-term deposits are not as rate sensitive as other types of interest-bearing deposits. The Bank is asset sensitive in the three month or less time period, with the four to twelve months time period being liability-sensitive, the thirteen to sixty months time period being asset-sensitive and the over sixty months time period being asset-sensitive.
Time deposits in denominations of $100,000 or more and large municipal repurchase accounts are especially susceptible to interest rate changes. These deposits are matched with short-term investments. Matching sensitive positions alone does not ensure that the Bank has no interest rate risk. The re-pricing characteristics of assets are different from the re-pricing characteristics of funding sources. Thus, net interest income can be impacted by changes in interest rates even if the re-pricing opportunities of assets and liabilities are perfectly matched.
Mortgage backed securities are shown based on their contractual maturity but tend to be repaid earlier. Long-term debt maturing in 2010 with a quarterly call feature is shown in the 1-3 month re-pricing period. Repurchase agreements with a put feature are shown in the re-pricing period in which the structure is put back to the Bank.
The table below shows the sensitivity of the Bank's balance sheet at the dates indicated but is not necessarily indicative of the position on other dates.
Management’s Discussion and Analysis
Interest Rate Sensitivity (dollars in thousands)
| | | December 31, 2008 | |
| | | Maturities/Re-pricing | |
| | | | 1-3 | | | | 4-12 | | | | 13-60 | | | Over 60 | | | | |
| | | Months | | | Months | | | Months | | | Months | | | Total | |
| Earning assets: | | | | | | | | | | | | | | | | | | |
| Loans | | $ | 160,464 | | | $ | 47,818 | | | $ | 126,100 | | | $ | 52,074 | | | $ | 386,456 | |
| Investments | | | 1,153 | | | | 2,030 | | | | 1,130 | | | | 87,221 | | | | 91,534 | |
| Federal funds sold | | | 4,281 | | | | - | | | | - | | | | - | | | | 4,281 | |
| Deposits with banks | | | 2,685 | | | | - | | | | - | | | | - | | | | 2,685 | |
| Total | | | 168,583 | | | | 49,848 | | | | 127,230 | | | | 141,295 | | | | 484,956 | |
| | | | | | | | | | | | | | | | | | | | | |
| Interest-bearing liabilities: | | | | | | | | | | | | | | | | | | | | |
| Demand accounts | | | 31,567 | | | | - | | | | - | | | | - | | | | 31,567 | |
| Savings and money market | | | 82,459 | | | | - | | | | - | | | | - | | | | 82,459 | |
| Time deposits | | | 90,235 | | | | 135,017 | | | | 40,818 | | | | 2,325 | | | | 268,395 | |
| Repurchase agreements and purchased funds | | | 3,830 | | | | - | | | | - | | | | - | | | | 3,830 | |
| Other short-term borrowings | | | 6,000 | | | | 4,000 | | | | - | | | | - | | | | 10,000 | |
| Long-term debt | | | - | | | | - | | | | 53,500 | | | | 9,000 | | | | 46,500 | |
| Subordinated debentures | | | 12,372 | | | | - | | | | - | | | | - | | | | 12,372 | |
| Total | | | 226,463 | | | | 139,017 | | | | 94,318 | | | | 11,325 | | | | 471,123 | |
| Interest rate gap | | $ | (57,880 | ) | | $ | (89,169 | ) | | $ | 32,912 | | | $ | 127,970 | | | $ | 13,833 | |
| | | | | | | | | | | | | | | | | | | | | |
| Cumulative interest sensitivity gap | | $ | (57,880 | ) | | $ | (147,049 | ) | | $ | (114,137 | ) | | $ | 13,833 | | | | | |
| | | | | | | | | | | | | | | | | | | | | |
| Ratio of sensitivity gap to total earnings assets | | | (11.94 | )% | | | (18.39 | )% | | | 6.80 | % | | | 26.39 | % | | | 2.86 | % |
| Cumulative ratio of sensitivity gap to total earnings assets | | | (11.94 | )% | | | (30.33 | )% | | | (23.53 | )% | | | 2.86 | % | | | | |
Effects of Inflation
Interest rates are affected by inflation, but the timing and magnitude of the changes may not coincide with changes in the consumer price index. Management actively monitors the Bank’s interest rate sensitivity in order to minimize the effects of inflationary trends on the Bank’s operations. Other areas of non-interest expense may be more directly affected by inflation.
Commitments and Contingencies
Litigation
In the normal course of business the Bank is involved in various legal proceedings. After consultation with legal counsel, management believes that any liability resulting from such proceedings will not be material to the financial statements.
To meet the financing needs of its customers, the Bank is party to financial instruments with off-balance-sheet risk in the normal course of business. These financial instruments include commitments to extend credit and standby letters of credit. These instruments involve, to varying degrees, credit risk in excess of the amount recognized in the balance sheet.
Management’s Discussion and Analysis
Financial Instruments with Off-Balance-Sheet Risk
The Bank's exposure to credit loss in the event of nonperformance by the other party to the financial instrument for commitments to extend credit and standby letters of credit is represented by the contractual amount of those instruments. The Bank uses the same credit policies in making commitments and conditional obligations as for on-balance-sheet instruments. A summary of the Bank's commitments are as follows:
| | | 2008 | | | 2007 | |
| | | | | | | |
| Commitments to extend credit | | $ | 41,067,000 | | | $ | 48,600,000 | |
| Stand-by letters of credit | | | 3,194,000 | | | | 4,509,000 | |
| | | $ | 44,261,000 | | | $ | 53,109,000 | |
Commitments to extend credit are agreements to lend to a customer as long as there is no violation of any condition established in the contract. Commitments generally have fixed expiration dates or other termination clauses and may require payment of a fee. Since many of the commitments are expected to expire without being drawn upon, the total commitment amounts do not necessarily represent future cash requirements. The Bank evaluates each customer's creditworthiness on a case-by-case basis. The amount of collateral obtained, if deemed necessary by the Bank upon extension of credit, is based on management's credit evaluation of the party. Collateral held varies, but may include accounts receivable, inventory, property and equipment, residential real estate and income-producing commercial properties.
Standby letters of credit are conditional commitments issued by the Bank to guarantee the performance of a customer to a third party. Those guarantees are primarily issued to support public and private borrowing arrangements. The credit risk involved in issuing letters of credit is essentially the same as that involved in extending loan facilities to customers. Collateral held varies as specified above and is required in instances which the Bank deems necessary.
Concentrations of Credit Risk
Substantially all of the Bank's loans and commitments to extend credit have been granted to customers in the Bank's market area and such customers are generally depositors of the Bank. The concentrations of credit by type of loan are set forth in Note 5. The distribution of commitments to extend credit approximates the distribution of loans outstanding. The Bank's primary focus is toward commercial, consumer and small business transactions, and accordingly, it does not have a significant number of credits to any single borrower or group of related borrowers in excess of $4,000,000.
The Bank from time to time has cash and cash equivalents on deposit with financial institutions which exceed federally-insured limits.
Financial Ratios
The following table summarizes ratios considered to be significant indicators of the Bank’s operating results and financial condition for the periods indicated.
Key Financial Ratios
| | | 2008 | | | 2007 | | | 2006 | |
| | | | | | | | | | |
| Average equity to average assets | | | 6.20 | % | | | 7.64 | % | | | 7.27 | % |
| Return on average assets | | | (.38 | ) % | | | .89 | % | | | 1.02 | % |
| Return on average equity | | | (6.11 | ) % | | | 11.67 | % | | | 14.07 | % |
Annual Meeting
The annual meeting of stockholders will be held Thursday, May 21, 2009 at 7:00 p.m. at the Vineland Station Train Depot, Whiteville, North Carolina.
Requests for Information
Requests for information should be directed to Mr. James G. Graham, President, at Waccamaw Bankshares, Inc., Post Office Box 2009, Whiteville, North Carolina, 28472; telephone (910) 641-0044.
| | Stock Transfer Agent | | Legal Counsel |
| | | | | |
| Dixon Hughes PLLC | | First-Citizens Bank | | Gaeta & Eveson, P.A. |
| Certified Public Accountants | | & Trust Company | | 8305 Falls of Neuse Road |
| 2501 Blue Ridge Road | | Post Office Box 29522 | | Suite 203 |
| Suite 500 | | Raleigh, North Carolina 27626-0522 | | Raleigh, North Carolina 27615 |
| | | | |
Federal Deposit Insurance Corporation
The Bank is a member of the FDIC. This statement has not been reviewed, or confirmed for accuracy or relevance by the Federal Deposit Insurance Corporation.