TRANSALTA CORPORATION
Management’s Discussion and Analysis
This Management’s Discussion and Analysis (MD&A) contains forward-looking statements. These statements are based on certain estimates and assumptions and involve risks and uncertainties. Actual results may differ materially. Refer to the Forward-Looking Statements section of this MD&A for additional information.
Table of Contents
This MD&A should be read in conjunction with our 2024 audited annual consolidated financial statements (the consolidated financial statements) and our 2024 Annual Information Form (AIF), each for the fiscal year ended Dec. 31, 2024. In this MD&A, unless the context otherwise requires, “we”, “our”, “us”, the “Company” and “TransAlta” refer to TransAlta Corporation and its subsidiaries. The consolidated financial statements have been prepared in accordance with International Financial Reporting Standards (IFRS) for Canadian publicly accountable enterprises as issued by the International Accounting Standards Board (IASB) and in effect at Dec. 31, 2024. All tabular amounts in the following discussion are in millions of Canadian dollars unless otherwise noted, except amounts per share, which are in whole dollars to the nearest two decimals. This MD&A is dated Feb. 19, 2025. Additional information respecting TransAlta, including our AIF for the year ended Dec. 31, 2024, is available on SEDAR+ at www.sedarplus.ca, on EDGAR at www.sec.gov and on our website at www.transalta.com. Information on or connected to our website is not incorporated by reference herein.
| | | | | | | | |
| TransAlta Corporation | 2024 Integrated Report | M1 |
Forward-Looking Statements
This MD&A includes "forward-looking information" within the meaning of applicable Canadian securities laws and "forward-looking statements" within the meaning of applicable U.S. securities laws, including the Private Securities Litigation Reform Act of 1995 (collectively referred to herein as "forward-looking statements").
Forward-looking statements are not facts, but only predictions and generally can be identified by the use of statements that include phrases such as "may", "will", "can", "could", "would", "shall", "believe", "expect", "estimate", "anticipate", "intend", "plan", "forecast", "foresee", "potential", "enable", "continue" or other comparable terminology. These statements are not guarantees of our future performance, events or results and are subject to risks, uncertainties and other important factors that could cause our actual performance, events or results to be materially different from those set out in or implied by the forward-looking statements.
In particular, this MD&A contains forward-looking statements about the following, among other things:
•The strategic objectives of the Company and that the execution of the Company’s strategy will realize value for shareholders;
•Our capital allocation and financing strategy;
•Our sustainability goals and targets, including those in our 2024 Sustainability Report;
•Our 2025 Outlook;
•Our financial and operational performance, including our hedge position;
•Optimizing and diversifying our existing assets;
•The increasingly contracted nature of our fleet;
•Expectations about strategies for growth and expansion, including opportunities for Centralia redevelopment, and data centre opportunities;
•Expected costs and schedules for planned projects;
•Expected regulatory processes and outcomes, including in relation to the Alberta restructured energy market;
•The power generation industry and the supply and demand of electricity;
•The cyclicality of our business;
•Expected outcomes with respect to legal proceedings;
•The expected impact of future tax and accounting changes; and
•Expected industry, market and economic conditions.
The forward-looking statements contained in this MD&A are based on many assumptions including, but not limited to, the following:
•No significant changes to applicable laws and regulations;
•No unexpected delays in obtaining required regulatory approvals;
•No material adverse impacts to investment and credit markets;
•No significant changes to power price and hedging assumptions;
•No significant changes to gas commodity price assumptions and transport costs;
•No significant changes to interest rates;
•No significant changes to the demand and growth of renewables generation;
•No significant changes to the integrity and reliability of our facilities;
•No significant changes to the Company's debt and credit ratings;
•No unforeseen changes to economic and market conditions; and
•No significant event occurring outside the ordinary course of business.
These assumptions are based on information currently available to TransAlta, including information obtained from third-party sources. Actual results may differ materially from those predicted by such assumptions.
Factors that may adversely impact what is expressed or implied by forward-looking statements contained in this MD&A include, but are not limited to:
•Fluctuations in power prices;
•Changes in supply and demand for electricity;
•Our ability to contract our electricity generation for prices that will provide expected returns;
•Our ability to replace contracts as they expire;
•Risks associated with development projects and acquisitions;
•Any difficulty raising needed capital in the future on reasonable terms or at all;
•Our ability to achieve our targets relating to environmental, social and governance (ESG) performance;
•Long-term commitments on gas transportation capacity that may not be fully utilized over time;
•Changes to the legislative, regulatory and political environments;
•Environmental requirements and changes in, or liabilities under, these requirements;
•Operational risks involving our facilities, including unplanned outages and equipment failure;
•Disruptions in the transmission and distribution of electricity;
•Reductions in production;
•Impairments and/or writedowns of assets;
•Adverse impacts on our information technology systems and our internal control systems, including increased cybersecurity threats;
•Commodity risk management and energy trading risks;
| | | | | | | | |
| M2 | TransAlta Corporation | 2024 Integrated Report |
•Reduced labour availability and ability to continue to staff our operations and facilities;
•Disruptions to our supply chains;
•Climate-change related risks;
•Reductions to our generating units' relative efficiency or capacity factors;
•General economic risks, including deterioration of equity markets, increasing interest rates or rising inflation;
•General domestic and international economic and political developments, including potential trade tariffs;
•Industry risk and competition;
•Counterparty credit risks;
•Inadequacy or unavailability of insurance coverage;
•Increases in the Company's income taxes and any risk of reassessments;
•Legal, regulatory and contractual disputes and proceedings involving the Company;
•Reliance on key personnel; and
•Labour relations matters.
The foregoing risk factors, among others, are described in further detail in the Governance and Risk Management section of this MD&A.
Readers are urged to consider these factors carefully when evaluating the forward-looking statements, which reflect the Company's expectations only as of the date hereof and are cautioned not to place undue reliance on them. The forward-looking statements included in this document are made only as of the date hereof and we do not undertake to publicly update these forward-looking statements to reflect new information, future events or otherwise, except as required by applicable laws. The purpose of the financial outlooks contained herein is to give the reader information about management's current expectations and plans and readers are cautioned that such information may not be appropriate for other purposes. In light of these risks, uncertainties and assumptions, the forward-looking statements might occur to a different extent or at a different time than we have described, or might not occur at all. We cannot assure that projected results or events will be achieved.
| | | | | | | | |
| TransAlta Corporation | 2024 Integrated Report | M3 |
Description of the Business
TransAlta Corporation is one of Canada’s largest publicly traded power generators, owning and operating a diverse fleet across Canada, the United States and Western Australia. Our portfolio includes hydro, wind, solar, battery storage, natural gas and coal, complemented by our exceptional asset optimization and energy marketing capabilities. As one of Canada’s largest producers of wind and thermal generation and Alberta’s largest producer of hydro power, TransAlta remains committed to a balanced, technology-agnostic generation mix. With strong cash flows underpinned by a high-quality portfolio, TransAlta strives to deliver sustainable long-term shareholder value in an evolving energy landscape.
The Company's goal is to deliver solutions to meet our customers' needs for reliable, sustainable power. With over a century of experience, TransAlta is a trusted partner delivering tailored solutions. Our strategic priorities include optimizing our Alberta Portfolio, executing our growth plan, realizing the value of our legacy generating facilities, maintaining financial strength and capital discipline, defining the next generation of power solutions and leading in ESG and market policy development. We are primarily focused on opportunities within our core markets of Canada, the United States and Western Australia.
Our sustainability goals include our commitment to cease coal-fired generation at the end of 2025. We remain on track to achieve our 2026 target of 75 per cent scope 1 and 2 GHG emissions reductions since 2015 and our carbon net-zero goal by 2045. Since 2005, we have reduced our scope 1 and 2 GHG emissions by 32 million tonnes (MT) of CO2e or an 77 per cent reduction, representing approximately 11 per cent of Canada's Paris Agreement 2030 decarbonization target(1).
Portfolio of Assets
Our asset portfolio is geographically diversified with operations across our core markets.
Our Hydro, Wind and Solar, Gas and Energy Transition segments are responsible for operating and maintaining our generation facilities. Our Energy Marketing segment is responsible for marketing and scheduling our merchant asset fleet in North America (excluding Alberta) along with the procurement, transport and storage of natural gas, providing knowledge to support our growth team, and generating a stand-alone gross margin separate from our asset business through a leading North American energy marketing and trading platform.
Our highly diversified portfolio consists of both merchant assets and high-quality contracted assets. Our merchant assets include our unique hydro merchant portfolio and our merchant legacy thermal portfolio and wind assets. Our merchant exposure is primarily in Alberta, where 58 per cent of our capacity is located and 77 per cent of our Alberta capacity is available to participate in the merchant market. Our high-quality contracted assets provide stable long-term cash flow and earnings, balancing our merchant fleet.
In Alberta, the Company manages merchant exposure by executing hedging strategies that include a significant base of commercial and industrial (C&I) customers, supplemented with financial hedges. A significant portion of our thermal generation capacity in Alberta is hedged to provide greater cash flow certainty while also capturing higher returns for our shareholders through the optimization of our merchant generation portfolio. Refer to the 2025 Outlook section and the Optimization of the Alberta Portfolio of this MD&A for further details.
(1)In 2005, TransAlta's estimated scope 1 and 2 GHG emissions were 41.9 MT of CO2e, which did not receive independent limited assurance. Canada's Paris Agreement 2030 decarbonization target assumed 293 MT of CO2e or a 40 per cent reduction from a 2005 baseline of 732 MT of CO2e.
| | | | | | | | |
| M4 | TransAlta Corporation | 2024 Integrated Report |
The following table provides our consolidated ownership by segment of our facilities across the regions in which we operate as of Dec. 31, 2024:
| | | | | | | | | | | | | | | | | | | | | | | | | | | | | | | | | | |
| Hydro | Wind & Solar | Gas | Energy Transition | | | Total |
Year ended Dec. 31, 2024 | Gross Installed Capacity (MW) | Number of
facilities | Gross Installed Capacity (MW)(1) | Number of
facilities | Gross Installed Capacity (MW)(1)(2) | Number of facilities(2) | Gross Installed Capacity (MW) | Number of facilities(3) | | | Gross Installed Capacity (MW) | Number of
facilities |
| Alberta | 834 | | 17 | | 764 | | 14 | | 3,650 | | 15 | | — | | — | | | | 5,248 | | 46 | |
| | | | | | | | | | | |
| Canada, excluding Alberta | 88 | | 7 | | 751 | | 9 | | 705 | | 4 | | — | | — | | | | 1,544 | | 20 | |
| | | | | | | | | | | |
| U.S. | — | | — | | 1,024 | | 10 | | 29 | | 1 | | 671 | | 2 | | | | 1,724 | | 13 | |
| | | | | | | | | | | |
| Western Australia | — | | — | | 48 | | 3 | | 450 | | 6 | | — | | — | | | | 498 | | 9 | |
| | | | | | | | | | | | |
| | | | | | | | | | | | |
| Total | 922 | | 24 | | 2,587 | | 36 | | 4,834 | | 26 | | 671 | | 2 | | | | 9,014 | | 88 | |
| | | | | | | | | | | | |
(1)Gross installed capacity for consolidated reporting is based on a proportionate interest held in a facility. Refer to the Plant Summary section for details.
(2)Includes 1,747 MW of capacity attributable to nine facilities acquired from Heartland, which exclude the Planned Divestitures. Refer to the Significant and Subsequent events section.
(3)Includes the Centralia coal facility and the Skookumchuck hydro facility.
Contracted Capacity
The following table provides our contracted capacity by segment in MW and as a percentage of total gross installed capacity of our facilities across the regions in which we operate as of Dec. 31, 2024:
| | | | | | | | | | | | | | | | | | | |
| As at Dec. 31, 2024 | Hydro | Wind & Solar | Gas(1) | Energy Transition | | | Total |
| Alberta | — | 336 | 887 | — | | | 1,223 |
| Canada, excluding Alberta | 88 | 751 | 705 | — | | | 1,544 |
| U.S. | — | 1,024 | 29 | 381 | | | 1,434 |
| Western Australia | — | 48 | 450 | — | | | 498 |
| Total contracted capacity (MW) | 88 | 2,159 | 2,071 | 381 | | | 4,699 |
| Contracted capacity as a % of total capacity (%) | 10 | 83 | 43 | 57 | | | 52 |
| | | | | | | |
(1)Includes contracted capacity of 436 MW from facilities acquired from Heartland: 376 MW in Alberta and 60 MW in Canada, excluding Alberta. The figures exclude the contracted capacity of Planned Divestitures. Refer to the Significant and Subsequent events section.
Approximately 52 per cent of our total installed capacity is contracted. Contracts are primarily with strong creditworthy counterparties.
The following table provides the weighted average contract life by segment of our contracted and merchant facilities across the regions in which we operate as of Dec. 31, 2024:
| | | | | | | | | | | | | | | | | | | |
| As at Dec. 31, 2024 | Hydro | Wind & Solar | Gas(1) | Energy Transition | | | Total |
| Alberta | — | | 7 | | 2 | | — | | | | 3 | |
| Canada, excluding Alberta | 15 | | 9 | | 7 | | — | | | | 8 | |
| U.S. | — | | 13 | | 1 | | — | | | | 8 | |
| Western Australia | — | | 14 | | 14 | | — | | | | 14 | |
| | | | | | | |
Total weighted average contract life (years)(2) | 1 | | 10 | | 4 | | — | | | | 5 | |
(1)Total weighted average contract life calculation of our gas facilities as at Dec. 31, 2024 includes the contracts added from the acquisition of Heartland and excludes the contracts pertaining to Planned Divestitures.
(2)The contract life of merchant facilities is included as nil years.
| | | | | | | | |
| TransAlta Corporation | 2024 Integrated Report | M5 |
Highlights
For the year ended Dec. 31, 2024, the Company demonstrated strong financial and operational performance. The results were within the upper range of management's expectations due to active management of the Company's merchant portfolio and hedging strategies. During 2024, the Company settled a higher volume of hedges at prices that were significantly above the spot market in Alberta and achieved commercial operation at the White Rock and Horizon Hill wind facilities. On Dec. 4, 2024, the Company also completed the acquisition of Heartland Generation, which added 1,747 MW to gross
installed capacity. IFRS financial results include the Poplar Hill and Rainbow Lake facilities, (collectively, the Planned Divestitures), which the Company agreed to divest pursuant to a consent agreement entered into with the Commissioner of Competition for Canada. Our non-IFRS measures and operational KPIs exclude the results of the Planned Divestitures. Refer to the Significant and Subsequent Events section of this MD&A for details on the Heartland acquisition and the Planned Divestitures.
| | | | | | | | | | | | | |
| | | |
| Year ended Dec. 31 | | | 2024 | 2023 | 2022(4) |
| Operational information | | | | | |
| Availability (%) | | | 91.2 | | 88.8 | | 89.8 | |
| Production (GWh) | | | 22,811 | | 22,029 | | 21,258 | |
| Select financial information | | | | | |
| Revenues | | | 2,845 | | 3,355 | | 2,976 | |
| | | | | |
| | | | | |
| | | | | |
Adjusted EBITDA(1) | | | 1,253 | | 1,632 | | 1,656 | |
| Earnings before income taxes | | | 319 | | 880 | | 353 | |
| | | | | |
| Net earnings attributable to common shareholders | | | 177 | | 644 | | 4 | |
| Cash flows | | | | | |
| Cash flow from operating activities | | | 796 | | 1,464 | | 877 | |
Funds from operations(1)(2) | | | 810 | | 1,351 | | 1,346 | |
Free cash flow(1)(2) | | | 569 | | 890 | | 961 | |
| Per share | | | | | |
| Weighted average number of common shares outstanding | | | 302 | | 276 | | 271 | |
| Net earnings per share attributable to common shareholders, basic and diluted | | | 0.59 | | 2.33 | | 0.01 | |
| Dividends declared per common share | | | 0.24 | | 0.22 | | 0.21 | |
| Dividends declared per preferred share | | | 1.36 | | 1.33 | | 0.25 | |
Funds from operations per share(1)(2) | | | 2.68 | | 4.89 | | 4.97 | |
Free cash flow per share(1)(2) | | | 1.88 | | 3.22 | | 3.55 | |
| | | | | |
| As at Dec. 31 | | | 2024 | 2023 | 2022 |
| Liquidity and capital resources | | | | | |
Available liquidity(5) | | | 1,616 | | 1,738 | | 2,118 | |
| Adjusted net debt to adjusted EBITDA (times) | | | 3.6 | | 2.5 | | 2.1 | |
| | | | | |
Total consolidated net debt(1)(3) | | | 3,798 | | 3,453 | | 2,854 | |
| | | | | |
| | | | | |
| Assets and liabilities | | | | | |
| Total assets | | | 9,499 | | 8,659 | | 10,741 | |
Total long-term liabilities(6) | | | 5,087 | | 5,253 | | 5,864 | |
Total liabilities(7) | | | 7,656 | | 6,995 | | 8,752 | |
(1)These items are not defined and have no standardized meaning under IFRS and may not be comparable to similar measures presented by other issuers. Presenting these items from period to period provides management and investors with the ability to evaluate earnings (loss) trends more readily in comparison with prior periods’ results. Refer to the Segmented Financial Performance and Operating Results section of this MD&A for further discussion of these items, including, where applicable, reconciliations to measures calculated in accordance with IFRS. Also, refer to the Additional IFRS Measures and Non-IFRS Measures section of this MD&A.
(2)Funds from operations (FFO) per share and free cash flow (FCF) per share are calculated using the weighted average number of common shares outstanding during the period. Refer to the Additional IFRS Measures and Non-IFRS Measures section of this MD&A for the purpose of these non-IFRS ratios.
(3)Refer to the table in the Financial Capital section of this MD&A for more details on the composition of total consolidated net debt.
(4)During 2024 our adjusted EBITDA composition was amended to exclude the impact of Brazeau penalties and related provisions. Therefore, the Company has applied this composition to all previously reported periods. Refer to the Additional IFRS Measures and Non-IFRS Measures section of this MD&A.
(5)Available liquidity is calculated as a sum of total available capacity under the committed credit and term facilities and cash and cash equivalents net of bank overdraft, less the amounts drawn under the non-committed demand facilities.
(6)Total long-term liabilities correspond to total non-current liabilities in the consolidated statements of financial position under IFRS .
(7)Total liabilities correspond to a sum of current and non-current liabilities in the consolidated statements of financial position under IFRS.
| | | | | | | | |
| M6 | TransAlta Corporation | 2024 Integrated Report |
Operating Performance
The following table provides availability (%) by segment:
| | | | | | | | | | | | | |
| Year ended Dec. 31 | | | 2024 | 2023 | 2022 |
| Hydro | | | 90.7 | | 90.8 | | 96.7 | |
| Wind and Solar | | | 93.4 | | 86.9 | | 83.8 | |
| Gas | | | 92.2 | | 91.6 | | 94.6 | |
Energy Transition(1) | | | 80.0 | | 79.8 | | 77.2 | |
| Availability (%) | | | 91.2 | | 88.8 | | 89.8 | |
(1)Availability adjusted for dispatch optimization for the year ended 2022 was 79 per cent.
Availability is an important measure for the Company as it represents the percentage of time a facility is available to produce electricity and is an indicator of the overall performance of the fleet.
The Company schedules dedicated time (planned outages) to maintain, repair or make improvements to the facilities at a time that will minimize the impact to operations. In high price environments, actual outage schedules may change to accelerate the return to service of the unit.
2024 versus 2023
Availability for the year ended Dec. 31, 2024, was 91.2 per cent, compared to 88.8 per cent in 2023, consistent with management's expectations. Higher availability compared to the prior year was primarily due to:
•The addition of the White Rock and Horizon Hill wind facilities; and
•The return to service of the Kent Hills wind facilities.
2023 versus 2022
Availability for the year ended Dec. 31, 2023, was 88.8 per cent, compared to 89.8 per cent in 2022. Lower availability compared to the prior year was primarily due to:
•Planned outages in the Hydro segment, mainly at our Alberta Hydro Assets, to perform scheduled maintenance; and
•Planned outages at Sundance Unit 6, Sheerness Unit 1, Keephills Units 2 and 3 and Sarnia for scheduled maintenance in the Gas segment; partially offset by
•Lower planned outages at Centralia Unit 2 in the Energy Transition segment; and
•The partial return to service of the Kent Hills wind facilities.
Production and Long-Term Average Generation
The following table provides the long-term average generation (LTA generation) on a consolidated basis for each of our segments:
| | | | | | | | | | | | | | | | | | | | | | | | | | | | | | | | |
| 2024 | 2023 | 2022 |
| Year ended Dec. 31 | Actual production (GWh) | LTA generation (GWh) | Production as a % of LTA | Actual production (GWh) | LTA generation (GWh) | Production as a % of LTA | Actual production (GWh) | LTA generation (GWh) | Production as a % of LTA | |
| Hydro | 1,723 | | 2,015 | | 86 | % | 1,769 | | 2,015 | | 88 | % | 1,988 | | 2,015 | | 99 | % | | | |
| Wind and Solar | 5,949 | | 6,876 | | 87 | % | 4,243 | | 5,127 | | 83 | % | 4,248 | | 4,950 | | 86 | % | | | |
| | | | | | | | | | | | |
| | | | | | | | | | | | |
| Gas | 12,317 | | | | 11,873 | | | | 11,448 | | | | | | |
| Energy Transition | 2,822 | | | | 4,144 | | | | 3,574 | | | | | | |
| | | | | | | | | | | | |
| | | | | | | | | | | | |
| Total | 22,811 | | | | 22,029 | | | | 21,258 | | | | | | |
| | | | | | | | | | | | |
| | | | | | | | |
| TransAlta Corporation | 2024 Integrated Report | M7 |
In addition to availability, the Company uses LTA generation as another indicator of performance for the renewable facilities whereby actual production levels are compared against the expected long-term average. In the short term, for each of the Hydro and Wind and Solar segments, the conditions will vary from one period to the next. Over longer durations, facilities are expected to produce in line with their long-term averages, which is broadly considered a reliable indicator of performance.
LTA generation is calculated on an annualized basis from the average annual energy yield predicted from our simulation model based on historical resource data performed over a period of typically greater than 25 years.
The LTA generation for Gas and Energy Transition is not applicable as these facilities are dispatchable and their production is largely dependent on market conditions and merchant demand.
2024 versus 2023
Total production for 2024 increased by 782 GWh, or four per cent, compared to 2023, primarily due to:
•Production from new facilities, including the White Rock West and East wind facilities commissioned in January and April 2024, respectively, the Horizon Hill wind facility commissioned in May 2024, and the Northern Goldfields solar facilities commissioned in November 2023;
•Production from the facilities acquired with Heartland;
•Favourable market conditions in the Ontario wholesale power market that enabled higher dispatch at the Sarnia facility in the Gas segment that resulted in higher merchant production to the Ontario grid;
•The return to service of the Kent Hills wind facilities in the first quarter of 2024; and
•Full-year production from the Garden Plain wind facility; partially offset by
•Increased economic dispatch at the Centralia facility due to lower market prices compared to the prior year in the Energy Transition segment; and
•Higher dispatch optimization in Alberta.
2023 versus 2022
Total production for 2023, increased by 771 GWh, or four per cent, compared to 2022, primarily due to:
•Lower planned and unplanned outages at the Centralia facility in the Energy Transition segment compared to prior year, which allowed the Company to increase dispatch during the periods of higher merchant pricing;
•Higher availability in the Gas segment during periods of supply tightness, allowing for the Company to operate during periods of peak pricing;
•Production from new facilities, including the Garden Plain wind facility, commissioned in August 2023 and the Northern Goldfields solar facilities in November 2023; and
•The partial return to service of the Kent Hills wind facilities in the fourth quarter of 2023, partially offset by
•Lower than average wind and water resources in the year;
•Lower availability in the Hydro segment due to increased planned maintenance outages compared to 2022; and
•Relatively mild weather in the fourth quarter of 2023, compared to the same period in 2022 when markets experienced tighter supply due to the extreme cold weather in Alberta.
| | | | | | | | |
| M8 | TransAlta Corporation | 2024 Integrated Report |
Market Pricing
| | | | | | | | | | | |
| Year ended Dec. 31, 2024 | 2024 | 2023 | 2022 |
| Alberta spot power price ($/MWh) | 63 | | 134 | | 162 | |
| Mid-Columbia spot power price (US$/MWh) | 56 | | 76 | | 82 | |
| Ontario spot power price ($/MWh) | 32 | | 28 | | 47 | |
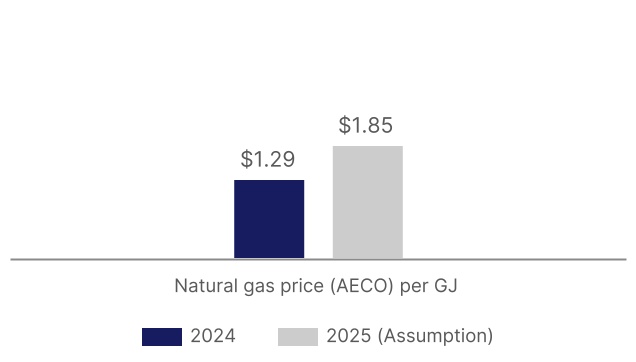
| Natural gas price (AECO) per GJ ($) | 1.29 | | 2.54 | | 5.08 | |
For the year ended Dec. 31, 2024, spot electricity prices in Alberta were 53 per cent lower compared to 2023, driven by lower natural gas prices and the anticipated increased supply from new renewable and combined-cycle gas facilities.
Spot electricity prices in the Pacific Northwest were 26 per cent lower compared to 2023 due to lower natural gas prices.
AECO natural gas prices for the year ended Dec. 31, 2024, were 49 per cent lower compared to 2023, mainly due to higher gas production and higher storage levels in Alberta and throughout North America.
For the year ended Dec. 31, 2023, spot electricity prices in Alberta and the Pacific Northwest were lower compared to
2022. Lower prices in both regions resulted from lower natural gas prices and overall weaker weather-driven demand in the second half of 2023, with notably lower prices due to above normal weather patterns in the fourth quarter of 2023.
For Alberta specifically, warm weather in the fourth quarter of 2023 resulted in a strong wind resource pattern, which, combined with new installed capacity, added supply in the market compared to the prior year.
AECO natural gas prices for the year ended Dec. 31, 2023, were lower compared to 2022, mainly due to increased production and storage levels in Alberta and North America.
Financial Performance Review of Consolidated Information
| | | | | | | | | | | | | | | | |
| | | |
| Year ended Dec. 31 | | | 2024 | | 2023 | 2022 |
| Revenues | | | 2,845 | | | 3,355 | | 2,976 | |
| Fuel and purchased power | | | 939 | | | 1,060 | | 1,263 | |
| Carbon compliance | | | 112 | | | 112 | | 78 | |
| Operations, maintenance and administration | | | 655 | | | 539 | | 521 | |
| Depreciation and amortization | | | 531 | | | 621 | | 599 | |
| Asset impairment charges (reversals) | | | 46 | | | (48) | | 9 | |
| Interest income | | | 30 | | | 59 | | 24 | |
| Interest expense | | | 324 | | | 281 | | 286 | |
| Earnings before income taxes | | | 319 | | | 880 | | 353 | |
| Income tax expense | | | 80 | | | 84 | | 192 | |
| Net earnings attributable to common shareholders | | | 177 | | | 644 | | 4 | |
| Net earnings attributable to non-controlling interests | | | 10 | | | 101 | | 111 | |
2024 versus 2023
Revenues totalling $2,845 million, decreased by $510 million, or 15 per cent, compared to 2023, primarily due to:
•Lower merchant spot and hedged power prices in the Alberta market;
•Lower revenue from derivatives and other trading activities in the Wind and Solar segment driven by higher unrealized mark-to-market losses on the long-term wind energy sales related to the Oklahoma facilities, primarily
due to strengthening forecasted wind capture prices reflected in the year; and
•Lower revenue at Centralia due to higher economic dispatch driven by lower market prices; partially offset by
•Higher revenue from derivatives and other trading activities in the Gas segment driven by higher volume of favourable hedging positions settled, which generated positive contributions over settled spot prices in Alberta;
| | | | | | | | |
| TransAlta Corporation | 2024 Integrated Report | M9 |
•Higher environmental and tax attributes revenues from the Hydro segment and the sale of production tax credits from the Oklahoma wind facilities to taxable U.S. counterparties;
•Commercial operation of the White Rock and Horizon Hill wind facilities, the Northern Goldfields solar facilities, the Mount Keith 132kV expansion and return to service of the Kent Hills wind facilities; and
•Higher revenue in the Gas segment with the acquisition of Heartland.
Fuel and purchased power costs totalling $939 million, decreased by $121 million, or 11 per cent, compared to 2023, primarily due to:
•Lower purchased power costs driven by lower Mid-Columbia prices on repurchases of power;
•Lower fuel consumption due to higher dispatch optimization in the Gas segment in Alberta and higher economic dispatch in the Energy Transition segment; and
•Lower natural gas prices.
Carbon compliance costs totalling $112 million, were consistent with 2023, primarily due to:
•Utilization of internally generated and externally purchased emission credits to settle a portion of our 2023 GHG obligation; offset by
•An increase in the carbon price from $65 per tonne in 2023 to $80 per tonne in 2024; and
•Higher production in the Gas segment.
OM&A expenses totalling $655 million, increased by $116 million, or 22 per cent, compared to 2023, primarily due to:
•Penalties assessed by the Alberta Market Surveillance Administrator for self-reported contraventions pertaining to hydro ancillary services provided during 2021 and 2022;
•Higher spend to support strategic and growth initiatives;
•The addition of the White Rock and Horizon Hill wind facilities and the return to service of the Kent Hills wind facilities;
•The Heartland acquisition-related transaction and restructuring costs, mainly comprising severance, legal and consulting fees; and
•Higher spending related to the planning and design of an upgrade to our enterprise resource planning (ERP) system.
Depreciation and amortization totalling $531 million, decreased by $90 million, or 14 per cent, compared to 2023, primarily due to:
•Revisions to useful lives of certain facilities in prior and current periods; partially offset by
•Commercial operation of the White Rock and Horizon Hill wind facilities and return to service of the Kent Hills wind facilities.
Asset impairment charges totalling $46 million, increased by $94 million, compared to asset impairment recoveries in 2023, primarily due to:
•An increase in decommissioning and restoration provisions on retired assets driven by a decrease in discount rates and revisions in estimated decommissioning costs; and
•Impairment charges related to development projects that are no longer proceeding.
Interest income totalling $30 million, decreased by $29 million, or 49 per cent, compared to 2023, primarily due to lower cash balances and lower interest rates.
Interest expense totalling $324 million, increased by 43 million, or 15 per cent, compared to 2023, primary due to lower capitalized interest resulting from lower construction activity in 2024 compared to 2023.
Earnings before income taxes totalling $319 million, decreased by $561 million, or 64 per cent, compared to 2023, due to the above noted items. Refer to the Segment Financial Performance and Operating Results section for additional information.
Income tax expense totalling $80 million, decreased by $4 million, or five per cent, compared to 2023, due to:
•Lower earnings before income taxes due to the above noted items; partially offset by
•A recovery related to the reversal of previously derecognized Canadian deferred tax assets.
Net earnings attributable to non-controlling interests totalling $10 million, decreased by $91 million, or 90 per cent, compared to 2023, primarily due to lower net earnings for TransAlta Cogeneration, LP (TA Cogen) resulting from lower merchant pricing in the Alberta market and the acquisition of TransAlta Renewables Inc. (TransAlta Renewables) on Oct. 5, 2023.
| | | | | | | | |
| M10 | TransAlta Corporation | 2024 Integrated Report |
2023 versus 2022
Revenues totalling $3,355 million, increased by $379 million, or 13 per cent, compared to 2022, primarily due to:
•Higher realized and unrealized gains from hedging and derivative positions across the segments; partially offset by
•Lower revenue from merchant sales due to lower spot power prices and production in Alberta.
Fuel and purchased power costs totalling $1,060 million, decreased by $203 million, or 16 per cent, compared to 2022, primarily due to:
•Lower natural gas commodity pricing; partially offset by
•Higher fuel usage in both the Gas and Energy Transition segments.
Carbon compliance costs totalling $112 million, increased by $34 million, or 44 per cent, compared to 2022, primarily due to:
•An increase in the carbon price per tonne from $50 per tonne in 2022 to $65 per tonne in 2023;
•Higher production in the Gas segment; and
•No utilization of emission credits to settle GHG obligations as was done in the prior year.
OM&A expenses totalling $539 million, increased by $18 million, or three per cent, compared to 2022, primarily due to:
•Higher spending on strategic and growth initiatives;
•Higher costs associated with the relocation of the Company's head office; and
•Increased costs due to inflationary pressures.
Depreciation and amortization totalling $621 million, increased by $22 million, or four per cent, compared to 2022, primarily due to:
•Revisions to useful lives of certain facilities; and
•Commercial operation of new facilities.
Asset impairment reversals totalling $48 million, increased by $57 million, compared to an asset impairment charge in 2022, primarily due to:
•decommissioning and restoration provisions for retired assets being favourably impacted by a change in timing of expected cash outflows, partially offset by lower discount rates, resulting in a net impairment reversal of $34 million; and
•A Hydro segment impairment reversal of $10 million due to a contract extension and favourable changes in power price assumptions.
Interest income totalling $59 million, increased by $35 million, or 146 per cent, compared to 2022, primarily due to higher cash balances and favourable interest rates.
Earnings before income taxes totalling $880 million, increased by $527 million, or 149 per cent, compared to 2022, due to the above noted items.
Income tax expense totalling $84 million, decreased by $108 million, or 56 per cent, compared to 2022, due to a recovery relating to the reversal of previously derecognized Canadian deferred tax assets and lower U.S. non-deductible expenses relating to U.S. operations, partially offset by higher earnings from Canadian operations.
Net earnings attributable to non-controlling interests totalling $101 million, decreased by $10 million, or nine per cent, compared to 2022, primarily due to lower net earnings for TA Cogen.
| | | | | | | | |
| TransAlta Corporation | 2024 Integrated Report | M11 |
Adjusted EBITDA — 2024 versus 2023
For the year ended Dec. 31, 2024, the Company's adjusted EBITDA was $1,253 million as compared to $1,632 million in 2023, a decrease of $379 million, or 23 per cent. The major factors impacting adjusted EBITDA are summarized in the following table:
| | | | | |
| Year ended Dec. 31 |
| Adjusted EBITDA for the year ended Dec. 31, 2023 | 1,632 | |
Hydro: Lower primarily due to lower spot power prices and ancillary services prices in the Alberta market, partially offset by realized premiums above the spot power prices, higher environmental and tax attributes revenues due to higher sales of emission credits to third parties and intercompany sales to the Gas segment and higher ancillary service volumes due to increased demand by the Alberta Electric System Operator (AESO). | (143) | |
Wind and Solar: Higher primarily due to new sales of production tax credits, the return to service of the Kent Hills wind facilities, the commercial operation of the White Rock and Horizon Hill wind facilities, partially offset by lower realized power pricing in the Alberta market and higher OM&A due to the addition of new wind facilities. | 59 | |
Gas: Lower primarily due to lower power prices in the Alberta market and resulting increase in economic dispatch, an increase in the price of carbon, higher carbon costs and fuel usage related to production and lower capacity payments, partially offset by a higher volume of favourable hedging positions settled, the utilization of emission credits to settle a portion of our 2023 GHG obligation and lower natural gas prices. | (266) | |
Energy Transition: Lower primarily due to increased economic dispatch driven by lower market prices which negatively impacted merchant production, partially offset by lower fuel and purchased power costs. | (31) | |
Energy Marketing: Higher primarily due to favourable market volatility and the timing of realized settled trades during the current year in comparison to the prior year and lower OM&A. | 22 | |
Corporate: Lower primarily due to higher spend to support strategic and growth initiatives. | (20) | |
Adjusted EBITDA(1) for the year ended Dec. 31, 2024 | 1,253 | |
(1)Adjusted EBITDA is not defined and has no standardized meaning under IFRS and may not be comparable to similar measures presented by other issuers. Refer to the Additional IFRS Measures and Non-IFRS Measures section of this MD&A. For a comparison of 2024 and 2023 earnings before income tax, the most directly comparable IFRS measure, see pages M67-M68
| | | | | | | | |
| M12 | TransAlta Corporation | 2024 Integrated Report |
Adjusted EBITDA — 2023 versus 2022
For the year ended Dec. 31, 2023, the Company's adjusted EBITDA was $1,632 million compared to $1,656 million in 2022, a decrease of $24 million. The major factors impacting adjusted EBITDA are summarized in the following table:
| | | | | |
| Year ended Dec. 31 |
Adjusted EBITDA for the year ended Dec. 31, 2022(1) | 1,656 | |
Hydro: Lower primarily due to lower ancillary services volumes, lower spot power and ancillary services prices in the Alberta market, lower production due to lower availability and lower than average water resources, partially offset by realized gains from hedging strategy and sales of environmental attributes. | (90) | |
Wind and Solar: Lower primarily due to lower environmental attribute revenues, lower realized power prices in Alberta, lower wind resource across the operating fleet, lower liquidated damages recognized at the Windrise wind facility and higher OM&A, partially offset by the commercial operation of the Garden Plain wind facility, the Northern Goldfields solar facilities and the partial return to service of the Kent Hills wind facilities. | (54) | |
Gas: Higher primarily due to higher power price hedges partially offsetting the impacts of lower Alberta spot prices, lower natural gas commodity costs and higher production, partially offset by lower thermal revenues, higher carbon prices and higher carbon costs and fuel usage related to production. | 172 | |
Energy Transition: Higher primarily due to higher production from higher availability and merchant sales volumes, partially offset by lower market prices compared to the prior year. | 36 | |
Energy Marketing: Lower primarily due to lower realized settled trades during the year on market positions in comparison to prior year and higher OM&A. | (74) | |
Corporate: Lower primarily due to increased spending to support strategic and growth initiatives and higher costs associated with the relocation of the Company's head office. | (14) | |
Adjusted EBITDA(2) for the year ended Dec. 31, 2023 | 1,632 | |
(1)During 2024 our adjusted EBITDA composition was amended to exclude the impact of Brazeau penalties and related provisions. Therefore, the Company has applied this composition to all previously reported periods. Refer to the Additional IFRS Measures and Non-IFRS Measures section of this MD&A.
(2)Adjusted EBITDA is not defined and has no standardized meaning under IFRS and may not be comparable to similar measures presented by other issuers. Refer to the Additional IFRS Measures and Non-IFRS Measures section of this MD&A. For a comparison of 2023 and 2022 earnings before income tax, the most directly comparable IFRS measure, see pages M68-M69.
| | | | | | | | |
| TransAlta Corporation | 2024 Integrated Report | M13 |
Free Cash Flow — 2024 versus 2023
For the year ended Dec. 31, 2024, the Company's FCF decreased by $321 million, or 36 per cent, compared to 2023, but was within the upper range of our expected full-year financial guidance. The major factors impacting FCF are summarized in the following table:
| | | | | |
| Year ended Dec. 31 |
| FCF for the year ended Dec. 31, 2023 | 890 | |
| Lower Adjusted EBITDA due to the items noted above. | (379) | |
| Higher current income tax expense due to the full utilization of Canadian non-capital loss carryforwards in 2023, partially offset by lower earnings before income taxes in 2024 compared to the prior year. | (93) | |
Higher net interest expense(1) due to lower capitalized interest resulting from lower construction activity in 2024 compared to 2023 and lower interest income due to lower cash balances and interest rates in 2024 compared to prior year. | (67) | |
| Lower distributions paid to subsidiaries' non-controlling interests relating to lower TA Cogen net earnings resulting from lower merchant pricing in the Alberta market and the cessation of distributions to TransAlta Renewables non-controlling interest. On Oct. 5, 2023, the Company acquired all of the outstanding common shares of TransAlta Renewables not already owned, directly or indirectly. | 183 |
| Higher provisions accrued in the current year compared to the prior year resulting in higher FCF. | 11 | |
| Lower sustaining capital expenditures due to the receipt of a lease incentive related to the Company's head office, and lower planned major maintenance at our Alberta and Western Australian gas facilities, partially offset by higher major maintenance at our Alberta Hydro facilities. | 32 |
| |
| |
| |
Other non-cash items(2) | 14 |
Other(3) | (22) | |
FCF(4) for the year ended Dec. 31, 2024 | 569 | |
(1)Net interest expense includes interest expense less interest income and excludes non-cash items like financing amortization and accretion.
(2)Other non-cash items consists of Alberta market pool incentives, carbon obligation and contract liabilities. Refer to the Reconciliation of Cash Flow from Operations to FFO and FCF section tables in this MD&A for more details.
(3)Other consists of higher realized foreign exchange loss, higher decommissioning and restoration costs settled, higher dividends paid on preferred shares, lower principal payments on lease liabilities and lower productivity capital. Refer to the Reconciliation of Cash Flow from Operations to FFO and FCF section tables in this MD&A for more details.
(4)FCF is not defined and has no standardized meaning under IFRS and may not be comparable to similar measures presented by other issuers. Refer to the Additional IFRS Measures and Non-IFRS Measures section of this MD&A. For a comparison of 2024 and 2023 cash flow from operations, the most directly comparable IFRS measure, see page M56.
| | | | | | | | |
| M14 | TransAlta Corporation | 2024 Integrated Report |
Free Cash Flow — 2023 versus 2022
For the year ended Dec. 31, 2023, the Company's FCF decreased by $71 million, or 7 per cent, compared to 2022, and was in line with our revised expected full-year financial guidance. The major factors impacting FCF are summarized in the following table:
| | | | | |
| Year ended Dec. 31 |
| FCF for the year ended Dec. 31, 2022 | 961 | |
| Lower Adjusted EBITDA due to the items noted above. | (24) | |
| Higher interest income due to higher cash balances and favourable interest rates. | 35 | |
| Lower current income tax expense due to previously restricted non-capital loss carryforwards that were utilized to offset taxable income. | 15 | |
| Higher sustaining capital expenditures due to higher planned major maintenance costs for the Hydro and Gas segments, partially offset by lower planned major maintenance in the Wind and Solar and Energy Transition segments. | (32) | |
| |
| Higher distributions paid to subsidiaries' non-controlling interests related to the timing of distributions paid to TA Cogen, partially offset by lower distributions paid to TransAlta Renewables. | (36) | |
| Lower provisions being accrued compared to the prior year, with no notable settlements being recorded in either year. | (26) | |
Other non-cash items(1) | 11 | |
Other(2) | (14) | |
FCF(3) for the year ended Dec. 31, 2023 | 890 | |
(1)Other non-cash items consists of Alberta market pool incentives, carbon obligation, contract liabilities, the SunHills royalty onerous contract and Brazeau penalties. Refer to the Reconciliation of Cash Flow from Operations to FFO and FCF section tables in this MD&A for more details.
(2)Other consists of higher realized foreign exchange loss, higher decommissioning and restoration costs settled, higher dividends paid on preferred shares and higher principal payments on lease liabilities. Refer to the Reconciliation of Cash Flow from Operations to FFO and FCF section tables in this MD&A for more details.
(3)FCF is not defined and has no standardized meaning under IFRS and may not be comparable to similar measures presented by other issuers. Refer to the Additional IFRS Measures and Non-IFRS Measures section of this MD&A. For a comparison of 2023 and 2022 cash flow from operations, the most directly comparable IFRS measure, see page M57.
| | | | | | | | |
| TransAlta Corporation | 2024 Integrated Report | M15 |
Capital Expenditures
Sustaining Capital Expenditures
We are in a long-cycle business that requires significant capital expenditures. Our goal is to undertake sustaining capital expenditures that ensure our facilities operate reliably and safely.
The Company's sustaining capital expenditures by segment are summarized in the table below:
| | | | | | | | | | | |
| Year ended Dec. 31 | 2024 | 2023 | 2022 |
| Hydro | 56 | | 41 | | 35 | |
| Wind and Solar | 20 | | 15 | | 18 | |
| Gas | 52 | | 76 | | 41 | |
| Energy Transition | 12 | | 15 | | 19 | |
| | | |
| Corporate | 2 | | 27 | | 29 | |
| Sustaining capital expenditures | 142 | | 174 | | 142 | |
Total sustaining capital expenditures in 2024 were $32 million lower compared to 2023, primarily due to:
•The receipt of a lease incentive related to the Company's head office, included in the Corporate segment; and
•Lower planned major maintenance at our Alberta and Western Australian gas facilities; partially offset by
•Higher major maintenance at our Alberta hydro assets; and
•Higher major maintenance at our Wind and Solar facilities.
Total sustaining capital expenditures in 2023 were $32 million higher compared to 2022, primarily due to:
•Higher planned major maintenance at our Alberta Hydro assets;
•Higher planned major maintenance at our Sarnia, Sundance Unit 6 and Keephills Units 2 and 3 facilities in the Gas segments; partially offset by
•Lower planned major maintenance in the Wind and Solar segment primarily due to a reduction in major component replacements; and
•Lower planned outage work performed in the Energy Transition segment.
| | | | | | | | |
| M16 | TransAlta Corporation | 2024 Integrated Report |
Growth and Development Expenditures
Growth and development expenditures are impacted by the timing and construction of projects within the development pipeline. The following table provides our growth and development spending by segment:
| | | | | | | | | | | |
| Year ended Dec. 31 | 2024 | 2023 | 2022 |
| Hydro | 9 | | 6 | | 2 | |
| Wind and Solar | 64 | | 673 | | 711 | |
| Gas | 59 | | 60 | | 61 | |
| | | |
| | | |
| Growth and development expenditures | 132 | | 739 | | 774 | |
Growth and development expenditures were lower in 2024 compared to 2023 and 2022, as many of the development projects achieved commercial operation in the first half of 2024. The White Rock East and Horizon Hill wind facilities were commissioned in the second quarter of 2024. The White Rock West wind facility and Mount Keith 132kV expansion were commissioned in the first quarter of 2024.
Refer to the Strategic Priorities section of this MD&A for more details.
In 2023 and 2022, the growth and development expenditures incurred primarily related to:
•The Garden Plain wind facility, which achieved commercial operation in August 2023;
•The Northern Goldfields solar facilities, which achieved commercial operation in November 2023;
•The White Rock and the Horizon Hill wind projects; and
•The Mount Keith 132kV expansion.
Significant and Subsequent Events
Declared Increase in Common Share Dividend
The Company’s Board of Directors has approved a $0.02 annualized increase to the common share dividend, or 8 per cent increase, and declared a dividend of $0.065 per common share to be payable on July 1, 2025 to shareholders of record at the close of business on June 1, 2025. The quarterly dividend of $0.065 per common share represents an annualized dividend of $0.26 per common share.
TransAlta Acquires Heartland Generation from Energy Capital Partners
On Dec. 4, 2024, the Company closed the acquisition of Heartland Generation Ltd. and certain affiliates (collectively, Heartland) for a purchase price of $542 million from an affiliate of Energy Capital Partners (ECP), the parent of Heartland (the Transaction). To meet the requirements of the federal Competition Bureau, the Company entered into a consent agreement with the Commissioner of Competition pursuant to which TransAlta agreed to divest Heartland's Poplar Hill and Rainbow Lake assets (the Planned Divestitures) following closing of the Transaction. In consideration of the Planned Divestitures, TransAlta and ECP agreed to a reduction of $80 million from the original purchase price for the Transaction. ECP will be entitled to receive the proceeds from the sale of Poplar Hill and Rainbow Lake, net of certain adjustments
following completion of the Planned Divestitures. TransAlta also received a further $95 million at closing of the Transaction to reflect the economic benefit of the Heartland business arising from Oct. 31, 2023 to the closing date of the Transaction, pursuant to the terms of the share purchase agreement. The net cash payment for the Transaction, before working capital adjustments, totalled $215 million, and was funded through a combination of cash on hand and draws on TransAlta's credit facilities.
Excluding the Planned Divestitures, the Transaction adds 1,747 MW (net interest) of complementary capacity from nine facilities, including contracted cogeneration and peaking generation, legacy gas-fired thermal generation, and transmission capacity, all of which will be critical to support reliability in the Alberta electricity market.
Mothballing of Sundance Unit 6
On Nov. 4, 2024, the Company provided notice to the AESO that Sundance Unit 6 will be mothballed on April 1, 2025, for a period of up to two years depending on market conditions. TransAlta maintains the flexibility to return the mothballed unit to service when market fundamentals improve or opportunities to contract are secured. The unit remains available and fully operational for the first quarter of 2025.
| | | | | | | | |
| TransAlta Corporation | 2024 Integrated Report | M17 |
Appointment of New Chief Financial Officer (CFO)
The Board appointed Joel Hunter as Executive Vice President, Finance and CFO, effective July 1, 2024.
Production Tax Credit (PTC) Sale Agreements
On Feb. 22, 2024, the Company entered into 10-year transfer agreements with an AA- rated customer for the sale of approximately 80 per cent of the expected PTCs to be generated from the White Rock and the Horizon Hill wind facilities.
On June 21, 2024, the Company entered into an additional 10-year transfer agreement with an A+ rated customer for the sale of the remaining 20 per cent of the expected PTCs.
The expected average annual EBITDA from the two agreements is approximately $78 million (US$57 million).
Normal Course Issuer Bid (NCIB)
TransAlta remains committed to enhancing shareholder returns through appropriate capital allocation such as share buybacks and its quarterly dividend. In the first quarter of 2024, the Company announced an enhanced common share repurchase program for 2024, allocating up to $150 million, and targeting up to 42 per cent of 2024 FCF guidance, to be returned to shareholders in the form of share repurchases and dividends.
On May 27, 2024, the Company announced that it had received approval from the Toronto Stock Exchange to purchase up to 14 million common shares during the 12-month period that commenced May 31, 2024, and terminates May 31, 2025. Any common shares purchased under the NCIB will be cancelled.
For the year ended Dec. 31, 2024, the Company purchased and cancelled a total of 13,467,400 common shares, at an average price of $10.59 per common share, for a total cost of $143 million, including taxes.
Horizon Hill Wind Facility Achieves Commercial Operation
On May 21, 2024, the 202 MW Horizon Hill wind facility achieved commercial operation. The facility is located in Logan County, Oklahoma and is fully contracted to Meta Platforms Inc. for the offtake of 100 per cent of the generation.
White Rock Wind Facilities Achieve Commercial Operation
On Jan. 1, 2024, the 100 MW White Rock West wind facility achieved commercial operation. On April 22, 2024, the 202 MW White Rock East wind facility also completed commissioning. The facilities are located in Caddo County, Oklahoma and are contracted under two long-term power purchase agreements (PPAs) with Amazon Energy LLC for the offtake of 100 per cent of the generation.
Mount Keith 132kV Expansion Complete
The Mount Keith 132kV expansion project was completed during the first quarter of 2024. The expansion was developed under the existing PPA with BHP Nickel West (BHP), which extends until Dec. 31, 2038. The expansion will facilitate the connection of additional generating capacity to the transmission network which supports BHP's operations.
| | | | | | | | |
| M18 | TransAlta Corporation | 2024 Integrated Report |
Segmented Financial Performance and Operating Results
Segmented information is prepared on the same basis that the Company manages its business, evaluates financial results and makes key operating decisions. The following table reflects the summary financial information on a consolidated basis for the year ended Dec. 31:
| | | | | | | | | | | |
| Adjusted EBITDA(1) |
| Year ended Dec. 31 | 2024 | 2023 | 2022(2) |
| Hydro | 316 | | 459 | | 549 | |
| Wind and Solar | 316 | | 257 | | 311 | |
| Gas | 535 | | 801 | | 629 | |
| Energy Transition | 91 | | 122 | | 86 | |
| Energy Marketing | 131 | | 109 | | 183 | |
| Corporate | (136) | | (116) | | (102) | |
Total adjusted EBITDA(1) | 1,253 | | 1,632 | | 1,656 | |
| Earnings before income taxes | 319 | | 880 | | 353 | |
(1)This item is not defined and has no standardized meaning under IFRS and may not be comparable to similar measures presented by other issuers. Refer to the Additional IFRS Measures and Non-IFRS Measures section of this MD&A.
(2)During 2024 our adjusted EBITDA composition was amended to exclude the impact of Brazeau penalties and related provisions. Therefore, the Company has applied this composition to all previously reported periods. Refer to the Additional IFRS Measures and Non-IFRS Measures section of this MD&A.
2024 versus 2023
Earnings before income taxes for the year ended Dec. 31, 2024, decreased by $561 million, or 64 per cent, compared to 2023, primarily due to:
•The factors causing lower adjusted EBITDA above;
•Higher asset impairment charges related to an increase in the decommissioning provision on retired assets, driven by a decrease in discount rates and revisions in estimated decommissioning costs, and higher impairment charges related to development projects that are no longer proceeding;
•Lower unrealized mark-to-market gains and lower realized gains on closed exchange positions in the Energy Marketing segment mainly driven by market volatility across North American power and natural gas markets;
•Higher unrealized mark-to-market losses recorded in the Wind and Solar segment primarily related to the long-term wind energy sales related to the Oklahoma facilities;
•Higher interest expense due to lower capitalized interest during 2024 resulting from lower construction activity in 2024 compared to 2023;
•Lower capacity payments in 2024 for Southern Cross Energy in Western Australia due to the scheduled conclusion on Dec. 31, 2023, of the demand capacity charge under the customer contract, partially offset by the commencement in March 2024 of capacity payments
for the Mount Keith 132kV expansion;
•Heartland acquisition-related transaction and restructuring costs;
•Lower interest income due to lower cash balances and lower interest rates during 2024;
•Higher spending relating to planning and design work on a planned upgrade to our ERP system; and
•Penalties assessed by the Alberta Market Surveillance Administrator for self-reported contraventions pertaining to Hydro ancillary services provided during 2021 and 2022; partially offset by
•Lower depreciation and amortization compared to 2023 related to revisions of useful lives of certain facilities in prior and current periods, partially offset by the commercial operation of new facilities during the year and the return to service of the Kent Hills wind facilities;
•Higher unrealized mark-to-market gains recorded in the Energy Transition segment primarily related to the favourable changes in forward prices; and
•Higher net other operating income mainly due to Sundance A decommissioning cost reimbursement.
2023 versus 2022
Earnings before income taxes for the year ended Dec. 31, 2023, increased by $527 million, or 149 per cent, compared to 2022, primarily due to:
| | | | | | | | |
| TransAlta Corporation | 2024 Integrated Report | M19 |
•Higher unrealized mark-to-market gains in in the Gas segment primarily related to higher power price hedges;
•Higher unrealized mark-to-market gains in the Wind and Solar segment primarily related to Garden Plain and Big Level, partially offset by unrealized mark-to-market losses related to the Oklahoma facilities;
•Higher realized mark-to-market losses on closed exchange positions in the Energy Marketing segment mainly driven by market volatility across the North American power and natural gas markets;
•Higher asset impairment reversals for the Hydro and Wind and Solar segments due to favourable changes in power price assumptions and contract extensions, partially offset by a change in decommissioning and
restoration provisions for retired assets due to a change in the timing of expected cash outflows and the revisions in discount rates;
•Higher interest income due to higher cash balances and favourable interest rates; partially offset by
•Lower adjusted EBITDA (as described above);
•Lower gain on sale of assets in 2023. In 2022 the Company closed the sale of two hydro facilities and sold equipment related to its Energy Transition segment; and
•Higher depreciation and amortization due to revisions to useful lives of certain facilities and commercial operation of new facilities.
| | | | | | | | |
| M20 | TransAlta Corporation | 2024 Integrated Report |
Hydro
| | | | | | | | | | | | | | | | | | | | | | | | | |
| | | | | | | |
| Year ended Dec. 31 | | | 2024 | 2023 | Change | 2022(7) | Change |
| Gross installed capacity (MW) | | | 922 | | 922 | | — | | — | % | 922 | — | | — | % |
| LTA generation (GWh) | | | 2,015 | | 2,015 | | — | | — | % | 2,015 | | — | | — | % |
| Availability (%) | | | 90.7 | | 90.8 | | (0.1) | | — | % | 96.7 | | (5.9) | | (6) | % |
| | | | | | | | | |
| Production | | | | | | | | | |
| Contract production (GWh) | | | 281 | | 277 | | 4 | | 1 | % | 323 | | (46) | | (14) | % |
| Merchant production (GWh) | | | 1,442 | | 1,492 | | (50) | | (3) | % | 1,665 | | (173) | | (10) | % |
| Total energy production (GWh) | | | 1,723 | | 1,769 | | (46) | | (3) | % | 1,988 | | (219) | | (11) | % |
Ancillary service volumes (GWh)(1) | | | 2,951 | | 2,582 | | 369 | | 14 | % | 3,124 | | (542) | | (17) | % |
| | | | | | | | | |
Alberta Hydro Assets revenues(2)(3) | | | 144 | | 291 | | (147) | | (51) | % | 328 | | (37) | | (11) | % |
Other Hydro Assets and other revenues(2)(4) | | | 49 | | 51 | | (2) | | (4) | % | 42 | | 9 | | 21 | % |
| Alberta Hydro ancillary services revenues | | | 136 | | 173 | | (37) | | (21) | % | 256 | | (83) | | (32) | % |
| | | | | | | | | |
| Environmental and tax attributes revenues | | | 61 | | 14 | | 47 | | 336 | % | 1 | | 13 | | 1300 | % |
| | | | | | | | | |
| | | | | | | | | |
Adjusted revenues(5) | | | 390 | | 529 | | (139) | | (26) | % | 627 | | (98) | | (16) | % |
| Fuel and purchased power | | | 16 | | 19 | | (3) | | (16) | % | 22 | | (3) | | (14) | % |
Adjusted gross margin(6) | | | 374 | | 510 | | (136) | | (27) | % | 605 | | (95) | | (16) | % |
Adjusted OM&A(5) | | | 55 | | 48 | | 7 | | 15 | % | 53 | | (5) | | (9) | % |
| Taxes, other than income taxes | | | 3 | | 3 | | — | | — | % | 3 | | — | | — | % |
Adjusted EBITDA(6) | | | 316 | | 459 | | (143) | | (31) | % | 549 | | (90) | | (16) | % |
| Supplemental Information: | | | | | | | | | |
| Gross revenues per MWh | | | | | | | | | |
Alberta Hydro Assets energy ($/MWh)(2)(3) | | | 100 | | 195 | | (95) | | (49) | % | 197 | (2) | | (1) | % |
Alberta Hydro Assets ancillary ($/MWh)(1) | | | 46 | | 67 | | (21) | | (31) | % | 76 | (9) | | (12) | % |
| | | | | | | | | |
| | | | | | | | | |
(1)Ancillary services as described in the AESO Consolidated Authoritative Document Glossary.
(2)Alberta Hydro Assets include 13 hydro facilities on the Bow and North Saskatchewan river systems. Other Hydro Assets include our hydro facilities in British Columbia, Ontario and Alberta (other than the Alberta Hydro Assets).
(3)Alberta Hydro Assets revenues include revenues from swaps and forward hedges.
(4)Other revenues includes revenues from our transmission business and other contractual arrangements, including the flood mitigation agreement with the Government of Alberta and black start services.
(5)For details of the adjustments to revenues and OM&A included in adjusted EBITDA refer to the Additional IFRS and Non-IFRS Measures section of this MD&A.
(6)Adjusted EBITDA and adjusted gross margin are not defined and have no standardized meaning under IFRS and may not be comparable to similar measures presented by other issuers. Refer to the Additional IFRS and Non-IFRS Measures section of this MD&A.
(7)During 2024 our adjusted EBITDA composition was amended to exclude the impact of Brazeau penalties and related provisions. Therefore, the Company has applied this composition to all previously reported periods. Refer to the Additional IFRS Measures and Non-IFRS Measures section of this MD&A.
| | | | | | | | |
| TransAlta Corporation | 2024 Integrated Report | M21 |
2024 versus 2023
Adjusted revenues for the year ended Dec. 31, 2024, decreased compared to 2023, primarily due to:
•Lower spot power prices and ancillary services prices in the Alberta market; partially offset by
•Realized premiums above spot power prices and positive contributions from hedging;
•Higher environmental and tax attributes revenues due to increased sales of emission credits to third parties and intercompany sales to the Gas segment; and
•Higher ancillary services volumes due to increased demand by the AESO.
Adjusted EBITDA for the year ended Dec. 31, 2024, decreased compared to 2023, primarily due to lower adjusted revenues as explained by the factors above.
For further discussion on the Alberta market conditions and pricing, refer to the Alberta Electricity Portfolio section of this MD&A.
2023 versus 2022
Adjusted revenues for the year ended Dec. 31, 2023, decreased compared to 2022, primarily due to:
•Lower ancillary services volumes due to the AESO procuring lower volumes given its decision to reduce the cumulative volume of imports into Alberta;
•Lower spot power prices and ancillary services prices in the Alberta market; and
•Lower production due to lower availability from planned outages at our Alberta Hydro Assets and lower than average water resources; partially offset by
•Realized gains from our hedging strategy for the Alberta Hydro Assets; and
•Sales of environmental attributes driven by an increase in emission credit sales.
Adjusted EBITDA for the year ended Dec. 31, 2023, decreased compared to 2022, primarily due to lower adjusted revenues as explained by the factors above.
| | | | | | | | |
| M22 | TransAlta Corporation | 2024 Integrated Report |
Wind and Solar | | | | | | | | | | | | | | | | | | | | | | | | | | | | | | | |
| | | | | | | | |
| Year ended Dec. 31 | | | 2024 | | 2023 | | Change | 2022 | Change |
Gross installed capacity (MW)(1) | | | 2,587 | | | 2,084 | | 503 | | 24 | % | 1,906 | | 178 | | 9 | % |
| LTA generation (GWh) | | | 6,876 | | | 5,127 | | 1,749 | | 34 | % | 4,950 | | 177 | | 4 | % |
| Availability (%) | | | 93.4 | | | 86.9 | | 6.5 | | 7 | % | 83.8 | | 3.1 | | 4 | % |
| | | | | | | | | | | |
| Production | | | | | | | | | | | |
| Contract production (GWh) | | | 4,720 | | | 3,095 | | | 1,625 | | 53 | % | 3,182 | | (87) | | (3) | % |
| Merchant production (GWh) | | | 1,229 | | | 1,148 | | | 81 | | 7 | % | 1,066 | | 82 | | 8 | % |
| Total production (GWh) | | | 5,949 | | | 4,243 | | | 1,706 | | 40 | % | 4,248 | | (5) | | — | % |
| | | | | | | | | | | |
| Revenues | | | 372 | | | 347 | | | 25 | | 7 | % | 357 | | (10) | | (3) | % |
| | | | | | | | | | | |
| Environmental and tax attributes revenues | | | 77 | | | 26 | | | 51 | | 196 | % | 50 | | (24) | | (48) | % |
| | | | | | | | | | | |
Adjusted revenues(2) | | | 449 | | | 373 | | | 76 | | 20 | % | 407 | | (34) | | (8) | % |
| Fuel and purchased power | | | 30 | | | 30 | | | — | | — | % | 31 | | (1) | | (3) | % |
| Carbon compliance | | | — | | | — | | | — | | — | % | 1 | | (1) | | (100) | % |
Adjusted gross margin(3) | | | 419 | | | 343 | | | 76 | | 22 | % | 375 | | (32) | | (9) | % |
Adjusted OM&A(2) | | | 97 | | | 80 | | | 17 | | 21 | % | 68 | | 12 | | 18 | % |
| Taxes, other than income taxes | | | 16 | | | 12 | | | 4 | | 33 | % | 12 | | — | | — | % |
| Net other operating income | | | (10) | | | (6) | | | (4) | | 67 | % | (16) | | 10 | | (63) | % |
Adjusted EBITDA(3) | | | 316 | | | 257 | | | 59 | | 23 | % | 311 | | (54) | | (17) | % |
| | | | | | | | | | | |
| | | | | | | | | | | |
| | | | | | | | | | | |
| | | | | | | | | | | |
(1)Gross installed capacity and availability for 2024 include the 100 MW White Rock West and 202 MW White Rock East wind facilities that achieved commercial operation in January and April 2024, respectively, and the 202 MW Horizon Hill wind facility that achieved commercial operation in May 2024.Tower removal at Sinott in 2025, reduced gross installed capacity by 1 MW. Gross installed capacity and availability for 2024 and 2023 include the 130 MW Garden Plain wind facility that achieved commercial operation in August 2023 and the 48 MW Northern Goldfields solar facilities that achieved commercial operation in November 2023.
(2)For details of the adjustments to revenues and OM&A included in adjusted EBITDA, refer to the Additional IFRS Measures and Non-IFRS Measures section of this MD&A. The Skookumchuck wind facility has been included on a proportionate basis in the Wind and Solar segment.
(3)Adjusted EBITDA and adjusted gross margin are not defined and have no standardized meaning under IFRS and may not be comparable to similar measures presented by other issuers. Refer to the Additional IFRS and Non-IFRS Measures section of this MD&A.
| | | | | | | | |
| TransAlta Corporation | 2024 Integrated Report | M23 |
2024 versus 2023
Adjusted revenues for the year ended Dec. 31, 2024, increased compared to 2023, primarily due to:
•Higher environmental and tax attributes revenues from the sale of production tax credits from Horizon Hill and White Rock West and East wind facilities to taxable US counterparties;
•Higher production from the return to service of the Kent Hills wind facilities; and
•Commercial operation of the Horizon Hill and White Rock West and East wind facilities; partially offset by
•Lower realized power prices in the Alberta market.
Adjusted EBITDA for the year ended Dec. 31, 2024, increased compared to the same period in 2023, primarily due to:
•Higher adjusted revenues as explained by the factors above; partially offset by
•Higher OM&A mainly due to the addition of new wind facilities.
2023 versus 2022
Adjusted revenues for the year ended Dec. 31, 2023, decreased compared to 2022, primarily due to:
•Lower environmental attribute revenues driven by a reduction of offsets and emission credit sales;
•Lower realized power prices in Alberta; and
•Weaker than long-term average wind resource across the operating fleets; partially offset by
•Commercial operation of the Garden Plain wind facility and the Northern Goldfield Solar facilities in the third and fourth quarter, respectively; and
•The partial return to service of the Kent Hills wind facilities.
Adjusted EBITDA for the year ended Dec. 31, 2023, decreased compared to the same period in 2022, primarily due to:
•Lower adjusted revenues as explained by the factors above;
•Higher OM&A related to salary escalations, higher insurance costs and long-term service agreement escalations; and
•Lower liquidated damages recognized at the Windrise wind facility.
| | | | | | | | |
| M24 | TransAlta Corporation | 2024 Integrated Report |
Gas
| | | | | | | | | | | | | | | | | | | | | | | | | | | | | | | |
| | | | | | | | |
| Year ended Dec. 31 | | | 2024 | | 2023 | | Change | 2022 | Change |
Gross installed capacity (MW)(1) | | | 4,834 | | | 3,084 | | | 1,750 | | 57 | % | 3,084 | | — | | — | % |
| Availability (%) | | | 92.2 | | | 91.6 | | | 0.6 | | 1 | % | 94.6 | | (3.0) | | (3) | % |
| Production | | | | | | | | | | | |
| Contract sales volume (GWh) | | | 6,874 | | | 4,322 | | | 2,552 | | 59 | % | 3,806 | | 516 | | 14 | % |
| Merchant sales volume (GWh) | | | 6,576 | | | 7,889 | | | (1,313) | | (17) | % | 7,927 | | (38) | | — | % |
Purchased power (GWh)(2) | | | (1,133) | | | (338) | | | (795) | | 235 | % | (285) | | (53) | | 19 | % |
| Total production (GWh) | | | 12,317 | | | 11,873 | | | 444 | | 4 | % | 11,448 | | 425 | | 4 | % |
| | | | | | | | | | | |
Adjusted revenues(3) | | | 1,321 | | | 1,525 | | | (204) | | (13) | % | 1,521 | | 4 | | — | % |
Adjusted fuel and purchased power(3) | | | 470 | | | 449 | | | 21 | | 5 | % | 637 | | (188) | | (30) | % |
| Carbon compliance | | | 145 | | | 112 | | | 33 | | 29 | % | 83 | | 29 | | 35 | % |
Adjusted gross margin(4) | | | 706 | | | 964 | | | (258) | | (27) | % | 801 | | 163 | | 20 | % |
| OM&A | | | 198 | | | 192 | | | 6 | | 3 | % | 195 | | (3) | | (2) | % |
| Taxes, other than income taxes | | | 13 | | | 11 | | | 2 | | 18 | % | 15 | | (4) | | (27) | % |
| Net other operating income | | | (40) | | | (40) | | | — | | — | % | (38) | | (2) | | 5 | % |
Adjusted EBITDA(4) | | | 535 | | | 801 | | | (266) | | (33) | % | 629 | | 172 | | 27 | % |
| | | | | | | | | | | |
| | | | | | | | | | | |
| | | | | | | | | | | |
(1)Gross installed capacity and availability for 2024 include the 1,747 MW Heartland gas facilities and exclude the Planned Divestitures. Refer to the Significant and Subsequent events section. Gross installed capacity for Keephills Unit 3 was adjusted by 3 MW during 2024 due to reduced equipment load.
(2)Power required to fulfil contractual obligations during planned and unplanned outages is included in purchased power.
(3)For details of the adjustments to revenues and fuel and purchased power included in adjusted EBITDA, refer to the Additional IFRS Measures and Non-IFRS Measures section of this MD&A.
(4)Adjusted EBITDA and adjusted gross margin are not defined and have no standardized meaning under IFRS and may not be comparable to similar measures presented by other issuers. Refer to the Additional IFRS Measures and Non-IFRS Measures section of this MD&A.
2024 versus 2023
The Gas fleet performance was broadly in line with management's expectations for the segment.
Adjusted revenues for the year ended Dec. 31, 2024, decreased compared to 2023, primarily due to:
•Lower power prices in the Alberta market;
•Increased dispatch optimization from Alberta Gas facilities driven by lower power prices; and
•Lower capacity payments in 2024 for Southern Cross Energy in Western Australia due to the scheduled conclusion on Dec. 31, 2023, of the demand capacity charge under the customer contract, partially offset by the commencement in March 2024 of capacity payments for the Mount Keith 132kV expansion; partially offset by
•Higher volume of favourable hedging positions settled, which generated positive contributions over settled spot prices in Alberta.
Adjusted EBITDA for the year ended Dec. 31, 2024, decreased compared to 2023, primarily due to:
•Lower adjusted revenues explained above;
•An increase in the carbon price from $65 to $80 per tonne, impacting gross margin from our Canadian gas facilities; and
•Higher carbon costs and fuel usage related to production; partially offset by
•The utilization of emission credits to settle a portion of our 2023 GHG obligation; and
•Lower natural gas prices.
| | | | | | | | |
| TransAlta Corporation | 2024 Integrated Report | M25 |
2023 versus 2022
Adjusted revenues for the year ended Dec. 31, 2023, increased compared to 2022, primarily due to:
•Higher production due to the fleet being available during periods of supply tightness and peak pricing; and
•Higher power price hedges, partially offsetting the impact of lower Alberta spot prices; partially offset by
•Lower thermal revenues due to lower steam revenue pricing at the Sarnia facility compared to 2022.
Adjusted EBITDA for the year ended Dec. 31, 2023, increased compared to 2022, primarily due to:
•Lower natural gas commodity costs for the Alberta Gas facilities; and
•Higher adjusted revenues explained above; partially offset by
•Higher carbon costs and fuel usage related to production with the utilization of emission credits to settle a portion of the GHG obligation in 2022; and
•Carbon price increases from $50 per tonne to $65 per tonne, impacting our Canadian gas facilities.
| | | | | | | | |
| M26 | TransAlta Corporation | 2024 Integrated Report |
Energy Transition
| | | | | | | | | | | | | | | | | | | | | | | | | | | | | | | |
| | | | | | | | |
| Year ended Dec. 31 | | | 2024 | | 2023 | | Change | 2022 | Change |
| Gross installed capacity (MW) | | | 671 | | | 671 | | | — | | — | % | 671 | | — | | — | % |
| Availability (%) | | | 80.0 | | | 79.8 | | | 0.2 | | — | % | 77.2 | | 2.6 | | 3 | % |
| | | | | | | | | | | |
| Production | | | | | | | | | | | |
| Contract sales volume (GWh) | | | 3,338 | | | 3,329 | | | 9 | | — | % | 3,329 | | — | | — | % |
| Merchant sales volume (GWh) | | | 3,201 | | | 4,417 | | | (1,216) | | (28) | % | 3,951 | | 466 | | 12 | % |
Purchased power (GWh)(1) | | | (3,717) | | | (3,602) | | | (115) | | 3 | % | (3,706) | | 104 | | (3) | % |
| Total production (GWh) | | | 2,822 | | | 4,144 | | | (1,322) | | (32) | % | 3,574 | | 570 | | 16 | % |
| | | | | | | | | | | |
Adjusted revenues(2) | | | 582 | | | 746 | | | (164) | | (22) | % | 724 | | 22 | | 3 | % |
| Fuel and purchased power | | | 418 | | | 557 | | | (139) | | (25) | % | 566 | | (9) | | (2) | % |
| Carbon compliance | | | 1 | | | — | | | 1 | | — | % | (1) | | 1 | | (100) | % |
Adjusted gross margin(3) | | | 163 | | | 189 | | | (26) | | (14) | % | 159 | | 30 | | 19 | % |
| OM&A | | | 69 | | | 64 | | | 5 | | 8 | % | 69 | | (5) | | (7) | % |
| Taxes, other than income taxes | | | 3 | | | 3 | | | — | | — | % | 4 | | (1) | | (25) | % |
| | | | | | | | | | | |
Adjusted EBITDA(3) | | | 91 | | | 122 | | | (31) | | (25) | % | 86 | | 36 | | 42 | % |
| Supplemental information: | | | | | | | | | | | |
| Highvale mine reclamation spend | | | 11 | | | 15 | | | (4) | | (27) | % | 12 | 3 | | 25 | % |
| Centralia mine reclamation spend | | | 16 | | | 13 | | | 3 | | 23 | % | 16 | (3) | | (19) | % |
| | | | | | | | | | | |
| | | | | | | | | | | |
(1)All of the power produced by Centralia is sold by the Energy Marketing segment for physical market delivery, which is shown as merchant sales volumes. Power required to fulfil contractual obligations is included in purchased power. Total production from the facility includes the net result of merchant sales volumes and purchased power.
(2)For details of the adjustments to revenues included in adjusted EBITDA, refer to the Additional IFRS Measures and Non-IFRS Measures section of this MD&A.
(3)Adjusted EBITDA and adjusted adjusted gross margin are not defined and have no standardized meaning under IFRS and may not be comparable to similar measures presented by other issuers. Refer to the Additional IFRS Measures and Non-IFRS Measures section of this MD&A.
2024 versus 2023
Adjusted revenues for the year ended Dec. 31, 2024, decreased compared to 2023, primarily due to increased economic dispatch driven by lower market prices which negatively impacted merchant production.
Adjusted EBITDA for the year ended Dec. 31, 2024, decreased compared to 2023, primarily due to:
•Lower revenues as explained by the factors above; partially offset by
•Lower fuel and purchased power costs due to lower Mid-Columbia prices on purchases of power and lower production volumes.
Mine reclamation spending for the year ended Dec. 31, 2024, was consistent with 2023.
2023 versus 2022
Adjusted revenues for the year ended Dec. 31, 2023, increased compared to 2022, primarily due to:
•Higher production from higher availability due to lower planned and unplanned outages at Centralia Unit 2; and
•Less economic dispatch leading to higher merchant sales volumes; partially offset by
•Lower market prices.
Adjusted EBITDA for the year ended Dec. 31, 2023, increased compared to 2022, primarily due to:
•Higher revenues as explained by the factors above;
•Lower purchased power costs due to lower pricing and increased volumes of production; and
•Lower OM&A expenses due to the retirement of Sundance Unit 4 in the first quarter of 2022.
Mine reclamation spending for the year ended Dec. 31, 2023, was consistent with 2022.
| | | | | | | | |
| TransAlta Corporation | 2024 Integrated Report | M27 |
Energy Marketing | | | | | | | | | | | | | | | | | | | | | | | | | |
| | | | | | | |
| Year ended Dec. 31 | | | 2024 | 2023 | Change | 2022 | Change |
Adjusted revenues(1) | | | 167 | | 152 | | 15 | | 10 | % | 218 | | (66) | | (30) | % |
| OM&A | | | 36 | | 43 | | (7) | | (16) | % | 35 | | 8 | | 23 | % |
Adjusted EBITDA(2) | | | 131 | | 109 | | 22 | | 20 | % | 183 | | (74) | | (40) | % |
(1)For details of the adjustments to revenues included in adjusted EBITDA, refer to the Additional IFRS Measures and Non-IFRS Measures section of this MD&A.
(2)Adjusted EBITDA is not defined and has no standardized meaning under IFRS and may not be comparable to similar measures presented by other issuers. Refer to the Additional IFRS Measures and Non-IFRS Measures section of this MD&A.
2024 versus 2023
Adjusted revenues and Adjusted EBITDA for the year ended Dec. 31, 2024, increased compared to 2023, primarily due to favourable market volatility across North American power and natural gas markets and higher realized settled trades in 2024 in compared to the prior year, primarily due to:
•The Company was able to capitalize on volatility in the trading of both physical and financial power and gas products across North American deregulated markets while maintaining the overall risk profile of the business unit; and
•A decrease in OM&A mainly due to lower incentives related to revenue before adjustments compared to the prior year.
2023 versus 2022
Adjusted revenues and Adjusted EBITDA for the year ended Dec. 31, 2023, decreased compared to 2022. This was in line with management's expectations, but lower year-over-year, primarily due to:
•Lower realized settled trades during the year on market positions in comparison to the prior year; and
•An increase in OM&A mainly due to higher incentives related to revenues before adjustments.
Corporate
| | | | | | | | | | | | | | | | | | | | | | | | | | | | | | | |
| | | | | | | | |
| Year ended Dec. 31 | | | 2024 | | 2023 | | Change | 2022 | Change |
Adjusted OM&A(1) | | | 135 | | | 115 | | | 20 | | 17 | % | 101 | | 14 | | 14 | % |
| Taxes, other than income taxes | | | 1 | | | 1 | | | — | | — | % | 1 | | — | | — | % |
Adjusted EBITDA(2) | | | (136) | | | (116) | | | (20) | | 17 | % | (102) | | (14) | | 14 | % |
| | | | | | | | | | | |
| | | | | | | | | | | |
| | | | | | | | | | | |
| | | | | | | | | | | |
| | | | | | | | | | | |
| | | | | | | | | | | |
| | | | | | | | | | | |
| | | | | | | | | | | |
| | | | | | | | | | | |
(1)For details of the adjustments to OM&A included in adjusted EBITDA, refer to the Additional IFRS Measures and Non-IFRS Measures section of this MD&A.
(2)Adjusted EBITDA is not defined and has no standardized meaning under IFRS and may not be comparable to similar measures presented by other issuers Refer to the Additional IFRS Measures and Non-IFRS Measures section of this MD&A.
2024 versus 2023
Adjusted EBITDA for the year ended Dec. 31, 2024, decreased compared to 2023, primarily due to increased spending to support strategic and growth initiatives related to early stage growth projects.
2023 versus 2022
Adjusted EBITDA for the year ended Dec. 31, 2023, decreased compared to 2022, primarily due to:
•Increased spending to support strategic and growth initiatives;
•Higher costs associated with the relocation of the Company's head office; and
•Increased costs due to inflationary pressures.
| | | | | | | | |
| M28 | TransAlta Corporation | 2024 Integrated Report |
Performance by Segment with Supplemental Geographical Information
The following table provides adjusted EBITDA by segment across the regions we operate in:
| | | | | | | | | | | | | | | | | | | | | | | | |
| | | | | | | | |
| | | | | | | | |
| | | | | | | | |
| | | | | | | | |
| | | | | | | | |
| | | | | | | | |
| | | | | | | | |
| | | | | | | | |
| | | | | | | | |
| | | | | | | | |
| | | | | | | | |
| | | | | | | | |
| | | | | | | | |
| | | | | | | | |
| | | | | | | | |
| | | | | | | | |
| Year ended Dec. 31, 2024 | | Hydro | Wind & Solar | Gas | Energy Transition | Energy Marketing | Corporate | Total |
| Alberta | | 307 | | 51 | | 340 | | (10) | | 131 | | (136) | | 683 | |
| Canada, excluding Alberta | | 9 | | 122 | | 91 | | — | | — | | — | | 222 | |
| U.S. | | — | | 135 | | 12 | | 101 | | — | | — | | 248 | |
| Western Australia | | — | | 8 | | 92 | | — | | — | | — | | 100 | |
Adjusted EBITDA(1) | | 316 | | 316 | | 535 | | 91 | | 131 | | (136) | | 1,253 | |
| Earnings before income taxes | | | | | | | | 319 | |
| | | | | | | | |
| Year ended Dec. 31, 2023 | | Hydro | Wind & Solar | Gas | Energy Transition | Energy Marketing | Corporate | Total |
| Alberta | | 451 | | 77 | | 571 | | (10) | | 109 | | (116) | | 1,082 | |
| Canada, excluding Alberta | | 8 | | 95 | | 89 | | — | | — | | — | | 192 | |
| U.S. | | — | | 84 | | 10 | | 132 | | — | | — | | 226 | |
| Western Australia | | — | | 1 | | 131 | | — | | — | | — | | 132 | |
Adjusted EBITDA(1) | | 459 | | 257 | | 801 | | 122 | | 109 | | (116) | | 1,632 | |
| Earnings before income taxes | | | | | | | | 880 | |
(1)Adjusted EBITDA is not defined and has no standardized meaning under IFRS and may not be comparable to similar measures presented by other issuers. Refer to the Additional IFRS Measures and Non-IFRS Measures section of this MD&A.
Optimization of the Alberta Portfolio
Our merchant exposure is primarily in Alberta, where 58 per cent of our capacity is located, 77 per cent of which is available to participate in the merchant market. Our portfolio of assets consists of hydro, wind, battery storage and natural gas generation facilities.
The acquisition of Heartland enhances and further diversifies TransAlta’s competitive portfolio in the highly dynamic and shifting electricity landscape in Alberta, by adding 507 MW of contracted cogeneration capacity, 387 MW of contracted and merchant peaking generation capacity, 950 MW of natural gas-fired thermal generation capacity, transmission capacity and a development pipeline. The fast-ramping nature of certain Heartland facilities is ideally positioned to respond to expected price volatility and deliver peaking capacity in periods of higher demand in the Alberta market. Refer to the Significant and Subsequent events section.
Generating capacity in Alberta is subject to market forces. Power from commercial generation is cleared through a wholesale electricity market. Power is dispatched in accordance with an economic merit order administered by the Alberta Electric System Operator (AESO), based upon offers by generators to sell power in the real-time energy-
only market. Our merchant Alberta fleet operates under this framework and we internally manage our offers to sell power.
Optimization of portfolio performance in the Alberta merchant market is driven by the diversity of fuel types, which enables portfolio management. It also provides us with capacity that can be monetized as either energy production or ancillary services. A significant portion of the generation capacity in the portfolio has been hedged to provide greater cash flow certainty. The Company's hedging strategy includes maintaining a significant base of Commercial and Industrial (C&I) customers and is supplemented with financial hedges.
During periods of low market prices, the Company may choose not to generate power from the thermal fleet and monetize its hedged or contract positions. This results in a change in revenue not correlating with a change in production. During 2024, there were periods of low market prices, and the Company opted not to generate production from the thermal fleet, and as a result, the thermal generation sold through C&I contracts and financial hedges exceeded the actual merchant production generated.
| | | | | | | | |
| TransAlta Corporation | 2024 Integrated Report | M29 |
The Alberta hydro fleet provides ancillary services and grid reliability products such as black start services, in the event of a system-wide blackout in the province, and drought mitigation, by systematically regulating river flows.
Our Alberta wind and hydro fleets provide a steady stream of environmental credits that the Company sells to third parties and intercompany to the Gas segment.
The following table provides information for the Company's Alberta electricity portfolio:
| | | | | | | | | | | | | | | | | | | | | | | | | | | | | | | | | | | | | | | | | | | | | | | | |
| | | | |
| | | | | | | | | | | | | | | | |
| | | | | | | | | | | | | | | | |
| | | | | | | | | | | | | | | | |
| | | | | | | | | | | | | | | | |
| | | | | | | | | | | | | | | | |
| | | | | | | | | | | | | | | | |
| | | | | | | | | | | | | | | | |
| | | | | | | | | | | | | | | | |
| | | | | | | | | | | | | | | | |
| 2024 | 2023 | 2022 | |
| Year ended Dec. 31 | Hydro | Wind & Solar | Gas(4) | Energy
Transition | Total | Hydro | Wind & Solar | Gas | Energy Transition | Total | Hydro | Wind & Solar | Gas | Energy
Transition | Total | |
Gross
installed capacity (MW) | 834 | | 764 | | 3,650 | | — | | 5,248 | | 834 | | 766 | | 1,960 | | — | | 3,560 | | 834 | | 636 | | 1,960 | | — | | 3,430 | | |
Total production(1) (GWh) | 1,443 | | 1,981 | | 8,385 | | — | | 11,809 | | 1,492 | | 1,907 | | 8,360 | | — | | 11,759 | | 1,665 | | 1,686 | | 8,106 | | 19 | | 11,476 | | |
| Contract production (GWh) | — | | 928 | | 2,566 | | — | | 3,494 | | — | | 774 | | 861 | | — | | 1,635 | | — | | 620 | | 526 | | — | | 1,146 | | |
| Merchant production (GWh) | 1,443 | | 1,053 | | 5,819 | | — | | 8,315 | | 1,492 | | 1,133 | | 7,499 | | — | | 10,124 | | 1,665 | | 1,066 | | 7,580 | | 19 | | 10,330 | | |
Purchased power (GWh) | — | | — | | (918) | | — | | (918) | | — | | — | | (150) | | — | | (150) | | — | | — | | (197) | | — | | (197) | | |
| Hedged production (GWh) | 558 | | 136 | | 8,386 | | | 9,080 | | 378 | | 221 | | 7,173 | | — | | 7,550 | | — | | — | | 7,228 | | — | | 7,228 | | |
| Production contracted or hedged (%) | 39 | % | 54 | % | 131 | % | — | % | 106 | % | 25 | % | 41 | % | 96 | % | — | % | 78 | % | — | % | 37 | % | 96 | % | — | % | 73 | % | |
| Hedged production as a percentage of gross installed capacity (%) | 8 | % | 2 | % | 26 | % | — | % | 20 | % | 5 | % | 3 | % | 42 | % | — | % | 24 | % | — | % | — | % | 42 | % | — | % | 24 | % | |
| | | | | | | | | | | | | | | | |
Revenues(2)(3)(5) ($) | 370 | | 105 | | 887 | | 5 | | 1,367 | | 509 | | 130 | | 1,083 | | 5 | | 1,727 | | 602 | | 155 | | 989 | | 6 | | 1,752 | | |
| Fuel ($) | 6 | | 11 | | 297 | | 1 | | 315 | | 8 | | 17 | | 307 | | — | | 332 | | 10 | | 17 | | 419 | | 5 | | 451 | | |
Purchased power ($) | 7 | | 3 | | 60 | | — | | 70 | | 9 | | 3 | | 29 | | — | | 41 | | 8 | | 4 | | 23 | | — | | 35 | | |
Carbon compliance(3) ($) | — | | — | | 125 | | 1 | | 126 | | — | | — | | 106 | | — | | 106 | | — | | 1 | | 70 | | (1) | | 70 | | |
Gross margin(5) ($) | 357 | | 91 | | 405 | | 3 | | 856 | | 492 | | 110 | | 641 | | 5 | | 1,248 | | 584 | | 133 | | 477 | | 2 | | 1,196 | | |
| | | | | | | | | | | | | | | | |
| | | | | | | | | | | | | | | | |
| | | | | | | | | | | | | | | | |
(1)Total production includes contract and merchant production.
(2)Revenues have been adjusted to exclude the impact of unrealized mark-to-market gains or losses and to include realized gains and losses on closed exchange positions.
(3)The intercompany sales of emission credits from the Hydro segment to the Gas segment are eliminated on consolidation in the Corporate segment. Refer to the Additional IFRS Measures and Non-IFRS Measures section of this MD&A.
(4)Gross installed capacity for Alberta facilities in 2024 includes 1,687 MW from the acquisition of Heartland and excludes production from Planned Divestitures. Refer to the Significant and Subsequent events section.
(5)During 2024 our adjusted EBITDA composition was amended to exclude the impact of Brazeau penalties and related provisions. Therefore, the Company has applied this composition to all previously reported periods. Refer to the Additional IFRS Measures and Non-IFRS Measures section of this MD&A.
| | | | | | | | |
| M30 | TransAlta Corporation | 2024 Integrated Report |
2024 versus 2023
Total production for the Alberta portfolio for the year ended Dec. 31, 2024, was 11,809 GWh, compared to 11,759 GWh in 2023. The increase of 50 GWh, or 0.4 per cent, was primarily due to:
•Higher production in the Gas segment due to the addition of gas facilities from the acquisition of Heartland; and
•A full-year of production from the addition of the Garden Plain wind facility, which was commissioned in August 2023; partially offset by
•Higher dispatch optimization in the Gas segment; and
•Lower production from the Alberta Hydro Assets due to lower water resources compared to the prior year.
Hedged production for the year ended Dec. 31, 2024, increased compared to 2023. In anticipation of the risk of lower prices in 2024, the Company deployed a defensive strategy to increase financial hedges for the merchant portfolio at attractive margins. Realized gains and losses on financial hedges are included in revenues in the table above.
Gross margin for the Alberta portfolio for the year ended Dec. 31, 2024, was $856 million, compared to $1,248 million in 2023. The decrease of $392 million, or 31 per cent, was primarily due to:
•The impact of lower Alberta spot power prices and lower hydro ancillary services prices;
•Increased dispatch optimization in the Gas segment driven by lower power prices;
•An increase in the carbon price per tonne from $65 in 2023 to $80 in 2024; partially offset by
•Higher gains realized on financial hedges settled in the period;
•Higher environmental and tax attributes revenues due to the increased sales of emission credits to third parties and intercompany sales from the Hydro segment to the Gas segment;
•The utilization of emission credits in the Gas segment in 2024 to settle a portion of our 2023 GHG obligation;
•Higher hydro ancillary services volumes due to increased demand by the AESO; and
•Lower natural gas prices.
2023 versus 2022
Total production for the year ended Dec. 31, 2023, was 11,759 GWh, compared to 11,476 GWh in 2022. The increase of 283 GWh, or two per cent, was primarily due to:
•The commercial operation of the Garden Plain wind facility in the third quarter of 2023;
•Higher production from our Gas facilities due to strong market conditions in the first half of 2023; partially offset by
•Lower water resources in the Alberta Hydro Assets.
Hedged production for the year ended Dec. 31, 2023, increased compared to 2022, primarily due to the opportunity to secure additional margins with strategic hedges for the hydro assets.
Gross margin for the Alberta portfolio for the year ended Dec. 31, 2023, was $1,248 million, compared to $1,196 million in 2022. The increase of $52 million, or four per cent, was primarily due to:
•Higher power price hedges, partially offsetting the impacts of lower Alberta spot prices; and
•Lower natural gas prices compared to 2022; partially offset by
•Lower ancillary services revenues due to the AESO procuring lower volumes given its decision to reduce the cumulative volume of imports into Alberta.
| | | | | | | | |
| TransAlta Corporation | 2024 Integrated Report | M31 |
The following table provides information for the Company's Alberta electricity portfolio:
| | | | | | | | | | | | | |
| | | |
| Year ended Dec. 31 | | | 2024 | 2023 | 2022 |
| Alberta Market | | | | | |
| Spot power price average per MWh | | | 63 | | 134 | | 162 | |
| Natural gas price (AECO) per GJ | | | 1.29 | | 2.54 | | 5.08 | |
| Carbon compliance price per tonne | | | 80 | | 65 | | 50 | |
| Alberta Portfolio Results | | | | | |
Realized merchant power price per MWh(1) | | | 109 | | 136 | | 126 | |
| Hydro energy spot power price per MWh | | | 91 | | 175 | | 197 | |
| Hydro ancillary services price per MWh | | | 46 | | 67 | | 76 | |
| Wind energy spot power price per MWh | | | 35 | | 73 | | 90 | |
| Gas spot power price per MWh | | | 86 | | 162 | | 194 | |
Hedged power price average per MWh(2) | | | 84 | | 111 | | 86 | |
| Hedged volume (GWh) | | | 9,080 | | 7,550 | | 7,228 | |
Fuel cost per MWh(3) | | | 38 | | 40 | | 56 | |
Carbon compliance cost per MWh(4) | | | 15 | | 13 | | 9 | |
(1)Realized merchant power price for the Alberta electricity portfolio is the average price realized as a result of the Company's merchant power sales and portfolio optimization activities (excluding assets under long-term contract and ancillary revenues) divided by total merchant GWh produced.
(2)Hedged power price average per MWh is calculated as the average sales price for all hedges and direct customer sales during the reporting period.
(3)Fuel cost per MWh is calculated on production from carbon-emitting generation in the Gas and Energy Transition segments.
(4)Carbon compliance cost per MWh is calculated on production from carbon-emitting generation, as well as power purchased, in the Gas and Energy Transition segments.
2024 versus 2023
The average spot power price per MWh for the Alberta portfolio for the year ended Dec. 31, 2024 decreased from $134 per MWh in 2023 to $63 per MWh in 2024, primarily due to:
•Higher generation from the addition of increased supply of new renewables and combined-cycle gas facilities into the market compared to the prior period; and
•Lower natural gas prices.
The realized merchant power price per MWh of production for the Alberta portfolio for the year ended Dec. 31, 2024, decreased by $27 per MWh, compared to 2023, primarily due to:
•Lower average spot power prices as explained above; and
•Lower hedge prices compared to the prior year.
Fuel cost per MWh for the year ended Dec. 31, 2024, decreased by $2 per MWh, compared to 2023, primarily due to lower natural gas prices.
Carbon compliance cost per MWh of production for the year ended Dec. 31, 2024, increased by $2 per MWh, compared to 2023, primarily due to:
•The increase in carbon pricing from $65 per tonne in 2023 to $80 per tonne in 2024; partially offset by
•The utilization of emission credits to settle a portion of the 2023 GHG obligation during the year.
2023 versus 2022
The average spot power price per MWh for the year ended Dec. 31, 2023 decreased from $162 per MWh in 2022 to $134 per MWh in 2023, primarily due to:
•Moderate temperatures in the last six months of the year compared with the prior year;
•Higher total renewable generation in the Alberta market from new Wind and Solar facilities and higher wind resources during the fourth quarter of 2023; and
•Lower natural gas prices.
Realized merchant power price per MWh of production for the Alberta portfolio for the year ended Dec. 31, 2023, increased by $10 per MWh, compared to 2022, primarily due to:
•Optimization of our available capacity across all fuel types; and
•Higher hedge prices compared to the prior year.
| | | | | | | | |
| M32 | TransAlta Corporation | 2024 Integrated Report |
Fuel cost per MWh for the Alberta portfolio for the year ended Dec. 31, 2023, decreased by $16 per MWh, compared to 2022, primarily due to lower natural gas prices.
Carbon compliance cost per MWh of production for the Alberta portfolio for the year ended Dec. 31, 2023, increased by $4 per MWh, compared to 2022 primarily due to:
•The increase in carbon pricing from $50 per tonne in 2022 to $65 per tonne in 2023; and
•No utilization of emission credits to settle the GHG obligation during the year. In 2022 the Company used emission credits to settle a portion of the carbon compliance obligation resulting in a lower carbon cost per MWh.
| | | | | | | | |
| TransAlta Corporation | 2024 Integrated Report | M33 |
Fourth Quarter Highlights
For the quarter ended Dec. 31, 2024, the Company's performance was impacted by lower power prices in the Alberta and Mid-Columbia markets. The results were in line with management's expectations due to active management of the Company's merchant portfolio and hedging strategies. During the fourth quarter of 2024, the Company settled a higher volume of hedges that were
significantly above average spot prices. The acquisition of Heartland on Dec. 4, 2024 positively contributed to the production in the Gas segment and further diversifies TransAlta’s competitive portfolio in the highly dynamic and shifting electricity landscape in Alberta by adding 1,747 MW to gross installed capacity.
Consolidated Financial Highlights
| | | | | | | | | |
| Three months ended Dec. 31 | 2024 | | 2023 |
| Operational information | | | |
| Availability (%) | 87.8 | | | 86.9 | |
| Production (GWh) | 6,199 | | | 5,783 | |
| Select financial information | | | |
| Revenues | 678 | | | 624 | |
| | | |
| | | |
| | | |
Adjusted EBITDA(1) | 285 | | | 289 | |
| Loss before income taxes | (51) | | | (35) | |
| | | |
| Net loss attributable to common shareholders | (65) | | | (84) | |
| Cash flows | | | |
| Cash flow from operating activities | 215 | | | 310 | |
Funds from operations(1) | 137 | | | 229 | |
Free cash flow(1) | 48 | | | 121 | |
| Per share | | | |
| Weighted average number of common shares outstanding | 298 | | | 308 | |
| | | |
| | | |
| | | |
| | | |
Free cash flow per share(1)(2) | 0.16 | | | 0.39 | |
(1)These items are not defined and have no standardized meaning under IFRS and may not be comparable to similar measures presented by other issuers. Refer to the Segmented Financial Performance and Operating Results section of this MD&A for further discussion of these items, including, where applicable, reconciliations to measures calculated in accordance with IFRS. Also, refer to the Additional IFRS Measures and Non-IFRS Measures section of this MD&A.
(2)FFO per share and FCF per share are calculated using the weighted average number of common shares outstanding during the period. Refer to the Additional IFRS Measures and Non-IFRS Measures section of this MD&A for the purpose of these non-IFRS ratios.
| | | | | | | | |
| M34 | TransAlta Corporation | 2024 Integrated Report |
Operating Performance
The following table provides availability (%) by segment:
| | | | | | | | | | | |
| Three months ended Dec. 31 | | | 2024 | 2023 | |
| Hydro | | | 85.8 | | 76.6 | | |
| Wind and Solar | | | 92.2 | | 90.3 | | |
Gas(1) | | | 84.1 | | 89.5 | | |
| Energy Transition | | | 91.7 | | 79.6 | | |
| Availability (%) | | | 87.8 | | 86.9 | | |
(1)Availability for 2024 includes the facilities acquired from Heartland and excludes the Planned Divestitures. Refer to the Significant and Subsequent events section.
Availability for the three months ended Dec. 31, 2024, was 87.8 per cent compared to 86.9 per cent for the same period in 2023, primarily due to:
•The addition of the White Rock and Horizon Hill wind facilities which operated with high availability;
•The return to service of the Kent Hills wind facilities;
•Higher availability in the Hydro segment due to lower planned outages;
•Higher availability in the Energy Transition segment due to lower unplanned outages; and
•Positive contribution from the addition of the gas facilities acquired with Heartland; partially offset by
•Lower availability for the Gas segment due to planned outages at Sarnia, Sheerness and Keephills.
Production and Long-Term Average Generation
| | | | | | | | | | | | | | | | | | | | | | | |
| 2024 | | 2023 |
| Three months ended Dec. 31 | Actual production (GWh) | LTA generation (GWh) | Production as a % of LTA | | Actual production (GWh) | LTA generation (GWh) | Production as a % of LTA |
| Hydro | 452 | | 447 | | 101 | % | | 326 | | 447 | | 73 | % |
| Wind and Solar | 1,831 | | 2,175 | | 84 | % | | 1,479 | | 1,361 | | 109 | % |
| | | | | | | |
| | | | | | | |
Gas(1) | 2,875 | | | | | 2,892 | | | |
| Energy Transition | 1,041 | | | | | 1,086 | | | |
| | | | | | | |
| | | | | | | |
| Total | 6,199 | | | | | 5,783 | | | |
| | | | | | | |
(1)Gas production for 2024 includes 511 GWh from Heartland, excluding production from the Planned Divestitures. Refer to the Significant and Subsequent events section.
Production for the three months ended Dec. 31, 2024, was 6,199 GWh compared to 5,783 GWh for the same period in 2023. The increase was primarily due to:
•Higher production in the Wind and Solar segment due to the addition of the Horizon Hill and the White Rock West and East wind facilities during 2024;
•Higher production in the Hydro segment compared to the same period in 2023 due to water conservation in the fourth quarter of 2023 that resulted in lower production volumes compared to the current period; partially offset by
•Lower production in the Energy Transition segment due to higher dispatch optimization, which negatively affected merchant production; and
•Lower production in the Gas segment driven by lower availability at the Sarnia facility due to planned outages, higher economic dispatch in Alberta and lower production from Western Australia due to lower demand, partially offset by positive contribution from the Heartland gas facilities.
| | | | | | | | |
| TransAlta Corporation | 2024 Integrated Report | M35 |
Financial Performance Review on Consolidated Information
| | | | | | | | | | | |
| |
| Three months ended Dec. 31 | 2024 | | 2023 |
| Revenues | 678 | | | 624 | |
| Fuel and purchased power | 249 | | | 278 | |
| Carbon compliance | 39 | | | 27 | |
| Operations, maintenance and administration | 234 | | | 150 | |
| Depreciation and amortization | 143 | | | 132 | |
| Asset impairment charges | 20 | | | 26 | |
| Interest expense | 92 | | | 66 | |
| Foreign exchange gain (loss) | 17 | | | (7) | |
| | | |
| Loss before income taxes | (51) | | | (35) | |
| Income tax (recovery) expense | (8) | | | 19 | |
| Net loss attributable to common shareholders | (65) | | | (84) | |
| Net (loss) earnings attributable to non-controlling interests | (4) | | | 5 | |
Current Year Variance Analysis (Fourth quarter 2024 versus Fourth quarter 2023)
Revenues for the three months ended Dec. 31, 2024, increased by $54 million, or nine per cent, compared to the same period in 2023, primarily due to:
•Higher revenue in the Gas segment due to favourable contribution from hedging and the addition of Heartland facilities;
•Higher revenues in the Hydro segment due to higher production in the fourth quarter of 2024 due to water conservation in the same period of 2023; and
•Revenue from the commercial operation of the White Rock and Horizon Hill wind facilities in the current period; partially offset by
•Lower realized power prices and dispatch optimization in Alberta;
•Lower revenues in the Energy Marketing segment due to lower market volatility across North American power and natural gas markets; and
•Lower revenues in the Energy Transition segment due to increased economic dispatch due to lower market prices.
Fuel and purchased power costs for the three months ended Dec. 31, 2024, decreased by $29 million, or 10 per cent, compared to the same period in 2023, primarily due to:
•Lower purchased power costs driven by lower Mid-Columbia prices on repurchases of power and lower production in the Energy Transition segment.
Carbon compliance costs for the three months ended Dec. 31, 2024, increased by $12 million compared to 2023 due to:
•Carbon price increase from $65 to $80 per tonne; and
•Carbon compliance costs attributable to facilities acquired from Heartland.
OM&A expenses for the three months ended Dec. 31, 2024, increased by $84 million, or 56 per cent, compared to the same period in 2023, primarily due to:
•Penalties assessed by the Alberta Market Surveillance Administrator for self-reported contraventions pertaining to hydro ancillary services provided during 2021 and 2022;
•Heartland acquisition-related transaction and restructuring costs;
•Higher spending in connection with planning and design work on a planned upgrade to our ERP system;
•Addition of OM&A costs from Heartland;
•Higher maintenance costs at the South Hedland facility; and
•Higher spend to support strategic and growth initiatives.
Depreciation and amortization for the three months ended Dec. 31, 2024, increased by $11 million, or eight per cent, compared to the same period in 2023, primarily due to:
•Commercial operation of the White Rock and Horizon Hill wind facilities; partially offset by
•Revisions to the useful lives of certain facilities.
| | | | | | | | |
| M36 | TransAlta Corporation | 2024 Integrated Report |
Asset impairment charges for the three months ended Dec. 31, 2024 decreased by $6 million, or 23 per cent, compared to the same period in 2023, primarily due to:
•Lower decommissioning and restoration provisions on retired assets driven by lower discount rates in the current period compared to the same period in 2023; partially offset by
•Impairment charges related to development projects that are no longer proceeding.
Interest expense for the three months ended Dec. 31, 2024 increased by $26 million, or 39 per cent, compared to 2023, primarily due to lower capitalized interest in 2024 as a result of capital projects being completed in the first half of 2024.
Foreign exchange gains for the three months ended Dec. 31, 2024 increased by $24 million due to favorable changes in foreign exchange rates.
Loss before income taxes for the three months ended Dec. 31, 2024 totalling $51 million, increased by $16 million, or 46 per cent, compared to the same period in 2023, due to the above noted items.
Income tax recovery for the three months ended Dec. 31, 2024, increased by $27 million, or 142 per cent, compared to 2023 as a result of a higher loss before income taxes due to the above noted items; in addition to lower non-deductible expenses.
Net loss attributable to common shareholders for the three months ended Dec. 31, 2024 was $65 million compared to a net loss of $84 million in the same period of 2023, an improvement of $19 million, or 23 per cent, primarily due to the above noted items.
Net earnings (loss) attributable to non-controlling interests for the three months ended Dec. 31, 2024, decreased by $9 million, or 180 per cent, compared to the same period in 2023, primarily due to lower TA Cogen net earnings resulting from lower Alberta market merchant pricing.
| | | | | | | | |
| TransAlta Corporation | 2024 Integrated Report | M37 |
Segmented Financial Performance and Operating Results for the Fourth Quarter
A summary of our adjusted EBITDA by segment and loss before income taxes for the three months ended Dec. 31, 2024, and 2023 is as follows:
| | | | | | | | | | | |
| Adjusted EBITDA(1) |
| Three months ended Dec. 31 | 2024 | 2023 |
| Hydro | 57 | | | 56 | |
| Wind and Solar | 95 | | | 82 | |
| Gas | 116 | | | 141 | |
| Energy Transition | 28 | | | 26 | |
| Energy Marketing | 27 | | | 14 | |
| Corporate | (38) | | | (30) | |
Total adjusted EBITDA(1) | 285 | | | 289 | |
| Loss before income taxes | (51) | | | (35) | |
(1)This item is not defined and has no standardized meaning under IFRS and may not be comparable to similar measures presented by other issuers. Refer to the Additional IFRS Measures and Non-IFRS Measures section of this MD&A.
Loss before income taxes for the three months ended Dec. 31, 2024, increased by $16 million, or 46 per cent, compared to the same period in 2023, primarily due to:
•Factors causing lower adjusted EBITDA (as described above);
•Higher interest expense due to lower capitalized interest in the fourth quarter of 2024 resulting from lower capital activity in 2024 compared to the same period in 2023;
•Heartland acquisition-related transaction and restructuring costs in the fourth quarter of 2024;
•Higher ERP upgrade costs related to planning and design work;
•Penalties assessed by the Alberta Market Surveillance Administrator for self-reported contraventions pertaining to Hydro ancillary services provided during 2021 and 2022;
•Higher depreciation and amortization due to the commercial operation of the White Rock and Horizon Hill wind facilities during 2024;
•Higher taxes other than income taxes mainly consisting of property taxes due to the addition of new wind facilities during 2024; partially offset by
•Higher realized and unrealized foreign exchange gains;
•Lower realized gains on closed exchange positions in 2024 compared to the same period in 2023;
•Higher net other operating income mainly due to Sundance A decommissioning cost reimbursement; and
•Lower asset impairment charges related to the decommissioning and restoration provisions on retired assets driven by lower discount rates in the current period compared to the same period in 2023, partially offset by impairment charges related to development projects that are no longer proceeding.
| | | | | | | | |
| M38 | TransAlta Corporation | 2024 Integrated Report |
The major factors impacting adjusted EBITDA for the three months ended Dec. 31, 2024, are summarized in the following table:
| | | | | |
| Three months ended Dec. 31 |
| Adjusted EBITDA for the three months ended Dec. 31, 2023 | 289 | |
Hydro: Higher due to higher merchant revenues driven by higher volumes, partially offset by lower spot power prices and lower environmental and tax attributes revenues. | 1 | |
Wind and Solar: Higher due to environmental and tax attributes revenues from the sale of production tax credits from Horizon Hill and White Rock West and East wind facilities to taxable US counterparties, higher revenues driven by increased production from the addition of the White Rock and Horizon Hill wind facilities and the return to service of the Kent Hills wind facilities, partially offset by unfavourable merchant power prices in Alberta. | 13 | |
Gas: Lower due to lower realized power prices in Alberta, an increase in the carbon price in Canada, and higher OM&A driven by higher maintenance costs at the South Hedland facility, partially offset by higher volume of favourable hedging positions settled, positive contribution from the Heartland gas facilities and lower capacity payments. | (25) | |
Energy Transition: Higher due to lower fuel and purchased power costs, partially offset by increased economic dispatch due to lower market prices. | 2 | |
Energy Marketing: Higher due to favourable market volatility and the timing of realized settled trades during 2024 compared to the same period in 2023. | 13 | |
Corporate: Lower due to higher spend to support strategic and growth initiatives. | (8) | |
Adjusted EBITDA(1) for the three months ended Dec. 31, 2024 | 285 | |
(1)Adjusted EBITDA is not defined and has no standardized meaning under IFRS and may not be comparable to similar measures presented by other issuers. Refer to the Additional IFRS Measures and Non-IFRS Measures section of this MD&A.
FCF for the three months ended Dec. 31, 2024, decreased by $73 million, or 60 per cent, compared to the same period in 2023.
| | | | | |
| Three months ended Dec. 31 |
| FCF for the three months ended Dec. 31, 2023 | 121 | |
| Lower adjusted EBITDA due to the items noted above. | (4) | |
Higher net interest expense(1) due to lower capitalized interest as a result of capital projects being completed in the first half of 2024 and lower interest income due to lower cash balances in 2024. | (23) | |
| Higher current income tax expense due to the full utilization of Canadian non-capital loss carryforwards in 2023, partially offset by a higher loss before income taxes in the current period compared to the same period in 2023. | (25) | |
| Lower sustaining capital due to lower planned maintenance at the Alberta gas facilities, partially offset by higher planned maintenance at the Sarnia cogeneration facility and Alberta hydro facilities. | 7 | |
| Higher dividends paid on preferred shares. | (1) | |
| Lower distributions paid to subsidiaries' non-controlling interests due to lower TA Cogen net earnings. | 13 | |
| Higher provisions accrued in the current year compared to the prior year resulting in higher FCF. | 3 | |
| Higher realized foreign exchange losses compared to realized foreign exchange gains in the comparative period. | (29) | |
Other(2) | (14) | |
FCF(2)(3) for the three months ended Dec. 31, 2024 | 48 | |
(1)Net interest expense includes interest expense less interest income and excludes non-cash items like financing amortization and accretion.
(2)Refer to the Reconciliation of Cash Flow from Operations to FFO and FCF section tables in this MD&A for more details.
(3)FCF is not defined and has no standardized meaning under IFRS and may not be comparable to similar measures presented by other issuers. Refer to the Additional IFRS Measures and Non-IFRS Measures section of this MD&A.
| | | | | | | | |
| TransAlta Corporation | 2024 Integrated Report | M39 |
Alberta Electricity Portfolio
The following table provides information for the Company's Alberta electricity portfolio for the three months ended Dec. 31:
| | | | | | | | | | | | | | | | | | | | | | | | | | | | | | | | | | | | | |
| 2024 | 2023 | |
| Three months ended Dec. 31 | Hydro | Wind & Solar | Gas | Energy Transition | Total | Hydro | Wind & Solar | Gas | Energy Transition | Total | | | | | |
| Gross installed capacity (MW) | 834 | | 764 | | 3,650 | | — | | 5,248 | | 834 | | 766 | | 1,960 | | — | | 3,560 | | | | | | |
Total production(1) (GWh) | 367 | | 619 | | 2,164 | | — | | 3,150 | | 278 | | 745 | | 1,966 | | — | | 2,989 | | | | | | |
| Contract production (GWh) | — | | 257 | | 837 | | — | | 1,094 | | — | | 353 | | 438 | | — | | 791 | | | | | | |
| Merchant production (GWh) | 367 | | 362 | | 1,327 | | — | | 2,056 | | 278 | | 391 | | 1,528 | | — | | 2,197 | | | | | | |
| Purchased power (GWh) | — | | — | | (286) | | — | | (286) | | — | | — | | (50) | | — | | (50) | | | | | | |
| Hedged production (GWh) | 205 | | 44 | | 2,388 | | | 2,637 | | 58 | | 82 | | 1,684 | | — | | 1,824 | | | | | | |
| Production contracted or hedged (%) | 56 | % | 49 | % | 149 | % | — | % | 118 | % | 21 | % | 58 | % | 108 | % | — | % | 87 | % | | | | | |
| Hedged production as a percentage of gross installed capacity (%) | 11 | % | 3 | % | 30 | % | — | % | 23 | % | 3 | % | 5 | % | 39 | % | — | % | 23 | % | | | | | |
| | | | | | | | | | | | | | | |
Revenues(2) ($) | 72 | | 24 | | 235 | | 1 | | 332 | | 71 | | 38 | | 221 | | 1 | | 331 | | | | | | |
| Fuel ($) | 1 | | 3 | | 86 | | 1 | | 91 | | 3 | | 5 | | 76 | | — | | 84 | | | | | | |
| Purchased power ($) | 1 | | 1 | | 14 | | — | | 16 | | 2 | | — | | 5 | | — | | 7 | | | | | | |
Carbon compliance(3)($) | — | | — | | 34 | | — | | 34 | | — | | — | | 25 | | — | | 25 | | | | | | |
Gross margin(2) ($) | 70 | | 20 | | 101 | | — | | 191 | | 66 | | 33 | | 115 | | 1 | | 215 | | | | | | |
(1)Total production includes contract production and merchant production.
(2)Revenues have been adjusted to exclude the impact of unrealized mark-to-market gains or losses and to include realized gains and losses on closed exchange positions. Alberta Hydro revenues for the three months ended Dec. 31, 2024 exclude the impact of Brazeau penalties.
(3)The intercompany sales of emission credits from the Hydro segment to the Gas segment is eliminated on consolidation in the Corporate segment. Refer to the Additional IFRS Measures and Non-IFRS Measures section of this MD&A.
Total production for the Alberta portfolio for the three months ended Dec. 31, 2024, was 3,150 GWh, compared to 2,989 GWh for the same period in 2023. The increase of 161 GWh, or five per cent, was primarily due to:
•Higher production from the Alberta Gas assets due to the Heartland acquisition;
•Higher production from the Alberta Hydro Assets due to significant water conservation during the fourth quarter of 2023; partially offset by
•Higher economic dispatch for the Alberta gas facilities; and
•Lower production in the Wind and Solar segment due to lower wind resource.
Hedged production for the Alberta portfolio for the three months ended Dec. 31, 2024, increased compared to the same period in 2023. In anticipation of the risk of lower prices in 2024, the Company deployed a defensive strategy to increase financial hedges for the merchant portfolio at attractive margins. Realized gains and losses on financial hedges are included in revenues in the table above.
Gross margin for the Alberta portfolio for the three months ended Dec. 31, 2024, was $191 million, compared to $215 million in 2023. The decrease of $24 million, or eleven per cent, was primarily due to:
•Lower Alberta spot power prices;
•Higher carbon compliance costs due to increase in the carbon price from $65 per tonne in 2023 to $80 per tonne in 2024; and
•Higher purchased power due to the contractual requirement to fulfill physical power trades; partially offset by
•Higher gains realized on financial hedges settled in the period.
| | | | | | | | |
| M40 | TransAlta Corporation | 2024 Integrated Report |
The following table provides information for the Company's Alberta electricity portfolio for the three months ended Dec. 31:
| | | | | | | | | | | |
| | | |
| Three months ended Dec. 31 | | | 2024 | 2023 | |
| Alberta Market | | | | | |
| Spot power price average per MWh | | | 52 | | 82 | | |
| Natural gas price (AECO) per GJ | | | 1.42 | | 2.19 | | |
| Carbon compliance price per tonne | | | 80 | | 65 | | |
| Alberta Portfolio Results | | | | | |
Realized merchant power price per MWh(1) | | | 110 | | 117 | | |
| Hydro energy spot power price per MWh | | | 78 | | 107 | | |
| Hydro ancillary services price per MWh | | | 39 | | 37 | | |
| Wind energy spot power price per MWh | | | 26 | | 49 | | |
| Gas spot power price per MWh | | | 75 | | 101 | | |
Hedged power price average per MWh(2) | | | 80 | | 90 | | |
| Hedged volume (GWh) | | | 2,637 | | 1,824 | | |
Fuel cost per MWh(3) | | | 42 | | 43 | | |
Carbon compliance cost per MWh(4) | | | 16 | | 13 | | |
(1)Realized merchant power price for the Alberta electricity portfolio is the average price realized as a result of the Company's merchant power sales and portfolio optimization activities (excluding assets under long-term contract and ancillary revenues) divided by total merchant GWh produced.
(2)Hedged power price average per MWh is calculated as the average sales price for all hedges and direct customer sales during the reporting period.
(3)Fuel cost per MWh is calculated on production from carbon-emitting generation in the Gas and Energy Transition segments.
(4)Carbon compliance cost per MWh is calculated on production from carbon-emitting generation, as well as power purchased, in the Gas and Energy Transition segments.
The average spot power price per MWh for the Alberta portfolio for the three months ended Dec. 31, 2024, decreased from $82 per MWh in 2023 to $52 per MWh in 2024, primarily due to:
•Higher generation from the addition of increased supply of new renewables and combined-cycle gas facilities into the market compared to the prior period; and
•Lower natural gas prices.
The realized merchant power price per MWh of production for the Alberta portfolio for the three months ended Dec. 31, 2024, although significantly higher than average spot power prices during the year, decreased by $7 per MWh compared to the same period in 2023, primarily due to:
•Lower average spot power prices as explained above; and
•Lower hedge prices compared to the prior year.
Fuel cost per MWh for the three months ended Dec. 31, 2024, decreased by $1 per MWh, compared to the same period in 2023, primarily due to lower natural gas prices.
Carbon compliance cost per MWh of production for the Alberta portfolio for the three months ended Dec. 31, 2024, increased by $3 per MWh, compared to 2023, primarily due to the carbon compliance price increase from $65 per tonne in 2023 to $80 per tonne in 2024.
| | | | | | | | |
| TransAlta Corporation | 2024 Integrated Report | M41 |
Selected Quarterly Information
Our results are seasonal due to the nature of the electricity market and related fuel costs. Higher maintenance costs are often incurred in the spring and fall when electricity prices are expected to be lower, and electricity prices generally increase in the peak winter and summer months in our main markets due to increased heating and cooling loads. Margins are also typically impacted in the second quarter due to the volume of hydro production resulting
from spring runoff and rainfall in the Pacific Northwest, which impacts production at Centralia. Typically, hydroelectric facilities generate most of their electricity and revenues during the spring months when melting snow starts feeding watersheds and rivers. Inversely, wind speeds are historically greater during the cold winter months and lower in the warm summer months.
| | | | | | | | | | | | | | |
| | Q1 2024 | Q2 2024 | Q3 2024 | Q4 2024 |
| Revenues | 947 | | 582 | | 638 | | 678 | |
| Carbon compliance | 40 | | (8) | | 41 | | 39 | |
| OM&A | 134 | | 144 | | 143 | | 234 | |
| Depreciation and amortization | 124 | | 131 | | 133 | | 143 | |
| | | | |
| Earnings (loss) before income taxes | 267 | | 94 | | 9 | | (51) | |
| | | | |
| | | | |
| Net earnings (loss) attributable to common shareholders | 222 | | 56 | | (36) | | (65) | |
Net earnings (loss) per share attributable to common shareholders, basic and diluted(1) | 0.72 | | 0.18 | | (0.12) | | (0.22) | |
| Cash flow from operating activities | 244 | | 108 | | 229 | | 215 | |
| | | | |
| | | | | | | | | | | | | | |
| Q1 2023 | Q2 2023 | Q3 2023 | Q4 2023 |
| Revenues | 1,089 | | 625 | | 1,017 | | 624 | |
| Carbon compliance | 32 | | 25 | | 28 | | 27 | |
| OM&A | 124 | | 134 | | 131 | | 150 | |
| Depreciation and amortization | 176 | | 173 | | 140 | | 132 | |
| Earnings (loss) before income taxes | 383 | | 79 | | 453 | | (35) | |
| Net earnings (loss) attributable to common shareholders | 294 | | 62 | | 372 | | (84) | |
Net earnings (loss) per share attributable to common shareholders, basic and diluted(1) | 1.10 | | 0.23 | | 1.41 | | (0.27) | |
| Cash flow from operating activities | 462 | | 11 | | 681 | | 310 | |
(1)Basic and diluted earnings (loss) per share attributable to common shareholders is calculated in each period using the basic and diluted weighted average common shares outstanding during the period, respectively. As a result, the sum of the earnings (loss) per share for the four quarters making up the calendar year may sometimes differ from the annual earnings (loss) per share.
Operating results have been impacted by the following events:
•Acquisition of Heartland on Dec. 4, 2024. Refer to the Significant and Subsequent events section of this MD&A for more details; and
•Commissioning of the Garden Plain wind facility in the third quarter of 2023, the Northern Goldfields solar facilities in the fourth quarter of 2023, the White Rock West wind facility and the Mount Keith 132kV expansion in the first quarter of 2024 and the White Rock East and Horizon Hill wind facilities in the second quarter of 2024.
In addition to the items described above, revenues have been impacted by:
•Higher production in each quarter of 2024, compared to the same periods in the prior year;
•The effects of unrealized mark-to-market gains and losses from hedging and derivative positions; and
•Lower realized pricing in each quarter of 2024, compared to the same periods in the prior years impacted by additions of new natural gas, wind and solar supply in the Alberta market in 2024.
Carbon compliance costs have been impacted by:
•Higher costs of carbon per tonne. In 2024, the cost of carbon was $80 per tonne as compared to $65 per tonne in 2023; and
•In the second quarter of 2024, carbon compliance costs were reduced by using internally generated and externally purchased emission credits to settle a portion of the 2023 GHG obligation.
| | | | | | | | |
| M42 | TransAlta Corporation | 2024 Integrated Report |
OM&A has been impacted by:
•Higher costs stemming from planning and design work on a planned upgrade to our ERP system in all quarters of 2024;
•Higher spend to support strategic and growth initiatives in all quarters of 2024 compared to same period in prior year;
•Return to service of Kent Hills wind facilities and the addition of Horizon Hill and White Rock wind facilities.
•In the fourth quarter of 2024 Heartland acquisition-related transaction and restructuring costs, mainly comprising severance, legal and consultant fees; and
•In the fourth quarter of 2024 penalties assessed by the Alberta Market Surveillance Administrator for self-reported contraventions pertaining to Hydro ancillary services provided during 2021 and 2022.
Depreciation has been impacted by:
•Revisions in the useful lives of certain facilities that occurred in the third quarters of 2023 and 2024, partially offset by
•An increase in depreciation due to the addition of White Rock wind facilities in the first quarter of 2024, Horizon Hill wind facilities in the second quarter of 2024.
Higher asset impairment charges due to:
•Development projects that are no longer proceeding in all four quarters of 2024;
•Increase in decommissioning provisions for retired assets due to changes in estimated cash flows in the third quarter of 2023 and 2024; and
•changes in expected timing of restoration expenditures occurring, recognized in the third quarter of 2023 and the third and fourth quarters of 2024.
Earnings (loss) before income taxes has been impacted by the following:
•The items described above; and
•Higher interest expense due to lower capitalized interest during 2024 as compared to 2023 resulting from lower capital activity in 2024 compared to 2023.
Net earnings (loss) attributable to common shareholders has been impacted by fluctuations in current and deferred tax expense with earnings before tax across the quarters.
Cash flow from operating activities has been impacted by the following:
•The items described above;
•Unfavourable changes in non-cash operating working capital balances in the last four quarters of 2024, compared to the same periods in the prior year due to unfavourable changes in accounts payable and accrued liabilities due to lower capital spend and lower cost accruals, partially offset by lower collateral provided due to lower market volatility;
•Higher unrealized foreign exchange gains in the last four quarters of 2024 compared to the same periods in 2023; and
•Higher provisions and other non-cash items.
Strategic Priorities
The Company remains focused on investing in electricity solutions that meet the evolving needs of customers and communities. We take a balanced, prudent and disciplined approach to capital allocation, ensuring long-term value creation for shareholders. Our strategy prioritizes generating meaningful, risk-adjusted returns by optimizing our legacy thermal assets, operating our diverse fleet of renewable facilities, our exceptional marketing and trading capabilities, and expanding our generating portfolio through the addition of contracted clean energy assets and selective gas assets. Given our skill set, competitive advantages and market positioning, we are well-positioned to capture significant opportunities in our core markets of Canada, the United States and Western Australia.
The Company continues to make strong progress on key strategic priorities, ensuring the business remains resilient, growth-focused and aligned with the evolving energy landscape.
| | | | | | | | |
| TransAlta Corporation | 2024 Integrated Report | M43 |
Optimize Alberta Portfolio
In Alberta, the Company continues to proactively deploy hedging strategies, to mitigate the impact of lower merchant power prices, along with optimization activities. The acquisition of Heartland Generation has significantly strengthened our Alberta portfolio, adding 1,747 MW of flexible capacity, including contracted cogeneration, peaking generation and transmission capacity. Of note, the acquisition added 290 MW of peaking gas capacity, which will be optimized within our larger portfolio to address increasing intermittency in Alberta.
The Company is maximizing the value of its hydro fleet by enhancing its operational capabilities and flexibility. We are also advancing initiatives to maximize the value of our existing thermal assets and meet the growing demand for affordable and reliable power.
Execute Growth Plan
In 2024, significant progress was made on growth initiatives. Early in the year we successfully completed our two Oklahoma wind facilities: the 302 MW White Rock wind facilities and the 202 MW Horizon Hill wind facility. We also achieved commercial operations for our Mount Keith Transmission Expansion project. These additions, along with the fully rehabilitated Kent Hills facilities are expected to contribute over $175 million in EBITDA annually.
Our growth plan is guided by a technology-agnostic approach, focusing on our core operating jurisdictions and clear target customer segments within them.
Realize the Value of Legacy Generating Facilities
The Company is seeing considerable opportunities to support the energy transition with sophisticated, reliable and affordable power solutions in our core operating jurisdictions. Particularly, at our legacy thermal sites in Alberta and Washington State, where we are actively pursuing accretive opportunities with existing and prospective customers. We believe that these sites hold significant value and provide unique advantages to customers.
Maintain Financial Strength and Capital Discipline
The Company maintains a strong financial position, with $1.6 billion in liquidity as of Dec. 31, 2024, and a disciplined approach to capital allocation. The Company balances investments in growth, debt repayments and returns to shareholders through share repurchases and dividend payments. Reflecting confidence in the business, the annual common share dividend was increased by eight per cent to $0.26 per share, our sixth consecutive dividend increase, effective July 1, 2025. The Company also announced an ongoing commitment to its share repurchase plan, allowing the Company to repurchase up to $100 million in common shares. Together, these actions represent a return of up to 35 per cent of the midpoint of 2025 free cash flow guidance to shareholders.
Define Next Generation of Power Solutions
The Company has been at the forefront of innovation in the power-generation sector since the early 1900s when we developed our first hydro assets. We continue to make progress on our identification of the next generation of energy solutions that will be needed to power our customers’ needs in an efficient, reliable and affordable manner. Refer to the Enabling Innovation and Technology Adoption section of the MD&A for further discussion.
Lead in ESG and Market Policy Development
The Company is an active participant in policy development in all key markets in which we operate. Most notably, we are actively engaging with the Government of Alberta and the Alberta Electric System Operator on Alberta's restructured energy market, which is intended to deliver the objectives of reliability, affordability, and decarbonization by 2050 for the province. TransAlta is committed to actively engaging in the AESO's consultation process, to support the development of an investable market structure that can responsibly achieve a sustainable grid in a manner that ensures reliability and affordability for Albertans.
| | | | | | | | |
| M44 | TransAlta Corporation | 2024 Integrated Report |
Growth
Throughout 2024 we refined our development pipeline to reflect our views on changes in regulation, interconnection timelines and with a focus on maximizing returns and meeting the evolving needs of our customers. We also incorporated additional redevelopment opportunities at our legacy thermal facilities. We will continue to take a disciplined approach to evaluating project economics. Our pipeline includes 280 MW of advanced-stage development projects along with 3,330 to 5,230 MW of projects in earlier stages of development. We are focused primarily on redevelopment opportunities at our legacy sites in addition
to evaluating greenfield and merger and acquisition prospects in Alberta, Western Australia and the western United States.
Advanced-Stage Development
These projects have detailed engineering, advanced positions in the interconnection queue and/or are progressing offtake opportunities. Projects in advanced-stage development do not have final approval from the Board of Directors at time of reporting.
The following table shows the pipeline of future growth projects in advanced-stage development:
| | | | | | | | | | | | | | | | |
| Project | Type | Region | Target investment date | MW | | |
| Tempest | Wind | Alberta | On hold | 100 | | | |
| | | | | | |
| WaterCharger | Battery Storage | Alberta | On hold | 180 | | | |
| | | | | | |
| | | | | | |
| | | | | | |
| | | | | | | | |
| TransAlta Corporation | 2024 Integrated Report | M45 |
Early-Stage Development
These projects are in the early stages and may or may not move ahead. Generally, these projects will have:
•Collected meteorological data;
•Begun securing land control;
•Started environmental studies;
•Confirmed appropriate access to transmission; and
•Started preliminary permitting and other regulatory approval processes.
The following table shows the pipeline of future growth projects currently under early-stage development:
| | | | | | | | | | | | | | |
| Project | Type | Region | Potential investment date(1) | MW |
| | | | |
| Canada | | | | |
| | | | |
| New Brunswick Battery | Battery | New Brunswick | 2027+ | 10 | |
| SunHills Solar | Solar | Alberta | 2027+ | 170 | |
| | | | |
Tent Mountain Pumped Storage(2) | Hydro | Alberta | 2029 | | 192 | |
| Provost | Wind | Alberta | 2027+ | 170 | |
| Red Rock | Wind | Alberta | 2027+ | 100 | |
| | | | |
| | | | |
| Antelope Coulee | Wind | Saskatchewan | 2027+ | 200 | |
| Other Canadian Opportunities | Wind | Various | 2026+ | 374 | |
| Brazeau Pumped Hydro | Hydro | Alberta | TBD | 300-900 |
Alberta Thermal Redevelopment(3) | Various | Alberta | 2027+ | 400-1200 |
| | Total | | 1,916 - 3,316 |
| United States | | | | |
| | | | |
| | | | |
| | | | |
| | | | |
| | | | |
| Square Top | Solar | Oklahoma | 2026 | | 195 | |
| Old Town | Wind | Illinois | 2026 | | 185 | |
| | | | |
| | | | |
| | | | |
| | | | |
| Trapper Valley | Wind | Wyoming | 2027+ | 225 | |
| | | | |
| | | | |
| Other U.S. opportunities | Wind | Various | 2026+ | 144 | |
Centralia site redevelopment(3) | Various | Washington | 2025+ | 500-1000 |
| | Total | | 1,249 - 1,749 |
| Australia | | | | |
| Boodarie Solar | Solar | Western Australia | 2025 | | 50 | |
| | | | |
| Other Australian opportunities | Gas, Solar, Transmission | Western Australia | 2025+ | 115 | |
| | Total | | 165 | |
| Canada, United States and Australia | | Total | | 3,330 - 5,230 |
(1)Potential investment date is to be determined (TBD).
(2)This represents the Company's 60 per cent interest in Tent Mountain Renewable Energy Complex.
(3)The Company is currently evaluating redevelopment opportunities at these brownfield sites.
| | | | | | | | |
| M46 | TransAlta Corporation | 2024 Integrated Report |
Projects under Construction
Projects under construction will be financed through existing liquidity in the near term.
We will continue to explore permanent financing solutions on an asset-by-asset basis. We are continually monitoring the timing and costs of our projects under construction.
The following projects have been approved by the Board of Directors, have executed PPAs and are currently under construction or in the process of being commissioned:
| | | | | | | | | | | | | | | | | | | | | | | | | | | | | | | | | | | | | | |
| | | | Total project (millions) | | | | | |
| Project | Type | Region | MW | Estimated
spend | Spent to
date | Target
completion
date | PPA Term (years) | Average annual EBITDA(1) range | | Status |
| | | | | | | | | | | | |
| | | | | | | | | | | | |
| | | | | | | | | | | |
| | | | | | | | | | | | |
| | | | | | | | | | | | |
| Western Australia | | | | | | | | | | | |
| | | | | | | | | | | | |
| Mount Keith West network upgrade | Transmission | WA | n/a | AU$37 | | — | AU$40 | AU$19 | Q4 2025 | 14 | AU$6 - AU$7 | | •Engineering completed •Site works commenced •On track to be completed on schedule |
Total(2) | | | n/a | $34 | — | $36 | | $17 | | | $6 - $7 | | |
(1)This item is not defined and has no standardized meaning under IFRS and is forward-looking. It may not be comparable to similar measures presented by other issuers. Refer to the Additional IFRS Measures and Non-IFRS Measures section of this MD&A for further discussion.
(2)Total expected spending and average annual EBITDA were converted using a Canadian dollar forward exchange rate for 2024. Spend to date was converted using the period-end closing rate.
| | | | | | | | |
| TransAlta Corporation | 2024 Integrated Report | M47 |
Financial Position
The following table highlights significant changes in the Consolidated Statements of Financial Position from Dec. 31, 2023, to Dec. 31, 2024:
| | | | | | | | | | | |
| Dec. 31, 2024 | Dec. 31, 2023 | Increase/(decrease) |
| Assets | | | |
| Current assets | | | |
| Cash and cash equivalents | 337 | | 348 | | (11) | |
| | | |
| Trade and other receivables | 767 | | 807 | | (40) | |
| Risk management assets | 318 | | 151 | | 167 | |
| | | |
| Assets held for sale | 80 | | — | | 80 | |
Other current assets(1) | 271 | | 274 | | (3) | |
| Total current assets | 1,773 | | 1,580 | | 193 | |
| | | |
| Non-current assets | | | |
| Risk management assets | 93 | | 52 | | 41 | |
| Investments | 159 | | 138 | | 21 | |
| Property, plant and equipment, net | 6,020 | | 5,714 | | 306 | |
| Intangible assets, net | 281 | | 223 | | 58 | |
| Deferred income tax assets | 52 | | 21 | | 31 | |
| Goodwill | 517 | | 464 | | 53 | |
| Long-term portion of finance lease receivable | 305 | | 171 | | 134 | |
Other non-current assets(2) | 299 | | 296 | | 3 | |
| Total non-current assets | 7,726 | | 7,079 | | 647 | |
| Total assets | 9,499 | | 8,659 | | 840 | |
| | | |
| Liabilities | | | |
| Current liabilities | | | |
| Accounts payable, accrued liabilities and other current liabilities | 756 | | 809 | | (53) | |
| | | |
| Risk management liabilities | 277 | | 314 | | (37) | |
| Decommissioning and other provisions (current) | 83 | | 35 | | 48 | |
| | | |
| | | |
| Credit facilities, long-term debt and lease liabilities | 572 | | 532 | | 40 | |
| | | |
| | | |
| Exchangeable securities | 750 | | — | | 750 | |
| Contingent consideration payable | 81 | | — | | 81 | |
Other current liabilities(3) | 50 | | 52 | | (2) | |
| Total current liabilities | 2,569 | | 1,742 | | 827 | |
| | | |
| Non-current liabilities | | | |
| Credit facilities, long-term debt and lease liabilities | 3,236 | | 2,934 | | 302 | |
| Exchangeable securities | — | | 744 | | (744) | |
| Decommissioning and other provisions (long-term) | 850 | | 654 | | 196 | |
| Risk management liabilities (long-term) | 305 | | 274 | | 31 | |
| Defined benefit obligation and other long-term liabilities | 202 | | 251 | | (49) | |
| Deferred income tax liabilities | 470 | | 386 | | 84 | |
Other non-current liabilities(4) | 24 | | 10 | | 14 | |
| Total non-current liabilities | 5,087 | | 5,253 | | (166) | |
| Total liabilities | 7,656 | | 6,995 | | 661 | |
| | | |
| Equity | | | |
| Equity attributable to shareholders | 1,746 | | 1,537 | | 209 | |
| Non-controlling interests | 97 | | 127 | | (30) | |
| Total equity | 1,843 | | 1,664 | | 179 | |
| Total liabilities and equity | 9,499 | | 8,659 | | 840 | |
(1)Includes restricted cash, inventory and prepaid expenses and other.
(2)Includes right-of-use assets and other assets.
(3)Includes bank overdraft and dividends payable.
(4)Includes contract liabilities.
| | | | | | | | |
| M48 | TransAlta Corporation | 2024 Integrated Report |
Significant changes in Company's Consolidated Statements of Financial Position were as follows:
On Dec. 4, 2024, the Company acquired Heartland. The Financial Position as at Dec. 31, 2024 includes the assets and liabilities of Heartland. Refer to note 4 of our consolidated financial statements for further details.
Working Capital
The deficit of current assets over current liabilities, including the current portion of long-term debt and lease liabilities, was $796 million as at Dec. 31, 2024 (Dec. 31, 2023 – deficit of current assets over current liabilities of $162 million). The deficit increased primarily as a result of the reclassification of the exchangeable securities to a current liability. The exchangeable securities are classified as current as their conversion option can be exercised at any time after Dec. 31, 2024 at Brookfield's option, although there is no obligation to deliver cash equivalent resources and the holder cannot call for repayment. Refer to the Accounting Changes section of this MD&A for more details.
Current assets increased by $193 million to $1,773 million as at Dec. 31, 2024, from $1,580 million as at Dec. 31, 2023, primarily due to:
•Higher risk management assets mainly due to changes in market pricing across multiple markets as well as higher price forecasts;
•Addition of assets held for sale for the Planned Divestitures (refer to Significant and Subsequent events section); partially offset by
•Lower trade receivables, mainly due to timing of cash receipts and lower collateral provided in the Energy Marketing segment due to favourable changes in market prices, offset by an increase in trade and other receivables due to Heartland acquisition; and
•Lower cash and cash equivalents mainly due to lower cash flow from operating activities.
Current liabilities increased by $827 million from $1,742 million as at Dec. 31, 2023, to $2,569 million as at Dec. 31, 2024, mainly due to:
•The exchangeable securities being classified as current as described above;
•Contingent consideration payable related to the Planned Divestitures (refer to the Significant and Subsequent events section); and
•Higher current portion of decommissioning and other provisions due to the addition of balances from Heartland;
•Higher current portion of credit facilities, long-term debt and lease liabilities mainly due to additions of balances from Heartland; partially offset by
•Lower accounts payable, accrued liabilities and other current liabilities mainly due to lower cost accruals and lower capital spend, partially offset by the additions of accounts payable balances from Heartland acquisition and higher current income taxes payable; and
•Lower risk management liabilities due to changes in market pricing across multiple prices and contract settlements.
Non-Current Assets
Non-current assets as at Dec. 31, 2024, were $7,726 million, an increase of $647 million from $7,079 million as at Dec. 31, 2023, primarily due to:
•Higher property, plant and equipment (PP&E) resulting from $413 million of additions from Heartland recognized at acquisition and capital additions of $311 million mainly related to the construction of growth projects and planned major maintenance activities. The increase in PP&E additions was partially offset by depreciation of $516 million;
•Higher finance lease receivable related to the additions from Heartland and the Mount Keith 132kV finance lease receivable;
•Higher deferred income tax asset due to an increase in deductible temporary differences arising from the Heartland acquisition;
•Higher risk management assets due to favourable changes in market prices across multiple markets and addition of risk management assets from Heartland;
•Higher goodwill balance due to goodwill arising on Heartland acquisition;
•Higher intangibles mainly due to the addition of power sale contracts from Heartland; and
•Higher investments balance resulting from contributions and equity income from equity-accounted investments.
Non-Current Liabilities
Non-current liabilities as at Dec. 31, 2024 were $5,087 million, a decrease of $166 million from $5,253 million as at Dec. 31, 2023, mainly due to:
•The exchangeable securities being classified as current liabilities;
•Lower defined benefit obligations and other long-term liabilities mainly due to a decrease in retail power contract liabilities resulting from amortization based on volumes delivered; partially offset by
•Increase in credit facilities, long-term debt and lease liabilities due to the addition of Heartland credit facilities and an increase in the cash drawings under the syndicated credit facility;
| | | | | | | | |
| TransAlta Corporation | 2024 Integrated Report | M49 |
•Increase in decommissioning and other provisions due to additions of generating facilities from Heartland acquisition, revisions in discounts rates and estimated decommissioning costs and commissioning of Horizon Hill and White Rock wind facilities;
•Higher deferred income tax liabilities due to an increase in temporary taxable differences arising from the Heartland acquisition; and
•Higher risk management liabilities due to forward price changes and volatility in market pricing across multiple markets.
Total Equity
As at Dec. 31, 2024, the increase in total equity of $179 million was due to:
•Net earnings of $239 million; and
•Net gains on derivatives from cash flow hedges of $194 million; partially offset by
•Share repurchases under the NCIB of $143 million;
•Dividends declared on common and preferred shares of $123 million; and
•Distributions to non-controlling interests of $40 million.
Financial Capital
The Company is focused on maintaining a strong balance sheet and financial position to ensure access to sufficient financial capital. Credit ratings provide information relating to the Company's financing costs, liquidity and operations, and affect the Company's ability to obtain short and long-term financing and/or the cost of such financing. Maintaining a strong balance sheet also allows the Company to enter into contracts with a variety of counterparties on terms and prices that are favourable to the Company’s financial results and provide TransAlta with better access to capital markets through commodity and credit cycles.
In 2024, Moody's reaffirmed the Company's long-term rating of Ba1 with a stable outlook. Morningstar DBRS reaffirmed the Company's issuer rating and unsecured debt/medium-term notes rating of BBB (low) and the Company's preferred shares rating of Pfd-3 (low), all with a stable outlook. In addition, S&P Global Ratings reaffirmed the Company's senior unsecured debt rating and issuer credit rating of BB+ with a stable outlook. Risks associated with our credit ratings are discussed in the Governance and Risk Management section of this MD&A.
| | | | | | | | |
| M50 | TransAlta Corporation | 2024 Integrated Report |
Capital Structure
Our capital structure consists of the following components as shown below:
| | | | | | | | | | | | | | | | | | | | | | | | | | |
| 2024 | | 2023 | 2022 |
| $ | % | $ | % | $ | % |
| | | | | | | | |
| Net senior unsecured debt | | | | | | | | |
| Recourse debt - CAD debentures | 251 | | | 4 | | | 251 | | 5 | | 251 | | 5 | |
| Recourse debt - U.S. senior notes | 995 | | | 16 | | | 911 | | 17 | | 934 | | 18 | |
| | | | | | | | |
| Credit facilities | 543 | | | 9 | | | 397 | | 7 | | 428 | | 9 | |
| Other | — | | | — | | | — | | — | | 1 | | — | |
Less: cash and cash equivalents(1) | (336) | | | (6) | | | (345) | | (6) | | (1,118) | | (21) | |
Less: other cash and liquid assets(2) | (7) | | | — | | | 5 | | — | | (3) | | — | |
| Net senior unsecured debt | 1,446 | | | 23 | | | 1,219 | | 23 | | 493 | 11 | |
| Other debt liabilities | | | | | | | | |
| Exchangeable debentures | 350 | | | 6 | | | 344 | | 6 | | 339 | | 6 | |
| Non-recourse debt | | | | | | | | |
| TAPC Holdings LP bond | 75 | | | 1 | | | 85 | | 1 | | 94 | | 2 | |
| | | | | | | | |
| | | | | | | | |
| | | | | | | | |
| | | | | | | | |
| Pingston bond | 39 | | | 1 | | | 39 | | 1 | | 45 | | 1 | |
| Melancthon Wolfe Wind bond | 133 | | | 2 | | | 168 | | 3 | | 202 | | 4 | |
| New Richmond Wind bond | 93 | | | 2 | | | 103 | | 2 | | 112 | | 2 | |
| Kent Hills Wind bond | 179 | | | 3 | | | 193 | | 3 | | 206 | | 4 | |
| Windrise Wind bond | 157 | | | 3 | | | 164 | | 3 | | 170 | | 3 | |
| South Hedland non-recourse debt | 675 | | | 11 | | | 691 | | 13 | | 711 | | 14 | |
| Heartland term facility | 224 | | | 4 | | | — | | — | | — | | — | |
| OCP Bond | 192 | | | 3 | | | 217 | | 4 | | 241 | | 4 | |
OCP LP restricted cash(3) | (17) | | | — | | | (17) | | — | | (17) | | — | |
| U.S. tax equity financing | 101 | | | 1 | | | 104 | | 1 | | 123 | | 2 | |
| | | | | | | | |
| Lease liabilities | 151 | | | 2 | | | 143 | | 3 | | 135 | | 2 | |
| | | | | | | | |
Total consolidated net debt(4)(5)(6) | 3,798 | | | 62 | | | 3,453 | | 63 | | 2,854 | | 55 | |
Exchangeable preferred securities(6) | 400 | | | 7 | | | 400 | | 7 | | 400 | | 7 | |
| Equity attributable to shareholders | | | | | | | | |
| Common shares | 3,179 | | | 53 | | | 3,285 | | 60 | | 2,863 | | 54 | |
| Preferred shares | 942 | | | 16 | | | 942 | | 17 | | 942 | | 18 | |
| Contributed surplus, deficit and accumulated other comprehensive loss | (2,375) | | | (40) | | | (2,690) | | (49) | | (2,695) | | (51) | |
| Non-controlling interests | 97 | | | 2 | | | 127 | | 2 | | 879 | | 17 | |
| Total capital | 6,041 | | | 100 | | | 5,517 | | 100 | | 5,243 | | 100 | |
(1)Cash and cash equivalents is net of bank overdraft.
(2)Includes the fair value of economic and designated hedging instruments on debt, as the carrying value of the related debt is impacted by changes in foreign exchange rates.
(3)Principal portion of the TransAlta OCP LP restricted cash related to the TransAlta OCP LP bonds as this cash is restricted specifically to repay outstanding debt.
(4)These items are not defined and have no standardized meaning under IFRS and may not be comparable to similar measures presented by other issuers. Refer to the Additional IFRS Measures and Non-IFRS Measures section of this MD&A for further discussion, including reconciliations to measures calculated in accordance with IFRS.
(5)The tax equity financing for the Skookumchuck wind facility, an equity-accounted joint venture, is not represented in these amounts.
(6)The total consolidated net debt excludes the exchangeable preferred securities as they are considered equity with dividend payments for credit purposes.
| | | | | | | | |
| TransAlta Corporation | 2024 Integrated Report | M51 |
We have enhanced liquidity and shareholder value through the following:
2024
•Renewed the $400 million Term Facility with the maturity extended by one year to September 2025;
•Extended the $1.9 billion syndicated credit facility and $240 million bilateral credit facilities by one year to June 2028 and June 2026, respectively;
•Purchased and cancelled 13,467,400 common shares at an average price of $10.59 per share through our NCIB program, for a total cost of $143 million; and
•Assumed new credit facilities and letter of credit facilities as part of the Heartland acquisition.
2023
•Extended the committed syndicated credit facility by one year to June 30, 2027, and the committed bilateral credit facilities by one year to June 30, 2025;
•Refinanced the $45 million Pingston non-recourse bond due in 2023 with a non-recourse bond for approximately $39 million, with a fixed interest rate of 6.145 per cent per annum, payable semi-annually, and maturing on May 8, 2043; and
•Purchased and cancelled 7,537,500 common shares at an average price of $11.49 per share through our NCIB program, for a total cost of $87 million.
2022
•Issued US$400 million Senior Green Bonds, with a fixed coupon rate of 7.75 per cent per annum (effective interest rate of 5.98 per cent), due on Nov. 15, 2029;
•Repaid the US$400 million 4.50 per cent unsecured senior notes due 2022;
•Extended the committed syndicated credit facilities by one year to June 30, 2026, and the committed bilateral credit facilities by one year to June 30, 2024;
•Closed a two-year floating rate Term Facility with our banking syndicate for $400 million with a maturity date of Sept. 7, 2024. The Term Facility has interest rates that vary depending on the option selected (e.g., Canadian prime and bankers' acceptances); and
•Purchased and cancelled 4,342,300 common shares at an average price of $12.48 per share through our NCIB program, for a total cost of $54 million.
Credit Facilities
The Company's credit facilities are summarized in the table below:
| | | | | | | | | | | | | | | | | |
| As at Dec. 31, 2024 | | Utilized | | |
| Credit facilities | Facility
size | Outstanding letters of credit(1) | Cash drawings | Available
capacity | Maturity
date |
| Committed | | | | | |
| Syndicated credit facility | 1,950 | | 456 | | 145 | | 1,349 | | Q2 2028 |
| | | | | |
| Bilateral credit facilities | 240 | | 161 | | — | | 79 | | Q2 2026 |
| Term Facility | 400 | | — | | 400 | | — | | Q3 2025 |
| Heartland Credit Facilities | 276 | | 14 | | 224 | | 38 | | Q4 2027 |
| Heartland EDC letter of credit facility | 50 | | 14 | | — | | 36 | | Q1 2025 |
| Total Committed | 2,916 | | 645 | | 769 | | 1,502 | | |
| Non-Committed | | | | | |
| | | | | |
| Demand facilities | 400 | | 220 | | — | | 180 | | N/A |
| Total Non-Committed | 400 | | 220 | | — | | 180 | | |
(1)TransAlta has obligations to issue letters of credit and cash collateral to secure potential liabilities to certain parties, including those related to potential environmental obligations, commodity risk management and hedging activities, pension plan obligations, construction projects and purchase obligations. Letters of credit drawn against the non-committed facilities reduce available capacity under the committed syndicated credit facilities.
| | | | | | | | |
| M52 | TransAlta Corporation | 2024 Integrated Report |
In the second quarter of 2024, the $400 million Term Facility was renewed with the maturity extended by one year to September 2025. The $1,900 syndicated credit facility and $240 million bilateral credit facilities were also extended by one year to June 2028 and June 2026, respectively.
As part of the Heartland acquisition on Dec. 4, 2024, the Company assumed a $232 million drawn term facility and $25 million revolving facility with a syndicate of banks, (collectively Heartland Credit Facilities). At Dec. 31, 2024 the drawn term facility was $224 million. The $25 million revolving facility is undrawn and available for working capital and general corporate purposes. The maturity date for the Heartland Credit Facilities is Dec. 22, 2027. The Heartland Credit Facilities also include a $27 million debt service reserve letter of credit facility.
As part of the Heartland acquisition, the Company has access to a $50 million unsecured letter of credit facility with two Canadian banks, which is supported by a performance security guarantee from Export Development Canada (EDC).
The Heartland Credit Facilities are not subject to any maintenance or financial covenants but do contain certain covenants that limit Heartland’s ability to, among other things, incur additional indebtedness, create or permit liens to exist, make certain acquisitions or dispositions, make distributions and enter into certain hedging agreements.
Non-Recourse Debt and Other
The Melancthon Wolfe Wind LP, Pingston Power Inc., TAPC Holdings LP, New Richmond Wind LP, Kent Hills Wind LP, TEC Hedland Pty Ltd. and Windrise Wind LP non-recourse bonds, the TransAlta OCP LP bond, and Heartland Credit Facilities are subject to customary financing conditions and covenants that may restrict the Company’s ability to access funds generated by the facilities’ operations. Upon meeting certain distribution tests, typically performed once per quarter, the funds are able to be distributed by the subsidiary entities to their respective parent entity. These conditions include meeting a debt-service coverage ratio prior to distribution, which was met by these entities in the fourth quarter of 2024, with the exception of Kent Hills Wind LP. The funds in the Kent Hills Wind entity that have accumulated since the fourth quarter test will remain there until the next debt-service coverage ratio is calculated in the first quarter of 2025. At Dec. 31, 2024, $117 million (Dec. 31, 2023 – $79 million) of cash was subject to these financial restrictions.
At Dec. 31, 2024, $5 million (AU$6 million) of funds held by TEC Hedland Pty Ltd. are not able to be accessed by other corporate entities as the funds must be solely used by the project entities for the purpose of paying major maintenance costs.
Additionally, certain non-recourse bonds require that reserve accounts be established and funded through cash held on deposit and/or by providing letters of credit.
Between 2025 and 2027, the Company has a total of $1,066 million of scheduled debt repayments, including the $400 million maturity of the Term Facility, with the balance of $666 million related to scheduled non-recourse debt and tax equity repayments. The $750 million of exchangeable securities are exchangeable after Dec. 31, 2024.
U.S. Tax Equity Financing and Production Tax Credits
The Company owns equity interests in wind facilities that are eligible for tax incentives available for renewable energy facilities in the U.S. Current U.S., tax law allows qualified wind energy projects to receive production tax credits (PTCs) that are earned for each MWh of generation during the first 10 years of the project's operation. To monetize tax incentives, the Company has partnered with Tax Equity Investors (TEIs) who invest in these facilities in exchange for a share of the tax incentives and cash. TransAlta accounts for the TEIs' interest as long-term debt, where cash distributions and allocations of tax incentives to the TEIs primarily reduce the long-term debt balance. Upon the TEIs achieving an agreed-upon after-tax investment return, the project flip point occurs (Flip Point). Prior to achieving the Flip Point, the TEIs are allocated substantially all of the taxable attributes including PTCs produced and a proportion of cash. After the Flip Point has been reached, the Company retains substantially all of the cash and the taxable income (losses) generated by the facility.
In 2023, U.S. tax laws were amended to allow entities to monetize certain clean energy tax credits, including PTCs, by transferring (selling) them to third-party taxpayers, in exchange for cash consideration.
| | | | | | | | |
| TransAlta Corporation | 2024 Integrated Report | M53 |
The following table outlines information regarding the Company's tax equity financing arrangements with PTC eligibility:
| | | | | | | | | | | | | | | | | | | | | | |
| Facility | Commercial operation date | Expected Flip Point | Initial TEI investment ($US) | Expected annual PTC ($US) | | TEI allocation of cash distributions (pre-Flip Point) Undiscounted(1) ($US) | TEI allocation of taxable income and PTCs (pre-Flip Point) | |
| Lakeswind | 2014 | 2027 | 45 | | — | | | 7 | | 99 | % | |
| Big Level and Antrim | 2019 | 2029 | 126 | | 10 | | | 41 | | 99 | % | |
Skookumchuck(2) | 2020 | 2030 | 121 | | 11 | | | 17 | | 99 | % | |
| North Carolina Solar | 2021 | 2028 | 64 | | N/A | | 7 | | N/A | |
| | | | | | | | |
| | | | | | | | |
| | | | | | | | |
(1)Cumulative expected cash distributions from Dec. 31, 2024 to the expected Flip Point.
(2)The Company has a 49 per cent interest in the Skookumchuck wind facility, which is treated as an equity investment under IFRS and our proportionate share of the net earnings is reflected as equity income on the statement of earnings under IFRS.
Returns to Providers of Capital
Interest Income and Interest Expense
Interest income and the components of interest expense are shown below:
| | | | | | | | | | | | | |
| | | |
| Year ended Dec. 31 | | | 2024 | 2023 | 2022 |
| Interest income | | | 30 | | 59 | | 24 | |
| | | | | |
| Interest on debt | | | 197 | | 203 | | 164 | |
| Interest on exchangeable debentures | | | 31 | | 29 | | 29 | |
| Interest on exchangeable preferred shares | | | 28 | | 28 | | 28 | |
| Capitalized interest | | | (16) | | (57) | | (16) | |
| Interest on lease liabilities | | | 10 | | 9 | | 7 | |
| Credit facility fees, bank charges and other interest | | | 21 | | 21 | | 27 | |
| | | | | |
| Tax shield on tax equity financing | | | 3 | | — | | (2) | |
| Accretion of provisions | | | 50 | | 48 | | 49 | |
| Interest expense | | | 324 | | 281 | | 286 | |
Interest income was lower due to lower average cash balances and lower interest rates. Interest expense was higher than in 2023, primarily due to lower capitalized
interest resulting from lower construction activity in 2024 compared to 2023.
| | | | | | | | |
| M54 | TransAlta Corporation | 2024 Integrated Report |
Share Capital
The following tables outline the common and preferred shares issued and outstanding:
| | | | | | | | | | | |
| | Number of shares (millions) |
| As at | Feb. 19, 2025 | Dec. 31, 2024 | Dec. 31, 2023 |
| | | |
| Common shares issued and outstanding, end of period | 297.6 | | 297.5 | | 306.9 | |
| | | |
| | | |
| Preferred shares | | | |
| Series A | 9.6 | | 9.6 | | 9.6 | |
| Series B | 2.4 | | 2.4 | | 2.4 | |
| Series C | 10.0 | | 10.0 | | 10.0 | |
| Series D | 1.0 | | 1.0 | | 1.0 | |
| Series E | 9.0 | | 9.0 | | 9.0 | |
| Series G | 6.6 | | 6.6 | | 6.6 | |
| Preferred shares issued and outstanding in equity | 38.6 | | 38.6 | | 38.6 | |
Series I - exchangeable securities(1) | 0.4 | | 0.4 | | 0.4 | |
| Preferred shares issued and outstanding | 39.0 | | 39.0 | | 39.0 | |
(1)Brookfield invested $400 million in consideration for redeemable, retractable, first preferred shares. For accounting purposes, these preferred shares are considered debt and disclosed as such in the consolidated financial statements.
Non-Controlling Interests
On Oct. 5, 2023, the Company acquired all of the outstanding common shares of TransAlta Renewables not already owned, directly or indirectly, by TransAlta and certain of its affiliates.
As at Dec. 31, 2024, the Company owned 50.01 per cent of TransAlta Cogeneration, LP (TA Cogen) (Dec. 31, 2023 – 50.01 per cent), which owns, operates or has an interest in three natural-gas-fired cogeneration facilities (Ottawa, Windsor and Fort Saskatchewan) and a natural-gas-fired facility (Sheerness). On Dec. 4, 2024, the Company acquired the remaining 50 per cent interest in Sheerness as part of the Heartland acquisition.
As at Dec. 31, 2024, the Company owned 83 per cent of Kent Hills Wind LP (Dec. 31, 2023 - 83 per cent), which owns and operates three wind facilities.
Since the Company owns a controlling interest in TA Cogen and Kent Hills Wind LP, we consolidated the entire earnings, assets and liabilities in relation to the subsidiaries.
Earnings, assets and liabilities of these subsidiaries, and of TransAlta Renewables prior to Oct. 5, 2023, were allocated to the other owners in proportion to their ownership interests. On Oct. 5, 2023, the Company acquired all of the outstanding common shares of TransAlta Renewables not already owned, directly or indirectly.
The reported net earnings attributable to non-controlling interests for the year ended Dec. 31, 2024, decreased by $91 million, compared to 2023, primarily as a result of lower TA Cogen net earnings attributable to non-controlling interests resulting from lower production and lower merchant pricing in the Alberta market and the cessation of distributions to TransAlta Renewables non-controlling interest.
| | | | | | | | |
| TransAlta Corporation | 2024 Integrated Report | M55 |
Cash Flows
The following table highlights significant changes in the Consolidated Statements of Cash Flows for the year ended Dec. 31, 2024 and Dec. 31, 2023:
| | | | | | | | | | | | | | |
| | |
| Year ended Dec. 31 | 2024 | | 2023 | 2022 |
| Cash and cash equivalents, beginning of year | 348 | | | 1,134 | | 947 | |
| Provided by (used in): | | | | |
| Operating activities | 796 | | | 1,464 | | 877 | |
| Investing activities | (520) | | | (814) | | (741) | |
| Financing activities | (291) | | | (1,432) | | 45 | |
| Translation of foreign currency cash | 4 | | | (4) | | 6 | |
| | | | |
| Cash and cash equivalents, end of year | 337 | | | 348 | | 1,134 | |
Cash Flow from Operating Activities
Cash from operating activities for the year ended Dec. 31, 2024, decreased compared with the same period in 2023, primarily due to the following:
| | | | | |
| Year ended Dec. 31 |
| Cash flow from operating activities for the year ended Dec. 31, 2023 | 1,464 | |
| Lower gross margin due to lower revenues, excluding the effect of unrealized losses from risk management activities, partially offset by lower fuel and purchased power. | (351) | |
| Higher OM&A due to increased spending on planning and design of an ERP system upgrade, higher spending on strategic and growth initiatives, penalties assessed by the Alberta Market Surveillance Administrator for self-reported contraventions and Heartland acquisition-related transaction and restructuring costs. | (116) | |
| |
| Higher current income tax expense due to the full utilization of Canadian non-capital loss carryforwards in 2023, offset by lower earnings before income taxes in 2024. | (93) | |
| Lower interest income due to lower cash balances and lower interest rates. | (29) | |
| Higher interest expense on debt primary due to lower capitalized interest resulting from lower construction activity in 2024 compared to 2023. | (35) | |
| Unfavourable change in non-cash operating working capital balances due to lower accounts payables and accrued liabilities, partially offset by lower collateral provided as a result of market price volatility. | (86) | |
| Other non-cash items | 42 | |
| Cash flow from operating activities for the year ended Dec. 31, 2024 | 796 | |
| | | | | | | | |
| M56 | TransAlta Corporation | 2024 Integrated Report |
Cash from operating activities for the year ended Dec. 31, 2023, increased compared with the same period in 2022, primarily due to the following:
| | | | | |
| Year ended Dec. 31 |
| Cash flow from operating activities for the year ended Dec. 31, 2022 | 877 | |
| Higher gross margin due to lower natural gas costs included in fuel and purchased power, partially offset by lower revenues net of unrealized gains and losses from risk management activities and higher carbon compliance costs. | 127 | |
| Higher OM&A due to increased spending on strategic and growth initiatives, higher costs associated with the relocation of the Company's head office, and increased costs due to inflationary pressures. | (18) | |
| |
| Lower current income tax expense due to previously restricted non-capital loss carryforwards were utilized to offset taxable income. | 15 | |
| Higher interest income due to higher cash balances and favourable interest rates. | 35 | |
| Favourable change in non-cash operating working capital balances due to lower accounts receivable and collateral provided as a result of volatility in the market and market prices, partially offset by lower accounts payable and collateral received related to derivative instruments. | 440 | |
| Other | (12) | |
| Cash flow from operating activities for the year ended Dec. 31, 2023 | 1,464 | |
Cash Flow Used in Investing Activities
Cash used in investing activities for the year ended Dec. 31, 2024, decreased compared with the same period in 2023, primarily due to the following:
| | | | | |
| Year ended Dec. 31 |
| Cash flow used in investing activities for the year ended Dec. 31, 2023 | (814) | |
| |
| Cash paid for the acquisition of Heartland. | (217) | |
| Lower additions to PP&E due to larger construction program in 2023 compared to 2024. | 564 | |
| |
| Lower proceeds on sale of PP&E due to the sale of equipment related to Sundance Unit 5 in 2023. | (25) | |
| Unfavourable change in non-cash investing working capital balances due to lower capital accruals. | (18) | |
| Lower cash receipts under the new Mount Keith 132kV expansion finance lease receivable as compared to the Southern Cross Energy finance lease receivable. | (34) | |
| Lower cash contributions to equity accounted investments. | 8 | |
Other(1) | 16 | |
| Cash flow used in investing activities for the year ended Dec. 31, 2024 | (520) | |
(1)Mainly comprised of the lease incentive received, offset by lower realized gains on financial instruments, increase in the restricted cash balance and other investing items.
| | | | | | | | |
| TransAlta Corporation | 2024 Integrated Report | M57 |
Cash used in investing activities for the year ended Dec. 31, 2023, increased compared with the same period in 2022, primarily due to the following:
| | | | | |
| Year ended Dec. 31 |
| Cash flow used in investing activities for the year ended Dec. 31, 2022 | (741) | |
| |
| Lower additions to PP&E due to 2022 additions mainly for the construction of the White Rock wind projects, Garden Plain wind facility, the Horizon Hill wind project and the Northern Goldfields solar facilities. In 2023, most of these facilities achieved commercial operation. | 43 | |
| |
| Lower intangible assets due to lower additions of intangibles under development. | 18 | |
| Lower proceeds on sale of PP&E due to closing the sale of two hydro facilities and equipment related to Sundance Unit 5 and other equipment in 2022. | (37) | |
| Unfavourable change in non-cash investing working capital balances due to lower capital accruals. | (28) | |
| |
Other(1) | (69) | |
| Cash flow used in investing activities for the year ended Dec. 31, 2023 | (814) | |
(1)Mainly comprised of higher spending on project development costs, higher contributions to investments, lower insurance proceeds and lower settlements in 2023.
Cash Flow Used in Financing Activities
Cash used in financing activities for the year ended Dec. 31, 2024, decreased compared with the same period in 2023, primarily due to the following:
| | | | | |
| Year ended Dec. 31 |
| Cash flow used in financing activities for the year ended Dec. 31, 2023 | (1,432) | |
| Acquisition of TransAlta Renewables in 2023. | 811 | |
| Increase in borrowings under credit facilities during 2024. | 189 | |
| Lower distributions paid to non-controlling interests. | 183 | |
| Higher repurchases of common shares under the NCIB. | (56) | |
| Lower repayments of long-term debt in 2024 compared to prior year. | 33 | |
| No long-term debt issued in 2024. | (39) | |
| Lower realized losses on financial instruments. | 34 | |
| Other | (14) | |
| Cash flow used in financing activities for the year ended Dec. 31, 2024 | (291) | |
| | | | | | | | |
| M58 | TransAlta Corporation | 2024 Integrated Report |
Cash used in financing activities for the year ended Dec. 31, 2023, increased compared with the same period in 2022, primarily due to the following:
| | | | | |
| Year ended Dec. 31 |
| Cash flow from financing activities for the year ended Dec. 31, 2022 | 45 | |
| Lower repayment of long-term debt due to the repayment of US$400 million senior notes in 2022. | 457 | |
| Higher share capital issuance due to cash used and shares issued to acquire TransAlta Renewables. | (811) | |
| Lower net increase in borrowings under credit facilities. | (495) | |
| Lower issuance of long-term debt due to the Company issuing US$400 million senior notes in 2022. | (493) | |
| Lower realized gains on financial instruments due to recognizing a gain on the repayment of US$400 million senior notes in 2022. | (72) | |
| Higher distributions paid to non-controlling interests. | (36) | |
| Higher repurchases of common shares under the NCIB. | (35) | |
| Other | 8 | |
| Cash flow used in financing activities for the year ended Dec. 31, 2023 | (1,432) | |
| | | | | | | | |
| TransAlta Corporation | 2024 Integrated Report | M59 |
Other Consolidated Analysis
Unconsolidated Structured Entities or Arrangements
Disclosure is required of all unconsolidated structured entities or arrangements such as transactions, agreements or contractual arrangements with unconsolidated entities, structured finance entities, special purpose entities or variable interest entities that are reasonably likely to materially affect liquidity or the availability of, or requirements for, capital resources. We currently have no such unconsolidated structured entities or arrangements.
Related-Party Transactions
In the normal course of operations, we enter into transactions on market terms with related parties, including consolidated and equity accounted entities, which have been measured at exchange value and are recognized in the consolidated financial statements, including, but not limited to asset management fees, power purchase and derivative contracts. Refer to Note 36, Related-Party Transactions in the consolidated financial statements for further details.
Guarantee Contracts
We have obligations to issue letters of credit and cash collateral to secure potential liabilities to certain parties, including those related to potential environmental obligations, commodity risk management and hedging activities, pension plan obligations, construction projects and purchase obligations. At Dec. 31, 2024, we provided letters of credit totalling $865 million (2023 – $782 million) and cash collateral of $124 million (2023 – $145 million).
These letters of credit and cash collateral secure certain amounts included on our Consolidated Statements of Financial Position under risk management liabilities, defined benefit obligations and other long-term liabilities and decommissioning and other provisions. The increase in the amount of letters of credit issued during 2024 relates to higher physical and financial derivative transactions in a net liability position and additions of new letters of credit issued from the acquisition of Heartland.
Commitments
Contractual commitments are as follows:
| | | | | | | | | | | | | | | | | | | | | | | |
| | 2025 | 2026 | 2027 | 2028 | 2029 | 2030 and thereafter | Total |
Natural gas and transportation contracts(1) | 75 | | 68 | | 65 | | 66 | | 64 | | 425 | | 763 | |
Transmission(1) | 23 | | 23 | | 21 | | 10 | | 8 | | 105 | | 190 | |
Coal supply agreements(1) | 75 | | — | | — | | — | | — | | — | | 75 | |
Long-term service agreements(1) | 61 | | 47 | | 50 | | 31 | | 18 | | 151 | | 358 | |
Operating leases(1,2) | 4 | | 3 | | 3 | | 2 | | 2 | | 22 | | 36 | |
Long-term debt(3) | 566 | | 169 | | 331 | | 309 | | 824 | | 1,493 | | 3,692 | |
Exchangeable securities(4) | — | | — | | — | | — | | — | | 750 | | 750 | |
| Principal payments on lease liabilities | 4 | | 5 | | 5 | | 5 | | 5 | | 127 | | 151 | |
Interest on long-term debt and lease liabilities(1)(5) | 205 | | 178 | | 169 | | 151 | | 136 | | 649 | | 1,488 | |
Interest on exchangeable securities(1,4) | 53 | | 53 | | 53 | | 52 | | 12 | | — | | 223 | |
Growth(1) | 46 | | 3 | | — | | — | | — | | — | | 49 | |
| | | | | | | |
| Total | 1,112 | | 549 | | 697 | | 626 | | 1,069 | | 3,722 | | 7,775 | |
(1)Not recognized as a financial liability on the Consolidated Statements of Financial Position and excludes the impact of interest rate hedges.
(2)Includes leases that have not been recognized as a lease liability and leases that have not yet commenced.
(3)Excludes impact of hedge accounting and derivatives.
(4)The exchangeable debentures are due May 1, 2039 and the exchangeable preferred shares are perpetual. However, a cash payment could occur after Dec. 31, 2028, at the Company's option, if the exchangeable securities are not exchanged by Brookfield Renewable Partners or its affiliates (collectively Brookfield). At Brookfield's option, the exchangeable securities are currently exchangeable into an equity ownership interest in TransAlta’s Alberta Hydro Assets.
(5)Interest on long-term debt is based on debt currently in place with no assumption as to refinancing on maturity.
| | | | | | | | |
| M60 | TransAlta Corporation | 2024 Integrated Report |
Contingencies
TransAlta is occasionally named as a party in various claims and legal and regulatory proceedings that arise during the normal course of its business. TransAlta reviews each of these claims, including the nature of the claim, the amount in dispute or claimed and the availability of insurance coverage. There can be no assurance that any particular claim will be resolved in the Company’s favour or that such claims may not have a material adverse effect on TransAlta. Inquiries from regulatory bodies may also arise in the normal course of business, to which the Company responds as required.
The Company conducts internal reviews of its offers and offer behaviour in both the energy and ancillary services markets in Alberta on an ongoing basis and will self-report suspected contraventions or respond to inquiries from regulatory agencies as required. There currently is no certainty that any particular matter will be resolved in the Company’s favour or that such matters may not have a material adverse effect on TransAlta.
Brazeau Facility — Well Licence Applications to Consider Hydraulic Fracturing Activities
The Alberta Energy Regulator (AER) issued a subsurface order on May 27, 2019, which does not permit any hydraulic fracturing within three kilometres of the Brazeau facility, but permits hydraulic fracturing in all formations (except the Duvernay) within three to five kilometres of the Brazeau facility. Subsequently, two oil and gas operators submitted applications to the AER for 10 well licences (which include hydraulic fracturing activities) within three to five kilometres of the Brazeau facility.
The Company's position, based on independent expert analysis commissioned by the Government of Alberta, is that hydraulic fracturing activities within five kilometres of the Brazeau facility pose an unacceptable risk and that the applications should be denied. The regulatory hearing to consider these applications - Proceeding 379 - has been adjourned to November 2025.
Brazeau Facility - Claim Against the Government of Alberta
On Sept. 9, 2022, the Company filed a Statement of Claim against the Government of Alberta in the Alberta Court of King’s Bench seeking a declaration that: (a) granting mineral leases within five kilometres of the Brazeau facility is a breach of a 1960 agreement between the Company and the Alberta Government; and (b) the Government of Alberta is required to indemnify the Company for any costs or damages that result from the risks of hydraulic fracturing near the Brazeau facility. On Sept. 29, 2022, the Government of Alberta filed its Statement of Defence, which asserts, among other things, that the Company: (a) is trying to usurp the jurisdiction of the AER; and (b) is out
of time under the Limitations Act (Alberta). The trial is scheduled to be heard in September or October 2025 in the event the parties are unable to resolve the dispute prior to such date.
Garden Plain
Garden Plain I LP, a wholly-owned subsidiary of the Company, retained a third-party contractor to construct the Garden Plain wind project near Hanna, Alberta. The contractor experienced scheduling delays, challenges with construction and significant cost overruns, resulting in overdue deadlines, and has asserted a claim for $53 million in damages. The Company disputes this claim in its entirety and asserts a counterclaim. The parties have initiated the dispute resolution procedure with an arbitration hearing scheduled for three weeks starting April 14, 2025.
Sundance A Decommissioning
TransAlta filed an application with the Alberta Utilities Commission seeking payment from the Balancing Pool for TransAlta’s decommissioning costs for Sundance A, including its proportionate share of the Highvale mine. The application was heard by Alberta Utilities Commission in the first quarter of 2024. A decision was rendered on Dec. 9, 2024, which directed the Balancing Pool to pay TransAlta $9 million, being the shortfall of decommissioning costs of Sundance A from previously collected amounts under the Power Purchase Arrangement Regulation.
Brazeau — Spinning Reserve Self-Report
On Nov. 30, 2022, TransAlta self-reported to the Market Surveillance Administrator (MSA) a potential violation of the Independent System Operator rules relating to offers of active spinning reserves at Brazeau when it was not properly configured to do so between Aug. 13, 2021, and Nov. 1, 2022. In 2022 a provision of $20 million was initially recognized in revenue reflecting a potential disgorgement of revenue and $2 million for potential penalties and fines. On Nov. 29, 2024, the MSA issued penalties to TransAlta for this self-report and TransAlta made a payment of $33 million in January 2025.
| | | | | | | | |
| TransAlta Corporation | 2024 Integrated Report | M61 |
Financial Instruments
Financial instruments are used for proprietary trading purposes and to manage our exposure to interest rates, commodity prices and currency fluctuations, as well as other market risks. We may currently use physical and financial swaps, forward sale and purchase contracts, futures contracts, foreign exchange contracts, interest rate swaps and options to achieve our risk management objectives. Some of our physical commodity contracts have been entered into and are held for the purposes of meeting our expected purchase, sale or usage requirements and, as such, are not considered financial instruments, and are not recognized as a financial asset or financial liability. Other physical commodity contracts that are not held for normal purchase or sale requirements, and derivative financial instruments are recognized on the Consolidated Statements of Financial Position and are accounted for using the fair value method of accounting. The initial recognition of fair value and subsequent changes in fair value can affect reported earnings in the period when the change occurs if hedge accounting is not elected. Otherwise, changes in fair value will generally not affect earnings until the financial instrument is settled.
Some of our financial instruments and physical commodity contracts qualify for, and are recorded under, hedge accounting rules. The accounting for those contracts, for which we have elected to apply hedge accounting, depends on the type of hedge. Our financial instruments are mainly used for cash flow hedges or non-hedges. These categories and their associated accounting treatments are explained in further detail below.
For all types of hedges, we test for effectiveness at the end of each reporting period to determine if the instruments are performing as intended and hedge accounting can still be applied. The financial instruments we enter into are designed to ensure that future cash inflows and outflows are predictable. In a hedging relationship, the effective portion of the change in the fair value of the hedging derivative does not impact net earnings (loss), while any ineffective portion is recognized in net earnings (loss).
We have certain contracts in our portfolio that, at their inception, do not qualify for, or we have chosen not to elect to apply, hedge accounting. For these contracts, we recognize in net earnings (loss) mark-to-market gains and losses resulting from changes in forward prices compared to the price at which these contracts were transacted. These changes in price alter the timing of earnings recognition, but do not necessarily determine the final settlement amount received. The fair value of future contracts will continue to fluctuate as market prices change. The fair value of derivatives that are not traded on an active exchange, or extend beyond the time period for which exchange-based quotes are available, are
determined using valuation techniques or models.
Cash Flow Hedges
Cash flow hedges are categorized as project, foreign exchange, interest rate or commodity hedges and are used to offset foreign exchange, interest rate and commodity price exposures resulting from market fluctuations.
Foreign currency forward contracts and cross-currency swaps may be used to hedge foreign exchange exposures resulting from anticipated contracts and firm commitments denominated in foreign currencies, primarily related to capital expenditures and currency exposures related to U.S. dollar denominated debt.
Physical and financial swaps, forward sale and purchase contracts, futures contracts and options may be used primarily to offset the variability in future cash flows caused by fluctuations in electricity and natural gas prices. Interest rate swaps may be used to convert the fixed interest cash flows related to interest expense on debt to floating rates and vice versa.
In a cash flow hedge, changes in the fair value of the hedging instrument (a forward contract or financial swap, for example) are recognized in risk management assets or liabilities and the related gains or losses are recognized in other comprehensive income or loss (OCI). These gains or losses are subsequently reclassified from OCI to net earnings (loss) in the same period as the hedged forecast cash flows impact net earnings (loss) and offset the losses or gains arising from the forecast transactions. For project hedges, the gains and losses reclassified from OCI are included in the carrying amount of the related PP&E.
Hedge accounting follows a principles-based approach for qualifying hedges that is aligned with an entity's approach to risk management. When we do not elect hedge accounting or when the hedge is no longer effective and does not qualify for hedge accounting, the gains or losses as a result of changes in prices, interest or exchange rates related to these financial instruments are recorded in net earnings (loss) in the period in which they arise.
Net Investment Hedges
Foreign-denominated long-term debt is used to hedge exposure to changes in the carrying values of our net investments in foreign operations that have a functional currency other than the Canadian dollar. Our net investment hedges using U.S. dollar denominated debt remain effective and in place. Gains or losses on these instruments are recognized and deferred in OCI and reclassified to net earnings on the disposal of the foreign operation. We also manage foreign exchange risk by matching foreign-denominated expenses with revenues,
| | | | | | | | |
| M62 | TransAlta Corporation | 2024 Integrated Report |
such as offsetting revenues from our U.S. operations with interest payments on our U.S. dollar denominated debt.
Non-Hedges
Financial instruments not designated as hedges are used for proprietary trading and to reduce commodity price, foreign exchange and interest rate risks. Changes in the fair value of financial instruments not designated as hedges are recognized in risk management assets or liabilities and the related gains or losses are recognized in net earnings (loss) in the period in which the change occurs.
Fair Values
The majority of fair values for our foreign exchange, interest rate, commodity hedges and non-hedge derivatives are calculated using adjusted quoted prices from an active market or inputs validated by broker quotes. We may enter into commodity transactions involving non-standard features for which market-observable data is not available. These transactions are defined under IFRS as Level III instruments. Level III instruments incorporate inputs that are not observable from the market and fair
value is therefore determined using valuation techniques. Fair values are validated by using reasonably possible alternative assumptions as inputs to valuation techniques and any material differences are disclosed in the notes to the consolidated financial statements.
At Dec. 31, 2024, Level III instruments had a net liabilities carrying value of $234 million (2023 – net liabilities $147 million). The Level III liabilities increased in 2024 primarily due to market price changes and the addition of contingent consideration related to the Planned Divestitures from the acquisition of Heartland, offset by contract settlements in the year. Our risk management profile and practices have not changed materially from Dec. 31, 2023.
Refer to the Material Accounting Policies and Critical Accounting Estimates section of this MD&A for further details regarding valuation techniques.
| | | | | | | | |
| TransAlta Corporation | 2024 Integrated Report | M63 |
Additional IFRS Measures and Non-IFRS Measures
An additional IFRS measure is a line item, heading or subtotal that is relevant to an understanding of the consolidated financial statements but is not a minimum line item mandated under IFRS, or the presentation of a financial measure that is relevant to an understanding of the consolidated financial statements but is not presented elsewhere in the consolidated financial statements. We have included line items entitled gross margin and operating income (loss) in our Consolidated Statements of Earnings (Loss) for the years ended Dec. 31, 2024, 2023 and 2022. Presenting these line items provides management and investors with a measurement of ongoing operating performance that is readily comparable from period to period.
We use a number of financial measures to evaluate our performance and the performance of our business segments, including measures and ratios that are presented on a non-IFRS basis, as described below. Unless otherwise indicated, all amounts are in Canadian dollars and have been derived from our consolidated financial statements prepared in accordance with IFRS. We believe that these non-IFRS amounts, measures and ratios, read together with our IFRS amounts, provide readers with a better understanding of how management assesses results.
Non-IFRS amounts, measures and ratios do not have standardized meanings under IFRS. They are unlikely to be comparable to similar measures presented by other companies and should not be viewed in isolation from, as an alternative to, or more meaningful than, our IFRS results.
Non-IFRS Financial Measures
Adjusted EBITDA, FFO, FCF, Adjusted gross margin, total consolidated net debt and adjusted net debt are non-IFRS measures that are presented in this MD&A. This section provides additional information in respect of such non-IFRS measures, including a reconciliation of such non-IFRS measures to the most comparable IFRS measure.
Adjusted EBITDA
Each business segment assumes responsibility for its operating results measured by adjusted EBITDA. Adjusted EBITDA is an important metric for management that represents our core operational results. In the fourth quarter of 2024, our adjusted EBITDA composition was adjusted to exclude the impact of the Brazeau penalties assessed, the Sundance A decommissioning cost reimbursement, the ERP integration costs, revenues and expenses of the Planned Divestitures and Acquisition related and integration costs associated with the Heartland acquisition as these transactions are not reflective of ongoing operations or performance of our operating
assets. Accordingly, the Company has applied this composition to all previously reported periods. Interest, taxes, depreciation and amortization are not included, as differences in accounting treatments may distort our core business results. In addition, certain reclassifications and adjustments are made to better assess results, excluding those items that may not be reflective of ongoing business performance. This presentation may facilitate the readers' analysis of trends. The most directly comparable IFRS measure is earnings before income taxes.
The following are descriptions of the adjustments made.
Adjustments to Revenue
•Adjusted EBITDA is adjusted to exclude the impact of unrealized mark-to-market gains or losses and unrealized foreign exchange gains or losses on commodity transactions.
•Adjustments are made for gains and losses related to closed positions effectively settled by offsetting positions with exchanges that have been recorded in the period the positions are settled.
•Certain assets that we own in Canada and in Western Australia are fully contracted and recorded as finance leases under IFRS. We believe that it is more appropriate to reflect the payments we receive under the contracts as a capacity payment in our revenues instead of as finance lease income and a decrease in finance lease receivables.
•The Brazeau penalties are issued by the Alberta Market Surveillance Administrator for self-reported contraventions pertaining to Hydro ancillary services provided during 2021 and 2022. The penalties have been excluded and does not represent ongoing performance. In 2022 a provision of $20 million was initially recognized in revenue reflecting a potential disgorgement of revenue and $2 million for potential penalties and fines. The final assessment contained no disgorgement of revenue and penalties of $33 million. This resulted in a reversal of the original disgorgement provision in revenue in the year ended Dec. 31, 2024 and recognition of the full amount of the penalties assessed in OM&A.
•Revenues from the Planned Divestitures are not included as they do not reflect ongoing business performance.
Adjustments to Fuel and Purchased Power
•On the commissioning of the South Hedland facility in July 2017, we prepaid approximately $74 million of electricity transmission and distribution costs. Interest income is recorded on the prepaid funds. We reclassify this interest income as a reduction in the transmission and distribution costs expensed each period to reflect the net cost to the business.
| | | | | | | | |
| M64 | TransAlta Corporation | 2024 Integrated Report |
•Fuel and purchased power from the Planned Divestitures is not included as it does not reflect ongoing business performance.
Adjustments to OM&A
•Acquisition-related transaction and restructuring costs, mainly comprising severance, legal and consultant fees, are not included as these do not reflect ongoing business performance.
•The Brazeau penalties are issued by the Alberta Market Surveillance Administrator for self-reported contraventions pertaining to Hydro ancillary services provided during 2021 and 2022. The penalties have been excluded as it does not represent ongoing performance. The provision was initially recognized in 2022 based on an estimate and revised in 2024 based on the actual resolution of the matter.
•ERP integration costs representing planning and design of upgrades to the existing ERP system in 2024 are not included as they represent project costs that do not occur on a regular basis and therefore, do not reflect ongoing performance.
Adjustments to Net Other Operating Income
•The Sundance A decommissioning cost reimbursement in 2024 is not included as it relates to a settlement of a contingency for a facility that is no longer in operation. Refer to Note 8 from our consolidated financial statements for further details.
•Insurance recoveries related to the Kent Hills tower collapse in 2023 and 2022 are not included as these relate to investing activities and are not reflective of ongoing business performance.
•An onerous contract provision for future royalty payments recognized with the shutdown of the Highvale mine is excluded in 2022 as these are not part of operating income.
•Contract termination penalties in 2022 as a result of the Company's Clean Energy Transition plan are not included.
Adjustments to Earnings (Loss) in Addition to Interest, Taxes, Depreciation and Amortization
•Asset impairment charges and reversals are not included as these are accounting adjustments that impact depreciation and amortization and do not reflect ongoing business performance.
•Any gains or losses on asset sales or foreign exchange gains or losses are not included as these are not part of operating income.
Adjustments for Equity-Accounted Investments
•During the fourth quarter of 2020, we acquired a 49 per cent interest in the Skookumchuck wind facility, which is treated as an equity investment under IFRS and our proportionate share of the net earnings is reflected as equity income on the statement of earnings under IFRS.
As this investment is part of our regular power-generating operations, we have included our proportionate share of the adjusted EBITDA of the Skookumchuck wind facility in our total adjusted EBITDA. In addition, in the Wind and Solar adjusted results, we have included our proportionate share of revenues and expenses to reflect the full operational results of this investment. We have not included EMG International, LLC’s adjusted EBITDA in our total adjusted EBITDA as it does not represent our regular power-generating operations.
Average Annual EBITDA
Average annual EBITDA is a forward-looking non-IFRS financial measure that is used to show the average annual EBITDA that the project is expected to generate.
Funds From Operations (FFO)
FFO is an important metric as it provides a proxy for cash generated from operating activities before changes in working capital and provides the ability to evaluate cash flow trends in comparison with results from prior periods. FFO is a non-IFRS measure. For a description of the adjustments made to Cash Flow from Operations (the most directly comparable IFRS measure) to calculate FFO, see the tables on pages M70 and M74.
Adjustments to Cash Flow from Operations
•FFO related to the Skookumchuck wind facility, which is treated as an equity-accounted investment under IFRS and equity income, net of distributions from joint ventures, is included in cash flow from operations under IFRS. As this investment is part of our regular power-generating operations, we have included our proportionate share of FFO.
•Payments received on finance lease receivables are reclassified to reflect cash from operations.
•We adjust for items within the Energy Transition segment that may not be reflective of ongoing operations including certain costs related to decisions made to accelerate our transition off-coal in Alberta and our planned transition off-coal for Centralia. These are included in the "Clean energy transition provisions and adjustments" in the reconciliation.
•Sundance A decommissioning cost reimbursement in 2024 is not included as it relates to a settlement of a contingency for a facility that is no longer in operation.
•Cash received/paid on closed positions are reflected in the period that the position is settled.
•We adjust for costs associated with acquisition-related transactions or restructuring and that are not reflective of ongoing operations.
•Other adjustments include payments/receipts for production tax credits, which are reductions to tax equity
| | | | | | | | |
| TransAlta Corporation | 2024 Integrated Report | M65 |
debt and include distributions from equity-accounted joint ventures.
Free Cash Flow (FCF)
FCF is an important metric as it represents the amount of cash that is available to invest in growth initiatives, make scheduled principal repayments on debt, repay maturing debt, pay common share dividends or repurchase common shares. Changes in working capital are excluded so FFO and FCF are not distorted by changes that we consider temporary in nature, reflecting, among other things, the impact of seasonal factors and timing of receipts and payments. FCF is a non-IFRS measure. For a description of the adjustments made to Cash Flow from Operations (the most directly comparable IFRS measure) to calculate FCF, see the tables on pages M70 and M74. Adjusted Gross Margin
Adjusted gross margin is calculated as adjusted revenues less adjusted fuel and purchased power and carbon compliance costs, where adjustments to revenue or fuel and purchased power were applied as stated above. The Skookumchuck wind facility has been included on a proportionate basis in the Wind and Solar segment. The most directly comparable measure is gross margin in the consolidated statement of earnings.
Non-IFRS Ratios
FFO per share, FCF per share and adjusted net debt to adjusted EBITDA are non-IFRS ratios that are presented in the MD&A. Refer to the Reconciliation of Cash Flow from Operations to FFO and FCF and Key Non-IFRS Financial Ratios sections of this MD&A for additional information.
FFO per Share and FCF per Share
FFO per share and FCF per share are calculated using the weighted average number of common shares outstanding during the period. FFO per share and FCF per share are non-IFRS ratios.
Supplementary Financial Measures
Sustaining capital expenditures and growth and development expenditures are supplementary financial measures used to present our spend related to facilitate safe and reliable operation of our existing facilities and the construction of projects, respectively. Refer to the Capital Expenditures section of this MD&A for additional information.
The Alberta electricity portfolio metrics disclosed are supplementary financial measures used to present the gross margin by segment for the Alberta market. Refer to the Alberta Portfolio section of this MD&A for additional information.
| | | | | | | | |
| M66 | TransAlta Corporation | 2024 Integrated Report |
Full-Year Reconciliation of Non-IFRS Measures on a Consolidated Basis by Segment
The following table reflects adjusted EBITDA by segment and provides reconciliation to earnings before income taxes for the year ended Dec. 31, 2024:
| | | | | | | | | | | | | | | | | | | | | | | | | | | | | | | | |
| Hydro | Wind & Solar(1) | Gas | Energy Transition | Energy
Marketing | Corporate | Total | Equity- accounted investments(1) | Reclass adjustments | IFRS financials |
| Revenues | 409 | | 357 | | 1,350 | | 616 | | 168 | | (34) | | 2,866 | | (21) | | — | | 2,845 | |
| Reclassifications and adjustments: | | | | | | | | | | |
| Unrealized mark-to-market (gain) loss | 1 | | 84 | | (60) | | (36) | | 14 | | — | | 3 | | — | | (3) | | — | |
| Realized gain (loss) on closed exchange positions | — | | — | | 7 | | 2 | | (15) | | — | | (6) | | — | | 6 | | — | |
| Decrease in finance lease receivable | — | | 2 | | 19 | | — | | — | | — | | 21 | | — | | (21) | | — | |
| Finance lease income | — | | 6 | | 8 | | — | | — | | — | | 14 | | — | | (14) | | — | |
| Revenues from Planned Divestitures | — | | — | | (1) | | — | | — | | — | | (1) | | — | | 1 | | — | |
| Brazeau penalties | (20) | | — | | — | | — | | — | | — | | (20) | | — | | 20 | | — | |
| Unrealized foreign exchange loss on commodity | — | | — | | (2) | | — | | — | | — | | (2) | | — | | 2 | | — | |
| Adjusted revenues | 390 | | 449 | | 1,321 | | 582 | | 167 | | (34) | | 2,875 | | (21) | | (9) | | 2,845 | |
| Fuel and purchased power | 16 | | 30 | | 475 | | 418 | | — | | — | | 939 | | — | | — | | 939 | |
| Reclassifications and adjustments: | | | | | | | | | | |
| Fuel and purchased power related to Planned Divestitures | — | | — | | (1) | | — | | — | | — | | (1) | | — | | 1 | | — | |
| Australian interest income | — | | — | | (4) | | — | | — | | — | | (4) | | — | | 4 | | — | |
| Adjusted fuel and purchased power | 16 | | 30 | | 470 | | 418 | | — | | — | | 934 | | — | | 5 | | 939 | |
| Carbon compliance | — | | — | | 145 | | 1 | | — | | (34) | | 112 | | — | | — | | 112 | |
| Gross margin | 374 | 419 | | 706 | | 163 | | 167 | | — | | 1,829 | | (21) | | (14) | | 1,794 | |
| OM&A | 86 | | 97 | | 198 | | 69 | | 36 | | 173 | | 659 | | (4) | | — | | 655 | |
| Reclassifications and adjustments: | | | | | | | | | | |
| Brazeau penalties | (31) | | — | | — | | — | | — | | — | | (31) | | — | | 31 | | — | |
| ERP integration costs | — | | — | | — | | — | | — | | (14) | | (14) | | — | | 14 | | — | |
| Acquisition-related transaction and restructuring costs | — | | — | | — | | — | | — | | (24) | | (24) | | | 24 | | — | |
| Adjusted OM&A | 55 | | 97 | | 198 | | 69 | | 36 | | 135 | | 590 | | (4) | | 69 | | 655 | |
| Taxes, other than income taxes | 3 | | 16 | | 13 | | 3 | | — | | 1 | | 36 | | — | | — | | 36 | |
| Net other operating income | — | | (10) | | (40) | | (9) | | — | | — | | (59) | | — | | — | | (59) | |
| Reclassifications and adjustments: | | | | | | | | | | |
| | | | | | | | | | |
| Sundance A decommissioning cost reimbursement | — | | — | | — | | 9 | | — | | — | | 9 | | — | | (9) | | — | |
| | | | | | | | | | |
| Adjusted net other operating income | — | | (10) | | (40) | | — | | — | | — | | (50) | | — | | (9) | | (59) | |
Adjusted EBITDA(2) | 316 | 316 | | 535 | | 91 | | 131 | | (136) | | 1,253 | | | | |
| Equity income | | | | | | | | | | 5 | |
| Finance lease income | | | | | | | | | | 14 | |
| | | | | | | | | | |
| Depreciation and amortization | | | | | | | | | | (531) | |
| Asset impairment charges | | | | | | | | | | (46) | |
| Interest income | | | | | | | | | | 30 | |
| Interest expense | | | | | | | | | | (324) | |
| Foreign exchange gain | | | | | | | | | | 5 | |
| Gain on sale of assets and other | | | | | | | | | | 4 | |
| Earnings before income taxes | | | | | | | | | | 319 | |
(1)The Skookumchuck wind facility has been included on a proportionate basis in the Wind and Solar segment.
(2)Adjusted EBITDA is not defined and has no standardized meaning under IFRS and may not be comparable to similar measures presented by other issuers. Refer to the Additional IFRS Measures and Non-IFRS Measures section of this MD&A.
| | | | | | | | |
| TransAlta Corporation | 2024 Integrated Report | M67 |
The following table reflects adjusted EBITDA by segment and provides reconciliation to earnings before income taxes for the year ended Dec. 31, 2023:
| | | | | | | | | | | | | | | | | | | | | | | | | | | | | | | | |
| Hydro | Wind & Solar(1) | Gas | Energy Transition | Energy
Marketing | Corporate | Total | Equity- accounted investments(1) | Reclass adjustments | IFRS financials |
| Revenues | 533 | | 357 | | 1,514 | | 751 | | 220 | | 1 | | 3,376 | | (21) | | — | | 3,355 | |
| Reclassifications and adjustments: | | | | | | | | | | |
| Unrealized mark-to-market loss | (4) | | 16 | | (67) | | (5) | | 23 | | — | | (37) | | — | | 37 | | — | |
| Realized gain (loss) on closed exchange positions | — | | — | | 10 | | — | | (91) | | — | | (81) | | — | | 81 | | — | |
| Decrease in finance lease receivable | — | | — | | 55 | | — | | — | | — | | 55 | | — | | (55) | | — | |
| Finance lease income | — | | — | | 12 | | — | | — | | — | | 12 | | — | | (12) | | — | |
| Unrealized foreign exchange gain on commodity | — | | — | | 1 | | — | | — | | — | | 1 | | — | | (1) | | — | |
| Adjusted revenues | 529 | | 373 | | 1,525 | | 746 | | 152 | | 1 | | 3,326 | | (21) | | 50 | | 3,355 | |
| Fuel and purchased power | 19 | | 30 | | 453 | | 557 | | — | | 1 | | 1,060 | | — | | — | | 1,060 | |
| Reclassifications and adjustments: | | | | | | | | | | |
| Australian interest income | — | | — | | (4) | | — | | — | | — | | (4) | | — | | 4 | | — | |
| Adjusted fuel and purchased power | 19 | | 30 | | 449 | | 557 | | — | | 1 | | 1,056 | | — | | 4 | | 1,060 | |
| Carbon compliance | — | | — | | 112 | | — | | — | | — | | 112 | | — | | — | | 112 | |
| Gross margin | 510 | | 343 | | 964 | | 189 | | 152 | | — | | 2,158 | | (21) | | 46 | | 2,183 | |
| OM&A | 48 | | 80 | | 192 | | 64 | | 43 | | 115 | | 542 | | (3) | | — | | 539 | |
| Taxes, other than income taxes | 3 | | 12 | | 11 | | 3 | | — | | 1 | | 30 | | (1) | | — | | 29 | |
| Net other operating income | — | | (7) | | (40) | | — | | — | | — | | (47) | | | — | | (47) | |
| Reclassifications and adjustments: | | | | | | | | | | |
| Insurance recovery | — | | 1 | | — | | — | | — | | — | | 1 | | — | | (1) | | — | |
| Adjusted net other operating income | — | | (6) | | (40) | | — | | — | | — | | (46) | | — | | (1) | | (47) | |
Adjusted EBITDA(2) | 459 | | 257 | | 801 | | 122 | | 109 | | (116) | | 1,632 | | | | |
| Equity income | | | | | | | | | | 4 | |
| Finance lease income | | | | | | | | | | 12 | |
| Depreciation and amortization | | | | | | | | | | (621) | |
| Asset impairment reversals | | | | | | | | | | 48 | |
| Interest income | | | | | | | | | | 59 | |
| Interest expense | | | | | | | | | | (281) | |
| Foreign exchange gain | | | | | | | | | | (7) | |
| Gain on sale of assets and other | | | | | | | | | | 4 | |
| Earnings before income taxes | | | | | | | | | | 880 | |
(1)The Skookumchuck wind facility has been included on a proportionate basis in the Wind and Solar segment.
(2)Adjusted EBITDA is not defined and has no standardized meaning under IFRS and may not be comparable to similar measures presented by other issuers. Refer to the Additional IFRS Measures and Non-IFRS Measures section of this MD&A.
| | | | | | | | |
| M68 | TransAlta Corporation | 2024 Integrated Report |
The following table reflects adjusted EBITDA by segment and provides reconciliation to earnings before income taxes for the year ended Dec. 31, 2022:
| | | | | | | | | | | | | | | | | | | | | | | | | | | | | | | | |
| Hydro | Wind & Solar(1) | Gas | Energy Transition | Energy
Marketing | Corporate | Total | Equity- accounted investments(1) | Reclass adjustments | IFRS financials |
| Revenues | 606 | | 303 | | 1,209 | | 714 | | 160 | | (2) | | 2,990 | | (14) | | | 2,976 | |
| Reclassifications and adjustments: | | | | | | | | | | |
| Unrealized mark-to-market (gain) loss | 1 | | 104 | | 251 | | 10 | | 12 | | — | | 378 | | — | | (378) | | — | |
| Realized gain (loss) on closed exchange positions | — | | — | | (4) | | — | | 47 | | — | | 43 | | — | | (43) | | — | |
| Decrease in finance lease receivable | — | | — | | 46 | | — | | — | | — | | 46 | | — | | (46) | | — | |
| Finance lease income | — | | — | | 19 | | — | | — | | — | | 19 | | — | | (19) | | — | |
| Brazeau penalties | 20 | | — | | — | | — | | — | | — | | 20 | | — | | (20) | | — | |
| Unrealized foreign exchange gain on commodity | — | | — | | — | | — | | (1) | | — | | (1) | | — | | 1 | | — | |
| Adjusted revenues | 627 | | 407 | | 1,521 | | 724 | | 218 | | (2) | | 3,495 | | (14) | | (505) | | 2,976 | |
| Fuel and purchased power | 22 | | 31 | | 641 | | 566 | | — | | 3 | | 1,263 | | — | | — | | 1,263 | |
| Reclassifications and adjustments: | | | | | | | | | | |
| Australian interest income | — | | — | | (4) | | — | | — | | — | | (4) | | — | | 4 | | — | |
| | | | | | | | | | |
| | | | | | | | | | |
| Adjusted fuel and purchased power | 22 | | 31 | | 637 | | 566 | | — | | 3 | | 1,259 | | — | | 4 | | 1,263 | |
| Carbon compliance | — | | 1 | | 83 | | (1) | | — | | (5) | | 78 | | — | | — | | 78 | |
| Gross margin | 605 | | 375 | | 801 | | 159 | | 218 | | — | | 2,158 | | (14) | | (509) | | 1,635 | |
| OM&A | 55 | | 68 | | 195 | | 69 | | 35 | | 101 | | 523 | | (2) | | — | | 521 | |
| Reclassifications and adjustments: | | | | | | | | | | |
| | | | | | | | | | |
| Brazeau penalties | (2) | | — | | — | | — | | — | | — | | (2) | | — | | 2 | | — | |
| | | | | | | | | | |
| Adjusted OM&A | 53 | | 68 | | 195 | | 69 | | 35 | | 101 | | 521 | | (2) | | 2 | | 521 | |
| Taxes, other than income taxes | 3 | | 12 | | 15 | | 4 | | — | | 1 | | 35 | | (2) | | — | | 33 | |
| Net other operating income | — | | (23) | | (38) | | — | | — | | — | | (61) | | 3 | | — | | (58) | |
| Reclassifications and adjustments: | | | | | | | | | | |
| Royalty onerous contract and contract termination penalties | — | | 7 | | — | | — | | — | | — | | 7 | | — | | (7) | | — | |
| Adjusted net other operating income | — | | (16) | | (38) | | — | | — | | — | | (54) | | 3 | | (7) | | (58) | |
Adjusted EBITDA(2)(3) | 549 | | 311 | | 629 | | 86 | | 183 | | (102) | | 1,656 | | | | |
| Equity income | | | | | | | | | | 9 | |
| Finance lease income | | | | | | | | | | 19 | |
| Depreciation and amortization | | | | | | | | | | (599) | |
| Asset impairment charges | | | | | | | | | | (9) | |
| Interest income | | | | | | | | | | 24 | |
| Interest expense | | | | | | | | | | (286) | |
| Foreign exchange gain | | | | | | | | | | 4 | |
| Gain on sale of assets and other | | | | | | | | | | 52 | |
| Earnings before income taxes | | | | | | | | | | 353 | |
(1)The Skookumchuck wind facility has been included on a proportionate basis in the Wind and Solar segment.
(2)Adjusted EBITDA is not defined and has no standardized meaning under IFRS and may not be comparable to similar measures presented by other issuers. Refer to the Additional IFRS Measures and Non-IFRS Measures section of this MD&A.
(3)During 2024 our adjusted EBITDA composition was amended to exclude the impact of Brazeau penalties and related provisions. Therefore, the Company has applied this composition to all previously reported periods. Refer to the Additional IFRS Measures and Non-IFRS Measures section of this MD&A.
| | | | | | | | |
| TransAlta Corporation | 2024 Integrated Report | M69 |
Full-Year Reconciliation of Cash Flow from Operations to FFO and FCF
The table below reconciles our cash flow from operating activities to our FFO and FCF:
| | | | | | | | | | | | | | | | |
| | | |
| | | 2024 | | 2023 | 2022 |
Cash flow from operating activities(1) | | | 796 | | | 1,464 | | 877 | |
| Change in non-cash operating working capital balances | | | (38) | | | (124) | | 316 | |
| Cash flow from operations before changes in working capital | | | 758 | | | 1,340 | | 1,193 | |
| Adjustments | | | | | | |
Share of adjusted FFO from joint venture(1) | | | 8 | | | 8 | | 8 | |
| Decrease in finance lease receivable | | | 21 | | | 55 | | 46 | |
Clean energy transition provisions and adjustments(2) | | | — | | | 11 | | 42 | |
| Sundance A decommissioning cost reimbursement | | | (9) | | | — | | — | |
| Realized gain (loss) on closed exchanged positions | | | (6) | | | (81) | | 37 | |
| Acquisition-related transaction and restructuring costs | | | 19 | | | — | | — | |
Other(3) | | | 19 | | | 18 | | 20 | |
FFO(4) | | | 810 | | | 1,351 | | 1,346 | |
| Deduct: | | | | | | |
Sustaining capital(1) | | | (142) | | | (174) | | (142) | |
| Productivity capital | | | (1) | | | (3) | | (4) | |
| Dividends paid on preferred shares | | | (52) | | | (51) | | (43) | |
| Distributions paid to subsidiaries’ non-controlling interests | | | (40) | | | (223) | | (187) | |
| Principal payments on lease liabilities | | | (6) | | | (10) | | (9) | |
FCF(4) | | | 569 | | | 890 | | 961 | |
| Weighted average number of common shares outstanding in the period | | | 302 | | | 276 | | 271 | |
FFO per share(4) | | | 2.68 | | | 4.89 | | 4.97 | |
FCF per share(4) | | | 1.88 | | | 3.22 | | 3.55 | |
(1)Includes our share of amounts for the Skookumchuck wind facility, an equity-accounted joint venture.
(2)2023 includes amounts related to onerous contracts recognized in 2021 and a voluntary contribution to the U.S. Defined Benefit Pension Plan for the Centralia thermal facility. During 2022, to support the employees affected by the closure of the Highvale mine and our transition off coal to cleaner sources, the Company made a voluntary special contribution of $35 million to the Highvale mine pension plan. 2022 also includes amounts related to onerous contracts recognized in 2021.
(3)Other consists of production tax credits, which is a reduction to tax equity debt, less distributions from an equity-accounted joint venture.
(4)These items are not defined and have no standardized meaning under IFRS and may not be comparable to similar measures presented by other issuers. Refer to the Additional IFRS Measures and Non-IFRS Measures section of this MD&A.
| | | | | | | | |
| M70 | TransAlta Corporation | 2024 Integrated Report |
The table below provides a reconciliation of our adjusted EBITDA to our FFO and FCF:
| | | | | | | | | | | | | | | | |
| | | |
| Year ended Dec. 31 | | | 2024 | | 2023 | 2022(5) |
Adjusted EBITDA(1)(4) | | | 1,253 | | | 1,632 | | 1,656 | |
| Provisions | | | 10 | | | (1) | | 25 | |
Net interest expense(2) | | | (231) | | | (164) | | (200) | |
| Current income tax expense | | | (143) | | | (50) | | (65) | |
| Realized foreign exchange loss | | | (27) | | | (4) | | — | |
| Decommissioning and restoration costs settled | | | (41) | | | (37) | | (35) | |
| Other non-cash items | | | (11) | | | (25) | | (35) | |
FFO(3)(4) | | | 810 | | | 1,351 | | 1,346 | |
| Deduct: | | | | | | |
Sustaining capital(4) | | | (142) | | | (174) | | (142) | |
| Productivity capital | | | (1) | | | (3) | | (4) | |
| Dividends paid on preferred shares | | | (52) | | | (51) | | (43) | |
| Distributions paid to subsidiaries’ non-controlling interests | | | (40) | | | (223) | | (187) | |
| Principal payments on lease liabilities | | | (6) | | | (10) | | (9) | |
| | | | | | |
FCF(3)(4) | | | 569 | | | 890 | | 961 | |
(1)Adjusted EBITDA is defined in the Additional IFRS Measures and Non-IFRS Measures section of this MD&A and reconciled to earnings (loss) before income taxes above.
(2)Net interest expense includes interest expense less interest income and excludes non-cash items like financing amortization and accretion.
(3)These items are not defined and have no standardized meaning under IFRS and may not be comparable to similar measures presented by other issuers. FFO and FCF are defined in the Additional IFRS Measures and Non-IFRS Measures section of this MD&A and reconciled to cash flow from operating activities above.
(4)Includes our share of amounts for the Skookumchuck wind facility, an equity-accounted joint venture.
(5)During 2024 our adjusted EBITDA composition was amended to exclude the impact of Brazeau penalties and related provisions. Therefore, the Company has applied this composition to all previously reported periods. Refer to the Additional IFRS Measures and Non-IFRS Measures section of this MD&A.
| | | | | | | | |
| TransAlta Corporation | 2024 Integrated Report | M71 |
Fourth Quarter Reconciliation of Non-IFRS Measures on a Consolidated Basis by Segment
The following table reflects adjusted EBITDA by segment and provides reconciliation to earnings before income taxes for the three months ended Dec. 31, 2024:
| | | | | | | | | | | | | | | | | | | | | | | | | | | | | | | | |
| Hydro | Wind & Solar(1) | Gas | Energy Transition | Energy
Marketing | Corporate | Total | Equity- accounted investments(1) | Reclass adjustments | IFRS financials |
| Revenues | 93 | | 104 | | 319 | | 155 | | 14 | | — | | 685 | | (7) | | — | | 678 | |
| Reclassifications and adjustments: | | | | | | | | | | |
| Unrealized mark-to-market (gain) loss | 4 | | 23 | | 26 | | (8) | | 19 | | — | | 64 | | — | | (64) | | — | |
| Realized gains (losses) on closed exchange positions | — | | — | | (1) | | 2 | | 1 | | — | | 2 | | — | | (2) | | — | |
| Decrease in finance lease receivable | — | | 1 | | 5 | | — | | — | | — | | 6 | | — | | (6) | | — | |
| Finance lease income | — | | 2 | | 3 | | — | | — | | — | | 5 | | — | | (5) | | — | |
| Revenues from Planned Divestitures | — | | — | | (1) | | — | | — | | — | | (1) | | — | | 1 | | — | |
| Brazeau penalties | (20) | | — | | — | | — | | — | | — | | (20) | | — | | 20 | | — | |
| Unrealized foreign exchange gain on commodity | — | | — | | (1) | | — | | — | | — | | (1) | | — | | 1 | | — | |
| Adjusted revenues | 77 | | 130 | | 350 | | 149 | | 34 | | — | | 740 | | (7) | | (55) | | 678 | |
| Fuel and purchased power | 3 | | 8 | | 136 | | 102 | | — | | — | | 249 | | — | | — | | 249 | |
| Reclassifications and adjustments: | | | | | | | | | | |
| Fuel and purchased power related to Planned Divestitures | — | | — | | (1) | | — | | — | | — | | (1) | | — | | 1 | | — | |
| Australian interest income | — | | — | | (1) | | — | | — | | — | | (1) | | — | | 1 | | — | |
| Adjusted fuel and purchased power | 3 | | 8 | | 134 | | 102 | | — | | — | | 247 | | — | | 2 | | 249 | |
| Carbon compliance | — | | — | | 39 | | — | | — | | — | | 39 | | — | | — | | 39 | |
| Gross margin | 74 | | 122 | | 177 | | 47 | | 34 | | — | | 454 | | (7) | | (57) | | 390 | |
| OM&A | 47 | | 27 | | 67 | | 19 | | 7 | | 68 | | 235 | | (1) | | — | | 234 | |
| Reclassifications and adjustments: | | | | | | | | | | |
| Brazeau penalties | (31) | | — | | — | | — | | — | | — | | (31) | | — | | 31 | | — | |
| ERP integration costs | — | | — | | — | | — | | — | | (14) | | (14) | | — | | 14 | | — | |
| Acquisition-related transaction and restructuring costs | — | | — | | — | | — | | — | | (16) | | (16) | | — | | 16 | | — | |
| Adjusted OM&A | 16 | | 27 | | 67 | | 19 | | 7 | | 38 | | 174 | | (1) | | 61 | | 234 | |
| Taxes, other than income taxes | 1 | | 3 | | 4 | | — | | — | | — | | 8 | | 1 | | — | | 9 | |
| Net other operating income | — | | (3) | | (10) | | (9) | | — | | — | | (22) | | — | | — | | (22) | |
| Reclassifications and adjustments: | | | | | | | | | | |
| Sundance A decommissioning cost reimbursement | — | | — | | — | | 9 | | — | | — | | 9 | | — | | (9) | | — | |
| | | | | | | | | | |
| Adjusted net other operating income | — | | (3) | | (10) | | — | | — | | — | | (13) | | — | | (9) | | (22) | |
Adjusted EBITDA(2) | 57 | | 95 | | 116 | | 28 | | 27 | | (38) | | 285 | | | | |
| Equity income | | | | | | | | | | 2 | |
| Finance lease income | | | | | | | | | | 5 | |
| | | | | | | | | | |
| Depreciation and amortization | | | | | | | | | | (143) | |
| Asset impairment charges | | | | | | | | | | (20) | |
| Interest income | | | | | | | | | | 11 | |
| Interest expense | | | | | | | | | | (92) | |
| Foreign exchange gain | | | | | | | | | | 17 | |
| | | | | | | | | | |
| Loss before income taxes | | | | | | | | (51) | |
(1)The Skookumchuck wind facility has been included on a proportionate basis in the Wind and Solar segment.
(2)Adjusted EBITDA is not defined and has no standardized meaning under IFRS and may not be comparable to similar measures presented by other issuers. Refer to the Additional IFRS Measures and Non-IFRS Measures section of this MD&A.
| | | | | | | | |
| M72 | TransAlta Corporation | 2024 Integrated Report |
The following table reflects adjusted EBITDA by segment and provides reconciliation to loss before income taxes for the three months ended Dec. 31, 2023:
| | | | | | | | | | | | | | | | | | | | | | | | | | | | | | | | |
| Hydro | Wind & Solar(1) | Gas | Energy Transition | Energy
Marketing | Corporate | Total | Equity- accounted investments(1) | Reclass adjustments | IFRS financials |
| Revenues | 77 | | 94 | | 246 | | 175 | | 39 | | — | | 631 | | (7) | | — | | 624 | |
| Reclassifications and adjustments: | | | | | | | | | | |
| Unrealized mark-to-market (gain) loss | (2) | | 20 | | 53 | | 7 | | (19) | | — | | 59 | | — | | (59) | | — | |
| Realized gain on closed exchange positions | — | | — | | 23 | | — | | 4 | | — | | 27 | | — | | (27) | | — | |
| Decrease in finance lease receivable | — | | — | | 15 | | — | | — | | — | | 15 | | — | | (15) | | — | |
| Finance lease income | — | | — | | 2 | | — | | — | | — | | 2 | | — | | (2) | | — | |
| Unrealized foreign exchange gain on commodity | — | | — | | 1 | | — | | — | | — | | 1 | | — | | (1) | | — | |
| Adjusted revenues | 75 | | 114 | | 340 | | 182 | | 24 | | — | | 735 | | (7) | | (104) | | 624 | |
| Fuel and purchased power | 5 | | 8 | | 127 | | 138 | | — | | — | | 278 | | — | | — | | 278 | |
| Reclassifications and adjustments: | | | | | | | | | | |
| Australian interest income | — | | — | | (1) | | — | | — | | — | | (1) | | — | | 1 | | — | |
| | | | | | | | | | |
| | | | | | | | | | |
| Adjusted fuel and purchased power | 5 | | 8 | | 126 | | 138 | | — | | — | | 277 | | — | | 1 | | 278 | |
| Carbon compliance | — | | — | | 27 | | — | | — | | — | | 27 | | — | | — | | 27 | |
| Gross margin | 70 | | 106 | | 187 | | 44 | | 24 | | — | | 431 | | (7) | | (105) | | 319 | |
| OM&A | 13 | | 25 | | 56 | | 18 | | 10 | | 29 | | 151 | | (1) | | — | | 150 | |
| | | | | | | | | |
| | | | | | | | | | |
| | | | | | | | | | |
| | | | | | | | | | |
| Taxes, other than income taxes | 1 | | 1 | | — | | — | | — | | 1 | | 3 | | — | | — | | 3 | |
| Net other operating income | — | | (3) | | (10) | | — | | — | | — | | (13) | | — | | — | | (13) | |
| Reclassifications and adjustments: | | | | | | | | | | |
| | | | | | | | | | |
| Insurance recovery | — | | 1 | | — | | — | | — | | — | | 1 | | — | | (1) | | — | |
Adjusted net other operating
income | — | | (2) | | (10) | | — | | — | | — | | (12) | | — | | (1) | | (13) | |
Adjusted EBITDA(2) | 56 | | 82 | | 141 | | 26 | | 14 | | (30) | | 289 | | | | |
| Equity income | | | | | | | | | | 3 | |
| Finance lease income | | | | | | | | | | 2 | |
| Depreciation and amortization | | | | | | | | | | (132) | |
| Asset impairment charges | | | | | | | | | | (26) | |
| Interest income | | | | | | | | | | 12 | |
| Interest expense | | | | | | | | | | (66) | |
| Foreign exchange loss | | | | | | | | | | (7) | |
| | | | | | | | | | |
| Loss before income taxes | | | | | | | | (35) | |
(1)The Skookumchuck wind facility has been included on a proportionate basis in the Wind and Solar segment.
(2)Adjusted EBITDA is not defined and has no standardized meaning under IFRS and may not be comparable to similar measures presented by other issuers. Refer to the Additional IFRS Measures and Non-IFRS Measures section of this MD&A.
| | | | | | | | |
| TransAlta Corporation | 2024 Integrated Report | M73 |
Fourth Quarter Reconciliation of Cash Flow from Operations to FFO and FCF
The table below reconciles our cash flow from operating activities to our FFO and FCF:
| | | | | | | | | | | | | | |
| | | | |
| Three months ended Dec. 31 | 2024 | | 2023 | | | |
Cash flow from operating activities(1) | 215 | | | 310 | | | | |
| Change in non-cash operating working capital balances | (97) | | | (135) | | | | |
| Cash flow from operations before changes in working capital | 118 | | | 175 | | | | |
| Adjustments | | | | | | |
Share of adjusted FFO from joint venture(1) | 4 | | | 3 | | | | |
| Decrease in finance lease receivable | 6 | | | 15 | | | | |
Clean energy transition provisions and adjustments(2) | — | | | 4 | | | | |
| Sundance A decommissioning cost reimbursement | (9) | | | — | | | | |
| Realized gain on closed exchanged positions | 2 | | | 27 | | | | |
| Acquisition-related transaction and restructuring costs | 11 | | | — | | | | |
Other(3) | 5 | | | 5 | | | | |
FFO(3) | 137 | | | 229 | | | | |
| Deduct: | | | | | | |
Sustaining capital(1) | (67) | | | (74) | | | | |
| Productivity capital | (1) | | | (1) | | | | |
| Dividends paid on preferred shares | (13) | | | (12) | | | | |
| Distributions paid to subsidiaries’ non-controlling interests | (6) | | | (19) | | | | |
| Principal payments on lease liabilities | (3) | | | (2) | | | | |
| Other | 1 | | | — | | | | |
FCF(4) | 48 | | | 121 | | | | |
| Weighted average number of common shares outstanding in the period | 298 | | | 308 | | | | |
FFO per share(4) | 0.46 | | | 0.74 | | | | |
FCF per share(4) | 0.16 | | | 0.39 | | | | |
(1)Includes our share of amounts for Skookumchuck, an equity-accounted joint venture. The amount for the fourth quarter of 2023 was adjusted to conform to current period presentation.
(2)Includes amounts related to onerous contracts recognized in 2021 and a voluntary contribution to the U.S. Defined Benefit Pension Plan for the Centralia thermal facility.
(3)Other consists of production tax credits, which is a reduction to tax equity debt, less distributions from the equity-accounted joint venture.
(4)These items are not defined and have no standardized meaning under IFRS and may not be comparable to similar measures presented by other issuers. Refer to the Additional IFRS Measures and Non-IFRS Measures section of this MD&A.
| | | | | | | | |
| M74 | TransAlta Corporation | 2024 Integrated Report |
The table below provides a reconciliation of our adjusted EBITDA to our FFO and FCF for the three months ended Dec 31. 2024 and 2023:
| | | | | | | | | | | | | |
| | |
| Three months ended Dec. 31 | 2024 | | 2023 | | |
Adjusted EBITDA(1)(4) | 285 | | | 289 | | | |
| Provisions | 2 | | | (1) | | | |
Net interest expense(2) | (64) | | | (41) | | | |
| Current income tax (expense) recovery | (20) | | | 5 | | | |
| Realized foreign exchange loss (gain) | (20) | | | 9 | | | |
| Decommissioning and restoration costs settled | (12) | | | (15) | | | |
| Other non-cash items | (34) | | | (17) | | | |
FFO(3)(4) | 137 | | | 229 | | | |
| Deduct: | | | | | |
Sustaining capital(4) | (67) | | | (74) | | | |
| Productivity capital | (1) | | | (1) | | | |
| Dividends paid on preferred shares | (13) | | | (12) | | | |
| Distributions paid to subsidiaries’ non-controlling interests | (6) | | | (19) | | | |
| Principal payments on lease liabilities | (3) | | | (2) | | | |
| Other | 1 | | | — | | | |
FCF(3)(4) | 48 | | | 121 | | | |
| | | | | |
(1)Adjusted EBITDA is defined in the Additional IFRS Measures and Non-IFRS Measures section of this MD&A and reconciled to earnings (loss) before income taxes above.
(2)Net interest expense includes interest expense less interest income and excludes non-cash items like financing amortization and accretion.
(3)These items are not defined and have no standardized meaning under IFRS and may not be comparable to similar measures presented by other issuers. FFO and FCF are defined in the Additional IFRS Measures and Non-IFRS Measures section of this MD&A and reconciled to cash flow from operating activities above.
(4)Includes our share of amounts for the Skookumchuck wind facility, an equity-accounted joint venture.
| | | | | | | | |
| TransAlta Corporation | 2024 Integrated Report | M75 |
Key Non-IFRS Financial Ratios
The methodologies and ratios used by rating agencies to assess our credit rating are not publicly disclosed. We have developed our own definitions of ratios and targets to help evaluate the strength of our financial position.
These metrics and ratios are not defined and have no standardized meaning under IFRS and may not be comparable to those used by other entities or by rating agencies.
Adjusted Net Debt to Adjusted EBITDA
| | | | | | | | | | | | | | |
| Year ended Dec. 31 | 2024 | | 2023 | 2022 |
Credit facilities, long-term debt and lease liabilities(1) | 3,808 | | | 3,466 | | 3,653 | |
| Exchangeable debentures | 350 | | | 344 | | 339 | |
Less: Cash and cash equivalents(2) | (336) | | | (345) | | (1,118) | |
Add: 50 per cent of issued preferred shares and exchangeable preferred shares(3) | 671 | | | 671 | | 671 | |
Other(4) | (24) | | | (12) | | (20) | |
Adjusted net debt(5) | 4,469 | | | 4,124 | | 3,525 | |
Adjusted EBITDA(6)(7) | 1,253 | | | 1,632 | | 1,656 | |
| Adjusted net debt to adjusted EBITDA (times) | 3.6 | | | 2.5 | | 2.1 | |
(1)Consists of current and non-current portions of long-term debt, which includes lease liabilities and tax equity financing.
(2)Cash and cash equivalents, net of bank overdraft.
(3)Exchangeable preferred shares are considered equity with dividend payments for credit-rating purposes. For accounting purposes, they are accounted for as debt with interest expense in the consolidated financial statements. For purposes of this ratio, we consider 50 per cent of issued preferred shares, including these, as debt.
(4)Includes principal portion of TransAlta OCP restricted cash ($17 million for 2024, 2023 and 2022) and fair value of hedging instruments on debt (included in risk management assets and/or liabilities on the Consolidated Statements of Financial Position).
(5)The tax equity financing for the Skookumchuck wind facility, an equity-accounted joint venture, is not represented in this amount. Adjusted net debt is not defined and has no standardized meaning under IFRS and may not be comparable to similar measures presented by other issuers. Presenting this item from period to period provides management and investors with the ability to evaluate earnings trends more readily in comparison with prior periods’ results. Refer to the Additional IFRS Measures and Non-IFRS Measures section of this MD&A.
(6)Last 12 months.
(7)During 2024 our adjusted EBITDA composition was amended to exclude the impact of Brazeau penalties and related provisions. Therefore, the Company has applied this composition to all previously reported periods. Refer to the Additional IFRS Measures and Non-IFRS Measures section of this MD&A.
The Company's capital is managed using a net debt position. We use the adjusted net debt to adjusted EBITDA ratio as a measurement of financial leverage and to assess our ability to service debt. Our target for adjusted net debt to adjusted EBITDA is 3.0 to 4.0 times. Our adjusted net debt to adjusted EBITDA ratio for Dec. 31, 2024 was
higher compared to Dec. 31, 2023, due to higher adjusted net debt resulting from the assumption of Heartland debt, lower cash balances due to cash paid to acquire Heartland on Dec. 4, 2024 and lower adjusted EBITDA in 2024 compared to 2023.
| | | | | | | | |
| M76 | TransAlta Corporation | 2024 Integrated Report |
2025 Outlook
For 2025, the Company expects adjusted EBITDA to be in the range of $1.15 to $1.25 billion and FCF to be in the range of $450 to $550 million which is based on the following:
•Higher contribution from the wind and solar portfolio due to a full-year impact of new asset additions of the White Rock and Horizon Hill wind facilities;
•Contribution from assets acquired with Heartland;
•Lower contributions from the legacy merchant hydro, wind and gas assets in Alberta which are expected to
step down due to lower expected average power prices in Alberta given baseload gas and renewables supply additions in late 2024 and 2025;
•Lower current income tax expense in 2025 compared to 2024 actual; and
•Increased net interest expense in 2025 as a result of the Heartland acquisition and lower interest income earned on lower cash deposits and lower capitalized interest on growth projects.
The following table outlines our expectations on key financial targets and related assumptions for 2025 and should be read in conjunction with the narrative discussion that follows and the Governance and Risk Management section of this MD&A:
| | | | | | | | | | | | |
| Measure | 2025 Target | 2024 Target | | 2024 Actual |
Adjusted EBITDA(1) | $1,150 to $1,250 million | $1,150 to $1,300 million | | $1,253 million |
FCF(1)(2) | $450 to $550 million | $450 to $600 million | | $569 million |
| FCF per share | $1.51 to $1.85 | $1.47 to $1.96 | | $1.88 |
| Dividend per share | $0.26 annualized | $0.24 annualized | | $0.24 annualized |
(1)These items are not defined and have no standardized meaning under IFRS and may not be comparable to similar measures presented by other issuers. Refer to the Reconciliation of Non-IFRS Measures section of this MD&A for further discussion of these items, including, where applicable, reconciliations to measures calculated in accordance with IFRS. See also the Additional IFRS Measures and Non-IFRS Measures section of this MD&A.
The Company's outlook for 2025 may be impacted by a number of factors as detailed further below.
Range of key 2025 power and gas price assumptions
| | | | | | | | | | | | | |
| Market | | 2025 Assumptions | 2024 Assumptions | 2024 Actual | |
| Alberta spot ($/MWh) | | $40 to $60 | $75 to $95 | $63 | |
| Mid-Columbia spot (US$/MWh) | | US$50 to US$70 | US$85 to US$95 | US$76 | |
| AECO gas price ($/GJ) | | $1.60 to $2.10 | $2.50 to $3.00 | $1.29 | |
Alberta spot price sensitivity: a +/- $1 per MWh change in spot price is expected to have a +/-$3 million impact on adjusted EBITDA for 2025.
Other assumptions relevant to the 2025 outlook
| | | | | | | | | | | | | |
| Measure | 2025 Expectations | 2024 Expectations | | 2024 Actual | |
| Energy Marketing gross margin | $110 to $130 million | $110 to $130 million | | $167 million | |
| Sustaining capital | $145 to $165 million | $130 to $150 million | | $142 million | |
| Current income tax expense | $95 to $130 million | $95 to $130 million | | $143 million | |
| Net interest expense | $255 to $275 million | $240 to $260 million | | $231 million | |
| | | | | | | | |
| TransAlta Corporation | 2024 Integrated Report | M77 |
Alberta Hedging
| | | | | | | | | | | | | | | | | | |
| Range of hedging assumptions | Q1 2025 | Q2 2025 | Q3 2025 | Q4 2025 | 2026 | |
| Hedged production (GWh) | 2,117 | | 1,758 | | 1,942 | | 1,845 | | 4,713 | | |
| Hedge price ($/MWh) | $72 | $70 | $70 | $70 | $75 | |
| Hedged gas volumes (GJ) | 14 million | 6 million | 6 million | 6 million | 18 million | |
| Hedge gas prices ($/GJ) | $2.98 | $3.63 | $3.77 | $3.65 | $3.67 | |
| | | | | | |
| | | | | | |
Market Pricing
The following graphs include 2025 pricing based on a range of assumptions and are subject to change:
Annual Average Spot Electricity Prices
Annual Average Gas (AECO) Prices
For 2025, spot electricity prices in Alberta are expected to be lower compared to 2024, driven by normalized weather expectations and the addition of new natural gas and cogeneration, and wind and solar supply. Spot electricity prices in the Pacific Northwest are expected to be comparable in 2025, but will depend on natural gas prices and the actual hydrology for the region during the year.
AECO natural gas prices are expected to be higher than in 2024.
The objective of our portfolio management strategy in Alberta is to balance opportunity and risk and to deliver optimization strategies that contribute to our total
investment, which includes a return on invested capital. We can be more or less hedged in a given period, and we expect to realize our annual targets through a combination of forward hedging and selling generation into the spot market. The assets within the Alberta electricity portfolio are managed as a portfolio to maximize the overall value of generation and capacity from our hydro, wind, energy storage and thermal facilities. Hedging is a key component of cash flow certainty and the hedges are primarily tied to our portfolio of gas facilities and also allocated to our portfolio of hydro facilities rather than a single facility.
| | | | | | | | |
| M78 | TransAlta Corporation | 2024 Integrated Report |
Sustaining Capital Expenditures
Our estimate for total sustaining capital is as follows:
| | | | | | | | | |
| | Spent in 2024 | Expected spend in 2025 |
| Total sustaining capital | | $142 million | $145 to $165 million |
The Company expects sustaining capital to be in the range of $145 to $165 million. The midpoint for the range represents an 11 per cent increase from the midpoint of the 2024 expected sustaining capital range of $130 to $150 million, and a nine per cent increase from 2024 sustaining capital spend. This is driven by increased Hydro dam safety spending and the additional capital requirements to support Heartland gas facilities, offset by lower sustaining capital expenditures for planned major maintenance related to our other gas facilities and lower sustaining
capital from our Energy Transition segment as 2025 is our Centralia plant's final year of coal-fired generation.
Liquidity and Capital Resources
We maintain adequate available liquidity under our committed credit facilities. As at Dec. 31, 2024, we had access to $1.6 billion in liquidity, including $336 million in cash, which exceeds the funds required for committed growth, sustaining capital and productivity projects.
Material Accounting Policies and Critical Accounting Estimates
The selection and application of accounting policies is an important process that has developed as our business activities have evolved and as accounting rules and guidance have changed. Accounting rules generally do not involve a selection among alternatives, but involve the implementation and interpretation of existing rules and the use of judgment relative to the circumstances existing in the business. Every effort is made to comply with all applicable rules on or before the effective date and we believe the proper implementation and consistent application of accounting rules is critical.
However, not all situations are specifically addressed in the accounting literature. In these cases, our best judgment is used to adopt a policy for accounting for these situations. We draw analogies to similar situations and the accounting guidelines governing them, consider foreign accounting standards and consult with our independent auditors about the appropriate interpretation and application of these policies. Each of the critical accounting policies involves complex situations and a high degree of judgment either in the application and interpretation of existing literature or in the development of estimates that impact our consolidated financial statements.
Our material accounting policies are described in Note 2 of the consolidated financial statements. Each policy involves a number of estimates and assumptions to be made about matters that are uncertain at the time the estimate is made. Different estimates, with respect to key variables used for the calculations, or changes to estimates, could potentially have a material impact on our financial position or results of operations.
We have discussed the development and selection of these critical accounting estimates with the Audit, Finance and Risk Committee (AFRC) of the Board of Directors and our independent auditors. The AFRC has reviewed and
approved our disclosure relating to critical accounting estimates in this MD&A. These critical accounting estimates are described as follows:
Tariff
On Feb. 1, 2025, the President of the United States issued three executive orders directing the United States to impose new tariffs on imports originating from Canada, Mexico and China. These orders call for additional 25 per cent duty on imports into the United States of Canadian-origin and Mexican-origin products and 10 per cent duty on Chinese-origin products, except for Canadian energy resources that are subject to an additional 10 per cent duty. On Feb. 3, 2025, a 30-day pause on potential tariffs was implemented. The actual tariffs and their impacts to the Company remain uncertain. The Company is assessing the direct and indirect impacts to its business of such tariffs, retaliatory tariffs or other trade protectionist measures implemented as this situation develops.
Revenue Recognition
Revenue from Contracts with Customers
Identification of Performance Obligations
Where contracts contain multiple promises for goods or services, management exercises judgment in determining whether goods or services constitute distinct goods or services or a series of distinct goods or services that are substantially the same and that have the same pattern of transfer to the customer. The determination of a performance obligation affects whether the transaction price is recognized at a point in time or over time. Management considers both the mechanics of the contract and the economic and operating environment of the
| | | | | | | | |
| TransAlta Corporation | 2024 Integrated Report | M79 |
contract in determining whether the goods or services in a contract are distinct.
Transaction Price
In determining the transaction price and estimates of variable consideration, management considers the past history of customer usage and capacity requirements when estimating the goods and services to be provided to the customer. The Company also considers the historical production levels and operating conditions for its variable generating assets.
Allocation of Transaction Price to Performance Obligations
When multiple performance obligations are present in a contract, transaction price is allocated to each performance obligation in an amount that depicts the consideration the Company expects to be entitled to in exchange for transferring the good or service.
The Company’s contracts generally outline a specific amount to be invoiced to a customer associated with each performance obligation in the contract. Where contracts do not specify amounts for individual performance obligations, the Company estimates the amount of the transaction price to allocate to individual performance obligations based on their standalone selling price, which is primarily estimated based on the amounts that would be charged to customers under similar market conditions.
Satisfaction of Performance Obligations
The satisfaction of performance obligations requires management to use judgment as to when control of the underlying good or service transfers to the customer. Determining when a performance obligation is satisfied affects the timing of revenue recognition. Management considers both customer acceptance of the good or service and the impact of laws and regulations such as certification requirements in determining when this transfer occurs. Management also applies judgment to determine whether the invoice practical expedient permits recognition of revenue at the invoiced amount if that invoiced amount corresponds directly with the entity's performance to date.
Revenue from Other Sources
Revenue from Derivatives
Commodity risk management activities involve the use of derivatives such as physical and financial swaps, forward sales contracts, futures contracts and options that are used to earn revenues and to gain market information. These derivatives are accounted for using fair value accounting. The determination of the fair value of commodity risk management contracts and derivative instruments is complex and relies on judgments concerning future prices, volatility and liquidity, among other factors. Some of our derivatives are not traded on an active exchange or extend beyond the time period for which exchange-based quotes are available, requiring us to use
internal valuation techniques or other models such as numerical derivative valuation or scenario analysis.
Merchant Revenue
Revenues from non-contracted capacity (i.e., merchant) are composed of energy payments, at market price, for each MWh produced and are recognized upon delivery.
Financial Instruments
The fair value of a financial instrument is the price that would be received to sell an asset or paid to transfer a liability in an orderly transaction between market participants at the measurement date. Fair values can be determined by reference to prices for instruments in active markets to which we have access. In the absence of an active market, we determine fair values based on valuation models or by reference to other similar products in active markets.
Fair values determined using valuation models require the use of assumptions. In determining those assumptions, we look primarily to external readily observable market inputs. However, if not available, we use inputs that are not based on observable market data.
Level Determinations and Classifications
The Level I, II and III classifications in the fair value hierarchy are utilized by the Company. The fair value measurement of a financial instrument is included in only one of the three levels, the determination of which is based on the lowest level input that is significant to the derivation of the fair value. Refer to Note 14(I) and (II) from our consolidated financial statements for further details on the inputs used for each level.
The effect of using reasonably possible alternative assumptions as inputs to valuation techniques for contracts included in the Level III fair value measurements at Dec. 31, 2024, is an estimated total upside of $200 million (2023 – $194 million) and total downside of $146 million (2023 – $116 million) impact to the carrying value of the financial instruments. Fair values are stressed for unobservable inputs, which can include variable volumes, unobservable prices and wind discounts, among other inputs. The variable volumes are stressed up and down based on historically available production data. Prices are stressed for longer-term deals where there are no liquid market quotes using various internal and external forecasting sources to establish a high and a low price range. Wind discounts represent price to volume relationships and are stressed specific to each location.
In addition to the Level III fair value measurements discussed above, the Brookfield Investment Agreement allows Brookfield the option to exchange all of the outstanding exchangeable securities into an equity ownership interest of up to a maximum of 49 per cent in an entity formed to hold TransAlta’s Alberta Hydro Assets
| | | | | | | | |
| M80 | TransAlta Corporation | 2024 Integrated Report |
after Dec. 31, 2024. The fair value of the option to exchange is considered a Level III fair value measurement, with an estimated downside of $30 million (2023 – $25 million) potential impact to the carrying value of nil as at Dec. 31, 2024 (2023 – nil). The sensitivity analysis has been prepared using the Company’s assessment that a change in the implied discount rate of the future cash flow of one per cent is a reasonably possible change.
Valuation of PP&E and Associated Contracts
At the end of each reporting period, we assess whether there is any indication that PP&E and finite life intangible assets are impaired or whether a previously recognized impairment may no longer exist or may have decreased.
Our operations, the market and business environment are routinely monitored and judgments and assessments are made to determine whether an event has occurred that indicates a possible impairment. If such an event has occurred, an estimate is made of the recoverable amount of the asset or cash-generating unit (CGU) to which the asset belongs. A CGU is the smallest identifiable group of assets that generates cash inflows that are largely independent of the cash inflows from other assets or groups of assets and goodwill is allocated to each CGU or group of CGUs that is expected to benefit from the synergies of the acquisition from which the goodwill arose. The recoverable amount is the higher of an asset’s fair value less costs of disposal or its value in use. Fair value is the price that would be received to sell an asset in an orderly transaction between market participants at the measurement date. In determining fair value less costs of disposal, information about third-party transactions for similar assets is used and if none is available, other valuation techniques, such as discounted cash flows, are used. Value in use is computed using the present value of management’s best estimates of future cash flows based on the current use and present condition of the asset. In estimating either fair value less costs of disposal or value in use using discounted cash flow methods, estimates and assumptions must be made about sales prices, cost of sales, production, fuel consumed, capital expenditures, retirement costs and other related cash inflows and outflows over the life of the facilities, which can range from 30 to 49 years. In developing these assumptions, management uses estimates of contracted and future market prices based on expected market supply and demand in the region in which the facility operates, anticipated production levels, planned and unplanned outages, changes to regulations and transmission capacity or constraints for the remaining life of the facilities.
Discount rates are determined by employing a weighted average cost of capital methodology that is based on capital structure, cost of equity and cost of debt assumptions based on comparable companies with similar
risk characteristics and market data as the asset, CGU or group of CGUs subject to the test. These estimates and assumptions are susceptible to change from period to period and actual results can and often do differ from the estimates and can have either a positive or negative impact on the estimate of the impairment charge and may be material.
The impairment outcome can also be impacted by the determination of CGUs or groups of CGUs for asset and goodwill impairment testing. The allocation of goodwill is reassessed upon changes in the composition of segments, CGUs or groups of CGUs. In respect of determining CGUs, significant judgment is required to determine what constitutes independent cash flows between power facilities that are connected to the same system. We evaluate the market design, transmission constraints and the contractual profile of each facility, as well as our commodity price risk management plans and practices, in order to inform this determination. With regard to the allocation or reallocation of goodwill, significant judgment is required to evaluate synergies and their impacts. Minimum thresholds also exist with respect to segmentation and internal monitoring activities.
We evaluate synergies with regard to opportunities from combined talent and technology, functional organization and future growth potential and we consider our own performance measurement processes in making this determination. No changes arose in our CGUs in 2024.
PP&E impairment charges can be reversed in future periods if circumstances improve. No assurances can be given if any reversal will occur or the amount or timing of any such reversal.
Asset Impairments
During 2024, the Company recorded asset impairment charges of $24 million related to retired assets due to changes in discount rates and cash flow revisions. Refer to Note 24 and 7 in our consolidated financial statements for further details.
Valuation of Goodwill
We evaluate goodwill for impairment at least annually, or more frequently if indicators of impairment exist. If the carrying amount of a CGU or group of CGUs, including goodwill, exceeds the unit’s fair value, the excess represents a goodwill impairment loss.
For the purposes of the 2024 goodwill impairment review, the Company determined the recoverable amounts of the Wind and Solar segment by calculating the fair value less costs of disposal using discounted cash flow projections. In 2024, the Company relied on the recoverable amounts determined in 2023 for the Hydro and Energy Marketing segments in performing the 2024 goodwill impairment review. The recoverable amounts are based on the
| | | | | | | | |
| TransAlta Corporation | 2024 Integrated Report | M81 |
Company’s long-range forecasts for the periods extending to the last planned asset retirement in 2072. The resulting fair value measurement is categorized within Level III of the fair value hierarchy. We have determined there were no goodwill impairments for 2024, 2023 and 2022.
Determining the fair value of the CGUs or group of CGUs is susceptible to changes from period to period as management is required to make assumptions about future cash flows, including estimates of contracted and future market prices based on expected market supply and demand in the region in which the facility operates, anticipated production levels, planned and unplanned outages, changes to regulations and transmission capacity or constraints for the remaining life of the facilities.
The significant assumptions impacting the determination of fair value for the Wind and Solar segment, with a high degree of subjectivity, are the following:
• Forecasts of sales prices for each facility are determined by taking into consideration contract prices for facilities subject to long- or short-term contracts, forward price curves for merchant plants and regional supply-demand balances. Where forward price curves are not available for the duration of the facility’s useful life, prices are determined by extrapolation techniques using historical industry and company-specific data. Merchant electricity prices used in Wind and Solar models ranged between $40 to $225 per MWh during the forecast period (2023 – $35 to $238 per MWh).
• Discount rates used ranged from 6.4 to 7.3 per cent (2023 – 6.4 to 7.5 per cent).
• The White Rock and Horizon Hill wind facilities are subject to location specific price basis, sourced from third party analysis. This analysis is based on models of the transmission system, including assumptions around potential system upgrades as well as forecasted generation and load in the area.
Project Development Costs
Project development costs include external, direct and incremental costs that are necessary for completing an acquisition or construction project. The appropriateness of capitalization of these costs is evaluated each reporting period and amounts capitalized for projects no longer probable of occurring are charged to net earnings (loss). At the end of each reporting period, we assess whether there is any indication that capitalized project development costs are impaired by evaluating the effect of any significant adverse events on projects, including the evaluation of whether the criteria for capitalization continues to be appropriate. During 2024, the Company recognized impairment of project development costs related to projects that are no longer proceeding. Refer to note 7 of our consolidated financial statements.
Useful Life of PP&E
Each significant component of an item of PP&E is depreciated over its estimated useful life. A component is a tangible asset that can be separately identified as an asset and is expected to provide a benefit of greater than one year. Estimated useful lives are determined based on current facts and past experience and take into consideration the anticipated physical life of the asset, existing long-term sales agreements and contracts, current and forecasted demand, the potential for technological obsolescence and regulations. The useful lives of PP&E and depreciation rates used are reviewed at least annually to ensure they continue to be appropriate.
Change in Estimate — Useful Lives
During 2024 and 2023, the Company adjusted the useful lives of certain assets in the Gas segment to reflect changes to the future operating expectations of the assets. This resulted in a decrease of $112 million (2023 - $92 million) in depreciation expense that was recognized in the Consolidated Statement of Earnings in 2024 and 2023, respectively.
Leases
In determining whether the Company's contracts contain, or are, leases, management must use judgment to assess whether the contract provides the customer with the right to substantially all of the economic benefits from the use of the asset during the lease term and whether the customer obtains the right to direct the use of the asset during the lease term. For those agreements considered to contain, or be, leases, further judgment is required to determine the lease term by assessing whether termination or extension options are reasonably certain to be exercised. Judgment is also applied in identifying in-substance fixed payments (included) and variable payments that are based on usage or performance factors (excluded) and in identifying lease and non-lease components (services that the supplier performs) of contracts and in allocating contract payments to lease and non-lease components.
For leases where the Company is a lessor, judgment is required to determine if substantially all of the significant risks and rewards of ownership are transferred to the customer or remains with the Company, to appropriately account for the agreement as either a finance or operating lease. These judgments can be significant and impact how we classify amounts related to the arrangement as either PP&E or as a finance lease receivable on the Consolidated Statements of Financial Position and therefore the amount of certain items of revenue and expense are dependent upon such classifications.
| | | | | | | | |
| M82 | TransAlta Corporation | 2024 Integrated Report |
Income Taxes
Preparation of the consolidated financial statements involves determining an estimate of, or provision for, income taxes in each of the jurisdictions in which we operate. The process also involves making an estimate of taxes currently payable and income taxes expected to be payable or recoverable in future periods, referred to as deferred income taxes. An assessment must also be made to determine the likelihood that our future taxable income will be sufficient to permit the recovery of deferred income tax assets. To the extent that such recovery is not probable, deferred income tax assets must be reduced. The reduction of the deferred income tax asset can be reversed if the estimated future taxable income improves. No assurances can be given if any reversal will occur or the amount or timing of any such reversal. Management must exercise judgment in its assessment of continually changing tax interpretations, regulations and legislation to ensure that deferred income tax assets and liabilities are complete and fairly presented. Differing assessments and applications than our estimates could materially impact the amount recognized for deferred income tax assets and liabilities. Our tax filings are subject to audit by taxation authorities. The outcome of some audits may change our tax liability, although we believe that we have adequately provided for income taxes in accordance with IFRS based on all information currently available. The outcome of pending audits is not known nor is the potential impact on the consolidated financial statements determinable.
Employee Future Benefits
We provide selected pension and other post-employment benefits to employees, such as health and dental benefits. The cost of providing these benefits depends on many factors, including actual plan experience and estimates and assumptions about future experience.
The liabilities for pension, other post-employment benefits and associated pension costs included in annual compensation expenses are impacted by employee demographics, including age, compensation levels, employment periods, the level of contributions made to the plans and earnings on plan assets.
Changes to the provisions of the plans may also affect current and future pension costs. Pension costs may also be significantly impacted by changes in key actuarial assumptions, including, for example, the discount rates used in determining the defined benefit obligation and the net interest cost on the net defined benefit liability. The discount rate used to estimate our obligation reflects high-quality corporate fixed income securities currently available and expected to be available during the period to maturity of the pension benefits.
Defined Benefit Obligation
The liability for pension and post-employment benefits and associated costs included in compensation expenses are impacted by estimates related to changes in key actuarial assumptions, including discount rates. The defined benefit obligation has decreased by $9 million to $146 million as at Dec. 31, 2024, from $155 million as at Dec. 31, 2023. A one per cent increase in discount rates would have a $34 million impact on the defined benefit obligation.
Decommissioning and Restoration Provisions
We recognize decommissioning and restoration provisions for generating facilities and mine sites in the period in which they are incurred if there is a legal or constructive obligation to remove the facilities and restore the site. The amount recognized as a provision is the best estimate of the expenditures required to settle the provision. Expected values are probability weighted to deal with the risks and uncertainties inherent in the timing and amount of settlement of many decommissioning and restoration provisions. Expected values are discounted at the current market-based risk-free interest rate adjusted to reflect the market’s evaluation of our credit standing.
The Company recognizes provisions for decommissioning obligations. Initial decommissioning provisions and subsequent changes thereto, are determined using the Company’s best estimate of the required cash expenditures, adjusted to reflect the risks and uncertainties inherent in the timing and amount of settlement.
On Dec. 4, 2024 as part of the Heartland acquisition, the Company recognized decommissioning and restoration provision of $101 million.
During 2024, the decommissioning and restoration provision increased by $21 million due to revisions in estimated cash flows and timing of cash flows for certain Gas and Hydro assets. The timing of cash flows was adjusted to optimize and maximize efficiencies by staging required reclamation work. Operating assets included in PP&E increased by $14 million and $7 million was recognized as an impairment charge in net earnings related to retired assets.
During 2024, revisions in discount rates increased the decommissioning and restoration provision by $35 million due to a decrease in discount rates. On average, discount rates decreased compared to 2023, with rates ranging from 5.3 to 8.4 per cent as at Dec. 31, 2024. This has resulted in a corresponding increase in PP&E of $18 million on operating assets and the recognition of a $17 million impairment charge in net earnings related to retired assets.
| | | | | | | | |
| TransAlta Corporation | 2024 Integrated Report | M83 |
Other Provisions
Where necessary, we recognize provisions arising from ongoing business activities, such as interpretation and application of contract terms, ongoing litigation and force majeure claims. These provisions and subsequent changes thereto are determined using our best estimate of the outcome of the underlying event and can also be impacted by determinations made by third parties, in compliance with contractual requirements. The actual amount of the provisions that may be required could differ materially from the amount recognized. As part of the acquisition of Heartland, the Company recognized an onerous contract provision of $47 million related to certain natural gas transportation contracts assumed. Payments required under the contracts continue through the first quarter of 2031.
Classification of Joint Arrangements
Upon entering into a joint arrangement, the Company must classify it as either a joint operation or joint venture and the classification affects the accounting for the joint arrangement. In making this classification, the Company exercises judgment in evaluating the terms and conditions of the arrangement to determine whether the parties have rights to the assets and obligations or rights to the net assets. Factors such as the legal structure, contractual arrangements and other facts and circumstances, such as where the purpose of the arrangement is primarily for the provision of the output to the parties and when the parties are substantially the only source of cash flows for the arrangement, must be evaluated to understand the rights of the parties to the arrangement.
Significant Influence
Upon entering into an investment, the Company must classify it as either an investment as an associate or an investment under IFRS 9. In making this classification, the Company exercises judgment in evaluating whether the Company has significant influence over the investee. Significant influence is the power to participate in the financial and operating policy decisions of the investee, but is not control or joint control over those policies. If the Company holds 20 per cent or more of the voting rights in the investee, it is presumed that the entity has significant influence, unless it can be clearly demonstrated that this is not the case. Other factors such as representation on the board of directors, participation in policy-making processes, material transactions between the Company and investee, interchange of managerial personnel or providing essential technical information are considered when assessing if the Company has significant influence over an investee.
| | | | | | | | |
| M84 | TransAlta Corporation | 2024 Integrated Report |
Accounting Changes
Current Accounting Changes
Amendments to IAS 1 — Non-current Liabilities with Covenants and Classification of Liabilities as Current or Non-current
In October 2022, the IASB issued Non-current Liabilities with Covenants, which amends IAS 1 Presentation of Financial Statements, to clarify how conditions with which an entity must comply within 12 months after the reporting period affect the classification of a liability. In January 2020, the IASB issued Classification of Liabilities as Current or Non-current, which amends IAS 1 Presentation of Financial Statements regarding the classification of liabilities as current or non‐current, clarifying that contractual rights and conditions existing at the end of the reporting period are relevant in determining whether the Company has a right to defer settlement of a liability by at least 12 months.
Additionally, the IASB clarified that the classification of a liability is unaffected by the likelihood that an entity will exercise its deferral right. The amendments are applied retrospectively, effective for annual periods beginning on or after Jan. 1, 2024, and were adopted by the Company on that date.
The Company has an Investment Agreement whereby Brookfield Renewable Partners or its affiliates (collectively, Brookfield) invested $750 million in TransAlta through the purchase of exchangeable securities (Exchangeable Securities), which are exchangeable into an equity ownership interest in TransAlta’s Alberta hydro assets in the future. On Jan. 1, 2024, the Company reclassified the Exchangeable Securities from non-current liabilities to current liabilities as the conversion option can be exercised at any time after Dec. 31, 2024, although there is no obligation to deliver cash equivalent resources and the holder cannot call for repayment. This accounting is consistent with the amendment.
Future Accounting Changes
Amendments to IFRS 9 and IFRS 7 — Nature-Dependent Electricity Contracts
On Dec. 18, 2024, the IASB issued amendments to IFRS 9 Financial Instruments and IFRS 7 Financial Instruments: Disclosure to improve reporting of the financial effects of nature-dependent electricity (e.g., wind and solar) contracts, which are often structured as power purchase agreements. Under these contracts, the amount of electricity generated can vary based on uncontrollable factors such as weather conditions. The amendments clarify the application of own-use requirements, permit hedge accounting if these contracts are used as hedging instruments and add new disclosure requirements about the effect of these contracts on a company's financial performance and cash flows. The amendments are effective for annual reporting periods beginning on or after Jan. 1, 2026. The Company is currently evaluating the impacts to the financial statements.
Amendments to IFRS 7 and IFRS 9 — Classification and Measurement of Financial Instruments
On May 29, 2024, the IASB issued Amendments to the Classification and Measurement of Financial Instruments effective Jan. 1, 2026 impacting IFRS 7 and 9. The IASB amended the requirements related to settling financial liabilities using an electronic payment system and assessing contractual cash flow characteristics of financial assets, including those with ESG-linked features. The Company is currently evaluating the impacts to the financial statements.
IFRS 18 — Presentation and Disclosure in Financial Statements
On April 9, 2024, the IASB issued a new standard, IFRS 18 Presentation and Disclosure in Financial Statements, which introduced new requirements for improved comparability in the statement of profit or loss, enhanced transparency of management-defined performance measures and more useful grouping of information in the financial statements. The standard is effective for annual reporting periods beginning on or after Jan. 1, 2027. The Company is currently evaluating the impacts to the financial statements.
| | | | | | | | |
| TransAlta Corporation | 2024 Integrated Report | M85 |
Sustainability
Sustainability, or environmental, social and governance (ESG) management and performance, is a core value at TransAlta. Sustainability is integrated into our governance, decision-making, risk management and day-to-day business processes. Our focus on continuous improvement on material sustainability factors seeks to mitigate ESG-related risks and provides long-term value creation to our stakeholders. TransAlta's sustainability pillars support our corporate strategy and weave through our business. Our sustainability pillars were refreshed in 2024 and include:
•Reliable and Responsible Electricity Production
•Safe, Healthy, Diverse and Engaged Workplace
•Positive Indigenous, Stakeholder, Customer and Employee Relationships
•Environmental Stewardship
•Technology and Innovation
Reporting on Our Material Sustainability Factors
TransAlta has been reporting on sustainability since 1994. The Company's sustainability reporting is integrated within this MD&A to provide information on how sustainability factors affect our business and is guided by leading sustainability reporting frameworks. We partially adopt guidance from the Canadian Sustainability Standards Board, International Sustainability Standards Board, International Financial Reporting Standards (IFRS) Foundation, Integrated Reporting Framework, Global Reporting Initiative (GRI) and the Sustainability Accounting Standards Board (SASB) requirements for electric utilities and power generators. We continue to monitor the development of sustainability- and climate-related disclosure requirements in the jurisdictions in which we operate to assess our future reporting obligations.
Since 2007, TransAlta's material sustainability data to be disclosed has received limited assurance from independent
third-party providers. Climate-related information to be disclosed is partially informed by the IFRS S2 Climate-related Disclosures Standard and the recommendations of the Task Force on Climate-related Financial Disclosures (TCFD).
In 2024, we reviewed and updated our management response to our 2021 climate-related scenario analysis. We also reviewed and updated our Climate Transition Plan and climate-related financial metrics. GHG emissions data for scopes 1, 2 and 3 follow the accounting and reporting standards of the GHG Protocol. For further information on climate change management and the findings of our scenario analysis, refer to the Transitioning Our Energy Mix section of this MD&A.
Disclosure of our most relevant sustainability factors in 2024 remained unchanged from 2022 and is guided by our most recent materiality assessment. In 2022, we refreshed our materiality assessment by evaluating key sector-specific research, supported by internal and external engagement on key sustainability factors. Our Enterprise Risk Management (ERM) program is designed to help the Company focus its efforts on key enterprise risks, within the planning horizon that could significantly impact the success of our strategy, including our sustainability objectives.
Key topics identified within SASB, TCFD, IFRS and the Taskforce on Nature-related Financial Disclosures (TNFD) were reviewed to inform the identification of our material sustainability factors. We also considered sustainability factors from the electricity sector through Electricity Canada’s 2021 Sustainable Electricity Report and conducted a peer review of material sustainability factors. This work, validated by our executive team, resulted in the identification of 21 material sustainability factors, which are presented in the Sustainability Governance section of this MD&A.
For further guidance on our risk factors, refer to the Governance and Risk Management section of this MD&A.
| | | | | | | | |
| M86 | TransAlta Corporation | 2024 Integrated Report |
Our 2024 Sustainability Performance
Performance against our 2024 sustainability targets is outlined below and excludes the acquisition of Heartland Generation on Dec. 4, 2024 (refer to the Significant and Subsequent Events section of this MD&A). Target year means by Dec. 31 of that year. For more information on all our sustainability performance indicators, refer to the Sustainability Performance Indicators section of this report.
ESG Alignment: Environmental
| | | | | | | | | | | | | | | | | | | | |
| Sustainability goal | Sustainability target | Results | Comments | | | |
| Reduce GHG emissions | By 2026, achieve a 75 per cent reduction of scope 1 and 2 GHG emissions from 2015 base year(1) | On track | Since 2015, we have reduced scope 1 and 2 GHG emissions by 22.7 MT CO2e or 70 per cent. | | | |
By 2045, achieve net-zero for 100 per cent of TransAlta’s scope 1 and 2 GHG emissions(2) | On track | | | |
| By 2024, verify and disclose 80 per cent of TransAlta’s scope 3 emissions | Achieved | We received limited assurance on 93 per cent of TransAlta’s scope 3 emissions in 2024. | | | |
| Reduce air emissions | By 2026, achieve a 95 per cent reduction of SO2 emissions and an 80 per cent reduction of NOx emissions below 2005 levels | Achieved in 2022 | We achieved this target in 2022 through the reduction of our SO2 emissions by 98 per cent and NOx emissions by 83 per cent from 2005 levels. In 2024, we retained the achievement of this target. | | | |
| Reclaim land utilized for mining | By 2040, complete full reclamation of our Centralia coal mine in Washington State | On track | Reclamation work at Centralia is underway and 44 per cent of the coal mine land has been reclaimed. | | | |
| By 2046, complete full reclamation of our Highvale coal mine in Alberta | On track | Our Highvale coal mine in Alberta closed in 2021. Reclamation work is underway and 22 per cent of the coal mine land has been reclaimed. | | | |
| Responsible water management | By 2026, reduce fleet-wide water consumption (withdrawals minus discharge) by 20 million m3 or 40 per cent over a 2015 baseline | Achieved in 2022 | We achieved this target in 2022 through the reduction of our fleet-wide water consumption by approximately 20 million m3 or 43 per cent from 2015 levels. In 2024, we retained the achievement of this target. | | | |
| Protecting nature and biodiversity | By 2024, assess and disclose nature-related risks and opportunities including TransAlta’s dependencies and impacts on ecosystems, land, water and air | Achieved | Assessment of nature-related risks and opportunities was completed in 2024. | | | |
Achieve zero biodiversity-related incidents(3) | Achieved | We recorded zero (0) biodiversity-related incidents. | | | |
(1)Gross GHG emissions reduction target, which does not include utilization of internally generated and externally purchased emission credits. TransAlta does not plan to use carbon credits to achieve its 2026 GHG emissions reduction target.
(2)Target covers 100 per cent of TransAlta's operating assets. The Company may choose to neutralize residual emissions from gas-fired generation through fuel switching, new technologies or nature-based solutions to achieve its 2045 net-zero target. For further information, refer to the Climate Transition Plan in the Transitioning Our Energy Mix section of this MD&A.
(3)Biodiversity-related incidents are significant environmental incidents that affect habitats and species included on the Red List of the International Union for Conservation of Nature and are classified as near-threatened, vulnerable, endangered and critically endangered.
| | | | | | | | |
| TransAlta Corporation | 2024 Integrated Report | M87 |
ESG Alignment: Social
| | | | | | | | | | | |
| Sustainability goal | Sustainability target | Results | Comments |
| Reduce safety incidents | Achieve a Total Recordable Injury Frequency (TRIF) rate below 0.32 with a goal of 0.00 | Not Achieved | We recorded a TRIF rate of 0.56 compared to 0.30 in 2023. We recorded zero serious injuries in 2024. The identification and control of high-energy hazards is foundational to our strong performance on serious injury prevention. |
| Integrate sustainability into supply chain | By 2024, 80 per cent of our spend will be with suppliers that have a sustainability policy or commitment | Not Achieved | On average, 79 per cent of our spend in 2022, 2023 and 2024 was with suppliers that have a sustainability policy or commitment. |
| Support prosperous Indigenous communities | Support equal access to all levels of education for youth and Indigenous peoples through financial support and employment opportunities | On track | Support represented a total value of $320,000, or 11 per cent of TransAlta’s total community investment. |
Provide Indigenous cultural awareness training during the onboarding of all new TransAlta employees(1) | Achieved | We provided Indigenous awareness training to 100 per cent of employees in Canada, the U.S. and Western Australia onboarded in 2024. |
ESG Alignment: Governance
| | | | | | | | | | | |
| Sustainability goal | Sustainability target | Results | Comments |
| Strengthen gender equality | Achieve 50 per cent female representation on the Board by 2030 | On track | As at Dec. 31, 2024, women represented 38 per cent of our Board composition, compared to 46 per cent in 2023.(2) |
| Achieve at least 40 per cent female employment among all employees of the Company by 2030 | On track | As at Dec. 31, 2024, women represented 28 per cent of all employees, an increase over 2023 levels (27 per cent). |
| Maintain equal pay for women in equivalent roles as men | Achieved | We achieved a 99 per cent female/male pay equity ratio. We strive to maintain this ratio within a deviation of plus or minus three per cent. |
| Demonstrate leadership on ESG reporting within financial disclosures | Maintain our position as a leader on integrated ESG disclosure through increased annual alignment with leading sustainability disclosure frameworks | On track | In 2024, TransAlta received an award for best ESG reporting (mid-cap) by the IR Magazine Canada. We also received the Sustainability, ESG and Purpose Award from the Governance Professionals of Canada. This award underscores our commitment to embedding sustainability into our governance, strategy and risk management practices.(3) |
(1)TransAlta employees have 60 days to complete onboarding training; hence, this target refers to employees onboarded from Jan. 1 to Oct. 31, 2024.
(2)Board composition includes all independent directors, and our President and CEO who is not independent. In 2024, we achieved 50 per cent female representation on the Board, excluding the two nominees from Brookfield.
(3)A description of the specific set of criteria and/or methodology used by the IR Magazine Canada can be found at https://events.irmagazine.com/canadaawards. The Governance Professionals of Canada 2024 Report of the Judges can be found at https://www.flipsnack.com/gpcanada/2024-gpc-eg-awards-judges-report/full-view.html.
| | | | | | | | |
| M88 | TransAlta Corporation | 2024 Integrated Report |
ESG Alignment: Environmental and Social
| | | | | | | | | | | |
| Sustainability goal | Sustainability target | Results | Comments |
| Coal transition | No further coal generation by the end of 2025 with 100 per cent of our owned net generation capacity to be from renewables and gas | On track | We retired 670 MW of coal-fired generation at Centralia on Dec. 31, 2020. In 2021, we retired or converted all coal plants in Canada and closed the Highvale coal mine, thus ceasing all coal generation in Canada. We plan to cease coal-fired generation at our Centralia plant by Dec. 31, 2025. |
| Clean energy solutions for customers | Develop new renewable projects that support customer sustainability goals to achieve both long-term power price affordability and carbon reductions | On track | Since 2021, we have added over 800 MW of new capacity through renewable projects such as Windrise (206 MW), Garden Plain (130 MW), Northern Goldfields Solar (48 MW), White Rock (302 MW) and Horizon Hill (202 MW). As a result, our U.S. renewables fleet represents over 1 GW. |
2025+ Sustainability Targets
Our 2025 and longer-term sustainability targets support the performance of our business. Goals and targets are established to manage current and emerging material sustainability factors in support of the United Nations Sustainable Development Goals (UN SDGs) and the Future-Fit Business Benchmark, which defines sustainable goals for businesses.
In 2024, TransAlta updated four sustainability targets in the areas of air emissions, water resources, safety and Indigenous relations, while setting a new climate-related target to achieve a 30 per cent reduction of our scope 1 and 2 GHG emissions intensity by 2030 from a 2023 base year.
We have maintained our climate-related targets to achieve net-zero of scope 1 and 2 GHG emissions by 2045 and to reduce 75 per cent of our scope 1 and 2 GHG emissions by 2026 from a 2015 base year. This target covers 100 per cent of TransAlta's operating assets and is estimated to align with the electricity sector decarbonization pathway to limit global warming to 1.5°C, as one of the Paris Agreement goals.
Targets are outlined below. Target year means by Dec. 31 of that year.
| | | | | | | | |
| TransAlta Corporation | 2024 Integrated Report | M89 |
ESG Alignment: Environmental
| | | | | | | | |
| Sustainability goal | Sustainability target | Alignment with UN SDG Target or Future-Fit Business Benchmark |
| Reduce GHG emissions | By 2026, achieve a 75 per cent reduction of scope 1 and 2 GHG emissions from 2015 base year(1) | UN SDG Target 13.2: "Integrate climate change measures into national policies, strategies and planning" |
| By 2030, achieve a 30 per cent reduction of scope 1 and 2 GHG emissions intensity from 2023 base year |
By 2045, achieve net-zero for scope 1 and 2 GHG emissions(2) |
| Reduce air emissions | By 2030, achieve a 90 per cent reduction of SO2 emissions intensity from 2023 base year | UN SDG Target 9.4: "By 2030, upgrade infrastructure and retrofit industries to make them sustainable, with increased resource-use efficiency and greater adoption of clean and environmentally sound technologies and industrial processes" |
| Reclaim land utilized for mining | By 2040, complete full reclamation of our Centralia coal mine in Washington State | Future-Fit Business Benchmark: "Positive Pursuits 13: Ecosystems are restored"
|
| By 2046, complete full reclamation of our Highvale coal mine in Alberta | Future-Fit Business Benchmark: "Positive Pursuits 13: Ecosystems are restored" |
| Manage water resources | By 2030, maintain water consumption intensity at 2023 levels | UN SDG Target 6.4: "By 2030, substantially increase water-use efficiency across all sectors and ensure sustainable withdrawals and supply of freshwater to address water scarcity and substantially reduce the number of people suffering from water scarcity" |
| Protect nature and biodiversity | Achieve zero biodiversity-related incidents(3) | UN SDG Target 15.5: "Take urgent and significant action to reduce the degradation of natural habitats, halt the loss of biodiversity and, by 2020, protect and prevent the extinction of threatened species” |
| Transition away from coal | Cease coal generation by the end of 2025 with 100 per cent of our owned net generation capacity to be from renewables and gas | UN SDG Target 7.1: "By 2030, ensure universal access to affordable, reliable and modern energy services" |
(1)Gross GHG emissions reduction target, which does not include utilization of internally generated and externally purchased emission credits. TransAlta does not plan to use carbon credits to achieve its 2026 GHG emissions reduction target. The Company may choose to update this target to include the acquisition of Heartland Generation on Dec. 4, 2024, in alignment with internationally recognized methodologies such as the GHG Protocol.
(2)Target covers 100 per cent of TransAlta's operating assets. The Company may choose to neutralize residual emissions from gas-fired generation through fuel switching, new technologies or nature-based solutions to achieve its 2045 net-zero target. For further information, refer to the Climate Transition Plan in the Transitioning Our Energy Mix section of this MD&A.
(3)Biodiversity-related incidents are significant environmental incidents that affect habitats and species included on the Red List of the International Union for Conservation of Nature and are classified as near-threatened, vulnerable, endangered and critically endangered.
| | | | | | | | |
| M90 | TransAlta Corporation | 2024 Integrated Report |
ESG Alignment: Social
| | | | | | | | |
| Sustainability goal | Sustainability target | Alignment with UN SDG Target or Future-Fit Business Benchmark |
| Reduce safety incidents | Achieve a Total Recordable Injury Frequency rate below 0.37 with a goal of 0.00 | UN SDG Target 8.8: "Protect labour rights and promote safe and secure working environments for all workers, including migrant workers, in particular women migrants, and those in precarious employment" |
| Support prosperous Indigenous communities | Support access to education and wellbeing for Indigenous communities | UN SDG Target 4.5: "By 2030, eliminate gender disparities in education and ensure equal access to all levels of education and vocational training for the vulnerable, including persons with disabilities, Indigenous peoples and children in vulnerable situations" |
| Provide Indigenous cultural awareness training during the onboarding of all new TransAlta employees | UN SDG Target 12.8: "By 2030, ensure that people everywhere have the relevant information and awareness for sustainable development and lifestyles in harmony with nature" |
ESG Alignment: Governance
| | | | | | | | |
| Sustainability goal | Sustainability target | Alignment with UN SDG Target or Future-Fit Business Benchmark |
| Strengthen gender equality | Achieve 50 per cent female representation on the Board by 2030 | UN SDG Target 5.5: "Ensure women’s full and effective participation and equal opportunities for leadership at all levels of decision making in political, economic and public life" |
| Achieve at least 40 per cent female employment among all employees of the Company by 2030 |
| Maintain equal pay for women in equivalent roles as men |
| | | | | | | | |
| TransAlta Corporation | 2024 Integrated Report | M91 |
Transitioning Our Energy Mix
We recognize the impact of climate change on society and our business both today and into the future. TransAlta's renewable energy journey began 113 years ago when we built the first hydro assets in Alberta, which still operate today. In 1993, we began operating our first wind facility, which was the first commercial wind facility in Canada; in 2014, we acquired our first solar facility; and, in 2020, we constructed our first battery storage facility. Today, we operate 60 renewable power facilities across Canada, the U.S. and Western Australia.
Our reporting on climate change management has been guided by the TCFD recommendations since 2018. In 2024, we partially adopted guidance from IFRS S2, which is based on the TCFD recommendations with industry-specific climate metrics based on the SASB standards.
Strategy and Risk Management
Climate Change Strategy
As described in the following sections, our risks and opportunities assessment and scenarios analysis support the development and continuous improvement of our climate change strategy. We actively monitor and manage climate-related risks and opportunities to ensure we remain resilient across scenarios.
TransAlta remains committed to creating a path to resiliency in a decarbonizing world in support of the goals adopted under the Paris Agreement, and the goals adopted during subsequent international climate meetings. Our strategy is focused on the operation of our existing assets (wind, hydro, solar, natural gas, battery storage and coal), the phase-out of coal-fired electricity generation, the development of renewable energy and storage, and the use of natural gas generation to ensure reliability.
Our customers continue to integrate climate risk into their business decisions; therefore, we see an advantage in our renewable power business to support our customers' sustainability goals. From 2000 to 2024, we increased our nameplate renewable power capacity from approximately 900 MW to over 3,600 MW. Today, TransAlta is one of the largest producers of wind power in Canada, and the largest producer of hydro power in Alberta.
Another way we contribute to our customers’ sustainability goals is through environmental attributes. The environmental attributes we generate include carbon offsets, renewable energy credits and emission offsets. Our customers use environmental attributes to lower compliance costs attributed to carbon policies or renewable portfolio standards. Environmental attributes can also help achieve voluntary corporate sustainability or carbon reduction goals.
To combat the challenges of renewable energy intermittency, we continue to invest in battery storage and evaluate the role of natural gas to provide reliability and flexibility. In 2020, we launched WindCharger, a "first-of-its-kind in Alberta" battery storage project that stores energy produced by our Summerview II wind facility and discharges electricity into the Alberta grid during system supply shortages, as well as providing critical system support services to the system operator. This project received co-funding from Emissions Reduction Alberta. Further, in 2021, we agreed to provide solar electricity supported with a battery energy storage system to BHP Nickel West through the construction of the Northern Goldfields hybrid solar project in Western Australia. The Northern Goldfields solar and battery storage facilities were commissioned in 2023. In 2022, TransAlta entered into an agreement for the expansion of the Mount Keith 132kV transmission system. The expansion was completed in February 2024.
We have also taken important steps to reduce our carbon footprint over the last several years. In 2021, we adopted a more stringent climate-related target to reduce 75 per cent of scope 1 and 2 GHG emissions by 2026 from a 2015 base year. This target covers 100 per cent of TransAlta's operating assets and is estimated to align with the electricity sector decarbonization pathway to limit global warming to 1.5°C, as one of the Paris Agreement goals. Furthermore, we adopted a long-term climate-related target to achieve net-zero for 100 per cent of TransAlta’s scope 1 and 2 GHG emissions by 2045. This target aligns with the Canadian Net-Zero Emissions Accountability Act to achieve net-zero emissions by 2050.
Since 2018, we have retired 4,464 MW of coal-fired generation capacity, while converting 1,659 MW to natural gas. Comparatively, our converted natural gas units' CO2 intensity is approximately 57 per cent less than coal-fired generation. Repurposing these facilities rather than decommissioning them reduces the cost and emissions associated with new construction, and aligns with the UN SDGs, specifically "Goal 9: Industry, Innovation and Infrastructure." Completed conversions and the closure of our Highvale coal mine also contribute to the goals of the Powering Past Coal Alliance, which TransAlta joined in 2021 at COP26. In 2025, we plan to cease coal-fired operations at our sole remaining coal unit, located in the U.S., to complete TransAlta's transition away from coal-fired electricity generation.
We engage with policymakers and stakeholders involved in the energy transition to ensure that parties understand the need to maintain reliable, sustainable and affordable energy as countries move to net-zero electricity systems. At TransAlta, we plan to continue investing in renewables and assessing the best options to deliver energy storage.
| | | | | | | | |
| M92 | TransAlta Corporation | 2024 Integrated Report |
At the same time, we believe that natural gas plays an essential role in the electricity sector, providing critical reliable, dispatchable generation to support current systems demands.
Climate Transition Plan
A climate-related transition plan describes how a company aims to minimize climate-related risks and increase opportunities, in alignment with IFRS S2 and TCFD. In 2024, TransAlta updated its Climate Transition Plan, which outlines our approach to reducing operational and value chain emissions with the target to deliver net-zero operations by 2045. Our Climate Transition Plan includes sustainable finance and inclusive transition actions that reflect TransAlta's commitment to a progress toward a lower-carbon economy. For further information, refer to Sustainable Finance in the Transitioning Our Energy Mix section of this MD&A and Inclusive Transition in the Engaging with Our Stakeholders to Create Positive Relationships section of this MD&A.
Our Climate Transition Plan defines TransAlta's past, short-term (2025-2027) and medium- to long-term actions (beyond 2028). For each of these actions, we assessed our ability to control (C) intended outcomes, partner (P) with stakeholders to drive outcomes or influence (I) outcomes that will help us achieve our decarbonization targets.
The highest level of climate-change oversight, including the actions of our Climate Transition Plan, is at the Board of Directors (Board) level. For further information, refer to Oversight by the Board of Directors in the Climate Change Governance section of this MD&A. Information on executive compensation linked to climate-related targets is described in ESG-Linked Compensation in the Building a Diverse and Inclusive Workforce section of this MD&A. Metrics and targets supporting our Climate Transition Plan, including climate-related financial metrics, are described in Climate Change Metrics and Targets in the Transitioning Our Energy Mix section of this MD&A.
| | | | | | | | |
| TransAlta Corporation | 2024 Integrated Report | M93 |
| | | | | | | | | | | |
| Past actions | Short-term actions (2025-2027) | Medium to long-term actions (2028 +) |
| Hydro | Became the largest producer of hydro power in Alberta (C) | Evaluate and deploy investments in renewable projects, where appropriate (C) | Evaluate and deploy investments in renewable projects, where appropriate (C) |
| Wind and solar | From 2000 to 2024, we grew our nameplate renewables capacity by approximately 2,200 MW (C) |
| Battery storage | First battery storage facility delivered in 2020 (C) In 2023, completed the construction of a 48 MW solar and battery storage system in Western Australia (C) | Evaluate and deploy battery storage, where appropriate (C) | Evaluate and deploy battery storage, where appropriate (C) |
| Natural gas | Converted 1,659 MW from coal to natural gas since 2018 (C) Completed our coal-to-gas conversions in Canada in 2021 (C) | Operate simple-cycle, combined-cycle and cogeneration facilities in Canada, the U.S. and Western Australia (C) Assess deployment of nature-based or engineered solutions to neutralize unabated gas-fired generation where appropriate (C) Evaluate use of renewable and low-carbon natural gas (C) | Neutralize residual GHG emissions (scopes 1 and 2) from gas-fired generation through fuel switching, new technologies or nature-based solutions (C) |
| Emerging abatement technologies and solutions | In 2023, started partnership to target early-stage revolutionary technologies through a US$25 million investment in a deep decarbonization fund (P) In 2023, started an electric vehicle pilot project in our hydro operations (C) In 2024, started a partnership to study the deployment of a small modular nuclear reactor at the site of an existing coal-to-gas plant in Alberta (P) In 2024, continued to support the development of low-cost, low-emissions hydrogen production through a $2 million investment in a Canadian-based venture (P) | Identify the next generation of power solutions and technologies and potential for parallel investments in new complementary sectors by the end of 2025 (P) Assess ways to support customers with broader decarbonization technologies beyond electrification (P) Identify opportunities to partner, pilot and deploy novel, net-zero generation technologies (P) Assess and deploy GHG removal technologies where appropriate (C) Evaluate the electrification of our vehicle fleet (C) | Deploy new net-zero generation technologies and solutions where appropriate (C) Choose materials, products and processes that generate fewer GHG emissions, mainly through energy savings (C) Evaluate the electrification of our vehicle fleet (C) |
| Energy transition (coal) | Retired 4,464 MW of coal-fired generation capacity since 2018 including ending coal generation in Canada in 2021 (C) Ceased coal mining in Canada in 2021 and in the U.S. in 2006 (C) In 2023, started partnership to repurpose landfilled fly ash to advance low-carbon concrete projects in Alberta (P) | Continue to execute reclamation work at our coal mines (C) Cease coal-fired generation by the end of 2025 (C) Contribute to a circular economy through mining waste reuse or by-product sales (C) | Complete full reclamation in Washington State by 2040 and in Alberta by 2046 (C) |
| | | | | | | | |
| M94 | TransAlta Corporation | 2024 Integrated Report |
Climate Transition Plan (Continued)
| | | | | | | | | | | |
| Past actions | Short-term actions (2025-2027) | Medium to long-term actions (2028 +) |
| Supply chain | Enhanced supplier management functionality within the corporate procurement system (C) From 2022 to 2024, 79 per cent of our spend was with suppliers that had a sustainability policy or commitment (C) | Develop ESG criteria for supply chain engagement (C) Understand direct suppliers, their GHG emissions profile and targets (C) Incorporate ESG data reporting capability in corporate procurement system (C) | Engage with suppliers to explore enhancement of their GHG emissions reduction targets (I) Consider setting direction for engaging suppliers with GHG emissions reduction targets (C) |
| Value chain | Updated scope 3 GHG emissions reporting methodology (C) In 2024, verified and disclosed 93 per cent of our total scope 3 emissions (C) | Consider scope 3 GHG emissions targets (C) Consider verification and disclosure of remaining scope 3 GHG emissions (C) | Consider scope 3 GHG emissions targets (C)
|
| Sustainable finance | In 2021, converted existing $1.3 billion loan into a Sustainability-Linked Loan aligned with our GHG emissions reduction and female employment targets (C) In 2021, secured $173 million green bond financing for an eligible wind project in Alberta (C) In 2022, issued US$400 million Senior Green Bonds for eligible renewable energy and energy-efficiency projects (C) Linked ESG performance to employees’ and executive remuneration (C) | Continue to evaluate the use of sustainable or green financing instruments to fund renewable energy and battery storage projects (C) Link ESG performance to employees’ and executive remuneration (C) | Continue to evaluate the use of sustainable or green financing instruments to grow our renewables and storage capacity (C) Link ESG performance to employees’ and executive remuneration (C) |
| Inclusive transition | Developed a five-year Equity, Diversity and Inclusion (ED&I) strategy (C) Conducted an ED&I census to measure progress (C) Set employee engagement and ED&I targets as part of ESG-linked compensation (C) Since 2023, launched four employee resource groups (C) Since 2022, provided Indigenous cultural awareness training to all employees (C) From 2012 to 2023, invested US$55 million to support energy efficiency, economic and community development and education and retraining initiatives in Washington State (P) Since 2016, invested in the communities impacted by the phase-out of coal generation in Alberta (P) | Empower employees through culture champions to foster a culture of allyship, inclusion and belonging (C) Adapt workplaces to incorporate structural changes for inclusive work environments (C) Embed ED&I into our culture strategy and daily work activities (C) Continue to invest in the communities impacted by the phase-out of coal generation in Alberta (P) Strengthen Indigenous relations focused on community engagement and consultation, community investment and partnership opportunities (P) Promote supplier diversity in our operations (C) | Advance recruitment and retention of female employees to progress towards gender-based targets (C) Maintain succession practices to increase diverse representation at the senior management level (C) Increase female representation in Generation by encouraging women to pursue a career in electricity (C) Enhance opportunities for diverse suppliers in our procurement processes (C) Continue to enhance our Indigenous relations focused on partnership opportunities with local communities (P) Provide ongoing support to local community organizations aligned with our community investment pillars where we operate and grow (P) |
| | | | | | | | |
| TransAlta Corporation | 2024 Integrated Report | M95 |
Climate Change Governance
Climate-related risks and opportunities can significantly impact our business. We therefore actively manage such risks and opportunities so that we can continue to grow and achieve our goals. Climate-related issues are identified at every level of management, including the Board, executive team, business units and corporate functions.
Oversight by the Board of Directors
The highest level of climate change oversight is at the Board level. Specific oversight of certain aspects of the Company's response to climate change is delegated to the Board, its Governance, Safety and Sustainability Committee (GSSC), Audit, Finance and Risk Committee (AFRC), and Investment Performance Committee (IPC).
Meeting quarterly, the GSSC assists the Board in monitoring and assessing compliance with climate change regulation and reporting. The GSSC receives management reports on changes in climate-related legislation and the potential impact of policy developments on TransAlta's business. The GSSC also supports the Board in overseeing Company-wide climate change strategies, policies and practices. The GSSC also reviews environmental protection guidelines, including with respect to GHG mitigation, and considers whether our environmental procedures are being implemented effectively.
The AFRC and IPC also play an important role in managing TransAlta's climate-related risks and opportunities. The AFRC assists the Board in overseeing the integrity of our consolidated financial statements and considers climate risks and opportunities related to our financial decision-making. The AFRC is also responsible for approving our Commodity and Financial Exposure Management policies and reviewing quarterly ERM reporting. The IPC considers and assesses risks related to capital investment projects, including overseeing climate risk assessments and mitigation plans.
The Board reviews and updates the Company's strategy annually. In 2024, the Board's strategic planning sessions included climate-related issues considering growth initiatives and strategies, capital allocation, policy development and other matters. Our Board is comprised of individuals with a mix of skills, knowledge and experience critical to our strategy success and business growth. In 2024, three of our 12 Board members identified environment/climate change among their top four relevant competencies. Given the breadth of experience and skills of each director, the Board skills matrix lists only the top four competencies of each director nominee, based on the Board’s assessment and each director’s self-evaluation. Criteria used to assess competence on climate-related issues include the director's knowledge of corporate responsibility practices and sustainable development practices, including as they pertain to climate change.
For further information regarding Board members competence on climate-related issues, refer to TransAlta's Management Proxy Circular.
Role of Senior Management
TransAlta’s President and CEO maintains the highest level of oversight on climate-related issues at the executive level. Senior management of the Company, including our President and CEO, provide the Board with updates on climate-related risks and opportunities to inform business strategy, mitigate risk, and ensure alignment with TransAlta’s GHG emissions reduction goals.
Our business units and corporate functions work closely together to support the executive team in understanding climate-related risks and opportunities, including legislative and regulatory developments. Our executive team reviews such risks and opportunities quarterly and reports to the GSSC and AFRC, as applicable.
At the business unit level, climate change risks are identified through our Total Safety Management System, asset management function and systems, energy and trading business, communication with stakeholders, active monitoring and participation in working groups.
Notably, we link our annual incentive plans (short-term incentive and long-term incentives) to our strategic goals. In 2024, our strategic goals included growing renewable energy and supporting our customers' sustainability goals to decarbonize through on-site renewable energy generation.
For further information on incentives for ESG performance, refer to the discussion on ESG-Linked Compensation in Building a Diverse and Inclusive Workforce section of this MD&A.
Climate Scenarios
In 2021, TransAlta conducted climate scenario analysis to understand risks and opportunities and assess our strategy's resiliency under several potential future climate scenarios. The analysis used scenarios from the International Energy Agency’s (IEA) World Energy Outlook 2020, a large-scale simulation model designed to replicate how energy markets function. We used three scenarios: Stated Policies (STEPS); Sustainable Development (SDS); and Net-Zero Emissions by 2050 (NZE).
In STEPS, the energy system has no major additional climate and environmental policies enacted by government(s). STEPS assumes that carbon pricing continues in Canada while no carbon price is set in the U.S. or Australia. STEPS also assumes that the power sector reduces emissions by 45 per cent by 2040 while natural gas generation capacity increases. Finally, STEPS is limited to the deployment of commercial-ready technologies, including wind and solar.
| | | | | | | | |
| M96 | TransAlta Corporation | 2024 Integrated Report |
In SDS, the goals of the Paris Agreement (2015) are achieved, resulting in net-zero emissions by 2070. The SDS assumes a rapid increase in clean energy policies and investments that position the energy system to also achieve key UN SDGs. In SDS, all current net-zero pledges are achieved and there are extensive efforts to reduce emissions. SDS assumes that carbon pricing continues in Canada and is set in the U.S. and Australia. It also assumes that the power sector reduces emissions by 90 per cent by 2040 while natural gas capacity remains stable into 2030 and declines toward 2040. Finally, SDS assumes that beyond wind and solar, the energy system relies on batteries, storage and some level of carbon capture, utilization and storage (CCUS) and hydrogen.
NZE represents a pathway for the global energy sector to achieve net-zero emissions by 2050. This scenario also assumes key energy-related SDGs are achieved through universal energy access by 2030 and major improvements in air quality.
NZE is built upon the idea that a global increase in electrification supports the journey to net-zero. It assumes that an aggressive carbon price is set in Canada, the U.S. and Australia. It also assumes the power sector reaches net-zero emissions by 2035 in advanced economies while natural gas capacity is stable to 2030 and declines significantly into 2040. Like the SDS, NZE assumes that beyond wind and solar, the energy system relies on batteries, storage and some level of CCUS and hydrogen.
In 2024, we reviewed the findings from the climate scenario analysis and updated the management response accordingly.
| | | | | | | | |
| TransAlta Corporation | 2024 Integrated Report | M97 |
Key Climate Scenario Findings
In 2021, TransAlta used climate scenarios from the IEA World Energy Outlook 2020 to analyze the resiliency of our business and determine specific risks and opportunities for our individual assets. All three scenarios present opportunities for TransAlta’s growth related to renewables, storage solutions and ancillary services. Our scenario analysis at that time determined that our wind and solar assets had the highest prospects for growth. Under all scenarios, hydro remains a valuable asset as it allows for expansion to include storage.
Findings outlined below may not reflect currently available climate scenarios or policy frameworks. We continue to monitor climate-related risks and opportunities that may impact our business over time. For further information, refer to the Managing Climate Change Risks and Opportunities section in this MD&A.
The following sections highlight TransAlta's top risks, opportunities and management response across all scenarios.
Top Identified Climate-Related Risks by Scenario (2021)
| | | | | | | | | | | |
| Increased clean energy competition | Decreased demand of natural gas electricity | Increased operational costs |
| | | |
| Description | Subsidies/funds available for clean energy transition increase as governments aim to grow installed capacity of renewables to meet rising electricity demand and compensate for the closure of carbon-intensive power plants. In Canada, it is expected that major grid decarbonization investments will flow into Alberta as most other provincial markets are heavily regulated and/or are already low carbon. This will increase competition in the wholesale electricity market, making a large part of the generating fleet frequently bid at zero, driving down the average price of dispatched electricity. Simultaneously the cost of renewables, expected to decline across all scenarios, decreases the capital barrier to entry. These combined factors will increase competition for TransAlta. The IEA scenarios do not provide clear indication of electricity pricing and how it can be affected by increased competition. As such, this remains a point of uncertainty. Some structural market changes may be required to guarantee returns for power generators and successfully decarbonize the grid. | Demand for power from natural gas declines as the market shifts towards cleaner power with gas shifting to a reliability backstop role. An additional decline from Canadian oil and gas customers can occur as oil production levels drop under NZE and SDS. The transition to a lower-carbon world will likely result in volatility and market uncertainty. Natural gas power may be necessary to provide power in the transition if the pace of decarbonization is slower than expected in the scenarios or if grid-scale storage solutions do not develop/commercialize as modelled. In these cases, with coal phased out, natural gas facilities will be relied on for baseload generation. This means that natural gas facilities may still play a role for a smooth and efficient energy transition. Optimization of natural gas facilities is required, and additional investments need to be assessed with caution to consider the pace of decarbonization and consequent risk of decreased demand for natural gas power. | Carbon price increases the cost of natural gas operations. Additional mandated emissions reductions could force remaining plants to invest in technologies like CCUS, further increasing the operating costs for natural gas plants. Natural gas facilities in the U.S. and Western Australia face less risk compared to assets in Alberta as they are contracted and can pass down carbon costs to their clients. Current and anticipated regional carbon pricing monitoring is required to plan and assess increases in operational costs and impacts on new projects and investments. |
| | | |
| | | |
| | | | | | | | |
| M98 | TransAlta Corporation | 2024 Integrated Report |
| | | | | | | | | | | |
| Increased clean energy competition | Decreased demand of natural gas electricity | Increased operational costs |
| | | |
| NZE | By 2040, renewables are expected to comprise over 85 per cent of the total electricity generation in the regions where we operate. This surge in renewables will increase competition and drive electricity pricing down depending on availability and the cost of energy storage. The change in electricity prices and increased market uncertainty are expected to impact our profits. | The share of natural gas electricity generation is expected to decline over 50 per cent in the regions in which we operate by 2040 compared to 2019 levels. This lower demand for natural gas power is expected to impact our natural gas facilities if no management responses are implemented. | Higher operational costs driven by an increase in carbon price to US$205/tonne CO2e by 2040 in all our operating regions (advanced economies under IEA scenarios) and lower operational capacity is expected to impact the profits from our natural gas facilities. |
| | | |
| SDS | Fewer subsidies/funds are expected under this scenario compared to NZE. However, renewable costs will still decline approximately 10 per cent in wind and 55 per cent in solar by 2040 compared to 2019 levels. This decline with some level of subsidy will increase competition and potentially decrease electricity prices, which is expected to impact our profits. | Natural gas electricity generation still falls over 50 per cent in North America while remaining flat in Western Australia by 2040 compared to 2019 levels. Demand for natural gas power is expected to decrease at a slower pace than under NZE. This could potentially impact our natural gas facilities if no management responses are implemented. | Increase in operational costs would happen at a slower rate compared to NZE but carbon costs are still expected to reach US$140/tonne CO2e by 2040 in all of our operating regions. This could potentially impact the operational capacity and profits from our natural gas facilities, depending on the ability to pass carbon prices on through our contracts. |
| | | |
| | | |
| STEPS | While minimal subsidies are expected and the cost of entry will not decline at the same rate as SDS or NZE, renewable costs are still expected to decline approximately eight per cent in wind and 45 per cent in solar by 2040 compared to 2019 levels. This will still cause an increase in competition that is expected to be offset by additional electricity demand and therefore it is not expected to impact our profits. | Natural gas electricity generation is expected to increase over 15 per cent in the regions in which we operate by 2040 compared to 2019 levels. These changes are not expected to affect our natural gas facilities. | Operational costs are not expected to significantly increase under this scenario as only Canada is expected to adopt a carbon price in 2040. |
| | | |
| | | |
| Management response | Navigating uncertainty around market dynamics (structure, pricing and competition), government policies and planning is critical for TransAlta. We use hedging and PPAs to reduce pricing-related risks. See more details of our strategy and risk management under the Climate Strategy section and the Managing Climate Change Risks and Opportunities section of this MD&A. | As concerns regarding grid reliability and demand increase, we have increased our focus on optimizing our gas facilities to maximize value and cash flows and to support future renewables and storage growth. Our converted natural gas units' CO2 intensity is approximately 57 per cent less than coal generation. Repurposing the coal facilities rather than decommissioning them reduces the cost and emissions associated with new construction and aligns with the UN SDGs, specifically "Goal 9: Industry, Innovation and Infrastructure." In parallel, we plan to achieve a 100 per cent portfolio mix of renewables and natural gas by the end of 2025. | We have taken significant steps to reduce our carbon footprint. Since 2015, we have reduced scope 1 and 2 GHG emissions by 70 per cent. By 2026, we have a commitment to reduce scope 1 and 2 GHG emissions by 75 per cent from 2015 base year and have a target to achieve net-zero emissions by 2045. |
| | | |
| | | | | | | | |
| TransAlta Corporation | 2024 Integrated Report | M99 |
Top Identified Climate-Related Opportunities by Scenario (2021)
| | | | | | | | |
| Renewables become major energy source | New technology development |
| | |
| Description | Opportunities to grow the renewable fleet exist across all scenarios. Renewable assets (hydro, wind, solar) are expected to become the default form of generation with demand for power from these types of assets increasing. Hydro is likely to grow in value given increased renewables penetration and the need for reliable zero-emitting generation. This can make hydroelectric power a stronger source of baseload electricity in many regions. The decreasing cost of renewables also facilitates the growth of a renewable fleet, especially under NZE and SDS. | Opportunities for the development of battery or hydroelectric storage systems and ancillary services exist across all scenarios as renewable energy continues to penetrate the grid. Developments in these areas are required to keep electricity flowing when the renewables in a region are not producing. Storage is anticipated to play an especially important role in the energy transition. Cost-competitive battery storage enables greater adoption of renewables. |
| | |
| | |
| NZE | A growth of renewable electricity generation of approximately 950 per cent is expected by 2040 compared to 2019 levels. This results in renewables comprising more than 85 per cent of the electricity generation in the regions in which we operate. The transition of hydro to baseload capacity is expected to create upside for TransAlta. An increase in TransAlta’s renewable capacity and demand are expected to enable growth and higher revenues. | Increased revenues through access to new and emerging markets are expected to enable growth and higher revenues under NZE. With more than 85 per cent of electricity in areas in which we operate made up of renewables, there will be big steps forward in storage and ancillary services technologies. Storage capacity is expected to grow to approximately 250 GW in the U.S. by 2040. |
| | |
| | |
| SDS | A growth of renewable electricity generation of approximately 550 per cent is expected by 2040 compared to 2019 levels. This results in renewables comprising more than 75 per cent of the electricity generation in the regions in which we operate. An increase in TransAlta’s renewable capacity and demand are expected to enable growth and higher revenues. | Increased revenues through access to new and emerging markets are expected to enable growth and higher revenues under SDS. A lower share of renewables than in NZE will allow swing production to remain present; however, growth in ancillary and storage capacity will still be needed to support the market. Storage capacity is expected to grow to approximately 110 GW in the U.S. by 2040. |
| | |
| | |
| STEPS | STEPS growth is muted relative to the other scenarios but still sees a growth of renewables of 280 per cent by 2040 compared to 2019 levels. This growth will allow approximately 50 per cent of electricity generation to come from renewables in areas in which we operate by 2040. An increase in TransAlta’s renewable capacity and demand are expected to enable growth and higher revenues. | Access to new and emerging markets would be limited under this scenario compared to NZE and SDS. While growth in renewables is expected, the need for new technologies is not a necessity in this market and may not be profitable. Therefore, our revenues are not expected to be affected. |
| | |
| | |
| Management response | Our renewable energy commitment began more than 100 years ago when we built the first hydro assets in Alberta, which still operate today. We now operate 60 renewable facilities across Canada, the U.S. and Western Australia. Our strategy is focused on the operation and/or repurposing of our existing assets (wind, hydro, solar, gas, storage and coal) and the development of renewable energy, storage and natural gas generation for reliability. From 2000 to 2024, we increased our nameplate renewables capacity from approximately 900 MW to over 3,600 MW. Today, TransAlta is one of the largest producers of wind power in Canada and the largest producer of hydro power in Alberta. | To address and mitigate the challenges of renewable energy intermittency, we continue to invest in battery storage. In 2020, we launched WindCharger, a "first of its kind in Alberta" battery storage project that stores energy produced by our Summerview II wind facility and discharges electricity into the Alberta grid during system supply shortages. Further, in 2023, we completed the Northern Goldfields solar project in Western Australia, which provides solar electricity supported with a battery energy storage system and will support BHP Nickel West in meeting its emissions reduction targets. In 2024, TransAlta launched a project with Atlas Power Technologies Inc. for a hybrid hydro supercapacitor energy storage system, expected to be the first of its kind in North America. The project is complementary to an existing hydro facility that augments the power plant’s response time and the capability to address frequency response needs. |
| | |
| | | | | | | | |
| M100 | TransAlta Corporation | 2024 Integrated Report |
NZE: The most significant risks include increased competition, decreased demand for natural gas and increased operational costs due to increased carbon pricing and emissions reduction mandates. The most significant opportunities include a shift toward renewables as the default energy source and new technology developments, including battery storage systems and ancillary services. It is worth noting that there are additional risks and opportunities for TransAlta under NZE. For example, changes in how energy market services are offered could positively or negatively impact our business. Further, as carbon credit policies evolve, so will our ability to use credits. Lastly, as renewables become the primary energy source, a rethinking of ancillary services will be necessary but could create significant opportunities for TransAlta.
SDS: The risks and opportunities remain the same under SDS as NZE; however, the impacts are reduced as market changes are slower and less extreme. Renewables still become the primary electricity source and there are new technology opportunities, particularly in batteries. Natural gas electricity demand still declines by 2040. Carbon
pricing exists in the U.S. and Australia, but the price is reduced compared to NZE. Lastly, a reevaluation of ancillary services still presents an opportunity for TransAlta.
STEPS: Under STEPS, renewable generation sees significant growth but does not become the predominant energy source. Implementing new technologies is much slower and the demand for batteries is reduced. The demand for natural gas electricity does not decline and there are no large-scale market changes making services, pricing and ancillary services more stable. This removes the risk associated with natural gas electricity demand but eliminates the opportunity for growth in ancillary services. Physical risks become more relevant under this scenario than transitional risks.
The findings from the climate scenarios work alongside our sustainability metrics and targets to inform the evolution and resiliency of our Company's strategy and financial planning, risk management, opportunity assessment and planning for uncertainty.
Managing Climate Change Risks and Opportunities
We actively monitor and manage climate-related risks through our Company-wide ERM processes. In 2021, we used a climate scenario analysis to review specific risks. As previously mentioned, climate change risks and opportunities are addressed at each of the Board, executive and management, business unit levels and through our corporate functions. The business units and corporate functions work closely together and provide information on risks and opportunities to management, the executive team and the Board.
Climate change risks at the asset or business unit level are identified through our Total Safety Management System, asset management function and systems, energy and trading business, communication with stakeholders, active monitoring and participation in working groups. All identified material risks are added to our ERM register and scored based on likelihood and impact. We do not consider risks in isolation and major risks are the focus of management response and mitigation plans. Further discussion can be found in Reporting in the Governance and Risk Management section of this MD&A.
We divide our climate change risks into two major categories as per IFRS S2 and TCFD guidance: (i) risks related to the transition to a lower-carbon economy; and (ii) risks related to the physical impacts of climate change.
Transition Risks to a Lower-Carbon Economy
We actively aim to understand and manage the impact of climate change on our business. In 2024, we updated the transition risks outlined below.
Policy and Legal Risks
Changes in current environmental legislation have a potentially significant impact upon our business and operations in Canada, the U.S. and Australia.
For a more detailed assessment of policy and regulatory risks, refer to the Governance and Risk Management section of this MD&A.
Canada
The Government of Canada has set objectives for carbon emissions reductions, including a 45 to 50 per cent national emissions reduction over 2005 levels by 2035, a net-zero electricity grid by 2035 and a net-zero national economy by 2050. The current government plans to rely on several policy tools to achieve its emissions objectives, including but not limited to carbon pricing, emissions performance regulations, funding for industrial energy transition, and incentives for consumers.
| | | | | | | | |
| TransAlta Corporation | 2024 Integrated Report | M101 |
Canada’s provinces have jurisdiction over their respective electricity sectors and play an important role in setting carbon pricing policy and emissions performance standards, subject to the federal government's authority to set national carbon pricing standards. Jurisdictional responsibilities between the federal and provincial governments enable both levels of government to implement policies that impact our sector. Leadership changes at either level of government can influence policy direction.
Risks
•Changes in carbon pricing and emissions performance regulations may impact TransAlta’s generation fleet in Canada as governments may change policy stringency in conjunction with climate targets.
•Government funding for industrial energy transition may create out of market incentives for competing generation.
•Regulatory incentives, including emissions reduction crediting, may create out of market incentives for competing generation.
•Lack of federal/provincial coordination with respect to climate policy and regulation may lead to investment uncertainty.
Opportunities
•Independent estimates suggest that achieving Canada’s current climate targets will require a minimum of twice Canada’s current non-emitting generation. Further, we continue to see strong private sector demand for contracted renewable electricity generation to meet corporate sustainability goals.
•Government funding to support the development of innovative technology to reduce emissions from the electricity sector offers TransAlta the potential opportunity to gain project support to grow its energy storage fleet.
•Government support for industrial electrification will grow the electricity load over time and create new opportunities for electricity generation.
Management Response
•We believe that TransAlta’s corporate strategy positions our Company to meet the demand for renewable and dispatchable generation driven by customers and government policy.
•We are focused on developing and acquiring contracted assets that provide long-term certainty with respect to revenue and eligibility for government incentive programs as applicable. TransAlta actively assesses available government renewable energy tax legislation and programs to maximize, wherever possible, access to project incentives.
•Our diversified portfolio and contracted growth reduces the proportional Company exposure to potential policy and regulatory decisions that negatively impact natural gas generation.
•Our coal-to-gas facilities fit within government plans to continue providing reliable and competitively priced electricity for consumers and industry.
•Our remaining natural gas facilities (non-coal-to-gas) operate under contract, reducing TransAlta’s exposure to changes in carbon pricing.
•We engage with the federal and provincial governments in Canada to inform and influence policy development to ensure that our generating fleet continues to serve our customers.
•We actively work, both directly and through industry associations, to encourage governments to adopt a level playing field within funding and crediting programs so that all new emerging technology projects receive equitable government incentives and funding.
•We engage with all relevant Canadian governments to seek policy alignment across carbon pricing and regulatory and funding programs to create the greatest possible degree of investment certainty.
United States
President Trump was elected on Nov. 4, 2024. It is expected that the U.S. Government will reduce carbon emission reduction objectives in 2025 following the inauguration. Currently, the Inflation Reduction Act of 2022 remains in force and aims to reduce U.S. carbon emissions by 40 per cent by 2030 from 2005 levels. The U.S. does not have a national carbon pricing regime but does offer federal incentives for renewable generation and energy storage.
State and regional renewable and climate policies have a significant impact on the pace of energy transition in the country, with several jurisdictions maintaining renewable portfolio standards and/or carbon pricing regimes. Similar to Canada, independent estimates suggest that the U.S. will require substantial growth in zero-emissions generation to meet its national, state and regional climate targets.
Risks
•TransAlta operates two thermal generating facilities in the U.S. that could be subject to policy changes, but we believe that our risk exposure is low due to existing agreements and contracts associated with these facilities (refer to Management Response below).
•Potential changes to federal wind permitting could pose risks for new wind development projects.
| | | | | | | | |
| M102 | TransAlta Corporation | 2024 Integrated Report |
•Federal incentives for clean energy that are available today are expected to maintain competition in renewables and energy storage.
Opportunities
•Achieving government and private sector sustainability commitments will require sustained growth in zero-emissions electricity generation over the coming decades. TransAlta remains focused on providing renewable electricity as a core component of a balanced energy portfolio to contracted customers in a manner that is aligned with federal, state and private sector goals.
•Strong customer demand to meet low-carbon energy and reliability needs present opportunities for TransAlta.
•U.S. tax incentive programs offer significant support for new renewable and energy storage projects, making the U.S. an attractive growth market.
Management Response
•TransAlta’s single coal unit in Washington State is subject to a retirement agreement with the state government that exempts the facility from any carbon regulation before its end of life in 2025. TransAlta’s cogeneration unit at Ada operates under a contract that reduces the Company’s exposure to policy risk.
•The Company remains focused on developing and acquiring contracted assets that provide long-term certainty with respect to revenue.
•TransAlta will continue to assess government policy changes related to our business under the new U.S. administration.
Australia
The Australian Government has a 43 per cent national emissions reduction target over 2005 levels by 2030 and a goal to achieve a net-zero national economy by 2050. Decarbonization efforts have been centered on funding clean technologies, upgrading the electricity grid to support more renewables, regulating and reporting of GHG emissions, and incentivizing zero-emissions vehicle adoption. Large GHG emitters are required to reduce their scope 1 emissions under the Australian Government's National Safeguard Mechanism (SGM). While the government has made recent changes to the SGM, these changes are not expected to have a material impact on TransAlta's assets. Australian state governments have all adopted net-zero goals and a number of states have interim targets for 2030 and 2040. These state policies are driving demand for zero-emissions electricity and energy storage.
Risks
•TransAlta’s Western Australian natural gas facilities may face policy risk related to changes in government policies
but we believe that we remain well positioned to mitigate those risks (refer to Management Response below).
Opportunities
•The Company remains focused on maintaining renewable and dispatchable electricity generation in Western Australia and other markets. Government policies and funding programs are generally supportive of the types of projects contemplated within TransAlta’s strategy.
•Strong corporate demand for renewable electricity solutions in Australia's natural resource sectors present opportunities for TransAlta to leverage its existing expertise to help customers meet regulatory requirements and reach their decarbonization objectives.
Management Response
•TransAlta’s assets are predominantly contracted with an ability to pass through carbon compliance costs and serve remote industrial load. As a result, the Company faces reduced policy risk.
•The Company continues to deliver renewable electricity solutions to natural resource customers in Western Australia. Our growing suite of technologies, including renewables and energy storage, positions us to provide contracted solutions to customers focused on the need for reliable and sustainable energy.
•TransAlta also continues to assess opportunities to grow our renewable energy generation in alignment with Australia's national and state climate goals.
Technology Risks
Technological changes to support the low-carbon transition present both risks and opportunities for TransAlta. We evaluate existing and emerging impacts of technology through our Energy Innovation team and our ERM process. Examples of technology risks and opportunities include infrastructure changes and digitization combined with greater adoption of energy efficiency (less use of our end product). Cost-competitive battery storage will enable greater adoption of renewables and a shift to a distributed power generation model. We continue to evaluate battery storage for its financial viability while monitoring the potential impact battery technology could have on natural gas power generation. In 2020, we completed our first battery storage (10 MW) project at one of our wind facilities in Southern Alberta. In 2023, we delivered a hybrid system of solar with battery storage (48 MW) in Western Australia. We continue to investigate the possibility of battery storage at our other facility locations. Our teams continuously adopt improved technology at each of our new developments, which helps protect shareholder value and maintain reliable and affordable electricity delivery.
We believe that we are well-positioned to take advantage of technological opportunities in storage through hydro
| | | | | | | | |
| TransAlta Corporation | 2024 Integrated Report | M103 |
and/or battery power, as well as advancements in renewable technologies. We will continue monitoring new technologies such as storage, hydrogen and CCUS for future deployment.
For further information on technology and innovation, refer to the Enabling Innovation and Technology Adoption section of this MD&A.
Market Risks
Our major market risks are associated with our natural gas facilities and specifically carbon pricing which could impact our operating costs. We actively monitor market risks through our energy marketing and asset optimization teams and our ERM process. Further, our corporate functions apply regionally specific carbon pricing, both current and anticipated, as a mechanism to manage future risks of uncertainty in the carbon market. To simultaneously manage our risks and leverage market opportunities, we continue operating our hydro, wind and solar facilities and evaluating fleet growth opportunities.
Our renewable fleet makes our overall portfolio more resilient to climate risk, provides increased flexibility in generation and creates incremental environmental value through environmental attributes. Lastly, we recognize the opportunity to grow our ancillary services, such as systems support, providing flexibility and reliability to the grid.
Reputation Risks
Negative reputational impacts, including revenue loss and a reduced customer base, are evaluated through our ERM process. In the past, we experienced negative reputational impacts due to our coal operations. We believe that our transition path away from coal mitigates this reputational risk. As consumer trends move in favour of renewable electricity, we are investing in a diversified mix of renewable generation and optimizing our existing natural gas fleet. We believe that natural-gas-fired generation enables the energy transition by ensuring the reliability of the electricity grid. We continue to actively monitor and manage reputational risks by delivering reliable and responsible power solutions.
Physical Risks of Climate Change
As we learn more about the physical risks associated with climate change, we continue to consider acute and chronic risks that could significantly impact our operations. We continue to investigate the physical impacts of climate change on our operating assets.
Acute Physical Risks
We have operating assets in three countries and varied geographic locations, many of which could be impacted by extreme weather events. These events can impact our operations and give rise to risks. Due to the nature of our business, our earnings are sensitive to seasonal weather
variations. Variations in winter weather affect the demand for electrical heating requirements while variations in summer weather affect the demand for electrical cooling requirements. These variations in demand translate into spot market price volatility. Variations in precipitation also affect water supplies, which in turn affect our hydroelectric assets. Also, variations in sunlight conditions can have an effect on energy production levels from our solar facilities.
Our generation facilities and their operations are exposed to potential damage and partial or complete loss resulting from environmental disasters (e.g., floods, strong winds, wildfires, earthquakes, tornados and cyclones), equipment failures and other events beyond our control. Climate change can increase the frequency and severity of these extreme weather events. The occurrence of a significant event that disrupts the operation or ability of the generation facilities to produce or sell power for an extended period, including events that preclude existing customers from purchasing electricity, could have a material adverse effect. In certain cases, there is the potential that some events may not excuse us from performing our obligations pursuant to agreements with third parties. The fact that several of our generation facilities are located in remote areas may make access for repair of damage difficult.
We continuously evaluate the potential impact of acute climate change on our business. For example, our gas facility at the South Hedland, Australia, is built with climate adaptation in mind. We designed the facility to withstand a category 5 cyclone (the highest cyclone rating). We have mitigated the risk of floods that can occur in the area by constructing the facility above normal flood levels. In 2019, a category 4 cyclone hit this facility and did not impact operations. We were able to continue generating electricity through the storm despite widespread flooding and the shutdown of the nearby port. In Canada, since the 2013 floods in Southern Alberta, we have implemented projects that increase the resilience of our hydro facilities to severe climate events. We have also modified operations at several of our facilities as per an agreement with the Government of Alberta. This reduces flood risk in the spring while also recognizing the potential for increased droughts as a result of climate change in the future. TransAlta continues to participate in multi-stakeholder groups developing options for climate resiliency across Southern Alberta.
Chronic Physical Risks
Chronic physical risks refer to longer-term shifts in climate patterns that may cause sea level rise, chronic heat waves, changes in precipitation patterns and extreme variability in weather patterns.
These variations in weather could have an impact on our generating assets. Ice can accumulate on wind turbine blades in the winter months. The accumulation of ice on
| | | | | | | | |
| M104 | TransAlta Corporation | 2024 Integrated Report |
wind turbine blades depends on a number of factors, including temperature and ambient humidity. Accumulated ice can have a significant impact on energy yields and could result in the wind turbine experiencing more downtime. Extreme cold temperatures can also impact the ability of wind turbines to operate effectively and this could
result in more downtime and reduced production. In addition, climate change could result in increased variability to water flow or wind patterns that could impact our hydro and wind businesses and associated revenue generation.
Climate Change Metrics and Targets
Metrics and Targets
TransAlta has established climate-related goals and targets with reference to the UN SDGs. Performance against our 2024 climate-related targets is outlined below and excludes the acquisition of Heartland Generation on Dec. 4, 2024. Target year means by Dec. 31 of that year.
| | | | | | | | | | | | | | |
| Renewable Energy Growth |
| | | | |
| Sustainability target | | Develop new renewable projects that support our customers' sustainability goals to achieve both long-term power price affordability and carbon reductions.(1) | | No further coal generation; 100 per cent of our owned net generation capacity from renewables and gas. |
| | | | |
| | | | |
| Target year | | 2024 | | 2025 |
| | | | |
| | | | |
| Progress | | Since 2021, we have added over 800 MW of new capacity through renewable projects such as Windrise (206 MW), Garden Plain (130 MW), Northern Goldfields Solar (48 MW), White Rock (302 MW) and Horizon Hill (202 MW). | | In 2024, our owned net generation capacity from renewables and gas represented approximately 90 per cent of our total 6,425 MW owned net generation capacity. In 2021, we achieved full phase-out of coal in Canada. In the U.S., we plan to cease coal-fired generation at our Centralia plant by Dec. 31, 2025. |
| | | | |
| | | | |
| UN SDG alignment | | Target 7.2: "By 2030, increase substantially the share of renewable energy in the global energy mix". | | Target 7.1: "By 2030, ensure universal access to affordable, reliable and modern energy services”. |
| | | | |
(1)This includes the construction of new renewable projects (hydro, wind and solar).
| | | | | | | | | | | | | | |
| GHG Emissions Reduction |
| | | | |
| Sustainability target | | By 2026, achieve a 75 per cent reduction of scope 1 and 2 GHG emissions from a 2015 base year. | | By 2045, achieve net-zero for 100 per cent of TransAlta’s scope 1 and 2 GHG emissions. |
| | | | |
| | | | |
| Target year | | 2026 | | 2045 |
| | | | |
| | | | |
| Progress | | We are on track to achieve our target of 75 per cent scope 1 and 2 GHG emissions reductions by 2026. Since 2015, we have reduced scope 1 and 2 GHG emissions by 22.7 MT CO2e or 70 per cent. | | Since 2005, we have reduced our scope 1 and 2 GHG emissions by 32 million tonnes (MT) of CO2e or a 77 per cent reduction, proudly representing approximately 11 per cent of Canada's Paris Agreement 2030 decarbonization target(1). We believe that our corporate strategy supports achieving our net-zero target. |
| | | | |
| | | | |
| UN SDG alignment | | Target 13.2: "Integrate climate change measures into national policies, strategies and planning". | | Target 13.2: "Integrate climate change measures into national policies, strategies and planning". |
| | | | |
(1)In 2005, TransAlta's estimated scope 1 and 2 GHG emissions were 41.9 MT of CO2e, which did not receive independent limited assurance. Canada's Paris Agreement 2030 decarbonization target assumed 293 MT of CO2e or a 40 per cent reduction from a 2005 baseline of 732 MT of CO2e.
| | | | | | | | |
| TransAlta Corporation | 2024 Integrated Report | M105 |
TransAlta's target to reduce 75 per cent of our scope 1 and 2 GHG emissions by 2026 from a 2015 base year is estimated to align with the electricity sector decarbonization pathway to limit global warming to 1.5°C, as one of the Paris Agreement goals.
GHG Disclosures
Scope 1 and 2 Emissions
Scope 1 emissions are the direct emissions from owned or controlled sources. Scope 2 emissions are indirect emissions from the generation of purchased energy. TransAlta's scope 1 and 2 GHG emissions are calculated using different methodologies depending on the technologies available at our facilities. Emissions data has been aligned with the “Setting Organizational Boundaries: Operational Control” methodology set out in The Greenhouse Gas Protocol: A Corporate Accounting and Reporting Standard developed by the World Resources Institute and the World Business Council for Sustainable Development. We report emissions on an operation control basis, which means we report 100 per cent of emissions at the facilities that we operate.
We compile our corporate GHG inventory using our business segment GHG calculations. As a result, emission factors and global warming potentials used in our GHG calculations can vary due to difference in regional compliance guidance. Applying harmonized global warming potentials across our fleet would result in a minor variance to our overall calculated GHG totals.
Our GHG data is reported to a number of different regulatory bodies throughout the year for regional compliance and, as a result, may incur minor revisions as we review and report data annually. Any historical revisions will be captured and reported in future disclosure. As per the Kyoto Protocol, GHGs include carbon dioxide, methane, nitrous oxide, sulphur hexafluoride, nitrogen trifluoride, hydrofluorocarbons and perfluorocarbons. Our exposure is limited to carbon dioxide, methane, nitrous oxide and a small amount of sulphur hexafluoride. The majority of our estimated GHG emissions result from carbon dioxide emissions from stationary combustion from coal and natural-gas-powered generation. Methane emissions from our operations are mainly due to incomplete combustion of natural gas from natural-gas-powered plants and there are no fugitive methane emissions associated with our operations. In 2024, methane emissions were 0.5 per cent of our total emissions.
The following tables detail our GHG emissions by scope, business segment and country in million tonnes of CO2e. Some values do not sum to the indicated total due to rounding of tabulated emissions. Zeros (0.0) indicate truncated values.
| | | | | | | | | | | |
| Year ended Dec. 31 | 2024 | 2023 | 2022 |
| Scope 1 | 9.5 | 10.9 | 10.2 |
| Scope 2 | 0.1 | 0.1 | 0.1 |
| Total scope 1 and 2 GHG emissions | 9.6 | 10.9 | 10.3 |
| | | | | | | | | | | |
| Year ended Dec. 31 | 2024 | 2023 | 2022 |
| Hydro | 0.0 | 0.0 | 0.0 |
| Wind and Solar | 0.0 | 0.0 | 0.0 |
| Gas | 6.3 | 6.4 | 6.3 |
| Energy Transition | 3.2 | 4.5 | 4.0 |
| Corporate and Energy Marketing | 0.0 | 0.0 | 0.0 |
| Total scope 1 and 2 GHG emissions | 9.6 | 10.9 | 10.3 |
| | | | | | | | | | | |
| Year ended Dec. 31 | 2024 | 2023 | 2022 |
| Australia | 0.9 | 1.0 | 0.9 |
| Canada | 5.4 | 5.3 | 5.2 |
| United States | 3.3 | 4.6 | 4.1 |
| Total scope 1 and 2 GHG emissions | 9.6 | 10.9 | 10.3 |
| | | | | | | | |
| M106 | TransAlta Corporation | 2024 Integrated Report |
In 2024, our GHG emissions (scope 1 and 2) were 9.6 million tonnes as a result of normal operating activities. This represents a 12 per cent decrease from 2023. As a result, in 2024 our scope 1 and 2 GHG emissions intensity decreased to 0.35 tCO2e/MWh from 0.41 tCO2e/MWh in 2023. TransAlta plans to cease generation from our single remaining coal unit by the end of 2025, which will further reduce the Company’s emissions.
TransAlta sells the environmental attributes generated from our renewable energy facilities and does not subtract this amount from our total GHG emissions (scope 1 and 2).
However, it should be noted that TransAlta’s customers are reporting GHG emissions reductions using our renewable energy assets, projects and operations.
GHG emissions are verified to a level of reasonable assurance in locations in which we operate within a carbon regulatory framework. Any historical revisions to GHG data will be captured and reported in future disclosure. The majority of our GHG emissions result from carbon dioxide emissions from stationary combustion from coal- and natural-gas-fired generation.
The following table highlights our scope 1 and 2 GHG emissions reductions since 2015 and our targeted emissions in 2026 in million tonnes of CO2e. The actual GHG emissions for the Company in 2026 will vary from that presented below depending on, among other things, the growth of the Company, including its on-site generation business.
| | | | | | | | | | | |
| Year ended Dec. 31 | 2026 (forecast) | 2024 | 2015 |
| Total scope 1 and 2 GHG emissions | 8.1 | 9.6 | 32.2 |
Scope 3 Emissions
Scope 3 emissions are all indirect emissions (not included in scope 1 or 2) that occur in the value chain of the reporting company, including both upstream and downstream emissions. TransAlta's scope 3 emissions are calculated using methodologies consistent with the GHG Protocol Corporate Value Chain (Scope 3) Accounting and Reporting Standard (Scope 3 Standard) and with reference to the additional guidance provided in the GHG Protocol Technical Guidance for Calculating Scope 3 Emissions (Scope 3 Guidance) developed by the World Resources Institute and the World Business Council for Sustainable Development.
TransAlta's scope 3 emissions include the indirect GHG emissions resulting from activities in our value chain but outside of our operational control. Of the 15 categories described in the GHG Protocol Scope 3 Guidance, four are not relevant to our business and, therefore, are not included in the calculation: Category 8: Upstream leased assets, Category 12: End-of-life treatment of sold products, Category 13: Downstream leased assets, and Category 14: Franchises.
In 2024, we achieved our target to verify and disclose 80 per cent of TransAlta’s scope 3 emissions by 2024. Of the 15 categories described in the GHG Protocol Scope 3 Guidance, five are the most relevant to our business and together they accounted for 93 per cent of our total scope 3 emissions of approximately 3.7 million tonnes of CO2e in 2024. They include Category 1: Purchased goods and services, Category 2: Capital goods, Category 3: Fuel and energy-related activities, Category 11: Use of sold products, and Category 15: Investments. These emissions received limited assurance by a third-party provider.
| | | | | | | | |
| TransAlta Corporation | 2024 Integrated Report | M107 |
The following table details our total scope 3 GHG emissions in million tonnes of CO2e. Some values do not sum to the indicated total due to rounding of tabulated emissions. Zeros (0.0) indicate truncated values.
| | | | | | | | | | | |
| Year ended Dec. 31 | 2024 | 2023 | 2022 |
Category 1: Purchased goods and services(1) | 0.0 | 0.0 | 0.0 |
Category 2: Capital goods(2) | 0.0 | 0.1 | | 0.1 | |
Category 3: Fuel and energy-related activities(3) | 1.0 | 1.0 | | 1.0 | |
Category 11: Use of sold products(4) | 0.6 | 0.7 | | 0.6 | |
Category 15: Investments(5) | 1.8 | 1.7 | | 1.8 | |
Other relevant categories(6) | 0.2 | 0.3 | | 0.3 | |
| Total scope 3 GHG emissions | 3.7 | | 3.7 | | 3.8 | |
(1)Category 1: Purchased goods and services includes emissions associated with the purchase of goods and services described as operating expenses.
(2)Category 2: Capital goods includes emissions associated with the purchase of capital goods and services described as capital expenditures.
(3)Category 3: Fuel and energy-related activities includes emissions associated with the extraction, production of all fuels consumed and midstream transportation of natural gas (pipeline). Excludes the emissions associated with electricity purchased from the grid as they have been accounted for in our scope 2 GHG emissions, but accounting for the transmission and distribution losses.
(4)Category 11: Use of sold products includes emissions associated with natural gas combustion during electricity production where the sales and delivery of physical natural gas occur.
(5)Category 15: Investments includes scope 1 and 2 GHG emissions (on an equity basis) from our assets that are owned (as a joint venture or other ownership structure) but not operated by TransAlta.
(6)Other relevant categories include Category 4: Upstream transportation and distribution, Category 5: Waste generated in operations, Category 6: Business travel, Category 7: Employee commuting, Category 9: Downstream transportation and distribution, and Category 10: Processing of sold products. These emissions were estimated based on best available information and did not receive limited assurance by a third-party provider.
Avoided Emissions
In 2024, production from renewable assets resulted in the avoidance of approximately 2.8 million tonnes of CO2e for our customers. TransAlta's avoided emissions are defined as the sum of the displaced emissions by our renewable assets in the jurisdictions where we operate.
The value is calculated as the product of the generation of electricity obtained from a renewable source (hydro, wind and solar) and the specific CO2 emissions intensity from the grid of the jurisdiction in which we operate. Avoided emissions increased in 2024 compared to 2023 primarily due to an increase in renewable fleet generation.
The following table highlights our avoided emissions in million tonnes of CO2e.
| | | | | | | | | | | |
| Year ended Dec. 31 | 2024 | 2023 | 2022 |
| Total GHG emissions avoided | 2.8 | 2.3 | 2.7 |
| | | | | | | | |
| M108 | TransAlta Corporation | 2024 Integrated Report |
Sustainable Finance
Sustainable finance is the process of taking due account of ESG considerations (e.g., climate change, biodiversity, human rights, etc.) when making investment decisions. Sustainable finance is a key pillar of TransAlta’s Climate Transition Plan. This means that we may choose to utilize pools of capital available to sustainable economic activities and projects to finance our energy transition.
TransAlta deploys green and sustainable financing to build our renewable energy fleet. This supports our goal to deliver on our customers’ needs for renewable electricity. Since 2020, we have issued $726 million in green bonds and converted our four-year, $2.0 billion revolving credit facility, into a sustainability-linked loan.
In 2022, TransAlta issued US$400 million ($533 million) in Senior Green Bonds, and an amount equal to the net proceeds from the bonds has been allocated to finance or
refinance new and/or existing eligible green projects. The bonds were issued under TransAlta's Green Bond Framework, which aligns with the Green Bond Principles published by the International Capital Market Association. For further information, refer to Green Bond Framework in the Shareholder Information section of the Investor Centre on our website.
In 2021, TransAlta converted an existing $1.3 billion syndicated revolving credit facility into a sustainability-linked loan. The loan aligns the cost of borrowing to the Company's GHG emissions reductions and gender diversity targets. Sustainability-linked loans are any types of loan instruments and/or contingent facilities (such as bonding lines, guarantee lines or letters of credit) that incentivize the borrower’s achievement of ambitious, predetermined sustainability performance objectives.
The summary below shows the carrying value of the issued green bonds and the total committed facility size of our ESG financial operations portfolio.
| | | | | | | | | | | |
| As at Dec. 31 (in millions of Canadian dollars) | 2024 | 2023 | 2022 |
Green bonds (1) | 726 | 684 | 703 |
| Sustainability-linked loans | 1,950 | | 1,950 | 1,250 |
(1)Green bonds are related to the Senior Green Bonds issued in 2022.
| | | | | | | | |
| TransAlta Corporation | 2024 Integrated Report | M109 |
Climate-Related Financial Metrics
The results of TransAlta’s 2021 climate-related scenario analysis, aligning with a 1.5°C warmer world, have shown that opportunities to grow the renewable fleet exist across all scenarios and locations. Our revenue from renewable energy generation (hydro, wind and solar) in 2024 was $839 million (2023 – $902 million).
In 2024, our growth capital expenditures for renewable energy generation were $61 million (2023 – $630 million). In addition, TransAlta continues to invest in emerging abatement technologies and solutions. In 2024, our investments in low-carbon research and development were $8 million (2023 – $4 million).
In 2024, adjusted EBITDA from renewable energy generation was $632 million (2023 – $716 million). Our renewable fleet makes our overall portfolio more resilient to climate-related risks, provides increased flexibility in generation and creates incremental environmental value through environmental attributes. Our revenue in 2024 from environmental attribute sales was $79 million (2023 – $36 million).
The disclosure of TransAlta's financial metrics related to our climate-related risks and opportunities partially aligns with the IFRS S2 and TCFD recommendations.
A summary of our climate-related financial metrics is presented below.
| | | | | | | | | | | |
| Year ended Dec. 31 (in millions of Canadian dollars) | 2024 | 2023 | 2022 |
Growth capital expenditures for renewable energy generation(1) | 61 | | 630 | | 666 |
Renewable energy adjusted EBITDA(2) | 632 | | 716 | | 860 |
Environmental and tax attributes revenue(3) | 79 | 36 | | 53 | |
Renewable energy revenue(4) | 839 | | 902 | 1,014 | |
Investments in low-carbon research and development(5) | 8 | | 4 | | 12 | |
(1)Growth capital expenditures include amounts deployed for growth projects and acquisitions related to renewable energy generation. This includes the Garden Plain wind project and the Northern Goldfields solar project, both completed in 2023, and the White Rock and Horizon Hill wind projects, both completed in 2024. This excludes the Mount Keith transmission expansion and Mount Keith west network upgrade projects.
(2)Adjusted EBITDA from renewable energy generation includes hydro, wind, solar and battery storage facilities. The renewable energy adjusted EBITDA is the total adjusted EBITDA of the Hydro and Wind and Solar segments. These items are not defined and have no standardized meaning under IFRS and may not be comparable to similar measures presented by other issuers. During 2024 our adjusted EBITDA composition was amended to exclude the impact of Brazeau penalties and related provisions. Therefore, the Company has applied this composition to all previously reported periods. Refer to the Additional IFRS Measures and Non-IFRS Measures and Segmented Financial Performance and Operating Results sections of this MD&A.
(3)Environmental and tax attributes revenue represents a full amount of hydro, wind and solar environmental credit sales, including intercompany sales.
(4)Adjusted revenue from renewable energy generation includes hydro, wind, solar and battery storage facilities. For details of the adjustments to revenues included in adjusted EBITDA refer to the Additional IFRS and Non-IFRS Measures section of this MD&A
(5)Investments in low-carbon research and development include our equity investment in Ekona Power Inc.'s (Ekona) Series A funding round and our four-year investment in EIP’s Deep Decarbonization Frontier Fund 1 (the Frontier Fund).
| | | | | | | | |
| M110 | TransAlta Corporation | 2024 Integrated Report |
Alignment with Climate-Related Disclosures Frameworks
The table below shows the partial alignment of our climate change management disclosure with TCFD and IFRS S2 recommendations.
| | | | | | | | |
| TCFD Recommended Disclosures | Other Alignments | Location |
| Governance | | |
| Describe the board’s oversight of climate-related risks and opportunities | IFRS S2: 6 | Oversight by the Board of Directors |
| | |
| Describe management’s role in assessing and managing climate-related risks and opportunities | IFRS S2: 6 | Role of Senior Management |
| | |
| Strategy | | |
| Describe the climate-related risks and opportunities the organization has identified over the short, medium and long term | IFRS S2: 8-9 | Key Scenario Findings |
| | |
| Describe the impact of climate-related risks and opportunities on the organization’s businesses, strategy and financial planning | IFRS S2: 8-9 | Climate Change Strategy, Key Climate Scenario Findings |
| | |
| Describe the resilience of the organization’s strategy, taking into consideration different climate-related scenarios, including a 2°C or lower scenario | IFRS S2: 22-23 | Climate Scenarios, Key Climate Scenario Findings |
| | |
| Risk management | | |
| Describe the organization’s processes for identifying and assessing climate-related risks | IFRS S2: 10 | Climate Change Strategy |
| | |
| Describe the organization’s processes for managing climate-related risks | IFRS S2: 24-25 | Managing Climate Change Risks and Opportunities |
| | |
| Describe how processes for identifying, assessing and managing climate-related risks are integrated into the organization’s overall risk management | IFRS S2: 24-25 | Managing Climate Change Risks and Opportunities |
| | |
| Metrics and targets | | |
| Disclose the metrics used by the organization to assess climate-related risks and opportunities in line with its strategy and risk management process | IFRS S2: 27-28 | Climate Change Metrics and Targets |
| | |
| Disclose scope 1, scope 2 and, if appropriate, scope 3 greenhouse gas (GHG) emissions and the related risks | IFRS S2: 29-32 | Climate Change Metrics and Targets |
| | |
| Describe the targets used by the organization to manage climate-related risks and opportunities and performance against targets | IFRS S2: 33-36 | Climate Change Metrics and Targets |
| | |
| | | | | | | | |
| TransAlta Corporation | 2024 Integrated Report | M111 |
Enabling Innovation and Technology Adoption
TransAlta has been at the forefront of innovation in the power-generation sector since the early 1900s when we developed our first hydro facilities. We have been an early adopter and developer of wind technology, including the first commercial wind facility in Canada, and are now one of the largest wind generators in the country. In 2015, we made our first investment in solar technology in Massachusetts, in 2020, we installed the first utility-scale battery in Alberta and, in 2023, completed our first solar microgrid with battery energy storage system in Western Australia. This section covers manufactured and intellectual capital management partially in alignment with guidance from the IFRS's Integrated Reporting Framework.
Our Energy Innovation Team
In 2021, we established an Energy Innovation team to investigate, prioritize and deploy new net-zero electricity generation technologies that address reliability, decarbonization and affordability. The Energy Innovation team is focused on identifying projects that complement our hydro, wind and solar assets to deliver reliable and low-carbon electricity to customers. The Energy Innovation team is also looking at electrification more broadly to investigate potential new, adjacent business opportunities for TransAlta.
Our Energy Innovation team participates in the Low Carbon Peer Group, a discussion forum made up of TransAlta’s peers in the electricity sector in the U.S. and Canada. We also continue to participate in the energy innovation ecosystem through engagement with various innovation accelerators that 'incubate' and accelerate start-ups by matching new technology solutions with practical problems identified by end-users, like TransAlta or our customers.
Renewable Energy
In 2024, TransAlta's nameplate capacity was 2,406 MW from wind and battery storage, 944 MW from hydro energy, and 181 MW from solar power. In 2024, our U.S. renewables fleet represented over 1 GW.
In April 2024, the Company achieved commercial operation of our 302 MW White Rock wind facilities, located in Oklahoma. The facilities are fully contracted to Amazon Energy LLC and currently supply clean and affordable electricity to our customer.
In May 2024, TransAlta achieved commercial operation of our 202 MW Horizon Hill wind facility, located in Oklahoma. The facility is fully contracted to Meta Platforms Inc., which is receiving both clean electricity and environmental attributes from the facility.
In 2023, the Garden Plain wind facility in Alberta was commissioned adding 130 MW to our gross installed
capacity. The facility is fully contracted with Pembina Pipeline Corporation (100 MW) and PepsiCo Canada (30 MW). In addition, in 2023, the 48 MW Northern Goldfields solar and battery storage facilities in Western Australia achieved commercial operation.
Scaling Up Energy Solutions
Battery Storage
We continue to invest in battery energy storage systems as an important element to provide reliability through the energy transition – continuing an important role TransAlta has played for over 100 years with our hydro facilities.
In 2024, TransAlta’s development pipeline included four energy storage projects in Canada: WaterCharger (project is on hold, lithium-ion battery storage, 180 MW), Tent Mountain (pumped hydro storage, 160 MW), Brazeau (pumped hydro storage, 300-900 MW) and New Brunswick Power Battery (battery, 10 MW). These projects could play various roles on electricity grids including providing reliability services and storing surplus generation for discharge at peak periods.
In 2023, the Northern Goldfields solar and battery storage facilities in Western Australia achieved commercial operation. The energy storage consists of the 10 MW/5 MWh Leinster Battery Energy Storage System which is integrated into TransAlta’s remote network. The network and new generation supports BHP Nickel West to meet its emissions reduction targets and deliver lower-carbon nickel to its customers.
Electric Mobility
Companies can play an important role in reducing emissions by exploring the use of electric vehicles in their own operations. TransAlta is currently exploring the potential of electrifying our service fleet with zero-emission vehicles. In 2023, we launched a pilot project called Project Electrify to test four fully-electric vehicles at different facilities in Canada. The project will run from 2024 to 2025, during which time operators will gain hands-on experience with the technology and provide feedback on whether to pursue further electrification of our fleet.
Future Solutions
Hydrogen
In 2022, we announced a $2 million equity investment in Ekona's Series A funding round. The investment will help support the commercialization of Ekona’s novel methane pyrolysis technology platform, which produces cleaner and lower-cost turquoise hydrogen. If successful, Ekona’s distributed technology allows for on-site hydrogen
| | | | | | | | |
| M112 | TransAlta Corporation | 2024 Integrated Report |
production, hence avoiding the need for costly transportation of hydrogen. Furthermore, its solid carbon byproduct allows for low-cost, low-emissions hydrogen production without the need for carbon sequestration. TransAlta is a member of Ekona’s Strategic Committee and continues to work with Ekona as it develops its pyrolysis technology.
Small Modular Reactors (SMR)
Small modular reactors have a power capacity of up to 300 MW per unit and differ from traditional nuclear in that they modular, factory-assembled units transported to a location for installation. Additionally, they implement passive or walk-away safety features designed to dramatically reduce the risk of nuclear events. While high costs remain a challenge for all forms of nuclear, SMR developers argue that smaller MW plants made from manufactured components will allow the industry to access steep cost declines as the technology matures and more units are deployed. By providing reliable, emissions-free baseload power, nuclear power may play an important role in clean energy transitions.
In 2024, TransAlta announced a partnership with X-Energy Reactor Company, LLC to study the deployment of X-Energy’s Xe-100 advanced small modular nuclear reactors in Alberta. With support from a grant from Emissions Reduction Alberta, the study will examine the feasibility of deploying X-Energy’s advanced high-temperature gas-cooled small modular nuclear reactor at an existing coal-to-gas plant in Alberta.
TransAlta continues to monitor developments in SMR and explore the benefits of carbon dioxide removal options to support the net-zero transition of our operations, such as nature-based solutions, direct air capture, carbon capture, utilization and storage, and other technologies.
Hybrid Hydro Supercapacitor Energy Storage
In 2024, TransAlta launched a project with Atlas Power Technologies Inc. for a hybrid hydro supercapacitor energy storage system, which is expected to be the first of its kind in North America. With support from a grant from Emissions Reduction Alberta, the project is complementary to an existing hydroelectric generating station that augments the power plant’s response time and capability to address frequency response needs.
Disruptive Technologies
In 2022, we entered into a commitment to invest US$25 million over the next four years in Energy Impact Partners' (EIP) Deep Decarbonization Frontier Fund 1 (the Frontier Fund) that invests in early-stage, innovative technology companies that seek to accelerate the transition to net-zero GHG emissions. TransAlta's investment in the Frontier Fund provides TransAlta with the opportunity to pool funds with some of the largest utilities in the U.S. and Europe to identify, pilot, commercialize and bring to market technologies that will support its decarbonization goals. In total, the Company invested US$12 million to this fund as at Dec. 31, 2024.
Fusion
Fusion technologies attempt to recreate the fusion reactions in the sun by fusing two hydrogen molecules together. If successful, fusion promises low-cost energy, with far shorter-lived nuclear waste.
Through EIP, TransAlta has invested in ZAP Energy, a leading fusion startup. ZAP Energy’s technology stabilizes the hydrogen plasma using sheared flow (driving current through the flow creating the magnetic field confining and compressing the plasma) rather than magnetic fields. In 2022, ZAP announced it will conduct a feasibility study of retrofitting our retired Big Hanaford gas plant located in Centralia to host its first-of-a-kind Z-pinch fusion pilot plant. In 2024, ZAP received a second grant in the same amount of US$1 million from the Centralia Coal Transition Grants Energy Technology Board as part of energy transition investments to move away from coal in Washington State.
For more information on our investments in low-carbon research and development, refer to the Climate-Related Financial Metrics section of this MD&A.
| | | | | | | | |
| TransAlta Corporation | 2024 Integrated Report | M113 |
Managing Environmental Resources
We continue to increase financial value from natural or environmental capital-related business activities, while striving to minimize our environmental footprint and potential risk factors related to environmental impacts. This section covers natural capital management partially in alignment with guidance from the IFRS's Integrated Reporting Framework.
Environmental Strategy
All energy sources used to generate electricity impact the environment. While we are pursuing a business strategy that includes investing in renewable energy resources such as wind, hydro and solar, we also believe that natural gas will continue to play an important role in meeting energy needs. In 2026, we expect that our generation mix will be made up of natural gas and renewable energy only.
Our Environmental Policy defines how we are integrating the protection of nature and the environment within TransAlta’s strategy, our Total Safety Management System, as well as the principles of conduct for the management of natural resources.
Environmental Management System
At TransAlta, we operate our facilities in line with best practices related to environmental management standards. Our environmental management processes are verified annually to ensure we continuously improve our environmental performance. Our knowledge of environmental management systems (EMS) has matured since we aligned our processes in accordance with the internationally recognized ISO 14001 EMS standard. Currently, the most material natural or environmental capital impacts to our business are GHG emissions, air emissions (i.e., pollutants) and energy use. Other material impacts that we manage and track performance on via our environmental management practices include land use, water use, waste management and biodiversity.
In addition to our environmental management practices, we are subject to environmental laws and regulations that affect aspects of our operations, including air emissions, water quality, wastewater discharges and the generation, transport and disposal of waste and hazardous substances. The Company’s activities have the potential to damage natural habitat, impact vegetation and wildlife, or cause contamination to land or water that may require remediation under applicable laws and regulations. These laws and regulations require us to obtain and comply with a variety of environmental registrations, licences, permits and other approvals. The environmental regulations in the jurisdictions in which we operate are robust. Both public officials and private individuals may seek to enforce
environmental laws and regulations against the Company. We interact with a number of regulators on an ongoing basis.
Nature-Related Risks and Opportunities
Nature-related risks may exist based on a Company’s dependencies on and impacts to biodiversity, ecosystems and ecosystem services (BEES) and could result in nature-related events. These events could impact resource availability and sustainability, disrupt the supply chain necessary for successful operations, have negative regulatory compliance implications and cause reputational damage. Nature-related opportunities might exist when supporting or enhancing BEES, to the benefit of business operations. These opportunities can include accessing healthy, natural resources (i.e., soil and water), supporting a resilient ecosystem that is less prone to fluctuations (e.g., drought, flooding and erosion) and enhancing tourism and recreational opportunities.
Overseeing Nature-Related Issues
TransAlta's GSSC assists the Board in fulfilling its oversight responsibilities with respect to the Company’s monitoring of environmental regulations, public policy changes and the development of strategies, policies and practices for the environment. For further information, refer to the Sustainability Governance section of this MD&A.
Assessing Nature-Related Dependencies and Impacts
In 2024, TransAlta conducted our first nature-related risks and opportunities assessment, achieving our 2022 sustainability target to "assess and disclose nature-related risks and opportunities including TransAlta’s dependencies and impacts on ecosystems, land, water and air" by 2024.
We chose to follow the TNFD recommendations where possible, as a commitment to using internationally recognized methodologies. The analysis utilized the TNFD guidance on assessing nature-related issues—the Locate, Evaluate, Assess, Prepare (LEAP) approach—in conjunction with the TNFD Additional Sector Guidance – Electric Utilities and Power Generators (June 2024).
Methods applied include the review of environmental evaluations, permits and monitoring reports, the collection of environmental and geospatial data, the use of the TNFD data tools and the review of findings by internal and external subject matter experts. In addition, we adopted a TNFD scenario that projects moderate nature-related risks to business operations over the next 20 years, driven by gradual ecosystem degradation, climate change and shifting customer and shareholder expectations. This analysis excluded projections of physical risks related to climate change.
| | | | | | | | |
| M114 | TransAlta Corporation | 2024 Integrated Report |
Given the large number of TransAlta's assets, a subset of facilities was selected and included over 3,100 MW of nameplate capacity from hydro, wind, solar, natural gas and coal facilities in Canada, the U.S. and Western Australia.
The following sections highlight TransAlta's top dependencies, impacts, risks, opportunities and mitigation measures related to nature.
Material Dependencies
We identified where and how the Company's operations may interface with nature and determined whether those interfaces are material. This means that our goal was not to understand or evaluate every potential issue, but rather focus on ecosystem services considered material to the operation of our selected facilities.
Our most material dependencies are associated with the regulation of the climate and climatic events, the use of water in production cycles, mainly in gas- and coal-fired power generation and the regulation of the water cycle, which enables the operation of hydroelectric facilities.
For further information on climate change, refer to the section Managing Climate Change Risks and Opportunities. of this MD&A.
TransAlta's nature-related dependencies found to be material are summarized in the table below.
Material Dependencies by Generation Type
| | | | | | | | | | | | | | |
Ecosystem service(1) | Hydro | Wind | Solar | Gas and coal |
| Groundwater | M | NA | VL | M |
| Surface water | VH | NA | VL | VH |
| Water supply | VH | VL | M | H |
| Water flow regulation | VH | NA | NA | M |
Climate regulation(2) | VH | VH | VH | VL |
| Flood and storm protection | H | M | M | M |
| Soil stabilization and erosion control | H | M | M | L |
Legend: (VL) Very Low, (L) Low, (M) Medium, (H) High, (VH) Very High and (NA) Not Applicable, as defined by the TNFD Additional Sector Guidance - Electric Utilities and Power Generators (June 2024).
(1)The use of renewable resources (wind and solar radiation) and mineral resources (natural gas and coal), water flow regulation, flood and storm protection, and soil stabilization and erosion control are material to our operations but were excluded from this analysis because associated metrics were not available at an international scale. Facilities have locally mandated controls to manage risks, including engineering solutions built into the design phase.
(2)Climate regulation services are the ecosystem contributions to the regulation of ambient atmospheric conditions and were excluded from this analysis because they are discussed in the section Managing Climate Change Risks and Opportunities.
Material Impact Drivers
Impact drivers are a measurable quantity of a natural resource that is used as an input to production (e.g., the volume of water consumed) or a measurable non-product output of a business activity (e.g., a kilogram of NOx emissions released into the atmosphere).
The analysis of TransAlta's material impact drivers included the assessment of 26 metrics related to land use, water, air emissions, GHG emissions, waste, species at risk, invasive alien species and enforcement actions or fines.
Our material nature-related impact drivers are associated with GHG emissions and the use of water as summarized in the table below.
| | | | | | | | |
| TransAlta Corporation | 2024 Integrated Report | M115 |
Material Impact Drivers by Generation Type
| | | | | | | | | | | | | | |
Impact driver(1) | Hydro | Wind | Solar | Gas and coal |
| Land use change | VH | H | VH | NA |
| Freshwater use change | VH | M | NA | H |
| Water use | VH | NA | NA | VH |
| GHG emissions | L | NA | NA | VH |
| Non-GHG emissions | NA | NA | NA | VH |
| Water/soil pollutants | H | L | L | M |
| Solid waste | L | L | L | H |
| Area of land use | M | H | L | M |
| Area of freshwater use | H | NA | NA | M |
Biological alterations(2) | H | NA | NA | NA |
Legend: (L) Low, (M) Medium, (H) High, (VH) Very High and (NA) Not Applicable, as defined by the TNFD Additional Sector Guidance - Electric Utilities and Power Generators (June 2024).
(1)Noise and light disturbances are material to our operations but were excluded from this analysis because mitigations are built into project design and monitored during operations, in accordance with applicable regulatory requirements in the jurisdictions in which we operate. The state of nature (e.g., species extinction risk, direct mortality, fisheries risk and incidents related to birds, bats, fish and others) is material to our operations but was not included in this table because the TNFD has not provided the associated materiality ratings. Metrics related to the state of nature were included in our analysis and are summarized under the Biodiversity heading in the Environmental Performance section of this MD&A.
(2)Biological alterations or interferences include the impact from activities that directly introduce nonnative invasive species into areas of operation.
Potential Risks, Opportunities and Mitigation Measures
Nature-related risks are the potential threats posed to an organization linked to its dependencies on nature and its impacts on nature. These can derive from physical and transition risks.
The analysis of TransAlta's nature-related risks and opportunities was conducted with a focus on physical risks. These risks were evaluated to help us understand how our operations result in changes in the state of nature and how this affects ecosystem service provision.
Transition risks such as regulatory and policy, reputation, market and technology risks related to the Company are discussed in the Governance and Risk Management section of this MD&A. Transition risks related to climate change are disclosed in the Managing Climate Change Risks and Opportunities section of this MD&A.
Nature-related opportunities are activities that create positive outcomes for organizations and nature by avoiding or reducing impact on nature, or contributing to its restoration.
The metrics we use to assess and manage material nature-related dependencies and impacts as well as risks and opportunities in line with its strategy and risk management process can be found in the Environmental Performance section of this MD&A. Current and future nature-related targets can be found in the Our 2024 Sustainability Performance and 2025+ Sustainability Targets sections of this MD&A.
| | | | | | | | |
| M116 | TransAlta Corporation | 2024 Integrated Report |
TransAlta's nature-related risks and opportunities and their mitigation measures are summarized in the following table.
Identified Potential Risks and Opportunities and Mitigation Measures
| | | | | | | | |
| Potential risks | Mitigation measures and opportunities |
| | |
| Hydro | Substantial alteration of natural water flow regimes is typical, leading to major changes in water levels, flow timing and velocity. Two facilities are located within 35 km of a World Heritage site as defined by the United Nations Educational, Scientific and Cultural Organization (UNESCO). These facilities are not within 35 km of Key Biodiversity Areas. Minimal impact related to land pollution, including spills, may occur. Facilities are located in areas with very low to low water stress, as determined by the Aqueduct Water Risk Atlas. Some facilities are located within critical habitat for species at risk. While there is potential for fish mortality, species extinction risk and mortality risk related to species listed by the International Union for Conservation of Nature (IUCN) are minimal. Typically, there is minimal impact from the emissions of GHG, SO2, NOx, particulate matter and mercury. | Most facilities maintain minimum or riparian flows to help support fish habitats despite the fluctuations in natural water flows. These measures aim to moderate the effects of dam operations on local water systems and wildlife. Our Cascade (36 MW) and Spray (112 MW) facilities are located within the Canadian Rocky Mountain Parks (UNESCO World Heritage Site). Cascade is located in and Spray is adjacent to Banff National Park. These facilities are Ecologo certified. This means that their energy products or services have undergone third-party testing for reduced impacts on aquatic, riparian and terrestrial ecosystems. In 2021, we renewed our previous agreement with the Government of Alberta for another five years to manage water flow on the Bow River at our Ghost Reservoir facility to aid in potential flood mitigation efforts, as well as at our Kananaskis River System (which includes the Interlakes, Pocaterra and Barrier hydroelectric plants) for drought mitigation efforts. In 2024, TransAlta signed onto a voluntary water-sharing memorandum of understanding with over 30 other water licence holders in the Bow River Basin in Alberta. Due to its role managing water storage and water flows in the Bow River system for power generation, drought prevention and flood control, the Company collaborates with other downstream water licence holders to manage water flows. |
| | |
| | |
| Wind | No measurable impact on water natural flow regimes. Facilities are located in areas with very low to moderate water stress. Some facilities are located within a Key Biodiversity Area, but not within 35 km of UNESCO World Heritage sites. Minimal impact related to land pollution, including spills, may occur. While there is potential for wildlife mortality, species extinction risk and mortality risk related to IUCN-listed species are minimal to low. Typically, there is minimal impact from the emissions associated with wind facilities. | Wind facilities can be associated with bird and bat mortalities. Given this, our wind facilities are required to complete post-construction mortality monitoring for a set number of years after the start of operations. If mortality exceeds acceptable levels, additional monitoring and mitigation measures are usually required (e.g., curtailment). Further information on mortality of species at risk can be found under the Biodiversity heading in the Environmental Performance section of this MD&A. |
| | |
| | |
| Solar | No measurable impact on water natural flow regimes. Facilities are located in areas with moderate water stress. Minimal impact related to land pollution, including spills, may occur. Some facilities are located within a Key Biodiversity Area, but not within 35 km of UNESCO World Heritage sites. While there is potential for wildlife mortality, species extinction risk is minimal. Mortality risk related to IUCN-listed species is moderate. Typically, there is minimal impact from the emissions associated with solar facilities. | Facilities are located in areas with moderate water stress. However, their water use is minimal. Typically, solar facilities can have high impacts on land use and land use change. These impacts could be reduced if facilities are small in size. This is the case with our North Carolina solar facility (122 MW), which is composed of 20 small sites throughout the state. Further information on mortality of species at risk can be found under the Biodiversity heading in the Environmental Performance section of this MD&A. |
| | |
| | |
| | | | | | | | |
| TransAlta Corporation | 2024 Integrated Report | M117 |
| | | | | | | | |
| Identified Potential Risks and Opportunities and Mitigation Measures (Continued) |
| Potential risks | Mitigation measures and opportunities |
| | |
| Natural gas | Some modification of water flow, affecting specific local stretches of water bodies is typical. Seasonal or operational impacts on flow may exist but are limited in scope and duration. Most facilities are located in areas with low water stress, but our Western Australian operations are located in areas with very high water stress. Facilities are not located within 35 km of Key Biodiversity Areas or UNESCO World Heritage sites. Minimal impact related to land pollution, including spills, may occur. Facilities are not located within critical habitat for species at risk. Species extinction risk and mortality risk related to IUCN-listed species are minimal to moderate. High to major impacts from the emissions of GHG, NOx and particulate matter are typical, with minimal impact from SO2 and mercury. | Water for gas operations is withdrawn primarily from rivers where we hold permits and must therefore adhere to regulations on the quality of discharged water. Our largest water withdrawal and discharge occurs at our Sarnia gas cogeneration facility (which produces both electricity and steam for our customers). The facility operates as a once-through, non-contact cooling system for our steam turbines. In 2024, we returned approximately 97 per cent of the water withdrawn from the adjacent St. Clair River to support our Sarnia operations. Our facilities in Western Australia have been designed to minimize water consumption. Water supply at these facilities is provided at no cost under PPAs with our mining customers, hence our risk is significantly mitigated. Water used in our operations is returned to our customers, who repurpose this water for vegetation and dust suppression in their mining operations. In addition, the South Hedland facility has developed a Water Efficiency Management Plan with Water Corporation WA, the principal supplier of water, wastewater and drainage services in Western Australia. Initiatives are aimed at reducing water consumption and costs through innovative technology and efficiencies identified through facility management. In 2022, we met our 2026 targets to achieve a 95 per cent reduction of SO2 emissions and an 80 per cent reduction of NOx emissions below 2005 levels and we retained the achievement over 2023 and 2024. We continue to progress towards our 2026 target to reduce scope 1 and 2 GHG emissions by 75 per cent from 2015 levels. Since 2015, we have reduced scope 1 and 2 GHG emissions by 22.7 MT CO2e or 70 per cent. |
| | |
| | |
| Coal | TransAlta’s sole remaining coal-fired generation facility, Centralia, is located in an area with very low water stress. Some modification of water flow, affecting specific local stretches of water bodies is typical. Seasonal or operational impacts on flow may exist but are limited in scope and duration. Centralia is not located within 35 km of Key Biodiversity Areas or UNESCO World Heritage sites. Minimal impact related to land pollution, including spills, may occur. Centralia is not located within critical habitat for species at risk. Species extinction risk and mortality risk related to IUCN-listed species are minimal. Typically, there is major impact from the emissions of GHG, SO2, NOx, particulate matter and mercury. | TransAlta historically operated three coal mines. The Whitewood mine in Alberta is completely reclaimed and the land was donated to the community. Further information can be found in the Case Study: TransAlta's Donation to the Alberta Conservation Association in the Community Investments section of this MD&A. The Highvale mine in Alberta closed in 2021 and the Centralia mine in Washington State closed in 2006. Both Highvale and Centralia are actively reducing their footprint through site reclamation, with targeted completion by 2046 and 2040 respectively. In 2021, we retired or converted all coal plants in Canada to natural-gas-fired generation. We plan to cease coal-fired generation at our Centralia plant in the U.S. by Dec. 31, 2025. |
| | |
| | | | | | | | |
| M118 | TransAlta Corporation | 2024 Integrated Report |
Environmental Performance
Our performance on managing environmental aspects is presented in the following sections and excludes the acquisition of Heartland Generation on Dec. 4, 2024.
Energy Use
TransAlta uses energy in a number of different ways. We burn natural gas, diesel and coal to generate electricity. We plan to cease coal-fired generation at Centralia by the end of 2025. We harness the kinetic energy of water and wind
to generate electricity. We also generate electricity from the sun. In addition to combustion of fuel sources, we also track combustion of gasoline and diesel in our vehicles and the electricity use and fuel use for heating (such as natural gas) in the buildings we occupy. Knowledge of how much energy we use allows us to optimize and create energy efficiencies. As an electricity generator, we continually and consistently look for ways to optimize and create efficiencies related to the use of energy.
The following table captures our energy use (petajoules). Energy use decreased by 11 per cent in 2024 over 2023. Some values do not sum to the indicated total due to rounding. Zeros (0) indicate truncated values.
| | | | | | | | | | | |
| Year ended Dec. 31 | 2024 | 2023 | 2022 |
| Hydro | 0 | 0 | 0 | |
| Wind and Solar | 0 | 0 | 0 | |
| Gas | 122 | 123 | 130 | |
| Energy Transition | 52 | 73 | 64 | |
| Corporate and Energy Marketing | 0 | 0 | 0 | |
| Total energy use (petajoules) | 175 | 197 | 195 | |
Air Emissions
Our one remaining coal-fired facility emits air emissions that we track, analyze and report to regulatory bodies. We also work on mitigation solutions depending on the type of air emission. We report our major air emissions from coal, which include NOx, SO2, particulate matter and mercury. We continue reducing air emissions in our existing facilities through our conversion and retirement of coal units in Alberta (completed in 2021) and Washington State (planned completion by the end of 2025).
In 2022, we achieved our 2026 target of 95 per cent SO2 and 80 per cent NOx emissions reductions over 2005 levels. In 2025, TransAlta set a new target "By 2030, achieve a 90 per cent reduction of SO2 emissions intensity from 2023 base year".
As per guidance from SASB, detailed air emissions disclosure is required when a facility is located within 49 kilometres of an area with a population greater than 50,000 persons.
Many of our gas facilities are located in very remote and unpopulated regions, away from dense urban areas. However, our Sarnia, Windsor, Ottawa, Fort Saskatchewan and Ada gas facilities and Centralia coal facility are located within 49 kilometres of dense or urban environments. In 2024, these facilities accounted for 41 per cent of total NOx, 99 per cent of total SO2, 31 per cent of total particulate matter and 56 per cent of total mercury.
Our total air emissions in 2024 show a decrease of 18 per cent for SO2 and 18 per cent for NOx from 2023 levels. This is primarily due to the decrease in production from our coal facility.
| | | | | | | | |
| TransAlta Corporation | 2024 Integrated Report | M119 |
The following table represents our material air emissions. Figures have been rounded for SO2 (to the nearest one hundred), NOx (to the nearest one thousand), particulate matter (to the nearest ten, when possible) and mercury (to the nearest whole number).
| | | | | | | | | | | |
| Year ended Dec. 31 | 2024 | 2023 | 2022 |
SO2 (tonnes) | 870 | 1,100 | 1,200 |
NOx (tonnes) | 8,700 | 11,000 | 11,000 |
| Particulate matter (tonnes) | 320 | 460 | 360 |
| Mercury (kilograms) | 16 | | 21 | | 21 |
Water
Our principal water use is for cooling and steam generation in our coal and gas facilities, but our hydro operations also require water flow for operations. Water for coal and gas operations is withdrawn primarily from rivers where we hold permits and must therefore adhere to regulations on the quality of discharged water. The difference between withdrawal and discharge, representing consumption, is due to several factors, which include evaporation loss and steam production for customers, which we are unable to recover.
In 2022, we achieved our water consumption reduction target to reduce fleet-wide water consumption (withdrawals minus discharge) by 20 million m3 or 40 per
cent in 2026 over the 2015 baseline. Water consumption in 2015 was 45 million m3. This target is in line with the UN SDGs, specifically "Goal 6: Clean Water and Sanitation." In 2024, we retained the achievement of this target. In 2025, TransAlta set a new target "By 2030, maintain water consumption intensity at 2023 levels".
In 2024, we withdrew approximately 237 million m3 (2023 – 273 million m3) and returned approximately 212 million m3 (2023 – 239 million m3) or 90 per cent. Overall, water consumption was approximately 25 million m3 (2023 – 34 million m3).
The following table represents our water withdrawal, water discharge and total water consumption (million m3). Some values do not sum to the indicated total due to rounding. Figures below have been rounded to the nearest million m3.
| | | | | | | | | | | |
| Year ended Dec. 31 | 2024 | 2023 | 2022 |
| Water withdrawal | 237 | | 273 | | 233 | |
| Water discharge | 212 | | 239 | | 207 | |
Total water consumption (million m3) | 25 | | 34 | | 26 | |
Dam Safety
Our dam safety programs include all hydroelectric developments, constructed ponds and fluid retaining structures such as ash lagoons and canals, as well as associated equipment and structures and the personnel required to operate, maintain and inspect these items. They are governed through our Dam Safety Policy and Dam Safety Management System, which includes requirements on design, modification and decommissioning, operation, maintenance and surveillance, public safety, emergency management and risk management.
TransAlta’s Board and its President and CEO oversee the effectiveness of our dam safety programs and receive regular updates. In 2022, a member of the Board was designated as the Company's Dam Safety Advisor to assist the Board in fulfilling its oversight role in regard to the Company's dam safety practices given the unique and technical aspects of dam safety. In addition, TransAlta
engages an external Dam Safety Review Panel to provide external review of the program and its management, including overall assessment and benchmarking against other national and international programs. Our monitoring programs include:
•Regular operations and engineering inspections;
•Testing critical equipment;
•Numerous instruments in the dams monitoring water level, temperature, movement, earthquake detection;
•Use of drones and satellite remote movement monitoring;
•Emergency plans and exercises with internal and external stakeholders; and
•Regular third-party reviews that are shared with the regulators.
We work closely with local stakeholders including conservation authorities and public agencies on watershed management, emergency planning and flood response. In 2022, we started decommissioning the Keephills Ash
| | | | | | | | |
| M120 | TransAlta Corporation | 2024 Integrated Report |
Lagoon, a facility that is no longer needed for ash storage following the coal-to-gas conversion of Keephills Unit 2. This project will reshape the existing lagoon so that it is stable for the long term and is the first step towards decommissioning the structure. Similar work is underway to remove the coal combustion waste storage ponds at the Centralia facility in Washington State.
TransAlta is proud of its reputation in dam safety. We participate in many industry associations including the Canadian Dam Association, Dam Safety Interest Group of the Centre for Energy Advancement through Technological Innovation, United States Society on Dams, Canadian Geotechnical Society, Dam Safety Advisory Committee of the Alberta Chamber of Resources and Association of State Dam Safety Officials.
For information on our corporate emergency management program, refer to Public Health and Safety in the Engaging with Our Stakeholders to Create Positive Relationships section of this MD&A.
Waste
The importance of environmental protection and waste management is outlined in our Environmental Policy as a corporate responsibility for TransAlta and its employees, and contractors working on TransAlta's behalf. Our waste data is reported annually to a number of different regulatory bodies.
In 2024, our operations generated approximately 384,000 tonnes equivalent of waste (2023 – 479,000 tonnes). Of the total waste generated, 98 per cent was non-hazardous waste and zero per cent was directed to landfill (2023 – 0.2 per cent). Since its retirement, we have been selling ash from our Highvale and Centralia Mine, which accounts for 97 per cent of the total waste generated.
The following table represents our total waste generation (tonnes equivalent). Figures have been rounded to the nearest one thousand.
| | | | | | | | | | | |
| Year ended Dec. 31 | 2024 | 2023 | 2022 |
| Waste to landfill (tonne eq.) | 1,000 | 1,000 | 2,000 |
| Waste recycled (tonne eq.) | 12,000 | 19,000 | 22,000 |
| Waste reuse (tonne eq.) | 372,000 | 457,000 | 453,000 |
| Total waste generation (tonnes equivalent) | 384,000 | 479,000 | 506,000 |
| Percentage of total waste to landfill | 0.3 | | 0.2 | 0.4 |
| Percentage of total waste: hazardous | 2.4 | | 3.5 | | 5.0 |
| Percentage of hazardous waste to landfill | 0.0 | 0.0 | 0.0 |
Our reuse waste or byproduct waste is generally sold to third parties. Our operating teams are diligent at not only minimizing waste, but also maximizing recoverable value from waste. We have invested in equipment to capture byproducts from the combustion of coal, such as fly ash, bottom ash, gypsum and cenospheres, for subsequent sale. These non-hazardous materials add value to products like cement and asphalt, wallboard, paints and plastics.
Coal Ash Management
Given our transition off coal, we ceased producing fly ash waste in Canada at the end of 2021 and will no longer produce it past the end of 2025 in the U.S. In 2023, Lafarge Canada and TransAlta entered into an agreement designed to advance low-carbon concrete projects in Alberta. The project repurposes landfilled fly ash, a waste product from TransAlta’s Highvale mine, which ceased operations in 2021. The ash is used to replace cement in concrete manufacturing. Turning the recovered product into something marketable, reduces the amount of cement produced and consequent emissions while offering new
job and economic growth opportunities. This innovative technology contributes to reducing waste and is expected to reduce reclamation liabilities for TransAlta.
Land Use
Our largest land use had been associated with land disturbed by surface mining of coal, which we ceased to do in 2021. Of the three mines we operated, the Whitewood mine in Alberta is completely reclaimed and the land certification process is ongoing. Our Centralia mine in Washington State is currently in the reclamation phase and we have adopted a target to fully reclaim this mine by 2040.
Our Highvale mine in Alberta ceased operations on Dec. 31, 2021, when we discontinued coal-fired power generation in Canada. The mine reclamation of Highvale has been progressively executed as part of our regulatory approvals and our target is to have it fully reclaimed by 2046. In 2022, our reclamation team submitted our final reclamation plans. The updated plans align with community priorities
| | | | | | | | |
| TransAlta Corporation | 2024 Integrated Report | M121 |
for the reclaimed land. In 2024, we continued contouring disturbed areas, re-establishing drainage, replacing topsoil and subsoil, and advancing re-vegetation and land management.
Our land use practices regarding previous mining activities incorporate progressive reclamation where the final end use of the land is considered at all stages of planning and development. To date, we have reclaimed approximately 5,000 hectares, which is equivalent to 40 per cent of land disturbed (12,500 hectares).
Biodiversity
The importance of environmental protection and biodiversity is outlined in our Environmental Policy as a corporate responsibility for TransAlta and a responsibility of each employee and contractor working on TransAlta's behalf. In 2022, the Company adopted the target to "achieve zero biodiversity-related incidents". This means zero biodiversity-related incidents that affected habitats and species included on the Red List of the IUCN from near threatened to critically endangered.
The following table represents our biodiversity incidents in accordance with the IUCN Red List classification.
| | | | | | | | | | | |
| Year ended Dec. 31 | 2024 | 2023 | 2022 |
| Critically endangered | 0 | | 0 | | 0 | |
| Endangered | 0 | | 0 | | 0 | |
| Vulnerable | 0 | | 0 | | 0 | |
| Near threatened | 0 | | 0 | | 0 | |
| Total biodiversity-related incidents | 0 | | 0 | | 0 | |
Environmental Incidents and Spills
Protecting the environment supports healthy ecosystems and mitigates our environmental compliance risk and reputational risk. We maintain corporate incident management procedures, as part of our Total Safety Management System, for response, investigation and lessons learned to minimize environmental incidents. With respect to biodiversity management (management of ecosystems, natural habitats and life in the areas we operate), we seek to establish robust environmental research and data collection to establish scientifically sound baselines of the natural environment around our facilities to ensure we can accurately evaluate the level of significance to biodiversity following an incident.
We closely monitor the air, land, water and wildlife in these areas to identify and curtail potential impacts.
In 2024, no regulatory non-compliance environmental incidents were recorded (2023 – no incidents). No fines or environmental enforcement actions occurred.
The following table represents our regulatory non-compliance environmental incidents.
| | | | | | | | | | | |
| Year ended Dec. 31 | 2024 | 2023 | 2022 |
| Regulatory non-compliance environmental incidents | 0 | 0 | 1 |
Regarding spills and releases, efforts are placed on providing immediate response to all environmental spills to ensure assessment, containment and recovery of spilled materials result in minimal impact to the environment.
The volume of spills in 2024 was zero (0) m3 (2023 – 0 m3).
The following table represents our significant environmental incidents.
| | | | | | | | | | | |
| Year ended Dec. 31 | 2024 | 2023 | 2022 |
| Significant environmental incidents | 0 | 0 | 0 |
| | | | | | | | |
| M122 | TransAlta Corporation | 2024 Integrated Report |
Engaging with Our Stakeholders to Create Positive Relationships
We strive to create shared value for our stakeholders through social and relationship value creation at TransAlta. The most material impacts on our social and relationship performance are fostering positive relationships with Indigenous neighbours, communities, stakeholders, governments, industry and landowners in the areas where we operate, as well as public health and safety. This section covers sustainability factors of social and relationship capital and intellectual capital partially in alignment with guidance from the IFRS's Integrated Reporting Framework. Performance outlined below excludes the acquisition of Heartland Generation on Dec. 4, 2024.
Inclusive Transition
In support of our energy transition, from 2012 to 2023, TransAlta invested US$55 million to support energy efficiency, economic and community development and education and retraining initiatives in Washington State. The investment is part of the TransAlta Energy Transition Bill passed in 2011. This bill was a historic agreement between policymakers, environmentalists, labour leaders and TransAlta to transition away from coal in Washington State by ceasing Centralia's coal-fired generation by the end of 2025.
Three funding boards were formed to invest the US$55 million starting in 2015: the Weatherization Board (US$10 million), the Economic and Community Development Board (US$20 million), and the Energy Technology Board (US$25 million). These boards are independent from TransAlta and provide grants to local businesses, non-profit organizations and local governments to improve energy efficiency, educate and retrain workers for the next generation of jobs and fund energy technology projects. To date, the Weatherization Board has invested US$10 million, the Economic and Community Development Board US$18.9 million and the Energy Technology Board US$15.5 million. Further information on Centralia Coal Transition Grants can be found on the website https://cctgrants.com/.
Additionally, in 2016, TransAlta announced that we had reached an agreement with the Government of Alberta for the cessation of emissions from coal-fired electricity
generation facilities in Alberta (Off-Coal Agreement). As part of the Off-Coal Agreement, TransAlta has and continues to invest in programs and initiatives to support the communities surrounding the plants negatively impacted by the phase-out of coal generation during the transition.
Customers
TransAlta serves industrial and commercial customers with power and energy services across its fleet in Canada, the U.S. and Western Australia. We are focused on customer-centred growth to bring high levels of service quality and reliability for our customers. As one of the largest electricity generators in Canada, our team serves businesses with:
•Energy solutions starting from the design phase;
•Energy consumption and cost management solutions;
•Market price risk and volume exposure mitigation; and
•Monitoring of energy market design changes, price signals and applicable and available incentives.
The Customer Solutions team at TransAlta has maintained a large portfolio of customers in Alberta across a broad range of industry segments, including commercial real estate, municipal, manufacturing, industrial, hospitality, finance and oil and gas. Our work has been recognized by our customers through an average retention rate of 92 per cent over the last three years.
Across our business in Canada, the U.S. and Western Australia, we provide on-site generation for large mining and industrial customers. This requires us to continually engage with these customers, ensuring that current electricity requirements are provided safely, reliably and cost-effectively. We continue to explore opportunities to develop renewable energy facilities to support customers achieving their sustainability goals and targets, such as 100 per cent renewable power targets and/or GHG emissions reduction targets. Production from renewable electricity in 2024 resulted in the avoidance of approximately 2.8 million tonnes of CO2e for our customers.
| | | | | | | | |
| TransAlta Corporation | 2024 Integrated Report | M123 |
Our experience in developing and operating power facilities is highlighted below.
| | | | | |
| Power generation type | Operating experience (years) |
| Hydro | 113 | |
| Natural Gas | 74 | |
| Wind | 27 | |
| Solar | 10 | |
| Battery Energy Storage Systems | 4 | |
For further details on how we support our customers' sustainability objectives, please refer to the Enabling Innovation and Technology Adoption section of this MD&A.
Human Rights
TransAlta is committed to honouring domestic and internationally accepted labour standards and supports the protection of human rights of all its employees, contractors, suppliers, partners, Indigenous partners and other stakeholders. We abide by human rights and modern slavery legislation in Canada, the U.S. and Australia. We have a zero tolerance approach to discrimination based on age, disability, gender, race, religion, colour, national origin, political affiliation or veteran’s status or any other prohibited ground as defined by human rights legislation in the jurisdictions in which we operate. We afford equal opportunities for all gender identities, support the right to freedom of association and the right to organize unions and bargain collectively. We do not conduct operational human rights reviews or impact assessments, but we have governance practices in place for the protection of human rights.
Our Human Rights and Discrimination Policy outlines our commitment to human rights in our operations and supply chain to ensure that our personnel policies and practices in our global operations respect fundamental rights. Expected behaviours of all our employees are set out in our Corporate Code of Conduct. We are committed to creating a work environment where all workers feel safe and are valued for the diversity they bring to our business. Our annual mandatory Code of Conduct training is required for employees prior to signing off the Code of Conduct. In 2024, 100 per cent of employees completed the training and acknowledged and signed the Code of Conduct. We also have adopted a Supplier Code of Conduct that defines the principles and standards expected of suppliers, their employees and contractors to meet while providing goods and/or services to TransAlta.
Our Whistleblower Policy provides a mechanism for our employees, officers, directors and contractors to report, among other things, any actual or suspected ethical or legal violations. We would seek to remedy the impact promptly in order to establish a corrective action
plan in collaboration with the relevant individuals and stakeholders.
TransAlta files annual reports under Canada's Fighting Against Forced Labour and Child Labour in Supply Chains Act and Australia's Modern Slavery Act 2018. Such reports set forth the actions that we have taken to assess and address modern slavery risks within our operations and supply chain.
Supply Chain
We continue to seek solutions to advance supply chain sustainability. As we explore major projects, we assess vendors both at the evaluation stage and as part of information requests on such elements as safe work practices, environmental practices and Indigenous spend. This means, for example and for select procurement engagements, getting information on:
•Estimated value of services that will be procured though local Indigenous businesses;
•Estimated number of local Indigenous persons that will be employed;
•Understanding overall community spend and engagement; and
•Understanding the state of community relations through interview processes and stakeholder work.
In the coming years, we plan to develop ESG criteria for supply chain engagement and work to understand our direct suppliers' GHG emissions profile and targets. Our long-term plan is to collaborate with suppliers to explore enhancement of their GHG emissions targets and to consider setting direction for engaging suppliers with GHG emissions reduction targets.
In 2022, TransAlta approved a new goal to integrate sustainability into our supply chain. Our target is "By 2024, 80 per cent of our spend will be with suppliers that have a sustainability policy or commitment". This supports the intent of the UN SDG Target 12.7: “Promote public procurement practices that are sustainable, in accordance with national policies and priorities.” In 2024, we confirmed that, on average, 79 per cent of our spend since 2022 was with suppliers that have a sustainability policy or commitment. Even though our target to achieve 80 per
| | | | | | | | |
| M124 | TransAlta Corporation | 2024 Integrated Report |
cent of our spend with suppliers that have a sustainability policy or commitment by 2024 was not achieved, all vendors and suppliers of TransAlta are required to adhere to our Supplier Code of Conduct. Under this code, suppliers of goods and services to TransAlta are required to adhere to our core values, including health and safety, ethical business conduct and environmental leadership. The code also allows suppliers to report ethical or legal concerns via TransAlta’s Ethics Helpline.
TransAlta will continue to consider other targets to help integrate sustainability into supply chain.
Indigenous Relationships and Partnerships
At TransAlta, we use our core values—safety, innovation, sustainability, respect and integrity—to guide our business practices and our engagement with stakeholders and Indigenous communities. We seek to build and nurture relationships and work to listen and understand the impacts our operations may have on local communities. We maintain open communication channels and are dedicated to resolving issues promptly and professionally through dialogue.
In addition to the Company's core values, engagement practices are guided by industry best practices and standards, corporate policies and regulatory requirements. Our commitment to Indigenous relations is spearheaded by a centralized corporate team that fosters a relationship-based approach, involving employees at our facilities and within each business unit.
TransAlta's Indigenous Relations Policy focuses on five key areas: awareness, community engagement, community investment, business development, employment and training. Efforts are focused on building and maintaining solid relationships and strong communication channels that enable TransAlta to: share information regarding operations and growth initiatives; gather feedback to inform project planning; and understand priorities and interests from communities to better address concerns and unlock opportunities.
Methods of engagement include:
•Relationship building through regular communication and meetings with representatives at various levels within Indigenous communities and organizations;
•Hosting company-community activities to share both business information and cultural knowledge;
•Maintaining consistent communications with each community and following appropriate community protocols and procedures;
•Participating in community events such as pow wows and blessing ceremonies; and
•Providing both monetary and in-kind sponsorships for community initiatives.
TransAlta strives to maintain relationships through the life cycle of our facilities, from project development and construction, through operation, until decommissioning phases are complete. This is recognized in our Indigenous Relations Policy, which includes acknowledgement and understanding of the intent of the recommendations of the United Nations Declaration on the Rights of Indigenous Peoples.
Support for Indigenous Youth, Education and Employment
TransAlta recognizes the importance of investing in Indigenous students and our financial support helps students complete their education, become self-sufficient and move forward to become future leaders in their communities.
In 2024, TransAlta provided more than $320,000 to support Indigenous youth, education and employment programs, representing 11 per cent of TransAlta’s total community investment. Highlights include:
•The Read On Literacy Program (Read On) – In 2024, TransAlta partnered with Read On to provide elementary students in communities near our operations with in-person and virtual sessions. Read On is an Indigenous literacy program that seeks to mentor young people in First Nation schools to achieve their maximum academic, personal and social development by promoting the core values of education, literacy, taking pride in one’s culture and making good decisions in one’s life.
•In the Spirit of Planting Seeds – In 2024, TransAlta donated to the Growbox Project, an initiative by the Piikani Nation Lands Department aimed at addressing food security and promoting environmental stewardship. The project, titled "Sūṗii ṗo’omaaksin" or "in the spirit of planting seeds," involves the development of a comprehensive greenhouse program that integrates renewable energy technologies and Blackfoot cultural teachings. The program includes a hydroponic farm for year-round food production, educational opportunities for students, and efforts to promote food sustainability and sovereignty within the Piikani Nation community.
Indigenous Cultural Awareness Training
In line with our sustainability target set in 2023, the Company made a deliberate effort to ensure that every new employee participated in Indigenous Cultural Awareness training. In 2024, TransAlta successfully reached 100 per cent completion of the Indigenous Cultural Awareness Training program during the onboarding of all new employees across our operating jurisdictions in Canada, the U.S. and Western Australia. This initiative has been instrumental in providing valuable insights into the rich history, culture and perspectives of Indigenous communities within the jurisdictions where we operate.
| | | | | | | | |
| TransAlta Corporation | 2024 Integrated Report | M125 |
Case Study: Diamond Willow Youth Lodge
To meet the unique needs of Calgary’s Indigenous youth, TransAlta has invested over $1 million since 2018 in the Diamond Willow Youth Lodge. Named after the species of willow tree used to build sacred sweat lodges, the diamond willow is known for its strength and flexibility making it ideal for creating the framework of the lodge.
This accessible and safe space provides a broad spectrum of support for the culture, identity, housing, mentorship and well-being needs of Indigenous youth aged 12 to 29. In 2023, 292 youth were supported by the lodge during 829 visits. The number of attendees has been increasing steadily year-over-year since inception. Over 165 events, workshops and activities were hosted including traditional cooking, drumming groups, hide and circle camps, tipi pole harvesting and tea ceremonies.
Stakeholder Relationships
Fostering positive relationships with our stakeholders is important to TransAlta. Driven by our core values, we see stakeholder transparency as an integral part of our business success. We work to build relationships and understand the importance of early and regular dialogue to determine what opportunities or impacts our activities may have on local stakeholders.
Our Stakeholders
To act in the best interests of the Company and optimize the balance between financial, environmental and social values of our stakeholders and TransAlta, we seek to:
•Build relationships through regular engagement with stakeholders regarding our operations, growth prospects and future developments;
•Consider feedback and make changes to project designs and plans to resolve and/or accommodate concerns expressed by our stakeholders; and
•Respond in a timely and professional manner to stakeholder inquiries and concerns and work diligently to resolve issues or complaints.
Our stakeholders are identified through stakeholder mapping exercises and prospective project development or acquisition. Through decades of establishing stakeholder relationships in the areas of our facilities, we have developed a strong knowledge of who our stakeholders are and have gained understanding of our stakeholders' issues and concerns. In many of our operating areas, we have decades of established relationships and work to maintain a consistent level of communication and trust. In newer areas, we spend time and effort on site listening and learning to ensure we consider all perspectives.
Our principal stakeholder groups are listed in the following table.
| | | | | | | | |
| TransAlta Stakeholders |
| Non-governmental organizations | Community associations | Transmission facility operators |
| Regulators | Industry associations | Communities |
| Charitable organizations/Non-profit | Standards organizations | Retirees |
| All levels of government | Media | Residents/Landowners |
| Suppliers | Business partners | Investor organizations |
| Contractors | Unions/Labour organizations | Financial institutions |
| Government agencies | Resource industry associations | Mineral rights owners |
| System operators | Think tanks | Railroad owners |
| Customers | Academics | Utility owners |
| Shareholders | Employees | Creditors |
| | | | | | | | |
| M126 | TransAlta Corporation | 2024 Integrated Report |
Our stakeholder engagement practices are guided by industry best practices, international standards, corporate policies and regulatory requirements. Examples of our methods of engagement are listed in the following table.
| | | | | | | | |
| Information and communication | Dialogue and consultation | Relationship building |
| Open houses, town halls and public information sessions | In-person meetings with local groups and communities | Community advisory bodies |
| Newsletters, telephone conversations, emails and letters | Meetings with individual stakeholders (e.g., landowners and residents) | Capacity agreements |
| Websites | Targeted audience sessions | Sponsorships and donations |
| Social media postings | Tours of our facilities and sites | Hosting and attending events |
A key focus of our work is to support business growth through proactive engagement with stakeholders in our geographic operating areas in Canada, the U.S. and Western Australia to develop and maintain relationships, assess needs and fit and seek out collaborative opportunities. This helps ensure any stakeholder concerns are identified and can be addressed early in the development process, thereby minimizing project delays. We conduct consultation during project development and construction phase and maintain engaged communication throughout operations to decommissioning phase.
In 2024, TransAlta was active in many communities in the jurisdictions where we operate. We delivered open houses, hosted community barbecues, conducted ongoing engagement with environmental, recreation and civil society groups and made numerous visits and interacted with non-profit organizations.
Community Investments
In 2024, TransAlta contributed approximately $2.9 million in donations and sponsorships (2023 – $3.2 million), with a continued focus in three priority areas: youth and education, environmental leadership and community health and wellness.
One of our significant community investments each year is to United Way campaigns. This year, TransAlta employees, retirees, contractors and the Company raised over $1.3 million for the United Way of Calgary and Area.
In 2024, TransAlta made a number of other significant investments, including the following highlights:
•Community Health and Wellness – In 2024, TransAlta donated to the Goldfields Women's Refuge Finlayson House in Australia, which offers a safe haven for women and children escaping domestic violence, providing them with shelter, support, and the tools to rebuild their lives.
•Environmental Leadership – In 2024, TransAlta donated to the Day on the Creek event as part of our commitment to supporting youth education and environmental stewardship in the Waterton Biosphere Region in Alberta.
Our contribution helps provide valuable educational opportunities for students and the community, fostering a deeper understanding of watershed stewardship and the importance of preserving our natural environment.
•Youth and Education – In 2012, students from a kindergarten class were awarded a $2,500 college scholarship by TransAlta after winning a regional eco-challenge competition. In 2024, 19 students of the kindergarten class reached their high school graduation. As of their graduation date, the initial principal of the scholarship more than doubled. A celebration for the students and their families was held at the Centralia facility.
Case Study: TransAlta's Donation to the Alberta Conservation Association
In 2024, TransAlta and the Alberta Conservation Association (ACA) celebrated a significant milestone at the Whitewood Mine location. Through our partnership, TransAlta completed a donation of 1,274 acres to the ACA. This donation will ensure that the land remains preserved in its natural state, contributing to biodiversity and conservation efforts.
The Whitewood Mine, formerly a coal mine in Parkland County, Alberta required reclamation and conservation efforts to transform it into a sustainable natural habitat. The challenge was to preserve the land's diverse natural landscapes and ensure its long-term protection.
TransAlta's donation to the ACA is part of a larger effort to create the Whitewood Mine Conservation Site, which will encompass a total of 2,167 acres, combining past and present sales and donations. This makes it the largest continuous conservation property owned by the ACA in Alberta. The site features diverse natural landscapes, including a 100-acre lake, small water bodies and various natural habitats.
The transformation of the Whitewood Mine into a conservation area showcases the Company's commitment to environmental stewardship, reclamation and community engagement. Upon receiving its final reclamation
| | | | | | | | |
| TransAlta Corporation | 2024 Integrated Report | M127 |
certificate, the ACA plans to open the site to the public, providing a valuable recreational and educational resource for the community.
Public Health and Safety
We are committed to protecting the public and our assets, as well as the physical, psychological and social well-being of our employees.
We specifically look to minimize the following risks:
•Harm to people;
•Damage to property;
•Operational liability; and
•Loss of organizational reputation and integrity.
We work to prevent incidents and lower our risk by administering security controls such as restricting physical access around and into our operating facilities. The use of security technology such as surveillance cameras and electronic access is utilized to ensure the control of secure areas. Regular audits and security risk assessments are conducted to ensure continuous improvement of the Security Management Program. Our Security Management Program is focused on the protection of people, property, information and reputation.
The Corporate Emergency Management Program prepares employees should an emergency incident occur. The program receives executive sponsorship and includes an emergency management policy and standard, which sets an expectation for employees to continuously prepare for emergencies. It provides an overarching framework for each business unit to provide an Emergency Response Plan and Business Continuity Plan. We implement our Incident Command System, which is a standardized on-scene emergency and incident management system that provides an organizational structure capable of responding to single or multiple incidents. Designed to aid in the management of resources during incidents, it combines facilities, equipment, personnel, procedures and communications operating within a common organizational structure. It is used as part of an all-hazards approach for incident management and is officially recognized for multi-agency response in emergency situations, however complex the incident might be.
We develop strong relationships with local emergency responders. We periodically conduct multi-agency training events at our facilities. This ensures continuous improvement and familiarity with our assets and builds strong communication channels for emergency response.
Our processes designate how we communicate with stakeholders in the event of a crisis. This is managed by our Crisis Communications Team. The team has the responsibility and goal to provide a unified message on behalf of the Company throughout the response and recovery, ensure all messaging is approved by the Incident
Commander, co-ordinate messaging with any applicable external agencies and, if necessary, deploy them to an incident site.
Annual training, exercise and drill requirements are adhered to by our employees operating at our facilities. The results are tracked, audited and presented at our annual executive review. The findings and recommendations assist in maintaining an effective program across the organization.
Data and Digital Asset Protection
We work diligently to protect our digital assets, including our corporate data and our digital identities that provide access into line of business applications. Cybersecurity threats that compromise these assets include the manipulation of data integrity, system and network hacking, use of social engineering tactics through email phishing and compromise of operations and infrastructure through the use of ransomware, credential breaches and attacks introduced through unknowing third-party vendors and service providers.
Given the ever-evolving nature of cyberattacks, we are continuously adapting our cybersecurity program to focus on three key pillars: technology, processes and people. Each of these pillars can be reinforced independently to address specific cybersecurity risks and threats through a comprehensive and multi-faceted program. TransAlta continually assesses our cyber threat and risk levels through independent auditing and simulated cyber-attacks (i.e., penetration testing). Results from these assessments and exercises guide our cybersecurity strategy and practices, implementing measures and controls to proactively mitigate internal and external cybersecurity risks and threats posed to the organization.
TransAlta’s Cybersecurity Policy defines how we identify and manage cybersecurity risks and threats, as well as how we detect, respond, and recover from cybersecurity incidents. We comply with all relevant legal, regulatory, industry standards and compliance requirements such as the North American Electric Reliability Corporation Critical Infrastructure Protection (NERC CIP), the Australian Security of Critical Infrastructure Act and the U.S. Sarbanes Oxley Act, where applicable. The NERC CIP and Australian Security of Critical Infrastructure rules are a set of standards aimed at regulating, enforcing, monitoring and managing the security of the North American and Australian power system. These compliance standards apply specifically to address cybersecurity risks.
In 2024, there were no identified cybersecurity breaches to our technology environment. Refer to Cybersecurity Risk in the Governance and Risk Management section of this MD&A for further details.
| | | | | | | | |
| M128 | TransAlta Corporation | 2024 Integrated Report |
Building a Diverse and Inclusive Workforce
Engaging our workforce, developing our employees, creating an equitable, diverse and inclusive work environment and minimizing safety incidents are the keys to human capital value creation at TransAlta and our most material areas for management. In 2024, we enhanced our ESG performance through our efforts to promote an equitable, diverse and inclusive workforce. This section covers sustainability factors of human capital partially in alignment with guidance from the IFRS's Integrated Reporting Framework. Performance outlined below excludes the acquisition of Heartland Generation on Dec. 4, 2024.
Equity, Diversity and Inclusion
TransAlta’s commitment and focus on excellence in equity, diversity and inclusion (ED&I) is found in our workplace and among our co-workers who advocate for the values of equity and inclusion at all working levels. This commitment is outlined in our Board and Workforce Diversity Policy and Diversity and Inclusion Pledge. We believe that a strong focus on ED&I will create a culture of belonging, allowing our employees to bring their authentic selves to work where they can thrive, innovate, improve service to our customers, deliver company results and positively impact the communities that we live in.
In 2024, TransAlta executed the fourth year of our five-year ED&I strategy to achieve the goals and aspirations defined in our ED&I Pledge.
Gender Diversity
A number of case studies have highlighted the link between gender diversity and additional business value. TransAlta is an active supporter of gender diversity as a driver for value, but also as an ethical business practice. Our commitment to gender diversity in our business is evidenced by our female participation rates on both our executive team and Board. In 2024, women made up 32 per cent of our executive team and 38 per cent of our Board.
To further support female advancement, we have set targets to: (i) maintain equal pay for women in equivalent roles, (ii) achieve 50 per cent representation of women on our Board by 2030 and (iii) achieve 40 per cent representation of women among all employees by 2030. Currently, women employees represent 28 per cent of all employees. Though the majority of our operational roles are currently held by male employees, we remain committed to achieving the 40 per cent goal in this time period.
In 2024, we continued with the Women in Trades Scholarship that provides eligible students enrolled in post-secondary trade programs with financial support. In 2024, we also continued with the gender diversity program in our
Generation business to strategically target the recruitment of women. The program seeks to break down barriers and create opportunities for women to thrive in fields with historically lower female representation.
Workforce Health and Safety
At TransAlta, safety is a core value and is the foundation of how we operate. While generating affordable and reliable electricity for our customers is important, nothing is more important than the health and safety of our people and the communities we serve. We are committed to fostering a culture where we work and learn together to keep each other safe. Our focus on Operational Excellence puts into action our mission to safely do the right work at the right time to power and empower our communities.
Our management systems underpin the delivery of safe, reliable and competitive electricity to our customers and partners. The Company's Total Safety Management System is a combination of recognized best practices in process safety, risk management, asset management, occupational health, safety and environmental management.
At TransAlta, safety is a core part of everyone’s role and a shared responsibility. As our safety culture maturity progresses, we are focused on cultivating a positive safety experience for everyone. We believe that the overall safety experience depends on the interaction between three elements: the physical work environment, the social environment and the individual environment. We made significant progress on our safety culture transformation journey through training and initiatives that support the three elements of positive safety. This training provides the tools and strategies to increase employees' ability to identify and control high energy hazards, enhance psychological safety and support mental health. At TransAlta, a positive safety culture is not only the absence of harm but the presence of protective factors that increase well-being.
In 2024, our strong safety performance was supported by our strategic areas of focus: maturing our safety culture, understanding risk and standardizing safety information and systems. To support our safety cultural growth, new employees and leaders completed training modules designed to gain tools to understand their role in setting, building, and maintaining our safety culture. Through peer board sessions designed to embed an understanding of human and organizational performance principles, serious injury and fatality prevention and psychological safety, leaders held over 100 sessions across the fleet.
One of our safety indicators is TRIF, which tracks the number of injury incidents that require treatment beyond first aid, relative to total exposure hours worked. Our TRIF
| | | | | | | | |
| TransAlta Corporation | 2024 Integrated Report | M129 |
result for 2024 was 0.56 compared to 0.30 in 2023. We recorded zero serious injuries in 2024. The identification and control of high energy hazards is foundational to our strong performance on serious injury prevention.
The following table represents our corporate safety performance and includes employees and contractors.
| | | | | | | | | | | |
| Year ended Dec. 31 | 2024 | 2023 | 2022 |
| Lost-time injuries | 0 | 1 | 0 | |
| Medical aids | 6 | 4 | 6 | |
| Restricted work injuries | 2 | 0 | 0 | |
| Exposure hours | 2,844,000 | 3,362,000 | 3,058,000 | |
| Total Recordable Injury Frequency (TRIF) | 0.56 | 0.30 | 0.39 | |
We focus on leading indicators and participation through Total Safety Reports (hazard, near miss, positive observations, and cybersecurity reports). Total Safety Report Frequency demonstrates the proactive activities, per worker per year, we are taking to identify and prevent an injury from occurring. We also report and recognize positive behaviours in the workplace to enhance psychological safety. This allows us to not only respond to incidents if they occur but find opportunities to strengthen barriers and layers of protection to mitigate potential incidents. In 2024, we recorded 16.3 reports per worker, which is above our exceptional performance target of 15. Evidence of the positive impacts associated with strong engagement and a maturing safety culture is apparent in TransAlta's overall safety performance. In 2024, TransAlta was recognized by the Alberta Mine Safety Association with the Trail Blazer Business Leader Award. This award recognizes executive leaders and senior managers for exemplary and inspiring leadership with a high commitment to health and safety.
Organizational Culture and Structure
Our employees are central to value creation. Our corporate culture has evolved and adapted throughout our 113-year history. Our values are safety, innovation, sustainability, respect and integrity. These five values help provide clarity for our employees and guide our behaviour and decision-making. They also provide a foundation for leadership, collaboration, community support, personal growth and work-life balance. Through corporate initiatives and support throughout all levels of leadership, we encourage our employees to maximize their potential.
Culture Transformation
In 2022, we embarked on our culture transformation journey with the goal of becoming a culture of results, purpose and learning. We developed a three-year culture strategy, Culture Charter and Culture Roadmap that defines milestones. For alignment and transparency, all of these documents are available to our employees. Part of
our culture transformation involves improving employee psychological safety to encourage employees to speak up with a view to increase innovation, creativity and ultimately, results.
We conduct annual employee engagement surveys to gauge the employee experience, and based on survey results, leaders created action plans to drive improvement and increase engagement at the business unit and team level.
Finally, we are focused on improving employee health and well-being. To increase awareness, we have launched education sessions on a variety of topics such as mental health, women’s health, men’s health, nutrition, resiliency, etc.
Organizational Structure
In 2024, we had 1,205 (2023 – 1,257) active employees. With approximately 29 per cent of our employees being unionized, we strive to maintain open and positive relationships with union representatives and regularly meet to exchange information, listen to concerns and share ideas that further our mutual objectives. Collective bargaining is conducted in good faith and we respect the rights of employees to participate in collective bargaining.
Our organizational structure changed in 2024. Our business continues to operate four generating segments, with Gas, Wind and Solar, Hydro and Energy Transition, with support from our Corporate and Energy Marketing segments. Our operations portfolio is run by a single leadership team, which provides operational and financial synergies, thus enhancing our competitiveness.
Employee Retention and Recognition
ESG-Linked Compensation
At TransAlta, we have linked our ESG performance to our employees’ compensation including that of our executive leadership team. Our annual and long-term incentive pay
| | | | | | | | |
| M130 | TransAlta Corporation | 2024 Integrated Report |
for performance plans are linked to TransAlta achieving various sustainability goals, where the targets and metrics are reviewed and approved annually by our Board of Directors and further outlined in our annual compensation plans.
In 2024, 20 per cent of our annual incentive plan was linked to achieving specific ESG targets: 10 per cent referred to our organizational culture improvements and 10 per cent was linked to safety. Our long-term incentive plans include strategic goals related to leading in ESG policy development and progress towards our ESG targets. Refer to the Management Proxy Circular for additional details on our ESG related compensation.
Employee Performance and Recognition
Coaching, feedback and management are fundamental to our performance philosophy, with leaders and employees being asked to participate in regular meetings to discuss work progress, professional and career development throughout the year.
We strive to be an employer of choice through our HR and total rewards programs, which include pay-for performance incentive plans, as reviewed and approved by the Board of Directors. TransAlta’s annual and long-term incentive plans are designed to measure and recognize employees’ contributions towards metrics and targets. To motivate and engage employees in a timely manner, we continue to utilize employee recognition programs, including a quarterly recognition program and a peer-to-peer recognition program.
Talent Development
TransAlta places significant focus on talent development and retaining its employees. Annually, employees complete a combination of optional, mandatory and customized training as part of their roles. All employees have access to learning sessions from speakers who are experts on topics as varied as psychological safety, ED&I, mental and physical health, culture, financial wellness, core skills and leadership development.
Delivering Reliable and Affordable Energy
TransAlta’s goal is to be a leading customer-centred electricity company, one that is committed to a sustainable future. Our strategy is focused on meeting our customers' need for affordable and reliable electricity, operational excellence and continual improvement. This section covers manufactured, intellectual and social and relationship capital management partially in alignment with guidance from the IFRS's Integrated Reporting Framework.
Energy Affordability
TransAlta helps commercial and industrial customers manage their cost of energy. TransAlta has a full suite of procurement strategies and products with various terms available to our customers to assist them in understanding and reducing their energy costs.
For customers interested in making a long-term commitment to obtain predictable costs, TransAlta has the experience to develop renewable energy facilities, battery energy storage systems and hybrid solutions, or long-term offtake agreements from its existing and future renewable and gas-fired facilities.
End-Use Efficiency and Demand
TransAlta’s commercial and industrial customers have access to an extensive set of monthly reports providing detailed tracking of customer usage, allowing for corrective action as required, as well as cost-saving recommendations.
Our Power Factor Report advises customers if their sites are operating at less than a 90 per cent power factor so
they can consider installing energy-efficient equipment. By reducing the customer’s power system demand charge through power factor correction, the customer’s site puts less strain on the electricity grid and reduces its carbon footprint. TransAlta’s Site Health Report advises customers of a site whose peak demand has been permanently reduced for a variety of reasons from its initial in-service date. The customer may be paying a higher demand charge each month to the distribution company based on the original peak demand expected at the site. TransAlta collaborates with the customer and determines the new peak demand based on the customer’s operation. The customer, working with the distribution company, may find it economic to buy down the distribution contract to reduce the monthly distribution costs going forward.
Grid Resiliency
As a large electricity generator, TransAlta works diligently to ensure the power we provide our customers is reliable and affordable. We provide decentralized and customized power solutions to industrial customers. We also supply power to centralized power systems and own and operate transmission grid infrastructure in Alberta that addresses system reliability needs.
In all jurisdictions where we operate, we work closely with the system operators to ensure overall supply adequacy and reliability of the grid. We consider a myriad of factors in our planning and operation decisions that could put grid resiliency at risk, including renewable energy intermittency, cyberattacks, extreme weather events and natural
| | | | | | | | |
| TransAlta Corporation | 2024 Integrated Report | M131 |
disasters. We are also committed to ensuring strong compliance with North American Electric Reliability Corporation standards, Alberta Reliability Standards and the Power System Security and Reliability standards in the Western Electricity Market in Australia for the power plant and transmission infrastructure that we own and operate.
As a Company, we are keenly focused on deploying renewable and gas-fired power generation and new technology solutions to meet the emerging and future needs of the electric system that we operate in.
In 2020, WindCharger was the first battery energy storage asset ever developed in Alberta and was a leading participant in the Alberta Electric System Operator’s pilot fast frequency response project. Fast frequency response is a novel and critical new fast-acting transmission reliability service that helps meet the needs of a more renewable-based grid by augmenting the electricity systems ability to recover from the sudden loss of generation or interties. WindCharger continues to provide of system reliability service.
In 2024, TransAlta launched a project with Atlas Power Technologies Inc. for a hybrid hydro supercapacitor energy storage system, which is expected to be the first of its kind in North America. With support from a grant from Emissions Reduction Alberta, the project is complementary to an existing hydroelectric generating station that augments the power plant’s response time and capability to address frequency response needs.
For more information on technologies to support grid resiliency, refer to the Enabling Innovation and Technology Adoption section of this MD&A. For more information on extreme weather events and natural disasters, refer to Weather in the Managing Environmental Resources section of this MD&A.
Asset Management
TransAlta's asset management program is designed to deliver operational excellence by optimizing the total lifecycle value from physical assets across the Company's generation portfolio in Canada, the U.S. and Western Australia. The program involves a centralized team of engineers and specialists who collaborate with plant engineers and operators. They remotely monitor generation facilities for emerging equipment reliability and performance issues.
If an issue arises, the asset management engineer will assess and then notify facility operations of the findings to support investigation and remedy the issue to minimize the impact to operations. For example, if a wind turbine starts to show early signs of performance deviation compared to others, the operations team is notified and they will investigate and remedy the issue.
The monitoring, analysis and diagnostics completed by the asset management engineer enable early identification of equipment issues based on longer-term trend analysis and complements day-to-day facility operations. Anticipating risks and asset faults early allows for planned and scheduled repairs to be optimized and facility availability to be maximized.
Advanced Analytics
TransAlta has a dedicated data and analytics team that collaborates with the asset management and operations teams to leverage data science models, modernized technology platforms, and advanced analytics. Through this collaboration, solutions for specific use-cases are developed, enabling valuable insights that are actioned. Examples of these use-cases include data science models for detecting performance anomalies for wind turbines and models for detecting frequency excursions for compliance with the market rules.
| | | | | | | | |
| M132 | TransAlta Corporation | 2024 Integrated Report |
Sustainability Governance
In order for an organization to truly integrate sustainability, it requires accountability at the Board and executive level. It requires an understanding of sustainability factors and associated corporate actions to address these issues, while continuing to balance operations and growth.
Sustainability is overseen by TransAlta's GSSC of the Board. The GSSC assists the Board in fulfilling its oversight responsibilities with respect to the Company’s monitoring of climate change, environmental, health and safety regulations, public policy changes and the development of strategies, policies and practices for climate change, environment, health and safety and social well-being, including human rights, working conditions and responsible sourcing.
The following policies help govern sustainability at TransAlta and are publicly available in the Governance section of the Investor Centre on our website:
•Corporate Code of Conduct
•Supplier Code of Conduct
•Whistleblower Policy
•Total Safety Management Policy
•Human Rights and Discrimination Policy
•Indigenous Relations Policy
•Board and Workforce Diversity Policy and Diversity and Inclusion Pledge
•Environmental Policy
In 2024, our sustainability memberships included key sustainability organizations and working groups such as the IFRS Sustainability Alliance, the Trellis Network (formerly GreenBiz) and the Electricity Canada Sustainable Electricity Steering Committee and Climate Change Adaptation Committee, which all provide validation and support of our sustainability strategy and practices.
In 2024, our material sustainability factors remained unchanged from 2022. They are presented below in alphabetical order.
•Air quality and emissions
•Asset integrity and grid resiliency
•Biodiversity and land management
•Climate change and greenhouse gas emissions
•Dam safety
•Energy use and conservation
•Equity, diversity and inclusion
•Ethics and business conduct
•Health, safety and well-being
•Human rights and labour practices
•Indigenous relationships and partnerships
•Information asset protection and cybersecurity
•Renewable energy and innovative technologies
•Security and emergency preparedness and response
•Stakeholder engagement and community investment
•Supply chain and sustainable sourcing
•Sustainability governance
•Sustainable finance
•Talent attraction, retention and development
•Waste management
•Water management
For additional details on governance, refer to the Governance and Risk Management section of this MD&A.
| | | | | | | | |
| TransAlta Corporation | 2024 Integrated Report | M133 |
Governance and Risk Management
Our business activities expose us to a variety of risks and opportunities including, but not limited to, regulatory changes, rapidly changing market dynamics and increased volatility in our key commodity markets. Our goal is to manage these risks and opportunities so that we are in a position to develop our business and achieve our goals while remaining reasonably protected from an unacceptable level of risk or financial exposure. We use a multi-level risk management oversight structure to manage the risks and opportunities arising from our business activities, the markets in which we operate and the political environments and structures with which we interact.
Governance
The key elements of our governance practices are:
•Employees, management and the Board are committed to ethical business conduct, integrity and honesty;
•We have established key policies and standards to provide a framework for how we conduct our business;
•The Chair of our Board and all directors, other than our President and CEO, are independent within the meaning of National Instrument 58-101 — Disclosure of Corporate Governance Practices;
•The Board includes individuals with a mix of skills, knowledge and experience that are critical for our business and our strategy;
•The effectiveness of the Board is achieved through robust annual evaluations and continuing education of our directors; and
•Our management and the Board facilitate and foster an open dialogue with shareholders and community stakeholders.
Commitment to ethical conduct is the foundation of our corporate governance model. We have adopted the following codes of conduct to guide our business decisions and everyday business activities:
•Corporate Code of Conduct, which applies to all employees and officers of TransAlta and its subsidiaries;
•Directors’ Code of Conduct;
•Supplier's Code of Conduct;
•Finance Code of Ethics, which applies to all financial employees of the Company; and
•Energy Trading Code of Conduct, which applies to all of our employees engaged in energy marketing.
Our Corporate Code of Conduct outlines the standards and expectations we have for our employees, officers, directors, consultants and suppliers with respect to, among
other things, the protection and proper use of our assets. The codes also provide guidelines with respect to securing our assets, avoiding conflicts of interest, respect in the workplace, social responsibility, privacy, compliance with laws, insider trading, environment, health and safety and our commitment to ethical and honest conduct. Our Corporate Code of Conduct and Directors' Code of Conduct each goes beyond the laws, rules and regulations that govern our business in the jurisdictions in which we operate; they outline the principal business practices with which all employees and directors must comply.
Our employees, officers and directors are informed annually about the importance of ethics and professionalism in their daily work and must certify annually that they have reviewed and understand their responsibilities as set forth in the respective codes of conduct. This certification also requires our employees, officers and directors to acknowledge that they have complied with the standards set out in the respective code during the last calendar year.
The Board provides stewardship of the Company and ensures that the Company establishes key policies and procedures for the identification, assessment and management of principal risks and strategic plans. The Board monitors and assesses the performance and progress of the Company’s goals through candid and timely reports from the CEO and the senior management team. We have also established an annual evaluation process whereby our directors are provided with an opportunity to evaluate the Board, Board committees, individual directors and the Chair of the Board’s performance.
To allow the Board to establish and manage the financial, environmental and social elements of our governance practices, the Board has delegated certain responsibilities to the AFRC, GSSC, the Human Resources Committee (the HRC) and the Investment Performance Committee (IPC).
The AFRC, consisting of independent members of the Board, provides assistance to the Board in fulfilling its oversight responsibility relating to the integrity of our consolidated financial statements and the financial reporting process; the systems of internal accounting and financial controls; the internal audit function; the external auditors’ qualifications and terms and conditions of appointment, including remuneration, independence, performance and reports; and the legal and risk compliance programs as established by management and the Board. The AFRC approves our Commodity and Financial Exposure Management policies and reviews quarterly ERM reporting.
The GSSC is responsible for developing and recommending to the Board a set of corporate governance
| | | | | | | | |
| M134 | TransAlta Corporation | 2024 Integrated Report |
principles applicable to the Company and for monitoring compliance with these principles. The GSSC is also responsible for Board recruitment, succession planning and for the nomination of directors to the Board and its committees. In addition, the GSSC assists the Board in fulfilling its oversight responsibilities with respect to the Company’s monitoring of climate change, environmental, health and safety regulations, public policy changes and the development of strategies, policies and practices for climate change, environmental, health and safety and social well-being, including human rights, working conditions and responsible sourcing. The GSSC also receives an annual report on the annual codes of conduct certification process. For further information on the Board's oversight of climate-related factors, refer to Climate Change Governance in the ESG section of this MD&A.
In regards to overseeing and seeking to ensure that the Company consistently achieves strong environment, health and safety (EH&S) performance, the GSSC undertakes a number of actions that include: (i) receiving regular reports from management regarding environmental compliance, trends and TransAlta’s responses; (ii) receiving reports and briefings on management’s initiatives with respect to changes in climate change legislation, policy developments as well as other draft initiatives and the potential impact such initiatives may have on our operations; (iii) assessing the impact of the GHG policies implementation and other legislative initiatives on the Company’s business; (iv) reviewing with management the EH&S policies of the Company; (v) reviewing with management the health and safety practices implemented within the Company, as well as the evaluation and training processes put in place to address problem areas; (vi) discussing with management ways to improve the EH&S processes and practices; (vii) considering and recommending our sustainability targets to the Board and evaluating our performance against such targets; (viii) reviewing the effectiveness of our response to EH&S issues and any new initiatives put in place to further improve the Company’s EH&S culture; and (IX) reviewing our safety performance.
The HRC is empowered by the Board to review and approve the Company's key compensation and human resources policies that are intended to attract, recruit, retain and motivate employees. The HRC also makes recommendations to the Board regarding the compensation of the CEO, including the review and adoption of equity-based incentive compensation plans, the adoption of human resources policies that support human rights and ethical conduct and the review and approval of executive management succession and development plans.
The IPC is empowered by the Board to oversee management's investment conclusions and the execution of major Board-approved capital expenditure projects that further the Company's strategic plans. The IPC helps the
Board in fulfilling its oversight responsibilities with respect to broadly reviewing and monitoring project management and control processes, financial profile, capital costs, procurement practices and project schedules in a more in-depth manner than time permits during regularly scheduled Board meetings.
The responsibilities of other stakeholders within our risk management oversight structure are described below:
The CEO and executive management review and report on key risks quarterly. Specific Trading Risk Management reviews are held monthly by the Commodity Risk and Compliance Committee and weekly by the commodity risk team, the commercial managers in Trading and Marketing and the Executive Vice-President, Finance and Chief Financial Officer.
The Investment Committee is a management committee chaired by our Executive Vice-President, Finance and Chief Financial Officer and comprises the President and Chief Executive Officer; Executive Vice-President, Generation; Executive Vice-President, Commercial and Customer Relations; and Vice-President, Corporate Strategy. It reviews and approves all major capital expenditures including growth, productivity, life extensions and major coal outages. Projects that are approved by the Investment Committee will then be put forward for approval by the Board, if required.
The Commodity Risk & Compliance Committee is chaired by our Executive Vice-President, Finance and Chief Financial Officer and comprises at least three members of senior management. It oversees the risk and compliance program in trading and ensures that this program is adequately resourced to monitor trading operations from a risk and compliance perspective. It also ensures the existence of appropriate controls, processes, systems and procedures to monitor adherence to policy.
The Hydro Operating Committee consists of two members who are Brookfield employees with expertise in hydro facility management and two TransAlta members. This committee was formed in 2019 to collaborate on matters in connection with the operation and maximization of the value of TransAlta's Alberta Hydro Assets. It is delivering on its objectives by reviewing the operating, maintenance, safety and environmental aspects of TransAlta's Alberta Hydro Assets and, following that review, providing advice and recommendations to TransAlta’s hydro operational team. The Hydro Operating Committee has an initial term of six years, which can be extended for an additional two years.
TransAlta is listed on the Toronto Stock Exchange and the New York Stock Exchange and is subject to the governance regulations, rules and standards applicable under both exchanges. Our corporate governance practices meet the following governance rules and guidelines of the TSX and Canadian Securities
| | | | | | | | |
| TransAlta Corporation | 2024 Integrated Report | M135 |
Administrators: (i) Multilateral Instrument 52-109 — Certification of Disclosure in Issuers’ Annual and Interim Filings; (ii) National Instrument 52-110 — Audit Committees; (iii) National Policy 58-201 — Corporate Governance Guidelines; and (iv) National Instrument 58-101 — Disclosure of Corporate Governance Practices. As a “foreign private issuer” under U.S. securities laws, we are generally permitted to comply with Canadian corporate governance requirements. Additional information regarding our governance practices can be found in our most recent management information circular.
Risk Controls
Our risk controls have several key components:
Enterprise Tone
We strive to foster beliefs and actions that are true to and respectful of our many stakeholders. We do this by investing in communities where we live and work, operating and growing sustainably, putting safety first and being responsible to the many groups and individuals with whom we work.
Policies
We maintain a comprehensive set of enterprise-wide policies. These policies establish delegated authorities and limits for business transactions, and they allow for an exception approval process. Periodic reviews and audits are performed to ensure compliance with these policies. All employees and directors are required to sign the Corporate Code of Conduct on an annual basis.
Reporting
On a regular basis, residual risk exposures are reported to key decision-makers including the Board, the AFRC, senior management and/or the Commodity Risk & Compliance Committee, as applicable. Reporting to this latter committee includes analysis of new risks, monitoring of status to risk limits, the review of events that can affect these risks and discussion and the review of the status of actions to minimize risks. This monthly reporting provides for effective and timely risk management and oversight.
Whistleblower System
We have a process in place where employees, contractors, shareholders or other stakeholders may confidentially or anonymously report any potential legal or ethical concerns, including concerns relating to accounting, internal control accounting, auditing or financial matters or relating to alleged violations of any laws or our Corporate Code of Conduct. These concerns can be submitted confidentially and anonymously, either directly to the AFRC or through TransAlta’s toll-free telephone or online Ethics Helpline. The AFRC Chair is immediately notified of any material complaints and, otherwise, the AFRC receives a report at every quarterly committee meeting on all findings related to any material complaints or complaints relating to
accounting or financial reporting or alleged breaches in internal controls over financial reporting.
Value at Risk and Trading Positions
Value at risk (VaR) is one of the primary measures used to manage our exposure to market risk resulting from commodity risk management activities. VaR is calculated and reported on a daily basis. This metric describes the potential change in the value of our trading portfolio over a three-day period within a 95 per cent confidence level, resulting from normal market fluctuations.
VaR is a commonly used metric that is employed by industry to track the risk in commodity risk management positions and portfolios. Two common methodologies for estimating VaR are the historical variance/covariance and scenario analysis approaches. We estimate VaR using the historical variance/covariance approach. An inherent limitation of historical variance/covariance VaR is that historical information used in the estimate may not be indicative of future market risk. Stress tests are performed periodically to measure the financial impact to the trading portfolio resulting from potential market events, including fluctuations in market prices, volatilities of those prices and the relationships between those prices. We also employ additional risk mitigation measures. VaR at Dec. 31, 2024, associated with our proprietary commodity risk management activities was $3 million (2023 – $4 million). Refer to the Risk Factors – Commodity Price Risk section of this MD&A below for further discussion.
Risk Factors
Risk is an inherent factor of doing business. The following section addresses some, but not all, risk factors that could affect our future plans, performance, results or outcomes and our activities in mitigating those risks. These risks do not occur in isolation, but must be considered in conjunction with each other.
A reference herein to a material adverse effect on the Company means such an effect on the Company or its business, operations, financial condition, results of operations and/or its cash flows, as the context requires.
For some risk factors, we show the after-tax effect on net earnings (loss) of changes in certain key variables. The analysis is based on business conditions and production volumes in 2024. Each item in the sensitivity analysis assumes all other potential variables are held constant. While these sensitivities are applicable to the period and the magnitude of changes on which they are based, they may not be applicable in other periods, under other economic circumstances or for a greater magnitude of changes. The changes in rates should also not be assumed to be proportionate to earnings in all instances.
| | | | | | | | |
| M136 | TransAlta Corporation | 2024 Integrated Report |
Equipment failure and the operation and maintenance of our facilities involve risks that may materially and adversely affect our business.
There is a risk of equipment failure or underperformance to our operations due to wear and tear, latent defect, design error or operator error, among other things, which could have a material adverse effect on our business. Although our generation facilities have generally operated in accordance with expectations, there can be no assurance that they will continue to do so. Our facilities are exposed to operational risks that can lead to outages and increased production risk which could have a material adverse effect on our business. Further, some of our generation facilities were constructed many years ago and may require significant capital expenditures to maintain peak reliability or operations. Newer facilities also require various levels of capital expenditures to maintain peak reliability or operations. There can be no assurance that our maintenance program will be able to detect potential failures in our facilities before they occur or eliminate all adverse consequences in the event of failure.
As well, we are exposed to procurement risk for specialized parts that may have long lead times. If we are unable to procure these parts when they are needed for maintenance activities, we could face an extended period where our equipment is unavailable to produce electricity. Further, if a manufacturer is unable or unwilling to provide satisfactory maintenance or warranty support on reasonable terms, we may have to enter into alternative arrangements with other providers or perform the services ourselves. These arrangements could be more expensive to us than our current arrangements and if we are unable to enter into satisfactory alternative arrangements, our inability to access technical expertise or parts could have a material adverse effect on us. TransAlta manages this risk with our capital spares policy.
While we maintain an inventory of, or otherwise make arrangements to obtain, spare parts to replace critical equipment and maintain insurance for property damage and business interruption to protect against certain operating risks, these protections may not be adequate to cover lost revenues or increased expenses and penalties that could result if we were unable to operate our generation facilities at a level necessary to comply with our contracts. In addition, circumstances could arise in the future whereby the Company may be obligated to produce power at a cost that exceeds the revenues being derived therefrom.
There can be no assurance that any applicable insurance coverage would be adequate to protect our business from material adverse effects. In addition, there can be no assurance that we will be able to restore equipment or assets that have reached the end of their useful lives.
We manage our generation equipment and technology risk by:
•Operating our facilities within defined industry standards that optimize availability over their commercial operating life;
•Performing preventive maintenance in accordance with applicable industry practices, major equipment supplier recommendations and our operating experience;
•Adhering to comprehensive maintenance programs and regular turnaround schedules;
•Adjusting maintenance plans by facility to reflect equipment type, age and commercial risk;
•Having adequate business interruption insurance in place to cover extended forced outages;
•Having clauses in our PPAs and other long-term contracts that allow us to declare force majeure in the event of an unforeseen failure;
•Selecting and applying proven technology in our generating facilities, where practical;
•Where technology is newer, ensuring service agreements with equipment suppliers include appropriate availability and performance guarantees;
•Monitoring our fleet against industry performance to identify issues or advancements that may impact performance and adjusting our maintenance and investment programs accordingly;
•Negotiating strategic supply agreements with selected vendors to ensure key components are readily available in the event of a significant outage;
•Monitoring the condition of our assets and performing predictive analytics, and adjusting our maintenance programs to maintain availability;
•Entering into long-term arrangements with our strategic supply partners to ensure availability of critical spare parts; and
•Implementing long-term asset management strategies that optimize the life cycles of our existing facilities and/or identify replacement requirements for generating assets.
Unexpected changes in the cost of maintenance or in the cost and durability of components for the Company's facilities may adversely affect the results of our operations.
Inflation or other increases in the Company's cost structure that are beyond the control of the Company could materially adversely impact our financial performance. Examples of such costs include, but are not limited to, unexpected increases in the cost of procuring materials
| | | | | | | | |
| TransAlta Corporation | 2024 Integrated Report | M137 |
and services required for maintenance activities, and unexpected replacement or repair costs associated with equipment underperformance or lower-than-anticipated durability.
Changes in the price of electricity may materially adversely affect our business.
A portion of our revenues are tied, either directly or indirectly, to the market price for electricity in the markets in which we operate, and in particular in the Alberta electricity market. Market electricity prices are impacted by a number of factors, including the strength of the economy, the available transmission capacity, the price of fuel that is used to generate electricity (and, accordingly, certain of the factors that affect the price of fuel described below), the management of generation, the amount of excess generating capacity relative to load in a particular market, the cost of controlling emissions and cost of carbon, the structure of the particular market, the availability of transmission (including from other jurisdictions), increased adoption of energy-efficiency and conservation initiatives, and weather conditions that impact electrical load. As a result, we cannot precisely predict future electricity prices and electricity price volatility (particularly lower Alberta electricity prices) that could have a material and adverse effect on us. Further, the Alberta market is the only fully deregulated electricity market in Canada and this market structure permits corporate offtakers to invest in new renewable generation in the province solely for ESG reasons (i.e., to align with decarbonization goals) that may not align with supply and demand fundamentals. This could potentially result in an oversupply of intermittent electricity in the Alberta electricity market and could put downward pressure on electricity prices and contribute to significant price volatility in the near term.
Our facilities and construction projects have structured agreements in their contracts around force majeure events that are beyond our control, but positions the organization to industry standards for insurance or contract claw back in costs. Such events could result in material adverse effects.
Our facilities, construction projects and operations are exposed to potential interruption and damage, or partial or full loss resulting from environmental disasters (e.g., floods, high winds, fires, ice storms, earthquakes and public health crises, such as pandemics and epidemics), other seismic activity and equipment failures. Climate change can also increase the frequency and severity of these extreme weather events. There can be no assurance that in the event of an earthquake, flood, cyclone, hurricane, tornado, tsunami, terrorist attack, act of war or other natural, man-made or technical catastrophe, all or some parts of our generation facilities and infrastructure systems will not be disrupted. The occurrence of a significant event that disrupts the ability of our power generation assets to
produce power for an extended period, including events that preclude existing customers under PPAs from purchasing electricity, could have a material negative impact on our business. Our facilities, construction projects and operations could be exposed to the effects of severe weather conditions, natural and man-made disasters and other potentially catastrophic events. The occurrence of such an event may not release us from performing our obligations pursuant to PPAs or other agreements with third parties. In addition, many of our generation facilities are located in remote areas, which can make repair of damage costly or difficult to access. Catastrophic events, including public health crises, could result in volatility and disruption to global supply chains, disruption to global financial markets, trade and market sentiment, risks to employee health and safety, a slowdown or temporary suspension of operations in impacted locations, postponements in the initiation and/or completion of the Company's development or construction projects, and delays in the completion of services, any of which may result in the Company incurring penalties under contracts, additional costs or the cancellation of contracts.
Risks relating to TransAlta's development and growth projects and acquisitions may materially and adversely affect us.
Development and growth projects and acquisitions that we undertake may be subject to execution and capital cost risks, including, but not limited to, risks relating to regulatory approvals, third-party opposition, cost escalations, securing land rights, construction delays, shortages of raw materials, supply chain constraints, or skilled labour and capital constraints. The occurrences of these risks could have a material and adverse impact on us, our financial condition, our ability to operate and our cash flows.
Expansion of our business through development projects and acquisitions may place increased demands on our management, operating systems, internal controls and financial and physical resources. In addition, the process of integrating acquired businesses or development projects may involve unforeseen difficulties. Failure to successfully manage or integrate any acquired businesses or development projects could have a material adverse impact on us, our financial condition, our ability to operate and our cash flows. Further, we cannot make assurances that we will be successful in integrating any acquisition or that the commercial opportunities or operational synergies of any acquisition will be realized as expected.
We may pursue acquisitions in new markets that are subject to regulation by various foreign governments and regulatory authorities and to the application of foreign laws. Such foreign laws or regulations may not provide for the same type of legal certainty and rights, in connection with our contractual relationships in such countries, as are
| | | | | | | | |
| M138 | TransAlta Corporation | 2024 Integrated Report |
afforded to us currently, which may adversely affect our ability to receive revenues or enforce our rights in connection with any such foreign operations. In addition, the laws and regulations of some countries may limit our ability to hold a majority interest in some of the projects that we may acquire, thus limiting our ability to control the operation of such projects. Any existing or new operations may also be subject to significant political, economic and financial risks, which vary by country, and may include: (a) changes in government policies or personnel; (b) changes in general economic conditions; (c) restrictions on currency transfer or convertibility; (d) changes in labour relations; (e) political instability and civil unrest; (f) regulatory or other changes in the local electricity market; and (g) breach or repudiation of important contractual undertakings by governmental entities and expropriation and confiscation of assets and facilities for less than fair market value.
With respect to acquisitions, we cannot make assurances that we will identify suitable transactions or that we will have access to sufficient resources, through our credit facilities, the capital markets or otherwise, to pursue and complete any identified acquisition opportunities on a timely basis and at a reasonable cost. Any acquisition that we propose or complete would be subject to regulatory approvals and other normal commercial risks that could result in the transaction not being completed on the terms anticipated, on time, or at all. In the event we are unable to close a transaction that we've entered into, we may be subject to termination fees that could become payable to the vendor. An unavoidable level of risk remains regarding potential undisclosed or unknown liabilities relating to any acquisition. The existence of such undisclosed liabilities may have a material adverse impact on our business, financial condition, results of operations and cash flows.
There can be no assurance that the Company will realize the anticipated benefits in respect of the Heartland Generation acquisition.
The acquisition of Heartland Generation may not deliver the anticipated benefits expected to arise from such transaction, including as it pertains to accretion to free cash flow, the remaining life of the Heartland Generation assets and the ability for such assets to generate sufficient average annual EBITDA to meet the Company's expectations. Furthermore, as with all development projects, there are risks related to the development of the 400 MW Battle River Carbon Hub Project held by Heartland Generation, including risk relating to the project’s continued development, the ability to obtain regulatory approval and the economic outlook required to support a final investment decision.
We could suffer lost revenues or increased expenses and penalties if we are unable to operate our generation facilities at a level necessary to comply with our PPAs.
The ability of our facilities to generate the maximum amount of power or steam that can be sold under PPAs is an important determinant of our revenues. Under certain PPAs, if the facility is not capable of generating electricity or steam for the required availability in a given contract year, penalty payments may be payable to the relevant purchaser by us and could give rise to termination rights. The payment of any such penalties or the termination of such PPAs could adversely affect our revenues and profitability.
We are dependent on access to parts and equipment from certain key suppliers and we may be adversely affected if these relationships are not maintained.
Our ability to compete and expand depends on having access, at a reasonable cost, to equipment, parts and components that are technologically and economically competitive with those used by our competitors. Although we have individual framework agreements with various suppliers, there can be no assurance that these relationships with suppliers will be maintained or not adversely affected. If they are not maintained, or are adversely affected, our ability to compete may be impaired due to lack of access or significant delays to the supply of equipment, parts or components.
We depend on certain joint venture, strategic and other partners that may have interests or objectives that conflict with our objectives and such differences could have a negative impact on us.
We have entered into various arrangements with communities or joint venture, strategic or other partners in connection with the operation of our facilities and assets. Certain of these partners may have or develop interests or objectives that are different from, or in conflict with, our objectives. Any such differences could have a negative impact on the Company's ability to realize the anticipated benefits of, or the anticipated increase in the value of facilities or assets subject to, these arrangements. We are sometimes required through the permitting and approval processes to notify and consult with various stakeholder groups, including landowners, Indigenous groups and municipalities. Any unforeseen delays in this process may negatively impact our ability to complete any given facility on time or at all and could result in write-offs or give rise to reputational harm.
| | | | | | | | |
| TransAlta Corporation | 2024 Integrated Report | M139 |
Dam and dyke failures may result in lost generating capacity, increased maintenance and repair costs and other liabilities.
A natural or man-made disaster, and certain other events, including natural or induced seismic activity, could potentially cause dam failures at our hydroelectric facilities and various dam sites. The occurrence of dam or dyke failures at any of our facilities could result in a loss of generating capacity, damage to the environment or damages and harm to third parties or the public, and such failures could require us to incur significant expenditures of capital and other resources or expose us to significant liabilities for damages. There can be no assurance that our dam safety program will be able to detect potential dam failures prior to their occurrence or eliminate all adverse consequences in the event of failure. Other safety regulations could change from time to time, potentially impacting our costs and operations. Reinforcing all dams or dykes to enable them to withstand more severe events could require us to incur significant expenditures of capital and other resources. The consequences of dam or dyke failures could have a material adverse effect on us. This includes any increased risk of dam failure due to induced seismic activity triggered by fracking near our hydroelectric facilities, which could increase the risk of dam failure or require the Company to incur potentially significant capital investments to mitigate such risk and that would not otherwise be required.
The power generation industry has certain inherent risks related to worker health and safety, and the environment, that could cause us to suffer unanticipated expenditures or to incur fines, penalties or other consequences material to our business and operations.
The ownership and operation of our power generation assets carry an inherent risk of liability and reputational harm related to worker health and safety, and the environment, including the risk of government-imposed orders to remedy unsafe conditions and/or to remediate or otherwise address environmental contamination, potential penalties for contravention of health, safety and environmental laws, licences, permits and other approvals, and potential civil liability. Compliance with (and any future changes to) health, safety and environmental laws and the requirements of licences, permits and other approvals are expected to remain material to our business. The occurrence of any of these events or any changes, additions to, or more rigorous enforcement of health, safety and environmental laws, licences, permits or other approvals could have a significant impact on our operations and/or result in additional material expenditures. As a consequence, no assurances can be given that additional environmental and workers' health and safety issues relating to presently known or unknown matters will
not require unanticipated expenditures, or result in fines, penalties or other consequences (including changes to operations) material to our business and operations.
Climate change and other variations in weather can affect demand for electricity and our ability to generate electricity.
Due to the nature of our business, our earnings are sensitive to weather variations from period to period, as well as long-term changes due to climate change. Variations in winter weather affect the demand for electrical heating requirements. Variations in summer weather affect the demand for electrical cooling requirements. These variations in demand can translate into electricity market price volatility. Variations in precipitation also affect water supplies, which in turn affect our hydroelectric assets. Also, variations in sunlight and wind conditions can have an effect on energy production levels from our solar and wind facilities. Typically, when winters are warmer or summers are cooler, demand for energy is lower than expected, resulting in less electricity consumption than forecasted and often resulting in lower than expected market prices for electricity. Conversely, when winters are colder or summers are warmer, market prices for natural gas or electricity tend to be higher; however, in these circumstances, if we have entered into hedges and are unable to produce or consume the amount of natural gas or electricity that we have hedged we could be required to purchase additional volumes at higher prices to cover our hedge position.
Our generation facilities and their operations are exposed to potential damage and partial or complete loss resulting from environmental disasters (e.g., floods, strong winds, wildfires, earthquakes, tornados and cyclones), equipment failures and other events beyond our control, which could make it difficult for the Company to continue to generate electricity during such periods, and such circumstances could pose threats to the Company's equipment and personnel.
The accumulation of ice on wind turbine blades depends on a number of factors including temperature and ambient humidity, and can have a significant impact on energy yields and could result in the wind turbine experiencing more downtime. Extreme cold temperatures can also impact the ability of wind turbines to operate effectively, and this could result in more downtime and reduced production. Sudden temperature changes can create an increased risk of ice crystals that can pose a number of constraints on our hydro operations.
Climate change is expected to change the volume and timing of precipitation which may impact the ability of hydro facilities to maximize the generation from available water. These changes in flow may result in additional operational costs to manage water through the hydro plants. Variations in weather may be impacted by climate
| | | | | | | | |
| M140 | TransAlta Corporation | 2024 Integrated Report |
change resulting in sustained higher temperatures, rising sea levels and altered precipitation patterns that could have an impact on our generating assets. Furthermore, climate change could result in increased variability or sustained long-term changes to our water and wind resources impacting hydroelectric and wind electricity generation, which could adversely affect our revenues and profitability.
Variation in wind levels may negatively impact the amount of electricity generated at our wind facilities.
Given that wind is variable, the amount of electricity produced from our wind facilities is also variable. In addition, the strength and consistency of the wind resource at our wind facilities may vary from what we anticipate due to a number of factors, including the extent to which our site-specific historic wind data and wind forecasts accurately reflect actual long-term wind speeds, strength and consistency, the potential impact of climatic factors, the accuracy of our assumptions relating to, among other things, weather, icing, degradation, site access, wake and wind shear line losses and wind shear, and the potential impact of topographical variations and the potential for electricity losses to occur before delivery.
A reduced amount of wind at the location of one or more of our wind facilities over an extended period may reduce the production from such facilities, as well as any environmental attributes that accrue to us related to that production and reduce our revenues and profitability.
There can be no assurance that we will achieve or be able to adhere to our sustainability targets and any failure to do so may present adverse consequences to our business.
The Company annually establishes sustainability targets to, among things, manage current and emerging material sustainability issues, which include targets relating to decarbonization (refer to the 2025+ Sustainability Targets section of this MD&A for details). The Board of Directors has the discretion to determine the sustainability targets being adopted by the Company and may modify or cancel any previously established sustainability target at any time. The Board of Director's determination to establish, alter or cancel any sustainability target will depend on, among other things: the United Nations Sustainable Development Goals; results of operations; technological considerations; financial condition; market opportunities; legal, regulatory and contractual considerations; and other relevant factors. Further, there is no certainty that the Company will be successful in achieving any particular sustainability target within the stated time frame, or at all. If we are not able to achieve, or adhere to, our sustainability targets, we may not satisfy our stakeholders' current and future
expectations, which could negatively impact our reputation and could result in certain investors being unable to hold our common shares.
Many of our activities and properties are subject to environmental regulations, and any liabilities arising under these requirements may materially adversely affect our business.
Our operations are subject to federal, provincial, state and local environmental laws, regulations and guidelines relating to the generation and transmission of electrical and thermal energy and surface mine reclamation (collectively, environmental regulations). These environmental regulations pertain to pollution and the protection of the environment, health and safety, and govern, among other things, air emissions, water usage and discharges, storage, treatment and disposal of waste and other materials, and remediation of sites and responsible land use. These laws and regulations can impose liability and obligations for costs to investigate and remediate contamination without regard to fault, and under certain circumstances liability may be joint and several, resulting in one responsible party being held responsible for the entire obligation. Environmental regulations can also impose, among other things, restrictions, liabilities and obligations in connection with the generation, handling, use, storage, transport, treatment and disposal of hazardous substances and waste, and can impose cleanup, disclosure or other responsibilities with respect to spills, releases and emissions of various substances to the environment. Environmental regulations can also require that facilities and other properties associated with our operations be operated, maintained, abandoned and reclaimed to the satisfaction of applicable regulatory authorities. In addition, the relative stringency of environmental regulations can reduce or decline based on political direction, resulting in potentially unstable policy environments at national, state/province and regional levels in Canada, the U.S. and Western Australia, which may impose different compliance requirements or standards on our business. These various compliance standards may impact costs and/or our ability to operate our facilities.
Changes in standards, new or amended regulation, increased enforcement by regulatory authorities, more extensive permitting requirements, an increase in the number and types of assets operated by the Company subject to environmental regulation and the implementation or change to regional, provincial, state and national environmental regulations may impose varying obligations on us in the jurisdictions in which we operate, and could increase our expenditures. To the extent these expenditures cannot be passed through to our customers under our PPAs or otherwise, our costs could be material. In addition, compliance with environmental regulation may result in restrictions on some of our operations. It is
| | | | | | | | |
| TransAlta Corporation | 2024 Integrated Report | M141 |
anticipated that compliance costs are at risk of change due to increased political and public attention.
If we do not comply with environmental regulations, regulatory agencies could seek to impose statutory, administrative and/or criminal liabilities on us, curtail our operations, or require significant expenditures on compliance, new equipment or technology, reporting obligations and research and development.
With Bill C-59 we anticipate continued and growing scrutiny by lawyers and other stakeholders relating to sustainability performance. We could face civil liability in the event that private parties seek to impose liability on us for property damage, personal injury or other costs and losses. We cannot guarantee that lawsuits or administrative or investigative actions will not be started against us and otherwise affect our operations and assets. If an action is filed against us or may otherwise affect our operations and assets, we could be required to make substantial expenditures to defend against, or provide evidence of our activities or to bring our Company, our operations and assets into compliance, which could have a material adverse effect on our business.
The estimated reclamation costs applicable to the Company's operations may be inaccurate and could require greater financial resources than currently anticipated. As an owner of mines that were previously in operation, we maintain permits from the applicable regulatory body providing for the authorization of certain mining operations that result in a disturbance of the surface. These requirements sought to limit the adverse impacts of coal mining with more restrictive requirements potentially being adopted from time to time. As an owner of mines that were previously in operation, we may also be required to submit a bond or otherwise secure payment of certain long-term obligations including mine closure or reclamation costs. Surety bond costs have increased in recent years and the market terms of such bonds have generally become more unfavourable. In addition, the number of companies willing to issue surety bonds has decreased. We could be required to self-fund these obligations should we be unable to renew or secure the required surety bonds for our mining operations or if it becomes more economical to do so.
We manage environmental compliance risk by:
•Seeking continuous improvement in numerous performance metrics such as emissions, safety, land and water impacts and environmental incidents;
•Staffing projects during construction and maintenance activities with expert environmental firms to help assure compliance during the project execution process and long term operations of the asset;
•Conducting environmental, health and safety management system audits to assess conformance to
our Total Safety Management System, which is designed to continuously improve performance;
•Committing significant experienced resources to work with regulators in Canada, Western Australia and the U.S. to advocate that regulatory changes are well-designed and cost-effective;
•Developing compliance plans that address how to meet or surpass emission standards for GHG, mercury, SO2 and NOx, which will be adjusted as regulations are finalized;
•Purchasing carbon emissions reduction offsets or credits;
•Investing in renewable energy projects, such as wind, solar and hydro generation and storage technologies; and
•Incorporating change-in-law provisions in contracts that allow recovery of certain compliance costs from our customers.
We are committed to remaining in compliance with all environmental regulations relating to operations and facilities. Compliance with both regulatory requirements and management system standards is regularly audited through our performance assurance policy and results are reported to the GSSC.
The laws and regulations in the various markets in which we operate are subject to change, which may materially adversely affect us.
Most of the markets in which we operate and intend to operate are subject to significant regulatory oversight and control. We are not able to predict whether there will be any further changes in the regulatory environment, including potential carbon and other environmental regulations, changes in market structure or market design, or changes in other laws and regulations. Existing market rules, regulations and reliability standards are often dynamic and may be revised or re-interpreted, and new laws and regulations may be adopted or become applicable to us or our facilities, which could have a material adverse effect on us. Many of our projects must also comply with reliability standards, including those established by the North American Electric Reliability Corporation and Alberta Reliability Standards. Failure to comply with these mandatory reliability standards could result in sanctions, including substantial monetary penalties. We manage these risks systematically through a regulatory and compliance program designed to reduce any potential negative impact on us. However, we cannot guarantee that we will be able to adapt our business in a timely manner in response to any changes in the regulatory regimes in which we operate, and such failure to adapt could have a material adverse effect on our business.
| | | | | | | | |
| M142 | TransAlta Corporation | 2024 Integrated Report |
Regulatory authorities may also from time to time audit or investigate our activities in the markets in which we operate or pursue trading. Such audits or investigations may result in sanctions or penalties that may materially affect our future activities, reputation or financial status.
Our facilities are also subject to various licensing and permitting requirements in the jurisdictions in which we operate. Many of these licences and permits need to be renewed from time to time. If we are unsuccessful in obtaining or renewing such licences or permits, or the terms of such licences or permits are changed in a manner that is adverse to our business, we could be materially adversely affected.
Any changes in the rules and regulations of provincial or state public utility commissions or other regulatory bodies in the other markets in which we compete, or may compete in the future, may materially adversely affect us.The laws and regulations in the various markets in which we operate are subject to change, which may materially adversely affect us.
The reduction, elimination or expiration of government subsidies and economic incentives could adversely affect our prospects for growth.
We seek to take full advantage of government policies that promote renewable power generation and enhance the economic feasibility of renewable power projects. Renewable power generation sources currently benefit from various incentives in the form of feed-in tariffs, rebates, tax credits, renewable portfolio standards (such as the U.S. government policy mechanism that supports the adoption of renewable power by setting a targeted percentage of a jurisdiction's total electricity procurement from renewable power) and other incentives throughout the markets in which we participate or intend to participate. If incentives are removed, we would expect to see some reduction in development opportunities, but given that all generators would be in the same boat, the impact may be muted.
We may be adversely affected if our supply of water is materially reduced.
Our hydroelectric and natural gas facilities and our coal-fired facility require continuous water flow for their operation. Shifts in weather or climate patterns, seasonable precipitation, the timing and rate of melting, run-off and other factors beyond our control may reduce the water flow to our facilities. Any material reduction in the water flow to our facilities would limit our ability to produce and market electricity from these facilities and could have a material adverse effect on us. There is an increasing level of regulation respecting the use, treatment and discharge of water, and respecting the licensing of water rights in jurisdictions where we operate. Any such
change in regulations could have a material adverse effect on us.
Availability or disruption of fuel supply to our thermal plants could have an adverse impact on the operation of our facilities and our financial condition.
Our gas facilities rely on having adequate supplies of natural gas and our Centralia facility requires adequate supplies of coal to run the facility reliably and at full capacity. As a result, we face the risk of not having adequate fuel supplies available due to insufficient natural gas transportation service, disruptions in fuel supplies due to weather, strikes, lockouts, or breakdowns of equipment, the timing of receiving regulatory approvals or we could be materially adversely affected if the cost of fuel that we must buy to generate electricity increases to a greater degree than the price that we can obtain for the electricity that we sell. Several factors affect the price of fuel, many of which are beyond our control, including:
•Prevailing market prices for fuel;
•Global demand for energy products;
•The cost of carbon and other environmental concerns;
•Weather-related disruptions affecting the ability to deliver fuels or near-term demand for fuels;
•Increases in the supply of energy products in the wholesale power markets;
•Political instability, including the war in Ukraine;
•The extent of fuel transportation capacity, cost of fuel transportation service into our markets or potential rail strikes; and
•The cost of mining or extraction that, in turn, depends on various factors such as labour market pressures, equipment replacement costs and permitting.
Changes in any of these factors may increase our cost of producing power or decrease the amount of revenue received from the sale of power, which could have a material adverse effect on us.
In the event the Company secures more natural gas than required to operate its facilities, the Company may have difficulty reselling such natural gas and it could be exposed to the market price for natural gas in respect of any such resales. There is no certainty that the Company will be successful in reselling or recovering its costs in respect of such resales of natural gas.
As well, the coal used to fuel the Centralia facility is sourced from the Powder River Basin in Montana and Wyoming through contracts to purchase and transport such coal to our Centralia facility. The loss of our suppliers or inability to receive coal at Centralia under our existing
| | | | | | | | |
| TransAlta Corporation | 2024 Integrated Report | M143 |
coal contracts at sufficient quantities, or at all, could also significantly affect our ability to serve our customers and have an adverse impact on our financial condition and results of operations. We could face the risk of inadequate supply service due to our reliance on the Pioneer Pipeline and on the ATCO Pipeline as a significant provider of natural gas for our Sundance and Keephills units.
We manage gas supply and price risk by:
•Working to ensure that we have at least two pipelines supplying the gas used in electrical generation in Alberta;
•Contracting for firm gas delivery and supply;
•Monitoring the financial viability of gas producers and pipelines;
•Hedging gas price exposure; and
•Monitoring pipeline maintenance schedules and transportation availability.
We manage coal supply and price risk by:
•Sourcing the coal used at Centralia from different mine sources to ensure sufficient coal is available at a competitive cost;
•Contracting sufficient trains to deliver the coal requirements at Centralia;
•Ensuring coal inventories on hand at Centralia are at appropriate levels for usage requirements;
•Ensuring efficient coal handling and storage facilities are in place so that the coal being delivered can be processed in a timely and efficient manner;
•Monitoring and maintaining coal specifications and carefully matching the specifications mined with the requirements of our facilities;
•Monitoring the financial viability of Centralia suppliers; and
•Hedging diesel exposure in mining and transportation costs.
In managing gas supply risk the company will enter into long term transportation service agreements to ensure that facilities have adequate gas supply. This also could result in the additional risk of of being in a surplus position where some of the transportation capacity may not be needed, and the Company is still required to pay for the unused transportation. To manage this risk the Company will remarket excess natural gas transport capacity in the short-term while seeking long-term or permanent assignments.
Our facilities rely on national and regional transmission systems and related facilities that are owned and operated by third parties and have both regulatory and physical constraints that could impede access to electricity markets.
Our power generation facilities depend on electric transmission systems and related facilities owned and operated primarily by third parties to deliver the electricity that we generate to delivery points where ownership changes and we are paid. The risks associated with the aging transmission infrastructure in the markets where we operate are increasing because new connections to the transmission system are consuming capacity faster than it is being added by new transmission developments.
Further, transmission systems operate with both regulatory and physical constraints that in certain circumstances may impede access to electricity markets. There may be instances in system emergencies in which our power generation facilities are physically disconnected from the power grid, or our production curtailed for periods of time. Most of our electricity sales contracts do not provide for payments to be made if electricity is not delivered.
Our power generation facilities may also be subject to changes in regulations governing the cost and characteristics of use of the transmission and distribution systems to which our power generation facilities are connected. Our power generation facilities in the future may not be able to secure access to this interconnection or transmission capacity at reasonable prices, in a timely fashion or at all, which could then cause delays and additional costs in attempting to negotiate or renegotiate PPAs or to construct new projects. In addition, we may not benefit from preferential arrangements in the future. Any such increased costs and delays could delay the commercial operation dates of any new projects and negatively impact our revenues and financial condition.
Cyberattacks may cause disruptions to our operations and could have a material adverse effect on our business.
We rely on our information technology to process, transmit and store electronic information and data used for the safe operation of our assets. Over the past few years, geopolitical tensions and the pandemic have significantly impacted the cybersecurity ecosystem, increasing the frequency and diversity of cyberattacks, including threats of war-driven cyberattacks (i.e., terrorism) against critical infrastructure and threat actors taking advantage of the pandemic (e.g., charity scams) and hybrid working environments. In the continuously evolving cybersecurity threat landscape, any attacks or breaches of network or information systems may disrupt our business operations or compromise the proprietary, confidential or personal
| | | | | | | | |
| M144 | TransAlta Corporation | 2024 Integrated Report |
information of the Company, its customers, partners or others with whom the Company has dealings. Cyberattackers may use a range of techniques, from exploiting vulnerabilities within our user base (social engineering attacks), to using sophisticated malicious code on a single or distributed basis to try to breach our network security controls. We anticipate that the cyber threat landscape will continue to evolve, with increasing threats of ransomware, compromised insider threats, supply chain attacks, advanced targeted phishing and artificial intelligence. Cyber threats originate from various sources and vectors, from nation states, organized hacking groups or malware/ransomware. The cyber threat landscape continues to evolve, as we see cyber threats shift their focus from traditional attacks against perimeter information technology systems, to more effective attacks, such as phishing and ransomware. A successful cyberattack may allow for the unauthorized interception, destruction, use or dissemination of proprietary, confidential or personal information and may cause disruptions to our operations. As information technology /operation technology systems are integral to TransAlta’s business operations, the risk of a cybersecurity incident threatens the safety of the public, TransAlta personnel and/or business functions, service delivery, reputation and profitability.
We are subject to regulatory, legislative and business requirements (e.g., North American Electric Reliability Corporation Critical Infrastructure Protection, SOX, Privacy) and also adopt industry endorsed standards and frameworks (e.g., National Institute of Standards and Technology, Critical Infrastructure Projection/Reliability Standards) as they pertain to our cybersecurity program and the implementation of our cybersecurity controls and processes.
While we have cyber insurance, as well as systems, policies, procedures, practices, hardware, software applications and data backups designed to prevent or limit the effect of security breaches of our network and infrastructure, there can be no assurance that these measures will be sufficient and that such security breaches will not occur or, if they do occur, that they will be adequately addressed in a timely manner.
TransAlta has established a comprehensive cybersecurity program to manage cybersecurity risks through effective security practices and structured and tailored plans.
TransAlta maintains compliance to regulatory, legislative, and business requirements (e.g., NERC CIP, SOX, Privacy) by adopting industry-endorsed standards and frameworks (e.g., National Institute of Standards and Technology (NIST), CIP/Reliability Standards) to implement a pragmatic fit-for-purpose cybersecurity program, implementing cybersecurity controls and processes under the following domains:
•Identify: TransAlta conducts comprehensive risk assessments to identify and document the organization's assets, systems and data, as well as potential risks and vulnerabilities.
•Protect: TransAlta implements security controls, policies and procedures to safeguard the organization's assets, systems and data from unauthorized access, use, disclosure, disruption, modification or destruction. This includes implementing access controls, encryption, firewalls and intrusion detection/prevention systems to protect the organization's networks and systems.
•Detect: TransAlta implements incident detection and response capabilities to detect and respond to cyber incidents. This includes monitoring systems, networks and data for suspicious activity.
•Respond: TransAlta has developed incident response plans, procedures and teams, and has provided training and conducted exercises to ensure that these plans and procedures are operating effectively.
•Recover: TransAlta has developed disaster recovery and business continuity plans, and it conducts test exercises of these plans to ensure their effectiveness. This includes identifying critical systems, data and processes to ensure the continuity of business operations, as well as implementing backup and recovery solutions to ensure that the organization's data can be restored in the event of a disaster.
Although complete cyber risk elimination is not achievable given the evolving cyber threat landscape, we believe that the security controls implemented to detect, prevent and respond to a cyber incident significantly reduce TransAlta’s cyber risk and potential incident impact to acceptable levels. In addition, cyber insurance is utilized to further manage and transfer residual cyber risk to TransAlta’s business. We continue to improve our overall security maturity and defense capabilities against cyber threats and align cybersecurity practices to industry standards, business objectives and regulatory compliance requirements.
Our technology and systems for communication and monitoring may be vulnerable to security breaches or interruptions, which could result in increased operating expenses and other liabilities.
We rely on technology, mainly on computer, telephone, satellite, cellular and related networks and infrastructure, to conduct our business and monitor the production of our generation facilities. These systems and infrastructure could be vulnerable to unforeseen problems including, but not limited to, cyberattacks, breaches, vandalism and theft. Our operations are dependent upon our ability to protect our information and operating technology against damage
| | | | | | | | |
| TransAlta Corporation | 2024 Integrated Report | M145 |
from fire, power loss, telecommunications failure or a similar catastrophic event. While we have dedicated resources for maintaining appropriate levels of cybersecurity and we use third-party technology to help protect us against security breaches and cyber incidents, our measures may not be effective and our information technology and infrastructure may be vulnerable to attacks by hackers or breached due to employee error, malfeasance or other disruptions. Any such security breaches and cyber incidents or other disruptions could jeopardize the security of information stored in and transmitted through our systems and network infrastructure, and could result in significant setbacks and potential liabilities and deter future customers. Additionally, we must be able to protect our generation facility infrastructure against physical damage and any service disruptions.
Any damage or failure that causes an interruption in operations could have an adverse effect on our customers. While we have systems, policies, hardware, practices and procedures designed to prevent or limit the effect of failure or interruptions of our generation facilities and infrastructure, there can be no assurance that these measures will be sufficient and that any such failures or interruptions will not occur or, if they do occur, that they will be adequately addressed in a timely manner.
We operate in a highly competitive environment and may not be able to compete successfully.
We operate in a number of Canadian provinces, as well as in the U.S. and Western Australia. These areas of operation are affected by competition ranging from large utilities to small independent power producers, as well as private equity, pension funds, international conglomerates, traditional energy companies and technology firms. In addition, potential customers may look to deploy their own capital to self-supply their own electricity needs. Some competitors have significantly greater financial and other resources than we do. Such competition could have a material adverse effect on our business. Emerging technology affecting the demand, generation, distribution or storage of electricity may also significantly impact our business and ability to compete. Climate change and regulatory incentives are expected to drive innovation and transformation of the power generation sector, including energy production and consumption, and there can be no certainty that the Company will benefit from such innovation or transformation. Furthermore, older facilities may over time be unable to compete with newer more efficient facilities utilizing improvements to existing power technologies and cost-efficient new technologies, including gas turbines with lower heat rates. In Alberta, certain industrial customers rely on behind-the-fence generation; these customers are not being supplied electricity from the grid, which reduces the competitive
load in the province and puts downward pressure on pool prices. Further, certain large industrial companies in Alberta operate significant cogeneration facilities, which generate steam required for their operations and often results in large amounts of excess generation being offered to the wholesale electricity market. These cogeneration facilities offer their energy into the market at low prices to ensure it is dispatched, which results in the facility realizing an achieved price close to the average pool price, which potentially puts downward pressure on the pool price and could result in certain of the Company's facilities not being dispatched.
Changes in general economic and market conditions may have a material adverse effect on us.
Adverse changes in general economic and market conditions could negatively impact demand for electricity as well as our revenue, operating costs, the timing and extent of capital expenditures, the net recoverable value of PP&E, financing costs, credit and liquidity risk and counterparty risk which could cause us to suffer a material adverse effect.
We may be unsuccessful in legal actions.
We are occasionally named as a party in various disputes, claims and legal or regulatory proceedings that arise during the normal course of our business. We review each of these claims, including the nature and merits of the claim, the amount in dispute or the remedy claimed and the availability of insurance coverage. There can be no assurance that any particular dispute, claim or proceeding will be resolved in our favour or that our liabilities with respect to such claims will not have a material adverse effect on us. Refer to the Other Consolidated Analysis section of this MD&A for further details.
We may have difficulty raising needed capital in the future, which could significantly harm our business.
To the extent that our sources of cash and cash flow from operations are insufficient to fund our activities or we are unable to divest assets to generate capital, we may need to raise additional funds. Additional financing may not be available when needed, and if such financing is available, it may not be available on terms that are favourable to our business.
Recovery of the capital investment in power projects generally occurs over a long period of time. As a result, we must obtain funds from equity or debt financings, including tax equity transactions, or from government grants, to help finance the acquisition and development of projects and to support the general and administrative costs of operating our business. Our ability to arrange financing, either at the corporate level or at the subsidiary level (including non-
| | | | | | | | |
| M146 | TransAlta Corporation | 2024 Integrated Report |
recourse project debt or tax equity), and the costs of such capital are dependent on numerous factors, including: (a) general economic and capital market conditions; (b) credit availability from banks and other financial institutions; (c) investor confidence and the markets in which we conduct operations; (d) our financial performance and/or the expected financial performance of certain assets; (e) our level of indebtedness and compliance with covenants in our debt agreements; (f) our cash flow and/or the expected cash flow of certain assets; and (g) our credit ratings. We are subject to certain financial covenants under our credit facility that could limit the amount of additional debt that the Company could raise in certain circumstances. An inability to raise project debt or tax equity financing could reduce the number of projects that we are able to finance. If we are unable to raise additional funds when needed, we could be required to delay the acquisition and construction of growth projects, reduce the scope of projects, abandon or sell some of our projects or generation facilities, or default on our contractual commitments in the future, any of which could adversely affect our business, financial condition and results of operations.
TransAlta's debt securities will be structurally subordinated to any debt of our subsidiaries that is currently outstanding or may be incurred in the future.
We operate our business through, and a majority of our assets are held by, our subsidiaries, including partnerships. Our results of operations and ability to service indebtedness are dependent upon the results of operations of our subsidiaries and the payment of funds by these subsidiaries to TransAlta in the form of loans, dividends or otherwise. Our subsidiaries may be restricted in their ability to pay amounts due, or make any funds available to TransAlta, whether by dividends, interest payments, loans, advances or other payments. In addition, the payment of dividends and the making of loans, advances and other payments to us by our subsidiaries may be subject to statutory or contractual restrictions or tax withholding amounts. In the event of the liquidation of any subsidiary, the assets of the subsidiary would be used first to repay the indebtedness of the subsidiary, including trade payables or obligations under any guarantees, before being used to pay TransAlta's indebtedness, including any debt securities issued by TransAlta. Such indebtedness and any other future indebtedness of such subsidiaries would be structurally senior for such subsidiary to any debt securities issued by TransAlta.
Our subsidiaries have financed some investments using non-recourse project financing. Each non-recourse project loan is structured to be repaid out of cash flow provided by the project. In the event of a default under a financing agreement that is not secured, the lenders would generally have rights to the related assets. In the event of foreclosure after a default, our subsidiary may lose its
equity in the asset or may not be entitled to any cash that the asset may generate.
A downgrade of our credit ratings could materially and adversely affect us.
Rating agencies regularly evaluate us, basing their ratings of our long and short-term debt, along with our issuer rating, on a number of factors. There can be no assurance that one or more of our credit ratings and the corresponding outlooks will not be changed. Our borrowing costs and ability to raise funds are directly impacted by our credit ratings. Credit ratings may be important to suppliers or counterparties when they seek to engage in certain transactions with us. A credit rating downgrade could potentially impair our ability to enter into arrangements with suppliers or counterparties, to engage in certain transactions, and could limit our access to private and public credit markets and increase the costs of borrowing under our existing credit facilities. See Note 15 of our audited consolidated financial statements for the year ended Dec. 31, 2024, which financial statements are incorporated by reference herein.
Changes to our reputation may have a material adverse effect on us.
Reputation risk relates to the risk associated with our business because of changes in opinion from the general public, private stakeholders, governments, financiers and other entities. Our reputation is one of our most valued assets. The potential for harming our reputation exists in every business decision and all risks can have an impact on reputation, which in turn can negatively impact our business and securities. Reputational risk cannot be managed in isolation from other forms of risk. Negative impacts from a compromised reputation could include revenue loss, reduction in our customer base and the decreased value of our securities.
We manage reputation risk by:
•Striving as a neighbour and business partner, in the regions where we operate, to build viable relationships based on mutual understanding leading to workable solutions with our neighbours and other community stakeholders;
•Clearly communicating our business objectives and priorities to a variety of stakeholders on a routine and transparent basis;
•Applying innovative technologies to improve our operations, work environment and environmental footprint;
•Maintaining positive relationships with various levels of government;
•Pursuing sustainable development as a longer-term corporate strategy;
| | | | | | | | |
| TransAlta Corporation | 2024 Integrated Report | M147 |
•Ensuring that each business decision is made with integrity and in line with our corporate values;
•Communicating the impact and rationale of business decisions to stakeholders in a timely manner; and
•Maintaining strong corporate values that support reputation risk management initiatives, including the annual Code of Conduct sign-off.
We may fail to meet financial expectations.
Our quarterly revenue, earnings, cash flows and results of operations are difficult to predict and fluctuate from quarter to quarter. Our quarterly results of operations are influenced by a number of factors, including the risks described in this MD&A, many of which are outside of our control and that may cause such results to fall below market expectations. Although we base our planned operating expenses in part on our expectations of future revenue, a significant portion of our expenses are relatively fixed in the short-term. If revenue for a particular quarter is lower than expected, we will likely be unable to proportionately reduce our operating expenses for that quarter, which will adversely affect our results of operations for that quarter.
Our cash dividend payments are not guaranteed.
The payment of dividends is not guaranteed and could fluctuate. The Board of Directors has the discretion to determine the amount and timing of any dividends to be declared and paid to our shareholders. In addition, the payment of dividends on common shares is, in all cases, subject to prior satisfaction of preferential dividends applicable to each series of our first preferred shares. We may alter our dividend on common shares at any time. The Board of Directors' determination to declare dividends will depend on, among other things: results of operations; financial condition; current and expected future levels of earnings; operating cash flow; liquidity requirements; market opportunities; income taxes; maintenance and growth capital expenditures; debt repayments; legal, regulatory and contractual constraints; working capital requirements; taxes payable; and other relevant factors. Our short- and long-term borrowings may prohibit us from paying dividends at any time at which a default or event of default would exist under such debt, or if a default or event of default would exist as a result of paying the dividend.
Over time, our capital and other cash needs may change significantly from our current needs, which could affect whether we pay dividends and the amount of any dividends we may pay in the future. If we continue to pay dividends at the current level, we may not retain a sufficient amount of cash to finance growth opportunities, meet any large unanticipated liquidity requirements or fund our operations in the event of a significant business downturn. The Board of Directors, subject to the
requirements of our bylaws and other governance documents, may amend, revoke or suspend our dividends at any time. A decline in the market price or liquidity, or both, of our common shares could result if the Board of Directors reduces or eliminates the payment of dividends.
We are dependent on the operations of our facilities for our cash availability. The actual amount of cash available for dividends to holders of our common shares will depend upon numerous factors relating to each of our generation facilities including: operating performance of our generation facilities; profitability; changes in gross margin; fluctuations in working capital; capital expenditure levels; applicable laws; tax position; financing; compliance with contracts; and contractual restrictions contained in the instruments governing any indebtedness. Any reduction in the amount of cash available for distribution from our generation facilities will reduce the amount of cash available to pay dividends to holders of our common shares.
The market price for our common shares may be volatile.
The market price for our common shares may be volatile and subject to wide fluctuations in response to numerous factors, many of which are beyond our control, including: (a) actual or anticipated fluctuations in our results of operations; (b) recommendations by securities research analysts; (c) changes in the economic performance or market valuations of other companies that investors deem comparable; (d) the loss or resignation of executive officers and other key personnel; (e) sales or perceived sales of additional common shares; (f) significant acquisitions or business combinations, strategic partnerships, joint ventures or capital commitments by or involving us or our competitors; and (g) trends, concerns, technological or competitive developments, regulatory changes and other related issues in the power generation industry or our target markets.
Financial markets have experienced significant price and volume fluctuations that have particularly affected the market prices of equity securities of companies and such fluctuations have, in many cases, been unrelated to the operating performance, underlying asset values or prospects of such companies. Accordingly, the market price of our common shares may decline even if our operating results, underlying asset values or prospects have not changed. Additionally, these factors, as well as other related factors, may cause decreases in asset values that may result in impairment losses. Certain institutional investors may base their investment decisions on consideration of our environmental, governance and social practices and performance against such institutions' respective investment guidelines and criteria, and failure to meet such criteria may result in limited or no investment in our common shares by those institutions, which could adversely affect the trading price of our common shares.
| | | | | | | | |
| M148 | TransAlta Corporation | 2024 Integrated Report |
We may not be able to extend, renew or replace expiring or terminated PPAs, or other customer contracts at favourable rates or on a long-term basis.
Our ability to extend, renew or replace our existing PPAs or other customer contracts depends on a number of factors beyond our control, including, but not limited to: whether the PPA counterparty has a continued need for energy at the time of the agreement’s expiration; the presence or absence of governmental incentives or mandates which prevails market prices; the availability of other electricity sources; the satisfactory performance of our obligations under such PPAs; the regulatory environment applicable to our contractual counterparties at the time; macroeconomic factors present at the time, such as population, business trends, international trade laws, regulations, agreements, treaties, policies or other countries and related energy demand; and the effects of regulation on the contracting practices of our contractual counterparties.
If we are not able to extend, renew or replace on acceptable terms existing PPAs before contract expiration, or if such agreements are otherwise terminated prior to their expiration, we may not have any ability to sell electricity to the market or to other customers. If we are able to sell electricity on an uncontracted basis, we would sell electricity at prevailing market prices that could be materially lower than under the applicable contract. This could result in us having less stable cash flows. If there is no satisfactory market for a project’s uncontracted energy, we may decommission the project before the end of its useful life. Any failure to extend, renew or replace a significant portion of our existing PPAs, or other customer contracts, or extending, renewing or replacing them at lower prices or with other unfavourable terms, or the decommissioning of a project, could have a material adverse effect on our business, financial condition, results of operations and ability to pay dividends to our shareholders.
We may fail to fully or effectively hedge our supply and price risk exposure.
We closely monitor the risks associated with changes in electricity and input fuel prices on our future operations and, where we consider it appropriate, use various physical and financial instruments to hedge our assets and operations from such price risks. The efficacy of our risk management and hedging program may be adversely impacted by unanticipated events and costs that we are not able to effectively mitigate, including unanticipated events that impact supply and demand, such as extreme weather and unplanned outages. We may also be adversely impacted if we make incorrect assumptions that were relied upon in establishing our hedges. We are exposed to changes in electricity prices and natural gas prices on purchases of electricity or natural gas from the
market to fulfil our supply obligations under these short- and long-term hedge contracts. If we are unable to produce or consume the amount of natural gas or electricity that we have hedged, we could incur losses as we could be required to purchase additional volumes in the market at higher prices in order to cover our hedge position. Comparably, if the market price for electricity is higher than the hedged price we would be subject to the opportunity cost associated with not realizing the higher market price.
We are also exposed to basis risk as certain of our generating facilities receives the "node" price for the electricity it delivers to the grid while the financial PPA for such generating facility settles at the "hub" price. The differences between the "node" price and "hub" price can be significant from time to time.
Trading risks may have a material adverse effect on our business.
Our trading and marketing business frequently involves establishing trading positions in the wholesale energy markets on both a medium-term and short-term basis, and on both an asset and proprietary basis. To the extent that we have long positions in the energy markets, a downturn in market prices will result in losses from a decline in the value of such long positions. Conversely, to the extent that we enter into forward sales contracts to deliver energy that we do not own, or take short positions in the energy markets, an upturn in market prices will expose us to losses as we attempt to cover any short positions by acquiring energy in a rising market.
In addition, from time to time, we may have a trading strategy consisting of simultaneously holding a long position and a short position, from which we expect to earn a profit based on changes in the relative value of the two positions. If, however, the relative value of the two positions changes in a direction or manner that we did not anticipate, we would realize losses from such a paired position.
If the strategy that we use to hedge our exposures to these various risks is not effective, we could incur significant losses. Our trading positions can be impacted by volatility in the energy markets that, in turn, depend on various factors, including weather in various geographical areas and short-term supply and demand imbalances, which cannot be predicted with any certainty. A shift in the energy markets could adversely affect our positions, which could also have a material adverse effect on our business.
We use a number of risk management controls conducted by our risk management group to limit our exposure to risks arising from our trading activities. These controls include risk capital limits, Value at Risk, Gross Margin at Risk, tail risk scenarios, position limits, concentration limits, credit limits and approved product controls. We cannot guarantee
| | | | | | | | |
| TransAlta Corporation | 2024 Integrated Report | M149 |
that losses will not occur and such losses may be outside the parameters of our risk controls.
Certain of the contracts to which we are a party require that we provide collateral against our obligations.
We are exposed to risk under certain arrangements, including financial derivative contracts and electricity and natural gas purchase and sale contracts entered into for the purposes of hedging and proprietary trading. The terms and conditions of these contracts may require us to provide collateral when the fair value of these contracts is in excess of any credit limits granted by our counterparties and the contract obliges that we provide the collateral. The change in fair value of these contracts often occurs due to changes in commodity prices. These contracts include: (a) financial derivative contracts when forward commodity prices are more or less than contracted prices, depending on the transactions; (b) purchase agreements, when forward commodity prices are less than contracted prices; and (c) sales agreements, when forward commodity prices exceed contracted prices. Downgrades in our creditworthiness by certain credit rating agencies may decrease the credit limits granted by our counterparties and, accordingly, increase the amount of collateral that we may have to provide. Any increase in the amount of collateral provided by the Company could reduce our liquidity and materially adversely affect us.
If counterparties to our contracts are unable to meet their obligations, we may be materially and adversely affected.
If purchasers of our electricity and steam or other contractual counterparties default on their obligations, we may be materially and adversely affected. While we have procedures and controls in place to manage counterparty credit risk before entering into contracts, all contracts inherently contain default risk. Moreover, while we seek to monitor trading activities to ensure that the credit limits for counterparties are not exceeded, we cannot guarantee that a party will not default. If counterparties to our contracts are unable to meet their obligations, we could suffer a reduction in revenue that could have a material adverse effect on our business.
We manage our exposure to credit risk by:
•Establishing and adhering to policies that define credit limits based on the creditworthiness of counterparties;
•Contract term limits and restrictions on the credit concentration with any specific counterparty;
•Requiring formal sign-off on contracts that include commercial, financial, legal and operational reviews;
•Requiring security instruments, such as parental guarantees, letters of credit and cash collateral or third-party credit insurance if a counterparty goes over its limits. Such security instruments can be collected if a counterparty fails to fulfil its obligation; and
•Reporting our exposure using a variety of methods that allow key decision-makers to assess credit exposure by counterparty. This reporting allows us to assess credit limits for counterparties and the mix of counterparties based on their credit ratings.
If established credit exposure limits are exceeded, we take steps to reduce this exposure, such as by requesting collateral, if applicable, or by halting commercial activities with the affected counterparty. However, there can be no assurances that we will be successful in avoiding losses as a result of a contract counterparty not meeting its obligations.
As needed, additional risk mitigation tactics will be taken to reduce the risk to TransAlta. These risk mitigation tactics may include, but are not limited to, immediate follow-up on overdue amounts, adjusting payment terms to ensure a portion of funds are received sooner, requiring additional collateral, reducing transaction terms and working closely with impacted counterparties on negotiated solutions.
Our credit risk management profile and practices have not changed materially from Dec. 31, 2023. We had no material counterparty losses in 2024. We continue to keep a close watch on changes and trends in the market and the impact these changes could have on our energy trading business and hedging activities and will take appropriate actions as required, although no assurance can be given that we will always be successful.
| | | | | | | | |
| M150 | TransAlta Corporation | 2024 Integrated Report |
The following table outlines our maximum exposure to credit risk without taking into account collateral held or right of set-off, including the distribution of credit ratings, as at Dec. 31, 2024:
| | | | | | | | | | | | | | |
| Investment grade (per cent) | Non-investment grade (per cent) | Total (per cent) | Total amount ($) |
Trade and other receivables(1,2) | 87 | | 13 | | 100 | | 767 | |
| Long-term finance lease receivables | 100 | | — | | 100 | | 305 | |
Risk management assets(1) | 58 | | 42 | | 100 | | 411 | |
Loan receivable(2) | — | | 100 | | 100 | | 25 | |
| Total | | | | 1,508 | |
(1)Letters of credit and cash and cash equivalents are the primary types of collateral held as security related to these amounts.
(2)Includes $25 million loan receivable included within other assets with a counterparty that has no external credit rating.
The maximum credit exposure to any one customer for commodity trading operations, including the fair value of open trading positions net of any collateral held, is $77 million (2023 – $23 million).
Because of our multinational operations, we are subject to currency rate risk, tax, regulatory and political risk.
We have exposure to various currencies as a result of our investments and operations in foreign jurisdictions, the earnings from those operations, the acquisition of equipment and services and foreign-denominated commodities from foreign suppliers, and our U.S. and Australian dollar-denominated debt. Our exposures are primarily to the U.S. and Australian currencies, and changes in the values of these currencies relative to the Canadian dollar could negatively impact our operating cash flows or the value of our foreign investments. While we attempt to manage this risk by using hedging instruments, including cross-currency interest rate swaps, forward exchange contracts and matching revenues and expenses by currency at the corporate level, there can be no assurance that these risk management efforts will be effective, and fluctuations in these exchange rates may have a material adverse effect on our business.
In addition to currency rate risk, our foreign operations may be subject to tax, regulatory and political risk. Any change to the regulations governing power generation or the political climate in the countries where we have operations could impose additional costs and have a material adverse effect on us.
We manage our currency rate risk by establishing and adhering to policies that include:
•Hedging our net investments in U.S. operations using U.S. dollar denominated debt;
•Entering into forward foreign exchange contracts to hedge future foreign-denominated expenditures including our U.S. dollar denominated senior debt that is outside the net investment portfolio; and
•Hedging our expected foreign operating cash flows. Our target is to hedge a minimum of 60 per cent of our forecasted foreign operating cash flows over a four-year period, with a minimum of 90 per cent in the current year, 70 per cent in the next year, 50 per cent in the third year and 30 per cent in the fourth year. The U.S. and Australian exposure, net of debt service and sustaining capital expenditures, is managed with forward foreign exchange contracts.
| | | | | | | | |
| TransAlta Corporation | 2024 Integrated Report | M151 |
The sensitivity of our net earnings to changes in foreign exchange rates has been prepared using management’s assessment that an average $0.03 increase or decrease in the U.S. or Australian currencies relative to the Canadian dollar is a reasonable potential change over the next quarter and is shown below:
| | | | | | | | |
| Factor | Increase or decrease | Approximate impact on net earnings (millions) |
| Exchange rate | $0.03 | $20 | |
We are not able to insure against all potential risks and may become subject to higher insurance premiums.
Our business is exposed to the risks inherent in the construction and operation of electricity generation facilities, such as breakdowns, manufacturing defects, natural disasters, injury, damage to third parties, theft, terrorist attacks, cyberattacks and sabotage. We are also exposed to environmental risks. We maintain insurance policies, covering usual and customary risks associated with our business, with creditworthy insurance carriers. Our insurance policies, however, may not cover losses, or may be subject to limitations in coverage as a result of force majeure, natural disasters, terrorist or cyberattacks or sabotage, armed hostilities, or other perils. Our insurance policies may be subject to increase resulting from climate change, for example due to increased storm severity and frequency. In addition, we generally do not maintain insurance for certain environmental risks, such as environmental contamination. Our insurance policies are subject to annual review by the respective insurers and may not be renewed at all or on similar or favourable terms. A significant uninsured loss or a loss significantly exceeding the limits of our insurance policies or the failure to renew such insurance policies on similar or favourable terms could have a material adverse effect on our business, financial condition and results of operations.
Our insurance coverage may not be available in the future on commercially reasonable terms or adequate insurance
limits may not be available in the market. In addition, the insurance proceeds received for loss or damage to any of our generation facilities may not be sufficient to permit us to continue to make payments on our debt.
Provision for income taxes may not be sufficient.
Our operations are complex and located in several countries, and the computation of the provision for income taxes involves tax interpretations, regulations and legislation that are continually changing. In addition, our tax filings are subject to audit by taxation authorities. While we believe that our tax filings have been made in material compliance with all applicable tax interpretations, regulations and legislation, we cannot guarantee that we will not have disagreements with taxation authorities with respect to our tax filings that could have a material adverse effect on our business.
The Company and its subsidiaries are subject to changing laws, treaties and regulations in and between countries. Various tax proposals in the countries we operate in could result in changes to the basis on which deferred taxes are calculated or could result in changes to income or non-income tax expense. There has recently been an increased focus on issues related to the taxation of multinational corporations. A change in tax laws, treaties or regulations, or in the interpretation thereof, could result in a materially higher income or non-income tax expense that could have a material adverse impact on us.
The sensitivity of changes in income tax rates upon our net earnings is shown below:
| | | | | | | | |
| Factor | Increase or decrease (per cent) | Approximate impact on net earnings (millions) |
| Tax rate | 1 | | $3 | |
If we fail to attract and retain key personnel, we could be materially adversely affected.
The loss of any of our key personnel or our inability to attract, train, retain and motivate additional qualified management and other personnel could have a material adverse effect on our business. Competition for these personnel is intense and there can be no assurance that we will be successful in this regard. If we are unable to
successfully negotiate new collective bargaining agreements with our unionized workforce, as required, we will be adversely affected.
While we believe we have a satisfactory relationship with our unionized employees, we cannot guarantee that we will be able to successfully negotiate or renegotiate our collective bargaining agreements on terms agreeable to
| | | | | | | | |
| M152 | TransAlta Corporation | 2024 Integrated Report |
TransAlta. In 2024 we successfully renegotiated one collective bargaining agreement.
We expect to renegotiate four collective bargaining agreements in 2025. Any hurdles in negotiating these collective bargaining agreements could lead to higher employee costs and a work stoppage or strike, which could have a material adverse effect on us.
We manage this risk by:
•Possessing a labour relations strategy;
•Applying a human-centric approach that emphasizes the employee experience, including actively improving our workplace culture, focusing on ED&I strategies and offering health and wellness programming and initiatives;
•Focusing on employee learning and development;
•Monitoring industry compensation and aligning salaries with those benchmarks;
•Using incentive pay for non-union roles to align employee goals with corporate goals;
•Monitoring and managing target levels of employee turnover; and
•Ensuring employees have the appropriate training and qualifications to perform their jobs.
We are subject to risks associated with our ownership interests in projects that are under construction, which could result in our inability to complete construction projects on time or at all, and make projects too expensive to complete or cause the return on an investment to be less than expected.
TransAlta has interests in certain projects that have not yet started operations or are under construction. There may be delays or unexpected developments in completing any future construction projects, which could cause the construction costs of these projects to exceed our expectations, result in substantial delays or prevent the project from commencing commercial operations. Various factors could contribute to construction-cost overruns, construction halts or delays or the failure to commence commercial operations, including: delays in obtaining, or the inability to obtain, necessary land rights, permits and licences; delays and increased costs related to the interconnection of new projects to the transmission system; the inability to acquire or maintain land use and access rights; the failure to receive contracted third-party services; interruptions to dispatch at the projects; supply chain disruptions, including as a result of changes in international trade laws, regulations, agreements, treaties, taxes, tariffs, duties or policies of Canada, the U.S. or other countries in which the Company's suppliers are located; work stoppages; labour disputes; weather interferences;
unforeseen engineering, environmental and geological problems, including, but not limited to, discoveries of contamination, protected plant or animal species or habitat, archaeological or cultural resources or other environment-related factors; unanticipated cost overruns in excess of budgeted contingencies; and failure of contracting parties to perform under contracts.
In addition, if we or one of our subsidiaries has an agreement for a third party to complete construction of any project, TransAlta is subject to the viability and performance of the third party. Our inability to find a replacement contracting party, if the original contracting party has failed to perform, could result in the abandonment of the construction of such project, while we could remain obligated under other agreements associated with the project, including, but not limited to, offtake PPA's.
We manage project risks by:
•Ensuring all projects follow established corporate processes and policies;
•Identifying key risks during every stage of project development and ensuring mitigation plans are factored into capital estimates and contingencies;
•Reviewing project plans, key assumptions and returns with senior management prior to Board of Director approvals;
•Consistently applying project management methodologies and processes;
•Determining contracting strategies that are consistent with the project scope and scale to ensure key risks, such as labour and technology, are managed by contractors and equipment suppliers;
•Ensuring contracts for construction and major equipment include key terms for performance, delays and quality backed by appropriate levels of liquidated damages;
•Reviewing projects after achieving commercial operation to ensure learnings are incorporated into the next project;
•Negotiating contracts for construction and major equipment to lock in key terms such as price, availability of long lead equipment, foreign currency rates and warranties as much as is economically feasible before proceeding with the project; and
•Entering into labour agreements to provide security around labour cost, supply and productivity.
| | | | | | | | |
| TransAlta Corporation | 2024 Integrated Report | M153 |
New technology and artificial intelligence may present emerging risks that could have a material adverse effect on the Company.
We are introducing artificial intelligence and robotics at some of our facilities. The use of artificial intelligence and robotics at our facilities may not yield materially better results, higher outputs or increased productivity and there is no certainty that we will realize benefits from investments in these technologies. Additionally, the use of artificial intelligence is subject to the risk that privacy concerns relating to such technology could deter current and potential customers.
The global energy transition may have an adverse effect on the Company.
The decarbonization of the global energy system in order to achieve net-zero emissions and minimize a global temperature rise poses several risks to TransAlta's business, including but not limited to, changing regulations and policies, market risks from the volatility of and uncertainty of the energy supply and demand, and operational risks from new technologies.
The sensitivity of volumes to our net earnings is shown below:
| | | | | | | | |
| Factor | Increase or decrease (per cent) | Approximate impact on net earnings (millions) |
| Availability/production | 1 | | $17 | |
Changes in interest rates can impact our borrowing costs and affect our interest rate risk.
Changes in interest rates can impact our borrowing costs. Changes in our cost of capital may also affect the feasibility of new growth initiatives.
At Dec. 31, 2024, approximately 18 per cent (2023 – 14 per cent) of our total long-term debt was subject to changes in floating interest rates through a combination of floating rate debt and interest rate swaps.
We manage interest rate risk by establishing and adhering to policies that include:
•Employing a combination of fixed and floating rate debt instruments;
•Monitoring the mixture of floating and fixed rate debt and adjusting to ensure efficiency; and
•Opportunistically hedging probable debt issuances and outstanding variable rate borrowings using interest rate swaps.
The sensitivity of changes in interest rates upon our net earnings is shown below:
| | | | | | | | |
| Factor | Increase or decrease (per cent) | Approximate impact on net earnings (millions) |
| Interest rate | 50 bps | $3 | |
| | | | | | | | |
| M154 | TransAlta Corporation | 2024 Integrated Report |
Disclosure Controls and Procedures
Management is responsible for establishing and maintaining adequate internal control over financial reporting (ICFR) and disclosure controls and procedures (DC&P). For the year ended Dec. 31, 2024, the majority of our workforce supporting and executing our ICFR and DC&P continue to work on a hybrid basis. The Company has implemented appropriate controls and oversight for both in-office and remote work. There has been minimal impact to the design and performance of our internal controls.
ICFR is a framework designed to provide reasonable assurance regarding the reliability of financial reporting and the preparation of the consolidated financial statements for external purposes in accordance with IFRS. Management has used the Internal Control – Integrated Framework issued by the Committee of Sponsoring Organizations of the Treadway Commission (2013 framework) to assess the effectiveness of the Company’s ICFR.
DC&P refer to controls and other procedures designed to ensure that information required to be disclosed in the reports we file or submit under securities legislation is recorded, processed, summarized and reported within the time frame specified in applicable securities legislation. DC&P include, without limitation, controls and procedures designed to ensure that information required to be disclosed by us in our reports that we file or submit under applicable securities legislation is accumulated and communicated to management, including our Chief Executive Officer and Chief Financial Officer, as appropriate to allow timely decisions regarding our required disclosure.
Together, the ICFR and DC&P frameworks provide internal control over financial reporting and disclosure. In designing and evaluating our ICFR and DC&P, management recognizes that any controls and procedures, no matter
how well designed and operated, can provide only reasonable assurance of achieving the desired control objectives and as such may not prevent or detect all misstatements and management is required to apply its judgment in evaluating and implementing possible controls and procedures. Further, the effectiveness of ICFR is subject to the risk that controls may become inadequate because of changes in conditions or that the degree of compliance with policies or procedures may change.
In accordance with the provisions of NI 52-109 and consistent with U.S. Securities and Exchange Commission guidance, the scope of the evaluation did not include internal controls over financial reporting of Heartland, which the Company acquired on Dec. 4, 2024. Heartland was excluded from management's evaluation of the effectiveness of the Company's internal control over financial reporting as at Dec. 31, 2024, due to the proximity of the acquisition to year-end. Further details related to the acquisition are disclosed in Note 4 to the Company's Consolidated Financial Statements for the year ended Dec. 31, 2024. Included in the 2024 Consolidated Financial Statements of TransAlta for Heartland are eight per cent per cent and 20 per cent of the Company's total and net assets, respectively, as at Dec. 31, 2024 and one per cent and (5) per cent of the Company's revenues and net earnings, respectively, for the year ended Dec. 31, 2024.
Management has evaluated, with the participation of our Chief Executive Officer and Chief Financial Officer, the effectiveness of our ICFR and DC&P as of the end of the period covered by this MD&A. Based on the foregoing evaluation, our Chief Executive Officer and Chief Financial Officer have concluded that, as at Dec. 31, 2024, the end of the period covered by this MD&A, our ICFR and DC&P were effective.
| | | | | | | | |
| TransAlta Corporation | 2024 Integrated Report | M155 |