UNITED STATES SECURITIES AND EXCHANGE COMMISSION
WASHINGTON, D.C. 20549
FORM 20-F
| ¨ | REGISTRATION STATEMENT PURSUANT TO SECTION 12(b) OR (g) OF THE SECURITIES EXCHANGE ACT OF 1934 |
| | OR |
| | |
| þ | ANNUAL REPORT PURSUANT TO SECTION 13 OR 15(d) OF THE SECURITIES EXCHANGE ACT OF 1934 FOR THE FISCAL YEAR ENDED DECEMBER 31, 2015 |
| | OR |
| | |
| ¨ | TRANSITION REPORT PURSUANT TO SECTION 13 OR 15(d) OF THE SECURITIES EXCHANGE ACT OF 1934 |
| | OR |
| | |
| ¨ | SHELL COMPANY REPORT PURSUANT TO SECTION 13 OR 15(d) OF THE SECURITIES EXCHANGE ACT OF 1934 |
| | |
| | Date of event requiring this shell company report |
| | |
| | FOR THE TRANSITION PERIOD FROM TO JANUARY 1, 2015 TO DECEMBER 31, 2015 |
COMMISSION FILE NUMBER 000-49751
Catalyst Paper Corporation
(Exact name of Registrant as specified in its charter)
N/A
(Translation of Registrant’s name into English)
British Columbia, Canada
(Jurisdiction of incorporation or organization)
2nd Floor, 3600 Lysander Lane
Richmond
British Columbia, Canada V7B 1C3
(Address of principal executive offices)
James Isaac, 604-247-4738,james.isaac@catalystpaper.com,
2nd Floor, 3600 Lysander Lane, Richmond, BC V7B 1C3
(Name, Telephone, E-mail and/or Facsimile number and Address of Company Contact Person)
Securities registered or to be registered pursuant to Section 12(b) of the Act:
None.
Securities registered or to be registered pursuant to Section 12(g) of the Act:
Common Shares.
Securities for which there is a reporting obligation pursuant to Section 15(d) of the Act:
None.
The number of outstanding shares of each of the issuer’s classes of capital or common stock as of
December 31, 2015 was:
14,527,571
Indicate by check mark if the registrant is a well-known seasoned issuer, as defined in Rule 405 of the Securities Act. Yes¨ Nox
If this report is an annual or transition report, indicate by check mark if the registrant is not required to file reports pursuant to Section 13 or 15(d) of the Securities Exchange Act of 1934. Yes¨ Nox
Indicate by check mark whether the registrant (1) has filed all reports required to be filed by Section 13 or 15(d) of the Securities Exchange Act of 1934 during the preceding 12 months (or for such shorter period that the registrant was required to file such reports), and (2) has been subject to such filing requirements for the past 90 days. Yesx No¨
Indicate by check mark whether the registrant has submitted electronically and posted on its corporate Web site, if any, every Interactive Data File required to be submitted and posted pursuant to Rule 405 of regulation S-T (§232.405 of this chapter) during the preceding 12 months (or for such shorter period that the registrant was required to submit and post such files). Yes¨ No¨
Indicate by check mark whether the registrant is a large accelerated filer, an accelerated filer, or a non-accelerated filer. See definition of “accelerated filer and large accelerated filer” in Rule 12b-2 of the Exchange Act. (Check one):
| Large accelerated filer ¨ | Accelerated filer ¨ | Non-accelerated filer x |
Indicate by check mark which basis of accounting the registrant has used to prepare the financial statements included in this filing:
| U.S. GAAP x | International Financial Reporting Standards as issued | Other ¨ |
| | by the International Accounting Standards Board ¨ | |
If this is an annual report, indicate by check mark whether the registrant is a shell company (as defined in Rule 12b-2 of the Exchange Act). Yes¨ Nox
(APPLICABLE ONLY TO ISSUERS INVOLVED IN BANKRUPTCY PROCEEDINGS DURING THE PAST FIVE YEARS)
Indicate by check mark whether the registrant has filed all documents and reports required to be filed by Sections 12, 13 or 15(d) of the Securities Exchange Act of 1934 subsequent to the distribution of securities under a plan confirmed by a court. Yesx No¨
TABLE OF CONTENTS
PART I
Unless otherwise specified, “Catalyst”, the “Company”, the “Corporation”, “we”, “us”, “our” and similar terms refer to Catalyst Paper Corporation and its subsidiaries and affiliates. Unless otherwise indicated, all dollar amounts are expressed in Canadian dollars, references to “$” and “dollars” are to Canadian dollars and references to “U.S.$” and “U.S. dollars” are to United States dollars. As used in this annual report references to “tonnes” means metric tonnes, which is equivalent to 1,000 kilograms or 2,204 pounds (1.1023 tons) and the term “ton”, or the symbol “ST”, refers to a short ton, an imperial unit of measurement equal to 0.9072 metric tonnes.
| ITEM 1 | IDENTITY OF DIRECTORS, SENIOR MANAGEMENT, ADVISERS AND AUDITORS |
| A. | Directors and Senior Management |
Information not required for an annual report.
Information not required for an annual report.
Information not required for an annual report.
| ITEM 2 | OFFER STATISTICS AND EXPECTED TIMETABLE |
Information not required for an annual report.
Cautionary Statement with Regard to Forward-Looking Statements
This annual report contains forward-looking statements within the meaning of the U.S. Private Securities Litigation Reform Act of 1995 and forward-looking information within the meaning of Canadian securities laws (collectively, “forward-looking statements”) including, without limitation, forward-looking statements concerning our strategy, plans, future operating performance, contingent liabilities and outlook. These statements relate to, among other things, analyses and other information that are based on forecasts of future results, estimates of amounts not yet determinable and assumptions of management.
Generally, forward-looking statements can be identified by the use of words or phrases such as “expects,” “anticipates,” “plans,” “projects,” “estimates,” “assumes,” “intends,” “strategy,” “goals,” “objectives,” “potential,” or variations thereof, or stating that certain actions, events or results “may,” “could,” “would,” “might” or “will” be taken, occur or be achieved, or the negative of any of these terms or similar expressions. These forward-looking statements are subject to a variety of known and unknown risks, uncertainties and other factors that could cause actual events or results to differ from those expressed or implied, including, without limitation, the following risks and uncertainties discussed in this annual report and in Management’s Discussion and Analysis for the financial year-ended December 31, 2015, which may be found on SEDAR atwww.sedar.com and EDGAR atwww.sec.gov:
Various market, environmental, financial and human resource risks related to the recent acquisition of the Biron and Rumford paper mills in the United States;
Supply interruptions which may occur due to reliance by the Biron paper mill on the Wisconsin Rapids pulp and paper mill and the Lake States Wood Supply Group;
Uncertainty related to our ability to successfully integrate the recently acquired Biron and Rumford paper mills into our operations;
| · | Our inability to generate sufficient cash to service all our indebtedness; |
| · | Risks related to our level of indebtedness which may limit our financial and operating activities; |
| · | The limited trading market for our common shares; |
| · | Fluctuations in the demand and market price for our products; |
| · | The impact that media trends may have on demand for our products; |
| · | Fluctuations in foreign exchange rates; |
| · | The effects of competition from domestic and foreign producers; |
| · | Risks related to the international sale of our products; |
| · | Fluctuations in the cost and supply of wood fibre; |
| · | Dependence on the supply of certain raw materials; |
| · | The effect of future losses on our liquidity and ongoing operations; |
| · | Uncertainty relating to labour relations; |
| · | Dependence on third party transportation providers; |
| · | The impact on our operations of aboriginal land claims in Canada; |
| · | The impact of increases in energy costs on our business; |
| · | Costs which may be necessary for us to incur in order to comply with environmental laws and regulations; |
| · | The impact on our business of equipment failures and the need to increase capital and maintenance expenditures; |
| · | Failure of certain customers to pay us promptly and in full under the credit terms that we extend to them; |
| · | The retention of certain qualified management personnel; |
| · | Limitations and exclusions contained in our insurance policies; |
| · | Risks related to natural disasters in regions where our mills are located; |
| · | The impact of our benefit pensions plans and other post-retirement benefit plans on our financial condition; and |
| · | The impact of a change in legal control. |
This list is not exhaustive of the factors that may affect any of our forward-looking statements. Our forward-looking statements are based on what management considers to be reasonable assumptions, beliefs, expectations and opinions based on information currently available to management. We cannot assure you that actual events, performance or results will be consistent with these forward-looking statements, and management’s assumptions may prove to be incorrect.
Assumptions have been made with respect to our forward-looking statements, including those identified below, which could prove to be significantly incorrect:
| · | Our ability to develop, manufacture and sell new products and services that meet the needs of our customers and gain commercial acceptance; |
| · | Our ability to continue to sell our products and services in the expected quantities at the expected prices and expected times; |
| · | Our ability to successfully obtain cost savings from our cost reduction initiatives; |
| · | Our ability to successfully integrate the recently acquired Biron and Rumford mills into our operations; |
| · | Our ability to implement business strategies and pursue opportunities; |
| · | Expected cost of goods sold; |
| · | Expected component supply costs and constraints; and |
| · | Expected foreign exchange and tax rates. |
You are cautioned that the foregoing list is not exhaustive of all factors and assumptions which may have been used. Our forward-looking statements reflect current expectations regarding future events and operating performance and speak only as of the date hereof and we do not assume any obligation to update forward-looking statements if circumstances or management’s beliefs, expectations or opinions should change other than as required by applicable law. For the reasons set forth above, you should not place undue reliance on forward-looking statements.
Market and Industry Data and Forecast
This annual report on Form 20-F includes market share and industry data and other statistical information and forecasts that we have obtained from independent industry publications, government publications, market research reports and other published independent sources. Some data is also based on our good faith estimates, which is derived from our internal surveys, as well as independent sources. RISI, Inc., an independent paper and forest products industry research firm (“RISI”), is the source of a considerable amount of the third party industry data and forecasts contained herein. Industry publications, surveys and forecasts generally state that the information contained therein has been obtained from sources believed to be reliable. However, we cannot and do not provide any assurance as to the accuracy or completeness of included information and do not guarantee the accuracy or completeness of such information.
Forecasts are particularly likely to be inaccurate, especially over long periods of time. Although we believe these sources to be reliable, we have not independently verified any of the data nor have we ascertained the underlying economic assumptions relied upon therein.
Presentation of Financial Information
We prepare our consolidated financial statements in accordance with U.S. generally accepted accounting principles (U.S. GAAP).
In accordance with U.S. GAAP, an enterprise value was established for the Company as of September 30, 2012, the end of the quarter following the effective date of our plan of arrangement under theCompanies’ Creditors Arrangement Act(“CCAA”), under fresh start accounting. This enterprise value was determined with the assistance of an independent financial advisor. References to Successor or Successor company refer to the Company on or after September 30, 2012, and references to Predecessor or Predecessor company refer to the Company prior to September 30, 2012.
| A. | Selected Financial Data |
The following table sets forth consolidated historical financial and operating data for Catalyst Paper Corporation for the periods indicated. The financial statement data as of December 31, 2015, December 31, 2014, December 31, 2013, December 31, 2012, September 30, 2012 and December 31, 2011, for the years ended December 31, 2015, 2014 and 2013, the three months ended December 31, 2013 and nine months ended September 30, 2013, and the year ended December 31, 2011 is derived from our audited consolidated financial statements in our annual report. This information should be read in conjunction with Operating and Financial Review and Prospects, which is included inthe annual report. The financial information has been derived from consolidated financial statements that have been prepared in accordance with U.S. GAAP. All information provided below is in millions of Canadian dollars, except information related to volume, information per share, and revenue per tonne.
CONSOLIDATED STATEMENTS OF EARNINGS (LOSS) DATA
(In millions of Canadian dollars)
| | | Successor | | | Predecessor | |
| | | Year
ended December 31, | | | Three months
ended
December 31, | | | Nine months
ended
September 30, | | | Year
ended
December 31, | |
| | | 2015 | | | 2014 | | | 2013 | | | 2012 | | | 2012 | | | 2011 | |
| Sales | | $ | 1,991.1 | | | $ | 1,109.3 | | | $ | 1,051.4 | | | $ | 260.5 | | | $ | 797.7 | | | $ | 1,079.7 | |
| Operating expenses | | | | | | | | | | | | | | | | | | | | | | | | |
| Cost of sales, excluding depreciation and amortization | | | 1,882.4 | | | | 1,028.2 | | | | 970.9 | | | | 245.6 | | | | 718.0 | | | | 970.7 | |
| Depreciation and amortization | | | 61.4 | | | | 44.6 | | | | 47.0 | | | | 12.9 | | | | 23.4 | | | | 105.5 | |
| Selling, general and administrative | | | 58.2 | | | | 33.0 | | | | 33.2 | | | | 7.7 | | | | 26.2 | | | | 40.3 | |
| Restructuring and change-of-control | | | 1.8 | | | | 0.5 | | | | 1.2 | | | | – | | | | 5.3 | | | | 5.9 | |
| Impairment and other closure costs | | | – | | | | 16.5 | | | | 86.9 | | | | – | | | | – | | | | 661.8 | |
| | | | 2,003.8 | | | | 1,122.8 | | | | 1,139.2 | | | | 266.2 | | | | 772.9 | | | | 1,784.2 | |
| Operating earnings (loss) | | | (12.7 | ) | | | (13.5 | ) | | | (87.8 | ) | | | (5.7 | ) | | | 24.8 | | | | (704.5 | ) |
| Interest expense, net | | | (49.4 | ) | | | (35.5 | ) | | | (37.4 | ) | | | (11.6 | ) | | | (60.3 | ) | | | (73.2 | ) |
| Foreign exchange gain (loss) on long-term debt | | | (57.7 | ) | | | (24.1 | ) | | | (18.8 | ) | | | (3.2 | ) | | | 24.0 | | | | (9.7 | ) |
| Other income (expense), net | | | 43.0 | | | | 1.2 | | | | 14.9 | | | | 0.1 | | | | (2.6 | ) | | | (2.1 | ) |
| Loss before reorganization items and income taxes | | | (76.8 | ) | | | (71.9 | ) | | | (129.1 | ) | | | (20.4 | ) | | | (14.1 | ) | | | (789.5 | ) |
| Reorganization items, net | | | – | | | | – | | | | (1.2 | ) | | | (3.2 | ) | | | 666.9 | | | | – | |
| Income (loss) before income taxes | | | (76.8 | ) | | | (71.9 | ) | | | (130.3 | ) | | | (23.6 | ) | | | 652.8 | | | | (789.5 | ) |
| Income tax expense (recovery) | | | (27.4 | ) | | | 0.4 | | | | 0.1 | | | | 0.2 | | | | (1.1 | ) | | | (8.4 | ) |
| Earnings (loss) from continuing operations | | | (49.4 | ) | | | (72.3 | ) | | | (130.4 | ) | | | (23.8 | ) | | | 653.9 | | | | (781.1 | ) |
| Gain (loss) from discontinued operations net of tax | | | – | | | | – | | | | 3.1 | | | | (12.9 | ) | | | (3.6 | ) | | | (195.5 | ) |
| Net earnings (loss) | | | (49.4 | ) | | | (72.3 | ) | | | (127.3 | ) | | | (36.7 | ) | | | 650.3 | | | | (976.6 | ) |
| Net (earnings) loss attributable to non-controlling interest | | | – | | | | – | | | | (0.3 | ) | | | 1.5 | | | | (31.9 | ) | | | 2.6 | |
| Net earnings (loss) attributable to the Company | | $ | (49.4 | ) | | $ | (72.3 | ) | | $ | (127.6 | ) | | $ | (35.2 | ) | | $ | 618.4 | | | $ | (974.0 | ) |
CONSOLIDATED BALANCE SHEET DATA
(In millions of Canadian dollars)
| | | Successor | | | Predecessor | |
| | | As at
December 31, | | | As at
September 30, | | | As at
December 31, | |
| | | 2015 | | | 2014 | | | 2013 | | | 2012 | | | 2012 | | | 2011 | |
| Working Capital1 | | $ | 210.6 | | | $ | 144.6 | | | $ | 153.6 | | | $ | 151.4 | | | $ | 203.7 | | | $ | 152.4 | |
| Property, plant and equipment | | | 456.9 | | | | 379.3 | | | | 412.2 | | | | 611.6 | | | | 614.1 | | | | 386.3 | |
| Total Assets | | | 919.1 | | | | 668.7 | | | | 700.1 | | | | 978.8 | | | | 1040.1 | | | | 737.6 | |
| Current portion of long-term debt | | | 3.2 | | | | 3.0 | | | | 2.0 | | | | 6.6 | | | | 6.7 | | | | 466.8 | |
| Total debt1 | | | 497.8 | | | | 329.1 | | | | 303.8 | | | | 428.6 | | | | 465.6 | | | | 842.3 | |
| Shareholders’ equity (deficiency) | | | (116.7 | ) | | | (95.6 | ) | | | 12.9 | | | | 116.3 | | | | 144.9 | | | | (593.6 | ) |
CONSOLIDATED STATEMENTS OF CASH FLOWS DATA
(In millions of Canadian dollars)
| | | Successor | | | Predecessor | |
| | | Year
ended December 31, | | | Three months
ended
December 31, | | | Nine months
ended
September 30, | | | Year
ended
December 31, | |
| | | 2015 | | | 2014 | | | 2013 | | | 2012 | | | 2012 | | | 2011 | |
| Cash flows provided (used) by operating activities | | $ | (6.6 | ) | | $ | 21.3 | | | $ | (7.5 | ) | | $ | 52.1 | | | $ | (44.0 | ) | | $ | (71.5 | ) |
| Cash flows provided (used) by investing activities | | | (103.4 | ) | | | (19.2 | ) | | | 31.4 | | | | (6.2 | ) | | | (3.4 | ) | | | (17.7 | ) |
| Cash flows provided (used) by financing activities | | $ | 107.4 | | | $ | (3.3 | ) | | $ | (30.3 | ) | | $ | (40.0 | ) | | $ | 34.9 | | | $ | 18.9 | |
OTHER FINANCIAL DATA
(In millions of Canadian dollars, except per tonne)
| | | Successor | | | Predecessor | |
| | | Year
ended December 31, | | | Three months
ended
December 31, | | | Nine months
ended
September 30, | | | Year ended
December 31, | |
| | | 2015 | | | 2014 | | | 2013 | | | 2012 | | | 2012 | | | 2011 | |
| Adjusted EBITDA 2 | | $ | 48.7 | | | $ | 47.6 | | | $ | 46.1 | | | $ | 7.2 | | | $ | 48.2 | | | $ | 62.8 | |
| Adjusted EBITDA margin 3 | | | 2.4 | % | | | 4.3 | % | | | 4.4 | % | | | 2.8 | % | | | 6.0 | % | | | 5.8 | % |
| Weighted average common shares outstanding (in millions) | | | 14.5 | | | | 14.5 | | | | 14.5 | | | | 14.4 | | | | 381.9 | | | | 381.9 | |
| Basic and diluted earnings (loss) per share (in dollars) | | | | | | | | | | | | | | | | | | | | | | | | |
| - Continuing operations | | $ | (3.41 | ) | | $ | (4.99 | ) | | $ | (9.01 | ) | | $ | (1.55 | ) | | $ | 1.63 | | | $ | (2.04 | ) |
| - Discontinued operations | | | – | | | | – | | | | 0.21 | | | | (0.89 | ) | | | (0.01 | ) | | | (0.51 | ) |
| Common shares outstanding at end of period (in millions) | | | 14.5 | | | | 14.5 | | | | 14.5 | | | | 14.5 | | | | 14.4 | | | | 381.9 | |
| Sales (000 tonnes) | | | | | | | | | | | | | | | | | | | | | | | | |
| Coated paper | | | 937 | | | | 194 | | | | 189 | | | | 51 | | | | 145 | | | | 179 | |
| Uncoated paper | | | 426 | | | | 508 | | | | 573 | | | | 156 | | | | 460 | | | | 659 | |
| Newsprint | | | 346 | | | | 347 | | | | 283 | | | | 66 | | | | 198 | | | | 205 | |
| Pulp | | | 345 | | | | 340 | | | | 328 | | | | 74 | | | | 251 | | | | 308 | |
| Average Sales Revenue per tonne | | | | | | | | | | | | | | | | | | | | | | | | |
| Coated paper | | | 1,103 | | | | 936 | | | | 934 | | | | 930 | | | | 909 | | | | 939 | |
| Uncoated paper | | | 898 | | | | 837 | | | | 800 | | | | 795 | | | | 808 | | | | 793 | |
| Newsprint | | | 681 | | | | 685 | | | | 679 | | | | 666 | | | | 678 | | | | 689 | |
| Pulp | | | 807 | | | | 779 | | | | 683 | | | | 604 | | | | 637 | | | | 804 | |
| Production (000 tonnes) | | | | | | | | | | | | | | | | | | | | | | | | |
| Coated paper | | | 943 | | | | 197 | | | | 191 | | | | 49 | | | | 147 | | | | 180 | |
| Uncoated paper | | | 418 | | | | 511 | | | | 580 | | | | 144 | | | | 465 | | | | 662 | |
| Newsprint | | | 343 | | | | 352 | | | | 289 | | | | 65 | | | | 200 | | | | 208 | |
| Pulp | | | 345 | | | | 344 | | | | 323 | | | | 75 | | | | 243 | | | | 315 | |
Notes to Selected Consolidated Financial Information
| 1 | Current portion of long term debt is included in total debt and excluded from working capital. |
| 2 | Adjusted EBITDA is a non-GAAP measure. Adjusted EBITDA does not have a standardized meaning. Adjusted EBITDA as set forth above represents net earnings (loss) before net interest expense, income taxes, depreciation and amortization and impairment, foreign exchange gain (loss) on long-term debt, loss on repayment of long-term debt, other income (expense), and non-controlling interests. We focus on adjusted EBITDA as we believe this measure enables comparison of our results between periods without regard to debt service, income taxes and capital expenditure requirements. Adjusted EBITDA is also useful in analyzing our ability to comply with our debt covenants. As such, we believe it would be useful for investors and other users to be aware of this measure so they can better assess our operating performance. Adjusted EBITDA should not be considered by an investor as an alternative to net income, an indicator of our financial performance or an alternative to cash flows as a measure of liquidity. As there are no generally accepted methods for calculating adjusted EBITDA, this measure as calculated by us might not be comparable to similarly titled measures reported by other companies. |
| 3 | Adjusted EBITDA margin is defined as adjusted EBITDA as a percentage of sales. |
We have provided below a reconciliation of adjusted EBITDA to net earnings (loss) attributable to the Company, which we believe is the most directly comparable U.S. GAAP measure.
| (In millions of dollars) | | 2011 | | | 2012 | | | 2013 | | | 2014 | | | 2015 | |
| Net earnings (loss) attributable to the Company | | $ | (974.0 | ) | | $ | 583.2 | | | $ | (127.6 | ) | | $ | (72.3 | ) | | $ | (49.4 | ) |
| Net earnings (loss) attributable to non-controlling interest | | | (2.6 | ) | | | 30.4 | | | | 0.3 | | | | – | | | | – | |
| Net earnings (loss) | | | (976.6 | ) | | | 613.6 | | | | (127.3 | ) | | | (72.3 | ) | | | (49.4 | ) |
| Depreciation and amortization | | | 105.5 | | | | 36.3 | | | | 47.0 | | | | 44.6 | | | | 61.4 | |
| Impairment | | | 661.8 | | | | – | | | | 86.9 | | | | 16.5 | | | | – | |
| Foreign exchange (gain) loss on long-term debt | | | 9.7 | | | | (20.8 | ) | | | 18.8 | | | | 24.1 | | | | 57.7 | |
| Bargain purchase gain | | | – | | | | – | | | | – | | | | – | | | | (43.9 | ) |
| Loss on Powell River fire | | | 2.4 | | | | – | | | | – | | | | – | | | | – | |
| Other (income) expense, net | | | (0.3 | ) | | | 2.5 | | | | (14.9 | ) | | | (1.2 | ) | | | 0.9 | |
| Interest expense, net | | | 73.2 | | | | 71.9 | | | | 37.4 | | | | 35.5 | | | | 49.4 | |
| Income tax expense (recovery) | | | (8.4 | ) | | | (0.9 | ) | | | 0.1 | | | | 0.4 | | | | (27.4 | ) |
| Reorganization items, net | | | – | | | | (663.7 | ) | | | 1.2 | | | | – | | | | – | |
| (Earnings) loss from discontinued operations, net of tax | | | 195.5 | | | | 16.5 | | | | (3.1 | ) | | | – | | | | – | |
| Adjusted EBITDA 1 | | $ | 62.8 | | | $ | 55.4 | | | $ | 46.1 | | | $ | 47.6 | | | $ | 48.7 | |
| 1 | Adjusted EBITDA is a non-GAAP measure. Adjusted EBITDA does not have a standardized meaning. Adjusted EBITDA as set forth above represents net earnings (loss) before net interest expense, income taxes, depreciation and amortization and impairment, foreign exchange gain (loss) on long-term debt, loss on repayment of long-term debt, other income (expense), and non-controlling interests. We focus on adjusted EBITDA as we believe this measure enables comparison of our results between periods without regard to debt service, income taxes and capital expenditure requirements. Adjusted EBITDA is also useful in analyzing our ability to comply with our debt covenants. As such, we believe it would be useful for investors and other users to be aware of this measure so they can better assess our operating performance. Adjusted EBITDA should not be considered by an investor as an alternative to net income, an indicator of our financial performance or an alternative to cash flows as a measure of liquidity. As there are no generally accepted methods for calculating adjusted EBITDA, this measure as calculated by us might not be comparable to similarly titled measures reported by other companies. |
Exchange Rate Data
Bank of Canada
The following table sets forth certain exchange rates based upon the noon rate as quoted by the Bank of Canada. Such rates are set forth as, for the period indicated, U.S. dollars per Canadian $1.00. On March 3, 2016, the noon rate was 0.7459 U.S. dollars per Canadian $1.00.
| | | 2010 | | | 2011 | | | 2012 | | | 2013 | | | 2014 | | | 2015 | |
| | | | | | | | | | | | | | | | | | | |
| Low | | | 0.9278 | | | | 0.9430 | | | | 0.9599 | | | | 0.9348 | | | | 0.8589 | | | | 0.7148 | |
| High | | | 1.0054 | | | | 1.0583 | | | | 1.0299 | | | | 1.0164 | | | | 0.9422 | | | | 0.7485 | |
| Period-end | | | 1.0054 | | | | 0.9833 | | | | 1.0051 | | | | 0.9402 | | | | 0.8620 | | | | 0.7225 | |
| Average rate 1 | | | 0.9710 | | | | 1.0110 | | | | 1.0004 | | | | 0.9710 | | | | 0.9054 | | | | 0.7820 | |
| | | 2015 | | | 2016 | |
| | | September | | | October | | | November | | | December | | | January | | | February | |
| Low | | | 0.7455 | | | | 0.7552 | | | | 0.7485 | | | | 0.7148 | | | | 0.6854 | | | | 0.7123 | |
| High | | | 0.7606 | | | | 0.7750 | | | | 0.7637 | | | | 0.7485 | | | | 0.7159 | | | | 0.7395 | |
| Period-end | | | 0.7466 | | | | 0.7644 | | | | 0.7500 | | | | 0.7225 | | | | 0.7102 | | | | 0.7395 | |
| Average rate 1 | | | 0.7538 | | | | 0.7650 | | | | 0.7530 | | | | 0.7297 | | | | 0.7031 | | | | 0.7248 | |
| 1 | The average rate is derived by taking the average of the noon rate for each business day during the relevant period. |
| B. | Capitalization and Indebtedness |
Information not required for an annual report.
| C. | Reasons for the Offer and Use of Proceeds |
Information not required for an annual report.
We face risks and uncertainties which fall into the general business areas of markets, international commodity prices, currency exchange rates, environmental issues, fibre supply, government regulation and policy and, for Canadian companies, trade barriers and potential impacts of Aboriginal rights, including unresolved Aboriginal land claims in British Columbia.
In order to address our business risks and effectively manage them, we have developed a process for managing risk and the interrelationship risks have with our strategic plan. We provide regular updates to the Audit Committee, work with corporate and operational management to identify, measure, and prioritize the critical risks facing the Company and manage these risks by ensuring that they are adequately addressed through mitigating procedures where appropriate. The objectives of the risk-management function include developing a common framework for understanding what constitutes principal business risks, ensuring that risk management activities are aligned with business strategies, and providing an effective mechanism for governance in the area of risk management.
The recent acquisition of two U.S. paper mills exposes the Company to market, environmental, financial and human resource risks
The completion of the acquisition of the Biron paper mill located in Wisconsin and the Rumford paper and pulp mill located in Maine, USA has significantly increased Catalyst Paper’s operations, specialty paper market share, environmental footprint and supply requirements and significantly increases our operations in the United States. The acquisition exposes us to various risks, some of which are general in nature and some of which are unique to the operations of these mills, the regions they are located in, and the markets they sell their product to.
Key risks include but are not limited to:
| · | ongoing decline in coated paper markets due to general weakness in North American and international demand and due to market share lost to lower cost product alternatives, |
| · | erosion of future profitability due to general inflation and regional price pressure on fibre and energy, |
| · | the introduction of onerous environmental laws and regulations that may impose restrictions on our operations and processes, |
| · | potential environmental and labour claims that may arise from circumstances not currently identified, including but not limited to instances of site contamination and labour grievances, |
| · | unexpected delays in production and major maintenance events may negatively impact operations, customer service and costs, |
| · | breakdowns, obsolescence and impairment of long-lived assets, parts and supplies may negatively impact operations, customer service and costs, |
| · | potential labour unrest may negatively impact operations, customer service and costs, |
| · | delays and unexpected costs associated with post-acquisition activities including transition, integration and system separation may negatively impact liquidity, free cash flow and future profitability, |
| · | unexpected issues with the assignment of supply agreements or credit terms with vendors may negatively impact operations, customer service and costs, |
| · | actual results falling short of earnings projections and synergies identified by management may negatively impact to liquidity, free cash flow and future profitability, and |
| · | management not having the capacity to complete an orderly transition and integration of the U.S. mills while simultaneously operating the Canadian mills. |
Reliance by the Biron paper mill on the Wisconsin Rapids pulp and paper mill and the Lake States Wood Supply Group may result in supply interruption
The newly acquired Biron paper mill is a semi-integrated mill that is connected by way of three subterranean tunnels to Verso Corporation’s Wisconsin Rapids pulp and paper mill. Biron currently relies on the Wisconsin Rapids mill for the supply of softwood kraft pulp which is required to produce Biron’s coated mechanical paper products. Biron also relies on the Wisconsin Rapids mill for waste transfer and treatment services, including the landfilling of flyash generated by Biron’s power boilers and the treatment of process water by the Water Quality Center which is owned and operated by the Wisconsin Rapids mill. Wood is currently being purchased for the Biron mill by the Lake States Wood Supply Group which buys wood for a number of other regional mills that are owned and operated by Verso Corporation. An extended interruption in the supply of softwood kraft pulp or waste treatment services by the Wisconsin Rapids mill, or an interruption in wood supply by the Lake States Wood Supply Group, could have adverse consequences to our operations, customer service and costs. We have entered into agreements with Verso Corporation related to the supply of these goods and services that contain provisions and remedies that are intended to mitigate material losses due to extended supply interruptions. The recent Chapter 11 bankruptcy filings of both Verso Corporation and its affiliate, NewPage Corporation, could potentially have an adverse impact on such arrangements, however, other viable market options would be available to us.
We may not be able to successfully integrate the recently acquired U.S. paper mills into our operations
Any acquisition is accompanied by risks. For example, there may be significant change in commodity prices after we have committed to complete the transaction; we may have difficulty integrating and assimilating the operations and personnel of any acquired companies, realizing anticipated synergies and maximizing the final and strategic position of the combined enterprise, and maintaining uniform standards, policies and controls across the organization; and the acquired business or assets may have unknown liabilities which may be significant. The success of our acquisition will depend upon our ability to effectively manage the integration and operations of properties or assets we acquired and to realize anticipated benefits. The process of managing acquired businesses may involve unforeseen difficulties and may require a disproportionate amount of management resources, which may divert management’s focus and resources from other strategic opportunities and from operational matters during this process. There can be no assurance that we will be able to successfully manage the integration and operations of the businesses or assets we acquire.
There is a risk that our systems, procedures and controls will not be adequate to support the expansion of our operations resulting from the acquisition of the Biron paper mill located in Wisconsin and the Rumford paper and pulp mill located in Maine, USA. Our future operating results could be affected by the ability of our officers and key employees to manage the changing business conditions and to integrate the Biron paper mill and the Rumford paper and pulp mill operations into our own. No assurance can be given that the acquisition of the Biron paper mill and the Rumford paper and pulp mill will result in the anticipated benefits expected from the acquisition. In addition, there may be liabilities, such as environmental liabilities, that we have failed to discover or have underestimated in connection with the acquisition. There may also be capital expenditure requirements that we have failed to discover or underestimated in connection with the acquisition, which amounts may be material. Any such liabilities or capital expenditure requirements could have a material adverse effect on our business, financial condition or future prospects.
We may not be able to generate sufficient cash to service all of our indebtedness and may be forced to take other actions to satisfy our obligations under our indebtedness, which may not be successful
Our ability to service our debt obligations or to refinance our debt obligations depends on our financial condition and operating performance, which are subject to prevailing economic and competitive conditions and certain financial, business, legislative, regulatory and other factors beyond our control. We may not be able to maintain the required level of cash flows from operating activities sufficient to permit us to fund our day-to-day operations or to pay the principal, premium, if any, and interest on our indebtedness.
If our cash flows and capital resources are insufficient to fund our debt service obligations, we could face substantial liquidity problems and could be forced to reduce or delay capital expenditures or to sell assets or operations, seek additional capital or restructure or refinance our indebtedness. We may not be able to affect any such alternative measures, if necessary, on commercially reasonable terms or at all and, even if successful, such alternative actions may not allow us to meet our scheduled debt service obligations. The credit agreements that govern the ABL Facility and a US $20.0 million loan that matures on July 31, 2017 (“Term Loan”) and the indentures that govern our PIK Toggle Senior Secured Notes due 2017 (“2017 Notes”), including the PIK Toggle Senior Secured Notes due 2017 with a principal amount of US $25.0 million (“Offered Notes”) restrict our ability to dispose of assets and use the proceeds from any such dispositions and may also restrict our ability to raise debt or equity capital to be used to repay other indebtedness when it becomes due. We may not be able to consummate those dispositions or obtain proceeds in an amount sufficient to meet debt service obligations when due. Our inability to generate sufficient cash flows to satisfy our debt obligations, or to refinance our indebtedness on commercially reasonable terms or at all, would materially and adversely affect our financial position and results of operations and our ability to satisfy our obligations under the 2017 Notes (including the Offered Notes), the Term Loan and the ABL Facility.
If we cannot service our debt obligations, we will be in default and as a result, holders of the 2017 Notes could declare all outstanding principal and interest to be due and payable, the lenders under the ABL Facility and Term Loan could terminate their commitments to loan money, our secured lenders could foreclose against the assets securing such borrowings and we could be forced into bankruptcy or liquidation.
Our degree of leverage may limit our financial and operating activities
Our historical capital requirements have been considerable and our future capital requirements could vary significantly and may be affected by general economic conditions, wood fibre supply, currency exchange rates, industry trends, performance, interest rates and many other factors that are not within our control. Subject to the limits contained in the credit agreements that governs the ABL Facility and Term Loan and the indentures that govern the 2017 Notes (including the Offered Notes), we may be able to incur additional debt from time to time to finance working capital, capital expenditures, investments or acquisitions, or for other purposes. If we do so, the risks related to our high level of debt could intensify. Our substantial level of indebtedness has had in the past, and could have in the future, important consequences, including the following:
| · | making it more difficult for us to satisfy our obligations with respect to our debt, |
| · | limiting our ability to obtain additional financing to fund future working capital, capital expenditures, product developments, acquisitions or other general corporate requirements, |
| · | requiring a substantial portion of our cash flows to be dedicated to debt service payments instead of other purposes, thereby reducing the amount of cash flows available for working capital, capital expenditures and other general corporate purposes, |
| · | increasing our vulnerability to general adverse economic and industry conditions, |
| · | exposing us to the risk of increased interest rates as certain of our borrowings including our borrowings under the ABL Facility are at variable rates of interest, |
| · | limiting our flexibility in planning for and reacting to changes in our industry, |
| · | placing us at a disadvantage compared to other, less leveraged competitors, and |
| · | increasing our cost of borrowing. |
There is a limited trading market for the Company’s common shares
Although our common shares are listed on the Toronto Stock Exchange (“TSX”), certain holders of common shares may also be creditors of the Company and there is no certainty of a viable trading market for the common shares. The potential lack of liquidity for the common shares may make it more difficult for us to raise additional capital, if necessary, and it may affect the price volatility of the common shares. There can also be no assurance that a holder will be able to sell its common shares at a particular time or that the prices such holder receives when it sells will be favorable. Future trading prices of the common shares will depend on many factors, including our operating performance and financial condition.
Certain holders of common shares may also be creditors of the Company and may seek to dispose of such securities to obtain liquidity. Such sales could cause the trading prices for these securities to be depressed. Further, the possibility that the holders of common shares may determine to sell all or a large portion of their shares in a short period of time may adversely affect the market price of the common shares.
Our business is of a cyclical nature and demand for our products may fluctuate significantly
The markets for pulp and paper products are highly cyclical and are characterized by periods of excess product supply due to many factors, including additions to industry capacity, increased industry production, structural changes in the industry, periods of weak demand due to weak general economic activity or other causes, and reduced inventory levels maintained by customers.
Demand for forest products generally correlates to global economic conditions. Demand for pulp and paper products in particular is driven primarily by levels of advertising. In periods of economic weakness, reduced spending by consumers and businesses results in decreased demand for forest products, causing lower product prices and possible manufacturing downtime. The North American newsprint and directory paper market is mature with demand for newsprint declining significantly in the last five years.
We believe these declines in newsprint and directory paper demand will continue long term, although we have the ability to partially mitigate the impact by switching production from newsprint and directory paper to other paper grades. Demand for our products is traditionally weaker in the first half of the year.
As at December 31, 2015, one of the paper machines at our Crofton mill continues to be indefinitely curtailed. On December 15, 2014, we indefinitely curtailed Paper Machine No. 9 at Powell River due to a lack of orders and a declining market for the paper manufactured on No. 9. On September 1, 2015, we indefinitely curtailed Paper Machine No. 12 at Rumford due to a lack of orders and a declining market for the coated paper manufactured on No. 12. Should demand for our products weaken, additional indefinite or periodic production curtailments may be required, which could have an adverse impact on our financial condition and ability to generate sufficient cash flows to satisfy our operational needs and debt service requirements.
We operate in a commodity market where prices may fluctuate significantly
The pulp and paper industry is a commodity market in which producers compete primarily on the basis of price. Prices for our products have fluctuated significantly in the past and may fluctuate significantly in the future, principally as a result of market conditions of supply and demand, as well as changes in exchange rates. Our earnings are sensitive to price changes for our principal products, with the effect of price changes on newsprint and mechanical specialty printing paper grades being the greatest. Market prices for our products typically are not directly affected by input costs or other costs of sales and, consequently, we have limited ability to pass through increases in operating costs to our customers without an increase in market prices. Even though our costs may increase, our customers may not accept price increases for our products or the prices for our products may decline. As our financial performance is principally dependent on the prices we receive for our products, prolonged periods of low prices, customer refusal to accept announced price increases, or significant cost increases that cannot be passed on in product prices may be materially adverse to us.
Media trends may lead to continued declines in demand for our products
Trends in advertising, Internet use and electronic data transmission and storage have had and continue to have adverse effects on traditional print media. As our newsprint, telephone directory and retail customers increase their use of other forms of media and advertising, demand for our newsprint, uncoated mechanical and coated mechanical papers may continue to decline on a long-term basis.
We are subject to exchange rate fluctuations
Nearly all of our sales are based upon prices set in U.S. dollars, while a substantial portion of our costs and expenses are incurred in Canadian dollars and our results of operations and financial condition are reported in Canadian dollars. The acquisition on January 7, 2015 of the U.S. paper mills will continue to further increase the Company’s U.S. dollar exposure on sales and costs. Increases in the value of the Canadian dollar relative to the U.S. dollar reduce the amount of revenue in Canadian dollar terms from sales made in U.S. dollars, and would reduce cash flow available to fund operations and debt service obligations.
Since we have debt denominated in U.S. dollars including our 2017 Notes (including the Offered Notes), our reported earnings could fluctuate materially as a result of exchange rates given that changes in the value of the Canadian dollar against the U.S. dollar during a given financial reporting period result in a foreign currency gain or loss on the translation of U.S. dollar cash and debt into Canadian currency.
We manage a part of our currency exposure through the use of currency options and forward contracts to hedge anticipated future sales denominated in foreign currencies and U.S. dollar denominated debt. However, no assurance can be made that we will engage in any hedging transactions or, if we decide to engage in any such transactions, that we will be successful in eliminating or mitigating currency exchange risks.
We face significant global competition
We compete with American, European and Asian producers in highly competitive global markets. Some of our competitors are larger and can accordingly achieve greater economies of scale, some have greater financial resources and some operate mills in locations that have lower energy, furnish or labour costs or have less stringent environmental and governmental regulations than the locations where we operate.
Our ability to compete is also affected by the quality of our products and customer service and our ability to maintain high plant efficiencies and operating rates and to control our manufacturing costs. If we were unable to compete effectively, there may be a materially adverse impact on our business.
We face risks related to our international sales
A significant portion of our sales are outside of Canada and the United States. For the year of 2015, 84% of our pulp sales and 16% of our paper sales were international. These international sales result in additional risks including restrictive government actions (including trade quotas, tariffs and other trade barriers and currency restrictions), local labour laws and regulations, the need to comply with multiple and potentially conflicting laws and regulations, unfavourable national or regional business conditions or political or economic instability in some of these jurisdictions, higher transportation costs and difficulty in obtaining distribution and sales support.
We export a significant quantity of a super calendered paper (“SC paper”) from Canada to the United States. On December 10, 2015, the U.S. Department of Commerce (“DOC”) issued its Final Order to impose countervailing duties on Canadian imports of SC paper from Catalyst Paper and three other Canadian SC paper producers. Catalyst was assigned an “all-others” countervailing duty rate of 18.85%, the weighted average rate of the two companies for whom individual investigations were conducted. The imposition of countervailing duties may negatively impact the profitability of SC paper exports into the United States and our ability to compete against U.S. producers of SC paper. On December 15, 2015, the Company filed a request for the DOC to initiate an expedited review pursuant to which the DOC would examine the countervailing duty order on SC Paper specifically with respect to Catalyst. On February 8, 2016, the DOC published its notice initiating the requested expedited review.
We are exposed to fluctuations in the cost and supply of wood fibre
We have no significant timber holdings and are dependent on third parties for the supply of wood fibre required for our paper manufacturing operations.
For our B.C. operations, approximately 70% of our fibre is provided by five suppliers. Our fibre supply could be reduced as a result of events beyond our control, including industrial disputes, natural disasters and material curtailments and shutdown of operations by suppliers for market or other reasons. Market-related curtailments or shutdowns can be influenced by both seasonal and cyclical factors, such as raw material availability, finished goods inventory levels, interest rates and demand for lumber. Weakness in the U.S. housing market could lead to production curtailment for B.C. lumber producers and result in a reduction in residual fibre supply available to us. We source a significant quantity of our fibre from the interior of B.C. The current mountain pine beetle infestation in the B.C. interior is expected to reduce the long-term fibre supply in the B.C. interior and could have a significant impact on the availability, quality and cost of fibre.
As it relates to the newly acquired U.S. paper mills, fibre suppliers in the region are significantly less concentrated than our B.C. operations, with the top five suppliers for each respective mill providing 47% of fibre at the Rumford mill and 18% of fibre at the Biron mill. For the Biron mill, which currently relies on the Lake States Wood Supply Group for its wood supply, wood supply interruption is a potential risk in 2016 along with the other regional mills owned by Verso Corporation, if the region experiences a challenging late winter or longer winter break-up period given the very low inventories at the Biron mill and.
For our B.C. operations, approximately 70% of our fibre is sourced under long-term fibre agreements with third parties with pricing based on market prices or on prices determined under market-based formulas. For our newly acquired U.S. operations, approximately 98% is sourced directly from third parties with the remaining 2% sourced from short term stumpage purchases.
Given that the market price for fibre varies due to external factors, there is a risk that we will not continue to have access to wood fibre at previous levels or pricing.
Aboriginal groups have claimed aboriginal title over substantial portions of B.C.’s timberlands, including areas where the forest tenures held by our suppliers are located. Although the renewal of forest tenures held by our suppliers may be adversely affected by claims of aboriginal title, the specific impact cannot be estimated at this time.
We are dependent on the supply of certain raw materials
In addition to wood fibre, we are dependent on the supply of certain chemicals and raw materials used in our manufacturing processes. Any material disruption in the supply of these chemicals or raw materials could affect our ability to meet customer demand in a timely manner and harm our reputation, and any material increase in the cost of these chemicals or other raw materials could negatively affect our business and the results of our operations.
We have incurred losses in recent periods and may incur losses in the future that may affect liquidity and ongoing operations
As of December 31, 2015, we had recorded net losses in 11 of the last 12 quarters. These losses were driven by reduced prices, weak market demand, production curtailments, general inflationary pressure and increased input costs and, until recently, a strong Canadian dollar. Should we be unable to return to sustained profitability, cash generated through operations may be insufficient to meet operating cash requirements, requiring increased reliance on the ABL Facility to fund operating costs. If sufficient funding is not available under the ABL Facility, then additional funding sources may be required and there is no assurance that we will be able to access additional funding sources on favourable terms or at all to meet our cash requirements. The failure to obtain such funding could adversely affect our operations and our ability to maintain compliance with covenants under the ABL Facility, the 2017 Notes, and the Term Loan. While the acquisition on January 7, 2015 of the U.S. paper mills will provide additional sources of income, the operation of these newly acquired mills and the related transition and integration activities may place additional pressure on future liquidity.
Labour disruptions could have a negative impact on our business
Labour disruptions could occur and have a negative impact on our business. In Canada, our labour agreements with Unifor and Public and Private Works of Canada (“PPWC”) for our manufacturing facilities expire on April 30, 2017 and the labour agreement with Unifor for our distribution facility expires on March 31, 2019. In the United States, our labour agreements with the unions located in our Biron, Wisconsin manufacturing facilities expire on March 31, 2018 while the agreements with the unions in our Rumford, Maine facility expire on June 30, 2018.
We are dependent on third party transportation providers
We are dependent on third party service providers for the transportation of our raw materials and products by rail, truck, barge or ship. Material disruptions in the operations of our transportation service providers due to weather, seasonal impacts, labour disruptions or other factors could negatively affect our ability to meet customer demand in a timely manner and result in increased costs and a material adverse impact on our business, the results of our operations and reputation.
Claims of aboriginal title and rights in Canada may affect our operations
The ability to operate our mills in Canada may be affected by claims of aboriginal rights and title by aboriginal groups. The governments of Canada and B.C. have established a formal process to negotiate settlements with aboriginal groups throughout B.C. in order to resolve these land claims. It is the policy of the governments that ownership of lands held in fee simple by third parties (such as us) will not be affected by treaty negotiations. The Powell River mill site has been included in areas to which an aboriginal group has asserted aboriginal title both through treaty negotiations with government and by commencing an action in 2005 in the Supreme Court of B.C. While we and other industrial companies have been named as parties in the court proceeding along with the governments of Canada and B.C., counsel for the aboriginal group has advised us that the plaintiffs are currently negotiating with these two governments and have no intention of proceeding with the action at this time. Based on the history of similar proceedings, we expect that it would be many years before a final court decision could be rendered if the proceeding were pursued.
Recent Supreme Court of Canada decisions have confirmed that the governments of Canada and B.C. are obligated to consult with and, in certain circumstances, accommodate aboriginal groups whenever there is a reasonable prospect decision, such as a decision to issue or amend a regulatory permit, which may affect aboriginal groups’ rights or title. This duty of consultation and accommodation may affect our ability to obtain or amend necessary regulatory permits on a timely basis and may influence the conditions set out in such permits.
On January 22, 2016, a Notice of Civil Claim was filed jointly by the Halalt, Sunvault Energy Inc., and Aboriginal Power Corp., alleging that Catalyst disclosed certain confidential information pertaining to a proposed anaerobic digester facility in breach of a confidentiality agreement. The claim brought against Catalyst by the Halalt and its partner, Sunvault, relates to a long-term joint venture biomass project at the Crofton mill that the Halalt proposed to Catalyst. Aboriginal Power Corp. is an affiliated entity of both Sunvault and the Halalt. Catalyst was concurrently evaluating a distinctly different proposal by another party.
Ultimately, Catalyst decided not to proceed with either joint-venture proposal.
After informing the Halalt of our decision, they filed a claim against Catalyst for breach of contract in connection with the long-term joint venture biomass project proposed by the Halalt and Sunvault seeking, among other things, approximately $100 million in damages. Also on January 22, 2016, a Notice of Civil Claim was filed by the Halalt First Nation and its members alleging Catalyst has illegally trespassed on, and caused damages to, the Halalt’s asserted territories and fisheries resources through the operation of Catalyst’s Crofton Mill since 1957. The Halalt is seeking, among other things, an interim and permanent injunction restraining Catalyst from conducting its operations at the Crofton Mill that interfere with the Halalt’s claimed riparian, water and land rights and are also seeking approximately $2 billion in damages. Catalyst denies the allegations in both claims and intends to vigorously defend itself.
Increases in energy costs could have a negative impact on our business
Our operations consume a significant amount of electricity, natural gas and fuel oil. Increases in prices for these commodities can increase manufacturing costs and have an adverse impact on our business and results of our operations.
In British Columbia, although our electricity supply agreements are provincially regulated and pricing has historically been stable, B.C. Hydro and Power Authority (“B.C. Hydro”) in recent years has sought, and to some extent achieved, rate increases above historical levels. In the past three years, rate increases totaled 27% which added $30 million to our costs annually. In November 2013, the British Columbia government announced a proposed 10 year electricity plan commencing in April, 2014. Based on our 2013 electricity consumption levels, this plan could result in an increase in our electricity costs from 2013 levels totaling 27% over the first four years of the plan which results in increases in electricity costs of approximately $13 million in the first year of the plan, approximately $24 million in the second year of the plan and approximately $33 million per year in each of the next two years of the plan. If the plan is implemented in its present form, rate increases at these levels will have an impact on our earnings. We have mitigated some of the impact of rate increases in the past through reductions in usage at the highest incremental power rate and intend to further mitigate rate increases by implementing energy conservation projects and increasing our capacity to self-generate electricity. Although we are working with government and BC Hydro to identify and explore options and solutions to mitigate the effect of these increases, there can be no assurance that we will be able to eliminate or mitigate our exposure to the effect of all the rate increases.
Electricity costs in our U.S. operations are mitigated by the larger proportion of self-generation capacity. The Biron, Wisconsin mill is supplied by a regulated utility and the rates are projected to be relatively stable for this year. The mill in Rumford, Maine operates in a deregulated jurisdiction and has the capacity to generate all of its electrical needs with self-generation and effectively hedges power costs with the fuel costs for self-generation.
The U.S. operations both consume significant volumes of coal; this pricing is set in annual contracts.
Our Canadian and U.S. mills consume oil and natural gas which are purchased on spot markets and for which pricing fluctuates significantly due to various external factors. We manage our exposure to the price volatility for these fuels by using lower priced alternatives where feasible and in some circumstances through the use of financial instruments and physical supply agreements under a hedging program. There is, however, no assurance that we will be successful in eliminating or mitigating exposure to price volatility for these fuels.
We are subject to significant environmental regulation
We are subject to extensive environmental laws and regulations that impose stringent requirements on our operations, including, among other things, air emissions, liquid effluent discharges, water regulation, the storage, handling and disposal of hazardous materials and wastes, remediation of contaminated sites and landfill operation and closure obligations. It may be necessary for us to incur substantial costs to comply with such environmental laws and regulations.
Some of our operations are subject to stringent permitting requirements and from time to time we face opposition to construction or expansion of proposed facilities. We may discover currently unknown environmental liabilities in relation to our past or present operations or at our current or former facilities, or we may be faced with difficulty in obtaining project approvals in the future. These occurrences may (i) require site or other remediation costs to maintain compliance or correct violations of environmental laws and regulations, (ii) result in denial of required permits, (iii) result in government or private claims for damage to person, property or the environment, or (iv) result in civil or criminal fines and penalties or other sanctions.
On March 12, 2015, charges were laid against us by Environment and Climate Change Canada following two separate incidents that took place at the Company’s Powell River operations in September 2012. Both unrelated incidents were caused by unforeseen power failures which led to releases of cooling water and effluent, generally consisting of untreated waste water containing organic matter such as pulverized wood fibres. On December 8, 2015, Catalyst Paper and the Federal Crown made a joint recommendation to the Court pursuant to which Catalyst pleaded guilty to three counts, two related to deposits that occurred in 2012 and one in relation to a failure to take legally required samples when there was a potential deposit in 2014. In addition, the recommendation required us to pay a $15,000 fine, and a further payment of $185,000 to the Environmental Damages Fund. The Court accepted the recommendation and directed that funds be allocated by the Environmental Damages Fund for salmon habitat restoration, protection or enhancement in British Columbia. As a result of pleading guilty to the foregoing charges, under new environmental legislation expected to come into force in the first half of 2016, Catalyst would be subject to stiffer fines for subsequent such incidents and other offences.
Our Canadian operations may be affected by the regulation of greenhouse gases: The Federal government has proposed combustion appliance based standards which could come into effect in 2020 and all Canadian mills currently meet those standards with ease. British Columbia announced its goal of reducing the provincial release of greenhouse gases (“GHG”) by 33% by 2020, based on 2007 levels, with interim reduction targets of 6% by 2012 and 18% by 2016. B.C. has not issued regulations for this GHG reduction program at this time. It is too early to determine the impact on the Company under such a program.
Our U.S. operations are subject to various stringent air regulations including the U.S. Environmental Protection Agency (“EPA”). Maximum Achievable Control Technology (MACT) standards. One boiler at Biron and two at Rumford are impacted by the standard and may require capital infusion of approximately $6 million in total by end of 2016 to meet their respective deadlines of January 31, 2017. Federal authorities could revise the standard before it comes into force and the Company continues to consider all approaches to reaching compliance including fuel switching, emissions controls, and energy reduction initiatives.
Equipment failures and the need to increase capital and maintenance expenditures could have a negative impact on our business
Our business is capital intensive. Our annual capital expenditure requirements vary due to differing requirements for current maintenance, expansion, business capital and environmental compliance and future projects. We regularly carry out maintenance on our manufacturing equipment but key components may still require repair or replacement. The costs associated with such maintenance and capital expenditures or our inability to source the necessary funds to enable us to maintain or upgrade our facilities as required could have an adverse effect on our business and operations.
In addition, we may from time to time temporarily suspend operations at one or more facilities to perform necessary maintenance or carry out capital projects. These temporary suspensions could affect the ability to meet customer demand in a timely manner and adversely affect our business.
We may be subject to litigation which could result in unexpected costs and expenditure of time and resources
We may from time to time be subject to claims and litigation proceedings generally associated with commercial and employment law issues. Given that these claims are subject to many uncertainties and the inability to predict with any certainty their outcomes and financial impacts, there is no guarantee that actions that may be brought against us in the future will be resolved in our favour or covered by our insurance. Any losses from settlements or adverse judgments arising out of these claims could be materially adverse to our operations and business.
The Snowflake mill sources water from groundwater wells in the vicinity of the Little Colorado River for its process requirements. The Little Colorado River Adjudication, filed in 1978, is pending in the Superior Court of Arizona, Apache County. The purpose of this adjudication is to determine the nature, extent and relative priority, if applicable, of the water rights of all claimants to the Little Colorado River system and sources. There are more than 3,500 participants. Catalyst sold its interest in the Snowflake mill in January, 2013, and therefore, the new owner will become a party to the adjudication as a result of its acquisition of the mill. Native American tribes and the United States government contend that the Snowflake mill’s withdrawal and use of groundwater impermissibly interferes with water rights to the Little Colorado River. We dispute this contention. However, an adverse determination could result in claims for damages that may be materially adverse to us.
In addition, securities class-action litigation often has been brought against public companies following periods of volatility in the market price of their securities. It is possible that we could be the target of similar litigation in future. Securities litigation could result in substantial costs and damages and divert management’s attention and resources.
We extend trade credit to our customers and they may not pay us promptly or in full
We extend trade credit to many purchasers of our products and rely on their creditworthiness. Some of these customers operate in highly competitive, mature, cyclical or low-margin businesses and some are highly leveraged financially or are experiencing negative cash flows which may result in them needing to refinance, restructure or file for bankruptcy protection or bankruptcy. We will typically have a greater number of such customers during economic downturns. The failure of such customers to pay us promptly and in full under the credit terms we extend to them could have a material adverse impact on our operating cash flows.
We are dependent upon certain of our management personnel
The success of our operations is influenced to a significant degree by our ability to attract and retain senior management with relevant industry experience. Successful implementation of our business strategy is dependent on our ability to attract and retain our executive officers and management team. The unexpected loss of services of any key management personnel or the inability to recruit and retain qualified personnel in the future could have an adverse effect on our business and financial results.
Consumer boycotts or increases in costs due to chain-of-custody programs may adversely affectdemand for our products
Some of our customers are sensitive to issues associated with harvesting of old growth forests and require us to supply products that are not produced from these forests. A growing number of customers want to purchase products that originate from sustainable managed forests as validated by certification programs. We have implemented our chain-of-custody systems to verify that selected paper products contain 100% certified wood fibre, but we may be required to implement additional or more stringent chain-of-custody certification programs with increased costs to meet our customers’ demands. Demand for our products may be adversely affected if we do not implement such programs or if we become subject to organized boycotts or similar actions by environmental or other groups.
Our insurance has limitations and exclusions
We maintain insurance coverage that we believe would ordinarily be maintained by an operator of facilities similar to our own. The insurance policies are subject to limits and exclusions. Damage to or destruction of our facilities could accordingly exceed the limits of our policies or be subject to policy exclusions.
Our Canadian mills are located in seismically active areas
Our three operating mills in Canada are situated adjacent to the ocean on the south coast of B.C. This is a seismically active area and these mills and the surrounding transportation infrastructure are accordingly susceptible to risk of damage or destruction caused by earthquakes and tsunamis. Our insurance may not cover the total losses associated with damage or destruction caused by an earthquake or tsunami, and this insurance is subject to limits and deductibles in respect of such damage that may limit the amount recoverable.
Our mills in the United States are partially located on flood plains
Our two U.S. based mills are situated adjacent to rivers. These rivers occasionally experience rising water levels and as such are susceptible to risk of damage or destruction caused by floods. Our insurance may not cover the total losses associated with damage or destruction caused by floods and this insurance is subject to limits and deductibles in respect of such damage that may limit the amount recoverable. Both mills have comprehensive flood response plans that are tested annually and early warning systems that alert the mills to rising water levels.
Post-retirement plan obligations may affect our financial condition
We maintain defined benefit pension plans and other post-retirement benefit plans for certain retired employees. As at December 31, 2015, the underfunded liability associated with the defined benefit pension plans was $108.5 million and the underfunded liability associated with the other post-retirement benefit plans was $172.9 million. Funding requirements for these plans are dependent on various factors, including interest rates, asset returns, regulatory requirements for funding purposes, and changes to plan benefits. In 2016, we are required to contribute $6.5 million towards the underfunded liability of the defined benefit pension plans. Although we expect to continue to make contributions to fund post-retirement plan obligations and to meet legal funding obligations for the defined benefit pension plan, no assurance can be made that the underfunded liability under these plans will not be materially adverse to us in the future.
A change in our legal control could be materially adverse
As at February 29, 2016, we have outstanding debt of US$260.5 million of 2017 Notes (including the Offered Notes) and $16.5million of Term Loans. If a Change of Control (as such term is defined in the indentures governing these notes) occurs, we are required to make an offer to purchase all outstanding 2017 Notes (including the Offered Notes) at a price equal to 101% of their principal amount, plus accrued and unpaid interest to the date of payment, in accordance with the procedures set out in the indentures. The credit agreement for the Term Loan entered into on March 20, 2014 contains a provision whereby the loan will be deemed to be in default in the case of a change in legal control. On the occurrence of an event of default the Term Loan becomes due and payable in whole together with any accrued interest. We may not have sufficient financial resources to fund any such repurchase.
| ITEM 4 | INFORMATION ON THE CORPORATION |
| A. | History and Development of the Corporation |
Incorporation
We were formed on September 1, 2001 by the amalgamation under theCanada Business Corporations Act of Norske Skog Canada Limited and Pacifica Papers Inc. On October 3, 2005, we changed our name to Catalyst Paper Corporation.
Catalyst’s principal predecessor was British Columbia Forest Products Limited, which was a company formed by the amalgamation under the laws of the Province of British Columbia on December 30, 1971 of its predecessor company, incorporated by certificate of incorporation, with memorandum and articles, under the laws of the Province of British Columbia on January 31, 1946, and 24 of its wholly owned subsidiaries. On September 2, 1988, British Columbia Forest Products Limited changed its name to Fletcher Challenge Canada Limited. Prior to July 2000, 50.76% of Fletcher Challenge Canada Limited was owned by Fletcher Challenge Limited of New Zealand (“Fletcher Challenge New Zealand”). On July 28, 2000, Norske Skogindustrier ASA completed a transaction with Fletcher Challenge New Zealand whereby all of the business and assets of Fletcher Challenge New Zealand’s worldwide paper division were acquired by Norske Skogindustrier ASA. As part of this transaction, Norske Skogindustrier ASA acquired Fletcher Challenge New Zealand’s 50.76% interest in Fletcher Challenge Canada Limited. On December 15, 2000, Fletcher Challenge Canada Limited changed its name to Norske Skog Canada Limited.
As a result of the amalgamation with Pacifica Papers Inc. and subsequent equity issues, Norske Skogindustrier ASA’s interest in Catalyst decreased to 29.4%. In February 2006, Norske Skogindustrier ASA sold its remaining 29.4% interest in Catalyst by way of a secondary offering.
Pacifica Papers Inc.’s predecessor was Pacifica Papers Limited Partnership. On June 8, 1998, Pacifica Papers Limited Partnership, through its indirect wholly owned subsidiary, Pacifica Papers Acquisition Company Ltd., acquired all the shares of MB Paper Limited from MacMillan Bloedel Limited. On March 12, 1999, the unitholders of Pacifica Papers Limited Partnership approved a reorganization, pursuant to which Pacifica Papers Limited Partnership changed its corporate form from a partnership to a corporation. As part of this reorganization, 28,750,000 common shares of Pacifica Papers Inc. were distributed to all the unitholders of Pacifica Paper Limited Partnership in exchange for their partnership units on a one for one basis.
14,400,000 new common shares were issued from the treasury of the Corporation to certain secured creditors of the Corporation on September 13, 2012 and 127,571 new common shares were further issued from treasury on December 19, 2012 to certain unsecured creditors of the Corporation in accordance with the Corporation’s plan of arrangement under theCompanies’ Creditors Arrangement Act. Under the terms of that plan of arrangement, all former securities of the Corporation issued and outstanding on September 13, 2012 were deemed automatically cancelled. See “Proceedings Under the Companies’ Creditors Arrangement Act – Implementation of Plan”.
On January 7, 2015, Catalyst Paper completed the acquisition of the Biron paper mill located in Wisconsin and the Rumford pulp and paper mill located in Maine, USA from NewPage Corporation, NewPage Wisconsin System Inc., and Rumford Paper Company (“Sellers”). On closing of the acquisition, Catalyst, through its subsidiary, acquired from the Sellers certain properties and assets used to operate the two mills. Catalyst and its subsidiaries also entered into various ancillary agreements with the Sellers providing for, among other things, the purchase and sale of certain raw materials to and from the mills, transition of certain customer orders and accounts, licenses or transfer of certain intellectual property rights, treatment and disposal of waste and wastewater and certain transitional services.
Our head and registered office is located at 2nd Floor, 3600 Lysander Lane, Richmond, British Columbia, V7B 1C3 and our telephone number is 604-247-4400.
2015 HISTORY
2016 Subsequent Developments
Executive Changes
On March 10, 2016, the Corporation announced that Sean Curran was appointed Senior Vice President, Sales and Marketing, effective April 18, 2016. His predecessor, Jim Bayles, retired on March 31, 2016.
Fatality at Crofton Mill
On January 27, 2016, a mill employee was fatally injured at the Crofton mill as a result of an industrial vehicle roll-over. The mill activated its Emergency Response Plan, and the RCMP and WorkSafe BC were promptly contracted to launch an investigation of the incident. WorkSafe BC is leading the investigation into the circumstances surrounding the incident to determine cause. The RCMP and Coroner’s Office are also investigating and the Corporation is fully supporting the investigations.
Two Lawsuits Filed by Halalt First Nation
On January 22, 2016, Catalyst was served with two Notices of Civil Claim filed in the Supreme Court of British Columbia by the Halalt First Nation (“Halalt”) and its business partners. The Corporation intends to vigorously defend itself against both claims. The first claim, filed jointly by the Halalt, Sunvault Energy Inc. and Aboriginal Power Corp. alleges that the Corporation disclosed certain confidential information pertaining to a proposed anaerobic digester facility in breach of a confidentiality agreement. The plaintiffs are seeking, among other things, approximately $100 million in damages from Catalyst in connection with the alleged breach of contract and a permanent injunction restraining Catalyst from constructing, owning or operating an anaerobic digester facility. The second claim, filed by the Halalt and its members, alleges that the Corporation illegally trespassed on, and caused damages to, the Halalt’s asserted territories and fisheries resources through the operation of its Crofton Mill since 1957. The Halalt is seeking an interim and permanent injunction restraining the Corporation from conducting its operations at the Crofton Mill and are also seeking approximately $2 billion in damages.
2015 Developments
Imposition of Countervailing Duties
On July 28, 2015, the DOC issued its Preliminary Determination to impose countervailing duties on Canadian imports of SC Paper from Catalyst Paper and three other Canadian SC paper producers. Catalyst was assigned an “all-others” countervailing duty rate of 11.19%, the simple average of the preliminary rates assigned to Port Hawkesbury Paper and Resolute Forest Products.
On October 13, 2015, the DOC issued its final determination to impose countervailing duties on Canadian imports of SC Paper, assigning a final “all-others” rate of 18.85% based on a weighted average of the final rates assigned to Port Hawkesbury Paper and Resolute Forest Products, the two companies for whom individual investigations were conducted. Based on our current sales mix, the duty has been imposed on approximately 4% of our total sales.
On November 18, 2015, the U.S. International Trade Commission (ITC) reached an affirmative determination on the countervailing duties, and on December 10, 2015, the DOC issued its final countervailing duty order. On December 15, 2015, the Corporation filed a request for the DOC to initiate an expedited review pursuant to which the DOC would examine the countervailing duty order on SC Paper specifically with respect to Catalyst. On February 8, 2016, the DOC published its notice initiating the requested expedited review. On February 16, 2016, the petitioners filed additional subsidy allegations against Catalyst. It is not yet determined whether the DOC will permit such additional allegations to become part of the expedited review at this stage of the process.
Successful Transition and System Separation
On November 13, 2015, we successfully completed the separation of all business software systems and related infrastructure from Verso Corporation. We ended all transition services under the Transition Services Agreement with Verso Corporation on a timely basis subsequent to the system separation. Total transition and separation costs related to the acquisition of the U.S. paper mills was approximately US$14 million, of which US$6.1 million was capitalized as information system assets. A substantial portion of these costs were one-time, nonrecurring in nature as it related to transition and system separation activities.
Energy Cost Mitigation
In October 2015, a high pressure steam turbine and generator (G13) were taken into active use at our Powell River mill. G13 was the first project completed by Catalyst Paper under the BC Hydro Power Smart Program. The project was completed on time and on budget, and will reduce annual energy cost by approximately $4.7 million.
On November 1, 2015, BC Hydro launched a load curtailment pilot initiative for its industrial customers to reduce peak power needs across BC. The net benefit realized under the pilot program in 2015 was $0.7 million.
Appeal of Sales Tax Ruling
On October 21, 2015, Catalyst sought leave to appeal at the Supreme Court of Canada the judgment of the BC Court of Appeal made February 4, 2015 with respect to Catalyst’s action against the Province of British Columbia involving a reassessment of the amount of sales tax payable under the Social Services Tax Act on electricity purchased from Powell River Energy Inc. (“PREI”) in 2001 through 2010. This application is still in process.
Indefinite Curtailment of Rumford No. 12 Paper Machine
On September 1, 2015, we indefinitely curtailed Paper Machine No.12 at Rumford after temporarily curtailing the machine on May 20, 2015 due to a lack of orders and a declining market for the coated paper manufactured on No. 12. The curtailment resulted in the elimination of 51 positions. We do not anticipate that the outlook for product manufactured on No. 12 will change in the foreseeable future. The indefinite curtailment resulted in reduced coated paper production of approximately 80,000 tonnes based on the prior year’s production on the No. 12 machine.
Executive Changes
Effective July 20, 2015, Frank De Costanzo was appointed Senior Vice President and Chief Financial Officer of the Corporation. Mr. De Costanzo’s predecessor, Brian Baarda, resigned from the Corporation effective April 14, 2015.
Major Investment at Rumford Mill
In the second quarter of 2015, we upgraded the Rumford mill’s Recovery Boiler C by replacing the 35-year-old generating bank. The total incremental cost and lost contribution related to the shut was $11.0 million plus an additional $4.5 million in capital spend. The production impact of the shut was lost pulp production of 9,185 tonnes. This upgrade is a major building block to achieve a step change in energy costs at the Rumford mill. This investment, along with moving power boiler maintenance to the fall (to ensure maximum steaming rate capability for the winter months) and the shift in product mix to more coated freesheet will position the mill to be a net seller of electricity in the 2015/2016 winter period.
Operating Issues at Crofton Mill
In the second quarter of 2015, the Crofton mill was impacted by significant operating issues impacting its oxygen plant that resulted in production losses of 8,668 tonnes of pulp and 8,785 tonnes of paper. We incurred incremental costs and lost contribution of $4.4 million due to the outage.
Harmonization of Paper Brands
On May 4, 2015, our coated product offering transitioned to consist of the Orion, Vision, Escanaba, Dependoweb, Capri and Consoweb brands. Production of these brands commenced at Port Alberni, while continuing at Biron and Rumford. Extensive market analysis revealed that these legacy NewPage brands benefit from deep market share and a long history of customer acceptance. We believe that these brands will give us a competitive advantage in the marketplace. On September 14, 2015, we launched an expanded Oxford C1S line-up of products for multiple market segments, including Cut and Stack Labels, Commercial C1S & Lamination and Pressure Sensitive applications.
Purchase of Mills in Maine and Wisconsin
On January 7, 2015, we completed the acquisition of the Biron paper mill located in Wisconsin, U.S. and the Rumford paper and pulp mill located in Maine, U.S. from NewPage Corporation, NewPage Wisconsin System Inc., and Rumford Paper Company. The cash payment made on the closing was US$62.4 million, after giving effect to an adjustment under the purchase agreement based on estimated working capital at closing. The final purchase price is subject to certain additional post-closing adjustments. We filed a business acquisition report in accordance with Form 51-102F4 in respect of this acquisition on April 7, 2015.
The acquisition was financed through advances under our ABL Credit Facility. The Corporation entered into an amendment to its ABL Credit Facility to increase the maximum amount of credit available thereunder from $175.0 million to $225.0 million. The Corporation also issued PIK Toggle Senior Secured Notes due 2017 (Offered Notes) with a principal amount of US$25.0 million. The Offered Notes are on substantially the same terms and form part of the same series as Catalyst’s existing PIK Toggle Senior Secured Notes due 2017 (2017 Notes). The Offered Notes were issued at a 20% discount to face value with Catalyst receiving gross proceeds under the Offering of US$20.0 million. Acquisition costs of $4.5 million were incurred, of which $1.4 million was incurred in Q1 2015.
Subsequent adjustments were made to the bargain purchase gain recognized on the date of the acquisition related to pension liabilities, long-term environmental remedial obligations, workers compensation and accrued payroll liabilities based on additional evidence supporting the fair value of these liabilities as of the acquisition date of January 7, 2015. The adjustments resulted in an increase to the bargain purchase gain recognized on the date of acquisition.
Production Curtailment
The following table summarizes pulp and paper production curtailment in 2015:
2015 Production Curtailment (tonnes) | | Coated Paper(1) | | | Uncoated Paper(1) | | | Newsprint | | | Pulp | | | Total | |
| Q1 | | | — | | | | — | | | | — | | | | — | | | | — | |
| Q2 | | | 33,000 | | | | 12,000 | | | | — | | | | — | | | | 45,000 | |
| Q3 | | | — | | | | — | | | | — | | | | — | | | | — | |
| Q4 | | | — | | | | — | | | | — | | | | — | | | | — | |
| Total | | | 33,000 | | | | 12,000 | | | | — | | | | — | | | | 45,000 | |
| 1 | Market curtailment was taken at the Rumford, Port Alberni and Powell River mills in the second quarter due to lack of customer orders and the seasonally slow second-quarter retail period. |
| 2 | Table does not include indefinitely curtailed paper machines, including Crofton paper machine No. 1, curtailed in 2010, Powell River paper machine No. 9, curtailed in 2014, and Rumford paper machine No. 12, indefinitely curtailed on September 1, 2015 after being temporarily curtailed on May 20, 2015. |
We are the largest producer of mechanical printing papers in western North America. We also produce northern bleached softwood kraft (“NBSK”) pulp. On December 31, 2015, our business comprised four business segments: coated paper, uncoated paper, newsprint and pulp. Coated papers included coated groundwood, coated freesheet and coated one-sided specialty paper, and uncoated paper included both uncoated mechanical and directory paper. We are the only producer of coated groundwood paper and soft-calendared mechanical paper in western North America. Our three pulp and paper operations in British Columbia are located at Crofton on the east coast of Vancouver Island, British Columbia, Port Alberni on central Vancouver Island, and Powell River on the west coast of the British Columbia mainland. On January 7, 2015, we acquired a paper and pulp mill in Rumford, Maine, USA that produces coated groundwood, coated freesheet and coated specialty paper as well as pulp, and a paper mill in Biron Wisconsin, USA that produces coated groundwood paper. See Item 3D for a description of the material effects of government regulations on the Company’s business.
The chart below represents our expectation as to mill capacity in 2015, in thousands of tonnes, among the different product lines that can be produced at each mill. Capacity per product can vary as some of our paper machines are capable of producing more than one product line.
2016 Capacity by Mill Location and Product Line1
| | | | | | Coated Paper1 | | | Uncoated Paper1 | | | Newsprint1 | | | Market Pulp | | | | |
| Mill Location | | Number
Of Paper
Machines | | | Coated
Freesheet | | | Coated
Groundwood | | | Coated
One-
Sided
Specialty | | | Uncoated
Mechanical | | | Directory | | | Newsprint | | | Market Pulp | | | Total | |
| Crofton, B.C. 4 | | | 2 | | | | | | | | – | | | | – | | | | – | | | | | | | | 350,000 | | | | 377,0002 | | | | 727,000 | |
| Port Alberni, B.C. | | | 2 | | | | | | | | 224,000 | | | | | | | | – | | | | 116,000 | | | | – | | | | – | | | | 340,000 | |
| Powell River, B.C.5 | | | 2 | | | | | | | | – | | | | – | | | | 350,000 | | | | | | | | – | | | | – | | | | 350,000 | |
| Rumford, ME6 | | | 2 | | | | 237,000 | | | | 154,000 | | | | 47,000 | | | | | | | | | | | | | | | | 114,0003 | | | | 552,000 | |
| Biron, WI | | | 2 | | | | | | | | 335,000 | | | | | | | | | | | | | | | | | | | | | | | | 335,000 | |
| Total capacity (tonnes) | | | 10 | | | | 237,000 | | | | 713,000 | | | | 47,000 | | | | 350,000 | | | | 116,000 | | | | 350,000 | | | | 491,000 | | | | 2,304,000 | |
| % of total capacity | | | | | | | 11 | % | | | 31 | % | | | 2 | % | | | 15 | % | | | 5 | % | | | 15 | % | | | 21 | % | | | 100 | % |
| 1 | Capacities expressed in the above tables can vary as we are able to switch production between products, particularly coated groundwood, coated freesheet, coated specialties and machine-finished uncoated grades. |
| 2 | Total pulp capacity at Crofton is 407,000 tonnes, of which 377,000 tonnes are designated as market pulp with the remaining 30,000 tonnes being consumed internally. |
| 3 | Total pulp capacity at Rumford is 485,000 tonnes, of which 114,000 tonnes are designated as market pulp with the remaining 371,000 tonnes being consumed internally. |
| 4 | No. 1 paper machine at Crofton remains indefinitely curtailed since 2010. |
| 5 | No. 9 paper machine at Powell River remains indefinitely curtailed since 2014. |
| 6 | No. 12 paper machine at Rumford was indefinitely curtailed on September 1, 2015. |
Coated Paper
Coated paper can be manufactured on our four paper machines at the U.S. paper mills and on one paper machine at our Port Alberni mill. The coated paper business segment has a total annual production capacity of 997,000 tonnes in 2016, of which 773,000 tonnes were added with the acquisition of the U.S. paper mills on January 7, 2015.
Coated paper products represent our largest business segment, generating 52% of our 2015 consolidated sales revenue (17% for 2014). Our customer base consists primarily of retailers, commercial printers and magazine and catalogue publishers, as well as labels, packaging and pressure-sensitive face papers for our coated one-sided specialty paper. Coated paper products are sold primarily by our sales and marketing personnel in North America, and through distributors and agents in other geographic markets. In 2015, 93% of our coated paper sales volumes were with customers in North America.
Uncoated Paper
Uncoated paper can be manufactured on four paper machines at our Port Alberni and Powell River mills. The uncoated paper business segment has a current total annual production capacity of 466,000 tonnes in 2016.
Uncoated paper sales generated 19% of our 2015 consolidated sales revenue (38% for 2014). The customer base for uncoated paper consists primarily of retailers, magazines and catalogue publishers, commercial printers and telephone directory publishers. In 2015, 88% of our uncoated paper sales volumes were with customers in North America.
Newsprint
Newsprint can be manufactured on our paper machines at Crofton, Powell River and Port Alberni. The newsprint business segment has a current total annual production capacity of 350,000 tonnes in 2016.
Newsprint sales generated 12% of our 2015 consolidated sales revenue (21% for 2014). The newsprint customer base consists primarily of newspaper publishers located in western and central North America, Asia and Latin America. In 2015, 44% of our newsprint sales volumes were with customers in North America.
Pulp
Our pulp segment consists of NBSK pulp manufactured on two production lines at the Crofton mill. The Crofton mill has a total annual production capacity of 407,000 tonnes of which approximately 30,000 tonnes represent capacity being consumed internally.
The pulp segment continues to consist of NBSK pulp that we produce at our Crofton mill. The kraft pulp that we produce at our Rumford mill is used primarily in the production of coated paper at Rumford, while our Canadian pulp is produced primarily to be marketed and sold into Asia. The revenue and costs related to market pulp produced at our Rumford mill has been recognized as a corporate adjustment outside of our segmented results.
The pulp customer base includes producers of tissue, magazine papers, woodfree printing and writing papers and certain specialty paper products. Pulp is sold primarily by sales and marketing personnel based in Canada, and through a network of agents in locations throughout the world.
Pulp sales generated 17% of our 2015 consolidated sales revenue (24% for 2014). In 2015, 96% of our NBSK pulp sales volume from Crofton was sold to customers in Asia.
Paper Marketing
The principal customers for our paper products are retailers, magazine, book and catalogue publishers, commercial printers, telephone directory publishers, newspaper publishers, labels, packaging and pressure-sensitive face papers. These customers were located primarily in western and central North America, Asia and Latin America, prior to our addition of the US paper mills, which has significantly increased our coated paper market share in eastern North America. Paper customers are served primarily by our sales and marketing personnel in North America and distributors and agents in other geographic markets. Historically, approximately two-thirds of our paper sales revenue has been generated from sales to customers in the United States. The United States is still the world's largest consumer of coated and uncoated mechanical paper and newsprint, representing 22% of the world’s consumption for coated paper, 28% for uncoated mechanical paper and 13% for newsprint.
The Crofton mill is located on tidewater and has deep-sea vessel loading facilities. Our paper products are shipped overseas utilizing both deep-sea vessels and containers, and by a combination of barge, rail and truck for destinations in North America. We use the services of independent warehouses for distribution to our customers in other parts of the world.
Pulp
Pulp Operations
We manufacture market pulp on two lines of pulp production at our Crofton mill. We manufacture softwood and hardwood market kraft pulp at our Rumford mill. Our annual pulp production capacity for 2016 is 892,000 tonnes. Our annual market pulp capacity is 491,000 tonnes (which excludes pulp consumed internally).
The first pulp line at Crofton began operating in 1957 and the second began in 1965. This mill is equipped with one continuous digester and eight batch digesters, which provide the flexibility to cook different species of chips independently. Crofton's batch digesters utilize a rapid displacement heating cooking system. This system allows for quick turnaround in the batch cooking process, because it rapidly extracts and replaces the cooking liquor in the cooking vessel for each batch without a significant loss in temperature. This technology improves the overall quality of Crofton’s pulp and provides a stronger and more uniform pulp than conventional batch cooking. The Crofton kraft pulp mill produces Northern bleached softwood kraft, or NBSK pulp grades. One grade is a low coarseness fine fibre pulp is marketed as CKBC. This pulp is consumed internally at our Port Alberni and Powell River operations and sold to market customers. CKBC is a high tensile strength grade which is ideally suited for the manufacture of lightweight papers and tissue. The other pulp grade produced is made from spruce, pine and fir, coastal hemlock and Douglas fir species and is marketed as CKHF. This grade has high intrinsic strength and bulk, and is used in a variety of printing and writing papers and a range of specialty papers.
The batch digesters at Rumford were installed in 1948 and the Kamyr was installed in 1961. The two pulp lineswere rebuilt in 1990 and produce both hardwood and softwood kraft pulp. This mill is equipped with one continuous digester that produces softwood kraft pulp, and ten batch digesters that produce hardwood kraft pulp but with swing capacity on four batch digesters to produce softwood kraft pulp. The hardwood kraft line is outfitted with an elemental chlorine free chemical bleaching process and benefited from a major upgrade in 2001. The softwood kraft line is also outfitted with an elemental chlorine free chemical bleaching process.
Pulp Marketing
Our Crofton pulp mill is well situated for export shipments to Asia. Our strategy is to maintain a diversified range of freight-logical customers, including producers of tissue, magazine papers, woodfree printing and writing papers and certain specialty paper products.
Pulp customers are served by sales and marketing personnel in Canada and a network of agents in locations throughout the world. The Crofton pulp mill is located on tidewater and has deep-sea vessel loading facilities. Pulp is shipped to offshore locations primarily by break bulk on deep-sea vessels.
Pulp customers of our Rumford mill are served by sales and marketing personnel in the United States.
COMPETITION
The markets for our products are highly competitive on a global basis. The pulp and paper industry is essentially a commodity market in which producers compete primarily on the basis of price. In addition, since an important percentage of our production is directed to export markets, we compete on a worldwide basis against many producers of approximately the same or larger capacity. In export markets, Canadian producers generally compete with American, European and Asian producers. See Items 5A and 8A for a description of the principal markets in which the Company competes.
FIBRE SUPPLY
Our pulp and paper operations in Canada consume wood fibre which is purchased from more than 25 independent sawmills and more than 25 pulp log suppliers. Our fibre supply comes primarily from residual wood chips from sawmill operations located on the coast or in the southern interior of British Columbia and secondarily from the chipping of pulp logs originating from locations throughout the region.
In 2015, our fibre supply for our B.C. pulp and paper operations was comprised of sawmill wood chips and pulp logs. Approximately 70% of our fibre is provided by five suppliers. As it relates to the newly acquired US paper mills, fibre suppliers in the region are significantly less concentrated than our B.C. operations, with the top five suppliers for each respective mill providing 47% of fibre at the Rumford mill and 18% of fibre at the Biron mill.
Approximately 70% of our B.C. fibre is sourced under indefinite (evergreen) term fibre agreements with third party suppliers (some of which were put in place when we sold our timber and timber processing assets in the 1990s) with pricing based on market prices or at prices determined under market-based formulas and including an evergreen contract with a coastal log producer under which additional wood chips can be obtained from regional sawmills in exchange for sawlogs. For our newly acquired U.S. operations, approximately 98% is sourced directly from third parties with the remaining 2% sourced from short term stumpage purchases.
The remainder of the fibre requirements for our pulp and paper operations is sourced from independent suppliers, many under long-term contracts. Fibre is purchased from these suppliers at market prices or at prices determined under market based formulas. From time to time we sell fibre to outside customers. We also engage in fibre trading activities to ensure optimum allocation of different fibre grades to the appropriate product.
Our operations are subject to a wide range of issues that can impact the availability and price of fibre supply, including suppliers’ lumber market demand, sawlog supply, coastal solid wood industry restructuring, strikes, and regional market prices. The diversity of supply from over 50 independent suppliers in British Columbia located in three geographical regions helps to mitigate the risk of interruptions to fibre deliveries to our operations. Our production levels in 2015 through 2013 were not impacted by fibre shortages. The Biron mill currently relies on the Lake States Wood Supply Group for its wood supply, which is owned and operated by Verso Corporation. For Biron, wood supply interruption is a potential risk in 2016 if Verso Corporation, currently operating under Chapter 11 Bankruptcy Protection, decides to repudiate on the wood supply agreement.
During the past five years, we have implemented a chain of custody system to certify our wood fibre supply. Approximately 75% of our total fibre basket in British Columbia is certified to either the Programme for the Endorsement of Forest Certification (“PEFC”) or Forest Stewardship Council (“FSC”) standard. PEFC is an independent non-profit organization that assesses and mutually recognizes national forest certification programs developed through multi-stakeholder processes. The PEFC standard is a third party audited system that identifies the source of wood fibre and whether or not it is derived from a forest independently certified as being managed in accordance with a recognized sustainable forest certification system.
Competitive Strengths
We believe that we have the following competitive strengths:
| · | Cost Reduction Processes. We implemented an opportunities for improvement (“OFI”) program which encourages and rewards employees to take ownership of the business by identifying and implementing opportunities for cost savings or revenue generation. To date, the OFI program has successfully delivered tens of millions of dollars of cost savings and margin improvements. We also launched a formal mill revitalization program (the “Revitalization Program”) at each of our Powell River, Rumford and Biron mills in 2015 and at our Crofton and Port Alberni mills and head office in early 2016. The Revitalization Program continues to deliver step change cost reduction and improve the cost position of each mill. |
| · | Strong Market Position. We are the largest producer and marketer of printing papers (newsprint and specialty printing papers) in Western North America with production capacity of approximately 2.3 million tonnes of paper and pulp. We are the only producer of coated groundwood and supercalendered papers in Western North America and the largest producer of glossy paper in the region. Our Crofton operation is a tidewater mill giving it reliable, low-cost access to international pulp and paper markets via breakbulk vessels. The acquisition of the Rumford paper and pulp mill and Biron paper mill on January 7, 2015 significantly increases our coated paper market share in North America in general and eastern North America in particular. |
| · | Diversified Product Mix and Product Development. We are focused on optimizing our product mix by developing higher value grades and introducing new product lines, which allow us to explore niche opportunities in the marketplace. The most recent additions to our extensive lineup are the coated paper and market pulp grades and related brands that were purchased as part of the acquisition of the Rumford paper and pulp mill and the Biron mill. The Biron paper mill produces lightweight coated and ultra-lightweight coated paper. The Rumford paper and pulp mill produces coated specialty, coated freesheet and coated groundwood paper, as well as Kraft market pulp. The acquired U.S. mills will continue to sell their paper and pulp grades under existing brand names that were purchased as part of the acquisition which consist of Vision, Escanaba, Dependoweb, Capri and Consoweb for their coated groundwood grades, Orion for their coated freesheet grades, Oxford for their coated specialty grades, and Swift River Kraft for their market pulp grades. These coated paper grades both widen the range of our product offering and add higher quality specialty paper grades to our production capacity. Specialized products generally provide higher margins and improved demand prospects than standard commodity grades. In 2013, we introduced Ascent, a lightweight coated graphic and printing paper. In 2012, we introduced Marathon Lite, an ultra-light newsprint grade that offers publishers and printers environmental and economic benefits of a lighter sheet without sacrificing print quality or runability. In 2010 we introduced Pacificote™ , a high brightness and high gloss paper with superior printability ideal for magazine, catalogue, insert and direct mail advertising applications. We also launched Electrabrite™ Book, a range of caliper-controlled grades for book publishers, Electrabrite 100% recycled hi-bright grade papers (a grade that was produced at Snowflake prior to is closure in 2012) and E-Star Max, an 84-bright uncoated mechanical grade for commercial printing. These are our most recent additions to our expansive range of Electra-paper grades that include Electraprime™ (a soft-calendered, high-brightness paper designed to compete as an alternative to traditional supercalendered grades and used primarily for advertising inserts and flyers), Electrastar™ (a super high-brightness grade designed for applications in which brightness is a desirable characteristic such as inserts and specialty newspapers), Electrabrite Lite (a lighter basis weight, high-brightness product that is used by newspapers and retailers) and Electracote Brite (a brighter, heavier-coated paper ideal for magazines, catalogue or retail insert applications as an attractive alternative to more expensive coated grades). We also introduced our Sage line of specialty printing papers in 2010 which allows us to offer the Pacificote and Electra-grades as being manufactured carbon-neutral from certified wood fibre from sustainably managed forests with documented verification. We manage fluctuations in demand for our products through our ability to switch production between products and machines, particularly coated groundwood, coated freesheet, coated specialties, machine-finished uncoated grades. |
| · | Efficient Supply Chain Management Practices. Distribution costs have a significant impact on net sales realizations. Our strong and flexible distribution network optimizes all transportation modes available to us, such as barge, truck, rail, breakbulk, and container shipping. Controlling key elements of our supply chain has allowed us to control costs while achieving a high on-time delivery performance and low damage levels especially to west coast print sites where our strategic importance to customers is highest. Our Crofton mill site directly ships breakbulk to offshore customers via regularly scheduled vessels. We operate a central distribution centre in Surrey, B.C. which continuously receives volumes from our three British Columbia mills and then ships via rail, truck and container to our customers. This allows us to choose the most cost effective transportation mode in conjunction with customer requirements. We also lease or otherwise have available 572 paper quality boxcars to ensure adequate car supply. Specialized software is used to maximize payloads in rail, truck, and containers while ensuring each load is safe, legal, and minimizes risk of transit damage. We lease two barges which we use in conjunction with a third party towing company to transport our products to the Surrey Distribution Centre. The acquisition of the US paper mills increases the geographic diversification of our mills and storage warehouses which creates opportunities to further optimize distribution costs by supplying customers from the most freight-logical mill locations. In 2015, we opened a regional customer service centre in Dayton, Ohio to service the supply chain, order management and customer service needs of the acquired U.S. paper mills. |
| · | Corporate Social Responsibility. Catalyst Paper is considered one of the most responsible paper manufacturers in North America as it operates some of the cleanest mills and has one of the best track records of working with opinion leading special interest groups. Catalyst Paper Corporation places great importance on our social responsibility making sure our actions are consistent with our values. This means understanding our footprint on the environment including minimizing impacts in the manufacture, use and recycle of our paper. 100% of the virgin fiber used in our paper comes from legally harvested North American forests and is considered low risk under the FSC risk assessment process. On average, 74% of the energy used to make our paper comes from renewable hydroelectric and biomass energy sources meaning the carbon footprint of our products are only about 1/3 of the sectors average on a per ton basis. We continue to set the pace in green manufacturing by working collaboratively to improve our operations with special interest groups like World Wildlife Fund (WWF), Greenpeace, Forest Ethics, Canopy Planet, Sierra Club and GreenBlue. Unlike virtually every other man made product today, we are proud that 100% of our papers are readily recyclable having come from 100% renewable forests. |
BUSINESS STRATEGY
Our objective is to return to profitability and maximize cash flows through reduced manufacturing costs and optimizing our brands and customer base in a socially responsible manner. Our strategy is more fully described in management’s discussion and analysis section“Strategy” and “Outlook”of the 2015 Annual Report, which is incorporated by reference herein. In 2016, the focus will be on objectives and initiatives in three areas;
| · | Financial Generate positive free cash flow results by increasing operating earnings, reducing overhead costs and further optimizing our capital structure, increase the value of benefits realized under the Corporation’s OFI program from the prior year, improve cost competitiveness and productivity through the Revitalization Program at our five mills and develop and execute a debt refinancing plan. |
| · | Social Improve safety by reducing the medical incident rate by a minimum of 20% compared to the prior year, improve employee performance through the adoption of incentive pay plans for both hourly and salaried employees that are aligned to the Corporation’s objectives, and implement a new performance management system for salaried employees. |
| · | Commercial Optimize our product mix by increasing our market share of higher-margin coated freesheet and coated one-sided specialty paper and reducing the basis weight of our other paper grades, and expand our product offering through new product development. |
| · | Environmental work with community stakeholders to identify and implement strategic initiatives that mutually benefit our mills and the communities they operate in, develop and implement a Corporate Social Responsibility (CSR) strategy, strengthen Catalyst’s standing with mill communities and with First Nations, and adhere to high international standards for transparency and reporting of performance on social, governance and environmental factors. |
| C. | Organizational Structure |
We own, directly or indirectly, all of the issued and outstanding shares of the following principal subsidiaries:
| Subsidiaries | | Jurisdiction |
| Catalyst Paper Operations Inc. | | Delaware |
| Catalyst Pulp Operations Limited | | British Columbia |
| Catalyst Pulp Sales Inc. | | British Columbia |
| Catalyst Pulp and Paper Sales Inc. | | British Columbia |
| | | |
| Catalyst Paper (USA) Inc. | | California |
| Catalyst Paper Holdings Inc. | | Delaware |
| Catalyst Paper (Snowflake) Inc. | | Delaware |
| Pacifica Papers Sales Inc. | | Delaware |
| Pacifica Poplars Ltd. | | British Columbia |
| Pacifica Poplars Inc. | | Delaware |
| Pacifica Papers U.S. Inc. | | Delaware |
We are a partner of the British Columbia general partnership, Catalyst Paper. Catalyst Paper Corporation holds a 71.3% interest in the partnership and our subsidiary, Catalyst Pulp Operations Limited, holds the remainder.
| D. | Property, Plant and Equipment |
Paper
Paper Operations
Our paper can be manufactured on 13 paper machines at five mill locations. Our paper machines consist of the following:
| Crofton | Product |
| Paper Machine No. 1 (“C1”)(1) | Newsprint |
| Paper Machine No. 2 (“C2”) | Newsprint |
| Paper Machine No. 3 (“C3”) | Newsprint |
| | |
| Port Alberni | Product |
| Paper Machine No. 4 (“A4”) | Uncoated paper |
| Paper Machine No. 5 (“A5”) | Coated paper |
| | |
| Powell River | Product |
| Paper Machine No. 9 (“P9”)(2) | Uncoated paper |
| Paper Machine No. 10 (“P10”) | Uncoated paper |
| Paper Machine No. 11 (“P11”) | Uncoated paper |
| | |
| Biron | Product |
| Paper Machine No. 25 (“B25”) | Coated paper |
| Paper Machine No 26 (“B26”) | Coated paper |
| | |
| Rumford | Product |
| Paper Machine No. 10 (“R10”) | Coated paper |
| Paper Machine No. 12 (“R12”)(3) | Coated paper |
| Paper Machine No. 15 (“R15”) | Coated paper |
| 1 | No. 1 paper machine at Crofton remains indefinitely curtailed since 2010. |
| 2 | No. 9 paper machine at Powell River remains indefinitely curtailed since 2014. |
| 3 | No. 12 paper machine at Rumford was indefinitely curtailed on September 1, 2015. |
Our estimated 2016 capacity to produce paper in tonnes compared to our production for each of the last two years is as follows:
| | | Annual Capacity | | | Net Production
Year ended December 31 (tonnes) | |
| Mill | | 2016 (tonnes) | | | 2015 | | | 2014 | |
| Crofton(1) | | | 350,000 | | | | 318,561 | | | | 332,289 | |
| Port Alberni | | | 340,000 | | | | 310,400 | | | | 333,040 | |
| Powell River(2) | | | 350,000 | | | | 332,779 | | | | 405,087 | |
| Biron | | | 335,000 | | | | 312,591 | | | | — | |
| Rumford(3) | | | 438,000 | | | | 428,924 | | | | — | |
| | | | 1,813,000 | | | | 1,703,255 | | | | 1,070,416 | |
| 1 | We have indefinitely curtailed our No.1 paper machine at Crofton, displacing the equivalent of 140,000 tonnes of annual newsprint production from Crofton. The capacity noted above does not include the capacity of that paper machine. |
| 2 | We indefinitely curtailed our No. 9 paper machine at Powell River on December 15, 2014, displacing the equivalent of 110,000 tonnes of annual uncoated mechanical production from Powell River. The capacity noted above does not include the capacity of that paper machine. |
| 3 | We indefinitely curtailed our No. 12 paper machine at Rumford on September 1, 2015, displacing the equivalent of 80,000 tonnes of annual coated groundwood production based on the prior year’s production. The capacity noted above does not include the capacity of that paper machine. |
Crofton
Crofton's capacity is 350,000 tonnes of newsprint. C1 at Crofton was curtailed from February 1, 2009 to May 25, 2009 and indefinitely curtailed since January 21, 2010.
The Crofton paper mill’s three paper machines commenced operation in 1964, 1968 and 1982. All three machines are capable of producing either newsprint or directory paper as market conditions warrant but C2 and C3 are currently dedicated to producing newsprint. All machines were installed with, or have been converted to, twin-wire sheet formation, which provides a more uniform quality of sheet for both printing surfaces. Pulp furnish for the paper mill is supplied by a three-line TMP mill.
Port Alberni
Port Alberni's annual capacity is 340,000 tonnes of directory paper and lightweight coated paper.
The Port Alberni paper mill has two paper machines; one was put into operation in 1957 and the other in 1968. A5 was upgraded in 1995 to produce lightweight coated paper and is the only lightweight coated paper machine in western North America. Its on-line technology allows for the coating of paper on both sides simultaneously, reduces the amount of kraft pulp required to produce conventional lightweight coated paper and produces the desired product quality in terms of runability, printability and bulk.
Pulp furnish for the paper mill is supplied primarily from the mill's TMP plant. An $8 million upgrade to the mill’s TMP plant was completed in May, 2009 which increased the TMP facility’s capacity and displaced higher cost pulp. Equipment at the Port Alberni mill allows us to use crumb kraft pulp from the Crofton mill in our lightweight coated paper.
Powell River
Powell River's annual capacity is 350,000 tonnes of uncoated paper. The Powell River mill has three paper machines, which were put into operation in 1957, 1967 and 1981. These machines produce machine finished super-brights and hi-brights, soft calendered hi-bright papers and newsprint. The P9 paper machine was temporarily curtailed on October 27, 2014 and indefinitely curtailed on December 15, 2014 due to a lack of orders and a declining market for the paper manufactured on it. P9 had been dedicated to the production of Electrastar™ and Electrabrite™ grades, our super-bright and hi-bright grades, respectively. In 2004, we upgraded P10 and the peroxide bleach plant to support the production of higher value specialty printing papers, including Electracal™ and Electraprime™ grades. We continue our effort to push towards the development of high-brightness products at our Powell River mill, and in 2005 we completed a further upgrade of the peroxide bleach plant to expand the mill’s production capacity for higher brightness uncoated specialty printing grades. Pulp furnish for the paper mill comes primarily from a TMP plant. The Powell River mill also has the capability to use recycled de-inked pulp on a limited scale.
On October 13, 2015, the DOC issued its final determination to impose countervailing duties on imports of SC Paper into the U.S. from Canada, assigning a final “all-others” rate of 18.85% based on a weighted average of the final rates assigned to Port Hawkesbury Paper and Resolute Forest Products, the two companies for whom individual investigations were conducted. We currently produce SC Paper on paper machine No. 10.
PREI owns two hydroelectric dams near the Powell River mill with a combined generating capacity of 83 megawatts and provides the power generated by its facilities to us under a power purchase agreement between us and PREI which expires in 2016 with extensions to 2021 in one-year renewal term increments at our option. Payments to PREI under the power purchase agreement and related agreements are essentially equivalent to the applicable British Columbia Hydro and Power Authority rate from time to time. PREI’s hydroelectric facilities supply approximately 40%of the annual power needs of the Powell River mill, although this amount varies depending on hydrological conditions. The power purchase agreement and related agreements continue in effect after the sale of our interest in PREI in 2013.
Biron
Biron's annual capacity is 335,000 tonnes of lightweight and ultra-lightweight coated groundwood paper. Production currently consists of approximately 60% rotogravure grades and approximately 40% web-offset grades.
The Biron paper mill has two paper machines, B25 which was put into operation in 1957 and B26 which was put in operation in 1986. B25 was the subject of a major rebuild in 1999, is outfitted with an off-machine, two-station coater, and produces both offset and rotogravure coated groundwood paper. B26 was subjected to major rebuilds in 1996, 1997, 2013 and 2005, is outfitted with an on-machine, two-station coater, and produces both offset and rotogravure coated groundwood paper.
Pulp furnish for the paper mill is supplied primarily from the mill's three-line TMP plant and its stone groundwood facility.
Rumford
Rumford's annual capacity is 438,000 tonnes of coated one-sided specialty, coated freesheet and coated groundwood paper.
The Rumford paper mill has three paper machines, R10 which was put into operation in 1964, R12 which was put in operation in 1948, and R15 which was put in operation in 1980. R10 has benefited from various upgrades in 1990, 1998, and 2005 and produces coated one-sided specialty, coated freesheet and coated groundwood paper. R12 has benefited from upgrades in 2005, 2010 and 2012 and produces coated one-sided specialty, coated freesheet and coated groundwood paper. R15 has benefited from various upgrades from 1993 to 2012 and produces coated freesheet and coated groundwood paper.
On September 1, 2015, we indefinitely curtailed Paper Machine No.12 after temporarily curtailing the machine on May 20, 2015 due to a lack of orders and a declining market for the coated paper manufactured on No. 12.
Pulp furnish for the paper mill is supplied primarily from the mill's two kraft pulp lines and a groundwood pulping facility.
Properties
Our head office is located in leased premises in Richmond, British Columbia. The lease covers an aggregate of 39,275 square feet and expires March 31, 2018.
We sub-lease the land and buildings for our distribution warehouse and facility in Surrey, British Columbia, which expires in June 2019, subject to further options to renew. We lease the premises for our Nanaimo office pursuant to a lease which was recently extended for a further 42 months to February 2018 with a reduction to the rentable area after the initial 24 months. We entered into a new lease for the premises for our sales office in Seattle, Washington pursuant to a lease which expires on September 30, 2020. We lease premises for our Ohio office pursuant to a lease which expires on August 30, 2020 (with an option to renew for two additional 5 year terms)
Each of our Crofton, Powell River and Port Alberni manufacturing facilities in British Columbia are situated on land we own. The Crofton mill is located on a 107 hectare site, the Powell River mill is located on a 94 hectare site and the Port Alberni mill is located on a 44 hectare site. The newly acquired US mills are situated on land we own, with the Rumford mill located on a 50 hectare site and the Biron mill located on a 53 hectare site. The Snowflake mill site lands were sold as part of the sale of the Snowflake assets and shares of The Apache Railway Company in January, 2013.
Environment
Our operations are subject to a wide range of general and industry-specific environmental laws and regulations including those related to waste management, air emissions, water discharges and remediation of environmental contamination. There has been significant upgrading of our facilities during the past two decades to comply with solid and hazardous wastes, effluent and air regulations. Environmental performance is monitored regularly by us, third party consultants and government regulatory bodies. We believe that our facilities are operating in material compliance with applicable environmental laws and regulations.
In addition to regular monitoring of emission points and reporting to regulatory authorities, we manage our environmental performance through environmental management systems. These systems are registered to the ISO 14001:2004 standard at all three of our operating facilities in British Columbia. We are currently assessing the opportunity to deploy similar ISO certification at our US facilities. The environmental management system utilizes annual internal surveillance audits and external compliance audits of our manufacturing facilities. Action plans are developed to address any deficiencies and updates are regularly communicated to management and a committee of the Board. Compliance audits at all five of our active operations were completed during 2015 and based upon our past experience, we would not expect that costs to address any deficiencies so identified would be material.
Numerous Canadian and US federal, state and provincial environmental issues are in transition which could translate into more vigorous regulatory standards and permits in the next decade. Numerous issues exist with respect to water use and discharges, air emissions, solid waste and greenhouse gases. A number of these key items are described below.
Solid Waste
An ongoing environmental facet of our operations is the disposal of solid waste. Most non-recyclable waste is disposed of at on-site landfills. Based on current practice, we have at least ten years’ capacity in our key landfills at Crofton, Port Alberni Powell River and Rumford. Biron disposes of its solid waste in a landfill that is owned and operated by Verso Corporation’s Water Quality Center (WQC) per the terms of an operating agreement. We continue to work to reduce volumes sent to landfill by reducing waste generation, increasing recycling efforts and investigating alternative uses for all waste.
Water Use and Wastewater Discharges
All of our facilities use substantial quantities of water for paper and pulp manufacturing and cooling purposes. Each mill has focused on reduction initiatives over the past decade and in 2015 we consumed 150 million m3 of process water equivalent to 68 m3 per tonne of finished product. Wastewater is treated at Crofton, Port Alberni, Powell River and Rumford using primary and secondary treatment technologies before discharge to receiving waters. All discharges of treated process and cooling water are routinely tested, monitored, and results shared with regulators at required intervals. The Biron mill discharges wastewater to the Verso Corporation owned WQC for treatment per the terms of an operating agreement. There are currently no recognised material deficiencies in the quality of any of our wastewater discharges.
The Corporation is working on a number of issues relating to water use and wastewater. New USEPA rules affect our cooling water intakes at Biron where we will undertake studies in 2016 with time to meet compliance by June 2020. Rumford is working with state regulators to finalize limits for aluminum, cadmium and copper in treated effluent. Powell River has applied to the Province of British Columbia to increase its allowable biochemical oxygen demand (“BOD”) discharges by 10%.
In December 2015, the Corporation pleaded guilty to three Environment Canada charges; two relating to discharges of partially treated wastewater in 2012 and 2014 caused by unforeseeable power interruptions and one related to failure to sample those discharges. A $15,000 fine and $185,000 payment to the Environmental Damages Fund was made by the Corporation. The Corporation has since 2013 spent over $2 million upgrading the Powell River waste water infrastructure including installation of numerous diesel powered backup generators.
Air Emissions
Over the past twenty years, substantial capital has been spent at all facilities upgrading air emissions controls and infrastructure. This includes odour collection and treatment systems and new precipitators at Crofton and Rumford, a fluidized bed boiler conversion at Port Alberni and a fluidized bed boiler at Powell River. We believe that our facilities are generally well positioned to comply with expected future air emissions standards.
Canadian federal and provincial regulators established voluntary performance standards in 2013 for major industries in Canada with respect to particulate matter (PM) and sulphur dioxides (SO2). Catalyst’s Canadian mills are in material compliance with the voluntary standards. In 2015, the regulators released proposed 2020 mandatory SO2 targets which our Canadian mills should also be able comply with without further modification. By 2017, the Canadian regulators also plan to propose mandatory limits for NOx, ozone and particulate matter (PM2.5).
Our US operations are subject to various stringent air regulations including the USEPA’s Maximum Achievable Control Technology (MACT) standards for industrial boilers. One boiler at Biron is impacted by this standard and will require capital infusion of approximately $2 million by the end of 2016 to meet the regulatory compliance deadline of January 31, 2017 to convert to natural gas firing.
Climate Change
We have long recognized the importance of GHG reductions, from the perspective of both stakeholder expectations and expanding regulatory requirements. At our Canadian operations, direct GHG emissions in 2015 were at 15% of their 1990 levels on an absolute basis reflecting best in class performance.
We have been recognized through the Carbon Disclosure Project for the quality and financial relevance of our climate change disclosure and we introduced our Sage line of environmentally preferred products in 2010 and continue to offer manufactured carbon neutral products. By virtue of early response and rigorous carbon accounting, we believe we are well positioned relative to developments like proposed increases to B.C.’s carbon tax.
Our Canadian operations are unlikely to be adversely affected by any federal regulation of greenhouse gases since BC’s current reduction targets are likely to be seen as at least equivalent to any new federal targets. BC’s announced goal of reducing the provincial release of GHGs is 33% by 2020, based on 2007 levels, with interim reduction targets of 6% by 2012 and 18% by 2016. BC has not issued any changes to its climate change policies at this time. Our US operations are currently not affected by any mandatory GHG reduction limits or carbon taxation. However, following U.S. EPA’s issuance of its endangerment finding relating to GHG, there have been several regulatory initiatives to further regulate GHG emissions in the United States. Future GHG emissions limits may require us to incur additional capital and operational expenditures but Catalyst does continue to focus on energy and fuel reduction initiatives which reduce our exposure to the costs of climate change.
Environmental Expenditures
In 2015, we spent approximately $800,000 on environmental capital projects. We estimate that capital expenditures relating to known environmental matters, including compliance issues and the assessment and remediation of the environmental condition of our properties, will total approximately $700,000 in 2016. Post 2016, we currently do not anticipate any issues that will require such levels of capital or operational spending as to materially impair our competitive position.
Contaminated Sites
Under environmental laws in effect in the jurisdictions that we operate, Catalyst could be responsible for the remediation of environmental contamination and may be subject to associated liabilities and claims for personal injury and property and natural resource damages. We own or operate numerous properties that have been in business for many years and have acquired and disposed of properties and businesses over time. During that time, we or prior owners or operators may have generated or disposed of wastes or stored or handled other materials that are or may be considered hazardous or may have polluted the soil, surface water or groundwater at or around our facilities. BC contaminated sites legislation specifies the circumstances in which investigations in respect of any property that has been used for certain industrial or commercial purposes must be carried out, and if a site is determined to be contaminated, remediation will normally be required under government supervision. Under US environmental laws, such as the Comprehensive Environmental Response, Compensation, and Liability Act of 1980, strict liability for the cost of cleanup of a contaminated site can be imposed upon current or former site owners and operators, or upon any party that sent waste to the site, regardless of the lawfulness of the activities that led to the contamination. To date, such laws have not resulted in any material cost to us but there can be no guarantee that such costs will not be incurred in the future as a consequence, for example, of the discovery of unknown conditions or changes in enforcement policies. We are not aware that any of our sites or land parcels are requiring further remediation actions or cleanup at this time.
SOCIALRESPONSIBILITY
Corporate Social Responsibility Program
Catalyst continues to distinguish itself in the marketplace with its leading corporate social responsibility program. We strive to deliver non-controversial paper and pulp products by minimizing the impact of our operations and use of non-renewable resources, using only raw fiber from sustainability managed forests, working with many of the world’s most recognized environmental non-government organizations, transparently communicating our performance, and actively demonstrating leadership by engaging all stakeholders on pertinent local and global issues. We plan to continue to leverage this operational advantage in the marketplace.
Fibre Certification Chain of Custody
We have implemented the FSC, PEFC and SFI chain of custody systems to verify that select paper products made at our Canadian and US mills contain 100% certified wood fibre. Certified fibre is an effective means of providing customers and stakeholders with surety that our forest based products come from sustainability well managed, non-controversial sources of wood. We annually disclose our fibre pedigree in our annual Sustainability Report and through the CDP Forests program enhancing our transparency and public access to accurate data. Catalyst does not currently source any virgin wood fibre from boreal forest sources.
Aboriginal Relations and Business Development
We continue to maintain cordial relationships with numerous First Nations bands in proximity of our mills, and to develop aboriginal business initiatives at a pace and scope suitable to the capacity of each band. The most extensive initiative is a limited partnership with the Tla’amin (“Sliammon”) Nation and the City of Powell River which was formed in 2006.
In 2014, we began exploring business opportunities with the Halalt First Nation who are located near the Crofton mill in B.C. Those discussions came to an impasse in February 2015 when they broke off talks. In January 2016, the Halalt filed the two claims described above under the heading “Three Year History – 2016 Subsequent Developments- Two Lawsuits Filed by Halalt First Nation”.
| ITEM 4A | UNRESOLVED STAFF COMMENTS |
None.
| ITEM 5 | OPERATING AND FINANCIAL REVIEW AND PROSPECTS |
The following operating and financial review and prospects provides information that we believe is useful in understanding our operating results, cash flows and financial condition for the three years ended December 31, 2015.
Business overview
The acquisition of the U.S. paper mills in Biron, Wisconsin and Rumford, Maine was a transformational event for our Company, and significantly changed our product mix, cost structure, operational footprint and market share of coated paper. As expected, earnings and cash flow for the first half of 2015 were negatively impacted by higher capital spending, transition and separation costs related to the integration of the U.S. paper mills, and a delay in fully eliminating the costs related to the indefinite curtailment of Powell River’s No. 9 paper machine in December 2014. Our results improved significantly in the second half of the year due to integration synergies, product mix optimization and continued mill Revitalization Program efforts.
A number of one-time events negatively impacted our operating earnings for the year, significantly increasing maintenance, labour and overhead costs and lowering production volumes. These events, which reduced our earnings by approximately $38 million, included the Rumford recovery boiler upgrade, Crofton oxygen plant outage, significant second quarter market curtailment at our Rumford, Port Alberni and Powell River mills, restructuring costs related to Powell River’s Revitalization Program, legal fees and duties incurred on a countervailing action and acquisition costs related to the U.S. paper mills.
The positive impact of a weaker Canadian dollar was mostly offset by lower paper and pulp pricing, due to declining North American paper demand, increased foreign paper imports into the U.S. in response to the strong U.S. dollar, and the impact of economic slowdown in China on the pulp market. The profitability of our supercalendered paper sales were negatively impacted by the imposition of countervailing duties on our U.S. exports, as further described below under the headingImposition of Countervailing Duties.
Our mill Revitalization Program, first initiated at the Powell River mill in the fourth quarter of 2014, has been expanded to both of our U.S. mills. Under this program, we have realized substantial reductions in headcount and related labour costs along with other cost savings across our operations. This was partially offset by the negative impact of a hydroelectricity rate increase on our Canadian operations, high energy cost in the first quarter at our U.S. operations due to exceptionally cold weather, significant price escalation on fibre in the regions where our U.S. mills are located, and the strong U.S. dollar pushing U.S. dollar denominated costs higher.
Financial Performance
We recorded a net loss of $49.4 million and a net loss before specific items of $28.0 million in 2015. This compared to a net loss of $72.3 million and a net loss before specific items of $28.3 million in 2014.
Significant specific items in 2015 included a bargain purchase gain related to the acquisition of the U.S. paper mills, market curtailment at our Port Alberni, Powell River and Rumford mills, the cost and production impact of an unplanned oxygen plant outage at our Crofton mill, a recovery boiler upgrade at our Rumford mill, restructuring costs, professional fees related to a countervailing action filed against the Company and a foreign exchange loss on the translation of U.S. dollar denominated debt.
Significant specific items in the prior year included an impairment charge on fixed assets, acquisition costs related to the U.S. paper mills, restructuring costs related to the Powell River No. 9 indefinite curtailment, settlement loss on a multi-employer pension plan liability related to the discontinued Snowflake mill, a foreign exchange loss on the translation of U.S. dollar denominated debt, a gain on the sale of a mortgage receivable from PRSC Limited Partnership and interest in PRSC Land Development Ltd and a net loss on the settlement of debt.
Selected Annual Financial Information
| (In millions of dollars, except where otherwise stated) | | 2015 | | | 2014 | | | 2013 | |
| Sales 2 | | $ | 1,991.1 | | | $ | 1,109.3 | | | $ | 1,051.4 | |
| Operating earnings (loss) 2 | | | (12.7 | ) | | | (13.5 | ) | | | (87.8 | ) |
| Depreciation and amortization 2 | | | 61.4 | | | | 44.6 | | | | 47.0 | |
| Adjusted EBITDA 1,2 | | | 48.7 | | | | 47.6 | | | | 46.1 | |
| − before specific items 1,2 | | | 86.7 | | | | 51.2 | | | | 47.3 | |
| Net earnings (loss) attributable to the Company | | | (49.4 | ) | | | (72.3 | ) | | | (127.6 | ) |
| − before specific items 1 | | | (28.0 | ) | | | (28.3 | ) | | | (31.5 | ) |
| Total assets | | | 919.1 | | | | 668.7 | | | | 700.1 | |
| Total long-term liabilities | | | 788.1 | | | | 624.0 | | | | 565.5 | |
| Adjusted EBITDA margin 1,2 | | | 2.4 | % | | | 4.3 | % | | | 4.4 | % |
| − before specific items 1,2 | | | 4.4 | % | | | 4.6 | % | | | 4.5 | % |
| Net earnings (loss) per share attributable to the Company’s common shareholders (in dollars) | | | | | | | | | | | | |
| - basic and diluted from continuing operations | | $ | (3.41 | ) | | $ | (4.99 | ) | | $ | (9.01 | ) |
| - basic and diluted from discontinued operations | | | – | | | | – | | | | 0.21 | |
| - before specific items | | | (1.93 | ) | | | (1.95 | ) | | | (2.17 | ) |
| (In thousands of tonnes) | | | | | | | | | | | | |
| Sales 2 | | | 2,134.3 | | | | 1,389.3 | | | | 1,373.3 | |
| Production 2 | | | 2,136.8 | | | | 1,403.5 | | | | 1,382.6 | |
| Common shares (millions) | | | | | | | | | | | | |
| At period-end | | | 14.5 | | | | 14.5 | | | | 14.5 | |
| Weighted average | | | 14.5 | | | | 14.5 | | | | 14.5 | |
| 1 | Refer toNon-GAAP measures. |
| 2 | Numbers exclude the Snowflake mill’s results from operations which have been reclassified as discontinued operations; earnings from discontinued operations, net of tax, are shown separately from continuing operations in the consolidated statements of earnings (loss) in our annual consolidated financial statements for the year ended December 31, 2015. |
Market Overview

* Uncoated mechanical is comprised of high-gloss and standard grades.
North American demand decreased for all paper grades in 2015. The decline in North American demand was most significant for directory paper at 25.0%, while newsprint and uncoated mechanical grades declined by 10.1% and 10.9%, respectively. The 9.7% reduction in demand for coated groundwood was partly due to capacity closures in the year, while the decline in coated freesheet demand was more moderate at 4.3%. Declining demand and increased imports due to the strong U.S. dollar drove average benchmark prices lower for newsprint and uncoated mechanical. Directory prices remained flat, while prices for coated paper increased due to capacity closures which more than offset the decline in demand.
The global market for NBSK pulp increased by 1.9% from the prior year. NBSK pulp benchmark prices for China decreased in 2015 due to increased pulp capacity and economic slowdown in China.
Canadian Dollar
The chart below illustrates the movement of the US$/CDN$ average spot rate over the past three years:

US$/CDN$ Exchange
| | | 2013 | | | 2014 | | | 2015 | |
| | | Q1 | | | Q2 | | | Q3 | | | Q4 | | | Q1 | | | Q2 | | | Q3 | | | Q4 | | | Q1 | | | Q2 | | | Q3 | | | Q4 | |
| Average spot rate | | | 0.992 | | | | 0.977 | | | | 0.963 | | | | 0.953 | | | | 0.906 | | | | 0.917 | | | | 0.918 | | | | 0.881 | | | | 0.806 | | | | 0.813 | | | | 0.764 | | | | 0.749 | |
| Average effective rate | | | 0.992 | | | | 0.977 | | | | 0.963 | | | | 0.953 | | | | 0.906 | | | | 0.917 | | | | 0.918 | | | | 0.881 | | | | 0.805 | | | | 0.813 | | | | 0.764 | | | | 0.749 | |
| Period-end spot rate | | | 0.985 | | | | 0.951 | | | | 0.972 | | | | 0.940 | | | | 0.905 | | | | 0.937 | | | | 0.892 | | | | 0.862 | | | | 0.789 | | | | 0.802 | | | | 0.747 | | | | 0.723 | |
The majority of our sales are denominated in U.S. dollars. The Canadian dollar weakened in 2015 primarily due to falling oil and other commodity prices and continued to trade below par against the U.S. dollar. There was no difference between our average effective exchange rate and the average spot rate in 2015. The US$/CDN$ exchange rate movement in 2015 compared to 2014 resulted in a positive variance of $192.4 million on revenue and a positive variance of $124.1 million on adjusted EBITDA. Year-end spot rate movement resulted in an after-tax foreign exchange loss of $57.7 million on the translation of U.S. dollar denominated debt in 2015, compared to an after-tax foreign exchange loss of $24.1 million in 2014. We have a program in place to hedge a portion of our anticipated U.S. dollar sales, although, effective April 1, 2010, we no longer designate the positions as hedges for accounting purposes. At December 31, 2015, we had foreign currency options and forward contracts with a notional principal of US$115.0 million with major financial institutions. Refer to our annual consolidated financial statements for the year ended December 31, 2015 note 26,Financial instruments, for additional details.
CONSOLIDATED RESULTS - ANNUAL
CONSOLIDATED RESULTS OF OPERATIONS
Year ended December 31, 2015 compared to year ended December 31, 2014
Sales
Sales revenues increased by 79% due to the addition of approximately 738,000 tonnes of coated paper sales and approximately 80,000 tonnes of pulp sales in 2015 from the acquisition of the U.S. paper mills, the positive impact of a weaker Canadian dollar, and a significant change to our product mix reflecting the addition of higher priced specialty grades manufactured at the Rumford and Biron mills.
Adjusted EBITDA
The following table provides variances between periods for adjusted EBITDA:
| (In millions of dollars) | | Adjusted EBITDA 1 | |
| 2014 | | $ | 47.6 | |
| Paper prices | | | 23.6 | 2 |
| Pulp prices | | | (38.1 | ) |
| Impact of Canadian dollar | | | 111.9 | |
| Volume and mix | | | 187.9 | 2 |
| Distribution costs | | | 31.2 | |
| Furnish mix and costs | | | (122.5 | )2 |
| Chemical costs | | | 23.8 | |
| Operating supplies | | | (6.8 | ) |
| Power and fuel costs | | | 22.2 | |
| Labour costs | | | (119.1 | ) |
| Maintenance costs | | | (69.4 | ) |
| Property taxes, licenses and insurance | | | (6.9 | ) |
| Selling, general and administrative costs | | | (21.3 | ) |
| Lower of cost or market impact on inventory, net of inventory change | | | 0.4 | |
| Power generation | | | 2.4 | |
| Restructuring costs | | | (1.3 | ) |
| Inventory valuation | | | (12.2 | ) |
| Other, net | | | (4.7 | ) |
| 2015 | | $ | 48.7 | |
| 1 | Refer toNon-GAAP measures, for further details. |
| 2 | Variances are attributable to the addition of approximately 738,000 tonnes of coated paper sales and approximately 80,000 tonnes of pulp sales related to the January 7, 2015 acquisition of the U.S. paper mills. |
Operating Earnings (Loss)
Operating earnings increased by $0.8 million due to an impairment charge in the prior year of $16.5 million and higher adjusted EBITDA of $1.1 million, partially offset by higher depreciation in the current year of $16.8 million.
Net Earnings (Loss)
Net earnings increased by $22.9 million due primarily to an after-tax bargain purchase gain of $43.9 million on the acquisition of the U.S. paper mills, an income tax recovery related to the reduction of a valuation allowance and recognition of deferred tax benefits of $26.7, an increased after-tax foreign exchange gain on the translation of U.S. dollar denominated working capital of $2.5 million and higher after-tax operating earnings of $0.9 million, partly offset by higher after-tax interest expense of $12.9 million, an increased after-tax foreign exchange loss on the translation of U.S. dollar denominated debt of $33.6 million and an increased after-tax loss on foreign currency options and forward contracts of $11.7 million.
The following table reconciles 2015 net earnings (loss) attributable to the Company to 2014:
| (In millions of dollars) | | Pre-tax | | | After-tax | |
| 2014 net loss attributable to the Company | | $ | (71.9 | ) | | $ | (72.3 | ) |
| Higher adjusted EBITDA | | | 1.1 | | | | 1.2 | |
| Higher depreciation and amortization expense | | | (16.8 | ) | | | (16.8 | ) |
| Lower impairment charge | | | 16.5 | | | | 16.5 | |
| Change in foreign exchange gain (loss) on long-term debt | | | (33.6 | ) | | | (33.6 | ) |
| Higher other income, net | | | (2.1 | ) | | | 24.6 | |
| Bargain purchase gain | | | 43.9 | | | | 43.9 | |
| Higher interest expense | | | (13.9 | ) | | | (12.9 | ) |
| 2015 net loss attributable to the Company | | $ | (76.8 | ) | | $ | (49.4 | ) |
Segmented Results - Annual
As of January 1, 2015, we changed our operating segments to reflect our new reporting structure and expanded product range and production capacity resulting from the acquisition of the Biron and Rumford mills on January 7, 2015. Our operating segments, formerly categorized as specialty printing papers, newsprint and pulp, have been expanded to four categories: coated paper, uncoated paper, newsprint, and pulp. We have restated comparative segmented results accordingly.
Coated paper includes coated groundwood, coated freesheet, and coated one-sided specialty paper. We produce coated paper at our Port Alberni, Biron and Rumford mills. Uncoated paper includes uncoated mechanical and directory (lightweight uncoated) paper. We produce uncoated paper primarily at our Powell River and Port Alberni mills, and continue to produce newsprint paper primarily at our Crofton mill.
The pulp segment continues to consist of NBSK pulp that we produce at our Crofton mill. The kraft pulp that we produce at our Rumford mill is used primarily in the production of coated paper at Rumford, while our Canadian pulp is produced primarily to be marketed and sold into Asia. The revenue and cost related to market pulp produced at Rumford will therefore not be reported under the pulp operating segment, and will be treated as a corporate adjustment outside of our segmented results.
Coated Paper
| (In millions of dollars, except where otherwise stated) | | 2015 | | | 2014 | | | 20132 | |
| Sales | | $ | 1,033.8 | | | $ | 181.7 | | | $ | 176.4 | |
| Operating earnings (loss) | | | (25.1 | ) | | | (6.9 | ) | | | (5.1 | ) |
| Depreciation and amortization | | | 24.0 | | | | 6.5 | | | | 8.0 | |
| Adjusted EBITDA1 | | | (1.1 | ) | | | (0.4 | ) | | | 2.9 | |
| –before specific items1 | | | 19.9 | | | | 2.7 | | | | 3.0 | |
| Adjusted EBITDA margin1 | | | (0.1 | )% | | | (0.2 | )% | | | 1.6 | % |
| –before specific items1 | | | 1.9 | % | | | 1.5 | % | | | 1.7 | % |
| (In thousands of tonnes) | | | | | | | | | | | | |
| Sales | | | 937.1 | | | | 194.0 | | | | 188.9 | |
| Production | | | 942.5 | | | | 196.8 | | | | 191.0 | |
| 1 | Refer toNon-GAAP measures. |
| 2 | Numbers exclude the Snowflake mill’s results from operations which have been reclassified as discontinued operations in the consolidated statements of earnings (loss) in the annual consolidated financial statements for the year ended December 31, 2015. |
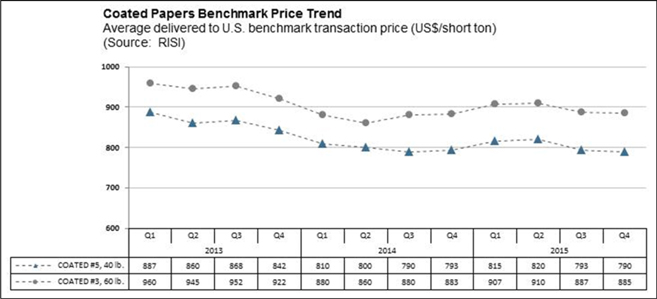
Segment Overview
North American demand for coated groundwood decreased by 9.7% and for coated freesheet decreased by 4.3% for the year due to reduced advertising pages in magazines and a decrease in catalogues being mailed out. North American inventories of coated paper grew in the year. Operating rates for coated paper continued to be strong due to capacity closures balancing declining North American demand and an increase in foreign imports resulting from the strong U.S. dollar. The average benchmark prices for coated no. 5 paper increased by 0.9% to US$805 per short ton, and increased for coated No. 3 paper by 2.7% to US$897 per short ton compared to the prior year.
We curtailed the Rumford No. 12 paper machine in 2015 due to a lack of orders and weak market conditions, resulting in curtailment of approximately 80,000 tonnes of coated paper based on the prior year’s production.
Operational Performance
The following chart summarizes the operating performance of our coated paper segment:
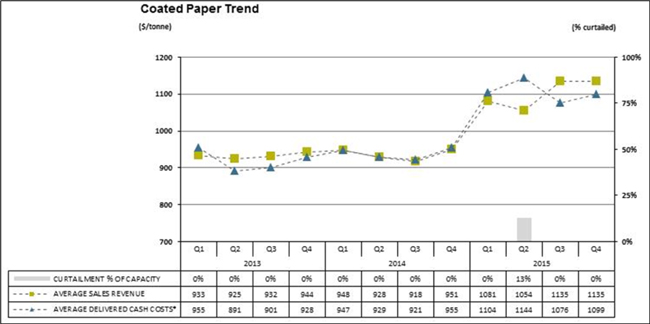
| * | Average delivered cash costs per tonne consist of cost of sales, excluding depreciation and amortization, and including the impact of SG&A and restructuring costs. |
The 2015 coated paper geographic sales distribution, based on sales volume, is depicted in the chart below:
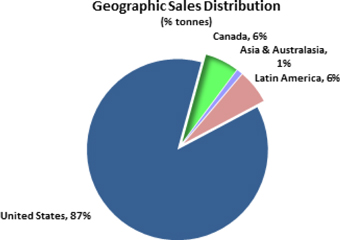
| · | Sales volume increased by 743,100 tonnes reflecting the addition of approximately 738,000 tonnes of sales of coated groundwood, coated freesheet and coated one-sided specialty paper with the acquisition of the U.S. paper mills, partially offset by market curtailment at Port Alberni in the second quarter. |
| · | Average sales revenue increased $167 per tonne due to the positive impact of a weaker Canadian dollar and the addition of higher-priced coated freesheet and coated one-sided specialty paper. |
| · | Average delivered cash costs increased by $166 per tonne reflecting higher fibre cost in the regions where the U.S. mills operate, the cost of the Rumford recovery boiler upgrade in the second quarter, lost production related to market curtailment at the Rumford and Port Alberni mills in the second quarter, higher utilization of kraft, coating and chemicals to manufacture coated freesheet and coated one-sided specialty paper, higher electric power rates for our Canadian operations, and the cost impact of a weaker Canadian dollar on freight, coating and chemical costs |
Uncoated Paper
| (In millions of dollars, except where otherwise stated) | | 2015 | | | 2014 | | | 20132 | |
| Sales | | $ | 382.5 | | | $ | 425.0 | | | $ | 458.7 | |
| Operating earnings (loss) | | | (11.2 | ) | | | (44.0 | ) | | | (97.3 | ) |
| Depreciation and amortization | | | 25.5 | | | | 28.4 | | | | 32.4 | |
| Adjusted EBITDA1 | | | 14.3 | | | | 0.9 | | | | 22.0 | |
| – before specific items1 | | | 26.9 | | | | 1.4 | | | | 22.6 | |
| Adjusted EBITDA margin1 | | | 3.7 | % | | | 0.2 | % | | | 4.8 | % |
| – before specific items1 | | | 7.0 | % | | | 0.3 | % | | | 4.9 | % |
| (In thousands of tonnes) | | | | | | | | | | | | |
| Sales | | | 425.9 | | | | 507.9 | | | | 573.1 | |
| Production | | | 418.3 | | | | 511.3 | | | | 579.9 | |
| 1 | Refer toNon-GAAP measures. |
| 2 | Numbers exclude the Snowflake mill’s results from operations which have been reclassified as discontinued operations in the consolidated statements of earnings (loss) in the annual consolidated financial statements for the year ended December 31, 2015. |
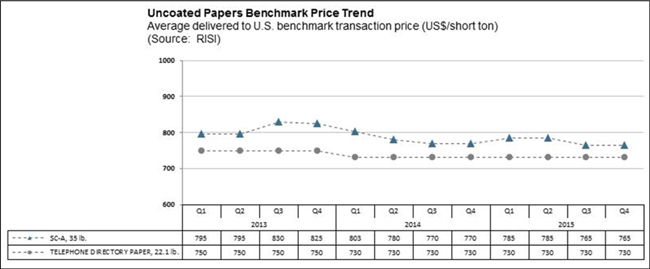
Segment Overview
North American demand for uncoated mechanical paper decreased by 10.9% compared to the prior year reflecting reduced advertising and page count in the retail sector. The average benchmark prices for soft-calendered A grade (SC-A) decreased by 0.7% to US$775 per short ton. North American directory demand fell 25.0% in the year compared to the prior year due to ongoing pressure to reduce or eliminate white pages, smaller books, lower circulation, and the continued migration from printed books to the Internet. The average directory benchmark price remained flat at US$730 per short ton due to contract pricing and operating rates remaining strong despite declining demand due to continued capacity reduction in the directory marketplace.
The Powell River No. 9 paper machine, permanently curtailed in December 15, 2014, remained indefinitely curtailed throughout 2015, resulting in 110,000 tonnes of curtailment of uncoated paper on an annualized basis.
Operational Performance
The following chart summarizes the operating performance of our uncoated paper segment:
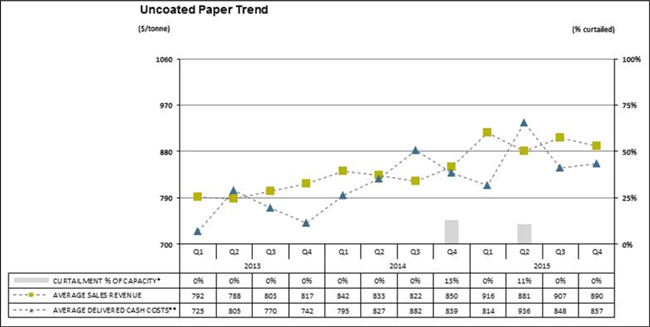
| * | Average delivered cash costs per tonne consist of cost of sales, excluding depreciation and amortization, and including the impact of SG&A and restructuring costs. |
The 2015 uncoated papers geographic sales distribution, based on sales volume, is depicted in the chart below:
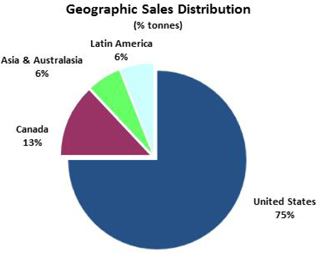
| · | Sales volume decreased by 82,000 tonnes due to the indefinite curtailment of Powell River No. 9 paper machine in the fourth quarter of 2014 and lost tonnes due to market curtailment at the Port Alberni mill and Powell River mills in the second quarter. |
| · | Average sales revenue increased $61 per tonne due to the positive impact of a weaker Canadian dollar, partly offset by lower average transaction prices and the imposition of the countervailing duties on U.S. exports of SC Paper. |
| · | Average delivered cash costs increased by $29 per tonne due to increased cost of fibre, electric power and steam fuel, lost production related to the Q2 market curtailment, and the cost impact of a weaker Canadian dollar on freight, furnish and chemical costs, partly offset by fixed cost savings from the curtailment of the Powell River No. 9 paper machine and Revitalization Program initiatives. |
Newsprint
| (In millions of dollars, except where otherwise stated) | | 2015 | | | 2014 | | | 20132 | |
| Sales | | $ | 235.5 | | | $ | 237.9 | | | $ | 192.3 | |
| Operating earnings (loss) | | | (10.4 | ) | | | (0.6 | ) | | | 8.4 | |
| Depreciation and amortization | | | 7.3 | | | | 7.3 | | | | 5.1 | |
| Adjusted EBITDA1 | | | (3.1 | ) | | | 6.7 | | | | 13.5 | |
| – before specific items1 | | | (1.8 | ) | | | 6.7 | | | | 13.9 | |
| Adjusted EBITDA margin1 | | | (1.3 | )% | | | 2.8 | % | | | 7.0 | % |
| – before specific items1 | | | (0.8 | )% | | | 2.8 | % | | | 7.2 | % |
| (In thousands of tonnes) | | | | | | | | | | | | |
| Sales | | | 346.0 | | | | 347.4 | | | | 283.3 | |
| Production | | | 342.5 | | | | 351.8 | | | | 288.5 | |
| 1 | Refer toNon-GAAP measures. |
| 2 | Numbers exclude the Snowflake mill’s results from operations which have been reclassified as discontinued operations in the consolidated statements of earnings (loss) in the annual consolidated financial statements for the year ended December 31, 2015. |

Segment Overview
North American newsprint shipments were down by 4.1% in 2015 mostly due to lower newspaper print advertising and declining circulation. Reduced shipments also reflected North American capacity closures in the year. Newsprint inventories fell for the year compared to 2014 levels. The average North American newsprint benchmark price decreased 13.7% to US$520 per metric tonne compared to the previous year.
We announced a USA US$30 per tonne price increase for 48.8 gsm newsprint in December which was later revised to US$20 for January 1, 2016. Subsequently, another US$20 per tonne was announced for the USA market.
Additionally, we announced and are implementing a C$15 per tonne increase in Canada effective January 1, 2016, with an additional $20 per tonne to be implemented Feb 1, 2016.
Operational Performance
The following chart summarizes the operating performance of our newsprint segment:

| * | Average delivered cash costs per tonne consist of cost of sales, excluding depreciation and amortization, and including the impact of SG&A and restructuring costs. |
The 2015 newsprint geographic sales distribution, based on sales volume, is depicted in the chart below:
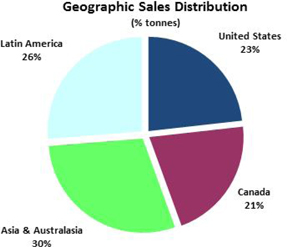
| · | Sales volume decreased by 1,400 tonnes compared to the prior year. |
| · | Average sales revenue decreased by $4 per tonne due to lower average transaction prices, partially offset by the positive impact of a weaker Canadian dollar. |
| · | Average delivered cash costs decreased $24 per tonne due primarily to incremental cost and lost production related to the Crofton oxygen plant outage in the second quarter and increased cost of distribution, chemicals, fibre, fillers and electric power, partially offset by lower maintenance spending. |
Pulp
| (In millions of dollars, except where otherwise stated) | | 2015 | | | 2014 | | | 20132 | |
| Sales | | $ | 278.8 | | | $ | 264.7 | | | $ | 224.0 | |
| Operating earnings (loss) | | | 39.0 | | | | 38.0 | | | | 6.1 | |
| Depreciation and amortization | | | 3.6 | | | | 2.4 | | | | 1.5 | |
| Adjusted EBITDA1 | | | 42.6 | | | | 40.4 | | | | 7.6 | |
| – before specific items1 | | | 45.7 | | | | 40.4 | | | | 7.8 | |
| Adjusted EBITDA margin1 | | | 15.3 | % | | | 15.3 | % | | | 3.4 | % |
| – before specific items1 | | | 16.4 | % | | | 15.3 | % | | | 3.5 | % |
| (In thousands of tonnes) | | | | | | | | | | | | |
| Sales | | | 345.3 | | | | 340.0 | | | | 328.0 | |
| Production | | | 344.6 | | | | 343.6 | | | | 323.2 | |
| 1 | Refer toNon-GAAP measures. |
| 2 | Numbers exclude the Snowflake mill’s results from operations which have been reclassified as discontinued operations in the consolidated statements of earnings (loss) in the annual consolidated financial statements for the year ended December 31, 2015. |
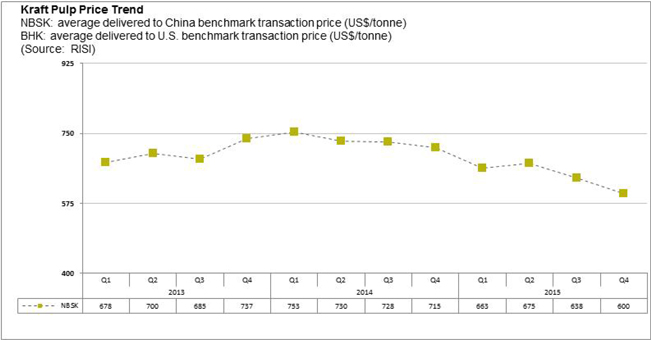
Segment Overview
Global shipments of NBSK pulp increased by 1.9% in 2015 compared to the prior year. The average NBSK benchmark price for China decreased by 12.0% to US$644 per tonne compared to the prior year due to increased pulp capacity and economic slowdown in China.
Operational Performance
The following chart summarizes the operating performance of our pulp segment:

| * | Average delivered cash costs per tonne consist of cost of sales, excluding depreciation and amortization, and including the impact of SG&A and restructuring costs. |
The primary market for our market pulp is Asia. The 2015 pulp geographic sales distribution, based on sales volume, is depicted in the chart below:
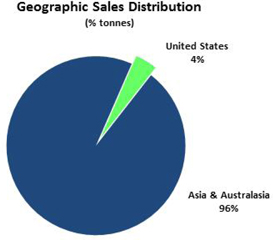
| · | Sales volume increased by 5,300 tonnes compared to the prior year due to increased productivity, partially offset by the production impact of the Crofton oxygen plant outage in the second quarter. |
| · | Average sales revenue increased by $29 per tonne due to the positive impact of a weaker Canadian dollar, partially offset by lower average transaction prices. |
| · | Average delivered cash costs increased by $24 per tonne due to higher fibre and chemical costs and increased maintenance spending partly due to the Crofton oxygen plant outage, partly offset by reduced distribution, steam fuel and kilns fuel costs. |
FINANCIAL CONDITION
The following table highlights the significant changes between the consolidated balance sheets as at December 31, 2015 and December 31, 2014:
| (In millions of dollars) | | 2015 | | | 2014 | | | Variance | | | Comments |
| Working capital | | $ | 210.6 | | | $ | 144.6 | | | $ | 66.0 | | | Increase in net working capital was mostly attributable to the addition of the accounts receivable, inventories, prepaids and accounts payable of the Biron and Rumford mills on the acquisition of the U.S. paper mills. |
| Assets held for sale | | | 1.5 | | | | 1.5 | | | | – | | | No change to assets held for sale. We continue to actively market the remaining poplar plantation land. |
| Property, plant and equipment | | | 456.9 | | | | 379.3 | | | | 77.6 | | | Increase mostly due to the addition of property, plant and equipment on acquisition of the U.S. paper mills and the revaluation of those assets, denominated in U.S. dollar as the functional currency of the acquired U.S. operations, to the weaker Canadian dollar. |
| Other assets | | | 5.6 | | | | 6.0 | | | | (0.4 | ) | | Decrease due to a reduction in deferred charges and the amortization of deferred financing costs, partially offset by the recognition of deferred financial costs on the issuance of the Offered Notes and increased borrowings under the ABL Facility related to the acquisition of the U.S. paper mills. |
| Total debt | | | 497.8 | | | | 329.1 | | | | 168.7 | | | Increase due to the impact of the weak Canadian dollar on the translation of U.S. dollar denominated debt, as well as the issuance of the Offered Notes and increased borrowings under the ABL Facility related to the acquisition of the U.S. paper mills. |
| Employee future benefits | | | 267.1 | | | | 282.4 | | | | (15.3 | ) | | Decrease due mostly to the recognition of a net actuarial gain of $19.1 million on our pension and other post-employment benefit programs as of December 31, 2015. |
| Other long-term obligations | | | 26.4 | | | | 15.5 | | | | 10.9 | | | Increase mostly due to the assumption of workers’ compensation liabilities and an asset retirement obligation for Rumford’s future landfill remediation related to the acquisition of the U.S. paper mills. |
OUTLOOK
Economy
The United States is expected to continue to lead global economic growth in 2016. Divergent monetary policies and the continued decline in oil and other commodity prices due to supply and demand imbalances have supported a strengthening U.S. dollar against most currencies, including the Canadian dollar, and we expect this trend to persist into 2016. Volatility of the Canadian dollar may significantly impact our operating and net earnings, cash flow and liquidity.
Markets
North American paper markets are expected to remain challenging in 2016 with the continued migration to electronic media. Although there were significant capacity reductions in the year in the North American newsprint and coated paper markets, this was offset by declining demand and higher foreign imports into the U.S. We expect that coated and uncoated paper demand will decline in the first half of 2016 before rebounding in the seasonally stronger second half of the year. Demand for directory paper will continue to decline due to paper conservation moves by publishers and migration to electronic media. Our directory sales are mostly under contract, and therefore, we do not expect pricing and demand to fluctuate significantly through the first half of 2016.
Newsprint demand in 2016 is expected to contract further due to declining circulation, page count reductions, conservation measures by publishers, and continued migration of information and advertising to the Internet. Newsprint prices for the remainder of the year will depend on the supply and demand balance. We are in the process of implementing a number of announced newsprint price increases on a 48.8 gsm basis. For the U.S., a US$20 per tonne increase on January 1st, with another US$20 per tonne increase on February 1, 2016. For Canada, a $15 per tonne increase on January 1st, with another $20 per tonne on February 1, 2016.
For NBSK pulp, Chinese buying patterns and requirements are expected to continue to drive the market in 2016.
Operations and capital spending
Price pressure for key inputs is expected to be marginal with the exception of power costs for our B.C. operations that will be unfavourably impacted by an announced energy cost rate increase of 4.0%, effective April 1, 2016. Declining fibre prices in the regions where our U.S. paper mills are located due to recent regional pulp and paper capacity closures are expected to have a deflationary impact on the furnish costs of our U.S. operations in 2016.
Having successfully completed the transition and system cutover with regard to the acquired U.S. paper mills, there will be an anticipated saving in related overhead and capital costs, but this will be partially offset by the full-year cost of incremental staff and infrastructure that were added in 2015 to support the marketing, operational and logistical activities of the U.S. paper mills. We will continue to drive savings through operational improvements by leveraging our OFI program and our mill Revitalization Program.
We will continue to optimize our product mix by increasing our market share in higher margin coated freesheet and coated one-sided specialty paper, and by targeting reduced basis weights in our coated groundwood and newsprint products. Our renewed focus in 2015 on new product development has yielded positive results, with a variety of specialty paper products and extensions to our existing products either at or near commercialization.
We will continue to pursue benefits under the BC Hydro Power Smart Program, having completed G13 at our Powell River mill in the quarter. A second project has been approved under the Program, with construction at our Crofton mill scheduled to commence in 2016 and slated for completion in 2017. In addition to the Power Smart Program, we will continue participating in BC Hydro’s load curtailment pilot initiative at our three Canadian mills. We will continue our discussions with key stakeholders on a suite of additional potential initiatives to further mitigate the impact of energy rate escalation.
Our maintenance plan for 2016 includes a total mill outage at our Crofton mill that was delayed from 2015, and our regular outages related to power and recovery boilers.
The following table summarizes major planned maintenance shutdown costs and related production downtime for 2016:
| | | 2016 | |
| | | Q1 | | | Q2 | | | Q3 | | | Q4 | | | Total | |
| Mill Location | | Tonnage
Impact | | | Mtce
Cost
($mm) | | | Tonnage
Impact | | | Mtce
Cost
($mm) | | | Tonnage
Impact | | | Mtce
Cost
($mm) | | | Tonnage
Impact | | | Mtce
Cost
($mm) | | | Tonnage
Impact | | | Mtce
Cost
($mm) | |
| Alberni | | | | | | | | | | | | | | | | | | | | | | | | | | | | | | | | | | | | | | | | |
| Other1 | | | – | | | | – | | | | – | | | | – | | | | – | | | | 0.2 | | | | – | | | | – | | | | – | | | | 0.2 | |
| Boilers | | | – | | | | – | | | | – | | | | – | | | | – | | | | 0.6 | | | | – | | | | 1.0 | | | | – | | | | 1.6 | |
| Crofton | | | | | | | | | | | | | | | | | | | | | | | | | | | | | | | | | | | | | | | | |
| TMO | | | – | | | | – | | | | 4,800 | | | | 2.5 | | | | – | | | | – | | | | – | | | | – | | | | 4,800 | | | | 2.5 | |
| Capital | | | – | | | | – | | | | 3,400 | | | | – | | | | – | | | | – | | | | – | | | | – | | | | 3,400 | | | | – | |
| Pulp | | | – | | | | – | | | | 9,600 | | | | 5.7 | | | | – | | | | – | | | | – | | | | – | | | | 9,600 | | | | 5.7 | |
| Boilers | | | – | | | | 3.8 | | | | – | | | | – | | | | – | | | | – | | | | – | | | | – | | | | – | | | | 3.8 | |
| Powell | | | | | | | | | | | | | | | | | | | | | | | | | | | | | | | | | | | | | | | | |
| Boilers | | | – | | | | 0.2 | | | | – | | | | 2.7 | | | | – | | | | – | | | | – | | | | – | | | | – | | | | 2.9 | |
| Biron | | | | | | | | | | | | | | | | | | | | | | | | | | | | | | | | | | | | | | | | |
| Boilers | | | – | | | | – | | | | – | | | | – | | | | – | | | | 2.2 | | | | – | | | | – | | | | – | | | | 2.2 | |
| Rumford | | | | | | | | | | | | | | | | | | | | | | | | | | | | | | | | | | | | | | | | |
| Pulp | | | – | | | | – | | | | – | | | | – | | | | – | | | | – | | | | 2,400 | | | | 8.8 | | | | 2,400 | | | | 8.8 | |
| Boilers | | | – | | | | – | | | | – | | | | – | | | | – | | | | 3.9 | | | | – | | | | 3.7 | | | | – | | | | 7.6 | |
| Total | | | – | | | | 4.0 | | | | 17,800 | | | | 10.9 | | | | – | | | | 6.9 | | | | 2,400 | | | | 13.5 | | | | 20,200 | | | | 35.3 | |
1 Includes maintenance in 2nd quarter on precipitator and maintenance in 3rd quarter on steam turbine generator.
Capital spending on both our Canadian and U.S. operations is expected to not exceed $35 million and will be managed to balance cash flow.
The Company will continue to hedge a portion of its U.S. dollar denominated sales in accordance with its policy to manage currency risk.
Liquidity, debt maturities and covenants
We do not currently anticipate any significant uses of cash in 2016 other than for our operations, working capital fluctuations, interest payments, Term Loan repayments and pension funding related to our Canadian and U.S. pension plans including our multi-employer pension plans. Based on liquidity currently at our disposal, we believe that we will be able to fund these requirements.
NON-GAAP MEASURES
Management uses certain measures that are not defined by U.S. GAAP to evaluate our performance. Such measures do not have a standardized meaning under U.S. GAAP and, as a result, the measures as employed by management are unlikely to be comparable to similarly titled measures reported by other entities. These non-GAAP measures should not be considered by an investor as an alternative to their nearest respective GAAP measure. Our non-GAAP measures include operating earnings (loss), adjusted EBITDA (earnings before interest, taxes, depreciation and amortization, impairment and other closure costs, and before other non-operating income and expenses), adjusted EBITDA before specific items, adjusted EBITDA margin, adjusted EBITDA margin before specific items, average delivered cash costs per tonne, net earnings (loss) attributable to the Company before specific items, net earnings (loss) per share attributable to the Company’s common shareholders before specific items, and free cash flow. We believe that, in addition to conventional measures prepared in accordance with U.S. GAAP, certain inventors use this information to evaluate our performance. Accordingly, it is intended to provide additional information and should not be considered in isolation or as a substitute for measures of performance prepared in accordance with U.S. GAAP.
Specific items are items that do not arise from the Company’s day-to-day operating, investing and financing activities, or items that are subject to material volatility based on factors outside of management’s control. Specific items include: foreign exchange gain or loss on long-term debt, gain or loss on cancellation of long-term debt, asset impairment and other closure costs, restructuring costs, unusual non-recurring items, and certain income tax adjustments.
Adjusted EBITDA and adjusted EBITDA before specific items
Adjusted EBITDA as defined equates to operating earnings (loss) plus depreciation and amortization and impairment and other closure costs. Adjusted EBITDA margin and adjusted EBITDA margin before specific items are defined as adjusted EBITDA and adjusted EBITDA before specific items as a percentage of sales.
These measures enable comparison of consolidated and segment operating results between periods without regard to debt service, income taxes, capital expenditure requirements, and specific items. These measures are provided to improve comparability between periods by eliminating the impact of financing (interest) and accounting (depreciation) items on our results.
Reconciliation of Net Earnings (Loss) Attributable to the Company by Year:
| (In millions of dollars) | | 2015 | | | 2014 | | | 2013 | |
| Net earnings (loss) attributable to the Company as reported | | $ | (49.4 | ) | | $ | (72.3 | ) | | $ | (127.6 | ) |
| Net earnings (loss) attributable to non-controlling interest | | | – | | | | – | | | | 0.3 | |
| Net earnings (loss) | | | (49.4 | ) | | | (72.3 | ) | | | (127.3 | ) |
| Depreciation and amortization1 | | | 61.4 | | | | 44.6 | | | | 47.0 | |
| Impairment | | | – | | | | 16.5 | | | | 86.9 | |
| Foreign exchange (gain) loss on long-term debt1 | | | 57.7 | | | | 24.1 | | | | 18.8 | |
| Bargain purchase gain | | | (43.9 | ) | | | | | | | | |
| Other (income) expense, net1 | | | 0.9 | | | | (1.2 | ) | | | (14.9 | ) |
| Interest expense, net1 | | | 49.4 | | | | 35.5 | | | | 37.4 | |
| Income tax (recovery) expense1 | | | (27.4 | ) | | | 0.4 | | | | 0.1 | |
| Reorganization items, net1 | | | – | | | | – | | | | 1.2 | |
| (Earnings) loss from discontinued operations net of tax | | | – | | | | – | | | | (3.1 | ) |
| Adjusted EBITDA | | $ | 48.7 | | | $ | 47.6 | | | $ | 46.1 | |
| Specific items | | | | | | | | | | | | |
| Restructuring costs | | | 1.8 | | | | 0.5 | | | | 1.2 | |
| Market curtailment | | | 11.7 | | | | – | | | | – | |
| Crofton oxygen plant outage | | | 4.4 | | | | – | | | | – | |
| Rumford recovery boiler upgrade | | | 11.0 | | | | – | | | | – | |
| Professional fees and duties on countervailing action | | | 7.7 | | | | – | | | | – | |
| Acquisition costs related to U.S. paper mills | | | 1.4 | | | | 3.1 | | | | – | |
| Total specific items | | | 38.0 | | | | 3.6 | | | | 1.2 | |
| Adjusted EBITDA before specific items | | $ | 86.7 | | | $ | 51.2 | | | $ | 47.3 | |
| 1 | Numbers exclude the Snowflake mill’s results from operations which have been reclassified as discontinued operations in the consolidated statements of earnings (loss) in the annual consolidated financial statements for the year ended December 31, 2015. |
Reconciliation to Net Earnings (Loss) Attributable to the Company by Quarter:
| | | 2015 | | | | | | 2014 | |
| (In millions of dollars) | | Total | | | Q4 | | | Q3 | | | Q2 | | | Q1 | | | Total | | | Q4 | | | Q3 | | | Q2 | | | Q1 | |
| Net earnings (loss) | | | (49.4 | ) | | | (26.3 | ) | | | (12.9 | ) | | | (32.4 | ) | | | 22.2 | | | | (72.3 | ) | | | (39.7 | ) | | | (22.5 | ) | | | (6.3 | ) | | | (3.8 | ) |
| Depreciation and amortization | | | 61.4 | | | | 17.3 | | | | 15.0 | | | | 14.8 | | | | 14.3 | | | | 44.6 | | | | 11.5 | | | | 11.2 | | | | 11.0 | | | | 10.9 | |
| Impairment | | | – | | | | – | | | | – | | | | – | | | | – | | | | 16.5 | | | | 16.5 | | | | – | | | | – | | | | – | |
| Foreign exchange (gain) loss on long-term debt | | | 57.7 | | | | 11.6 | | | | 24.0 | | | | (5.5 | ) | | | 27.6 | | | | 24.1 | | | | 9.2 | | | | 12.6 | | | | (8.9 | ) | | | 11.2 | |
| Bargain purchase gain | | | (43.9 | ) | | | – | | | | (1.7 | ) | | | (2.9 | ) | | | (39.3 | ) | | | – | | | | – | | | | – | | | | – | | | | – | |
| Other (income) expense, net | | | 0.9 | | | | (1.2 | ) | | | 2.5 | | | | (2.6 | ) | | | 2.2 | | | | (1.2 | ) | | | – | | | | (2.3 | ) | | | 3.2 | | | | (2.1 | ) |
| Interest expense, net | | | 49.4 | | | | 12.3 | | | | 13.5 | | | | 11.3 | | | | 12.3 | | | | 35.5 | | | | 9.0 | | | | 8.9 | | | | 8.1 | | | | 9.5 | |
| Income tax expense (recovery) | | | (27.4 | ) | | | 1.4 | | | | (1.6 | ) | | | (1.9 | ) | | | (25.3 | ) | | | 0.4 | | | | 0.3 | | | | 0.1 | | | | – | | | | – | |
| Adjusted EBITDA | | $ | 48.7 | | | $ | 15.1 | | | $ | 38.8 | | | $ | (19.2 | ) | | $ | 14.0 | | | $ | 47.6 | | | $ | 6.8 | | | $ | 8.0 | | | $ | 7.1 | | | $ | 25.7 | |
| Specific items | | | | | | | | | | | | | | | | | | | | | | | | | | | | | | | | | | | | | | | | |
| Restructuring costs | | | 1.8 | | | | 0.2 | | | | 0.3 | | | | 0.7 | | | | 0.6 | | | | 0.5 | | | | 0.5 | | | | – | | | | – | | | | – | |
| Market curtailment | | | 11.7 | | | | – | | | | – | | | | 11.7 | | | | – | | | | – | | | | – | | | | – | | | | – | | | | – | |
| Crofton oxygen plant outage | | | 4.4 | | | | – | | | | – | | | | 4.4 | | | | – | | | | – | | | | – | | | | – | | | | – | | | | – | |
| Rumford recovery boiler upgrade | | | 11.0 | | | | – | | | | – | | | | 11.0 | | | | – | | | | – | | | | – | | | | – | | | | – | | | | – | |
| Professional fees and duties on countervailing action | | | 7.7 | | | | 4.5 | | | | 2.1 | | | | 1.1 | | | | – | | | | – | | | | – | | | | – | | | | – | | | | – | |
| Acquisition costs related to U.S. paper mills | | | 1.4 | | | | – | | | | – | | | | – | | | | 1.4 | | | | 3.1 | | | | 3.1 | | | | – | | | | – | | | | – | |
| Total specific items | | | 38.0 | | | | 4.7 | | | | 2.4 | | | | 28.9 | | | | 2.0 | | | | 3.6 | | | | 3.6 | | | | – | | | | – | | | | – | |
| Adjusted EBITDA before specific items | | $ | 86.7 | | | $ | 19.8 | | | $ | 41.2 | | | $ | 9.7 | | | $ | 16.0 | | | $ | 51.2 | | | $ | 10.4 | | | $ | 8.0 | | | $ | 7.1 | | | $ | 25.7 | |
Net Earnings (Loss) Attributable to the Company before Specific Items
Specific items are defined previously, and the exclusion of such items from net earnings (loss) attributable to the Company facilitates the comparison of financial results between periods.
Reconciliation to Net Earnings (Loss) Attributable to the Company by Year:
| (In millions of dollars and after-taxes, except where otherwise stated) | | 2015 | | | 2014 | | | 2013 | |
| Net earnings (loss) attributable to the Company as reported | | $ | (49.4 | ) | | $ | (72.3 | ) | | $ | (127.6 | ) |
| Specific items: | | | | | | | | | | | | |
| Foreign exchange (gain) loss on long-term debt | | | 57.7 | | | | 24.1 | | | | 18.8 | |
| Bargain purchase gain | | | (43.9 | ) | | | – | | | | – | |
| Market curtailment | | | 11.7 | | | | – | | | | – | |
| Crofton oxygen plant outage | | | 4.4 | | | | – | | | | – | |
| Rumford recovery boiler upgrade | | | 11.0 | | | | – | | | | – | |
| Professional fees and duties on countervailing action | | | 7.7 | | | | – | | | | – | |
| Reduction of deferred tax asset valuation allowance | | | (30.4 | ) | | | – | | | | – | |
| Settlement loss on PIUMPF pension liability | | | – | | | | 1.2 | | | | – | |
| Settlement gain on special pension portability election | | | – | | | | – | | | | (2.6 | ) |
| Impairment and other closure costs1 | | | – | | | | 16.5 | | | | 87.1 | |
| Acquisition costs related to U.S. paper mills | | | 1.4 | | | | 3.1 | | | | – | |
| Restructuring and change-of-control costs1 | | | 1.8 | | | | 0.5 | | | | 1.6 | |
| Reorganization items, net1 | | | – | | | | – | | | | 1.1 | |
| Loss (gain) on settlement of debt | | | – | | | | 1.0 | | | | 2.3 | |
| Net gain on sale of non-core assets | | | – | | | | (2.4 | ) | | | (12.2 | ) |
| Net earnings (loss) attributable to the Company before specific items | | $ | (28.0 | ) | | $ | (28.3 | ) | | $ | (31.5 | ) |
| Net earnings (loss) per share attributable to the Company’s common shareholders in dollars: | | | | | | | | | | | | |
| As reported (continuing operations) | | $ | (3.41 | ) | | $ | (4.99 | ) | | $ | (9.01 | ) |
| Before specific items | | | (1.93 | ) | | | (1.95 | ) | | | (2.17 | ) |
| | | | | | | | | | | | | |
| 1 | Includes amount related to Snowflake which was included in discontinued operations, net of tax in the consolidated statements of earnings (loss) in the annual consolidated financial statements for the year ended December 31, 2015. |
Reconciliation to Net Earnings (Loss) Attributable to the Company by quarter:
(In millions of Canadian dollars
and after-taxes, except where | | 2015 | | | 2014 | |
| otherwise stated) | | Total | | | Q4 | | | Q3 | | | Q2 | | | Q1 | | | Total | | | Q4 | | | Q3 | | | Q2 | | | Q1 | |
| Net earnings (loss) | | $ | (49.4 | ) | | $ | (26.3 | ) | | $ | (12.9 | ) | | $ | (32.4 | ) | | $ | 22.2 | | | $ | (72.3 | ) | | $ | (39.7 | ) | | $ | (22.5 | ) | | $ | (6.3 | ) | | $ | (3.8 | ) |
| Specific items: | | | | | | | | | | | | | | | | | | | | | | | | | | | | | | | | | | | | | | | | |
| Foreign exchange (gain) loss on long-term debt | | | 57.7 | | | | 11.6 | | | | 24.0 | | | | (5.5 | ) | | | 27.6 | | | | 24.1 | | | | 9.2 | | | | 12.6 | | | | (8.9 | ) | | | 11.2 | |
| Bargain purchase gain | | | (43.9 | ) | | | – | | | | (1.7 | ) | | | (2.9 | ) | | | (39.3 | ) | | | – | | | | – | | | | – | | | | – | | | | – | |
| Market curtailment | | | 11.7 | | | | – | | | | – | | | | 11.7 | | | | – | | | | – | | | | – | | | | – | | | | – | | | | – | |
| Crofton oxygen plant outage | | | 4.4 | | | | – | | | | – | | | | 4.4 | | | | – | | | | – | | | | – | | | | – | | | | – | | | | – | |
| Rumford recovery boiler upgrade | | | 11.0 | | | | – | | | | – | | | | 11.0 | | | | – | | | | – | | | | – | | | | – | | | | – | | | | – | |
| Professional fees and duties on countervailing action | | | 7.7 | | | | 4.5 | | | | 2.1 | | | | 1.1 | | | | – | | | | – | | | | – | | | | – | | | | – | | | | – | |
| Reduction of deferred tax asset valuation allowance | | | (30.4 | ) | | | – | | | | (3.4 | ) | | | (1.9 | ) | | | (25.1 | ) | | | – | | | | – | | | | – | | | | – | | | | – | |
| Settlement loss on PIUMPF pension liability | | | – | | | | – | | | | – | | | | – | | | | – | | | | 1.2 | | | | – | | | | 1.2 | | | | – | | | | – | |
| Impairment (recovery) and other closure costs | | | – | | | | – | | | | – | | | | – | | | | – | | | | 16.5 | | | | 16.5 | | | | – | | | | – | | | | – | |
| Acquisition costs related to U.S. paper mills | | | 1.4 | | | | – | | | | – | | | | – | | | | 1.4 | | | | 3.1 | | | | 3.1 | | | | – | | | | – | | | | – | |
| Restructuring costs | | | 1.8 | | | | 0.2 | | | | 0.3 | | | | 0.7 | | | | 0.6 | | | | 0.5 | | | | 0.5 | | | | – | | | | – | | | | – | |
| Loss (gain) on settlement of debt | | | – | | | | – | | | | – | | | | – | | | | – | | | | 1.0 | | | | – | | | | – | | | | 1.9 | | | | (0.9 | ) |
| Net gain on sale of non-core assets | | | – | | | | – | | | | – | | | | – | | | | – | | | | (2.4 | ) | | | – | | | | (2.1 | ) | | | (0.3 | ) | | | – | |
| Net earnings (loss) attributable to the Company before specific items | | $ | (28.0 | ) | | $ | (10.0 | ) | | $ | 8.4 | | | $ | (13.8 | ) | | $ | (12.6 | ) | | $ | (28.3 | ) | | $ | (10.4 | ) | | $ | (10.8 | ) | | $ | (13.6 | ) | | $ | 6.5 | |
| Net earnings (loss) per share: | | | | | | | | | | | | | | | | | | | | | | | | | | | | | | | | | | | | | | | | |
| As reported | | $ | (3.41 | ) | | $ | (1.82 | ) | | $ | (0.89 | ) | | $ | (2.23 | ) | | $ | 1.53 | | | $ | (4.99 | ) | | $ | (2.75 | ) | | $ | (1.55 | ) | | $ | (0.43 | ) | | $ | (0.26 | ) |
| Before specific items | | | (1.93 | ) | | | (0.69 | ) | | | 0.58 | | | | (0.95 | ) | | | (0.87 | ) | | | (1.95 | ) | | | (0.72 | ) | | | (0.74 | ) | | | (0.94 | ) | | | 0.45 | |
Free Cash Flow
Free cash flow excludes working capital and certain other sources and uses of cash, which are disclosed in the consolidated statements of cash flows. This measure allows us to assess our ability to generate funds to repay debt and assists in cash flow forecasting.
Reconciliation to Cash Provided by Operating Activities less Cash Used by Investing Activities by year:
| (In millions of dollars) | | 2015 | | | 2014 | | | 2013 | |
| Cash provided (used) by operating activities | | $ | (6.6 | ) | | $ | 21.3 | | | $ | (7.5 | ) |
| Cash used by investing activities | | | (103.4 | ) | | | (19.2 | ) | | | 31.4 | |
| Proceeds from the sale of property, plant and equipment and other assets | | | (5.0 | ) | | | (4.7 | ) | | | (52.2 | ) |
| Other investing activities | | | – | | | | 2.0 | | | | 0.5 | |
| Non-cash working capital changes except changes in taxes and interest | | | (13.0 | ) | | | (15.9 | ) | | | 8.6 | |
| Other | | | 90.4 | | | | (0.7 | ) | | | (2.2 | ) |
| Free cash flow | | $ | (37.6 | ) | | $ | (17.2 | ) | | $ | (21.4 | ) |
Reconciliation to Cash Provided by Operating Activities less Cash Used by Investing Activities by Quarter:
| | | 2015 | | | 2014 | |
| (In millions of dollars) | | Total | | | Q4 | | | Q3 | | | Q2 | | | Q1 | | | Total | | | Q4 | | | Q3 | | | Q2 | | | Q1 | |
| Cash provided (used) by operating activities | | $ | (6.6 | ) | �� | $ | 19.4 | | | $ | (12.9 | ) | | $ | 8.3 | | | $ | (21.4 | ) | | $ | 21.3 | | | $ | 3.3 | | | $ | (8.8 | ) | | $ | 3.1 | | | $ | 23.7 | |
| Cash provided (used) by investing activities | | | (103.4 | ) | | | (10.7 | ) | | | 2.2 | | | | (11.1 | ) | | | (83.8 | ) | | | (19.2 | ) | | | (9.1 | ) | | | (1.9 | ) | | | 17.6 | | | | (25.8 | ) |
| Proceeds from the sale of property, plant and equipment and other assets | | | (5.0 | ) | | | – | | | | (5.0 | ) | | | – | | | | – | | | | (4.7 | ) | | | (0.1 | ) | | | (4.2 | ) | | | (0.4 | ) | | | – | |
| Other investing activities | | | – | | | | 0.6 | | | | (0.1 | ) | | | – | | | | (0.5 | ) | | | 2.0 | | | | 0.8 | | | | 0.4 | | | | 0.6 | | | | 0.2 | |
| Non-cash working capital changes except change in taxes and interest | | | (13.0 | ) | | | (44.0 | ) | | | 33.3 | | | | (33.2 | ) | | | 30.9 | | | | (15.9 | ) | | | (13.0 | ) | | | 13.8 | | | | (16.8 | ) | | | 0.1 | |
| Other | | | 90.4 | | | | 23.3 | | | | 5.9 | | | | (5.5 | ) | | | 66.7 | | | | (0.7 | ) | | | 5.9 | | | | (7.3 | ) | | | (12.7 | ) | | | 13.4 | |
| Free cash flow | | $ | (37.6 | ) | | $ | (11.4 | ) | | $ | 23.4 | | | $ | (41.5 | ) | | $ | (8.1 | ) | | $ | (17.2 | ) | | $ | (12.2 | ) | | $ | (8.0 | ) | | $ | (8.6 | ) | | $ | 11.6 | |
Management’s Calculation of Free Cash Flow by Year:
| (In millions of dollars) | | 2015 | | | 2014 | | | 2013 | |
| Adjusted EBITDA | | $ | 48.7 | | | $ | 47.6 | | | $ | 46.1 | |
| Interest expense, excluding amortization | | | (45.1 | ) | | | (34.1 | ) | | | (35.5 | ) |
| Capital expenditures | | | (34.5 | ) | | | (21.9 | ) | | | (23.4 | ) |
| Reorganization costs | | | – | | | | – | | | | (0.6 | ) |
| Employee future benefits, expense over (under) cash contributions1 | | | (6.7 | ) | | | (8.8 | ) | | | (7.0 | ) |
| Net operating cash flow from discontinued operations | | | – | | | | – | | | | (1.0 | ) |
| Free cash flow | | $ | (37.6 | ) | | $ | (17.2 | ) | | $ | (21.4 | ) |
| 1 | Free cash flow is adjusted to reflect the cash impact of employee future benefits rather than the accounting expense which is included in adjusted EBITDA. |
Management’s Calculation of Free Cash Flow by Quarter:
| | | 2015 | | | 2014 | |
| (In millions of dollars) | | Total | | | Q4 | | | Q3 | | | Q2 | | | Q1 | | | Total | | | Q4 | | | Q3 | | | Q2 | | | Q1 | |
| Adjusted EBITDA | | $ | 48.7 | | | $ | 15.1 | | | $ | 38.8 | | | $ | (19.2 | ) | | $ | 14.0 | | | $ | 47.6 | | | $ | 6.8 | | | $ | 8.0 | | | $ | 7.1 | | | $ | 25.7 | |
| Interest expense, excluding amortization | | | (45.1 | ) | | | (11.1 | ) | | | (12.4 | ) | | | (10.2 | ) | | | (11.4 | ) | | | (34.1 | ) | | | (8.7 | ) | | | (8.6 | ) | | | (7.7 | ) | | | (9.1 | ) |
| Capital expenditures | | | (34.5 | ) | | | (10.1 | ) | | | (2.9 | ) | | | (11.1 | ) | | | (10.4 | ) | | | (21.9 | ) | | | (8.4 | ) | | | (5.7 | ) | | | (4.7 | ) | | | (3.1 | ) |
| Employee future benefits, expense over (under) cash contributions1 | | | (6.7 | ) | | | (5.3 | ) | | | (0.1 | ) | | | (1.0 | ) | | | (0.3 | ) | | | (8.8 | ) | | | (1.9 | ) | | | (1.7 | ) | | | (3.3 | ) | | | (1.9 | ) |
| Free cash flow | | $ | (37.6 | ) | | $ | (11.4 | ) | | $ | 23.4 | | | $ | (41.5 | ) | | $ | (8.1 | ) | | $ | (17.2 | ) | | $ | (12.2 | ) | | $ | (8.0 | ) | | $ | (8.6 | ) | | $ | 11.6 | |
| | | | | | | | | | | | | | | | | | | | | | | | | | | | | | | | | | | | | | | | | |
| 1 | Free cash flow is adjusted to reflect the cash impact of employee future benefits rather than the accounting expense which is included in adjusted EBITDA. |
CRITICAL ACCOUNTING POLICIES AND ESTIMATES
The preparation of financial statements in conformity with U.S. GAAP requires companies to establish accounting policies and to make estimates that affect both the amount and timing of recording of assets, liabilities, revenues and expenses. Some of these estimates require judgments about matters that are inherently uncertain.
Note 2,Summary of significant accounting policies, in the December 31, 2015 consolidated financial statements includes a summary of the significant accounting policies used in their preparation. While all of the significant accounting policies are important to the annual consolidated financial statements, some of these policies may be viewed as involving a high degree of judgment. On an ongoing basis using currently available information, management reviews its estimates, including those related to environmental and legal liabilities, impairment of long-lived assets, pension and post-retirement benefits, provision for bad and doubtful accounts, fair value measurement, and income taxes. Actual results could differ from these estimates.
The following accounting policies require management’s most difficult, subjective and complex judgments, and are subject to measurement uncertainty.
Purchase of U.S. Paper Mills
On January 7, 2015, the Company acquired, through a wholly owned subsidiary, the Biron paper mill located in Wisconsin, U.S. and the Rumford pulp and paper mill located in Maine, U.S. for consideration of $73.9 million (US$62.4 million). The acquisition was financed through advances under the Company’s ABL Facility, which was amended to increase the maximum amount of credit available thereunder from $175.0 million to $225.0 million. The Company also completed a US$25.0 million offering of its PIK Toggle Senior Notes, i.e. Offered Notes, thereby increasing the principal amount of its outstanding 2017 Notes to US$260.5 million. The Offered Notes were issued at a 20% discount to face value with the Company receiving gross proceeds of US$20.0 million. The acquisition price of US$62.4 million is subject to potential adjustment based on the final statement of net working capital as of January 7, 2015 to be mutually agreed to between Catalyst Paper and Verso Corporation.
In accordance with the requirements of business combination accounting, we determined the net fair value for the acquired U.S. paper mills with the assistance of an independent financial advisor. The net fair value established as of the acquisition date of January 7, 2015 incorporated numerous major assumptions including management’s best estimate of future operating performance, forecasts of future product prices, and a discount rate based on the estimated blended rate of return required by our debt and equity investors.
As of September 30, 2015, adjustments were made to the preliminary fair value allocation to the pension liability, other post-employment benefits (OPEB) liability, and the long-term environmental remedial obligations assumed as of the date of acquisition date of January 7, 2015. The present value of the future pension liability was reduced by $4.4 million and an OPEB liability was recognized with a fair value of $3.1 million based on finalized actuarial assumptions, and the long-term environmental remedial obligations were reduced by $1.4 million based on the final determination of the expected date of future remediation of the Rumford landfill site, with a related increase to the bargain purchase gain and an increase to taxes previously reported.
As of June 30, 2015, an adjustment was made to the preliminary fair value allocation to workers compensation and accrued payroll liabilities based on additional evidence supporting the fair value of these liabilities as of the acquisition date of January 7, 2015. The revised fair value of workers compensation liabilities was based on an actual determination made by the Company’s insurance broker, while the revised fair value of accrued payroll liabilities was based on payments made to employees subsequent to the date of acquisition. This adjustment resulted in an increase of $2.9 million to the bargain purchase gain previously reported.
The final allocation to the assets acquired and liabilities assumed on the basis of their respective preliminary fair values as at January 7, 2015 is as follows:
| | | January 7,
2015 | |
| Assets acquired: | | | | |
| Accounts receivable | | $ | 56.1 | |
| Inventories | | | 80.8 | |
| Prepaids and other | | | 0.9 | |
| Property, plant and equipment | | | 91.7 | |
| Long-term assets | | | 0.2 | |
| | | $ | 229.7 | |
| Liabilities assumed: | | | | |
| Accounts payable and accruals | | $ | 65.6 | |
| Long-term environmental remedial obligations | | | 4.6 | |
| Long-term employee future benefits | | | 10.0 | |
| Other long-term liabilities | | | 5.0 | |
| Deferred income tax liability | | | 26.7 | |
| | | | 111.9 | |
| Fair value of acquired net assets | | $ | 117.8 | |
| Consideration paid | | $ | 73.9 | |
The excess of the fair value assigned to the net assets acquired over the purchase price has been recognized in other income as a gain of $43.9 million. The Company realized a gain on the asset purchase as it was a forced agreement. Verso Corporation sold the Biron and Rumford mills to comply with an antitrust settlement with the U.S. Department of Justice whereby the pending merger of Verso Corporation and NewPage was made conditional on the sale of the U.S. paper mills.
The Company incurred acquisition related costs which have been recognized in selling, general and administrative expenses of $4.5 million.
The amount of sales and net earnings of the U.S. mills included in our consolidated statement of operations from the date of acquisition, through the period ended December 31, 2015, was as follows:
| | | January 7, 2015 to
December 31, 2015 | |
| Sales | | $ | 885.6 | |
| Net loss | | | (14.9 | ) |
The mills are financially and operationally self-sustaining and accordingly, the current rate method has been used for the translation of its financial statements to Canadian dollars upon consolidation.
The following unaudited pro forma information reflects our consolidated results of operations as if the acquisition had taken place January 1, 2014. The unaudited pro forma information is not necessarily indicative of the results of operations that we would have reported had the transaction actually occurred at the beginning of these periods nor is it necessarily indicative of future results. The unaudited pro forma financial information does not reflect the impact of future events that may occur after the acquisition, including, but not limited to, anticipated cost savings from synergies or other operational improvements.
| | | 20151 | | | 2014 | |
| Sales | | $ | 1,991.1 | | | $ | 1,955.8 | |
| Net loss | | | (49.4 | ) | | | (106.9 | ) |
| 1 | The amount of sales and net earnings of the U.S. mills included in our consolidated statement of operations are from January 7, 2015 to December 31, 2015. |
The unaudited pro forma financial information presented in the table above has been adjusted to give effect to adjustments that are: (1) directly related to the business combination; (2) factually supportable; and (3) expected to have a continuing impact. These adjustments include, but are not limited to, the application of our accounting policies; elimination of related party transactions; depreciation and amortization related to fair value adjustments to property, plant and equipment and intangible assets including contracts assumed; and interest expense on acquisition related debt.
Environmental and legal liabilities
Environmental and legal liabilities are recorded when it is considered probable that a liability has been incurred and the amount of the loss can be reasonably estimated. Liabilities for environmental matters require evaluation of applicable environmental regulations and estimates of remediation alternatives and the costs thereof. Provisions for liabilities relating to legal actions and claims require judgments about projected outcomes and the range of loss, based on such factors as historical experience and recommendations of legal counsel.
As at December 31, 2015, we had a provision of $26.4 million for environmental, remedial and other obligations. We expect capital expenditures relating to known environmental matters, including compliance issues and the assessment and remediation of the environmental condition of the Company’s properties, will total approximately $0.7 million in 2016.
Impairment of long-lived assets
Continued declines in current and forecasted paper prices that may negatively impact future operating costs and profitability were identified as indicators of potential impairment of long-lived assets at December 31, 2015. In addition, the impact of the recently enacted countervailing duty on the U.S. export of supercalendered paper, as disclosed in note 28,Contingencies, in our consolidated financial statements for the year ended December 31, 2015, was identified as a possible impairment indicator. Five asset groups were identified for the purpose of the impairment analysis: Crofton paper, Powell River, Port Alberni, Biron and Rumford. Assets and related liabilities were grouped by mill. Crofton pulp group was excluded from the impairment analysis given that the indicators do not reflect that the carrying value of assets used for pulp production may not be recoverable.
The Company conducted step (i) of the impairment test to determine whether the carrying value of its long-lived assets were recoverable. The net carrying amount of assets of all reporting units exceeded the projected undiscounted future cash flows, after adjusting for the estimated impact of the countervailing duties. All the business units passed the recoverability test, and therefore, no impairment of the carrying value of property, plant and equipment was recorded as of December 31, 2015.
Estimates of future cash flows used to test the recoverability of long-lived assets included key assumptions related to foreign exchange rates, forecast product prices, market supply and demand, estimated useful life of the long-lived assets, production levels, production costs, inflation, and capital spending. The assumptions were derived from information generated internally and external published reports and forecasts. Product sales prices and foreign exchange assumptions for 2016 were based on management’s best estimates incorporating independent market information as well as analysis of historical data, trends and cycles. Product sales prices and foreign exchange assumptions for years 2017 to 2020 were based on independent, published market forecasts.
See note 6,Measurement Uncertainty – impairment of long-lived assets in our consolidated financial statements for the year ended December 31, 2015 for a description of inputs and assumptions used.
Pension and post-retirement benefits
We maintain various employee future benefit plans, which include defined benefit pension and post-retirement benefit plans. The Company retains independent actuarial firms to perform actuarial valuations of the fair value of our defined benefit pension and post-retirement benefit plan assets and benefit obligations, and to advise on the amounts to be recorded in our financial statements. This information is determined using certain assumptions, based on historical and market data that have a direct impact on the fair value of the assets and obligations and on the charges disclosed in our financial statements. These assumptions include:
| · | The discount rate, which is used to estimate the actuarial present value of the various plan obligations. The Company, assisted by independent actuarial advisors, sets the discount rate assumption annually to reflect the rates available on high-quality debt instruments, with cash flows that are expected to match the timing and amount of expected benefit payments. As at December 31, 2015, a discount rate of 3.70% for pension and 4.00% for post-retirement benefits per year were determined by us in consultation with our independent actuarial advisors. |
| · | The long-term return on assets used to estimate the growth in the value of invested assets available to satisfy certain obligations. The Company, with the assistance of independent actuarial firms, sets the expected rate of return on plan assets annually to reflect the current view of long-term investment returns. For 2015, a rate of return of 6.25% per year was determined by management in consultation with our independent actuarial advisors. |
| · | Salary increases used to estimate the impact that future compensation increases would have on pension and other post-retirement obligations. As at December 31, 2015, a rate of compensation increase of 1.5% per year was determined by management in consultation with our independent actuarial advisors. |
| · | Health care trend rates and mortality rates used to estimate the impact that future health care costs would have on pension and post-retirement obligations. As at December 31, 2015, a health care trend rate of 5% per year was determined by management in consultation with our independent actuarial advisors. The health care trend rate is assumed to decline by 0.5% per year annually, until it reaches the ultimate health care trend rate assumption of 4.5% per year. |
Actual experience can vary significantly from estimates and could have a material impact on the estimated cost of employee benefit plans and future cash requirements.
The following table provides a sensitivity analysis of the assumed overall health care cost trend rate used in measuring the net pension benefit obligation, and the net obligation for other employee future benefits and related net periodic benefit cost for 2015. This sensitivity analysis should be used with caution as it is hypothetical and changes in the health care cost trend rate may not be linear.
| | | Pension benefit plans | | | Other benefit plans | |
| (In millions of dollars) | | Net benefit
obligation | | | Net 2015
expense | | | Net benefit
obligation | | | Net 2015
Expense | |
| Assumed overall health care cost trend | | | | | | | | | | | | | | | | |
| Impact of: | | | | | | | | | | | | | | | | |
| 1% increase | | | N/A | | | | N/A | | | | 20.3 | | | | 1.4 | |
| 1% decrease | | | N/A | | | | N/A | | | | (17.5 | ) | | | (1.2 | ) |
Provision for bad debts and allowance for doubtful accounts
We regularly review the collectability of our accounts receivable. We record our allowance for doubtful accounts based on our best estimate of any potentially uncollectible accounts by highlighting those that are specifically high risk and applying judgment to arrive at an estimate. Consideration is given to current economic conditions and specific customer circumstances to determine the amount of any bad debt expense to be recorded. Accounts receivable balances for individual customers could potentially be material at any given time. We manage our credit risk principally through credit policies, which include the analysis of the financial position of our customers and the regular review of their credit limits and payment terms. We also subscribe to credit insurance for a majority of our receivables, periodically purchase accounts receivable puts on certain customers, and obtain bank letters of credit for some export markets and customers. Our estimate of the required allowance is a matter of judgment and the actual loss eventually sustained may be more or less than estimated.
As at December 31, 2015, accounts receivables comprised 20% of total assets. Included in this balance was a provision of $4.5 million for doubtful accounts, or 2.4% of accounts receivable (as at December 31, 2014 - $2.3 million for doubtful accounts, or 2.1% of accounts receivable). We believe our allowance for doubtful accounts as at December 31, 2015 is adequate to provide for probable losses existing in accounts receivable.
Fair value measurement
We measure our derivative and non-derivative financial instruments at fair value, defined as the price that would be received from selling an asset or that would be paid to transfer a liability in an orderly transaction between market participants at the measurement date. When determining fair value measurements, we consider the principal or most advantageous market in which it would transact and consider assumptions that market participants would use when pricing the asset or liability, such as inherent risk, transfer restrictions and risk of non-performance.
An established fair value hierarchy requires the Company to maximize the use of observable inputs and minimize the use of unobservable inputs when measuring fair value. A financial instrument’s categorization within the fair value hierarchy is based upon the lowest level of input that is both available and significant to the fair value measurement. Three levels of inputs may be used to measure fair value:
| Level 1 | – | Quoted prices in active markets for identical assets or liabilities. |
| | | |
| Level 2 | – | Observable inputs other than quoted prices in active markets for identical assets and liabilities, such as quoted prices for identical or similar assets or liabilities in markets that are not active, or other inputs that are observable or can be corroborated by observable market data for substantially the full term of the assets or liabilities. |
| | | |
| Level 3 | – | Inputs that are generally unobservable and are supported by little or no market activity and that are significant to the fair value determination of the assets or liabilities. |
The determination of fair value requires judgments, assumptions and estimates and may change over time.
As at December 31, 2015, we had currency contracts related to our U.S. dollar denominated sales. These contracts are reported at their fair value, as detailed below under the headingFinancial Instruments on page 57.
Income taxes
The amounts recorded for deferred income tax assets and liabilities are based on various judgments, assumptions and estimates. Deferred tax assets and liabilities are measured using enacted tax rates for the years in which assets and liabilities are expected to be recovered or settled. A projection of taxable income and estimates of the ultimate recovery or settlement of temporary differences are made for these years. The projection of future taxable income is based on management’s best estimate and may vary from actual.
At December 31, 2015, the Company provided a full valuation allowance against its deferred tax assets. As a result, no net deferred tax asset was recorded. A one-percentage-point change in our reported effective income tax rate would have minimal effect on our income tax expense or recovery.
In addition, we record provisions for federal, provincial and foreign taxes based on the respective tax laws of the jurisdictions in which we operate and on our judgment as to the appropriate allocation of income and deductions to these jurisdictions. Canadian, U.S. and international tax laws are subject to interpretation and our judgment may be challenged by taxation authorities. In such circumstances, the final resolution can result in settlements that differ from our estimated amounts.
CHANGES IN ACCOUNTING POLICIES
There were no new pronouncements or recent amendments issued by the Financial Accounting Standards Board (FASB) to the Accounting Standards Codification that materially impacted our consolidated financial statements or disclosures in 2015.
IMPACT OF ACCOUNTING PRONOUNCEMENTS AFFECTING FUTURE PERIODS
In May 2014, FASB issued a new standard on revenue recognition ASC Topic 606Revenue from Contracts with Customers. The Company intends to adopt the new standard in its financial statements for the annual period beginning on January 1, 2017. The extent of the impact of adoption of the standard has not yet been determined.
In March 2015, FASB issued a new standard on the presentation of debt issuance costs ASU Subtopic 835-30Interest-Imputation of Interest. The Company intends to adopt the new standard in its financial statements for the annual period beginning on January 1, 2016. The extent of the impact of adoption of the standard has not yet been determined.
There were no other new pronouncements issued by the FASB that may materially impact the Company’s consolidated financial statements for future periods.
| B. | Liquidity and Capital Resources |
Selected annual financial information
| (In millions of dollars, except where otherwise stated) | | 2015 | | | 2014 | | | 2013 | |
| Cash flows provided (used) by operations before changes in non-cash working capital | | $ | (9.1 | ) | | $ | 5.3 | | | $ | 7.3 | |
| Changes in non-cash working capital | | | 2.5 | | | | 16.0 | | | | (14.8 | ) |
| Cash flows provided (used) by: | | | | | | | | | | | | |
| Operations | | | (6.6 | ) | | | 21.3 | | | | (7.5 | ) |
| Investing activities | | | (103.4 | ) | | | (19.2 | ) | | | 31.4 | |
| Financing activities | | | 107.4 | | | | (3.3 | ) | | | (30.3 | ) |
| Capital spending | | | 34.5 | | | | 21.9 | | | | 23.4 | |
| Depreciation and amortization | | | 61.4 | | | | 44.6 | | | | 47.0 | |
| Impairment and other closure costs | | | – | | | | 16.5 | | | | 86.9 | |
| Capital spending as % of depreciation and amortization | | | 56 | % | | | 49 | % | | | 50 | % |
| Net debt to net capitalization at period-end1 | | | 131 | % | | | 143 | % | | | 96 | % |
| 1 | Net debt ratio equals net debt (total debt less cash) divided by net capitalization (shareholders’ equity attributable to the Company and total debt less cash). |
Selected quarterly financial information
| (In millions of dollars, except where | | 2015 | | | 2014 | |
| otherwise stated) | | Total | | | Q4 | | | Q3 | | | Q2 | | | Q1 | | | Total | | | Q4 | | | Q3 | | | Q2 | | | Q1 | |
| Cash flows provided (used) by operations before changes in non-cash working capital | | $ | (9.1 | ) | | $ | (2.2 | ) | | $ | 20.0 | | | $ | (27.4 | ) | | $ | 0.5 | | | $ | 5.3 | | | $ | (2.9 | ) | | $ | (2.5 | ) | | $ | (5.7 | ) | | $ | 16.4 | |
| Changes in non-cash working capital | | | 2.5 | | | | 21.6 | | | | (32.9 | ) | | | 35.7 | | | | (21.9 | ) | | | 16.0 | | | | 6.2 | | | | (6.3 | ) | | | 8.8 | | | | 7.3 | |
| Cash flows provided (used) by: | | | | | | | | | | | | | | | | | | | | | | | | | | | | | | | | | | | | | | | | |
| Operations | | | (6.6 | ) | | | 19.4 | | | | (12.9 | ) | | | 8.3 | | | | (21.4 | ) | | | 21.3 | | | | 3.3 | | | | (8.8 | ) | | | 3.1 | | | | 23.7 | |
| Investing activities | | | (103.4 | ) | | | (10.7 | ) | | | 2.2 | | | | (11.1 | ) | | | (83.8 | ) | | | (19.2 | ) | | | (9.1 | ) | | | (1.9 | ) | | | 17.6 | | | | (25.8 | ) |
| Financing activities | | | 107.4 | | | | (5.4 | ) | | | 7.0 | | | | 1.6 | | | | 104.2 | | | | (3.3 | ) | | | 7.6 | | | | 11.6 | | | | (22.4 | ) | | | (0.1 | ) |
| Capital spending | | | 34.5 | | | | 10.1 | | | | 2.9 | | | | 11.1 | | | | 10.4 | | | | 21.9 | | | | 8.4 | | | | 5.7 | | | | 4.7 | | | | 3.1 | |
| Depreciation and amortization | | | 61.4 | | | | 17.3 | | | | 15.0 | | | | 14.8 | | | | 14.3 | | | | 44.6 | | | | 11.5 | | | | 11.2 | | | | 11.0 | | | | 10.9 | |
| Impairment | | | – | | | | – | | | | – | | | | – | | | | – | | | | 16.5 | | | | 16.5 | | | | – | | | | – | | | | – | |
| Capital spending as % of depreciation and amortization | | | 56 | % | | | 58 | % | | | 19 | % | | | 75 | % | | | 73 | % | | | 49 | % | | | 73 | % | | | 51 | % | | | 43 | % | | | 28 | % |
| Net debt to net capitalization at period-end1 | | | 131 | % | | | 131 | % | | | 130 | % | | | 131 | % | | | 119 | % | | | 143 | % | | | 143 | % | | | 107 | % | | | 99 | % | | | 97 | % |
| 1 | Net debt ratio equals net debt (total debt less cash) divided by net capitalization (shareholders’ equity attributable to the Company and total debt less cash). |
Our principal cash requirements are for ongoing operating costs, working capital fluctuations, and capital expenditures as well as interest and principal payments on debt. We anticipate that future operating cash requirements can be funded through internally generated cash flows from operations and advances under our ABL Facility. Additional details are provided in “Capital resources” and in “Debt” below.
Operating activities
Cash flows from operating activities decreased by $27.9 million compared to 2014 due primarily to a lower favourable change in non-cash working capital of $13.5 million and an increase in interest paid of $10.9 million. Our net investment in working capital has increased to support the operations of the acquired U.S. paper mills.
Investing activities
Cash used for investing activities increased by $84.2 million due tothe acquisition of the U.S. paper mills for proceeds of $73.9 million and an increase in capital additions of $12.6 million. The increase in capital additions was mostly due to the higher capital requirements of operating two additional mills.
The components are provided below:
| (In millions of dollars) | | 2015 | | | 2014 | |
| Safety | | $ | 1.9 | | | $ | 1.7 | |
| Environment | | | 0.1 | | | | 1.0 | |
| Maintenance of business | | | 22.5 | | | | 14.1 | |
| Profit adding | | | 10.0 | | | | 5.1 | |
| Total | | $ | 34.5 | | | $ | 21.9 | |
Financing activities
Cash provided by financing activities increased by $110.7 million compared to 2014 due primarily to an increase in borrowings under our ABL Facility of $68.9 million and the issuance of Offered Notes of $23.7 million to finance the acquisition and operation of the U.S. paper mills, and a net cash outflow from the redemption, purchase and issuance of long-term debt in 2014 of $17.8 million.
Capital resources
Our capital resources include cash on hand and availability on our ABL Facility, with total liquidity at period-end summarized in the following table.
| | | ABL Facility | |
| | | 2015 | | | 2014 | |
| (In millions of dollars) | | Q4 | | | Q3 | | | Q2 | | | Q1 | | | Q4 | | | Q3 | | | Q2 | | | Q1 | |
| Borrowing base1 | | $ | 225.0 | | | $ | 225.0 | | | $ | 212.7 | | | $ | 225.0 | | | $ | 139.6 | | | $ | 139.9 | | | $ | 141.3 | | | $ | 148.2 | |
| Letters of credit | | | (22.4 | ) | | | (22.1 | ) | | | (21.8 | ) | | | (22.0 | ) | | | (18.4 | ) | | | (18.6 | ) | | | (18.5 | ) | | | (18.6 | ) |
| Amount drawn, net | | | (117.1 | ) | | | (121.7 | ) | | | (114.0 | ) | | | (111.3 | ) | | | (29.4 | ) | | | (20.0 | ) | | | (7.8 | ) | | | (1.3 | ) |
| Available to be drawn2 | | | 85.5 | | | | 81.2 | | | | 76.9 | | | | 91.7 | | | | 91.8 | | | | 101.3 | | | | 115.0 | | | | 128.3 | |
| Cash on hand | | | 8.3 | | | | 5.0 | | | | 8.7 | | | | 9.9 | | | | 10.9 | | | | 9.1 | | | | 8.2 | | | | 9.9 | |
| Restricted cash | | | – | | | | – | | | | – | | | | – | | | | – | | | | – | | | | – | | | | 22.5 | |
| Total liquidity | | $ | 93.8 | | | $ | 86.2 | | | $ | 85.6 | | | $ | 101.6 | | | $ | 102.7 | | | $ | 110.4 | | | $ | 123.2 | | | $ | 160.7 | |
| 1 | The borrowing base at December 31, 2015 includes a reserve of $1.4 million for pension, $3.5 million for creditor insurance deductibles, $2.8 million for landlord waivers, $1.5 million for employee source deductions, $0.3 million related to WorkSafeBC, and $2.4 million for mark-to-market exposure on our foreign currency revenue hedges. |
| 2 | Our ABL Facility is subject to certain financial covenants as disclosed in our annual consolidated financial statements for the year ended December 31, 2015 in note 15,Long-term debt in the consolidated financial statements for the year ended December 31, 2015. |
Our total liquidity decreased by $8.9 million from the prior year due to negative free cash flow of $37.6 million generated for the year and the exposure of a substantial portion of our borrowings under the ABL Facility to the strengthening U.S. dollar, partly offset by an increase to our maximum borrowing base from $175.0 million to $225.0 million to finance the acquisition of the U.S. paper mills. Liquidity for Q4 of 2015 increased by $7.6 million compared to Q3 of 2015 mostly due to a reduction in our investment in net working capital of $21.6 million, partly offset by negative fourth quarter free cash flow of $11.4 million.
For information related to the computation of our borrowing base and availability on the ABL Facility, refer to our annual consolidated financial statements for the year ended December 31, 2015 note 15,Long-term debt.
At February 29, 2016, we had 14,527,571 common shares issued and outstanding. The Company’s common shares have no par value and an unlimited number of shares are authorized for future issuance.
Debt
Our long-term debt increased in 2015 due to an increase to our net draw on the ABL Facility and the issuance of Offered Notes to finance the acquisition of the U.S. paper mills, and the foreign exchange impact of a weaker Canadian dollar. The following table illustrates the changes in our long-term debt for the year ended December 31, 2015:
Issue
| (In millions of dollars) | | January 1,
2015 | | | Net increase
(decrease) | | | Foreign
exchange | | | December 31,
2015 | |
| Term loan, due July 2017 | | $ | 18.5 | | | $ | (2.0 | ) | | $ | – | | | $ | 16.5 | |
| Senior secured notes, 11.0% due October 2017 (US$260.5 million; December 31, 2014 – US$235.5 million) | | | 273.1 | | | | 25.9 | | | | 57.7 | | | | 356.7 | |
| Revolving asset-based loan facility of up to $225.0 million due July 2017 | | | 29.4 | | | | 72.5 | | | | 15.2 | | | | 117.1 | |
| Capital lease obligations | | | 8.1 | | | | (0.6 | ) | | | – | | | | 7.5 | |
| Total debt | | $ | 329.1 | | | $ | 95.8 | | | $ | 72.9 | | | $ | 497.8 | |
| Less: current portion | | | 3.0 | | | | 0.2 | | | | – | | | | 3.2 | |
| Total long-term debt | | $ | 326.1 | | | $ | 95.6 | | | $ | 72.9 | | | $ | 494.6 | |
See Note 15,Long-term debt, in our annual consolidated financial statements for the year ended December 31, 2015 for additional information on changes to our debt.
Financial Instruments
Our financial instruments consist primarily of cash and cash equivalents, accounts receivable, accounts payable and accrued liabilities, long-term debt, and derivatives. Derivatives are used primarily to reduce exposure to currency risk on revenues, or occasionally debt, as well as price risk associated with revenue and energy costs. In accordance with our financial risk management program, we manage our exposure to risks through the use of financial instruments with counterparties that are of strong credit quality, normally being major financial institutions. We do not enter into financial instruments for speculative purposes.
At December 31, 2015, we had foreign currency options and forward contracts with a notional principal of US$115.0 million with major financial institutions. At the period-end exchange rate, these instruments were reported at their fair value of negative $4.5 million. For a description of the nature and extent of risk to the Company from our financial instruments, as well as our respective accounting treatment of financial instruments, refer to our annual consolidated financial statements for the year ended December 31, 2015 note 26,Financial instruments. For the methods and assumptions we use to determine the fair value of financial instruments, refer to our annual consolidated financial statements for the year ended December 31, 2015 note 25,Fair value measurement, of those statements.
The following table reconciles the average spot exchange rate to our effective exchange rate:
US$/CDN$ FOREIGN EXCHANGE
| | | 2015 | | | 2014 | |
| | | YTD | | | Q4 | | | Q3 | | | Q2 | | | Q1 | | | YTD | | | Q4 | | | Q3 | | | Q2 | | | Q1 | |
| Average Bank of Canada noon spot rate | | | 0.782 | | | | 0.749 | | | | 0.768 | | | | 0.813 | | | | 0.806 | | | | 0.906 | | | | 0.881 | | | | 0.918 | | | | 0.917 | | | | 0.906 | |
| Average effective rate included in adjusted EBITDA | | | 0.781 | | | | 0.749 | | | | 0.763 | | | | 0.813 | | | | 0.805 | | | | 0.906 | | | | 0.881 | | | | 0.918 | | | | 0.917 | | | | 0.906 | |
| (Favourable)/unfavourable impact of derivatives included in other expenses1 | | | 0.007 | | | | 0.006 | | | | 0.008 | | | | (0.004 | ) | | | 0.017 | | | | 0.002 | | | | 0.005 | | | | 0.007 | | | | (0.003 | ) | | | (0.001 | ) |
| Foreign exchange (gain)/loss, on working capital balances, included in other expenses2 | | | (0.003 | ) | | | (0.004 | ) | | | 0.001 | | | | 0.004 | | | | (0.012 | ) | | | (0.004 | ) | | | (0.008 | ) | | | (0.012 | ) | | | 0.010 | | | | (0.005 | ) |
| Average effective rate in net earnings/(loss) before income taxes3 | | | 0.785 | | | | 0.751 | | | | 0.772 | | | | 0.813 | | | | 0.810 | | | | 0.904 | | | | 0.878 | | | | 0.913 | | | | 0.924 | | | | 0.900 | |
| (In millions of dollars) | | | | | | | | | | | | | | | | | | | | | | | | | | | | | | | | | | | | | | | | |
| 1 Favourable/(unfavourable) impact of derivatives included in other expenses | | $ | (13.9 | ) | | $ | (2.8 | ) | | $ | (4.9 | ) | | $ | 1.8 | | | $ | (8.0 | ) | | $ | (2.2 | ) | | $ | (1.3 | ) | | $ | (1.7 | ) | | $ | 0.6 | | | $ | 0.2 | |
| 2 Foreign exchange gain/(loss) on working capital balances included in other expenses | | | 5.8 | | | | 2.1 | | | | (0.1 | ) | | | (2.1 | ) | | | 5.9 | | | | 3.5 | | | | 1.8 | | | | 2.8 | | | | (2.3 | ) | | | 1.2 | |
| 3 Excludes foreign exchange gain/(loss) on long-term debt and US$ interest expense | | | | | | | | | | | | | | | | | | | | | | | | | | | | | | | | | | | | | | | | |
| C. | Research and Development, Patents and Licences, etc. |
Research required to meet our specific needs is conducted at private laboratories under the direction of our technical experts and at the mill laboratories. Business unit technical staff provide scientific and technological expertise in support of operations and product development efforts. Our internal product development team carried out the bulk of our product development efforts in the last three years. We did not make significant research and development expenditures to outside contractors in the last three years.
See information provided in Item 5A.
| E. | Off-Balance Sheet Arrangements |
No material off-balance sheet arrangements existed as of December 31, 2015.
| F. | Tabular Disclosure of Contractual Obligations |
The following table presents the aggregate amount of future cash outflows for contractual obligations as of December 31, 2015:
Payments due by period
| Contractual Obligations | | Total | | | Less than 1
Year | | | 1 – 3
Years | | | 3 – 5
Years | | | More than 5
Years | |
| Long Term Debt Obligations | | $ | 494.2 | | | $ | 2.0 | | | $ | 492.2 | | | $ | - | | | $ | - | |
| Capital (Finance) Lease Obligations | | | 7.4 | | | | 1.2 | | | | 5.7 | | | | 0.5 | | | | - | |
| Operating Lease Obligations1 | | | 47.8 | | | | 35.0 | | | | 10.3 | | | | 2.5 | | | | - | |
| Other Long-Term Liabilities Reflected on the Company’s Balance Sheet under the GAAP of the primary financial statement | | | 88.5 | | | | 45.4 | | | | 43.1 | | | | - | | | | - | |
| Total | | $ | 637.9 | | | $ | 83.6 | | | $ | 551.3 | | | $ | 3.0 | | | $ | - | |
| 1 | Subsequent to the sale of the Company’s interest in PREI on March 20, 2013, the power purchase agreement between the Company and PREI meets the definition of an operating lease under U.S.GAAP (see disclosure for Variable Interest Entities under note 2,Summary of Significant Accounting Policiesin our audited consolidated financial statements for the year ended December 31, 2015). |
Statements in this report relating to matters that are not historical fact are forward-looking statements based on current expectations, forecasts and assumptions that involve risks and uncertainties that could cause actual outcomes and results to differ materially. Factors that could cause or contribute to such differences include, but are not limited to, general economic conditions, changes in technology, reliance on third party manufacturing, managing rapid growth, global sales risks, limited intellectual property protection and other risks and uncertainties described in the Corporation’s public filings with securities regulatory authorities.
| ITEM 6 | DIRECTORS, SENIOR MANAGEMENT AND EMPLOYEES |
| A. | Directors and Senior Management |
Directors
Our directors are as indicated in the following table. Each director indicated below was elected at the annual meeting of the shareholders of the Company (“AGM”) held on May 13, 2015 and will serve as a director of the Company until the AGM in 2016 or until his or her successor is elected or appointed, or unless his or her office is earlier vacated under any of the relevant provisions of our by-laws or theCanada Business Corporations Act.
| Name and Municipality of Residence | | Principal Occupation | | Director Since |
| | | | | |
John Brecker New York, New York | | Director of Bowery Management and Principal of Drivetrain Advisors. Co-founder of Longacres Fund Management, LLC. | | September 13, 2012 |
| Name and Municipality of Residence | | Principal Occupation | | Director Since |
| | | | | |
Todd Dillabough Calgary, Alberta | | Chairman, President and Chief Executive Officer of Barons Resources Corp. and a director of San Antonio Oil and Gas Services Ltd. Previously, President, Chief Executive Officer and Chief Operating Officer of Trident Resources Corporation and Pioneer Natural Resources Canada Inc. and a director of Aveos Fleet Performance Inc. | | September 13, 2012 |
| | | | | |
Walter Jones Denver, Colorado | | Corporate Director. Previously, Managing Director of CoMetrics and partner of J.H. Cohn LLP. | | September 13, 2012 |
| | | | | |
Leslie Lederer 1 Chicago, Illinois | | Self-employed Consultant. | | September 13, 2012 |
| | | | | |
Jill Leversage Vancouver, British Columbia | | Managing Director of Highland West Capital, a private merchant bank and Financial Consultant to CEOs in areas of strategic planning, financing interacting with auditors and other professionals, acting CFO duties. Previously, Managing Director, Investment Banking, and then Financial Consultant with TD. | | June 24, 2013 |
| | | | | |
Joe Nemeth Langley, British Columbia | | President and Chief Executive Officer. Previously, President and Chief Executive Officer of Canfor Pulp Products Inc. | | October 1, 2013 |
| | | | | |
Pierre Raymond Montreal, Quebec | | Corporate Director of Imvescor Restaurant Group Inc. Previously, Partner of Stikeman Elliott. | | July 8, 2014 |
Messrs. Jones and Brecker and Ms. Leversage are members of the Company’s Audit Committee.
Messrs. Dillabough, Lederer and Raymond are members of the Company’s Environmental, Health and Safety Committee.
Messrs. Dillabough, Lederer and Raymond are members of the Company’s Governance and Human Resources and Compensation Committee.
Officers
Officers are appointed to serve at the pleasure of the Board of Directors.
| Name and Municipality of Residence | | Principal Occupation |
| | | |
Brian Baarda1 Surrey, British Columbia | | Vice President, Finance and Chief Financial Officer from November 2009 to April 2015. |
| Name and Municipality of Residence | | Principal Occupation |
| | | |
Jim Bayles2 Vancouver, British Columbia | | Senior Vice President, Sales & Marketing from August 2014 to present. Previously, Vice President and General Manager, Newsprint & International Sales from 2008 to August 2015. |
| | | |
Frank De Costanzo3 Vancouver, British Columbia | | Senior Vice President & Chief Financial Officer from July 2015 to present. Previously, Vice President and Global Treasurer of Kinross Gold Corporation from September 2010 to July 2015. |
| | | |
James Isaac Surrey, British Columbia | | Corporate Legal Counsel from May, 2015 to present. Corporate Secretary from July 2015 to present. Previously, Vice President, Legal and Corporate Secretary of Columbus Group from October 2013 to July 2015 and Associate of Gowling Lafleur Henderson LLP from 2009 to October 2013. |
| | | |
Gerrie Kotze New Westminster, British Columbia | | Corporate Controller March 2014 to present. Previously, Director, Corporate Reporting, Risk & Insurance from February 2013 to February 2014; Director, Corporate Reporting from April 2011 to January 2013; and Accounting Manager of VersaCold Logistics Services from 2009 to 2011. |
| | | |
Greg Maule4 Dayton, Ohio | | Senior Vice President, Operations January 2015 to present. Previously, Vice President, Manufacturing Operations with NewPage Corporation from February 2012 to January 2015 and Mill Manager NewPage Escanaba Mill from 2010 to 2012 and Mill Manager NewPage Wisconsin Rapids Mill from 2005 to 2010. |
| | | |
Joe Nemeth Langley, British Columbia | | President and Chief Executive Officer from October 2013 to present and lead director of Fortress Paper Limited from October 2012 to present. Previously, President and Chief Executive Officer of Canfor Pulp Products Inc. from January 2003 to June 2012. |
| | | |
Len Posyniak Vancouver, British Columbia | | Senior Vice President, Human Resources and Corporate Services from August 2014 to present. Previously, Executive Vice President, Human Resources of Corix Group of Companies from 2013 to 2014; and Vice President, Human Resources of Insurance Corporation of British Columbia from 2006 to 2013. |
| | | |
Pat Sakai Burnaby, British Columbia | | Treasurer and Director, Taxation from March 2014 to present. Previously Director, Taxation from 1994 to March 2014. |
| 1 | Mr. Baarda resigned on April 15, 2015. |
| 2 | Mr. Bayles announced his retirement on January 29, 2016, to take effect March 31, 2016. |
| 3 | Mr. De Costanzo was appointed Senior Vice President & Chief Financial Officer on July 10, 2015. |
| 4 | Mr. Maule was appointed Senior Vice President, Operations on January 5, 2015. |
Our directors and officers as a group beneficially own, directly or indirectly, or exercise control or direction over less than 1% of our issued and outstanding common shares.
CEASE TRADE ORDERS, BANKRUPTCIES, PENALTIES OR SANCTIONS
Mr. Baarda was an officer of the Corporation when it filed for relief under the CCAA on January 31, 2012 and when the restructuring under the Plan became effective on September 13, 2012.
Mr. Brecker was a director of Dune Energy, Inc. when the company and two affiliated debtors each filed a voluntary petition for relief under Chapter 11 of the United States Bankruptcy Code on March 8, 2015.
Mr. Dillabough was the Chief Executive Officer of Trident Exploration Corp. when it filed a voluntary petition for relief under the Companies’ Creditors Arrangement Act (Canada) (“CCAA”) and under Chapter 11 of the United States Bankruptcy Code in September 2009 and then emerged successfully in June 2010. Mr. Dillabough was a director of Aveos Fleet Performance Inc. when that company filed a voluntary petition for relief under the CCAA on March 19, 2012. Mr. Dillabough resigned from Aveos Fleet Performance Inc. immediately following the filing.
Mr. Lederer was a director of Port Townsend Paper Corporation in 2007 when it filed for relief under Chapter 11 of the United States Bankruptcy Code.
Compensation Discussion and Analysis
The Corporation’s executive compensation strategy is based on a philosophy which includes three principal components:
| (i) | base salary and benefits aimed at compensating the executive for specific and general accountabilities as well as the skills, knowledge and experience brought to the job; |
| (ii) | short term incentives payable in cash intended to focus initiative on annual objectives and reward behaviour that achieves corporate performance targets; and |
| (iii) | mid and long term incentives granted partly through the issuance of equity based compensation, such as stock options, restricted share units, phantom share units and deferred share units, to encourage the enhancement of shareholder value and partly payable in cash. |
The total compensation strategy is intended to accomplish the following objectives:
| · | to attract executive officers who have demonstrated superior leadership and management skills; |
| · | to retain the services of valued members of the executive team throughout the normal business cycles typical of resource-based companies; |
| · | to link the interests of the executive officers with those of the Shareholders; and |
| · | to motivate executive officers to achieve excellence within their respective areas of accountability. |
Current Peer Group
The Corporation believes its compensation objectives will be reached with a total compensation package which corresponds to base salaries targeted at or below the median of primary and/or secondary peer groups established by the Board.
The 2015 acquisition of the Biron, Wisconsin and Rumford Maine Mills expanded the Corporation’s production capacity by 65%. The Corporation’s product lines and customer base also expanded and results in further penetration of the US market. Close to 50% of Corporation’s business is now in the U.S.
Because of the added scale and complexity of the Corporation, and as part of the 2015 executive compensation review, the Governance, Human Resources and Compensation Committee (“GHRCC”) revised the primary peer group to include publicly-traded Canadian forest and paper product companies with annual revenue between $500 million and $4.5 billion and publicly-traded U.S. paper product companies with revenue between $800 million and $2 billion. Catalyst’s estimated 2015 revenue is positioned close to the 75th percentile of this larger group of companies.
The primary peers are as follows:
Canadian Peers
| Canfor Corporation | Canfor Pulp Products Inc. |
| Interfor Corporation | Mercer International Inc. |
| Norbord Inc. | Resolute Forest Products Inc. |
| Stella-Jones Inc. | Tembec Inc. |
| West Fraser Timber Co. Ltd. | West Forest Products Inc. |
U.S. Peers
| Clearwater Paper Corporation | Neenah Paper Ltd. |
| PH Glatfelter Co. | Verso Paper Corporation |
As a secondary reference, Catalyst also compares its compensation to capital intensive industries. No revenue restriction is applied, as the data used is size-adjusted based on Catalyst’s annual revenue.
The GHRCC reviews and benchmarks the Corporation’s total compensation for its executives against the comparator peer group to ensure that Catalyst is providing competitive compensation. Actual awards paid to executives will vary based upon both individual and corporate performance as determined by the GHRCC. Under this philosophy average performance is expected to merit below average pay and superior performance is rewarded with top decile, pay, subject to significant weighting towards the impact of corporate performance. Further variability may exist between the 50th and 90th percentile based on the knowledge, experience and performance that the executive brings to his or her respective position.
Salaries, benefits and perquisites are generally reviewed annually and adjustments are made when appropriate.
Various sources of market data are used to ensure that executive compensation levels are aligned with competitive market trends and that the executive compensation plan remains competitive relative to total compensation packages for similar roles in the forest industry and general industry. The Corporation intends, over time, to adjust the compensation opportunity for the executives to reflect the scope and complexity of their roles and to align pay levels according to the Corporation’s compensation philosophy relative to the peer group.
Base Salary, Benefits and Perquisites
Base salary is a fixed element of compensation for each executive officer for performing his or her position’s specific responsibilities and is typically determined with general reference to, among other things, base salary compensation at industry peers. Base salary is intended to fit into the Corporation’s overall compensation objectives by serving to attract and retain talented executive officers. Base salaries are targeted at or below the median of primary and/or secondary peer groups established by the Board with the assistance of independent consultants. Variability may exist between the 50th and 90th percentile based on the knowledge, experience and performance that the executive brings to his or her respective position.
Short Term Incentive Plan
The executive short-term incentive plan (“STIP”) is intended to provide variable pay based on the achievement of measurable corporate and individual performance objectives. Each executive position has a target STIP award value that is expressed as a percentage of base salary. The percentage of base salary represented by the target STIP award for the CEO and each Named Executive Officer (“NEO” as defined below) is as follows: Mr. Nemeth: 100%; Mr. Bayles: 60%; Mr. De Costanzo: 60%, Mr. Maule: 60% and Mr. Posyniak: 60%. Target STIP potential is established such that target total cash compensation is positioned between the 75th and 90th percentile levels of the primary peer group. STIP targets and awards are designed to be reflective of executive performance and are linked to specific value creation within the organization. STIP awards are allocated in cash.
The Board adopted a new design for the STIP plan for use in 2015 that is driven by improvement in free cash flow and important corporate, business unit and individual performance measures. The plan becomes active once the free cash flow trigger set by the Board has been hurdled. Employees then become eligible for a STIP award based on corporate, divisional and individual performance. As the free cash flow trigger was not hurdled in 2015, there were no STIP payments to the CEO and Named Executive Officers for 2015.
Mid to Long Term Incentive Plan
The Board believes that executives should have a stake in the Corporation’s future and their interests should be aligned with those of the shareholders.
The mid to long-term incentive plan (“MLTIP”) has targets established for each participant and has three components, each based on 1/3 of the target MLTIP over the MLTIP period for each executive:
| 1. | Time based awards, payable in three instalments at the end of each year of the applicable MLTIP period in cash. |
| 2. | Performance based cash awards where free cash flow (calculated as EBITDA less capital expenditures, interest expense, taxes and employee future benefits (excess cash funding over expense)) for any year in the MLTIP period exceeds $1 million. The payment is calculated for each year by multiplying the 1/3 target MLTIP amount which are divided into three equal annual components that are adjusted for each year using the performance multiplier (the ratio of free cash flow for the year over $12.5 million to a maximum ratio of 2 to 1). There were no performance based cash awards earned in respect of 2014 or 2015. |
| 3. | Grants of phantom share unit (“PhantomSUs” or “PSUs”) which provide for payments in an amount by which the market value of a catalyst share on the vesting date exceeds the market value of a catalyst share on the grant date of that share unit. PhantomSUs are issued and paid in CAD currency. Market value is based on a 20-day volume weighted average trading price per share. For the NEOs, PSUs have been granted with the following grant prices: $1.17 per share in the case of Mr. Nemeth; $3.59 in the case of Mr. De Costanzo; $2.73 in the case of Mr. Maule; $2.59 per share in the case of Mr. Bayles and $2.20 per share in the case of Mr. Posyniak. |
In order to be eligible for time based awards, the executive has to be employed by the Corporation on the applicable vesting date. Vesting of performance based cash awards and PhantomSUs granted under the MLTIP vest, on December 31, 2016 with accelerated vesting and payment on a pro-rated basis in the event of retirement, death or disability, termination without cause or change of control and similar events. Applicable payments occur shortly after vest. Performance based cash awards and PhantomSUs are forfeited on resignation or termination with cause.
As described under “Compensation Discussion and Analysis”, the Corporation’s compensation strategy is intended to encourage the enhancement of Shareholder value and link the interests of the executive officers with those of the shareholders. The Corporation is considering alternatives to the present MLTIP model. Specifically, the Corporation wishes to consider moving to a long term incentive pay plan.
TheBoard and the GHRCC have considered the implications of the risks associated with the Corporation’s compensation policies and practices. No risks have been identified arising from the Corporation’s compensation policies and practices that are reasonably likely to have a material adverse effect on the Corporation. As a result, the Board and the GHRCC do not believe that the Corporation’s compensation policies and practices encourage executive officers of the Corporation to expose the Corporation to inappropriate or excessive risks.
Both the Board and the GHRCC are regularly briefed on the Corporation’s results and their effect on the Corporation’s compensation plans. The STIP for salaried employees is both driven by the financial gains made from operational improvements as well as several key performance indicators. The gains are subject to review and validation by the Director of Audit and Risk Management, who reports his finding directly to the Audit Committee.
The MLTIP provides the GHRCC with the capacity to apply informed judgment to adjust payouts in the case of an extraordinary event.
The Corporation does not currently have a policy on whether or not a NEO or director is permitted to purchase financial instruments that are designed to hedge or offset a decrease in market value of equity securities granted as compensation or held, directly or indirectly, by the named executive officer or director.
Performance Graph
As described elsewhere in this Circular, the Corporation’s current common shares (symbol: CYT) were listed and commenced trading on the TSX on January 7, 2013. The TSX had previously suspended trading of the Corporation’s former common shares (symbol: CTL) on February 1, 2012 and delisted them on March 8, 2012 due to the Corporation’s proceedings under the CCAA. The Corporation’s former common shares were then cancelled on September 13, 2012 for no consideration when the restructuring under the Plan of Arrangement completed.
For historical purposes, the following graph compares the yearly percentage change in the Corporation’s cumulative total shareholder return from an investment in the Corporation’s former common shares (symbol: CTL) with the cumulative total return of the S&P/TSX Composite Index (“S&P/TSX”) and the TSX Paper & Forest Products Group and Sub Group (“TSX P&FP”) over the period from December 31, 2010 to March 8, 2012 when they were delisted and illustrates a cumulative return on a $100 investment in the Corporation’s former common shares made on December 31, 2010 as compared with the cumulative return on the S&P/TSX and the TSX P&FP on the same dates.
The graph below also provides a corresponding comparison for the new common shares (symbol: CYT) from January 7, 2013 to December 31, 2015. Performance as indicated in the graph does not necessarily indicate future performance.

| | | Dec 31/11 | | | Dec 31/12 | | | Dec 31/13 | | | Dec 31/14 | | | Dec 31/15 | |
| CTL | | | 14.9 | | | | 6.4 | | | | n/a | | | | n/a | | | | n/a | |
| CYT | | | n/a | | | | n/a | | | | 100.0 | | | | 152.0 | | | | 120.0 | |
| S&P/TSX | | | 91.4 | | | | 97.9 | | | | 97.9 | | | | 121.9 | | | | 112.0 | |
| TSX P&FP | | | 26.0 | | | | 42.8 | | | | 42.8 | | | | 76.2 | | | | 59.9 | |
The graph above reflects how the Corporation continued to be negatively impacted by structural changes in the industry in 2011 to 2015 including permanently reduced demand for certain paper products and significant excess production capacity. During this period, the Corporation structured its executive compensation strategy to take into account the cyclical nature and structural deficiencies of the industry. No STIP awards were made in respect of 2012 or 2013. A STIP award in respect of 2014 performance was awarded in 2015.
Compensation Governance
The GHRCC was established by the Board to assist the Board in fulfilling its responsibilities relating to, among other things, determining compensation matters, including the evaluation and approval of the Corporation’s compensation plans, policies and programs. It is the GHRCC’s responsibility to ensure that the Corporation develops and maintains a compensation program for its executive officers that will be fair and competitive, consistent with the best interests of the Corporation.
The GHRCC is responsible for reviewing the position description and performance goals and objectives relevant to the compensation of the Chief Executive Officer (the “CEO”) and for evaluating the CEO’s performance in light of those goals and objectives. The GHRCC recommends to the Board the CEO’s compensation based on such evaluation. The GHRCC is also responsible for making recommendations to the Board with respect to the compensation of all executive officers, including incentive compensation plans, equity-based plans, the terms of any employment agreement, severance and change of control arrangements and any special or supplemental benefits.
The GHRCC reviews and approves, at the beginning of each year, corporate objectives for the CEO. At the end of the year, the GHRCC evaluates the CEO’s performance against those objectives. The results of the assessment are reported to the Board. The GHRCC also reviews the performance of other executives with input from the CEO.
The GHRCC determines the compensation of the Corporation’s executive officers, reviews the compensation philosophy and guidelines for executive management as well as the individual compensation of each member of the executive team, and reports its conclusions to the Board for its consideration and approval. The GHRCC also administers any stock option or share-based compensation plans, if applicable, and makes recommendations regarding the granting of stock options or share-based compensation to executive management and other key employees of the Corporation where such stock option or share-based compensation plans are in effect.
The GHRCC met twelve (12) times in the year ended December 31, 2015.
Messrs. Raymond, Lederer, and Dillabough are all experienced in corporate governance matters. Messrs. Lederer and Dillabough have served as corporate officers of publicly traded companies, and each has significant experience serving on human resources and compensation committees. Prior to joining the Corporation, Mr. Raymond was a securities and corporate finance lawyer with experience handling corporate governance matters.
Executive Compensation – Committee Activities and Related Fees
The GHRCC has the authority to retain and receive advice from compensation consultants to carry out its duties. The GHRCC periodically receives reports on current executive compensation practices from independent consultants.
The GHRCC engaged Towers Watson to complete a formal review of executive compensation in 2015. The GHRCC’s work plan developed with Towers Watson included both a review of total compensation as well as specific study of the Corporation’s MLTIP plan. The fees paid to Towers Watson for work in relation to executive and director compensation matters was $119,019 in 2015.
In 2015, because of the significant change in the scale and complexity of the corporation, the Board adopted a new compensation peer group, and adjusted the salaries and STIP targets of the CEO and NEOs to better align with the peer group.
In Q4 2015, the Board entered into negotiations with the CEO to renew his employment contract, which was to expire on December 31, 2016. The board wanted to recognize Mr. Nemeth’s contributions and leadership since joining Catalyst in October, 2013 and the secure his services going forward. A new employment agreement was agreed to by the parties on March 1, 2016, and provides for a base salary of $725,000in 2016, and provides revised terms to Mr. Nemeth’s participation in the STIP, the MLTIP (in 2016) and for participation in a new LTIP to be introduced in 2017.
Executive Compensation – All Other Fees
Towers Watson provides other services to the Corporation in connection with the administration of its salaried employee defined benefit pension plan (closed to new entrants since 1994). The consulting fees paid to Towers Watson for work related to pension plan administration, valuation and other activities was $387,675 in 2015.
The Corporation and Towers Watson have taken several steps to maintain the independence of the executive compensation consultant, including ensuring the consultant’s pay is not directly affected by any change in services provided by Towers Watson to management. In addition, the executive compensation consultant:
| · | Is not the client relationship manager; |
| · | Is not involved in any client development activities related to increase consulting services to the Corporation; |
| · | Has limited interactions with management unless they specifically relate to matters for the GHRCC’s review and approval; and |
| · | Does not share any confidential information obtained through work with the GHRCC with other segments of Towers Watson. |
Any decisions made by the Corporation with respect to the compensation of its executives are its own responsibility and may reflect factors and considerations other than the information provided by any compensation consulting firms.
Summary Compensation Table
The following table reflects compensation paid during 2015, 2014 and 2013 to each of the Chief Executive Officer, the Chief Financial Officer and the Corporation’s three most highly compensated executive officers other than the Chief Executive Officer and Chief Financial Officer earning a combined salary and bonus in excess of $150,000 in 2015 (each a “Named Executive Officer” or “NEO).
| | | | | | | | | | | | | | Non-Equity Incentive Plan Compensation | | | | | | | | | | |
Name and Principal
Position | | Year | | Salary ($) | | | Share
based
Awards(1) ($) | | | Option
based
Awards(2) ($) | | | Annual
Incentive
Plans(3) ($) | | | Long term
Incentive
Plans(4) ($) | | | Pension
Value(5) ($) | | | All Other
Compensation(6) ($) | | | Total Compensation ($) | |
| J. Nemeth | | 2015 | | | 625,000 | | | | — | | | | — | | | | 86,250 | (7) | | | 175,000 | | | | 295,370 | | | | — | | | | 1,181,620 | |
| President and Chief | | 2014 | | | 575,000 | | | | — | | | | — | | | | 85,000 | | | | 175,000 | | | | 294,390 | | | | — | | | | 1,129,390 | |
| Executive Officer | | 2013 | | | 157,019 | | | | 275,612 | | | | — | | | | — | | | | 50,000 | | | | 75,351 | | | | — | | | | 557,982 | |
| B. Baarda(8) | | 2015 | | | 98,302 | | | | — | | | | — | | | | 47,300 | (7) | | | — | | | | 10,659 | | | | — | | | | 156,261 | |
| Vice President, | | 2014 | | | 315,000 | | | | — | | | | — | | | | 31,894 | | | | 66,667 | | | | 31,501 | | | | — | | | | 445,062 | (8) |
| Finance and Chief Financial Officer | | 2013 | | | 290,000 | | | | 94,554 | | | | — | | | | — | | | | 258,400 | | | | 29,000 | | | | — | | | | 671,954 | |
| J. Bayles(9) | | 2015 | | | 275,000 | | | | — | | | | — | | | | 25,000 | (7) | | | 66,667 | | | | 28,132 | | | | — | | | | 394,799 | |
| Senior Vice | | 2014 | | | 237,500 | | | | 87,824 | (9) | | | — | | | | 34,557 | | | | 50,000 | | | | 21,612 | | | | — | | | | 431,493 | (9) |
| President, Sales & Marketing | | 2013 | | | 198,750 | | | | — | | | | — | | | | 605 | | | | — | | | | 9,968 | | | | — | | | | 209,323 | (9) |
F. De Costanzo(10)
Senior Vice President & Chief Financial Officer | | 2015 | | | 184,750 | | | | 91,854 | | | | — | | | | — | | | | 100,000 | | | | 18,475 | | | | 38,975 | (10) | | | 434,054 | |
G. Maule(11)
Senior Vice President, Operations | | 2015 | | | 402,629 | | | | 81,820 | | | | — | | | | — | | | | 94,820 | | | | 25,729 | | | | — | | | | 604,998 | |
| L. Posyniak | | 2015 | | | 275,000 | | | | — | | | | — | | | | 37,500 | (7) | | | 66,667 | | | | 27,937 | | | | — | | | | 407,104 | |
| Senior Vice President, Human Resources and Corporate Services | | 2014 | | | 98,557 | | | | 98,420 | | | | — | | | | 48,747 | | | | 66,667 | | | | 9,856 | | | | — | | | | 322,247 | |
| (1) | Represents the fair value of PhantomSUs as at Grant Date. The fair value was estimated using the Black-Scholes option-pricing model. The 2013 share based awards for Mr. Nemeth was corrected in the 2014 circular (the previously reported amount was $327,313). The 2013 share based award for Mr. Baarda was also corrected in the 2014 circular (the previously reported amount was $101,683). |
| (2) | There are no outstanding option based awards. |
| (3) | No STIP payment was made for 2015. Amounts in this column reflect other bonuses paid to be made in 2016 for 2015 performance. |
| (4) | Consists of payments made under the 2014 MLTIP. |
| (5) | Amounts in this column for all NEOs reflect annual contributions and allocations to the Corporation’s defined contribution pension plan, including the supplemental executive retirement plan (“SERP”), for the years ended December 31, 2015, 2014, and 2013. The total pension contribution for Mr. Nemeth includes SERP allocations of $67,500 for 2013 and $270,000 for 2014 and 2015 made pursuant to his employment contract. |
| (6) | Except where indicated, perquisites, including property and personal benefits, do not exceed in the aggregate $50,000 or more than 10% of the respective Named Executive Officer’s total salary for the financial year. |
| (7) | Bonus payments for the acquisition of Biron and Rumford. |
| (8) | Mr. Baarda resigned on April 15, 2015. Mr. Baarda has been corrected in the current version of the circular to $445,062 (the previously reported amount was $413,168) |
| (9) | Mr. Bayles announced his retirement on January 29, 2016, to take effect March 31, 2016. The 2013 total compensation for Mr. Bayles has been corrected in the current version of the circular to $431,493 (the previously reported amount was $445,062). The 2012 total compensation has been corrected to $209,323 (the previously reported amount was $206,332) |
| (10) | Mr. De Costanzo was appointed Senior Vice-President & Chief Financial Officer on July 10, 2015. Amounts in this column for Mr. De Costanzo includes a moving allowance of $31,850. |
| (11) | Mr. Maule was appointed Senior Vice President, Operations on January 5, 2015. He is paid in USD, the amounts presented above have been converted to CDN using the monthly average noon exchange rate for the month the earnings was paid out. |
Incentive Plan Awards
Phantom Share Unit Plan
The Corporation has a PhantomSU plan in connection with the current MLTIP. PhantomSUs do not entitle the holder to any shares of the Corporation. Each PhantomSU represents one common share of the Corporation and entitles the holder to a payment on the vesting date that corresponds to the increase in value of the underlying common shares from the grant date to the vesting date under the MLTIP calculated using the 20 day volume weighted average trading price on the TSX preceding the applicable date. PhantomSUs issued to participants are credited to them by means of an entry in a notional account in their favour on the books of the Corporation. Vesting and payment is determined in accordance with the terms of the MLTIP. Currently there are 721,939 PhantomSUs outstanding under the MLTIP that are held by Named Executive Officers.
Share Compensation Plan
The 2015 share compensation plan (the “Share Compensation Plan”) was approved and adopted at the annual general and special meeting of shareholders on May 13, 2015. The Share Compensation Plan enables the Corporation to issue restricted share units (RSUs), performance share units (PSUs) and stock options. As at December 31, 2015, there were no RSUs, PSUs or stock options outstanding.
Outstanding Share Based and Option Based Awards
The following table shows all outstanding PhantomSUs held by each of the Named Executive Officers as at December 31, 2015. There were no other share-based or option-based awards held by Named Executive Officers as at December 31, 2015.
| | | Share Based Awards(1)(2) | |
| Name | | Number of shares or units of shares
that have not vested
(#) | | | Market or payout value of share based
awards that have not vested
($) | |
| J. Nemeth | | | 449,438 | | | | 635,990 | |
| J. Bayles(3) | | | 77,220 | | | | 61,485 | |
| F. De Costanzo(4) | | | 55,710 | | | | 31,269 | |
| G. Maule(5) | | | 48,840 | | | | 36,945 | |
| L. Posyniak(6) | | | 90,731 | | | | 83,585 | |
| (1) | Represents PhantomSUs under the 2014 MLTIP. |
| (2) | PhantomSUs were granted to executive officers in 2013, 2014 and 2015 and vest on December 31, 2016. It represents the fair value of PhantomSUs as at December 31, 2015. The fair value was estimated using the Black-Scholes option-pricing model assuming, a risk-free interest rate of 0.5%, no annual dividends, a 92% volatility rate, a remaining PhantomSU life of 1 year and grant date values of $1.17 per share in the case of Mr. Nemeth; $3.59 in the case of Mr. De Costanzo; $2.73 in the case of Mr. Maule; $2.59 per share in the case of Mr. Bayles and $2.20 per share in the case of Mr. Posyniak. The risk-free interest rate was based on a zero-coupon government of Canada bond with a remaining term approximately equivalent to the expected life of the PSUs. The Corporation estimated the annual dividends per share and, expected price volatility based upon historical experience. |
| (3) | Mr. Bayles announced his resignation on January 29, 2016 to take effect on March 31, 2016 |
| (4) | Mr. De Costanzo was appointed Senior Vice-President & Chief Financial Officer on July 10, 2015. |
| (5) | Mr. Maule was appointed Senior Vice President, Operations on January 5, 2015. |
| (6) | Mr. Posyniak was appointed Senior Vice President, Human Resources and Corporate Services on August 11, 2014. |
Incentive Plan Awards – Value Vested or Earned During the Year
No share-based awards vested during 2015. There are no outstanding option based awards as at December 31, 2015.
Pension Plan Benefits
Defined Contribution Plans
Named Executive Officers who are Canadian residents participate in a defined contribution plan pursuant to which the Corporation contributes 5% of the executive’s base salary and STIP to a maximum of $25,370 in 2015 ($24,930 in 2014 and $24,270 in 2013). The executive directs the investment of his or her defined contribution account based on a number of alternatives. Upon retirement the executive is entitled to all amounts contributed to and earned on his or her defined contribution account, but no minimum amount of investment return or payout is guaranteed.
Named Executive Officers who are United States residents were entitled to participate in a US defined contribution 401K plan (“US DC Plan”). The US DC Plan provides for employer matching contributions equal to 100% of the first 3% of eligible pay contributed to the plan, and 50% of the next 2% of eligible pay contributed to the plan. In addition, the Corporation would make regular discretionary non-elective contributions for eligible employees equal to 7% of eligible pay (which is subject to certain limits). The employee directs the investment of his defined contribution account based on a number of alternatives. The employee contribution level and matching contribution levels are subject to certain maximums as limited by law. An employee may choose to contribute after tax contributions up to 10% of eligible pay as limited by law. Under the US DC Plan, eligible pay includes salary, bonus, employer share purchase contributions, and vacation taken in pay. Upon retirement, the employee may elect to receive installments or lump sum as provided for by the plan.
Supplemental Executive Retirement Plan (“SERP”)
The Corporation has established a defined contribution segment of the Corporation’s SERP for Named Executive Officers domiciled in Canada. As at December 31, 2015, each of the Named Executive Officers, with the exception of Mr. Maule, was a member of the defined contribution segment of the SERP.
The purpose of the SERP is to provide benefits to Participants to enable them to retire with a total retirement income deemed appropriate by the Board of Directors. Benefits provided by the SERP are in addition to and integrated with the benefits provided under the Catalyst Paper Corporation Retirement Plan for salaried employees.
The SERP brings the Company’s total contribution towards a Named Executive Officer retirement plan to 10% of salary and STIP less the amount credited to the defined contribution plan (see below for more detail). This is done through regular contributions to a notional account. Money contributed to the account are then notionally invested in the employee’s choice of three funds from the defined contribution plan. Money within the SERP are secured by a letter of credit.
The Corporation makes regular notional contributions to the SERP, on behalf of the executives, by way of allocations to their SERP accounts, the amount of which varies among the executives. The SERP credits for the CEO are in accordance with Mr. Nemeth’s employment agreement.
The eligible Canadian domiciled Named Executive Officers’ SERP accounts, other than Mr. Nemeth, are credited with an amount equal to 10% of their salary and STIP less the amount credited to the defined contribution plan referred to above. Under the defined contribution segment of the SERP, the amount of STIP recognized in pensionable earnings is the lesser of 50% of the STIP payment received for the year and 50% of the executive’s target STIP for the year. In the event that 50% of actual STIP payments received are greater than 50% of the executive’s target STIP, the excess amount is carried forward as a banked STIP credit and may be used in years where the executive’s actual incentive compensation is less than the target incentive. In the event that 50% of actual bonus received is less than 50% of target STIP, the unrecognized portion between actual STIP received and the target STIP is carried forward until retirement, termination of employment or death, and any banked STIP credits at that time are applied to the cumulative amount of the unrecognized target STIP awards from prior years. Amounts for Named Executive Officers, other than Mr. Nemeth, vest at the earlier of age 55 or completion of five years of SERP participation.
Mr. Nemeth’s SERP account was credited with lump sum allocations of $270,000 on January 1, 2014, January 1, 2015 and January 1, 2016. All such allocations vest on December 31, 2016 so long as he remains actively employed by Catalyst as of the vesting date. Pursuant to the employment agreement between Mr. Nemeth and the Corporation dated March 1, 2016, Mr. Nemeth will continue to receive lump sum allocations of $270,000 on January 1 of each year. The 2017 and 2018 allocations, and the allocations for each two year period thereafter, shall vest on December 31 of the second year of such two year period, but shall vest only if actively employed as of the respective vesting date. In the case of a termination without cause, all allocations made to the date of termination will vest on the termination date.
On retirement, the executive can elect to receive benefits as either a lump sum or in ten equal annual installments, calculated based on the 10-year Government of Canada bond rate.
Defined Contribution Plans Table
| Name | | Accumulated value
at start of year
($) | | | Compensatory(1)
($) | | | Non-compensatory(2)
($) | | | Accumulated value at
year end
($) | |
| J. Nemeth | | | 411,223 | | | | 295,370 | | | | (23,450 | ) | | | 683,143 | |
| J. Bayles(3) | | | 75,661 | | | | 28,132 | | | | 2,899 | | | | 106,691 | |
| F. De Costanzo(4) | | | 0 | | | | 18,475 | | | | 129 | | | | 18,604 | |
| B. Baarda(5) | | | 700,592 | | | | 10,659 | | | | 35,046 | | | | 0 | |
| L. Posyniak(6) | | | 9,961 | | | | 27,937 | | | | 227 | | | | 38,124 | |
| (1) | Represents the employer contribution. |
| (2) | Represents non-compensatory amounts including employee contributions and regular investment earnings on employer and employee contributions. |
| (3) | Mr. Bayles announced his resignation on January 29, 2016 to take effect March 31, 2016. |
| (4) | Mr. De Costanzo was appointed Senior Vice-President & Chief Financial Officer on July 10, 2015. |
| (5) | Mr. Baarda resigned on April 15, 2015. |
| (6) | Mr. Posyniak was appointed Senior Vice President, Human Resources and Corporate Services on August 11, 2014. |
In addition, the amounts in the above table include amounts under the column entitled “Long Term Incentive Plans” in the Summary Compensation Table that were taken as allocations to individual SERP accounts as indicated in Note 5 to the Summary Compensation Table above.
Termination and Change of Control Benefits
Pursuant to the employment agreement between Mr. Nemeth and the Corporation March 1, 2016, if Mr. Nemeth’s employment is terminated without cause, by way of one or more lump sums or by monthly payments over a period not exceeding 24 months: (i) he will be paid his then current base salary for a period of 2 years from the date of termination; (ii) the Corporation will make pension contributions or otherwise pay him the equivalent amount for a period of 2 years from the date of termination; and (iii) he will be paid an amount equal to two times the average STIP payment actually paid to him in the preceding two years. In the case of: (i) a termination prior to January 1, 2017, he will be paid payments under the 2014 MLTIP in accordance with its terms, and (ii) in the case of a termination after January 1, 2017, he will be paid payments under the LTIP in effect immediately prior to termination, in accordance with its terms, as applicable, on a pro rata basis to the date of termination. Medical and dental benefits will continue for two years after termination or until eligibility for benefits from new employment, whichever occurs first. All contributions made to the SERP will vest on the date of termination. If Mr. Nemeth’s employment is terminated or the accountabilities or authority of his role is significantly altered within 12 months after a change of control of the Corporation, he will be entitled to a lump sum payment equal to two years’ base salary and pension contributions together with an amount equal to two times the average STIP payment actually paid to him in the preceding two years (or, if only one annual STIP payment has been made, two times the amount of that STIP payment), payment under the 2014 MLTIP in accordance with its terms (if applicable), payment under the LTIP in accordance with its terms (if applicable), and continuation of medical and dental benefits for two years after termination or until eligibility for benefits from new employment whichever occurs first. Assuming that such termination had occurred on December 31, 2015, the estimated value of the incremental payments and benefits to which Mr. Nemeth would be entitled under the agreement is $2,296,129.
Pursuant to the employment agreement between Mr. Posyniak and the Corporation dated July 11, 2014, if Mr. Posyniak’s employment is terminated without cause he will be entitled to continuation of his base salary and pension plan contributions for 24 months following the date of termination (the salary continuance period), together with an amount equal to two times the average STIP payment actually paid to him in the preceding two years and payments under the 2014 MLTIP in accordance with its terms. Medical and dental benefits will continue for two years after termination or until eligibility for benefits from new employment whichever occurs first. The Corporation will continue all employment perquisites and privileges during such period. In addition, Mr. Posyniak will receive outplacement service and financial counselling services to a maximum of $10,000. If Mr. Posyniak’s employment is terminated or the accountabilities or authority of his role is significantly altered within 12 months after a change of control of the Corporation, he will be entitled to a lump sum payment equal to the sum of two years’ base salary and pension contributions, together with an amount equal to two times the average STIP payment actually paid to him in the preceding two years, payment under the 2014 MLTIP in accordance with its terms and continuation of medical and dental benefits for two years after termination or until eligibility for benefits from new employment whichever occurs first. Assuming that such termination had occurred on December 31, 2015, the estimated value of the incremental payments and benefits to which Mr. Posyniak would be entitled under the agreement is $700,838.
Pursuant to the employment agreement between Mr. Bayles and the Corporation dated April 2, 2014, if Mr. Bayles’ employment is terminated without cause he will be entitled to continuation of his base salary and pension plan contributions for 24 months following the date of termination (the salary continuance period), and payments under the 2014 MLTIP in accordance with its terms. Medical and dental benefits will continue for two years after termination or until eligibility for benefits from new employment, whichever occurs first. The Corporation will continue all employment perquisites and privileges during the salary continuance period. Assuming that such termination had occurred on December 31, 2015, the estimated value of the incremental payments and benefits to which Mr. Bayles would be entitled under the agreement is $674,938. Mr. Bayles announced his resignation on January 29, 2016 to take effect on March 31, 2016.
Pursuant to the employment agreement between Mr. De Costanzo and the Corporation dated June 15, 2015, if Mr. De Costanzo’s employment is terminated without cause he will be entitled to continuation of his base salary and pension plan contributions for 24 months following the date of termination (the salary continuance period), together with an amount equal to two times the average STIP payment actually paid to him in the preceding two years and payments under the 2014 MLTIP in accordance with its terms. Medical and dental benefits will continue for two years after termination or until eligibility for benefits from new employment whichever occurs first. In addition, Mr. De Costanzo will receive outplacement service and financial counselling services to a maximum of $10,000. If De Costanzo’s employment is terminated or the accountabilities or authority of his role is significantly altered within 12 months after a change of control of the Corporation, he will be entitled to a lump sum payment equal to the sum of two years’ base salary and pension contribution, together with an amount equal to two times the average STIP payment actually paid to him in the preceding two years, payment under the 2014 MLTIP in accordance with its terms and continuation of medical and dental benefits for two years after termination or until eligibility for benefits from new employment whichever occurs first. Assuming that such termination had occurred on December 31, 2015, the estimated value of the incremental payments and benefits to which De Costanzo’s would be entitled under the agreement is $941,019.
Pursuant to the employment agreement between Mr. Maule and the Corporation dated July 11, 2014, if Mr. Maule’s employment is terminated without cause he will be entitled to continuation of his base salary and pension plan contribution for 24 months following the date of termination (the salary continuance period), together with an amount equal to two times the average STIP payment actually paid to him in the preceding two years and payments under the 2014 MLTIP in accordance with its terms. Medical and dental benefits will continue for two years after termination or until eligibility for benefits from new employment whichever occurs first. In addition, Mr. Maule will receive outplacement service and financial counselling services to a maximum of $10,000. If Mr. Maule’s employment is terminated or the accountabilities or authority of his role is significantly altered within 12 months after a change of control of the Corporation, he will be entitled to a lump sum payment equal to the sum of two years’ base salary and pension contribution, together with an amount equal to two times the average STIP payment actually paid to him in the preceding two years, payment under the 2014 MLTIP in accordance with its terms and continuation of medical and dental benefits for two years after termination or until eligibility for benefits from new employment whichever occurs first. Assuming that such termination had occurred on December 31, 2015, the estimated value of the incremental payments and benefits to which Mr. Maule would be entitled under the agreement is $1,109,325
Board of Directors Compensation
The GHRCC is responsible for annually reviewing directors’ compensation and making recommendations to the Board. Directors may receive their compensation in the form of cash or deferred share units, or a combination of both.
Under the current directors’ compensation policy, directors are paid an annual cash retainer, meeting fees and equity compensation through PhantomSUs. The Corporation’s Share Compensation Plan enables the Corporation to issue stock options. No stock options were issued in fiscal 2015.
Remuneration of Directors
The following table shows the value and components of the cash compensation elements paid to the Corporation’s directors in 2015:
| | | Retainer | | | Attendance Fees | | | | | | | |
| Director | | Board Chair
Retainer
($) | | | Board
Retainer
($) | | | Committee
Chair
Retainer
($)(1) | | | Committee
Retainer
($) | | | Board
Meetings
($)(2) | | | Committee
Meetings
($)(3) | | | Travel
Fees
($)(4) | | | Total
Paid(5)
($) | |
| John Brecker | | | — | | | $ | 55,000 | | | | — | | | $ | 5,000 | | | $ | 15,000 | | | $ | 11,000 | | | $ | 5,000 | | | $ | 91,000 | |
| Todd Dillabough | | | — | | | $ | 55,000 | | | $ | 10,000 | | | $ | 5,000 | | | $ | 14,000 | | | $ | 18,000 | | | | — | | | $ | 102,000 | |
| Walter Jones | | | — | | | $ | 55,000 | | | $ | 20,000 | | | | — | | | $ | 14,000 | | | $ | 11,000 | | | $ | 4,000 | | | $ | 104,000 | |
| Les Lederer(6) | | $ | 155,000 | | | | — | | | | — | | | | — | | | $ | 15,000 | | | $ | 18,750 | | | $ | 5,000 | | | $ | 193,750 | |
| Jill Leversage | | | — | | | $ | 55,000 | | | | — | | | $ | 5,000 | | | $ | 15,000 | | | $ | 11,000 | | | | — | | | $ | 86,000 | |
| Pierre Raymond | | | — | | | $ | 55,000 | | | $ | 10,000 | | | $ | 5,000 | | | $ | 15,000 | | | $ | 18,750 | | | $ | 5,000 | | | $ | 108,750 | |
| (1) | The Chair of the Audit Committee receives an annual retainer of $20,000. The Chairs of Committees of the Board other than the Audit Committee receive an annual retainer of $10,000. |
| (2) | Each director receives $2,000 per meeting of the Board attended in person and $1,000 per meeting attended by telephone. |
| (3) | Each member of the Audit Committee receives $2,000 per meeting of the Audit Committee attended in person and $1,000 per meeting attended by telephone. Each member of a committee other than the Audit Committee receives $1,500 per meeting of such Committee attended in person and $750 per meeting attended by telephone. |
| (4) | For non-business class travel over 3 hours in duration, each director receives $1,000 per round trip. |
| (5) | PhantomSUs were granted to directors in 2015. No options or other share based awards were granted to directors during 2015. |
| (6) | Mr. Lederer is Chair of the Board. |
In 2015, Towers Watson was retained to provide advice to the GHRCC on the market competitiveness of the Corporation’s director compensation. Towers Watson was paid an aggregate amount of $13,500 in respect of such services in 2015.
The following table shows all compensation provided to the directors for the Corporation’s most recently completed financial year other than Mr. Nemeth, as Chief Executive Officer of the Corporation, does not receive compensation in his capacity as a director.
| Name | | Fees earned
($) | | | Share
based
awards(1)
($) | | | Option
based
awards(1)
($) | | | Non-equity
incentive plan
compensation ($) | | | Pension
value
($) | | | All other
compensation
($) | | | Total
($) | |
| John Brecker | | | 91,000 | | | | 47,381 | | | | — | | | | — | | | | — | | | | — | | | | 138,381 | |
| Todd Dillabough | | | 102,000 | | | | 47,381 | | | | — | | | | — | | | | — | | | | — | | | | 149,381 | |
| Walter Jones | | | 104,000 | | | | 47,381 | | | | — | | | | — | | | | — | | | | — | | | | 151,381 | |
| Les Lederer(2) | | | 193,750 | | | | 47,381 | | | | — | | | | — | | | | — | | | | — | | | | 241,131 | |
| Jill Leversage | | | 86,000 | | | | 47,381 | | | | — | | | | — | | | | — | | | | — | | | | 133,381 | |
| Pierre Raymond | | | 108,750 | | | | 47,381 | | | | | | | | | | | | | | | | | | | | 156,131 | |
| (1) | PhantomSUs were granted to directors in 2014 and 2015. Represents the fair value of PhantomSUs as at Grant Date. The fair value was estimated using the Black-Scholes option-pricing model assuming, a risk-free interest rate of 0.5%, no annual dividends, a 92% volatility rate. For shares granted in May 2015, a remaining PhantomSU life of 3.3 years and a grant date value of $3.55. For shares granted in August 2015, a remaining PhantomSU life of 3.8 years and a grant date value of $3.01. The risk-free interest rate was based on a zero-coupon Government of Canada bond with a remaining term approximately equivalent to the expected life of the PSUs. The Corporation estimated the annual dividends per share and, expected price volatility based upon historical experience. No options or other share based awards were granted to directors during 2015. |
| (2) | Mr. Lederer was also paid consulting services fees of US$9,625 with respect to the acquisition of the NewPage Biron and Rumford mills in January, 2015 and US$16,800 with respect to a potential capital project in November, 2015. |
Phantom Share Units (Equity Based Pay)
Directors will be granted PhantomSUs consistent with the Corporation’s executive MLTIP as summarized below:
| Terms | | Details | | Alignment with executive MLTIP |
| Granting | | Annual after AGM (timing to be determined) | | MTLIP grants made on a discrete basis once every three years |
| Payout | | Incremental increase in share price at the end of three years | | Same as PhantomSUs component |
| Vesting | | Cliff vest at the end of three years (see example below) | | Same as PhantomSUs component |
| Market Price | | Based on Catalyst’s 20-day volume weighted average share price | | Same as PhantomSUs component |
| Settlement | | Cash | | Same |
| Termination and Retirement Provisions | | Fully vests with payout upon termination/retirement based on the market price as of the termination/retirement date. Awards will also fully vest should a Transforming Event occur (suggested approach given annual awards) | | Consistent since the MLTIP pro-rates awards for retirement or termination without cause or a Transforming Event but every grant represents three years’ worth of awards |
Vesting Illustration
The chart below illustrates the timing of the vesting of the PSU awards for Catalyst’s directors assuming the first annual grant is made in 2014. Directors will receive annual payouts from the program starting in 2017.
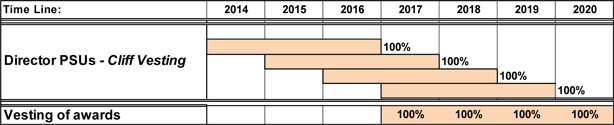
Phantom Share Units
PhantomSUs will be granted to directors on an annual basis after the annual general meeting (“AGM”). The structure of the PhantomSUs is consistent with those granted to executives of the Corporation, except that awards will fully vest and payout when the director leaves the Board. As of December 31, 2015, there were 680,372 PhantomSUs outstanding under the MLTIP that are held by directors.
DSU Plan
Under the current directors’ Deferred Share Unit (“DSU”) plan, directors may choose to convert all or part of their cash compensation into DSUs. The number of DSUs granted to a director is equal to the elected amount of the compensation divided by the weighted average price of the common shares on the TSX over the ten days prior to the calculation date. The value of the DSUs is payable by the Corporation only after the director’s departure from the Board and is equal to the number of DSUs held by the director multiplied by the weighted average price of the common shares on the TSX over the ten days prior to the relevant redemption date. Directors may elect to redeem their DSUs at any time prior to December 15th of the year following the year they ceased to be a director. All amounts are paid in cash, subject to statutory withholdings. A director may change his or her DSU election prior to the commencement of each calendar year.
As at December 31, 2015, there were no DSUs outstanding.
Outstanding Share Based and Option Based Awards
The following table shows all outstanding PhantomSUs held by each of the directors as at December 31, 2015. There were no other share-based or option-based awards held by directors as at December 31, 2015.
| | | Share Based Awards | |
| Name | | Number of shares or units of shares
that have not vested
(#) | | | Market or payout value of share based
awards that have not vested(1)
($) | |
| John Brecker | | | 38,489 | | | | 40,708 | |
| Todd Dillabough | | | 38,489 | | | | 40,708 | |
| Walter Jones | | | 38,489 | | | | 40,708 | |
| Les Lederer | | | 38,489 | | | | 40,708 | |
| Jill Leversage | | | 38,489 | | | | 40,708 | |
| Pierre Raymond | | | 38,489 | | | | 40,708 | |
| (1) | PhantomSUs were granted to directors in 2014 and 2015. Represents the fair value of PhantomSUs as at December 31, 2015. The fair value was estimated using the Black-Scholes option-pricing model assuming, a risk-free interest rate of 0.5%, no annual dividends, a 92% volatility rate. For the shares granted in 2014, a remaining PhantomSU life of 2 years and a grant date value of $2.28. For shares granted in May 2015, a remaining PhantomSU life of 3.3 years and a grant date value of $3.55. For shares granted in August 2015, a remaining PhantomSU life of 3.8 years and a grant date value of $3.01. The risk-free interest rate was based on a zero-coupon Government of Canada bond with a remaining term approximately equivalent to the expected life of the PSUs. The Corporation estimated the annual dividends per share and, expected price volatility based upon historical experience. No options or other share based awards were granted to directors during 2014 and 2015. |
Incentive Plan Awards – Value Vested or Earned
There was no value vested in respect of option-based or share-based awards during 2015. All option-based and share-based awards that were outstanding on September 13, 2012 were cancelled for no consideration on that date pursuant to the Corporation’s Plan of Arrangement under the CCAA.
Securities Authorized for Issuance Under Equity Compensation Plans
As at December 31, 2015, there were 1,452,757 common shares authorized for issuance under the Share Compensation Plan.
Each director holds office until the next annual general meeting in 2016 or until his or her successor is elected or appointed, or unless his or her office is earlier vacated under any of the relevant provisions of our by-laws or the Canadian Business Corporation Act (“CBCA”).Directors do not have service contracts with the Company.
Committees of the Board
The Board has established an Audit Committee, Environmental, Health and Safety Committee and Governance, Human Resources and Compensation Committee.
Governance, Human Resources and Compensation Committee (“GHRCC”)
The GHRCC consists of Pierre Raymond (Chair), Todd Dillabough and Leslie Lederer, all of whom are independent.
The GHRCC’s principal function is:
| (i) | to develop and monitor the Corporation’s overall approach to corporate governance issues; |
| (ii) | to recommend to the Board the nominees for election and re-election as members of the Board; |
| (iii) | to review the performance of the Board as a whole and of its committees; and |
| (iv) | to oversee organizational structure, executive appointment and succession, executive compensation, performance review of the Chief Executive Officer, approval of changes to benefit provisions in the Corporation’s salaried pension plans and approval of collective agreements. |
Governance
The Board has delegated to the GHRCC the responsibility for developing and monitoring the Corporation’s overall approach to corporate governance and implementing and administering the governance system. This GHRCC has established position descriptions for the Board as a whole, each Board committee, individual directors, the Chair of the Board and the Chief Executive Officer. The GHRCC reviews these mandates annually, and makes recommendations for amendments where appropriate.
This GHRCC is responsible for recommending to the Board the nominees for election or re-election to the Board. The GHRCC is also responsible for the ongoing assessment of the effectiveness and contribution of the Board, its committees and the individual directors and regularly analyzes the strengths, skills and experience on the Board to determine if changes are required taking into account the strategic direction of the Corporation.
The GHRCC conducts an annual review of the Board as a whole, each committee and individual directors. All directors are surveyed to obtain feedback on the effectiveness of the Board, the committees and individual directors. The review covers the operation of the Board and the committees, the adequacy of the information given to directors, communications between the Board and management and strategic direction and processes. The GHRCC makes recommendations to the Board based on the results of the review.
Human Resources and Compensation
The GHRCC reviews and approves, at the beginning of each year, corporate objectives for the CEO. At the end of the year, the GHRCC evaluates the CEO’s performance against those objectives. The results of the assessment are reported to the Board. The GHRCC also reviews the performance of other executives with input from the CEO.
The GHRCC determines the compensation of the Corporation’s executive officers, reviews the compensation philosophy and guidelines for executive management as well as the individual compensation of each member of the executive team, and reports its conclusions to the Board for its consideration and approval. The GHRCC also administers any stock option or other share based compensation plans, if applicable, and makes recommendations regarding the granting of stock options or other share based compensation to executive management and other key employees of the Corporation where stock option or other share based compensation plans are in effect.
Audit Committee
The Audit Committee consists of Walter Jones (Chair), John Brecker and Jill Leversage. Each of these directors are independent for the purposes of sitting on the Audit Committee, as defined under applicable securities law, and are financially literate. The Board has determined that Ms. Leverage qualifies as an “audit committee financial expert” for the purposes of applicable securities law. The relevant education and experience of each current Audit Committee member is as follows:
| Name | | Relevant Education and Experience |
| Walter Jones | | Mr. Jones has more than 25 years of experience as a turnaround advisor, chief restructuring officer or operating trustee for troubled companies in a broad range of industries. Mr. Jones, now retired, was an equity partner in a large regional accounting and consulting firm and before that was a principal in the restructuring practice of a large regional accounting and advisory firm. Earlier in his career he was; the CFO of an NYSE listed retailer, the vice-president of finance of a merchant banking firm specializing in financially troubled companies and a general management consultant with a national accounting and consulting firm. Mr. Jones holds a Bachelor of Science in industrial engineering from Pennsylvania State University. Mr. Jones is a member of one other audit committee. |
| | | |
| John Brecker | | Mr. Brecker holds a law degree from St. John’s University and a political science degree from American University. He has extensive director and management experience in a family of hedge funds and in those capacities actively supervised financial officers. |
| Name | | Relevant Education and Experience |
| Jill Leversage | | Ms. Leversage is a chartered accountant with more than 25 years of experience in investment banking and M&A advisory services, particularly in the forest and manufacturing industries. She holds a Bachelor of Commerce degree from the University of Calgary and is a Chartered Business Valuator and a Fellow of the Institute of Chartered Professional Accountants of BC. Ms. Leversage is a member of two other audit committees. |
The principal functions of the Audit Committee are:
| (i) | to review all financial information and statutory disclosure documents prior to their approval by the Board and their distribution to Shareholders and other interested persons; |
| (ii) | to evaluate systems of internal control and procedures for financial reporting; |
| (iii) | to review and recommend for approval by the Board the terms of engagement and remuneration of the external auditors; |
| (iv) | to monitor the performance of the external and internal auditors and assess the independence thereof; and |
| (v) | to recommend to the Board the appointment of investment managers for the Corporation’s salaried pension plans and to monitor the performance of these managers. |
The roles and responsibilities of the Audit Committee are contained in its terms of reference, which are reviewed annually. A copy of the text of the Audit Committee’s terms of reference is attached as Schedule D to this Circular.
The Board, through the Audit Committee, identifies and reviews with management the principal risks facing the Corporation and ensures that appropriate risk management systems and internal control systems are implemented. The Audit Committee is also responsible for the Corporation’s financial reporting processes and the quality of its financial reporting. The Audit Committee is free to communicate with the Corporation’s external and internal auditors at any time, and the Committee meets with the Corporation’s internal and external auditors, without management present, on a regular basis.
Through the Audit Committee, the Board has approved policies relating to the treatment and disclosure of corporate information. Public disclosure about the Corporation is reviewed by a group that includes the Chief Executive Officer, Chief Financial Officer, legal, investor relations and corporate controller’s department, and others as required, to ensure timely and accurate disclosure.
All quarterly and annual financial statements, press releases, investor presentations and other corporate materials are posted immediately on the Corporation’s website at www.catalystpaper.com and on SEDAR at www.sedar.com. The Corporation provides live internet and conference call access to interested parties in connection with the release of its quarterly financial information.
The Audit Committee is responsible for pre-approving all non-audit services to be performed by the external auditors. The Chair of the Audit Committee is authorized to pre-approve non-audit services that have a value equal to up to $100,000. All non-audit services pre-approved by the Chair of the Audit Committee are presented to the Audit Committee at its first scheduled meeting following the Chair of the Audit Committee’s pre-approval. In February, 2016, the Audit Committee approved the engagement of the external auditors for the period ending February 28, 2017 for the provision of certain tax related services and miscellaneous accounting advice having an aggregate cost of $150,000.
During the last two financial years, the Corporation incurred the following fees that were paid or payable to its external auditors:
| | | Period ending December 31 | |
| | | 2014 | | | 2015 | |
| Audit Fees | | $ | 770,000 | | | $ | 1,567,500 | |
| Audit Related Fees | | | 23,500 | | | | 23,500 | |
| Tax Fees | | | 84,000 | | | | 60,000 | |
| Total | | $ | 877,500 | | | $ | 1,651,000 | |
The services rendered in connection with “Audit Related Fees” in 2015 consisted primarily of the auditor’s involvement with the audit of our pension plan. The services rendered in connection with “Tax Fees” consisted primarily of tax compliance services.
Environmental, Health and Safety Committee
The EHSC consists of Todd Dillabough (Chair), Leslie Lederer and Pierre Raymond, all of whom are independent.
The mandate of the Environmental, Health and Safety Committee is to:
| (i) | establish principles of environment, health and safety stewardship for the Corporation; |
| (ii) | monitor the Corporation’s compliance with those principles; |
| (iii) | review the Corporation’s methods of communicating environmental, health and safety policies and procedures; and |
| (iv) | review the risks related to environmental issues, including an evaluation of the cost benefit associated with those risks. |
The Environmental, Health and Safety Committee also reviews directors’ duties and responsibilities related to environmental, health and safety matters and recommends practices and procedures to the Board which may be conducive to fulfilling the Corporation’s environmental, health and safety policies.
As of December 31, 2015, we had approximately 2,700 active hourly and salaried employees in Canada and the United States.
Approximately 1,200 hourly employees at our Canadian pulp and paper mills and the Surrey Distribution Centre are members of either Unifor or the Pulp, Paper and Woodworkers of Canada (“PPWC”).
In our US mills, which were acquired on January 7, 2015, approximately 940 hourly employees are covered by collective agreements with United Steelworkers (“USW”), the International Brotherhood of Electrical Workers (“IBEW”), the Office and Professional Employees International Union (“OPEIU”), the International Association of Machinists and Aerospace Workers (“IAM”) and the United Association of Journeymen and Apprentices of the Plumbing and Pipefitting Industry (“UA”).
In the Crofton, Port Alberni and Powell River mills, located in British Columbia, Canada, hourly employees are represented by Unifor and PPWC under five year collective agreements that expire on April 30, 2017. In addition, Unifor is the bargaining agent for a group of hourly employees working in the Surrey Distribution Centre, located in Surrey, British Columbia. This collective agreement expires on March 31, 2019.
The US mills are located in Rumford, Maine and Biron, Wisconsin. Both mills are subject to a Master Labour Agreement entered between the predecessor owners of these mills and the various impacted unions. Catalyst became the successor employer and assumed the obligations under the existing collective agreements through its purchase of these mills. The Master Labour Agreement has an effective date from December 21, 2012 to December 20, 2016 and sets out certain terms and conditions of employment for hourly employees in the covered locations which are in addition to the terms set out in the individual collective agreements applicable to each mill.
The USW, OPEIU, IAM, UA and IBEW represent employees in the Biron mill. At the Rumford mill, hourly employees are represented by the IBEW and the USW. Originally, the expiry dates for these collective agreements were to occur at various times throughout 2015; however, per the Master Labour Agreement, the expiry dates for the collective agreements were extended to March 31, 2018 for the Biron mill and to June 30, 2018 for the Rumford mill.
Our directors and officers as a group beneficially own, directly or indirectly, or exercise control or direction over, less than one percent of the issued and outstanding common shares.
The Company does not currently have a stock option or a restricted share unit (“RSU”) plan. Effective September 13, 2012, the Company’s previous stock option and restricted share unit plans ceased to be in effect and all outstanding stock options and restricted share unit plans were cancelled for no consideration pursuant to the Company’s Plan of Arrangement under the CCAA. There are accordingly no stock options or restricted share units outstanding as of December 31, 2015. The Company is considering the adoption of a share compensation plan that would include the possibility of issuing stock options, performance share units and restricted stock units. The adoption of such a plan would be subject to shareholder and TSX approval.
As at December 31, 2015, the authorized capital of the Company consists of an unlimited number of common shares and 100,000,000preferred shares, of which 14,527,571 common shares and no preferred shares are issued and outstanding.
| ITEM 7 | MAJOR SHAREHOLDERS AND RELATED PARTY TRANSACTIONS |
To the knowledge of the directors and executive officers of the Corporation, as at March 1, 2016, the only persons that beneficially own, directly or indirectly, or exercise control or direction over, more than 5% of the outstanding common shares are:
| (i) | Cyrus Capital Partners L.P., which maintains an aggregate number of common shares held by all of its managed accounts of 6,452,141 common shares, which represents approximately 44.4% of the outstanding common shares; |
| (ii) | Mudrick Capital Management, L.P., which maintains an aggregate number of common shares held by all of its managed accounts of 2,860,473 common shares, which represents approximately 19.7% of the outstanding common shares; |
| (iii) | Stonehill Capital Management, LLC, which maintains an aggregate number of Common Shares held by all of its managed accounts of 1,449,468 Common Shares, which represents approximately 9.9% of the outstanding Common Shares; and |
| (iv) | Oaktree Capital Management, L.P., which maintains an aggregate number of Common Shares held by all of its managed accounts of 802,772 Common Shares, which represents approximately 5.5% of the outstanding Common Shares. |
| B. | Related Party Transactions |
The Company did not undertake any related party transactions during the year ended December 31, 2015.
| C. | Interests of Experts and Counsel |
Information not required for an annual report.
| ITEM 8 | FINANCIAL INFORMATION |
| A. | Consolidated Statements and Other Financial Information |
See Item 17, “Financial Statements”.
Legal Proceedings
We occasionally become party to legal proceedings, generally related to contract disputes and employment law in the ordinary course of business. The final results of currently ongoing legal proceedings, while not immediately determinable, are not expected to have a material effect on our financial results.
Contingencies
Imposition of Countervailing Duties
On July 28, 2015, the DOC issued its Preliminary Determination to impose countervailing duties on Canadian imports of SC Paper from Catalyst Paper and three other Canadian SC paper producers. Catalyst was assigned an “all-others” countervailing duty rate of 11.19%, the simple average of the preliminary rates assigned to Port Hawkesbury Paper and Resolute Forest Products.
On October 13, 2015, the DOC issued its final determination to impose countervailing duties on Canadian imports of SC Paper, assigning a final “all-others” rate of 18.85% based on a weighted average of the final rates assigned to Port Hawkesbury Paper and Resolute Forest Products, the two companies for whom individual investigations were conducted. Based on our current sales mix, the duty has been imposed on approximately 4% of our total sales.
On November 18, 2015, the U.S. International Trade Commission (“ITC”) reached an affirmative determination on the countervailing duties, and on December 10, 2015, the DOC issued its final countervailing duty order. On December 15, 2015, the Company filed a request for the DOC to initiate an expedited review pursuant to which the DOC would examine the countervailing duty order on SC Paper specifically with respect to Catalyst. On February 8, 2016, the DOC published its notice initiating the requested expedited review. On February 16, 2016, the petitioners filed additional subsidy allegations against Catalyst. It is not yet determined whether the DOC will permit such additional allegations to become part of the expedited review at this stage of the process
Two Lawsuits Filed by Halalt First Nation
On January 22, 2016, Catalyst Paper was served with two Notices of Civil Claim by the Halalt First Nation and its business partners. The Company intends to vigorously defend itself against both claims. The first claim, filed jointly by the Halalt, Sunvault Energy Inc. and Aboriginal Power Corp. alleges that the Company disclosed certain confidential information pertaining to a proposed anaerobic digester facility in breach of a confidentiality agreement. The plaintiffs are seeking, among other things, approximately $100 million in damages from Catalyst in connection with the alleged breach of contract and a permanent injunction restraining Catalyst Paper from constructing, owning or operating an anaerobic digester facility. The second claim, filed by the Halalt and its members, alleges that the Company illegally trespassed on, and caused damages to, the Halalt’s asserted territories and fisheries resources through the operation of its Crofton Mill since 1957. The Halalt is seeking an interim and permanent injunction restraining the Company from conducting its operations at the Crofton Mill and are also seeking approximately $2 billion in damages.
Charges Laid Pertaining to Powell River Effluent Releases
On March 12, 2015, charges were laid against us by Environment Canada following two separate incidents that took place at the Company’s Powell River operations in September 2012. Both unrelated incidents were caused by unforeseen power failures which led to releases of cooling water and effluent, generally consisting of untreated waste water containing organic matter such as pulverized wood fibres. On December 8, 2015, Catalyst Paper and the Federal Crown made a joint recommendation to the Court pursuant to which Catalyst pleaded guilty to three counts, two related to deposits that occurred in 2012 and one in relation to a failure to take legally required samples when there was a potential deposit in 2014. In addition, the recommendation required us to pay a $15,000 fine, and a further payment of $185,000 to the Environmental Damages Fund. The Court accepted the recommendation and directed that funds be allocated by the Environmental Damages Fund for salmon habitat restoration, protection or enhancement in British Columbia.
Appeal of Sales Tax Ruling
On October 21, 2015, Catalyst sought leave to appeal at the Supreme Court of Canada the judgment of the BC Court of Appeal made February 4, 2015 with respect to Catalyst’s action against the Province of British Columbia involving a reassessment of the amount of sales tax payable under the Social Services Tax Act on electricity purchased from PREI in 2001 through 2010. This application is still in process.
Export Sales
Export sales constitute a significant portion of our sales. The following chart describes our total export sales and describes the percentage of total export sales for Canada, United States and other countries for the last three fiscal years.
(In millions of dollars, except where otherwise stated)
| | | 20131 | | | 2014 | | | 2015 | |
| | | $ | | | % | | | $ | | | % | | | $ | | | % | |
| Canada | | | 121.6 | | | | 11 | | | | 108.6 | | | | 10 | | | | 142.6 | | | | 7 | |
| United States | | | 523.9 | | | | 50 | | | | 532.0 | | | | 48 | | | | 1,312.8 | | | | 66 | |
| Asia and Australasia | | | 303.0 | | | | 29 | | | | 361.5 | | | | 33 | | | | 371.3 | | | | 19 | |
| Latin America | | | 102.7 | | | | 10 | | | | 106.7 | | | | 9 | | | | 161.6 | | | | 8 | |
| Europe & Other | | | 0.2 | | | | - | | | | 0.5 | | | | - | | | | 2.8 | | | | - | |
| Total sales | | | 1,051.4 | | | | 100 | | | | 1,109.3 | | | | 100 | | | | 1,991.1 | | | | 100 | |
| 1 | Excludes Snowflake sales; the Snowflake operation was classified as a discontinued operation in 2012 and comparative numbers were restated accordingly. |
Dividend Policy
We are not permitted to pay dividends to holders of our common shares under the terms of the indenture governing our 2017 Notes while our 2017 Notes are outstanding. No dividends have been paid in the last five years.
No significant changes have occurred since the date of the annual financial statements provided herein.
| ITEM 9 | THE OFFER AND LISTING |
| A. | Offer and Listing Details |
Common Shares
As at December 31, 2015, the Company has 14,527,571 common shares outstanding. These common shares were issued in 2012 to certain secured and unsecured creditors under the Plan and were listed on the TSX under the symbol “CYT” on January 7, 2013.
On February 1, 2012, the TSX suspended the trading of our former common shares (symbol “CTL”) on the TSX due to the commencement of our proceedings under the CCAA. The last day that our shares traded on the TSX was January 31, 2012. At the close of market on March 8, 2012, the TSX delisted the Company’s common shares on the basis that the Company no longer met the TSX continued listing requirements as a result of our financial condition and the commencement of our CCAA proceedings in January, 2012. During the month of January, 2012, the common shares traded at a high of $0.35, a low of $0.01 and an average daily volume of 2,111,500 shares. The Company’s former common shares did not trade on the TSX during the remainder of 2012 and were cancelled for no consideration effective September 13, 2012.
Using information from published sources, the following information shows the high and low trading values of our common shares (“CYT”) for the periods indicated:
| | | High
($) | | | Low
($) | |
| For the year ended | | | | | | | | |
| December 31, 2015 | | | 7.50 | | | | 2.01 | |
| December 31, 2014 | | | 3.50 | | | | 1.35 | |
| December 31, 2013 | | | 2.76 | | | | 1.00 | |
| | | | | | | | | |
| For the quarter ended | | | | | | | | |
| December 31, 2015 | | | 2.61 | | | | 2.01 | |
| September 30, 2015 | | | 3.51 | | | | 2.10 | |
| June 30, 2015 | | | 4.02 | | | | 3.30 | |
| March 31, 2015 | | | 7.50 | | | | 3.00 | |
| December 31, 2014 | | | 3.50 | | | | 2.24 | |
| September 30, 2014 | | | 2.83 | | | | 1.90 | |
| June 30, 2014 | | | 3.12 | | | | 2.01 | |
| March 31, 2014 | | | 3.25 | | | | 1.35 | |
| | | | | | | | | |
| For the month ended | | | | | | | | |
| February 29, 2016 | | | 1.25 | | | | 1.25 | |
| January 31, 2016 | | | 2.35 | | | | 2.00 | |
| December 31, 2015 | | | 2.40 | | | | 2.40 | |
| November 30, 2015 | | | 2.61 | | | | 2.10 | |
| October 31, 2015 | | | 2.07 | | | | 2.01 | |
| September 30, 2015 | | | 2.50 | | | | 2.10 | |
Information not required for an annual report.
See Item 9.A above.
Information not required for an annual report.
Information not required for an annual report.
Information not required for an annual report.
| ITEM 10 | ADDITIONAL INFORMATION |
Information not required for an annual report.
| B. | Memorandum and Articles of Association |
Description of Share Capital
We are authorized to issue an unlimited number of common shares and 100,000,000 preferred shares. As of December 31, 2015, there were 14,527,571 common shares issued and outstanding and no preferred shares issued and outstanding. All of the issued and outstanding common shares are fully paid. Holders of common shares are entitled to receive dividends as and when declared by our Board of Directors and, unless otherwise provided by legislation, are entitled to one vote per share on all matters to be voted on at all meetings of shareholders. Upon the voluntary or involuntary liquidation, dissolution or winding-up of the Company, the holders of common shares are entitled to share ratably in the remaining assets available for distribution after payment of liabilities. The common shares are not subject to any future call or assessment and there are no pre-emptive, conversion or redemption rights attached to the common shares.
We do not, nor do any of our subsidiaries, hold any common shares in the capital of the Company.
As of December 31, 2015, there are no outstanding stock options or restricted share units, nor are there any stock option or restricted share unit plans in effect.
Description of Articles of Amalgamation and By-Laws
Our articles of amalgamation issued pursuant to the CBCA contain no restrictions on the business we may carry on and the Company’s corporation number is 393761-5.
Our articles of amalgamation and by-laws contain no restrictions on the power of directors:
| 1. | to vote on a proposal arrangement or contract in which the director is materially interested; |
| 2. | in the absence of an independent quorum, to vote compensation to themselves or any member of their body; or |
| 3. | with respect to borrowing powers exercisable by the directors or how such borrowing powers may be varied. |
The restrictions on the ability of a director to vote and the requirement to disclose his or her interest are governed by applicable corporate legislation. There are no restrictions or provisions in our articles of amalgamation or by-laws regarding the retirement or non-retirement of directors under an age limit, although the Board of Directors’ Administrative Guidelines provide that a director must retire at the age of 70, unless otherwise approved by the Board of Directors. There are no restrictions or provisions in our articles of amalgamation or by-laws pertaining to the number of shares required for director qualification.
Rights, Preferences and Restrictions of Shares
Holders of common shares have a right to receive dividends if, as and when declared by the directors. There is no time limit after which dividend entitlement lapses. Each common share entitles the holder to one vote on a poll in respect of the election of directors and any other matter properly coming before a meeting of such holders.
Our directors do not stand for re-election at staggered intervals and cumulative voting for the election of our directors is not permitted. Neither the common shares nor the preferred shares have any right to share in our profits, other than in respect of dividends.
The holders of common shares, subject to the rights of any issued and outstanding preferred shares, have the right to share pro-rata in any surplus in the event of our liquidation.
There are no redemption or sinking fund provisions or liability to further capital calls on holders of common shares. Special rights and restrictions that may be attached to any series of preferred shares issued in the future may include redemption or sinking fund provisions.
The rights, preferences and restrictions applicable to preferred shares will be determined by the Board of Directors at the time such preferred shares are created and issued.
Meetings
Meetings of shareholders may be called by our directors and may be requisitioned by the holders of not less than five percent of our issued share capital carrying the right to vote at a meeting. The court may also call a meeting of shareholders upon application by any director or shareholder. For the purposes of determining shareholders entitled to receive notice of a meeting, the directors may fix an advance date as the record date for such determination. Any record date shall not precede by more than 50 days or by less than 21 days the date on which the meeting is to be held. Each registered shareholder and our auditor is entitled to attend meetings of shareholders.
There are no limitations on the right to own our securities, including the right of non-resident or foreign shareholders to hold or exercise voting rights on our securities, imposed by the laws of Canada or by our articles of amalgamation or by-laws. There are no provisions in our articles of amalgamation or by-laws that would have the effect of delaying, deferring or preventing a change of control of us and that would only operate with respect to a merger, acquisition or corporate restructuring involving us or any of our subsidiaries.
There are no provisions in our articles of amalgamation or by-laws governing the ownership threshold above which shareholder ownership must be disclosed.
| 1. | Restructuring and Support Agreement dated March 11, 2012 among the Corporation and certain holders of the Corporation's 2016 Notes and 2014 Notes. |
| 2. | Second Amended and Restated Plan of Compromise and Arrangement of the Corporation dated June 14, 2012. |
| 3. | Indenture, dated as of September 13, 2012, governing the Corporation’s issuance of secured debentures, notes, bonds or other evidences of indebtedness in an unlimited aggregate principal amount to be issued from time to time pursuant to the Indenture, among Catalyst, the subsidiary guarantors and Wilmington Trust, National Association, as trustee. |
| 4. | First Supplemental Indenture dated as of September 13, 2012, among the Corporation, the subsidiary guarantors named therein and Wilmington Trust, National Association, as trustee governing the terms of the Corporation’s PIK Toggle Senior Secured Notes due October 30, 2017. |
| 5. | Second Supplemental Indenture dated as of September 13, 2012, among the Corporation, the subsidiary guarantors named therein and Wilmington Trust, National Association, as trustee governing the terms of the Corporation’s Floating Rate Senior Secured Notes due September 13, 2016. |
| 6. | Credit Agreement dated as of September 13, 2012 among Catalyst, certain lenders party thereto, Canadian Imperial Bank of Commerce as Administrative Agent and Co-Collateral Agent with Wells Fargo Capital Finance Corporation Canada. |
| 7. | First Amending Agreement dated as of March 20, 2014 among Catalyst, certain lenders party thereto, Canadian Imperial Bank of Commerce as Administrative Agent. |
| 8. | Credit Agreement dated as of March 20, 2014 among Catalyst, certain lenders party thereto, Canadian Imperial Bank of Commerce as Administrative Agent and Co-Collateral Agent with Wells Fargo Capital Finance Corporation Canada. |
| 9. | Second Amending Agreement as of January 7, 2015 among Catalyst, certain lenders party thereto, Canadian Imperial Bank of Commerce as Administrative Agent. |
| 10. | Asset Purchase Agreement dated October 30, 2014, as amended January 7, 2015, among Catalyst Paper Holdings Inc., Catalyst Paper Operations Inc., NewPage Corporation, NewPage Wisconsin System Inc. and Rumford Paper Company. |
TheInvestment Canada Act(“ICA”) generally prohibits implementation of a reviewable investment by an individual, government or agency thereof, corporation, partnership, trust or joint venture that is not a “Canadian” as defined in the ICA (“non-Canadian”), unless after review, the minister responsible for the ICA (the “Minister”) is satisfied that the investment is likely to be of net benefit to Canada. An investment in common shares of the Company by a non-Canadian (other than a “WTO Investor” as defined in theICA) would be reviewable under the ICA if it was an investment to acquire direct control of us and our value of our assets was $5,000,000 or more.
With regard to an investment in common shares of the Company by a WTO Investor (that is not a state-owned enterprise), it would be reviewable under theICA if it was an investment to acquire direct control of us and the value of our assets of equals or exceeds a specified amount (the “Review Threshold”), which is revised every year. The Review Threshold is based on the enterprise value of the Company at the time of proposed acquisition. Enterprise value is determined in accordance with the ICA. The current enterprise value review threshold is C$600 million. The review threshold will increase to C$800 million effective April 24, 2017 and to C$1 billion effective April 24, 2019. Commencing January 1, 2021, the review threshold will be adjusted annually based on growth in nominal GDP.
A non-Canadian, whether a WTO Investor or otherwise, would acquire control of the Company for the purposes of the ICA if he acquired a majority of our common shares. Except in limited circumstances, the acquisition of less than a majority but one-third or more of our common shares would be presumed to be an acquisition of control of the Company unless it could be established we are not controlled in fact by the acquirer through the ownership of common shares. An acquisition of less than one-third of our common shares would be deemed not to constitute an acquisition of control.
Certain transactions in relation to our common shares would be exempt from the ICA, including:
| · | an acquisition of our common shares by a person in the ordinary course of that person’s business as a trader or dealer in securities; |
| · | an acquisition of control of the Company in connection with the realization of a security interest granted for a loan or other financial assistance and not for any purpose related to the provision of the ICA; and |
| · | an acquisition of control of the Company by reason of an amalgamation, merger, consolidation or corporate reorganization following which the ultimate direct or indirect control in fact of the Company, though the ownership of voting interests, remains unchanged. |
Additionally, all investments in Canada - even those that do not amount to an acquisition of control - may now be reviewed on grounds of whether they are likely to be injurious to national security. In particular, upon referral by the Minister, the governor in Counsel may take measures in respect of an investment that it considers advisable to protect national security, including, among other things, (a) directing the non-Canadian not to implement the investment, (b) authorizing the investment on certain conditions, or (c) requiring the non-Canadian to divest themselves of control of the Canadian business or of their investment.
Certain U.S. Federal Income Tax Considerations
The following is a summary of certain United States federal income tax considerations relevant to the ownership and disposition of our common shares, but does not purport to be a complete analysis of all the potential tax considerations relating thereto. This summary is based on the tax laws of the United States (including the Internal Revenue Code of 1986, as amended (the “Code”), its legislative history, existing and proposed regulations thereunder, published rulings and court decisions) as in effect on the date hereof, all of which are subject to change, possibly with retroactive effect. We have not sought any ruling from the Internal Revenue Service (the “IRS”) with respect to the statements made and the conclusions reached in the following summary, and no assurance can be made that the IRS will agree with such statements and conclusions.
This summary applies only if an investor holds our common shares as capital assets. Unless specifically stated otherwise, this summary also does not address the tax considerations arising under the laws of any country other than the United States, any United States state, or any local jurisdiction. In addition, this summary does not address tax considerations applicable to an investor’s particular circumstances or to investors that may be subject to special tax rules, including, without limitation:
| · | banks, insurance companies, or other financial institutions; |
| · | holders subject to the alternative minimum tax; |
| · | tax-exempt organizations; |
| · | brokers or dealers in securities or commodities; |
| · | traders in securities that elect to use a mark-to-market method of accounting for their securities holdings; |
| · | foreign (non-United States) persons or entities; |
| · | persons that are S-corporations, partnerships or other pass-through entities; |
| · | expatriates and certain former citizens or long-term residents of the United States; |
| · | holders whose functional currency is not the U.S. dollar; |
| · | persons holding our common shares as part of a hedging, straddle, conversion or constructive sale transaction or other risk reduction transactions; |
| · | real estate investment trusts or regulated investment companies; or |
| · | persons who are resident or ordinarily resident in Canada. |
Investors should consult their tax advisors about the United States federal, state, local and foreign tax consequences to them of the ownership and disposition of our common shares.
The summary below applies to an investor only if such investor is a beneficial owner of our common shares, is not resident in Canada for purposes of the income tax treaty between the United States and Canada (the “U.S. Tax Treaty”), and is, for United States federal income tax purposes:
| · | an individual citizen or resident of the United States; |
| · | a corporation (or other entity taxable as a corporation for United States federal income tax purposes) created or organized in the United States or under the laws of the United States, any state thereof, or the District of Columbia; |
| · | an estate, the income of which is subject to United States federal income taxation regardless of its source; or |
| · | a trust that (i) is subject to the primary supervision of a United States court and the control of all substantial decisions by one or more United States persons or (ii) has a valid election in effect under applicable Treasury Regulations to be treated as a United States person. |
Taxation of Common Shares
Dividends
Subject to the passive foreign investment company rules discussed below, the gross amount of any distribution by us of cash or property with respect to common shares, including any Canadian tax withheld, will be includable in income by an investor as dividend income at the time of receipt to the extent such distributions are made from our current or accumulated earnings and profits as determined under United States federal income tax principles. Such a dividend will not be eligible for the dividends received deduction generally allowed to corporate shareholders. To the extent, if any, that the amount of any distribution by us exceeds our current and accumulated earnings and profits as determined under United States federal income tax principles, it will be treated first as a tax-free return of an investor’s adjusted tax basis in the common shares and thereafter as capital gain. Notwithstanding the foregoing, we do not intend to maintain calculations of earnings and profits as determined under United States federal income tax principles. Therefore, an investor should expect that a distribution generally will be treated as a dividend even if that distribution would otherwise be treated as a non-taxable return of capital or as capital gain under the rules described above.
Dividends received by an individual may be eligible for preferential rates of taxation, provided (i) certain holding period requirements are satisfied, (ii) the Company is eligible for the benefits of the U.S. Tax Treaty, and (iii) we are not, and in the preceding year were not, a “passive foreign investment company” (as described below). Dividends that are not eligible for preferential rates of taxation will be subject to ordinary income tax rates.
Dividends paid in Canadian dollars will be included in an investor’s gross income in a U.S. dollar amount calculated by reference to the exchange rate in effect on the date of receipt, regardless of whether the Canadian dollars are converted into U.S. dollars at that time. If Canadian dollars are converted into U.S. dollars on the date of receipt, an investor generally should not be required to recognize any foreign exchange gain or loss. An investor who receives a distribution of Canadian dollars and converts the Canadian dollars into U.S. dollars subsequent to the date of receipt of such Canadian dollars will have foreign exchange gain or loss based on any appreciation or depreciation in the value of the Canadian dollar against the U.S. dollar. Such gain or loss will generally be U.S. source ordinary income or loss. Investors should consult their tax advisors regarding the treatment of a foreign currency gain or loss.
Sale or Exchange of Common Shares
Subject to the passive foreign investment company rules discussed below, generally an investor will recognize gain or loss on the sale or exchange of common shares equal to the difference between the amount realized on such sale or exchange and an investor’s adjusted tax basis in the common shares. Gain or loss recognized by an investor on the sale or exchange of a common share generally will be capital gain or loss and generally will be long-term if held more than one year and otherwise short-term. Long-term capital gains recognized by non-corporate investors, including individuals, generally will be subject to a maximum rate of tax of 20%. The deductibility of capital losses is subject to limitations.
If the consideration an investor receives for the common shares is not paid in U.S. dollars, the amount realized will be the U.S. dollar value of the payment an investor receives determined by reference to the spot exchange rate in effect on the date of the sale or exchange or, if the common shares sold or exchanged are traded on an “established securities market” and an investor is a cash basis taxpayer or an electing accrual basis taxpayer, the spot exchange rate in effect on the settlement date. An investor will have a tax basis in any foreign currency received equal to the U.S. dollar amount realized. Any gain or loss an investor realizes on a subsequent conversion of foreign currency will be U.S. source ordinary income or loss, as the case may be.
Tax on Net Investment Income
A 3.8% tax will be imposed on some or all of the net investment income of certain individuals with modified adjusted gross income of over $200,000 ($250,000 in the case of joint filers) and the undistributed net investment income of certain estates and trusts. For these purposes, “net investment income” generally will include dividends (including dividends paid with respect to the common shares) and net gain attributable to the disposition of property not held in a trade or business (including net gain from the sale, exchange or other taxable disposition of the common shares) and certain other income, but will be reduced by any deductions properly allocable to such income or net gain.
Foreign Tax Credit Considerations
For purposes of the U.S. foreign tax credit limitations, dividends on the common shares will be foreign source income and will generally constitute “passive category income” but could, in the case of certain investors, constitute “general category income.” In general, gain or loss realized upon sale or exchange of the common shares by an investor will be U.S. source income or loss, as the case may be.
Subject to certain complex limitations, including holding period requirements, generally an investor will be entitled to a credit against an investor’s United States federal income tax liability or a deduction in computing an investor’s United States federal taxable income in respect of any Canadian taxes withheld by us (to the extent not refundable). Investors should consult their tax advisors as to the consequences of Canadian withholding taxes and the availability of a foreign tax credit or deduction.
Passive Foreign Investment Company Status
The foregoing discussion assumes that we were not a Passive Foreign Investment Company (“PFIC”) for any taxable year during which an investor held common shares. In general, a non-U.S. corporation is classified as a PFIC for each taxable year in which (i) 75% or more of its gross income is passive income (as defined for U.S. federal income tax purposes) or (ii) on average for such taxable year, 50% or more (by value) of its assets either produce or are held for the production of passive income. To the best of our knowledge and belief and based on information available, we are not and have not been a PFIC at least within the most recent five years, and we expect that we will not become a PFIC in the foreseeable future. However, PFIC classification is factual in nature, generally cannot be determined until the close of the taxable year in question, and is determined annually based on application of complex rules which are uncertain in some respects. Consequently, we cannot provide any assurance that we have not been or will not become a PFIC for any taxable year during which an investor holds or held common shares. If we were determined to be a PFIC for any taxable year during which an investor holds or held common shares, an investor could be subject to special, adverse U.S. federal income tax rules (including increased tax liability). Investors should consult their own tax advisors concerning the U.S. federal income tax consequences of Catalyst being or having been a PFIC.
Information Reporting and Backup Withholding
An investor (other than an “exempt recipient,” including a corporation and certain other persons who, when required, demonstrate their exempt status) may be subject to backup withholding at a rate of 28%, and to information reporting requirements with respect to dividends on, and to proceeds from the sale or exchange of, the common shares. In general, if a non-corporate investor subject to information reporting fails to furnish a correct taxpayer identification number or otherwise fails to comply with applicable backup withholding requirements, backup withholding may apply. The backup withholding tax is not an additional tax and may be credited against an investor’s regular United States federal income tax liability or refunded by the IRS where applicable.
Canadian Federal Income Tax Considerations
The following is a summary of the principal Canadian federal income tax consequences generally applicable to a holder of common shares of Catalyst (a “U.S. holder”) who (i) deals at arm’s length with Catalyst, (ii) holds such common shares as capital property, and who for the purposes of theIncome Tax Act (Canada) (the “Act”) and the Canada-United States Income Tax Convention (the “Treaty”), (iii) is at all relevant times resident in the United States, (iv) is not and is not deemed to be resident in Canada, (v) is entitled to full benefits under the Treaty, and (vi) does not use or hold and is not deemed to use or hold the common shares in carrying on a business in Canada. Special rules, which are not discussed below, may apply to a U.S. holder which is an insurer that carries on business in Canada and elsewhere or that is a limited liability company. Such U.S. holders are advised to consult their own tax advisors.
This summary is of a general nature only and is not, and should not be interpreted as, legal or tax advice to any particular U.S. holder and no representation is made with respect to the Canadian income tax consequences to any particular person. Accordingly, U.S. holders are advised to consult their own tax advisors with respect to their particular circumstances.
Under the Act and the Treaty, a U.S. holder of common shares will generally be subject to a 15% withholding tax on dividends paid or credited or deemed by the Act to have been paid or credited on such shares. The withholding tax rate is 5% where the U.S. holder is a corporation that beneficially owns at least 10% of the voting shares of Catalyst and the dividends may be exempt from such withholding in the case of some U.S. holders such as certain qualifying pension funds and charities.
In general, a U.S. holder will not be subject to Canadian income tax on capital gains arising on the disposition of common shares of Catalyst at a time that the Catalyst’s common shares are listed on the TSX unless (i) at any time in the 60-month period immediately preceding the disposition, 25% or more of the shares of any class or series of the capital stock of Catalyst were owned by the U.S. holder, persons with whom the U.S. holder did not deal at arm’s length for purposes of the Act or the U.S. holder and such persons and (ii) the value of the common shares of Catalyst at the time of the disposition derives principally from real property (as defined in the Treaty) situated in Canada. For this purpose, the Treaty defines real property situated in Canada to include rights to explore for or exploit mineral deposits, sources and other natural resources situated in Canada, rights to amounts computed by reference to the amount or value of production from such resources, certain other rights in respect of natural resources situated in Canada and shares of a corporation the value of whose shares is derived principally from real property situated in Canada.
| F. | Dividends and Paying Agents |
Information not required for an annual report.
Information not required for an annual report.
Any documents referred to in this annual report shall be available for review at the registered office of the Company located at 2nd floor, 3600 Lysander Lane, Richmond, BC V7B 1C3.
Information not required for an annual report.
| ITEM 11 | QUANTITATIVE AND QUALITATIVE DISCLOSURES ABOUT MARKET RISK |
| A. | Quantitative Information about Market Risk |
| (a) | Financial Risk Management |
Financial instruments of the Company consist primarily of cash and cash equivalents, accounts receivable, accounts payable and accrued liabilities and long-term debt. Financial instruments of the Company also include derivatives which the Company uses to reduce its exposure to currency and price risk associated with its revenues, energy costs and long-term debt.
The Company has exposure to risk from its financial instruments, specifically credit risk, market risk (including currency, price and interest rate risk) and liquidity risk.
Credit risk is the risk of financial loss to the Company if a customer or counterparty to a financial instrument fails to meet its contractual obligation. This risk derives principally from the Company’s receivables from customers and derivative counterparties.
Accounts Receivable
The Company is exposed to credit risk on accounts receivable from its customers who are mainly in the newspaper publishing, commercial printing and paper manufacturing businesses. The Company manages its credit risk principally through credit policies, which include the analysis of the financial positions of its customers and the regular review of their credit limits. The Company also subscribes to credit insurance for substantially all of its receivables, periodically purchases accounts receivable puts on certain customers, and obtains bank letters of credit for some export market customers.
Aging of receivables were as follows:
| | | December 31,
2015 | | | December 31,
2014 | |
| Trade receivables, gross | | | | | | | | |
| Current | | $ | 149.4 | | | $ | 88.6 | |
| Past due 1-30 days | | | 14.0 | | | | 2.9 | |
| Past due 31-90 days | | | 3.5 | | | | 1.1 | |
| Past due over 90 days | | | 4.0 | | | | 9.5 | |
| | | | 170.9 | | | | 102.1 | |
| Allowance for doubtful accounts | | | (4.5 | ) | | | (2.3 | ) |
| Trade receivables, net | | | 166.4 | | | | 99.8 | |
| Other receivables, including sales tax recoverables | | | 18.7 | | | | 11.1 | |
| Accounts receivable (note 9) | | $ | 185.1 | | | $ | 110.9 | |
The movement in the allowance for doubtful accounts in respect of trade receivables were as follows:
| | | 2015 | | | 2014 | |
| Balance, beginning of period | | $ | 2.3 | | | $ | 1.8 | |
| Increase in provision | | | 2.2 | | | | 0.5 | |
| Balance, end of period (note 9) | | $ | 4.5 | | | $ | 2.3 | |
Derivatives
The Company is also exposed to credit risk with counterparties to the Company’s derivative financial instruments. The credit risk arises from the potential for a counterparty to default on its contractual obligations, and is limited to those contracts where the Company would incur a cost to replace a defaulted transaction. The Company manages this risk by diversifying through counterparties that are of strong credit quality, normally major financial institutions.
Market risk is the risk that changes in market prices, such as foreign exchange rates, commodity prices and interest rates will affect the Company’s cash flows or the value of its financial instruments (e.g., fixed interest long-term debt).
Currency risk
For the year ended December 31, 2015, the Company was exposed to the risk that future cash flows will fluctuate as substantially all of the Company’s sales and accounts receivable are denominated in U.S. dollars, while only a portion of its costs and payables were denominated in or referenced to U.S. dollars. The Company was also exposed to the fluctuations in the fair value of its debt denominated in U.S. dollars. The Company used foreign currency options and forward contracts to partially hedge trade receivables and anticipated future sales denominated in foreign currencies as well as U.S. dollar denominated debt.
For the year ended December 31, 2014, the Company’s hedging policy for anticipated sales and accounts receivable included 0% to 67% of 0- to 12-month and 0% to 25% of 13- to 24-month U.S. dollar net exposure. Hedges were layered in over time, increasing the portion of sales or accounts receivable hedged as it gets closer to the expected date of the sale or collection of the accounts receivable. The Company’s hedging policy for its U.S. dollar denominated debt includes 0% to 60% of U.S. dollar net exposure. Future U.S. dollar revenues also provide a partial natural hedge for U.S. dollar denominated debt.
Price risk
The Company’s policy allows for hedges of newsprint and pulp to be placed on anticipated sales, and hedges of old newsprint to be placed on anticipated purchases and allows for anticipated purchases at 0% to 70% of 0- to 12-month, 0% to 60% of 13- to 24-month and 0% to 30% of 25- to 36-month of the net exposure for oil and natural gas.
Interest rate risk
The fair value of the Company’s fixed-rate debt or the future cash flows of variable-rate debt or fixed-to-floating interest swaps may fluctuate because of changes in market interest rates. The Company’s policy is to keep the majority of its term debt on a fixed-rate basis, but to allow for the placing of some fixed-to-floating swaps at rates considered acceptable.
Sensitivity analysis for derivative positions and variable rate debt
| | | | | | | | | Effect from increase
in rate or price | | | Effect from decrease
in rate or price | |
| As at December 31, 2015 | | Currency and notional amount | | | Change in rate or price | | | Net
earnings (loss) | | | Other comprehensive income | | | Net
earnings (loss) | | | Other comprehensive income | |
| Revenue hedges | | | | | | | | | | | | | | | | | | | | | | | | |
| Currency risk (US$/CDN$) | | US$ | 115.0 | | | | 5 | % | | $ | 3.7 | | | | – | | | $ | (4.6 | ) | | | – | |
| ABL Facility | | | | | | | | | | | | | | | | | | | | | | | | |
| Interest risk (annualized) | | CDN$ | 40.6 | | | | 100 | bps | | | (0.3 | ) | | | – | | | | 0.3 | | | | – | |
| Interest risk ( annualized) | | US$ | 55.3 | | | | 100 | bps | | | (0.4 | ) | | | – | | | | 0.4 | | | | – | |
Liquidity risk is the risk that the Company will not be able to meet its financial obligations as they fall due. The Company’s approach to managing liquidity is to ensure, as far as possible, that it will have sufficient liquidity to meet its liabilities when due over the next 12 to 24 months, under both normal and stressed conditions, without incurring unacceptable losses or risking damage to the Company’s reputation.
The Company’s principal cash requirements are for interest payments on its debt, capital expenditures and working capital needs. The Company uses its operating cash flows, ABL Facility and cash balances to maintain its liquidity. Internal forecasts are regularly prepared that include earnings, capital expenditures, cash flows, cash or revolver drawings, and sensitivities for major assumptions. The internal forecasts include borrowing base availability and covenant compliance. The Company also monitors the maturities of its long-term debt and assesses refinancing costs and risks in deciding when to refinance debt in advance of its maturity.
| (b) | Revenue Risk Management Instruments |
Foreign currency options and forward contracts outstanding to sell U.S. dollars were as follows:
| | | Options | |
| | | Purchased US$ put | | | Sold US$ call | |
| Term | | Notional amount | | | Average rate
US$/CDN$ | | | Notional amount | | | Average rate
US$/CDN$ | |
| As at December 31, 2015 | | | | | | | | | | | | | | | | |
| 0 to 11 months | | $ | 115.0 | | | | 0.7835 | | | $ | 115.0 | | | | 0.7257 | |
At period-end exchange rates, the net amount the Company would incur to settle the above contracts and options is $4.5 million (December 31, 2014 - $2.0 million). At December 31, 2015, purchased U.S. dollar put options and sold U.S. dollar call options are marked to market, and the related gains and losses are recognized in other income.
| B. | Qualitative Information about Market Risk |
See Item 11A.
This disclosure item is not applicable.
| ITEM 12 | DESCRIPTION OF SECURITIES OTHER THAN EQUITY SECURITIES |
Information not required for an annual report.
Information not required for an annual report.
Information not required for an annual report.
Information not required for an annual report.
| D. | American Depository Shares |
This disclosure item is not applicable.
PART II
| ITEM 13 | DEFAULTS, DIVIDEND ARREARAGES AND DELINQUENCIES |
There has been no default in the payment of principal or interest on our outstanding indebtedness since the date of filing of our last annual report on Form 20-F.
No dividends are in arrears.
| ITEM 14 | MATERIAL MODIFICATIONS TO THE RIGHTS OF SECURITY HOLDERS AND USE OF PROCEEDS |
| A. | There have been no material modifications to the instruments defining the rights of holders of any class of registered securities since the date of filing of our last annual report on Form 20-F. |
| B. | This disclosure item is not applicable. |
| C. | This disclosure item is not applicable. |
| D. | This disclosure item is not applicable. |
| E. | This disclosure item is not applicable. |
| ITEM 15 | CONTROLS AND PROCEDURES |
| A. | Disclosure Controls and Procedures |
We conducted an evaluation of the effectiveness of the design and operation of our disclosure controls and procedures. The evaluation was conducted under the supervision and with the participation of management, including the chief executive officer and chief financial officer, as of December 31, 2015. Based on the evaluation, our chief executive officer and chief financial officer concluded that such disclosure controls and procedures – as defined in Canada under National Instrument 52-109, Certification of Disclosure in Issuers’ Annual and Interim Filings, and in Rules 13a-15(e) and 15d-15(e) promulgated under theUnited States Securities Exchange Act of 1934, as amended (theU.S. Exchange Act) – are effective as at December 31, 2015. The assessment is based on the criteria for internal control over financial reporting described in the “Internal Control – Integrated Framework 2013” issued by the Committee of Sponsoring Organizations of the Treadway Commission.
It should be noted that while our disclosure controls and procedures are designed to provide a reasonable level of assurance of achieving their objectives, our chief executive officer and chief financial officer do not expect that our disclosure controls and procedures or internal control over financial reporting will prevent all errors and fraud. A control system, no matter how well conceived or operated, can provide only reasonable, not absolute, assurance that the objectives of the control system are met.
On January 7, 2015, we completed the acquisition of the Biron paper mill located in Wisconsin, U.S. and the Rumford paper and pulp mill located in Maine, U.S. from NewPage Corporation, NewPage Wisconsin System Inc., and Rumford Paper Company. We are in the process of integrating the acquired mills into our internal control environment. With the exception of internal controls related to the acquired mills, we did not make any changes in internal controls over financial reporting during the period ended December 31, 2015 that have materially affected, or are reasonably likely to materially affect, our internal control over financial reporting.
Section 404 of the United StatesSarbanes-Oxley Act, Management Assessment of Internal Controls (Section 404), continues to require that management (a) has the responsibility for establishing and maintaining an adequate internal control structure and procedure for financial reporting, and (b) assesses and reports on the effectiveness of internal control over financial reporting annually. As of December 31, 2015 management has assessed the effectiveness of the Company’s internal control over financial reporting. Based on this assessment, management has determined the Company’s internal control over financial reporting was effective as of December 31, 2015 and issued Management’s Report on Financial Statements and Assessment of Internal Control over Financial Statements dated February 29, 2016 to that effect.
The Board of directors’ Audit Committee, as part of its oversight role, has reviewed and recommended the approval of this MD&A to the Board of directors. The Board of directors has read and approved this MD&A. Through discussions with management, the Board of directors and the Audit Committee have satisfied themselves that management has implemented the necessary disclosure controls.
| B. | Management’s Annual Report on Internal Control Over Financial Reporting |
Section 404 of the United StatesSarbanes-Oxley Act, Management Assessment of Internal Controls (“Section 404”), continues to require that management (a) have the responsibility for establishing and maintaining an adequate internal control structure and procedure for financial reporting, and (b) assess and report on the effectiveness of internal control over financial reporting annually. As of December 31, 2015, management has assessed the effectiveness of our internal control over financial reporting. Based on this assessment, management has determined our internal control over financial reporting was effective as of December 31, 2015, and issued Management’s Report on Financial Statements and Assessment of Internal Control over Financial Statements dated February 29, 2016 to that effect. This document is included in Item 17.
| C. | Attestation Report of the REGISTERED Public Accounting Firm |
Included in Item 17.
| D. | Changes in Internal Control over Financial Reporting |
There were no changes in our internal control over financial reporting during the period ended December 31, 2015 that materially affected or are reasonably likely to materially affect our internal control over financial reporting.
| ITEM 16A | AUDIT COMMITTEE FINANCIAL EXPERT |
The Board of Directors has determined that Ms. Jill Leversage, an individual serving on the audit committee of our Board of Directors, is an audit committee financial expert and is independent as defined in Item 16A of Form 20-F under the Securities Exchange Act of 1934, as amended.
We have a Code of Corporate Ethics and Behaviour that applies to directors, executives and employees, and is reviewed and committed to by salaried employees each year. Breaches of this code can be reported through an anonymous phone line or other methods, but no reports were received in 2015.
Our governance practices meet or exceed the effective governance guidelines of our listing stock exchange. For more information on our governance, visithttp://catalystpaper.com/about/governance.
| ITEM 16C | PRINCIPAL ACCOUNTANT FEES AND SERVICES |
During the last two financial years, the Corporation incurred the following fees that were paid or payable to its external auditors:
| | | Period ending December 31 | |
| | | 2014 | | | 2015 | |
| Audit Fees | | $ | 770,000 | | | $ | 1,567,500 | |
| Audit Related Fees | | | 23,500 | | | | 23,500 | |
| Tax Fees | | | 84,000 | | | | 60,000 | |
| Total | | $ | 877,500 | | | $ | 1,651,000 | |
The services rendered in connection with “Audit Related Fees” in 2015 consisted primarily of the auditor’s involvement with the audit of our pension plan. The services rendered in connection with “Tax Fees” consisted primarily of tax compliance services.
The Audit Committee has adopted policies and procedures for the pre-approval of audit, tax and other non-audit services provided by the independent registered public accounting firm. These policies and procedures are summarized below.
The terms of engagement and scope of the annual audit of the financial statements are agreed to by the Audit Committee in advance of the engagement of the independent registered public accounting firm in respect of the annual audit. The Audit Committee approves the audit fees.
The independent registered public accounting firm is not permitted to provide non-audit services that would compromise their independence or violate any laws or regulations that would affect their appointment as independent registered chartered accountants. They are eligible for selection to provide non-audit services only to the extent that their skills and experience make them a logical supplier of the services. The Audit Committee must pre-approve the provision of all non-audit services by the independent registered public accounting firm and will consider regulatory guidelines in determining the scope of permitted services. The Audit Committee has pre-approved non-audit services in respect of individual assignments for permitted services that meet certain criteria. Assignments outside these parameters must be specifically pre-approved by the Audit Committee in advance of commissioning the work.
In 2015, our Audit Committee approved all audit, tax and other non-audit services performed by our independent registered public accounting firm.
| ITEM 16D | Exemptions From Listing Standards for Audit Committees |
This disclosure item is not required in an annual report.
| ITEM 16E | Purchases of Equity Securities by the Issuer and its Affiliated purchaser |
This disclosure item is not applicable.
| ITEM 16F | Change in Registrant’s Certifying Accountant |
No change.
| ITEM 16G | Corporate Governance |
This disclosure item is not applicable.
| ITEM 16H | MINE SAFETY DISCLOSURE |
This disclosure item is not applicable.
PART III
| ITEM 17 | FINANCIAL STATEMENTS |
The following financial statements have been filed as part of this annual report.
Reports of Independent Registered Public Accounting Firm and Consolidated Financial Statements of Catalyst Paper Corporation
Audited Consolidated Financial Statements;
| | Report of Independent Registered Public Accounting Firm. |
| | Consolidated Balance Sheets as at December 31, 2015 and December 31, 2014. |
Consolidated Statements of Earnings (Loss) for the years ended December 31, 2015, 2014 and 2013.
Consolidated Statements of Comprehensive Income (Loss) for the years ended December 31, 2015, 2014 and 2013.
Consolidated Statements of Equity (Deficiency) for the years ended December 31, 2015, 2014 and 2013.
Consolidated Statements of Cash Flows for the years ended December 31, 2015, 2014 and 2013.
Consolidated Statements of Business Segments for the years ended December 31, 2015, 2014 and 2013.
| | Notes to the Consolidated Statements. |
| ITEM 18 | FINANCIAL STATEMENTS |
See Item 17.
| ITEM 19 | | EXHIBITS |
| | | |
| 1.1 | | Articles of Catalyst Paper Corporation (3) |
| | | |
| 1.2 | | Bylaws of Norske Skog Canada Limited. (2) |
| | | |
| 4.1 | | Chip Supply Agreement dated November 19, 1992 between Crown Forest Industries Limited and Riverside Forest Products Limited, as assigned July 6, 2000 and assigned January 1, 2001 (current parties Catalyst Paper and Tolko Industries Ltd.). (1) |
| | | |
| 4.1.1 | | Amending Letter dated August 23, 2005 between NorskeCanada and Riverside Forest Product Limited relating to Chip Supply Agreement referred to in Exhibit 4.1 above (current parties Catalyst Paper and Tolko Industries Ltd.). (4) |
| | | |
| 4.2 | | Amended and Restated Chip and Pulplog Supply Agreement dated as of June 23, 1997 between 3264891 Canada Limited, 3264912 Canada Limited and TimberWest Forest Limited, as amended January 1, 1999 (Current parties Catalyst Paper and TimberWest Forest Corp. and TimberWest Forest Company). (1) |
| | | |
| 4.2.1 | | Amendment dated October 3, 2002 to the Amended and Restated Chip and Pulplog Supply Agreement referred to in Exhibit 4.2 above. (1) |
| | | |
| 4.2.2 | | Amendment dated January 1, 2008 to the Amended and Restated Chip and Pulplog Supply Agreement referred to in Exhibit 4.2 above. (4) |
| | | |
| 4.2.3 | | Log Supply Option Agreement dated January 1, 2008 between Catalyst Paper, TimberWest Forest Corp. and TimberWest Forest Company amending agreement referred to in Exhibit 4.2 above. (4) |
| | | |
| 4.3 | | Amended and Restated Timber Harvesting Management Agreement dated as of January 1, 1999 between Fletcher Challenge Canada Limited, TimberWest Forest Corp. and TimberWest Forest Company (current parties Catalyst Paper Corporation, TimberWest Forest Corp and TimberWest Forest Company Partnership). (1) |
| | | |
| 4.3.1 | | Amendment dated January 1, 2008 to Amended and Restated Timber Harvesting Management Agreement referred to in Exhibit 4.3 above. (4) |
| 4.4 | | Chip and Log Supply Agreement dated as of June 8, 1998 between MacMillan Bloedel Limited and MB Paper Limited (current parties Western Forest Products Inc. and Catalyst Paper Corporation). (2) |
| | | |
| 4.4.1 | | Amendment dated March 28, 2006 to Chip and Log Supply Agreement referred to in Exhibit 4.4 above. (4) |
| | | |
| 4.4.2 | | Amendment and Waiver dated October 10, 2006 to Chip and Log Supply Agreement referred to in Exhibit 4.4 above. (4) |
| | | |
| 4.4.3 | | Amendment dated December 5, 2008 to Chip and Log Supply Agreement referred to in Exhibit 4.4 above. (4) |
| | | |
| 4.5 | | Chip and Sawlog Supply Agreement dated September 8, 1980 between British Columbia Forest Products Limited and Doman Industries Limited. (4) |
| | | |
| 4.5.1 | | Amendment dated December 2, 2002 to Chip and Sawlog Supply Agreement referred to in Exhibit 4.5 above. (4) |
| | | |
| 4.5.2 | | Amendment dated November 2, 2004 to Chip and Sawlog Supply Agreement referred to in Exhibit 4.5 above. (4) |
| | | |
| 4.5.3 | | Amendment dated February 1, 2005 to Chip and Sawlog Supply Agreement referred to in Exhibit 4.5 above. (4) |
| | | |
| 4.5.4 | | Amendment dated June 27, 2005 to Chip and Sawlog Supply Agreement referred to in Exhibit 4.5 above. (4) |
| | | |
| 4.5.5 | | Amendment dated October 10, 2006 to Chip and Sawlog Supply Agreement referred to in Exhibit 4.5 above. (4) |
| | | |
| 4.6 | | Chip and Pulplog Supply Agreement dated July 1, 2004 between Teal Jones and Norske Canada (current parties Teal Jones and Catalyst Paper). (4) |
| | | |
| 4.7 | | Restructuring and Support Agreement, entered into on March 12, 2012 among Catalyst Paper Corporation, certain of its subsidiaries and certain holders of its 2014 Notes and 2016 Notes. (6). |
| | | |
| 4.8 | | Indenture, dated as of September 13, 2012, governing the Company’s issuance of secured debentures, notes, bonds or other evidences of indebtedness in an unlimited aggregate principal amount to be issued from time to time pursuant to the Indenture, among Catalyst, the subsidiary guarantors and Wilmington Trust, National Association, as trustee. (7) |
| | | |
| 4.9 | | First Supplemental Indenture dated as of September 13, 2012, among the Company, the subsidiary guarantors named therein and Wilmington Trust, National Association, as trustee governing the terms of the Company’s PIK Toggle Senior Secured Notes due October 30, 2017. (7) |
| | | |
| 4.10 | | Second Supplemental Indenture dated as of September 13, 2012, among the Company, the subsidiary guarantors named therein and Wilmington Trust, National Association, as trustee governing the terms of the Company’s Floating Rate Senior Secured Notes due September 13, 2016. (7) |
| | | |
| 4.11. | | Credit Agreement dated as of September 13, 2012 among the Company, certain lenders party thereto, Canadian Imperial Bank of Commerce as Administrative Agent and Co-Collateral Agent with Wells Fargo Capital Finance Corporation Canada. (8) |
| | | |
| 4.11.1 | | First Amending Agreement to Credit Agreement dated as of March 20, 2014 among the Company, certain lenders party thereto, Canadian Imperial Bank of Commerce as Administrative Agent and Co-Collateral Agent with Wells Fargo Capital Finance Corporation Canada. (10) |
| | | |
| 4.12 | | Credit Agreement dated as of March 20, 2014 among the Company, certain lender parties thereto, Canadian Imperial Bank of Commerce as Administrative Agent and Co-Collateral Agent with Wells Fargo Capital Finance Corporation Canada.(10) |
| 6.1 | | Statement explaining calculation of earnings per share (EPS) (9) |
| | | |
| 7.1 | | Statement explaining the calculation of any ratios in the report (9) |
| | | |
| 12.1 | | Certification of CEO and CFO pursuant to Section 302 of the Sarbanes-Oxley Act of 2002. (9) |
| | | |
| 13.1 | | Certification of CEO and CFO pursuant to 18 U.S.C. Section 1350, as adopted pursuant to Section 906 of the Sarbanes-Oxley Act of 2002. (9) |
| | | |
| 15.1 | | Consolidated balance sheets of the Company as of December 31, 2015 and December 31, 2014 and the related consolidated statements of earnings (loss), comprehensive income (loss), equity (deficiency), and cash flows for each of the years in the three-year period ended December 31, 2015. (9) |
| | | |
| 101.1NS | | XBRL Instance Document |
| | | |
| 101.SCH | | XBRL Taxonomy Extension Schema Document |
| | | |
| 101.CAL | | XBRL Taxonomy Extension Calculation Linkbase Document |
| | | |
| 101.LAB | | XBRL Taxonomy Extension Label Linkbase Document |
| | | |
| 101.PRE | | XBRL Taxonomy Extension Presentation Linkbase Document |
| | | |
| 101.DEF | | XBRL Taxonomy Extension Definitions Linkbase Document |
| | | |
| (10) | | Previously filed (No. 000-49751) on Form 20-F of Catalyst Paper Corporation on March 9, 2015. |
| | | |
| (9) | | Filed herewith. |
| | | |
| (8) | | Previously filed (No. 000-49751) on Form 6-K of Catalyst Paper Corporation on September 25, 2012. |
| | | |
| (7) | | Previously filed (No. 000-49751) on Form 6-K of Catalyst Paper Corporation on September 21, 2012. |
| | | |
| (6) | | Previously filed (No. 000-49751) on Form 6-K of Catalyst Paper Corporation on March 13, 2012. |
| | | |
| (5) | | Previously filed (No. 000-49751) on Form 20-F of Catalyst Paper Corporation on May 12, 2010. |
| | | |
| (4) | | Previously filed (No. 000-49751) on Form 20-F of Catalyst Paper Corporation on May 14, 2009. |
| | | |
| (3) | | Previously filed with registration statement (No. 000-49751) on Form 20-F of Catalyst Paper Corporation on March 19, 2013. |
| | | |
| (2) | | Previously filed with registration statement (No. 333-82406) on Form F-4 of Norske Skog Canada Limited on March 1, 2002. |
| | | |
| (1) | | Previously filed with the registration statement (No. 333-82406) on Form F-4 of Norske Skog Canada Limited on March 1, 2002. Confidential information has been omitted and has been filed separately with the Securities and Exchange Commission. |
SIGNATURES
The Registrant hereby certifies that it meets all of the requirements for filing this Form 20-F and has duly caused and authorized the undersigned to sign this annual report on its behalf.
| | CATALYST PAPER CORPORATION |
| | By: | \\s\\ Frank De Costanzo |
| | | Name: | Frank De Costanzo |
| | | Title: | Senior Vice President & Chief Financial Officer |
Date: March 31, 2016