UNITED STATES
SECURITIES AND EXCHANGE COMMISSION
Washington, D.C. 20549
FORM N-CSR
CERTIFIED SHAREHOLDER REPORT OF REGISTERED
MANAGEMENT INVESTMENT COMPANIES
Investment Company Act file number | 811-10487 |
|
Hotchkis and Wiley Funds |
(Exact name of registrant as specified in charter) |
|
725 S. Figueroa Street, 39th Floor
Los Angeles, California | | 90071 |
(Address of principal executive offices) | | (Zip code) |
|
Anna Marie Lopez Hotchkis and Wiley Capital Management, LLC 725 S. Figueroa Street, 39th Floor Los Angeles, California 90071 |
(Name and address of agent for service) |
|
Registrant’s telephone number, including area code: | (213) 430-1000 | |
|
Date of fiscal year end: | June 30 | |
|
Date of reporting period: | June 30, 2006 | |
| | | | | | | | |
Copies to:
Julie Allecta, Esq.
Paul, Hastings, Janofsky & Walker, LLP
55 Second Street, Twenty-Fourth Floor
San Francisco, California 94105
(Counsel for the Registrant)
Item 1 - Report to Shareholder
Core Value Fund
Large Cap Value Fund
Mid-Cap Value Fund
Small Cap Value Fund
All Cap Value Fund


JUNE 30, 2006
ANNUAL REPORT
TABLE OF CONTENTS
| SHAREHOLDER LETTER | | | | | 3 | | |
|
| FUND PERFORMANCE DATA | | | | | 5 | | |
|
| FUND EXPENSE EXAMPLES | | | | | 11 | | |
|
| SCHEDULE OF INVESTMENTS: | |
|
| CORE VALUE FUND | | | | | 13 | | |
|
| LARGE CAP VALUE FUND | | | | | 15 | | |
|
| MID-CAP VALUE FUND | | | | | 17 | | |
|
| SMALL CAP VALUE FUND | | | | | 19 | | |
|
| ALL CAP VALUE FUND | | | | | 21 | | |
|
| STATEMENTS OF ASSETS AND LIABILITIES | | | | | 22 | | |
|
| STATEMENTS OF OPERATIONS | | | | | 23 | | |
|
| STATEMENTS OF CHANGES IN NET ASSETS | | | | | 24 | | |
|
| FINANCIAL HIGHLIGHTS | | | | | 26 | | |
|
| NOTES TO THE FINANCIAL STATEMENTS | | | | | 31 | | |
|
BOARD CONSIDERATIONS IN APPROVING CONTINUATION
OF INVESTMENT ADVISORY CONTRACTS | | | | | 42 | | |
|
DEAR SHAREHOLDER:
We are pleased to present you with this annual report for the Hotchkis and Wiley Funds. The following investment review and annual report relates to the activities of the Funds for the fiscal year ended June 30, 2006.
OVERVIEW
US equity markets delivered strong absolute returns as most of the major equity indices gained 8 to 15% during the last fiscal year. The surge in smaller cap stocks was particularly notable as the small cap Russell 2000 Index gained 14.58% and the Russell Midcap Index gained 13.66% versus the large cap Russell 1000 Index return of 9.08%. Value-oriented stocks outperformed growth by over 590 basis points in large cap stocks, but were not a significant factor in small cap stocks. The best performing sectors were energy, materials and industrials while healthcare, utilities and consumer discretionary were particularly weak. During the last fiscal year, the Fed increased interest rates in an effort to fight inflation. Against this backdrop, commodity producers such as oil and mining companies surged to new highs as the underlying commodity prices reached new highs. Fearing the adverse impact of higher interest rates, the market has shunned economically sensitive consumer stocks such as homebuilders and embraced the deeply cyclical commodity producers. Our disciplined focus on value has encouraged us to seek out undervalued, out-of-favor stocks like the homebuilders, while avoiding more momentum-oriented groups such as the commodity producers. This philosophy has enabled us to manage through market cycles and benefited our clients over the long-term.
HOTCHKIS AND WILEY CORE VALUE FUND
The Fund's Class I, Class A, and Class C shares had annual total returns of 5.31%, 5.01%, and 4.24%, respectively, compared to the S&P 500 Index return of 8.63% and the style-specific Russell 1000 Value Index return of 12.10%. (Fund results shown do not reflect sales charges and would be lower if sales charges were included. More complete performance information can be found on page 6 of this report to shareholders.)
Nearly all relative underperformance was concentrated in the information technology, industrials, and consumer discretionary sectors. Within the information technology sector, software developers Microsoft Corp. and CA Inc. were negative contributors. In the industrials sector, Cendant Corp. was particularly weak. In the consumer discretionary sector, homebuilders Centex Corp. and Pulte Homes Inc., retail giant Home Depot Inc. and advertising agency Interpublic Group of Cos. were sources of negative performance. Hospital operator Tenet Healthcare Corp. was also a notable underperformer. Our underweight in energy also detracted from performance. Strong relative performance from aluminum producer Alcoa Inc., railroad operator CSX Corp., tobacco giant Altria Group Inc. and IT services provider Electronic Data Systems were leading contributors to performance.
HOTCHKIS AND WILEY LARGE CAP VALUE FUND
The Fund's Class I, Class A, Class C, and Class R shares had annual total returns of 3.10%, 2.82%, 2.08%, and 2.59%, respectively, compared to the S&P 500 Index return of 8.63% and the style-specific Russell 1000 Value Index return of 12.10%. (Fund results shown do not reflect sales charges and would be lower if sales charges were included. More complete performance information can be found on page 7 of this report to shareholders.)
The majority of relative underperformance was concentrated in the information technology, industrials, and consumer discretionary sectors. Within the information technology sector, software developers Microsoft Corp. and CA Inc. were negative contributors. In the industrials sector, Cendant Corp. was particularly weak. In consumer discretionary, homebuilder Lennar Corp., retail giant Home Depot Inc. and automotive supplier Delphi Corp. were sources of negative performance. Hospital operator Tenet Healthcare Corp. was a notable underperformer. Our underweight in energy also detracted from performance. Strong relative performance from aluminum producer Alcoa Inc., supermarket operator Albertsons, tobacco giant Altria Group Inc. and IT services provider Electronic Data Systems were leading contributors to performance.
HOTCHKIS AND WILEY MID-CAP VALUE FUND
The Fund's Class I, Class A, Class C, and Class R shares had annual total returns of 8.53%, 8.27%, 7.46%, and 7.99%, respectively, compared to the Russell Midcap Index return of 13.66% and the Russell Midcap Value Index return of 14.26%. (Fund results shown do not reflect sales charges and would be lower if sales charges were included. More complete performance information can be found on page 8 of this report to shareholders.)
The majority of relative underperformance was concentrated in the financials and consumer discretionary sectors. Within the financials sector, land developer St. Joe Co. was particularly weak. In the consumer discretionary sector, homebuilders Centex Corp. and Pulte Homes Inc., automotive suppliers Lear Corp. and Delphi Corp. and publisher Valassis Communications Inc. were sources of negative performance. Hospital operator Tenet Healthcare Corp. and software developer CA Inc. also were notable underperformers. Strong relative performance from railroad operator CSX Corp., industrial equipment manufacturer Flowserve Corp. and IT services provider Electronic Data Systems were leading contributors to performance.
HOTCHKIS AND WILEY SMALL CAP VALUE FUND
The Fund's Class I, Class A, and Class C shares had annual total returns of 5.13%, 4.86%, and 4.07%, respectively, compared to the Russell 2000 Index return of 14.58% and the Russell 2000 Value Index return of 14.61%. (Fund results shown do not reflect sales charges and would be lower if sales charges were included. More complete performance information can be found on page 9 of this report to shareholders.)
Nearly all relative underperformance was concentrated in the consumer discretionary sector and, to a lesser degree, the financials and materials sectors. Within the consumer discretionary sector, homebuilder WCI Communities, automotive supplier Lear Corp., publisher Valassis Communications Inc. and apparel companies Warnaco Group Inc. and Eddie Bauer Holdings, Inc. were sources of negative performance. In the financials sector, mortgage REITs Aames Investment Corp., Fieldstone Investment Corp. and MortgageIT Holdings Inc., as well as land developer St. Joe Co., were weak. Within the materials sector, we were underweight in the strong performing metals and mining segment. Strong relative performance from industrial equipment manufacturer Flowserve Corp., coal producer Foundation Coal Holdings Inc., temporary staffing
3
company Spherion Corp. and oil refiner Giant Industries Inc. were leading contributors to performance.
HOTCHKIS AND WILEY ALL CAP VALUE FUND
The Fund's Class I, Class A, and Class C shares had annual total returns of –0.24%,–0.50%, and –1.25%, respectively, compared to the S&P 500 Index return of 8.63% and the Russell 3000 Value Index return of 12.32%. (Fund results shown do not reflect sales charges and would be lower if sales charges were included. More complete performance information can be found on page 10 of this report to shareholders.)
The majority of relative underperformance was concentrated in a small number of stocks including homebuilder WCI Communities, software developer CA Inc., hospital operator Tenet Healthcare Corp. and mortgage REITs Aames Investment Corp., Fieldstone Investment Corp. and MortgageIT Holdings Inc. Strong relative performance from insurer The Hanover Insurance Group Inc., oil refiner Tesoro Corp., software developer BMC Software Inc., industrial equipment manufacturer Flowserve Corp. and IT services provider Electronic Data Systems were leading contributors to performance.
We appreciate your continued support of the Hotchkis and Wiley Funds, and we look forward to serving your investment needs in the future.
Sincerely,
 | |  | |  | |
|
Nancy D. Celick
President | | George Davis
Portfolio Manager | | Sheldon Lieberman
Portfolio Manager | |
|
 | |  | |  | |
|
Patty McKenna
Portfolio Manager | | James Miles
Portfolio Manager | | Stan Majcher
Portfolio Manager | |
|
 | |  | | | |
|
David Green
Portfolio Manager | | Joe Huber
Portfolio Manager | | | |
|
The above reflects opinions of portfolio managers as of June 30, 2006. They are subject to change and any forecasts made cannot be guaranteed. Fund holdings and sector allocations are subject to change and are not a recommendation to buy or sell any security. Schedule of Investments begin on page 13. The Funds have no obligation to disclose purchases or sales in these securities.
Past performance does not guarantee future results.
4
Fund Performance Data
ABOUT FUND PERFORMANCE
The Large Cap Value Fund and Mid-Cap Value Fund have four classes of shares. The Core Value Fund, Small Cap Value Fund and All Cap Value Fund have three classes of shares. Each share class has its own sales charge and expense structure, allowing you to invest in the way that best suits your needs. The Core Value Fund, Large Cap Value Fund, Mid-Cap Value Fund, Small Cap Value Fund and All Cap Value Fund are closed to new investors, except as described in the prospectus.
Class I shares have no initial sales charge and bear no ongoing distribution and service fees under a 12b-1 plan. Class I shares are available only to eligible investors.
Class A shares incur a maximum initial sales charge of 5.25% and an annual distribution and service fee of 0.25%.
Class C shares are subject to an annual distribution and service fee of 1.00%. In addition, Class C shares are subject to a 1.00% contingent deferred sales charge (CDSC) if redeemed within one year after purchase.
Class R shares have no initial sales charge or CDSC and are subject to an annual distribution and service fee of 0.50%. Class R shares are available only to certain retirement plans.
The performance shown represents past performance. Past performance is no guarantee of future results and current performance may be higher or lower than the performance shown. Investment results and principal value will fluctuate so that shares, when redeemed, may be worth more or less than their original cost. To obtain performance data current to the most recent month-end, access our website at www.hwcm.com or by calling 1-866-HW-FUNDS.
Performance results do not reflect the deduction of taxes that a shareholder would pay on Fund distributions or the redemption of Fund shares. Figures shown in the "Average Annual Total Return" tables assume reinvestment of all dividends and capital gains distributions at net asset value on the ex-dividend date. The Funds' investment advisor pays annual operating expenses of the Funds' Class I, Class A, Class C and Class R shares over certain levels. If the investment advisor did not pay such expenses, net returns would be lower. Investment return and principal value of shares will fluctuate so that shares, when redeemed, may be worth more or less than their original cost. Dividends paid by each class of shares will vary because of the different levels of distribution and service fees, if any, applicable to each class, which are deducted from the income available to be paid to shareholders. Performance of all Funds except the Co re Value Fund and All Cap Value Fund includes that of predecessor funds.
FUND RISKS
Mutual fund investing involves risk; loss of principal is possible. The Small Cap Value Fund, Mid-Cap Value Fund and All Cap Value Fund invest in small- and medium-capitalization companies which tend to have limited liquidity and greater price volatility than large-capitalization companies. The All Cap Value Fund is a non-diversified fund which involves greater risk than investing in diversified funds, such as business risk, significant stock price fluctuations and sector concentration. Growth stocks typically are more volatile than value stocks; however, value stocks have a lower expected growth rate in earnings and sales.
MARKET INDEXES
The following are definitions for indexes used in the performance summary tables on the following pages. These indexes are unmanaged and include the reinvestment of dividends, but do not reflect the payment of transaction costs and advisory and other fees associated with an investment in the Funds. The securities that comprise these indexes may differ substantially from the securities in the Funds' portfolios. The Funds' value disciplines may prevent or restrict investment in major stocks in the benchmark indexes. It is not possible to invest directly in an index. Each index named is not the only index which may be used to characterize performance of a specific Fund and other indexes may portray different comparative performance.
S&P 500® Index, a capital weighted, unmanaged index, represents the aggregate market value of the common equity of 500 stocks primarily traded on the New York Stock Exchange.
Russell 1000® Index, an unmanaged index, measures the performance of the 1,000 largest companies in the Russell 3000® Index.
Russell 1000® Value Index, measures the performance of those Russell 1000® companies with lower price-to-book ratios and lower forecasted growth values.
Russell Midcap® Index, an unmanaged index, measures the performance of the 800 smallest companies in the Russell 1000® Index.
Russell Midcap® Value Index, measures the performance of those Russell Midcap® companies with lower price-to-book values and lower forecasted growth values.
Russell 2000® Index, is a stock market index comprised of the 2,000 smallest companies in the Russell 3000® Index.
Russell 2000® Value Index, measures the performance of those Russell 2000® companies with lower price-to-book ratios and lower forecasted growth values.
Russell 3000® Index, an unmanaged index, is comprised of the 3,000 largest U.S. companies based on total market capitalization, which represents approximately 98% of the investable U.S. equity market.
Russell 3000® Value Index, measures the performance of those Russell 3000® companies with lower price-to-book ratios and lower forecasted growth values.
5
Fund Performance Data
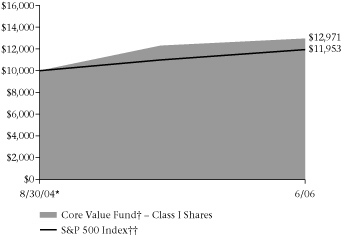
CORE VALUE FUND
Total Return Based on a $10,000 Investment
Comparative Results†††
| | | 1 Year | | Since
8/30/04* | |
| Class I | |
| Average annual total return | | | 5.31 | % | | | 15.25 | % | |
| Class A | |
| Average annual total return (with sales charge) | | | –0.50 | % | | | 11.62 | % | |
| Average annual total return (without sales charge) | | | 5.01 | % | | | 14.95 | % | |
| Class C | |
| Average annual total return (with CDSC) | | | 3.24 | % | | | 14.07 | % | |
| Average annual total return (without CDSC) | | | 4.24 | % | | | 14.07 | % | |
| S&P 500 Index†† | |
| Average annual total return | | | 8.63 | % | | | 10.20 | % | |
| Russell 1000 Index†† | |
| Average annual total return | | | 9.08 | % | | | 11.45 | % | |
| Russell 1000 Value Index†† | |
| Average annual total return | | | 12.10 | % | | | 14.75 | % | |
With sales charge and CDSC returns shown for Class A and Class C shares, respectively, have been adjusted to reflect the current applicable sales charges of each specific class. Returns for Class A reflect the current maximum initial sales charges of 5.25%. Class C shares have no adjustment for sales charges, but redemptions within one year of purchase may be subject to a CDSC of 1%. Average annual total returns (without sales charge or CDSC) do not reflect the current maximum sales charges. Had the sales charge or CDSC been included, the Fund's returns would have been lower.
† The Fund invests primarily in stocks of U.S. companies with market capitalizations similar to the Russell 1000 Index.
†† See index descriptions on page 5.
††† Fund returns during certain periods shown reflect a fee waiver and/or expense reimbursement. Without waiver/reimbursement, returns would have been lower.
* Commencement of Class I, Class A and Class C.
Past performance is not indicative of future results and the table does not reflect the deduction of taxes that a shareholder would pay on Fund distributions or the redemption of Fund shares.
6
Fund Performance Data
LARGE CAP VALUE FUND
Total Return Based on a $10,000 Investment

Comparative Results†††
| | | 1 Year | | 5 Years | | 10 Years | | Since
6/24/87* | |
| Class I | |
| Average annual total return | | | 3.10 | % | | | 11.11 | % | | | 11.51 | % | | | 11.16 | % | |
| Class A | |
| Average annual total return (with sales charge) | | | –2.58 | % | | | 9.69 | % | | | 10.72 | % | | | 10.62 | % | |
| Average annual total return (without sales charge) | | | 2.82 | % | | | 10.88 | % | | | 11.32 | % | | | 10.93 | % | |
| Class C | |
| Average annual total return (with CDSC) | | | 1.08 | % | | | 10.04 | % | | | 10.43 | % | | | 10.06 | % | |
| Average annual total return (without CDSC) | | | 2.08 | % | | | 10.04 | % | | | 10.43 | % | | | 10.06 | % | |
| Class R | |
| Average annual total return | | | 2.59 | % | | | 10.67 | % | | | 11.01 | % | | | 10.64 | % | |
| S&P 500 Index†† | |
| Average annual total return | | | 8.63 | % | | | 2.49 | % | | | 8.32 | % | | | 10.28 | % | |
| Russell 1000 Index†† | |
| Average annual total return | | | 9.08 | % | | | 3.12 | % | | | 8.56 | % | | | 10.41 | % | |
| Russell 1000 Value Index†† | |
| Average annual total return | | | 12.10 | % | | | 6.90 | % | | | 10.85 | % | | | n/a | | |
Returns shown for Class A, Class C, and Class R shares for the periods prior to their inception are derived from the historical performance of Class I shares of the Fund during such periods and have been adjusted to reflect the higher total annual operating expenses of each specific class. (Inception dates: Class A — 10/26/01; Class C — 2/4/02; Class R — 8/28/03.)
With sales charge and CDSC returns shown for Class A and Class C shares, respectively, have been adjusted to reflect the current applicable sales charges of each specific class. Returns for Class A reflect the current maximum initial sales charges of 5.25%. Class C shares have no adjustment for sales charges, but redemptions within one year of purchase may be subject to a CDSC of 1%. Average annual total returns (without sales charge or CDSC) do not reflect the current maximum sales charges. Had the sales charge or CDSC been included, the Fund's returns would have been lower.
† The Fund invests primarily in stocks of U.S. companies with market capitalizations similar to the Russell 1000 Index.
†† See index descriptions on page 5.
††† Fund returns during certain periods shown reflect a fee waiver and/or expense reimbursement. Without waiver/reimbursement, returns would have been lower.
* Commencement of Class I.
Past performance is not indicative of future results and the table does not reflect the deduction of taxes that a shareholder would pay on Fund distributions or the redemption of Fund shares.
7
Fund Performance Data
MID-CAP VALUE FUND
Total Return Based on a $10,000 Investment

Comparative Results†††
| | | 1 Year | | 5 Years | | Since
1/02/97* | |
| Class I | |
| Average annual total return | | | 8.53 | % | | | 15.61 | % | | | 17.51 | % | |
| Class A | |
| Average annual total return (with sales charge) | | | 2.59 | % | | | 14.12 | % | | | 16.57 | % | |
| Average annual total return (without sales charge) | | | 8.27 | % | | | 15.35 | % | | | 17.23 | % | |
| Class C | |
| Average annual total return (with CDSC) | | | 6.46 | % | | | 14.48 | % | | | 16.32 | % | |
| Average annual total return (without CDSC) | | | 7.46 | % | | | 14.48 | % | | | 16.32 | % | |
| Class R | |
| Average annual total return | | | 7.99 | % | | | 15.36 | % | | | 17.10 | % | |
| Russell Midcap Index†† | |
| Average annual total return | | | 13.66 | % | | | 9.92 | % | | | 11.84 | % | |
| Russell Midcap Value Index†† | |
| Average annual total return | | | 14.26 | % | | | 13.01 | % | | | 13.16 | % | |
Returns shown for Class A, Class C, and Class R shares for the periods prior to their inception are derived from the historical performance of Class I shares of the Fund during such periods and have been adjusted to reflect the higher total annual operating expenses of each specific class. (Inception dates: Class A, Class C — 1/2/01; Class R — 8/28/03.)
With sales charge and CDSC returns shown for Class A and Class C shares, respectively, have been adjusted to reflect the current applicable sales charges of each specific class. Returns for Class A reflect the current maximum initial sales charges of 5.25%. Class C shares have no adjustment for sales charges, but redemptions within one year of purchase may be subject to a CDSC of 1%. Average annual total returns (without sales charge or CDSC) do not reflect the current maximum sales charges. Had the sales charge or CDSC been included, the Fund's returns would have been lower.
† The Fund invests primarily in stocks of U.S. companies with market capitalizations similar to the Russell Midcap Index.
†† See index descriptions on page 5.
††† Fund returns during certain periods shown reflect a fee waiver and/or expense reimbursement. Without waiver/reimbursement, returns would have been lower.
* Commencement of Class I.
Past performance is not indicative of future results and the table does not reflect the deduction of taxes that a shareholder would pay on Fund distributions or the redemption of Fund shares.
8
Fund Performance Data
SMALL CAP VALUE FUND
Total Return Based on a $10,000 Investment

Comparative Results†††
| | | 1 Year | | 5 Years | | 10 Years | | Since
9/20/85* | |
| Class I | |
| Average annual total return | | | 5.13 | % | | | 19.65 | % | | | 15.50 | % | | | 13.93 | % | |
| Class A | |
| Average annual total return (with sales charge) | | | –0.64 | % | | | 18.16 | % | | | 14.79 | % | | | 13.40 | % | |
| Average annual total return (without sales charge) | | | 4.86 | % | | | 19.44 | % | | | 15.41 | % | | | 13.69 | % | |
| Class C | |
| Average annual total return (with CDSC) | | | 3.07 | % | | | 18.48 | % | | | 14.38 | % | | | 12.83 | % | |
| Average annual total return (without CDSC) | | | 4.07 | % | | | 18.48 | % | | | 14.38 | % | | | 12.83 | % | |
| Russell 2000 Index†† | |
| Average annual total return | | | 14.58 | % | | | 8.50 | % | | | 9.05 | % | | | 11.03 | % | |
| Russell 2000 Value Index†† | |
| Average annual total return | | | 14.61 | % | | | 13.09 | % | | | 13.26 | % | | | n/a | | |
Returns shown for Class A and Class C shares for the periods prior to their inception are derived from the historical performance of Class I shares of the Fund during such periods and have been adjusted to reflect the higher total annual operating expenses of each specific class. (Inception dates: Class A — 10/6/00; Class C — 2/4/02.)
With sales charge and CDSC returns shown for Class A and Class C shares, respectively, have been adjusted to reflect the current applicable sales charges of each specific class. Returns for Class A reflect the current maximum initial sales charges of 5.25%. Class C shares have no adjustment for sales charges, but redemptions within one year of purchase may be subject to a CDSC of 1%. Average annual total returns (without sales charge or CDSC) do not reflect the current maximum sales charges. Had the sales charge or CDSC been included, the Fund's returns would have been lower.
† The Fund invests primarily in stocks of U.S. companies with market capitalizations less than $3 billion.
†† See index descriptions on page 5.
††† Fund returns during certain periods shown reflect a fee waiver and/or expense reimbursement. Without waiver/reimbursement, returns would have been lower.
* Commencement of Class I.
Past performance is not indicative of future results and the table does not reflect the deduction of taxes that a shareholder would pay on Fund distributions or the redemption of Fund shares.
9
Fund Performance Data
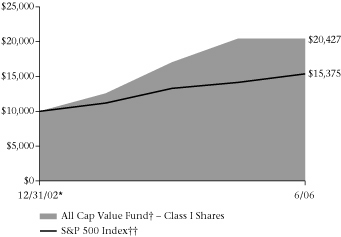
ALL CAP VALUE FUND
Total Return Based on a $10,000 Investment
Comparative Results†††
| | | 1 Year | | Since
12/31/02* | |
| Class I | |
| Average annual total return | | | –0.24 | % | | | 22.67 | % | |
| Class A | |
| Average annual total return (with sales charge) | | | –5.72 | % | | | 20.75 | % | |
| Average annual total return (without sales charge) | | | –0.50 | % | | | 22.62 | % | |
| Class C | |
| Average annual total return (with CDSC) | | | –2.25 | % | | | 21.43 | % | |
| Average annual total return (without CDSC) | | | –1.25 | % | | | 21.43 | % | |
| S&P 500 Index†† | |
| Average annual total return | | | 8.63 | % | | | 13.08 | % | |
| Russell 3000 Index†† | |
| Average annual total return | | | 9.56 | % | | | 14.52 | % | |
| Russell 3000 Value Index†† | |
| Average annual total return | | | 12.32 | % | | | 17.37 | % | |
Returns shown for Class C shares for the periods prior to their inception are derived from the historical performance of Class I shares of the Fund during such periods and have been adjusted to reflect the higher total annual operating expenses of the class. (Inception date: Class C — 8/28/03.)
With sales charge and CDSC returns shown for Class A and Class C shares, respectively, have been adjusted to reflect the current applicable sales charges of each specific class. Returns for Class A reflect the current maximum initial sales charges of 5.25%. Class C shares have no adjustment for sales charges, but redemptions within one year of purchase may be subject to a CDSC of 1%. Average annual total returns (without sales charge or CDSC) do not reflect the current maximum sales charges. Had the sales charge or CDSC been included, the Fund's returns would have been lower.
† The Fund invests primarily in stocks of U.S. companies.
†† See index descriptions on page 5.
†† Fund returns during certain periods shown reflect a fee waiver and/or expense reimbursement. Without waiver/reimbursement, returns would have been lower.
* Commencement of Class I and Class A.
Past performance is not indicative of future results and the table does not reflect the deduction of taxes that a shareholder would pay on Fund distributions or the redemption of Fund shares.
10
Fund Expense Examples (Unaudited)
As a mutual fund shareholder, you incur two types of costs: (1) transaction costs such as initial sales charges (loads) on purchase payments and contingent deferred sales charges on redemptions and (2) ongoing costs, including management fees, distribution and service (12b-1) fees and other fund expenses. The following examples are intended to help you understand your ongoing costs (in dollars) of investing in the Funds and to compare these costs with the ongoing costs of investing in other mutual funds. The examples are based on an investment of $1,000 invested at the beginning of the most recent six-month period and held for the entire period (January 1, 2006 – June 30, 2006).
The table on the following page illustrates the Funds' costs in two ways:
Based on actual fund return. This section provides information about actual account values and actual expenses. You may use the information in this section, together with the amount you invested, to estimate the expenses that you paid over the period. Simply divide your account value by $1,000 (for example, an $8,600 account value divided by $1,000 = 8.6), then multiply the result by the number in the section under the heading entitled "Expenses Paid During Period" to estimate the expenses you paid on your account during this period.
Based on hypothetical 5% return. This section provides information about hypothetical account values and hypothetical expenses based on the Funds' actual expense ratios and an assumed rate of return of 5% per year before expenses, which is not the Funds' actual return. The hypothetical account values and expenses may not be used to estimate the actual ending account balance or expenses you paid for the period. You may use this information to compare the ongoing costs of investing in the Funds and other funds. To do so, compare this 5% hypothetical example with the 5% hypothetical examples that appear in the shareholder reports of the other funds.
Please note that the expenses shown in the table are meant to highlight your ongoing costs only and do not reflect any transactional costs, such as sales charges (loads). Therefore, the second section is useful in comparing ongoing costs only, and will not help you determine the relative total costs of owning different funds. In addition, if these transactional costs were included, your costs would have been higher.
The calculations assume no shares were bought or sold during the period. Your actual costs may have been higher or lower, depending on the amount of your investment and the timing of any purchases or redemptions.
11
Fund Expense Examples (Unaudited)
| | | Beginning
Account Value
1/1/06 | | Ending
Account Value
6/30/06 | | Expenses Paid
During Period*
1/1/06 - 6/30/06 | | Annualized
Expense Ratio | |
| Based on Actual Fund Returns | |
| Core Value Fund | |
| Class I | | $ | 1,000.00 | | | $ | 996.90 | | | $ | 4.70 | | | | 0.95 | % | |
| Class A | | | 1,000.00 | | | | 995.30 | | | | 5.99 | | | | 1.20 | | |
| Class C | | | 1,000.00 | | | | 991.40 | | | | 9.68 | | | | 1.95 | | |
| Large Cap Value Fund | |
| Class I | | | 1,000.00 | | | | 1,000.40 | | | | 5.06 | | | | 0.98 | | |
| Class A | | | 1,000.00 | | | | 999.10 | | | | 6.29 | | | | 1.22 | | |
| Class C | | | 1,000.00 | | | | 995.70 | | | | 9.95 | | | | 1.97 | | |
| Class R | | | 1,000.00 | | | | 997.90 | | | | 7.53 | | | | 1.49 | | |
| Mid-Cap Value Fund | |
| Class I | | | 1,000.00 | | | | 1,025.20 | | | | 5.22 | | | | 1.01 | | |
| Class A | | | 1,000.00 | | | | 1,024.20 | | | | 6.42 | | | | 1.27 | | |
| Class C | | | 1,000.00 | | | | 1,020.20 | | | | 10.17 | | | | 2.01 | | |
| Class R | | | 1,000.00 | | | | 1,022.90 | | | | 7.72 | | | | 1.51 | | |
| Small Cap Value Fund | |
| Class I | | | 1,000.00 | | | | 983.90 | | | | 5.31 | | | | 1.04 | | |
| Class A | | | 1,000.00 | | | | 982.70 | | | | 6.49 | | | | 1.30 | | |
| Class C | | | 1,000.00 | | | | 978.90 | | | | 10.21 | | | | 2.04 | | |
| All Cap Value Fund | |
| Class I | | | 1,000.00 | | | | 973.50 | | | | 4.89 | | | | 0.97 | | |
| Class A | | | 1,000.00 | | | | 971.90 | | | | 6.11 | | | | 1.22 | | |
| Class C | | | 1,000.00 | | | | 968.60 | | | | 9.76 | | | | 1.97 | | |
| Based on Hypothetical 5% Yearly Returns | |
| Core Value Fund | |
| Class I | | | 1,000.00 | | | | 1,020.08 | | | | 4.76 | | | | 0.95 | | |
| Class A | | | 1,000.00 | | | | 1,018.79 | | | | 6.06 | | | | 1.20 | | |
| Class C | | | 1,000.00 | | | | 1,015.08 | | | | 9.79 | | | | 1.95 | | |
| Large Cap Value Fund | |
| Class I | | | 1,000.00 | | | | 1,019.74 | | | | 5.11 | | | | 0.98 | | |
| Class A | | | 1,000.00 | | | | 1,018.50 | | | | 6.36 | | | | 1.22 | | |
| Class C | | | 1,000.00 | | | | 1,014.83 | | | | 10.04 | | | | 1.97 | | |
| Class R | | | 1,000.00 | | | | 1,017.26 | | | | 7.60 | | | | 1.49 | | |
| Mid-Cap Value Fund | |
| Class I | | | 1,000.00 | | | | 1,019.64 | | | | 5.21 | | | | 1.01 | | |
| Class A | | | 1,000.00 | | | | 1,018.45 | | | | 6.41 | | | | 1.27 | | |
| Class C | | | 1,000.00 | | | | 1,014.73 | | | | 10.14 | | | | 2.01 | | |
| Class R | | | 1,000.00 | | | | 1,017.16 | | | | 7.70 | | | | 1.51 | | |
| Small Cap Value Fund | |
| Class I | | | 1,000.00 | | | | 1,019.44 | | | | 5.41 | | | | 1.04 | | |
| Class A | | | 1,000.00 | | | | 1,018.25 | | | | 6.61 | | | | 1.30 | | |
| Class C | | | 1,000.00 | | | | 1,014.48 | | | | 10.39 | | | | 2.04 | | |
| All Cap Value Fund | |
| Class I | | | 1,000.00 | | | | 1,019.84 | | | | 5.01 | | | | 0.97 | | |
| Class A | | | 1,000.00 | | | | 1,018.60 | | | | 6.26 | | | | 1.22 | | |
| Class C | | | 1,000.00 | | | | 1,014.88 | | | | 9.99 | | | | 1.97 | | |
* Expenses are equal to the Funds' annualized expense ratio by class multiplied by the average account value over the period, multiplied by the number of days in the most recent six-month period (181), then divided by the number of days in the most recent 12-month period (365).
12
Schedule of Investments — June 30, 2006
Hotchkis and Wiley Core Value Fund
COMMON
STOCKS — 99.24% | | Shares
Held | | Value | |
| Aerospace & Defense — 4.30% | |
| Lockheed Martin Corporation | | | 581,100 | | | $ | 41,688,114 | | |
| Northrop Grumman Corporation | | | 202,000 | | | | 12,940,120 | | |
| Raytheon Company | | | 317,700 | | | | 14,159,889 | | |
| | | | 68,788,123 | | |
| Auto Components — 0.89% | |
| Magna International Inc. | | | 197,500 | | | | 14,214,075 | | |
| Chemicals — 2.19% | |
| The Mosaic Company (a) | | | 2,244,300 | | | | 35,123,295 | | |
| Commercial Banks — 1.67% | |
| Comerica, Inc. | | | 280,700 | | | | 14,593,593 | | |
| KeyCorp | | | 169,800 | | | | 6,058,464 | | |
| UnionBanCal Corporation | | | 94,000 | | | | 6,071,460 | | |
| | | | 26,723,517 | | |
| Commercial Services & Supplies — 3.60% | |
| Cendant Corporation | | | 2,107,400 | | | | 34,329,546 | | |
| PHH Corporation (a) | | | 1,975 | | | | 54,392 | | |
| Waste Management, Inc. | | | 646,600 | | | | 23,200,008 | | |
| | | | 57,583,946 | | |
| Computers & Peripherals — 0.10% | |
| Hewlett-Packard Company | | | 52,800 | | | | 1,672,704 | | |
| Diversified Financial Services — 4.77% | |
| Bank of America Corporation | | | 458,222 | | | | 22,040,478 | | |
| CIT Group, Inc. | | | 49,900 | | | | 2,609,271 | | |
| JPMorgan Chase & Company | | | 1,229,600 | | | | 51,643,200 | | |
| | | | 76,292,949 | | |
| Electric Utilities — 3.93% | |
| Entergy Corporation | | | 167,000 | | | | 11,815,250 | | |
| FirstEnergy Corporation | | | 40,400 | | | | 2,190,084 | | |
| FPL Group, Inc. | | | 1,182,900 | | | | 48,948,402 | | |
| | | | 62,953,736 | | |
| Food & Staples Retailing — 2.82% | |
| Safeway, Inc. | | | 1,222,100 | | | | 31,774,600 | | |
| Wal-Mart Stores, Inc. | | | 278,400 | | | | 13,410,528 | | |
| | | | 45,185,128 | | |
| Food Products — 3.71% | |
| Kraft Foods, Inc. | | | 563,900 | | | | 17,424,510 | | |
| Sara Lee Corporation | | | 787,800 | | | | 12,620,556 | | |
| Unilever PLC ADR | | | 1,304,460 | | | | 29,402,528 | | |
| | | | 59,447,594 | | |
| Health Care Providers & Services — 2.62% | |
| HCA, Inc. | | | 662,000 | | | | 28,565,300 | | |
| Tenet Healthcare Corporation (a) | | | 1,911,000 | | | | 13,338,780 | | |
| | | | 41,904,080 | | |
| | Shares
Held | | Value | |
| Hotels, Restaurants & Leisure — 2.75% | |
| Harrah's Entertainment, Inc. | | | 316,400 | | | $ | 22,521,352 | | |
| McDonald's Corporation | | | 189,800 | | | | 6,377,280 | | |
| Yum! Brands, Inc. | | | 300,000 | | | | 15,081,000 | | |
| | | | 43,979,632 | | |
| Household Durables — 5.90% | |
| Centex Corporation | | | 1,275,700 | | | | 64,167,710 | | |
| Pulte Homes, Inc. | | | 1,054,700 | | | | 30,364,813 | | |
| | | | 94,532,523 | | |
| Industrial Conglomerates — 4.17% | |
| Tyco International Limited | | | 2,428,300 | | | | 66,778,250 | | |
| Insurance — 14.60% | |
| Assurant, Inc. | | | 282,000 | | | | 13,648,800 | | |
| Conseco Inc. (a) | | | 579,300 | | | | 13,381,830 | | |
| Genworth Financial Inc. | | | 1,356,300 | | | | 47,253,492 | | |
| Hartford Financial Services Group, Inc. | | | 167,200 | | | | 14,145,120 | | |
| MetLife, Inc. | | | 960,800 | | | | 49,202,568 | | |
| Principal Financial Group, Inc. | | | 150,800 | | | | 8,392,020 | | |
| Prudential Financial, Inc. | | | 250,300 | | | | 19,448,310 | | |
| The St. Paul Travelers Companies, Inc. | | | 1,227,800 | | | | 54,735,324 | | |
| XL Capital Ltd. | | | 220,700 | | | | 13,528,910 | | |
| | | | 233,736,374 | | |
| IT Services — 6.85% | |
| Electronic Data Systems Corporation | | | 3,179,400 | | | | 76,496,364 | | |
| MasterCard, Inc. (a) | | | 690,800 | | | | 33,158,400 | | |
| | | | 109,654,764 | | |
| Machinery — 2.09% | |
| Flowserve Corporation (a) | | | 586,700 | | | | 33,383,230 | | |
| Media — 0.90% | |
| Interpublic Group of Companies, Inc. (a) | | | 1,732,800 | | | | 14,468,880 | | |
| Metals & Mining — 4.23% | |
| Alcan, Inc. | | | 375,800 | | | | 17,640,052 | | |
| Alcoa, Inc. | | | 1,549,900 | | | | 50,154,764 | | |
| | | | 67,794,816 | | |
| Multi Utilities — 1.99% | |
| Public Service Enterprise Group Incorporated | | | 481,300 | | | | 31,823,556 | | |
| Oil, Gas & Consumable Fuels — 0.80% | |
| Petro-Canada | | | 270,600 | | | | 12,829,146 | | |
| Paper & Forest Products — 1.58% | |
| International Paper Company | | | 325,000 | | | | 10,497,500 | | |
| Weyerhaeuser Company | | | 237,000 | | | | 14,753,250 | | |
| | | | 25,250,750 | | |
| Pharmaceuticals — 1.88% | |
| Merck & Company, Inc. | | | 826,200 | | | | 30,098,466 | | |
See Notes to the Financial Statements
13
Schedule of Investments — June 30, 2006
Hotchkis and Wiley Core Value Fund
| | Shares
Held | | Value | |
| Real Estate Management & Development — 1.21% | |
| The St Joe Company | | | 415,200 | | | $ | 19,323,408 | | |
| Road & Rail — 2.94% | |
| CSX Corporation | | | 668,600 | | | | 47,096,184 | | |
| Semiconductor & Semiconductor Equipment — 0.30% | |
| Freescale Semiconductor, Inc. (a) | | | 166,200 | | | | 4,819,800 | | |
| Software — 6.69% | |
| CA Inc. | | | 3,758,400 | | | | 77,235,120 | | |
| Microsoft Corporation | | | 1,282,600 | | | | 29,884,580 | | |
| | | | 107,119,700 | | |
| Specialty Retail — 2.39% | |
| Home Depot, Inc. | | | 1,071,000 | | | | 38,331,090 | | |
| Thrifts & Mortgage Finance — 4.08% | |
| Freddie Mac | | | 802,800 | | | | 45,767,628 | | |
| Washington Mutual, Inc. | | | 428,700 | | | | 19,540,146 | | |
| | | | 65,307,774 | | |
| Tobacco — 2.86% | |
| Altria Group, Inc. | | | 623,300 | | | | 45,768,919 | | |
| Wireless Telecommunication Services — 0.43% | |
| Alltel Corporation | | | 106,600 | | | | 6,804,278 | | |
Total investments — 99.24%
(Cost $1,590,879,029) | | | | | | | 1,588,790,687 | | |
| Time deposit* — 1.53% | | | | | | | 24,543,763 | | |
| Liabilities in excess of other assets — (0.77%) | | | | | | | (12,325,885 | ) | |
| Net assets — 100.00% | | | | | | $ | 1,601,008,565 | | |
(a) — Non-income producing security.
ADR — American Depository Receipt.
* — Time deposit bears interest at 4.48% and matures on 7/3/2006. Invested through a cash management account administered by Brown Brothers Harriman & Co.
| Investments by Industry (% of net assets) | |
| Insurance | | | 14.6 | % | |
| IT Services | | | 6.8 | | |
| Software | | | 6.7 | | |
| Household Durables | | | 5.9 | | |
| Diversified Financial Services | | | 4.8 | | |
| Aerospace & Defense | | | 4.3 | | |
| Metals & Mining | | | 4.2 | | |
| Industrial Conglomerates | | | 4.2 | | |
| Thrifts & Mortgage Finance | | | 4.1 | | |
| Electric Utilities | | | 3.9 | | |
| Food Products | | | 3.7 | | |
| Commercial Services & Supplies | | | 3.6 | | |
| Road & Rail | | | 2.9 | | |
| Tobacco | | | 2.9 | | |
| Food & Staples Retailing | | | 2.8 | | |
| Hotels, Restaurants & Leisure | | | 2.7 | | |
| Health Care Providers & Services | | | 2.6 | | |
| Specialty Retail | | | 2.4 | | |
| Chemicals | | | 2.2 | | |
| Machinery | | | 2.1 | | |
| Multi Utilities | | | 2.0 | | |
| Pharmaceuticals | | | 1.9 | | |
| Commercial Banks | | | 1.7 | | |
| Paper & Forest Products | | | 1.6 | | |
| Real Estate Management & Development | | | 1.2 | | |
| Media | | | 0.9 | | |
| Auto Components | | | 0.9 | | |
| Oil, Gas & Consumable Fuels | | | 0.8 | | |
| Wireless Telecommunication Services | | | 0.4 | | |
| Semiconductor & Semiconductor Equipment | | | 0.3 | | |
| Computers & Peripherals | | | 0.1 | | |
| Total | | | 99.2 | % | |
See Notes to the Financial Statements
14
Schedule of Investments — June 30, 2006
Hotchkis and Wiley Large Cap Value Fund
COMMON
STOCKS — 99.53% | | Shares
Held | | Value | |
| Aerospace & Defense — 4.69% | |
| Lockheed Martin Corporation | | | 2,239,300 | | | $ | 160,647,382 | | |
| Raytheon Company | | | 2,335,400 | | | | 104,088,778 | | |
| | | | 264,736,160 | | |
| Auto Components — 0.93% | |
| Magna International Inc. | | | 731,100 | | | | 52,617,267 | | |
| Chemicals — 2.98% | |
| Eastman Chemical Company | | | 3,114,000 | | | | 168,156,000 | | |
| Commercial Banks — 2.07% | |
| KeyCorp | | | 1,667,000 | | | | 59,478,560 | | |
| UnionBanCal Corporation | | | 888,700 | | | | 57,401,133 | | |
| | | | 116,879,693 | | |
| Commercial Services & Supplies — 4.08% | |
| Cendant Corporation | | | 8,376,100 | | | | 136,446,669 | | |
| Waste Management, Inc. | | | 2,617,000 | | | | 93,897,960 | | |
| | | | 230,344,629 | | |
| Diversified Financial Services — 4.43% | |
| Bank of America Corporation | | | 1,933,023 | | | | 92,978,406 | | |
| CIT Group, Inc. | | | 90,100 | | | | 4,711,329 | | |
| JPMorgan Chase & Co. | | | 3,628,300 | | | | 152,388,600 | | |
| | | | 250,078,335 | | |
| Electric Utilities — 6.78% | |
| Entergy Corporation | | | 1,298,400 | | | | 91,861,800 | | |
| FirstEnergy Corporation | | | 1,280,000 | | | | 69,388,800 | | |
| FPL Group, Inc. | | | 5,365,000 | | | | 222,003,700 | | |
| | | | 383,254,300 | | |
| Food & Staples Retailing — 0.88% | |
| Supervalu, Inc. | | | 26,742 | | | | 820,973 | | |
| Wal-Mart Stores, Inc. | | | 1,012,200 | | | | 48,757,674 | | |
| | | | 49,578,647 | | |
| Food Products — 3.88% | |
| Kraft Foods, Inc. | | | 1,798,500 | | | | 55,573,650 | | |
| Sara Lee Corporation | | | 3,004,100 | | | | 48,125,682 | | |
| Unilever PLC ADR | | | 5,124,240 | | | | 115,500,370 | | |
| | | | 219,199,702 | | |
| Health Care Providers & Services — 2.52% | |
| HCA, Inc. | | | 1,382,600 | | | | 59,659,190 | | |
| Tenet Healthcare Corporation (a) | | | 11,868,400 | | | | 82,841,432 | | |
| | | | 142,500,622 | | |
| Hotels, Restaurants & Leisure — 2.83% | |
| Harrah's Entertainment, Inc. | | | 1,284,950 | | | | 91,462,741 | | |
| Yum! Brands, Inc. | | | 1,363,400 | | | | 68,538,118 | | |
| | | | 160,000,859 | | |
| | Shares
Held | | Value | |
| Household Durables — 5.79% | |
| Centex Corporation | | | 1,236,100 | | | $ | 62,175,830 | | |
| Lennar Corporation — B Shares | | | 2,335,820 | | | | 95,278,098 | | |
| Lennar Corporation | | | 3,829,300 | | | | 169,906,041 | | |
| | | | 327,359,969 | | |
| Industrial Conglomerates — 4.34% | |
| Tyco International Limited | | | 8,916,800 | | | | 245,212,000 | | |
| Insurance — 15.37% | |
| Genworth Financial Inc. | | | 5,399,900 | | | | 188,132,516 | | |
| The Hanover Insurance Group, Inc. | | | 1,520,500 | | | | 72,162,930 | | |
| MetLife, Inc. | | | 4,132,400 | | | | 211,620,204 | | |
| Principal Financial Group, Inc. | | | 92,000 | | | | 5,119,800 | | |
| Prudential Financial, Inc. | | | 49,600 | | | | 3,853,920 | | |
| The St. Paul Travelers Companies, Inc. | | | 4,240,100 | | | | 189,023,658 | | |
| UnumProvident Corporation | | | 7,380,500 | | | | 133,808,465 | | |
| XL Capital Ltd. | | | 1,059,500 | | | | 64,947,350 | | |
| | | | 868,668,843 | | |
| IT Services — 4.92% | |
| Electronic Data Systems Corporation | | | 11,556,600 | | | | 278,051,796 | | |
| Machinery — 1.80% | |
| SPX Corporation | | | 1,814,100 | | | | 101,498,895 | | |
| Metals & Mining — 3.23% | |
| Alcoa, Inc. | | | 5,643,748 | | | | 182,631,685 | | |
| Multi Utilities — 1.98% | |
| Alliant Energy Corporation | | | 5,200 | | | | 178,360 | | |
| Public Service Enterprise Group Incorporated | | | 1,692,700 | | | | 111,921,324 | | |
| | | | 112,099,684 | | |
| Oil, Gas & Consumable Fuels — 1.38% | |
| Ashland, Inc. | | | 263,900 | | | | 17,602,130 | | |
| Tesoro Corporation | | | 810,800 | | | | 60,291,088 | | |
| | | | 77,893,218 | | |
| Paper & Forest Products — 1.05% | |
| Weyerhaeuser Company | | | 951,600 | | | | 59,237,100 | | |
| Real Estate Investment Trusts — 3.46% | |
Apartment Investment &
Management Company | | | 1,169,900 | | | | 50,832,155 | | |
| New Century Financial Corporation | | | 1,975,800 | | | | 90,392,850 | | |
| Plum Creek Timber Company | | | 1,534,700 | | | | 54,481,850 | | |
| | | | 195,706,855 | | |
| Road & Rail — 0.02% | |
| Union Pacific Corporation | | | 11,600 | | | | 1,078,336 | | |
See Notes to the Financial Statements
15
Schedule of Investments — June 30, 2006
Hotchkis and Wiley Large Cap Value Fund
| | Shares
Held | | Value | |
| Software — 9.70% | |
| BMC Software, Inc. (a) | | | 6,649,200 | | | $ | 158,915,880 | | |
| CA Inc. | | | 13,327,900 | | | | 273,888,345 | | |
| Microsoft Corporation | | | 4,956,100 | | | | 115,477,130 | | |
| | | | 548,281,355 | | |
| Specialty Retail — 2.42% | |
| Home Depot, Inc. | | | 3,814,800 | | | | 136,531,692 | | |
| Textiles, Apparel & Luxury Goods — 1.45% | |
| Jones Apparel Group, Inc. | | | 2,571,400 | | | | 81,744,806 | | |
| Thrifts & Mortgage Finance — 4.17% | |
| Freddie Mac | | | 3,147,500 | | | | 179,438,975 | | |
| Washington Mutual, Inc. | | | 1,235,700 | | | | 56,323,206 | | |
| | | | 235,762,181 | | |
| Tobacco — 2.38% | |
| Altria Group, Inc. | | | 1,832,200 | | | | 134,538,446 | | |
Total investments — 99.53%
(Cost $5,444,475,014) | | | | | | | 5,623,643,075 | | |
| Time deposit* — 0.86% | | | | | | | 48,303,359 | | |
| Liabilities in excess of other assets — (0.39%) | | | | | | | (21,879,328 | ) | |
| Net assets — 100.00% | | | | | | $ | 5,650,067,106 | | |
(a) — Non-income producing security.
ADR — American Depository Receipt.
* — Time deposit bears interest at 4.48% and matures on 7/3/2006. Invested through a cash management account administered by Brown Brothers Harriman & Co.
| Investments by Industry (% of net assets) | |
| Insurance | | | 15.4 | % | |
| Software | | | 9.7 | | |
| Electric Utilities | | | 6.8 | | |
| Household Durables | | | 5.8 | | |
| IT Services | | | 4.9 | | |
| Aerospace & Defense | | | 4.7 | | |
| Diversified Financial Services | | | 4.4 | | |
| Industrial Conglomerates | | | 4.3 | | |
| Thrifts & Mortgage Finance | | | 4.2 | | |
| Commercial Services & Supplies | | | 4.1 | | |
| Food Products | | | 3.9 | | |
| Real Estate Investment Trusts | | | 3.5 | | |
| Metals & Mining | | | 3.2 | | |
| Chemicals | | | 3.0 | | |
| Hotels, Restaurants & Leisure | | | 2.8 | | |
| Health Care Providers & Services | | | 2.5 | | |
| Specialty Retail | | | 2.4 | | |
| Tobacco | | | 2.4 | | |
| Commercial Banks | | | 2.1 | | |
| Multi Utilities | | | 2.0 | | |
| Machinery | | | 1.8 | | |
| Textiles, Apparel & Luxury Goods | | | 1.4 | | |
| Oil, Gas & Consumable Fuels | | | 1.4 | | |
| Paper & Forest Products | | | 1.0 | | |
| Auto Components | | | 0.9 | | |
| Food & Staples Retailing | | | 0.9 | | |
| Road & Rail | | | 0.0 | | |
| Total | | | 99.5 | % | |
See Notes to the Financial Statements
16
Schedule of Investments — June 30, 2006
Hotchkis and Wiley Mid-Cap Value Fund
COMMON
STOCKS — 97.74% | | Shares
Held | | Value | |
| Auto Components — 1.02% | |
| Magna International Inc. | | | 600,700 | | | $ | 43,232,379 | | |
| Chemicals — 9.90% | |
| Agrium, Inc. | | | 4,560,800 | | | | 105,901,776 | | |
| Eastman Chemical Company | | | 2,351,000 | | | | 126,954,000 | | |
| FMC Corporation | | | 507,400 | | | | 32,671,486 | | |
| Lubrizol Corporation | | | 1,453,900 | | | | 57,937,915 | | |
| The Mosaic Company (a) | | | 6,084,700 | | | | 95,225,555 | | |
| | | | 418,690,732 | | |
| Commercial Banks — 2.75% | |
| Comerica, Inc. | | | 805,200 | | | | 41,862,348 | | |
| KeyCorp | | | 1,191,050 | | | | 42,496,664 | | |
| UnionBanCal Corporation | | | 497,800 | | | | 32,152,902 | | |
| | | | 116,511,914 | | |
| Commercial Services & Supplies — 2.42% | |
| IKON Office Solutions, Inc. | | | 8,136,400 | | | | 102,518,640 | | |
| Electric Utilities — 3.78% | |
| Entergy Corporation | | | 647,800 | | | | 45,831,850 | | |
| FPL Group, Inc. | | | 2,760,200 | | | | 114,217,076 | | |
| | | | 160,048,926 | | |
| Food & Staples Retailing — 3.87% | |
| BJ's Wholesale Club, Inc. (a) | | | 2,671,500 | | | | 75,737,025 | | |
| Safeway, Inc. | | | 3,386,500 | | | | 88,049,000 | | |
| | | | 163,786,025 | | |
| Gas Utilities — 1.12% | |
| Southern Union Company | | | 1,744,091 | | | | 47,195,109 | | |
| Health Care Providers & Services — 1.14% | |
| Tenet Healthcare Corporation (a) | | | 6,889,300 | | | | 48,087,314 | | |
| Hotels, Restaurants & Leisure — 2.83% | |
| Harrah's Entertainment, Inc. | | | 968,500 | | | | 68,937,830 | | |
| Yum! Brands, Inc. | | | 1,011,500 | | | | 50,848,105 | | |
| | | | 119,785,935 | | |
| Household Durables — 6.76% | |
| Centex Corporation | | | 3,030,300 | | | | 152,424,090 | | |
| Furniture Brands International, Inc. | | | 1,255,600 | | | | 26,166,704 | | |
| Pulte Homes, Inc. | | | 3,735,800 | | | | 107,553,682 | | |
| | | | 286,144,476 | | |
| Insurance — 15.00% | |
| Assurant, Inc. | | | 1,504,500 | | | | 72,817,800 | | |
| CNA Financial Corporation (a) | | | 1,605,324 | | | | 52,911,479 | | |
| Conseco Inc. (a) | | | 3,994,600 | | | | 92,275,260 | | |
| Genworth Financial Inc. | | | 4,094,600 | | | | 142,655,864 | | |
| The Hanover Insurance Group, Inc. | | | 1,379,400 | | | | 65,466,324 | | |
| | Shares
Held | | Value | |
| Lincoln National Corporation | | | 715,800 | | | $ | 40,399,752 | | |
| UnumProvident Corporation | | | 7,045,900 | | | | 127,742,167 | | |
| XL Capital Ltd. | | | 659,500 | | | | 40,427,350 | | |
| | | | 634,695,996 | | |
| IT Services — 7.79% | |
| BearingPoint, Inc. (a) | | | 4,124,300 | | | | 34,520,391 | | |
| Electronic Data Systems Corporation | | | 8,511,800 | | | | 204,793,908 | | |
| MasterCard, Inc. (a) | | | 1,880,400 | | | | 90,259,200 | | |
| | | | 329,573,499 | | |
| Machinery — 7.00% | |
| Flowserve Corporation (a) | | | 3,843,900 | | | | 218,717,910 | | |
| SPX Corporation | | | 1,384,300 | | | | 77,451,585 | | |
| | | | 296,169,495 | | |
| Marine — 0.67% | |
| Alexander & Baldwin, Inc. | | | 644,400 | | | | 28,527,588 | | |
| Media — 5.41% | |
| Dow Jones & Company, Inc. | | | 3,661,300 | | | | 128,182,113 | | |
| R.H. Donnelley Corporation (a) | | | 790,566 | | | | 42,745,904 | | |
| Valassis Communications, Inc. (a) | | | 2,456,500 | | | | 57,948,835 | | |
| | | | 228,876,852 | | |
| Oil, Gas & Consumable Fuels — 1.64% | |
| Ashland, Inc. | | | 90,300 | | | | 6,023,010 | | |
| Tesoro Corporation | | | 849,500 | | | | 63,168,820 | | |
| | | | 69,191,830 | | |
| Real Estate Investment Trusts — 2.47% | |
American Home Mortgage
Investment Corporation | | | 1,940,300 | | | | 71,519,458 | | |
| Saxon Capital, Inc. | | | 2,875,900 | | | | 32,900,296 | | |
| | | | 104,419,754 | | |
| Real Estate Management & Development — 6.44% | |
| MI Developments, Inc. | | | 3,008,300 | | | | 102,011,453 | | |
| The St. Joe Company | | | 3,657,900 | | | | 170,238,666 | | |
| | | | 272,250,119 | | |
| Road & Rail — 0.20% | |
| CSX Corporation | | | 117,700 | | | | 8,290,788 | | |
| Software — 10.11% | |
| BMC Software, Inc. (a) | | | 8,244,200 | | | | 197,036,380 | | |
| CA Inc. | | | 9,894,700 | | | | 203,336,085 | | |
| Mercury Interactive Corporation (a) | | | 169,300 | | | | 5,920,421 | | |
| Novell, Inc. (a) | | | 3,258,900 | | | | 21,606,507 | | |
| | | | 427,899,393 | | |
| Specialty Retail — 3.16% | |
| Foot Locker, Inc. | | | 3,938,600 | | | | 96,456,314 | | |
| Rent-A-Center, Inc. (a) | | | 1,505,500 | | | | 37,426,730 | | |
| | | | 133,883,044 | | |
See Notes to the Financial Statements
17
Schedule of Investments — June 30, 2006
Hotchkis and Wiley Mid-Cap Value Fund
| | Shares
Held | | Value | |
| Textiles, Apparel & Luxury Goods — 2.26% | |
| Jones Apparel Group, Inc. | | | 3,013,700 | | | $ | 95,805,523 | | |
Total investments — 97.74%
(Cost $3,734,833,394) | | | | | 4,135,585,331 | | |
| Time deposit* — 1.73% | | | | | 73,173,159 | | |
| Other assets in excess of liabilities — 0.53% | | | | | 22,521,686 | | |
| Net assets — 100.00% | | | | $ | 4,231,280,176 | | |
(a) — Non-income producing security.
* — Time deposit bears interest at 4.48% and matures on 7/3/2006. Invested through a cash management account administered by Brown Brothers Harriman & Co.
| Investments by Industry (% of net assets) | |
| Insurance | | | 15.0 | % | |
| Software | | | 10.1 | | |
| Chemicals | | | 9.9 | | |
| IT Services | | | 7.8 | | |
| Machinery | | | 7.0 | | |
| Household Durables | | | 6.8 | | |
| Real Estate Management & Development | | | 6.4 | | |
| Media | | | 5.4 | | |
| Food & Staples Retailing | | | 3.9 | | |
| Electric Utilities | | | 3.8 | | |
| Specialty Retail | | | 3.2 | | |
| Hotels, Restaurants & Leisure | | | 2.8 | | |
| Commercial Banks | | | 2.7 | | |
| Real Estate Investment Trusts | | | 2.5 | | |
| Commercial Services & Supplies | | | 2.4 | | |
| Textiles, Apparel & Luxury Goods | | | 2.3 | | |
| Oil, Gas & Consumable Fuels | | | 1.6 | | |
| Health Care Providers & Services | | | 1.1 | | |
| Gas Utilities | | | 1.1 | | |
| Auto Components | | | 1.0 | | |
| Marine | | | 0.7 | | |
| Road & Rail | | | 0.2 | | |
| Total | | | 97.7 | % | |
See Notes to the Financial Statements
18
Schedule of Investments — June 30, 2006
Hotchkis and Wiley Small Cap Value Fund
COMMON
STOCKS — 99.21% | | Shares
Held | | Value | |
| Aerospace & Defense — 1.04% | |
| EDO Corp. | | | 324,800 | | | $ | 7,905,632 | | |
| Chemicals — 9.27% | |
| Agrium, Inc. | | | 725,600 | | | | 16,848,432 | | |
| CF Industries Holdings, Inc. | | | 1,899,000 | | | | 27,079,740 | | |
| Lubrizol Corporation | | | 220,500 | | | | 8,786,925 | | |
| Pioneer Companies, Inc. (a) | | | 557,100 | | | | 15,197,688 | | |
| Tronox Incorporated | | | 189,900 | | | | 2,464,902 | | |
| | | | 70,377,687 | | |
| Commercial Services & Supplies — 12.87% | |
| Bowne & Company, Inc. | | | 1,351,700 | | | | 19,329,310 | | |
| IKON Office Solutions, Inc. | | | 1,538,700 | | | | 19,387,620 | | |
| Kelly Services, Inc. | | | 1,040,300 | | | | 28,264,951 | | |
| PHH Corporation (a) | | | 790,500 | | | | 21,770,370 | | |
| Spherion Corporation (a) | | | 976,600 | | | | 8,906,592 | | |
| | | | 97,658,843 | | |
| Electric Utilities — 1.49% | |
| Great Plains Energy, Inc. | | | 404,800 | | | | 11,277,728 | | |
| Food & Staples Retailing — 3.17% | |
| BJ's Wholesale Club, Inc. (a) | | | 548,300 | | | | 15,544,305 | | |
| Pathmark Stores, Inc. (a) | | | 904,200 | | | | 8,508,522 | | |
| | | | 24,052,827 | | |
| Gas Utilities — 1.27% | |
| Southern Union Company | | | 355,662 | | | | 9,624,214 | | |
| Hotels, Restaurants & Leisure — 6.86% | |
| Jameson Inns, Inc. (a) | | | 2,921,017 | | | | 8,529,370 | | |
| Lodgian, Inc. (a) | | | 1,691,009 | | | | 24,096,878 | | |
| Magna Entertainment Corp. (a) | | | 2,116,300 | | | | 11,131,738 | | |
| Sunterra Corporation (a) | | | 809,400 | | | | 8,288,256 | | |
| | | | 52,046,242 | | |
| Household Durables — 9.77% | |
| Beazer Homes USA, Inc. | | | 268,400 | | | | 12,311,508 | | |
| Brookfield Homes Corporation | | | 75,964 | | | | 2,503,014 | | |
| Comstock Homebuilding Cos, Inc. (a) | | | 385,000 | | | | 2,437,050 | | |
| Furniture Brands International, Inc. | | | 495,700 | | | | 10,330,388 | | |
| MDC Holdings, Inc. | | | 221,500 | | | | 11,502,495 | | |
| WCI Communities, Inc. (a) | | | 1,741,100 | | | | 35,065,754 | | |
| | | | 74,150,209 | | |
| Insurance — 8.30% | |
| Conseco Inc. (a) | | | 318,900 | | | | 7,366,590 | | |
| The Hanover Insurance Group, Inc. | | | 631,100 | | | | 29,952,006 | | |
| KMG America Corporation (a) | | | 808,900 | | | | 7,174,943 | | |
| | Shares
Held | | Value | |
| PMA Capital Corp. (a) | | | 405,700 | | | $ | 4,178,710 | | |
| United America Indemnity, Ltd (a) | | | 685,628 | | | | 14,288,487 | | |
| | | | 62,960,736 | | |
| IT Services — 1.28% | |
| BearingPoint, Inc. (a) | | | 1,156,800 | | | | 9,682,416 | | |
| Machinery — 5.72% | |
| Flowserve Corporation (a) | | | 763,400 | | | | 43,437,460 | | |
| Marine — 2.08% | |
| Alexander & Baldwin, Inc. | | | 356,900 | | | | 15,799,963 | | |
| Media — 7.65% | |
| Live Nation Inc. (a) | | | 433,000 | | | | 8,815,880 | | |
| R.H. Donnelley Corporation (a) | | | 122,200 | | | | 6,607,354 | | |
| Valassis Communications, Inc. (a) | | | 906,200 | | | | 21,377,258 | | |
| Westwood One, Inc. | | | 2,830,300 | | | | 21,227,250 | | |
| | | | 58,027,742 | | |
| Metals & Mining — 0.53% | |
| Algoma Steel, Inc. (a) | | | 126,400 | | | | 4,014,464 | | |
| Oil, Gas & Consumable Fuels — 8.28% | |
| Alpha Natural Resources, Inc. (a) | | | 739,800 | | | | 14,514,876 | | |
| Foundation Coal Holdings, Inc. | | | 608,400 | | | | 28,552,212 | | |
| Overseas Shipholding Group | | | 334,400 | | | | 19,779,760 | | |
| | | | 62,846,848 | | |
| Real Estate Investment Trusts — 6.20% | |
| Aames Investment Corporation | | | 1,436,300 | | | | 7,167,137 | | |
| Capital Lease Funding, Inc. | | | 875,900 | | | | 9,994,019 | | |
| Eagle Hospitality Properties Trust Inc. | | | 563,100 | | | | 5,422,653 | | |
| Fieldstone Investment Corporation | | | 371,600 | | | | 3,403,856 | | |
| Fieldstone Investment Corporation 144A (r) | | | 556,700 | | | | 5,099,372 | | |
| Government Properties Trust, Inc. | | | 66,700 | | | | 632,983 | | |
| Lexington Corporate Properties Trust | | | 499,700 | | | | 10,793,520 | | |
| MortgageIT Holdings, Inc. | | | 379,500 | | | | 4,576,770 | | |
| | | | 47,090,310 | | |
| Real Estate Management & Development — 5.84% | |
| MI Developments, Inc. | | | 1,054,400 | | | | 35,754,704 | | |
| The St. Joe Company | | | 102,200 | | | | 4,756,388 | | |
| Thomas Properties Group, Inc. | | | 322,600 | | | | 3,793,776 | | |
| | | | 44,304,868 | | |
| Software — 1.78% | |
| Agile Software Corporation (a) | | | 509,200 | | | | 3,228,328 | | |
| Mercury Interactive Corporation (a) | | | 60,900 | | | | 2,129,673 | | |
| Novell, Inc. (a) | | | 1,229,300 | | | | 8,150,259 | | |
| | | | 13,508,260 | | |
See Notes to the Financial Statements
19
Schedule of Investments — June 30, 2006
Hotchkis and Wiley Small Cap Value Fund
| | Shares
Held | | Value | |
| Specialty Retail — 1.70% | |
| Eddie Bauer Holdings, Inc. (a) | | | 490,400 | | | $ | 5,639,600 | | |
| Rent-A-Center, Inc. (a) | | | 290,700 | | | | 7,226,802 | | |
| | | | 12,866,402 | | |
| Textiles, Apparel & Luxury Goods — 4.11% | |
| The Warnaco Group Inc. (a) | | | 1,671,200 | | | | 31,218,016 | | |
Total investments — 99.21%
(Cost $661,130,825) | | | | | | | 752,850,867 | | |
| Time deposit* — 1.24% | | | | | | | 9,441,312 | | |
| Liabilities in excess of other assets — (0.45%) | | | | | | | (3,441,590 | ) | |
| Net assets — 100.00% | | | | | | $ | 758,850,589 | | |
(a) — Non-income producing security.
(r) — Restricted security. Purchased in a private placement transaction; resale to the public may require registration or be limited to qualified institutional buyers.
* — Time deposit bears interest at 4.48% and matures on 7/3/2006. Invested through a cash management account administered by Brown Brothers Harriman & Co.
| Investments by Industry (% of net assets) | |
| Commercial Services & Supplies | | | 12.9 | % | |
| Household Durables | | | 9.8 | | |
| Chemicals | | | 9.3 | | |
| Insurance | | | 8.3 | | |
| Oil, Gas & Consumable Fuels | | | 8.3 | | |
| Media | | | 7.6 | | |
| Hotels, Restaurants & Leisure | | | 6.8 | | |
| Real Estate Investment Trusts | | | 6.2 | | |
| Real Estate Management & Development | | | 5.8 | | |
| Machinery | | | 5.7 | | |
| Textiles, Apparel & Luxury Goods | | | 4.1 | | |
| Food & Staples Retailing | | | 3.2 | | |
| Marine | | | 2.1 | | |
| Software | | | 1.8 | | |
| Specialty Retail | | | 1.7 | | |
| Electric Utilities | | | 1.5 | | |
| IT Services | | | 1.3 | | |
| Gas Utilities | | | 1.3 | | |
| Aerospace & Defense | | | 1.0 | | |
| Metals & Mining | | | 0.5 | | |
| Total | | | 99.2 | % | |
See Notes to the Financial Statements
20
Schedule of Investments — June 30, 2006
Hotchkis and Wiley All Cap Value Fund
COMMON
STOCKS — 98.89% | | Shares
Held | | Value | |
| Aerospace & Defense — 2.03% | |
| Lockheed Martin Corporation | | | 60,100 | | | $ | 4,311,574 | | |
| Chemicals — 1.98% | |
| Eastman Chemical Company | | | 77,800 | | | | 4,201,200 | | |
| Commercial Services & Supplies — 3.12% | |
| IKON Office Solutions, Inc. | | | 525,500 | | | | 6,621,300 | | |
| Health Care Providers & Services — 2.08% | |
| Tenet Healthcare Corporation (a) | | | 634,100 | | | | 4,426,018 | | |
| Household Durables — 15.46% | |
| WCI Communities, Inc. (a) | | | 1,630,600 | | | | 32,840,284 | | |
| Insurance — 12.97% | |
| Hanover Insurance Group, Inc. | | | 142,500 | | | | 6,763,050 | | |
| The St. Paul Travelers Companies, Inc. | | | 140,000 | | | | 6,241,200 | | |
| UnumProvident Corporation | | | 562,200 | | | | 10,192,686 | | |
| XL Capital Ltd. | | | 70,900 | | | | 4,346,170 | | |
| | | | 27,543,106 | | |
| IT Services — 12.25% | |
| Electronic Data Systems Corporation | | | 902,000 | | | | 21,702,120 | | |
| MasterCard, Inc. (a) | | | 89,800 | | | | 4,310,400 | | |
| | | | 26,012,520 | | |
| Machinery — 12.11% | |
| Flowserve Corporation (a) | | | 274,400 | | | | 15,613,360 | | |
| Miller Industries, Inc. (a) | | | 488,198 | | | | 10,105,699 | | |
| | | | 25,719,059 | | |
| Real Estate Investment Trusts — 12.89% | |
| Capital Lease Funding, Inc. | | | 913,900 | | | | 10,427,599 | | |
| Fieldstone Investment Corporation | | | 198,700 | | | | 1,820,092 | | |
| Fieldstone Investment Corporation 144A (r) | | | 216,900 | | | | 1,986,804 | | |
| Government Properties Trust, Inc. | | | 926,100 | | | | 8,788,689 | | |
| MortgageIT Holdings, Inc. | | | 361,200 | | | | 4,356,072 | | |
| | | | 27,379,256 | | |
| Real Estate Management & Development — 4.84% | |
| MI Developments, Inc. | | | 303,500 | | | | 10,291,685 | | |
| | Shares
Held | | Value | |
| Software — 19.16% | |
| BMC Software, Inc. (a) | | | 417,500 | | | $ | 9,978,250 | | |
| CA Inc. | | | 1,494,500 | | | | 30,711,975 | | |
| | | | 40,690,225 | | |
Total investments — 98.89%
(Cost $205,115,185) | | | | | 210,036,227 | | |
| Time deposit* — 1.02% | | | | | 2,171,728 | | |
| Other assets in excess of liabilities — 0.09% | | | | | 193,735 | | |
| Net assets — 100.00% | | | | $ | 212,401,690 | | |
(a) — Non-income producing security.
(r) — Restricted security. Purchased in a private placement transaction; resale to the public may require registration or be limited to qualified institutional buyers.
* — Time deposit bears interest at 4.48% and matures on 7/3/2006. Invested through a cash management account administered by Brown Brothers Harriman & Co.
| Investments by Industry (% of net assets) | |
| Software | | | 19.2 | % | |
| Household Durables | | | 15.5 | | |
| Insurance | | | 13.0 | | |
| Real Estate Investment Trusts | | | 12.9 | | |
| IT Services | | | 12.2 | | |
| Machinery | | | 12.1 | | |
| Real Estate Management & Development | | | 4.8 | | |
| Commercial Services & Supplies | | | 3.1 | | |
| Health Care Providers & Services | | | 2.1 | | |
| Aerospace & Defense | | | 2.0 | | |
| Chemicals | | | 2.0 | | |
| Total | | | 98.9 | % | |
See Notes to the Financial Statements
21
Statements of Assets & Liabilities
JUNE 30, 2006
| | | Core Value
Fund | | Large Cap Value
Fund | | Mid-Cap Value
Fund | | Small Cap Value
Fund | | All Cap Value
Fund | |
| Assets: | |
| Investments, at value* | | $ | 1,588,790,687 | | | $ | 5,623,643,075 | | | $ | 4,135,585,331 | | | $ | 752,850,867 | | | $ | 210,036,227 | | |
| Time deposit | | | 24,543,763 | | | | 48,303,359 | | | | 73,173,159 | | | | 9,441,312 | | | | 2,171,728 | | |
| Dividends and interest receivable | | | 1,888,584 | | | | 9,411,479 | | | | 4,397,748 | | | | 1,192,811 | | | | 620,589 | | |
| Receivable for investments sold | | | 1,035,417 | | | | 17,494,079 | | | | 19,358,039 | | | | — | | | | 11,408,317 | | |
| Receivable for Fund shares sold | | | 3,841,209 | | | | 19,848,480 | | | | 28,672,192 | | | | 1,341,049 | | | | 20,535 | | |
| Other assets | | | 58,062 | | | | 100,956 | | | | 65,861 | | | | 38,897 | | | | 24,761 | | |
| Total assets | | $ | 1,620,157,722 | | | $ | 5,718,801,428 | | | $ | 4,261,252,330 | | | $ | 764,864,936 | | | $ | 224,282,157 | | |
| Liabilities: | |
| Payable for investments purchased | | $ | 16,618,462 | | | $ | 54,729,017 | | | $ | 13,803,617 | | | $ | 3,805,635 | | | $ | 10,651,611 | | |
| Payable for Fund shares repurchased | | | 1,001,768 | | | | 8,903,422 | | | | 13,198,793 | | | | 1,595,543 | | | | 964,769 | | |
| Accrued expenses and other liabilities | | | 1,528,927 | | | | 5,101,883 | | | | 2,969,744 | | | | 613,169 | | | | 264,087 | | |
| Total liabilities | | | 19,149,157 | | | | 68,734,322 | | | | 29,972,154 | | | | 6,014,347 | | | | 11,880,467 | | |
| Net assets | | $ | 1,601,008,565 | | | $ | 5,650,067,106 | | | $ | 4,231,280,176 | | | $ | 758,850,589 | | | $ | 212,401,690 | | |
| Net Assets consist of: | |
| Paid in capital | | $ | 1,593,694,120 | | | $ | 5,306,335,039 | | | $ | 3,505,811,675 | | | $ | 602,795,425 | | | $ | 196,559,150 | | |
| Undistributed net investment income | | | 5,169,534 | | | | 27,685,178 | | | | — | | | | — | | | | — | | |
| Undistributed net realized gain on securities | | | 4,233,234 | | | | 136,878,828 | | | | 324,716,564 | | | | 64,335,122 | | | | 10,921,498 | | |
| Net unrealized appreciation (depreciation) of securities | | | (2,088,323 | ) | | | 179,168,061 | | | | 400,751,937 | | | | 91,720,042 | | | | 4,921,042 | | |
| Net assets | | $ | 1,601,008,565 | | | $ | 5,650,067,106 | | | $ | 4,231,280,176 | | | $ | 758,850,589 | | | $ | 212,401,690 | | |
| Calculation of Net Asset Value Per Share — Class A | |
| Net assets | | $ | 673,032,258 | | | $ | 2,959,443,570 | | | $ | 1,088,853,674 | | | $ | 184,473,122 | | | $ | 92,688,967 | | |
Shares outstanding (unlimited shares $0.001
par value authorized) | | | 52,575,530 | | | | 126,885,854 | | | | 37,849,983 | | | | 3,819,311 | | | | 4,776,903 | | |
| Net asset value per share | | $ | 12.80 | | | $ | 23.32 | | | $ | 28.77 | | | $ | 48.30 | | | $ | 19.40 | | |
| Public Offering Price Per Share — Class A | |
($12.80 divided by 0.9475, $23.32 divided by
0.9475, $28.77 divided by 0.9475, $48.30
divided by 0.9475, $19.40 divided by 0.9475) | | $ | 13.51 | | | $ | 24.61 | | | $ | 30.36 | | | $ | 50.98 | | | $ | 20.47 | | |
Calculation of Net Asset Value Per Share and
Public Offering Price Per Share — Class C | |
| Net assets | | $ | 162,884,792 | | | $ | 488,479,586 | | | $ | 246,241,917 | | | $ | 20,717,337 | | | $ | 59,822,049 | | |
Shares outstanding (unlimited shares $0.001
par value authorized) | | | 12,864,139 | | | | 21,274,947 | | | | 8,848,713 | | | | 452,014 | | | | 3,148,070 | | |
| Net asset value per share | | $ | 12.66 | | | $ | 22.96 | | | $ | 27.83 | | | $ | 45.83 | | | $ | 19.00 | | |
Calculation of Net Asset Value Per Share and
Public Offering Price Per Share — Class R | |
| Net assets | | | | | | $ | 82,769,530 | | | $ | 22,500,761 | | | | | | | | | | |
Shares outstanding (unlimited shares $0.001
par value authorized) | | | | | | | 3,526,051 | | | | 774,671 | | | | | | | | | | |
| Net asset value per share | | | | | | $ | 23.47 | | | $ | 29.05 | | | | | | | | | | |
Calculation of Net Asset Value Per Share and
Public Offering Price Per Share — Class I | |
| Net assets | | $ | 765,091,515 | | | $ | 2,119,374,420 | | | $ | 2,873,683,824 | | | $ | 553,660,130 | | | $ | 59,890,674 | | |
Shares outstanding (unlimited shares $0.001
par value authorized) | | | 59,561,265 | | | | 90,482,589 | | | | 99,404,318 | | | | 11,503,223 | | | | 3,092,910 | | |
| Net asset value per share | | $ | 12.85 | | | $ | 23.42 | | | $ | 28.91 | | | $ | 48.13 | | | $ | 19.36 | | |
| *Cost of investments | | $ | 1,590,879,029 | | | $ | 5,444,475,014 | | | $ | 3,734,833,394 | | | $ | 661,130,825 | | | $ | 205,115,185 | | |
See Notes to the Financial Statements
22
Statements of Operations
FOR THE YEAR ENDED JUNE 30, 2006
| | | Core Value
Fund | | Large Cap Value
Fund | | Mid-Cap Value
Fund | | Small Cap Value
Fund | | All Cap Value
Fund | |
| Investment income: | |
| Income* | |
| Dividends | | $ | 17,514,505 | | | $ | 121,214,248 | | | $ | 54,956,801 | | | $ | 10,980,889 | | | $ | 4,828,032 | | |
| Interest | | | 883,813 | | | | 4,474,964 | | | | 3,425,966 | | | | 650,945 | | | | 229,188 | | |
| Total income | | | 18,398,318 | | | | 125,689,212 | | | | 58,382,767 | | | | 11,631,834 | | | | 5,057,220 | | |
| Expenses: | |
| Advisory fees | | | 6,806,720 | | | | 39,634,791 | | | | 30,973,724 | | | | 6,239,839 | | | | 1,873,979 | | |
| Professional fees and expenses | | | 45,905 | | | | 143,013 | | | | 130,718 | | | | 58,442 | | | | 38,971 | | |
| Custodian fees and expenses | | | 63,074 | | | | 191,124 | | | | 156,585 | | | | 46,807 | | | | 23,519 | | |
| Transfer agent fees and expenses | | | 1,220,037 | | | | 8,244,509 | | | | 7,917,203 | | | | 1,758,424 | | | | 246,764 | | |
| Accounting fees and expenses | | | 163,540 | | | | 775,997 | | | | 621,986 | | | | 149,224 | | | | 75,312 | | |
| Administration fees | | | 266,216 | | | | 1,478,927 | | | | 1,125,242 | | | | 229,624 | | | | 71,166 | | |
| Trustees' fees and expenses | | | 17,077 | | | | 89,045 | | | | 73,650 | | | | 14,736 | | | | 4,159 | | |
| Reports to shareholders | | | 83,753 | | | | 449,577 | | | | 387,515 | | | | 64,280 | | | | 25,162 | | |
| Registration fees | | | 253,773 | | | | 358,332 | | | | 173,094 | | | | 71,769 | | | | 56,829 | | |
| Distribution and service fees — Class A | | | 1,108,419 | | | | 7,200,502 | | | | 2,817,906 | | | | 587,705 | | | | 294,947 | | |
| Distribution and service fees — Class B (Note 1) | | | — | | | | 12,123 | | | | 68,535 | | | | 18,087 | | | | — | | |
| Distribution and service fees — Class C | | | 1,099,707 | | | | 5,270,092 | | | | 2,591,039 | | | | 259,328 | | | | 696,235 | | |
| Distribution and service fees — Class R | | | — | | | | 283,680 | | | | 109,094 | | | | — | | | | — | | |
| Other expenses | | | 12,258 | | | | 137,110 | | | | 136,647 | | | | 31,734 | | | | 8,989 | | |
| Total expenses | | | 11,140,479 | | | | 64,268,822 | | | | 47,282,938 | | | | 9,529,999 | | | | 3,416,032 | | |
| Less, expense waiver | | | (310,185 | ) | | | — | | | | — | | | | — | | | | — | | |
| Net expenses | | | 10,830,294 | | | | 64,268,822 | | | | 47,282,938 | | | | 9,529,999 | | | | 3,416,032 | | |
| Net investment income | | | 7,568,024 | | | | 61,420,390 | | | | 11,099,829 | | | | 2,101,835 | | | | 1,641,188 | | |
| Realized and Unrealized Gain (Loss) on Securities: | |
| Net realized gains on securities | | | 6,178,421 | | | | 209,552,427 | | | | 468,850,335 | | | | 90,186,330 | | | | 15,321,556 | | |
Net change in unrealized appreciation
(depreciation) of securities | | | (9,275,353 | ) | | | (145,033,959 | ) | | | (165,629,089 | ) | | | (49,998,423 | ) | | | (17,963,545 | ) | |
| Net gains (losses) on securities | | | (3,096,932 | ) | | | 64,518,468 | | | | 303,221,246 | | | | 40,187,907 | | | | (2,641,989 | ) | |
Net Increase (Decrease) in Net Assets Resulting from
Operations | | $ | 4,471,092 | | | $ | 125,938,858 | | | $ | 314,321,075 | | | $ | 42,289,742 | | | $ | (1,000,801 | ) | |
| *Net of Foreign Taxes Withheld | | $ | 61,128 | | | $ | 125,018 | | | $ | 497,535 | | | $ | 250,618 | | | $ | 26,289 | | |
See Notes to the Financial Statements
23
Statements of Changes in Net Assets
| | | Core Value Fund | | Large Cap Value Fund | | Mid-Cap Value Fund | |
| | | Year ended
June 30, 2006 | | Period
August 30, 2004^
through June 30, 2005 | | Year ended
June 30, 2006 | | Year ended
June 30, 2005 | | Year ended
June 30, 2006 | | Year ended
June 30, 2005 | |
| | | | | | | | | | | | | (Restated – See Note 5) | |
| Operations: | |
| Net investment income (loss) | | $ | 7,568,024 | | | $ | 258,561 | | | $ | 61,420,390 | | | $ | 18,521,757 | | | $ | 11,099,829 | | | $ | 5,521,703 | | |
| Net realized gain on securities | | | 6,178,421 | | | | 249,144 | | | | 209,552,427 | | | | 44,470,932 | | | | 468,850,335 | | | | 175,224,490 | | |
| Net change in unrealized appreciation (depreciation) of securities | | | (9,275,353 | ) | | | 7,187,030 | | | | (145,033,959 | ) | | | 259,156,977 | | | | (165,629,089 | ) | | | 344,273,511 | | |
| Net increase (decrease) in net assets resulting from operations | | | 4,471,092 | | | | 7,694,735 | | | | 125,938,858 | | | | 322,149,666 | | | | 314,321,075 | | | | 525,019,704 | | |
| Dividends and Distributions to Shareholders: | |
| Investment income — net: | |
| Class I | | | (1,037,205 | ) | | | (91,190 | ) | | | (16,473,329 | ) | | | (2,424,819 | ) | | | (11,288,321 | ) | | | (4,026,703 | ) | |
| Class A | | | (1,400,556 | ) | | | (6,424 | ) | | | (23,400,290 | ) | | | (3,522,648 | ) | | | (1,632,743 | ) | | | (1,103,303 | ) | |
| Class C | | | (115,666 | ) | | | (6,010 | ) | | | (1,412,914 | ) | | | (187,110 | ) | | | — | | | | (32,300 | ) | |
| Class R | | | — | | | | — | | | | (318,175 | ) | | | (28,035 | ) | | | (8,976 | ) | | | — | | |
| Realized gain on securities — net: | |
| Class I | | | (729,022 | ) | | | — | | | | (39,507,405 | ) | | | (1,757,813 | ) | | | (171,445,705 | ) | | | (47,234,415 | ) | |
| Class A | | | (1,171,110 | ) | | | — | | | | (65,331,581 | ) | | | (3,240,290 | ) | | | (70,993,730 | ) | | | (31,272,383 | ) | |
| Class B (Note 1) | | | — | | | | — | | | | — | | | | (25,500 | ) | | | — | | | | (1,468,504 | ) | |
| Class C | | | (294,199 | ) | | | — | | | | (12,121,667 | ) | | | (646,401 | ) | | | (17,026,991 | ) | | | (7,463,100 | ) | |
| Class R | | | — | | | | — | | | | (1,145,626 | ) | | | (23,219 | ) | | | (1,364,768 | ) | | | (377,076 | ) | |
| Net decrease in net assets resulting from dividends and distributions to shareholders | | | (4,747,758 | ) | | | (103,624 | ) | | | (159,710,987 | ) | | | (11,855,835 | ) | | | (273,761,234 | ) | | | (92,977,784 | ) | |
| Capital Share Transactions: | |
| Net increase (decrease) in net assets resulting from capital share transactions | | | 1,527,532,445 | | | | 66,161,675 | | | | 1,466,755,557 | | | | 3,307,239,893 | | | | 550,589,095 | | | | 1,296,688,199 | | |
| Net Assets: | |
| Total increase (decrease) in net assets | | | 1,527,255,779 | | | | 73,752,786 | | | | 1,432,983,428 | | | | 3,617,533,724 | | | | 591,148,936 | | | | 1,728,730,119 | | |
| Beginning of year | | | 73,752,786 | | | | — | | | | 4,217,083,678 | | | | 599,549,954 | | | | 3,640,131,240 | | | | 1,911,401,121 | | |
| End of year | | $ | 1,601,008,565 | | | $ | 73,752,786 | | | $ | 5,650,067,106 | | | $ | 4,217,083,678 | | | $ | 4,231,280,176 | | | $ | 3,640,131,240 | | |
| Undistributed net investment income | | $ | 5,169,534 | | | $ | 154,937 | | | $ | 27,685,178 | | | $ | 12,742,196 | | | | — | | | $ | 4,098,614 | | |
| | | Small Cap Value Fund | | All Cap Value Fund | |
| | | Year ended
June 30, 2006 | | Year ended
June 30, 2005 | | Year ended
June 30, 2006 | | Year ended
June 30, 2005 | |
| | | | | (Restated – See Note 5) | | | | (Restated – See Note 5) | |
| Operations: | |
| Net investment income (loss) | | $ | 2,101,835 | | | $ | (1,972,163 | ) | | $ | 1,641,188 | | | $ | 601,010 | | |
| Net realized gain on securities | | | 90,186,330 | | | | 101,952,392 | | | | 15,321,556 | | | | 4,797,099 | | |
| Net change in unrealized appreciation (depreciation) of securities | | | (49,998,423 | ) | | | 20,956,835 | | | | (17,963,545 | ) | | | 18,834,404 | | |
| Net increase (decrease) in net assets resulting from operations | | | 42,289,742 | | | | 120,937,064 | | | | (1,000,801 | ) | | | 24,232,513 | | |
| Dividends and Distributions to Shareholders: | |
| Investment income — net: | |
| Class I | | | (1,468,525 | ) | | | — | | | | (806,755 | ) | | | (52,268 | ) | |
| Class A | | | (327,127 | ) | | | — | | | | (1,354,857 | ) | | | (41,286 | ) | |
| Class C | | | — | | | | — | | | | (355,291 | ) | | | — | | |
| Class R | | | — | | | | — | | | | — | | | | — | | |
| Realized gain on securities — net: | |
| Class I | | | (71,794,813 | ) | | | (55,173,507 | ) | | | (2,032,151 | ) | | | (101,981 | ) | |
| Class A | | | (30,513,282 | ) | | | (30,404,861 | ) | | | (4,046,817 | ) | | | (166,985 | ) | |
| Class B (Note 1) | | | — | | | | (1,688,489 | ) | | | — | | | | — | | |
| Class C | | | (3,479,173 | ) | | | (3,638,230 | ) | | | (2,377,250 | ) | | | (99,543 | ) | |
| Class R | | | — | | | | — | | | | — | | | | — | | |
| Net decrease in net assets resulting from dividends and distributions to shareholders | | | (107,582,920 | ) | | | (90,905,087 | ) | | | (10,973,121 | ) | | | (462,063 | ) | |
| Capital Share Transactions: | |
| Net increase (decrease) in net assets resulting from capital share transactions | | | 33,787,990 | | | | 181,126,866 | | | | (9,564,826 | ) | | | 131,315,951 | | |
| Net Assets: | |
| Total increase (decrease) in net assets | | | (31,505,188 | ) | | | 211,158,843 | | | | (21,538,748 | ) | | | 155,086,401 | | |
| Beginning of year | | | 790,355,777 | | | | 579,196,934 | | | | 233,940,438 | | | | 78,854,037 | | |
| End of year | | $ | 758,850,589 | | | $ | 790,355,777 | | | $ | 212,401,690 | | | $ | 233,940,438 | | |
| Undistributed net investment income | | | — | | | | — | | | | — | | | $ | 593,599 | | |
^ Commencement of operations.
See Notes to the Financial Statements
24
See Notes to the Financial Statements
25
Financial Highlights
The following per share data and ratios have been derived from information provided in the financial statements.
| | | | | Income from investment operations | | Dividends and distributions | |
| Core Value Fund | | Net asset
value,
beginning
of period | | Net
investment
income2 | | Net gains
(losses) on
securities
(both
realized and
unrealized) | | Total from
investment
operations | | Dividends
(from net
investment
income) | | Distributions
(from
capital
gains) | | Total
distributions | |
| Class I | |
| Year ended 6/30/2006 | | $ | 12.28 | | | $ | 0.14 | | | $ | 0.51 | | | $ | 0.65 | | | $ | (0.05 | ) | | $ | (0.03 | ) | | $ | (0.08 | ) | |
Period from 8/30/20041 to
6/30/2005 | | | 10.00 | | | | 0.08 | | | | 2.23 | | | | 2.31 | | | | (0.03 | ) | | | — | | | | (0.03 | ) | |
| Class A | |
| Year ended 6/30/2006 | | | 12.26 | | | | 0.11 | | | | 0.50 | | | | 0.61 | | | | (0.04 | ) | | | (0.03 | ) | | | (0.07 | ) | |
Period from 8/30/20041 to
6/30/2005 | | | 10.00 | | | | 0.05 | | | | 2.24 | | | | 2.29 | | | | (0.03 | ) | | | — | | | | (0.03 | ) | |
| Class C | |
| Year ended 6/30/2006 | | | 12.19 | | | | 0.01 | | | | 0.50 | | | | 0.51 | | | | (0.01 | ) | | | (0.03 | ) | | | (0.04 | ) | |
Period from 8/30/20041 to
6/30/2005 | | | 10.00 | | | | 0.01 | | | | 2.20 | | | | 2.21 | | | | (0.02 | ) | | | — | | | | (0.02 | ) | |
| | | | | | | | | Ratios to Average Net Assets | |
| Core Value Fund | | Net asset
value, end
of period | | Total
Return3 | | Net assets,
end of
period (in
thousands) | | Expenses,
net of
reimbursement | | Expenses | | Investment
income —
net | |
| Class I | |
| Year ended 6/30/2006 | | $ | 12.85 | | | | 5.31 | % | | $ | 765,092 | | | | 0.95 | % | | | 0.99 | % | | | 1.08 | % | |
Period from 8/30/20041 to
6/30/2005 | | | 12.28 | | | | 23.16 | | | | 36,586 | | | | 0.95 | 4 | | | 1.30 | 4 | | | 0.96 | 4 | |
| Class A | |
| Year ended 6/30/2006 | | | 12.80 | | | | 5.01 | | | | 673,032 | | | | 1.20 | | | | 1.23 | | | | 0.82 | | |
Period from 8/30/20041 to
6/30/2005 | | | 12.26 | | | | 22.93 | | | | 21,684 | | | | 1.20 | 4 | | | 1.50 | 4 | | | 0.73 | 4 | |
| Class C | |
| Year ended 6/30/2006 | | | 12.66 | | | | 4.24 | | | | 162,885 | | | | 1.95 | | | | 1.98 | | | | 0.06 | | |
Period from 8/30/20041 to
6/30/2005 | | | 12.19 | | | | 22.10 | | | | 15,483 | | | | 1.95 | 4 | | | 2.26 | 4 | | | (0.02 | )4 | |
| | | Year ended
June 30, 2006 | | Period August 30, 20041
through June 30, 2005 | |
| Portfolio turnover rate | | | 13 | % | | | 13 | % | |
1 Commencement of operations.
2 Effective 7/1/2005, net investment income per share has been calculated based on average shares outstanding during the period.
3 Total returns exclude the effects of sales charges. The Fund's investment advisor may have waived a portion of its advisory fee and/or reimbursed a portion of the Fund's expenses. Without such waiver and/or reimbursement, the Fund's performance would have been lower.
4 Annualized.
See Notes to the Financial Statements
26
Financial Highlights
The following per share data and ratios have been derived from information provided in the financial statements.
| | | | | Income from investment operations | | Dividends and distributions | |
| Large Cap Value Fund | | Net asset
value,
beginning
of period | | Net
investment
income2 | | Net gains
(losses) on
securities
(both
realized and
unrealized) | | Total from
investment
operations | | Dividends
(from net
investment
income) | | Distributions
(from
capital
gains) | | Total
distributions | |
| Class I | |
| Year ended 6/30/2006 | | $ | 23.47 | | | $ | 0.33 | | | $ | 0.40 | | | $ | 0.73 | | | $ | (0.25 | ) | | $ | (0.53 | ) | | $ | (0.78 | ) | |
| Year ended 6/30/2005 | | | 20.09 | | | | 0.17 | | | | 3.42 | | | | 3.59 | | | | (0.13 | ) | | | (0.08 | ) | | | (0.21 | ) | |
| Year ended 6/30/2004 | | | 15.26 | | | | 0.10 | | | | 4.92 | | | | 5.02 | | | | (0.12 | ) | | | (0.07 | ) | | | (0.19 | ) | |
| Year ended 6/30/2003 | | | 15.99 | | | | 0.17 | | | | 0.36 | | | | 0.53 | | | | (0.16 | ) | | | (1.10 | ) | | | (1.26 | ) | |
| Year ended 6/30/2002 | | | 16.82 | | | | 0.22 | | | | (0.32 | ) | | | (0.10 | ) | | | (0.15 | ) | | | (0.58 | ) | | | (0.73 | ) | |
| Class A | |
| Year ended 6/30/2006 | | | 23.39 | | | | 0.27 | | | | 0.39 | | | | 0.66 | | | | (0.20 | ) | | | (0.53 | ) | | | (0.73 | ) | |
| Year ended 6/30/2005 | | | 20.04 | | | | 0.15 | | | | 3.38 | | | | 3.53 | | | | (0.10 | ) | | | (0.08 | ) | | | (0.18 | ) | |
| Year ended 6/30/2004 | | | 15.25 | | | | 0.11 | | | | 4.85 | | | | 4.96 | | | | (0.10 | ) | | | (0.07 | ) | | | (0.17 | ) | |
| Year ended 6/30/2003 | | | 15.98 | | | | 0.16 | | | | 0.35 | | | | 0.51 | | | | (0.14 | ) | | | (1.10 | ) | | | (1.24 | ) | |
Period from 10/26/20011 to
6/30/2002 | | | 15.57 | | | | 0.13 | | | | 0.87 | | | | 1.00 | | | | (0.09 | ) | | | (0.50 | ) | | | (0.59 | ) | |
| Class C | |
| Year ended 6/30/2006 | | | 23.07 | | | | 0.09 | | | | 0.39 | | | | 0.48 | | | | (0.06 | ) | | | (0.53 | ) | | | (0.59 | ) | |
| Year ended 6/30/2005 | | | 19.84 | | | | 0.04 | | | | 3.29 | | | | 3.33 | | | | (0.02 | ) | | | (0.08 | ) | | | (0.10 | ) | |
| Year ended 6/30/2004 | | | 15.15 | | | | (0.13 | ) | | | 4.93 | | | | 4.80 | | | | (0.04 | ) | | | (0.07 | ) | | | (0.11 | ) | |
| Year ended 6/30/2003 | | | 15.92 | | | | (0.16 | ) | | | 0.56 | | | | 0.40 | | | | (0.07 | ) | | | (1.10 | ) | | | (1.17 | ) | |
Period from 2/4/20021 to
6/30/2002 | | | 15.60 | | | | 0.03 | | | | 0.29 | | | | 0.32 | | | | — | | | | — | | | | — | | |
| Class R | |
| Year ended 6/30/2006 | | | 23.56 | | | | 0.22 | | | | 0.39 | | | | 0.61 | | | | (0.17 | ) | | | (0.53 | ) | | | (0.70 | ) | |
| Year ended 6/30/2005 | | | 20.25 | | | | 0.14 | | | | 3.36 | | | | 3.50 | | | | (0.11 | ) | | | (0.08 | ) | | | (0.19 | ) | |
Period from 8/30/20031 to
6/30/2004 | | | 16.26 | | | | 0.02 | | | | 3.97 | | | | 3.99 | | | | — | | | | — | | | | — | | |
| | | | | | | | | Ratios to Average Net Assets | |
| Large Cap Value Fund | | Net asset
value, end
of period | | Total
Return3 | | Net assets,
end of
period (in
thousands) | | Expenses,
net of
reimbursement | | Expenses | | Investment
income —
net | |
| Class I | |
| Year ended 6/30/2006 | | $ | 23.42 | | | | 3.10 | % | | $ | 2,119,374 | | | | 0.98 | % | | | 0.98 | % | | | 1.40 | % | |
| Year ended 6/30/2005 | | | 23.47 | | | | 17.95 | | | | 1,235,903 | | | | 0.99 | | | | 0.99 | | | | 1.22 | | |
| Year ended 6/30/2004 | | | 20.09 | | | | 33.20 | | | | 200,719 | | | | 1.03 | | | | 1.06 | | | | 0.85 | | |
| Year ended 6/30/2003 | | | 15.26 | | | | 4.95 | | | | 44,077 | | | | 1.05 | | | | 1.34 | | | | 1.32 | | |
| Year ended 6/30/2002 | | | 15.99 | | | | (0.38 | ) | | | 39,215 | | | | 1.00 | | | | 1.50 | | | | 1.30 | | |
| Class A | |
| Year ended 6/30/2006 | | | 23.32 | | | | 2.82 | | | | 2,959,444 | | | | 1.22 | | | | 1.22 | | | | 1.15 | | |
| Year ended 6/30/2005 | | | 23.39 | | | | 17.68 | | | | 2,440,384 | | | | 1.24 | | | | 1.24 | | | | 0.96 | | |
| Year ended 6/30/2004 | | | 20.04 | | | | 32.78 | | | | 311,596 | | | | 1.28 | | | | 1.31 | | | | 0.60 | | |
| Year ended 6/30/2003 | | | 15.25 | | | | 4.79 | | | | 28,704 | | | | 1.30 | | | | 1.59 | | | | 1.07 | | |
Period from 10/26/20011 to
6/30/2002 | | | 15.98 | | | | 6.51 | | | | 6,546 | | | | 1.25 | 4 | | | 1.75 | 4 | | | 1.05 | 4 | |
| Class C | |
| Year ended 6/30/2006 | | | 22.96 | | | | 2.08 | | | | 488,480 | | | | 1.97 | | | | 1.97 | | | | 0.40 | | |
| Year ended 6/30/2005 | | | 23.07 | | | | 16.80 | | | | 506,674 | | | | 1.99 | | | | 1.99 | | | | 0.22 | | |
| Year ended 6/30/2004 | | | 19.84 | | | | 31.83 | | | | 78,986 | | | | 2.03 | | | | 2.06 | | | | (0.14 | ) | |
| Year ended 6/30/2003 | | | 15.15 | | | | 4.05 | | | | 2,408 | | | | 2.05 | | | | 2.34 | | | | 0.32 | | |
Period from 2/4/20021 to
6/30/2002 | | | 15.92 | | | | 2.05 | | | | 1,092 | | | | 2.00 | 4 | | | 2.50 | 4 | | | 0.30 | 4 | |
| Class R | |
| Year ended 6/30/2006 | | | 23.47 | | | | 2.59 | | | | 82,770 | | | | 1.49 | | | | 1.49 | | | | 0.92 | | |
| Year ended 6/30/2005 | | | 23.56 | | | | 17.35 | | | | 25,933 | | | | 1.49 | | | | 1.49 | | | | 0.77 | | |
Period from 8/30/20031 to
6/30/2004 | | | 20.25 | | | | 24.54 | | | | 1,665 | | | | 1.71 | 4 | | | 1.74 | 4 | | | 0.53 | 4 | |
| | | Year Ended June 30, | |
| | | 2006 | | 2005 | | 2004 | | 2003 | | 2002 | |
| Portfolio turnover rate | | | 27 | % | | | 14 | % | | | 5 | % | | | 35 | % | | | 96 | % | |
1 Commencement of operations.
2 Effective 7/1/2005, net investment income per share has been calculated based on average shares outstanding during the period.
3 Total returns exclude the effects of sales charges. Prior to 7/1/2004, the Fund's investment advisor may have waived a portion of its advisory fee and/or reimbursed a portion of the Fund's expenses. Without such waiver and/or reimbursement, the Fund's performance would have been lower.
4 Annualized.
See Notes to the Financial Statements
27
Financial Highlights
The following per share data and ratios have been derived from information provided in the financial statements.
| | | | | Income from investment operations | | Dividends and distributions | |
| Mid-Cap Value Fund | | Net asset
value,
beginning
of period | | Net
investment
income2 | | Net gains
(losses) on
securities
(both
realized and
unrealized) | | Total from
investment
operations | | Dividends
(from net
investment
income) | | Distributions
(from
capital
gains) | | Total
distributions | |
| Class I | |
| Year ended 6/30/2006 | | $ | 28.55 | | | $ | 0.12 | | | $ | 2.27 | | | $ | 2.39 | | | $ | (0.13 | ) | | $ | (1.90 | ) | | $ | (2.03 | ) | |
| Year ended 6/30/2005 | | | 24.53 | | | | 0.10 | 5 | | | 4.83 | 5 | | | 4.93 | | | | (0.07 | ) | | | (0.84 | ) | | | (0.91 | ) | |
| Year ended 6/30/2004 | | | 17.64 | | | | 0.11 | 5 | | | 7.19 | 5 | | | 7.30 | | | | (0.08 | ) | | | (0.33 | ) | | | (0.41 | ) | |
| Year ended 6/30/2003 | | | 17.01 | | | | 0.13 | 5 | | | 0.89 | 5 | | | 1.02 | | | | (0.05 | ) | | | (0.34 | ) | | | (0.39 | ) | |
| Year ended 6/30/2002 | | | 17.14 | | | | 0.13 | 5 | | | 0.66 | 5 | | | 0.79 | | | | (0.15 | ) | | | (0.77 | ) | | | (0.92 | ) | |
| Class A | |
| Year ended 6/30/2006 | | | 28.41 | | | | 0.05 | | | | 2.25 | | | | 2.30 | | | | (0.04 | ) | | | (1.90 | ) | | | (1.94 | ) | |
| Year ended 6/30/2005 | | | 24.43 | | | | 0.04 | 5 | | | 4.81 | 5 | | | 4.85 | | | | (0.03 | ) | | | (0.84 | ) | | | (0.87 | ) | |
| Year ended 6/30/2004 | | | 17.61 | | | | 0.06 | 5 | | | 7.15 | 5 | | | 7.21 | | | | (0.06 | ) | | | (0.33 | ) | | | (0.39 | ) | |
| Year ended 6/30/2003 | | | 16.99 | | | | 0.09 | 5 | | | 0.90 | 5 | | | 0.99 | | | | (0.03 | ) | | | (0.34 | ) | | | (0.37 | ) | |
| Year ended 6/30/2002 | | | 17.12 | | | | 0.07 | 5 | | | 0.70 | 5 | | | 0.77 | | | | (0.13 | ) | | | (0.77 | ) | | | (0.90 | ) | |
| Class C | |
| Year ended 6/30/2006 | | | 27.70 | | | | (0.17 | ) | | | 2.20 | | | | 2.03 | | | | — | | | | (1.90 | ) | | | (1.90 | ) | |
| Year ended 6/30/2005 | | | 23.99 | | | | (0.15 | )5 | | | 4.70 | 5 | | | 4.55 | | | | — | | | | (0.84 | ) | | | (0.84 | ) | |
| Year ended 6/30/2004 | | | 17.38 | | | | (0.11 | )5 | | | 7.05 | 5 | | | 6.94 | | | | — | | | | (0.33 | ) | | | (0.33 | ) | |
| Year ended 6/30/2003 | | | 16.87 | | | | (0.02 | )5 | | | 0.87 | 5 | | | 0.85 | | | | — | | | | (0.34 | ) | | | (0.34 | ) | |
| Year ended 6/30/2002 | | | 17.07 | | | | (0.03 | )5 | | | 0.67 | 5 | | | 0.64 | | | | (0.07 | ) | | | (0.77 | ) | | | (0.84 | ) | |
| Class R | |
| Year ended 6/30/2006 | | | 28.71 | | | | (0.03 | ) | | | 2.28 | | | | 2.25 | | | | (0.01 | ) | | | (1.90 | ) | | | (1.91 | ) | |
| Year ended 6/30/2005 | | | 24.78 | | | | (0.05 | )5 | | | 4.89 | 5 | | | 4.84 | | | | (0.07 | ) | | | (0.84 | ) | | | (0.91 | ) | |
Period from 8/30/20031 to
6/30/2004 | | | 19.33 | | | | 0.02 | 5 | | | 5.84 | 5 | | | 5.86 | | | | (0.08 | ) | | | (0.33 | ) | | | (0.41 | ) | |
| | | | | | | | | Ratios to Average Net Assets | |
| Mid-Cap Value Fund | | Net asset
value, end
of period | | Total
Return3 | | Net assets,
end of
period (in
thousands) | | Expenses,
net of
reimbursement | | Expenses | | Investment
income —
net | |
| Class I | |
| Year ended 6/30/2006 | | $ | 28.91 | | | | 8.53 | % | | $ | 2,873,684 | | | | 1.01 | % | | | 1.01 | % | | | 0.40 | % | |
| Year ended 6/30/2005 | | | 28.55 | | | | 20.41 | | | | 2,244,061 | | | | 1.03 | | | | 1.03 | | | | 0.36 | 5 | |
| Year ended 6/30/2004 | | | 24.53 | | | | 41.67 | | | | 908,242 | | | | 1.03 | | | | 1.03 | | | | 0.50 | 5 | |
| Year ended 6/30/2003 | | | 17.64 | | | | 6.46 | | | | 162,404 | | | | 1.15 | | | | 1.22 | | | | 0.84 | 5 | |
| Year ended 6/30/2002 | | | 17.01 | | | | 4.77 | | | | 63,741 | | | | 1.15 | | | | 1.40 | | | | 0.89 | 5 | |
| Class A | |
| Year ended 6/30/2006 | | | 28.77 | | | | 8.27 | | | | 1,088,854 | | | | 1.27 | | | | 1.27 | | | | 0.16 | | |
| Year ended 6/30/2005 | | | 28.41 | | | | 20.13 | | | | 1,075,253 | | | | 1.28 | | | | 1.28 | | | | 0.16 | 5 | |
| Year ended 6/30/2004 | | | 24.43 | | | | 41.21 | | | | 755,749 | | | | 1.28 | | | | 1.28 | | | | 0.25 | 5 | |
| Year ended 6/30/2003 | | | 17.61 | | | | 6.26 | | | | 60,159 | | | | 1.40 | | | | 1.47 | | | | 0.60 | 5 | |
| Year ended 6/30/2002 | | | 16.99 | | | | 4.64 | | | | 18,790 | | | | 1.40 | | | | 1.65 | | | | 0.60 | 5 | |
| Class C | |
| Year ended 6/30/2006 | | | 27.83 | | | | 7.46 | | | | 246,242 | | | | 2.01 | | | | 2.01 | | | | (0.58 | ) | |
| Year ended 6/30/2005 | | | 27.70 | | | | 19.23 | | | | 252,381 | | | | 2.03 | | | | 2.03 | | | | (0.58 | )5 | |
| Year ended 6/30/2004 | | | 23.99 | | | | 40.19 | | | | 201,360 | | | | 2.04 | | | | 2.04 | | | | (0.50 | )5 | |
| Year ended 6/30/2003 | | | 17.38 | | | | 5.40 | | | | 15,209 | | | | 2.15 | | | | 2.22 | | | | (0.15 | )5 | |
| Year ended 6/30/2002 | | | 16.87 | | | | 3.85 | | | | 9,084 | | | | 2.15 | | | | 2.40 | | | | (0.13 | )5 | |
| Class R | |
| Year ended 6/30/2006 | | | 29.05 | | | | 7.99 | | | | 22,501 | | | | 1.51 | | | | 1.51 | | | | (0.10 | ) | |
| Year ended 6/30/2005 | | | 28.71 | | | | 19.83 | | | | 20,038 | | | | 1.53 | | | | 1.53 | | | | (0.18 | )5 | |
Period from 8/30/20031 to
6/30/2004 | | | 24.78 | | | | 30.58 | | | �� | 4,032 | | | | 1.72 | 4 | | | 1.72 | 4 | | | 0.10 | 4,5 | |
| | | Year Ended June 30, | |
| | | 2006 | | 2005 | | 2004 | | 2003 | | 2002 | |
| Portfolio turnover rate | | | 55 | % | | | 27 | % | | | 25 | % | | | 56 | % | | | 82 | % | |
1 Commencement of operations.
2 Net investment income (loss) per share has been calculated based on average shares outstanding during each period.
3 Total returns exclude the effects of sales charges. Prior to 7/1/2003, the Fund's investment advisor may have waived a portion of its advisory fee and/or reimbursed a portion of the Fund's expenses. Without such waiver and/or reimbursement, the Fund's performance would have been lower.
4 Annualized.
5 As restated. See Note 5 to the Financial Statements.
See Notes to the Financial Statements
28
Financial Highlights
The following per share data and ratios have been derived from information provided in the financial statements.
| | | | | Income from investment operations | | Dividends and distributions | |
| Small Cap Value Fund | | Net asset
value,
beginning
of period | | Net
investment
income2 | | Net gains
(losses) on
securities
(both
realized and
unrealized) | | Total from
investment
operations | | Dividends
(from net
investment
income) | | Distributions
(from
capital
gains) | | Total
distributions | |
| Class I | |
| Year ended 6/30/2006 | | $ | 52.52 | | | $ | 0.18 | | | $ | 2.57 | | | $ | 2.75 | | | $ | (0.14 | ) | | $ | (7.00 | ) | | $ | (7.14 | ) | |
| Year ended 6/30/2005 | | | 50.54 | | | | (0.08 | )5 | | | 9.36 | 5 | | | 9.28 | | | | — | | | | (7.30 | ) | | | (7.30 | ) | |
| Year ended 6/30/2004 | | | 34.55 | | | | (0.06 | )5 | | | 16.90 | 5 | | | 16.84 | | | | (0.02 | ) | | | (0.83 | ) | | | (0.85 | ) | |
| Year ended 6/30/2003 | | | 31.83 | | | | 0.05 | 5 | | | 2.72 | 5 | | | 2.77 | | | | (0.05 | ) | | | — | | | | (0.05 | ) | |
| Year ended 6/30/2002 | | | 26.63 | | | | 0.10 | 5 | | | 5.30 | 5 | | | 5.40 | | | | (0.20 | ) | | | — | | | | (0.20 | ) | |
| Class A | |
| Year ended 6/30/2006 | | | 52.74 | | | | 0.06 | | | | 2.58 | | | | 2.64 | | | | (0.08 | ) | | | (7.00 | ) | | | (7.08 | ) | |
| Year ended 6/30/2005 | | | 50.84 | | | | (0.20 | )5 | | | 9.40 | 5 | | | 9.20 | | | | — | | | | (7.30 | ) | | | (7.30 | ) | |
| Year ended 6/30/2004 | | | 34.81 | | | | (0.17 | )5 | | | 17.03 | 5 | | | 16.86 | | | | — | | | | (0.83 | ) | | | (0.83 | ) | |
| Year ended 6/30/2003 | | | 32.12 | | | | (0.02 | )5 | | | 2.76 | 5 | | | 2.74 | | | | (0.05 | ) | | | — | | | | (0.05 | ) | |
| Year ended 6/30/2002 | | | 26.86 | | | | (0.04 | )5 | | | 5.50 | 5 | | | 5.46 | | | | (0.20 | ) | | | — | | | | (0.20 | ) | |
| Class C | |
| Year ended 6/30/2006 | | | 50.67 | | | | (0.32 | ) | | | 2.48 | | | | 2.16 | | | | — | | | | (7.00 | ) | | | (7.00 | ) | |
| Year ended 6/30/2005 | | | 49.45 | | | | (0.56 | )5 | | | 9.08 | 5 | | | 8.52 | | | | — | | | | (7.30 | ) | | | (7.30 | ) | |
| Year ended 6/30/2004 | | | 34.13 | | | | (0.50 | )5 | | | 16.65 | 5 | | | 16.15 | | | | — | | | | (0.83 | ) | | | (0.83 | ) | |
| Year ended 6/30/2003 | | | 31.71 | | | | (0.24 | )5 | | | 2.68 | 5 | | | 2.44 | | | | (0.02 | ) | | | — | | | | (0.02 | ) | |
Period from 2/4/20021 to
6/30/2002 | | | 28.84 | | | | (0.26 | )5 | | | 3.13 | 5 | | | 2.87 | | | | — | | | | — | | | | — | | |
| | | | | | | | | Ratios to Average Net Assets | |
| Small Cap Value Fund | | Net asset
value, end
of period | | Total
Return3 | | Net assets,
end of
period (in
thousands) | | Expenses,
net of
reimbursement | | Expenses | | Investment
income —
net | |
| Class I | |
| Year ended 6/30/2006 | | $ | 48.13 | | | | 5.13 | % | | $ | 553,660 | | | | 1.04 | % | | | 1.04 | % | | | 0.35 | % | |
| Year ended 6/30/2005 | | | 52.52 | | | | 19.49 | | | | 518,365 | | | | 1.06 | | | | 1.06 | | | | (0.16 | )5 | |
| Year ended 6/30/2004 | | | 50.54 | | | | 49.06 | | | | 324,984 | | | | 1.14 | | | | 1.14 | | | | (0.12 | )5 | |
| Year ended 6/30/2003 | | | 34.55 | | | | 8.72 | | | | 136,680 | | | | 1.22 | | | | 1.25 | | | | 0.18 | 5 | |
| Year ended 6/30/2002 | | | 31.83 | | | | 20.45 | | | | 97,458 | | | | 1.24 | | | | 1.32 | | | | 0.35 | 5 | |
| Class A | |
| Year ended 6/30/2006 | | | 48.30 | | | | 4.86 | | | | 184,473 | | | | 1.30 | | | | 1.30 | | | | 0.12 | | |
| Year ended 6/30/2005 | | | 52.74 | | | | 19.20 | | | | 232,453 | | | | 1.31 | | | | 1.31 | | | | (0.40 | )5 | |
| Year ended 6/30/2004 | | | 50.84 | | | | 48.70 | | | | 217,833 | | | | 1.39 | | | | 1.39 | | | | (0.37 | )5 | |
| Year ended 6/30/2003 | | | 34.81 | | | | 8.57 | | | | 111,208 | | | | 1.47 | | | | 1.50 | | | | (0.07 | )5 | |
| Year ended 6/30/2002 | | | 32.12 | | | | 20.47 | | | | 13,660 | | | | 1.49 | | | | 1.57 | | | | (0.34 | )5 | |
| Class C | |
| Year ended 6/30/2006 | | | 45.83 | | | | 4.07 | | | | 20,717 | | | | 2.04 | | | | 2.04 | | | | (0.63 | ) | |
| Year ended 6/30/2005 | | | 50.67 | | | | 18.30 | | | | 26,792 | | | | 2.06 | | | | 2.06 | | | | (1.15 | )5 | |
| Year ended 6/30/2004 | | | 49.45 | | | | 47.62 | | | | 25,132 | | | | 2.14 | | | | 2.14 | | | | (1.13 | )5 | |
| Year ended 6/30/2003 | | | 34.13 | | | | 7.66 | | | | 8,676 | | | | 2.22 | | | | 2.25 | | | | (0.82 | )5 | |
Period from 2/4/20021 to
6/30/2002 | | | 31.71 | | | | 9.99 | | | | 3,484 | | | | 2.24 | 4 | | | 2.32 | 4 | | | (1.72 | )4,5 | |
| | | Year Ended June 30, | |
| | | 2006 | | 2005 | | 2004 | | 2003 | | 2002 | |
| Portfolio turnover rate | | | 52 | % | | | 49 | % | | | 64 | % | | | 54 | % | | | 75 | % | |
1 Commencement of operations.
2 Net investment income (loss) per share has been calculated based on average shares outstanding during each period.
3 Total returns exclude the effects of sales charges. Prior to 7/1/2003, the Fund's investment advisor may have waived a portion of its advisory fee and/or reimbursed a portion of the Fund's expenses. Without such waiver and/or reimbursement, the Fund's performance would have been lower.
4 Annualized.
5 As restated. See Note 5 to the Financial Statements.
See Notes to the Financial Statements
29
Financial Highlights
The following per share data and ratios have been derived from information provided in the financial statements.
| | | | | Income from investment operations | | Dividends and distributions | |
| All Cap Value Fund | | Net asset
value,
beginning
of period | | Net
investment
income2 | | Net gains
(losses) on
securities
(both
realized and
unrealized) | | Total from
investment
operations | | Dividends
(from net
investment
income) | | Distributions
(from
capital
gains) | | Total
distributions | |
| Class I | |
| Year ended 6/30/2006 | | $ | 20.36 | | | $ | 0.21 | | | $ | (0.26 | ) | | $ | (0.05 | ) | | $ | (0.27 | ) | | $ | (0.68 | ) | | $ | (0.95 | ) | |
| Year ended 6/30/2005 | | | 17.02 | | | | 0.16 | 5 | | | 3.27 | 5 | | | 3.43 | | | | (0.03 | ) | | | (0.06 | ) | | | (0.09 | ) | |
| Year ended 6/30/2004 | | | 12.58 | | | | 0.00 | 5 | | | 4.46 | 5 | | | 4.46 | | | | (0.01 | ) | | | (0.01 | ) | | | (0.02 | ) | |
Period from 12/31/20021 to
6/30/2003 | | | 10.00 | | | | 0.02 | 5 | | | 2.56 | 5 | | | 2.58 | | | | — | | | | — | | | | — | | |
| Class A | |
| Year ended 6/30/2006 | | | 20.40 | | | | 0.17 | | | | (0.26 | ) | | | (0.09 | ) | | | (0.23 | ) | | | (0.68 | ) | | | (0.91 | ) | |
| Year ended 6/30/2005 | | | 17.09 | | | | 0.11 | 5 | | | 3.28 | 5 | | | 3.39 | | | | (0.02 | ) | | | (0.06 | ) | | | (0.08 | ) | |
| Year ended 6/30/2004 | | | 12.62 | | | | (0.04 | )5 | | | 4.53 | 5 | | | 4.49 | | | | (0.01 | ) | | | (0.01 | ) | | | (0.02 | ) | |
Period from 12/31/20021 to
6/30/2003 | | | 10.00 | | | | 0.02 | 5 | | | 2.60 | 5 | | | 2.62 | | | | — | | | | — | | | | — | | |
| Class C | |
| Year ended 6/30/2006 | | | 20.02 | | | | 0.01 | | | | (0.25 | ) | | | (0.24 | ) | | | (0.10 | ) | | | (0.68 | ) | | | (0.78 | ) | |
| Year ended 6/30/2005 | | | 16.88 | | | | (0.02 | )5 | | | 3.22 | 5 | | | 3.20 | | | | — | | | | (0.06 | ) | | | (0.06 | ) | |
Period from 8/28/20031 to
6/30/2004 | | | 14.32 | | | | (0.14 | )5 | | | 2.71 | 5 | | | 2.57 | | | | — | | | | (0.01 | ) | | | (0.01 | ) | |
| | | | | | | | | Ratios to Average Net Assets | |
| All Cap Value Fund | | Net asset
value, end
of period | | Total
Return3 | | Net assets,
end of
period (in
thousands) | | Expenses,
net of
reimbursement | | Expenses | | Investment
income —
net | |
| Class I | |
| Year ended 6/30/2006 | | $ | 19.36 | | | | (0.24 | )% | | $ | 59,891 | | | | 0.97 | % | | | 0.97 | % | | | 1.01 | % | |
| Year ended 6/30/2005 | | | 20.36 | | | | 20.14 | | | | 54,969 | | | | 1.04 | | | | 1.04 | | | | 0.88 | 5 | |
| Year ended 6/30/2004 | | | 17.02 | | | | 35.48 | | | | 22,678 | | | | 1.15 | | | | 1.25 | | | | 0.03 | 5 | |
Period from 12/31/20021 to
6/30/2003 | | | 12.58 | | | | 25.80 | | | | 3,560 | | | | 1.10 | 4 | | | 5.84 | 4 | | | 0.40 | 4,5 | |
| Class A | |
| Year ended 6/30/2006 | | | 19.40 | | | | (0.50 | ) | | | 92,689 | | | | 1.22 | | | | 1.22 | | | | 0.83 | | |
| Year ended 6/30/2005 | | | 20.40 | | | | 19.84 | | | | 112,898 | | | | 1.29 | | | | 1.29 | | | | 0.61 | 5 | |
| Year ended 6/30/2004 | | | 17.09 | | | | 35.56 | | | | 35,438 | | | | 1.40 | | | | 1.50 | | | | (0.22 | )5 | |
Period from 12/31/20021 to
6/30/2003 | | | 12.62 | | | | 26.20 | | | | — | | | | 1.10 | 4 | | | 5.84 | 4 | | | 0.40 | 4,5 | |
| Class C | |
| Year ended 6/30/2006 | | | 19.00 | | | | (1.25 | ) | | | 59,822 | | | | 1.97 | | | | 1.97 | | | | 0.05 | | |
| Year ended 6/30/2005 | | | 20.02 | | | | 18.98 | | | | 66,074 | | | | 2.04 | | | | 2.04 | | | | (0.14 | )5 | |
Period from 8/28/20031 to
6/30/2004 | | | 16.88 | | | | 17.97 | | | | 20,739 | | | | 2.35 | 4 | | | 2.46 | 4 | | | (0.96 | )4,5 | |
| | | | | Year Ended June 30, | | Period December 31, 20021 | |
| | | 2006 | | 2005 | | 2004 | | through June 30, 2003 | |
| Portfolio turnover rate | | | 73 | % | | | 39 | % | | | 30 | % | | | 11 | % | |
1 Commencement of operations.
2 Net investment income per share has been calculated based on average shares outstanding during each period.
3 Total returns exclude the effects of sales charges. Prior to 7/1/2004, the Fund's investment advisor waived a portion of its advisory fee and/or reimbursed a portion of the Fund's expenses. Without such waiver and/or reimbursement, the Fund's performance would have been lower.
4 Annualized.
5 As restated. See Note 5 to the Financial Statements.
See Notes to the Financial Statements
30
Notes to the Financial Statements
JUNE 30, 2006
NOTE 1.
Organization and Significant Accounting Policies. Hotchkis and Wiley Funds (the "Trust") is registered under the Investment Company Act of 1940 as an open-end, management investment company. The Trust was organized as a Delaware statutory trust on July 23, 2001 and consists of five series of shares. The Hotchkis and Wiley Core Value Fund, the Hotchkis and Wiley Large Cap Value Fund, the Hotchkis and Wiley Mid-Cap Value Fund and the Hotchkis and Wiley Small Cap Value Fund (collectively, the "H&W Funds") are diversified series and the Hotchkis and Wiley All Cap Value Fund (together with the H&W Funds, hereafter referred to as the "Funds") is a non-diversified series of the Trust. The Trust was organized to acquire the assets and liabilities of the Mercury HW Large Cap Value Fund, the Mercury HW Mid-Cap Value Fund and the Mercury HW Small Cap Va lue Fund (the "Mercury HW Funds"). On February 4, 2002, the Mercury HW Funds were reorganized into the Trust through a non-taxable exchange. These financial statements include operating results, changes in net assets and financial highlights of the Mercury HW Funds prior to the reorganization.
The Large Cap Value Fund and Mid-Cap Value Fund have four classes of shares: Class A, Class C, Class I and Class R. The Core Value Fund, Small Cap Value Fund and All Cap Value Fund have three classes of shares; Class A, Class C and Class I. Class A shares are sold with a front-end sales charge. Class C shares may be subject to a contingent deferred sales charge. All classes of shares have identical voting, dividend, liquidation and other rights and the same terms and conditions, except that Class A, Class C and Class R shares bear certain expenses related to the distribution and servicing expenditures. The Core Value Fund, Large Cap Value Fund, Mid-Cap Value Fund, Small Cap Value Fund and All Cap Value Fund are closed to new investors, except as described in the prospectus. Effective August 19, 2005, the Large Cap Value Fund, Mid-Cap Value Fund and Small Cap Value Fund converted their Class B shares into their Class A shares. Cl ass B shares no longer exist.
The Funds' audited financial statements have been prepared in conformity with accounting principles generally accepted in the United States of America, which may require the use of management accruals and estimates. Actual results could differ from those estimates. The following is a summary of significant accounting policies followed by the Funds.
Security Valuation: Portfolio securities that are listed on a securities exchange (whether domestic or foreign) or The Nasdaq Stock Market ("NSM") are valued at the last sale price (or official closing price) on that day as of the close of the New York Stock Exchange (which is generally 4:00 p.m. New York time), or, in the absence of recorded sales, at the average of readily available closing bid and asked prices on such exchange or NSM. Unlisted equity securities that are not included in NSM are valued at the average of the quoted bid and asked price in the over-the-counter market. Fixed-income securities are normally valued on the basis of quotes obtained from broker/dealers or pricing services. Short-term investments which mature in less than 60 days are valued at amortized cost, which approximates fair value. Investments quoted in foreign currenc y are valued daily in U.S. dollars on the basis of the foreign currency exchange rate prevailing at the time of valuation. Securities and assets for which market value quotations are not available are valued at their fair value as determined in good faith by or under the direction of the Trust's Board of Trustees.
Federal Income Taxes: It is each Fund's policy to continue to comply with the requirements of the Internal Revenue Code applicable to regulated investment companies and each Fund intends to distribute substantially all of its investment company net taxable income and net capital gains to shareholders. Therefore, no federal income tax provision is required. Under the applicable foreign tax law, a withholding tax may be imposed on interest, dividends and capital gains at various rates.
Income and Expense Allocation: Common expenses incurred by the Trust which are not allocable to a specific Fund are allocated among the Funds based upon relative net assets or evenly, depending on the nature of the expenditure. Net investment income, other than class-specific expenses, and realized and unrealized gains and losses are allocated daily to each class of shares based upon the relative net asset value of outstanding shares of each class at the beginning of the day (after adjusting for the current day's capital share activity of the respective class).
Dividends and Distributions to Shareholders: Dividends from net investment income are declared and paid semi-annually for the Large Cap Value Fund and annually for the Core Value Fund, Mid-Cap Value Fund, Small Cap Value Fund and All Cap Value Fund. Distributions of net realized capital gains, if any, will be declared and paid at least annually.
Security Transactions and Investment Income: Security and shareholder transactions are recorded on trade date. Realized gains and losses on sales of investments are calculated on the identified cost basis. Dividend income and dividends and distributions to shareholders are recorded on the ex-dividend date. Interest income is recognized on the accrual basis. Generally accepted accounting principles require that permanent financial reporting and tax differences relating to shareholder distributions be reclassified within the capital accounts. Return of capital distributions received from REIT securities are recorded as an adjustment to the cost of the security and thus may impact unrealized gains or losses on the security.
31
NOTE 2.
Fees and Transactions with Affiliates. The Trust has entered into an Investment Advisory Agreement for each of the Funds with Hotchkis and Wiley Capital Management, LLC (the "Advisor"), with which certain officers and a Trustee of the Trust are affiliated. The Advisor is a limited liability company, the primary members of which are HWCap Holdings, a limited liability company whose members are current and retired employees of the Advisor, and Stephens — H&W, LLC, a limited liability company whose primary member is SF Holdings, Corp., which is a diversified holding company. The Advisor is responsible for the management of the Funds' investments and provides the necessary personnel, facilities, equipment and certain other services necessary to the operations of each Fund. The Advisor receives a fee, computed daily and payable monthly, at the an nual rates presented below as applied to each Fund's daily net assets. The Advisor has contractually agreed to pay all operating expenses in excess of the annual rates presented below as applied to such Fund's daily net assets through October 31, 2007.
| | | Core
Value | | Large Cap
Value | | Mid-Cap
Value | | Small Cap
Value | | All Cap
Value | |
| Annual Advisory Fee Rate | | | 0.75 | % | | | 0.75 | % | | | 0.75 | % | | | 0.75 | % | | | 0.75 | % | |
| Annual cap on expenses — Class I | | | 0.95 | % | | | 1.05 | % | | | 1.15 | % | | | 1.25 | % | | | 1.25 | % | |
| Annual cap on expenses — Class A | | | 1.20 | % | | | 1.30 | % | | | 1.40 | % | | | 1.50 | % | | | 1.50 | % | |
| Annual cap on expenses — Class C | | | 1.95 | % | | | 2.05 | % | | | 2.15 | % | | | 2.25 | % | | | 2.25 | % | |
| Annual cap on expenses — Class R | | | Not applicable | | | | 1.55 | % | | | 1.65 | % | | | Not applicable | | | | Not applicable | | |
Effective April 1, 2005, Quasar Distributors, LLC is the principal underwriter and distributor for the shares of the Funds ("Quasar" or the "Distributor"). The Distributor is affiliated with the Funds' Transfer Agent, Fund Accountant and Administrator, U.S. Bancorp Fund Services, LLC. Prior to April 1, 2005, the Funds' distributor was Stephens Inc. ("Stephens"). Pursuant to the Distribution Plan adopted by the Trust in accordance with Rule 12b-1 under the Investment Company Act of 1940, the Funds pay the Distributor ongoing distribution and service fees. The fees are accrued daily at the annual rates based upon the average daily net assets of the shares as follows:
| | | Distribution and Service
Fee | |
| Class A | | | 0.25 | % | |
| Class C | | | 1.00 | % | |
| Class R | | | 0.50 | % | |
Pursuant to separate agreements with the Distributor, selected dealers and other financial intermediaries also provide distribution services to the Funds. The ongoing distribution and service fee compensates the Distributor and selected dealers for providing distribution-related and shareholder services to Class A, Class C and Class R shareholders.
Certain selected dealers and other financial intermediaries charge a fee for shareholder accounting services and administrative services that they provide to the Funds on behalf of certain shareholders; the portion of this fee paid by the Funds is included within transfer agent fees and expenses in the Statements of Operations.
As of April 1, 2005, U.S. Bancorp Fund Services, LLC, is the administrator for each Fund. Prior to April 1, 2005, the Funds' administrator was Stephens.
As permitted by Rule 10f-3 under the Investment Company Act of 1940, the Board of Trustees of the Trust has adopted procedures which allow the Funds, under certain conditions described in the Rule, to acquire newly issued securities from a member of an underwriting group in which an affiliated underwriter participates.
NOTE 3.
Investments. Purchases and sales of investment securities, excluding short-term investments, for the year ended June 30, 2006 were as follows:
| | | Core Value | | Large Cap Value | | Mid-Cap Value | | Small Cap Value | | All Cap Value | |
| Purchases | | $ | 1,635,506,817 | | | $ | 2,847,286,618 | | | $ | 2,500,876,353 | | | $ | 420,329,999 | | | $ | 176,970,772 | | |
| Sales | | | 113,061,985 | | | | 1,387,238,433 | | | | 2,224,153,703 | | | | 471,969,253 | | | | 174,638,856 | | |
32
The following information is presented on an income tax basis as of June 30, 2006:
| | | Core Value | | Large Cap Value | | Mid-Cap Value | | Small Cap Value | | All Cap Value | |
| Cost of investments(a) | | $ | 1,590,879,029 | | | $ | 5,444,918,969 | | | $ | 3,735,488,780 | | | $ | 661,334,257 | | | $ | 205,487,459 | | |
| Gross unrealized appreciation | | | 90,842,717 | | | | 490,803,750 | | | | 591,509,102 | | | | 143,585,096 | | | | 22,729,242 | | |
| Gross unrealized depreciation | | | 92,931,040 | | | | 312,079,644 | | | | 191,412,551 | | | | 52,068,486 | | | | 18,180,474 | | |
Net unrealized appreciation
on investments | | | (2,088,323 | ) | | | 178,724,106 | | | | 400,096,551 | | | | 91,516,610 | | | | 4,548,768 | | |
Distributable ordinary income
(as of 6/30/2006) | | | 5,169,534 | | | | 31,078,422 | | | | 17,178,600 | | | | 17,398,709 | | | | 905,438 | | |
Distributable long-term gains
(as of 6/30/2006) | | | 4,233,234 | | | | 133,929,539 | | | | 308,193,350 | | | | 47,139,845 | | | | 10,388,334 | | |
| Total distributable earnings | | | 9,402,768 | | | | 165,007,961 | | | | 325,371,950 | | | | 64,538,554 | | | | 11,293,772 | | |
| Other accumulated losses | | | — | | | | — | | | | — | | | | — | | | | — | | |
| Total accumulated earnings | | | 7,314,445 | | | | 343,732,067 | | | | 725,468,501 | | | | 156,055,164 | | | | 15,842,540 | | |
(a) Any differences between book and tax cost are due primarily to wash sale losses.
On the Statements of Assets and Liabilities, the following adjustments were made for permanent tax adjustments:
| | | Undistributed
Net Realized
Gain on securities | | Undistributed
Net Investment
Income | | Paid in
Capital | |
| Core Value | | $ | 1 | | | $ | (1 | ) | | $ | — | | |
| Large Cap Value | | | 4,769,942 | | | | (4,769,943 | ) | | | 1 | | |
| Mid-Cap Value | | | | | | | (1,780,567 | ) | | | 1,780,567 | | |
| Small Cap Value | | | (261,273 | ) | | | (306,183 | ) | | | 567,456 | | |
| All Cap Value | | | (514,509 | ) | | | 282,116 | | | | 232,393 | | |
The permanent differences primarily relate to the long term capital gains character of dividend income received from REIT securities.
The tax components of distributions paid during the fiscal years ended June 30, 2006 and 2005, capital loss carryovers as of June 30, 2006 and tax basis post-October losses as of June 30, 2006, which are not recognized for tax purposes until the first day of the following fiscal year, are:
| | | June 30, 2006 | | June 30, 2005 | |
| | | Ordinary
Income
Distributions | | Long-Term
Capital Gains
Distributions | | Net Capital
Loss
Carryovers | | Post-October
Losses | | Ordinary
Income
Distributions | | Long-Term
Capital Gains
Distributions | |
| Core Value | | $ | 2,813,372 | | | $ | 1,934,386 | | | | — | | | | — | | | $ | 103,624 | | | | — | | |
| Large Cap Value | | | 45,903,198 | | | | 113,807,789 | | | | — | | | | — | | | | 9,315,651 | | | $ | 2,540,185 | | |
| Mid-Cap Value | | | 35,465,145 | | | | 238,296,089 | | | | — | | | | — | | | | 66,107,430 | | | | 26,870,354 | | |
| Small Cap Value | | | 13,770,674 | | | | 93,812,246 | | | | — | | | | — | | | | 18,869,699 | | | | 72,035,388 | | |
| All Cap Value | | | 2,516,903 | | | | 8,456,218 | | | | — | | | | — | | | | 330,784 | | | | 131,279 | | |
NOTE 4.
Capital Share Transactions. Transactions in capital shares for each class were as follows:
| | | For the Year Ended
June 30, 2006 | | For the Period
August 30, 2004* to
June 30, 2005 | |
| Core Value Fund — Class I | | Shares | | Dollar
Amount | | Shares | | Dollar
Amount | |
| Shares sold | | | 59,231,744 | | | $ | 765,972,686 | | | | 3,504,513 | | | $ | 37,075,791 | | |
Shares issued upon reinvestment of dividends
and distributions | | | 134,818 | | | | 1,749,939 | | | | 8,113 | | | | 91,190 | | |
| Total issued | | | 59,366,562 | | | | 767,722,625 | | | | 3,512,626 | | | | 37,166,981 | | |
| Shares redeemed | | | (2,784,758 | ) | | | (36,168,882 | ) | | | (533,165 | ) | | | (6,149,463 | ) | |
| Net increase | | | 56,581,804 | | | $ | 731,553,743 | | | | 2,979,461 | | | $ | 31,017,518 | | |
* Commencement of operations.
33
| | | For the Year Ended
June 30, 2006 | | For the Period
August 30, 2004* to
June 30, 2005 | |
| Core Value Fund — Class A | | Shares | | Dollar
Amount | | Shares | | Dollar
Amount | |
| Shares sold | | | 57,985,211 | | | $ | 742,196,777 | | | | 1,797,323 | | | $ | 21,033,643 | | |
Shares issued upon reinvestment of dividends
and distributions | | | 154,569 | | | | 2,001,662 | | | | 279 | | | | 3,131 | | |
| Total issued | | | 58,139,780 | | | | 744,198,439 | | | | 1,797,602 | | | | 21,036,774 | | |
| Shares redeemed | | | (7,332,846 | ) | | | (95,269,869 | ) | | | (29,006 | ) | | | (333,856 | ) | |
| Net increase | | | 50,806,934 | | | $ | 648,928,570 | | | | 1,768,596 | | | $ | 20,702,918 | | |
| | | For the Year Ended
June 30, 2006 | | For the Period
August 30, 2004* to
June 30, 2005 | |
| Core Value Fund — Class C | | Shares | | Dollar
Amount | | Shares | | Dollar
Amount | |
| Shares sold | | | 12,424,776 | | | $ | 157,732,522 | | | | 1,289,526 | | | $ | 14,647,174 | | |
Shares issued upon reinvestment of dividends
and distributions | | | 13,734 | | | | 176,619 | | | | 42 | | | | 476 | | |
| Total issued | | | 12,438,510 | | | | 157,909,141 | | | | 1,289,568 | | | | 14,647,650 | | |
| Shares redeemed | | | (844,230 | ) | | | (10,859,009 | ) | | | (19,709 | ) | | | (206,411 | ) | |
| Net increase | | | 11,594,280 | | | $ | 147,050,132 | | | | 1,269,859 | | | $ | 14,441,239 | | |
| | | For the Year Ended
June 30, 2006 | | For the Year Ended
June 30, 2005 | |
| Large Cap Value Fund — Class I | | Shares | | Dollar
Amount | | Shares | | Dollar
Amount | |
| Shares sold | | | 52,350,606 | | | $ | 1,243,896,224 | | | | 46,200,924 | | | $ | 1,016,606,169 | | |
Shares issued upon reinvestment of dividends
and distributions | | | 2,103,004 | | | | 49,748,988 | | | | 159,050 | | | | 3,470,900 | | |
| Total issued | | | 54,453,610 | | | | 1,293,645,212 | | | | 46,359,974 | | | | 1,020,077,069 | | |
| Shares redeemed | | | (16,628,941 | ) | | | (398,214,044 | ) | | | (3,694,189 | ) | | | (80,674,090 | ) | |
| Net increase | | | 37,824,669 | | | $ | 895,431,168 | | | | 42,665,785 | | | $ | 939,402,979 | | |
| | | For the Year Ended
June 30, 2006 | | For the Year Ended
June 30, 2005 | |
| Large Cap Value Fund — Class A | | Shares | | Dollar
Amount | | Shares | | Dollar
Amount | |
| Shares sold | | | 55,205,432 | | | $ | 1,313,477,458 | | | | 97,054,995 | | | $ | 2,135,553,654 | | |
Shares issued upon reinvestment of dividends
and distributions | | | 2,699,325 | | | | 63,667,674 | | | | 221,213 | | | | 4,846,243 | | |
| Transfers in from Class B (Note 1) | | | 327,266 | | | | 7,720,216 | | | | — | | | | — | | |
| Total issued | | | 58,232,023 | | | | 1,384,865,348 | | | | 97,276,208 | | | | 2,140,399,897 | | |
| Shares redeemed | | | (35,686,964 | ) | | | (847,335,151 | ) | | | (8,480,450 | ) | | | (187,828,557 | ) | |
| Net increase | | | 22,545,059 | | | $ | 537,530,197 | | | | 88,795,758 | | | $ | 1,952,571,340 | | |
* Commencement of operations.
34
| | | For the Year Ended
June 30, 2006 | | For the Year Ended
June 30, 2005 | |
| Large Cap Value Fund — Class B | | Shares | | Dollar
Amount | | Shares | | Dollar
Amount | |
| Shares sold | | | 10,305 | | | $ | 241,549 | | | | 100,585 | | | $ | 2,158,166 | | |
Shares issued upon reinvestment of dividends
and distributions | | | — | | | | — | | | | 325 | | | | 7,123 | | |
| Total issued | | | 10,305 | | | | 241,549 | | | | 100,910 | | | | 2,165,289 | | |
| Shares redeemed | | | (34,161 | ) | | | (801,821 | ) | | | (78,058 | ) | | | (1,669,381 | ) | |
| Transfers out to Class A (Note 1) | | | (330,847 | ) | | | (7,720,216 | ) | | | — | | | | — | | |
| Total redeemed | | | (365,008 | ) | | | (8,522,037 | ) | | | (78,058 | ) | | | (1,669,381 | ) | |
| Net (decrease) increase | | | (354,703 | ) | | $ | (8,280,488 | ) | | | 22,852 | | | $ | 495,908 | | |
| | | For the Year Ended
June 30, 2006 | | For the Year Ended
June 30, 2005 | |
| Large Cap Value Fund — Class C | | Shares | | Dollar
Amount | | Shares | | Dollar
Amount | |
| Shares sold | | | 2,935,927 | | | $ | 68,830,750 | | | | 18,571,425 | | | $ | 405,128,363 | | |
Shares issued upon reinvestment of dividends
and distributions | | | 220,165 | | | | 5,129,048 | | | | 10,074 | | | | 220,618 | | |
| Total issued | | | 3,156,092 | | | | 73,959,798 | | | | 18,581,499 | | | | 405,348,981 | | |
| Shares redeemed | | | (3,841,561 | ) | | | (89,927,848 | ) | | | (602,410 | ) | | | (13,141,390 | ) | |
| Net (decrease) increase | | | (685,469 | ) | | $ | (15,968,050 | ) | | | 17,979,089 | | | $ | 392,207,591 | | |
| | | For the Year Ended
June 30, 2006 | | For the Year Ended
June 30, 2005 | |
| Large Cap Value Fund — Class R | | Shares | | Dollar
Amount | | Shares | | Dollar
Amount | |
| Shares sold | | | 2,857,275 | | | $ | 68,361,274 | | | | 1,104,052 | | | $ | 24,475,697 | | |
Shares issued upon reinvestment of dividends
and distributions | | | 37,610 | | | | 893,766 | | | | 1,202 | | | | 26,558 | | |
| Total issued | | | 2,894,885 | | | | 69,255,040 | | | | 1,105,254 | | | | 24,502,255 | | |
| Shares redeemed | | | (469,356 | ) | | | (11,212,310 | ) | | | (86,931 | ) | | | (1,940,180 | ) | |
| Net increase | | | 2,425,529 | | | $ | 58,042,730 | | | | 1,018,323 | | | $ | 22,562,075 | | |
| | | For the Year Ended
June 30, 2006 | | For the Year Ended
June 30, 2005 | |
| Mid-Cap Value Fund — Class I | | Shares | | Dollar
Amount | | Shares | | Dollar
Amount | |
| Shares sold | | | 30,382,408 | | | $ | 891,900,784 | | | | 49,716,155 | | | $ | 1,305,710,893 | | |
Shares issued upon reinvestment of dividends
and distributions | | | 5,645,530 | | | | 159,429,772 | | | | 1,743,598 | | | | 46,153,023 | | |
| Total issued | | | 36,027,938 | | | | 1,051,330,556 | | | | 51,459,753 | | | | 1,351,863,916 | | |
| Shares redeemed | | | (15,225,703 | ) | | | (444,564,052 | ) | | | (9,888,454 | ) | | | (261,881,675 | ) | |
| Net increase | | | 20,802,235 | | | $ | 606,766,504 | | | | 41,571,299 | | | $ | 1,089,982,241 | | |
35
| | | For the Year Ended
June 30, 2006 | | For the Year Ended
June 30, 2005 | |
| Mid-Cap Value Fund — Class A | | Shares | | Dollar
Amount | | Shares | | Dollar
Amount | |
| Shares sold | | | 8,657,845 | | | $ | 252,505,200 | | | | 17,598,405 | | | $ | 455,504,459 | | |
Shares issued upon reinvestment of dividends
and distributions | | | 1,873,521 | | | | 52,720,863 | | | | 856,097 | | | | 22,583,811 | | |
| Transfers in from Class B (Note 1) | | | 1,208,863 | | | | 35,552,659 | | | | — | | | | — | | |
| Total issued | | | 11,740,229 | | | | 340,778,722 | | | | 18,454,502 | | | | 478,088,270 | | |
| Shares redeemed | | | (11,735,309 | ) | | | (341,132,928 | ) | | | (11,539,800 | ) | | | (303,776,127 | ) | |
| Net (decrease) increase | | | 4,920 | | | $ | (354,206 | ) | | | 6,914,702 | | | $ | 174,312,143 | | |
| | | For the Year Ended
June 30, 2006 | | For the Year Ended
June 30, 2005 | |
| Mid-Cap Value Fund — Class B | | Shares | | Dollar
Amount | | Shares | | Dollar
Amount | |
| Shares sold | | | 36,612 | | | $ | 1,056,770 | | | | 357,396 | | | $ | 9,125,585 | | |
Shares issued upon reinvestment of dividends
and distributions | | | — | | | | — | | | | 12,775 | | | | 329,592 | | |
| Total issued | | | 36,612 | | | | 1,056,770 | | | | 370,171 | | | | 9,455,177 | | |
| Shares redeemed | | | (543,334 | ) | | | (15,720,867 | ) | | | (374,333 | ) | | | (9,582,261 | ) | |
| Transfers out to Class A (Note 1) | | | (1,242,253 | ) | | | (35,552,659 | ) | | | — | | | | — | | |
| Total redeemed | | | (1,785,587 | ) | | | (51,273,526 | ) | | | (374,333 | ) | | | (9,582,261 | ) | |
| Net decrease | | | (1,748,975 | ) | | $ | (50,216,756 | ) | | | (4,162 | ) | | $ | (127,084 | ) | |
| | | For the Year Ended
June 30, 2006 | | For the Year Ended
June 30, 2005 | |
| Mid-Cap Value Fund — Class C | | Shares | | Dollar
Amount | | Shares | | Dollar
Amount | |
| Shares sold | | | 922,684 | | | $ | 25,844,270 | | | | 1,338,007 | | | $ | 33,918,020 | | |
Shares issued upon reinvestment of dividends
and distributions | | | 239,911 | | | | 6,556,768 | | | | 109,771 | | | | 2,835,387 | | |
| Total issued | | | 1,162,595 | | | | 32,401,038 | | | | 1,447,778 | | | | 36,753,407 | | |
| Shares redeemed | | | (1,424,409 | ) | | | (40,287,596 | ) | | | (730,055 | ) | | | (18,799,505 | ) | |
| Net (decrease) increase | | | (261,814 | ) | | $ | (7,886,558 | ) | | | 717,723 | | | $ | 17,953,902 | | |
| | | For the Year Ended
June 30, 2006 | | For the Year Ended
June 30, 2005 | |
| Mid-Cap Value Fund — Class R | | Shares | | Dollar
Amount | | Shares | | Dollar
Amount | |
| Shares sold | | | 284,546 | | | $ | 8,378,701 | | | | 661,661 | | | $ | 17,520,685 | | |
Shares issued upon reinvestment of dividends
and distributions | | | 16,425 | | | | 467,312 | | | | 4,171 | | | | 111,326 | | |
| Total issued | | | 300,971 | | | | 8,846,013 | | | | 665,832 | | | | 17,632,011 | | |
| Shares redeemed | | | (224,285 | ) | | | (6,565,902 | ) | | | (130,573 | ) | | | (3,065,014 | ) | |
| Net increase | | | 76,686 | | | $ | 2,280,111 | | | | 535,259 | | | $ | 14,566,997 | | |
36
| | | For the Year Ended
June 30, 2006 | | For the Year Ended
June 30, 2005 | |
| Small Cap Value Fund — Class I | | Shares | | Dollar
Amount | | Shares | | Dollar
Amount | |
| Shares sold | | | 3,907,539 | | | | $ 201,609,438 | | | | 4,742,288 | | | $ | 238,811,946 | | |
Shares issued upon reinvestment of dividends
and distributions | | | 697,962 | | | | 33,907,000 | | | | 556,041 | | | | 27,129,214 | | |
| Total issued | | | 4,605,501 | | | | 235,516,438 | | | | 5,298,329 | | | | 265,941,160 | | |
| Shares redeemed | | | (2,971,430) | | | | (153,469,718) | | | | (1,859,292 | ) | | | (93,346,697 | ) | |
| Net increase | | | 1,634,071 | | | | $ 82,046,720 | | | | 3,439,037 | | | $ | 172,594,463 | | |
| | | For the Year Ended
June 30, 2006 | | For the Year Ended
June 30, 2005 | |
| Small Cap Value Fund — Class A | | Shares | | Dollar
Amount | | Shares | | Dollar
Amount | |
| Shares sold | | | 682,714 | | | $ | 35,294,061 | | | | 846,792 | | | $ | 42,838,041 | | |
Shares issued upon reinvestment of dividends
and distributions | | | 393,692 | | | | 19,220,058 | | | | 402,976 | | | | 19,770,027 | | |
| Transfers in from Class B (Note 1) | | | 140,169 | | | | 7,688,272 | | | | — | | | | — | | |
| Total issued | | | 1,216,575 | | | | 62,202,391 | | | | 1,249,768 | | | | 62,608,068 | | |
| Shares redeemed | | | (1,804,552) | | | | (93,329,775) | | | | (1,126,982 | ) | | | (56,233,004 | ) | |
| Net (decrease) increase | | | (587,977) | | | | $(31,127,384) | | | | 122,786 | | | $ | 6,375,064 | | |
| | | For the Year Ended
June 30, 2006 | | For the Year Ended
June 30, 2005 | |
| Small Cap Value Fund — Class B | | Shares | | Dollar
Amount | | Shares | | Dollar
Amount | |
| Shares sold | | | 11,465 | | | $ | 616,120 | | | | 84,854 | | | $ | 4,113,806 | | |
Shares issued upon reinvestment of dividends
and distributions | | | — | | | | — | | | | 4,392 | | | | 207,679 | | |
| Total issued | | | 11,465 | | | | 616,120 | | | | 89,246 | | | | 4,321,485 | | |
| Shares redeemed | | | (117,095) | | | | (6,273,530 | ) | | | (65,138 | ) | | | (3,158,675 | ) | |
| Transfers out to Class A (Note 1) | | | (146,168 | ) | | | (7,688,272 | ) | | | — | | | | — | | |
| Total redeemed | | | (263,263 | ) | | | (13,961,802 | ) | | | (65,138 | ) | | | (3,158,675 | ) | |
| Net (decrease) increase | | | (251,798 | ) | | $ | (13,345,682 | ) | | | 24,108 | | | $ | 1,162,810 | | |
| | | For the Year Ended
June 30, 2006 | | For the Year Ended
June 30, 2005 | |
| Small Cap Value Fund — Class C | | Shares | | Dollar
Amount | | Shares | | Dollar
Amount | |
| Shares sold | | | 86,299 | | | | $ 4,179,367 | | | | 104,812 | | | $ | 5,020,102 | | |
Shares issued upon reinvestment of dividends
and distributions | | | 18,055 | | | | 839,733 | | | | 17,983 | | | | 851,146 | | |
| Total issued | | | 104,354 | | | | 5,019,100 | | | | 122,795 | | | | 5,871,248 | | |
| Shares redeemed | | | (181,066) | | | | (8,804,764) | | | | (102,329 | ) | | | (4,876,719 | ) | |
| Net (decrease) increase | | | (76,712) | | | | $(3,785,664) | | | | 20,466 | | | $ | 994,529 | | |
37
| | | For the Year Ended
June 30, 2006 | | For the Year Ended
June 30, 2005 | |
| All Cap Value Fund — Class I | | Shares | | Dollar
Amount | | Shares | | Dollar
Amount | |
| Shares sold | | | 407,172 | | | $ | 8,341,731 | | | | 1,741,043 | | | $ | 32,367,226 | | |
Shares issued upon reinvestment of dividends
and distributions | | | 132,073 | | | | 2,577,971 | | | | 8,009 | | | | 154,249 | | |
| Total issued | | | 539,245 | | | | 10,919,702 | | | | 1,749,052 | | | | 32,521,475 | | |
| Shares redeemed | | | (146,770 | ) | | | (2,969,485 | ) | | | (380,879 | ) | | | (7,124,203 | ) | |
| Net increase | | | 392,475 | | | $ | 7,950,217 | | | | 1,368,173 | | | $ | 25,397,272 | | |
| | | For the Year Ended
June 30, 2006 | | For the Year Ended
June 30, 2005 | |
| All Cap Value Fund — Class A | | Shares | | Dollar
Amount | | Shares | | Dollar
Amount | |
| Shares sold | | | 1,211,905 | | | $ | 24,809,433 | | | | 4,165,696 | | | $ | 79,595,327 | | |
Shares issued upon reinvestment of dividends
and distributions | | | 167,351 | | | | 3,276,366 | | | | 7,700 | | | | 148,838 | | |
| Total issued | | | 1,379,256 | | | | 28,085,799 | | | | 4,173,396 | | | | 79,744,165 | | |
| Shares redeemed | | | (2,135,896 | ) | | | (42,831,350 | ) | | | (713,504 | ) | | | (13,055,881 | ) | |
| Net (decrease) increase | | | (756,640 | ) | | $ | (14,745,551 | ) | | | 3,459,892 | | | $ | 66,688,284 | | |
| | | For the Year Ended
June 30, 2006 | | For the Year Ended
June 30, 2005 | |
| All Cap Value Fund — Class C | | Shares | | Dollar
Amount | | Shares | | Dollar
Amount | |
| Shares sold | | | 513,526 | | | $ | 10,352,915 | | | | 2,332,893 | | | $ | 43,913,633 | | |
Shares issued upon reinvestment of dividends
and distributions | | | 56,046 | | | | 1,078,502 | | | | 1,948 | | | | 37,124 | | |
| Total issued | | | 569,572 | | | | 11,431,417 | | | | 2,334,841 | | | | 43,950,757 | | |
| Shares redeemed | | | (721,727 | ) | | | (14,200,909 | ) | | | (263,054 | ) | | | (4,720,362 | ) | |
| Net (decrease) increase | | | (152,155 | ) | | $ | (2,769,492 | ) | | | 2,071,787 | | | $ | 39,230,395 | | |
NOTE 5.
Restatement. Returns of capital on distributions received from REIT securities held in the portfolios of the Mid-Cap Value Fund, Small Cap Value Fund, and All Cap Value Fund were incorrectly classified in prior years by recording them as income rather than as an adjustment to the cost of the security. This misclassification had no impact on amounts previously reported for net asset value, distributions paid, amounts of taxable income reported to shareholders, total return, portfolio turnover rate, security valuation, or net change in net assets from operations. These financial statements have been restated to correct the classification of the amounts reported for net investment income, net realized gain and change in unrealized appreciation on investments in the Statement of Changes in Net Assets for the year ended June 30, 2005, and for the net inve stment income per share, net gains (losses) on securities (both realized and unrealized) per share, and the ratio of net investment income to average net assets for the years ended prior to June 30, 2006 in the Financial Highlights. Net investment income per share for all prior periods has been calculated based on average shares outstanding during each period to conform with the calculation method used for the year ended June 30, 2006.
The amounts before and after the restatement are shown in the table below:
| | | Mid-Cap Value Fund | | Small Cap Value Fund | | All Cap Value Fund | |
Statements of Changes in Net Assets
Year ended June 30, 2005 | | As originally
reported | | Restated | | As originally
reported | | Restated | | As originally
reported | | Restated | |
| Net investment income (loss) | | $ | 10,510,738 | | | $ | 5,521,703 | | | $ | (765,510 | ) | | $ | (1,972,163 | ) | | $ | 1,075,501 | | | $ | 601,010 | | |
| Net realized gain on securities | | | 174,658,626 | | | | 175,224,490 | | | | 101,427,721 | | | | 101,952,392 | | | | 4,671,291 | | | | 4,797,099 | | |
Net change in unrealized appreciation
of securities | | | 339,850,340 | | | | 344,273,511 | | | | 20,274,853 | | | | 20,956,835 | | | | 18,485,721 | | | | 18,834,404 | | |
Net increase in net assets resulting
from operations | | $ | 525,019,704 | | | $ | 525,019,704 | | | $ | 120,937,064 | | | $ | 120,937,064 | | | $ | 24,232,513 | | | $ | 24,232,513 | | |
| Undistributed net investment income | | $ | 6,141,951 | | | $ | 4,098,614 | | | $ | 574,723 | | | $ | — | | | $ | 838,996 | | | $ | 593,599 | | |
38
| Mid-Cap Value Fund | | | | Class I | | Class A | | Class C | | Class R | |
| Financial Highlights | | Year/Period
Ended | | As originally
reported | | Restated | | As originally
reported | | Restated | | As originally
reported | | Restated | | As originally
reported | | Restated | |
Net investment
income per share | | | 2005 | | | $ | 0.11 | | | $ | 0.10 | | | $ | 0.07 | | | $ | 0.04 | | | $ | (0.11 | ) | | $ | (0.15 | ) | | $ | 0.03 | | | $ | (0.05 | ) | |
| | | | 2004 | | | | 0.06 | | | | 0.11 | | | | 0.03 | | | | 0.06 | | | | (0.03 | ) | | | (0.11 | ) | | | 0.08 | | | | 0.02 | | |
| | | | 2003 | | | | 0.09 | | | | 0.13 | | | | 0.05 | | | | 0.09 | | | | (0.01 | ) | | | (0.02 | ) | | | | | | | | | |
| | | | 2002 | | | | 0.11 | | | | 0.13 | | | | 0.11 | | | | 0.07 | | | | 0.02 | | | | (0.03 | ) | | | | | | | | | |
Net gains (losses)
on securities (both
realized and unrealized)
per share | | | 2005 | | | | 4.82 | | | | 4.83 | | | | 4.78 | | | | 4.81 | | | | 4.66 | | | | 4.70 | | | | 4.81 | | | | 4.89 | | |
| | | | 2004 | | | | 7.24 | | | | 7.19 | | | | 7.18 | | | | 7.15 | | | | 6.97 | | | | 7.05 | | | | 5.78 | | | | 5.84 | | |
| | | | 2003 | | | | 0.93 | | | | 0.89 | | | | 0.94 | | | | 0.90 | | | | 0.86 | | | | 0.87 | | | | | | | | | | |
| | | | 2002 | | | | 0.68 | | | | 0.66 | | | | 0.66 | | | | 0.70 | | | | 0.62 | | | | 0.67 | | | | | | | | | | |
Ratio of net investment
income to average
net assets | | | 2005 | | | | 0.56 | % | | | 0.36 | % | | | 0.31 | % | | | 0.16 | % | | | (0.43 | )% | | | (0.58 | )% | | | 0.05 | % | | | (0.18 | )% | |
| | | | 2004 | | | | 0.55 | | | | 0.50 | | | | 0.30 | | | | 0.25 | | | | (0.45 | ) | | | (0.50 | ) | | | 0.16 | | | | 0.10 | | |
| | | | 2003 | | | | 0.88 | | | | 0.84 | | | | 0.63 | | | | 0.60 | | | | (0.12 | ) | | | (0.15 | ) | | | | | | | | | |
| | | | 2002 | | | | 0.94 | | | | 0.89 | | | | 0.69 | | | | 0.60 | | | | (0.07 | ) | | | (0.13 | ) | | | | | | | | | |
| Small Cap Value Fund | | | | Class I | | Class A | | Class C | | | |
| Financial Highlights | | Year/Period
Ended | | As originally
reported | | Restated | | As originally
reported | | Restated | | As originally
reported | | Restated | | | | | |
Net investment
income per share | | | 2005 | | | $ | (0.02 | ) | | $ | (0.08 | ) | | $ | (0.14 | ) | | $ | (0.20 | ) | | $ | (0.49 | ) | | $ | (0.56 | ) | | | | | | | | | |
| | | | 2004 | | | | 0.07 | | | | (0.06 | ) | | | (0.01 | ) | | | (0.17 | ) | | | (0.24 | ) | | | (0.50 | ) | | | | | | | | | |
| | | | 2003 | | | | 0.08 | | | | 0.05 | | | | (0.11 | ) | | | (0.02 | ) | | | (0.14 | ) | | | (0.24 | ) | | | | | | | | | |
| | | | 2002 | | | | 0.07 | | | | 0.10 | | | | 0.20 | | | | (0.04 | ) | | | (0.04 | ) | | | (0.26 | ) | | | | | | | | | |
Net gains (losses)
on securities (both
realized and unrealized)
per share | | | 2005 | | | | 9.30 | | | | 9.36 | | | | 9.34 | | | | 9.40 | | | | 9.01 | | | | 9.08 | | | | | | | | | | |
| | | | 2004 | | | | 16.77 | | | | 16.90 | | | | 16.87 | | | | 17.03 | | | | 16.39 | | | | 16.65 | | | | | | | | | | |
| | | | 2003 | | | | 2.69 | | | | 2.72 | | | | 2.85 | | | | 2.76 | | | | 2.58 | | | | 2.68 | | | | | | | | | | |
| | | | 2002 | | | | 5.33 | | | | 5.30 | | | | 5.26 | | | | 5.50 | | | | 2.91 | | | | 3.13 | | | | | | | | | | |
Ratio of net investment
income to average
net assets | | | 2005 | | | | 0.03 | % | | | (0.16 | )% | | | (0.24 | )% | | | (0.40 | )% | | | (0.99 | )% | | | (1.15 | )% | | | | | | | | | |
| | | | 2004 | | | | (0.04 | ) | | | (0.12 | ) | | | (0.29 | ) | | | (0.37 | ) | | | (1.04 | ) | | | (1.13 | ) | | | | | | | | | |
| | | | 2003 | | | | 0.36 | | | | 0.18 | | | | 0.11 | | | | (0.07 | ) | | | (0.64 | ) | | | (0.82 | ) | | | | | | | | | |
| | | | 2002 | | | | 0.49 | | | | 0.35 | | | | 0.24 | | | | (0.34 | ) | | | (0.51 | ) | | | (1.72 | ) | | | | | | | | | |
| All Cap Value Fund | | | | Class I | | Class A | | Class C | | | |
| Financial Highlights | | Year/Period
Ended | | As originally
reported | | Restated | | As originally
reported | | Restated | | As originally
reported | | Restated | | | | | |
Net investment
income per share | | | 2005 | | | $ | 0.15 | | | $ | 0.16 | | | $ | 0.11 | | | $ | 0.11 | | | $ | 0.05 | | | $ | (0.02 | ) | | | | | | | | | |
| | | | 2004 | | | | 0.03 | | | | 0.00 | | | | 0.01 | | | | (0.04 | ) | | | (0.04 | ) | | | (0.14 | ) | | | | | | | | | |
| | | | 2003 | | | | 0.01 | | | | 0.02 | | | | 0.03 | | | | 0.02 | | | | | | | | | | | | | | | | | | |
Net gains (losses)
on securities (both
realized and unrealized)
per share | | | 2005 | | | | 3.28 | | | | 3.27 | | | | 3.28 | | | | 3.28 | | | | 3.15 | | | | 3.22 | | | | | | | | | | |
| | | | 2004 | | | | 4.43 | | | | 4.46 | | | | 4.48 | | | | 4.53 | | | | 2.61 | | | | 2.71 | | | | | | | | | | |
| | | | 2003 | | | | 2.57 | | | | 2.56 | | | | 2.59 | | | | 2.60 | | | | | | | | | | | | | | | | | | |
Ratio of net investment
income to average
net assets | | | 2005 | | | | 1.21 | % | | | 0.88 | % | | | 1.01 | % | | | 0.61 | % | | | 0.25 | % | | | (0.14 | )% | | | | | | | | | |
| | | | 2004 | | | | 0.32 | | | | 0.03 | | | | 0.07 | | | | (0.22 | ) | | | (0.60 | ) | | | (0.96 | ) | | | | | | | | | |
| | | | 2003 | | | | 0.47 | | | | 0.40 | | | | 0.47 | | | | 0.40 | | | | | | | | | | | | | | | | | | |
39
NOTE 6.
Indemnifications. Under the Trust's organizational documents, its officers and Trustees are indemnified against certain liability arising out of the performance of their duties to the Funds. In addition, in the normal course of business the Trust enters into contracts that contain a variety of representations and warranties, which provide general indemnifications. The Funds' maximum exposure under these arrangements is unknown, as this would involve future claims that may be made against the Funds. However, the Funds expect the risk of loss to be remote.
NOTE 7.
Federal Tax Disclosure (Unaudited). For the year ended June 30, 2006, the following percent of ordinary distributions paid qualifies for the dividend received deduction available to corporate shareholders: Large Cap Value Fund — 100%, Mid-Cap Value Fund — 65%, Small Cap Value Fund — 36%, All Cap Value Fund — 56%, Core Value Fund — 100%. For the fiscal year ended June 30, 2006, the following percentages of ordinary distributions paid are designated as qualified income under the Jobs and Growth Tax Relief Reconciliation Act of 2003: Large Cap Value Fund — 100%, Mid-Cap Value Fund — 66%, Small Cap Value Fund — 43%, All Cap Value Fund — 62%, Core Value Fund — 100%. Shareholders should consult their tax advisors.
Additional Information Applicable to Foreign Shareholders Only. For the year ended June 30, 2006, the funds designate the following percent of ordinary distributions paid as interest-related dividends under Internal Revenue Code Section 871(k)(1)(c): Large Cap Value Fund — 4%, Mid-Cap Value Fund — 3%, Small Cap Value Fund — 2%, All Cap Value Fund — 4%, Core Value Fund — 5%. For the fiscal year ended June 30, 2006, the following percentages of its ordinary income distributions paid are designated as short-term capital gain distributions under the Internal Revenue Code Section 871(k)(2)(c): Large Cap Value Fund — 9%, Mid-Cap Value Fund — 64%, Small Cap Value Fund — 87%, All Cap Value Fund — 0%, Core Value Fund — 9%.
NOTE 8.
Subsequent Event. Effective August 29, 2006, Class C shares are automatically converted to Class A approximately eight years after purchase and will then be subject to lower distribution and service fees.
40
Report of Independent Registered Public Accounting Firm
To the Board of Trustees and Shareholders
of Hotchkis and Wiley Funds
In our opinion, the accompanying statements of assets and liabilities, including the schedules of investments, and the related statements of operations and changes in net assets and the financial highlights present fairly, in all material respects, the financial position of each of the Funds constituting the Hotchkis and Wiley Funds (hereafter referred to as "Funds") at June 30, 2006, the results of each of their operations for the year then ended, the changes in each of their net assets for each of the years in the two year period then ended and their financial highlights for each of the periods presented, in conformity with accounting principles generally accepted in the United States of America. These financial statements and financial highlights (hereafter referred to as the "financial statements") are the responsibility of the Funds' management; our responsibility is to express an opinion on these financial statements based on our audits. We conducted our audits of these financial statements in accordance with the standards of the Public Company Accounting Oversight Board (United States). Those standards require that we plan and perform the audits to obtain reasonable assurance about whether the financial statements are free of material misstatement. An audit includes examining, on a test basis, evidence supporting the amounts and disclosures in the financial statements, assessing the accounting principles used and significant estimates made by management, and evaluating the overall financial statement presentation. We believe that our audits, which included confirmation of securities owned at June 30, 2006 by correspondence with the custodian and brokers, provide a reasonable basis for our opinion.
As discussed in Note 5 to the financial statements, the financial statements for the Hotchkis and Wiley Mid-Cap Value Fund, Small Cap Value Fund, and All Cap Value Fund have been restated for the periods ended prior to 2006.
PricewaterhouseCoopers LLP
Los Angeles, California
August 23, 2006
41
Board Considerations In Approving Continuation Of Investment Advisory Agreements
Background and Approval Process. Hotchkis and Wiley Capital Management LLC (the "Advisor") serves as investment adviser to the Hotchkis and Wiley Large Cap Value Fund, the Hotchkis and Wiley Mid-Cap Value Fund, the Hotchkis and Wiley Small Cap Value Fund, the Hotchkis and Wiley All Cap Value Fund and the Hotchkis and Wiley Core Value Fund, respectively (each a "Fund") pursuant to separate investment advisory agreements (the "Advisory Agreements") with the Hotchkis and Wiley Funds (the "Trust") that were initially approved by the Board of Trustees at the inception of each Fund. The Advisory Agreements are for two-year terms and continue thereafter if approved annually by the Trustees, including a majority of the Trustees who are not "interested persons" of the Trust (as defined in the Investment Company Act of 1940, as amended (the "1940 Act")) (the " Independent Trustees"), cast in person at a meeting called for the purpose of voting on the Advisory Agreements. The Advisory Agreements for each Fund were most recently considered by the Board at a meeting held on May 17, 2006.
As part of the annual contract review process, the Independent Trustees, through their independent legal counsel, requested and received extensive materials, including information relating to (i) the nature, extent and quality of services provided by the Advisor, including compliance with legal requirements, (ii) short-term and long-term performance of each class of each Fund relative to appropriate peer groups selected by an independent third party, their Lipper fund category and market indices, (iii) the costs of the services provided and the Advisor's profitability with respect to the management of each Fund, (iv) the extent to which the Advisor has in the past or is likely in the future to experience economies of scale in connection with the investment advisory services it provides to each Fund, (v) the expense ratios of each class of each Fund as compared with the expense ratios of their peer group and their Lipper fund cat egory and (vi) any benefits to the Advisor and its affiliates from its relationship with the Funds. The Independent Trustees noted that the information provided by the Advisor was thorough and responsive to their request. The information provided in response to this specific request supplemented information received by the Board throughout the year, both in writing and in meetings, regarding the Funds, including Fund performance, expense ratios, portfolio composition and regulatory compliance. The Independent Trustees also reviewed and discussed with independent legal counsel prior to the meeting a legal memorandum discussing, among other things, the duties of directors/trustees under the 1940 Act and relevant state law in reviewing and approving investment advisory contracts.
Two weeks prior to the Board meeting, the Independent Trustees held a conference call with their independent legal counsel to review the materials provided by the Advisor and an independent third party, and consequently supplemented their information request with additional questions for the Advisor. At the Board meeting, representatives of the Advisor made a presentation to the Trustees and responded to their questions. After the presentation and after reviewing the written materials provided by the Advisor and the independent third party, the Independent Trustees met privately with their independent legal counsel to consider the renewal of the Advisory Agreements. The Trustees considered the factors set out in case law and identified by the Securities and Exchange Commission as most relevant in considering the renewal of investment advisory agreements. The Trustees considered these and other factors, as summarized in more deta il below, and concluded that the terms of each Advisory Agreement are fair and reasonable and the continuance of each Agreement is in the best interests of each Fund. No single factor was determinative in the Board's analysis.
Nature, Extent and Quality of Services: As part of the Board's decision-making process, the Trustees noted that the Advisor and its predecessors have managed the Funds and their predecessors since their inception, and the Trustees believe that a long-term relationship with a capable, conscientious investment adviser is in the best interests of the Funds. The Board also considered that shareholders invest in a Fund knowing that the Advisor manages the portfolio and knowing the advisory fee that is paid by the Fund. In this connection, the Trustees considered, in particular, whether each Fund is managed in accordance with its investment objective and policies as disclosed to shareholders. The Trustees concluded that each Fund is managed consistent with its investment objective and policies.
The Trustees reviewed information regarding various services provided by the Advisor to the Funds, including an organizational chart and background information on personnel performing such services. The Trustees also reviewed each Fund's performance and information regarding the Advisor's investment program, which is driven by team-oriented, in-depth, fundamental research. The Trustees considered the depth and quality of the Advisor's investment process and stock-picking expertise, the very low turnover rates of the Advisor's key personnel, the overall stability of the Advisor's organization, and the experience, capability and integrity of its senior management. The Trustees reviewed the Advisor's compliance program and commitment to a rigorous compliance effort and the resultant compliance by the Funds with legal requirements. The Trustees also considered the Advisor's ongoing improvements to its business, including the additio n of key personnel and continuing investments in technology, such as the purchase of a client service infrastructure system, the launch and expansion of a website and the acquisition of a phone system with call center capabilities for the Funds.
42
The Trustees also considered other non-advisory services provided to the Funds, such as the services of Advisor employees as officers and other personnel provided that are necessary for Fund operations. The Trustees particularly noted that the services of the Trust's Chief Compliance Officer are provided to the Funds at no cost to the Funds, and that the Advisor had increased its compliance staff in response to a more challenging regulatory environment. The Trustees noted that the Advisor organizes Board meetings and the preparation of Board meeting materials, and oversees and manages the other Fund service providers. The Trustees further noted that in 2005, the Advisor had negotiated relationships with a new administrator that resulted in cost savings to the Funds.
Based on their review, the Trustees concluded that the nature, extent and quality of services provided (and expected to be provided) to each Fund under the Advisory Agreement were of a high level and were very satisfactory.
Investment Performance of the Funds and the Advisor: The Trustees review data on the short-term and long-term performance of the Funds in connection with each quarterly Board meeting. For the May 17, 2006 contract review meeting, the Trustees also received —in mid-April — and reviewed a report prepared by the Trust's administrator based on information compiled from an independent provider of data to mutual fund boards (the "Report") that compared the performance of each class of each Fund to that of a small group of comparable funds that are similar in terms of investment classification, asset size, load type and primary distribution channel ("Peer Funds") , and to the most comparable Lipper index, for several time periods. This data was as of December 31, 2005, and performance information through March 2006 was provided as well.
The Board considered that: (i) each class of the Large Cap Value Fund for each period covered in the Report other than the one-year period had the highest annual returns of its Peer Group, and for the one-year period was above or near the median, and also significantly out-performed the Lipper Equity Income Fund index for each period other than the one-year period, for which the Fund's performance was near that of the index, (ii) each class of the Mid-Cap Value Fund had the highest annual returns of its Peer Group for each period covered in the Report and also significantly out-performed the Lipper Mid-Cap Value Fund index for each period covered in the Report, other than the one-year period, for which each class out-performed the index and out-performed the Peer Group median, (iii) each class of the Small Cap Value Fund had the highest annual returns of its Peer Group for each period covered in the Report other than the one-yea r period, for which each class out-performed the median, and also significantly out-performed the Lipper Small Cap Value Fund index for each period covered in the Report, (iv) each class of the All Cap Value Fund had the highest annualized returns of its Peer Group for the three-year period, had near median performance for the two-year period, and for the one-year period, under-performed the Peer Group, Class A and Class I shares equaled or exceeded the Lipper Multi-Cap Value Fund index for each period covered in the Report, and Class C shares slightly under-performed the index for the one- and two-year period, but significantly out-performed the index for the three-year period, and (v) each class of the Core Value Fund out-performed its Peer Group median and performed near that of the Lipper Multi-Cap Value Fund index for the one-year period (noting that the Fund's inception date was August 30, 2004). The Trustees also considered each Fund's short-term and long-term performance versus appropriate benchmark indices.
The Trustees concluded that the performance of the Funds was very good and consistent with each Fund's investment objective and investment style.
Fees, Expenses and Profitability: The Trustees reviewed information provided by the Advisor and data contained in the Report regarding the Funds' advisory fees and expense ratios, including information regarding any expense caps for the Funds. The Trustees reviewed the Report showing how the Funds' advisory fees and expense ratios compared to those of their Peer Group as well as a competitive universe of funds. The Trustees also reviewed information provided by the Advisor on advisory fees charged by the Advisor for subadvisory services it provides to other mutual funds and advisory fees it charges to its separate account clients with investment objectives and policies similar to those of the Funds. The Trustees considered a list of the many additional functions performed for the Funds that the Advisor does not perform for its separate account and su badvisory clients. The Trustees noted that the Advisor's standard fee schedules for its institutional clients have increased over time and currently are higher than the fees charged to the Small Cap Value Fund and the All Cap Value Fund. The Trustees also noted that, in addition to providing more services and having higher costs for the Funds, it is generally acknowledged that managing mutual funds subjects an investment adviser to more legal and regulatory risk than is the case with separate accounts.
With respect to the advisory fee and expense ratios (by class) for the Large Cap Value Fund, the Trustees noted that the Report showed them to be generally among the higher fees within its Peer Group and among equity income funds within the Lipper universe, but the Trustees noted that the Fund had very good one-year and excellent long-term performance. The Trustees also noted that the Lipper universe aggregated data all for share classes so that the Advisor believed it was not indicative of the reasonableness of the Funds' expense ratios. With respect to the advisory fee and expense ratios (by class) for the Mid-Cap Value Fund, the Trustees noted that the Report showed the advisory fee generally to be among the higher fees within the Fund's Peer Group and among mid-cap value funds
43
within the Lipper universe, while the expense ratios for each class were above the median of the Peer Group but in the first or second quartile for the Lipper universe, except for Class C shares, for which the expense ratio was in the third quartile of the Lipper universe; the Trustees noted that the Mid-Cap Value Fund had very good one-year and excellent long-term performance. With respect to the advisory fee and expense ratios (by class) for the Small Cap Value Fund, the Trustees noted that the Report showed them generally to be in the mid-range among both the Fund's Peer Group and among small cap value funds within the Lipper universe, and the Trustees also noted that the Fund had very good one-year and excellent long-term performance. With respect to the advisory fee and expense ratios (by class) for the All Cap Value Fund, the Trustees noted that the Report showed them generally to be near the median of the Fund's Peer Grou p and in the mid- to upper range among the multi-cap value funds within the Lipper universe, with the expense ratios of each class other than Class C in the second quartile of the Lipper universe, and the Trustees also noted that the Fund had acceptable one-year performance and excellent three-year performance. With respect to the advisory fee and expense ratios (by class) for the Core Value Fund, the Trustees noted that the Report showed them to be lower than the median of the Fund's Peer Group and generally in the mid- to upper range of the multi-cap value funds within the Lipper universe, taking the expense caps into consideration, and the Trustees also noted that the Fund had excellent one-year performance. Based on their review, the Trustees concluded that the advisory fee and expense ratios were fair and reasonable for each Fund.
The Trustees reviewed information concerning profitability to the Advisor under the Advisory Agreements, including information regarding the methodology for allocating expenses. The Trustees reviewed data regarding the Advisor's variable expenses, fixed expenses, anticipated material variances expected in 2006 and impact of the expense caps (i.e., Fund costs absorbed by the Advisor that are above the expense caps agreed to by the Advisor, which currently are reached only by the Core Value Fund). The Trustees concluded that the Advisor's allocation methods appeared reasonable. The Trustees also recognized that individual fund or product line profitability of other advisers is generally not publicly available, and that profitability may be affected by numerous factors, so that the comparability of profitability among advisory firms is limited. The Trustees noted the importance of the Advisor's profitability — which is derived solely from investment management fees — in maintaining its entrepreneurial environment in a private, primarily employee-owned structure. They noted that the Advisor's compensation/profit structure facilitates retention of its management and investment professionals. They also noted that the Advisor has voluntarily limited growth of assets by closing the Funds to new investors and by not taking on new separate account clients in these strategies. The Trustees noted that these actions were financially disadvantageous to the Advisor, and illustrated a commitment to act in the best interests of Fund shareholders. The Trustees concluded that the level of profitability to the Advisor under the Advisory Agreements appeared to be a fair entrepreneurial profit.
Economies of Scale and Whether Fee Levels Reflect These Economies of Scale: The Trustees noted that the Advisor had determined to close each Fund to new investors (with limited exceptions), as well as cease new institutional accounts in four of the five investment styles, to enable the Advisor to maintain investment flexibility, and that this decision limited the Advisor's revenue. The Trustees also considered information regarding the investment, compliance and client service personnel who have been hired and the systems upgrade. The Trustees noted increased costs planned by the Advisor in 2006 that will benefit Fund shareholders. They were advised that these represent the reinvestment of savings from economies of scale generated by the Advisor's operations.
The Trustees recognized the position taken by the Advisor that, to the extent economies of scale exist, current levels of advisory fees reflect these economies of scale in light of the limited profit potential due to maintaining limits on the Funds' size as well as the costs associated with the high quality, in-depth research that the Advisor provides. The Trustees also are cognizant of the Advisor's position that its advisory fees provide it with sufficient revenue to enable it to close the Funds when they reach an appropriate size.
Having taken these factors into account, the Trustees concluded that the Funds' shareholders share in reduced costs experienced by the Advisor through the additional services, investment in talented employees and capital improvements provided by the Advisor. The Trustees noted that while breakpoints to an advisory fee are one way for the benefits of economies of scale to be shared with investors, other methods of sharing might also be considered if the Funds continue to produce additional economies of scale. The Independent Trustees requested that the Advisor consider what additional actions it might recommend in the event the Funds further develop economies of scale.
Indirect Benefits to the Advisor from its Relationship to the Funds: The Trustees considered information regarding any indirect benefits to the Advisor that could be identified from its relationship to the Funds. In particular, the Trustees considered any benefits from soft dollar arrangements. The Trustees noted that, while the Advisor does not use the Funds' commissions to pay for third party research, the Advisor does receive proprietary research from brokers that execute Fund trades. The Trustees noted that the proprietary research received was "bundled" with the commission cost and that, while the Advisor's profitability might be somewhat lower were it to have to pay for this research with hard dollars, the bundled research services provide valuable information or service to the investment research process, which benefits the Funds (as well as t he Advisor's other clients). The Trustees also noted that the commissions paid by the Funds are generally quite low.
44
INDEPENDENT TRUSTEES
| Name and Year of Birth | | Position
Held with the
Trust | | Term of
Office1 and
Length of
Time Served | | Principal Occupation(s) During
Past Five Years | | Number of
Portfolios in
Fund Complex
overseen by
Trustee | | Public
Directorships | |
Randall H. Breitenbach
(born 1960) | | Trustee | | Trustee since 2001 | | Co-Founder, Director and CEO, BreitBurn Energy Company LP (1988 — present); Chairman, Finance Committee, Stanford University PIC Endowment (1999 — present). | | 1 registered investment company consisting of 5 portfolios | | None | |
|
Robert L. Burch III
(born 1934) | | Trustee | | Trustee since 2001 | | Managing Partner, A.W. Jones Co. (investments) (1984 — present); Chairman, Jonathan Mfg. Corp. (slide manufacturing) (1977 — 2004). | | 1 registered investment company consisting of 5 portfolios | | None | |
|
Marcy Elkind Ph.D.
(born 1947) | | Trustee | | Trustee since 2005 | | President, Elkind Economics, Inc. (1980 — present). | | 1 registered investment company consisting of 5 portfolios | | None | |
|
Robert Fitzgerald
(born 1952) | | Trustee | | Trustee since 2005 | | Chief Financial Officer of National Retirement Partner's Inc. (2005-present); Executive Vice President and Chief Financial Officer of PIMCO Advisors L.P. (1995 — 2001). | | 1 registered investment company consisting of 5 portfolios | | None | |
|
John Gavin
(born 1931) | | Trustee | | Trustee since 2001 | | Senior Counselor, Hicks Holdings (private equity investment firm) (2001 — present); Chairman, Gamma Holdings (international capital and consulting) (1968 — present); Partner and Managing Director, Hicks, Muse, Tate & Furst (Latin America) (private equity investment firm) (1994 — 2001); U.S. Ambassador to Mexico (1981 — 1986). | | 1 registered investment company consisting of 5 portfolios | | Causeway Capital Management Trust; Claxson S.A.; TCW Galileo Funds | |
|
INTERESTED TRUSTEE AND OFFICERS2
| Name and Year of Birth | | Position
Held with the
Trust | | Term of
Office and
Length of
Time Served | | Principal Occupation(s) During
Past Five Years | | Number of
Portfolios in
Fund Complex
overseen by
Trustee | | Public
Directorships | |
Nancy D. Celick*
(born 1951) | | President, Secretary and Trustee | | President and Trustee since 2001 Secretary since 2005 | | Chief Operating Officer of the Advisor (2001 — present); First Vice President of Merrill Lynch Investment Advisors, L.P. ("MLIM") (2000 — 2001); Director of MLIM (1993 — 1999). | | 1 registered investment company consisting of 5 portfolios | | None | |
|
Anna Marie Lopez
(born 1967) | | Vice President, Treasurer and Chief Compliance Officer | | Treasurer since 2001; Vice President since 2004; and CCO since 2004 | | Chief Compliance Officer of the Advisor (2001 — present); Compliance Officer of MLIM (1997 — 2001). | | Not applicable | | Not applicable | |
|
* Ms. Celick is an "interested person," as defined in the Investment Company Act of 1940, of the Trust based on her position as COO of the Advisor.
1 Each Trustee serves until his or her successor is elected and qualified, until he or she retires in accordance with the Trust's retirement policy, or until his or her death or resignation or removal as provided in the Trust's Agreement and Declaration of Trust.
2 Elected by and serve at the pleasure of the Board of Trustees of the Trust.
The Statement of Additional Information includes additional information about the Trust's Trustees and officers, and is available without charge upon request by calling the transfer agent at 1-866-HW-FUNDS (1-866-493-8637). The address for all Trustees and officers of the Trust is c/o Hotchkis and Wiley Capital Management, LLC, 725 South Figueroa Street, 39th Floor, Los Angeles, CA 90017, attention: Trust Secretary.
45
(This page intentionally left blank)
(This page intentionally left blank)
ADVISOR
Hotchkis and Wiley Capital Management, LLC
725 South Figueroa Street, 39th Floor
Los Angeles, California 90017
LEGAL COUNSEL
Paul, Hastings, Janofsky & Walker LLP
55 Second Street, 24th Floor
San Francisco, California 94105
INDEPENDENT REGISTERED PUBLIC ACCOUNTING FIRM
PricewaterhouseCoopers LLP
350 South Grand Avenue
Los Angeles, California 90071
DISTRIBUTOR
Quasar Distributors, LLC
615 East Michigan Street
Milwaukee, WI 53202
ADMINISTRATOR AND TRANSFER AGENT
U.S. Bancorp Fund Services, LLC
615 East Michigan Street
Milwaukee, Wisconsin 53202
CUSTODIAN
Brown Brothers Harriman & Co.
40 Water Street
Boston, Massachusetts 02109
This report is for the information of shareholders of the Hotchkis and Wiley Funds, but may also be used as sales literature when preceded or accompanied by a current prospectus, which gives details about charges, expenses, investment objectives and operating policies of the Funds.
A description of the policies and procedures that the Funds use to determine how to vote proxies relating to portfolio securities is included in the Statement of Additional Information, which is available without charge, upon request, by calling 1-866-HW-FUNDS (1-866-493-8637) and on the Securities and Exchange Commission's website at http://www.sec.gov.
Information regarding how the Funds voted proxies relating to portfolio securities during the 12-month period ended June 30, 2006 is available without charge on the Funds' website at www.hwcm.com and on the Securities and Exchange Commission's website at http://www.sec.gov.
Hotchkis and Wiley Funds file a complete schedule of portfolio holdings with the Securities and Exchange Commission ("SEC") for the first and third quarters of each fiscal year on Form N-Q. The Funds' Forms N-Q are available free of charge on the SEC's website at http://www.sec.gov. You may also review or, for a fee, copy the forms at the SEC's Public Reference Room in Washington, D.C. (1-202-551-8090). The Forms N-Q are also available on our website at http://www.hwcm.com under the "Download Center".


725 SOUTH FIGUEROA STREET, 39th Floor
LOS ANGELES, CALIFORNIA 90017-5439
www.hwcm.com
1.866.HW.FUNDS (1.866.493.8637)
CODE #HWF-AR-0606-0806
JUNE 30, 2006

ANNUAL REPORT
Item 2 – | Code of Ethics |
| |
| The registrant has adopted a code of ethics that applies to the registrant’s principal executive officer, principal financial officer and principal accounting officer, or persons performing similar functions. A copy of the code of ethics is available without charge upon request by calling toll-free 1-800-796-5606. |
| |
Item 3 – | Audit Committee Financial Expert |
| |
| The registrant’s Board has determined that Robert Fitzgerald, a member of the registrant’s Audit Committee, is an “audit committee financial expert” and “independent,” as such terms are defined in this Item. This designation will not increase the designee’s duties, obligations or liability as compared to his duties, obligations and liability as a member of the Audit Committee and of the Board; nor will it reduce the responsibility of the other Audit Committee members. The Board believes each member of the Audit Committee contributes significantly to the effective oversight of the registrant’s financial statements and condition. |
| |
Item 4 – | Principal Accountant Fees and Services |
| |
| Fees billed by the registrant’s auditors for each of the last two fiscal years, including fees for non-audit services billed to the adviser and affiliates for engagements that relate directly to the operations and financial reporting of the registrant, and a description of the nature of the services comprising the fees, are listed below: |
| |
| Registrant: |
| (a) | Audit Fees |
| | Fiscal year ended June 30, 2006 – $95,000 |
| | Fiscal year ended June 30, 2005 – $82,000 |
| |
| (b) | Audit-Related Fees |
| | Fiscal year ended June 30, 2006 – $0 |
| | Fiscal year ended June 30, 2005 – $0 |
| |
| (c) | Tax Fees |
| | Fiscal year ended June 30, 2006 – $27,250 |
| | Fiscal year ended June 30, 2005 – $25,000 |
| | |
| | The nature of the services include tax compliance, tax advice and tax planning. |
| |
| (d) | All Other Fees |
| | Fiscal year ended June 30, 2006 – $0 |
| | Fiscal year ended June 30, 2005 – $0 |
| Adviser and affiliates (includes only fees for non-audit services billed to the adviser and affiliates for engagements that relate directly to the operations and financial reporting of the registrant and were subject to the pre-approval policies described below): |
| |
| (b) | Audit-Related Fees |
| | Fiscal year ended June 30, 2006 – $0 |
| | Fiscal year ended June 30, 2005 – $0 |
| | |
| (c) | Tax Fees |
| | Fiscal year ended June 30, 2006 – $0 |
| | Fiscal year ended June 30, 2005 – $0 |
| | |
| (d) | All Other Fees |
| | Fiscal year ended June 30, 2006 – $0 |
| | Fiscal year ended June 30, 2005 – $0 |
| | |
| (e)(1) The registrant’s Audit Committee (the “Committee”) has adopted policies and procedures with regard to the pre-approval of services. The Committee shall pre-approve any engagement of the independent auditors to provide any non-prohibited services to the registrant, including the fees and other compensation to be paid to the independent auditors. The Chairman of the Audit Committee may grant the pre-approval of services to the registrant for non-prohibited services for engagements of less than $5,000. All such delegated pre- approvals shall be presented to the Audit Committee no later than the next Audit Committee meeting. The Committee shall also pre-approve any engagement of the independent auditors, including the fees and other compensation to be paid to the independent auditors, to provide any non-audit services to the Adviser (or any “control affiliate” of the Adviser providing ongoing services to the registrant), if the engagement relates directly to the operations and financial reporting of the registrant. The Chairman of the Audit Committee may grant the pre-approval for non-prohibited services to the Adviser for engagements of less than $5,000. All such delegated pre-approvals shall be presented to the Audit Committee no later than the next Audit Committee meeting. |
| | |
| (e)(2) | |
| | | |
| | (b) | Audit-Related Fees |
| | | Fiscal year ended June 30, 2006 – 0% |
| | | Fiscal year ended June 30, 2005 – 0% |
| | | |
| | (c) | Tax Fees |
| | | Fiscal year ended June 30, 2006 – 0% |
| | | Fiscal year ended June 30, 2005 – 0% |
| | | |
| | (d) | All Other Fees |
| | | Fiscal year ended June 30, 2006 – 0% |
| | | Fiscal year ended June 30, 2005 – 0% |
| | | |
| (f) | Not Applicable |
| | | | |
| | |
| (g) | |
| | Fiscal year ended June 30, 2006 – $177,000 |
| | Fiscal year ended June 30, 2005 – $49,100 |
| | |
| (h) The registrant’s Audit Committee has considered whether the provision of non-audit services that were rendered to the registrant’s investment adviser and any entity controlling, controlled by, or under common control with the investment adviser that provides ongoing services to the registrant that were not pre-approved pursuant to paragraph (c)(7)(ii) of Rule 2-01 of Regulation S-X is compatible with maintaining the principal accountant’s independence. |
| | |
Item 5 – | Audit Committee of Listed Registrants |
| |
| Not applicable |
| |
Item 6 – | Schedule of Investments |
| |
| Schedule of Investments is included as part of the report to shareholders filed under Item 1 of this Form. |
| |
Item 7 – | Disclosure of Proxy Voting Policies and Procedures for Closed-End Management Investment Companies |
| |
| Not applicable |
| |
Item 8 – | Portfolio Managers of Closed-End Management Investment Companies. |
| |
| Not applicable |
| |
Item 9 – | Purchases of Equity Securities by Closed-End Management Investment Company and Affiliated Purchasers. |
| |
| Not applicable |
| |
Item 10 – | Submission of Matters to a Vote of Security Holders |
| |
| The identification and recommendation of individuals for Board membership is the responsibility of the Nominating and Governance Committee. Shareholders may submit suggestions for candidates by forwarding their correspondence by U.S. mail or other courier service to the Funds’ Secretary for the attention of the Chairman of the Nominating and Governance Committee, 725 S. Figueroa Street, 39th Floor, Los Angeles, CA 90017-5439. |
| |
Item 11 – | Controls and Procedures |
|
(a) | The officers providing the certifications in this report in accordance with Rule 30a-2 under the Investment Company Act of 1940 (the “Act”)have concluded, based on their evaluation of the registrant’s disclosure controls and procedures (as such term is defined in Rule 30a-3 under the Act), that such controls and procedures are effective, based on their evaluation of the disclosure controls and procedures as of a date within 90 days of the filing date of this report. |
| |
(b) | There was no change in the registrant’s internal controls over financial reporting (as defined in Rule 30a-3(d) under the Act) that occurred during the registrant’s last fiscal half-year which has materially affected, or is reasonably likely to materially affect, the registrant’s internal control over financial reporting. |
|
Item 12 – | Exhibits |
| |
(a)(1) – | Code of Ethics: Available without charge upon request by calling toll-free 1-800-796-5606. |
| |
(a)(2) – | Certifications pursuant to Section 302 of the Sarbanes-Oxley Act of 2005. Attached hereto. |
| |
(a)(3) – | Not applicable |
| |
(b) – | Certifications pursuant to Section 906 of the Sarbanes-Oxley Act of 2002. Attached hereto. |
| | | |
SIGNATURES
Pursuant to the requirements of the Securities Exchange Act of 1934 and the Investment Company Act of 1940, the registrant has duly caused this report to be signed on its behalf by the undersigned, thereunto duly authorized.
Hotchkis and Wiley Funds
By: | /s/ Nancy D. Celick | |
| Nancy D. Celick, |
| President of Hotchkis and Wiley Funds |
Date: August 25, 2006
Pursuant to the requirements of the Securities Exchange Act of 1934 and the Investment Company Act of 1940, this report has been signed below by the following persons on behalf of the registrant and in the capacities and on the dates indicated.
Hotchkis and Wiley Funds
By: | /s/ Nancy D. Celick | |
| Nancy D. Celick, |
| President of Hotchkis and Wiley Funds |
| |
Date: August 25, 2006 |
| |
By: | /s/ Anna Marie Lopez | |
| Anna Marie Lopez, |
| Treasurer of Hotchkis and Wiley Funds |
Date: August 25, 2006