UNITED STATES
SECURITIES AND EXCHANGE COMMISSION
Washington, D.C. 20549
FORM N-CSR
CERTIFIED SHAREHOLDER REPORT OF REGISTERED
MANAGEMENT INVESTMENT COMPANIES
Investment Company Act file number | 811-10487 |
|
Hotchkis and Wiley Funds |
(Exact name of registrant as specified in charter) |
|
725 S. Figueroa Street, 39th Floor
Los Angeles, California | | 90071 |
(Address of principal executive offices) | | (Zip code) |
|
Anna Marie Lopez
Hotchkis and Wiley Capital Management, LLC
725 S. Figueroa Street, 39th Floor
Los Angeles, California 90071 |
(Name and address of agent for service) |
|
Copies to:
Julie Allecta, Esq.
Paul, Hastings, Janofsky & Walker, LLP
55 Second Street, Twenty-Fourth Floor
San Francisco, California 94105 |
(Counsel for the Registrant) |
|
Registrant’s telephone number, including area code: | (213) 430-1000 | |
|
Date of fiscal year end: | June 30, 2008 | |
|
Date of reporting period: | July 1, 2007 - June 30, 2008 | |
| | | | | | | | |
Item 1 - Report to Shareholders
Core Value Fund
Large Cap Value Fund
Mid-Cap Value Fund
Small Cap Value Fund
All Cap Value Fund

HOTCHKIS AND WILEY FUNDS
JUNE 30, 2008
ANNUAL REPORT

TABLE OF CONTENTS
| SHAREHOLDER LETTER | | | | | 3 | | |
|
| FUND PERFORMANCE DATA | | | | | 5 | | |
|
| SCHEDULE OF INVESTMENTS: | |
|
| CORE VALUE FUND | | | | | 11 | | |
|
| LARGE CAP VALUE FUND | | | | | 13 | | |
|
| MID-CAP VALUE FUND | | | | | 15 | | |
|
| SMALL CAP VALUE FUND | | | | | 17 | | |
|
| ALL CAP VALUE FUND | | | | | 19 | | |
|
| STATEMENTS OF ASSETS AND LIABILITIES | | | | | 22 | | |
|
| STATEMENTS OF OPERATIONS | | | | | 23 | | |
|
| STATEMENTS OF CHANGES IN NET ASSETS | | | | | 24 | | |
|
| FINANCIAL HIGHLIGHTS | | | | | 26 | | |
|
| NOTES TO THE FINANCIAL STATEMENTS | | | | | 29 | | |
|
| REPORT OF INDEPENDENT REGISTERED PUBLIC ACCOUNTING FIRM | | | | | 35 | | |
|
| FUND EXPENSE EXAMPLES | | | | | 36 | | |
|
BOARD CONSIDERATIONS IN APPROVING CONTINUATION
OF INVESTMENT ADVISORY AGREEMENTS | | | | | 37 | | |
|
| MANAGEMENT | | | | | 40 | | |
|
| INFORMATION ABOUT THE FUNDS | | | | | BACK COVER | | |
|
DEAR SHAREHOLDER:
The following investment review and annual report relates to the activities of the Hotchkis and Wiley Funds for the one year period ended June 30, 2008.
OVERVIEW
The market environment is currently one of concentration and extremes. Performance has been concentrated in a few areas, leading to extreme valuation differentials and distorted results. For example, the Russell 1000 Value Index has risen about 11% cumulatively over the past three years. Without the benefit of energy stocks, the index would have declined –0.3%. Energy now represents more than 18% of the index, twice its weight in 2000. Soaring commodity stock prices and the severe downdraft in financial stocks have resulted in valuation differentials that have been exceeded only two times in the last fifty years.1
The year was a disappointing one in terms of investment performance for Hotchkis and Wiley. We significantly underperformed our benchmarks as the dynamics of the market unfolded. For traditional value managers, results have been discouraging, yet opportunities abound. History has shown that while the duration and magnitude of valuation dispersion is hard to predict, the closing of this gap can lead to sustained outperformance. Before the reversion occurs, short-term performance can be very volatile and frustrating as market emotions drive results. However, we believe fundamentals ultimately prevail and it is imperative to remain disciplined. We have endured similar cycles in the past as the principals of our investment team average two decades of experience and fourteen years working together as a group. Our experience and results affirm the benefits of our disciplined investment process, which relies on rigorous fundamental res earch, a focus on long-term earnings power, and an in-depth assessment of financial strength. Over the long term, the patient investor can benefit from the extreme valuation differentials of the current environment. We believe we are positioned to capitalize on these opportunities.
HOTCHKIS AND WILEY CORE VALUE FUND
The Fund's Class I, Class A, and Class C shares had total returns of –32.13%, –32.29%, and –32.81%, respectively, compared to the S&P 500 Index return of –13.12% and the Russell 1000 Value Index return of –18.78%. (Fund results shown do not reflect sales charges and would be lower if sales charges were included. More complete performance information can be found on page 6 of this report.)
Weakness versus the value benchmark was caused by an underweight in energy combined with an overweight and adverse stock selection in the financials and consumer discretionary sectors. Within the financials sector, thrift/mortgage stocks Washington Mutual and Freddie Mac, diversified financials companies Citigroup and Bank of America, as well as commercial bank Wachovia were sources of negative performance. Within the consumer discretionary sector, declines in homebuilders Pulte Homes and Lennar, home improvement giant Home Depot, and media company R.H. Donnelley contributed to weak performance. Top contributors to performance included discount retailer Wal-Mart, utilities operators Exelon, Entergy and FPL Group, as well as pharmaceuticals company Schering Plough.
1 Source: Empirical Research
HOTCHKIS AND WILEY LARGE CAP
VALUE FUND
The Fund's Class I, Class A, Class C, and Class R shares had total returns of –31.84%, –32.06%, –32.59%, and –32.27%, respectively, compared to the S&P 500 Index return of –13.12% and the Russell 1000 Value Index return of –18.78%. (Fund results shown do not reflect sales charges and would be lower if sales charges were included. More complete performance information can be found on page 7 of this report.)
Weakness versus the value benchmark was split evenly between stock selection and sector allocation. Negative stock selection occurred in the consumer discretionary and financials sectors of the Fund. Declines in thrift/mortgage stocks Washington Mutual and Freddie Mac, diversified financials companies Citigroup and Bank of America, and commercial bank Wachovia detracted from performance. Other negative contributors included media company Idearc, homebuilders Lennar and Centex, and home improvement giant Home Depot. Our underweight in energy also detracted from performance. Top contributors to performance included discount retailer Wal-Mart, utilities operators Exelon, Entergy and FPL Group, as well as software manufacturer BMC Software.
HOTCHKIS AND WILEY MID-CAP VALUE FUND
The Fund's Class I, Class A, Class C, and Class R shares had total returns of –34.05%, –34.20%, –34.68%, and –34.35%, respectively, compared to the Russell Midcap Index return of –11.19% and the Russell Midcap Value Index return of –17.09%. (Fund results shown do not reflect sales charges and would be lower if sales charges were included. More complete performance information can be found on page 8 of this report.)
Weakness versus the value benchmark was caused by an underweight in energy combined with both an overweight and adverse stock selection in the financials and consumer discretionary sectors. Within the financials sector, insurers Conseco and XL Capital, thrifts/mortgage company Washington Mutual and commercial banks Comerica, First Horizon and KeyCorp, were the main sources of negative performance. Within the consumer discretionary sector, declines in media companies R.H. Donnelley and Citadel Broadcasting and apparel manufacturer Jones Apparel Group contributed to weak performance. Top contributors to performance included BMC Software, ON Semiconductor, equipment manufacturer Flowserve, Eastman Chemical and utilities operator FPL Group.
HOTCHKIS AND WILEY SMALL CAP VALUE FUND
The Fund's Class I, Class A, and Class C shares had total returns of –29.19%, –29.36%, and –29.88%, respectively, compared to the Russell 2000 Index return of –16.19% and the Russell 2000 Value Index return of –21.63%. (Fund results shown do not reflect sales charges and would be lower if sales charges were included. More complete performance information can be found on page 9 of this report to shareholders.)
Weakness versus the value benchmark was primarily due to an underweight in materials and energy combined with an overweight in the underperforming consumer discretionary sector. Primary detractors within consumer discretionary were media companies Westwood One and R.H. Donnelley as well as homebuilders WCI Communities and
3
California Coastal Communities. Top contributors to performance included Foundation Coal Holdings, ON Semiconductor, U-Store-It-Trust, and equipment manufacturer Flowserve.
HOTCHKIS AND WILEY ALL CAP VALUE FUND
The Fund's Class I, Class A, and Class C shares had total returns of –28.58%, –28.80%, and –29.34%, respectively, compared to the S&P 500 Index return of –13.12% and the Russell 3000 Value Index return of –19.02%. (Fund results shown do not reflect sales charges and would be lower if sales charges were included. More complete performance information can be found on page 10 of this report to shareholders.)
Weakness versus the value benchmark was concentrated in a number of stocks including thrifts/mortgage company Washington Mutual, diversified financials company Bank of America, commercial bank Wachovia, equipment manufacturer Miller Industries, and real estate company MI Developments. Utilities operator Exelon, pharmaceuticals company AstraZeneca, and software manufacturer Microsoft were leading contributors to performance.
* * *
Despite the poor recent results, performance has been strong over the past eight years as we unwound the excesses of the tech-driven momentum-oriented market of the late 1990s. Our portfolios then had large exposure to energy, materials and industrials, all of which were struggling, and virtually no exposure to technology and healthcare. Today, that positioning has reversed. It is in those out-of-favor areas, as well as the financials and consumer discretionary sectors, that we are finding value at compelling prices.
Our portfolio exposures are a result of a rigorous, bottom-up review of individual stocks. We take a long-term view of what an individual company should produce in earnings and cash flow over several years, analyze the company's balance sheet, and weigh this value and the company's financial strength against the current stock price. Over time, economic principles have supported this value-oriented approach. Over shorter periods, though, sentiment and momentum can overwhelm these core tendencies.
Today, momentum is back as a strong technical factor. As a consequence, the past 12 months have been an unusually challenging period for us, with very disappointing results. However, our process mandates that we focus on long-term value. In momentum-oriented markets our portfolios tend to struggle, but the dislocation from fundamental value creates opportunity.
Hotchkis and Wiley has a disciplined investment process which we firmly believe to be effective and rewarding over time. Its 28-year history validates that. We appreciate your confidence in us, your continued support of the Hotchkis and Wiley Funds, and we look forward to serving your investment needs in the future.
Sincerely,
 | |  | |  | |
|
Anna Marie Lopez
President | | George Davis
Portfolio Manager | | Sheldon Lieberman
Portfolio Manager | |
|
 | |  | |  | |
|
Patty McKenna
Portfolio Manager | | James Miles
Portfolio Manager | | Stan Majcher
Portfolio Manager | |
|
 | |  | |  | |
|
David Green
Portfolio Manager | | Scott McBride
Portfolio Manager | | Judd Peters
Portfolio Manager | |
|
The above reflects opinions of portfolio managers as of June 30, 2008. They are subject to change and any forecasts made cannot be guaranteed. The Funds might not continue to hold any securities mentioned and have no obligation to disclose purchases or sales in these securities. Please refer to the Schedule of Investments in this report for a complete list of Fund holdings for June 30, 2008. Past performance does not guarantee future results. Indexes do not incur expenses or sales loads and are not available for investment. Cash flow measures the cash generating capability of a company by adding non-cash charges (e.g., depreciation) and interest expense to pretax income.
4
Fund Performance Data
ABOUT FUND PERFORMANCE
The Large Cap Value Fund and Mid-Cap Value Fund have four classes of shares. The Core Value Fund, Small Cap Value Fund and All Cap Value Fund have three classes of shares. Each share class has its own sales charge and expense structure, allowing you to invest in the way that best suits your needs. The Large Cap Value Fund, Small Cap Value Fund and All Cap Value Fund are closed to new investors, except as described in the prospectuses.
Class I shares have no initial sales charge and bear no ongoing distribution and service fees under a 12b-1 plan. Class I shares are available only to eligible investors.
Class A shares incur a maximum initial sales charge of 5.25% and an annual distribution and service fee of 0.25%.
Class C shares are subject to an annual distribution and service fee of 1.00%. In addition, Class C shares are subject to a 1.00% contingent deferred sales charge (CDSC) if redeemed within one year after purchase. Class C shares automatically convert to Class A shares approximately eight years after purchase and will then be subject to lower distribution and service fees.
Class R shares have no initial sales charge or CDSC and are subject to an annual distribution and service fee of 0.50%. Class R shares are available only to certain retirement plans.
The performance shown represents past performance. Past performance is no guarantee of future results and current performance may be higher or lower than the performance shown. Investment results and principal value will fluctuate so that shares, when redeemed, may be worth more or less than their original cost. To obtain performance data current to the most recent month-end, access the Funds' website at www.hwcm.com or call 1-866-HW-FUNDS.
Performance results do not reflect the deduction of taxes that a shareholder would pay on Fund distributions or the redemption of Fund shares. Figures shown in the "Average Annual Total Return" tables assume reinvestment of all dividends and capital gains distributions at net asset value on the ex-dividend date. The Funds' investment advisor pays annual operating expenses of the Funds' Class I, Class A, Class C and Class R shares over certain levels. If the investment advisor did not pay such expenses during certain periods, net returns would be lower. Dividends paid by each class of shares will vary because of the different levels of distribution and service fees, if any, applicable to each class, which are deducted from the income available to be paid to shareholders. Performance of all Funds except the Core Value Fund and All Cap Value Fund includes that of predecessor funds, as referenced in Note 1 of the Notes to the Financ ial Statements.
FUND RISKS
Mutual fund investing involves risk; loss of principal is possible. The Small Cap Value Fund, Mid-Cap Value Fund and All Cap Value Fund invest in small- and medium-capitalization companies which tend to have limited liquidity and greater price volatility than large-capitalization companies. The All Cap Value Fund is a non-diversified fund which involves greater risk than investing in diversified funds, such as business risk, significant stock price fluctuations and sector concentration. Growth stocks typically are more volatile than value stocks; however, value stocks have a lower expected growth rate in earnings and sales.
MARKET INDEXES
The following are definitions for indexes used in the shareholder letter and the performance summary tables on the following pages. These indexes are unmanaged and include the reinvestment of dividends, but do not reflect the payment of transaction costs and advisory and other fees associated with an investment in the Funds. The securities that comprise these indexes may differ substantially from the securities in the Funds' portfolios. The Funds' value disciplines may prevent or restrict investment in major stocks in the benchmark indexes. It is not possible to invest directly in an index. Each index named is not the only index which may be used to characterize performance of a specific Fund and other indexes may portray different comparative performance.
S&P 500® Index, a capital weighted, unmanaged index, represents the aggregate market value of the common equity of 500 stocks primarily traded on the New York Stock Exchange.
Russell 3000® Index, an unmanaged index, is comprised of the 3,000 largest U.S. companies based on total market capitalization, which represents approximately 98% of the investable U.S. equity market.
Russell 3000® Value Index measures the performance of those Russell 3000® companies with lower price-to-book ratios and lower forecasted growth values.
Russell 1000® Index, an unmanaged index, measures the performance of the 1,000 largest companies in the Russell 3000® Index.
Russell 1000® Value Index measures the performance of those Russell 1000® companies with lower price-to-book ratios and lower forecasted growth values.
Russell Midcap® Index, an unmanaged index, measures the performance of the 800 smallest companies in the Russell 1000® Index.
Russell Midcap® Value Index measures the performance of those Russell Midcap® companies with lower price-to-book ratios and lower forecasted growth values.
Russell 2000® Index, an unmanaged index, is a stock market index comprised of the 2,000 smallest companies in the Russell 3000® Index.
Russell 2000® Value Index measures the performance of those Russell 2000® companies with lower price-to-book ratios and lower forecasted growth values.
5
Fund Performance Data
CORE VALUE FUND
Total Return Based on a $10,000 Investment
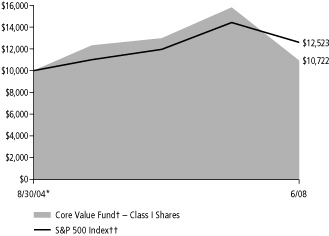
Comparative Results†††
| For Periods ended June 30, 2008 | | 1 Year | | Since
8/30/04* | |
| Class I | |
| Average annual total return | | | –32.13 | % | | | 1.84 | % | |
| Class A | |
| Average annual total return (with sales charge) | | | –35.84 | % | | | 0.19 | % | |
| Average annual total return (without sales charge) | | | –32.29 | % | | | 1.60 | % | |
| Class C | |
| Average annual total return (with CDSC) | | | –33.81 | % | | | 0.85 | % | |
| Average annual total return (without CDSC) | | | –32.81 | % | | | 0.85 | % | |
| S&P 500 Index†† | |
| Average annual total return | | | –13.12 | % | | | 6.04 | % | |
| Russell 1000 Index†† | |
| Average annual total return | | | –12.36 | % | | | 6.82 | % | |
| Russell 1000 Value Index†† | |
| Average annual total return | | | –18.78 | % | | | 6.52 | % | |
Average annual total returns with sales charge and CDSC shown for Class A and Class C shares, respectively, have been adjusted to reflect the current applicable sales charges of each specific class. Returns for Class A reflect the current maximum initial sales charges of 5.25%. Class C shares have no adjustment for sales charges, but redemptions within one year of purchase may be subject to a CDSC of 1%. Average annual total returns without sales charge or CDSC do not reflect the current maximum sales charges. Had the sales charge or CDSC been included, the Fund's returns would have been lower.
† The Fund invests primarily in stocks of U.S. companies with market capitalizations similar to the Russell 1000 Index.
†† See index descriptions on page 5.
††† Fund returns during certain periods shown reflect a fee waiver and/or expense reimbursement. Without waiver/reimbursement, returns would have been lower. Returns shown include the reinvestment of all dividends.
* Commencement of Class I, Class A and Class C.
Past performance is not indicative of future results and the table does not reflect the deduction of taxes that a shareholder would pay on Fund distributions or the redemption of Fund shares.
6
Fund Performance Data
LARGE CAP VALUE FUND
Total Return Based on a $10,000 Investment
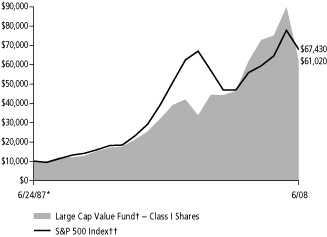
Comparative Results†††
| For Periods ended June 30, 2008 | | 1 Year | | 5 Years | | 10 Years | | Since
6/24/87* | |
| Class I | |
| Average annual total return | | | –31.84 | % | | | 5.72 | % | | | 4.60 | % | | | 8.99 | % | |
| Class A | |
| Average annual total return (with sales charge) | | | –35.63 | % | | | 4.31 | % | | | 3.82 | % | | | 8.47 | % | |
| Average annual total return (without sales charge) | | | –32.06 | % | | | 5.43 | % | | | 4.38 | % | | | 8.75 | % | |
| Class C | |
| Average annual total return (with CDSC) | | | –33.59 | % | | | 4.68 | % | | | 3.58 | % | | | 7.90 | % | |
| Average annual total return (without CDSC) | | | –32.59 | % | | | 4.68 | % | | | 3.58 | % | | | 7.90 | % | |
| Class R | |
| Average annual total return | | | –32.27 | % | | | 5.28 | % | | | 4.12 | % | | | 8.46 | % | |
| S&P 500 Index†† | |
| Average annual total return | | | –13.12 | % | | | 7.58 | % | | | 2.88 | % | | | 9.85 | % | |
| Russell 1000 Index†† | |
| Average annual total return | | | –12.36 | % | | | 8.22 | % | | | 3.38 | % | | | 9.66 | % | |
| Russell 1000 Value Index†† | |
| Average annual total return | | | –18.78 | % | | | 8.92 | % | | | 4.91 | % | | | n/a | | |
Returns shown for Class A, Class C, and Class R shares for the periods prior to their inception are derived from the historical performance of Class I shares of the Fund during such periods and have been adjusted to reflect the higher total annual operating expenses of each specific class. (Inception dates: Class A — 10/26/01; Class C — 2/4/02; Class R — 8/28/03.)
Average annual total returns with sales charge and CDSC shown for Class A and Class C shares, respectively, have been adjusted to reflect the current applicable sales charges of each specific class. Returns for Class A reflect the current maximum initial sales charges of 5.25%. Class C shares have no adjustment for sales charges, but redemptions within one year of purchase may be subject to a CDSC of 1%. Average annual total returns without sales charge or CDSC do not reflect the current maximum sales charges. Had the sales charge or CDSC been included, the Fund's returns would have been lower.
† The Fund invests primarily in stocks of U.S. companies with market capitalizations similar to the Russell 1000 Index.
†† See index descriptions on page 5.
††† Fund returns during certain periods shown reflect a fee waiver and/or expense reimbursement. Without waiver/reimbursement, returns would have been lower. Returns shown include the reinvestment of all dividends.
* Commencement of Class I.
Past performance is not indicative of future results and the table does not reflect the deduction of taxes that a shareholder would pay on Fund distributions or the redemption of Fund shares.
7
Fund Performance Data
MID-CAP VALUE FUND
Total Return Based on a $10,000 Investment
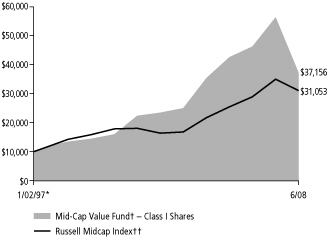
Comparative Results†††
| For Periods ended June 30, 2008 | | 1 Year | | 5 Years | | 10 Years | | Since
1/2/97* | |
| Class I | |
| Average annual total return | | | –34.05 | % | | | 8.27 | % | | | 10.72 | % | | | 12.10 | % | |
| Class A | |
| Average annual total return (with sales charge) | | | –37.65 | % | | | 6.83 | % | | | 9.85 | % | | | 11.31 | % | |
| Average annual total return (without sales charge) | | | –34.20 | % | | | 8.00 | % | | | 10.45 | % | | | 11.84 | % | |
| Class C | |
| Average annual total return (with CDSC) | | | –35.68 | % | | | 7.24 | % | | | 9.65 | % | | | 11.00 | % | |
| Average annual total return (without CDSC) | | | –34.68 | % | | | 7.24 | % | | | 9.65 | % | | | 11.00 | % | |
| Class R | |
| Average annual total return | | | –34.35 | % | | | 8.06 | % | | | 10.33 | % | | | 11.69 | % | |
| Russell Midcap Index†† | |
| Average annual total return | | | –11.19 | % | | | 13.07 | % | | | 8.10 | % | | | 10.36 | % | |
| Russell Midcap Value Index†† | |
| Average annual total return | | | –17.09 | % | | | 13.00 | % | | | 8.45 | % | | | 10.87 | % | |
Returns shown for Class A, Class C, and Class R shares for the periods prior to their inception are derived from the historical performance of Class I shares of the Fund during such periods and have been adjusted to reflect the higher total annual operating expenses of each specific class. (Inception dates: Class A, Class C — 1/2/01; Class R — 8/28/03.)
Average annual total returns with sales charge and CDSC shown for Class A and Class C shares, respectively, have been adjusted to reflect the current applicable sales charges of each specific class. Returns for Class A reflect the current maximum initial sales charges of 5.25%. Class C shares have no adjustment for sales charges, but redemptions within one year of purchase may be subject to a CDSC of 1%. Average annual total returns without sales charge or CDSC do not reflect the current maximum sales charges. Had the sales charge or CDSC been included, the Fund's returns would have been lower.
† The Fund invests primarily in stocks of U.S. companies with market capitalizations similar to the Russell Midcap Index.
†† See index descriptions on page 5.
††† Fund returns during certain periods shown reflect a fee waiver and/or expense reimbursement. Without waiver/reimbursement, returns would have been lower. Returns shown include the reinvestment of all dividends.
* Commencement of Class I.
Past performance is not indicative of future results and the table does not reflect the deduction of taxes that a shareholder would pay on Fund distributions or the redemption of Fund shares.
8
Fund Performance Data
SMALL CAP VALUE FUND
Total Return Based on a $10,000 Investment

Comparative Results†††
| For Periods ended June 30, 2008 | | 1 Year | | 5 Years | | 10 Years | | Since
9/20/85* | |
| Class I | |
| Average annual total return | | | –29.19 | % | | | 8.67 | % | | | 7.99 | % | | | 11.60 | % | |
| Class A | |
| Average annual total return (with sales charge) | | | –33.07 | % | | | 7.24 | % | | | 7.35 | % | | | 11.09 | % | |
| Average annual total return (without sales charge) | | | –29.36 | % | | | 8.41 | % | | | 7.93 | % | | | 11.36 | % | |
| Class C | |
| Average annual total return (with CDSC) | | | –30.88 | % | | | 7.69 | % | | | 6.99 | % | | | 10.54 | % | |
| Average annual total return (without CDSC) | | | –29.88 | % | | | 7.69 | % | | | 6.99 | % | | | 10.54 | % | |
| Russell 2000 Index†† | |
| Average annual total return | | | –16.19 | % | | | 10.29 | % | | | 5.53 | % | | | 9.89 | % | |
| Russell 2000 Value Index†† | |
| Average annual total return | | | –21.63 | % | | | 10.02 | % | | | 7.47 | % | | | n/a | | |
Returns shown for Class A and Class C shares for the periods prior to their inception are derived from the historical performance of Class I shares of the Fund during such periods and have been adjusted to reflect the higher total annual operating expenses of each specific class. (Inception dates: Class A — 10/6/00; Class C — 2/4/02.)
Average annual total returns with sales charge and CDSC shown for Class A and Class C shares, respectively, have been adjusted to reflect the current applicable sales charges of each specific class. Returns for Class A reflect the current maximum initial sales charges of 5.25%. Class C shares have no adjustment for sales charges, but redemptions within one year of purchase may be subject to a CDSC of 1%. Average annual total returns without sales charge or CDSC do not reflect the current maximum sales charges. Had the sales charge or CDSC been included, the Fund's returns would have been lower.
† The Fund invests primarily in stocks of U.S. companies with market capitalizations less than $3 billion.
†† See index descriptions on page 5.
††† Fund returns during certain periods shown reflect a fee waiver and/or expense reimbursement. Without waiver/reimbursement, returns would have been lower. Returns shown include the reinvestment of all dividends.
* Commencement of Class I.
Past performance is not indicative of future results and the table does not reflect the deduction of taxes that a shareholder would pay on Fund distributions or the redemption of Fund shares.
9
Fund Performance Data
ALL CAP VALUE FUND
Total Return Based on a $10,000 Investment
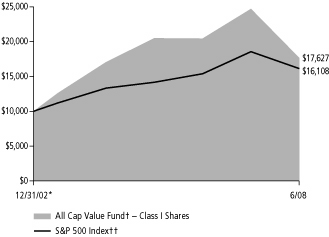
Comparative Results†††
| For Periods ended June 30, 2008 | | 1 Year | | 5 Years | | Since
12/31/02* | |
| Class I | |
| Average annual total return | | | –28.58 | % | | | 6.98 | % | | | 10.86 | % | |
| Class A | |
| Average annual total return (with sales charge) | | | –32.53 | % | | | 5.62 | % | | | 9.66 | % | |
| Average annual total return (without sales charge) | | | –28.80 | % | | | 6.77 | % | | | 10.73 | % | |
| Class C | |
| Average annual total return (with CDSC) | | | –30.34 | % | | | 5.94 | % | | | 9.77 | % | |
| Average annual total return (without CDSC) | | | –29.34 | % | | | 5.94 | % | | | 9.77 | % | |
| S&P 500 Index†† | |
| Average annual total return | | | –13.12 | % | | | 7.58 | % | | | 9.05 | % | |
| Russell 3000 Index†† | |
| Average annual total return | | | –12.69 | % | | | 8.37 | % | | | 9.95 | % | |
| Russell 3000 Value Index†† | |
| Average annual total return | | | –19.02 | % | | | 8.99 | % | | | 10.37 | % | |
Returns shown for Class C shares for the periods prior to their inception are derived from the historical performance of Class I shares of the Fund during such periods and have been adjusted to reflect the higher total annual operating expenses of the class. (Inception date: Class C — 8/28/03.)
Average annual total returns with sales charge and CDSC shown for Class A and Class C shares, respectively, have been adjusted to reflect the current applicable sales charges of each specific class. Returns for Class A reflect the current maximum initial sales charges of 5.25%. Class C shares have no adjustment for sales charges, but redemptions within one year of purchase may be subject to a CDSC of 1%. Average annual total returns without sales charge or CDSC do not reflect the current maximum sales charges. Had the sales charge or CDSC been included, the Fund's returns would have been lower.
† The Fund invests primarily in stocks of U.S. companies.
†† See index descriptions on page 5.
††† Fund returns during certain periods shown reflect a fee waiver and/or expense reimbursement. Without waiver/reimbursement, returns would have been lower. Returns shown include the reinvestment of all dividends.
* Commencement of Class I and Class A.
Past performance is not indicative of future results and the table does not reflect the deduction of taxes that a shareholder would pay on Fund distributions or the redemption of Fund shares.
10
Schedule of Investments — June 30, 2008
Hotchkis and Wiley Core Value Fund

| Largest Equity Holdings | | Percent of
net assets | |
| Royal Dutch Shell PLC - Class B - ADR | | | 5.47 | % | |
| CA, Inc. | | | 5.15 | % | |
| Wachovia Corporation | | | 4.14 | % | |
| Microsoft Corporation | | | 4.06 | % | |
| Freddie Mac | | | 3.48 | % | |
| Home Depot, Inc. | | | 3.23 | % | |
| The Dow Chemical Company | | | 3.03 | % | |
| Washington Mutual, Inc. | | | 2.96 | % | |
| National City Corporation | | | 2.94 | % | |
| Schering-Plough Corporation | | | 2.83 | % | |
| Bank of America Corporation | | | 2.63 | % | |
COMMON
STOCKS — 95.23% | | Shares
Held | | Value | |
CONSUMER DISCRETIONARY — 11.30%
Household Durables — 0.97% | |
| Centex Corporation | | | 974,800 | | | $ | 13,033,076 | | |
| Media — 2.57% | |
| Idearc, Inc. (b) | | | 627,700 | | | | 1,475,095 | | |
| Interpublic Group of Companies, Inc. (a) | | | 3,653,100 | | | | 31,416,660 | | |
| R.H. Donnelley Corporation (a) (b) | | | 582,200 | | | | 1,746,600 | | |
| | | | 34,638,355 | | |
| Multiline Retail — 1.61% | |
| J.C. Penney Company, Inc. | | | 598,700 | | | | 21,726,823 | | |
| Specialty Retail — 6.15% | |
| The Gap, Inc. | | | 1,493,900 | | | | 24,903,313 | | |
| Home Depot, Inc. | | | 1,859,000 | | | | 43,537,780 | | |
| Limited Brands, Inc. | | | 850,000 | | | | 14,322,500 | | |
| | | | 82,763,593 | | |
| TOTAL CONSUMER DISCRETIONARY | | | 152,161,847 | | |
CONSUMER STAPLES — 4.90%
Food & Staples Retailing — 2.72% | |
| Safeway, Inc. | | | 585,300 | | | | 16,710,315 | | |
| Wal-Mart Stores, Inc. | | | 354,900 | | | | 19,945,380 | | |
| | | | 36,655,695 | | |
| Tobacco — 2.18% | |
| Philip Morris International, Inc. (a) | | | 592,400 | | | | 29,258,636 | | |
| TOTAL CONSUMER STAPLES | | | 65,914,331 | | |
ENERGY — 6.43%
Oil, Gas & Consumable Fuels — 6.43% | |
| Royal Dutch Shell PLC — Class B — ADR | | | 918,800 | | | | 73,605,068 | | |
| Sunoco, Inc. | | | 320,300 | | | | 13,033,007 | | |
| | | | 86,638,075 | | |
| TOTAL ENERGY | | | 86,638,075 | | |
| | Shares
Held | | Value | |
FINANCIALS — 28.61%
Commercial Banks — 5.98% | |
| Comerica, Inc. | | | 232,300 | | | $ | 5,953,849 | | |
| KeyCorp | | | 1,330,103 | | | | 14,604,531 | | |
National City Corporation
(Acquired 4/21/2008; Cost $4,282,000) (r) | | | 856,400 | | | | 4,085,028 | | |
| Wachovia Corporation | | | 3,594,100 | | | | 55,816,373 | | |
| | | | 80,459,781 | | |
| Consumer Finance — 0.68% | |
| American Express Company | | | 188,400 | | | | 7,097,028 | | |
| Capital One Financial Corporation | | | 55,400 | | | | 2,105,754 | | |
| | | | 9,202,782 | | |
| Diversified Financial Services — 7.26% | |
| Bank of America Corporation | | | 1,483,122 | | | | 35,402,122 | | |
| Citigroup, Inc. | | | 1,923,100 | | | | 32,231,156 | | |
| JPMorgan Chase & Company | | | 878,800 | | | | 30,151,628 | | |
| | | | 97,784,906 | | |
| Insurance — 8.25% | |
| Conseco, Inc. (a) | | | 1,142,100 | | | | 11,329,632 | | |
| Genworth Financial, Inc. | | | 1,910,700 | | | | 34,029,567 | | |
| MetLife, Inc. | | | 364,000 | | | | 19,208,280 | | |
| The Travelers Companies, Inc. | | | 306,900 | | | | 13,319,460 | | |
| Unum Group | | | 1,052,100 | | | | 21,515,445 | | |
| XL Capital Limited | | | 569,100 | | | | 11,700,696 | | |
| | | | 111,103,080 | | |
| Thrifts & Mortgage Finance — 6.44% | |
| Freddie Mac | | | 2,858,800 | | | | 46,884,320 | | |
| Washington Mutual, Inc. (b) | | | 3,204,000 | | | | 15,795,720 | | |
Washington Mutual, Inc.
(Acquired 4/8/2008; Cost $42,662,500) (r) | | | 4,875,714 | | | | 24,037,269 | | |
| | | | 86,717,309 | | |
| TOTAL FINANCIALS | | | 385,267,858 | | |
The accompanying notes are an integral part of these financial statements.
11
Schedule of Investments — June 30, 2008
Hotchkis and Wiley Core Value Fund
| | Shares
Held | | Value | |
HEALTH CARE — 12.97%
Health Care Equipment & Supplies — 0.91% | |
| Covidien Limited | | | 254,100 | | | $ | 12,168,849 | | |
| Pharmaceuticals — 12.06% | |
| AstraZeneca PLC — ADR | | | 679,400 | | | | 28,894,882 | | |
| Bristol-Myers Squibb Company | | | 1,340,800 | | | | 27,526,624 | | |
| Eli Lilly & Company | | | 599,000 | | | | 27,649,840 | | |
| Johnson & Johnson | | | 198,100 | | | | 12,745,754 | | |
| Pfizer, Inc. | | | 1,571,600 | | | | 27,455,852 | | |
| Schering-Plough Corporation | | | 1,937,300 | | | | 38,145,437 | | |
| | | | 162,418,389 | | |
| TOTAL HEALTH CARE | | | 174,587,238 | | |
INDUSTRIALS — 7.74%
Aerospace & Defense — 2.80% | |
| Empresa Brasileira de Aeronautica SA — ADR | | | 352,500 | | | | 9,341,250 | | |
| Northrop Grumman Corporation | | | 424,800 | | | | 28,419,120 | | |
| | | | 37,760,370 | | |
| Air Freight & Logistics — 1.34% | |
| FedEx Corporation | | | 229,100 | | | | 18,050,789 | | |
| Industrial Conglomerates — 2.55% | |
| Tyco International Limited | | | 857,600 | | | | 34,338,304 | | |
| Machinery — 1.05% | |
| PACCAR, Inc. | | | 336,700 | | | | 14,084,161 | | |
| TOTAL INDUSTRIALS | | | 104,233,624 | | |
INFORMATION TECHNOLOGY — 15.93%
Communications Equipment — 1.47% | |
| Alcatel-Lucent — ADR (a) | | | 3,281,100 | | | | 19,817,844 | | |
| Electronic Equipment & Instruments — 2.10% | |
| Tyco Electronics Limited | | | 789,400 | | | | 28,276,308 | | |
| IT Services — 1.58% | |
| Electronic Data Systems Corporation | | | 863,300 | | | | 21,271,712 | | |
| Software — 10.78% | |
| CA, Inc. | | | 3,001,206 | | | | 69,297,846 | | |
| Microsoft Corporation | | | 1,989,000 | | | | 54,717,390 | | |
| Oracle Corporation (a) | | | 1,007,500 | | | | 21,157,500 | | |
| | | | 145,172,736 | | |
| TOTAL INFORMATION TECHNOLOGY | | | 214,538,600 | | |
MATERIALS — 3.29%
Chemicals — 3.29% | |
| The Dow Chemical Company | | | 1,169,900 | | | | 40,841,209 | | |
| Eastman Chemical Company | | | 51,000 | | | | 3,511,860 | | |
| | | | 44,353,069 | | |
| TOTAL MATERIALS | | | 44,353,069 | | |
| | Shares
Held | | Value | |
UTILITIES — 4.06%
Electric Utilities — 4.06% | |
| Entergy Corporation | | | 152,300 | | | $ | 18,349,104 | | |
| Exelon Corporation | | | 248,200 | | | | 22,328,072 | | |
| FPL Group, Inc. | | | 212,800 | | | | 13,955,424 | | |
| | | | 54,632,600 | | |
| TOTAL UTILITIES | | | 54,632,600 | | |
Total common stocks
(Cost $1,722,561,229) | | | 1,282,327,242 | | |
| CONVERTIBLE PREFERRED STOCKS — 2.63% | |
FINANCIALS — 2.63%
Commercial Banks — 2.63% | |
National City Corporation
(Acquired 4/21/2008; Cost $37,200,000) (f) (i) (r) | | | 372 | | | | 35,488,800 | | |
| TOTAL FINANCIALS | | | 35,488,800 | | |
Total convertible preferred stocks
(Cost $37,200,000) | | | 35,488,800 | | |
Total investments — 97.86%
(Cost $1,759,761,229) | | | 1,317,816,042 | | |
| Collateral for securities on loan^ — 1.20% | | | | | | | 16,192,365 | | |
| Time deposits* — 2.86% | | | | | | | 38,481,674 | | |
| Liabilities in excess of other assets — (1.92)% | | | | | | | (25,884,160 | ) | |
| Net assets — 100.00% | | $ | 1,346,605,921 | | |
(a) — Non-income producing security.
(b) — All or a portion of this security is on loan. The total market value of securites on loan was $15,852,983.
(f) — Fair valued security. The aggregate value of fair valued securities was $35,488,800, representing 2.63% of net assets.
(i) — Illiquid security.
(r) — Restricted security. Purchased in a private placement transaction; resale to the public may require registration. The total market value of restricted securities was $63,611,097, representing 4.72% of net assets.
ADR — American Depository Receipt.
^ — Collateral for securities on loan of $16,182,955 was invested in Royal Bank of Canada Repurchase Agreements which bear interest at 2.40% and mature on 7/1/2008. The repurchase proceeds are $16,184,034. The repurchase agreements are collateralized by United States Government & Agency Issues. The remaining collateral for securities on loan of $9,410 was held as cash.
* — Time deposits of $16,500,000 with JPMorgan Chase and $21,981,674 with Wells Fargo bear interest at 1.65% and mature on 7/1/2008. Invested through a cash management account administered by Brown Brothers Harriman & Co.
The accompanying notes are an integral part of these financial statements.
12
Schedule of Investments — June 30, 2008
Hotchkis and Wiley Large Cap Value Fund
| Largest Equity Holdings | | Percent of
net assets | |
| Royal Dutch Shell PLC - Class B - ADR | | | 5.20 | % | |
| CA, Inc. | | | 5.12 | % | |
| Microsoft Corporation | | | 4.28 | % | |
| Wachovia Corporation | | | 4.21 | % | |
| Freddie Mac | | | 3.46 | % | |
| Home Depot, Inc. | | | 3.44 | % | |
| Bank of America Corporation | | | 3.06 | % | |
| AstraZeneca PLC - ADR | | | 2.95 | % | |
| The Dow Chemical Company | | | 2.93 | % | |
| Eli Lilly & Company | | | 2.90 | % | |
COMMON
STOCKS — 97.93% | | Shares
Held | | Value | |
CONSUMER DISCRETIONARY — 11.38%
Household Durables — 1.04% | |
| Centex Corporation | | | 1,373,000 | | | $ | 18,357,010 | | |
| Lennar Corporation — Class B | | | 901,620 | | | | 10,007,982 | | |
| | | | 28,364,992 | | |
| Media — 0.37% | |
| Idearc, Inc. (b) | | | 4,282,100 | | | | 10,062,935 | | |
| Multiline Retail — 1.49% | |
| J.C. Penney Company, Inc. | | | 1,118,500 | | | | 40,590,365 | | |
| Specialty Retail — 7.07% | |
| AutoNation, Inc. (a) | | | 2,139,800 | | | | 21,440,796 | | |
| The Gap, Inc. | | | 2,894,200 | | | | 48,246,314 | | |
| Home Depot, Inc. | | | 4,008,747 | | | | 93,884,855 | | |
| Limited Brands, Inc. | | | 1,738,900 | | | | 29,300,465 | | |
| | | | 192,872,430 | | |
| Textiles, Apparel & Luxury Goods — 1.41% | |
| Jones Apparel Group, Inc. | | | 2,808,500 | | | | 38,616,875 | | |
| TOTAL CONSUMER DISCRETIONARY | | | 310,507,597 | | |
CONSUMER STAPLES — 3.64%
Food & Staples Retailing — 0.99% | |
| Wal-Mart Stores, Inc. | | | 482,700 | | | | 27,127,740 | | |
| Tobacco — 2.65% | |
| Altria Group, Inc. | | | 654,000 | | | | 13,446,240 | | |
| Philip Morris International, Inc. (a) | | | 1,191,200 | | | | 58,833,368 | | |
| | | | 72,279,608 | | |
| TOTAL CONSUMER STAPLES | | | 99,407,348 | | |
ENERGY — 6.36%
Oil, Gas & Consumable Fuels — 6.36% | |
| Royal Dutch Shell PLC — Class B — ADR | | | 1,770,700 | | | | 141,850,777 | | |
| Sunoco, Inc. | | | 774,100 | | | | 31,498,129 | | |
| | | | 173,348,906 | | |
| TOTAL ENERGY | | | 173,348,906 | | |
| | Shares
Held | | Value | |
FINANCIALS — 31.51%
Commercial Banks — 5.26% | |
| Comerica, Inc. | | | 906,200 | | | $ | 23,225,906 | | |
| National City Corporation | | | 1,099,800 | | | | 5,246,046 | | |
| Wachovia Corporation | | | 7,401,800 | | | | 114,949,954 | | |
| | | | 143,421,906 | | |
| Consumer Finance — 0.91% | |
| Capital One Financial Corporation | | | 649,900 | | | | 24,702,699 | | |
| Diversified Financial Services — 8.02% | |
| Bank of America Corporation | | | 3,497,833 | | | | 83,493,274 | | |
| Citigroup, Inc. | | | 3,728,800 | | | | 62,494,688 | | |
| JPMorgan Chase & Company | | | 2,118,200 | | | | 72,675,442 | | |
| | | | 218,663,404 | | |
| Insurance — 10.25% | |
| Genworth Financial, Inc. | | | 4,196,400 | | | | 74,737,884 | | |
| The Hanover Insurance Group, Inc. | | | 917,200 | | | | 38,981,000 | | |
| MetLife, Inc. | | | 1,313,300 | | | | 69,302,841 | | |
| Unum Group | | | 3,487,900 | | | | 71,327,555 | | |
| XL Capital Limited | | | 1,224,600 | | | | 25,177,776 | | |
| | | | 279,527,056 | | |
| Thrifts & Mortgage Finance — 7.07% | |
| Fannie Mae | | | 1,141,900 | | | | 22,278,469 | | |
| Freddie Mac | | | 5,752,300 | | | | 94,337,720 | | |
| Washington Mutual, Inc. (b) | | | 6,397,700 | | | | 31,540,661 | | |
Washington Mutual, Inc.
(Acquired 4/8/2008; Cost $79,518,625) (r) | | | 9,087,842 | | | | 44,803,060 | | |
| | | | 192,959,910 | | |
| TOTAL FINANCIALS | | | 859,274,975 | | |
The accompanying notes are an integral part of these financial statements.
13
Schedule of Investments — June 30, 2008
Hotchkis and Wiley Large Cap Value Fund
| | Shares
Held | | Value | |
HEALTH CARE — 11.29%
Pharmaceuticals — 11.29% | |
| AstraZeneca PLC — ADR | | | 1,891,500 | | | $ | 80,445,495 | | |
| Bristol-Myers Squibb Company | | | 2,918,900 | | | | 59,925,017 | | |
| Eli Lilly & Company | | | 1,710,700 | | | | 78,965,912 | | |
| Johnson & Johnson | | | 239,600 | | | | 15,415,864 | | |
| Pfizer, Inc. | | | 4,180,800 | | | | 73,038,576 | | |
| | | | 307,790,864 | | |
| TOTAL HEALTH CARE | | | 307,790,864 | | |
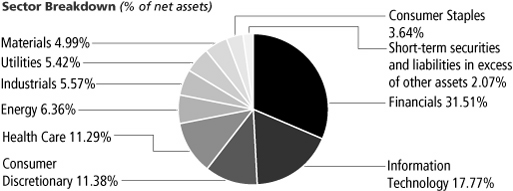
INDUSTRIALS — 5.57%
Aerospace & Defense — 1.62% | |
| Northrop Grumman Corporation | | | 660,200 | | | | 44,167,380 | | |
| Industrial Conglomerates — 2.67% | |
| Tyco International Limited | | | 1,818,900 | | | | 72,828,756 | | |
| Machinery — 1.28% | |
| PACCAR, Inc. | | | 835,500 | | | | 34,948,965 | | |
| TOTAL INDUSTRIALS | | | 151,945,101 | | |
INFORMATION TECHNOLOGY — 17.77%
Communications Equipment — 1.73% | |
| Alcatel-Lucent — ADR (a) | | | 7,829,600 | | | | 47,290,784 | | |
| Electronic Equipment & Instruments — 2.17% | |
| Tyco Electronics Limited | | | 1,651,500 | | | | 59,156,730 | | |
| IT Services — 2.84% | |
| Electronic Data Systems Corporation | | | 3,138,700 | | | | 77,337,568 | | |
| Software — 11.03% | |
| BMC Software, Inc. (a) | | | 1,239,300 | | | | 44,614,800 | | |
| CA, Inc. | | | 6,044,741 | | | | 139,573,069 | | |
| Microsoft Corporation | | | 4,240,600 | | | | 116,658,906 | | |
| | | | 300,846,775 | | |
| TOTAL INFORMATION TECHNOLOGY | | | 484,631,857 | | |
MATERIALS — 4.99%
Chemicals — 4.99% | |
| The Dow Chemical Company | | | 2,285,500 | | | | 79,786,805 | | |
| Eastman Chemical Company | | | 816,800 | | | | 56,244,848 | | |
| | | | 136,031,653 | | |
| TOTAL MATERIALS | | | 136,031,653 | | |
| | Shares
Held | | Value | |
UTILITIES — 5.42%
Electric Utilities — 5.42% | |
| Entergy Corporation | | | 222,900 | | | $ | 26,854,992 | | |
| Exelon Corporation | | | 795,200 | | | | 71,536,192 | | |
| FPL Group, Inc. | | | 754,300 | | | | 49,466,994 | | |
| | | | 147,858,178 | | |
| TOTAL UTILITIES | | | 147,858,178 | | |
Total investments — 97.93%
(Cost $3,625,807,620) | | | 2,670,796,479 | | |
| Collateral for securities on loan^ — 1.21% | | | | | | | 32,986,230 | | |
| Time deposit* — 2.43% | | | | | | | 66,290,570 | | |
| Liabilities in excess of other assets — (1.57)% | | | | | | | (42,714,364 | ) | |
| Net assets — 100.00% | | $ | 2,727,358,915 | | |
(a) — Non-income producing security.
(b) — All or a portion of this security is on loan. The total market value of securities on loan was $32,310,749.
(r) — Restricted security. Purchased in a private placement transaction; resale to the public may require registration. The total market value of restricted securities was $44,803,060, representing 1.64% of net assets.
ADR — American Depository Receipt.
^ — Collateral for securities on loan of $32,967,061 was invested in Royal Bank of Canada Repurchase Agreements which bear interest at 2.40% and mature on 7/1/2008. The repurchase proceeds are $32,969,259. The repurchase agreements are collateralized by United States Government & Agency Issues. The remaining collateral for securities on loan of $19,169 was held as cash.
* — Time deposit with Bank of America bears interest at 1.65% and matures on 7/1/2008. Invested through a cash management account administered by Brown Brothers Harriman & Co.
The accompanying notes are an integral part of these financial statements.
14
Schedule of Investments — June 30, 2008
Hotchkis and Wiley Mid-Cap Value Fund

| Largest Equity Holdings | | Percent of
net assets | |
| CA, Inc. | | | 5.25 | % | |
| Electronic Data Systems Corporation | | | 4.21 | % | |
| National City Corporation | | | 4.17 | % | |
| Eastman Chemical Company | | | 4.10 | % | |
| Safeway, Inc. | | | 3.69 | % | |
| Limited Brands, Inc. | | | 3.68 | % | |
| Jones Apparel Group, Inc. | | | 3.40 | % | |
| BMC Software, Inc. | | | 3.22 | % | |
| Interpublic Group of Companies, Inc. | | | 3.18 | % | |
| FPL Group, Inc. | | | 3.16 | % | |
COMMON
STOCKS — 94.15% | | Shares
Held | | Value | |
CONSUMER DISCRETIONARY — 20.74%
Auto Components — 0.73% | |
| Magna International, Inc. | | | 252,300 | | | $ | 14,946,252 | | |
| Household Durables — 0.18% | |
| Centex Corporation | | | 273,200 | | | | 3,652,684 | | |
| Media — 5.38% | |
| Citadel Broadcasting Corporation (a) (b) (c) | | | 16,071,900 | | | | 19,607,718 | | |
| Idearc, Inc. | | | 367,900 | | | | 864,565 | | |
| Interpublic Group of Companies, Inc. (a) | | | 7,550,900 | | | | 64,937,740 | | |
| R.H. Donnelley Corporation (a) (b) | | | 1,141,866 | | | | 3,425,598 | | |
| Valassis Communications, Inc. (a) | | | 1,662,400 | | | | 20,813,248 | | |
| | | | 109,648,869 | | |
| Specialty Retail — 10.82% | |
| AutoNation, Inc. (a) | | | 4,072,500 | | | | 40,806,450 | | |
| Foot Locker, Inc. | | | 3,174,600 | | | | 39,523,770 | | |
| The Gap, Inc. | | | 623,600 | | | | 10,395,412 | | |
| Limited Brands, Inc. | | | 4,461,800 | | | | 75,181,330 | | |
| Rent-A-Center, Inc. (a) | | | 2,671,000 | | | | 54,942,470 | | |
| | | | 220,849,432 | | |
| Textiles, Apparel & Luxury Goods — 3.63% | |
| Jones Apparel Group, Inc. (c) | | | 5,045,300 | | | | 69,372,875 | | |
| Liz Claiborne, Inc. | | | 332,700 | | | | 4,707,705 | | |
| | | | 74,080,580 | | |
| TOTAL CONSUMER DISCRETIONARY | | | 423,177,817 | | |
CONSUMER STAPLES — 3.69%
Food & Staples Retailing — 3.69% | |
| Safeway, Inc. | | | 2,638,400 | | | | 75,326,320 | | |
| TOTAL CONSUMER STAPLES | | | 75,326,320 | | |
ENERGY — 2.20%
Oil, Gas & Consumable Fuels — 2.20% | |
| Sunoco, Inc. | | | 1,105,000 | | | | 44,962,450 | | |
| TOTAL ENERGY | | | 44,962,450 | | |
| | Shares
Held | | Value | |
FINANCIALS — 28.21%
Commercial Banks — 8.51% | |
| Comerica, Inc. | | | 1,693,300 | | | $ | 43,399,279 | | |
| Fifth Third Bancorp | | | 675,200 | | | | 6,873,536 | | |
| First Horizon National Corporation (b) | | | 6,041,500 | | | | 44,888,345 | | |
| KeyCorp | | | 5,862,320 | | | | 64,368,274 | | |
National City Corporation
(Acquired 4/21/2008; Cost $9,183,500) (r) | | | 1,836,700 | | | | 8,761,059 | | |
| SunTrust Banks, Inc. | | | 145,700 | | | | 5,277,254 | | |
| | | | 173,567,747 | | |
| Consumer Finance — 0.72% | |
| Discover Financial Services | | | 1,119,300 | | | | 14,741,181 | | |
| Diversified Financial Services — 0.65% | |
| CIT Group, Inc. | | | 1,956,000 | | | | 13,320,360 | | |
| Insurance — 12.16% | |
| CNA Financial Corporation | | | 1,302,824 | | | | 32,766,023 | | |
| Conseco, Inc. (a) | | | 6,197,000 | | | | 61,474,240 | | |
| Genworth Financial, Inc. | | | 3,061,700 | | | | 54,528,877 | | |
| The Hanover Insurance Group, Inc. | | | 870,100 | | | | 36,979,250 | | |
| Unum Group | | | 1,998,500 | | | | 40,869,325 | | |
| XL Capital Limited | | | 1,041,200 | | | | 21,407,072 | | |
| | | | 248,024,787 | | |
| Real Estate Management & Development — 2.79% | |
| MI Developments, Inc. (c) | | | 2,533,400 | | | | 56,976,166 | | |
| Thrifts & Mortgage Finance — 3.38% | |
| Sovereign Bancorp, Inc. | | | 662,300 | | | | 4,874,528 | | |
| Washington Mutual, Inc. | | | 50,500 | | | | 248,965 | | |
Washington Mutual, Inc.
(Acquired 4/8/2008; Cost $113,325,125) (r) | | | 12,951,441 | | | | 63,850,606 | | |
| | | | 68,974,099 | | |
| TOTAL FINANCIALS | | | 575,604,340 | | |
The accompanying notes are an integral part of these financial statements.
15
Schedule of Investments — June 30, 2008
Hotchkis and Wiley Mid-Cap Value Fund
| | Shares
Held | | Value | |
HEALTH CARE — 3.67%
Health Care Providers & Services — 1.37% | |
| Lincare Holdings, Inc. (a) | | | 982,200 | | | $ | 27,894,480 | | |
| Pharmaceuticals — 2.30% | |
| King Pharmaceuticals, Inc. (a) | | | 4,481,700 | | | | 46,923,399 | | |
| TOTAL HEALTH CARE | | | 74,817,879 | | |
INDUSTRIALS — 7.76%
Aerospace & Defense — 1.13% | |
| Empresa Brasileira de Aeronautica SA — ADR | | | 874,200 | | | | 23,166,300 | | |
| Commercial Services & Supplies — 6.63% | |
| IKON Office Solutions, Inc. (c) | | | 5,061,281 | | | | 57,091,250 | | |
| Manpower, Inc. | | | 897,100 | | | | 52,247,104 | | |
| PHH Corporation (a) | | | 1,687,400 | | | | 25,901,590 | | |
| | | | 135,239,944 | | |
| TOTAL INDUSTRIALS | | | 158,406,244 | | |
INFORMATION TECHNOLOGY — 17.63%
Communications Equipment — 1.44% | |
| Alcatel-Lucent — ADR (a) | | | 3,602,000 | | | | 21,756,080 | | |
| Tellabs, Inc. (a) | | | 1,624,100 | | | | 7,552,065 | | |
| | | | 29,308,145 | | |
| Electronic Equipment & Instruments — 0.30% | |
| Tyco Electronics Limited | | | 172,100 | | | | 6,164,622 | | |
| IT Services — 4.33% | |
| Electronic Data Systems Corporation | | | 3,488,200 | | | | 85,949,248 | | |
| Unisys Corporation (a) | | | 587,700 | | | | 2,321,415 | | |
| | | | 88,270,663 | | |
| Semiconductor & Semiconductor Equipment — 2.33% | |
| Maxim Integrated Products, Inc. | | | 1,181,600 | | | | 24,990,840 | | |
| ON Semiconductor Corp. (a) | | | 2,459,700 | | | | 22,555,449 | | |
| | | | 47,546,289 | | |
| Software — 9.23% | |
| BMC Software, Inc. (a) | | | 1,826,900 | | | | 65,768,400 | | |
| CA, Inc. | | | 4,637,544 | | | | 107,080,891 | | |
| Novell, Inc. (a) | | | 2,646,900 | | | | 15,590,241 | | |
| | | | 188,439,532 | | |
| TOTAL INFORMATION TECHNOLOGY | | | 359,729,251 | | |
MATERIALS — 4.10%
Chemicals — 4.10% | |
| Eastman Chemical Company | | | 1,215,200 | | | | 83,678,672 | | |
| TOTAL MATERIALS | | | 83,678,672 | | |
| | Shares
Held | | Value | |
UTILITIES — 6.15%
Electric Utilities — 6.15% | |
| FPL Group, Inc. | | | 982,700 | | | $ | 64,445,466 | | |
| Great Plains Energy, Inc. | | | 1,349,800 | | | | 34,122,944 | | |
| Portland General Electric Company | | | 1,196,000 | | | | 26,933,920 | | |
| | | | 125,502,330 | | |
| TOTAL UTILITIES | | | 125,502,330 | | |
Total common stocks
(Cost $2,525,019,389) | | | 1,921,205,303 | | |
| CONVERTIBLE PREFERRED STOCKS — 3.74% | |
FINANCIALS — 3.74%
Commercial Banks — 3.74% | |
National City Corporation
(Acquired 4/21/2008; Cost $80,100,000) (f) (i) (r) | | | 801 | | | | 76,415,400 | | |
| TOTAL FINANCIALS | | | 76,415,400 | | |
Total convertible preferred stocks
(Cost $80,100,000) | | | 76,415,400 | | |
Total investments — 97.89%
(Cost $2,605,119,389) | | | 1,997,620,703 | | |
| Collateral for securities on loan^ — 2.06% | | | | | | | 42,078,445 | | |
| Time deposit* — 2.01% | | | | | | | 40,917,176 | | |
| Liabilities in excess of other assets — (1.96)% | | | | | | | (39,946,574 | ) | |
| Net assets — 100.00% | | $ | 2,040,669,750 | | |
(a) — Non-income producing security.
(b) — All or a portion of this security is on loan. The total market value of securities on loan was $40,777,607.
(c) — Affiliated issuer. See Note 6 in Notes to the Financial Statements.
(f) — Fair valued security. The aggregate value of fair valued securities was $76,415,400, representing 3.74% of net assets.
(i) — Illiquid security.
(r) — Restricted security. Purchased in a private placement transaction; resale to the public may require registration. The total market value of restricted securities was $149,027,065, representing 7.30% of net assets.
ADR — American Depository Receipt.
^ — Collateral for securities on loan of $42,053,992 was invested in Royal Bank of Canada Repurchase Agreements which bear interest at 2.40% and mature on 7/1/2008. The repurchase proceeds are $42,056,795. The repurchase agreements are collateralized by United States Government & Agency Issues. The remaining collateral for securities on loan of $24,453 was held as cash.
* — Time deposit with Bank of America bears interest at 1.65% and matures on 7/1/2008. Invested through a cash management account administered by Brown Brothers Harriman & Co.
The accompanying notes are an integral part of these financial statements.
16
Schedule of Investments — June 30, 2008
Hotchkis and Wiley Small Cap Value Fund
| Largest Equity Holdings | | Percent of
net assets | |
| MI Developments, Inc. | | | 4.89 | % | |
| Hudson Highland Group, Inc. | | | 4.68 | % | |
| Great Plains Energy, Inc. | | | 4.45 | % | |
| Foundation Coal Holdings, Inc. | | | 4.36 | % | |
| Quicksilver, Inc. | | | 4.19 | % | |
| Employers Holdings, Inc. | | | 3.92 | % | |
| CapLease, Inc. | | | 3.70 | % | |
| The Hanover Insurance Group, Inc. | | | 3.45 | % | |
| United America Indemnity Limited | | | 3.27 | % | |
| Sotheby's | | | 3.18 | % | |
COMMON
STOCKS — 96.09% | | Shares
Held | | Value | |
CONSUMER DISCRETIONARY — 27.62%
Diversified Consumer Services — 3.76% | |
| Corinthian Colleges, Inc. (a) | | | 170,000 | | | $ | 1,973,700 | | |
| Sotheby's (b) | | | 409,100 | | | | 10,787,967 | | |
| | | | 12,761,667 | | |
| Hotels, Restaurants & Leisure — 2.29% | |
| Lodgian, Inc. (a) | | | 994,109 | | | | 7,783,874 | | |
| Household Durables — 0.77% | |
| California Coastal Communities, Inc. (a) (b) | | | 341,200 | | | | 1,303,384 | | |
| Russ Berrie & Company, Inc. (a) | | | 166,200 | | | | 1,324,614 | | |
| | | | 2,627,998 | | |
| Media — 4.82% | |
| Valassis Communications, Inc. (a) | | | 762,500 | | | | 9,546,500 | | |
| Westwood One, Inc. (a) (c) | | | 5,487,500 | | | | 6,804,500 | | |
| | | | 16,351,000 | | |
| Specialty Retail — 4.95% | |
| Asbury Automotive Group, Inc. | | | 124,700 | | | | 1,602,395 | | |
| AutoNation, Inc. (a) | | | 430,100 | | | | 4,309,602 | | |
| Pacific Sunwear of California (a) | | | 105,900 | | | | 903,327 | | |
| Rent-A-Center, Inc. (a) | | | 486,000 | | | | 9,997,020 | | |
| | | | 16,812,344 | | |
| Textiles, Apparel & Luxury Goods — 11.03% | |
| Jones Apparel Group, Inc. | | | 455,900 | | | | 6,268,625 | | |
| K-Swiss, Inc. | | | 93,600 | | | | 1,375,920 | | |
| Phillips-Van Heusen | | | 131,000 | | | | 4,797,220 | | |
| Quiksilver, Inc. (a) | | | 1,449,200 | | | | 14,231,144 | | |
| Steven Madden Limited (a) | | | 66,000 | | | | 1,213,080 | | |
| The Warnaco Group, Inc. (a) | | | 217,600 | | | | 9,589,632 | | |
| | | | 37,475,621 | | |
| TOTAL CONSUMER DISCRETIONARY | | | 93,812,504 | | |
| | Shares
Held | | Value | |
CONSUMER STAPLES — 0.00%
Food & Staples Retailing — 0.00% | |
| The Great Atlantic & Pacific Tea Company, Inc. (a) | | | 72 | | | $ | 1,643 | | |
| TOTAL CONSUMER STAPLES | | | 1,643 | | |
ENERGY — 4.36%
Oil, Gas & Consumable Fuels — 4.36% | |
| Foundation Coal Holdings, Inc. | | | 167,300 | | | | 14,819,434 | | |
| TOTAL ENERGY | | | 14,819,434 | | |
FINANCIALS — 30.19%
Commercial Banks — 4.84% | |
| First Horizon National Corporation (b) | | | 926,000 | | | | 6,880,180 | | |
| Webster Financial Corporation | | | 513,000 | | | | 9,541,800 | | |
| | | | 16,421,980 | | |
| Insurance — 11.80% | |
| Employers Holdings, Inc. | | | 642,600 | | | | 13,301,820 | | |
| The Hanover Insurance Group, Inc. | | | 275,400 | | | | 11,704,500 | | |
| PMA Capital Corporation (a) | | | 376,900 | | | | 3,471,249 | | |
| Quanta Capital Holdings Limited | | | 186,000 | | | | 491,040 | | |
| United America Indemnity Limited (a) | | | 830,928 | | | | 11,109,507 | | |
| | | | 40,078,116 | | |
| Real Estate Investment Trusts — 8.53% | |
| CapLease, Inc. | | | 1,677,700 | | | | 12,565,973 | | |
| Lexington Realty Trust (b) | | | 414,000 | | | | 5,642,820 | | |
| U-Store-It Trust | | | 901,200 | | | | 10,769,340 | | |
| | | | 28,978,133 | | |
| Real Estate Management & Development — 4.89% | |
| MI Developments, Inc. | | | 738,400 | | | | 16,606,616 | | |
| Thrifts & Mortgage Finance — 0.13% | |
| Home Federal Bancorp, Inc. | | | 44,100 | | | | 434,826 | | |
| TOTAL FINANCIALS | | | 102,519,671 | | |
The accompanying notes are an integral part of these financial statements.
17
Schedule of Investments — June 30, 2008
Hotchkis and Wiley Small Cap Value Fund
| | Shares
Held | | Value | |
HEALTH CARE — 3.28%
Health Care Providers & Services — 1.24% | |
| Lincare Holdings, Inc. (a) | | | 147,900 | | | $ | 4,200,360 | | |
| Pharmaceuticals — 2.04% | |
| King Pharmaceuticals, Inc. (a) | | | 663,200 | | | | 6,943,704 | | |
| TOTAL HEALTH CARE | | | 11,144,064 | | |
INDUSTRIALS — 17.34%
Commercial Services & Supplies — 14.57% | |
| Heidrick & Struggles International, Inc. | | | 66,000 | | | | 1,824,240 | | |
| Hudson Highland Group, Inc. (a) (c) | | | 1,517,900 | | | | 15,892,413 | | |
| IKON Office Solutions, Inc. | | | 930,300 | | | | 10,493,784 | | |
| Kelly Services, Inc. — Class A | | | 418,100 | | | | 8,081,873 | | |
| PHH Corporation (a) | | | 434,200 | | | | 6,664,970 | | |
| Spherion Corporation (a) | | | 1,412,700 | | | | 6,526,674 | | |
| | | | 49,483,954 | | |
| Machinery — 2.77% | |
| Miller Industries, Inc. (a) (c) | | | 946,400 | | | | 9,426,144 | | |
| TOTAL INDUSTRIALS | | | 58,910,098 | | |
INFORMATION TECHNOLOGY — 7.24%
IT Services — 1.41% | |
| Ness Technologies, Inc. (a) | | | 130,000 | | | | 1,315,600 | | |
| Patni Computer Systems Limited — ADR | | | 278,400 | | | | 2,795,136 | | |
| Unisys Corporation (a) | | | 173,900 | | | | 686,905 | | |
| | | | 4,797,641 | | |
| Semiconductor & Semiconductor Equipment — 2.73% | |
| ON Semiconductor Corporation (a) | | | 1,011,100 | | | | 9,271,787 | | |
| Software — 3.10% | |
| Lawson Software, Inc. (a) | | | 666,000 | | | | 4,841,820 | | |
| Novell, Inc. (a) | | | 961,800 | | | | 5,665,002 | | |
| | | | 10,506,822 | | |
| TOTAL INFORMATION TECHNOLOGY | | | 24,576,250 | | |
MATERIALS — 0.37%
Chemicals — 0.37% | |
| Tronox, Inc. — Class A (b) | | | 153,300 | | | | 484,428 | | |
| Tronox, Inc. — Class B | | | 255,100 | | | | 770,402 | | |
| | | | 1,254,830 | | |
| TOTAL MATERIALS | | | 1,254,830 | | |
| | Shares
Held | | Value | |
UTILITIES — 5.69%
Electric Utilities — 5.69% | |
| Great Plains Energy, Inc. | | | 598,000 | | | $ | 15,117,440 | | |
| Portland General Electric Company | | | 187,200 | | | | 4,215,744 | | |
| | | | 19,333,184 | | |
| TOTAL UTILITIES | | | 19,333,184 | | |
Total investments — 96.09%
(Cost $385,362,811) | | | 326,371,678 | | |
| Collateral for securities on loan^ — 4.48% | | | | | 15,204,828 | | |
| Time deposit* — 3.15% | | | | | 10,690,356 | | |
| Liabilities in excess of other assets — (3.72)% | | | | | (12,633,944 | ) | |
| Net assets — 100.00% | | $ | 339,632,918 | | |
(a) — Non-income producing security.
(b) — All or a portion of this security is on loan. The total market value of securities on loan was $14,752,126.
(c) — Affiliated issuer. See Note 6 in Notes to the Financial Statements.
ADR — American Depository Receipt.
^ — Collateral for securities on loan of $15,195,992 was invested in Royal Bank of Canada Repurchase Agreements which bear interest at 2.40% and mature on 7/1/2008. The repurchase proceeds are $15,197,005. The repurchase agreements are collateralized by United States Government & Agency Issues. The remaining collateral for securities on loan of $8,836 was held as cash.
* — Time deposit with Bank of America bears interest at 1.65% and matures on 7/1/2008. Invested through a cash management account administered by Brown Brothers Harriman & Co.
The accompanying notes are an integral part of these financial statements.
18
Schedule of Investments — June 30, 2008
Hotchkis and Wiley All Cap Value Fund

| Largest Equity Holdings | | Percent of
net assets | |
| Philip Morris International, Inc. | | | 11.87 | % | |
| Hudson Highland Group, Inc. | | | 10.57 | % | |
| Washington Mutual, Inc. | | | 8.36 | % | |
| MI Developments, Inc. | | | 7.99 | % | |
| CA, Inc. | | | 6.56 | % | |
| Exelon Corporation | | | 5.02 | % | |
| Miller Industries, Inc. | | | 4.90 | % | |
| Electronic Data Systems Corporation | | | 4.58 | % | |
| Microsoft Corporation | | | 4.54 | % | |
| American Express Company | | | 4.35 | % | |
COMMON
STOCKS — 98.87% | | Shares
Held | | Value | |
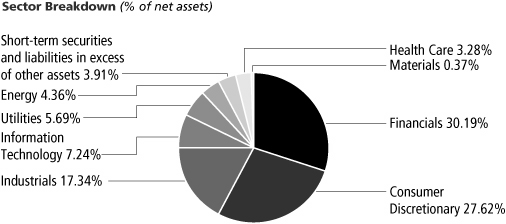
CONSUMER DISCRETIONARY — 4.75%
Hotels, Restaurants & Leisure — 2.45% | |
| Lodgian, Inc. (a) | | | 185,500 | | | $ | 1,452,465 | | |
| Media — 0.36% | |
| Westwood One, Inc. (a) | | | 172,600 | | | | 214,024 | | |
| Specialty Retail — 1.94% | |
| Home Depot, Inc. | | | 49,000 | | | | 1,147,580 | | |
| TOTAL CONSUMER DISCRETIONARY | | | 2,814,069 | | |
CONSUMER STAPLES — 11.87%
Tobacco — 11.87% | |
| Philip Morris International, Inc. (a) | | | 142,500 | | | | 7,038,075 | | |
| TOTAL CONSUMER STAPLES | | | 7,038,075 | | |
ENERGY — 2.41%
Oil, Gas & Consumable Fuels — 2.41% | |
| Royal Dutch Shell PLC — Class B — ADR | | | 17,800 | | | | 1,425,958 | | |
| TOTAL ENERGY | | | 1,425,958 | | |
FINANCIALS — 24.02%
Consumer Finance — 4.35% | |
| American Express Company | | | 68,400 | | | | 2,576,628 | | |
| Insurance — 3.32% | |
| Genworth Financial, Inc. | | | 89,100 | | | | 1,586,871 | | |
| XL Capital Limited | | | 18,400 | | | | 378,304 | | |
| | | | 1,965,175 | | |
| Real Estate Management & Development — 7.99% | |
| MI Developments, Inc. | | | 210,500 | | | | 4,734,145 | | |
| Thrifts & Mortgage Finance — 8.36% | |
Washington Mutual, Inc.
(Acquired 4/8/2008; Cost $8,800,000) (r) | | | 1,005,714 | | | | 4,958,171 | | |
| TOTAL FINANCIALS | | | 14,234,119 | | |
| | Shares
Held | | Value | |
HEALTH CARE — 7.37%
Pharmaceuticals — 7.37% | |
| AstraZeneca PLC — ADR | | | 59,800 | | | $ | 2,543,294 | | |
| Eli Lilly & Company | | | 12,200 | | | | 563,152 | | |
| Pfizer, Inc. | | | 72,400 | | | | 1,264,828 | | |
| | | | 4,371,274 | | |
| TOTAL HEALTH CARE | | | 4,371,274 | | |
INDUSTRIALS — 17.46%
Commercial Services & Supplies — 10.57% | |
| Hudson Highland Group, Inc. (a) | | | 598,700 | | | | 6,268,389 | | |
| Industrial Conglomerates — 1.99% | |
| Tyco International Limited | | | 29,425 | | | | 1,178,177 | | |
| Machinery — 4.90% | |
| Miller Industries, Inc. (a) | | | 291,398 | | | | 2,902,324 | | |
| TOTAL INDUSTRIALS | | | 10,348,890 | | |
INFORMATION TECHNOLOGY — 18.68%
IT Services — 4.58% | |
| Electronic Data Systems Corporation | | | 110,100 | | | | 2,712,864 | | |
| Software — 14.10% | |
| CA, Inc. | | | 168,300 | | | | 3,886,047 | | |
| Microsoft Corporation | | | 97,900 | | | | 2,693,229 | | |
| Oracle Corporation (a) | | | 84,700 | | | | 1,778,700 | | |
| | | | 8,357,976 | | |
| TOTAL INFORMATION TECHNOLOGY | | | 11,070,840 | | |
MATERIALS — 5.34%
Chemicals — 5.34% | |
| The Dow Chemical Company | | | 65,200 | | | | 2,276,132 | | |
| Eastman Chemical Company | | | 12,900 | | | | 888,294 | | |
| | | | 3,164,426 | | |
| TOTAL MATERIALS | | | 3,164,426 | | |
The accompanying notes are an integral part of these financial statements.
19
Schedule of Investments — June 30, 2008
Hotchkis and Wiley All Cap Value Fund
| | Shares
Held | | Value | |
UTILITIES — 6.97%
Electric Utilities — 6.97% | |
| Entergy Corporation | | | 9,600 | | | $ | 1,156,608 | | |
| Exelon Corporation | | | 33,100 | | | | 2,977,676 | | |
| | | | 4,134,284 | | |
| TOTAL UTILITIES | | | 4,134,284 | | |
Total investments — 98.87%
(Cost $68,753,172) | | | 58,601,935 | | |
| Time deposit* — 3.76% | | | | | 2,227,282 | | |
| Liabilities in excess of other assets — (2.63)% | | | | | (1,557,630 | ) | |
| Net assets — 100.00% | | $ | 59,271,587 | | |
(a) — Non-income producing security.
(r) — Restricted security. Purchased in a private placement transaction; resale to the public may require registration. The total market value of restricted securities was $4,958,171, representing 8.36% of net assets.
ADR — American Depository Receipt.
* — Time deposit with Wells Fargo bears interest at 1.65% and matures on 7/1/2008. Invested through a cash management account administered by Brown Brothers Harriman & Co.
The accompanying notes are an integral part of these financial statements.
20
(This page intentionally left blank)
Statements of Assets & Liabilities
JUNE 30, 2008
| | | Core Value
Fund | | Large Cap Value
Fund | | Mid-Cap Value
Fund | | Small Cap Value
Fund | | All Cap Value
Fund | |
| Assets: | |
| Investments, at value* | |
| Unaffiliated issuers | | $ | 1,317,816,042 | | | $ | 2,670,796,479 | | | $ | 1,794,572,694 | | | $ | 294,248,621 | | | $ | 58,601,935 | | |
| Affiliated issuers | | | — | | | | — | | | | 203,048,009 | | | | 32,123,057 | | | | — | | |
| Collateral for securities on loan | | | 16,192,365 | | | | 32,986,230 | | | | 42,078,445 | | | | 15,204,828 | | | | — | | |
| Time deposit | | | 38,481,674 | | | | 66,290,570 | | | | 40,917,176 | | | | 10,690,356 | | | | 2,227,282 | | |
| Dividends and interest receivable | | | 1,425,467 | | | | 3,031,379 | | | | 3,793,960 | | | | 752,998 | | | | 105,274 | | |
| Receivable for investments sold | | | 2,618,206 | | | | 14,242,976 | | | | 10,083,134 | | | | 2,175,686 | | | | 557,070 | | |
| Receivable for Fund shares sold | | | 4,887,545 | | | | 17,577,206 | | | | 3,245,860 | | | | 450,220 | | | | 3,056 | | |
| Other assets | | | 32,192 | | | | 99,741 | | | | 58,968 | | | | 17,649 | | | | 5,417 | | |
| Total assets | | $ | 1,381,453,491 | | | $ | 2,805,024,581 | | | $ | 2,097,798,246 | | | $ | 355,663,415 | | | $ | 61,500,034 | | |
| Liabilities: | |
| Collateral for securities on loan | | $ | 16,192,365 | | | $ | 32,986,230 | | | $ | 42,078,445 | | | $ | 15,204,828 | | | $ | — | | |
| Payable for investments purchased | | | 11,641,339 | | | | 8,712,714 | | | | 6,902,705 | | | | — | | | | 1,825,535 | | |
| Payable for Fund shares repurchased | | | 4,454,068 | | | | 30,434,619 | | | | 4,644,121 | | | | 303,147 | | | | 199,293 | | |
| Payable to Advisor | | | 875,029 | | | | 1,874,460 | | | | 1,390,542 | | | | 221,720 | | | | 39,892 | | |
| Accrued expenses and other liabilities | | | 1,684,769 | | | | 3,657,643 | | | | 2,112,683 | | | | 300,802 | | | | 163,727 | | |
| Total liabilities | | | 34,847,570 | | | | 77,665,666 | | | | 57,128,496 | | | | 16,030,497 | | | | 2,228,447 | | |
| Net assets | | $ | 1,346,605,921 | | | $ | 2,727,358,915 | | | $ | 2,040,669,750 | | | $ | 339,632,918 | | | $ | 59,271,587 | | |
| Net Assets consist of: | |
| Paid in capital | | $ | 1,954,052,526 | | | $ | 3,700,919,765 | | | $ | 2,833,432,202 | | | $ | 394,964,011 | | | $ | 70,159,402 | | |
| Undistributed net investment income | | | 14,792,750 | | | | 30,050,259 | | | | 7,583,445 | | | | 1,485,015 | | | | 96,308 | | |
| Undistributed net realized gain (loss) on securities | | | (180,294,168 | ) | | | (48,599,968 | ) | | | (192,847,211 | ) | | | 2,175,025 | | | | (832,886 | ) | |
| Net unrealized depreciation of securities | | | (441,945,187 | ) | | | (955,011,141 | ) | | | (607,498,686 | ) | | | (58,991,133 | ) | | | (10,151,237 | ) | |
| Net assets | | $ | 1,346,605,921 | | | $ | 2,727,358,915 | | | $ | 2,040,669,750 | | | $ | 339,632,918 | | | $ | 59,271,587 | | |
Calculation of Net Asset Value Per Share and
Public Offering Price Per Share — Class I | |
| Net assets | | $ | 1,132,685,155 | | | $ | 1,168,499,292 | | | $ | 1,551,863,173 | | | $ | 291,514,715 | | | $ | 22,921,314 | | |
Shares outstanding (unlimited shares $0.001
par value authorized) | | | 118,310,854 | | | | 71,544,741 | | | | 88,958,820 | | | | 9,203,486 | | | | 1,670,814 | | |
| Net asset value per share | | $ | 9.57 | | | $ | 16.33 | | | $ | 17.44 | | | $ | 31.67 | | | $ | 13.72 | | |
| Calculation of Net Asset Value Per Share — Class A | |
| Net assets | | $ | 168,159,853 | | | $ | 1,397,045,266 | | | $ | 415,674,377 | | | $ | 43,959,453 | | | $ | 22,729,392 | | |
Shares outstanding (unlimited shares $0.001
par value authorized) | | | 17,591,004 | | | | 85,993,042 | | | | 23,996,244 | | | | 1,387,231 | | | | 1,658,759 | | |
| Net asset value per share | | $ | 9.56 | | | $ | 16.25 | | | $ | 17.32 | | | $ | 31.69 | | | $ | 13.70 | | |
| Public Offering Price Per Share — Class A | |
| (Net asset value per share divided by 0.9475) | | $ | 10.09 | | | $ | 17.15 | | | $ | 18.28 | | | $ | 33.45 | | | $ | 14.46 | | |
Calculation of Net Asset Value Per Share and
Public Offering Price Per Share — Class C | |
| Net assets | | $ | 45,760,913 | | | $ | 116,946,916 | | | $ | 60,544,129 | | | $ | 4,158,750 | | | $ | 13,620,881 | | |
Shares outstanding (unlimited shares $0.001
par value authorized) | | | 4,864,047 | | | | 7,313,842 | | | | 3,691,206 | | | | 141,609 | | | | 1,033,174 | | |
| Net asset value per share | | $ | 9.41 | | | $ | 15.99 | | | $ | 16.40 | | | $ | 29.37 | | | $ | 13.18 | | |
Calculation of Net Asset Value Per Share and
Public Offering Price Per Share — Class R | |
| Net assets | | | | | | $ | 44,867,441 | | | $ | 12,588,071 | | | | | | | | | | |
Shares outstanding (unlimited shares $0.001
par value authorized) | | | | | | | 2,741,640 | | | | 719,878 | | | | | | | | | | |
| Net asset value per share | | | | | | $ | 16.37 | | | $ | 17.49 | | | | | | | | | | |
| *Cost of investments | |
| Unaffiliated issuers | | $ | 1,759,761,229 | | | $ | 3,625,807,620 | | | $ | 2,254,999,212 | | | $ | 308,567,444 | | | $ | 68,753,172 | | |
| Affiliated issuers | | | — | | | | — | | | | 350,120,177 | | | | 76,795,367 | | | | — | | |
The accompanying notes are an integral part of these financial statements.
22
Statements of Operations
FOR THE YEAR ENDED JUNE 30, 2008
| | | Core Value
Fund | | Large Cap Value
Fund | | Mid-Cap Value
Fund | | Small Cap Value
Fund | | All Cap Value
Fund | |
| Investment income: | |
Dividends*
Unaffiliated issuers | | $ | 46,695,272 | | | $ | 106,826,016 | | | $ | 43,847,045 | | | $ | 5,663,233 | | | $ | 1,546,269 | | |
| Affiliated issuers | | | — | | | | 3,161,545 | | | | 6,680,732 | | | | — | | | | — | | |
| Interest | | | 1,862,936 | | | | 1,840,957 | | | | 1,974,520 | | | | 442,260 | | | | 47,610 | | |
| Securities on loan | | | 48,357 | | | | 71,627 | | | | 1,598,175 | | | | 269,360 | | | | 611 | | |
| Total income | | | 48,606,565 | | | | 111,900,145 | | | | 54,100,472 | | | | 6,374,853 | | | | 1,594,490 | | |
| Expenses: | |
| Advisory fees | | | 15,312,765 | | | | 32,984,290 | | | | 24,208,987 | | | | 3,281,751 | | | | 711,417 | | |
| Professional fees and expenses | | | 74,484 | | | | 158,260 | | | | 125,524 | | | | 33,486 | | | | 21,952 | | |
| Custodian fees and expenses | | | 66,616 | | | | 163,108 | | | | 101,868 | | | | 22,475 | | | | 10,983 | | |
| Transfer agent fees and expenses | | | 2,815,394 | | | | 7,790,797 | | | | 6,381,771 | | | | 1,045,594 | | | | 123,365 | | |
| Accounting fees and expenses | | | 268,076 | | | | 602,599 | | | | 448,715 | | | | 81,955 | | | | 34,194 | | |
| Administration fees and expenses | | | 632,967 | | | | 1,353,146 | | | | 982,719 | | | | 134,953 | | | | 28,743 | | |
| Trustees' fees and expenses | | | 73,843 | | | | 166,056 | | | | 122,226 | | | | 16,455 | | | | 3,617 | | |
| Reports to shareholders | | | 620,517 | | | | 602,927 | | | | 632,756 | | | | 41,565 | | | | 21,579 | | |
| Registration fees | | | 69,558 | | | | 116,259 | | | | 74,915 | | | | 47,320 | | | | 48,234 | | |
| Distribution and service fees — Class A | | | 943,232 | | | | 5,393,790 | | | | 1,732,226 | | | | 173,330 | | | | 94,479 | | |
| Distribution and service fees — Class C | | | 958,966 | | | | 2,616,813 | | | | 1,315,180 | | | | 73,237 | | | | 262,080 | | |
| Distribution and service fees — Class R | | | — | | | | 369,319 | | | | 96,543 | | | | — | | | | — | | |
| Other expenses | | | 93,084 | | | | 250,523 | | | | 193,724 | | | | 27,549 | | | | 7,895 | | |
| Total expenses | | | 21,929,502 | | | | 52,567,887 | | | | 36,417,154 | | | | 4,979,670 | | | | 1,368,538 | | |
| Less, expense waiver by Advisor (Note 2) | | | (631,135 | ) | | | — | | | | — | | | | — | | | | — | | |
| Net expenses | | | 21,298,367 | | | | 52,567,887 | | | | 36,417,154 | | | | 4,979,670 | | | | 1,368,538 | | |
| Net investment income | | | 27,308,198 | | | | 59,332,258 | | | | 17,683,318 | | | | 1,395,183 | | | | 225,952 | | |
| Realized and Unrealized Gain (Loss) on Securities: | |
Net realized gains (losses) from sales of
Unaffiliated issuers | | | (172,436,548 | ) | | | 252,120,602 | | | | (84,925,650 | ) | | | 3,920,992 | | | | (453,025 | ) | |
| Affiliated issuers | | | — | | | | (253,947,925 | ) | | | (81,309,789 | ) | | | (1,051,791 | ) | | | — | | |
| Net realized gains (losses) from sales | | | (172,436,548 | ) | | | (1,827,323 | ) | | | (166,235,439 | ) | | | 2,869,201 | | | | (453,025 | ) | |
Net change in unrealized depreciation
of securities | | | (616,740,605 | ) | | | (1,686,859,361 | ) | | | (1,308,134,584 | ) | | | (186,591,104 | ) | | | (35,643,076 | ) | |
| Net losses on securities | | | (789,177,153 | ) | | | (1,688,686,684 | ) | | | (1,474,370,023 | ) | | | (183,721,903 | ) | | | (36,096,101 | ) | |
Net Decrease in Net Assets Resulting from
Operations | | $ | (761,868,955 | ) | | $ | (1,629,354,426 | ) | | $ | (1,456,686,705 | ) | | $ | (182,326,720 | ) | | $ | (35,870,149 | ) | |
| *Net of Foreign Taxes Withheld | | $ | 109,347 | | | $ | 39,582 | | | $ | 501,667 | | | $ | 75,898 | | | $ | 21,717 | | |
The accompanying notes are an integral part of these financial statements.
23
Statements of Changes in Net Assets
| | | Core Value Fund | | Large Cap Value Fund | | Mid-Cap Value Fund | |
| | | Year ended
June 30, 2008 | | Year ended
June 30, 2007 | | Year ended
June 30, 2008 | | Year ended
June 30, 2007 | | Year ended
June 30, 2008 | | Year ended
June 30, 2007 | |
| Operations: | |
| Net investment income (loss) | | $ | 27,308,198 | | | $ | 11,314,479 | | | $ | 59,332,258 | | | $ | 47,129,501 | | | $ | 17,683,318 | | | $ | 15,825,699 | | |
| Net realized gains (losses) on securities | | | (172,436,548 | ) | | | 150,501,139 | | | | (1,827,323 | ) | | | 447,083,574 | | | | (166,235,439 | ) | | | 582,515,988 | | |
| Net change in unrealized appreciation (depreciation) of securities | | | (616,740,605 | ) | | | 176,883,741 | | | | (1,686,859,361 | ) | | | 552,680,159 | | | | (1,308,134,584 | ) | | | 299,883,961 | | |
| Net increase (decrease) in net assets resulting from operations | | | (761,868,955 | ) | | | 338,699,359 | | | | (1,629,354,426 | ) | | | 1,046,893,234 | | | | (1,456,686,705 | ) | | | 898,225,648 | | |
| Dividends and Distributions to Shareholders: | |
| Investment income — net: | |
| Class I | | | (16,756,441 | ) | | | (7,444,390 | ) | | | (24,445,606 | ) | | | (26,679,719 | ) | | | (17,607,672 | ) | | | (1,662,121 | ) | |
| Class A | | | (1,910,536 | ) | | | (2,873,143 | ) | | | (20,847,020 | ) | | | (27,716,061 | ) | | | (2,534,440 | ) | | | — | | |
| Class C | | | (15,089 | ) | | | — | | | | (288,340 | ) | | | (963,704 | ) | | | — | | | | — | | |
| Class R | | | — | | | | — | | | | (476,173 | ) | | | (646,435 | ) | | | (33,893 | ) | | | — | | |
| Realized gain on securities — net: | |
| Class I | | | (102,705,915 | ) | | | (18,736,527 | ) | | | (166,352,921 | ) | | | (93,733,369 | ) | | | (372,401,415 | ) | | | (299,281,858 | ) | |
| Class A | | | (20,784,679 | ) | | | (11,331,671 | ) | | | (189,641,554 | ) | | | (118,094,581 | ) | | | (107,514,131 | ) | | | (107,705,371 | ) | |
| Class C | | | (5,904,382 | ) | | | (3,128,681 | ) | | | (22,374,659 | ) | | | (18,354,299 | ) | | | (21,238,299 | ) | | | (24,255,979 | ) | |
| Class R | | | — | | | | — | | | | (6,525,008 | ) | | | (3,773,796 | ) | | | (3,191,823 | ) | | | (2,342,894 | ) | |
| Net decrease in net assets resulting from dividends and distributions to shareholders | | | (148,077,042 | ) | | | (43,514,412 | ) | | | (430,951,281 | ) | | | (289,961,964 | ) | | | (524,521,673 | ) | | | (435,248,223 | ) | |
| Capital Share Transactions: | |
| Net increase (decrease) in net assets resulting from capital share transactions | | | (287,246,844 | ) | | | 647,605,250 | | | | (1,498,576,642 | ) | | | (120,757,112 | ) | | | (1,089,063,226 | ) | | | 416,683,753 | | |
| Net Assets: | |
| Total increase (decrease) in net assets | | | (1,197,192,841 | ) | | | 942,790,197 | | | | (3,558,882,349 | ) | | | 636,174,158 | | | | (3,070,271,604 | ) | | | 879,661,178 | | |
| Beginning of year | | | 2,543,798,762 | | | | 1,601,008,565 | | | | 6,286,241,264 | | | | 5,650,067,106 | | | | 5,110,941,354 | | | | 4,231,280,176 | | |
| End of year | | $ | 1,346,605,921 | | | $ | 2,543,798,762 | | | $ | 2,727,358,915 | | | $ | 6,286,241,264 | | | $ | 2,040,669,750 | | | $ | 5,110,941,354 | | |
| Undistributed net investment income | | $ | 14,792,750 | | | $ | 6,166,480 | | | $ | 30,050,259 | | | $ | 16,777,201 | | | $ | 7,583,445 | | | $ | 13,884,597 | | |
The accompanying notes are an integral part of these financial statements.
24
| | | Small Cap Value Fund | | All Cap Value Fund | |
| | | Year ended
June 30, 2008 | | Year ended
June 30, 2007 | | Year ended
June 30, 2008 | | Year ended
June 30, 2007 | |
| Operations: | |
| Net investment income (loss) | | $ | 1,395,183 | | | $ | 343,365 | | | $ | 225,952 | | | $ | (389,038 | ) | |
| Net realized gains (losses) on securities | | | 2,869,201 | | | | 48,998,985 | | | | (453,025 | ) | | | 11,908,245 | | |
| Net change in unrealized appreciation (depreciation) of securities | | | (183,721,903 | ) | | | 35,879,929 | | | | (35,643,076 | ) | | | 20,570,797 | | |
| Net increase (decrease) in net assets resulting from operations | | | (182,326,720 | ) | | | 85,222,279 | | | | (35,870,149 | ) | | | 32,090,004 | | |
| Dividends and Distributions to Shareholders: | |
| Investment income — net: | |
| Class I | | | — | | | | (916,052 | ) | | | (84,067 | ) | | | — | | |
| Class A | | | — | | | | (49,668 | ) | | | (45,119 | ) | | | — | | |
| Class C | | | — | | | | — | | | | — | | | | — | | |
| Class R | | | — | | | | — | | | | — | | | | — | | |
| Realized gain on securities — net: | |
| Class I | | | (37,215,564 | ) | | | (46,202,867 | ) | | | (2,985,960 | ) | | | (3,879,290 | ) | |
| Class A | | | (6,833,327 | ) | | | (11,978,196 | ) | | | (3,656,767 | ) | | | (5,693,281 | ) | |
| Class C | | | (696,153 | ) | | | (1,456,084 | ) | | | (2,619,799 | ) | | | (3,985,927 | ) | |
| Class R | | | — | | | | — | | | | — | | | | — | | |
| Net decrease in net assets resulting from dividends and distributions to shareholders | | | (44,745,044 | ) | | | (60,602,867 | ) | | | (9,391,712 | ) | | | (13,558,498 | ) | |
| Capital Share Transactions: | |
| Net increase (decrease) in net assets resulting from capital share transactions | | | (95,581,536 | ) | | | (121,183,783 | ) | | | (51,475,116 | ) | | | (74,924,632 | ) | |
| Net Assets: | |
| Total increase (decrease) in net assets | | | (322,653,300 | ) | | | (96,564,371 | ) | | | (96,736,977 | ) | | | (56,393,126 | ) | |
| Beginning of year | | | 662,286,218 | | | | 758,850,589 | | | | 156,008,564 | | | | 212,401,690 | | |
| End of year | | $ | 339,632,918 | | | $ | 662,286,218 | | | $ | 59,271,587 | | | $ | 156,008,564 | | |
| Undistributed net investment income | | $ | 1,485,015 | | | $ | — | | | $ | 96,308 | | | $ | — | | |
The accompanying notes are an integral part of these financial statements.
25
Financial Highlights
The following per share data and ratios have been derived from information provided in the financial statements.
| | | | | Income (loss) from investment operations | | Dividends and distributions | |
| Core Value Fund | | Net asset
value,
beginning
of period | | Net
investment
income
(loss)2 | | Net gains
(losses) on
securities
(both
realized and
unrealized) | | Total from
investment
operations | | Dividends
(from net
investment
income) | | Distributions
(from
capital
gains) | | Total
distributions | |
| Class I | |
| Year ended 6/30/2008 | | $ | 15.26 | | | $ | 0.18 | | | $ | (4.88 | ) | | $ | (4.70 | ) | | $ | (0.14 | ) | | $ | (0.85 | ) | | $ | (0.99 | ) | |
| Year ended 6/30/2007 | | | 12.85 | | | | 0.11 | | | | 2.68 | | | | 2.79 | | | | (0.11 | ) | | | (0.27 | ) | | | (0.38 | ) | |
| Year ended 6/30/2006 | | | 12.28 | | | | 0.14 | | | | 0.51 | | | | 0.65 | | | | (0.05 | ) | | | (0.03 | ) | | | (0.08 | ) | |
Period from 8/30/20041
to 6/30/2005 | | | 10.00 | | | | 0.08 | | | | 2.23 | | | | 2.31 | | | | (0.03 | ) | | | — | | | | (0.03 | ) | |
| Class A | |
| Year ended 6/30/2008 | | | 15.21 | | | | 0.14 | | | | (4.86 | ) | | | (4.72 | ) | | | (0.08 | ) | | | (0.85 | ) | | | (0.93 | ) | |
| Year ended 6/30/2007 | | | 12.80 | | | | 0.07 | | | | 2.68 | | | | 2.75 | | | | (0.07 | ) | | | (0.27 | ) | | | (0.34 | ) | |
| Year ended 6/30/2006 | | | 12.26 | | | | 0.11 | | | | 0.50 | | | | 0.61 | | | | (0.04 | ) | | | (0.03 | ) | | | (0.07 | ) | |
Period from 8/30/20041
to 6/30/2005 | | | 10.00 | | | | 0.05 | | | | 2.24 | | | | 2.29 | | | | (0.03 | ) | | | — | | | | (0.03 | ) | |
| Class C | |
| Year ended 6/30/2008 | | | 15.01 | | | | 0.04 | | | | (4.79 | ) | | | (4.75 | ) | | | (0.00 | ) | | | (0.85 | ) | | | (0.85 | ) | |
| Year ended 6/30/2007 | | | 12.66 | | | | (0.03 | ) | | | 2.65 | | | | 2.62 | | | | — | | | | (0.27 | ) | | | (0.27 | ) | |
| Year ended 6/30/2006 | | | 12.19 | | | | 0.01 | | | | 0.50 | | | | 0.51 | | | | (0.01 | ) | | | (0.03 | ) | | | (0.04 | ) | |
Period from 8/30/20041
to 6/30/2005 | | | 10.00 | | | | 0.01 | | | | 2.20 | | | | 2.21 | | | | (0.02 | ) | | | — | | | | (0.02 | ) | |
| | | | | Ratios to Average Net Assets | |
| Core Value Fund | | Net asset
value, end
of period | | Total
return3 | | Net assets,
end of
period (in
thousands) | | Expenses,
net of
reimbursement | | Expenses | | Investment
income —
net | |
| Class I | |
| Year ended 6/30/2008 | | $ | 9.57 | | | | (32.13 | )% | | $ | 1,132,685 | | | | 0.95 | % | | | 0.98 | % | | | 1.46 | % | |
| Year ended 6/30/2007 | | | 15.26 | | | | 21.80 | | | | 1,712,419 | | | | 0.95 | | | | 0.98 | | | | 0.77 | | |
| Year ended 6/30/2006 | | | 12.85 | | | | 5.31 | | | | 765,092 | | | | 0.95 | | | | 0.99 | | | | 1.08 | | |
Period from 8/30/20041
to 6/30/2005 | | | 12.28 | | | | 23.16 | | | | 36,586 | | | | 0.954 | | | | 1.304 | | | | 0.964 | | |
| Class A | |
| Year ended 6/30/2008 | | | 9.56 | | | | (32.29 | ) | | | 168,160 | | | | 1.20 | | | | 1.22 | | | | 1.07 | | |
| Year ended 6/30/2007 | | | 15.21 | | | | 21.57 | | | | 670,824 | | | | 1.20 | | | | 1.21 | | | | 0.49 | | |
| Year ended 6/30/2006 | | | 12.80 | | | | 5.01 | | | | 673,032 | | | | 1.20 | | | | 1.23 | | | | 0.82 | | |
Period from 8/30/20041
to 6/30/2005 | | | 12.26 | | | | 22.93 | | | | 21,684 | | | | 1.204 | | | | 1.504 | | | | 0.734 | | |
| Class C | |
| Year ended 6/30/2008 | | | 9.41 | | | | (32.81 | ) | | | 45,761 | | | | 1.95 | | | | 1.97 | | | | 0.35 | | |
| Year ended 6/30/2007 | | | 15.01 | | | | 20.77 | | | | 160,555 | | | | 1.90 | | | | 1.96 | | | | (0.21 | ) | |
| Year ended 6/30/2006 | | | 12.66 | | | | 4.24 | | | | 162,885 | | | | 1.95 | | | | 1.98 | | | | 0.06 | | |
Period from 8/30/20041
to 6/30/2005 | | | 12.19 | | | | 22.10 | | | | 15,483 | | | | 1.954 | | | | 2.264 | | | | (0.02 | )4 | |
| | | Year Ended June 30, | | Period August 30, 20041 | |
| | | 2008 | | 2007 | | 2006 | | through June 30, 2005 | |
| Portfolio turnover rate | | | 74 | % | | | 44 | % | | | 13 | % | | | 13 | % | |
| | | | | Income (loss) from investment operations | | Dividends and distributions | |
| Large Cap Value Fund | | Net asset
value,
beginning
of period | | Net
investment
income
(loss)2 | | Net gains
(losses) on
securities
(both
realized and
unrealized) | | Total from
investment
operations | | Dividends
(from net
investment
income) | | Distributions
(from
capital
gains) | | Total
distributions | |
| Class I | |
| Year ended 6/30/2008 | | $ | 26.62 | | | $ | 0.33 | | | $ | (8.32 | ) | | $ | (7.99 | ) | | $ | (0.28 | ) | | $ | (2.02 | ) | | $ | (2.30 | ) | |
| Year ended 6/30/2007 | | | 23.42 | | | | 0.25 | | | | 4.25 | | | | 4.50 | | | | (0.29 | ) | | | (1.01 | ) | | | (1.30 | ) | |
| Year ended 6/30/2006 | | | 23.47 | | | | 0.33 | | | | 0.40 | | | | 0.73 | | | | (0.25 | ) | | | (0.53 | ) | | | (0.78 | ) | |
| Year ended 6/30/2005 | | | 20.09 | | | | 0.17 | | | | 3.42 | | | | 3.59 | | | | (0.13 | ) | | | (0.08 | ) | | | (0.21 | ) | |
| Year ended 6/30/2004 | | | 15.26 | | | | 0.10 | | | | 4.92 | | | | 5.02 | | | | (0.12 | ) | | | (0.07 | ) | | | (0.19 | ) | |
| Class A | |
| Year ended 6/30/2008 | | | 26.51 | | | | 0.28 | | | | (8.31 | ) | | | (8.03 | ) | | | (0.21 | ) | | | (2.02 | ) | | | (2.23 | ) | |
| Year ended 6/30/2007 | | | 23.32 | | | | 0.19 | | | | 4.24 | | | | 4.43 | | | | (0.23 | ) | | | (1.01 | ) | | | (1.24 | ) | |
| Year ended 6/30/2006 | | | 23.39 | | | | 0.27 | | | | 0.39 | | | | 0.66 | | | | (0.20 | ) | | | (0.53 | ) | | | (0.73 | ) | |
| Year ended 6/30/2005 | | | 20.04 | | | | 0.15 | | | | 3.38 | | | | 3.53 | | | | (0.10 | ) | | | (0.08 | ) | | | (0.18 | ) | |
| Year ended 6/30/2004 | | | 15.25 | | | | 0.11 | | | | 4.85 | | | | 4.96 | | | | (0.10 | ) | | | (0.07 | ) | | | (0.17 | ) | |
| Class C | |
| Year ended 6/30/2008 | | | 26.12 | | | | 0.10 | | | | (8.18 | ) | | | (8.08 | ) | | | (0.03 | ) | | | (2.02 | ) | | | (2.05 | ) | |
| Year ended 6/30/2007 | | | 22.96 | | | | 0.03 | | | | 4.19 | | | | 4.22 | | | | (0.05 | ) | | | (1.01 | ) | | | (1.06 | ) | |
| Year ended 6/30/2006 | | | 23.07 | | | | 0.09 | | | | 0.39 | | | | 0.48 | | | | (0.06 | ) | | | (0.53 | ) | | | (0.59 | ) | |
| Year ended 6/30/2005 | | | 19.84 | | | | 0.04 | | | | 3.29 | | | | 3.33 | | | | (0.02 | ) | | | (0.08 | ) | | | (0.10 | ) | |
| Year ended 6/30/2004 | | | 15.15 | | | | (0.13 | ) | | | 4.93 | | | | 4.80 | | | | (0.04 | ) | | | (0.07 | ) | | | (0.11 | ) | |
| Class R | |
| Year ended 6/30/2008 | | | 26.68 | | | | 0.22 | | | | (8.37 | ) | | | (8.15 | ) | | | (0.14 | ) | | | (2.02 | ) | | | (2.16 | ) | |
| Year ended 6/30/2007 | | | 23.47 | | | | 0.12 | | | | 4.28 | | | | 4.40 | | | | (0.18 | ) | | | (1.01 | ) | | | (1.19 | ) | |
| Year ended 6/30/2006 | | | 23.56 | | | | 0.22 | | | | 0.39 | | | | 0.61 | | | | (0.17 | ) | | | (0.53 | ) | | | (0.70 | ) | |
| Year ended 6/30/2005 | | | 20.25 | | | | 0.14 | | | | 3.36 | | | | 3.50 | | | | (0.11 | ) | | | (0.08 | ) | | | (0.19 | ) | |
Period from 8/30/20031
to 6/30/2004 | | | 16.26 | | | | 0.02 | | | | 3.97 | | | | 3.99 | | | | — | | | | — | | | | — | | |
| | | | | Ratios to Average Net Assets | |
| Large Cap Value Fund | | Net asset
value, end
of period | | Total
return3 | | Net assets,
end of
period (in
thousands) | | Expenses,
net of
reimbursement | | Expenses | | Investment
income —
net | |
| Class I | |
| Year ended 6/30/2008 | | $ | 16.33 | | | | (31.84 | )% | | $ | 1,168,499 | | | | 1.00 | % | | | 1.00 | % | | | 1.53 | % | |
| Year ended 6/30/2007 | | | 26.62 | | | | 19.63 | | | | 2,669,807 | | | | 0.98 | | | | 0.98 | | | | 0.98 | | |
| Year ended 6/30/2006 | | | 23.42 | | | | 3.10 | | | | 2,119,374 | | | | 0.98 | | | | 0.98 | | | | 1.40 | | |
| Year ended 6/30/2005 | | | 23.47 | | | | 17.95 | | | | 1,235,903 | | | | 0.99 | | | | 0.99 | | | | 1.22 | | |
| Year ended 6/30/2004 | | | 20.09 | | | | 33.20 | | | | 200,719 | | | | 1.03 | | | | 1.06 | | | | 0.85 | | |
| Class A | |
| Year ended 6/30/2008 | | | 16.25 | | | | (32.06 | ) | | | 1,397,045 | | | | 1.25 | | | | 1.25 | | | | 1.28 | | |
| Year ended 6/30/2007 | | | 26.51 | | | | 19.35 | | | | 3,060,990 | | | | 1.22 | | | | 1.22 | | | | 0.73 | | |
| Year ended 6/30/2006 | | | 23.32 | | | | 2.82 | | | | 2,959,444 | | | | 1.22 | | | | 1.22 | | | | 1.15 | | |
| Year ended 6/30/2005 | | | 23.39 | | | | 17.68 | | | | 2,440,384 | | | | 1.24 | | | | 1.24 | | | | 0.96 | | |
| Year ended 6/30/2004 | | | 20.04 | | | | 32.78 | | | | 311,596 | | | | 1.28 | | | | 1.31 | | | | 0.60 | | |
| Class C | |
| Year ended 6/30/2008 | | | 15.99 | | | | (32.59 | ) | | | 116,947 | | | | 2.00 | | | | 2.00 | | | | 0.45 | | |
| Year ended 6/30/2007 | | | 26.12 | | | | 18.62 | | | | 452,182 | | | | 1.83 | | | | 1.97 | | | | 0.12 | | |
| Year ended 6/30/2006 | | | 22.96 | | | | 2.08 | | | | 488,480 | | | | 1.97 | | | | 1.97 | | | | 0.40 | | |
| Year ended 6/30/2005 | | | 23.07 | | | | 16.80 | | | | 506,674 | | | | 1.99 | | | | 1.99 | | | | 0.22 | | |
| Year ended 6/30/2004 | | | 19.84 | | | | 31.83 | | | | 78,986 | | | | 2.03 | | | | 2.06 | | | | (0.14 | ) | |
| Class R | |
| Year ended 6/30/2008 | | | 16.37 | | | | (32.27 | ) | | | 44,867 | | | | 1.50 | | | | 1.50 | | | | 1.02 | | |
| Year ended 6/30/2007 | | | 26.68 | | | | 19.06 | | | | 103,263 | | | | 1.48 | | | | 1.48 | | | | 0.49 | | |
| Year ended 6/30/2006 | | | 23.47 | | | | 2.59 | | | | 82,770 | | | | 1.49 | | | | 1.49 | | | | 0.92 | | |
| Year ended 6/30/2005 | | | 23.56 | | | | 17.35 | | | | 25,933 | | | | 1.49 | | | | 1.49 | | | | 0.77 | | |
Period from 8/30/20031
to 6/30/2004 | | | 20.25 | | | | 24.54 | | | | 1,665 | | | | 1.714 | | | | 1.744 | | | | 0.534 | | |
| | | Year Ended June 30, | |
| | | 2008 | | 2007 | | 2006 | | 2005 | | 2004 | |
| Portfolio turnover rate | | | 55 | % | | | 40 | % | | | 27 | % | | | 14 | % | | | 5 | % | |
1 Commencement of operations.
2 Effective 7/1/2005, net investment income (loss) per share has been calculated based on average shares outstanding during the period.
3 Total returns exclude the effects of sales charges. The Fund's investment advisor may have waived a portion of its advisory fee and/or reimbursed a portion of the Fund's expenses. Without such waiver and/or reimbursement, the Fund's performance would have been lower.
4 Annualized.
The accompanying notes are an integral part of these financial statements.
26
Financial Highlights
The following per share data and ratios have been derived from information provided in the financial statements.
| | | | | Income (loss) from investment operations | | Dividends and distributions | |
| Mid-Cap Value Fund | | Net asset
value,
beginning
of period | | Net
investment
income
(loss)2 | | Net gains
(losses) on
securities
(both
realized and
unrealized) | | Total from
investment
operations | | Dividends
(from net
investment
income) | | Distributions
(from
capital
gains) | | Total
distributions | |
| Class I | |
| Year ended 6/30/2008 | | $ | 31.99 | | | $ | 0.15 | | | $ | (10.34 | ) | | $ | (10.19 | ) | | $ | (0.20 | ) | | $ | (4.16 | ) | | $ | (4.36 | ) | |
| Year ended 6/30/2007 | | | 28.91 | | | | 0.14 | | | | 5.98 | | | | 6.12 | | | | (0.02 | ) | | | (3.02 | ) | | | (3.04 | ) | |
| Year ended 6/30/2006 | | | 28.55 | | | | 0.12 | | | | 2.27 | | | | 2.39 | | | | (0.13 | ) | | | (1.90 | ) | | | (2.03 | ) | |
| Year ended 6/30/2005 | | | 24.53 | | | | 0.10 | | | | 4.83 | | | | 4.93 | | | | (0.07 | ) | | | (0.84 | ) | | | (0.91 | ) | |
| Year ended 6/30/2004 | | | 17.64 | | | | 0.11 | | | | 7.19 | | | | 7.30 | | | | (0.08 | ) | | | (0.33 | ) | | | (0.41 | ) | |
| Class A | |
| Year ended 6/30/2008 | | | 31.75 | | | | 0.09 | | | | (10.26 | ) | | | (10.17 | ) | | | (0.10 | ) | | | (4.16 | ) | | | (4.26 | ) | |
| Year ended 6/30/2007 | | | 28.77 | | | | 0.06 | | | | 5.94 | | | | 6.00 | | | | — | | | | (3.02 | ) | | | (3.02 | ) | |
| Year ended 6/30/2006 | | | 28.41 | | | | 0.05 | | | | 2.25 | | | | 2.30 | | | | (0.04 | ) | | | (1.90 | ) | | | (1.94 | ) | |
| Year ended 6/30/2005 | | | 24.43 | | | | 0.04 | | | | 4.81 | | | | 4.85 | | | | (0.03 | ) | | | (0.84 | ) | | | (0.87 | ) | |
| Year ended 6/30/2004 | | | 17.61 | | | | 0.06 | | | | 7.15 | | | | 7.21 | | | | (0.06 | ) | | | (0.33 | ) | | | (0.39 | ) | |
| Class C | |
| Year ended 6/30/2008 | | | 30.43 | | | | (0.10 | ) | | | (9.77 | ) | | | (9.87 | ) | | | — | | | | (4.16 | ) | | | (4.16 | ) | |
| Year ended 6/30/2007 | | | 27.83 | | | | (0.11 | ) | | | 5.73 | | | | 5.62 | | | | — | | | | (3.02 | ) | | | (3.02 | ) | |
| Year ended 6/30/2006 | | | 27.70 | | | | (0.17 | ) | | | 2.20 | | | | 2.03 | | | | — | | | | (1.90 | ) | | | (1.90 | ) | |
| Year ended 6/30/2005 | | | 23.99 | | | | (0.15 | ) | | | 4.70 | | | | 4.55 | | | | — | | | | (0.84 | ) | | | (0.84 | ) | |
| Year ended 6/30/2004 | | | 17.38 | | | | (0.11 | ) | | | 7.05 | | | | 6.94 | | | | — | | | | (0.33 | ) | | | (0.33 | ) | |
| Class R | |
| Year ended 6/30/2008 | | | 32.01 | | | | 0.04 | | | | (10.36 | ) | | | (10.32 | ) | | | (0.04 | ) | | | (4.16 | ) | | | (4.20 | ) | |
| Year ended 6/30/2007 | | | 29.05 | | | | (0.02 | ) | | | 6.00 | | | | 5.98 | | | | — | | | | (3.02 | ) | | | (3.02 | ) | |
| Year ended 6/30/2006 | | | 28.71 | | | | (0.03 | ) | | | 2.28 | | | | 2.25 | | | | (0.01 | ) | | | (1.90 | ) | | | (1.91 | ) | |
| Year ended 6/30/2005 | | | 24.78 | | | | (0.05 | ) | | | 4.89 | | | | 4.84 | | | | (0.07 | ) | | | (0.84 | ) | | | (0.91 | ) | |
Period from 8/30/20031
to 6/30/2004 | | | 19.33 | | | | 0.02 | | | | 5.84 | | | | 5.86 | | | | (0.08 | ) | | | (0.33 | ) | | | (0.41 | ) | |
| | | | | Ratios to Average Net Assets | |
| Mid-Cap Value Fund | | Net asset
value, end
of period | | Total
return3 | | Net assets,
end of
period (in
thousands) | | Expenses,
net of
reimbursement | | Expenses | | Investment
income —
net | |
| Class I | |
| Year ended 6/30/2008 | | $ | 17.44 | | | | (34.05 | )% | | $ | 1,551,863 | | | | 1.03 | % | | | 1.03 | % | | | 0.65 | % | |
| Year ended 6/30/2007 | | | 31.99 | | | | 21.87 | | | | 3,681,426 | | | | 1.02 | | | | 1.02 | | | | 0.44 | | |
| Year ended 6/30/2006 | | | 28.91 | | | | 8.53 | | | | 2,873,684 | | | | 1.01 | | | | 1.01 | | | | 0.40 | | |
| Year ended 6/30/2005 | | | 28.55 | | | | 20.41 | | | | 2,244,061 | | | | 1.03 | | | | 1.03 | | | | 0.36 | | |
| Year ended 6/30/2004 | | | 24.53 | | | | 41.67 | | | | 908,242 | | | | 1.03 | | | | 1.03 | | | | 0.50 | | |
| Class A | |
| Year ended 6/30/2008 | | | 17.32 | | | | (34.20 | ) | | | 415,674 | | | | 1.28 | | | | 1.28 | | | | 0.38 | | |
| Year ended 6/30/2007 | | | 31.75 | | | | 21.56 | | | | 1,150,029 | | | | 1.26 | | | | 1.26 | | | | 0.19 | | |
| Year ended 6/30/2006 | | | 28.77 | | | | 8.27 | | | | 1,088,854 | | | | 1.27 | | | | 1.27 | | | | 0.16 | | |
| Year ended 6/30/2005 | | | 28.41 | | | | 20.13 | | | | 1,075,253 | | | | 1.28 | | | | 1.28 | | | | 0.16 | | |
| Year ended 6/30/2004 | | | 24.43 | | | | 41.21 | | | | 755,749 | | | | 1.28 | | | | 1.28 | | | | 0.25 | | |
| Class C | |
| Year ended 6/30/2008 | | | 16.40 | | | | (34.68 | ) | | | 60,544 | | | | 2.03 | | | | 2.03 | | | | (0.43 | ) | |
| Year ended 6/30/2007 | | | 30.43 | | | | 20.88 | | | | 252,320 | | | | 1.81 | | | | 2.01 | | | | (0.36 | ) | |
| Year ended 6/30/2006 | | | 27.83 | | | | 7.46 | | | | 246,242 | | | | 2.01 | | | | 2.01 | | | | (0.58 | ) | |
| Year ended 6/30/2005 | | | 27.70 | | | | 19.23 | | | | 252,381 | | | | 2.03 | | | | 2.03 | | | | (0.58 | ) | |
| Year ended 6/30/2004 | | | 23.99 | | | | 40.19 | | | | 201,360 | | | | 2.04 | | | | 2.04 | | | | (0.50 | ) | |
| Class R | |
| Year ended 6/30/2008 | | | 17.49 | | | | (34.35 | ) | | | 12,588 | | | | 1.53 | | | | 1.53 | | | | 0.16 | | |
| Year ended 6/30/2007 | | | 32.01 | | | | 21.27 | | | | 27,167 | | | | 1.52 | | | | 1.52 | | | | (0.06 | ) | |
| Year ended 6/30/2006 | | | 29.05 | | | | 7.99 | | | | 22,501 | | | | 1.51 | | | | 1.51 | | | | (0.10 | ) | |
| Year ended 6/30/2005 | | | 28.71 | | | | 19.83 | | | | 20,038 | | | | 1.53 | | | | 1.53 | | | | (0.18 | ) | |
Period from 8/30/20031
to 6/30/2004 | | | 24.78 | | | | 30.58 | | | | 4,032 | | | | 1.724 | | | | 1.724 | | | | (0.10 | )4 | |
| | | Year Ended June 30, | |
| | | 2008 | | 2007 | | 2006 | | 2005 | | 2004 | |
| Portfolio turnover rate | | | 51 | % | | | 45 | % | | | 55 | % | | | 27 | % | | | 25 | % | |
| | | | | Income (loss) from investment operations | | Dividends and distributions | |
| Small Cap Value Fund | | Net asset
value,
beginning
of period | | Net
investment
income
(loss)2 | | Net gains
(losses) on
securities
(both
realized and
unrealized) | | Total from
investment
operations | | Dividends
(from net
investment
income) | | Distributions
(from
capital
gains) | | Total
distributions | |
| Class I | |
| Year ended 6/30/2008 | | $ | 50.00 | | | $ | 0.15 | | | $ | (14.45 | ) | | $ | (14.30 | ) | | | — | | | $ | (4.03 | ) | | $ | (4.03 | ) | |
| Year ended 6/30/2007 | | | 48.13 | | | | 0.06 | | | | 6.42 | | | | 6.48 | | | $ | (0.09 | ) | | | (4.52 | ) | | | (4.61 | ) | |
| Year ended 6/30/2006 | | | 52.52 | | | | 0.18 | | | | 2.57 | | | | 2.75 | | | | (0.14 | ) | | | (7.00 | ) | | | (7.14 | ) | |
| Year ended 6/30/2005 | | | 50.54 | | | | (0.08 | ) | | | 9.36 | | | | 9.28 | | | | — | | | | (7.30 | ) | | | (7.30 | ) | |
| Year ended 6/30/2004 | | | 34.55 | | | | (0.06 | ) | | | 16.90 | | | | 16.84 | | | | (0.02 | ) | | | (0.83 | ) | | | (0.85 | ) | |
| Class A | |
| Year ended 6/30/2008 | | | 50.14 | | | | 0.02 | | | | (14.44 | ) | | | (14.42 | ) | | | — | | | | (4.03 | ) | | | (4.03 | ) | |
| Year ended 6/30/2007 | | | 48.30 | | | | (0.06 | ) | | | 6.44 | | | | 6.38 | | | | (0.02 | ) | | | (4.52 | ) | | | (4.54 | ) | |
| Year ended 6/30/2006 | | | 52.74 | | | | 0.06 | | | | 2.58 | | | | 2.64 | | | | (0.08 | ) | | | (7.00 | ) | | | (7.08 | ) | |
| Year ended 6/30/2005 | | | 50.84 | | | | (0.20 | ) | | | 9.40 | | | | 9.20 | | | | — | | | | (7.30 | ) | | | (7.30 | ) | |
| Year ended 6/30/2004 | | | 34.81 | | | | (0.17 | ) | | | 17.03 | | | | 16.86 | | | | — | | | | (0.83 | ) | | | (0.83 | ) | |
| Class C | |
| Year ended 6/30/2008 | | | 47.18 | | | | (0.29 | ) | | | (13.49 | ) | | | (13.78 | ) | | | — | | | | (4.03 | ) | | | (4.03 | ) | |
| Year ended 6/30/2007 | | | 45.83 | | | | (0.22 | ) | | | 6.09 | | | | 5.87 | | | | — | | | | (4.52 | ) | | | (4.52 | ) | |
| Year ended 6/30/2006 | | | 50.67 | | | | (0.32 | ) | | | 2.48 | | | | 2.16 | | | | — | | | | (7.00 | ) | | | (7.00 | ) | |
| Year ended 6/30/2005 | | | 49.45 | | | | (0.56 | ) | | | 9.08 | | | | 8.52 | | | | — | | | | (7.30 | ) | | | (7.30 | ) | |
| Year ended 6/30/2004 | | | 34.13 | | | | (0.50 | ) | | | 16.65 | | | | 16.15 | | | | — | | | | (0.83 | ) | | | (0.83 | ) | |
| | | | | Ratios to Average Net Assets | |
| Small Cap Value Fund | | Net asset
value, end
of period | | Total
return3 | | Net assets,
end of
period (in
thousands) | | Expenses,
net of
reimbursement | | Expenses | | Investment
income —
net | |
| Class I | |
| Year ended 6/30/2008 | | $ | 31.67 | | | | (29.19 | )% | | $ | 291,515 | | | | 1.08 | % | | | 1.08 | % | | | 0.39 | % | |
| Year ended 6/30/2007 | | | 50.00 | | | | 14.32 | | | | 526,706 | | | | 1.01 | | | | 1.01 | | | | 0.12 | | |
| Year ended 6/30/2006 | | | 48.13 | | | | 5.13 | | | | 553,660 | | | | 1.04 | | | | 1.04 | | | | 0.35 | | |
| Year ended 6/30/2005 | | | 52.52 | | | | 19.49 | | | | 518,365 | | | | 1.06 | | | | 1.06 | | | | (0.16 | ) | |
| Year ended 6/30/2004 | | | 50.54 | | | | 49.06 | | | | 324,984 | | | | 1.14 | | | | 1.14 | | | | (0.12 | ) | |
| Class A | |
| Year ended 6/30/2008 | | | 31.69 | | | | (29.36 | ) | | | 43,959 | | | | 1.33 | | | | 1.33 | | | | 0.04 | | |
| Year ended 6/30/2007 | | | 50.14 | | | | 14.03 | | | | 120,897 | | | | 1.26 | | | | 1.26 | | | | (0.14 | ) | |
| Year ended 6/30/2006 | | | 48.30 | | | | 4.86 | | | | 184,473 | | | | 1.30 | | | | 1.30 | | | | 0.12 | | |
| Year ended 6/30/2005 | | | 52.74 | | | | 19.20 | | | | 232,453 | | | | 1.31 | | | | 1.31 | | | | (0.40 | ) | |
| Year ended 6/30/2004 | | | 50.84 | | | | 48.70 | | | | 217,833 | | | | 1.39 | | | | 1.39 | | | | (0.37 | ) | |
| Class C | |
| Year ended 6/30/2008 | | | 29.37 | | | | (29.88 | ) | | | 4,159 | | | | 2.08 | | | | 2.08 | | | | (0.80 | ) | |
| Year ended 6/30/2007 | | | 47.18 | | | | 13.65 | | | | 14,683 | | | | 1.60 | | | | 2.01 | | | | (0.48 | ) | |
| Year ended 6/30/2006 | | | 45.83 | | | | 4.07 | | | | 20,717 | | | | 2.04 | | | | 2.04 | | | | (0.63 | ) | |
| Year ended 6/30/2005 | | | 50.67 | | | | 18.30 | | | | 26,792 | | | | 2.06 | | | | 2.06 | | | | (1.15 | ) | |
| Year ended 6/30/2004 | | | 49.45 | | | | 47.62 | | | | 25,132 | | | | 2.14 | | | | 2.14 | | | | (1.13 | ) | |
| | | Year Ended June 30, | |
| | | 2008 | | 2007 | | 2006 | | 2005 | | 2004 | |
| Portfolio turnover rate | | | 62 | % | | | 31 | % | | | 52 | % | | | 49 | % | | | 64 | % | |
1 Commencement of operations.
2 Net investment income (loss) per share has been calculated based on average shares outstanding during the period.
3 Total returns exclude the effects of sales charges. The Fund's investment advisor may have waived a portion of its advisory fee and/or reimbursed a portion of the Fund's expenses. Without such waiver and/or reimbursement, the Fund's performance would have been lower.
4 Annualized.
The accompanying notes are an integral part of these financial statements.
27
Financial Highlights
The following per share data and ratios have been derived from information provided in the financial statements.
| | | | | Income (loss) from investment operations | | Dividends and distributions | |
| All Cap Value Fund | | Net asset
value,
beginning
of period | | Net
investment
income
(loss)2 | | Net gains
(losses) on
securities
(both
realized and
unrealized) | | Total from
investment
operations | | Dividends
(from net
investment
income) | | Distributions
(from
capital
gains) | | Total
distributions | |
| Class I | |
| Year ended 6/30/2008 | | $ | 21.55 | | | $ | 0.11 | | | $ | (6.00 | ) | | $ | (5.89 | ) | | $ | (0.05 | ) | | $ | (1.89 | ) | | $ | (1.94 | ) | |
| Year ended 6/30/2007 | | | 19.36 | | | | 0.02 | | | | 3.87 | | | | 3.89 | | | | — | | | | (1.70 | ) | | | (1.70 | ) | |
| Year ended 6/30/2006 | | | 20.36 | | | | 0.21 | | | | (0.26 | ) | | | (0.05 | ) | | | (0.27 | ) | | | (0.68 | ) | | | (0.95 | ) | |
| Year ended 6/30/2005 | | | 17.02 | | | | 0.16 | | | | 3.27 | | | | 3.43 | | | | (0.03 | ) | | | (0.06 | ) | | | (0.09 | ) | |
| Year ended 6/30/2004 | | | 12.58 | | | | 0.00 | | | | 4.46 | | | | 4.46 | | | | (0.01 | ) | | | (0.01 | ) | | | (0.02 | ) | |
| Class A | |
| Year ended 6/30/2008 | | | 21.55 | | | | 0.06 | | | | (6.00 | ) | | | (5.94 | ) | | | (0.02 | ) | | | (1.89 | ) | | | (1.91 | ) | |
| Year ended 6/30/2007 | | | 19.40 | | | | (0.03 | ) | | | 3.88 | | | | 3.85 | | | | — | | | | (1.70 | ) | | | (1.70 | ) | |
| Year ended 6/30/2006 | | | 20.40 | | | | 0.17 | | | | (0.26 | ) | | | (0.09 | ) | | | (0.23 | ) | | | (0.68 | ) | | | (0.91 | ) | |
| Year ended 6/30/2005 | | | 17.09 | | | | 0.11 | | | | 3.28 | | | | 3.39 | | | | (0.02 | ) | | | (0.06 | ) | | | (0.08 | ) | |
| Year ended 6/30/2004 | | | 12.62 | | | | (0.04 | ) | | | 4.53 | | | | 4.49 | | | | (0.01 | ) | | | (0.01 | ) | | | (0.02 | ) | |
| Class C | |
| Year ended 6/30/2008 | | | 20.94 | | | | (0.07 | ) | | | (5.80 | ) | | | (5.87 | ) | | | — | | | | (1.89 | ) | | | (1.89 | ) | |
| Year ended 6/30/2007 | | | 19.00 | | | | (0.14 | ) | | | 3.78 | | | | 3.64 | | | | — | | | | (1.70 | ) | | | (1.70 | ) | |
| Year ended 6/30/2006 | | | 20.02 | | | | 0.01 | | | | (0.25 | ) | | | (0.24 | ) | | | (0.10 | ) | | | (0.68 | ) | | | (0.78 | ) | |
| Year ended 6/30/2005 | | | 16.88 | | | | (0.02 | ) | | | 3.22 | | | | 3.20 | | | | — | | | | (0.06 | ) | | | (0.06 | ) | |
Period from 8/28/20031
to 6/30/2004 | | | 14.32 | | | | (0.14 | ) | | | 2.71 | | | | 2.57 | | | | — | | | | (0.01 | ) | | | (0.01 | ) | |
| | | | | Ratios to Average Net Assets | |
| All Cap Value Fund | | Net asset
value, end
of period | | Total
return3 | | Net assets,
end of
period (in
thousands) | | Expenses,
net of
reimbursement | | Expenses | | Investment
income —
net | |
| Class I | |
| Year ended 6/30/2008 | | $ | 13.72 | | | | (28.58 | )% | | $ | 22,921 | | | | 1.07 | % | | | 1.07 | % | | | 0.63 | % | |
| Year ended 6/30/2007 | | | 21.55 | | | | 20.82 | | | | 44,410 | | | | 0.98 | | | | 0.98 | | | | 0.12 | | |
| Year ended 6/30/2006 | | | 19.36 | | | | (0.24 | ) | | | 59,891 | | | | 0.97 | | | | 0.97 | | | | 1.01 | | |
| Year ended 6/30/2005 | | | 20.36 | | | | 20.14 | | | | 54,969 | | | | 1.04 | | | | 1.04 | | | | 0.88 | | |
| Year ended 6/30/2004 | | | 17.02 | | | | 35.48 | | | | 22,678 | | | | 1.15 | | | | 1.25 | | | | 0.03 | | |
| Class A | |
| Year ended 6/30/2008 | | | 13.70 | | | | (28.80 | ) | | | 22,729 | | | | 1.31 | | | | 1.31 | | | | 0.36 | | |
| Year ended 6/30/2007 | | | 21.55 | | | | 20.56 | | | | 64,743 | | | | 1.23 | | | | 1.23 | | | | (0.14 | ) | |
| Year ended 6/30/2006 | | | 19.40 | | | | (0.50 | ) | | | 92,689 | | | | 1.22 | | | | 1.22 | | | | 0.83 | | |
| Year ended 6/30/2005 | | | 20.40 | | | | 19.84 | | | | 112,898 | | | | 1.29 | | | | 1.29 | | | | 0.61 | | |
| Year ended 6/30/2004 | | | 17.09 | | | | 35.56 | | | | 35,438 | | | | 1.40 | | | | 1.50 | | | | (0.22 | ) | |
| Class C | |
| Year ended 6/30/2008 | | | 13.18 | | | | (29.34 | ) | | | 13,621 | | | | 2.06 | | | | 2.06 | | | | (0.39 | ) | |
| Year ended 6/30/2007 | | | 20.94 | | | | 19.85 | | | | 46,856 | | | | 1.79 | | | | 1.98 | | | | (0.69 | ) | |
| Year ended 6/30/2006 | | | 19.00 | | | | (1.25 | ) | | | 59,822 | | | | 1.97 | | | | 1.97 | | | | 0.05 | | |
| Year ended 6/30/2005 | | | 20.02 | | | | 18.98 | | | | 66,074 | | | | 2.04 | | | | 2.04 | | | | (0.14 | ) | |
Period from 8/28/20031
to 6/30/2004 | | | 16.88 | | | | 17.97 | | | | 20,739 | | | | 2.354 | | | | 2.464 | | | | (0.96 | )4 | |
| | | Year Ended June 30, | |
| | | 2008 | | 2007 | | 2006 | | 2005 | | 2004 | |
| Portfolio turnover rate | | | 119 | % | | | 53 | % | | | 73 | % | | | 39 | % | | | 30 | % | |
1 Commencement of operations.
2 Net investment income (loss) per share has been calculated based on average shares outstanding during the period.
3 Total returns exclude the effects of sales charges. The Fund's investment advisor waived a portion of its advisory fee and reimbursed a portion of the Fund's expenses. Without such waiver and reimbursement, the Fund's performance would have been lower.
4 Annualized.
The accompanying notes are an integral part of these financial statements.
28
Notes to the Financial Statements
JUNE 30, 2008
NOTE 1.
Organization. Hotchkis and Wiley Funds (the "Trust") is registered under the Investment Company Act of 1940, as amended (the "1940 Act"), as an open-end, management investment company. The Trust was organized as a Delaware statutory trust on July 23, 2001 and consists of five series of shares. The Hotchkis and Wiley Core Value Fund, the Hotchkis and Wiley Large Cap Value Fund, the Hotchkis and Wiley Mid-Cap Value Fund and the Hotchkis and Wiley Small Cap Value Fund (collectively, the "H&W Funds") are diversified series and the Hotchkis and Wiley All Cap Value Fund (together with the H&W Funds, hereafter referred to as the "Funds") is a non-diversified series of the Trust. The Trust was organized to acquire the assets and liabilities of the Mercury HW Large Cap Value Fund, the Mercury HW Mid-Cap Value Fund and the Mercury HW Small Cap Value Fu nd (the "Mercury HW Funds"). On February 4, 2002, the Mercury HW Funds were reorganized into the Trust through a non-taxable exchange.
The Large Cap Value Fund and Mid-Cap Value Fund have four classes of shares: Class I, Class A, Class C and Class R. The Core Value Fund, Small Cap Value Fund and All Cap Value Fund have three classes of shares: Class I, Class A and Class C. Class A shares are sold with a front-end sales charge. Class C shares may be subject to a contingent deferred sales charge. Class C shares are automatically converted to Class A shares approximately eight years after purchase and will then be subject to lower distribution and service fees. All classes of shares have identical voting, dividend, liquidation and other rights and the same terms and conditions, except that Class A, Class C and Class R shares bear certain expenses related to the distribution and servicing expenditures. The Large Cap Value Fund, Small Cap Value Fund and All Cap Value Fund are closed to new investors, except as described in the prospectuses.
Significant Accounting Policies. The Funds' audited financial statements have been prepared in conformity with accounting principles generally accepted in the United States of America, which may require the use of management accruals and estimates. Actual results could differ from those estimates. The following is a summary of significant accounting policies followed by the Funds.
Security Valuation. Portfolio securities that are listed on a securities exchange (whether domestic or foreign) or The Nasdaq Stock Market ("NSM") (including the Nasdaq National Market and the Nasdaq Small Cap Market) are valued at the last reported sale price (or official closing price) on that day as of the close of the New York Stock Exchange (which is generally 4:00 p.m. New York time), or, in the absence of recorded sales, at the average of readily available closing bid and asked prices on such exchange or NSM. Unlisted equity securities that are not included in NSM are valued at the last sale price, or if the last sale price is unavailable, at the average of the quoted bid and asked prices in the over-the-counter market. Fixed-income securities are normally valued on the basis of quotes obtained from broker/dealers or pricing services. Short-te rm investments which mature in less than 60 days are valued at amortized cost, which approximates fair value. Investments quoted in foreign currency are valued daily in U.S. dollars on the basis of the foreign currency exchange rate prevailing at the time of valuation. Securities and assets for which market value quotations are not available are valued at their fair value as determined in good faith by or under the direction of the Trust's Board of Trustees.
FAS 157. In September 2006, the Financial Accounting Standards Board ("FASB") issued Statement of Financial Accounting Standards No. 157, "Fair Value Measurements" ("FAS 157"). FAS 157 establishes a single authoritative definition of fair value, sets out a framework for measuring fair value and requires additional disclosures about fair value measurements. FAS 157 applies to fair value measurements already required or permitted by existing standards. FAS 157 is effective for financial statements issued for fiscal years beginning after November 15, 2007 and interim periods within those fiscal years. The changes to current generally accepted accounting principles from the application of FAS 157 relate to the definition of fair value, the methods used to measure fair value, and expanded disclosures about fair value measurements.
As of June 30, 2008, the Trust adopted FAS 157. The Trust has performed an analysis of all existing investments to determine the significance and character of all inputs to their fair value determination. Based on this assessment, the adoption of FAS 157 did not have any material effect on the Funds' net asset values. However, the adoption of FAS 157 does require the Trust to provide additional disclosures about the inputs used to develop the measurements and the effect of certain measurements on changes in net assets for the reportable periods as contained in the Trust's periodic filings.
FAS 157 establishes a fair value hierarchy that prioritizes the inputs to valuation techniques used to measure fair value into the following three broad categories:
• Level 1 — Quoted unadjusted prices for identical instruments in active markets to which the Trust has access at the date of measurement.
• Level 2 — Quoted prices for similar instruments in active markets; quoted prices for identical or similar instruments in markets that are not active; and model-derived valuations in which all significant inputs and significant value drivers are observable in active markets. Level 2 inputs are those in markets for which there are few transactions, the prices are not current, little public information exists or instances where prices vary substantially over time or among brokered market makers.
• Level 3 — Model derived valuations in which one or more significant inputs or significant value drivers are unobservable. Unobservable inputs are those inputs that reflect the Trust's own assumptions that market participants would use to price the asset or liability based on the best available information.
The following table presents the valuation levels of each Fund's assets as of June 30, 2008:
| | | Core
Value | | Large Cap
Value | | Mid-Cap
Value | | Small Cap
Value | | All Cap
Value | |
| Level 1 — Quoted prices in an active market | | $ | 1,282,327,242 | | | $ | 2,670,796,479 | | | $ | 1,921,205,303 | | | $ | 326,371,678 | | | $ | 58,601,935 | | |
| Level 2 — Other significant observable market inputs | | | 35,488,800 | | | | — | | | | 76,415,400 | | | | — | | | | — | | |
| Level 3 — Significant unobservable inputs | | | — | | | | — | | | | — | | | | — | | | | — | | |
| Total | | $ | 1,317,816,042 | | | $ | 2,670,796,479 | | | $ | 1,997,620,703 | | | $ | 326,371,678 | | | $ | 58,601,935 | | |
29
The Trust did not have any liabilities that were measured at fair value on June 30, 2008.
Income and Expense Allocation. Common expenses incurred by the Trust which are not allocable to a specific Fund are allocated among the Funds based upon relative net assets or evenly, depending on the nature of the expenditure. Net investment income, other than class-specific expenses, and realized and unrealized gains and losses are allocated daily to each class of shares based upon the relative net asset value of outstanding shares of each class at the beginning of the day (after adjusting for the current day's capital share activity of the respective class).
Dividends and Distributions to Shareholders. Dividends and distributions to shareholders are recorded on the ex-dividend date. Dividends from net investment income are declared and paid semi-annually for the Large Cap Value Fund and annually for the Core Value Fund, Mid-Cap Value Fund, Small Cap Value Fund and All Cap Value Fund. Distributions of net realized capital gains, if any, will be declared and paid at least annually.
Security Transactions and Investment Income. Security and shareholder transactions are recorded on trade date. Realized gains and losses on sales of investments are calculated on the specifically identified cost basis of the securities. Dividend income, less foreign taxes withheld, if any, are recorded on the ex-dividend date. Interest income is recognized on the accrual basis. Market discounts, premiums and original issue discounts on fixed-income securities are amortized daily over the expected life of the security. Return of capital distributions received from REIT securities are recorded as an adjustment to the cost of the security and thus may impact unrealized gains or losses on the security.
Restricted and Illiquid Securities. The Funds may invest in securities that are subject to legal or contractual restrictions on resale or are illiquid. Restricted securities generally may be resold in transactions exempt from registration. An illiquid security is a security which cannot be disposed of promptly (within seven days) and in the usual course of business at approximately its fair value and includes repurchase agreements maturing in excess of seven days, time deposits with a withdrawal penalty, non-negotiable instruments and instruments for which no market exists. Disposal of these securities may involve time-consuming negotiations and expense, and prompt sale at the current valuation may be difficult.
NOTE 2.
Fees and Transactions with Affiliates. The Trust has entered into Investment Advisory Agreements for each of the Funds with Hotchkis and Wiley Capital Management, LLC (the "Advisor"), with which the officers and a Trustee of the Trust are affiliated. The Advisor is a limited liability company, the primary members of which are HWCap Holdings, a limited liability company whose members are current and former employees of the Advisor, and Stephens - H&W, LLC, a limited liability company whose primary member is SF Holding Corp., which is a diversified holding company. The Advisor is responsible for the management of the Funds' investments and provides the necessary personnel, facilities, equipment and certain other services necessary to the operations of each Fund. The Advisor receives a fee, computed daily and payable monthly, at the annual rates pre sented below as applied to each Fund's daily net assets. The Advisor has contractually agreed to pay all operating expenses in excess of the annual rates presented below as applied to such Fund's daily net assets through October 31, 2009.
| | | Core
Value | | Large Cap
Value | | Mid-Cap
Value | | Small Cap
Value | | All Cap
Value | |
| Annual Advisory Fee Rate | | | 0.75 | %1 | | | 0.75 | %1 | | | 0.75 | %1 | | | 0.75 | % | | | 0.75 | % | |
| Annual cap on expenses — Class I | | | 0.95 | % | | | 1.05 | % | | | 1.15 | % | | | 1.25 | % | | | 1.25 | % | |
| Annual cap on expenses — Class A | | | 1.20 | % | | | 1.30 | % | | | 1.40 | % | | | 1.50 | % | | | 1.50 | % | |
| Annual cap on expenses — Class C | | | 1.95 | % | | | 2.05 | % | | | 2.15 | % | | | 2.25 | % | | | 2.25 | % | |
| Annual cap on expenses — Class R | | | Not applicable | | | | 1.55 | % | | | 1.65 | % | | | Not applicable | | | | Not applicable | | |
1 Effective January 1, 2007, the Annual Advisory Fee Rate is 0.75% for the first $5 billion in assets, 0.65% for the next $5 billion in assets and 0.60% for assets over $10 billion.
Quasar Distributors, LLC is the principal underwriter and distributor for the shares of the Funds ("Quasar" or the "Distributor"). The Distributor is affiliated with the Funds' transfer agent, fund accountant and administrator, U.S. Bancorp Fund Services, LLC. Pursuant to the Distribution Plan adopted by the Trust in accordance with Rule 12b-1 under the 1940 Act, the Funds pay the Distributor ongoing distribution and service fees. The fees are accrued daily at the annual rates based upon the average daily net assets of the shares as follows:
| | | Distribution and
Service Fee | |
| Class A | | | 0.25 | % | |
| Class C | | | 1.00 | % | |
| Class R | | | 0.50 | % | |
Pursuant to separate agreements with the Distributor, selected dealers and other financial intermediaries also provide distribution services to the Funds. The ongoing distribution and service fee compensates the Distributor and selected dealers for providing distribution-related and shareholder services to Class A, Class C and Class R shareholders.
Certain selected dealers and other financial intermediaries charge a fee for shareholder accounting services and administrative services that they provide to the Funds on behalf of certain shareholders; the portion of this fee paid by the Funds is included within "Transfer agent fees and expenses" in the Statements of Operations.
NOTE 3.
Investments. Purchases and sales of investment securities, excluding short-term investments, for the year ended June 30, 2008 were as follows:
| | | Core Value | | Large Cap Value | | Mid-Cap Value | | Small Cap Value | | All Cap Value | |
| Purchases | | $ | 1,458,733,971 | | | $ | 2,410,885,141 | | | $ | 1,635,360,099 | | | $ | 265,957,114 | | | $ | 113,088,222 | | |
| Sales | | | 1,770,848,215 | | | | 4,272,201,984 | | | | 3,215,796,901 | | | | 408,867,440 | | | | 168,669,616 | | |
30
NOTE 4.
Federal Income Taxes. It is each Fund's policy to continue to comply with the requirements of the Internal Revenue Code applicable to regulated investment companies and each Fund intends to distribute substantially all of its investment company net taxable income and net capital gains to shareholders. Therefore, no federal income tax provision is required. Under the applicable foreign tax law, a withholding tax may be imposed on interest, dividends and capital gains at various rates.
Distributions paid to shareholders are based on net investment income and net realized gains determined on a tax basis, which may differ from net investment income and net realized gains for financial reporting purposes. These differences are due primarily to differing treatment for items such as short-term capital gains and losses; capital losses related to sales of certain securities within 30 days of purchase; and cost of investments sold. The fiscal year in which amounts are distributed may differ from the year in which the net investment income and net realized gains are recorded by the Funds for financial reporting purposes. The Funds may utilize earnings and profits distributed to shareholders on redemptions of shares as part of the dividends paid deduction. Generally accepted accounting principles require that permanent financial reporting and tax differences be reclassified within the capital accounts.
The following information is presented on an income tax basis as of June 30, 2008:
| | | Core Value | | Large Cap Value | | Mid-Cap Value | | Small Cap Value | | All Cap Value | |
| Cost of investments(a) | | $ | 1,779,337,879 | | | $ | 3,656,574,056 | | | $ | 2,627,508,223 | | | $ | 387,967,056 | | | $ | 68,755,183 | | |
| Gross unrealized appreciation | | | 66,043,852 | | | | 218,719,843 | | | | 172,605,519 | | | | 37,216,069 | | | | 2,505,517 | | |
| Gross unrealized depreciation | | | (527,565,689 | ) | | | (1,204,497,420 | ) | | | (802,493,039 | ) | | | (98,811,447 | ) | | | (12,658,765 | ) | |
| Net unrealized depreciation on investments | | | (461,521,837 | ) | | | (985,777,577 | ) | | | (629,887,520 | ) | | | (61,595,378 | ) | | | (10,153,248 | ) | |
Distributable ordinary income
(as of 6/30/08) | | | 14,792,750 | | | | 30,050,259 | | | | 7,583,445 | | | | 1,485,015 | | | | 96,308 | | |
Distributable long-term gains
(as of 6/30/08) | | | — | | | | 36,744 | | | | 3,807,596 | | | | 4,779,270 | | | | — | | |
| Total distributable earnings | | | 14,792,750 | | | | 30,087,003 | | | | 11,391,041 | | | | 6,264,285 | | | | 96,308 | | |
| Other accumulated losses | | | (160,717,518 | ) | | | (17,870,276 | ) | | | (174,265,973 | ) | | | — | | | | (830,875 | ) | |
| Total accumulated losses | | | (607,446,605 | ) | | | (973,560,850 | ) | | | (792,762,452 | ) | | | (55,331,093 | ) | | | (10,887,815 | ) | |
(a) Any differences between book and tax cost are due primarily to wash sale losses.
On the Statements of Assets and Liabilities, the following adjustments were made for permanent tax adjustments:
| | | Undistributed
Net Realized Gain
(Loss) on Securities | | Undistributed
Net Investment
Income | | Paid in
Capital | |
| Core Value | | $ | (138 | ) | | $ | 138 | | | $ | — | | |
| Large Cap Value | | | (13,916,419 | ) | | | (2,061 | ) | | | 13,918,480 | | |
| Mid-Cap Value | | | (3,808,465 | ) | | | 3,808,465 | | | | — | | |
| Small Cap Value | | | (89,832 | ) | | | 89,832 | | | | — | | |
| All Cap Value | | | 458 | | | | (458 | ) | | | — | | |
The permanent differences primarily relate to the long-term capital gains character of dividend income received from REIT securities.
The tax components of distributions paid during the fiscal years ended June 30, 2008 and 2007, capital loss carryovers as of June 30, 2008, and tax basis post-October losses as of June 30, 2008, which are not recognized for tax purposes until the first day of the following fiscal year, are:
| | | June 30, 2008 | | June 30, 2007 | |
| | | Ordinary
Income
Distributions | | Long-Term
Capital Gains
Distributions | | Net Capital
Loss
Carryovers | | Post-
October
Losses | | Ordinary
Income
Distributions | | Long-Term
Capital Gains
Distributions | |
| Core Value | | $ | 51,802,765 | | | $ | 96,274,277 | | | $ | — | | | $ | 160,717,518 | | | $ | 10,317,533 | | | $ | 33,196,879 | | |
| Large Cap Value | | | 72,124,221 | | | | 358,827,060 | | | | — | | | | 17,870,276 | | | | 59,398,863 | | | | 230,563,101 | | |
| Mid-Cap Value | | | 140,710,723 | | | | 383,810,950 | | | | — | | | | 174,265,973 | | | | 18,851,060 | | | | 416,397,163 | | |
| Small Cap Value | | | — | | | | 44,745,044 | | | | — | | | | — | | | | 16,057,366 | | | | 44,545,500 | | |
| All Cap Value | | | 2,656,418 | | | | 6,735,294 | | | | (31,503 | ) | | | 799,372 | | | | 1,051,874 | | | | 12,506,624 | | |
The Funds designated as long-term capital gain dividends, pursuant to Internal Revenue Code Section 852(b)(3), the amount necessary to reduce the earnings and profits of the Funds related to net capital gains to zero for the tax year ended June 30, 2008.
Effective July 1, 2007, the Trust adopted FASB Interpretation No. 48 ("FIN 48"), "Accounting for Uncertainty in Income Taxes", a clarification of FASB Statement No. 109, "Accounting for Income Taxes". FIN 48 establishes financial reporting rules regarding recognition and measurement of tax positions taken or expected to be taken on a tax return. The adoption of FIN 48 had no impact on the Funds' net assets or results of operations.
31
As of and during the year ended June 30, 2008, the Trust did not have a liability for any unrecognized tax benefits. The Trust recognizes interest and penalties, if any, related to unrecognized tax benefits as income tax expense in the Statements of Operations. During the year ended June 30, 2008, the Trust did not incur any interest or penalties. All tax years since inception remain open and subject to examination by tax jurisdictions.
NOTE 5.
Capital Share Transactions. Transactions in capital shares for each class were as follows:
| | | Sales | | Reinvestment of
dividends
and distributions | | Redemptions | | Net increase (decrease) | |
| | | Shares | | Amount | | Shares | | Amount | | Shares | | Amount | | Shares | | Amount | |
| Year Ended June 30, 2008 | |
| Core Value Fund | |
| Class I | | | 49,708,802 | | | $ | 617,935,371 | | | | 9,509,280 | | | $ | 113,730,995 | | | | (53,091,091 | ) | | $ | (607,940,559 | ) | | | 6,126,991 | | | $ | 123,725,807 | | |
| Class A | | | 5,076,535 | | | | 60,863,428 | | | | 1,489,496 | | | | 17,799,483 | | | | (33,077,083 | ) | | | (416,798,237 | ) | | | (26,511,052 | ) | | | (338,135,326 | ) | |
| Class C | | | 655,816 | | | | 7,683,688 | | | | 288,253 | | | | 3,404,262 | | | | (6,779,387 | ) | | | (83,925,275 | ) | | | (5,835,318 | ) | | | (72,837,325 | ) | |
Total net increase
(decrease) | | | 55,441,153 | | | | 686,482,487 | | | | 11,287,029 | | | | 134,934,740 | | | | (92,947,561 | ) | | | (1,108,664,071 | ) | | | (26,219,379 | ) | | | (287,246,844 | ) | |
| Large Cap Value Fund | |
| Class I * | | | 19,597,342 | | | | 419,808,596 | | | | 7,856,475 | | | | 163,356,032 | | | | (56,185,310 | ) | | | (1,189,667,322 | ) | | | (28,731,493 | ) | | | (606,502,694 | ) | |
| Class A | | | 34,913,055 | | | | 720,751,235 | | | | 8,601,611 | | | | 177,528,697 | | | | (72,983,452 | ) | | | (1,549,366,224 | ) | | | (29,468,786 | ) | | | (651,086,292 | ) | |
| Class C | | | 807,051 | | | | 16,785,265 | | | | 518,063 | | | | 10,480,421 | | | | (11,323,207 | ) | | | (244,404,241 | ) | | | (9,998,093 | ) | | | (217,138,555 | ) | |
| Class R | | | 889,024 | | | | 19,112,937 | | | | 216,591 | | | | 4,490,275 | | | | (2,234,446 | ) | | | (47,452,313 | ) | | | (1,128,831 | ) | | | (23,849,101 | ) | |
Total net increase
(decrease) | | | 56,206,472 | | | | 1,176,458,033 | | | | 17,192,740 | | | | 355,855,425 | | | | (142,726,415 | ) | | | (3,030,890,100 | ) | | | (69,327,203 | ) | | | (1,498,576,642 | ) | |
| Mid-Cap Value Fund | |
| Class I | | | 22,256,572 | | | | 482,336,141 | | | | 16,402,765 | | | | 340,521,403 | | | | (64,780,700 | ) | | | (1,495,575,523 | ) | | | (26,121,363 | ) | | | (672,717,979 | ) | |
| Class A | | | 7,011,865 | | | | 153,469,004 | | | | 3,879,787 | | | | 80,078,798 | | | | (23,115,909 | ) | | | (540,495,024 | ) | | | (12,224,257 | ) | | | (306,947,222 | ) | |
| Class C | | | 632,223 | | | | 12,712,470 | | | | 525,418 | | | | 10,308,701 | | | | (5,757,311 | ) | | | (129,591,154 | ) | | | (4,599,670 | ) | | | (106,569,983 | ) | |
| Class R | | | 475,979 | | | | 11,033,428 | | | | 48,592 | | | | 1,013,628 | | | | (653,522 | ) | | | (14,875,098 | ) | | | (128,951 | ) | | | (2,828,042 | ) | |
Total net increase
(decrease) | | | 30,376,639 | | | | 659,551,043 | | | | 20,856,562 | | | | 431,922,530 | | | | (94,307,442 | ) | | | (2,180,536,799 | ) | | | (43,074,241 | ) | | | (1,089,063,226 | ) | |
| Small Cap Value Fund | |
| Class I | | | 2,374,512 | | | | 85,971,961 | | | | 446,282 | | | | 15,258,372 | | | | (4,151,658 | ) | | | (152,198,811 | ) | | | (1,330,864 | ) | | | (50,968,478 | ) | |
| Class A | | | 247,022 | | | | 8,816,116 | | | | 122,432 | | | | 4,193,291 | | | | (1,393,537 | ) | | | (51,515,949 | ) | | | (1,024,083 | ) | | | (38,506,542 | ) | |
| Class C | | | 18,750 | | | | 613,187 | | | | 7,448 | | | | 237,372 | | | | (195,793 | ) | | | (6,957,075 | ) | | | (169,595 | ) | | | (6,106,516 | ) | |
Total net increase
(decrease) | | | 2,640,284 | | | | 95,401,264 | | | | 576,162 | | | | 19,689,035 | | | | (5,740,988 | ) | | | (210,671,835 | ) | | | (2,524,542 | ) | | | (95,581,536 | ) | |
| All Cap Value Fund | |
| Class I | | | 147,545 | | | | 2,610,572 | | | | 186,218 | | | | 2,975,756 | | | | (723,272 | ) | | | (12,870,344 | ) | | | (389,509 | ) | | | (7,284,016 | ) | |
| Class A | | | 86,135 | | | | 1,451,662 | | | | 163,579 | | | | 2,613,993 | | | | (1,595,665 | ) | | | (28,040,632 | ) | | | (1,345,951 | ) | | | (23,974,977 | ) | |
| Class C | | | 135,588 | | | | 2,114,325 | | | | 71,556 | | | | 1,104,815 | | | | (1,411,466 | ) | | | (23,435,263 | ) | | | (1,204,322 | ) | | | (20,216,123 | ) | |
Total net increase
(decrease) | | | 369,268 | | | | 6,176,559 | | | | 421,353 | | | | 6,694,564 | | | | (3,730,403 | ) | | | (64,346,239 | ) | | | (2,939,782 | ) | | | (51,475,116 | ) | |
* Includes an in-kind redemption which resulted in a realized gain of $13,918,480.
| | | Sales | | Reinvestment of
dividends
and distributions | | Redemptions | | Net increase (decrease) | |
| | | Shares | | Amount | | Shares | | Amount | | Shares | | Amount | | Shares | | Amount | |
| Year Ended June 30, 2007 | |
| Core Value Fund | |
| Class I | | | 62,917,991 | | | $ | 939,244,432 | | | | 1,770,792 | | | $ | 25,694,196 | | | | (12,066,185 | ) | | $ | (175,332,542 | ) | | | 52,622,598 | | | $ | 789,606,086 | | |
| Class A | | | 8,097,698 | | | | 117,576,074 | | | | 858,676 | | | | 12,433,625 | | | | (17,429,848 | ) | | | (241,687,112 | ) | | | (8,473,474 | ) | | | (111,677,413 | ) | |
| Class C | | | 433,645 | | | | 6,135,626 | | | | 207,445 | | | | 2,974,764 | | | | (2,805,864 | ) | | | (39,433,813 | ) | | | (2,164,774 | ) | | | (30,323,423 | ) | |
Total net increase
(decrease) | | | 71,449,334 | | | | 1,062,956,132 | | | | 2,836,913 | | | | 41,102,585 | | | | (32,301,897 | ) | | | (456,453,467 | ) | | | 41,984,350 | | | | 647,605,250 | | |
32
| | | Sales | | Reinvestment of
dividends
and distributions | | Redemptions | | Net increase (decrease) | |
| | | Shares | | Amount | | Shares | | Amount | | Shares | | Amount | | Shares | | Amount | |
| Large Cap Value Fund | |
| Class I | | | 23,946,480 | | | $ | 608,011,064 | | | | 4,647,162 | | | $ | 116,517,177 | | | | (18,799,997 | ) | | $ | (476,774,002 | ) | | | 9,793,645 | | | $ | 247,754,239 | | |
| Class A | | | 22,323,575 | | | | 565,954,627 | | | | 5,366,709 | | | | 134,426,367 | | | | (39,114,310 | ) | | | (980,975,663 | ) | | | (11,424,026 | ) | | | (280,594,669 | ) | |
| Class C | | | 664,965 | | | | 16,638,745 | | | | 715,585 | | | | 17,901,846 | | | | (5,343,562 | ) | | | (130,918,883 | ) | | | (3,963,012 | ) | | | (96,378,292 | ) | |
| Class R | | | 1,009,409 | | | | 25,517,130 | | | | 169,798 | | | | 4,303,628 | | | | (834,787 | ) | | | (21,359,148 | ) | | | 344,420 | | | | 8,461,610 | | |
Total net increase
(decrease) | | | 47,944,429 | | | | 1,216,121,566 | | | | 10,899,254 | | | | 273,149,018 | | | | (64,092,656 | ) | | | (1,610,027,696 | ) | | | (5,248,973 | ) | | | (120,757,112 | ) | |
| Mid-Cap Value Fund | |
| Class I | | | 23,698,208 | | | | 733,839,923 | | | | 9,832,454 | | | | 294,481,988 | | | | (17,854,797 | ) | | | (547,394,557 | ) | | | 15,675,865 | | | | 480,927,354 | | |
| Class A | | | 5,849,398 | | | | 180,229,618 | | | | 3,441,932 | | | | 102,432,403 | | | | (10,920,812 | ) | | | (332,455,231 | ) | | | (1,629,482 | ) | | | (49,793,210 | ) | |
| Class C | | | 261,185 | | | | 7,676,755 | | | | 777,590 | | | | 22,246,843 | | | | (1,596,612 | ) | | | (46,618,392 | ) | | | (557,837 | ) | | | (16,694,794 | ) | |
| Class R | | | 250,279 | | | | 7,755,980 | | | | 78,035 | | | | 2,344,158 | | | | (254,156 | ) | | | (7,855,735 | ) | | | 74,158 | | | | 2,244,403 | | |
Total net increase
(decrease) | | | 30,059,070 | | | | 929,502,276 | | | | 14,130,011 | | | | 421,505,392 | | | | (30,626,377 | ) | | | (934,323,915 | ) | | | 13,562,704 | | | | 416,683,753 | | |
| Small Cap Value Fund | |
| Class I | | | 2,412,047 | | | | 114,141,991 | | | | 1,020,657 | | | | 46,817,547 | | | | (4,401,577 | ) | | | (208,944,803 | ) | | | (968,873 | ) | | | (47,985,265 | ) | |
| Class A | | | 239,437 | | | | 11,405,235 | | | | 230,978 | | | | 10,636,541 | | | | (1,878,412 | ) | | | (88,896,469 | ) | | | (1,407,997 | ) | | | (66,854,693 | ) | |
| Class C | | | 7,521 | | | | 341,297 | | | | 30,536 | | | | 1,326,479 | | | | (178,867 | ) | | | (8,011,601 | ) | | | (140,810 | ) | | | (6,343,825 | ) | |
Total net increase
(decrease) | | | 2,659,005 | | | | 125,888,523 | | | | 1,282,171 | | | | 58,780,567 | | | | (6,458,856 | ) | | | (305,852,873 | ) | | | (2,517,680 | ) | | | (121,183,783 | ) | |
| All Cap Value Fund | |
| Class I | | | 80,884 | | | | 1,672,487 | | | | 192,443 | | | | 3,831,536 | | | | (1,305,914 | ) | | | (27,156,261 | ) | | | (1,032,587 | ) | | | (21,652,238 | ) | |
| Class A | | | 80,242 | | | | 1,650,418 | | | | 247,869 | | | | 4,940,023 | | | | (2,100,304 | ) | | | (42,032,239 | ) | | | (1,772,193 | ) | | | (35,441,798 | ) | |
| Class C | | | 59,408 | | | | 1,183,085 | | | | 194,014 | | | | 3,769,705 | | | | (1,163,996 | ) | | | (22,783,386 | ) | | | (910,574 | ) | | | (17,830,596 | ) | |
Total net increase
(decrease) | | | 220,534 | | | | 4,505,990 | | | | 634,326 | | | | 12,541,264 | | | | (4,570,214 | ) | | | (91,971,886 | ) | | | (3,715,354 | ) | | | (74,924,632 | ) | |
NOTE 6.
Investments in Affiliated Issuers. An issuer in which a Fund's holdings represent 5% or more of the outstanding voting securities of the issuer is an "affiliated" issuer as defined in the 1940 Act. A schedule of each Fund's investments in securities of affiliated issuers held during the year ended June 30, 2008, is set forth below:
| Large Cap Value Fund | |
| Issuer Name | | Share Balance
At July 1, 2007 | | Additions | | Reductions | | Share Balance
At June 30, 2008 | | Dividend
Income | | Value
At June 30, 2008 | |
| Centex Corporation * | | | 2,557,400 | | | | 5,108,600 | | | | (6,293,000 | ) | | | 1,373,000 | | | $ | 578,908 | | | $ | 18,357,010 | | |
| Lennar Corporation * | | | 7,799,420 | | | | 5,159,600 | | | | (12,057,400 | ) | | | 901,620 | | | | 2,582,637 | | | | 10,007,982 | | |
| | | | | | | | | | | $ | 3,161,545 | | | | |
* Issuer was not an affiliate as of June 30, 2008.
| Mid-Cap Value Fund | |
| Issuer Name | | Share Balance
At July 1, 2007 | | Additions | | Reductions | | Share Balance
At June 30, 2008 | | Dividend
Income | | Value
At June 30, 2008 | |
| Citadel Broadcasting Corporation+ | | | 4,187,100 | | | | 12,549,600 | | | | (664,800 | ) | | | 16,071,900 | | | $ | — | | | $ | 19,607,718 | | |
| Conseco, Inc.*+ | | | 7,599,900 | | | | 1,280,400 | | | | (2,683,300 | ) | | | 6,197,000 | | | | — | | | | 61,474,240 | | |
| Con-way, Inc.* | | | 2,680,800 | | | | — | | | | (2,680,800 | ) | | | — | | | | 701,460 | | | | — | | |
| IKON Office Solutions, Inc. | | | 8,708,300 | | | | 298,000 | | | | (3,945,019 | ) | | | 5,061,281 | | | | 1,234,814 | | | | 57,091,250 | | |
| Jones Apparel Group, Inc. | | | 4,693,500 | | | | 2,123,800 | | | | (1,772,000 | ) | | | 5,045,300 | | | | 3,299,730 | | | | 69,372,875 | | |
| MI Developments, Inc. | | | 3,420,300 | | | | — | | | | (886,900 | ) | | | 2,533,400 | | | | 1,444,728 | | | | 56,976,166 | | |
| Rent-A-Center, Inc.*+ | | | 3,820,300 | | | | — | | | | (1,149,300 | ) | | | 2,671,000 | | | | — | | | | 54,942,470 | | |
| Valassis Communications, Inc.*+ | | | 2,456,500 | | | | — | | | | (794,100 | ) | | | 1,662,400 | | | | — | | | | 20,813,248 | | |
| | | | | | | | | | | | | | | | | | | $ | 6,680,732 | | | | | | |
* Issuer was not an affiliate as of June 30, 2008.
+ Non-income producing security.
33
| Small Cap Value Fund | |
| Issuer Name | | Share Balance
At July 1, 2007 | | Additions | | Reductions | | Share Balance
At June 30, 2008 | | Dividend
Income | | Value
At June 30, 2008 | |
| Hudson Highland Group, Inc.+ | | | 877,800 | | | | 640,100 | | | | — | | | | 1,517,900 | | | $ | — | | | $ | 15,892,413 | | |
| Lodgian, Inc.*+ | | | 1,573,109 | | | | — | | | | (579,000 | ) | | | 994,109 | | | | — | | | | 7,783,874 | | |
| Miller Industries, Inc.+ | | | 349,100 | | | | 597,300 | | | | — | | | | 946,400 | | | | — | | | | 9,426,144 | | |
| Westwood One, Inc.+ | | | 2,710,600 | | | | 2,906,500 | | | | (129,600 | ) | | | 5,487,500 | | | | — | | | | 6,804,500 | | |
* Issuer was not an affiliate as of June 30, 2008.
+ Non-income producing security.
NOTE 7.
Securities Lending. Effective December 2007, the Funds entered into a securities lending arrangement with Brown Brothers Harriman & Co. (the "Custodian"). Under the securities lending agreement, the Custodian is authorized to loan securities on behalf of the Funds to approved brokers. In exchange, the Funds receive cash collateral in the amount of at least 102% of the value of the securities loaned plus accrued interest. The total market value of securities on loan for each Fund as of June 30, 2008 is disclosed on the Schedule of Investments. The cash collateral is invested in short-term instruments as noted in the Schedule of Investments. Income earned from these investments is included in "Securities on loan" on the Statement of Operations and is allocated to each Fund based on each Fund's proportion of the total cash collateral received. Altho ugh risk is mitigated by the collateral, the Funds could experience a delay in recovering their securities and possible loss of income or value if the borrower fails to return them. In addition, the Funds bear the risk of loss associated with the investment of cash collateral received.
A portion of the income generated by the investment of the collateral, net of any rebates paid by the Custodian to borrowers, is remitted to the Custodian as lending agent, and the remainder is paid to the Funds.
NOTE 8.
Indemnifications. Under the Trust's organizational documents, its officers and Trustees are indemnified against certain liability arising out of the performance of their duties to the Funds. In addition, in the normal course of business the Trust enters into contracts that contain a variety of representations and warranties, which provide general indemnifications. The Funds' maximum exposure under these arrangements is unknown, as this would involve future claims that may be made against the Funds. However, based on experience, the Funds expect the risk of loss to be remote.
NOTE 9.
New Accounting Standard. In March 2008, Statement of Financial Accounting Standards No. 161, "Disclosures about Derivative Instruments and Hedging Activities" ("SFAS 161") was issued and is effective for fiscal years beginning after November 15, 2008. SFAS 161 is intended to improve financial reporting for derivative instruments by requiring enhanced disclosure that enables investors to understand how and why an entity uses derivatives, how derivatives are accounted for, and how derivative instruments affect an entity's results of operations and financial position. Management is currently evaluating the potential impact of SFAS 161 on the Funds' financial statement disclosures, if any.
NOTE 10. (UNAUDITED)
Federal Tax Disclosure. For the year ended June 30, 2008, the following percentages of ordinary distributions paid qualifies for the dividend received deduction available to corporate shareholders: Core Value Fund — 77%, Large Cap Value Fund — 100%, Mid-Cap Value Fund — 42%, All Cap Value Fund — 59%. For the fiscal year ended June 30, 2008, the following percentages of ordinary distributions paid are designated as qualified income under the Jobs and Growth Tax Relief Reconciliation Act of 2003: Core Value Fund — 70%, Large Cap Value Fund — 100%, Mid-Cap Value Fund — 39%, All Cap Value Fund — 46%. Shareholders should consult their tax advisors.
Additional Information Applicable to Foreign Shareholders Only. For the year ended June 30, 2008, the Funds designate the following percentages of ordinary distributions paid as interest-related dividends under Internal Revenue Code Section 871(k)(1)(c): Core Value Fund — 3%, Large Cap Value Fund — 2%, Mid-Cap Value Fund — 4%, All Cap Value Fund — 3%. For the fiscal year ended June 30, 2008, the following percentages of its ordinary income distributions paid are designated as short-term capital gain distributions under the Internal Revenue Code Section 871(k)(2)(c): Core Value Fund — 63%, Large Cap Value Fund — 36%, Mid-Cap Value Fund — 86%, All Cap Value Fund — 95%.
34
Report of Independent Registered Public Accounting Firm
To the Board of Trustees and Shareholders
of Hotchkis and Wiley Funds
In our opinion, the accompanying statements of assets and liabilities, including the schedules of investments, and the related statements of operations and of changes in net assets and the financial highlights present fairly, in all material respects, the financial position of each of the Hotchkis and Wiley Funds (hereafter referred to as "Funds") at June 30, 2008, the results of each of their operations for the year then ended, the changes in each of their net assets for each of the two years in the period then ended and their financial highlights for each of the periods presented, in conformity with accounting principles generally accepted in the United States of America. These financial statements and financial highlights (hereafter referred to as "financial statements") are the responsibility of the Funds' management; our responsibility is to express an opinion on these financial statements based on our audits. We conducted our audits of these financial statements in accordance with the standards of the Public Company Accounting Oversight Board (United States). Those standards require that we plan and perform the audit to obtain reasonable assurance about whether the financial statements are free of material misstatement. An audit includes examining, on a test basis, evidence supporting the amounts and disclosures in the financial statements, assessing the accounting principles used and significant estimates made by management, and evaluating the overall financial statement presentation. We believe that our audits, which included confirmation of securities at June 30, 2008 by correspondence with the custodian and brokers, provide a reasonable basis for our opinion.
PricewaterhouseCoopers LLP
Los Angeles, California
August 12, 2008
35
Fund Expense Examples (Unaudited)
As a mutual fund shareholder, you incur two types of costs: (1) transaction costs such as initial sales charges (loads) on purchase payments and contingent deferred sales charges on redemptions and (2) ongoing costs, including management fees, distribution and service (12b-1) fees and other fund expenses. The following examples are intended to help you understand your ongoing costs (in dollars) of investing in the Funds and to compare these costs with the ongoing costs of investing in other mutual funds. The examples are based on an investment of $1,000 invested at the beginning of the most recent six-month period and held for the entire period (January 1, 2008 – June 30, 2008).
The table below illustrates the Funds' costs in two ways:
Based on Actual Fund Returns. This section provides information about actual account values and actual expenses. You may use the information in this section, together with the amount you invested, to estimate the expenses that you paid over the period. Simply divide your account value by $1,000 (for example, an $8,600 account value divided by $1,000 = 8.6), then multiply the result by the number in the section under the heading entitled "Expenses Paid During Period" to estimate the expenses you paid on your account during this period.
Based on Hypothetical 5% Yearly Returns. This section provides information about hypothetical account values and hypothetical expenses based on the Funds' actual expense ratios and an assumed rate of return of 5% per year before expenses, which is not the Funds' actual return. The hypothetical account values and expenses may not be used to estimate the actual ending account balance or expenses you paid for the period. You may use this information to compare the ongoing costs of investing in the Funds and other funds. To do so, compare this 5% hypothetical example with the 5% hypothetical examples that appear in the shareholder reports of the other funds.
Please note that the expenses shown in the table are meant to highlight your ongoing costs only and do not reflect any transactional costs, such as sales charges (loads). Therefore, the second section is useful in comparing ongoing costs only, and will not help you determine the relative total costs of owning different funds. In addition, if these transactional costs were included, your costs would have been higher.
The calculations assume no shares were bought or sold during the period. Your actual costs may have been higher or lower, depending on the amount of your investment and the timing of any purchases or redemptions.
| | | Based on Actual Fund Returns | | Based on Hypothetical 5% Yearly Returns | | | |
| | | Beginning
Account Value
1/1/08 | | Ending
Account Value
6/30/08 | | Expenses Paid
During Period*
1/1/08 - 6/30/08 | | Beginning
Account Value
1/1/08 | | Ending
Account Value
6/30/08 | | Expenses Paid
During Period*
1/1/08 - 6/30/08 | | Annualized
Expense Ratio | |
| Core Value Fund | |
| Class I | | $ | 1,000.00 | | | $ | 806.20 | | | $ | 4.27 | | | $ | 1,000.00 | | | $ | 1,020.14 | | | $ | 4.77 | | | | 0.95 | % | |
| Class A | | | 1,000.00 | | | | 806.10 | | | | 5.39 | | | | 1,000.00 | | | | 1,018.90 | | | | 6.02 | | | | 1.20 | | |
| Class C | | | 1,000.00 | | | | 802.90 | | | | 8.74 | | | | 1,000.00 | | | | 1,015.17 | | | | 9.77 | | | | 1.95 | | |
| Large Cap Value Fund | |
| Class I | | | 1,000.00 | | | | 802.10 | | | | 4.57 | | | | 1,000.00 | | | | 1,019.79 | | | | 5.12 | | | | 1.02 | | |
| Class A | | | 1,000.00 | | | | 800.50 | | | | 5.69 | | | | 1,000.00 | | | | 1,018.55 | | | | 6.37 | | | | 1.27 | | |
| Class C | | | 1,000.00 | | | | 797.10 | | | | 9.03 | | | | 1,000.00 | | | | 1,014.82 | | | | 10.12 | | | | 2.02 | | |
| Class R | | | 1,000.00 | | | | 798.80 | | | | 6.80 | | | | 1,000.00 | | | | 1,017.30 | | | | 7.62 | | | | 1.52 | | |
| Mid-Cap Value Fund | |
| Class I | | | 1,000.00 | | | | 851.10 | | | | 4.74 | | | | 1,000.00 | | | | 1,019.74 | | | | 5.17 | | | | 1.03 | | |
| Class A | | | 1,000.00 | | | | 850.30 | | | | 5.89 | | | | 1,000.00 | | | | 1,018.50 | | | | 6.42 | | | | 1.28 | | |
| Class C | | | 1,000.00 | | | | 847.10 | | | | 9.32 | | | | 1,000.00 | | | | 1,014.77 | | | | 10.17 | | | | 2.03 | | |
| Class R | | | 1,000.00 | | | | 849.40 | | | | 7.04 | | | | 1,000.00 | | | | 1,017.26 | | | | 7.67 | | | | 1.53 | | |
| Small Cap Value Fund | |
| Class I | | | 1,000.00 | | | | 953.30 | | | | 5.29 | | | | 1,000.00 | | | | 1,019.44 | | | | 5.47 | | | | 1.09 | | |
| Class A | | | 1,000.00 | | | | 952.50 | | | | 6.51 | | | | 1,000.00 | | | | 1,018.20 | | | | 6.72 | | | | 1.34 | | |
| Class C | | | 1,000.00 | | | | 948.90 | | | | 10.13 | | | | 1,000.00 | | | | 1,014.47 | | | | 10.47 | | | | 2.09 | | |
| All Cap Value Fund | |
| Class I | | | 1,000.00 | | | | 872.20 | | | | 5.31 | | | | 1,000.00 | | | | 1,019.19 | | | | 5.72 | | | | 1.14 | | |
| Class A | | | 1,000.00 | | | | 870.90 | | | | 6.47 | | | | 1,000.00 | | | | 1,017.95 | | | | 6.97 | | | | 1.39 | | |
| Class C | | | 1,000.00 | | | | 867.70 | | | | 9.94 | | | | 1,000.00 | | | | 1,014.22 | | | | 10.72 | | | | 2.14 | | |
* Expenses are equal to the Funds' annualized expense ratio by class multiplied by the average account value over the period, multiplied by the number of days in the most recent fiscal half-year (182), then divided by the number of days in the most recent fiscal year (366).
36
Board Considerations in Approving Continuation of Investment Advisory Agreements (Unaudited)
Background and Approval Process. Hotchkis and Wiley Capital Management, LLC (the "Advisor") serves as investment adviser to the Hotchkis and Wiley Large Cap Value Fund, the Hotchkis and Wiley Mid-Cap Value Fund, the Hotchkis and Wiley Small Cap Value Fund, the Hotchkis and Wiley All Cap Value Fund and the Hotchkis and Wiley Core Value Fund (each a "Fund") pursuant to separate investment advisory agreements (the "Advisory Agreements") with the Hotchkis and Wiley Funds (the "Trust"). The Advisory Agreements were initially approved by the Board of Trustees at the inception of each Fund for two-year terms. The Advisory Agreements continue thereafter if approved annually by the Trustees, including a majority of the Trustees who are not "interested persons" (as defined in the Investment Company Act of 1940, as amended (the "1940 Act")) of the Trust (the "I ndependent Trustees"), cast in person at a meeting called for the purpose of voting on the Advisory Agreements. The Advisory Agreements for each Fund were most recently considered by the Board at a meeting held in May 2008.
As part of the annual contract review process, the Independent Trustees, through their independent legal counsel, requested and received extensive materials, including information relating to (i) the nature, extent and quality of services provided by the Advisor, including compliance with legal requirements, (ii) short-term and long-term performance of Class A shares of each Fund relative to peer groups selected by an independent third party, their Lipper fund category and market indices, (iii) the costs of the services provided and the Advisor's profitability with respect to the management of each Fund, (iv) the extent to which the Advisor has in the past or is likely in the future to experience economies of scale in connection with the investment advisory services it provides to each Fund, (v) the expense ratios of Class A shares of each Fund as compared with the expense ratios of their peer group and their Lipper fund categor y and (vi) any benefits to the Advisor and its affiliates from its relationship with the Funds. The Independent Trustees also requested and received information specifically related to the Advisor's risk controls and risk evaluation process. The Independent Trustees noted that the information provided by the Advisor was thorough and responsive to their requests. The information provided in response to their annual and more-focused requests supplemented information received by the Board throughout the year, both in writing and in meetings, regarding the Funds, including Fund performance, expense ratios, portfolio composition and regulatory compliance. The Independent Trustees also reviewed and discussed with independent legal counsel prior to the meeting a legal memorandum discussing, among other things, the duties of directors/trustees under the 1940 Act and relevant state law in reviewing and approving investment advisory contracts.
Three weeks prior to the Board meeting, the Independent Trustees held a conference call with their independent legal counsel to review the materials provided by the Advisor and an independent third party, and consequently supplemented their information request with additional questions for the Advisor. At the Board meeting, representatives of the Advisor discussed certain responses with the Trustees and responded to their further questions. The Independent Trustees also met privately with their independent legal counsel to consider the renewal of the Advisory Agreements. The Trustees considered the factors set out in case law and identified by the Securities and Exchange Commission as most relevant in considering the renewal of investment advisory agreements. The Trustees considered these and other factors, as summarized in more detail below, and concluded that the terms of each Advisory Agreement are fair and reasonable and the continuance of each Agreement is in the best interests of each Fund. No single factor was determinative in the Board's analysis.
Nature, Extent and Quality of Services. As part of the Board's decision-making process, the Trustees noted that the Advisor and its predecessors have managed the Funds and their predecessors since their inception, and the Trustees believe that a long-term relationship with a capable, conscientious investment adviser is in the best interests of the Funds. The Board also considered that shareholders invest in a Fund specifically seeking the Advisor's investment expertise and style. The Board also noted that when shareholders invest in a Fund, they know the advisory fee that is paid by the Fund. In this connection, the Trustees considered, in particular, whether each Fund is managed in accordance with its investment objective and policies as disclosed to shareholders. The Trustees concluded that each Fund is managed consistent with its investment object ive and policies.
The Trustees reviewed information regarding various services provided by the Advisor to the Funds, including an organizational chart and background information on personnel performing such services. The Trustees also reviewed each Fund's performance and information regarding the Advisor's investment program, which is driven by team-oriented, in-depth, fundamental research. The Trustees considered the depth and quality of the Advisor's investment process and stock-picking expertise, the low turnover rates of the Advisor's key personnel, the overall stability of the Advisor's organization, and the experience, capability and integrity of its senior management. The Trustees considered the Advisor's detailed analysis of specific investments provided in response to the Independent Trustees' request. The Trustees noted the Advisor's research associates program launched in 2007 and the portfolio analyst added in 2008 to support the inve stment team. The Trustees considered the portfolio managers' significant investments in the Funds. The Trustees reviewed the Trust's compliance program and the Advisor's commitment to a rigorous compliance effort and the resultant compliance by the Funds and the Advisor with legal requirements. The Trustees also considered the Advisor's ongoing improvements to its business, including continuing investments in technology.
The Trustees also considered other non-advisory services provided to the Funds, such as the services of Advisor employees as officers and other personnel provided that are necessary for Fund operations. The Trustees particularly noted that the services of the Trust's Chief Compliance Officer are provided to the Funds at no cost to the Funds. The Trustees noted that the Advisor organizes Board meetings and the preparation of Board meeting materials, and oversees and manages the other Fund service providers. The Trustees further noted that the Advisor committed significant amounts of effort and expense to start the securities lending program begun by the Funds in February 2008.
Based on their review, the Trustees concluded that the nature, extent and quality of services provided (and expected to be provided) to each Fund under the Advisory Agreement were of a high level and were very satisfactory.
Investment Performance of the Funds and the Advisor. The Trustees reviewed data on the short-term and long-term performance of the Funds in connection with each quarterly Board meeting. As noted above, for the contract review meeting, the Trustees had received — in mid-April — and reviewed a report prepared by the Trust's administrator based on information compiled from Lipper Inc., an independent provider of data to mutual fund boards (the "Report"), that compared the performance of Class A shares of each Fund to that of a small group of comparable funds that the administrator believes are similar in terms of investment classification, asset size, number of holdings, load type, primary distribution channel and expense structure (each, a "Peer Group"), and to the most comparable Lipper universe and Lipper index, for several time periods. Th is data was as of
37
December 31, 2007, and performance information through March 2008 was provided as well. Since some funds' advisory contracts include administration services, the Report included administration fees with advisory fees for comparability. The Independent Trustees discussed with the Chief Executive Officer of the Advisor the appropriateness of the Peer Groups.
The Board considered that:
• the Large Cap Value Fund annual returns under-performed the Peer Group median for the 1-year and 3-year periods covered in the Report, and performed near the median of the Peer Group for the 5- and 10-year periods ; the Fund ranked in the fourth quartile of all equity income funds in the Lipper universe for the 1-, 3- and 10-year periods, and in the second quartile of the Lipper universe for the 5-year period; the Large Cap Value Fund also under-performed the Lipper Equity Income index for the 1-year and 3-year periods, and out-performed the index for the 5-year and 10-year periods,
• the Mid-Cap Value Fund annual returns under-performed the Peer Group median for the 1-, 3- and 5-year periods covered in the Report and out-performed the median of the Peer Group for the 10-year period; the Fund ranked in the fourth quartile of all mid-cap value funds in the Lipper universe for the 1-year and 3-year periods, in the third quartile for the 5-year period and in the first quartile for the 10-year period; the Mid-Cap Value Fund also under-performed the Lipper Mid-Cap Value index for the 1-, 3- and 5-year periods and out-performed the index for the 10-year period,
• the Small Cap Value Fund under-performed the Peer Group median for the 1-, 3- and 5-year periods covered in the Report, and performed at the median for the 10-year period; the Fund ranked in the fourth quartile of all small cap value funds in the Lipper universe for the 1-year and 3-year periods, in the third quartile for the 5-year period, and in the second quartile for the 10-year period; the Small Cap Value Fund also under-performed the Lipper Small Cap Value index for each period covered in the Report,
• the All Cap Value Fund under-performed its Peer Group median and the median of all multi-cap value funds in the Lipper universe for the 1-, 2-, 3- and 5-year periods covered in the Report (the Fund's inception date was December 31, 2002; the Fund ranked in the fourth quartile of all multi-cap value funds in the Lipper universe for the 1-, 2- and 3-year periods and in the second quartile for the 5-year period; the All Cap Value Fund under-performed the Lipper Multi-Cap Value index for the 1-, 2- and 3-year periods and out-performed the index for the 5-year period covered in the Report, and
• the Core Value Fund under-performed its Peer Group median for the 1-, 2- and 3-year periods covered in the Report (the Fund's inception date was August 30, 2004); the Fund ranked in the fourth quartile of all multi-cap value funds in the Lipper universe for the 1-, 2- and 3-year periods; the Core Value Fund under-performed the Lipper Multi-Cap Value index for each period covered in the Report.
The Trustees reviewed the Funds' performance and considered the Advisor's explanation of recent performance and plans to address the under-performance issue. In particular, the Trustees considered the Advisor's analysis of the three worst contributors to each Fund for 2006 and 2007 that was prepared in response to the Independent Trustees' request. The Trustees concluded that the long-term performance of each Fund was good, and that the Funds' under-performance was being responsibly addressed by the Advisor.
Fees, Expenses and Profitability. The Trustees reviewed information provided by the Advisor and data contained in the Report regarding the Funds' advisory fees and expense ratios, including information regarding any expense caps for the Funds. The Trustees reviewed data in the Report showing how the Funds' advisory fees and expense ratios compared to those of their respective Peer Groups as well as competitive universes of funds. The Trustees also reviewed information provided by the Advisor on advisory fees charged by the Advisor for subadvisory services it provides to other mutual funds and advisory fees it charges to its separate account clients with investment objectives and policies similar to those of the Funds. The Trustees considered a list of the many additional functions performed for the Funds that the Advisor does not perform for its sepa rate account and subadvisory clients. The Trustees noted that even though the Funds require more services and have higher costs, and even though it is generally acknowledged that managing mutual funds subjects an investment adviser to more legal and regulatory risk than is the case with separate accounts, the fees charged to each Fund other than the Core Value Fund are the same as or lower than the Advisor's current standard fee schedules for its separate account clients.
The Trustees considered the breakpoints that were added to the advisory fee schedules for the Large Cap Value Fund, Mid-Cap Value Fund and Core Value Fund effective January 1, 2007, noting that this had reduced the advisory fee rate for both the Large Cap Value Fund and the Mid-Cap Value Fund during 2007.
With respect to the advisory fee and expense ratios for the Large Cap Value Fund, the Trustees noted that the Report showed them to be generally among the higher fees within the Fund's Peer Group and among all retail front-end load equity income funds within the Lipper universe, but the Trustees again noted that the Advisor had recently agreed to add breakpoints to the Fund's fee schedule, which had reduced the advisory fee rate during 2007, and that the Large Cap Value Fund is the only fund in its Peer Group that is closed. With respect to the advisory fee and expense ratios for the Mid-Cap Value Fund, the Trustees noted that the Report showed the advisory fee generally to be among the higher fees within the Fund's Peer Group and among all retail front-end load mid-cap value funds within the Lipper universe, but the Trustees noted that the Advisor had recently agreed to add breakpoints to the Fund's fee schedule, which had redu ced the advisory fee rate to a limited extent during 2007. With respect to the advisory fee and expense ratios for the Small Cap Value Fund, the Trustees noted that the Report showed them generally to be in the mid-range among both the Fund's Peer Group and among all retail front-end load small cap value funds within the Lipper universe. With respect to the advisory fee and expense ratios for the All Cap Value Fund, the Trustees noted that the Report showed them generally to be in the mid-range among both the Fund's Peer Group and among all retail front-end load multi-cap value funds within the Lipper universe. With respect to the advisory fee and expense ratios for the Core Value Fund, the Trustees noted that the Report showed them to be in the mid-range among both the Fund's Peer Group and all retail front-end load multi-cap value funds within the Lipper universe. The Trustees considered the fee reductions that the Advisor negotiated from the Funds' administrator and fund accountant and custodian, beginnin g in November 2007, which had resulted in a recent reduction in the overall expense ratio of the Funds. The Trustees noted the quality of the Advisor's investment process and the good long-term performance of the Funds and, based on their review, the Trustees concluded that the advisory fee and expense ratios were fair and reasonable for each Fund.
38
The Trustees reviewed information concerning profitability to the Advisor under the Advisory Agreements, including information regarding the methodology for allocating expenses. The Trustees reviewed data regarding the Advisor's variable expenses, fixed expenses and anticipated material variances expected in 2008. The Trustees considered that the Advisor had formerly absorbed costs above expense caps for the Funds (and has agreed to continue to do so, although expense ratios currently are below the expense cap for each Fund other than the Core Value Fund) for which it would not be reimbursed, and also that the Advisor had agreed to a one-time voluntary waiver of Class C distribution payments in excess of $1.4 million for the period September 2006 to May 2007. The Trustees concluded that the Advisor's allocation methods appeared reasonable. The Trustees also recognized that individual fund or product line profitability of other a dvisers is generally not publicly available, and that profitability may be affected by numerous factors, so that the comparability of profitability among advisory firms is limited. The Trustees noted the importance of the Advisor's profitability — which is derived solely from investment management fees — in maintaining its entrepreneurial environment in a private, primarily employee-owned structure. They noted that the Advisor's compensation/profit structure facilitates retention of its management and investment professionals. They also noted that the Advisor has voluntarily limited growth of assets by closing the Funds to new investors and by not taking on new separate account clients in these strategies, while noting that the Core Value Fund and the Mid-Cap Value Fund were re-opened on December 1, 2007, and that the Mid-Cap Value separate accounts are now available to institutional clients. The Trustees noted that closing the Funds and separate accounts was financially disadvantageous to the Advi sor, and illustrated a commitment to act in the best interests of Fund shareholders. The Trustees concluded that the level of profitability to the Advisor under the Advisory Agreements appeared to be not excessive.
Economies of Scale and Whether Fee Levels Reflect These Economies of Scale. The Trustees noted that the Advisor had determined for most of 2007 and for prior periods to close each Fund to new investors (with limited exceptions), as well as cease accepting new separate accounts in four of the five investment styles, to enable the Advisor to maintain investment flexibility, and that this decision limited the Advisor's revenue. The Trustees also considered information regarding the investment, compliance and client service personnel who have been hired and the increase in technology spending.
The Trustees recognized the position taken by the Advisor that, to the extent economies of scale were occurring, current levels of advisory fees reflect these economies of scale in light of the limited profit potential due to maintaining limits on the Funds' size as well as the costs associated with the high quality, in-depth research that the Advisor provides. The Trustees took cognizance of the Advisor's position that its decision to close the Funds when they reach an appropriate size (and limit new separate accounts) was beneficial to shareholders and represented a form of sharing of economies of scale.
Having taken these factors into account, the Trustees concluded that the Funds' shareholders share in reduced costs experienced by the Advisor through the additional services, investment in talented employees and capital improvements provided by the Advisor. The Trustees also noted that the addition of breakpoints enabled shareholders of the Large Cap Value Fund and the Mid-Cap Value Fund (to a lesser extent) to share in economies of scale during 2007, while noting that the reduction in these Funds' net assets meant that the initial breakpoint was not currently being reached.
Indirect Benefits to the Advisor from its Relationship to the Funds. The Trustees considered information regarding any indirect benefits to the Advisor that could be identified from its relationship to the Funds. In particular, the Trustees considered any benefits from soft dollar arrangements. The Trustees noted that, while the Advisor does not use the Funds' commissions to pay for third party research, the Advisor does receive proprietary research from brokers that execute Fund trades. The Trustees noted that the proprietary research received was "bundled" with the commission cost and that, while the Advisor's profitability might be somewhat lower were it to have to pay for this research with hard dollars, the bundled research services provide valuable information or service to the investment research process, which benefits the Funds (as well as t he Advisor's other clients). The Trustees also noted that the commissions paid by the Funds are generally quite low.
* * * *
Based on their review, including their consideration of each of the factors referred to above, the Trustees concluded that the terms of each Advisory Agreement are fair and reasonable and that the renewal of each Agreement is in the best interests of each Fund.
39
Management (Unaudited)
INDEPENDENT TRUSTEES
| Name and Year of Birth | | Position
Held with the
Trust | | Term of
Office* and
Length of
Time Served | | Principal Occupation(s) During
Past Five Years | | Number of
Portfolios in
Fund Complex
Overseen by
Trustee | | Public
Directorships | |
Randall H. Breitenbach
(born 1960) | | Trustee | | Since 2001 | | Co-Founder, Director and CEO, BreitBurn Energy Partners, L.P. (1988 — present); Chairman, Finance Committee, Stanford University PIC Endowment (1999 — present). | | Five | | BreitBurn Energy Partners, L.P. | |
|
Robert L. Burch III
(born 1934) | | Trustee | | Since 2001 | | Managing Partner, A.W. Jones Co. (investments) (1984 — present); Chairman, Jonathan Mfg. Corp. (slide manufacturing) (1977 — 2004). | | Five | | None | |
|
Alejandra C. Edwards, Ph.D.
(born 1954) | | Trustee | | Since 2007 | | California State University — Long Beach: Associate Chair Economics (2001 — present); Graduate Advisor Economics (2000 — present); Professor of Economics (1994 — present). | | Five | | None | |
|
Marcy Elkind, Ph.D.
(born 1947) | | Trustee | | Since 2005 | | President, Elkind Economics, Inc. (1980 — present). | | Five | | None | |
|
Robert Fitzgerald
(born 1952) | | Trustee | | Since 2005 | | Chief Financial Officer of National Retirement Partners, Inc. (2005 — 2007); Executive Vice President and Chief Financial Officer of PIMCO Advisors L.P. (1995 — 2001). | | Five | | Brandes Investment Trust | |
|
John A.G. Gavin
(born 1931) | | Trustee
Chairman | | Since 2001
Since 2007 | | Senior Counselor, Hicks Holdings (private equity investment firm) (2001 — present); Chairman, Gamma Holdings (international capital and consulting) (1968 — present); Partner and Managing Director, Hicks, Muse, Tate & Furst (Latin America) (private equity investment firm) (1994 — 2001); U.S. Ambassador to Mexico (1981 — 1986). | | Five | | Causeway Capital Management Trust; Claxson S.A.; TCW Galileo Funds | |
|
Donald Morrison, Ph.D.
(born 1939) | | Trustee | | Since 2007 | | The William E. Leonhard Professor in the Anderson Graduate School of Management at the University of California, Los Angeles (1988 — present). | | Five | | None | |
|
* Each Trustee serves until his or her successor is elected and qualified, until he or she retires in accordance with the Trust's retirement policy, or until his or her death or resignation or removal as provided in the Trust's Agreement and Declaration of Trust.
INTERESTED TRUSTEE
| Name and Year of Birth | | Position
Held with
the Trust | | Term of
Office** and
Length of
Time Served | | Principal Occupation(s) During
Past Five Years | | Number of
Portfolios in
Fund Complex
Overseen by
Trustee | | Public
Directorships | |
George H. Davis, Jr.*
(born 1961) | | Trustee | | Since 2007 | | Chief Executive Officer and Portfolio Manager of Hotchkis and Wiley Capital Management, LLC (the "Advisor") (2001 — present). | | Five | | None | |
|
* Mr. Davis is an "interested person," as defined in the 1940 Act, of the Trust based on his position as Chief Executive Officer and Portfolio Manager of the Advisor.
** As Trustee, Mr. Davis serves until his successor is elected and qualified, until he retires in accordance with the Trust's retirement policy, or until his death or resignation or removal as provided in the Trust's Agreement and Declaration of Trust.
OFFICERS
| Name and Year of Birth | | Position
Held with
the Trust | | Term of
Office* and
Length of
Time Served | | Principal Occupation(s) During Past Five Years | |
Anna Marie Lopez
(born 1967) | | President | | Since 2007 | | Chief Operating Officer of the Advisor (2007 — present); Chief Compliance Officer of the Advisor (2001 — 2007). | |
|
Mark McMahon
(born 1968) | | Vice President and Secretary | | Since 2006 | | Director of Mutual Fund Operations of the Advisor (2006 — present); Client Relations Manager of Boston Financial Data Services (1991 — 2006). | |
|
James Menvielle
(born 1972) | | Vice President and Treasurer | | Since 2007 | | Chief Financial Officer of the Advisor (2006 — present); Controller of Metropolitan West Asset Management, LLC (1998 — 2006); Chief Financial Officer of MWAM Distributors, LLC (2004 — 2006). | |
|
Tina Kodama
(born 1968) | | Vice President and Chief Compliance Officer | | Since 2007 | | Chief Compliance Officer of the Advisor (2007 — present); Director of Compliance of the Advisor (2006 — 2007); Vice President — Compliance of First Pacific Advisors, Inc. (2004 — 2006); Vice President — Internal Audit of Countrywide Financial Corporation (2003 — 2004); Director of Compliance of Wilshire Associates Incorporated (2001 — 2003). | |
|
* Each officer is appointed by and serves at the pleasure of the Board of Trustees of the Trust.
The Statement of Additional Information includes additional information about the Trust's Trustees and officers, and is available without charge upon request by calling the transfer agent at 1-866-HW-FUNDS (1-866-493-8637). The address for all Trustees and officers of the Trust is c/o Hotchkis and Wiley Capital Management, LLC, 725 South Figueroa Street, 39th Floor, Los Angeles, CA 90017, attention: Trust Secretary.
40
(This page intentionally left blank)
(This page intentionally left blank)
(This page intentionally left blank)
Information about the Funds
ADVISOR
Hotchkis and Wiley Capital Management, LLC
725 South Figueroa Street, 39th Floor
Los Angeles, California 90017
LEGAL COUNSEL
Paul, Hastings, Janofsky & Walker LLP
55 Second Street, 24th Floor
San Francisco, California 94105
INDEPENDENT REGISTERED PUBLIC ACCOUNTING FIRM
PricewaterhouseCoopers LLP
350 South Grand Avenue
Los Angeles, California 90071
DISTRIBUTOR
Quasar Distributors, LLC
615 East Michigan Street
Milwaukee, WI 53202
ADMINISTRATOR AND TRANSFER AGENT
U.S. Bancorp Fund Services, LLC
615 East Michigan Street
Milwaukee, Wisconsin 53202
CUSTODIAN
Brown Brothers Harriman & Co.
40 Water Street
Boston, Massachusetts 02109
This report is for the information of shareholders of the Hotchkis and Wiley Funds, but may also be used as sales literature when preceded or accompanied by a current prospectus, which gives details about charges, expenses, investment objectives and operating policies of the Funds.
A description of the policies and procedures that the Funds use to determine how to vote proxies relating to portfolio securities is included in the Statement of Additional Information, which is available without charge, upon request, by calling 1-866-HW-FUNDS (1-866-493-8637) and on the Securities and Exchange Commission's ("SEC") website at http://www.sec.gov.
Information regarding how the Funds voted proxies relating to portfolio securities during the 12-month period ended June 30, 2008 is available without charge on the Funds' website at www.hwcm.com and on the SEC's website at http://www.sec.gov.
Hotchkis and Wiley Funds file a complete schedule of portfolio holdings with the SEC for the first and third quarters of each fiscal year on Form N-Q. The Funds' Forms N-Q are available free of charge on the SEC's website at http://www.sec.gov. You may also review or, for a fee, copy the forms at the SEC's Public Reference Room in Washington, D.C. (1-202-551-8090). The Forms N-Q are also available on the Funds' website at www.hwcm.com under the "Download Center".
HOTCHKIS AND WILEY FUNDS
725 SOUTH FIGUEROA STREET, 39th Floor
LOS ANGELES, CALIFORNIA 90017-5439
www.hwcm.com
1.866.HW.FUNDS (1.866.493.8637)
CODE #HWF-AR-0608-0808
JUNE 30, 2008
ANNUAL REPORT

Item 2 - Code of Ethics
The registrant has adopted a code of ethics that applies to the registrant’s principal executive officer and principal financial officer. The registrant has not made any amendments to its code of ethics during the period covered by the report. The registrant has not granted any waivers from any provisions of the code of ethics during the period covered by this report. A copy of the code of ethics is available without charge, upon request, by calling toll-free 1-800-796-5606.
Item 3 - Audit Committee Financial Expert
The registrant’s Board has determined that Robert Fitzgerald, a member of the registrant’s Audit Committee, is an “audit committee financial expert” and “independent,” as such terms are defined in this Item. This designation will not increase the designee’s duties, obligations or liability as compared to his duties, obligations and liability as a member of the Audit Committee and of the Board; nor will it reduce the responsibility of the other Audit Committee members. The Board believes each member of the Audit Committee contributes sign ificantly to the effective oversight of the registrant’s financial statements and condition.
Item 4 - Principal Accountant Fees and Services
Fees billed by the registrant’s auditors for each of the last two fiscal years, including fees for non-audit services billed to the adviser and affiliates for engagements that relate directly to the operations and financial reporting of the registrant, and a description of the nature of the services comprising the fees, are listed below:
Registrant:
(a) Audit Fees
Fiscal year ended June 30, 2008 - $105,600
Fiscal year ended June 30, 2007 - $100,700
(b) Audit-Related Fees
Fiscal year ended June 30, 2008 - $0
Fiscal year ended June 30, 2007 - $0
(c) Tax Fees
Fiscal year ended June 30, 2008 - $30,500
Fiscal year ended June 30, 2007 - $28,750
The nature of the services include tax compliance, tax advice and tax planning.
(d) All Other Fees
Fiscal year ended June 30, 2008 - $0
Fiscal year ended June 30, 2007 - $0
Adviser and affiliates (includes only fees for non-audit services billed to the adviser and affiliates for engagements that relate
directly to the operations and financial reporting of the registrant and were subject to the pre-approval policies described below):
(b) Audit-Related Fees
Fiscal year ended June 30, 2008 - $0
Fiscal year ended June 30, 2007 - $0
(c) Tax Fees
Fiscal year ended June 30, 2008 - $0
Fiscal year ended June 30, 2007 - $0
(d) All Other Fees
Fiscal year ended June 30, 2008 - $0
Fiscal year ended June 30, 2007 - $0
(e)(1) The registrant’s Audit Committee (the “Committee”) has adopted policies and procedures with regard to the pre-approval of services. The Committee shall pre-approve any engagement of the independent auditors to provide any non-prohibited services to the registrant, including the fees and other compensation to be paid to the independent auditors. The Chairman of the Audit Committee may grant the pre-approval of services to the registrant for non-prohibited services for engagements of less than $5,000. All such delegated pre-approvals shall be presented to the Audit Committee no later than the next Audit Committee meeting. The Committee shall also pre-approve any engagement of the independent auditors, including the fees and other compensation to be paid to the independent auditors, to provide any non-audit services to the Adviser (or any “control affiliate” of the Adviser providing ongoing services to the registrant), if the engagement relates directly to the operations and financial reporting of the registrant. The Chairman of the Audit Committee may grant the pre-approval for non-prohibited services to the Adviser for engagements of less than $5,000. All such delegated pre-approvals shall be presented to the Audit Committee no later than the next Audit Committee meeting.
(e)(2) The percentage of fees billed by the principal accountant applicable to non-audit services pursuant to waiver of pre-approval requirements were as follows:
(b) Audit-Related Fees
Fiscal year ended June 30, 2008 - 0%
Fiscal year ended June 30, 2007 - 0%
(c) Tax Fees
Fiscal year ended June 30, 2008 - 0%
Fiscal year ended June 30, 2007 - 0%
(d) All Other Fees
Fiscal year ended June 30, 2008 - 0%
Fiscal year ended June 30, 2007 - 0%
(f) Not Applicable - All of the principal accountant’s hours spent on auditing the registrant’s financial statements were attributed to work performed by full-time permanent employees of the principal accountant.
(g) The following indicates the non-audit fees billed or expected to be billed by the registrant’s accountant for services to the registrant and to the registrant’s investment adviser for the last two fiscal years:
Fiscal year ended June 30, 2008 - $110,100
Fiscal year ended June 30, 2007 - $120,300
(h) The registrant’s Audit Committee has considered whether the provision of non-audit services that were rendered to the registrant’s investment adviser and any entity controlling, controlled by, or under common control with the investment adviser that provides ongoing services to the registrant that were not pre-approved pursuant to paragraph (c)(7)(ii) of Rule 2-01 of Regulation S-X is compatible with maintaining the principal accountant’s independence.
Item 5 - Audit Committee of Listed Registrants
Not applicable
Item 6 - Schedule of Investments -
Schedule of Investments is included as part of the report to shareholders filed under Item 1 of this Form.
Item 7 - Disclosure of Proxy Voting Policies and Procedures for Closed-End Management Investment Companies
Not applicable
Item 8 - Portfolio Managers of Closed-End Management Investment Companies
Not Applicable
Item 9 - Purchases of Equity Securities by Closed-End Management Investment Company and Affiliated Purchasers
Not applicable
Item 10 - Submission of Matters to a Vote of Security Holders
The identification and recommendation of individuals for Board membership is the responsibility of the Nominating and Governance Committee. Shareholders may submit suggestions for candidates by forwarding their correspondence by U.S. mail or other courier service to the Funds’ Secretary for the attention of the Chairman of the Nominating and Governance Committee, 725 S. Figueroa Street, 39th Floor, Los Angeles, CA 90017-5439.
Item 11 - Controls and Procedures
(a) The officers providing the certifications in this report in accordance with Rule 30a-2 under the Investment Company Act of 1940 (the “Act”)have concluded, based on their evaluation of the registrant’s disclosure controls and procedures (as such term is defined in Rule 30a-3 under the Act), that such controls and procedures are effective, based on their
evaluation of the disclosure controls and procedures as of a date within 90 days of the filing date of this report.
(b) There was no change in the registrant’s internal controls over financial reporting (as defined in Rule 30a-3(d) under the Act) that occurred during the registrant’s last fiscal half-year which has materially affected, or is reasonably likely to materially affect, the registrant’s internal control over financial reporting.
Item 12 - Exhibits
(a)(1) - Code of Ethics: Available without charge, upon request, by calling toll-free 1-800-796-5606.
(a)(2) - Certifications pursuant to Section 302 of the Sarbanes-Oxley Act of 2002. Attached hereto.
(a)(3) - Not applicable
(b) - Certifications pursuant to Section 906 of the Sarbanes-Oxley Act of 2002. Attached hereto.
SIGNATURES
Pursuant to the requirements of the Securities Exchange Act of 1934 and the Investment Company Act of 1940, the registrant has duly caused this report to be signed on its behalf by the undersigned, thereunto duly authorized.
Hotchkis and Wiley Funds
By: | /s/ Anna Marie Lopez | |
| Anna Marie Lopez | |
| President of Hotchkis and Wiley Funds | |
| |
Date: August 20, 2008 | |
Pursuant to the requirements of the Securities Exchange Act of 1934 and the Investment Company Act of 1940, this report has been signed below by the following persons on behalf of the registrant and in the capacities and on the dates indicated.
Hotchkis and Wiley Funds
By: | /s/ Anna Marie Lopez | |
| Anna Marie Lopez | |
| President of Hotchkis and Wiley Funds | |
| |
Date: August 20, 2008 | |
By: | /s/ James Menvielle | |
| James Menvielle | |
| Treasurer of Hotchkis and Wiley Funds | |
| |
Date: August 20, 2008 | |
EXHIBIT INDEX
(a)(2) Certifications of Principal Executive Officer and Principal Financial Officer as required by Rule 30a-2(a) under the Investment Company Act of 1940.
(b) C ertification of Principal Executive Officer and Principal Financial Officer as required by Section 906 of the Sarbanes-Oxley Act of 2002.