UNITED STATES
SECURITIES AND EXCHANGE COMMISSION
Washington, D.C. 20549
FORM N-CSR
CERTIFIED SHAREHOLDER REPORT OF REGISTERED
MANAGEMENT INVESTMENT COMPANIES
Investment Company Act file number | 811-10487 |
|
Hotchkis and Wiley Funds |
(Exact name of registrant as specified in charter) |
|
725 S. Figueroa Street, 39th Floor
Los Angeles, California 90071 |
(Address of principal executive offices) (Zip code) |
|
Anna Marie Lopez Hotchkis and Wiley Capital Management, LLC 725 S. Figueroa Street, 39th Floor Los Angeles, California 90071 |
(Name and address of agent for service) |
|
Copies to: Mitchell Nichter, Esq. Paul, Hastings, Janofsky & Walker, LLP 55 Second Street, Twenty-Fourth Floor San Francisco, California 94105 |
(Counsel for the Registrant) |
|
Registrant’s telephone number, including area code: | (213) 430-1000 | |
|
Date of fiscal year end: | June 30, 2011 | |
|
Date of reporting period: | July 1, 2010 – June 30, 2011 | |
| | | | | | |
Item 1 – Report to Shareholders
Diversified Value Fund
Large Cap Value Fund
Mid-Cap Value Fund
Small Cap Value Fund
Value Opportunities Fund
Capital Income Fund
High Yield Fund

HOTCHKIS AND WILEY FUNDS
JUNE 30, 2011

ANNUAL REPORT
TABLE OF CONTENTS
| SHAREHOLDER LETTER | | | 3 | | |
|
| FUND PERFORMANCE DATA | | | 6 | | |
|
| SCHEDULE OF INVESTMENTS: | |
|
| DIVERSIFIED VALUE FUND | | | 14 | | |
|
| LARGE CAP VALUE FUND | | | 16 | | |
|
| MID-CAP VALUE FUND | | | 18 | | |
|
| SMALL CAP VALUE FUND | | | 20 | | |
|
| VALUE OPPORTUNITIES FUND | | | 22 | | |
|
| CAPITAL INCOME FUND | | | 24 | | |
|
| HIGH YIELD FUND | | | 30 | | |
|
| STATEMENTS OF ASSETS AND LIABILITIES | | | 36 | | |
|
| STATEMENTS OF OPERATIONS | | | 38 | | |
|
| STATEMENTS OF CHANGES IN NET ASSETS | | | 40 | | |
|
| FINANCIAL HIGHLIGHTS | | | 43 | | |
|
| NOTES TO THE FINANCIAL STATEMENTS | | | 47 | | |
|
| REPORT OF INDEPENDENT REGISTERED PUBLIC ACCOUNTING FIRM | | | 56 | | |
|
| FUND EXPENSE EXAMPLES | | | 57 | | |
|
BOARD CONSIDERATIONS IN APPROVING CONTINUATION OF
INVESTMENT ADVISORY AGREEMENTS | | | 58 | | |
|
BOARD CONSIDERATIONS IN APPROVING THE INVESTMENT
ADVISORY AGREEMENT FOR THE CAPITAL INCOME FUND | | | 60 | | |
|
| MANAGEMENT | | | 61 | | |
|
| PRIVACY POLICY | | | 62 | | |
|
| INFORMATION ABOUT THE FUNDS | | BACK COVER | |
|
DEAR SHAREHOLDER:
The following investment review and annual report relates to the activities of the Hotchkis and Wiley Funds for the twelve months ended June 30, 2011.
OVERVIEW
U.S. stocks performed admirably over the past twelve months as the market's recovery from depressed valuation levels continued. An extraordinary corporate earnings recovery lifted stock prices, culminating in a +30.7% return for the S&P 500 over the twelve months ended June 30, 2011.
Compared to the impressive equity performance in second half of 2010, returns in the first half of 2011 have been subdued. Investors appear unable to reconcile continued earnings recovery with lackluster economic reports, which has hindered returns and amplified volatility of late. While S&P 500 companies have recouped nearly all (~96%) of the earnings they generated in 2007, the price level of the index has recovered only about 70%. The result is an equity market exhibiting robust earnings and attractive valuations. Against this backdrop, however, investors are concerned about the sovereign debt crisis in Europe and fiscal policies in the U.S., most notably the debt ceiling issue. While the geopolitical and macroeconomic environment is important, our experience tells us that these concerns tend to be overly discounted in stock prices and that focusing on normal earnings power and valuation can lead to favorable investment outcomes over time.
Until a considerable pullback in the most recent quarter, commodity prices had climbed sharply, driving material and energy stocks higher — the two top-performing sectors over the past twelve months. Financials, particularly the large money center banks, have been notable laggards despite compelling pre-provision income generation and an improving credit environment. The attractive long-term valuation opportunity in financials remains largely undisputed, but investors are concerned about regulatory uncertainty and the sovereign debt landscape. These concerns are discounted to such a degree that we have compelling valuation support even under exceptionally pessimistic scenarios.
Going forward, we recognize an opportunity to own companies with sustainable franchises, robust free cash flow, and strong balance sheets at attractive valuations. In our large cap equity funds, for example, we have positions in select information technology companies that epitomize these traits. A decade ago these were the "must own" stocks at 60x earnings; now they trade for less than 10x earnings, have significant excess cash, and have begun to embrace the virtue of returning this cash to shareholders. The aggregate portfolios are composed of a diverse collection of companies with low financial leverage, sustainable cash flows, and high shareholder payouts — trading at single digit multiples of our normal earnings estimates.
HOTCHKIS AND WILEY DIVERSIFIED VALUE FUND
The Fund's Class I, Class A, and Class C shares had total returns for the twelve month period ended June 30, 2011 of 27.44%, 27.16%, and 26.11%, respectively, compared to the S&P 500 Index return of 30.69% and the Russell 1000 Value Index return of 28.94%. (Fund results shown do not reflect sales charges and would be lower if sales charges were included. More complete performance information can be found on page 7 of this report to shareholders.)
An overweight in large banks was the primary detractor from performance versus the Russell 1000 Value Index for the period as regulatory uncertainty weighed on investors. The underweight in energy was also a detractor as oil prices climbed for most of the period. The largest individual detractors were Hewlett-Packard, Genworth Financial, and Bank of America. Overall stock selection was positive and the largest contributor to relative performance over the twelve month period. Positive selection in the consumer discretionary, materials, and consumer staples sectors were the primary contributors. The largest individual contributors were Royal Dutch Shell, J.C. Penney, and ConocoPhillips.
HOTCHKIS AND WILEY LARGE CAP VALUE FUND
The Fund's Class I, Class A, Class C, and Class R shares had total returns for the twelve month period ended June 30, 2011 of 27.61%, 27.21%, 26.28%, and 26.87%, respectively, compared to the S&P 500 Index return of 30.69% and the Russell 1000 Value Index return of 28.94%. (Fund results shown do not reflect sales charges and would be lower if sales charges were included. More complete performance information can be found on page 8 of this report to shareholders.)
Large banks underperformed due to uncertainty surrounding the regulatory environment and other macro-level issues. The Fund's overweight in these large money center banks was the primary performance detractor versus the Russell 1000 Value Index over the twelve month period. Also hurting relative performance was an underweight in energy, the top-performing sector for the index. The largest individual detractors were Hewlett-Packard, Bank of America, and Genworth Financial. Positive stock selection overall was the largest performance contributor over the period; selection in the materials, consumer staples, and consumer discretionary sectors led the way. The largest individual contributors were Celanese, Royal Dutch Shell, and J.C. Penney.
HOTCHKIS AND WILEY MID-CAP VALUE FUND
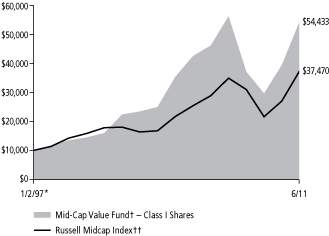
The Fund's Class I, Class A, Class C, and Class R shares had total returns for the twelve month period ended June 30, 2011 of 38.05%, 37.63%, 36.63%, and 37.32%, respectively, compared to the Russell Midcap Index return of 38.47% and the Russell Midcap Value Index return of 34.28%. (Fund results shown do not reflect sales charges and would be lower if sales charges were included. More complete performance information can be found on page 9 of this report to shareholders.)
Positive stock selection drove the outperformance versus the Russell Midcap Value Index over the twelve month period. Positive selection in the energy, materials, and information technology sectors were the top contributors. The largest individual contributors were MI Developments, Stone Energy, and Celanese. Detracting from performance was stock selection in the consumer discretionary and consumer staples sectors. The largest individual detractors were Valassis Communications, Jones Group, and Genworth Financial.
3
HOTCHKIS AND WILEY SMALL CAP VALUE FUND
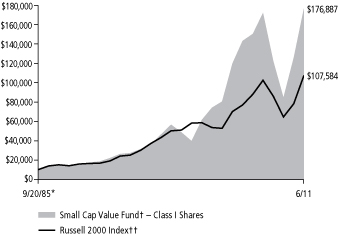
The Fund's Class I, Class A, and Class R shares had total returns for the twelve month period ended June 30, 2011 of 40.29%, 39.94%, and 38.93%, respectively, compared to the Russell 2000 Index return of 37.41% and the Russell 2000 Value Index return of 31.35%. (Fund results shown do not reflect sales charges and would be lower if sales charges were included. More complete performance information can be found on page 10 of this report to shareholders.)
Positive stock selection represented nearly all of the outperformance versus the Russell 2000 Value Index over the twelve month period. The strongest performance relative to the index came from the energy, health care, and materials sectors. The largest individual contributors were Stone Energy, Noranda Aluminum, and King Pharmaceuticals. Stock selection in the consumer discretionary and consumer staples sectors held back performance relative to the index. The largest individual detractors were Valassis Communications, Jones Group, and Overhill Farms.
HOTCHKIS AND WILEY VALUE OPPORTUNITIES FUND
The Fund's Class I, Class A, and Class R shares had total returns for the twelve month period ended June 30, 2011 of 42.81%, 42.40%, and 41.35%, respectively, compared to the Russell 3000 Index return of 32.37% and the Russell 3000 Value Index return of 29.13%. (Fund results shown do not reflect sales charges and would be lower if sales charges were included. More complete performance information can be found on page 11 of this report to shareholders.)
Nearly all of the outperformance over the past twelve months versus the Russell 3000 Value Index was due to positive security selection. Positive selection in financials and materials drove the outperformance. An overweight in industrials and an underweight in consumer staples also aided returns. The largest individual contributors were Freddie Mac (preferred shares), Noranda Aluminum, and MI Developments. Security selection in the consumer discretionary and industrials sectors detracted from performance relative to the benchmark. The largest individual detractors were Valassis Communications, Tree.com, and Hewlett-Packard.
HOTCHKIS AND WILEY CAPITAL INCOME FUND
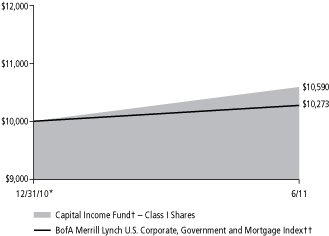
The Fund commenced operations on December 31, 2010. The investment review below discusses the Fund's performance since inception through June 30, 2011. The Fund's Class I and Class A shares had total returns of 5.90% and 5.87%, respectively, compared to the S&P 500 Index return of 6.02% and BofA Merrill Lynch U.S. Corporate, Government and Mortgage Index return of 2.73%. (Fund results shown do not reflect sales charges and would be lower if sales charges were included. More complete performance information can be found on page 12 of this report to shareholders.)
Since the inception of the Capital Income Fund on December 31, 2010, both the equity and fixed income markets have performed fairly well, returning between +2% and +6%; the Fund's return fell in the upper portion of this range. While the long-term target allocation between dividend paying equities and high yield bonds is 50/50, we have been partial to equities in 2011. The equity allocation has ranged from 52% to 58%, with the high yield allocation comprising the balance. The equity overweight has been a modest tailwind as equities have outperformed slightly.
The equity portion of the Fund outperformed the S&P 500 over the period. Positive stock selection in industrials and an overweight in utilities were the primary performance contributors over the six month period. The largest individual contributors were Lockheed Martin, Philip Morris International, and Royal Dutch Shell. An underweight in the consumer discretionary sector and stock selection in information technology were the primary performance detractors. The largest individual detractors were Microsoft, JPMorgan, and Wells Fargo.
High yield bonds outperformed their investment grade counterparts for the six month period. The high yield bond portion of the portfolio outperformed both the BofA Merrill Lynch U.S. Corporate, Government and Mortgage Index return of 2.73% and the BofA Merrill Lynch U.S. High Yield BB-B (Constrained 2%) Index return of 4.81%. Strong performance from the portfolio's financial services, capital goods, and energy credits were performance contributors. Automotives was the portfolio's only negative performing sector over the six months, as General Motors debt declined.
HOTCHKIS AND WILEY HIGH YIELD FUND
The Fund's Class I and Class A shares had total returns for the twelve month period ended June 30, 2011 of 18.45% and 18.11%, respectively, compared to the BofA Merrill Lynch U.S. High Yield BB-B (Constrained 2%) Index return of 14.56%. (Fund results shown do not reflect sales charges and would be lower if sales charges were included. More complete performance information can be found on page 13 of this report to shareholders.)
High yield bonds rallied over the twelve month period, outperforming investment grade bonds considerably. Treasury yields oscillated throughout the year but finished close to where they began, attributing the high yield market's rise to a contraction in spreads. The spread tightening was caused by meaningful improvements in market fundamentals — low defaults, credit upgrades, and robust refinancing. Default rates have cratered from over 3% twelve months ago to less than 1%, the upgrade/downgrade ratio (# of upgrades/# of downgrades) has matched its all-time high, and the sizeable new issue market has allowed for the extension of debt maturities. While yields are below historical averages, spreads remain attractive and imply a default rate around 5% — an overly pessimistic outcome, in our view, suggesting an attractive entry point at today's levels.
Nearly all of the outperformance over the past year came from positive credit selection. Credit selection in 15 of the 16 BofA Merrill Lynch sectors was positive or neutral over the twelve month period. The Fund's basic industry, financial services, and services sectors performed particularly well. The small cash position, which was simply a residual of the process, was the largest performance drag. Credit selection in consumer cyclicals also detracted from performance.
4
CONCLUSION
We appreciate your continued support of the Hotchkis and Wiley Funds, and we look forward to serving your investment needs in the future.
Sincerely,
 | |  | |  | |
|
Anna Marie Lopez
President | | George Davis
Fund Manager | | Sheldon Lieberman
Fund Manager | |
|
 | |  | |  | |
|
Patty McKenna
Fund Manager | | James Miles
Fund Manager | | Stan Majcher
Fund Manager | |
|
 | |  | |  | |
|
David Green
Fund Manager | | Scott McBride
Fund Manager | | Judd Peters
Fund Manager | |
|
 | |  | |  | |
|
Ray Kennedy
Fund Manager | | Mark Hudoff
Fund Manager | | Patrick Meegan
Fund Manager | |
|
Past performance does not guarantee future results.
The above reflects opinions of Fund managers as of June 30, 2011. They are subject to change and any forecasts made cannot be guaranteed. The Funds might not continue to hold any securities mentioned and have no obligation to disclose purchases or sales in these securities. Please refer to the Schedule of Investments in this report for a complete list of fund holdings for June 30, 2011. Indexes do not incur expenses or sales loads and are not available for investment.
Cash flow measures the cash generating capability of a company by adding non-cash charges (e.g., depreciation) and interest expense to pretax income. Free cash flow is earnings before depreciation, amortization, and non-cash charges minus maintenance capital expenditures.
The Global Industry Classification Standard (GICS) was developed by MSCI and S&P, an independent international financial data and investment services company. The GICS methodology is used by the MSCI indexes, which include domestic and international stocks, as well as by a large portion of the professional investment management community. The GICS hierarchy begins with 10 sectors and is followed by 24 industry groups, 67 industries and 147 sub-industries. Each stock that is classified will have a coding at all four of these levels.
Diversification does not assure a profit nor protect against risk in a declining market.
5
Fund Performance Data
ABOUT FUND PERFORMANCE
The Large Cap Value Fund and Mid-Cap Value Fund have four classes of shares. The Diversified Value Fund, Small Cap Value Fund, Value Opportunities Fund, Capital Income Fund and High Yield Fund have three classes of shares. Each share class has its own sales charge and expense structure, allowing you to invest in the way that best suits your needs. Currently, the Capital Income Fund and High Yield Fund are not offering Class C shares to investors.
Class I shares have no initial sales charge and bear no ongoing distribution and service fees under a 12b-1 plan. Class I shares are available only to eligible investors.
Class A shares incur a maximum initial sales charge of 5.25% for the Diversified Value Fund, Large Cap Value Fund, Mid-Cap Value Fund, Small Cap Value Fund and Value Opportunities Fund, 4.75% for the Capital Income Fund and 3.75% for the High Yield Fund and an annual distribution and service fee of 0.25%.
Class C shares are subject to an annual distribution and service fee of 1.00%. In addition, Class C shares are subject to a 1.00% contingent deferred sales charge (CDSC) if redeemed within one year after purchase. Class C shares automatically convert to Class A shares approximately eight years after purchase and will then be subject to lower distribution and service fees.
Class R shares have no initial sales charge or CDSC and are subject to an annual distribution and service fee of 0.50%. Class R shares are offered only by the Large Cap Value Fund and Mid-Cap Value Fund and are available only to certain retirement plans.
FUND RISKS
Mutual fund investing involves risk; loss of principal is possible. The Small Cap Value Fund, Mid-Cap Value Fund and Value Opportunities Fund invest in small- and medium-capitalization companies which tend to have limited liquidity and greater price volatility than large-capitalization companies. The Value Opportunities Fund is a non-diversified fund which involves greater risk than investing in diversified funds, such as business risk, significant stock price fluctuations and sector concentration. Growth stocks typically are more volatile than value stocks; however, value stocks have a lower expected growth rate in earnings and sales. The Value Opportunities Fund, Capital Income Fund and High Yield Fund invest in debt securities that decrease in value when interest rates rise. This risk is usually greater for longer-term debt securities. Investment by the Capital Income Fund and High Yield Fund in lower-rated and non-rated securities presents a greater risk of loss to principal and interest than higher-rated securities. The Capital Income Fund and High Yield Fund may invest in derivative securities, which derive their performance from the performance of an underlying asset, index, interest rate or currency exchange rate. Derivatives can be volatile and involve various types and degrees of risks. Depending upon the characteristics of particular derivatives, they can suddenly become illiquid. Investments in asset-backed and mortgage-backed securities include additional risks that investors should be aware of such as credit risk, prepayment risk, possible illiquidity and default, as well as increased susceptibility to adverse economic developments. The Funds may invest in foreign securities, including developed and emerging markets, which involve greater volatility and political, economic, and currency risks.
MARKET INDEXES
The following are definitions for indexes used in the shareholder letter and the performance summary tables on the following pages. These indexes are unmanaged and include the reinvestment of dividends, but do not reflect the payment of transaction costs and advisory and other fees associated with an investment in the Funds. The securities that comprise these indexes may differ substantially from the securities in the Funds' portfolios. The Funds' value disciplines may prevent or restrict investments in the benchmark indexes. It is not possible to invest directly in an index. Each index named is not the only index which may be used to characterize performance of a specific Fund and other indexes may portray different comparative performance.
S&P 500® Index, a capital weighted, unmanaged index, represents the aggregate market value of the common equity of 500 stocks primarily traded on the New York Stock Exchange.
Russell 3000® Index, an unmanaged index, is comprised of the 3,000 largest U.S. companies based on total market capitalization, which represents approximately 98% of the investable U.S. equity market.
Russell 3000® Value Index measures the performance of those Russell 3000® companies with lower price-to-book ratios and lower forecasted growth values.
Russell 1000® Index, an unmanaged index, measures the performance of the 1,000 largest companies in the Russell 3000® Index.
Russell 1000® Value Index measures the performance of those Russell 1000® companies with lower price-to-book ratios and lower forecasted growth values.
Russell Midcap® Index, an unmanaged index, measures the performance of the 800 smallest companies in the Russell 1000® Index.
Russell Midcap® Value Index measures the performance of those Russell Midcap® companies with lower price-to-book ratios and lower forecasted growth values.
Russell 2000® Index, an unmanaged index, is a stock market index comprised of the 2,000 smallest companies in the Russell 3000® Index.
Russell 2000® Value Index measures the performance of those Russell 2000® companies with lower price-to-book ratios and lower forecasted growth values.
BofA Merrill Lynch U.S. Corporate, Government and Mortgage Index (previously ML U.S. Domestic Master Index) is a broad-based measure of the total rate of return performance of the U.S. investment grade bond markets. The index is a capitalization weighted aggregation of outstanding U.S. Treasury, agency, and supranational, mortgage pass-through, and investment grade corporate bonds meeting specified selection criteria.
BofA Merrill Lynch U.S. High Yield BB-B (Constrained 2%) Index contains all securities in the BofA Merrill Lynch U.S. High Yield Index rated BB+ through B- by S&P (or equivalent as rated by Moody's or Fitch), but caps issuer exposure at 2%. Index constituents are capitalization-weighted, based on their current amount outstanding, provided the total allocation to an individual issuer does not exceed 2%.
6
Fund Performance Data
DIVERSIFIED VALUE FUND
Total Return Based on a $10,000 Investment
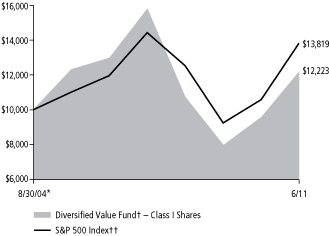
Comparative Results†††
| For Periods ended June 30, 2011 | | 1 Year | | 5 Years | | Since
8/30/04* | |
| Class I | |
| Average annual total return | | | 27.44 | % | | | –1.18 | % | | | 2.98 | % | |
| Class A | |
| Average annual total return (with sales charge) | | | 20.50 | % | | | –2.49 | % | | | 1.92 | % | |
| Average annual total return (without sales charge) | | | 27.16 | % | | | –1.43 | % | | | 2.72 | % | |
| Class C | |
| Average annual total return (with CDSC) | | | 25.11 | % | | | –2.10 | % | | | 1.99 | % | |
| Average annual total return (without CDSC) | | | 26.11 | % | | | –2.10 | % | | | 1.99 | % | |
| S&P 500 Index†† | |
| Average annual total return | | | 30.69 | % | | | 2.94 | % | | | 4.85 | % | |
| Russell 1000 Index†† | |
| Average annual total return | | | 31.93 | % | | | 3.30 | % | | | 5.43 | % | |
| Russell 1000 Value Index†† | |
| Average annual total return | | | 28.94 | % | | | 1.15 | % | | | 4.64 | % | |
Average annual total returns with sales charge and CDSC shown for Class A and Class C shares, respectively, have been adjusted to reflect the current applicable sales charges of each specific class. Returns for Class A reflect the current maximum initial sales charges of 5.25%. Class C shares have no adjustment for sales charges, but redemptions within one year of purchase may be subject to a CDSC of 1%. Average annual total returns without sales charge or CDSC do not reflect the current maximum sales charges. Had the sales charge or CDSC been included, the Fund's returns would have been lower.
† The Fund invests primarily in stocks of U.S. companies with market capitalizations similar to the Russell 1000 Index.
†† See index descriptions on page 6.
††† Fund returns during certain periods shown reflect a fee waiver and/or expense reimbursement. Without waiver/reimbursement, returns would have been lower. Returns shown include the reinvestment of all dividends.
* Commencement of Class I, Class A and Class C.
Past performance is not indicative of future results and the table does not reflect the deduction of taxes that a shareholder would pay on Fund distributions or the redemption of Fund shares.
7
Fund Performance Data
LARGE CAP VALUE FUND
Total Return Based on a $10,000 Investment

Comparative Results†††
| For Periods ended June 30, 2011 | | 1 Year | | 5 Years | | 10 Years | | Since
6/24/87* | |
| Class I | |
| Average annual total return | | | 27.61 | % | | | –2.04 | % | | | 4.33 | % | | | 8.28 | % | |
| Class A | |
| Average annual total return (with sales charge) | | | 20.57 | % | | | –3.36 | % | | | 3.52 | % | | | 7.79 | % | |
| Average annual total return (without sales charge) | | | 27.21 | % | | | –2.31 | % | | | 4.08 | % | | | 8.03 | % | |
| Class C | |
| Average annual total return (with CDSC) | | | 25.28 | % | | | –2.94 | % | | | 3.34 | % | | | 7.21 | % | |
| Average annual total return (without CDSC) | | | 26.28 | % | | | –2.94 | % | | | 3.34 | % | | | 7.21 | % | |
| Class R | |
| Average annual total return | | | 26.87 | % | | | –2.56 | % | | | 3.85 | % | | | 7.75 | % | |
| S&P 500 Index†† | |
| Average annual total return | | | 30.69 | % | | | 2.94 | % | | | 2.72 | % | | | 8.71 | % | |
| Russell 1000 Index†† | |
| Average annual total return | | | 31.93 | % | | | 3.30 | % | | | 3.21 | % | | | 8.89 | % | |
| Russell 1000 Value Index†† | |
| Average annual total return | | | 28.94 | % | | | 1.15 | % | | | 3.98 | % | | | n/a | | |
Returns shown for Class A, Class C, and Class R shares for the periods prior to their inception are derived from the historical performance of Class I shares of the Fund during such periods and have been adjusted to reflect the higher total annual operating expenses of each specific class. (Inception dates: Class A — 10/26/01; Class C — 2/4/02; Class R — 8/28/03.)
Average annual total returns with sales charge and CDSC shown for Class A and Class C shares, respectively, have been adjusted to reflect the current applicable sales charges of each specific class. Returns for Class A reflect the current maximum initial sales charges of 5.25%. Class C shares have no adjustment for sales charges, but redemptions within one year of purchase may be subject to a CDSC of 1%. Average annual total returns without sales charge or CDSC do not reflect the current maximum sales charges. Had the sales charge or CDSC been included, the Fund's returns would have been lower.
† The Fund invests primarily in stocks of U.S. companies with market capitalizations similar to the Russell 1000 Index.
†† See index descriptions on page 6.
††† Fund returns during certain periods shown reflect a fee waiver and/or expense reimbursement. Without waiver/reimbursement, returns would have been lower. Returns shown include the reinvestment of all dividends.
* Commencement of Class I.
Past performance is not indicative of future results and the table does not reflect the deduction of taxes that a shareholder would pay on Fund distributions or the redemption of Fund shares.
8
Fund Performance Data
MID-CAP VALUE FUND
Total Return Based on a $10,000 Investment
Comparative Results†††
| For Periods ended June 30, 2011 | | 1 Year | | 5 Years | | 10 Years | | Since
1/2/97* | |
| Class I | |
| Average annual total return | | | 38.05 | % | | | 3.32 | % | | | 9.29 | % | | | 12.40 | % | |
| Class A | |
| Average annual total return (with sales charge) | | | 30.39 | % | | | 1.95 | % | | | 8.44 | % | | | 11.72 | % | |
| Average annual total return (without sales charge) | | | 37.63 | % | | | 3.06 | % | | | 9.03 | % | | | 12.13 | % | |
| Class C | |
| Average annual total return (with CDSC) | | | 35.63 | % | | | 2.46 | % | | | 8.30 | % | | | 11.34 | % | |
| Average annual total return (without CDSC) | | | 36.63 | % | | | 2.46 | % | | | 8.30 | % | | | 11.34 | % | |
| Class R | |
| Average annual total return | | | 37.32 | % | | | 2.80 | % | | | 8.90 | % | | | 11.95 | % | |
| Russell Midcap Index†† | |
| Average annual total return | | | 38.47 | % | | | 5.30 | % | | | 7.59 | % | | | 9.54 | % | |
| Russell Midcap Value Index†† | |
| Average annual total return | | | 34.28 | % | | | 4.01 | % | | | 8.42 | % | | | 9.92 | % | |
Returns shown for Class A, Class C, and Class R shares for the periods prior to their inception are derived from the historical performance of Class I shares of the Fund during such periods and have been adjusted to reflect the higher total annual operating expenses of each specific class. (Inception dates: Class A, Class C — 1/2/01; Class R — 8/28/03.)
Average annual total returns with sales charge and CDSC shown for Class A and Class C shares, respectively, have been adjusted to reflect the current applicable sales charges of each specific class. Returns for Class A reflect the current maximum initial sales charges of 5.25%. Class C shares have no adjustment for sales charges, but redemptions within one year of purchase may be subject to a CDSC of 1%. Average annual total returns without sales charge or CDSC do not reflect the current maximum sales charges. Had the sales charge or CDSC been included, the Fund's returns would have been lower.
† The Fund invests primarily in stocks of U.S. companies with market capitalizations similar to the Russell Midcap Index.
†† See index descriptions on page 6.
††† Fund returns during certain periods shown reflect a fee waiver and/or expense reimbursement. Without waiver/reimbursement, returns would have been lower. Returns shown include the reinvestment of all dividends.
* Commencement of Class I.
Past performance is not indicative of future results and the table does not reflect the deduction of taxes that a shareholder would pay on Fund distributions or the redemption of Fund shares.
9
Fund Performance Data
SMALL CAP VALUE FUND
Total Return Based on a $10,000 Investment
Comparative Results†††
| For Periods ended June 30, 2011 | | 1 Year | | 5 Years | | 10 Years | | Since
9/20/85* | |
| Class I | |
| Average annual total return | | | 40.29 | % | | | 3.24 | % | | | 11.14 | % | | | 11.78 | % | |
| Class A | |
| Average annual total return (with sales charge) | | | 32.58 | % | | | 1.87 | % | | | 10.31 | % | | | 11.30 | % | |
| Average annual total return (without sales charge) | | | 39.94 | % | | | 2.98 | % | | | 10.91 | % | | | 11.53 | % | |
| Class C | |
| Average annual total return (with CDSC) | | | 37.93 | % | | | 2.41 | % | | | 10.15 | % | | | 10.73 | % | |
| Average annual total return (without CDSC) | | | 38.93 | % | | | 2.41 | % | | | 10.15 | % | | | 10.73 | % | |
| Russell 2000 Index†† | |
| Average annual total return | | | 37.41 | % | | | 4.08 | % | | | 6.27 | % | | | 9.65 | % | |
| Russell 2000 Value Index†† | |
| Average annual total return | | | 31.35 | % | | | 2.24 | % | | | 7.53 | % | | | n/a | | |
Returns shown for Class A and Class C shares for the periods prior to their inception are derived from the historical performance of Class I shares of the Fund during such periods and have been adjusted to reflect the higher total annual operating expenses of each specific class. (Inception dates: Class A — 10/6/00; Class C — 2/4/02.)
Average annual total returns with sales charge and CDSC shown for Class A and Class C shares, respectively, have been adjusted to reflect the current applicable sales charges of each specific class. Returns for Class A reflect the current maximum initial sales charges of 5.25%. Class C shares have no adjustment for sales charges, but redemptions within one year of purchase may be subject to a CDSC of 1%. Average annual total returns without sales charge or CDSC do not reflect the current maximum sales charges. Had the sales charge or CDSC been included, the Fund's returns would have been lower.
† The Fund invests primarily in stocks of U.S. companies with market capitalizations less than $3 billion.
†† See index descriptions on page 6.
††† Fund returns during certain periods shown reflect a fee waiver and/or expense reimbursement. Without waiver/reimbursement, returns would have been lower. Returns shown include the reinvestment of all dividends.
* Commencement of Class I.
Past performance is not indicative of future results and the table does not reflect the deduction of taxes that a shareholder would pay on Fund distributions or the redemption of Fund shares.
10
Fund Performance Data
VALUE OPPORTUNITIES FUND
Total Return Based on a $10,000 Investment

Comparative Results†††
| For Periods ended June 30, 2011 | | 1 Year | | 5 Years | | Since
12/31/02* | |
| Class I | |
| Average annual total return | | | 42.81 | % | | | 6.76 | % | | | 13.04 | % | |
| Class A | |
| Average annual total return (with sales charge) | | | 34.93 | % | | | 5.36 | % | | | 12.15 | % | |
| Average annual total return (without sales charge) | | | 42.40 | % | | | 6.49 | % | | | 12.86 | % | |
| Class C | |
| Average annual total return (with CDSC) | | | 40.35 | % | | | 5.82 | % | | | 11.98 | % | |
| Average annual total return (without CDSC) | | | 41.35 | % | | | 5.82 | % | | | 11.98 | % | |
| S&P 500 Index†† | |
| Average annual total return | | | 30.69 | % | | | 2.94 | % | | | 7.00 | % | |
| Russell 3000 Index†† | |
| Average annual total return | | | 32.37 | % | | | 3.35 | % | | | 7.82 | % | |
| Russell 3000 Value Index†† | |
| Average annual total return | | | 29.13 | % | | | 1.23 | % | | | 7.59 | % | |
Returns shown for Class C shares for the periods prior to their inception are derived from the historical performance of Class I shares of the Fund during such periods and have been adjusted to reflect the higher total annual operating expenses of the class. (Inception date: Class C — 8/28/03.)
Average annual total returns with sales charge and CDSC shown for Class A and Class C shares, respectively, have been adjusted to reflect the current applicable sales charges of each specific class. Returns for Class A reflect the current maximum initial sales charges of 5.25%. Class C shares have no adjustment for sales charges, but redemptions within one year of purchase may be subject to a CDSC of 1%. Average annual total returns without sales charge or CDSC do not reflect the current maximum sales charges. Had the sales charge or CDSC been included, the Fund's returns would have been lower.
† The Fund invests primarily in securities of companies with strong capital appreciation potential.
†† See index descriptions on page 6.
††† Fund returns during certain periods shown reflect a fee waiver and/or expense reimbursement. Without waiver/reimbursement, returns would have been lower. Returns shown include the reinvestment of all dividends.
* Commencement of Class I and Class A.
Past performance is not indicative of future results and the table does not reflect the deduction of taxes that a shareholder would pay on Fund distributions or the redemption of Fund shares.
11
Fund Performance Data
CAPITAL INCOME FUND
Total Return Based on a $10,000 Investment
Comparative Results†††
| For Periods ended June 30, 2011 | | Since
12/31/10* | |
| Class I | |
| Aggregate total return | | | 5.90 | % | |
| Class A | |
| Aggregate total return (with sales charge) | | | 0.83 | % | |
| Aggregate total return (without sales charge) | | | 5.87 | % | |
| S&P 500 Index†† | |
| Aggregate total return | | | 6.02 | % | |
| BofA Merrill Lynch U.S. Corporate, Government and Mortgage Index†† | |
| Aggregate total return | | | 2.73 | % | |
Returns shown for Class A shares for the periods prior to its inception are derived from the historical performance of Class I shares of the Fund during such periods and have been adjusted to reflect the higher total annual operating expenses of the class. (Inception date: Class A — 2/28/11.)
Aggregate total returns with sales charge shown for Class A shares have been adjusted to reflect the current applicable sales charge of the class. Returns for Class A reflect the current maximum initial sales charge of 4.75%. Aggregate total returns without sales charge do not reflect the current maximum sales charges. Had the sales charge been included, the Fund's returns would have been lower.
† The Fund invests primarily in dividend-paying equities and high yield fixed income securities.
†† See index description on page 6.
††† Fund returns during the period shown reflect a fee waiver and/or expense reimbursement. Without waiver/reimbursement, returns would have been lower. Returns shown include the reinvestment of all dividends. Returns for periods less than one year are not annualized.
* Commencement of Class I.
Past performance is not indicative of future results and the table does not reflect the deduction of taxes that a shareholder would pay on Fund distributions or the redemption of Fund shares.
12
Fund Performance Data
HIGH YIELD FUND
Total Return Based on a $10,000 Investment
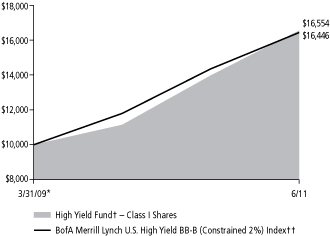
Comparative Results†††
| For Periods ended June 30, 2011 | | 1 Year | | Since
3/31/09* | |
| Class I | |
| Average annual total return | | | 18.45 | % | | | 25.12 | % | |
| Class A | |
| Average annual total return (with sales charge) | | | 13.68 | % | | | 22.41 | % | |
| Average annual total return (without sales charge) | | | 18.11 | % | | | 24.50 | % | |
| BofA Merrill Lynch U.S. High Yield BB-B (Constrained 2%) Index†† | |
| Average annual total return | | | 14.56 | % | | | 24.75 | % | |
Returns shown for Class A shares for the periods prior to its inception are derived from the historical performance of Class I shares of the Fund during such periods and have been adjusted to reflect the higher total annual operating expenses of the class. (Inception date: Class A — 5/29/09.)
Average annual total returns with sales charge shown for Class A shares have been adjusted to reflect the current applicable sales charge of the class. Returns for Class A reflect the current maximum initial sales charge of 3.75%. Average annual total returns without sales charge do not reflect the current maximum sales charges. Had the sales charge been included, the Fund's returns would have been lower.
† The Fund invests primarily in high yield securities.
†† See index description on page 6.
††† Fund returns during certain periods shown reflect a fee waiver and/or expense reimbursement. Without waiver/reimbursement, returns would have been lower. Returns shown include the reinvestment of all dividends.
* Commencement of Class I.
Past performance is not indicative of future results and the table does not reflect the deduction of taxes that a shareholder would pay on Fund distributions or the redemption of Fund shares.
13
Schedule of Investments — June 30, 2011
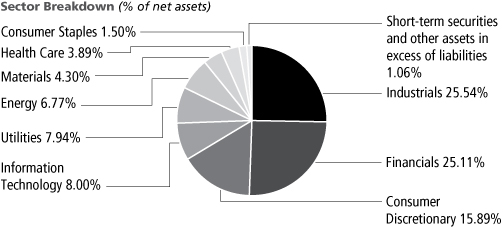
Hotchkis and Wiley Diversified Value Fund
| Largest Equity Holdings | | Percent of
net assets | |
| Hewlett-Packard Company | | | 4.50 | % | |
| Royal Dutch Shell PLC - Class B - ADR | | | 4.14 | % | |
| Wells Fargo & Company | | | 3.90 | % | |
| JPMorgan Chase & Company | | | 3.87 | % | |
| ConocoPhillips | | | 3.71 | % | |
| Lockheed Martin Corporation | | | 3.22 | % | |
| Vodafone Group PLC - ADR | | | 3.08 | % | |
| The Allstate Corporation | | | 2.99 | % | |
| Bank of America Corporation | | | 2.97 | % | |
| Exelon Corporation | | | 2.96 | % | |
COMMON
STOCKS — 99.19% | | Shares
Held | | Value | |
CONSUMER DISCRETIONARY — 11.47%
Auto Components — 2.24% | |
| Johnson Controls, Inc. | | | 91,200 | | | $ | 3,799,392 | | |
| Magna International, Inc. | | | 90,300 | | | | 4,879,812 | | |
| | | | 8,679,204 | | |
| Automobiles — 0.99% | |
| General Motors Company (a) | | | 125,900 | | | | 3,822,324 | | |
| Media — 3.69% | |
| Comcast Corporation | | | 307,100 | | | | 7,441,033 | | |
| The Interpublic Group of Companies, Inc. | | | 240,200 | | | | 3,002,500 | | |
| Time Warner Cable, Inc. | | | 49,600 | | | | 3,870,784 | | |
| | | | 14,314,317 | | |
| Multiline Retail — 2.12% | |
| J.C. Penney Company, Inc. | | | 238,100 | | | | 8,223,974 | | |
| Specialty Retail — 2.43% | |
| The Gap, Inc. | | | 250,400 | | | | 4,532,240 | | |
| Home Depot, Inc. | | | 135,400 | | | | 4,904,188 | | |
| | | | 9,436,428 | | |
| TOTAL CONSUMER DISCRETIONARY | | | 44,476,247 | | |
CONSUMER STAPLES — 6.67%
Beverages — 0.99% | |
| PepsiCo, Inc. | | | 54,400 | | | | 3,831,392 | | |
| Food & Staples Retailing — 4.46% | |
| CVS Caremark Corporation | | | 197,900 | | | | 7,437,082 | | |
| Safeway, Inc. | | | 146,800 | | | | 3,430,716 | | |
| Wal-Mart Stores, Inc. | | | 120,800 | | | | 6,419,312 | | |
| | | | 17,287,110 | | |
| Food Products — 0.74% | |
| Kraft Foods, Inc. | | | 80,900 | | | | 2,850,107 | | |
| Household Products — 0.48% | |
| Kimberly-Clark Corporation | | | 28,200 | | | | 1,876,992 | | |
| TOTAL CONSUMER STAPLES | | | 25,845,601 | | |
| | Shares
Held | | Value | |
ENERGY — 10.60%
Oil, Gas & Consumable Fuels — 10.60% | |
| Chevron Corporation | | | 27,700 | | | $ | 2,848,668 | | |
| Cobalt International Energy, Inc. (a) | | | 215,900 | | | | 2,942,717 | | |
| ConocoPhillips | | | 191,300 | | | | 14,383,847 | | |
| Royal Dutch Shell PLC — Class B — ADR | | | 223,800 | | | | 16,057,650 | | |
| Total SA — ADR | | | 84,000 | | | | 4,858,560 | | |
| TOTAL ENERGY | | | 41,091,442 | | |
FINANCIALS — 26.44%
Commercial Banks — 6.52% | |
| KeyCorp | | | 318,503 | | | | 2,653,130 | | |
| PNC Financial Services Group, Inc. | | | 66,315 | | | | 3,953,037 | | |
| SunTrust Banks, Inc. | | | 136,700 | | | | 3,526,860 | | |
| Wells Fargo & Company | | | 539,434 | | | | 15,136,518 | | |
| | | | 25,269,545 | | |
| Consumer Finance — 0.97% | |
| Capital One Financial Corporation | | | 73,200 | | | | 3,782,244 | | |
| Diversified Financial Services — 9.66% | |
| Bank of America Corporation | | | 1,050,222 | | | | 11,510,433 | | |
| Citigroup, Inc. | | | 262,374 | | | | 10,925,253 | | |
| JPMorgan Chase & Company | | | 366,400 | | | | 15,000,416 | | |
| | | | 37,436,102 | | |
| Insurance — 9.29% | |
| The Allstate Corporation | | | 380,200 | | | | 11,607,506 | | |
| American International Group, Inc. (a) | | | 217,500 | | | | 6,377,100 | | |
| Genworth Financial, Inc. (a) | | | 544,100 | | | | 5,593,348 | | |
| Hartford Financial Services Group, Inc. | | | 75,600 | | | | 1,993,572 | | |
| MetLife, Inc. | | | 88,742 | | | | 3,893,112 | | |
| Prudential Financial, Inc. | | | 30,800 | | | | 1,958,572 | | |
| XL Group PLC | | | 209,800 | | | | 4,611,404 | | |
| | | | 36,034,614 | | |
| TOTAL FINANCIALS | | | 102,522,505 | | |
The accompanying notes are an integral part of these financial statements.
14
Schedule of Investments — June 30, 2011
Hotchkis and Wiley Diversified Value Fund
| | Shares
Held | | Value | |
HEALTH CARE — 7.93%
Health Care Equipment & Supplies — 0.48% | |
| Covidien PLC | | | 35,000 | | | $ | 1,863,050 | | |
| Health Care Providers & Services — 1.00% | |
| Quest Diagnostics, Inc. | | | 65,500 | | | | 3,871,050 | | |
| Pharmaceuticals — 6.45% | |
| Eli Lilly & Company | | | 174,100 | | | | 6,533,973 | | |
| Johnson & Johnson | | | 79,100 | | | | 5,261,732 | | |
| Merck & Company, Inc. | | | 78,996 | | | | 2,787,769 | | |
| Novartis AG — ADR | | | 92,700 | | | | 5,664,897 | | |
| Pfizer, Inc. | | | 231,400 | | | | 4,766,840 | | |
| | | | 25,015,211 | | |
| TOTAL HEALTH CARE | | | 30,749,311 | | |
INDUSTRIALS — 10.81%
Aerospace & Defense — 6.39% | |
| The Boeing Company | | | 25,300 | | | | 1,870,429 | | |
| Embraer SA — ADR | | | 111,500 | | | | 3,431,970 | | |
| Huntington Ingalls Industries, Inc. (a) | | | 15,483 | | | | 534,164 | | |
| Lockheed Martin Corporation | | | 154,400 | | | | 12,501,768 | | |
| Northrop Grumman Corporation | | | 92,600 | | | | 6,421,810 | | |
| | | | 24,760,141 | | |
| Air Freight & Logistics — 1.36% | |
| FedEx Corporation | | | 55,500 | | | | 5,264,175 | | |
| Industrial Conglomerates — 1.01% | |
| Tyco International Limited | | | 79,200 | | | | 3,914,856 | | |
| Machinery — 2.05% | |
| Cummins, Inc. | | | 28,900 | | | | 2,990,861 | | |
| PACCAR, Inc. | | | 97,500 | | | | 4,981,275 | | |
| | | | 7,972,136 | | |
| TOTAL INDUSTRIALS | | | 41,911,308 | | |
INFORMATION TECHNOLOGY — 13.21%
Computers & Peripherals — 4.50% | |
| Hewlett-Packard Company | | | 479,200 | | | | 17,442,880 | | |
| Electronic Equipment, Instruments & Components — 1.79% | |
| TE Connectivity Limited | | | 188,900 | | | | 6,943,964 | | |
| IT Services — 0.50% | |
| International Business Machines Corporation | | | 11,200 | | | | 1,921,360 | | |
| Software — 6.42% | |
| CA, Inc. | | | 469,106 | | | | 10,714,381 | | |
| Microsoft Corporation | | | 394,000 | | �� | | 10,244,000 | | |
| Oracle Corporation | | | 120,000 | | | | 3,949,200 | | |
| | | | 24,907,581 | | |
| TOTAL INFORMATION TECHNOLOGY | | | 51,215,785 | | |
| | Shares
Held | | Value | |
MATERIALS — 1.11%
Chemicals — 1.11% | |
| Celanese Corporation | | | 44,100 | | | $ | 2,350,971 | | |
| PPG Industries, Inc. | | | 21,600 | | | | 1,961,064 | | |
| TOTAL MATERIALS | | | 4,312,035 | | |
TELECOMMUNICATION SERVICES — 3.08%
Wireless Telecommunication Services — 3.08% | |
| Vodafone Group PLC — ADR | | | 446,400 | | | | 11,927,808 | | |
| TOTAL TELECOMMUNICATION SERVICES | | | 11,927,808 | | |
UTILITIES — 7.87%
Electric Utilities — 5.38% | |
| Edison International | | | 143,900 | | | | 5,576,125 | | |
| Exelon Corporation | | | 268,300 | | | | 11,493,972 | | |
| PPL Corporation | | | 136,300 | | | | 3,793,229 | | |
| | | | 20,863,326 | | |
| Multi-Utilities — 2.49% | |
| Public Service Enterprise Group, Inc. | | | 295,000 | | | | 9,628,800 | | |
| TOTAL UTILITIES | | | 30,492,126 | | |
Total investments — 99.19%
(Cost $459,713,948) | | | 384,544,168 | | |
| Time deposit* — 0.58% | | | | | 2,243,436 | | |
| Other assets in excess of liabilities — 0.23% | | | | | 904,749 | | |
| Net assets — 100.00% | | $ | 387,692,353 | | |
(a) — Non-income producing security.
ADR — American Depositary Receipt
* — Time deposit with HSBC Bank bears interest at 0.03% and matures on 7/1/2011. Invested through a cash management account administered by Brown Brothers Harriman & Co.
The accompanying notes are an integral part of these financial statements.
15
Schedule of Investments — June 30, 2011
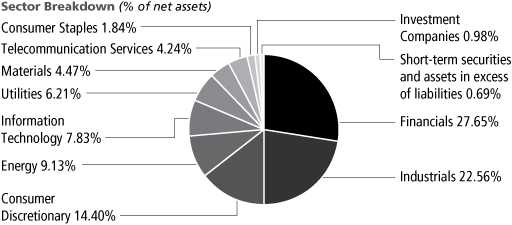
Hotchkis and Wiley Large Cap Value Fund
| Largest Equity Holdings | | Percent of
net assets | |
| Hewlett-Packard Company | | | 4.86 | % | |
| Royal Dutch Shell PLC - Class B - ADR | | | 4.39 | % | |
| JPMorgan Chase & Company | | | 4.38 | % | |
| Wells Fargo & Company | | | 4.11 | % | |
| ConocoPhillips | | | 4.00 | % | |
| Exelon Corporation | | | 3.96 | % | |
| Lockheed Martin Corporation | | | 3.58 | % | |
| Vodafone Group PLC - ADR | | | 3.56 | % | |
| The Allstate Corporation | | | 3.48 | % | |
| CA, Inc. | | | 3.25 | % | |
COMMON
STOCKS — 97.72% | | Shares
Held | | Value | |
CONSUMER DISCRETIONARY — 9.99%
Auto Components — 1.00% | |
| Magna International, Inc. | | | 177,900 | | | $ | 9,613,716 | | |
| Automobiles — 1.02% | |
| Harley-Davidson, Inc. | | | 239,600 | | | | 9,816,412 | | |
| Media — 2.60% | |
| Comcast Corporation | | | 1,030,600 | | | | 24,971,438 | | |
| Multiline Retail — 2.53% | |
| J.C. Penney Company, Inc. | | | 702,500 | | | | 24,264,350 | | |
| Specialty Retail — 2.64% | |
| The Gap, Inc. | | | 737,300 | | | | 13,345,130 | | |
| Home Depot, Inc. | | | 328,609 | | | | 11,902,218 | | |
| | | | 25,247,348 | | |
| Textiles, Apparel & Luxury Goods — 0.20% | |
| The Jones Group, Inc. | | | 176,900 | | | | 1,919,365 | | |
| TOTAL CONSUMER DISCRETIONARY | | | 95,832,629 | | |
CONSUMER STAPLES — 6.41%
Food & Staples Retailing — 5.08% | |
| CVS Caremark Corporation | | | 576,700 | | | | 21,672,386 | | |
| Safeway, Inc. | | | 411,500 | | | | 9,616,755 | | |
| Wal-Mart Stores, Inc. | | | 329,300 | | | | 17,499,002 | | |
| | | | 48,788,143 | | |
| Food Products — 0.84% | |
| Kraft Foods, Inc. | | | 229,200 | | | | 8,074,716 | | |
| Tobacco — 0.49% | |
| Philip Morris International, Inc. | | | 69,900 | | | | 4,667,223 | | |
| TOTAL CONSUMER STAPLES | | | 61,530,082 | | |
| | Shares
Held | | Value | |
ENERGY — 9.91%
Oil, Gas & Consumable Fuels — 9.91% | |
| ConocoPhillips | | | 510,700 | | | $ | 38,399,533 | | |
| Royal Dutch Shell PLC — Class B — ADR | | | 586,700 | | | | 42,095,725 | | |
| Total SA — ADR | | | 251,400 | | | | 14,540,976 | | |
| TOTAL ENERGY | | | 95,036,234 | | |
FINANCIALS — 27.69%
Commercial Banks — 6.67% | |
| PNC Financial Services Group, Inc. | | | 282,600 | | | | 16,845,786 | | |
| Regions Financial Corporation | | | 1,235,500 | | | | 7,660,100 | | |
| Wells Fargo & Company | | | 1,405,891 | | | | 39,449,301 | | |
| | | | 63,955,187 | | |
| Consumer Finance — 1.33% | |
| Capital One Financial Corporation | | | 247,300 | | | | 12,777,991 | | |
| Diversified Financial Services — 10.54% | |
| Bank of America Corporation | | | 2,763,889 | | | | 30,292,223 | | |
| Citigroup, Inc. | | | 690,068 | | | | 28,734,432 | | |
| JPMorgan Chase & Company | | | 1,027,300 | | | | 42,057,662 | | |
| | | | 101,084,317 | | |
| Insurance — 9.15% | |
| The Allstate Corporation | | | 1,094,900 | | | | 33,427,297 | | |
| Genworth Financial, Inc. (a) | | | 1,390,900 | | | | 14,298,452 | | |
| MetLife, Inc. | | | 415,058 | | | | 18,208,595 | | |
| Unum Group | | | 187,700 | | | | 4,782,596 | | |
| XL Group PLC | | | 777,900 | | | | 17,098,242 | | |
| | | | 87,815,182 | | |
| TOTAL FINANCIALS | | | 265,632,677 | | |
The accompanying notes are an integral part of these financial statements.
16
Schedule of Investments — June 30, 2011
Hotchkis and Wiley Large Cap Value Fund
| | Shares
Held | | Value | |
HEALTH CARE — 7.53%
Pharmaceuticals — 7.53% | |
| Eli Lilly & Company | | | 634,100 | | | $ | 23,797,773 | | |
| Johnson & Johnson | | | 157,000 | | | | 10,443,640 | | |
| Merck & Company, Inc. | | | 270,400 | | | | 9,542,416 | | |
| Novartis AG — ADR | | | 274,100 | | | | 16,750,251 | | |
| Pfizer, Inc. | | | 570,000 | | | | 11,742,000 | | |
| TOTAL HEALTH CARE | | | 72,276,080 | | |
INDUSTRIALS — 8.52%
Aerospace & Defense — 6.25% | |
| Embraer SA — ADR | | | 274,000 | | | | 8,433,720 | | |
| Huntington Ingalls Industries, Inc. (a) | | | 39,150 | | | | 1,350,675 | | |
| Lockheed Martin Corporation | | | 424,600 | | | | 34,379,862 | | |
| Northrop Grumman Corporation | | | 227,700 | | | | 15,790,995 | | |
| | | | 59,955,252 | | |
| Industrial Conglomerates — 1.00% | |
| Tyco International Limited | | | 194,125 | | | | 9,595,599 | | |
| Machinery — 1.27% | |
| PACCAR, Inc. | | | 237,800 | | | | 12,149,202 | | |
| TOTAL INDUSTRIALS | | | 81,700,053 | | |
INFORMATION TECHNOLOGY — 13.67%
Computers & Peripherals — 4.86% | |
| Hewlett-Packard Company | | | 1,281,200 | | | | 46,635,680 | | |
| Electronic Equipment, Instruments & Components — 1.76% | |
| TE Connectivity Limited | | | 458,425 | | | | 16,851,703 | | |
| IT Services — 0.95% | |
| International Business Machines Corporation | | | 52,900 | | | | 9,074,995 | | |
| Software — 6.10% | |
| CA, Inc. | | | 1,362,981 | | | | 31,130,486 | | |
| Microsoft Corporation | | | 1,056,000 | | | | 27,456,000 | | |
| | | | 58,586,486 | | |
| TOTAL INFORMATION TECHNOLOGY | | | 131,148,864 | | |
MATERIALS — 1.29%
Chemicals — 1.29% | |
| Celanese Corporation | | | 232,300 | | | | 12,383,913 | | |
| TOTAL MATERIALS | | | 12,383,913 | | |
TELECOMMUNICATION SERVICES — 3.56%
Wireless Telecommunication Services — 3.56% | |
| Vodafone Group PLC — ADR | | | 1,278,600 | | | | 34,164,192 | | |
| TOTAL TELECOMMUNICATION SERVICES | | | 34,164,192 | | |
UTILITIES — 9.15%
Electric Utilities — 6.64% | |
| Edison International | | | 420,200 | | | | 16,282,750 | | |
| Exelon Corporation | | | 886,500 | | | | 37,977,660 | | |
| PPL Corporation | | | 339,700 | | | | 9,453,851 | | |
| | | | 63,714,261 | | |
| | Shares
Held | | Value | |
| Multi-Utilities — 2.51% | |
| Public Service Enterprise Group, Inc. | | | 737,500 | | | $ | 24,072,000 | | |
| TOTAL UTILITIES | | | 87,786,261 | | |
Total investments — 97.72%
(Cost $1,128,783,577) | | | 937,490,985 | | |
| Time deposit* — 1.37% | | | | | 13,108,689 | | |
| Other assets in excess of liabilities — 0.91% | | | | | 8,732,327 | | |
| Net assets — 100.00% | | $ | 959,332,001 | | |
(a) — Non-income producing security.
ADR — American Depositary Receipt
* — Time deposit with Wells Fargo bears interest at 0.03% and matures on 7/1/2011. Invested through a cash management account administered by Brown Brothers Harriman & Co.
The accompanying notes are an integral part of these financial statements.
17
Schedule of Investments — June 30, 2011
Hotchkis and Wiley Mid-Cap Value Fund
| Largest Equity Holdings | | Percent of
net assets | |
| Valassis Communications, Inc. | | | 6.05 | % | |
| CA, Inc. | | | 4.12 | % | |
| Cobalt International Energy, Inc. | | | 4.09 | % | |
| Con-way, Inc. | | | 3.99 | % | |
| MI Developments, Inc. | | | 3.86 | % | |
| The Gap, Inc. | | | 3.72 | % | |
| Stone Energy Corporation | | | 3.50 | % | |
| Huntington Ingalls Industries, Inc. | | | 3.22 | % | |
| Arris Group, Inc. | | | 3.09 | % | |
| Edison International | | | 2.95 | % | |
COMMON
STOCKS — 99.14% | | Shares
Held | | Value | |
CONSUMER DISCRETIONARY — 21.10%
Auto Components — 4.37% | |
| The Goodyear Tire & Rubber Company (a) | | | 1,714,500 | | | $ | 28,752,165 | | |
| Magna International, Inc. | | | 563,400 | | | | 30,446,136 | | |
| | | | 59,198,301 | | |
| Automobiles — 0.49% | |
| Harley-Davidson, Inc. | | | 162,500 | | | | 6,657,625 | | |
| Media — 6.77% | |
| The Interpublic Group of Companies, Inc. | | | 779,000 | | | | 9,737,500 | | |
| Valassis Communications, Inc. (a) (b) | | | 2,702,900 | | | | 81,897,870 | | |
| | | | 91,635,370 | | |
| Multiline Retail — 2.09% | |
| J.C. Penney Company, Inc. | | | 819,000 | | | | 28,288,260 | | |
| Specialty Retail — 6.17% | |
| Aeropostale, Inc. (a) | | | 363,400 | | | | 6,359,500 | | |
| The Gap, Inc. | | | 2,785,800 | | | | 50,422,980 | | |
| Rent-A-Center, Inc. | | | 874,700 | | | | 26,730,832 | | |
| | | | 83,513,312 | | |
| Textiles, Apparel & Luxury Goods — 1.21% | |
| The Jones Group, Inc. | | | 1,516,000 | | | | 16,448,600 | | |
| TOTAL CONSUMER DISCRETIONARY | | | 285,741,468 | | |
CONSUMER STAPLES — 5.08%
Food & Staples Retailing — 5.08% | |
| Safeway, Inc. | | | 1,600,100 | | | | 37,394,337 | | |
| SUPERVALU, Inc. (c) | | | 3,328,300 | | | | 31,319,303 | | |
| TOTAL CONSUMER STAPLES | | | 68,713,640 | | |
| | Shares
Held | | Value | |
ENERGY — 10.61%
Oil, Gas & Consumable Fuels — 10.61% | |
| Cobalt International Energy, Inc. (a) | | | 4,064,400 | | | $ | 55,397,772 | | |
| Kosmos Energy Limited (a) (c) | | | 1,308,500 | | | | 22,218,330 | | |
| Murphy Oil Corporation | | | 160,700 | | | | 10,551,562 | | |
| Stone Energy Corporation (a) | | | 1,561,600 | | | | 47,457,024 | | |
| Tesoro Corporation (a) | | | 349,100 | | | | 7,997,881 | | |
| TOTAL ENERGY | | | 143,622,569 | | |
FINANCIALS — 27.98%
Commercial Banks — 11.27% | |
| Fifth Third Bancorp | | | 2,400,300 | | | | 30,603,825 | | |
| First Horizon National Corporation | | | 864,158 | | | | 8,244,064 | | |
| KeyCorp | | | 3,683,820 | | | | 30,686,220 | | |
| Regions Financial Corporation | | | 5,844,100 | | | | 36,233,420 | | |
| SunTrust Banks, Inc. | | | 1,327,300 | | | | 34,244,340 | | |
| Synovus Financial Corporation | | | 6,053,200 | | | | 12,590,656 | | |
| | | | 152,602,525 | | |
| Diversified Financial Services — 1.80% | |
| PHH Corporation (a) | | | 1,189,700 | | | | 24,412,644 | | |
| Insurance — 11.05% | |
| The Allstate Corporation | | | 507,800 | | | | 15,503,134 | | |
| CNO Financial Group, Inc. (a) | | | 4,368,400 | | | | 34,554,044 | | |
| Genworth Financial, Inc. (a) | | | 3,203,300 | | | | 32,929,924 | | |
| Hartford Financial Services Group, Inc. | | | 831,400 | | | | 21,924,018 | | |
| Unum Group | | | 781,200 | | | | 19,904,976 | | |
| XL Group PLC | | | 1,126,400 | | | | 24,758,272 | | |
| | | | 149,574,368 | | |
| Real Estate Management & Development — 3.86% | |
| MI Developments, Inc. | | | 1,718,200 | | | | 52,284,826 | | |
| TOTAL FINANCIALS | | | 378,874,363 | | |
The accompanying notes are an integral part of these financial statements.
18
Schedule of Investments — June 30, 2011
Hotchkis and Wiley Mid-Cap Value Fund
| | Shares
Held | | Value | |
HEALTH CARE — 1.81%
Health Care Equipment & Supplies — 0.32% | |
| Kinetic Concepts, Inc. (a) | | | 75,000 | | | $ | 4,322,250 | | |
| Health Care Providers & Services — 1.49% | |
| LifePoint Hospitals, Inc. (a) | | | 335,600 | | | | 13,115,248 | | |
| Quest Diagnostics, Inc. | | | 119,100 | | | | 7,038,810 | | |
| | | | 20,154,058 | | |
| TOTAL HEALTH CARE | | | 24,476,308 | | |
INDUSTRIALS — 12.77%
Aerospace & Defense — 5.48% | |
| Alliant Techsystems, Inc. | | | 142,700 | | | | 10,178,791 | | |
| Embraer SA — ADR | | | 663,700 | | | | 20,428,686 | | |
| Huntington Ingalls Industries, Inc. (a) | | | 1,264,300 | | | | 43,618,350 | | |
| | | | 74,225,827 | | |
| Construction & Engineering — 0.50% | |
| EMCOR Group, Inc. (a) | | | 229,000 | | | | 6,711,990 | | |
| Machinery — 0.51% | |
| Terex Corporation (a) | | | 243,800 | | | | 6,936,110 | | |
| Professional Services — 2.29% | |
| Manpower, Inc. | | | 577,000 | | | | 30,956,050 | | |
| Road & Rail — 3.99% | |
| Con-way, Inc. | | | 1,392,800 | | | | 54,054,568 | | |
| TOTAL INDUSTRIALS | | | 172,884,545 | | |
INFORMATION TECHNOLOGY — 11.91%
Communications Equipment — 3.09% | |
| Arris Group, Inc. (a) | | | 3,608,800 | | | | 41,898,168 | | |
| Computers & Peripherals — 0.18% | |
| Lexmark International, Inc. (a) | | | 81,800 | | | | 2,393,468 | | |
| Electronic Equipment, Instruments & Components — 2.85% | |
| TE Connectivity Limited | | | 1,050,700 | | | | 38,623,732 | | |
| Semiconductors & Semiconductor Equipment — 1.15% | |
| ON Semiconductor Corporation (a) | | | 1,487,000 | | | | 15,568,890 | | |
| Software — 4.64% | |
| CA, Inc. | | | 2,440,844 | | | | 55,748,877 | | |
| Symantec Corporation (a) | | | 355,700 | | | | 7,014,404 | | |
| | | | 62,763,281 | | |
| TOTAL INFORMATION TECHNOLOGY | | | 161,247,539 | | |
| | Shares
Held | | Value | |
UTILITIES — 7.88%
Electric Utilities — 7.88% | |
| Edison International | | | 1,032,000 | | | $ | 39,990,000 | | |
| Great Plains Energy, Inc. | | | 1,585,500 | | | | 32,867,415 | | |
| PPL Corporation | | | 1,217,200 | | | | 33,874,676 | | |
| TOTAL UTILITIES | | | 106,732,091 | | |
Total investments — 99.14%
(Cost $1,502,933,152) | | | 1,342,292,523 | | |
| Collateral for securities on loan^ — 1.29% | | | | | 17,477,265 | | |
| Time deposit* — 1.00% | | | | | 13,550,784 | | |
| Liabilities in excess of other assets — (1.43)% | | | | | (19,335,333 | ) | |
| Net assets — 100.00% | | $ | 1,353,985,239 | | |
(a) — Non-income producing security.
(b) — Affiliated issuer. See Note 6 in Notes to the Financial Statements.
(c) — All or a portion of this security is on loan. The total market value of securities on loan was $17,051,610.
ADR — American Depositary Receipt
^ — Collateral for securities on loan of $17,477,265 was invested in the Invesco Government Agency Portfolio. The 7-day yield as of June 30, 2011 was 0.02%.
* — Time deposit with Citibank bears interest at 0.03% and matures on 7/1/2011. Invested through a cash management account administered by Brown Brothers Harriman & Co.
The accompanying notes are an integral part of these financial statements.
19
Schedule of Investments — June 30, 2011
Hotchkis and Wiley Small Cap Value Fund
| Largest Equity Holdings | | Percent of
net assets | |
| Valassis Communications, Inc. | | | 6.10 | % | |
| Great Plains Energy, Inc. | | | 4.74 | % | |
| Alliant Techsystems, Inc. | | | 4.46 | % | |
| Noranda Aluminum Holding Corporation | | | 4.30 | % | |
| Con-way, Inc. | | | 4.21 | % | |
| MI Developments, Inc. | | | 3.75 | % | |
| Stone Energy Corporation | | | 3.68 | % | |
| Huntington Ingalls Industries, Inc. | | | 3.47 | % | |
| Symetra Financial Corporation | | | 3.40 | % | |
| Miller Industries, Inc. | | | 3.32 | % | |
COMMON
STOCKS — 98.94% | | Shares
Held | | Value | |
CONSUMER DISCRETIONARY — 15.89%
Auto Components — 1.05% | |
| The Goodyear Tire & Rubber Company (a) | | | 206,000 | | | $ | 3,454,620 | | |
| Hotels, Restaurants & Leisure — 0.68% | |
| Jack in the Box, Inc. (a) | | | 81,200 | | | | 1,849,736 | | |
| Lakes Entertainment, Inc. (a) | | | 175,900 | | | | 386,980 | | |
| | | | 2,236,716 | | |
| Household Durables — 0.79% | |
| Furniture Brands International, Inc. (a) | | | 632,800 | | | | 2,619,792 | | |
| Media — 6.94% | |
| The Interpublic Group of Companies, Inc. | | | 222,200 | | | | 2,777,500 | | |
| Valassis Communications, Inc. (a) | | | 664,300 | | | | 20,128,290 | | |
| | | | 22,905,790 | | |
| Multiline Retail — 0.34% | |
| 99 Cents Only Stores (a) | | | 54,700 | | | | 1,107,128 | | |
| Specialty Retail — 1.44% | |
| Rent-A-Center, Inc. | | | 155,800 | | | | 4,761,248 | | |
| Textiles, Apparel & Luxury Goods — 4.65% | |
| The Jones Group, Inc. | | | 717,300 | | | | 7,782,705 | | |
| Quiksilver, Inc. (a) | | | 1,609,600 | | | | 7,565,120 | | |
| | | | 15,347,825 | | |
| TOTAL CONSUMER DISCRETIONARY | | | 52,433,119 | | |
CONSUMER STAPLES — 1.50%
Food Products — 1.50% | |
| Overhill Farms, Inc. (a) (b) | | | 889,200 | | | | 4,935,060 | | |
| TOTAL CONSUMER STAPLES | | | 4,935,060 | | |
ENERGY — 6.77%
Energy Equipment & Services — 0.47% | |
| Bristow Group, Inc. | | | 30,300 | | | | 1,545,906 | | |
| | Shares
Held | | Value | |
| Oil, Gas & Consumable Fuels — 6.30% | |
| Cobalt International Energy, Inc. (a) | | | 579,700 | | | $ | 7,901,311 | | |
| Petroquest Energy, Inc. (a) | | | 105,400 | | | | 739,908 | | |
| Stone Energy Corporation (a) | | | 400,100 | | | | 12,159,039 | | |
| | | | 20,800,258 | | |
| TOTAL ENERGY | | | 22,346,164 | | |
FINANCIALS — 25.11%
Commercial Banks — 5.56% | |
| Associated Banc-Corp | | | 210,500 | | | | 2,925,950 | | |
| First Horizon National Corporation | | | 598,131 | | | | 5,706,172 | | |
| First Interstate BancSystem, Inc. | | | 226,600 | | | | 3,340,084 | | |
| M&T Bank Corporation | | | 3,991 | | | | 351,009 | | |
| Synovus Financial Corporation | | | 606,800 | | | | 1,262,144 | | |
| Webster Financial Corporation | | | 226,600 | | | | 4,763,132 | | |
| | | | 18,348,491 | | |
| Diversified Financial Services — 3.24% | |
| PHH Corporation (a) | | | 520,700 | | | | 10,684,764 | | |
| Insurance — 11.49% | |
| CNO Financial Group, Inc. (a) | | | 1,200,800 | | | | 9,498,328 | | |
| Employers Holdings, Inc. | | | 203,600 | | | | 3,414,372 | | |
| Global Indemnity PLC (a) | | | 422,113 | | | | 9,362,466 | | |
| The Hanover Insurance Group, Inc. | | | 11,700 | | | | 441,207 | | |
| Horace Mann Educators Corporation | | | 255,100 | | | | 3,982,111 | | |
| Symetra Financial Corporation | | | 835,200 | | | | 11,216,736 | | |
| | | | 37,915,220 | | |
| Real Estate Investment Trusts — 0.80% | |
| CapLease, Inc. | | | 539,100 | | | | 2,646,981 | | |
| Real Estate Management & Development — 3.75% | |
| MI Developments, Inc. | | | 407,500 | | | | 12,400,225 | | |
The accompanying notes are an integral part of these financial statements.
20
Schedule of Investments — June 30, 2011
Hotchkis and Wiley Small Cap Value Fund
| | Shares
Held | | Value | |
| Thrifts & Mortgage Finance — 0.27% | |
| First Financial Holdings, Inc. | | | 87,900 | | | $ | 788,463 | | |
| Territorial Bancorp, Inc. | | | 4,600 | | | | 95,312 | | |
| | | | 883,775 | | |
| TOTAL FINANCIALS | | | 82,879,456 | | |
HEALTH CARE — 3.89%
Health Care Equipment & Supplies — 1.94% | |
| Kinetic Concepts, Inc. (a) | | | 110,900 | | | | 6,391,167 | | |
| Health Care Providers & Services — 1.95% | |
| LifePoint Hospitals, Inc. (a) | | | 84,300 | | | | 3,294,444 | | |
| PharMerica Corporation (a) | | | 246,800 | | | | 3,149,168 | | |
| | | | 6,443,612 | | |
| TOTAL HEALTH CARE | | | 12,834,779 | | |
INDUSTRIALS — 25.54%
Aerospace & Defense — 8.15% | |
| Alliant Techsystems, Inc. | | | 206,400 | | | | 14,722,512 | | |
| Embraer SA — ADR | | | 22,900 | | | | 704,862 | | |
| Huntington Ingalls Industries, Inc. (a) | | | 332,400 | | | | 11,467,800 | | |
| | | | 26,895,174 | | |
| Commercial Services & Supplies — 0.46% | |
| The Geo Group, Inc. (a) | | | 65,200 | | | | 1,501,556 | | |
| Construction & Engineering — 0.43% | |
| EMCOR Group, Inc. (a) | | | 48,500 | | | | 1,421,535 | | |
| Machinery — 6.97% | |
| CIRCOR International, Inc. | | | 95,900 | | | | 4,107,397 | | |
| Meritor, Inc. (a) | | | 112,200 | | | | 1,799,688 | | |
| Miller Industries, Inc. | | | 586,900 | | | | 10,969,161 | | |
| Mueller Water Products, Inc. | | | 389,800 | | | | 1,551,404 | | |
| Terex Corporation (a) | | | 161,100 | | | | 4,583,295 | | |
| | | | 23,010,945 | | |
| Professional Services — 5.28% | |
| Heidrick & Struggles International, Inc. | | | 182,900 | | | | 4,140,856 | | |
| Hudson Highland Group, Inc. (a) | | | 1,624,700 | | | | 8,692,145 | | |
| Manpower, Inc. | | | 85,500 | | | | 4,587,075 | | |
| | | | 17,420,076 | | |
| Road & Rail — 4.25% | |
| Con-way, Inc. | | | 358,200 | | | | 13,901,742 | | |
| Saia, Inc. (a) | | | 7,600 | | | | 128,820 | | |
| | | | 14,030,562 | | |
| TOTAL INDUSTRIALS | | | 84,279,848 | | |
INFORMATION TECHNOLOGY — 8.00%
Communications Equipment — 3.23% | |
| Arris Group, Inc. (a) | | | 817,600 | | | | 9,492,336 | | |
| Symmetricom, Inc. (a) | | | 199,700 | | | | 1,164,251 | | |
| | | | 10,656,587 | | |
| | Shares
Held | | Value | |
| Computers & Peripherals — 0.17% | |
| Lexmark International, Inc. (a) | | | 19,800 | | | $ | 579,348 | | |
| IT Services — 3.35% | |
| Ciber, Inc. (a) | | | 307,000 | | | | 1,703,850 | | |
| Heartland Payment Systems, Inc. | | | 195,600 | | | | 4,029,360 | | |
| Ness Technologies, Inc. (a) | | | 704,800 | | | | 5,335,336 | | |
| | | | 11,068,546 | | |
| Semiconductors & Semiconductor Equipment — 1.25% | |
| ON Semiconductor Corporation (a) | | | 392,600 | | | | 4,110,522 | | |
| TOTAL INFORMATION TECHNOLOGY | | | 26,415,003 | | |
MATERIALS — 4.30%
Metals & Mining — 4.30% | |
| Noranda Aluminum Holding Corporation (a) | | | 937,400 | | | | 14,192,236 | | |
| TOTAL MATERIALS | | | 14,192,236 | | |
UTILITIES — 7.94%
Electric Utilities — 7.94% | |
| Great Plains Energy, Inc. | | | 754,200 | | | | 15,634,566 | | |
| Portland General Electric Company | | | 269,900 | | | | 6,823,072 | | |
| Westar Energy, Inc. | | | 139,400 | | | | 3,751,254 | | |
| TOTAL UTILITIES | | | 26,208,892 | | |
Total investments — 98.94%
(Cost $316,764,168) | | | 326,524,557 | | |
| Time deposit* — 0.18% | | | | | 598,580 | | |
| Other assets in excess of liabilities — 0.88% | | | | | 2,891,060 | | |
| Net assets — 100.00% | | $ | 330,014,197 | | |
(a) — Non-income producing security.
(b) — Affiliated issuer. See Note 6 in Notes to the Financial Statements.
ADR — American Depositary Receipt
* — Time deposit with Citibank bears interest at 0.03% and matures on 7/1/2011. Invested through a cash management account administered by Brown Brothers Harriman & Co.
The accompanying notes are an integral part of these financial statements.
21
Schedule of Investments — June 30, 2011
Hotchkis and Wiley Value Opportunities Fund
| Largest Equity Holdings | | Percent of
net assets | |
| Valassis Communications, Inc. | | | 12.49 | % | |
Federal Home Loan Mortgage
Corporation - Series Z | | | 5.10 | % | |
Noranda Aluminum Holding
Corporation | | | 4.47 | % | |
| JPMorgan Chase & Company | | | 4.46 | % | |
| Total SA - ADR | | | 4.26 | % | |
| Vodafone Group PLC - ADR | | | 4.24 | % | |
| Microsoft Corporation | | | 4.06 | % | |
| Cobalt International Energy, Inc. | | | 4.04 | % | |
| Hewlett-Packard Company | | | 3.77 | % | |
| Hudson Highland Group, Inc. | | | 3.62 | % | |
COMMON
STOCKS — 88.11% | | Shares
Held | | Value | |
CONSUMER DISCRETIONARY — 14.40%
Hotels, Restaurants & Leisure — 0.46% | |
| Lakes Entertainment, Inc. (a) | | | 179,600 | | | $ | 395,120 | | |
| Household Durables — 0.25% | |
| Furniture Brands International, Inc. (a) | | | 53,400 | | | | 221,076 | | |
| Media — 12.49% | |
| Valassis Communications, Inc. (a) | | | 354,800 | | | | 10,750,440 | | |
| Textiles, Apparel & Luxury Goods — 1.20% | |
| Quiksilver, Inc. (a) | | | 219,700 | | | | 1,032,590 | | |
| TOTAL CONSUMER DISCRETIONARY | | | 12,399,226 | | |
CONSUMER STAPLES — 1.84%
Food & Staples Retailing — 0.48% | |
| Wal-Mart Stores, Inc. | | | 7,800 | | | | 414,492 | | |
| Food Products — 1.36% | |
| Overhill Farms, Inc. (a) | | | 210,800 | | | | 1,169,940 | | |
| TOTAL CONSUMER STAPLES | | | 1,584,432 | | |
ENERGY — 8.30%
Oil, Gas & Consumable Fuels — 8.30% | |
| Cobalt International Energy, Inc. (a) | | | 255,100 | | | | 3,477,013 | | |
| Total SA — ADR | | | 63,400 | | | | 3,667,056 | | |
| TOTAL ENERGY | | | 7,144,069 | | |
FINANCIALS — 18.26%
Commercial Banks — 2.87% | |
| Wells Fargo & Company | | | 88,200 | | | | 2,474,892 | | |
| Diversified Financial Services — 4.46% | |
| JPMorgan Chase & Company | | | 93,800 | | | | 3,840,172 | | |
| Insurance — 5.54% | |
| The Allstate Corporation | | | 94,600 | | | | 2,888,138 | | |
| Global Indemnity PLC (a) | | | 84,684 | | | | 1,878,291 | | |
| | | | 4,766,429 | | |
| | Shares
Held | | Value | |
| Real Estate Management & Development — 2.10% | |
| MI Developments, Inc. | | | 59,300 | | | $ | 1,804,499 | | |
| Thrifts & Mortgage Finance — 3.29% | |
| Tree.com, Inc. (a) (b) | | | 553,200 | | | | 2,832,384 | | |
| TOTAL FINANCIALS | | | 15,718,376 | | |
INDUSTRIALS — 22.56%
Aerospace & Defense — 8.82% | |
| Alliant Techsystems, Inc. | | | 6,300 | | | | 449,379 | | |
| Huntington Ingalls Industries, Inc. (a) | | | 78,366 | | | | 2,703,627 | | |
| Lockheed Martin Corporation | | | 36,500 | | | | 2,955,405 | | |
| Northrop Grumman Corporation | | | 21,400 | | | | 1,484,090 | | |
| | | | 7,592,501 | | |
| Air Freight & Logistics — 0.45% | |
| Air T, Inc. | | | 42,900 | | | | 384,813 | | |
| Machinery — 4.41% | |
| KSB AG (f) | | | 1,100 | | | | 840,124 | | |
| Miller Industries, Inc. | | | 158,098 | | | | 2,954,852 | | |
| | | | 3,794,976 | | |
| Marine — 1.93% | |
| Clarkson PLC | | | 83,000 | | | | 1,658,481 | | |
| Professional Services — 3.62% | |
| Hudson Highland Group, Inc. (a) | | | 582,000 | | | | 3,113,700 | | |
| Road & Rail — 3.33% | |
| Con-way, Inc. | | | 74,000 | | | | 2,871,940 | | |
| TOTAL INDUSTRIALS | | | 19,416,411 | | |
INFORMATION TECHNOLOGY — 7.83%
Computers & Peripherals — 3.77% | |
| Hewlett-Packard Company | | | 89,100 | | | | 3,243,240 | | |
| Software — 4.06% | |
| Microsoft Corporation | | | 134,500 | | | | 3,497,000 | | |
| TOTAL INFORMATION TECHNOLOGY | | | 6,740,240 | | |
The accompanying notes are an integral part of these financial statements.
22
Schedule of Investments — June 30, 2011
Hotchkis and Wiley Value Opportunities Fund
| | Shares
Held | | Value | |
MATERIALS — 4.47%
Metals & Mining — 4.47% | |
| Noranda Aluminum Holding Corporation (a) | | | 254,400 | | | $ | 3,851,616 | | |
| TOTAL MATERIALS | | | 3,851,616 | | |
TELECOMMUNICATION SERVICES — 4.24%
Wireless Telecommunication Services — 4.24% | |
| Vodafone Group PLC — ADR | | | 136,500 | | | | 3,647,280 | | |
| TOTAL TELECOMMUNICATION SERVICES | | | 3,647,280 | | |
UTILITIES — 6.21%
Electric Utilities — 3.75% | |
| Exelon Corporation | | | 59,600 | | | | 2,553,264 | | |
| PPL Corporation | | | 24,300 | | | | 676,269 | | |
| | | | 3,229,533 | | |
| Multi-Utilities — 2.46% | |
| Public Service Enterprise Group, Inc. | | | 64,700 | | | | 2,111,808 | | |
| TOTAL UTILITIES | | | 5,341,341 | | |
Total common stocks
(Cost $76,313,802) | | | | | 75,842,991 | | |
| INVESTMENT COMPANIES — 0.98% | |
| Equity Mutual Funds — 0.98% | |
| Diamond Hill Financial Trends Fund, Inc. | | | 86,100 | | | | 848,085 | | |
Total investment companies
(Cost $644,142) | | | 848,085 | | |
| PREFERRED STOCKS — 9.39% | |
FINANCIALS — 9.39%
Real Estate Investment Trusts — 3.34% | |
| Strategic Hotels & Resorts, Inc. — Series A (a) | | | 99,700 | | | | 2,875,348 | | |
| Thrifts & Mortgage Finance — 6.05% | |
Federal Home Loan Mortgage
Corporation — Series K (a) | | | 33,900 | | | | 154,245 | | |
Federal Home Loan Mortgage
Corporation — Series N (a) | | | 118,600 | | | | 406,205 | | |
Federal Home Loan Mortgage
Corporation — Series S (a) | | | 18,700 | | | | 86,955 | | |
Federal Home Loan Mortgage
Corporation — Series T (a) | | | 37,900 | | | | 170,550 | | |
Federal Home Loan Mortgage
Corporation — Series Z (a) | | | 1,489,100 | | | | 4,392,845 | | |
| | | | 5,210,800 | | |
| TOTAL FINANCIALS | | | 8,086,148 | | |
Total preferred stocks
(Cost $3,452,337) | | | | | 8,086,148 | | |
CORPORATE
BONDS — 0.83% | | Amount | | Value | |
ENERGY — 0.83%
Oil, Gas & Consumable Fuels — 0.83% | |
American Petroleum Tankers LLC/American
Petroleum Tankers Company
10.250%, 05/01/2015 | | $ | 679,000 | | | $ | 712,950 | | |
| TOTAL ENERGY | | | 712,950 | | |
Total corporate bonds
(cost $663,420) | | | | | 712,950 | | |
Total investments — 99.31%
(Cost $81,073,701) | | | 85,490,174 | | |
| Time deposit* — 0.45% | | | | | 386,310 | | |
| Other assets in excess of liabilities — 0.24% | | | | | 205,535 | | |
| Net assets — 100.00% | | $ | 86,082,019 | | |
(a) — Non-income producing security.
(b) — Affiliated issuer. See Note 6 in Notes to the Financial Statements.
(f) — Security valued using Interactive Data's proprietary fair value pricing model. The total market value of this security was $840,124, representing 0.98% of net assets. See Note 1 in Notes to the Financial Statements.
ADR — American Depositary Receipt
* — Time deposit with HSBC Bank bears interest at 0.03% and matures on 7/1/2011. Invested through a cash management account administered by Brown Brothers Harriman & Co.
The accompanying notes are an integral part of these financial statements.
23
Schedule of Investments — June 30, 2011
Hotchkis and Wiley Capital Income Fund

| Largest Issuers | | Percent of
net assets | |
| Lockheed Martin Corporation | | | 3.65 | % | |
| Exelon Corporation | | | 3.60 | % | |
| Vodafone Group PLC - ADR | | | 3.47 | % | |
| Royal Dutch Shell PLC - Class B - ADR | | | 3.46 | % | |
| JPMorgan Chase & Company | | | 3.42 | % | |
| Microsoft Corporation | | | 3.20 | % | |
| ConocoPhillips | | | 2.56 | % | |
| Wells Fargo & Company | | | 2.55 | % | |
| Johnson & Johnson | | | 2.32 | % | |
| Philip Morris International, Inc. | | | 2.32 | % | |
COMMON
STOCKS — 57.44% | | Shares
Held | | Value | |
CONSUMER DISCRETIONARY — 2.97%
Automobiles — 0.37% | |
| General Motors Company (b) (i) | | | 4,600 | | | $ | 2,990 | | |
| General Motors Company (b) | | | 853 | | | | 25,897 | | |
| | | | 28,887 | | |
| Multiline Retail — 0.85% | |
| J.C. Penney Company, Inc. | | | 1,925 | | | | 66,490 | | |
| Specialty Retail — 1.75% | |
| Home Depot, Inc. | | | 3,802 | | | | 137,708 | | |
| TOTAL CONSUMER DISCRETIONARY | | | 233,085 | | |
CONSUMER STAPLES — 9.18%
Beverages — 1.14% | |
| PepsiCo, Inc. | | | 1,268 | | | | 89,305 | | |
| Food & Staples Retailing — 1.41% | |
| Wal-Mart Stores, Inc. (c) | | | 2,081 | | | | 110,584 | | |
| Food Products — 2.88% | |
| Kraft Foods, Inc. | | | 3,928 | | | | 138,384 | | |
| Unilever PLC — ADR | | | 2,737 | | | | 88,651 | | |
| | | | 227,035 | | |
| Household Products — 1.43% | |
| Kimberly-Clark Corporation | | | 1,680 | | | | 111,821 | | |
| Tobacco — 2.32% | |
| Philip Morris International, Inc. (c) | | | 2,722 | | | | 181,748 | | |
| TOTAL CONSUMER STAPLES | | | 720,493 | | |
ENERGY — 6.90%
Oil, Gas & Consumable Fuels — 6.90% | |
| ConocoPhillips | | | 2,669 | | | | 200,682 | | |
| Royal Dutch Shell PLC — Class B — ADR | | | 3,786 | | | | 271,646 | | |
| Total SA — ADR | | | 1,197 | | | | 69,234 | | |
| TOTAL ENERGY | | | 541,562 | | |
| | Shares
Held | | Value | |
FINANCIALS — 9.23%
Commercial Banks — 4.10% | |
| PNC Financial Services Group, Inc. | | | 2,578 | | | $ | 153,675 | | |
| Wells Fargo & Company | | | 5,984 | | | | 167,910 | | |
| | | | 321,585 | | |
| Diversified Financial Services — 3.42% | |
| JPMorgan Chase & Company (c) | | | 6,554 | | | | 268,321 | | |
| Insurance — 1.71% | |
| The Allstate Corporation | | | 4,396 | | | | 134,210 | | |
| TOTAL FINANCIALS | | | 724,116 | | |
HEALTH CARE — 7.39%
Pharmaceuticals — 7.39% | |
| Eli Lilly & Company | | | 3,560 | | | | 133,607 | | |
| Johnson & Johnson | | | 2,733 | | | | 181,799 | | |
| Novartis AG — ADR | | | 2,179 | | | | 133,159 | | |
| Pfizer, Inc. | | | 6,369 | | | | 131,201 | | |
| TOTAL HEALTH CARE | | | 579,766 | | |
INDUSTRIALS — 4.74%
Aerospace & Defense — 4.74% | |
| Lockheed Martin Corporation (c) | | | 3,541 | | | | 286,715 | | |
| Northrop Grumman Corporation | | | 1,232 | | | | 85,439 | | |
| TOTAL INDUSTRIALS | | | 372,154 | | |
INFORMATION TECHNOLOGY — 4.28%
IT Services — 1.08% | |
| International Business Machines Corporation | | | 495 | | | | 84,917 | | |
| Software — 3.20% | |
| Microsoft Corporation | | | 9,652 | | | | 250,952 | | |
| TOTAL INFORMATION TECHNOLOGY | | | 335,869 | | |
MATERIALS — 0.49%
Chemicals — 0.49% | |
| RPM International, Inc. | | | 1,678 | | | | 38,628 | | |
| TOTAL MATERIALS | | | 38,628 | | |
The accompanying notes are an integral part of these financial statements.
24
Schedule of Investments — June 30, 2011
Hotchkis and Wiley Capital Income Fund
| | Shares
Held | | Value | |
TELECOMMUNICATION SERVICES — 3.47%
Wireless Telecommunication Services — 3.47% | |
| Vodafone Group PLC — ADR | | | 10,202 | | | $ | 272,597 | | |
| TOTAL TELECOMMUNICATION SERVICES | | | 272,597 | | |
UTILITIES — 8.79%
Electric Utilities — 6.48% | |
| Edison International | | | 3,433 | | | | 133,029 | | |
| Exelon Corporation (c) | | | 6,592 | | | | 282,402 | | |
| PPL Corporation | | | 3,339 | | | | 92,924 | | |
| | | | 508,355 | | |
| Multi-Utilities — 2.31% | |
| Public Service Enterprise Group, Inc. | | | 5,557 | | | | 181,380 | | |
| TOTAL UTILITIES | | | 689,735 | | |
Total common stocks
(Cost $4,366,943) | | | | | 4,508,005 | | |
| PREFERRED STOCKS — 2.31% | |
FINANCIALS — 2.31%
Commercial Banks — 1.19% | |
| Citigroup Capital XIII, 7.875% (a) | | | 595 | | | | 16,529 | | |
| Countrywide Capital V, 7.000% | | | 1,958 | | | | 48,794 | | |
| Zions Bancorporation — Series C, 9.500% | | | 1,065 | | | | 27,839 | | |
| | | | 93,162 | | |
| Consumer Finance — 0.81% | |
Ally Financial, Inc. — Series G,
7.000% (Acquired 12/31/2010 — 03/24/2011,
Cost $28,203) (r) | | | 30 | | | | 28,196 | | |
| GMAC Capital Trust I — Series 2, 8.125% (a) | | | 1,375 | | | | 35,200 | | |
| | | | 63,396 | | |
| Real Estate Investment Trusts — 0.18% | |
Strategic Hotels & Resorts, Inc. — Series A,
8.500% (b) | | | 500 | | | | 14,420 | | |
| Thrifts & Mortgage Finance — 0.13% | |
Federal Home Loan Mortgage
Corporation — Series Z, 8.375% (b) | | | 3,385 | | | | 9,986 | | |
| TOTAL FINANCIALS | | | 180,964 | | |
Total preferred stocks
(Cost $170,354) | | | | | 180,964 | | |
| CONVERTIBLE PREFERRED STOCKS — 2.45% | |
CONSUMER DISCRETIONARY — 0.53%
Auto Components — 0.53% | |
| The Goodyear Tire & Rubber Company, 5.875% | | | 750 | | | | 41,715 | | |
| TOTAL CONSUMER DISCRETIONARY | | | 41,715 | | |
FINANCIALS — 1.43%
Commercial Banks — 0.70% | |
| KeyCorp — Series A, 7.750% | | | 200 | | | | 22,400 | | |
| Wells Fargo & Company, 7.500% | | | 30 | | | | 31,799 | | |
| | | | 54,199 | | |
| | Shares
Held | | Value | |
| Diversified Financial Services — 0.41% | |
| Citigroup, Inc., 7.500% | | | 271 | | | $ | 32,561 | | |
| Insurance — 0.32% | |
Hartford Financial Services
Group, Inc. — Series F, 7.250% | | | 960 | | | | 25,018 | | |
| TOTAL FINANCIALS | | | 111,778 | | |
UTILITIES — 0.49%
Electric Utilities — 0.49% | |
| PPL Corporation, 8.750% | | | 700 | | | | 38,437 | | |
| TOTAL UTILITIES | | | 38,437 | | |
Total convertible preferred stocks
(Cost $189,047) | | | | | 191,930 | | |
| INVESTMENT COMPANIES — 1.63% | |
| Exchange Traded Funds — 1.63% | |
| iShares iBoxx $ High Yield Corporate Bond Fund | | | 1,400 | | | | 127,834 | | |
Total investment companies
(Cost $129,276) | | | | | 127,834 | | |
CONVERTIBLE
BONDS — 0.37% | | Amount | | | |
INDUSTRIALS — 0.37%
Machinery — 0.37% | |
Meritor, Inc.
4.000%, 02/15/2027 | | $ | 30,000 | | | | 28,800 | | |
| TOTAL INDUSTRIALS | | | 28,800 | | |
Total convertible bonds
(Cost $31,911) | | | | | 28,800 | | |
| CORPORATE BONDS — 32.90% | |
CONSUMER DISCRETIONARY — 7.44%
Auto Components — 1.26% | |
Allison Transmission, Inc.
7.125%, 05/15/2019
(Acquired 05/09/2011, Cost $25,344) (r) | | | 25,000 | | | | 24,438 | | |
American Axle & Manufacturing Holdings, Inc.
9.250%, 01/15/2017
(Acquired 12/31/2010, Cost $19,999) (r) | | | 18,000 | | | | 19,710 | | |
Pinafore LLC/Pinafore, Inc.
9.000%, 10/01/2018
(Acquired 12/31/2010 — 06/03/2011,
Cost $32,552) (r) | | | 30,000 | | | | 32,475 | | |
Stoneridge, Inc.
9.500%, 10/15/2017
(Acquired 12/31/2010, Cost $21,619) (r) | | | 20,000 | | | | 22,200 | | |
| | | | 98,823 | | |
| Automobiles — 0.38% | |
Chrysler Group LLC
8.250%, 06/15/2021
(Acquired 05/19/2011 — 06/03/2011,
Cost $29,963) (r) | | | 30,000 | | | | 29,550 | | |
The accompanying notes are an integral part of these financial statements.
25
Schedule of Investments — June 30, 2011
Hotchkis and Wiley Capital Income Fund
| | Amount | | Value | |
| Hotels, Restaurants & Leisure — 1.94% | |
CityCenter Holdings LLC/
CityCenter Finance Corporation
11.500%, 01/15/2017
(Acquired 03/25/2011 — 06/20/2011,
Cost $25,327) (p) (r) | | $ | 25,000 | | | $ | 27,250 | | |
CKE Restaurants, Inc.
11.375%, 07/15/2018 | | | 45,000 | | | | 49,387 | | |
DineEquity, Inc.
9.500%, 10/30/2018
(Acquired 12/31/2010 — 06/03/2011,
Cost $32,257) (r) | | | 30,000 | | | | 32,700 | | |
NCL Corporation Limited
9.500%, 11/15/2018
(Acquired 12/31/2010 — 06/03/2011,
Cost $42,459) (r) | | | 40,000 | | | | 42,800 | | |
| | | | 152,137 | | |
| Household Durables — 0.32% | |
M/I Homes, Inc.
8.625%, 11/15/2018 | | | 25,000 | | | | 24,719 | | |
| Leisure Equipment & Products — 0.71% | |
Harrah's Operating Company, Inc.
10.000%, 12/15/2018 | | | 25,000 | | | | 22,688 | | |
Seven Seas Cruises
9.125%, 05/15/2019
(Acquired 05/13/2011, Cost $32,000) (r) | | | 32,000 | | | | 33,120 | | |
| | | | 55,808 | | |
| Media — 2.50% | |
Bresnan Broadband Holdings LLC
8.000%, 12/15/2018
(Acquired 12/31/2010, Cost $20,700) (r) | | | 20,000 | | | | 20,725 | | |
CCO Holdings LLC/
CCO Holdings Capital Corporation
6.500%, 04/30/2021 | | | 25,000 | | | | 24,781 | | |
Cequel Communications Holdings I LLC/
Cequel Capital Corporation
8.625%, 11/15/2017
(Acquired 12/31/2010 — 06/21/2011,
Cost $36,302) (r) | | | 35,000 | | | | 36,574 | | |
Clear Channel Worldwide
Holdings, Inc. — Series B
9.250%, 12/15/2017 | | | 30,000 | | | | 32,850 | | |
Cumulus Media, Inc.
7.750%, 05/01/2019
(Acquired 05/26/2011, Cost $20,050) (r) | | | 20,000 | | | | 19,400 | | |
Kabel BW Erste Beteiligungs GmbH/Kabel
Baden-Wurttemberg GmbH & Company KG
7.500%, 03/15/2019
(Acquired 03/28/2011 — 04/05/2011,
Cost $30,688) (r) | | | 30,000 | | | | 30,750 | | |
Unitymedia Hessen GmbH & Company/
Unitymedia NRW GmbH
8.125%, 12/01/2017
(Acquired 12/31/2010, Cost $31,500) (r) | | | 30,000 | | | | 32,025 | | |
| | | | 197,105 | | |
| | Amount | | Value | |
| Multiline Retail — 0.33% | |
Dillard's, Inc.
7.130%, 08/01/2018 | | $ | 25,000 | | | $ | 25,625 | | |
| TOTAL CONSUMER DISCRETIONARY | | | 583,767 | | |
CONSUMER STAPLES — 0.86%
Food Products — 0.32% | |
Del Monte Foods Company
7.625%, 02/15/2019
(Acquired 02/01/2011, Cost $25,000) (r) | | | 25,000 | | | | 25,375 | | |
| Household Products — 0.54% | |
FGI Holding Company, Inc.
11.250%, 10/01/2015 (p) | | | 20,587 | | | | 20,767 | | |
FGI Operating Company, Inc.
10.250%, 08/01/2015 | | | 20,000 | | | | 21,350 | | |
| | | | | | 42,117 | | |
| TOTAL CONSUMER STAPLES | | | 67,492 | | |
ENERGY — 3.79%
Energy Equipment & Services — 1.35% | |
McJunkin Red Man Corporation
9.500%, 12/15/2016
(Acquired 12/31/2010, Cost $23,854) (r) | | | 25,000 | | | | 25,563 | | |
Parker Drilling Company
9.125%, 04/01/2018 | | | 35,000 | | | | 37,100 | | |
PHI, Inc.
8.625%, 10/15/2018 | | | 25,000 | | | | 26,250 | | |
Thermon Industries, Inc.
9.500%, 05/01/2017 | | | 16,000 | | | | 17,240 | | |
| | | | 106,153 | | |
| Oil, Gas & Consumable Fuels — 2.44% | |
American Petroleum Tankers LLC/
American Petroleum Tankers Company
10.250%, 05/01/2015 | | | 32,000 | | | | 33,600 | | |
Comstock Resources, Inc.
8.375%, 10/15/2017 | | | 20,000 | | | | 21,100 | | |
| 7.750%, 04/01/2019 | | | 30,000 | | | | 30,263 | | |
Overseas Shipholding Group, Inc.
7.500%, 02/15/2024 | | | 27,000 | | | | 22,815 | | |
PetroQuest Energy LLC
10.000%, 09/01/2017 | | | 30,000 | | | | 31,800 | | |
Stone Energy Corporation
8.625%, 02/01/2017 | | | 50,000 | | | | 51,749 | | |
| | | | | | 191,327 | | |
| TOTAL ENERGY | | | 297,480 | | |
The accompanying notes are an integral part of these financial statements.
26
Schedule of Investments — June 30, 2011
Hotchkis and Wiley Capital Income Fund
| | Amount | | Value | |
FINANCIALS — 4.06%
Commercial Banks — 0.93% | |
CIT Group, Inc.
7.000%, 05/02/2017
(Acquired 12/31/2010 — 03/24/2011,
Cost $50,116) (r) | | $ | 50,000 | | | $ | 50,000 | | |
TransUnion LLC/TransUnion
Financing Corporation
11.375%, 06/15/2018 | | | 20,000 | | | | 22,700 | | |
| | | | 72,700 | | |
| Consumer Finance — 1.42% | |
Ally Financial, Inc.
7.250%, 09/15/2017 | | | 20,000 | | | | 20,034 | | |
Credit Acceptance Corporation
9.125%, 02/01/2017
(Acquired 04/04/2011, Cost $26,967) (r) | | | 25,000 | | | | 26,813 | | |
SLM Corporation — Series A
8.450%, 06/15/2018 | | | 30,000 | | | | 32,971 | | |
Springleaf Finance Corporation
6.900%, 12/15/2017 | | | 35,000 | | | | 32,288 | | |
| | | | 112,106 | | |
| Diversified Financial Services — 0.42% | |
PHH Corporation
9.250%, 03/01/2016 | | | 30,000 | | | | 32,963 | | |
| Insurance — 0.96% | |
American International Group, Inc.
8.175%, 05/15/2058 (a) | | | 25,000 | | | | 27,409 | | |
CNO Financial Group, Inc.
9.000%, 01/15/2018
(Acquired 12/31/2010 — 05/17/2011,
Cost $47,852) (r) | | | 45,000 | | | | 47,925 | | |
| | | | 75,334 | | |
| Investments & Miscellaneous Financial Services — 0.33% | |
Constellation Enterprises LLC
10.625%, 02/01/2016
(Acquired 01/20/2011 — 01/21/2011,
Cost $24,802) (i) (r) | | | 25,000 | | | | 25,656 | | |
| TOTAL FINANCIALS | | | 318,759 | | |
| | Amount | | Value | |
HEALTH CARE — 3.95%
Health Care Providers & Services — 2.05% | |
AMGH Merger Sub, Inc.
9.250%, 11/01/2018
(Acquired 12/31/2010 — 06/03/2011,
Cost $26,458) (r) | | $ | 25,000 | | | $ | 26,500 | | |
Capella Healthcare, Inc.
9.250%, 07/01/2017
(Acquired 12/31/2010 — 06/03/2011,
Cost $37,476) (r) | | | 35,000 | | | | 37,100 | | |
CDRT Merger Sub, Inc.
8.125%, 06/01/2019
(Acquired 05/13/2011 — 06/03/2011,
Cost $35,188) (r) | | | 35,000 | | | | 35,088 | | |
CHS/Community Health Systems, Inc.
8.875%, 07/15/2015 | | | 40,000 | | | | 41,300 | | |
Surgical Care Affiliates, Inc.
10.000%, 07/15/2017
(Acquired 12/31/2010, Cost $20,400) (r) | | | 20,000 | | | | 20,750 | | |
| | | | 160,738 | | |
| Health Care Technology — 0.98% | |
Giant Funding Corporation
8.250%, 02/01/2018
(Acquired 01/13/2011 — 06/03/2011,
Cost $31,388) (r) | | | 30,000 | | | | 31,425 | | |
MedAssets, Inc.
8.000%, 11/15/2018
(Acquired 12/31/2010, Cost $20,200) (r) | | | 20,000 | | | | 19,900 | | |
STHI Holding Corporation
8.000%, 03/15/2018
(Acquired 03/11/2011 — 03/24/2011,
Cost $25,764) (r) | | | 25,000 | | | | 25,500 | | |
| | | | 76,825 | | |
| Pharmaceuticals — 0.92% | |
ConvaTec Healthcare E SA
10.500%, 12/15/2018
(Acquired 12/31/2010 — 06/28/2011,
Cost $41,075) (r) | | | 40,000 | | | | 41,600 | | |
Endo Pharmaceuticals Holdings, Inc.
7.250%, 01/15/2022
(Acquired 06/03/2011 — 06/15/2011,
Cost $30,100) (r) | | | 30,000 | | | | 30,600 | | |
| | | | | | 72,200 | | |
| TOTAL HEALTH CARE | | | 309,763 | | |
The accompanying notes are an integral part of these financial statements.
27
Schedule of Investments — June 30, 2011
Hotchkis and Wiley Capital Income Fund
| | Amount | | Value | |
INDUSTRIALS — 4.60%
Airlines — 1.53% | |
America West Airlines
Pass Through Trust — Series 2001-1
7.100%, 04/02/2021 | | $ | 20,908 | | | $ | 20,751 | | |
American Airlines, Inc.
7.500%, 03/15/2016
(Acquired 03/09/2011 — 06/02/2011,
Cost $34,856) (r) | | | 35,000 | | | | 34,475 | | |
Continental Airlines, Inc.
Pass Through Trust — Series 2003-ERJ1
7.875%, 07/02/2018 | | | 37,937 | | | | 37,842 | | |
Delta Air Lines, Inc.
Pass Through Trust — Class B — Series 2007-1
8.021%, 08/10/2022 | | | 26,797 | | | | 27,231 | | |
| | | | 120,299 | | |
| Building Products — 0.45% | |
Roofing Supply Group LLC/
Roofing Supply Finance, Inc.
8.625%, 12/01/2017
(Acquired 12/31/2010 — 06/03/2011,
Cost $36,175) (r) | | | 35,000 | | | | 35,131 | | |
| Commercial Services & Supplies — 1.33% | |
International Lease Finance Corporation
8.250%, 12/15/2020 | | | 50,000 | | | | 54,125 | | |
RSC Equipment Rental, Inc./RSC Holdings III LLC
8.250%, 02/01/2021 | | | 30,000 | | | | 30,000 | | |
United Rentals North America, Inc.
8.375%, 09/15/2020 | | | 20,000 | | | | 20,350 | | |
| | | | 104,475 | | |
| Machinery — 0.96% | |
Accuride Corporation
9.500%, 08/01/2018 | | | 20,000 | | | | 21,500 | | |
Altra Holdings, Inc.
8.125%, 12/01/2016 | | | 20,000 | | | | 21,700 | | |
The Manitowoc Company, Inc.
8.500%, 11/01/2020 | | | 30,000 | | | | 32,175 | | |
| | | | 75,375 | | |
| Road & Rail — 0.33% | |
Florida East Coast Railway Corporation
8.125%, 02/01/2017
(Acquired 02/09/2011 — 04/06/2011,
Cost $26,070) (r) | | | 25,000 | | | | 25,938 | | |
| TOTAL INDUSTRIALS | | | 361,218 | | |
| | Amount | | Value | |
INFORMATION TECHNOLOGY — 1.12%
Communications Equipment — 0.31% | |
CDW Escrow Corporation
8.500%, 04/01/2019
(Acquired 03/29/2011, Cost $25,000) (r) | | $ | 25,000 | | | $ | 24,625 | | |
| Electronic Equipment, Instruments & Components — 0.60% | |
Freescale Semiconductor, Inc.
9.250%, 04/15/2018
(Acquired 12/31/2010, Cost $21,942) (r) | | | 20,000 | | | | 21,650 | | |
8.050%, 02/01/2020
(Acquired 06/07/2010, Cost $24,504) (r) | | | 25,000 | | | | 25,250 | | |
| | | | 46,900 | | |
| Software — 0.21% | |
First Data Corporation
8.875%, 08/15/2020
(Acquired 12/31/2010, Cost $15,881) (r) | | | 15,000 | | | | 16,088 | | |
| TOTAL INFORMATION TECHNOLOGY | | | 87,613 | | |
MATERIALS — 4.41%
Chemicals — 1.17% | |
Georgia Gulf Corporation
9.000%, 01/15/2017
(Acquired 12/31/2010, Cost $21,666) (r) | | | 20,000 | | | | 21,400 | | |
Hexion U.S. Finance Corporation/
Hexion Nova Scotia Finance ULC
8.875%, 02/01/2018 | | | 20,000 | | | | 20,900 | | |
Momentive Performance Materials, Inc.
9.000%, 01/15/2021 | | | 20,000 | | | | 20,500 | | |
Omnova Solutions, Inc.
7.875%, 11/01/2018
(Acquired 05/31/2011 — 06/27/2011,
Cost $30,025) (r) | | | 30,000 | | | | 28,988 | | |
| | | | 91,788 | | |
| Containers & Packaging — 0.78% | |
BWAY Holding Company
10.000%, 06/15/2018 | | | 30,000 | | | | 32,888 | | |
Solo Cup Company
8.500%, 02/15/2014 | | | 30,000 | | | | 28,125 | | |
| | | | 61,013 | | |
| Metals & Mining — 0.74% | |
Atkore International, Inc.
9.875%, 01/01/2018
(Acquired 12/31/2010 — 06/03/2011,
Cost $36,974) (r) | | | 35,000 | | | | 36,925 | | |
Rain CII Carbon LLC/CII Carbon Corporation
8.000%, 12/01/2018
(Acquired 12/31/2010, Cost $20,600) (r) | | | 20,000 | | | | 21,400 | | |
| | | | 58,325 | | |
The accompanying notes are an integral part of these financial statements.
28
Schedule of Investments — June 30, 2011
Hotchkis and Wiley Capital Income Fund
| | Amount | | Value | |
| Paper & Forest Products — 1.72% | |
Ainsworth Lumber Company Limited
11.000%, 07/29/2015
(Acquired 12/31/2010 — 06/21/2011,
Cost $39,984) (p) (r) | | $ | 41,000 | | | $ | 38,129 | | |
Georgia-Pacific LLC
7.750%, 11/15/2029 | | | 25,000 | | | | 28,851 | | |
Longview Fibre Paper & Packaging
8.000%, 06/01/2016
(Acquired 05/17/2011, Cost $36,318) (r) | | | 36,000 | | | | 36,360 | | |
Verso Paper Holdings LLC/Verso Paper, Inc.
8.750%, 02/01/2019
(Acquired 02/02/2011 — 06/28/2011,
Cost $34,871) (r) | | | 35,000 | | | | 31,325 | | |
| | | | | | 134,665 | | |
| TOTAL MATERIALS | | | 345,791 | | |
TELECOMMUNICATION SERVICES — 0.27%
Wireless Telecommunication Services — 0.27% | |
Clearwire Communication LLC/
Clearwire Finance, Inc.
12.000%, 12/01/2015
(Acquired 12/31/2010, Cost $21,583) (r) | | | 20,000 | | | | 21,450 | | |
| TOTAL TELECOMMUNICATION SERVICES | | | 21,450 | | |
UTILITIES — 2.40%
Electric Utilities — 1.04% | |
GenOn Energy, Inc.
9.500%, 10/15/2018 | | | 30,000 | | | | 31,349 | | |
NRG Energy, Inc.
7.875%, 05/15/2021
(Acquired 05/10/2011, Cost $25,000) (r) | | | 25,000 | | | | 25,000 | | |
Texas Competitive Electric Holdings Company LLC
11.500%, 10/01/2020
(Acquired 04/18/2011, Cost $25,063) (r) | | | 25,000 | | | | 24,688 | | |
| | | | 81,037 | | |
| Independent Power Producers & Energy Traders — 0.91% | |
Calpine Corporation
7.875%, 07/31/2020
(Acquired 12/31/2010 — 01/05/2011,
Cost $30,675) (r) | | | 30,000 | | | | 31,500 | | |
Edison Mission Energy
7.000%, 05/15/2017 | | | 30,000 | | | | 24,450 | | |
Mirant Americas Generation LLC
8.500%, 10/01/2021 | | | 15,000 | | | | 15,450 | | |
| | | | 71,400 | | |
| Multi-Utilities — 0.45% | |
Energy Future Intermediate
Holding Company LLC
9.750%, 10/15/2019 | | | 35,000 | | | | 35,559 | | |
| TOTAL UTILITIES | | | 187,996 | | |
Total corporate bonds
(Cost $2,576,039) | | | | | 2,581,329 | | |
WARRANTS — 0.11% | | Shares
Held | | Value | |
| Automobiles — 0.11% | |
General Motors Company
Expiration: July 2016
Exercise Price: $10.00 (b) | | | 406 | | | $ | 8,688 | | |
Total warrants
(Cost $11,639) | | | 8,688 | | |
Total investments — 97.21%
(Cost $7,475,209) | | | 7,627,550 | | |
| Time deposit* — 1.91% | | | | | 150,061 | | |
| Other assets in excess of liabilities — 0.88% | | | | | 69,105 | | |
| Net assets — 100.00% | | $ | 7,846,716 | | |
(a) — The coupon rate shown on variable rate securities represents the rate at June 30, 2011.
(b) — Non-income producing security.
(c) — All or a portion of this security is segregated as collateral for delayed delivery securities.
(i) — Illiquid security
(p) — Payment in-kind security.
(r) — Restricted security under Rule 144A of the Securities Act of 1933. Purchased in a private placement transaction; resale to the public may require registration or be limited to qualified institutional buyers. The total market value of these securities was $1,402,030, representing 17.87% of net assets.
ADR — American Depositary Receipt
* — Time deposit with HSBC Bank bears interest at 0.03% and matures on 7/1/2011. Invested through a cash management account administered by Brown Brothers Harriman & Co.
The accompanying notes are an integral part of these financial statements.
29
Schedule of Investments — June 30, 2011
Hotchkis and Wiley High Yield Fund

| Largest Issuers | | Percent of
net assets | |
| Ally Financial, Inc. | | | 2.67 | % | |
| International Lease Finance Corporation | | | 1.60 | % | |
| CIT Group, Inc. | | | 1.60 | % | |
| CNO Financial Group, Inc. | | | 1.52 | % | |
| Stone Energy Corporation | | | 1.51 | % | |
| CKE Restaurants, Inc. | | | 1.40 | % | |
| PetroQuest Energy LLC | | | 1.35 | % | |
| Comstock Resources, Inc. | | | 1.35 | % | |
| Zions Bancorporation | | | 1.35 | % | |
| Strategic Hotels & Resorts, Inc. | | | 1.32 | % | |
CORPORATE
BONDS — 81.20% | | Amount | | Value | |
| Airlines — 4.54% | |
America West Airlines
Pass Through Trust — Series 2001-1
7.100%, 04/02/2021 | | $ | 2,188,756 | | | $ | 2,172,340 | | |
American Airlines, Inc.
7.500%, 03/15/2016
(Acquired 03/09/2011 — 03/15/2011,
Cost $2,467,671) (r) | | | 2,480,000 | | | | 2,442,800 | | |
Continental Airlines, Inc.
Pass Through Trust — Series 2003-ERJ1
7.875%, 07/02/2018 | | | 1,718,837 | | | | 1,714,540 | | |
Delta Air Lines, Inc.
Pass Through Trust — Class B — Series 2007-1
8.021%, 08/10/2022 | | | 2,054,950 | | | | 2,088,240 | | |
United Air Lines, Inc.
Pass Through Trust — Class B — Series 2007-1
7.336%, 07/02/2019
(Acquired 06/23/2010 — 05/03/2011,
Cost $2,489,900) (e) (i) | | | 2,619,590 | | | | 2,511,401 | | |
| | | | 10,929,321 | | |
| Auto Loans — 1.10% | |
Credit Acceptance Corporation
9.125%, 02/01/2017
(Acquired 02/28/2011 — 04/04/2011,
Cost $2,649,718) (r) | | | 2,475,000 | | | | 2,654,438 | | |
| | Amount | | Value | |
| Auto Parts & Equipment — 3.63% | |
Accuride Corporation
9.500%, 08/01/2018 | | $ | 480,000 | | | $ | 516,000 | | |
Affinia Group, Inc.
10.750%, 08/15/2016
(Acquired 08/06/2009 — 02/09/2011,
Cost $1,856,326) (r) | | | 1,728,000 | | | | 1,935,360 | | |
Allison Transmission, Inc.
7.125%, 05/15/2019
(Acquired 04/27/2011 — 05/09/2011,
Cost $1,991,531) (r) | | | 1,975,000 | | | | 1,930,563 | | |
American Axle & Manufacturing Holdings, Inc.
9.250%, 01/15/2017
(Acquired 12/10/2009 — 05/03/2010,
Cost $969,076) (r) | | | 950,000 | | | | 1,040,250 | | |
Pinafore LLC/Pinafore, Inc.
9.000%, 10/01/2018
(Acquired 09/21/2010 — 01/12/2011,
Cost $2,189,323) (r) | | | 2,080,000 | | | | 2,251,600 | | |
Stoneridge, Inc.
9.500%, 10/15/2017
(Acquired 09/24/2010 — 01/04/2011,
Cost $1,030,103) (r) | | | 1,005,000 | | | | 1,115,550 | | |
| | | | 8,789,323 | | |
| Automakers — 0.98% | |
Chrysler Group LLC
8.250%, 06/15/2021
(Acquired 05/19/2011 — 06/13/2011,
Cost $2,415,346) (r) | | | 2,410,000 | | | | 2,373,850 | | |
| Banking — 0.59% | |
Ally Financial, Inc.
7.250%, 09/15/2017 | | | 1,431,000 | | | | 1,433,443 | | |
| Building & Construction — 1.13% | |
M/I Homes, Inc.
8.625%, 11/15/2018 | | | 2,730,000 | | | | 2,699,287 | | |
The accompanying notes are an integral part of these financial statements.
30
Schedule of Investments — June 30, 2011
Hotchkis and Wiley High Yield Fund
| | Amount | | Value | |
| Building Materials — 1.13% | |
Roofing Supply Group LLC/
Roofing Supply Finance, Inc.
8.625%, 12/01/2017
(Acquired 11/08/2010 — 01/12/2011,
Cost $2,813,306) (r) | | $ | 2,725,000 | | | $ | 2,735,219 | | |
| Chemicals — 2.58% | |
Georgia Gulf Corporation
9.000%, 01/15/2017
(Acquired 12/11/2009 — 08/13/2010,
Cost $1,300,598) (r) | | | 1,269,000 | | | | 1,357,830 | | |
Hexion U.S. Finance Corporation/
Hexion Nova Scotia Finance ULC
8.875%, 02/01/2018 | | | 1,480,000 | | | | 1,546,600 | | |
Momentive Performance Materials, Inc.
9.000%, 01/15/2021 | | | 1,230,000 | | | | 1,260,750 | | |
Omnova Solutions, Inc.
7.875%, 11/01/2018
(Acquired 05/31/2011 — 06/27/2011,
Cost $2,150,042) (r) | | | 2,125,000 | | | | 2,053,281 | | |
| | | | 6,218,461 | | |
| Consumer — Products — 1.14% | |
FGI Holding Company, Inc.
11.250%, 10/01/2015 (p) | | | 1,265,782 | | | | 1,276,858 | | |
FGI Operating Company, Inc.
10.250%, 08/01/2015 | | | 1,380,000 | | | | 1,473,150 | | |
| | | | 2,750,008 | | |
| Consumer/Commercial/Lease Financing — 5.46% | |
CIT Group, Inc.
7.000%, 05/01/2017 | | | 405 | | | | 404 | | |
7.000%, 05/02/2017
(Acquired 12/10/2009 — 03/24/2011,
Cost $3,768,005) (r) | | | 3,848,000 | | | | 3,848,000 | | |
International Lease Finance Corporation
8.250%, 12/15/2020 (c) | | | 3,570,000 | | | | 3,864,525 | | |
SLM Corporation — Series A
8.450%, 06/15/2018 (c) | | | 1,570,000 | | | | 1,725,537 | | |
Springleaf Finance Corporation
6.900%, 12/15/2017 | | | 2,525,000 | | | | 2,329,312 | | |
TransUnion LLC/
TransUnion Financing Corporation
11.375%, 06/15/2018 | | | 1,230,000 | | | | 1,396,050 | | |
| | | | 13,163,828 | | |
| Department Stores — 0.88% | |
Dillard's, Inc.
7.130%, 08/01/2018 | | | 2,070,000 | | | | 2,121,750 | | |
| Diversified Capital Goods — 0.52% | |
FCC Holdings, Inc.
12.000%, 12/15/2015
(Acquired 01/03/2011, Cost $1,253,125) (i) (r) | | | 1,250,000 | | | | 1,262,500 | | |
| | Amount | | Value | |
| Electric — Generation — 5.60% | |
Calpine Corporation
7.875%, 07/31/2020
(Acquired 06/15/2011 — 06/29/2011,
Cost $2,056,250) (r) | | $ | 2,000,000 | | | $ | 2,100,000 | | |
Edison Mission Energy
7.000%, 05/15/2017 (c) | | | 2,425,000 | | | | 1,976,375 | | |
Energy Future Holdings Corporation
9.750%, 10/15/2019 | | | 2,113,000 | | | | 2,146,729 | | |
Energy Future Intermediate
Holding Company LLC
9.750%, 10/15/2019 | | | 1,057,000 | | | | 1,073,873 | | |
GenOn Energy, Inc.
9.500%, 10/15/2018 | | | 1,720,000 | | | | 1,797,400 | | |
Mirant Americas Generation LLC
8.500%, 10/01/2021 | | | 1,058,000 | | | | 1,089,740 | | |
NRG Energy, Inc.
7.875%, 05/15/2021
(Acquired 05/10/2011 — 06/21/2011,
Cost $1,868,750) (r) | | | 1,875,000 | | | | 1,875,000 | | |
Texas Competitive Electric
Holdings Company LLC
11.500%, 10/01/2020
(Acquired 04/14/2011 — 04/18/2011,
Cost $1,473,913) (r) | | | 1,475,000 | | | | 1,456,563 | | |
| | | | 13,515,680 | | |
| Electronics — 1.00% | |
Freescale Semiconductor, Inc.
9.250%, 04/15/2018
(Acquired 04/20/2010 — 08/24/2010,
Cost $1,445,725) (r) | | | 1,410,000 | | | | 1,526,325 | | |
8.050%, 02/01/2020
(Acquired 06/07/2011 — 06/09/2011,
Cost $855,772) (r) | | | 875,000 | | | | 883,750 | | |
| | | | 2,410,075 | | |
| Energy — Exploration & Production — 4.21% | |
Comstock Resources, Inc.
8.375%, 10/15/2017 | | | 1,470,000 | | | | 1,550,850 | | |
| 7.750%, 04/01/2019 | | | 1,680,000 | | | | 1,694,700 | | |
PetroQuest Energy LLC
10.000%, 09/01/2017 | | | 3,080,000 | | | | 3,264,800 | | |
Stone Energy Corporation
8.625%, 02/01/2017 | | | 3,517,000 | | | | 3,640,095 | | |
| | | | 10,150,445 | | |
| Food — Wholesale — 0.83% | |
Del Monte Foods Company
7.625%, 02/15/2019
(Acquired 02/01/2011 — 03/07/2011,
Cost $2,004,375) (r) | | | 1,975,000 | | | | 2,004,625 | | |
The accompanying notes are an integral part of these financial statements.
31
Schedule of Investments — June 30, 2011
Hotchkis and Wiley High Yield Fund
| | Amount | | Value | |
| Forestry/Paper — 3.51% | |
Ainsworth Lumber Company Limited
11.000%, 07/29/2015
(Acquired 02/22/2010 — 06/21/2011,
Cost $2,865,313) (p) (r) | | $ | 2,914,203 | | | $ | 2,710,209 | | |
Georgia-Pacific LLC
7.750%, 11/15/2029 | | | 350,000 | | | | 403,913 | | |
Longview Fibre Paper & Packaging, Inc.
8.000%, 06/01/2016
(Acquired 05/17/2011 — 06/13/2011,
Cost $2,715,545) (r) | | | 2,680,000 | | | | 2,706,800 | | |
Verso Paper Holdings LLC/Verso Paper, Inc.
8.750%, 02/01/2019
(Acquired 01/11/2011 — 06/28/2011,
Cost $2,958,593) (r) | | | 2,950,000 | | | | 2,640,250 | | |
| | | | 8,461,172 | | |
| Gaming — 1.54% | |
CityCenter Holdings LLC/
CityCenter Finance Corporation
11.500%, 01/15/2017
(Acquired 01/13/2011 — 06/20/2011,
Cost $1,573,922) (p) (r) | | | 1,500,000 | | | | 1,635,000 | | |
Harrah's Operating Company, Inc.
10.000%, 12/15/2018 | | | 2,285,000 | | | | 2,073,638 | | |
| | | | 3,708,638 | | |
| Health Facilities — 3.09% | |
Capella Healthcare, Inc.
9.250%, 07/01/2017
(Acquired 06/21/2010 — 03/07/2011,
Cost $2,553,613) (r) | | | 2,435,000 | | | | 2,581,100 | | |
CHS/Community Health Systems, Inc.
8.875%, 07/15/2015 | | | 2,910,000 | | | | 3,004,575 | | |
Surgical Care Affiliates, Inc.
10.000%, 07/15/2017
(Acquired 12/15/2009 — 02/08/2011,
Cost $1,799,748) (r) | | | 1,790,000 | | | | 1,857,125 | | |
| | | | 7,442,800 | | |
| Health Services — 2.51% | |
AMGH Merger Sub, Inc.
9.250%, 11/01/2018
(Acquired 10/15/2010 — 03/08/2011,
Cost $2,136,655) (r) | | | 2,055,000 | | | | 2,178,300 | | |
CDRT Merger Sub, Inc.
8.125%, 06/01/2019
(Acquired 05/13/2011 — 06/27/2011,
Cost $1,876,750) (r) | | | 1,880,000 | | | | 1,884,700 | | |
STHI Holding Corporation
8.000%, 03/15/2018
(Acquired 03/11/2011 — 04/04/2011,
Cost $2,012,318) (r) | | | 1,955,000 | | | | 1,994,100 | | |
| | | | 6,057,100 | | |
| | Amount | | Value | |
| Investments & Miscellaneous Financial Services — 1.06% | |
Constellation Enterprises LLC
10.625%, 02/01/2016
(Acquired 01/20/2011 — 02/23/2011,
Cost $2,500,083) (i) (r) | | $ | 2,500,000 | | | $ | 2,565,625 | | |
| Leisure — 2.12% | |
NCL Corporation Limited
9.500%, 11/15/2018
(Acquired 11/04/2010 — 05/19/2011,
Cost $2,939,130) (r) | | | 2,770,000 | | | | 2,963,899 | | |
Seven Seas Cruises
9.125%, 05/15/2019
(Acquired 05/13/2011 — 05/17/2011,
Cost $2,133,625) (r) | | | 2,068,000 | | | | 2,140,380 | | |
| | | | 5,104,279 | | |
| Life Insurance — 1.52% | |
CNO Financial Group, Inc.
9.000%, 01/15/2018
(Acquired 12/14/2010 — 05/17/2011,
Cost $3,555,894) (r) | | | 3,445,000 | | | | 3,668,925 | | |
| Machinery — 1.54% | |
Altra Holdings, Inc.
8.125%, 12/01/2016 | | | 1,460,000 | | | | 1,584,100 | | |
The Manitowoc Company, Inc.
8.500%, 11/01/2020 | | | 1,980,000 | | | | 2,123,550 | | |
| | | | 3,707,650 | | |
| Media — Broadcast — 0.81% | |
Crown Media Holdings, Inc.
10.500%, 07/15/2019
(Acquired 06/29/2011, Cost $250,000) (d) (r) | | | 250,000 | | | | 258,750 | | |
Cumulus Media, Inc.
7.750%, 05/01/2019
(Acquired 04/29/2011 — 06/22/2011,
Cost $1,758,136) (r) | | | 1,750,000 | | | | 1,697,500 | | |
| | | | 1,956,250 | | |
The accompanying notes are an integral part of these financial statements.
32
Schedule of Investments — June 30, 2011
Hotchkis and Wiley High Yield Fund
| | Amount | | Value | |
| Media — Cable — 4.38% | |
Bresnan Broadband Holdings LLC
8.000%, 12/15/2018
(Acquired 12/01/2010 — 02/22/2011,
Cost $1,791,613) (r) | | $ | 1,730,000 | | | $ | 1,792,713 | | |
CCO Holdings LLC/
CCO Holdings Capital Corporation
6.500%, 04/30/2021 (c) | | | 2,455,000 | | | | 2,433,519 | | |
Cequel Communications Holdings I LLC/
Cequel Capital Corporation
8.625%, 11/15/2017
(Acquired 10/30/2009 — 06/21/2011,
Cost $2,319,512) (r) | | | 2,315,000 | | | | 2,419,175 | | |
Kabel BW Erste Beteiligungs GmbH/Kabel
Baden-Wurttemberg GmbH & Company KG
7.500%, 03/15/2019
(Acquired 03/23/2011 — 04/05/2011,
Cost $1,529,725) (r) | | | 1,500,000 | | | | 1,537,500 | | |
Unitymedia Hessen GmbH & Company/
Unitymedia NRW GmbH
8.125%, 12/01/2017
(Acquired 11/17/2009 — 11/02/2010,
Cost $2,304,490) (r) | | | 2,220,000 | | | | 2,369,850 | | |
| | | | 10,552,757 | | |
| Media — Services — 0.89% | |
Clear Channel Worldwide
Holdings, Inc. — Series B
9.250%, 12/15/2017 (c) | | | 1,960,000 | | | | 2,146,200 | | |
| Medical Products — 0.93% | |
Giant Funding Corporation
8.250%, 02/01/2018
(Acquired 01/12/2011 — 01/13/2011,
Cost $2,193,125) (r) | | | 2,150,000 | | | | 2,252,125 | | |
| Metals/Mining Excluding Steel — 0.55% | |
Rain CII Carbon LLC/CII Carbon Corporation
8.000%, 12/01/2018
(Acquired 11/23/2010, Cost $1,230,000) (r) | | | 1,230,000 | | | | 1,316,100 | | |
| Multi-Line Insurance — 1.06% | |
American International Group, Inc.
8.175%, 05/15/2058 (a) | | | 2,325,000 | | | | 2,549,014 | | |
| Oil Field Equipment & Services — 4.96% | |
American Petroleum Tankers LLC/
American Petroleum Tankers Company
10.250%, 05/01/2015 | | | 2,296,000 | | | | 2,410,800 | | |
McJunkin Red Man Corporation
9.500%, 12/15/2016
(Acquired 12/16/2009 — 04/20/2011,
Cost $2,232,027) (r) | | | 2,250,000 | | | | 2,300,625 | | |
Parker Drilling Company
9.125%, 04/01/2018 | | | 2,455,000 | | | | 2,602,300 | | |
PHI, Inc.
8.625%, 10/15/2018 | | | 2,275,000 | | | | 2,388,750 | | |
Thermon Industries, Inc.
9.500%, 05/01/2017 | | | 2,098,000 | | | | 2,260,595 | | |
| | | | 11,963,070 | | |
| | Amount | | Value | |
| Packaging — 1.77% | |
BWAY Holding Company
10.000%, 06/15/2018 | | $ | 1,970,000 | | | $ | 2,159,613 | | |
Solo Cup Company
8.500%, 02/15/2014 | | | 2,250,000 | | | | 2,109,375 | | |
| | | | 4,268,988 | | |
| Pharmaceuticals — 1.93% | |
ConvaTec Healthcare E SA
10.500%, 12/15/2018
(Acquired 12/28/2010 — 06/28/2011,
Cost $3,047,183) (r) | | | 2,910,000 | | | | 3,026,399 | | |
Endo Pharmaceuticals Holdings, Inc.
7.250%, 01/15/2022
(Acquired 06/06/2011 — 06/27/2011,
Cost $1,615,375) (r) | | | 1,600,000 | | | | 1,632,000 | | |
| | | | 4,658,399 | | |
| Railroads — 1.01% | |
Florida East Coast Railway Corporation
8.125%, 02/01/2017
(Acquired 01/19/2011 — 04/06/2011,
Cost $2,417,618) (r) | | | 2,345,000 | | | | 2,432,938 | | |
| Restaurants — 2.45% | |
CKE Restaurants, Inc.
11.375%, 07/15/2018 | | | 3,075,000 | | | | 3,374,813 | | |
DineEquity, Inc.
9.500%, 10/30/2018
(Acquired 12/01/2010 — 01/21/2011,
Cost $2,477,773) (r) | | | 2,330,000 | | | | 2,539,700 | | |
| | | | 5,914,513 | | |
| Software/Services — 1.54% | |
First Data Corporation
10.550%, 09/24/2015 (p) | | | 1,052,750 | | | | 1,097,492 | | |
8.875%, 08/15/2020
(Acquired 08/11/2010 — 11/01/2010,
Cost $1,045,833) (r) | | | 1,025,000 | | | | 1,099,312 | | |
MedAssets, Inc.
8.000%, 11/15/2018
(Acquired 11/09/2010 — 11/16/2010,
Cost $1,551,488) (r) | | | 1,520,000 | | | | 1,512,400 | | |
| | | | 3,709,204 | | |
| Specialty Retail — 0.08% | |
DirectBuy Holdings, Inc.
12.000%, 02/01/2017
(Acquired 01/21/2011, Cost $486,824) (r) | | | 500,000 | | | | 197,500 | | |
| Steel Producers/Products — 1.21% | |
Atkore International, Inc.
9.875%, 01/01/2018
(Acquired 12/15/2010 — 03/03/2011,
Cost $2,876,217) (r) | | | 2,755,000 | | | | 2,906,525 | | |
The accompanying notes are an integral part of these financial statements.
33
Schedule of Investments — June 30, 2011
Hotchkis and Wiley High Yield Fund
| | Amount | | Value | |
| Support — Services — 2.63% | |
PHH Corporation
9.250%, 03/01/2016 | | $ | 1,883,000 | | | $ | 2,068,946 | | |
RSC Equipment Rental, Inc./
RSC Holdings III LLC
8.250%, 02/01/2021 | | | 2,140,000 | | | | 2,140,000 | | |
United Rentals North America, Inc.
8.375%, 09/15/2020 | | | 2,085,000 | | | | 2,121,488 | | |
| | | | 6,330,434 | | |
| Telecom — Wireless — 1.01% | |
Clearwire Communication LLC/
Clearwire Finance, Inc.
12.000%, 12/01/2015
(Acquired 09/21/2010 — 03/15/2011,
Cost $1,848,063) (r) | | | 1,730,000 | | | | 1,855,425 | | |
Wind Acquisition Holdings Finance SA
12.250%, 07/15/2017
(Acquired 01/05/2011,
Cost $560,384) (p) (r) | | | 500,000 | | | | 578,750 | | |
| | | | 2,434,175 | | |
| Telecommunications Equipment — 0.93% | |
CDW Escrow Corporation
8.500%, 04/01/2019
(Acquired 03/29/2011,
Cost $1,175,000) (r) | | | 1,175,000 | | | | 1,157,375 | | |
CDW LLC/CDW Finance Corporation
11.500%, 10/12/2015 (p) | | | 12,999 | | | | 13,779 | | |
| 12.535%, 10/12/2017 | | | 1,000,000 | | | | 1,082,500 | | |
| | | | 2,253,654 | | |
| Transportation Excluding Air/Rail — 0.85% | |
Overseas Shipholding Group, Inc.
7.500%, 02/15/2024 | | | 2,432,000 | | | | 2,055,040 | | |
Total corporate bonds
(cost $192,697,851) | | | | | 195,825,328 | | |
| CONVERTIBLE BONDS — 0.93% | |
| Auto Parts & Equipment — 0.93% | |
Meritor, Inc.
4.000%, 02/15/2027 | | | 2,330,000 | | | | 2,236,800 | | |
Total convertible bonds
(cost $2,205,555) | | | | | 2,236,800 | | |
CONVERTIBLE PREFERRED
STOCKS — 4.30% | | Shares
Held | | Value | |
| Auto Parts & Equipment — 0.54% | |
| The Goodyear Tire & Rubber Company, 5.875% | | | 23,300 | | | $ | 1,295,946 | | |
| Banking — 2.00% | |
| Citigroup, Inc., 7.500% | | | 23,546 | | | | 2,829,052 | | |
| KeyCorp — Series A, 7.750% | | | 17,800 | | | | 1,993,600 | | |
| | | | 4,822,652 | | |
| Electric — Integrated — 0.94% | |
| PPL Corporation, 8.750% | | | 41,500 | | | | 2,278,765 | | |
| Multi-Line Insurance — 0.82% | |
Hartford Financial Services
Group, Inc. — Series F, 7.250% | | | 75,440 | | | | 1,965,966 | | |
Total convertible preferred stocks
(Cost $10,095,112) | | | | | 10,363,329 | | |
| PREFERRED STOCKS — 6.88% | |
| Banking — 4.62% | |
Ally Financial, Inc. — Series G, 7.000%
(Acquired 10/22/2010 — 03/24/2011,
Cost $2,363,725) (r) | | | 2,570 | | | | 2,415,479 | | |
| Citigroup Capital XIII, 7.875% (a) | | | 49,405 | | | | 1,372,471 | | |
| Countrywide Capital V, 7.000% | | | 62,098 | | | | 1,547,482 | | |
| GMAC Capital Trust I — Series 2, 8.125% (a) | | | 101,125 | | | | 2,588,800 | | |
| Zions Bancorporation — Series C, 9.500% | | | 124,135 | | | | 3,244,888 | | |
| | | | 11,169,120 | | |
| Gaming — 0.59% | |
| Las Vegas Sands Corporation — Series A, 10.000% | | | 12,500 | | | | 1,413,673 | | |
| Hotels — 1.32% | |
| Strategic Hotels & Resorts, Inc. — Series A, 8.500% (b) | | | 46,900 | | | | 1,352,596 | | |
| Strategic Hotels & Resorts, Inc. — Series C, 8.250% (b) | | | 64,700 | | | | 1,829,716 | | |
| | | | 3,182,312 | | |
| Investments & Miscellaneous Financial Services — 0.35% | |
Federal Home Loan Mortgage
Corporation — Series Z, 8.375% (b) | | | 282,538 | | | | 833,487 | | |
Total preferred stocks
(Cost $14,966,436) | | | | | 16,598,592 | | |
| COMMON STOCKS — 0.92% | |
| Automakers — 0.92% | |
| General Motors Company (b) (i) | | | 352,400 | | | | 229,060 | | |
| General Motors Company (b) | | | 65,459 | | | | 1,987,335 | | |
Total common stocks
(Cost $2,275,257) | | | | | 2,216,395 | | |
The accompanying notes are an integral part of these financial statements.
34
Schedule of Investments — June 30, 2011
Hotchkis and Wiley High Yield Fund
WARRANTS — 0.28% | | Shares
Held | | Value | |
| Automakers — 0.28% | |
General Motors Company
Expiration: July 2016
Exercise Price: $10.00 (b) | | | 31,171 | | | $ | 667,059 | | |
Total warrants
(Cost $735,178) | | | | | 667,059 | | |
Total investments — 94.51%
(Cost $222,975,389) | | | | | 227,907,503 | | |
| Time deposits* — 2.64% | | | | | 6,371,805 | | |
| Other assets in excess of liabilities — 2.85% | | | | | 6,871,657 | | |
| Net assets — 100.00% | | $ | 241,150,965 | | |
(a) — The coupon rate shown on variable rate securities represents the rate at June 30, 2011.
(b) — Non-income producing security.
(c) — All or a portion of this security is segregated as collateral for delayed delivery securities.
(d) — Delayed delivery security.
(e) — Restricted security not registered under the Securities Act of 1933. Purchased in a private placement transaction; resale to the public may require registration or be limited to qualified institutional buyers. The total market value of this security was $2,511,401, representing 1.04% of net assets.
(i) — Illiquid security.
(p) — Payment in-kind security.
(r) — Restricted security under Rule 144A of the Securities Act of 1933. Purchased in a private placement transaction; resale to the public may require registration or be limited to qualified institutional buyers. The total market value of these securities was $105,672,058, representing 43.82% of net assets.
* — Time deposits of $1,200,000 with Bank of America, $1,200,000 with Citibank, $1,200,000 with HSBC Bank, $1,200,000 with JPMorgan Chase and $1,571,805 with Wells Fargo bear interest at 0.03% and mature on 7/1/2011. Invested through a cash management account administered by Brown Brothers Harriman & Co.
The accompanying notes are an integral part of these financial statements.
35
Statements of Assets & Liabilities
JUNE 30, 2011
| | | Diversified Value
Fund | | Large Cap Value
Fund | | Mid-Cap Value
Fund | | Small Cap Value
Fund | |
| Assets: | |
| Investments, at value* | |
| Unaffiliated issuers | | $ | 384,544,168 | | | $ | 937,490,985 | | | $ | 1,260,394,653 | | | $ | 321,589,497 | | |
| Affiliated issuers | | | — | | | | — | | | | 81,897,870 | | | | 4,935,060 | | |
| Collateral for securities on loan | | | — | | | | — | | | | 17,477,265 | | | | — | | |
| Time deposit | | | 2,243,436 | | | | 13,108,689 | | | | 13,550,784 | | | | 598,580 | | |
| Dividends and interest receivable | | | 830,849 | | | | 2,712,073 | | | | 1,763,151 | | | | 218,311 | | |
| Receivable for investments sold | | | 585,993 | | | | 11,451,141 | | | | 7,444,694 | | | | 3,387,930 | | |
| Receivable for Fund shares sold | | | 574,737 | | | | 1,158,799 | | | | 1,269,032 | | | | 1,196,208 | | |
| Other assets | | | 47,168 | | | | 51,727 | | | | 59,339 | | | | 22,487 | | |
| Total assets | | $ | 388,826,351 | | | $ | 965,973,414 | | | $ | 1,383,856,788 | | | $ | 331,948,073 | | |
| Liabilities: | |
| Collateral for securities on loan | | $ | — | | | $ | — | | | $ | 17,477,265 | | | $ | — | | |
| Payable for investments purchased | | | 157,339 | | | | — | | | | 9,930,941 | | | | 1,187,695 | | |
| Payable for Fund shares repurchased | | | 322,710 | | | | 5,122,245 | | | | 700,808 | | | | 293,434 | | |
| Payable to Advisor | | | 215,014 | | | | 562,760 | | | | 810,547 | | | | 198,253 | | |
| Payable to Trustees | | | 330 | | | | 942 | | | | 1,146 | | | | 278 | | |
| Accrued distribution and service fees | | | 77,848 | | | | 453,502 | | | | 273,404 | | | | 105,374 | | |
| Accrued expenses and other liabilities | | | 360,757 | | | | 501,964 | | | | 677,438 | | | | 148,842 | | |
| Total liabilities | | | 1,133,998 | | | | 6,641,413 | | | | 29,871,549 | | | | 1,933,876 | | |
| Net assets | | $ | 387,692,353 | | | $ | 959,332,001 | | | $ | 1,353,985,239 | | | $ | 330,014,197 | | |
| Net Assets consist of: | |
| Paid-in capital | | $ | 1,211,427,800 | | | $ | 2,275,989,640 | | | $ | 1,869,075,398 | | | $ | 338,312,454 | | |
| Undistributed net investment income (loss) | | | 5,573,244 | | | | 15,119,527 | | | | 668,761 | | | | — | | |
| Undistributed net realized loss on securities | | | (754,138,911 | ) | | | (1,140,484,574 | ) | | | (355,118,291 | ) | | | (18,058,646 | ) | |
| Net unrealized appreciation (depreciation) of securities | | | (75,169,780 | ) | | | (191,292,592 | ) | | | (160,640,629 | ) | | | 9,760,389 | | |
| Net assets | | $ | 387,692,353 | | | $ | 959,332,001 | | | $ | 1,353,985,239 | | | $ | 330,014,197 | | |
Calculation of Net Asset Value Per Share and
Public Offering Price Per Share — Class I | |
| Net assets | | $ | 328,273,205 | | | $ | 588,822,540 | | | $ | 1,077,148,575 | | | $ | 254,186,918 | | |
| Shares outstanding (unlimited shares $0.001 par value authorized) | | | 32,801,587 | | | | 34,727,289 | | | | 43,157,435 | | | | 5,790,247 | | |
| Net asset value per share | | $ | 10.01 | | | $ | 16.96 | | | $ | 24.96 | | | $ | 43.90 | | |
| Calculation of Net Asset Value Per Share — Class A | |
| Net assets | | $ | 45,383,382 | | | $ | 319,863,343 | | | $ | 235,301,481 | | | $ | 64,100,434 | | |
| Shares outstanding (unlimited shares $0.001 par value authorized) | | | 4,522,634 | | | | 18,994,285 | | | | 9,509,826 | | | | 1,462,170 | | |
| Net asset value per share | | $ | 10.03 | | | $ | 16.84 | | | $ | 24.74 | | | $ | 43.84 | | |
| Public Offering Price Per Share — Class A | |
| (Net asset value per share divided by 0.9475) | | $ | 10.59 | | | $ | 17.77 | | | $ | 26.11 | | | $ | 46.27 | | |
Calculation of Net Asset Value Per Share and
Public Offering Price Per Share — Class C | |
| Net assets | | $ | 14,035,766 | | | $ | 36,612,278 | | | $ | 35,319,967 | | | $ | 11,726,845 | | |
| Shares outstanding (unlimited shares $0.001 par value authorized) | | | 1,414,562 | | | | 2,221,535 | | | | 1,522,221 | | | | 292,392 | | |
| Net asset value per share | | $ | 9.92 | | | $ | 16.48 | | | $ | 23.20 | | | $ | 40.11 | | |
Calculation of Net Asset Value Per Share and
Public Offering Price Per Share — Class R | |
| Net assets | | | | | | $ | 14,033,840 | | | $ | 6,215,216 | | | | | | |
| Shares outstanding (unlimited shares $0.001 par value authorized) | | | | | | | 827,858 | | | | 249,147 | | | | | | |
| Net asset value per share | | | | | | $ | 16.95 | | | $ | 24.95 | | | | | | |
| *Cost of investments | |
| Unaffiliated issuers | | $ | 459,713,948 | | | $ | 1,128,783,577 | | | $ | 1,425,862,575 | | | $ | 311,953,635 | | |
| Affiliated issuers | | | — | | | | — | | | | 77,070,577 | | | | 4,810,533 | | |
The accompanying notes are an integral part of these financial statements.
36
Statements of Assets & Liabilities
JUNE 30, 2011
| | | Value Opportunities
Fund | | Capital Income
Fund | | High Yield
Fund | |
| Assets: | |
| Investments, at value* | |
| Unaffiliated issuers | | $ | 82,657,790 | | | $ | 7,627,550 | | | $ | 227,907,503 | | |
| Affiliated issuers | | | 2,832,384 | | | | — | | | | — | | |
| Time deposit | | | 386,310 | | | | 150,061 | | | | 6,371,805 | | |
| Dividends and interest receivable | | | 213,621 | | | | 70,607 | | | | 4,172,272 | | |
| Receivable for investments sold | | | — | | | | 31,722 | | | | 2,070,877 | | |
| Receivable for Fund shares sold | | | 189,740 | | | | — | | | | 4,527,939 | | |
| Receivable from Advisor | | | — | | | | 8,622 | | | | — | | |
| Other assets | | | 9,939 | | | | 27,621 | | | | 23,406 | | |
| Total assets | | $ | 86,289,784 | | | $ | 7,916,183 | | | $ | 245,073,802 | | |
| Liabilities: | |
| Payable for investments purchased | | $ | 20,662 | | | $ | 46,153 | | | $ | 3,030,001 | | |
| Payable for Fund shares repurchased | | | 29,345 | | | | 99 | | | | 135,751 | | |
| Payable to Advisor | | | 52,822 | | | | — | | | | 68,086 | | |
| Payable to Trustees | | | 74 | | | | 6 | | | | 224 | | |
| Accrued distribution and service fees | | | 53,675 | | | | 49 | | | | 28,930 | | |
| Distributions payable to shareholders | | | — | | | | 767 | | | | 566,707 | | |
| Accrued expenses and other liabilities | | | 51,187 | | | | 22,393 | | | | 93,138 | | |
| Total liabilities | | | 207,765 | | | | 69,467 | | | | 3,922,837 | | |
| Net assets | | $ | 86,082,019 | | | $ | 7,846,716 | | | $ | 241,150,965 | | |
| Net Assets consist of: | |
| Paid-in capital | | $ | 80,292,601 | | | $ | 7,589,941 | | | $ | 227,664,341 | | |
| Undistributed net investment income | | | 360,527 | | | | 11,583 | | | | 577 | | |
| Undistributed net realized gain on securities | | | 1,012,418 | | | | 92,851 | | | | 8,553,933 | | |
| Net unrealized appreciation of securities | | | 4,416,473 | | | | 152,341 | | | | 4,932,114 | | |
| Net assets | | $ | 86,082,019 | | | $ | 7,846,716 | | | $ | 241,150,965 | | |
Calculation of Net Asset Value Per Share and
Public Offering Price Per Share — Class I | |
| Net assets | | $ | 39,013,840 | | | $ | 7,764,940 | | | $ | 187,319,312 | | |
| Shares outstanding (unlimited shares $0.001 par value authorized) | | | 1,847,290 | | | | 748,571 | | | | 14,641,101 | | |
| Net asset value per share | | $ | 21.12 | | | $ | 10.37 | | | $ | 12.79 | | |
| Calculation of Net Asset Value Per Share — Class A | |
| Net assets | | $ | 34,907,720 | | | $ | 81,776 | | | $ | 53,831,653 | | |
| Shares outstanding (unlimited shares $0.001 par value authorized) | | | 1,652,694 | | | | 7,880 | | | | 4,227,377 | | |
| Net asset value per share | | $ | 21.12 | | | $ | 10.38 | | | $ | 12.73 | | |
| Public Offering Price Per Share — Class A | |
| (Net asset value per share divided by 0.9475) | | $ | 22.29 | | | | | | | | | | |
| (Net asset value per share divided by 0.9525) | | | | $ | 10.90 | | | | | | |
| (Net asset value per share divided by 0.9625) | | | | | | $ | 13.23 | | |
Calculation of Net Asset Value Per Share and
Public Offering Price Per Share — Class C | |
| Net assets | | $ | 12,160,459 | | | | | | | | | | |
| Shares outstanding (unlimited shares $0.001 par value authorized) | | | 601,822 | | | | | | | | | | |
| Net asset value per share | | $ | 20.21 | | | | | | | | | | |
| *Cost of investments | |
| Unaffiliated issuers | | $ | 77,210,920 | | | $ | 7,475,209 | | | $ | 222,975,389 | | |
| Affiliated issuers | | | 3,862,781 | | | | — | | | | — | | |
The accompanying notes are an integral part of these financial statements.
37
Statements of Operations
FOR THE YEAR ENDED JUNE 30, 2011
| | | Diversified Value
Fund | | Large Cap Value
Fund | | Mid-Cap Value
Fund | | Small Cap Value
Fund | |
| Investment income: | |
| Dividends* | | $ | 10,234,100 | | | $ | 30,191,931 | | | $ | 16,153,681 | | | $ | 2,613,227 | | |
| Interest | | | 1,252 | | | | 3,014 | | | | 5,703 | | | | 1,355 | | |
| Securities on loan | | | 5,886 | | | | 15,482 | | | | 26,934 | | | | 4,054 | | |
| Total income | | | 10,241,238 | | | | 30,210,427 | | | | 16,186,318 | | | | 2,618,636 | | |
| Expenses: | |
| Advisory fees | | | 3,005,462 | | | | 8,583,022 | | | | 9,467,984 | | | | 2,059,608 | | |
| Professional fees and expenses | | | 39,885 | | | | 92,410 | | | | 96,568 | | | | 31,349 | | |
| Custodian fees and expenses | | | 30,532 | | | | 75,794 | | | | 38,236 | | | | 12,169 | | |
| Transfer agent fees and expenses | | | 968,482 | | | | 2,274,410 | | | | 2,780,200 | | | | 550,031 | | |
| Accounting fees and expenses | | | 57,767 | | | | 148,390 | | | | 163,212 | | | | 40,820 | | |
| Administration fees and expenses | | | 182,308 | | | | 514,657 | | | | 560,897 | | | | 120,641 | | |
| Trustees' fees and expenses | | | 52,613 | | | | 147,578 | | | | 161,968 | | | | 33,314 | | |
| Reports to shareholders | | | 57,935 | | | | 98,497 | | | | 152,993 | | | | 42,147 | | |
| Registration fees | | | 51,078 | | | | 86,984 | | | | 97,122 | | | | 57,779 | | |
| Distribution and service fees — Class A | | | 146,063 | | | | 1,339,719 | | | | 608,470 | | | | 132,786 | | |
| Distribution and service fees — Class C | | | 156,870 | | | | 398,745 | | | | 352,356 | | | | 79,200 | | |
| Distribution and service fees — Class R | | | — | | | | 77,887 | | | | 31,075 | | | | — | | |
| Other expenses | | | 38,401 | | | | 147,108 | | | | 153,108 | | | | 21,756 | | |
| Total expenses | | | 4,787,396 | | | | 13,985,201 | | | | 14,664,189 | | | | 3,181,600 | | |
| Expense waiver by Advisor (Note 2) | | | (677,543 | ) | | | (152,620 | ) | | | — | | | | — | | |
| Net expenses | | | 4,109,853 | | | | 13,832,581 | | | | 14,664,189 | | | | 3,181,600 | | |
| Net investment income (loss) | | | 6,131,385 | | | | 16,377,846 | | | | 1,522,129 | | | | (562,964 | ) | |
| Realized and Unrealized Gains on Securities: | |
| Net realized gains from: | |
| Sales of unaffiliated issuers | | | 29,115,834 | | | | 109,009,985 | | | | 170,777,107 | | | | 5,887,154 | | |
| Sales of affiliated issuers | | | — | | | | — | | | | 5,719,194 | | | | — | | |
| Net realized gains on securities | | | 29,115,834 | | | | 109,009,985 | | | | 176,496,301 | | | | 5,887,154 | | |
| Net change in unrealized appreciation of securities | | | 61,828,896 | | | | 142,849,684 | | | | 205,594,616 | | | | 76,081,588 | | |
| Net gains on securities | | | 90,944,730 | | | | 251,859,669 | | | | 382,090,917 | | | | 81,968,742 | | |
| Net Increase in Net Assets Resulting from Operations | | $ | 97,076,115 | | | $ | 268,237,515 | | | $ | 383,613,046 | | | $ | 81,405,778 | | |
| *Net of Foreign Taxes Withheld | | $ | 111,871 | | | $ | 317,719 | | | $ | 232,424 | | | $ | 25,606 | | |
The accompanying notes are an integral part of these financial statements.
38
Statements of Operations
FOR THE PERIOD ENDED JUNE 30, 2011
| | | Value Opportunities
Fund | | Capital Income
Fund+ | | High Yield
Fund | |
| Investment income: | |
| Dividends* | | $ | 1,233,518 | | | $ | 90,298 | | | $ | 980,732 | | |
| Interest | | | 86,756 | | | | 99,954 | | | | 15,478,304 | | |
| Securities on loan | | | 1,430 | | | | — | | | | — | | |
| Total income | | | 1,321,704 | | | | 190,252 | | | | 16,459,036 | | |
| Expenses: | |
| Advisory fees | | | 524,564 | | | | 22,913 | | | | 1,153,308 | | |
| Professional fees and expenses | | | 20,967 | | | | 15,572 | | | | 34,964 | | |
| Custodian fees and expenses | | | 12,192 | | | | 3,408 | | | | 10,650 | | |
| Transfer agent fees and expenses | | | 103,196 | | | | 13,863 | | | | 156,663 | | |
| Accounting fees and expenses | | | 14,860 | | | | 22,743 | | | | 44,600 | | |
| Administration fees and expenses | | | 30,414 | | | | 13,750 | | | | 91,335 | | |
| Trustees' fees and expenses | | | 8,213 | | | | 422 | | | | 23,588 | | |
| Reports to shareholders | | | 8,817 | | | | 1,269 | | | | 17,213 | | |
| Registration fees | | | 47,733 | | | | 13,183 | | | | 37,488 | | |
| Distribution and service fees — Class A | | | 71,961 | | | | 58 | | | | 97,733 | | |
| Distribution and service fees — Class C | | | 96,186 | | | | — | | | | — | | |
| Offering costs | | | — | | | | 24,175 | | | | — | | |
| Other expenses | | | 6,425 | | | | 965 | | | | 12,923 | | |
| Total expenses | | | 945,528 | | | | 132,321 | | | | 1,680,465 | | |
| Expense waiver by Advisor (Note 2) | | | — | | | | (79,371 | ) | | | (114,885 | ) | |
| Expense waiver by Administrator (Note 2) | | | — | | | | (24,750 | ) | | | — | | |
| Net expenses | | | 945,528 | | | | 28,200 | | | | 1,565,580 | | |
| Net investment income | | | 376,176 | | | | 162,052 | | | | 14,893,456 | | |
| Realized and Unrealized Gains on Securities: | |
| Net realized gains (losses) from: | |
| Sales of unaffiliated issuers | | | 4,266,339 | | | | 62,672 | | | | 10,733,809 | | |
| Sales of affiliated issuers | | | (44,575 | ) | | | — | | | | — | | |
| Foreign currency transactions | | | (6,102 | ) | | | — | | | | — | | |
| Net realized gains on securities | | | 4,215,662 | | | | 62,672 | | | | 10,733,809 | | |
| Net change in unrealized appreciation of securities | | | 15,223,713 | | | | 152,341 | | | | 4,360,950 | | |
| Net gains on securities | | | 19,439,375 | | | | 215,013 | | | | 15,094,759 | | |
| Net Increase in Net Assets Resulting from Operations | | $ | 19,815,551 | | | $ | 377,065 | | | $ | 29,988,215 | | |
| *Net of Foreign Taxes Withheld | | $ | 26,945 | | | $ | 1,205 | | | $ | — | | |
+ The Fund commenced operations on December 31, 2010.
The accompanying notes are an integral part of these financial statements.
39
Statements of Changes in Net Assets
| | | Diversified Value Fund | | Large Cap Value Fund | |
| | | Year ended
June 30, 2011 | | Year ended
June 30, 2010 | | Year ended
June 30, 2011 | | Year ended
June 30, 2010 | |
| Operations: | |
| Net investment income | | $ | 6,131,385 | | | $ | 6,137,640 | | | $ | 16,377,846 | | | $ | 15,753,349 | | |
| Net realized gains on securities | | | 29,115,834 | | | | 24,590,527 | | | | 109,009,985 | | | | 91,626,181 | | |
| Net change in unrealized appreciation of securities | | | 61,828,896 | | | | 51,108,962 | | | | 142,849,684 | | | | 113,829,913 | | |
| Net increase in net assets resulting from operations | | | 97,076,115 | | | | 81,837,129 | | | | 268,237,515 | | | | 221,209,443 | | |
| Dividends and Distributions to Shareholders: | |
| Net investment income: | |
| Class I | | | (3,189,584 | ) | | | (8,661,558 | ) | | | (1,195,113 | ) | | | (16,064,138 | ) | |
| Class A | | | (592,761 | ) | | | (1,214,806 | ) | | | (510,391 | ) | | | (17,999,865 | ) | |
| Class C | | | (67,992 | ) | | | (301,075 | ) | | | — | | | | (1,312,882 | ) | |
| Class R | | | — | | | | — | | | | — | | | | (559,010 | ) | |
| Net realized gains on securities: | |
| Class I | | | — | | | | — | | | | — | | | | — | | |
| Class A | | | — | | | | — | | | | — | | | | — | | |
| Class C | | | — | | | | — | | | | — | | | | — | | |
| Class R | | | — | | | | — | | | | — | | | | — | | |
Net decrease in net assets resulting from dividends and
distributions to shareholders | | | (3,850,337 | ) | | | (10,177,439 | ) | | | (1,705,504 | ) | | | (35,935,895 | ) | |
| Capital Share Transactions: | |
Net decrease in net assets resulting from capital share
transactions | | | (96,800,822 | ) | | | (110,814,136 | ) | | | (350,959,563 | ) | | | (291,006,578 | ) | |
| Net Assets: | |
| Total decrease in net assets | | | (3,575,044 | ) | | | (39,154,446 | ) | | | (84,427,552 | ) | | | (105,733,030 | ) | |
| Beginning of year | | | 391,267,397 | | | | 430,421,843 | | | | 1,043,759,553 | | | | 1,149,492,583 | | |
| End of year | | $ | 387,692,353 | | | $ | 391,267,397 | | | $ | 959,332,001 | | | $ | 1,043,759,553 | | |
| Undistributed net investment income | | $ | 5,573,244 | | | $ | 3,292,196 | | | $ | 15,119,527 | | | $ | 447,185 | | |
The accompanying notes are an integral part of these financial statements.
40
Statements of Changes in Net Assets
| | | Mid-Cap Value Fund | | Small Cap Value Fund | |
| | | Year ended
June 30, 2011 | | Year ended
June 30, 2010 | | Year ended
June 30, 2011 | | Year ended
June 30, 2010 | |
| Operations: | |
| Net investment income (loss) | | $ | 1,522,129 | | | $ | 2,847,727 | | | $ | (562,964 | ) | | $ | 400,407 | | |
| Net realized gains on securities | | | 176,496,301 | | | | 134,292,160 | | | | 5,887,154 | | | | 36,085,393 | | |
| Net change in unrealized appreciation of securities | | | 205,594,616 | | | | 226,710,894 | | | | 76,081,588 | | | | 37,933,996 | | |
| Net increase in net assets resulting from operations | | | 383,613,046 | | | | 363,850,781 | | | | 81,405,778 | | | | 74,419,796 | | |
| Dividends and Distributions to Shareholders: | |
| Net investment income: | |
| Class I | | | (3,219,747 | ) | | | (8,960,309 | ) | | | (317,460 | ) | | | (965,469 | ) | |
| Class A | | | (477,326 | ) | | | (1,897,204 | ) | | | (36,859 | ) | | | (97,453 | ) | |
| Class C | | | — | | | | (234,248 | ) | | | — | | | | (11,575 | ) | |
| Class R | | | (4,022 | ) | | | (42,446 | ) | | | — | | | | — | | |
| Net realized gains on securities: | |
| Class I | | | — | | | | — | | | | — | | | | — | | |
| Class A | | | — | | | | — | | | | — | | | | — | | |
| Class C | | | — | | | | — | | | | — | | | | — | | |
| Class R | | | — | | | | — | | | | — | | | | — | | |
Net decrease in net assets resulting from dividends and
distributions to shareholders | | | (3,701,095 | ) | | | (11,134,207 | ) | | | (354,319 | ) | | | (1,074,497 | ) | |
| Capital Share Transactions: | |
Net increase (decrease) in net assets resulting from capital share
transactions | | | (152,876,673 | ) | | | (334,285,993 | ) | | | 32,329,916 | | | | (38,123,734 | ) | |
| Net Assets: | |
| Total increase in net assets | | | 227,035,278 | | | | 18,430,581 | | | | 113,381,375 | | | | 35,221,565 | | |
| Beginning of year | | | 1,126,949,961 | | | | 1,108,519,380 | | | | 216,632,822 | | | | 181,411,257 | | |
| End of year | | $ | 1,353,985,239 | | | $ | 1,126,949,961 | | | $ | 330,014,197 | | | $ | 216,632,822 | | |
| Undistributed net investment income | | $ | 668,761 | | | $ | 2,847,727 | | | $ | — | | | $ | 330,914 | | |
The accompanying notes are an integral part of these financial statements.
41
Statements of Changes in Net Assets
| | | Value Opportunities Fund | | Capital Income Fund | | High Yield Fund | |
| | | Year ended
June 30, 2011 | | Year ended
June 30, 2010 | | Period ended
June 30, 2011+ | | Year ended
June 30, 2011 | | Year ended
June 30, 2010 | |
| Operations: | |
| Net investment income | | $ | 376,176 | | | $ | 379,538 | | | $ | 162,052 | | | $ | 14,893,456 | | | $ | 5,652,837 | | |
| Net realized gains on securities | | | 4,215,662 | | | | 9,443,069 | | | | 62,672 | | | | 10,733,809 | | | | 5,976,840 | | |
Net change in unrealized appreciation
(depreciation) of securities | | | 15,223,713 | | | | 602,407 | | | | 152,341 | | | | 4,360,950 | | | | (515,291 | ) | |
Net increase in net assets resulting
from operations | | | 19,815,551 | | | | 10,425,014 | | | | 377,065 | | | | 29,988,215 | | | | 11,114,386 | | |
| Dividends and Distributions to Shareholders: | |
| Net investment income: | |
| Class I | | | (338,384 | ) | | | (341,711 | ) | | | (149,527 | ) | | | (12,260,396 | ) | | | (4,597,070 | ) | |
| Class A | | | (193,897 | ) | | | (315,639 | ) | | | (942 | ) | | | (2,703,890 | ) | | | (1,044,888 | ) | |
| Class C | | | (61,725 | ) | | | (91,121 | ) | | | — | | | | — | | | | — | | |
| Net realized gains on securities: | |
| Class I | | | — | | | | — | | | | — | | | | (5,274,588 | ) | | | (1,986,505 | ) | |
| Class A | | | — | | | | — | | | | — | | | | (1,289,265 | ) | | | (644,379 | ) | |
| Class C | | | — | | | | — | | | | — | | | | — | | | | — | | |
Net decrease in net assets resulting from
dividends and distributions to shareholders | | | (594,006 | ) | | | (748,471 | ) | | | (150,469 | ) | | | (21,528,139 | ) | | | (8,272,842 | ) | |
| Capital Share Transactions: | |
Net increase in net assets resulting
from capital share transactions | | | 13,705,558 | | | | 9,658,397 | | | | 7,620,120 | | | | 117,462,062 | | | | 81,739,179 | | |
| Net Assets: | |
| Total increase in net assets | | | 32,927,103 | | | | 19,334,940 | | | | 7,846,716 | | | | 125,922,138 | | | | 84,580,723 | | |
| Beginning of period | | | 53,154,916 | | | | 33,819,976 | | | | — | | | | 115,228,827 | | | | 30,648,104 | | |
| End of period | | $ | 86,082,019 | | | $ | 53,154,916 | | | $ | 7,846,716 | | | $ | 241,150,965 | | | $ | 115,228,827 | | |
| Undistributed net investment income | | $ | 360,527 | | | $ | 584,459 | | | $ | 11,583 | | | $ | 577 | | | $ | 71,339 | | |
+ The Fund commenced operations on December 31, 2010.
The accompanying notes are an integral part of these financial statements.
42
Financial Highlights
The following per share data and ratios have been derived from information provided in the financial statements.
| | | | | Income (loss) from investment operations | | Dividends and distributions | | | | Ratios to Average Net Assets | |
| Diversified Value Fund | | Net asset
value,
beginning
of year | | Net
investment
income
(loss)1 | | Net gains
(losses) on
securities
(both
realized and
unrealized) | | Total from
investment
operations | | Dividends
(from net
investment
income) | | Distributions
(from capital
gains) | | Total
distributions | | Net asset
value, end
of year | | Total
return2 | | Net assets,
end of
year (in
thousands) | | Expenses,
net of
reimbursement/
waiver | | Expenses | | Net
investment
income
(loss) | |
| Class I | |
| Year ended 6/30/2011 | | $ | 7.94 | | | $ | 0.15 | | | $ | 2.02 | | | $ | 2.17 | | | $ | (0.10 | ) | | $ | — | | | $ | (0.10 | ) | | $ | 10.01 | | | | 27.44 | % | | $ | 328,273 | | | | 0.95 | % | | | 1.12 | % | | | 1.59 | % | |
| Year ended 6/30/2010 | | | 6.77 | | | | 0.12 | | | | 1.25 | | | | 1.37 | | | | (0.20 | ) | | | — | | | | (0.20 | ) | | | 7.94 | | | | 20.22 | | | | 330,586 | | | | 0.95 | | | | 1.11 | | | | 1.48 | | |
| Year ended 6/30/2009 | | | 9.57 | | | | 0.16 | | | | (2.65 | ) | | | (2.49 | ) | | | (0.31 | ) | | | — | | | | (0.31 | ) | | | 6.77 | | | | –25.59 | | | | 352,322 | | | | 0.95 | | | | 1.10 | | | | 2.20 | | |
| Year ended 6/30/2008 | | | 15.26 | | | | 0.18 | | | | (4.88 | ) | | | (4.70 | ) | | | (0.14 | ) | | | (0.85 | ) | | | (0.99 | ) | | | 9.57 | | | | –32.13 | | | | 1,132,685 | | | | 0.95 | | | | 0.98 | | | | 1.46 | | |
| Year ended 6/30/2007 | | | 12.85 | | | | 0.11 | | | | 2.68 | | | | 2.79 | | | | (0.11 | ) | | | (0.27 | ) | | | (0.38 | ) | | | 15.26 | | | | 21.80 | | | | 1,712,419 | | | | 0.95 | | | | 0.98 | | | | 0.77 | | |
| Class A | |
| Year ended 6/30/2011 | | | 7.96 | | | | 0.14 | | | | 2.02 | | | | 2.16 | | | | (0.09 | ) | | | — | | | | (0.09 | ) | | | 10.03 | | | | 27.16 | | | | 45,383 | | | | 1.20 | | | | 1.37 | | | | 1.42 | | |
| Year ended 6/30/2010 | | | 6.79 | | | | 0.10 | | | | 1.25 | | | | 1.35 | | | | (0.18 | ) | | | — | | | | (0.18 | ) | | | 7.96 | | | | 19.84 | | | | 45,427 | | | | 1.20 | | | | 1.36 | | | | 1.21 | | |
| Year ended 6/30/2009 | | | 9.56 | | | | 0.14 | | | | (2.64 | ) | | | (2.50 | ) | | | (0.27 | ) | | | — | | | | (0.27 | ) | | | 6.79 | | | | –25.83 | | | | 60,533 | | | | 1.20 | | | | 1.36 | | | | 1.98 | | |
| Year ended 6/30/2008 | | | 15.21 | | | | 0.14 | | | | (4.86 | ) | | | (4.72 | ) | | | (0.08 | ) | | | (0.85 | ) | | | (0.93 | ) | | | 9.56 | | | | –32.29 | | | | 168,160 | | | | 1.20 | | | | 1.22 | | | | 1.07 | | |
| Year ended 6/30/2007 | | | 12.80 | | | | 0.07 | | | | 2.68 | | | | 2.75 | | | | (0.07 | ) | | | (0.27 | ) | | | (0.34 | ) | | | 15.21 | | | | 21.57 | | | | 670,824 | | | | 1.20 | | | | 1.21 | | | | 0.49 | | |
| Class C | |
| Year ended 6/30/2011 | | | 7.90 | | | | 0.06 | | | | 2.00 | | | | 2.06 | | | | (0.04 | ) | | | — | | | | (0.04 | ) | | | 9.92 | | | | 26.11 | | | | 14,036 | | | | 1.95 | | | | 2.12 | | | | 0.61 | | |
| Year ended 6/30/2010 | | | 6.74 | | | | 0.04 | | | | 1.26 | | | | 1.30 | | | | (0.14 | ) | | | — | | | | (0.14 | ) | | | 7.90 | | | | 19.17 | | | | 15,254 | | | | 1.95 | | | | 2.11 | | | | 0.47 | | |
| Year ended 6/30/2009 | | | 9.41 | | | | 0.11 | | | | (2.60 | ) | | | (2.49 | ) | | | (0.18 | ) | | | — | | | | (0.18 | ) | | | 6.74 | | | | –26.26 | | | | 17,566 | | | | 1.73 | | | | 2.09 | | | | 1.48 | | |
| Year ended 6/30/2008 | | | 15.01 | | | | 0.04 | | | | (4.79 | ) | | | (4.75 | ) | | | (0.00 | )3 | | | (0.85 | ) | | | (0.85 | ) | | | 9.41 | | | | –32.81 | | | | 45,761 | | | | 1.95 | | | | 1.97 | | | | 0.35 | | |
| Year ended 6/30/2007 | | | 12.66 | | | | (0.03 | ) | | | 2.65 | | | | 2.62 | | | | — | | | | (0.27 | ) | | | (0.27 | ) | | | 15.01 | | | | 20.77 | | | | 160,555 | | | | 1.90 | | | | 1.96 | | | | (0.21 | ) | |
| | | Year Ended June 30, | |
| | | 2011 | | 2010 | | 2009 | | 2008 | | 2007 | |
| Portfolio turnover rate | | | 63 | % | | | 43 | % | | | 70 | % | | | 74 | % | | | 44 | % | |
| | | | | Income (loss) from investment operations | | Dividends and distributions | | | | Ratios to Average Net Assets | |
| Large Cap Value Fund | | Net asset
value,
beginning
of year | | Net
investment
income1 | | Net gains
(losses) on
securities
(both
realized and
unrealized) | | Total from
investment
operations | | Dividends
(from net
investment
income) | | Distributions
(from capital
gains) | | Total
distributions | | Net asset
value, end
of year | | Total
return2 | | Net assets,
end of
year (in
thousands) | | Expenses,
net of
reimbursement/
waiver | | Expenses | | Net
investment
income | |
| Class I | |
| Year ended 6/30/2011 | | $ | 13.32 | | | $ | 0.26 | | | $ | 3.42 | | | $ | 3.68 | | | $ | (0.04 | ) | | $ | — | | | $ | (0.04 | ) | | $ | 16.96 | | | | 27.61 | % | | $ | 588,823 | | | | 1.05 | % | | | 1.07 | % | | | 1.60 | % | |
| Year ended 6/30/2010 | | | 11.49 | | | | 0.21 | | | | 1.99 | | | | 2.20 | | | | (0.37 | ) | | | — | | | | (0.37 | ) | | | 13.32 | | | | 20.08 | | | | 478,653 | | | | 1.05 | | | | 1.09 | | | | 1.51 | | |
| Year ended 6/30/2009 | | | 16.33 | | | | 0.29 | | | | (4.80 | ) | | | (4.51 | ) | | | (0.33 | ) | | | (0.00 | )3 | | | (0.33 | ) | | | 11.49 | | | | –27.81 | | | | 500,821 | | | | 1.05 | | | | 1.07 | | | | 2.45 | | |
| Year ended 6/30/2008 | | | 26.62 | | | | 0.33 | | | | (8.32 | ) | | | (7.99 | ) | | | (0.28 | ) | | | (2.02 | ) | | | (2.30 | ) | | | 16.33 | | | | –31.84 | | | | 1,168,499 | | | | 1.00 | | | | 1.00 | | | | 1.53 | | |
| Year ended 6/30/2007 | | | 23.42 | | | | 0.25 | | | | 4.25 | | | | 4.50 | | | | (0.29 | ) | | | (1.01 | ) | | | (1.30 | ) | | | 26.62 | | | | 19.63 | | | | 2,669,807 | | | | 0.98 | | | | 0.98 | | | | 0.98 | | |
| Class A | |
| Year ended 6/30/2011 | | | 13.25 | | | | 0.21 | | | | 3.39 | | | | 3.60 | | | | (0.01 | ) | | | — | | | | (0.01 | ) | | | 16.84 | | | | 27.21 | | | | 319,863 | | | | 1.30 | | | | 1.31 | | | | 1.33 | | |
| Year ended 6/30/2010 | | | 11.44 | | | | 0.16 | | | | 2.01 | | | | 2.17 | | | | (0.36 | ) | | | — | | | | (0.36 | ) | | | 13.25 | | | | 19.82 | | | | 512,120 | | | | 1.30 | | | | 1.34 | | | | 1.17 | | |
| Year ended 6/30/2009 | | | 16.25 | | | | 0.27 | | | | (4.79 | ) | | | (4.52 | ) | | | (0.29 | ) | | | (0.00 | )3 | | | (0.29 | ) | | | 11.44 | | | | –28.02 | | | | 584,598 | | | | 1.30 | | | | 1.32 | | | | 2.21 | | |
| Year ended 6/30/2008 | | | 26.51 | | | | 0.28 | | | | (8.31 | ) | | | (8.03 | ) | | | (0.21 | ) | | | (2.02 | ) | | | (2.23 | ) | | | 16.25 | | | | –32.06 | | | | 1,397,045 | | | | 1.25 | | | | 1.25 | | | | 1.28 | | |
| Year ended 6/30/2007 | | | 23.32 | | | | 0.19 | | | | 4.24 | | | | 4.43 | | | | (0.23 | ) | | | (1.01 | ) | | | (1.24 | ) | | | 26.51 | | | | 19.35 | | | | 3,060,990 | | | | 1.22 | | | | 1.22 | | | | 0.73 | | |
| Class C | |
| Year ended 6/30/2011 | | | 13.05 | | | | 0.09 | | | | 3.34 | | | | 3.43 | | | | — | | | | — | | | | — | | | | 16.48 | | | | 26.28 | | | | 36,612 | | | | 2.05 | | | | 2.07 | | | | 0.59 | | |
| Year ended 6/30/2010 | | | 11.33 | | | | 0.06 | | | | 1.99 | | | | 2.05 | | | | (0.33 | ) | | | — | | | | (0.33 | ) | | | 13.05 | | | | 18.91 | | | | 38,064 | | | | 2.05 | | | | 2.09 | | | | 0.46 | | |
| Year ended 6/30/2009 | | | 15.99 | | | | 0.21 | | | | (4.72 | ) | | | (4.51 | ) | | | (0.15 | ) | | | (0.00 | )3 | | | (0.15 | ) | | | 11.33 | | | | –28.26 | | | | 44,951 | | | | 1.73 | | | | 2.07 | | | | 1.77 | | |
| Year ended 6/30/2008 | | | 26.12 | | | | 0.10 | | | | (8.18 | ) | | | (8.08 | ) | | | (0.03 | ) | | | (2.02 | ) | | | (2.05 | ) | | | 15.99 | | | | –32.59 | | | | 116,947 | | | | 2.00 | | | | 2.00 | | | | 0.45 | | |
| Year ended 6/30/2007 | | | 22.96 | | | | 0.03 | | | | 4.19 | | | | 4.22 | | | | (0.05 | ) | | | (1.01 | ) | | | (1.06 | ) | | | 26.12 | | | | 18.62 | | | | 452,182 | | | | 1.83 | | | | 1.97 | | | | 0.12 | | |
| Class R | |
| Year ended 6/30/2011 | | | 13.36 | | | | 0.17 | | | | 3.42 | | | | 3.59 | | | | — | | | | — | | | | — | | | | 16.95 | | | | 26.87 | | | | 14,034 | | | | 1.55 | | | | 1.56 | | | | 1.08 | | |
| Year ended 6/30/2010 | | | 11.54 | | | | 0.13 | | | | 2.03 | | | | 2.16 | | | | (0.34 | ) | | | — | | | | (0.34 | ) | | | 13.36 | | | | 19.55 | | | | 14,922 | | | | 1.55 | | | | 1.59 | | | | 0.97 | | |
| Year ended 6/30/2009 | | | 16.37 | | | | 0.23 | | | | (4.83 | ) | | | (4.60 | ) | | | (0.23 | ) | | | (0.00 | )3 | | | (0.23 | ) | | | 11.54 | | | | –28.17 | | | | 19,123 | | | | 1.55 | | | | 1.57 | | | | 1.93 | | |
| Year ended 6/30/2008 | | | 26.68 | | | | 0.22 | | | | (8.37 | ) | | | (8.15 | ) | | | (0.14 | ) | | | (2.02 | ) | | | (2.16 | ) | | | 16.37 | | | | –32.27 | | | | 44,867 | | | | 1.50 | | | | 1.50 | | | | 1.02 | | |
| Year ended 6/30/2007 | | | 23.47 | | | | 0.12 | | | | 4.28 | | | | 4.40 | | | | (0.18 | ) | | | (1.01 | ) | | | (1.19 | ) | | | 26.68 | | | | 19.06 | | | | 103,263 | | | | 1.48 | | | | 1.48 | | | | 0.49 | | |
| | | Year Ended June 30, | |
| | | 2011 | | 2010 | | 2009 | | 2008 | | 2007 | |
| Portfolio turnover rate | | | 43 | % | | | 47 | % | | | 69 | % | | | 55 | % | | | 40 | % | |
1 Net investment income (loss) per share has been calculated based on average shares outstanding during the period.
2 Total returns exclude the effects of sales charges. The Fund's investment advisor may have waived a portion of its advisory fee and/or reimbursed a portion of the Fund's expenses. Without such waiver and/or reimbursement, the Fund's performance would have been lower.
3 Amount is less than $0.005.
The accompanying notes are an integral part of these financial statements.
43
Financial Highlights
The following per share data and ratios have been derived from information provided in the financial statements.
| | | | | Income (loss) from investment operations | | Dividends and distributions | | | | Ratios to Average Net Assets | |
| Mid-Cap Value Fund | | Net asset
value,
beginning
of year | | Net
investment
income
(loss)1 | | Net gains
(losses) on
securities
(both
realized and
unrealized) | | Total from
investment
operations | | Dividends
(from net
investment
income) | | Distributions
(from capital
gains) | | Total
distributions | | Net asset
value, end
of year | | Total
return2 | | Net assets,
end of
year (in
thousands) | | Expenses,
net of
reimbursement/
waiver | | Expenses | | Net
investment
income
(loss) | |
| Class I | |
| Year ended 6/30/2011 | | $ | 18.14 | | | $ | 0.05 | | | $ | 6.85 | | | $ | 6.90 | | | $ | (0.08 | ) | | $ | — | | | $ | (0.08 | ) | | $ | 24.96 | | | | 38.05 | % | | $ | 1,077,149 | | | | 1.08 | % | | | 1.08 | % | | | 0.20 | % | |
| Year ended 6/30/2010 | | | 13.76 | | | | 0.05 | | | | 4.49 | | | | 4.54 | | | | (0.16 | ) | | | — | | | | (0.16 | ) | | | 18.14 | | | | 33.00 | | | | 875,883 | | | | 1.10 | | | | 1.10 | | | | 0.29 | | |
| Year ended 6/30/2009 | | | 17.44 | | | | 0.13 | | | | (3.68 | ) | | | (3.55 | ) | | | (0.09 | ) | | | (0.04 | ) | | | (0.13 | ) | | | 13.76 | | | | –20.21 | | | | 850,809 | | | | 1.15 | | | | 1.15 | | | | 0.94 | | |
| Year ended 6/30/2008 | | | 31.99 | | | | 0.15 | | | | (10.34 | ) | | | (10.19 | ) | | | (0.20 | ) | | | (4.16 | ) | | | (4.36 | ) | | | 17.44 | | | | –34.05 | | | | 1,551,863 | | | | 1.03 | | | | 1.03 | | | | 0.65 | | |
| Year ended 6/30/2007 | | | 28.91 | | | | 0.14 | | | | 5.98 | | | | 6.12 | | | | (0.02 | ) | | | (3.02 | ) | | | (3.04 | ) | | | 31.99 | | | | 21.87 | | | | 3,681,426 | | | | 1.02 | | | | 1.02 | | | | 0.44 | | |
| Class A | |
| Year ended 6/30/2011 | | | 18.01 | | | | (0.01 | ) | | | 6.78 | | | | 6.77 | | | | (0.04 | ) | | | — | | | | (0.04 | ) | | | 24.74 | | | | 37.63 | | | | 235,301 | | | | 1.33 | | | | 1.33 | | | | (0.06 | ) | |
| Year ended 6/30/2010 | | | 13.68 | | | | 0.01 | | | | 4.46 | | | | 4.47 | | | | (0.14 | ) | | | — | | | | (0.14 | ) | | | 18.01 | | | | 32.67 | | | | 215,231 | | | | 1.35 | | | | 1.35 | | | | 0.03 | | |
| Year ended 6/30/2009 | | | 17.32 | | | | 0.09 | | | | (3.64 | ) | | | (3.55 | ) | | | (0.05 | ) | | | (0.04 | ) | | | (0.09 | ) | | | 13.68 | | | | –20.41 | | | | 224,667 | | | | 1.40 | | | | 1.40 | | | | 0.67 | | |
| Year ended 6/30/2008 | | | 31.75 | | | | 0.09 | | | | (10.26 | ) | | | (10.17 | ) | | | (0.10 | ) | | | (4.16 | ) | | | (4.26 | ) | | | 17.32 | | | | –34.20 | | | | 415,674 | | | | 1.28 | | | | 1.28 | | | | 0.38 | | |
| Year ended 6/30/2007 | | | 28.77 | | | | 0.06 | | | | 5.94 | | | | 6.00 | | | | — | | | | (3.02 | ) | | | (3.02 | ) | | | 31.75 | | | | 21.56 | | | | 1,150,029 | | | | 1.26 | | | | 1.26 | | | | 0.19 | | |
| Class C | |
| Year ended 6/30/2011 | | | 16.98 | | | | (0.17 | ) | | | 6.39 | | | | 6.22 | | | | — | | | | — | | | | — | | | | 23.20 | | | | 36.63 | | | | 35,320 | | | | 2.08 | | | | 2.08 | | | | (0.81 | ) | |
| Year ended 6/30/2010 | | | 12.99 | | | | (0.12 | ) | | | 4.23 | | | | 4.11 | | | | (0.12 | ) | | | — | | | | (0.12 | ) | | | 16.98 | | | | 31.67 | | | | 30,317 | | | | 2.10 | | | | 2.10 | | | | (0.71 | ) | |
| Year ended 6/30/2009 | | | 16.40 | | | | 0.05 | | | | (3.42 | ) | | | (3.37 | ) | | | — | | | | (0.04 | ) | | | (0.04 | ) | | | 12.99 | | | | –20.52 | | | | 26,888 | | | | 1.66 | | | | 2.14 | | | | 0.41 | | |
| Year ended 6/30/2008 | | | 30.43 | | | | (0.10 | ) | | | (9.77 | ) | | | (9.87 | ) | | | — | | | | (4.16 | ) | | | (4.16 | ) | | | 16.40 | | | | –34.68 | | | | 60,544 | | | | 2.03 | | | | 2.03 | | | | (0.43 | ) | |
| Year ended 6/30/2007 | | | 27.83 | | | | (0.11 | ) | | | 5.73 | | | | 5.62 | | | | — | | | | (3.02 | ) | | | (3.02 | ) | | | 30.43 | | | | 20.88 | | | | 252,320 | | | | 1.81 | | | | 2.01 | | | | (0.36 | ) | |
| Class R | |
| Year ended 6/30/2011 | | | 18.18 | | | | (0.07 | ) | | | 6.85 | | | | 6.78 | | | | (0.01 | ) | | | — | | | | (0.01 | ) | | | 24.95 | | | | 37.32 | | | | 6,215 | | | | 1.58 | | | | 1.58 | | | | (0.30 | ) | |
| Year ended 6/30/2010 | | | 13.82 | | | | (0.04 | ) | | | 4.51 | | | | 4.47 | | | | (0.11 | ) | | | — | | | | (0.11 | ) | | | 18.18 | | | | 32.36 | | | | 5,519 | | | | 1.60 | | | | 1.60 | | | | (0.23 | ) | |
| Year ended 6/30/2009 | | | 17.49 | | | | 0.06 | | | | (3.68 | ) | | | (3.62 | ) | | | (0.01 | ) | | | (0.04 | ) | | | (0.05 | ) | | | 13.82 | | | | –20.65 | | | | 6,156 | | | | 1.65 | | | | 1.65 | | | | 0.44 | | |
| Year ended 6/30/2008 | | | 32.01 | | | | 0.04 | | | | (10.36 | ) | | | (10.32 | ) | | | (0.04 | ) | | | (4.16 | ) | | | (4.20 | ) | | | 17.49 | | | | –34.35 | | | | 12,588 | | | | 1.53 | | | | 1.53 | | | | 0.16 | | |
| Year ended 6/30/2007 | | | 29.05 | | | | (0.02 | ) | | | 6.00 | | | | 5.98 | | | | — | | | | (3.02 | ) | | | (3.02 | ) | | | 32.01 | | | | 21.27 | | | | 27,167 | | | | 1.52 | | | | 1.52 | | | | (0.06 | ) | |
| | | Year Ended June 30, | |
| | | 2011 | | 2010 | | 2009 | | 2008 | | 2007 | |
| Portfolio turnover rate | | | 62 | % | | | 67 | % | | | 85 | % | | | 51 | % | | | 45 | % | |
| | | | | Income (loss) from investment operations | | Dividends and distributions | | | | Ratios to Average Net Assets | |
| Small Cap Value Fund | | Net asset
value,
beginning
of year | | Net
investment
income
(loss)1 | | Net gains
(losses) on
securities
(both
realized and
unrealized) | | Total from
investment
operations | | Dividends
(from net
investment
income) | | Distributions
(from capital
gains) | | Total
distributions | | Net asset
value, end
of year | | Total
return2 | | Net assets,
end of
year (in
thousands) | | Expenses,
net of
reimbursement/
waiver | | Expenses | | Net
investment
income
(loss) | |
| Class I | |
| Year ended 6/30/2011 | | $ | 31.33 | | | $ | (0.05 | ) | | $ | 12.68 | | | $ | 12.63 | | | $ | (0.06 | ) | | $ | — | | | $ | (0.06 | ) | | $ | 43.90 | | | | 40.29 | % | | $ | 254,187 | | | | 1.08 | % | | | 1.08 | % | | | (0.13 | )% | |
| Year ended 6/30/2010 | | | 21.15 | | | | 0.07 | | | | 10.28 | | | | 10.35 | | | | (0.17 | ) | | | — | | | | (0.17 | ) | | | 31.33 | | | | 49.02 | | | | 165,348 | | | | 1.14 | | | | 1.14 | | | | 0.23 | | |
| Year ended 6/30/2009 | | | 31.67 | | | | 0.12 | | | | (9.99 | ) | | | (9.87 | ) | | | (0.16 | ) | | | (0.49 | ) | | | (0.65 | ) | | | 21.15 | | | | –30.69 | | | | 164,020 | | | | 1.12 | | | | 1.12 | | | | 0.58 | | |
| Year ended 6/30/2008 | | | 50.00 | | | | 0.15 | | | | (14.45 | ) | | | (14.30 | ) | | | — | | | | (4.03 | ) | | | (4.03 | ) | | | 31.67 | | | | –29.19 | | | | 291,515 | | | | 1.08 | | | | 1.08 | | | | 0.39 | | |
| Year ended 6/30/2007 | | | 48.13 | | | | 0.06 | | | | 6.42 | | | | 6.48 | | | | (0.09 | ) | | | (4.52 | ) | | | (4.61 | ) | | | 50.00 | | | | 14.32 | | | | 526,706 | | | | 1.01 | | | | 1.01 | | | | 0.12 | | |
| Class A | |
| Year ended 6/30/2011 | | | 31.34 | | | | (0.15 | ) | | | 12.68 | | | | 12.53 | | | | (0.03 | ) | | | — | | | | (0.03 | ) | | | 43.84 | | | | 39.94 | | | | 64,100 | | | | 1.33 | | | | 1.33 | | | | (0.39 | ) | |
| Year ended 6/30/2010 | | | 21.18 | | | | 0.00 | 3 | | | 10.30 | | | | 10.30 | | | | (0.14 | ) | | | — | | | | (0.14 | ) | | | 31.34 | | | | 48.70 | | | | 47,007 | | | | 1.39 | | | | 1.39 | | | | (0.01 | ) | |
| Year ended 6/30/2009 | | | 31.69 | | | | 0.07 | | | | (10.00 | ) | | | (9.93 | ) | | | (0.09 | ) | | | (0.49 | ) | | | (0.58 | ) | | | 21.18 | | | | –30.90 | | | | 15,630 | | | | 1.37 | | | | 1.37 | | | | 0.32 | | |
| Year ended 6/30/2008 | | | 50.14 | | | | 0.02 | | | | (14.44 | ) | | | (14.42 | ) | | | — | | | | (4.03 | ) | | | (4.03 | ) | | | 31.69 | | | | –29.36 | | | | 43,959 | | | | 1.33 | | | | 1.33 | | | | 0.04 | | |
| Year ended 6/30/2007 | | | 48.30 | | | | (0.06 | ) | | | 6.44 | | | | 6.38 | | | | (0.02 | ) | | | (4.52 | ) | | | (4.54 | ) | | | 50.14 | | | | 14.03 | | | | 120,897 | | | | 1.26 | | | | 1.26 | | | | (0.14 | ) | |
| Class C | |
| Year ended 6/30/2011 | | | 28.87 | | | | (0.42 | ) | | | 11.66 | | | | 11.24 | | | | — | | | | — | | | | — | | | | 40.11 | | | | 38.93 | | | | 11,727 | | | | 2.08 | | | | 2.08 | | | | (1.14 | ) | |
| Year ended 6/30/2010 | | | 19.65 | | | | (0.22 | ) | | | 9.56 | | | | 9.34 | | | | (0.12 | ) | | | — | | | | (0.12 | ) | | | 28.87 | | | | 47.56 | | | | 4,278 | | | | 2.14 | | | | 2.14 | | | | (0.77 | ) | |
| Year ended 6/30/2009 | | | 29.37 | | | | (0.01 | ) | | | (9.22 | ) | | | (9.23 | ) | | | — | | | | (0.49 | ) | | | (0.49 | ) | | | 19.65 | | | | –31.05 | | | | 1,761 | | | | 1.72 | | | | 2.12 | | | | (0.03 | ) | |
| Year ended 6/30/2008 | | | 47.18 | | | | (0.29 | ) | | | (13.49 | ) | | | (13.78 | ) | | | — | | | | (4.03 | ) | | | (4.03 | ) | | | 29.37 | | | | –29.88 | | | | 4,159 | | | | 2.08 | | | | 2.08 | | | | (0.80 | ) | |
| Year ended 6/30/2007 | | | 45.83 | | | | (0.22 | ) | | | 6.09 | | | | 5.87 | | | | — | | | | (4.52 | ) | | | (4.52 | ) | | | 47.18 | | | | 13.65 | | | | 14,683 | | | | 1.60 | | | | 2.01 | | | | (0.48 | ) | |
| | | Year Ended June 30, | |
| | | 2011 | | 2010 | | 2009 | | 2008 | | 2007 | |
| Portfolio turnover rate | | | 54 | % | | | 93 | % | | | 65 | % | | | 62 | % | | | 31 | % | |
1 Net investment income (loss) per share has been calculated based on average shares outstanding during the period.
2 Total returns exclude the effects of sales charges. The Fund's investment advisor may have waived a portion of its advisory fee and/or reimbursed a portion of the Fund's expenses. Without such waiver and/or reimbursement, the Fund's performance would have been lower.
3 Amount is less than $0.005.
The accompanying notes are an integral part of these financial statements.
44
Financial Highlights
The following per share data and ratios have been derived from information provided in the financial statements.
| | | | | Income (loss) from investment operations | | Dividends and distributions | | | | Ratios to Average Net Assets | |
| Value Opportunities Fund | | Net asset
value,
beginning
of year | | Net
investment
income
(loss)2 | | Net gains
(losses) on
securities
(both
realized and
unrealized) | | Total from
investment
operations | | Dividends
(from net
investment
income) | | Distributions
(from capital
gains) | | Total
distributions | | Net asset
value, end
of year | | Total
return3 | | Net assets,
end of
year (in
thousands) | | Expenses,
net of
reimbursement/
waiver | | Expenses | | Net
investment
income
(loss) | |
| Class I | |
| Year ended 6/30/2011 | | $ | 14.96 | | | $ | 0.14 | | | $ | 6.24 | | | $ | 6.38 | | | $ | (0.22 | ) | | $ | — | | | $ | (0.22 | ) | | $ | 21.12 | | | | 42.81 | % | | $ | 39,014 | | | | 1.11 | % | | | 1.11 | % | | | 0.74 | % | |
| Year ended 6/30/2010 | | | 10.99 | | | | 0.17 | | | | 4.08 | | | | 4.25 | | | | (0.28 | ) | | | — | | | | (0.28 | ) | | | 14.96 | | | | 38.72 | | | | 24,073 | | | | 1.15 | | | | 1.15 | | | | 1.12 | | |
| Year ended 6/30/2009 | | | 13.72 | | | | 0.20 | | | | (2.82 | ) | | | (2.62 | ) | | | (0.11 | ) | | | — | | | | (0.11 | ) | | | 10.99 | | | | –18.87 | | | | 17,668 | | | | 1.19 | | | | 1.19 | | | | 1.99 | | |
| Year ended 6/30/2008 | | | 21.55 | | | | 0.11 | | | | (6.00 | ) | | | (5.89 | ) | | | (0.05 | ) | | | (1.89 | ) | | | (1.94 | ) | | | 13.72 | | | | –28.58 | | | | 22,921 | | | | 1.07 | | | | 1.07 | | | | 0.63 | | |
| Year ended 6/30/2007 | | | 19.36 | | | | 0.02 | | | | 3.87 | | | | 3.89 | | | | — | | | | (1.70 | ) | | | (1.70 | ) | | | 21.55 | | | | 20.82 | | | | 44,410 | | | | 0.98 | | | | 0.98 | | | | 0.12 | | |
| Class A | |
| Year ended 6/30/2011 | | | 14.98 | | | | 0.11 | | | | 6.22 | | | | 6.33 | | | | (0.19 | ) | | | — | | | | (0.19 | ) | | | 21.12 | | | | 42.40 | | | | 34,908 | | | | 1.36 | | | | 1.36 | | | | 0.58 | | |
| Year ended 6/30/2010 | | | 11.01 | | | | 0.13 | | | | 4.09 | | | | 4.22 | | | | (0.25 | ) | | | — | | | | (0.25 | ) | | | 14.98 | | | | 38.43 | | | | 21,794 | | | | 1.40 | | | | 1.40 | | | | 0.87 | | |
| Year ended 6/30/2009 | | | 13.70 | | | | 0.17 | | | | (2.80 | ) | | | (2.63 | ) | | | (0.06 | ) | | | — | | | | (0.06 | ) | | | 11.01 | | | | –19.05 | | | | 9,533 | | | | 1.44 | | | | 1.44 | | | | 1.60 | | |
| Year ended 6/30/2008 | | | 21.55 | | | | 0.06 | | | | (6.00 | ) | | | (5.94 | ) | | | (0.02 | ) | | | (1.89 | ) | | | (1.91 | ) | | | 13.70 | | | | –28.80 | | | | 22,729 | | | | 1.31 | | | | 1.31 | | | | 0.36 | | |
| Year ended 6/30/2007 | | | 19.40 | | | | (0.03 | ) | | | 3.88 | | | | 3.85 | | | | — | | | | (1.70 | ) | | | (1.70 | ) | | | 21.55 | | | | 20.56 | | | | 64,743 | | | | 1.23 | | | | 1.23 | | | | (0.14 | ) | |
| Class C | |
| Year ended 6/30/2011 | | | 14.40 | | | | (0.05 | ) | | | 5.99 | | | | 5.94 | | | | (0.13 | ) | | | — | | | | (0.13 | ) | | | 20.21 | | | | 41.35 | | | | 12,160 | | | | 2.11 | | | | 2.11 | | | | (0.26 | ) | |
| Year ended 6/30/2010 | | | 10.61 | | | | 0.01 | | | | 3.95 | | | | 3.96 | | | | (0.17 | ) | | | — | | | | (0.17 | ) | | | 14.40 | | | | 37.38 | | | | 7,288 | | | | 2.15 | | | | 2.15 | | | | 0.10 | | |
| Year ended 6/30/2009 | | | 13.18 | | | | 0.12 | | | | (2.67 | ) | | | (2.55 | ) | | | (0.02 | ) | | | — | | | | (0.02 | ) | | | 10.61 | | | | –19.32 | | | | 6,619 | | | | 1.86 | | | | 2.19 | | | | 1.22 | | |
| Year ended 6/30/2008 | | | 20.94 | | | | (0.07 | ) | | | (5.80 | ) | | | (5.87 | ) | | | — | | | | (1.89 | ) | | | (1.89 | ) | | | 13.18 | | | | –29.34 | | | | 13,621 | | | | 2.06 | | | | 2.06 | | | | (0.39 | ) | |
| Year ended 6/30/2007 | | | 19.00 | | | | (0.14 | ) | | | 3.78 | | | | 3.64 | | | | — | | | | (1.70 | ) | | | (1.70 | ) | | | 20.94 | | | | 19.85 | | | | 46,856 | | | | 1.79 | | | | 1.98 | | | | (0.69 | ) | |
| | | Year Ended June 30, | |
| | | 2011 | | 2010 | | 2009 | | 2008 | | 2007 | |
| Portfolio turnover rate | | | 137 | % | | | 166 | % | | | 210 | % | | | 119 | % | | | 53 | % | |
| | | | | Income from investment operations | | Dividends and distributions | | | | Ratios to Average Net Assets | |
| Capital Income Fund | | Net asset
value,
beginning
of period | | Net
investment
income2 | | Net gains on
securities
(both
realized and
unrealized) | | Total from
investment
operations | | Dividends
(from net
investment
income) | | Distributions
(from capital
gains) | | Total
distributions | | Net asset
value, end
of period | | Total
return3 | | Net assets,
end of
period (in
thousands) | | Expenses,
net of
reimbursement/
waiver | | Expenses | | Net
investment
income | �� |
| Class I | |
Period from 12/31/20101
to 6/30/2011 | | $ | 10.00 | | | $ | 0.24 | | | $ | 0.35 | | | $ | 0.59 | | | $ | (0.22 | ) | | $ | — | | | $ | (0.22 | ) | | $ | 10.37 | | | | 5.90 | % | | $ | 7,765 | | | | 0.80 | %4 | | | 3.75 | %4 | | | 4.60 | %4 | |
| Class A | |
Period from 2/28/20111
to 6/30/2011 | | | 10.34 | | | | 0.15 | | | | 0.03 | | | | 0.18 | | | | (0.14 | ) | | | — | | | | (0.14 | ) | | | 10.38 | | | | 1.74 | | | | 82 | | | | 1.054 | | | | 4.124 | | | | 4.314 | | |
| | | Period December 31, 20101
through June 30, 2011 | |
| Portfolio turnover rate | | | 39 | % | |
1 Commencement of operations.
2 Net investment income (loss) per share has been calculated based on average shares outstanding during the period.
3 Total returns exclude the effects of sales charges. The Fund's investment advisor may have waived a portion of its advisory fee and/or reimbursed a portion of the Fund's expenses. Without such waiver and/or reimbursement, the Fund's performance would have been lower. Returns for periods less than one year are not annualized.
4 Annualized.
The accompanying notes are an integral part of these financial statements.
45
Financial Highlights
The following per share data and ratios have been derived from information provided in the financial statements.
| | | | | Income from investment operations | | Dividends and distributions | | | | Ratios to Average Net Assets | |
| High Yield Fund | | Net asset
value,
beginning
of period | | Net
investment
income2 | | Net gains on
securities
(both
realized and
unrealized) | | Total from
investment
operations | | Dividends
(from net
investment
income) | | Distributions
(from capital
gains) | | Total
distributions | | Net asset
value, end
of period | | Total
return3 | | Net assets,
end of
period (in
thousands) | | Expenses,
net of
reimbursement/
waiver | | Expenses | | Net
investment
income | |
| Class I | |
| Year ended 6/30/2011 | | $ | 12.01 | | | $ | 0.92 | | | $ | 1.23 | | | $ | 2.15 | | | $ | (0.93 | ) | | $ | (0.44 | ) | | $ | (1.37 | ) | | $ | 12.79 | | | | 18.45 | % | | $ | 187,319 | | | | 0.70 | % | | | 0.75 | % | | | 7.15 | % | |
| Year ended 6/30/2010 | | | 10.90 | | | | 1.02 | | | | 1.65 | | | | 2.67 | | | | (1.03 | ) | | | (0.53 | ) | | | (1.56 | ) | | | 12.01 | | | | 25.45 | | | | 93,139 | | | | 0.70 | | | | 0.89 | | | | 8.51 | | |
Period from 3/31/20091
to 6/30/2009 | | | 10.00 | | | | 0.24 | | | | 0.90 | | | | 1.14 | | | | (0.24 | ) | | | — | | | | (0.24 | ) | | | 10.90 | | | | 11.40 | | | | 28,097 | | | | 0.704 | | | | 2.024 | | | | 9.044 | | |
| Class A | |
| Year ended 6/30/2011 | | | 11.97 | | | | 0.88 | | | | 1.21 | | | | 2.09 | | | | (0.89 | ) | | | (0.44 | ) | | | (1.33 | ) | | | 12.73 | | | | 18.11 | | | | 53,832 | | | | 0.95 | | | | 1.01 | | | | 6.88 | | |
| Year ended 6/30/2010 | | | 10.89 | | | | 0.97 | | | | 1.64 | | | | 2.61 | | | | (1.00 | ) | | | (0.53 | ) | | | (1.53 | ) | | | 11.97 | | | | 24.76 | | | | 22,090 | | | | 0.95 | | | | 1.12 | | | | 8.10 | | |
Period from 5/29/20091
to 6/30/2009 | | | 10.84 | | | | 0.07 | | | | 0.05 | | | | 0.12 | | | | (0.07 | ) | | | — | | | | (0.07 | ) | | | 10.89 | | | | 1.16 | | | | 2,551 | | | | 0.954 | | | | 2.164 | | | | 7.594 | | |
| | | Year Ended June 30, | | | |
| | | 2011 | | 2010 | | Period March 31, 20091
through June 30, 2009 | |
| Portfolio turnover rate | | | 139 | % | | | 175 | % | | | 123 | % | |
1 Commencement of operations.
2 Net investment income per share has been calculated based on average shares outstanding during the period.
3 Total returns exclude the effects of sales charges. The Fund's investment advisor may have waived a portion of its advisory fee and/or reimbursed a portion of the Fund's expenses. Without such waiver and/or reimbursement, the Fund's performance would have been lower. Returns for periods less than one year are not annualized.
4 Annualized.
The accompanying notes are an integral part of these financial statements.
46
Notes to the Financial Statements
JUNE 30, 2011
NOTE 1.
Organization. Hotchkis and Wiley Funds (the "Trust") is registered under the Investment Company Act of 1940, as amended (the "1940 Act"), as an open-end, management investment company. The Trust was organized as a Delaware statutory trust on July 23, 2001 and consists of seven series of shares. The Hotchkis and Wiley Diversified Value Fund, the Hotchkis and Wiley Large Cap Value Fund, the Hotchkis and Wiley Mid-Cap Value Fund, the Hotchkis and Wiley Small Cap Value Fund, the Hotchkis and Wiley Capital Income Fund and the Hotchkis and Wiley High Yield Fund (collectively, the "H&W Funds") are diversified series and the Hotchkis and Wiley Value Opportunities Fund (together with the H&W Funds, hereafter referred to as the "Funds") is a non-diversified series of the Trust. The Trust was organized to acquire the assets and liabilities of the Mercury HW Large Cap Value Fund, the Mercury HW Mid-Cap Value Fund and the Mercury HW Small Cap Value Fund (the "Mercury HW Funds"). On February 4, 2002, the Mercury HW Funds were reorganized into the Trust through a non-taxable exchange. On August 28, 2009, the Hotchkis and Wiley Core Value Fund was renamed the Hotchkis and Wiley Diversified Value Fund and the Hotchkis and Wiley All Cap Value Fund was renamed the Hotchkis and Wiley Value Opportunities Fund.
The Large Cap Value Fund and Mid-Cap Value Fund have four classes of shares: Class I, Class A, Class C and Class R. The Diversified Value Fund, Small Cap Value Fund, Value Opportunities Fund, Capital Income Fund and High Yield Fund have three classes of shares: Class I, Class A and Class C. Class A shares are sold with a front-end sales charge. Class C shares may be subject to a contingent deferred sales charge. Class C shares are automatically converted to Class A shares approximately eight years after purchase and will then be subject to lower distribution and service fees. All classes of shares have identical voting, dividend, liquidation and other rights and the same terms and conditions, except that Class A, Class C and Class R shares bear certain expenses related to the distribution and servicing expenditures. Currently, the Capital Income Fund and High Yield Fund are not offering Class C shares to investors.
Significant Accounting Policies. The Funds' financial statements have been prepared in conformity with accounting principles generally accepted in the United States of America, which may require the use of management accruals and estimates. Actual results could differ from those estimates. The following is a summary of significant accounting policies followed by the Funds. In preparing these financial statements, the Trust has evaluated events and transactions for potential recognition or disclosure through the date the financial statements were issued.
Security Valuation. Portfolio securities that are listed on a securities exchange (whether domestic or foreign) or The Nasdaq Stock Market ("NSM") (including the Nasdaq National Market and the Nasdaq Small Cap Market) are valued at the last reported sale price (or official closing price) on that day as of the close of the New York Stock Exchange (which is generally 4:00 p.m. Eastern time), or, in the absence of recorded sales, at the average of readily available closing bid and asked prices on such exchange or NSM. Unlisted equity securities that are not included in NSM are valued at the last sale price or, if the last sale price is unavailable, at the average of the quoted bid and asked prices in the over-the-counter market. Fixed-income securities are generally valued at the mean between the bid and asked prices on the basis of information from independent pricing services but may also be valued based on reported transactions or a broker-dealer quotation. The pricing services may provide a price determined by a matrix pricing method or other analytical pricing models. Short-term investments with remaining maturities of 60 days or less are valued at amortized cost, which approximates fair value. Investments quoted in foreign currency are valued daily in U.S. dollars on the basis of the foreign currency exchange rate prevailing at the time of valuation. Securities and assets for which market value quotations are not available are valued at their fair value as determined in good faith by or under the direction of the Trust's Board of Trustees. The Board has approved the use of Interactive Data's proprietary fair value pricing model to assist in determining current valuation for foreign securities traded in markets that close prior to the New York Stock Exchange. When fair value pricing is employed, the value of the portfolio security used to calculate the Funds' net asset values may differ from quoted or official closing prices.
The Trust has performed an analysis of all existing investments to determine the significance and character of all inputs to their fair value determination. Various inputs are used in determining the value of each Fund's investments. These inputs are summarized in the following three broad categories:
• Level 1 — Quoted unadjusted prices for identical instruments in active markets to which the Trust has access at the date of measurement.
• Level 2 — Quoted prices for similar instruments in active markets; quoted prices for identical or similar instruments in markets that are not active; and model-derived valuations in which all significant inputs and significant value drivers are observable in active markets. Level 2 inputs are those in markets for which there are few transactions, the prices are not current, little public information exists or instances where prices vary substantially over time or among brokered market makers.
• Level 3 — Model derived valuations in which one or more significant inputs or significant value drivers are unobservable. Unobservable inputs are those inputs that reflect the Trust's own assumptions that market participants would use to price the asset or liability based on the best available information.
47
The following table presents the valuation levels of each Fund's assets as of June 30, 2011:
| | | Diversified
Value | | Large Cap
Value | | Mid-Cap
Value | | Small Cap
Value | |
Level 1 —
Quoted prices in an
active market: | |
| Common Stocks | | $ | 384,544,168 | | | $ | 937,490,985 | | | $ | 1,342,292,523 | | | $ | 326,524,557 | | |
| Level 2 — | |
Other significant observable
market inputs | | | — | | | | — | | | | — | | | | — | | |
| Level 3 — | |
| Significant unobservable inputs | | | — | | | | — | | | | — | | | | — | | |
| Total Investments | | $ | 384,544,168 | | | $ | 937,490,985 | | | $ | 1,342,292,523 | | | $ | 326,524,557 | | |
| | | Value
Opportunities | | Capital
Income | | High Yield | |
Level 1 —
Quoted prices in an
active market: | |
| Common Stocks | | $ | 75,002,867 | | | $ | 4,505,015 | | | $ | 1,987,335 | | |
| Investment Companies | | | 848,085 | | | | 127,834 | | | | — | | |
| Preferred Stocks | | | 7,679,943 | | | | 152,768 | | | | 12,769,440 | | |
| Convertible Preferred Stocks | | | — | | | | 191,930 | | | | 10,363,329 | | |
| Warrants | | | — | | | | 8,688 | | | | 667,059 | | |
| Level 2 — | |
Other significant observable
market inputs: | |
| Common Stocks | | | 840,124 | | | | 2,990 | | | | 229,060 | | |
| Preferred Stocks | | | 406,205 | | | | 28,196 | | | | 3,829,152 | | |
| Convertible Bonds | | | — | | | | 28,800 | | | | 2,236,800 | | |
| Corporate Bonds | | | 712,950 | | | | 2,581,329 | | | | 195,825,328 | | |
Level 3 —
Significant unobservable inputs | | | — | | | | — | | | | — | | |
| Total Investments | | $ | 85,490,174 | | | $ | 7,627,550 | | | $ | 227,907,503 | | |
Please refer to the Schedule of Investments for additional information regarding the composition of the amounts listed above.
There were transfers from Level 1 to Level 2 of $406,205 for the Value Opportunities Fund using market value as of June 30, 2011. The transfers were due to lack of trading volume on June 30, 2011. There were no transfers into or out of Level 1 or Level 2 during the year ended June 30, 2011 for the Diversified Value Fund, Large Cap Value Fund, Mid-Cap Value Fund, Small Cap Value Fund, Capital Income Fund and High Yield Fund. Transfers between Levels are recognized at the end of the reporting period.
The Trust did not have any liabilities that were measured at fair value on June 30, 2011.
Income and Expense Allocation. Common expenses incurred by the Trust which are not allocable to a specific Fund are allocated among the Funds based upon relative net assets or evenly, depending on the nature of the expenditure. Net investment income, other than class-specific expenses, and realized and unrealized gains and losses are allocated daily to each class of shares based upon the relative net asset value of outstanding shares of each class at the beginning of the day (after adjusting for the current day's capital share activity of the respective class).
Dividends and Distributions to Shareholders. Dividends and distributions to shareholders are recorded on the ex-dividend date. Dividends from net investment income are declared daily and paid monthly for the Capital Income Fund and High Yield Fund, declared and paid semi-annually for the Large Cap Value Fund and declared and paid annually for the Diversified Value Fund, Mid-Cap Value Fund, Small Cap Value Fund and Value Opportunities Fund. Distributions of net realized capital gains, if any, will be declared and paid at least annually.
Security Transactions and Investment Income. Security and shareholder transactions are recorded on trade date. Realized gains and losses on sales of investments are calculated on the specifically identified cost basis of the securities. Dividend income, less foreign taxes withheld, if any, are recorded on the ex-dividend date. Interest income is recognized on the accrual basis. Market discounts, premiums and original issue discounts on fixed-income securities are amortized daily over the expected life of the security using the effective yield method. Return of capital distributions received from REIT securities are recorded as an adjustment to the cost of the security and thus may impact unrealized gains or losses on the security.
Foreign Currency Transactions. Securities and other assets and liabilities denominated in foreign currencies are translated into U.S. dollar amounts at the date of valuation. Purchases and sales of securities and income and expense items denominated in foreign currencies are translated into U.S. dollar amounts on the respective dates of such transactions. The Funds isolate the portion of realized gains or losses resulting from changes in foreign exchange rates on securities from the fluctuations arising from changes in market prices of securities held. Reported net realized foreign exchange gains
48
or losses arise from sales of securities, currency gains or losses realized between the trade and settlement dates on securities transactions and the difference between the amounts of dividends, interest and foreign withholding taxes recorded on the Funds' books and the U.S. dollar equivalent of the amounts actually received or paid.
Payment In-Kind Securities. Certain Funds may invest in payment in-kind securities. Payment in-kind securities give the issuer the option at each interest payment date of making interest payments in either cash or additional debt securities. Those additional debt securities usually have the same terms, including maturity dates and interest rates, and associated risks as the original bonds. The daily market quotations of the original bonds may include the accrued interest (referred to as a dirty price) and may require a pro-rata adjustment to interest receivable from the unrealized appreciation or depreciation of securities on the Statements of Assets and Liabilities.
Restricted and Illiquid Securities. The Funds may invest in securities that are subject to legal or contractual restrictions on resale or are illiquid. Restricted securities generally may be resold in transactions exempt from registration. An illiquid security is a security which cannot be disposed of promptly (within seven days) and in the usual course of business at approximately its fair value and includes repurchase agreements maturing in excess of seven days, time deposits with a withdrawal penalty, non-negotiable instruments and instruments for which no market exists. Disposal of these securities may involve time-consuming negotiations and expense, and prompt sale at the current valuation may be difficult.
NOTE 2.
Fees and Transactions with Affiliates. The Trust has entered into Investment Advisory Agreements for each of the Funds with Hotchkis and Wiley Capital Management, LLC (the "Advisor"), with which the officers and a Trustee of the Trust are affiliated. The Advisor is a limited liability company, the primary members of which are HWCap Holdings, a limited liability company with members who are current and former employees of the Advisor, and Stephens — H&W, LLC, a limited liability company whose primary member is SF Holding Corp., which is a diversified holding company. The Advisor is responsible for the management of the Funds' investments and provides the personnel, facilities, equipment and certain other services necessary to the operations of each Fund. The Advisor receives a fee, computed daily and payable monthly, at the annual rates presented below as applied to each Fund's daily net assets. The Advisor has contractually agreed to pay all operating expenses in excess of the annual rates presented below as applied to such Fund's daily net assets through October 31, 2012.
| | | Diversified
Value | | Large Cap
Value | | Mid-Cap
Value | | Small Cap
Value | | Value
Opportunities | | Capital
Income | | High
Yield | |
| Annual Advisory Fee Rate | | | 0.75 | %1 | | | 0.75 | %1 | | | 0.75 | %1 | | | 0.75 | % | | | 0.75 | % | | | 0.65 | % | | | 0.55 | % | |
Annual cap on expenses —
Class I | | | 0.95 | % | | | 1.05 | % | | | 1.15 | % | | | 1.25 | % | | | 1.25 | % | | | 0.80 | % | | | 0.70 | % | |
Annual cap on expenses —
Class A | | | 1.20 | % | | | 1.30 | % | | | 1.40 | % | | | 1.50 | % | | | 1.50 | % | | | 1.05 | % | | | 0.95 | % | |
Annual cap on expenses —
Class C | | | 1.95 | % | | | 2.05 | % | | | 2.15 | % | | | 2.25 | % | | | 2.25 | % | | | 1.80 | % | | | 1.70 | % | |
Annual cap on expenses —
Class R | | Not applicable | | | 1.55 | % | | | 1.65 | % | | Not applicable | | Not applicable | | Not applicable | | Not applicable | |
1 Effective January 1, 2007, the Annual Advisory Fee Rate is 0.75% for the first $5 billion in assets, 0.65% for the next $5 billion in assets and 0.60% for assets over $10 billion.
Quasar Distributors, LLC is the principal underwriter and distributor for the shares of the Funds ("Quasar" or the "Distributor"). The Distributor is affiliated with the Funds' transfer agent, fund accountant and administrator, U.S. Bancorp Fund Services, LLC. Pursuant to the Distribution Plan adopted by the Trust in accordance with Rule 12b-1 under the 1940 Act, the Funds pay the Distributor ongoing distribution and service fees. The fees are accrued daily at the annual rates based upon the average daily net assets of the shares as follows:
| | | Distribution and Service
Fee | |
| Class A | | | 0.25 | % | |
| Class C | | | 1.00 | % | |
| Class R | | | 0.50 | % | |
Pursuant to separate agreements with the Distributor, selected dealers and other financial intermediaries also provide distribution services to the Funds. The ongoing distribution and service fee compensates the Distributor and selected dealers for providing distribution-related and shareholder services to Class A, Class C and Class R shareholders.
Certain selected dealers and other financial intermediaries charge a fee for shareholder accounting services and administrative services that they provide to the Funds on behalf of certain shareholders; the portion of this fee paid by the Funds is included within "Transfer agent fees and expenses" in the Statements of Operations.
Stephens Inc. is an affiliated broker-dealer of the Funds. For the year ended June 30, 2011, Stephens Inc. received the following amounts of front-end sales charges for Class A shares:
Diversified
Value | | Large Cap
Value | | Mid-Cap
Value | | Small Cap
Value | | Value
Opportunities | | Capital
Income* | | High Yield | |
| $ | — | | | $ | 2,198 | | | $ | 5,805 | | | $ | 4,193 | | | $ | 371 | | | $ | — | | | $ | 471 | | |
* The Capital Income Fund — Class A commenced operations on February 28, 2011.
49
U.S. Bancorp Fund Services, LLC, the Funds' administrator, agreed to waive a portion of its fees during the Capital Income Fund's first year of operations.
NOTE 3.
Investments. Purchases and sales of investment securities, excluding short-term investments, for the year ended June 30, 2011 were as follows:
| | | Diversified
Value | | Large Cap
Value | | Mid-Cap
Value | | Small Cap
Value | | Value
Opportunities | | Capital
Income* | | High
Yield | |
| Purchases | | $ | 247,196,926 | | | $ | 477,833,612 | | | $ | 775,259,754 | | | $ | 180,399,536 | | | $ | 108,273,573 | | | $ | 9,758,587 | | | $ | 373,483,693 | | |
| Sales | | | 342,052,803 | | | | 828,487,205 | | | | 941,494,107 | | | | 146,135,541 | | | | 94,779,292 | | | | 2,344,375 | | | | 273,298,963 | | |
* The Fund commenced operations on December 31, 2010.
The Funds did not have any purchases or sales of U.S. Government securities for the year ended June 30, 2011.
NOTE 4.
Federal Income Taxes. It is each Fund's policy to comply with the requirements of the Internal Revenue Code applicable to regulated investment companies and each Fund intends to distribute substantially all of its investment company net taxable income and net capital gains to shareholders. Therefore, no federal income tax provision is required. Under the applicable foreign tax law, a withholding tax may be imposed on interest, dividends and capital gains at various rates.
Distributions paid to shareholders are based on net investment income and net realized gains determined on a tax basis, which may differ from net investment income and net realized gains for financial reporting purposes. The fiscal year in which amounts are distributed may differ from the year in which the net investment income and net realized gains are recorded by the Funds for financial reporting purposes. The Funds may utilize earnings and profits distributed to shareholders on redemptions of shares as part of the dividends paid deduction. Generally accepted accounting principles require that permanent financial reporting and tax differences be reclassified within the capital accounts.
The following information is presented on an income tax basis as of June 30, 2011:
| | | Diversified
Value | | Large Cap
Value | | Mid-Cap Value | | Small Cap Value | | Value
Opportunities | | Capital
Income | | High Yield | |
| Tax cost of investments | | $ | 460,418,719 | | | $ | 1,151,205,500 | | | $ | 1,504,069,118 | | | $ | 319,367,611 | | | $ | 81,265,637 | | | $ | 7,446,935 | | | $ | 223,057,017 | | |
Gross unrealized
appreciation | | | 29,408,639 | | | | 70,259,180 | | | | 91,732,586 | | | | 49,751,845 | | | | 11,306,471 | | | | 297,710 | | | | 8,103,593 | | |
Gross unrealized
depreciation | | | (105,283,190 | ) | | | (283,973,695 | ) | | | (253,509,181 | ) | | | (42,594,899 | ) | | | (7,081,934 | ) | | | (117,095 | ) | | | (3,253,107 | ) | |
Net unrealized appreciation
(depreciation) on
investments | | | (75,874,551 | ) | | | (213,714,515 | ) | | | (161,776,595 | ) | | | 7,156,946 | | | | 4,224,537 | | | | 180,615 | | | | 4,850,486 | | |
Distributable ordinary income
(as of 6/30/11) | | | 5,573,244 | | | | 15,119,527 | | | | 668,761 | | | | — | | | | 1,430,002 | | | | 76,927 | | | | 6,791,093 | | |
Distributable long-term
gains (as of 6/30/11) | | | — | | | | — | | | | — | | | | — | | | | 442,058 | | | | — | | | | 2,411,752 | | |
| Total distributable earnings | | | 5,573,244 | | | | 15,119,527 | | | | 668,761 | | | | — | | | | 1,872,060 | | | | 76,927 | | | | 9,202,845 | | |
| Other accumulated losses | | | (753,434,140 | ) | | | (1,118,062,651 | ) | | | (353,982,325 | ) | | | (15,455,203 | ) | | | (307,179 | ) | | | (767 | ) | | | (566,707 | ) | |
Total accumulated gains
(losses) | | $ | (823,735,447 | ) | | $ | (1,316,657,639 | ) | | $ | (515,090,159 | ) | | $ | (8,298,257 | ) | | $ | 5,789,418 | | | $ | 256,775 | | | $ | 13,486,624 | | |
As of the close of business on December 31, 2010, in exchange for shares the Advisor transferred assets valued at $3,298,650 to the Capital Income Fund. As a result of the tax-free transfers, the Capital Income Fund acquired $30,179 of unrealized appreciation for tax purposes. As of June 30, 2011, the Capital Income Fund held securities with $28,274 of net unrealized appreciation relating to the transfers.
On the Statement of Assets and Liabilities, the following adjustments were made for permanent tax adjustments. These differences are due primarily to differing treatment for items such as in-kind redemptions, net operating losses, foreign currency gain/loss transactions, and transfers in-kind.
| | | Paid-
in Capital | | Undistributed
Net Investment
Income (Loss) | | Undistributed
Net Realized Gain
(Loss) on Securities | |
| Diversified Value | | $ | — | | | $ | — | | | $ | — | | |
| Large Cap Value | | | 257,199 | | | | — | | | | (257,199 | ) | |
| Mid-Cap Value | | | — | | | | — | | | | — | | |
| Small Cap Value | | | (562,964 | ) | | | 586,369 | | | | (23,405 | ) | |
| Value Opportunities | | | — | | | | (6,102 | ) | | | 6,102 | | |
| Capital Income | | | (30,179 | ) | | | — | | | | 30,179 | | |
| High Yield | | | 64,585 | | | | 68 | | | | (64,653 | ) | |
50
The tax components of distributions paid during the fiscal years ended June 30, 2011 and 2010, capital loss carryovers as of June 30, 2011, and tax basis post-October losses as of June 30, 2011, which are not recognized for tax purposes until the first day of the following fiscal year, are:
| | | June 30, 2011 | | June 30, 2010 | |
| | | Ordinary
Income
Distributions | | Long-Term
Capital Gains
Distributions | | Net Capital
Loss
Carryovers | | Post-
October
Losses | | Ordinary
Income
Distributions | | Long-Term
Capital Gains
Distributions | |
| Diversified Value | | $ | 3,850,337 | | | $ | — | | | $ | (753,434,140 | )1 | | $ | — | | | $ | 10,177,439 | | | $ | — | | |
| Large Cap Value | | | 1,705,504 | | | | — | | | | (1,117,291,671 | )1 | | | — | | | | 35,935,895 | | | | — | | |
| Mid-Cap Value | | | 3,701,095 | | | | — | | | | (353,982,325 | )1 | | | — | | | | 11,134,207 | | | | — | | |
| Small Cap Value | | | 354,319 | | | | — | | | | (10,875,844 | )2 | | | (4,579,359 | ) | | | 1,074,497 | | | | — | | |
| Value Opportunities | | | 594,006 | | | | — | | | | — | | | | (6,102 | )3 | | | 748,471 | | | | — | | |
| Capital Income* | | | 150,469 | | | | — | | | | — | | | | — | | | | — | | | | — | | |
| High Yield | | | 20,868,402 | | | | 659,737 | | | | — | | | | — | | | | 8,272,842 | | | | — | | |
* The Fund commenced operations on December 31, 2010.
1 Expires from 6/30/2017 to 6/30/2018.
2 Expires on 6/30/2017.
3 Post-October currency loss.
As of and during the year ended June 30, 2011, the Trust did not have a liability for any unrecognized tax benefits. The Trust recognizes interest and penalties, if any, related to unrecognized tax benefits as income tax expense in the Statements of Operations. During the year ended June 30, 2011, the Trust did not incur any interest or penalties. The tax years ended June 30, 2008 through June 30, 2011 remain open and subject to examination by tax jurisdictions.
NOTE 5.
Capital Share Transactions. Transactions in capital shares for each class were as follows:
| | | Sales | | Reinvestment of
dividends
and distributions | | Redemptions | | Net increase (decrease) | |
| | | Shares | | Amount | | Shares | | Amount | | Shares | | Amount | | Shares | | Amount | |
| Year Ended June 30, 2011 | |
| Diversified Value Fund | |
| Class I | | | 9,063,743 | | | $ | 84,516,357 | | | | 331,261 | | | $ | 3,153,607 | | | | (18,252,601 | ) | | $ | (167,482,470 | ) | | | (8,857,597 | ) | | $ | (79,812,506 | ) | |
| Class A | | | 1,775,147 | | | | 16,177,915 | | | | 37,457 | | | | 358,088 | | | | (2,994,213 | ) | | | (28,657,112 | ) | | | (1,181,609 | ) | | | (12,121,109 | ) | |
| Class C | | | 28,736 | | | | 263,989 | | | | 4,199 | | | | 39,850 | | | | (550,265 | ) | | | (5,171,046 | ) | | | (517,330 | ) | | | (4,867,207 | ) | |
Total net increase
(decrease) | | | 10,867,626 | | | | 100,958,261 | | | | 372,917 | | | | 3,551,545 | | | | (21,797,079 | ) | | | (201,310,628 | ) | | | (10,556,536 | ) | | | (96,800,822 | ) | |
| Large Cap Value Fund | |
| Class I^ | | | 11,670,128 | | | | 188,092,474 | | | | 69,479 | | | | 1,118,612 | | | | (12,935,580 | ) | | | (202,979,846 | ) | | | (1,195,973 | ) | | | (13,768,760 | ) | |
| Class A | | | 13,456,972 | | | | 203,875,840 | | | | 28,671 | | | | 459,024 | | | | (33,141,324 | ) | | | (526,050,068 | ) | | | (19,655,681 | ) | | | (321,715,204 | ) | |
| Class C | | | 119,277 | | | | 1,843,113 | | | | — | | | | — | | | | (813,915 | ) | | | (12,683,813 | ) | | | (694,638 | ) | | | (10,840,700 | ) | |
| Class R | | | 168,158 | | | | 2,687,617 | | | | — | | | | — | | | | (457,344 | ) | | | (7,322,516 | ) | | | (289,186 | ) | | | (4,634,899 | ) | |
Total net increase
(decrease) | | | 25,414,535 | | | | 396,499,044 | | | | 98,150 | | | | 1,577,636 | | | | (47,348,163 | ) | | | (749,036,243 | ) | | | (21,835,478 | ) | | | (350,959,563 | ) | |
| Mid-Cap Value Fund | |
| Class I | | | 11,457,820 | | | | 268,464,741 | | | | 133,711 | | | | 3,091,411 | | | | (16,711,568 | ) | | | (362,229,904 | ) | | | (5,120,037 | ) | | | (90,673,752 | ) | |
| Class A | | | 2,140,945 | | | | 49,682,049 | | | | 11,697 | | | | 268,444 | | | | (4,595,466 | ) | | | (105,424,146 | ) | | | (2,442,824 | ) | | | (55,473,653 | ) | |
| Class C | | | 296,806 | | | | 6,594,390 | | | | — | | | | — | | | | (560,030 | ) | | | (12,100,770 | ) | | | (263,224 | ) | | | (5,506,380 | ) | |
| Class R | | | 55,236 | | | | 1,257,221 | | | | 55 | | | | 1,259 | | | | (109,759 | ) | | | (2,481,368 | ) | | | (54,468 | ) | | | (1,222,888 | ) | |
Total net increase
(decrease) | | | 13,950,807 | | | | 325,998,401 | | | | 145,463 | | | | 3,361,114 | | | | (21,976,823 | ) | | | (482,236,188 | ) | | | (7,880,553 | ) | | | (152,876,673 | ) | |
| Small Cap Value Fund | |
| Class I | | | 2,122,618 | | | | 85,562,223 | | | | 3,328 | | | | 135,240 | | | | (1,613,031 | ) | | | (62,022,961 | ) | | | 512,915 | | | | 23,674,502 | | |
| Class A | | | 1,495,708 | | | | 58,804,285 | | | | 683 | | | | 27,750 | | | | (1,534,006 | ) | | | (55,671,977 | ) | | | (37,615 | ) | | | 3,160,058 | | |
| Class C | | | 219,582 | | | | 8,286,450 | | | | — | | | | — | | | | (75,395 | ) | | | (2,791,094 | ) | | | 144,187 | | | | 5,495,356 | | |
Total net increase
(decrease) | | | 3,837,908 | | | | 152,652,958 | | | | 4,011 | | | | 162,990 | | | | (3,222,432 | ) | | | (120,486,032 | ) | | | 619,487 | | | | 32,329,916 | | |
51
| | | Sales | | Reinvestment of
dividends
and distributions | | Redemptions | | Net increase (decrease) | |
| | | Shares | | Amount | | Shares | | Amount | | Shares | | Amount | | Shares | | Amount | |
| Year Ended June 30, 2011 | |
| Value Opportunities Fund | |
| Class I | | | 661,205 | | | $ | 12,796,546 | | | | 15,038 | | | $ | 280,771 | | | | (437,749 | ) | | $ | (7,961,186 | ) | | | 238,494 | | | $ | 5,116,131 | | |
| Class A | | | 2,180,195 | | | | 43,268,913 | | | | 7,314 | | | | 136,781 | | | | (1,989,792 | ) | | | (36,800,821 | ) | | | 197,717 | | | | 6,604,873 | | |
| Class C | | | 235,941 | | | | 4,511,089 | | | | 1,791 | | | | 32,156 | | | | (142,124 | ) | | | (2,558,691 | ) | | | 95,608 | | | | 1,984,554 | | |
Total net increase
(decrease) | | | 3,077,341 | | | | 60,576,548 | | | | 24,143 | | | | 449,708 | | | | (2,569,665 | ) | | | (47,320,698 | ) | | | 531,819 | | | | 13,705,558 | | |
| Capital Income Fund+ | |
| Class I* | | | 744,592 | | | | 7,495,847 | | | | 13,686 | | | | 142,260 | | | | (9,707 | ) | | | (99,805 | ) | | | 748,571 | | | | 7,538,302 | | |
| Class A** | | | 8,368 | | | | 86,771 | | | | 85 | | | | 889 | | | | (573 | ) | | | (5,842 | ) | | | 7,880 | | | | 81,818 | | |
Total net increase
(decrease) | | | 752,960 | | | | 7,582,618 | | | | 13,771 | | | | 143,149 | | | | (10,280 | ) | | | (105,647 | ) | | | 756,451 | | | | 7,620,120 | | |
| High Yield Fund | |
| Class I*** | | | 13,262,284 | | | | 169,337,240 | | | | 925,870 | | | | 11,784,662 | | | | (7,299,094 | ) | | | (94,184,191 | ) | | | 6,889,060 | | | | 86,937,711 | | |
| Class A | | | 3,116,008 | | | | 39,947,495 | | | | 272,528 | | | | 3,456,132 | | | | (1,006,952 | ) | | | (12,879,276 | ) | | | 2,381,584 | | | | 30,524,351 | | |
Total net increase
(decrease) | | | 16,378,292 | | | | 209,284,735 | | | | 1,198,398 | | | | 15,240,794 | | | | (8,306,046 | ) | | | (107,063,467 | ) | | | 9,270,644 | | | | 117,462,062 | | |
| Year Ended June 30, 2010 | |
| Diversified Value Fund | |
| Class I | | | 4,972,666 | | | | 41,350,065 | | | | 1,045,965 | | | | 8,493,234 | | | | (16,436,717 | ) | | | (129,371,439 | ) | | | (10,418,086 | ) | | | (79,528,140 | ) | |
| Class A | | | 522,457 | | | | 4,223,233 | | | | 80,860 | | | | 659,817 | | | | (3,816,820 | ) | | | (30,671,843 | ) | | | (3,213,503 | ) | | | (25,788,793 | ) | |
| Class C | | | 153,083 | | | | 1,262,454 | | | | 21,837 | | | | 177,316 | | | | (847,963 | ) | | | (6,936,973 | ) | | | (673,043 | ) | | | (5,497,203 | ) | |
Total net increase
(decrease) | | | 5,648,206 | | | | 46,835,752 | | | | 1,148,662 | | | | 9,330,367 | | | | (21,101,500 | ) | | | (166,980,255 | ) | | | (14,304,632 | ) | | | (110,814,136 | ) | |
| Large Cap Value Fund | |
| Class I | | | 25,070,013 | | | | 352,828,596 | | | | 1,393,942 | | | | 14,510,940 | | | | (34,132,258 | ) | | | (454,373,507 | ) | | | (7,668,303 | ) | | | (87,033,971 | ) | |
| Class A | | | 21,200,143 | | | | 288,574,600 | | | | 1,570,657 | | | | 16,303,426 | | | | (35,228,715 | ) | | | (487,066,216 | ) | | | (12,457,915 | ) | | | (182,188,190 | ) | |
| Class C | | | 202,449 | | | | 2,651,952 | | | | 64,665 | | | | 666,047 | | | | (1,318,327 | ) | | | (17,703,356 | ) | | | (1,051,213 | ) | | | (14,385,357 | ) | |
| Class R | | | 266,107 | | | | 3,662,651 | | | | 34,066 | | | | 357,350 | | | | (840,146 | ) | | | (11,419,061 | ) | | | (539,973 | ) | | | (7,399,060 | ) | |
Total net increase
(decrease) | | | 46,738,712 | | | | 647,717,799 | | | | 3,063,330 | | | | 31,837,763 | | | | (71,519,446 | ) | | | (970,562,140 | ) | | | (21,717,404 | ) | | | (291,006,578 | ) | |
| Mid-Cap Value Fund | |
| Class I | | | 17,043,465 | | | | 309,569,795 | | | | 434,374 | | | | 7,727,506 | | | | (31,010,770 | ) | | | (566,870,167 | ) | | | (13,532,931 | ) | | | (249,572,866 | ) | |
| Class A | | | 3,977,627 | | | | 71,499,896 | | | | 62,674 | | | | 1,108,079 | | | | (8,508,970 | ) | | | (150,031,070 | ) | | | (4,468,669 | ) | | | (77,423,095 | ) | |
| Class C | | | 312,381 | | | | 5,449,500 | | | | 8,473 | | | | 141,750 | | | | (604,972 | ) | | | (10,228,974 | ) | | | (284,118 | ) | | | (4,637,724 | ) | |
| Class R | | | 97,352 | | | | 1,761,632 | | | | 479 | | | | 8,560 | | | | (239,555 | ) | | | (4,422,500 | ) | | | (141,724 | ) | | | (2,652,308 | ) | |
Total net increase
(decrease) | | | 21,430,825 | | | | 388,280,823 | | | | 506,000 | | | | 8,985,895 | | | | (40,364,267 | ) | | | (731,552,711 | ) | | | (18,427,442 | ) | | | (334,285,993 | ) | |
| Small Cap Value Fund | |
| Class I | | | 1,988,405 | | | | 62,418,930 | | | | 9,658 | | | | 284,582 | | | | (4,476,881 | ) | | | (130,958,370 | ) | | | (2,478,818 | ) | | | (68,254,858 | ) | |
| Class A | | | 1,411,117 | | | | 48,237,777 | | | | 1,835 | | | | 55,335 | | | | (651,007 | ) | | | (20,085,060 | ) | | | 761,945 | | | | 28,208,052 | | |
| Class C | | | 98,402 | | | | 3,111,570 | | | | 201 | | | | 5,579 | | | | (39,990 | ) | | | (1,194,077 | ) | | | 58,613 | | | | 1,923,072 | | |
Total net increase
(decrease) | | | 3,497,924 | | | | 113,768,277 | | | | 11,694 | | | | 345,496 | | | | (5,167,878 | ) | | | (152,237,507 | ) | | | (1,658,260 | ) | | | (38,123,734 | ) | |
| Value Opportunities Fund | |
| Class I | | | 632,910 | | | | 10,063,236 | | | | 22,673 | | | | 328,752 | | | | (654,387 | ) | | | (8,215,374 | ) | | | 1,196 | | | | 2,176,614 | | |
| Class A | | | 1,251,634 | | | | 19,076,092 | | | | 12,357 | | | | 179,550 | | | | (674,733 | ) | | | (10,186,329 | ) | | | 589,258 | | | | 9,069,313 | | |
| Class C | | | 75,156 | | | | 1,136,877 | | | | 3,299 | | | | 46,251 | | | | (196,120 | ) | | | (2,770,658 | ) | | | (117,665 | ) | | | (1,587,530 | ) | |
Total net increase
(decrease) | | | 1,959,700 | | | | 30,276,205 | | | | 38,329 | | | | 554,553 | | | | (1,525,240 | ) | | | (21,172,361 | ) | | | 472,789 | | | | 9,658,397 | | |
52
| | | Sales | | Reinvestment of
dividends
and distributions | | Redemptions | | Net increase (decrease) | |
| | | Shares | | Amount | | Shares | | Amount | | Shares | | Amount | | Shares | | Amount | |
| Year Ended June 30, 2010 | |
| High Yield Fund**** | |
| Class I | | | 4,801,401 | | | $ | 58,007,943 | | | | 508,218 | | | $ | 6,077,968 | | | | (135,404 | ) | | $ | (1,636,737 | ) | | | 5,174,215 | | | $ | 62,449,174 | | |
| Class A | | | 1,732,205 | | | | 20,773,851 | | | | 122,212 | | | | 1,458,442 | | | | (242,963 | ) | | | (2,942,288 | ) | | | 1,611,454 | | | | 19,290,005 | | |
Total net increase
(decrease) | | | 6,533,606 | | | | 78,781,794 | | | | 630,430 | | | | 7,536,410 | | | | (378,367 | ) | | | (4,579,025 | ) | | | 6,785,669 | | | | 81,739,179 | | |
^ Includes an in-kind redemption which resulted in a realized gain of $290,071.
+ As of June 30, 2011, the Capital Income Fund had a single shareholder, Hotchkis and Wiley Capital Management, LLC, which individually held 47.1% of the total shares outstanding of the Capital Income Fund.
* For the period December 31, 2010 (commencement of operations) to June 30, 2011.
** For the period February 28, 2011 (commencement of operations) to June 30, 2011.
*** Includes an in-kind redemption which resulted in a realized gain of $64,585.
**** As of June 30, 2010, the High Yield Fund had a single shareholder, Hotchkis and Wiley Capital Management, LLC, which individually held 11.5% of the total shares outstanding of the High Yield Fund.
NOTE 6.
Investments in Affiliated Issuers. An issuer in which a Fund's holdings represent 5% or more of the outstanding voting securities of the issuer is an "affiliated" issuer as defined in the 1940 Act. A schedule of each Fund's investments in securities of affiliated issuers held during the year ended June 30, 2011, is set forth below:
Mid-Cap Value Fund
| Issuer Name | | Share Balance
At July 1, 2010 | | Additions | | Reductions | | Share Balance
At June 30, 2011 | | Dividend
Income | | Value
At June 30, 2011 | |
| Valassis Communications, Inc.+ | | | 1,554,400 | | | | 1,470,500 | | | | 322,000 | | | | 2,702,900 | | | $ | — | | | $ | 81,897,870 | | |
| | | | | | | | | | | $ | — | | | | | | |
+ Non-income producing security.
Small Cap Value Fund
| Issuer Name | | Share Balance
At July 1, 2010 | | Additions | | Reductions | | Share Balance
At June 30, 2011 | | Dividend
Income | | Value
At June 30, 2011 | |
| Hudson Highland Group, Inc.*+ | | | 1,624,700 | | | | — | | | | — | | | | 1,624,700 | | | $ | — | | | $ | 8,692,145 | | |
| Overhill Farms, Inc.+ | | | 780,200 | | | | 109,000 | | | | — | | | | 889,200 | | | | — | | | | 4,935,060 | | |
| | | | | | | | | | | $ | — | | | | | | |
* Issuer was not an affiliate as of June 30, 2011.
+ Non-income producing security.
Value Opportunities Fund
| Issuer Name | | Share Balance
At July 1, 2010 | | Additions | | Reductions | | Share Balance
At June 30, 2011 | | Dividend
Income | | Value
At June 30, 2011 | |
| Tree.com, Inc.+ | | | 256,000 | | | | 320,400 | | | | 23,200 | | | | 553,200 | | | $ | — | | | $ | 2,832,384 | | |
| | | | | | | | | | | $ | — | | | | | | |
+ Non-income producing security.
NOTE 7.
Securities Lending. Effective December 2007, the Funds entered into a securities lending arrangement with Brown Brothers Harriman & Co. (the "Custodian"). Under the securities lending agreement, the Custodian is authorized to loan securities on behalf of the Funds to approved brokers. In exchange, the Funds receive cash collateral in the amount of at least 102% of the value of the securities loaned plus accrued interest. The total market value of securities on loan for each Fund as of June 30, 2011 is disclosed on the Schedule of Investments. The cash collateral is invested in short-term instruments as noted on the Schedule of Investments. Income earned from these investments is included in "Securities on loan" on the Statement of Operations and is allocated to each Fund based on each Fund's proportion of the total cash collateral received. Securities lending involves counterparty risks, including the risk that the loaned securities may not be returned in a timely manner or at all. Subject to certain conditions, the Custodian has agreed to indemnify the Funds from losses resulting from a borrower's failure to return a loaned security. In addition, the Funds bear the risk of loss associated with the investment of cash collateral received.
53
A portion of the income generated by the investment of the collateral, net of any rebates paid by the Custodian to borrowers, is remitted to the Custodian as lending agent, and the remainder is paid to the applicable Fund.
NOTE 8.
Indemnifications. Under the Trust's organizational documents and indemnification agreements between each independent Trustee and the Trust, its officers and Trustees are indemnified against certain liability arising out of the performance of their duties to the Funds. In addition, in the normal course of business the Trust enters into contracts that contain a variety of representations and warranties, which provide general indemnifications. The Funds' maximum exposure under these arrangements is unknown, as this would involve future claims that may be made against the Funds. However, based on experience, the Funds expect the risk of loss to be remote.
NOTE 9.
Risk Factors. Investing in a Fund may involve certain risks including, but not limited to, those described below.
Lower rated debt securities generally have higher rates of interest and involve greater risk of default or price changes due to changes in the issuer's creditworthiness than higher rated debt securities. The market prices of these securities may fluctuate more than higher quality securities and may decline significantly in periods of general economic difficulty. There may be little trading in the secondary market for particular debt securities, which may make them more difficult to value or sell.
The prices of, and the income generated by, most debt securities held by a Fund may be affected by changing interest rates and by changes in the effective maturities and credit ratings of these securities. For example, the prices of debt securities in a Fund's portfolio generally will decline when interest rates rise and increase when interest rates fall. In addition, falling interest rates may cause an issuer to redeem, "call" or refinance a security before its stated maturity, which may result in the fund having to reinvest the proceeds in lower yielding securities. Debt securities are also subject to credit risk, which is the possibility that the credit strength of an issuer will weaken and/or an issuer of a debt security will fail to make timely payments of principal or interest and the security will go into default. Longer maturity debt securities generally have higher rates of interest and may be subject to greater price fluctuations than shorter maturity debt securities.
The prices of, and the income generated by, the common stocks and other equity securities held by a Fund may decline in response to certain events taking place around the world, including those directly involving the issuers whose securities are owned by the Fund; conditions affecting the general economy; overall market changes; local, regional or global political, social or economic instability; governmental or governmental agency responses to economic conditions; and currency, interest rate and commodity price fluctuations.
Certain funds, accounts, individuals or affiliates may from time to time own (beneficially or of record) or control a significant percentage of the Funds' shares. Redemptions by these entities of their holdings in the Funds may impact the Funds' liquidity and NAV. These redemptions may also force the Funds to sell securities.
NOTE 10.
New Accounting Pronouncements. In May 2011, the Financial Accounting Standards Board issued Accounting Standards Update ("ASU") No. 2011-04 "Amendments to Achieve Common Fair Value Measurement and Disclosure Requirements in U.S. GAAP and IFRSs." ASU No. 2011-04 requires additional disclosures regarding fair value measurements. Effective for fiscal years beginning after December 15, 2011, and for interim periods within those fiscal years, entities will need to disclose the following:
1) the amounts of any transfers between Level 1 and Level 2 and the reasons for those transfers, and
2) for Level 3 fair value measurements, quantitative information about the significant unobservable inputs used, a description of the entity's valuation processes, and a narrative description of the sensitivity of the fair value measurement to changes in the unobservable inputs and the interrelationship between inputs.
Management is currently evaluating the impact ASU No. 2011-04 will have on the Funds' financial statement disclosures.
NOTE 11.
The Regulated Investment Company Modernization Act. On December 22, 2010, The Regulated Investment Company Modernization Act of 2010 (the "Modernization Act") was signed by The President. The Modernization Act is the first major piece of legislation affecting Regulated Investment Companies ("RICs") since 1986 and it modernizes several of the federal income and excise tax provisions related to RICs. Some highlights of the enacted provisions are described below.
New capital losses may now be carried forward indefinitely, and retain the character of the original loss. Under pre-enactment law, capital losses could be carried forward for eight years, and carried forward as short-term capital, irrespective of the character of the original loss. The Modernization Act contains simplification provisions, which are aimed at preventing disqualification of a RIC for "inadvertent" failures of the asset diversification and/or qualifying income tests. Additionally, the Modernization Act exempts RICs from the preferential dividend rule, and repealed the 60-day designation requirement for certain types of pay-through income and gains. Finally, the Modernization Act contains several provisions aimed at preserving the character of distributions made by a fiscal year RIC during the portion of its taxable year ending after October 31 or December 31, reducing the circumstances under which a RIC might be required to file amended Forms 1099 to restate previously reported distributions.
Except for the simplification provisions related to RIC qualification, the Modernization Act is effective for taxable years beginning after December 22, 2010. The provisions related to RIC qualification are effective for taxable years for which the extended due date of the tax return is after December 22, 2010.
54
NOTE 12.
Subsequent Events. The Large Cap Value Fund declared distributions from net investment income payable on July 8, 2011 to shareholders of record on July 7, 2011. The distributions from Class I shares were $5,426,422 or $0.16 per share, Class A shares were $2,061,315 or $0.12 per share, Class C shares were $126,995 or $0.06 per share and Class R shares were $85,268 or $0.10 per share.
NOTE 13.(UNAUDITED)
Federal Tax Disclosure. The Funds designated as long-term capital gain dividends, pursuant to Internal Revenue Code Section 852(b)(3), the amount necessary to reduce the earnings and profits of the Funds related to net capital gains to zero for the tax year ended June 30, 2011.
For the year ended June 30, 2011, the following percentages of ordinary distributions paid qualify for the dividend received deduction available to corporate shareholders: Diversified Value Fund — 100.00%, Large Cap Value Fund — 100.00%, Mid-Cap Value Fund — 100.00%, Small Cap Value Fund — 100.00%, Value Opportunities Fund — 100.00%, Capital Income Fund — 41.34%, High Yield Fund — 3.66%.
For the year ended June 30, 2011, the following percentages of ordinary distributions paid are designated as qualified income under the Jobs and Growth Tax Relief Reconciliation Act of 2003: Diversified Value Fund — 100.00%, Large Cap Value Fund — 100.00%, Mid-Cap Value Fund — 100.00%, Small Cap Value Fund — 100.00%, Value Opportunities Fund — 100.00%, Capital Income Fund — 55.64%, High Yield Fund — 3.66%. Shareholders should consult their tax advisors.
Additional Information Applicable to Foreign Shareholders Only. For the year ended June 30, 2011, the Funds designate the following percentages of ordinary distributions paid as interest-related dividends under Internal Revenue Code Section 871(k)(1)(c): Diversified Value Fund — 0.47%, Large Cap Value Fund — 0.17%, Mid-Cap Value Fund — 0.98%, Small Cap Value Fund — 0.69%, Value Opportunities Fund — 0.80%, Capital Income Fund — 58.46%, High Yield Fund — 85.55%. For the year ended June 30, 2011, the following percentages of ordinary income distributions paid are designated as short-term capital gain distributions under Internal Revenue Code Section 871(k)(2)(c): Diversified Value Fund — 0.00%, Large Cap Value Fund — 0.00%, Mid-Cap Value Fund — 0.00%, Small Cap Value Fund — 0.00%, Value Opportunities Fund — 0.00%, Capital Income Fund — 0.00%, High Yield Fund — 28.29%.
55
Report of Independent Registered Public Accounting Firm
To the Board of Trustees and Shareholders
of Hotchkis and Wiley Funds
In our opinion, the accompanying statements of assets and liabilities, including the schedules of investments, and the related statements of operations and of changes in net assets and the financial highlights present fairly, in all material respects, the financial position of the Diversified Value Fund, Large Cap Value Fund, Mid-Cap Value Fund, Small Cap Value Fund, Value Opportunities Fund, Capital Income Fund and High Yield Fund (constituting the Hotchkis and Wiley Funds, hereafter referred to as the "Funds") at June 30, 2011, the results of each of their operations for the period then ended, the changes in each of their net assets and the financial highlights for each of the periods presented, in conformity with accounting principles generally accepted in the United States of America. These financial statements and financial highlights (hereafter referred to as "financial statements") are the responsibility of the Funds' management. Our responsibility is to express an opinion on these financial statements based on our audits. We conducted our audits of these financial statements in accordance with the standards of the Public Company Accounting Oversight Board (United States). Those standards require that we plan and perform the audit to obtain reasonable assurance about whether the financial statements are free of material misstatement. An audit includes examining, on a test basis, evidence supporting the amounts and disclosures in the financial statements, assessing the accounting principles used and significant estimates made by management, and evaluating the overall financial statement presentation. We believe that our audits, which included confirmation of securities at June 30, 2011 by correspondence with the custodian and brokers, provide a reasonable basis for our opinion.
PricewaterhouseCoopers LLC
Los Angeles, California
August 19, 2011
56
Fund Expense Examples (Unaudited)
As a mutual fund shareholder, you incur two types of costs: (1) transaction costs such as initial sales charges (loads) on purchase payments and contingent deferred sales charges on redemptions and (2) ongoing costs, including management fees, distribution and service (12b-1) fees and other fund expenses. The following examples are intended to help you understand your ongoing costs (in dollars) of investing in the Funds and to compare these costs with the ongoing costs of investing in other mutual funds. The examples are based on an investment of $1,000 invested at the beginning of the most recent six-month period and held for the entire period (January 1, 2011 – June 30, 2011).
The table below illustrates the Funds' costs in two ways:
Based on Actual Fund Returns. This section provides information about actual account values and actual expenses. You may use the information in this section, together with the amount you invested, to estimate the expenses that you paid over the period. Simply divide your account value by $1,000 (for example, an $8,600 account value divided by $1,000 = 8.6), then multiply the result by the number in the section under the heading entitled "Expenses Paid During Period" to estimate the expenses you paid on your account during this period.
Based on Hypothetical 5% Yearly Returns. This section provides information about hypothetical account values and hypothetical expenses based on the Funds' actual expense ratios and an assumed rate of return of 5% per year before expenses, which is not the Funds' actual return. The hypothetical account values and expenses may not be used to estimate the actual ending account balance or expenses you paid for the period. You may use this information to compare the ongoing costs of investing in the Funds and other funds. To do so, compare this 5% hypothetical example with the 5% hypothetical examples that appear in the shareholder reports of the other funds.
Please note that the expenses shown in the table are meant to highlight your ongoing costs only and do not reflect any transactional costs, such as sales charges (loads). Therefore, the second section is useful in comparing ongoing costs only, and will not help you determine the relative total costs of owning different funds. In addition, if these transactional costs were included, your costs would have been higher.
The calculations assume no shares were bought or sold during the period. Your actual costs may have been higher or lower, depending on the amount of your investment and the timing of any purchases or redemptions.
| | | Based on Actual Fund Returns | | Based on Hypothetical 5% Yearly Returns | | | |
| | | Beginning
Account Value
1/1/11 | | Ending
Account Value
6/30/11 | | Expenses Paid
During Period*
1/1/11 - 6/30/11 | | Beginning
Account Value
1/1/11 | | Ending
Account Value
6/30/11 | | Expenses Paid
During Period*
1/1/11 - 6/30/11 | | Annualized
Expense Ratio | |
| Diversified Value Fund | |
| Class I | | $ | 1,000.00 | | | $ | 1,035.20 | | | $ | 4.79 | | | $ | 1,000.00 | | | $ | 1,020.08 | | | $ | 4.76 | | | | 0.95 | % | |
| Class A | | | 1,000.00 | | | | 1,034.00 | | | | 6.05 | | | | 1,000.00 | | | | 1,018.84 | | | | 6.01 | | | | 1.20 | | |
| Class C | | | 1,000.00 | | | | 1,030.10 | | | | 9.82 | | | | 1,000.00 | | | | 1,015.12 | | | | 9.74 | | | | 1.95 | | |
| Large Cap Value Fund | |
| Class I | | | 1,000.00 | | | | 1,036.70 | | | | 5.30 | | | | 1,000.00 | | | | 1,019.59 | | | | 5.26 | | | | 1.05 | | |
| Class A | | | 1,000.00 | | | | 1,035.00 | | | | 6.56 | | | | 1,000.00 | | | | 1,018.35 | | | | 6.51 | | | | 1.30 | | |
| Class C | | | 1,000.00 | | | | 1,031.30 | | | | 10.32 | | | | 1,000.00 | | | | 1,014.63 | | | | 10.24 | | | | 2.05 | | |
| Class R | | | 1,000.00 | | | | 1,033.50 | | | | 7.82 | | | | 1,000.00 | | | | 1,017.11 | | | | 7.75 | | | | 1.55 | | |
| Mid-Cap Value Fund | |
| Class I | | | 1,000.00 | | | | 1,040.90 | | | | 5.26 | | | | 1,000.00 | | | | 1,019.64 | | | | 5.21 | | | | 1.04 | | |
| Class A | | | 1,000.00 | | | | 1,039.50 | | | | 6.52 | | | | 1,000.00 | | | | 1,018.40 | | | | 6.46 | | | | 1.29 | | |
| Class C | | | 1,000.00 | | | | 1,035.30 | | | | 10.29 | | | | 1,000.00 | | | | 1,014.68 | | | | 10.19 | | | | 2.04 | | |
| Class R | | | 1,000.00 | | | | 1,038.30 | | | | 7.78 | | | | 1,000.00 | | | | 1,017.16 | | | | 7.70 | | | | 1.54 | | |
| Small Cap Value Fund | |
| Class I | | | 1,000.00 | | | | 1,043.30 | | | | 5.37 | | | | 1,000.00 | | | | 1,019.54 | | | | 5.31 | | | | 1.06 | | |
| Class A | | | 1,000.00 | | | | 1,041.80 | | | | 6.63 | | | | 1,000.00 | | | | 1,018.30 | | | | 6.56 | | | | 1.31 | | |
| Class C | | | 1,000.00 | | | | 1,038.30 | | | | 10.41 | | | | 1,000.00 | | | | 1,014.58 | | | | 10.29 | | | | 2.06 | | |
| Value Opportunities Fund | |
| Class I | | | 1,000.00 | | | | 1,082.50 | | | | 5.68 | | | | 1,000.00 | | | | 1,019.34 | | | | 5.51 | | | | 1.10 | | |
| Class A | | | 1,000.00 | | | | 1,080.90 | | | | 6.97 | | | | 1,000.00 | | | | 1,018.10 | | | | 6.76 | | | | 1.35 | | |
| Class C | | | 1,000.00 | | | | 1,077.30 | | | | 10.82 | | | | 1,000.00 | | | | 1,014.38 | | | | 10.49 | | | | 2.10 | | |
| Capital Income Fund | |
| Class I | | | 1,000.00 | | | | 1,059.00 | | | | 4.08 | | | | 1,000.00 | | | | 1,020.83 | | | | 4.01 | | | | 0.80 | | |
| Class A | | | 1,000.00 | | | | 1,017.40 | | | | 3.54 | ** | | | 1,000.00 | | | | 1,019.59 | | | | 5.26 | | | | 1.05 | | |
| High Yield Fund | |
| Class I | | | 1,000.00 | | | | 1,044.90 | | | | 3.55 | | | | 1,000.00 | | | | 1,021.32 | | | | 3.51 | | | | 0.70 | | |
| Class A | | | 1,000.00 | | | | 1,043.70 | | | | 4.81 | | | | 1,000.00 | | | | 1,020.08 | | | | 4.76 | | | | 0.95 | | |
* Expenses are equal to the Funds' annualized expense ratio by class multiplied by the average account value over the period, multiplied by the number of days in the most recent fiscal half-year (181), then divided by the number of days in the most recent fiscal year (365).
** Actual expenses are equal to the Fund's annualized expense ratio for Class A multiplied by the average account value over the period, multiplied by 122/365 (to reflect the commencement of operations to June 30, 2011).
57
Board Considerations in Approving Continuation of Investment Advisory Agreements (Unaudited)
Background and Approval Process. Hotchkis and Wiley Capital Management, LLC (the "Advisor") serves as investment adviser to the Hotchkis and Wiley Large Cap Value Fund, the Hotchkis and Wiley Mid-Cap Value Fund, the Hotchkis and Wiley Small Cap Value Fund, the Hotchkis and Wiley Value Opportunities Fund, the Hotchkis and Wiley Diversified Value Fund and the Hotchkis and Wiley High Yield Fund (each a "Fund") pursuant to separate investment advisory agreements (the "Advisory Agreements") with the Hotchkis and Wiley Funds (the "Trust"). The Advisory Agreements were initially approved by the Board of Trustees at the inception of each Fund for two-year terms. The Advisory Agreements continue thereafter if approved annually by the Trustees, including a majority of the Trustees who are not "interested persons" (as defined in the Investment Company Act of 1940, as amended (the "1940 Act")) of the Trust (the "Independent Trustees"), cast in person at a meeting called for the purpose of voting on the Advisory Agreements. The Advisory Agreements for each Fund were most recently considered by the Board at a meeting held in May 2011.
As part of the annual contract review process, the Independent Trustees, through their independent legal counsel, requested and received extensive materials, including information relating to (i) the nature, extent and quality of services provided by the Advisor, including compliance with legal requirements, (ii) short-term and long-term performance of each Fund relative to peer groups, their Lipper fund category and market indices, (iii) the costs of the services provided and the Advisor's profitability with respect to the management of each Fund, (iv) the extent to which the Advisor has in the past or is likely in the future to experience economies of scale in connection with the investment advisory services it provides to each Fund, (v) the expense ratios of each Fund as compared with the expense ratios of their peer group and their Lipper fund category and (vi) any benefits to the Advisor and its affiliates from its relationship with the Funds. The Independent Trustees also requested and received information specifically related to the Advisor's risk controls and risk evaluation process. The Independent Trustees noted that the information provided by the Advisor was thorough and responsive to their requests. The information provided in response to their request supplemented information received by the Board throughout the year, both in writing and in meetings, regarding the Funds, including Fund performance, expense ratios, portfolio composition and regulatory compliance. The Independent Trustees also held a conference call with their independent legal counsel to review the materials provided by the Advisor and reviewed and discussed a legal memorandum regarding, among other things, the duties of directors/trustees under the 1940 Act and relevant state law in reviewing and approving investment advisory contracts. The Independent Trustees, through their independent legal counsel, then provided follow-up questions to the Advisor to which they received responses in advance of the May Board meeting.
At the Board meeting, representatives of the Advisor discussed certain responses with the Trustees and responded to their further questions. The Trustees considered the factors set out in case law and identified by the Securities and Exchange Commission as most relevant in considering the renewal of investment advisory agreements. The Trustees considered these and other factors, as summarized in more detail below, and concluded that the terms of each Advisory Agreement are fair and reasonable and the continuance of each Agreement is in the best interests of the applicable Fund. No single factor was determinative in the Board's analysis.
Nature, Extent and Quality of Services. As part of the Board's decision-making process, the Trustees noted that the Advisor and its predecessors have managed the Funds and their predecessors since their inception, and the Trustees believe that a long-term relationship with a capable, conscientious investment adviser is in the best interests of the Funds. The Board also considered that shareholders invest in a Fund specifically seeking the Advisor's investment expertise and style. The Board also noted that when shareholders invest in a Fund, they know the advisory fee that is paid by the Fund. In this connection, the Trustees considered, in particular, whether each Fund is managed in accordance with its investment objective and policies as disclosed to shareholders. The Trustees concluded that each Fund is managed consistent with its investment objective and policies.
The Trustees reviewed information regarding various services provided by the Advisor to the Funds, including an organizational chart and background information on personnel performing such services. The Trustees also reviewed each Fund's performance and information regarding the Advisor's investment program, which is driven by team-oriented, in-depth, fundamental research. The Trustees considered the depth and quality of the Advisor's investment process, the low turnover rates of the Advisor's key personnel, the overall stability of the Advisor's organization, and the experience, capability and integrity of its senior management. The Trustees considered the portfolio managers' significant investments in the Funds. The Trustees reviewed the Trust's compliance program and the Advisor's commitment to a rigorous compliance effort and the resultant compliance by the Funds and the Advisor with legal requirements.
The Trustees also considered other non-advisory services provided to the Funds, such as the services of Advisor employees as officers and other personnel provided that are necessary for Fund operations. The Trustees particularly noted that the services of the Trust's Chief Compliance Officer are provided to the Funds at no cost to the Funds. The Trustees noted that the Advisor organizes Board meetings and the preparation of Board meeting materials, and those Advisor employees serving as Trust officers oversee and manage the other Fund service providers.
Based on their review, the Trustees concluded that the nature, extent and quality of services provided (and expected to be provided) to each Fund under its Advisory Agreement were of a high level and were very satisfactory.
Investment Performance of the Funds and the Advisor. The Trustees noted that they review data on the short-term and long-term performance of the Funds in connection with each quarterly Board meeting. For the contract review meeting, the Trustees reviewed a report prepared by the Trust's administrator based on information compiled from Lipper Inc., an independent provider of data to mutual fund boards (the "Report"), that compared the performance of Class I shares of each Fund to that of a small group of funds that are similar primarily in terms of investment styles (each, a "Peer Group"). Performance information through March 2011 was provided by the Advisor as well. Since some Peer Group funds' advisory contracts include administration services, the Report included administration fees with advisory fees for comparability. The Trust's administrator provided a supplemental report comparing the performance of each Fund's Class I shares to that of the median of the most comparable Lipper universe, but the Advisor noted, and the Independent Trustees agreed, that the Funds' performance compared to that of the Peer Groups was more relevant.
The Board considered the performance information for each Fund, noting that each Fund significantly outperformed its Peer Group median for the 1-year period ended December 31, 2010. The Board considered that each equity Fund outperformed its Peer Group median for the 3-year period ended December 31, 2010, except for the Large Cap Value Fund. The Board noted that the High Yield Fund's inception date was March 31, 2009, so 3-year
58
performance was not yet available. The Board noted that each equity Fund underperformed its Peer Group median for the 5-year period ended December 31, 2010, except for the Value Opportunities Fund, and that each Fund with 10-year performance (i.e., the Large Cap Value, Mid Cap Value and Small Cap Value Funds) outperformed its Peer Group median for such period. The Board also noted that each Fund outperformed its benchmark index(es) for the 1-year period covered in the Report.
The Trustees considered the Advisor's efforts to address prior under-performance issues, particularly the Advisor's increased emphasis on risk assessment, and noted the significant improvements in the Funds' performance over the past two years.
Fees, Expenses and Profitability. The Trustees reviewed information provided by the Advisor and data contained in the Report and in the supplemental report regarding the Funds' advisory fees and expense ratios, including information regarding any expense caps for the Funds. The Trustees reviewed data in the Report showing how the Funds' advisory fees and expense ratios compared to those of their respective Peer Groups. The Trustees reviewed supplemental information from the administrator regarding median advisory fees and expense ratios of the most comparable Lipper universe. The Trustees also reviewed information provided by the Advisor on advisory fees charged by the Advisor for subadvisory services it provides to other mutual funds and advisory fees it charges to its separate account clients with investment objectives and policies similar to those of the Funds. The Trustees considered a list of the many additional functions performed for the Funds that the Advisor does not perform for its separate account and subadvisory clients. The Trustees noted that even though the Funds require more services and have higher costs, and even though it is generally acknowledged that managing mutual funds subjects an investment adviser to more legal and regulatory risk than is the case with separate accounts, the fees charged to each Fund other than the Diversified Value, Large Cap Value and High Yield Funds are the same as or lower than the Advisor's current standard fee schedules for its separate account clients.
With respect to the advisory fee for each Fund, the Trustees noted that the Report showed that the Small Cap Value and Value Opportunities Funds' net advisory fees (including administration fees) were lower than these Funds' Peer Group medians, that the High Yield Fund's net advisory fee (including administration fees) was essentially the same as its Peer Group median, and that the Diversified Value, Large Cap Value and Mid-Cap Value Funds' advisory fees (including administration fees) were somewhat higher than their Peer Group medians. The Trustees noted that the Advisor had agreed to add breakpoints to the fee schedule for the Large Cap Value, Mid-Cap Value and Diversified Value Funds effective January 1, 2007, but that lower asset levels in 2010 meant that the breakpoints did not have an impact on the advisory fees. They noted that the Advisor uses a research-intensive process where other firms, including those advising Peer Funds, might use investment processes that are less research-intensive. With respect to the expense ratios for the Funds, the Trustees noted that the Report showed that the Large Cap Value, Mid-Cap Value and Diversified Value Funds' net expense ratio was higher than the median of their Peer Group, and the Small Cap Value, Value Opportunities and High Yield Funds' net expense ratio was lower than the median of their Peer Group. The Trustees noted the quality of the Advisor's investment process and concluded that the advisory fee and expense ratios were fair and reasonable for each Fund.
The Trustees reviewed information concerning profitability to the Advisor under the Advisory Agreements, including information regarding the methodology for allocating expenses. The Trustees reviewed data regarding the Advisor's variable expenses and fixed expenses. The Trustees considered that in 2010, as well as in 2009, the Advisor had absorbed over $1 million of costs above expense caps for the Funds for which it would not be reimbursed, and has agreed to continue to do so, noting that annualized expense ratios continue to be above the expense cap for the Large Cap Value, Diversified Value and High Yield Funds. The Trustees also recognized that individual fund or product line profitability of other advisers is generally not publicly available, and that profitability may be affected by numerous factors, so that the comparability of profitability among advisory firms is limited. The Trustees noted the importance of the Advisor's profitability — which is derived solely from investment management fees — in maintaining its entrepreneurial environment in a private, primarily employee-owned structure. They noted that the Advisor's compensation/profit structure facilitates retention of its management and investment professionals. They also noted that from time to time the Advisor had voluntarily limited growth of assets by closing certain Funds to new investors. The Trustees noted that closing Funds was financially disadvantageous to the Advisor, and illustrated a commitment to act in the best interests of Fund shareholders. The Trustees concluded that the level of profitability to the Advisor under the Advisory Agreements appeared to be not excessive.
Economies of Scale and Whether Fee Levels Reflect These Economies of Scale. The Trustees considered information regarding the investment, compliance and client service personnel and the new fixed-income portfolio managers who have been hired by the Advisor over the past few years, and the increase in technology spending. The Trustees concluded that the Funds' shareholders share in the additional services, investment in talented employees and capital improvements provided by the Advisor without an increase in advisory fees. The Trustees also noted that the addition of breakpoints to the Large Cap Value, Mid-Cap Value and Diversified Value Funds has in the past enabled, and may in the future enable, shareholders to share in economies of scale.
Indirect Benefits to the Advisor from its Relationship to the Funds. The Trustees considered information regarding any indirect benefits to the Advisor that could be identified from its relationship to the Funds. In particular, the Trustees considered any benefits from soft dollar arrangements. The Trustees noted that, while the Advisor had not historically used the Funds' commissions to pay for research, other than for proprietary research from brokers that was "bundled" with the commission cost, at the May Board meeting the Advisor had requested the ability to use commission sharing arrangements that would permit the Advisor to pay for third-party research with the equity Funds' soft dollars. The Trustees considered that the bundled research services and the use of commission sharing arrangements are expected to provide valuable information or service to the investment research process, which benefits the Funds (as well as the Advisor's other clients). The Trustees noted that the ability to use the Funds' soft dollars to obtain third-party research would be a fallout benefit to the Advisor. The Trustees also noted that the commissions paid by the Funds are generally quite low and that the Advisor stated, in asking the Board to permit the use of commission sharing arrangements to obtain research for the Funds, that this would not affect best execution and the Funds should bear no additional costs as a result of these arrangements.
* * * *
Based on their review, including their consideration of each of the factors referred to above, the Trustees, including all of the Independent Trustees, concluded that the terms of each Advisory Agreement are fair and reasonable and that the renewal of each Agreement is in the best interests of each Fund.
59
Board Considerations in Approving the Investment Advisory Agreement for the
Capital Income Fund
The Board of Trustees of the Hotchkis and Wiley Funds (the "Trust"), including the Independent Trustees, approved the Investment Advisory Agreement (the "Advisory Agreement") between the Trust on behalf of the Hotchkis and Wiley Capital Income Fund (the "Fund") and Hotchkis and Wiley Capital Management, LLC (the "Advisor"), at a meeting held on November 17, 2010. The Board determined that the terms of the Advisory Agreement are fair and reasonable and that the Agreement is in the best interests of the Fund.
To reach this determination, the Board considered its duties under the Investment Company Act of 1940, as amended (the "1940 Act"), as well as under the general principles of state law in reviewing and approving investment advisory contracts; the requirements of the 1940 Act in such matters; the fiduciary duty of investment advisers with respect to advisory agreements and compensation; the standards used by courts in determining whether investment company boards have fulfilled their duties; and the factors to be considered by the Board in voting on such agreements. To assist the Board in its evaluation of the Advisory Agreement, the Independent Trustees participated in a special meeting in October 2010 at which the portfolio managers discussed their background and relevant experience and their investment strategy for the Fund. The Independent Trustees then received a report from the Advisor in advance of the November 2010 Board meeting responding to an information request contained in a memorandum from counsel to the Independent Trustees. The report, among other things, outlined the services to be provided by the Advisor; the proposed advisory fee for the Fund as compared to fees charged by investment advisers to comparable funds (noting that the Advisor does not currently have any other clients for which it manages in this style); estimated expenses of the Fund as compared to expense ratios of comparable funds; the nature of expenses to be incurred in providing services to the Fund and the potential for economies of scale, if any; financial data on the Advisor and estimated profitability from the Advisory Agreement; any fall-out benefits to the Advisor; and information on the Advisor's compliance program. The Independent Trustees also met separately with their independent legal counsel to discuss the information provided by the Advisor. The Board applied its business judgment to determine whether the arrangements between the Trust and the Advisor are reasonable business arrangements from the Fund's perspective as well as from the perspective of shareholders.
In reviewing the Advisory Agreement, the Board considered the nature, quality and extent of services to be provided by the Advisor. The Board considered that the Advisor will be responsible for the overall management and administration of the Fund. The Board noted the background and experience of the portfolio managers and their investment style. At the preliminary meeting held in October 2010 and at the November 2010 meeting, the Trustees received presentations from the portfolio managers and were able to ask questions about the proposed investment strategies for the Fund, how portfolio trades would be executed, and how the Advisor's compliance program would apply for the Fund. In light of the information presented and the considerations made, the Board concluded that the nature, quality and extent of services to be provided to the Fund by the Advisor under the Advisory Agreement are expected to be satisfactory.
The Board considered the advisory fees to be paid under the Advisory Agreement. The Board reviewed data compiled by the Advisor from information prepared by Lipper Inc., an independent source, showing the proposed advisory fee and the estimated expense ratio of the Fund as compared to the advisory fees and expense ratios of the institutional class of a peer group selected by the Advisor based on investment objective and portfolio composition. Based on the information provided, the Board noted that the Fund's proposed advisory fee was above the median of the peer group and that the Fund's expense ratio, taking into consideration the two year expense limitation to which the Advisor agreed, was slightly above the median expense ratio of the peer group, and also noted the impact on the data of the two funds in the peer group each having over $39 billion in assets under management. Since the Fund is newly organized, the Board did not consider investment performance of the Fund, but it did consider the performance of the Hotchkis and Wiley High Yield Fund, for which one of the portfolio managers serves as co-portfolio manager. On the basis of all the information provided on the fees and expenses of the Fund, the Board concluded that the advisory fees were reasonable and appropriate in light of the nature, quality and extent of services expected to be provided by the Advisor under the Advisory Agreement.
The Board noted that the Advisor anticipates that, in time, there may be economies of scale from managing the Fund as Fund assets grow, and that, in the meantime, the Advisor intends to minimize the impact of high expense ratios typical of a recently-formed small fund by agreeing to cap expenses for the first two years of operations. The Board noted that the Advisor stated that as Fund assets grow and expense ratios decrease below the expense caps, the Advisor will continue to invest in the investment team. The Board took the costs to be borne by the Advisor in connection with its services to be performed under the Advisory Agreement into consideration and noted that the Advisor estimated the Fund would not be profitable to the Advisor in the near term. The Board considered that the Advisor had identified as a fall-out benefit to the Advisor its being associated with the Trust.
* * * *
Based on all of the information considered and the conclusions reached, the Board, including the Independent Trustees, determined that the terms of the Advisory Agreement are fair and reasonable and that the approval of the Agreement is in the best interests of the Fund. No single factor was determinative in the Board's analysis.
60
Management (Unaudited)
INDEPENDENT TRUSTEES
| Name and Year of Birth | | Position
Held with
the Trust | | Term of
Office* and
Length of
Time Served | | Principal Occupation(s) During
Past Five Years | | Number of
Portfolios in
Fund Complex
Overseen by
Trustee | | Other
Directorships
Held by Trustee
During Past
Five Years | |
Randall H. Breitenbach
(born 1960) | | Trustee(a) | | Since 2001 | | Co-Founder, Director and CEO, BreitBurn Energy Company, LLC and President, BreitBurn Energy Partners, L.P. (1988 — present); Chairman Emeritus, Finance Committee, Stanford University PIC Endowment (1999 — present). | | Seven | | BreitBurn Energy Partners, L.P.; BreitBurn Energy Company, LLC | |
|
Robert L. Burch III
(born 1934) | | Trustee | | Since 2001 | | Managing Partner, A.W. Jones Co. (investments) (1984 — present); Chairman, Jonathan Mfg. Corp. (slide manufacturing) (1977 — 2004). | | Seven | | None | |
|
Alejandra C. Edwards, Ph.D.
(born 1954) | | Trustee | | Since 2007 | | California State University — Long Beach: Associate Chair Economics (2001 — present); Graduate Advisor Economics (2000 — present); Professor of Economics (1994 — present). | | Seven | | None | |
|
Marcy Elkind, Ph.D.
(born 1947) | | Trustee | | Since 2005 | | President, Elkind Economics, Inc. (1980 — present). | | Seven | | None | |
|
Robert Fitzgerald
(born 1952) | | Trustee(b) | | Since 2005 | | Chief Financial Officer of National Retirement Partners, Inc. (2005 — 2007); Executive Vice President and Chief Financial Officer of PIMCO Advisors L.P. (1995 — 2001). | | Seven | | Independent Trustee, Brandes Investment Trust (5 portfolios). | |
|
John A.G. Gavin
(born 1931) | | Trustee
Chairman | | Since 2001
Since 2007 | | Senior Counselor, Hicks Holdings (private equity investment firm) (2001 — present); Chairman, Gamma Holdings (international capital and consulting) (1968 — present); U.S. Ambassador to Mexico (1981 — 1986). | | Seven | | Independent Trustee: Causeway Capital Management Trust (3 portfolios); TCW Strategic Income Fund, Inc. (1 portfolio); TCW Funds, Inc. (27 portfolios). | |
|
Donald Morrison, Ph.D.
(born 1939) | | Trustee | | Since 2007 | | The William E. Leonhard Professor in the Anderson Graduate School of Management at the University of California, Los Angeles (1988 — present). | | Seven | | None | |
|
* Each Independent Trustee serves until his or her successor is elected and qualified or until his or her death or resignation or removal as provided in the Trust's Agreement and Declaration of Trust.
(a) Chairman of the Nominating and Governance Committee.
(b) Chairman of the Audit Committee.
INTERESTED TRUSTEE
| Name and Year of Birth | | Position
Held with
the Trust | | Term of
Office** and
Length of
Time Served | | Principal Occupation(s) During
Past Five Years | | Number of
Portfolios in
Fund Complex
Overseen by
Trustee | | Other
Directorships
Held by Trustee
During Past
Five Years | |
George H. Davis, Jr.*
(born 1961) | | Trustee | | Since 2007 | | Chief Executive Officer and Portfolio Manager of Hotchkis and Wiley Capital Management, LLC (the "Advisor") (2001 — present). | | Seven | | None | |
|
* Mr. Davis is an "interested person," as defined in the 1940 Act, of the Trust based on his position as Chief Executive Officer and Portfolio Manager of the Advisor.
** As Trustee, Mr. Davis serves until his successor is elected and qualified or until his death or resignation or removal as provided in the Trust's Agreement and Declaration of Trust.
OFFICERS
| Name and Year of Birth | | Position
Held with
the Trust | | Term of
Office* and
Length of
Time Served | | Principal Occupation(s) During Past Five Years | |
Anna Marie Lopez
(born 1967) | | President | | Since 2007 | | Chief Operating Officer of the Advisor (2007 — present); Chief Compliance Officer of the Advisor (2001 — 2007). | |
|
Mark McMahon
(born 1968) | | Vice President and Secretary | | Since 2006 | | Managing Director, Mutual Fund Operations of the Advisor (2006 — present); Client Relations Manager of Boston Financial Data Services (1991 — 2006). | |
|
James Menvielle
(born 1972) | | Vice President and Treasurer | | Since 2007 | | Chief Financial Officer of the Advisor (2006 — present); Controller of Metropolitan West Asset Management, LLC (1998 — 2006); Chief Financial Officer of MWAM Distributors, LLC (2004 — 2006). | |
|
Tina Kodama
(born 1968) | | Vice President and Chief Compliance Officer | | Since 2007 | | Chief Compliance Officer of the Advisor (2007 — present); Director of Compliance of the Advisor (2006 — 2007); Vice President — Compliance of First Pacific Advisors, Inc. (2004 — 2006). | |
|
* Each officer is appointed by and serves at the pleasure of the Board of Trustees of the Trust.
The Statement of Additional Information includes additional information about the Trust's Trustees and officers, and is available without charge upon request by calling the transfer agent at 1-866-HW-FUNDS (1-866-493-8637). The address for all Trustees and officers of the Trust is c/o Hotchkis and Wiley Capital Management, LLC, 725 South Figueroa Street, 39th Floor, Los Angeles, CA 90017, attention: Trust Secretary.
61
Privacy Policy
The Hotchkis and Wiley Funds and Hotchkis and Wiley Capital Management, LLC value our relationship with our clients as our most important asset. We are committed to safeguarding our clients' confidential non-public personal information. Our privacy policy outlines the steps we take to protect our clients' personal information.
We collect non-public personal information about you from the following sources in the normal course of business to serve you better:
• Information we receive about you on applications, questionnaires or other forms;
• Information you give us orally or on written or electronic correspondence;
• Information about your transactions with us, financial intermediaries, or others;
• Information received from your custodian, consultant, attorneys, or others; and
• Information provided and captured on our website, including any information captured on our website through the use of "cookies".
We do not sell your personal information to anyone, nor do we disclose your personal information to unaffiliated third parties without the client's authorization, except to your authorized representatives (including your consultant, attorney or accountant). We may disclose your personal information to financial intermediaries (such as broker-dealers and custodians) only as permitted by law and only as necessary for us to provide agreed services and products. We may also disclose your personal information to other service providers with whom we have business arrangements to help administrate our business. These service providers are bound by law or by contract to use your information only for the services for which we hired them, and are not permitted to use or share this information for any other purpose. In limited circumstances, we may disclose your personal information as required by law or in response to inquires from governmental authorities.
We limit access to your personal information, as much as possible, to those employees who need to know that information to provide products and services to you. We also maintain physical, electronic and procedural safeguards to guard the privacy of your nonpublic personal information.
We apply this policy to current and former clients.
This page is not part of the annual report.
62
(This page intentionally left blank)

Information about the Funds
ADVISOR
Hotchkis and Wiley Capital Management, LLC
725 South Figueroa Street, 39th Floor
Los Angeles, California 90017
LEGAL COUNSEL
Paul Hastings LLP
55 Second Street, 24th Floor
San Francisco, California 94105
INDEPENDENT REGISTERED PUBLIC ACCOUNTING FIRM
PricewaterhouseCoopers LLP
350 South Grand Avenue
Los Angeles, California 90071
DISTRIBUTOR
Quasar Distributors, LLC
615 East Michigan Street
Milwaukee, WI 53202
ADMINISTRATOR AND TRANSFER AGENT
U.S. Bancorp Fund Services, LLC
615 East Michigan Street
Milwaukee, Wisconsin 53202
CUSTODIAN
Brown Brothers Harriman & Co.
40 Water Street
Boston, Massachusetts 02109
This report is for the information of shareholders of the Hotchkis and Wiley Funds, but may also be used as sales literature when preceded or accompanied by a current prospectus, which gives details about charges, expenses, investment objectives and operating policies of the Funds.
A description of the policies and procedures that the Funds use to determine how to vote proxies relating to portfolio securities is included in the Statement of Additional Information, which is available without charge, upon request, by calling 1-866-HW-FUNDS (1-866-493-8637) and on the Securities and Exchange Commission's ("SEC") website at http://www.sec.gov.
Information regarding how the Funds voted proxies relating to portfolio securities during the 12-month period ended June 30, 2010 is available without charge on the Funds' website at www.hwcm.com and on the SEC's website at http://www.sec.gov.
Hotchkis and Wiley Funds file a complete schedule of portfolio holdings with the SEC for the first and third quarters of each fiscal year on Form N-Q. The Funds' Forms N-Q are available free of charge on the SEC's website at http://www.sec.gov. You may also review or, for a fee, copy the forms at the SEC's Public Reference Room in Washington, D.C. (1-202-551-8090). The Forms N-Q are also available on the Funds' website at www.hwcm.com under the "Download Center".

HOTCHKIS AND WILEY FUNDS
725 SOUTH FIGUEROA STREET, 39th Floor
LOS ANGELES, CALIFORNIA 90017-5439
www.hwcm.com
1.866.HW.FUNDS (1.866.493.8637)
CODE #HWF-AR-0611-0811
JUNE 30, 2011
ANNUAL REPORT
Item 2 - Code of Ethics
The registrant has adopted a code of ethics that applies to the registrant’s principal executive officer and principal financial officer. The registrant has not made any amendments to its code of ethics during the period covered by this report. The registrant has not granted any waivers from any provisions of the code of ethics during the period covered by this report. A copy of the code of ethics is available without charge, upon request, by calling toll-free 1-800-796-5606.
Item 3 - Audit Committee Financial Expert
The registrant’s Board has determined that Robert Fitzgerald, a member of the registrant’s Audit Committee, is an “audit committee financial expert” and “independent,” as such terms are defined in this Item. This designation will not increase the designee’s duties, obligations or liability as compared to his duties, obligations and liability as a member of the Audit Committee and of the Board; nor will it reduce the responsibility of the other Audit Committee members. The Board believes each member of the Audit Committee contributes significantly to the effective oversight of the registrant’s financial statements and condition.
Item 4 - Principal Accountant Fees and Services
The registrant has engaged its principal accountant to perform audit services, audit-related services, tax services and other services during the past two fiscal years. “Audit services” refer to performing an audit of the registrant’s annual financial statements or services that are normally provided by the accountant in connection with statutory and regulatory filings or engagements for those fiscal years. “Audit-related services” refer to the assurance and related services by the principal accountant that are reasonably related to the performance of the audit. “Tax services” refer to professional services rendered by the principal accountant for tax compliance, tax advice, and tax planning. The principal accountant did not provide any other services. The following table details the aggregate fees billed or expected to be billed for each of the last two fiscal years for audit fees, audit-related fees, tax fees and other fees by the principal accountant.
| | FYE 6/30/2011 | | FYE 6/30/2010 | |
Audit Fees | | $ | 115,700 | | $ | 130,800 | |
Audit-Related Fees | | $ | 0 | | $ | 0 | |
Tax Fees | | $ | 42,800 | | $ | 37,500 | |
All Other Fees | | $ | 0 | | $ | 0 | |
The registrant’s Audit Committee (the “Committee”) has adopted policies and procedures with regard to the pre-approval of services. The Committee shall pre-approve any engagement of the independent auditors to provide any non-prohibited services to the registrant, including the fees and other compensation to be paid to the independent auditors. The Chairman of the Audit Committee may grant the pre-approval of services to the registrant for non-prohibited services for engagements of less than $5,000. All such delegated pre-approvals shall be presented to the Audit Committee no later than the next Audit Committee meeting. The Committee shall also pre-approve any engagement of the independent auditors, including the fees and other
compensation to be paid to the independent auditors, to provide any non-audit services to the Adviser (or any “control affiliate” of the Adviser providing ongoing services to the registrant), if the engagement relates directly to the operations and financial reporting of the registrant. The Chairman of the Audit Committee may grant the pre-approval for non-prohibited services to the Adviser for engagements of less than $5,000. All such delegated pre-approvals shall be presented to the Audit Committee no later than the next Audit Committee meeting.
The percentage of fees billed by PricewaterhouseCoopers LLP applicable to non-audit services pursuant to waiver of pre-approval requirement were as follows:
| | FYE 6/30/2011 | | FYE 6/30/2010 | |
Audit-Related Fees | | 0 | % | 0 | % |
Tax Fees | | 0 | % | 0 | % |
All Other Fees | | 0 | % | 0 | % |
All of the principal accountant’s hours spent on auditing the registrant’s financial statements were attributed to work performed by full-time permanent employees of the principal accountant.
The following table indicates the non-audit fees billed or expected to be billed by the registrant’s accountant for services to the registrant and to the registrant’s investment adviser for the last two years. The registrant’s Audit Committee has considered whether the provision of non-audit services that were rendered to the registrant’s investment adviser and any entity controlling, controlled by, or under common control with the investment adviser that provides ongoing services to the registrant that were not pre-approved pursuant to paragraph (c)(7)(ii) of Rule 2-01 of Regulation S-X is compatible with maintaining the principal accountant’s independence and has concluded that the provision of such non-audit services by the accountant has not compromised the accountant’s independence.
Non-Audit Related Fees | | FYE 6/30/2011 | | FYE 6/30/2010 | |
Registrant | | $ | 42,800 | | $ | 37,500 | |
Registrant’s Investment Adviser | | $ | 99,300 | | $ | 105,000 | |
Item 5 - Audit Committee of Listed Registrants
Not applicable to registrants who are not listed issuers (as defined in Rule 10A-3 under the Securities Exchange Act of 1934).
Item 6 - Investments
Schedule of Investments is included as part of the report to shareholders filed under Item 1 of this Form.
Item 7 - Disclosure of Proxy Voting Policies and Procedures for Closed-End Management Investment Companies
Not applicable to open-end investment companies.
Item 8 - Portfolio Managers of Closed-End Management Investment Companies
Not applicable to open-end investment companies.
Item 9 - Purchases of Equity Securities by Closed-End Management Investment Company and Affiliated Purchasers
Not applicable to open-end investment companies.
Item 10 - Submission of Matters to a Vote of Security Holders
The identification and recommendation of individuals for Board membership is the responsibility of the Nominating and Governance Committee. Shareholders may submit suggestions for candidates by forwarding their correspondence by U.S. mail or other courier service to the Funds’ Secretary for the attention of the Chairman of the Nominating and Governance Committee, 725 S. Figueroa Street, 39th Floor, Los Angeles, CA 90017-5439.
Item 11 - Controls and Procedures
(a) The officers providing the certifications in this report in accordance with Rule 30a-2 under the Investment Company Act of 1940 (the “Act”) have concluded, based on their evaluation of the registrant’s disclosure controls and procedures (as defined in Rule 30a-3(c) under the Act), that such controls and procedures are effective, based on their evaluation of the disclosure controls and procedures as of a date within 90 days of the filing date of this report.
(b) There was no change in the registrant’s internal controls over financial reporting (as defined in Rule 30a-3(d) under the Act) that occurred during the registrant’s last fiscal half-year which has materially affected, or is reasonably likely to materially affect, the registrant’s internal control over financial reporting.
Item 12 - Exhibits
(a)(1) — Code of Ethics: Available without charge, upon request, by calling toll-free 1-800-796-5606.
(a)(2) — Certifications pursuant to Section 302 of the Sarbanes-Oxley Act of 2002. Attached hereto.
(a)(3) — Any written solicitation to purchase securities under Rule 23c-1 under the Act sent or given during the period covered by the report by or on behalf of the registrant to 10 or more persons. Not applicable to open-end investments companies.
(b) — Certifications pursuant to Section 906 of the Sarbanes-Oxley Act of 2002. Attached hereto.
SIGNATURES
Pursuant to the requirements of the Securities Exchange Act of 1934 and the Investment Company Act of 1940, the registrant has duly caused this report to be signed on its behalf by the undersigned, thereunto duly authorized.
Hotchkis and Wiley Funds |
|
|
By: | /s/ Anna Marie Lopez | |
| |
| Anna Marie Lopez |
| President of Hotchkis and Wiley Funds |
|
Date: August 25, 2011 |
Pursuant to the requirements of the Securities Exchange Act of 1934 and the Investment Company Act of 1940, this report has been signed below by the following persons on behalf of the registrant and in the capacities and on the dates indicated.
Hotchkis and Wiley Funds |
|
|
By: | /s/ Anna Marie Lopez | |
| |
| Anna Marie Lopez |
| President of Hotchkis and Wiley Funds |
|
Date: August 25, 2011 |
|
|
By: | /s/ James Menvielle | |
| |
| James Menvielle |
| Treasurer of Hotchkis and Wiley Funds |
|
Date: August 25, 2011 |
EXHIBIT INDEX
(a)(2) | | Certifications of Principal Executive Officer and Principal Financial Officer as required by Rule 30a-2(a) under the Investment Company Act of 1940. |
| | |
(b) | | Certification of Principal Executive Officer and Principal Financial Officer as required by Section 906 of the Sarbanes-Oxley Act of 2002. |