UNITED STATES
SECURITIES AND EXCHANGE COMMISSION
Washington, D.C. 20549
FORM N-CSR
CERTIFIED SHAREHOLDER REPORT OF REGISTERED
MANAGEMENT INVESTMENT COMPANIES
Investment Company Act file number | 811-10487 |
|
Hotchkis & Wiley Funds |
(Exact name of registrant as specified in charter) |
|
725 South Figueroa Street, 39th Floor Los Angeles, California | | 90017-5439 |
(Address of principal executive offices) | | (Zip code) |
|
Anna Marie Lopez Hotchkis & Wiley Capital Management, LLC 725 South Figueroa Street, 39th Floor Los Angeles, California 90017-5439 |
(Name and address of agent for service) |
|
Copies to: Maureen A. Miller, Esq. Joseph M. Mannon, Esq. Vedder Price P.C. 222 North LaSalle Street, 26th Floor Chicago, IL 60601 |
(Counsel for the registrant) |
|
Registrant’s telephone number, including area code: | (213) 430-1000 | |
|
Date of fiscal year end: | June 30, 2017 | |
|
Date of reporting period: | July 1, 2016 - December 31, 2016 | |
| | | | | | | | |
Item 1. Reports to Stockholders.

Hotchkis & Wiley Funds
Semi-annual Report
DECEMBER 31, 2016
DIVERSIFIED VALUE FUND
LARGE CAP VALUE FUND
MID-CAP VALUE FUND
SMALL CAP VALUE FUND
SMALL CAP DIVERSIFIED VALUE FUND
GLOBAL VALUE FUND
INTERNATIONAL VALUE FUND
VALUE OPPORTUNITIES FUND
CAPITAL INCOME FUND
HIGH YIELD FUND

SHAREHOLDER LETTER | | | 1 | | |
| FUND INFORMATION | | | 4 | | |
| FUND PERFORMANCE DATA | | | 6 | | |
SCHEDULE OF INVESTMENTS: | |
| DIVERSIFIED VALUE FUND | | | 16 | | |
| LARGE CAP VALUE FUND | | | 18 | | |
| MID-CAP VALUE FUND | | | 20 | | |
| SMALL CAP VALUE FUND | | | 22 | | |
| SMALL CAP DIVERSIFIED VALUE FUND | | | 25 | | |
| GLOBAL VALUE FUND | | | 32 | | |
| INTERNATIONAL VALUE FUND | | | 34 | | |
| VALUE OPPORTUNITIES FUND | | | 36 | | |
| CAPITAL INCOME FUND | | | 40 | | |
| HIGH YIELD FUND | | | 47 | | |
| STATEMENTS OF ASSETS & LIABILITIES | | | 54 | | |
| STATEMENTS OF OPERATIONS | | | 56 | | |
| STATEMENTS OF CHANGES IN NET ASSETS | | | 58 | | |
| FINANCIAL HIGHLIGHTS | | | 63 | | |
| NOTES TO THE FINANCIAL STATEMENTS | | | 68 | | |
| FUND EXPENSE EXAMPLES | | | 80 | | |
INFORMATION ABOUT THE FUNDS | | | BACK COVER | | |
DEAR SHAREHOLDER:
The following investment review and shareholder report relates to the activities of the Hotchkis & Wiley Funds for the six months ended December 31, 2016.
OVERVIEW
In the six months ended December 31, 2016, the S&P 500® Index returned +7.8%, the Russell Developed Index returned +7.6%, and the BofA Merrill Lynch US High Yield Index returned +7.5%.
Until recently, equity investors had favored real estate investment trusts (REITs), consumer staples, regulated utilities, and other market segments with relatively stable revenue streams and high dividend payout ratios. Many market participants, searching for yield in a low interest rate environment seemed to view these stocks as bond surrogates due to these attributes. The global market viewed these stocks as bond surrogates, particularly because of the low interest rate environments in major developed economies. Our opinion has been that these sectors were bid up to excessive valuation levels; stable businesses make for risky investments if you have to overpay relative to the intrinsic value of the enterprise. In contrast, stocks of companies with more cyclical businesses were shunned irrespective of valuation; hence, this is where we identified the most compelling risk-adjusted return opportunities across the market cap spectrum and across geographies. Value dislocations eventually revert to reflect underlying economic fundamentals. We observed the beginnings of such a reversion in the latter half of 2016, as the large dislocation between perceived bond proxies and cyclical companies narrowed. While the value reversion was large, so was the initial dislocation; as a result, we believe that value spreads remain wider than average today.
Over the long-term, a company's earnings power and associated intrinsic value are the dominant drivers of stock performance. In the short-term, changes in market sentiment can drive stock performance as macroeconomic factors, geopolitical issues, or other major events can cause investors to become skittish or greedy. As we look to 2017 and beyond, we maintain our unwavering commitment to the time-tested principles of long-term fundamental value investing and prudent risk management.
In credit markets, lower rated bonds performed best over the six months, with the CCC & below cohort up an impressive +17%. Many of these were energy credits; energy was the top-performing sector over the period, outperforming the broad market by more than 5 percentage points. High yield spreads tightened by about 200 basis points since June 30th, closing 2016 at 422 basis points. The high yield market's (BofA Merrill Lynch US High Yield Index) historical median spread is about 500 basis points, so the current market is tighter than average. While not ideal, a tighter-than-average market can be rationalized considering the benign default rate outlook. Commodity-related sectors have been cleansed and default activity has slowed to a crawl. With the weakest energy credits already restructured and oil prices up from depressed levels, commodity sectors appear to be on more solid footing. While individual opportunities remain for diligent active credit pickers, spreads for commodity sectors have fully converged with the rest of the market — a rather astonishing feat considering that early in 2016 commodity sector spreads were about 1,000 basis points wider than the rest of the market. Meanwhile, defaults have been essentially non-existent outside commodity sectors, persisting at less than 1% for more than a year.
Overall, the high yield market has been well-behaved which at least partially explains why valuations are slightly less compelling than historical averages. Leverage remains in check, maturities are termed out well, leveraged buy out (LBO) activity is contained, and low rated new issuance is at the lowest level in more than a decade. Considering that revenue and earnings have shown signs of improvement it is unsurprising that defaults are on the mend. Also, while much of the high yield market is fairly valued, opportunities exist for active managers.
HOTCHKIS & WILEY DIVERSIFIED VALUE FUND
The Fund's Class I shares had a total return of +19.02% for the six month period ended December 31, 2016 compared to the Russell 1000® Value Index return of +10.39%.
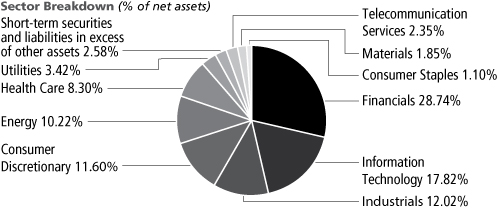
The Fund's Class I shares outperformed the Russell 1000® Value Index over the six month period. At the beginning of the period, about 33% of the portfolio was invested in stocks that traded at a discount to book value compared to about 13% for the index. This helped relative performance as this group outperformed the rest of the market by a considerable margin. Positive stock selection in financials was a large performance contributor as well, as the portfolio's aggregate exposure to banks and capital markets companies each returned more than +50%. The overweight exposure to financials and underweight exposures to consumer staples and real estate also helped performance. On the negative side, stock selection in utilities, telecommunication services, and information technology were modest detractors. The five largest individual positive contributors to relative performance over the six month period were Bank of America, Citizens Financial, Citigroup, Morgan Stanley, and AIG; the largest detractors were Calpine, Ericsson, Vodafone, GlaxoSmithKline, and Oracle.
HOTCHKIS & WILEY LARGE CAP VALUE FUND
The Fund's Class I shares had a total return of +16.95% for the six month period ended December 31, 2016, compared to the Russell 1000® Value Index return of +10.39%.
Over the six month period ended December 31, 2016, the Fund's Class I shares outperformed the Russell 1000® Value Index. Positive stock selection in financials was a major performance contributor over the period, led by banks and capital markets — both industries returned more than +50% in aggregate over the six month period for the Fund. The underweight allocation to consumer staples and real estate also helped relative performance along with the overweight allocation to financials. Stocks trading at a discount to book value outperformed the broad market significantly in the period; at the beginning of the period, about 33% of the Fund was invested in such stocks compared to about 13% for the Russell 1000® Value Index, which helped relative performance. Stock selection in utilities, telecommunication services, and information technology detracted from performance over the six months. The largest individual contributors to the positive relative performance over the period were Bank of America, Citizens Financial, Citigroup, State Street, and AIG; the largest detractors were Calpine, Vodafone, Ericsson, Oracle, and GlaxoSmithKline.
1
HOTCHKIS & WILEY MID-CAP VALUE FUND
The Fund's Class I shares had a total return of +23.93% for the six month period ended December 31, 2016, compared to the Russell Midcap® Value Index return of +10.22%.
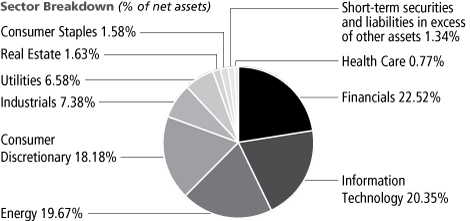
The Fund's Class I shares outperformed the Russell Midcap® Value Index in the six month period ended December 31, 2016. Six months ago, nearly 40% of the Fund was invested in stocks trading at a discount to book value compared to about 12% for the index, which helped relative performance as deeply discounted stocks outperformed the rest of the market substantially. Positive stock selection in industrials, financials, and real estate were notable performance contributors. The overweight allocation to financials and information technology along with the underweight allocation to real estate also helped. Stock selection in utilities and health care detracted from performance. The five largest individual contributors to the positive relative performance were Navistar, Citizens Financial, Regions Financial, Popular, and Whiting Petroleum; the largest individual detractors were Calpine, NRG Energy, Royal Mail, Ericsson, and Bed Bath & Beyond.
HOTCHKIS & WILEY SMALL CAP VALUE FUND
The Fund's Class I shares had a total return of +27.41% for the six month period ended December 31, 2016, compared to the Russell 2000® Value Index return of +24.19%.
The Fund's Class I shares outperformed the Russell 2000® Value Index over the six month period ended December 31, 2016. Positive stock selection was the primary driver of outperformance, led by the consumer discretionary, real estate, financials, and information technology sectors. The overweight exposure to industrials along with the underweight exposure to real estate and utilities also helped relative performance. The five largest individual positive contributors to relative performance over the six month period were Rush Enterprises, EnPro Industries, KeyCorp, ARRIS International, and Popular; the five largest detractors were LifePoint, Real Industry, Great Plains Energy, Masonite International, and NRG Energy.
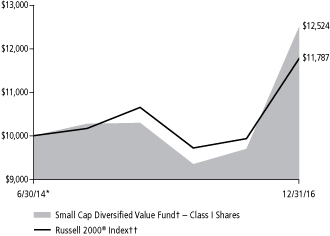
HOTCHKIS & WILEY SMALL CAP DIVERSIFIED VALUE FUND
The Fund's Class I shares had a total return of +29.17% for the six month period ended December 31, 2016, compared to the Russell 2000® Value Index return of +24.19%.
Over the six month period ended December 31, 2016, the Fund's Class I shares outperformed the Russell 2000® Value Index. Stock selection was positive in 8 of the 11 GICS® sectors over the period, and was particularly strong in real estate, consumer discretionary, and energy. The underweight allocation to real estate and utilities, along with the overweight allocation to energy helped relative performance as well. The Fund was overweight stocks with market capitalizations below $500 million, which also helped performance as smaller cap stocks outperformed. On the negative side, stock selection in health care and utilities along with the overweight exposure to consumer discretionary hurt relative performance.
HOTCHKIS & WILEY GLOBAL VALUE FUND
The Fund's Class I shares had a total return of +18.25% for the six month period ended December 31, 2016, compared to the Russell Developed Index return of +7.61%.
The Fund's Class I shares outperformed the Russell Developed Index over the six month period ended December 31, 2016. At the beginning of the period, the Fund had about 46% invested in stocks trading at a discount to book value compared to about 13% for the index. This helped relative performance considerably as this group of stocks outperformed the market by a wide margin. The Fund's ability to invest across the market cap spectrum benefitted relative performance as well because small and mid cap stocks outperformed large cap stocks; the Fund was overweight the former and underweight the latter. Stock selection was positive or neutral in 9 of the 11 GICS® sectors, with consumer discretionary, consumer staples, and financials leading the way. The overweight allocation to financials and underweight allocations to consumer staples and health care also helped relative performance. Stock selection in utilities and materials, along with the underweight exposure to materials hurt relative performance. The five largest positive contributors to relative performance over the period were Navistar, Bank of America, Citigroup, AIG, and Popular; the largest detractors were Calpine, Ericsson, Vodafone, Royal Mail, and NRG Energy.
HOTCHKIS & WILEY INTERNATIONAL VALUE FUND
The Fund's Class I shares had a total return of +13.90% for the six month period ended December 31, 2016, compared to the Russell Developed ex-U.S. Index return of +5.87%.
For the six months ended December 31, 2016, the Fund's Class I shares outperformed the Russell Developed ex-U.S. Index. The Fund had about 36% invested in stocks trading at a discount to book value at the beginning of the period, compared to about 21% for the index. This helped relative performance as deeply discounted stocks outperformed the broad market by a substantial margin. Stock selection was positive or neutral in 9 of the 11 GICS® sectors over the period, and was particularly strong in consumer staples, health care, and financials. Stock selection in telecommunication services and materials, along with the underweight exposure to materials and consumer discretionary detracted from performance. The five largest individual positive contributors to relative performance over the period were ARRIS International, Societe Generale, Barclays, WorleyParsons, and Draegerwerk; the largest detractors were Royal Mail, Ericsson, Vodafone, Rockhopper, and GlaxoSmithKline.
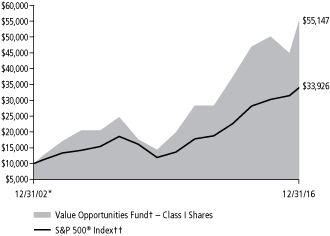
HOTCHKIS & WILEY VALUE OPPORTUNITIES FUND
The Fund's Class I shares had a total return of +22.81% for the six month period ended December 31, 2016, compared to the S&P 500® Index return of +7.82%.
The Fund's Class I shares outperformed the S&P 500® Index over the six months ended December 31, 2016. The Fund's ability to invest across the market cap spectrum benefitted relative performance. About 24% of the Fund was invested in stocks with a market cap below $3 billion at the beginning of the period; this group returned more than +30% over the period. Stocks trading at a discount to book value outperformed the broad market by a large margin over the six month period. About 42% of the Fund was invested in such stocks at the beginning of the period, compared to about 6% for the S&P 500® Index. Security selection was positive or neutral in all sectors except information technology, which was a nominal detractor. Security selection was particularly strong in health care, consumer
2
discretionary, financials, and industrials. The five largest positive stock contributors to relative performance in the period were Bank of America, Goldman Sachs, Office Depot, ARRIS International, and Rush Enterprises; the largest detractors were Ericsson, Royal Mail, Oracle, InterOil, and Real Industry.
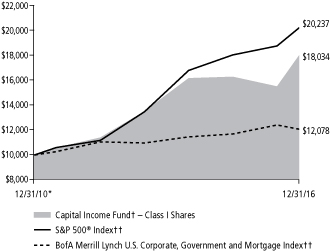
HOTCHKIS & WILEY CAPITAL INCOME FUND
The Fund's Class I shares had a total return of +16.22% for the six month period ended December 31, 2016, compared to the 50/50 blended benchmark of the S&P 500® Index and the BofA Merrill Lynch U.S. Corporate, Government and Mortgage Index return of +2.48%.
In the six month period ended December 31, 2016, the Fund's Class I shares outperformed the 50/50 blended benchmark. The Fund's average equity exposure over the period was 57% compared to the long-term target of 50%, with the balance invested in high yield bonds. This helped relative performance over the period as the equity portion of the portfolio outperformed the high yield portion of the portfolio — though both outperformed the respective benchmarks.
The equity portion of the Fund outperformed the S&P 500® Index over the six month period. At the beginning of the period, 44% of the Fund's equity portion was invested in stocks trading at a discount to book value compared to about 6% for the S&P 500® Index. This group of stocks outperformed the broad market considerably, helping relative performance. Positive stock selection in consumer discretionary, consumer staples, and financials were notable positive contributors along with the overweight exposure to financials and underweight exposure to consumer staples. The five largest positive contributors to relative performance over the period were Fifth Street Asset
Management, Popular, Bank of America, ARRIS International, and Citigroup; the largest detractors were Ericsson, Vodafone, Royal Mail, Calpine, and CoreCivic.
The high yield portion of the Fund outperformed the BofA Merrill Lynch U.S. Corporate, Government and Mortgage Index and the BofA Merrill Lynch US High Yield Index over the six month period. Outperformance relative to the high yield index was driven by positive credit selection in energy, automotive, and services credits along with the overweight allocation to the energy and basic industry sectors.
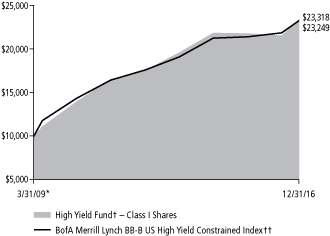
HOTCHKIS & WILEY HIGH YIELD FUND
The Fund's Class I shares had a total return of +8.15% for the six month period ended December 31, 2016, compared to the BofA Merrill Lynch BB-B US High Yield Constrained Index return of +6.32%.
The Fund's Class I shares outperformed the BofA Merrill Lynch US High Yield Index and the BofA Merrill Lynch BB-B US High Yield Constrained Index over the six months ended December 31, 2016. Positive credit selection in energy, automotive, services, and capital goods drove the outperformance during the period. The overweight exposure to the energy and basic industry sectors had a more modest positive impact on relative performance. Credit selection in consumer goods and the underweight exposure to telecommunications detracted from relative performance over the period.
CONCLUSION
We appreciate your continued support of the Hotchkis & Wiley Funds, and we look forward to serving your investment needs in the future.
Sincerely,

| | 
| | 
| | 
| |
Anna Marie Lopez
President | | George Davis
Fund Manager | | Sheldon Lieberman
Fund Manager | | Patty McKenna
Fund Manager | |

| | 
| | 
| | 
| |
James Miles
Fund Manager | | Stan Majcher
Fund Manager | | David Green
Fund Manager | | Scott McBride
Fund Manager | |

| | 
| | 
| | 
| |
Judd Peters
Fund Manager | | Ray Kennedy
Fund Manager | | Mark Hudoff
Fund Manager | | Patrick Meegan
Fund Manager | |

| | 
| | 
| | | |
Scott Rosenthal
Fund Manager | | Richard Mak
Fund Manager | | Ryan Thomes
Fund Manager | |
| |
3
ABOUT FUND PERFORMANCE
The Large Cap Value Fund and Mid-Cap Value Fund have four classes of shares. The Diversified Value Fund, Small Cap Value Fund, Small Cap Diversified Value Fund, Global Value Fund, International Value Fund, Value Opportunities Fund, Capital Income Fund and High Yield Fund have three classes of shares. Each share class has its own sales charge and expense structure, allowing you to invest in the way that best suits your needs. Currently, the Small Cap Diversified Value Fund, Global Value Fund and Capital Income Fund are not offering Class C shares to investors and the International Value Fund is not offering Class A or Class C shares to investors.
Class I shares have no initial sales charge and bear no ongoing distribution and service fees under a 12b-1 plan. Class I shares are available only to eligible investors.
Class A shares incur a maximum initial sales charge of 5.25% for the Diversified Value Fund, Large Cap Value Fund, Mid-Cap Value Fund, Small Cap Value Fund, Small Cap Diversified Value Fund, Global Value Fund, International Value Fund and Value Opportunities Fund, 4.75% for the Capital Income Fund and 3.75% for the High Yield Fund and an annual distribution and service fee of 0.25%.
Class C shares are subject to an annual distribution and service fee of 1.00%. In addition, Class C shares are subject to a 1.00% contingent deferred sales charge (CDSC) if redeemed within one year after purchase. Class C shares automatically convert to Class A shares approximately eight years after purchase and will then be subject to lower annual distribution and service fees.
Class R shares have no initial sales charge or CDSC and are subject to an annual distribution and service fee of 0.50%. Class R shares are offered only by the Large Cap Value Fund and Mid-Cap Value Fund and are available only to certain retirement plans.
FUND RISKS
Mutual fund investing involves risk; loss of principal is possible. The Mid-Cap Value Fund, Small Cap Value Fund, Small Cap Diversified Value Fund, Global Value Fund, International Value Fund and Value Opportunities Fund invest in small- and medium-capitalization companies which tend to have limited liquidity and greater price volatility than large-capitalization companies. The Value Opportunities Fund is a non-diversified fund which involves greater risk than investing in diversified funds, such as business risk, significant stock price fluctuations and sector concentration. Growth stocks typically are more volatile than value stocks; however, value stocks have a lower expected growth rate in earnings and sales. The Value Opportunities Fund, Capital Income Fund and High Yield Fund invest in debt securities that decrease in value when interest rates rise. This risk is usually greater for longer-term debt securities. Investment by the Value Opportunities Fund, Capital Income Fund and High Yield Fund in lower-rated and non-rated securities presents a greater risk of loss to principal and interest than higher-rated securities. The Value Opportunities Fund, Capital Income Fund and High Yield Fund may utilize derivative instruments, which derive their performance from the performance of an underlying asset, index, interest rate or currency exchange rate. Derivatives can be volatile and involve various types and degrees of risks. Depending upon the characteristics of particular derivatives, they can suddenly become illiquid. Investments by the Capital Income Fund and High Yield Fund in asset-backed and mortgage-backed securities include additional risks
that investors should be aware of such as credit risk, prepayment risk, possible illiquidity and default, as well as increased susceptibility to adverse economic developments. The Funds may invest in foreign securities, including developed and emerging markets, which involve greater volatility and political, economic, and currency risks.
MARKET INDEXES
The following are definitions for indexes used in the shareholder letter and the performance summary tables on the following pages. These indexes are unmanaged and include the reinvestment of dividends, but do not reflect the payment of transaction costs and advisory and other fees associated with an investment in the Funds. The securities that comprise these indexes may differ substantially from the securities in the Funds' portfolios. The Funds' value disciplines may prevent or restrict investments in the benchmark indexes. It is not possible to invest directly in an index. Each index named is not the only index which may be used to characterize performance of a specific Fund and other indexes may portray different comparative performance.
S&P 500® Index, a capital weighted, unmanaged index, represents the aggregate market value of the common equity of 500 stocks primarily traded on the New York Stock Exchange.
Russell 1000® Index, an unmanaged index, measures the performance of the 1,000 largest companies in the Russell 3000® Index.
Russell 1000® Value Index measures the performance of those Russell 1000® companies with lower price-to-book ratios and lower forecasted growth values.
Russell Midcap® Index, an unmanaged index, measures the performance of the 800 smallest companies in the Russell 1000® Index.
Russell Midcap® Value Index measures the performance of those Russell Midcap® companies with lower price-to-book ratios and lower forecasted growth values.
Russell 2000® Index, an unmanaged index, measures the performance of the 2,000 smallest companies in the Russell 3000® Index.
Russell 2000® Value Index measures the performance of those Russell 2000® companies with lower price-to-book ratios and lower forecasted growth values.
Russell Developed Index measures the performance of the investable securities in developed countries globally across all market capitalization ranges.
Russell Developed ex-U.S. Index measures the performance of the investable securities in developed countries globally across all market capitalization ranges, excluding U.S. securities.
BofA Merrill Lynch U.S. Corporate, Government and Mortgage Index is a broad-based measure of the total rate of return performance of the U.S. investment grade bond markets. The Index is a capitalization weighted aggregation of outstanding U.S. Treasury, agency and supranational, mortgage pass-through, and investment grade corporate bonds meeting specified selection criteria.
BofA Merrill Lynch BB-B US High Yield Constrained Index contains all securities in the BofA Merrill Lynch U.S. High Yield Index rated BB+ through B- by S&P (or equivalent as rated by Moody's or Fitch), but caps issuer exposure at 2%. Index constituents are capitalization-weighted, based on their current amount outstanding, provided the total allocation to an individual issuer does not exceed 2%.
4
BofA Merrill Lynch US High Yield Index tracks the performance of below investment grade, but not in default, U.S. dollar-denominated corporate bonds publicly issued in the U.S. domestic market, and includes issues with a credit rating of BBB or below, as rated by Moody's and S&P.
DISCLOSURE
Past performance does not guarantee future results.
The shareholder letter reflects opinions of Fund managers as of December 31, 2016. They are subject to change and any forecasts made cannot be guaranteed. The Funds might not continue to hold any securities mentioned and have no obligation to disclose purchases or sales in these securities. Please refer to the Schedule of Investments in this report for a complete list of Fund holdings for December 31, 2016. Indexes do not incur expenses or sales loads and are not available for investment.
The Global Industry Classification Standard (GICS® ) was developed by MSCI, an independent provider of global indices and benchmark-related products and services, and Standard & Poor's (S&P), an independent international financial data and investment services company. The GICS methodology has been widely accepted as an industry analysis framework for investment research, portfolio management and asset allocation. The GICS structure consists of 11 sectors, 24 industry groups, 68 industries and 157 sub-industries. Each stock that is classified will have a coding at all four of these levels.
Credit Quality weights by rating were derived from the highest bond rating as determined by S&P, Moody's or Fitch. Bond ratings are grades given to bonds that indicate their credit quality as determined by private independent rating services such as S&P, Moody's and Fitch. These firms evaluate a bond issuer's financial strength, or its ability to pay a bond's principal and interest in a timely fashion. Ratings are expressed as letters ranging from 'AAA', which is the highest grade, to 'D', which is the lowest grade. In limited situations when none of the three rating agencies have issued a formal rating, the Advisor will classify the security as nonrated.
Investing in value stocks presents the risk that value stocks may fall out of favor with investors and underperform other asset types during a given periods. Equities, bonds, and other asset classes have different risk profiles, which should be considered when investing. All investments contain risk and may lose value.
Earnings growth is not representative of the Fund's future performance.
A basis point is one hundredth of one percent (0.01%).
Book value is the net asset value of a company, calculated by subtracting total liabilities from total assets.
Duration is a commonly used measure of the potential volatility of the price of a debt security, or the aggregate market value of a portfolio of debt securities, prior to maturity. Securities with a longer duration generally have more volatile prices than securities of comparable quality with a shorter duration.
Market Capitalization of a company is calculated by multiplying the number of outstanding shares by the current market price of a share.
Price-to-book (P/B) is the price of a stock divided by its book value. Book value is the net asset value of a company, calculated by subtracting total liabilities from total assets.
Spread is the percentage point difference between yields of various classes of bonds compared to treasury bonds.
The Value Opportunities Fund held futures contracts and the High Yield Fund held credit default swap contracts, which resulted in realized gains and unrealized losses to each Fund.
5
DIVERSIFIED VALUE FUND
Total Return Based on a $10,000 Investment
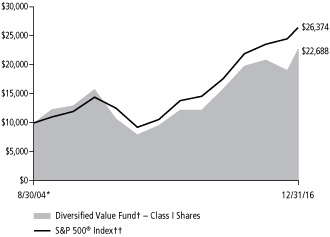
Comparative Results†††
For Periods ended December 31, 2016 | | Six Months | | 1 Year | | 5 Years | | 10 Years | | Since
8/30/04* | |
Class I | |
Average annual total return | | | 19.02 | % | | | 19.94 | % | | | 15.29 | % | | | 4.25 | % | | | 6.87 | % | |
Class A | |
Average annual total return (with sales charge) | | | 12.59 | % | | | 13.34 | % | | | 13.77 | % | | | 3.43 | % | | | 6.14 | % | |
Average annual total return (without sales charge) | | | 18.87 | % | | | 19.62 | % | | | 15.01 | % | | | 3.99 | % | | | 6.60 | % | |
Class C | |
Average annual total return (with CDSC) | | | 17.42 | % | | | 17.67 | % | | | 14.13 | % | | | 3.24 | % | | | 5.82 | % | |
Average annual total return (without CDSC) | | | 18.42 | % | | | 18.67 | % | | | 14.13 | % | | | 3.24 | % | | | 5.82 | % | |
S&P 500® Index†† | |
Average annual total return | | | 7.82 | % | | | 11.96 | % | | | 14.66 | % | | | 6.95 | % | | | 8.18 | % | |
Russell 1000® Index†† | |
Average annual total return | | | 8.01 | % | | | 12.05 | % | | | 14.69 | % | | | 7.08 | % | | | 8.44 | % | |
Russell 1000® Value Index†† | |
Average annual total return | | | 10.39 | % | | | 17.34 | % | | | 14.80 | % | | | 5.72 | % | | | 7.97 | % | |
Average annual total returns with sales charge and CDSC shown for Class A and Class C shares, respectively, have been adjusted to reflect the applicable sales charges of each specific class. Returns for Class A reflect the maximum initial sales charge of 5.25%. Class C shares have no adjustment for sales charges, but redemptions within one year of purchase may be subject to a CDSC of 1%. Average annual total returns without sales charge or CDSC do not reflect the sales charges. Had the sales charge or CDSC been included, the Fund's returns would have been lower.
† The Fund invests primarily in equity securities of companies with market capitalizations similar to the Russell 1000® Index.
†† See index descriptions in the Fund Information section.
††† Fund returns during certain periods shown reflect a fee waiver and/or expense reimbursement. Without waiver/reimbursement, returns would have been lower. Returns shown include the reinvestment of all dividends. Returns for periods less than one year are not annualized.
* Commencement of Class I, Class A and Class C.
Past performance is not indicative of future results and the graph and table do not reflect the deduction of taxes that a shareholder would pay on Fund distributions or the redemption of Fund shares.
6
LARGE CAP VALUE FUND
Total Return Based on a $10,000 Investment
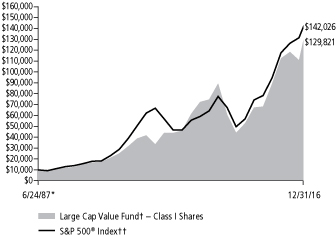
Comparative Results†††
For Periods ended December 31, 2016 | | Six Months | | 1 Year | | 5 Years | | 10 Years | | Since
6/24/87* | |
Class I | |
Average annual total return | | | 16.95 | % | | | 19.72 | % | | | 15.80 | % | | | 4.32 | % | | | 9.07 | % | |
Class A | |
Average annual total return (with sales charge) | | | 10.61 | % | | | 13.11 | % | | | 14.27 | % | | | 3.49 | % | | | 8.62 | % | |
Average annual total return (without sales charge) | | | 16.74 | % | | | 19.38 | % | | | 15.51 | % | | | 4.05 | % | | | 8.82 | % | |
Class C | |
Average annual total return (with CDSC) | | | 15.31 | % | | | 17.50 | % | | | 14.65 | % | | | 3.31 | % | | | 8.00 | % | |
Average annual total return (without CDSC) | | | 16.31 | % | | | 18.50 | % | | | 14.65 | % | | | 3.31 | % | | | 8.00 | % | |
Class R | |
Average annual total return | | | 16.65 | % | | | 19.13 | % | | | 15.23 | % | | | 3.79 | % | | | 8.54 | % | |
S&P 500® Index†† | |
Average annual total return | | | 7.82 | % | | | 11.96 | % | | | 14.66 | % | | | 6.95 | % | | | 9.40 | % | |
Russell 1000® Index†† | |
Average annual total return | | | 8.01 | % | | | 12.05 | % | | | 14.69 | % | | | 7.08 | % | | | 9.52 | % | |
Russell 1000® Value Index†† | |
Average annual total return | | | 10.39 | % | | | 17.34 | % | | | 14.80 | % | | | 5.72 | % | | | n/a | | |
Returns shown for Class A, Class C, and Class R shares for the periods prior to their inception are derived from the historical performance of Class I shares of the Fund during such periods and have been adjusted to reflect the higher total annual operating expenses of each specific class. (Inception dates: Class A — 10/26/01; Class C — 2/4/02; Class R — 8/28/03.)
Average annual total returns with sales charge and CDSC shown for Class A and Class C shares, respectively, have been adjusted to reflect the applicable sales charges of each specific class. Returns for Class A reflect the maximum initial sales charge of 5.25%. Class C shares have no adjustment for sales charges, but redemptions within one year of purchase may be subject to a CDSC of 1%. Average annual total returns without sales charge or CDSC do not reflect the sales charges. Had the sales charge or CDSC been included, the Fund's returns would have been lower.
† The Fund invests primarily in equity securities of companies with market capitalizations similar to the Russell 1000® Index.
†† See index descriptions in the Fund Information section.
††† Fund returns during certain periods shown reflect a fee waiver and/or expense reimbursement. Without waiver/reimbursement, returns would have been lower. Returns shown include the reinvestment of all dividends. Returns for periods less than one year are not annualized.
* Commencement of Class I.
Past performance is not indicative of future results and the graph and table do not reflect the deduction of taxes that a shareholder would pay on Fund distributions or the redemption of Fund shares.
7
MID-CAP VALUE FUND
Total Return Based on a $10,000 Investment
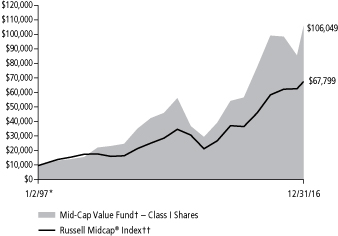
Comparative Results†††
For Periods ended December 31, 2016 | | Six Months | | 1 Year | | 5 Years | | 10 Years | | Since
1/2/97* | |
Class I | |
Average annual total return | | | 23.93 | % | | | 21.00 | % | | | 17.28 | % | | | 7.27 | % | | | 12.54 | % | |
Class A | |
Average annual total return (with sales charge) | | | 17.29 | % | | | 14.37 | % | | | 15.74 | % | | | 6.43 | % | | | 11.96 | % | |
Average annual total return (without sales charge) | | | 23.79 | % | | | 20.70 | % | | | 16.99 | % | | | 7.00 | % | | | 12.26 | % | |
Class C | |
Average annual total return (with CDSC) | | | 22.30 | % | | | 18.81 | % | | | 16.11 | % | | | 6.27 | % | | | 11.45 | % | |
Average annual total return (without CDSC) | | | 23.30 | % | | | 19.81 | % | | | 16.11 | % | | | 6.27 | % | | | 11.45 | % | |
Class R | |
Average annual total return | | | 23.61 | % | | | 20.43 | % | | | 16.72 | % | | | 6.74 | % | | | 12.06 | % | |
Russell Midcap® Index†† | |
Average annual total return | | | 7.87 | % | | | 13.80 | % | | | 14.72 | % | | | 7.86 | % | | | 10.05 | % | |
Russell Midcap® Value Index†† | |
Average annual total return | | | 10.22 | % | | | 20.00 | % | | | 15.70 | % | | | 7.59 | % | | | 10.64 | % | |
Returns shown for Class A, Class C, and Class R shares for the periods prior to their inception are derived from the historical performance of Class I shares of the Fund during such periods and have been adjusted to reflect the higher total annual operating expenses of each specific class. (Inception dates: Class A, Class C — 1/2/01; Class R — 8/28/03.)
Average annual total returns with sales charge and CDSC shown for Class A and Class C shares, respectively, have been adjusted to reflect the applicable sales charges of each specific class. Returns for Class A reflect the maximum initial sales charge of 5.25%. Class C shares have no adjustment for sales charges, but redemptions within one year of purchase may be subject to a CDSC of 1%. Average annual total returns without sales charge or CDSC do not reflect the sales charges. Had the sales charge or CDSC been included, the Fund's returns would have been lower.
† The Fund invests primarily in equity securities of companies with market capitalizations similar to the Russell Midcap® Index.
†† See index descriptions in the Fund Information section.
††† Fund returns during certain periods shown reflect a fee waiver and/or expense reimbursement. Without waiver/reimbursement, returns would have been lower. Returns shown include the reinvestment of all dividends. Returns for periods less than one year are not annualized.
* Commencement of Class I.
Past performance is not indicative of future results and the graph and table do not reflect the deduction of taxes that a shareholder would pay on Fund distributions or the redemption of Fund shares.
8
SMALL CAP VALUE FUND
Total Return Based on a $10,000 Investment
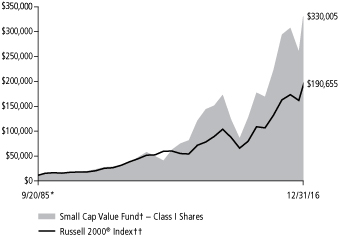
Comparative Results†††
For Periods ended December 31, 2016 | | Six Months | | 1 Year | | 5 Years | | 10 Years | | Since
9/20/85* | |
Class I | |
Average annual total return | | | 27.41 | % | | | 20.12 | % | | | 17.12 | % | | | 7.71 | % | | | 11.83 | % | |
Class A | |
Average annual total return (with sales charge) | | | 20.58 | % | | | 13.53 | % | | | 15.57 | % | | | 6.86 | % | | | 11.38 | % | |
Average annual total return (without sales charge) | | | 27.25 | % | | | 19.81 | % | | | 16.82 | % | | | 7.43 | % | | | 11.58 | % | |
Class C | |
Average annual total return (with CDSC) | | | 25.75 | % | | | 17.91 | % | | | 15.95 | % | | | 6.71 | % | | | 10.77 | % | |
Average annual total return (without CDSC) | | | 26.75 | % | | | 18.91 | % | | | 15.95 | % | | | 6.71 | % | | | 10.77 | % | |
Russell 2000® Index†† | |
Average annual total return | | | 18.68 | % | | | 21.31 | % | | | 14.46 | % | | | 7.07 | % | | | 9.87 | % | |
Russell 2000® Value Index†† | |
Average annual total return | | | 24.19 | % | | | 31.74 | % | | | 15.07 | % | | | 6.26 | % | | | n/a | | |
Returns shown for Class A and Class C shares for the periods prior to their inception are derived from the historical performance of Class I shares of the Fund during such periods and have been adjusted to reflect the higher total annual operating expenses of each specific class. (Inception dates: Class A — 10/6/00; Class C — 2/4/02.)
Average annual total returns with sales charge and CDSC shown for Class A and Class C shares, respectively, have been adjusted to reflect the applicable sales charges of each specific class. Returns for Class A reflect the maximum initial sales charge of 5.25%. Class C shares have no adjustment for sales charges, but redemptions within one year of purchase may be subject to a CDSC of 1%. Average annual total returns without sales charge or CDSC do not reflect the sales charges. Had the sales charge or CDSC been included, the Fund's returns would have been lower.
† The Fund invests primarily in equity securities of companies with market capitalizations similar to the Russell 2000® Index.
†† See index descriptions in the Fund Information section.
††† Fund returns during certain periods shown reflect a fee waiver and/or expense reimbursement. Without waiver/reimbursement, returns would have been lower. Returns shown include the reinvestment of all dividends. Returns for periods less than one year are not annualized.
* Commencement of Class I.
Past performance is not indicative of future results and the graph and table do not reflect the deduction of taxes that a shareholder would pay on Fund distributions or the redemption of Fund shares.
9
SMALL CAP DIVERSIFIED VALUE FUND
Total Return Based on a $10,000 Investment
Comparative Results†††
For Periods ended December 31, 2016 | | Six Months | | 1 Year | | Since
6/30/14* | |
Class I | |
Average annual total return | | | 29.17 | % | | | 34.02 | % | | | 9.40 | % | |
Class A | |
Average annual total return (with sales charge) | | | 22.26 | % | | | 26.48 | % | | | 6.79 | % | |
Average annual total return (without sales charge) | | | 28.98 | % | | | 33.54 | % | | | 9.09 | % | |
Russell 2000® Index†† | |
Average annual total return | | | 18.68 | % | | | 21.31 | % | | | 6.79 | % | |
Russell 2000® Value Index†† | |
Average annual total return | | | 24.19 | % | | | 31.74 | % | | | 8.25 | % | |
Average annual total returns with sales charge shown for Class A shares have been adjusted to reflect the applicable sales charge of the class. Returns for Class A reflect the maximum initial sales charge of 5.25%. Average annual total returns without sales charge do not reflect the sales charge. Had the sales charge been included, the Fund's returns would have been lower.
† The Fund invests primarily in equity securities of companies with market capitalizations similar to the Russell 2000® Index.
†† See index descriptions in the Fund Information section.
††† Fund returns during certain periods shown reflect a fee waiver and/or expense reimbursement. Without waiver/reimbursement, returns would have been lower. Returns shown include the reinvestment of all dividends. Returns for periods less than one year are not annualized.
* Commencement of Class I and Class A.
Past performance is not indicative of future results and the graph and table do not reflect the deduction of taxes that a shareholder would pay on Fund distributions or the redemption of Fund shares.
10
GLOBAL VALUE FUND
Total Return Based on a $10,000 Investment

Comparative Results†††
For Periods ended December 31, 2016 | | Six Months | | 1 Year | | Since
12/31/12* | |
Class I | |
Average annual total return | | | 18.25 | % | | | 16.41 | % | | | 11.08 | % | |
Class A | |
Average annual total return (with sales charge) | | | 12.00 | % | | | 10.03 | % | | | 9.36 | % | |
Average annual total return (without sales charge) | | | 18.21 | % | | | 16.14 | % | | | 10.83 | % | |
Russell Developed Index†† | |
Average annual total return | | | 7.61 | % | | | 8.82 | % | | | 10.06 | % | |
Returns shown for Class A shares for the periods prior to its inception are derived from the historical performance of Class I shares of the Fund during such periods and have been adjusted to reflect the higher total annual operating expenses of the class. (Inception date: Class A — 8/30/13.)
Average annual total returns with sales charge shown for Class A shares have been adjusted to reflect the applicable sales charge of the class. Returns for Class A reflect the maximum initial sales charge of 5.25%. Average annual total returns without sales charge do not reflect the sales charge. Had the sales charge been included, the Fund's returns would have been lower.
† The Fund invests primarily in U.S. and non-U.S. companies.
†† See index description in the Fund Information section.
††† Fund returns during certain periods shown reflect a fee waiver and/or expense reimbursement. Without waiver/reimbursement, returns would have been lower. Returns shown include the reinvestment of all dividends. Returns for periods less than one year are not annualized.
* Commencement of Class I.
Past performance is not indicative of future results and the graph and table do not reflect the deduction of taxes that a shareholder would pay on Fund distributions or the redemption of Fund shares.
11
INTERNATIONAL VALUE FUND
Total Return Based on a $10,000 Investment

Comparative Results†††
For Periods ended December 31, 2016 | | Six Months | | Since
12/31/15*
(1 Year) | |
Class I | |
Average annual total return | | | 13.90 | % | | | 11.17 | % | |
Russell Developed ex-U.S. Index†† | |
Average annual total return | | | 5.87 | % | | | 3.36 | % | |
† The Fund invests primarily in non-U.S. companies.
†† See index description in the Fund Information section.
††† Fund returns during certain periods shown reflect a fee waiver and/or expense reimbursement. Without waiver/reimbursement, returns would have been lower. Returns shown include the reinvestment of all dividends. Returns for periods less than one year are not annualized.
* Commencement of Class I.
Past performance is not indicative of future results and the graph and table do not reflect the deduction of taxes that a shareholder would pay on Fund distributions or the redemption of Fund shares.
12
VALUE OPPORTUNITIES FUND
Total Return Based on a $10,000 Investment
Comparative Results†††
For Periods ended December 31, 2016 | | Six Months | | 1 Year | | 5 Years | | 10 Years | | Since
12/31/02* | |
Class I | |
Average annual total return | | | 22.81 | % | | | 19.42 | % | | | 17.79 | % | | | 9.24 | % | | | 12.97 | % | |
Class A | |
Average annual total return (with sales charge) | | | 16.25 | % | | | 12.88 | % | | | 16.24 | % | | | 8.39 | % | | | 12.32 | % | |
Average annual total return (without sales charge) | | | 22.69 | % | | | 19.15 | % | | | 17.51 | % | | | 8.97 | % | | | 12.75 | % | |
Class C | |
Average annual total return (with CDSC) | | | 21.19 | % | | | 17.24 | % | | | 16.63 | % | | | 8.20 | % | | | 11.89 | % | |
Average annual total return (without CDSC) | | | 22.19 | % | | | 18.24 | % | | | 16.63 | % | | | 8.20 | % | | | 11.89 | % | |
S&P 500® Index†† | |
Average annual total return | | | 7.82 | % | | | 11.96 | % | | | 14.66 | % | | | 6.95 | % | | | 9.12 | % | |
Returns shown for Class C shares for the periods prior to its inception are derived from the historical performance of Class I shares of the Fund during such periods and have been adjusted to reflect the higher total annual operating expenses of the class. (Inception date: Class C — 8/28/03.)
Average annual total returns with sales charge and CDSC shown for Class A and Class C shares, respectively, have been adjusted to reflect the applicable sales charges of each specific class. Returns for Class A reflect the maximum initial sales charge of 5.25%. Class C shares have no adjustment for sales charges, but redemptions within one year of purchase may be subject to a CDSC of 1%. Average annual total returns without sales charge or CDSC do not reflect the sales charge. Had the sales charge or CDSC been included, the Fund's returns would have been lower.
† The Fund invests primarily in securities of companies with strong capital appreciation potential.
†† See index description in the Fund Information section.
††† Fund returns during certain periods shown reflect a fee waiver and/or expense reimbursement. Without waiver/reimbursement, returns would have been lower. Returns shown include the reinvestment of all dividends. Returns for periods less than one year are not annualized.
* Commencement of Class I and Class A.
Past performance is not indicative of future results and the graph and table do not reflect the deduction of taxes that a shareholder would pay on Fund distributions or the redemption of Fund shares.
13
CAPITAL INCOME FUND
Total Return Based on a $10,000 Investment
Comparative Results†††
For Periods ended December 31, 2016 | | Six Months | | 1 Year | | 5 Years | | Since
12/31/10* | |
Class I | |
Average annual total return | | | 16.22 | % | | | 21.50 | % | | | 11.21 | % | | | 10.33 | % | |
Class A | |
Average annual total return (with sales charge) | | | 10.39 | % | | | 15.37 | % | | | 10.29 | % | | | 9.66 | % | |
Average annual total return (without sales charge) | | | 15.92 | % | | | 21.07 | % | | | 11.36 | % | | | 10.55 | % | |
S&P 500® Index†† | |
Average annual total return | | | 7.82 | % | | | 11.96 | % | | | 14.66 | % | | | 12.47 | % | |
BofA Merrill Lynch U.S. Corporate, Government and Mortgage Index†† | |
Average annual total return | | | –2.72 | % | | | 2.61 | % | | | 2.28 | % | | | 3.20 | % | |
Returns shown for Class A shares for the periods prior to its inception are derived from the historical performance of Class I shares of the Fund during such periods and have been adjusted to reflect the higher total annual operating expenses of the class. (Inception date: Class A — 2/28/11.)
Average annual total returns with sales charge shown for Class A shares have been adjusted to reflect the applicable sales charge of the class. Returns for Class A reflect the maximum initial sales charge of 4.75%. Average annual total returns without sales charge do not reflect the sales charge. Had the sales charge been included, the Fund's returns would have been lower.
† The Fund invests primarily in dividend-paying equities and high yield fixed income securities.
†† See index descriptions in the Fund Information section.
††† Fund returns during certain periods shown reflect a fee waiver and/or expense reimbursement. Without waiver/reimbursement, returns would have been lower. Returns shown include the reinvestment of all dividends. Returns for periods less than one year are not annualized.
* Commencement of Class I.
Past performance is not indicative of future results and the graph and table do not reflect the deduction of taxes that a shareholder would pay on Fund distributions or the redemption of Fund shares.
14
HIGH YIELD FUND
Total Return Based on a $10,000 Investment
Comparative Results†††
For Periods ended December 31, 2016 | | Six Months | | 1 Year | | 5 Years | | Since
3/31/09* | |
Class I | |
Average annual total return | | | 8.15 | % | | | 16.02 | % | | | 7.55 | % | | | 11.54 | % | |
Class A | |
Average annual total return (with sales charge) | | | 3.94 | % | | | 11.33 | % | | | 6.45 | % | | | 10.61 | % | |
Average annual total return (without sales charge) | | | 7.96 | % | | | 15.69 | % | | | 7.27 | % | | | 11.16 | % | |
Class C | |
Average annual total return (with CDSC) | | | 6.61 | % | | | 14.08 | % | | | 6.47 | % | | | 10.42 | % | |
Average annual total return (without CDSC) | | | 7.61 | % | | | 15.08 | % | | | 6.47 | % | | | 10.42 | % | |
BofA Merrill Lynch BB-B US High Yield Constrained Index†† | |
Average annual total return | | | 6.32 | % | | | 14.72 | % | | | 7.05 | % | | | 11.50 | % | |
Returns shown for Class A and Class C shares for the periods prior to their inception are derived from the historical performance of Class I shares of the Fund during such periods and have been adjusted to reflect the higher total annual operating expenses of the class. (Inception dates: Class A — 5/29/09; Class C — 12/31/12.)
Average annual total returns with sales charge and CDSC shown for Class A and Class C shares, respectively, have been adjusted to reflect the applicable sales charges of each specific class. Returns for Class A reflect the maximum initial sales charge of 3.75%. Class C shares have no adjustment for sales charges, but redemptions within one year of purchase may be subject to a CDSC of 1%. Average annual total returns without sales charge or CDSC do not reflect the sales charges. Had the sales charge or CDSC been included, the Fund's returns would have been lower. Effective August 29, 2014, the Fund imposes a 2.00% redemption fee on shares that are redeemed or exchanged if they have been held for 90 days or less. Returns shown do not reflect the imposition of the redemption fee. Had the redemption fee been included, the Fund's returns would have been lower.
† The Fund invests primarily in high yield securities.
†† See index description in the Fund Information section.
††† Fund returns during certain periods shown reflect a fee waiver and/or expense reimbursement. Without waiver/reimbursement, returns would have been lower. Returns shown include the reinvestment of all dividends. Returns for periods less than one year are not annualized.
* Commencement of Class I.
Past performance is not indicative of future results and the graph and table do not reflect the deduction of taxes that a shareholder would pay on Fund distributions or the redemption of Fund shares.
15
Schedule of Investments — December 31, 2016
Hotchkis & Wiley Diversified Value Fund (Unaudited)

Largest Equity Holdings | | Percent of
net assets | |
American International Group, Inc. | | | 4.98 | % | |
Citigroup, Inc. | | | 4.76 | % | |
Microsoft Corp. | | | 3.99 | % | |
Bank of America Corp. | | | 3.81 | % | |
Marathon Oil Corp. | | | 3.80 | % | |
Hewlett Packard Enterprise Company | | | 3.79 | % | |
Oracle Corp. | | | 3.27 | % | |
Corning, Inc. | | | 2.97 | % | |
Telefonaktiebolaget LM Ericsson | | | 2.55 | % | |
Sanofi | | | 2.50 | % | |
COMMON
STOCKS — 99.94% | | Shares
Held | | Value | |
CONSUMER DISCRETIONARY — 11.99%
Auto Components — 1.41% | |
Adient PLC (a) | | | 13,274 | | | $ | 777,856 | | |
Magna International, Inc. | | | 23,800 | | | | 1,032,920 | | |
| | | | 1,810,776 | | |
Automobiles — 2.75% | |
General Motors Company | | | 57,500 | | | | 2,003,300 | | |
Harley-Davidson, Inc. | | | 10,700 | | | | 624,238 | | |
Honda Motor Company Ltd. — ADR | | | 30,900 | | | | 901,971 | | |
| | | | 3,529,509 | | |
Media — 5.89% | |
CBS Corp. | | | 25,100 | | | | 1,596,862 | | |
Comcast Corp. | | | 29,100 | | | | 2,009,355 | | |
Discovery Communications, Inc. — Class A (a) | | | 92,400 | | | | 2,532,684 | | |
Discovery Communications, Inc. — Class C (a) | | | 29,900 | | | | 800,722 | | |
Omnicom Group, Inc. | | | 7,300 | | | | 621,303 | | |
| | | | 7,560,926 | | |
Multiline Retail — 0.82% | |
Target Corp. | | | 14,500 | | | | 1,047,335 | | |
Specialty Retail — 1.12% | |
Bed Bath & Beyond, Inc. | | | 35,200 | | | | 1,430,528 | | |
TOTAL CONSUMER DISCRETIONARY | | | 15,379,074 | | |
CONSUMER STAPLES — 2.21%
Food & Staples Retailing — 0.96% | |
Wal-Mart Stores, Inc. | | | 17,800 | | | | 1,230,336 | | |
Food Products — 1.25% | |
Bunge Ltd. | | | 10,000 | | | | 722,400 | | |
Kellogg Company | | | 12,000 | | | | 884,520 | | |
| | | | 1,606,920 | | |
TOTAL CONSUMER STAPLES | | | 2,837,256 | | |
| | Shares
Held | | Value | |
ENERGY — 10.62%
Oil, Gas & Consumable Fuels — 10.62% | |
Apache Corp. | | | 10,400 | | | $ | 660,088 | | |
Cobalt International Energy, Inc. (a) | | | 337,100 | | | | 411,262 | | |
Hess Corp. | | | 46,600 | | | | 2,902,714 | | |
Kosmos Energy Ltd. (a) | | | 109,100 | | | | 764,791 | | |
Marathon Oil Corp. | | | 281,800 | | | | 4,877,958 | | |
Murphy Oil Corp. | | | 54,300 | | | | 1,690,359 | | |
Royal Dutch Shell PLC — ADR | | | 42,762 | | | | 2,325,398 | | |
TOTAL ENERGY | | | 13,632,570 | | |
FINANCIALS — 29.13%
Banks — 15.08% | |
Bank of America Corp. | | | 221,222 | | | | 4,889,006 | | |
Citigroup, Inc. | | | 102,674 | | | | 6,101,916 | | |
Citizens Financial Group, Inc. | | | 65,600 | | | | 2,337,328 | | |
JPMorgan Chase & Company | | | 28,000 | | | | 2,416,120 | | |
Regions Financial Corp. | | | 96,300 | | | | 1,382,868 | | |
Wells Fargo & Company | | | 40,334 | | | | 2,222,807 | | |
| | | | 19,350,045 | | |
Capital Markets — 4.41% | |
The Goldman Sachs Group, Inc. | | | 5,700 | | | | 1,364,865 | | |
Morgan Stanley | | | 53,900 | | | | 2,277,275 | | |
State Street Corp. | | | 25,900 | | | | 2,012,948 | | |
| | | | 5,655,088 | | |
Consumer Finance — 2.24% | |
Capital One Financial Corp. | | | 32,900 | | | | 2,870,196 | | |
Insurance — 7.40% | |
The Allstate Corp. | | | 18,200 | | | | 1,348,984 | | |
American International Group, Inc. | | | 97,800 | | | | 6,387,318 | | |
The Travelers Companies, Inc. | | | 14,400 | | | | 1,762,848 | | |
| | | | 9,499,150 | | |
TOTAL FINANCIALS | | | 37,374,479 | | |
The accompanying notes are an integral part of these financial statements.
16
Schedule of Investments — December 31, 2016
Hotchkis & Wiley Diversified Value Fund (Unaudited)
| | Shares
Held | | Value | |
HEALTH CARE — 8.53%
Biotechnology — 0.77% | |
Biogen, Inc. (a) | | | 3,500 | | | $ | 992,530 | | |
Health Care Equipment & Supplies — 1.07% | |
Medtronic PLC | | | 8,782 | | | | 625,542 | | |
Zimmer Biomet Holdings, Inc. | | | 7,300 | | | | 753,360 | | |
| | | | 1,378,902 | | |
Health Care Providers & Services — 2.47% | |
Anthem, Inc. | | | 22,000 | | | | 3,162,940 | | |
Pharmaceuticals — 4.22% | |
GlaxoSmithKline PLC — ADR | | | 57,100 | | | | 2,198,921 | | |
Sanofi — ADR | | | 79,400 | | | | 3,210,936 | | |
| | | | 5,409,857 | | |
TOTAL HEALTH CARE | | | 10,944,229 | | |
INDUSTRIALS — 12.98%
Aerospace & Defense — 3.27% | |
The Boeing Company | | | 11,500 | | | | 1,790,320 | | |
Embraer SA — ADR | | | 25,800 | | | | 496,650 | | |
Rockwell Collins, Inc. | | | 20,600 | | | | 1,910,856 | | |
| | | | 4,197,826 | | |
Building Products — 1.79% | |
Johnson Controls International PLC | | | 55,747 | | | | 2,296,219 | | |
Electrical Equipment — 1.02% | |
Eaton Corp. PLC | | | 19,500 | | | | 1,308,255 | | |
Industrial Conglomerates — 1.41% | |
Koninklijke Philips NV | | | 59,046 | | | | 1,805,036 | | |
Machinery — 5.49% | |
| CNH Industrial NV | | | 218,200 | | | | 1,896,158 | | |
Cummins, Inc. | | | 20,800 | | | | 2,842,736 | | |
PACCAR, Inc. | | | 11,000 | | | | 702,900 | | |
Parker-Hannifin Corp. | | | 11,500 | | | | 1,610,000 | | |
| | | | 7,051,794 | | |
TOTAL INDUSTRIALS | | | 16,659,130 | | |
INFORMATION TECHNOLOGY — 17.35%
Communications Equipment — 2.55% | |
Telefonaktiebolaget LM Ericsson — ADR | | | 560,800 | | | | 3,269,464 | | |
Electronic Equipment, Instruments & Components — 3.32% | |
Corning, Inc. | | | 157,200 | | | | 3,815,244 | | |
TE Connectivity Ltd. | | | 6,300 | | | | 436,464 | | |
| | | | 4,251,708 | | |
IT Services — 0.43% | |
Teradata Corp. (a) | | | 20,400 | | | | 554,268 | | |
| | Shares
Held | | Value | |
Software — 7.26% | |
Microsoft Corp. | | | 82,300 | | | $ | 5,114,122 | | |
Oracle Corp. | | | 109,300 | | | | 4,202,585 | | |
| | | | 9,316,707 | | |
Technology Hardware, Storage & Peripherals — 3.79% | |
Hewlett Packard Enterprise Company | | | 210,300 | | | | 4,866,342 | | |
TOTAL INFORMATION TECHNOLOGY | | | 22,258,489 | | |
MATERIALS — 1.46%
Containers & Packaging — 1.46% | |
International Paper Company | | | 22,900 | | | | 1,215,074 | | |
Packaging Corp. of America | | | 7,800 | | | | 661,596 | | |
TOTAL MATERIALS | | | 1,876,670 | | |
TELECOMMUNICATION SERVICES — 1.89%
Wireless Telecommunication Services — 1.89% | |
Vodafone Group PLC — ADR | | | 99,263 | | | | 2,424,995 | | |
TOTAL TELECOMMUNICATION SERVICES | | | 2,424,995 | | |
UTILITIES — 3.78%
Electric Utilities — 0.85% | |
PPL Corp. | | | 16,500 | | | | 561,825 | | |
The Southern Company | | | 10,900 | | | | 536,171 | | |
| | | | 1,097,996 | | |
Independent Power and Renewable Electricity
Producers — 2.93% | |
Calpine Corp. (a) | | | 226,700 | | | | 2,591,181 | | |
NRG Energy, Inc. | | | 94,900 | | | | 1,163,474 | | |
| | | | 3,754,655 | | |
TOTAL UTILITIES | | | 4,852,651 | | |
Total common stocks
(Cost $162,061,843) | | | | | 128,239,543 | | |
Total long-term investments
(Cost $162,061,843) | | | | | 128,239,543 | | |
SHORT-TERM
INVESTMENTS — 0.14% | | Principal
Amount | | | |
Time Deposits — 0.14% | |
Bank of Montreal, 0.26%, 01/03/2017* | | $ | 182,134 | | | | 182,134 | | |
Total short-term investments
(Cost $182,134) | | | 182,134 | | |
Total investments — 100.08%
(Cost $162,243,977) | | | | | 128,421,677 | | |
Liabilities in excess of other assets — (0.08)% | | | | | (100,176 | ) | |
Net assets — 100.00% | | $ | 128,321,501 | | |
(a) — Non-income producing security.
ADR — American Depositary Receipt
* — Invested through a cash management account administered by Brown Brothers Harriman & Co.
The accompanying notes are an integral part of these financial statements.
17
Schedule of Investments — December 31, 2016
Hotchkis & Wiley Large Cap Value Fund (Unaudited)
Largest Equity Holdings | | Percent of
net assets | |
American International Group, Inc. | | | 5.00 | % | |
Citigroup, Inc. | | | 4.93 | % | |
Hewlett Packard Enterprise Company | | | 4.15 | % | |
Marathon Oil Corp. | | | 4.14 | % | |
Bank of America Corp. | | | 4.04 | % | |
Microsoft Corp. | | | 3.77 | % | |
Oracle Corp. | | | 3.62 | % | |
Anthem, Inc. | | | 3.00 | % | |
Corning, Inc. | | | 2.79 | % | |
Capital One Financial Corp. | | | 2.72 | % | |
COMMON
STOCKS — 97.42% | | Shares
Held | | Value | |
CONSUMER DISCRETIONARY — 11.60%
Auto Components — 1.70% | |
Adient PLC (a) | | | 77,691 | | | $ | 4,552,693 | | |
Magna International, Inc. | | | 82,900 | | | | 3,597,860 | | |
| | | | 8,150,553 | | |
Automobiles — 2.68% | |
General Motors Company | | | 205,900 | | | | 7,173,556 | | |
Harley-Davidson, Inc. | | | 40,000 | | | | 2,333,600 | | |
Honda Motor Company Ltd. — ADR | | | 115,300 | | | | 3,365,607 | | |
| | | | 12,872,763 | | |
Media — 5.27% | |
CBS Corp. | | | 89,700 | | | | 5,706,714 | | |
Comcast Corp. | | | 103,200 | | | | 7,125,960 | | |
Discovery Communications, Inc. — Class A (a) | | | 350,500 | | | | 9,607,205 | | |
Discovery Communications, Inc. — Class C (a) | | | 107,100 | | | | 2,868,138 | | |
| | | | 25,308,017 | | |
Multiline Retail — 0.80% | |
Target Corp. | | | 52,900 | | | | 3,820,967 | | |
Specialty Retail — 1.15% | |
Bed Bath & Beyond, Inc. | | | 135,700 | | | | 5,514,848 | | |
TOTAL CONSUMER DISCRETIONARY | | | 55,667,148 | | |
CONSUMER STAPLES — 1.10%
Food & Staples Retailing — 1.10% | |
Wal-Mart Stores, Inc. | | | 76,600 | | | | 5,294,592 | | |
TOTAL CONSUMER STAPLES | | | 5,294,592 | | |
ENERGY — 10.22%
Oil, Gas & Consumable Fuels — 10.22% | |
Hess Corp. | | | 176,400 | | | | 10,987,956 | | |
Marathon Oil Corp. | | | 1,148,700 | | | | 19,883,997 | | |
Murphy Oil Corp. | | | 298,900 | | | | 9,304,757 | | |
Royal Dutch Shell PLC — ADR | | | 163,572 | | | | 8,895,045 | | |
TOTAL ENERGY | | | 49,071,755 | | |
| | Shares
Held | | Value | |
FINANCIALS — 28.74%
Banks — 14.63% | |
Bank of America Corp. | | | 876,949 | | | $ | 19,380,573 | | |
Citigroup, Inc. | | | 397,988 | | | | 23,652,427 | | |
Citizens Financial Group, Inc. | | | 205,100 | | | | 7,307,713 | | |
JPMorgan Chase & Company | | | 126,400 | | | | 10,907,056 | | |
Wells Fargo & Company | | | 162,763 | | | | 8,969,869 | | |
| | | | 70,217,638 | | |
Capital Markets — 4.13% | |
The Goldman Sachs Group, Inc. | | | 30,400 | | | | 7,279,280 | | |
State Street Corp. | | | 161,200 | | | | 12,528,464 | | |
| | | | 19,807,744 | | |
Consumer Finance — 2.72% | |
Capital One Financial Corp. | | | 149,500 | | | | 13,042,380 | | |
Insurance — 7.26% | |
The Allstate Corp. | | | 64,900 | | | | 4,810,388 | | |
American International Group, Inc. | | | 367,500 | | | | 24,001,425 | | |
The Travelers Companies, Inc. | | | 49,300 | | | | 6,035,306 | | |
| | | | 34,847,119 | | |
TOTAL FINANCIALS | | | 137,914,881 | | |
HEALTH CARE — 8.30%
Health Care Equipment & Supplies — 1.44% | |
Medtronic PLC | | | 32,700 | | | | 2,329,221 | | |
Zimmer Biomet Holdings, Inc. | | | 44,600 | | | | 4,602,720 | | |
| | | | 6,931,941 | | |
Health Care Providers & Services — 3.00% | |
Anthem, Inc. | | | 100,000 | | | | 14,377,000 | | |
Pharmaceuticals — 3.86% | |
GlaxoSmithKline PLC — ADR | | | 194,500 | | | | 7,490,195 | | |
Sanofi — ADR | | | 273,300 | | | | 11,052,252 | | |
| | | | 18,542,447 | | |
TOTAL HEALTH CARE | | | 39,851,388 | | |
The accompanying notes are an integral part of these financial statements.
18
Schedule of Investments — December 31, 2016
Hotchkis & Wiley Large Cap Value Fund (Unaudited)
| | Shares
Held | | Value | |
INDUSTRIALS — 12.02%
Aerospace & Defense — 2.02% | |
The Boeing Company | | | 48,000 | | | $ | 7,472,640 | | |
Embraer SA — ADR | | | 115,000 | | | | 2,213,750 | | |
| | | | 9,686,390 | | |
Building Products — 1.89% | |
Johnson Controls International PLC | | | 219,919 | | | | 9,058,463 | | |
Industrial Conglomerates — 1.62% | |
Koninklijke Philips NV | | | 254,866 | | | | 7,791,254 | | |
Machinery — 6.09% | |
| CNH Industrial NV | | | 809,500 | | | | 7,034,555 | | |
Cummins, Inc. | | | 91,900 | | | | 12,559,973 | | |
PACCAR, Inc. | | | 37,500 | | | | 2,396,250 | | |
Parker-Hannifin Corp. | | | 51,600 | | | | 7,224,000 | | |
| | | | 29,214,778 | | |
Professional Services — 0.40% | |
ManpowerGroup, Inc. | | | 21,600 | | | | 1,919,592 | | |
TOTAL INDUSTRIALS | | | 57,670,477 | | |
INFORMATION TECHNOLOGY — 17.82%
Communications Equipment — 2.49% | |
Telefonaktiebolaget LM Ericsson — ADR | | | 2,051,700 | | | | 11,961,411 | | |
Electronic Equipment, Instruments & Components — 3.79% | |
Corning, Inc. | | | 552,600 | | | | 13,411,602 | | |
TE Connectivity Ltd. | | | 68,900 | | | | 4,773,392 | | |
| | | | 18,184,994 | | |
Software — 7.39% | |
Microsoft Corp. | | | 291,400 | | | | 18,107,596 | | |
Oracle Corp. | | | 451,700 | | | | 17,367,865 | | |
| | | | 35,475,461 | | |
Technology Hardware, Storage & Peripherals — 4.15% | |
Hewlett Packard Enterprise Company | | | 860,500 | | | | 19,911,970 | | |
TOTAL INFORMATION TECHNOLOGY | | | 85,533,836 | | |
MATERIALS — 1.85%
Containers & Packaging — 1.85% | |
International Paper Company | | | 167,200 | | | | 8,871,632 | | |
TOTAL MATERIALS | | | 8,871,632 | | |
TELECOMMUNICATION SERVICES — 2.35%
Wireless Telecommunication Services — 2.35% | |
Vodafone Group PLC — ADR | | | 461,044 | | | | 11,263,305 | | |
TOTAL TELECOMMUNICATION SERVICES | | | 11,263,305 | | |
UTILITIES — 3.42%
Electric Utilities — 0.40% | |
PPL Corp. | | | 56,300 | | | | 1,917,015 | | |
| | Shares
Held | | Value | |
Independent Power and Renewable Electricity
Producers — 3.02% | |
Calpine Corp. (a) | | | 849,200 | | | $ | 9,706,356 | | |
NRG Energy, Inc. | | | 389,300 | | | | 4,772,818 | | |
| | | | 14,479,174 | | |
TOTAL UTILITIES | | | 16,396,189 | | |
Total common stocks
(Cost $519,661,478) | | | | | 467,535,203 | | |
Total long-term investments
(Cost $519,661,478) | | | | | 467,535,203 | | |
SHORT-TERM
INVESTMENTS — 3.52% | | Principal
Amount | | | |
Time Deposits — 3.52% | |
The Bank of Tokyo-Mitsubishi UFJ, Ltd.,
0.26%, 01/03/2017* | | $ | 16,890,844 | | | | 16,890,844 | | |
Total short-term investments
(Cost $16,890,844) | | | 16,890,844 | | |
Total investments — 100.94%
(Cost $536,552,322) | | | | | 484,426,047 | | |
Liabilities in excess of other assets — (0.94)% | | | | | (4,495,154 | ) | |
Net assets — 100.00% | | $ | 479,930,893 | | |
(a) — Non-income producing security.
ADR — American Depositary Receipt
* — Invested through a cash management account administered by Brown Brothers Harriman & Co.
The accompanying notes are an integral part of these financial statements.
19
Schedule of Investments — December 31, 2016
Hotchkis & Wiley Mid-Cap Value Fund (Unaudited)
Largest Equity Holdings | | Percent of
net assets | |
Popular, Inc. | | | 4.27 | % | |
ARRIS International PLC | | | 4.12 | % | |
Whiting Petroleum Corp. | | | 4.07 | % | |
NRG Energy, Inc. | | | 3.50 | % | |
Kosmos Energy Ltd. | | | 3.41 | % | |
Citizens Financial Group, Inc. | | | 3.34 | % | |
Regions Financial Corp. | | | 3.31 | % | |
Corning, Inc. | | | 3.26 | % | |
Office Depot, Inc. | | | 3.20 | % | |
The Goodyear Tire & Rubber Company | | | 3.17 | % | |
COMMON
STOCKS — 98.66% | | Shares
Held | | Value | |
CONSUMER DISCRETIONARY — 18.18%
Auto Components — 5.10% | |
Adient PLC (a) | | | 427,100 | | | $ | 25,028,060 | | |
The Goodyear Tire & Rubber Company | | | 2,251,200 | | | | 69,494,544 | | |
Magna International, Inc. | | | 398,000 | | | | 17,273,200 | | |
| | | | 111,795,804 | | |
Household Durables — 2.17% | |
TRI Pointe Group, Inc. (a) | | | 4,150,400 | | | | 47,646,592 | | |
Media — 3.74% | |
Discovery Communications, Inc. — Class A (a) | | | 1,611,100 | | | | 44,160,251 | | |
Discovery Communications, Inc. — Class C (a) | | | 410,800 | | | | 11,001,224 | | |
News Corp. | | | 2,334,900 | | | | 26,757,954 | | |
| | | | 81,919,429 | | |
Multiline Retail — 1.09% | |
Kohl's Corp. | | | 486,000 | | | | 23,998,680 | | |
Specialty Retail — 6.08% | |
Bed Bath & Beyond, Inc. | | | 1,168,300 | | | | 47,479,712 | | |
Office Depot, Inc. | | | 15,518,000 | | | | 70,141,360 | | |
Rent-A-Center, Inc. | | | 601,300 | | | | 6,764,625 | | |
Staples, Inc. | | | 968,700 | | | | 8,766,735 | | |
| | | | 133,152,432 | | |
TOTAL CONSUMER DISCRETIONARY | | | 398,512,937 | | |
CONSUMER STAPLES — 1.58%
Food Products — 1.58% | |
Bunge Ltd. | | | 477,400 | | | | 34,487,376 | | |
TOTAL CONSUMER STAPLES | | | 34,487,376 | | |
ENERGY — 19.67%
Energy Equipment & Services — 1.43% | |
Frank's International NV (l) | | | 853,000 | | | | 10,500,430 | | |
McDermott International, Inc. (a) | | | 2,838,700 | | | | 20,977,993 | | |
| | | | 31,478,423 | | |
| | Shares
Held | | Value | |
Oil, Gas & Consumable Fuels — 18.24% | |
Cairn Energy PLC (a) (v) | | | 23,218,600 | | | $ | 67,461,648 | | |
Cobalt International Energy, Inc. (a) | | | 16,578,000 | | | | 20,225,160 | | |
Hess Corp. | | | 81,600 | | | | 5,082,864 | | |
InterOil Corp. (a) | | | 110,300 | | | | 5,248,074 | | |
Kosmos Energy Ltd. (a) | | | 10,675,200 | | | | 74,833,152 | | |
Marathon Oil Corp. | | | 2,645,400 | | | | 45,791,874 | | |
Murphy Oil Corp. | | | 785,800 | | | | 24,461,954 | | |
Ophir Energy PLC (a) (o) (v) | | | 56,995,800 | | | | 67,459,125 | | |
Whiting Petroleum Corp. (a) | | | 7,416,900 | | | | 89,151,138 | | |
| | | | 399,714,989 | | |
TOTAL ENERGY | | | 431,193,412 | | |
FINANCIALS — 22.52%
Banks — 14.47% | |
CIT Group, Inc. | | | 1,430,900 | | | | 61,070,812 | | |
Citizens Financial Group, Inc. | | | 2,056,500 | | | | 73,273,095 | | |
Fifth Third Bancorp | | | 406,100 | | | | 10,952,517 | | |
Popular, Inc. | | | 2,135,000 | | | | 93,555,700 | | |
Regions Financial Corp. | | | 5,046,600 | | | | 72,469,176 | | |
SunTrust Banks, Inc. | | | 104,400 | | | | 5,726,340 | | |
| | | | 317,047,640 | | |
Consumer Finance — 1.73% | |
Ally Financial, Inc. | | | 559,400 | | | | 10,639,788 | | |
Santander Consumer USA Holdings, Inc. (a) | | | 2,026,500 | | | | 27,357,750 | | |
| | | | 37,997,538 | | |
Insurance — 4.98% | |
Brown & Brown, Inc. | | | 245,700 | | | | 11,022,102 | | |
CNO Financial Group, Inc. | | | 1,789,100 | | | | 34,261,265 | | |
Enstar Group Ltd. (a) | | | 30,000 | | | | 5,931,000 | | |
Unum Group | | | 126,800 | | | | 5,570,324 | | |
Willis Towers Watson PLC | | | 428,177 | | | | 52,357,484 | | |
| | | | 109,142,175 | | |
The accompanying notes are an integral part of these financial statements.
20
Schedule of Investments — December 31, 2016
Hotchkis & Wiley Mid-Cap Value Fund (Unaudited)
| | Shares
Held | | Value | |
Thrifts & Mortgage Finance — 1.34% | |
PHH Corp. (a) | | | 1,942,100 | | | $ | 29,442,236 | | |
TOTAL FINANCIALS | | | 493,629,589 | | |
HEALTH CARE — 0.77%
Health Care Equipment & Supplies — 0.52% | |
Zimmer Biomet Holdings, Inc. | | | 109,700 | | | | 11,321,040 | | |
Health Care Providers & Services — 0.25% | |
LifePoint Health, Inc. (a) | | | 98,000 | | | | 5,566,400 | | |
TOTAL HEALTH CARE | | | 16,887,440 | | |
INDUSTRIALS — 7.38%
Aerospace & Defense — 0.98% | |
Embraer SA — ADR | | | 1,111,600 | | | | 21,398,300 | | |
Air Freight & Logistics — 2.35% | |
Royal Mail PLC (v) | | | 9,067,600 | | | | 51,544,079 | | |
Machinery — 3.64% | |
Allison Transmission Holdings, Inc. | | | 297,900 | | | | 10,036,251 | | |
Cummins, Inc. | | | 190,100 | | | | 25,980,967 | | |
Navistar International Corp. (a) | | | 1,399,000 | | | | 43,886,630 | | |
| | | | 79,903,848 | | |
Road & Rail — 0.41% | |
Avis Budget Group, Inc. (a) | | | 244,300 | | | | 8,960,924 | | |
TOTAL INDUSTRIALS | | | 161,807,151 | | |
INFORMATION TECHNOLOGY — 20.35%
Communications Equipment — 7.22% | |
ARRIS International PLC (a) | | | 2,996,600 | | | | 90,287,558 | | |
Telefonaktiebolaget LM Ericsson — ADR | | | 11,653,000 | | | | 67,936,990 | | |
| | | | 158,224,548 | | |
Electronic Equipment, Instruments & Components — 6.73% | |
Avnet, Inc. | | | 812,700 | | | | 38,692,647 | | |
CDW Corp. | | | 716,100 | | | | 37,301,649 | | |
Corning, Inc. | | | 2,942,800 | | | | 71,421,756 | | |
| | | | 147,416,052 | | |
IT Services — 0.72% | |
Teradata Corp. (a) | | | 582,600 | | | | 15,829,242 | | |
Semiconductors & Semiconductor Equipment — 3.29% | |
Marvell Technology Group Ltd. | | | 2,346,700 | | | | 32,548,729 | | |
ON Semiconductor Corp. (a) | | | 3,102,300 | | | | 39,585,348 | | |
| | | | 72,134,077 | | |
Technology Hardware, Storage & Peripherals — 2.39% | |
Hewlett Packard Enterprise Company | | | 2,261,900 | | | | 52,340,366 | | |
TOTAL INFORMATION TECHNOLOGY | | | 445,944,285 | | |
| | Shares
Held | | Value | |
REAL ESTATE — 1.63%
Equity Real Estate Investment Trusts — 1.63% | |
CoreCivic, Inc. | | | 186,200 | | | $ | 4,554,452 | | |
The GEO Group, Inc. | | | 868,900 | | | | 31,219,577 | | |
TOTAL REAL ESTATE | | | 35,774,029 | | |
UTILITIES — 6.58%
Independent Power and Renewable Electricity
Producers — 6.58% | |
Calpine Corp. (a) | | | 5,899,200 | | | | 67,427,856 | | |
NRG Energy, Inc. | | | 6,252,200 | | | | 76,651,972 | | |
TOTAL UTILITIES | | | 144,079,828 | | |
Total common stocks
(Cost $2,187,972,445) | | | | | 2,162,316,047 | | |
Total long-term investments
(Cost $2,187,972,445) | | | | | 2,162,316,047 | | |
COLLATERAL FOR SECURITIES ON LOAN — 0.29% | |
Money Market Funds — 0.29% | |
Invesco Government & Agency Portfolio —
Institutional Class, 0.43%^ | | | 6,304,168 | | | | 6,304,168 | | |
Total collateral for securities on loan
(Cost $6,304,168) | | | 6,304,168 | | |
SHORT-TERM
INVESTMENTS — 1.22% | | Principal
Amount | | | |
Time Deposits — 1.22% | |
Brown Brothers Harriman & Co.,
0.05%, 01/03/2017* | | GBP | 47 | | | | 58 | | |
Deutsche Bank AG, 0.26%, 01/03/2017* | | $ | 26,879,474 | | | | 26,879,474 | | |
Total short-term investments
(Cost $26,879,536) | | | 26,879,532 | | |
Total investments — 100.17%
(Cost $2,221,156,149) | | | | | 2,195,499,747 | | |
Liabilities in excess of other assets — (0.17)% | | | | | (3,747,077 | ) | |
Net assets — 100.00% | | $ | 2,191,752,670 | | |
(a) — Non-income producing security.
(l) — All or a portion of this security is on a loan. The total market value of securities on loan was $6,136,431. The remaining contractual maturity of all of the securities lending transactions is overnight and continuous.
(o) — Affiliated issuer. See Note 6 in Notes to the Financial Statements.
(v) — Security was fair valued as a result of market movements following the close of local trading using a third-party vendor's proprietary fair value pricing model. The total market value of these securities was $186,464,852, which represented 8.51% of net assets. See Security Valuation in Note 1 in Notes to the Financial Statements.
ADR — American Depositary Receipt
GBP — British Pounds
^ — Rate shown is the 7-day yield as of December 31, 2016.
* — Invested through a cash management account administered by Brown Brothers Harriman & Co.
The accompanying notes are an integral part of these financial statements.
21
Schedule of Investments — December 31, 2016
Hotchkis & Wiley Small Cap Value Fund (Unaudited)

Largest Equity Holdings | | Percent of
net assets | |
ARRIS International PLC | | | 4.60 | % | |
Rush Enterprises, Inc. | | | 4.06 | % | |
EnPro Industries, Inc. | | | 3.97 | % | |
Horace Mann Educators Corp. | | | 3.97 | % | |
KBR, Inc. | | | 3.67 | % | |
Office Depot, Inc. | | | 3.42 | % | |
Enstar Group Ltd. | | | 3.41 | % | |
Popular, Inc. | | | 3.40 | % | |
Tutor Perini Corp. | | | 3.19 | % | |
The GEO Group, Inc. | | | 3.11 | % | |
COMMON
STOCKS — 99.14% | | Shares
Held | | Value | |
CONSUMER DISCRETIONARY — 11.78%
Hotels, Restaurants & Leisure — 0.59% | |
Golden Entertainment, Inc. | | | 80,700 | | | $ | 977,277 | | |
Ruby Tuesday, Inc. (a) | | | 1,217,700 | | | | 3,933,171 | | |
| | | | 4,910,448 | | |
Household Durables — 3.57% | |
M/I Homes, Inc. (a) | | | 408,100 | | | | 10,275,958 | | |
TRI Pointe Group, Inc. (a) | | | 1,679,400 | | | | 19,279,512 | | |
| | | | 29,555,470 | | |
Media — 1.30% | |
MDC Partners, Inc. (a) | | | 1,634,500 | | | | 10,705,975 | | |
Specialty Retail — 6.32% | |
Group 1 Automotive, Inc. | | | 65,400 | | | | 5,097,276 | | |
Office Depot, Inc. | | | 6,264,500 | | | | 28,315,540 | | |
Sonic Automotive, Inc. | | | 826,000 | | | | 18,915,400 | | |
| | | | 52,328,216 | | |
TOTAL CONSUMER DISCRETIONARY | | | 97,500,109 | | |
ENERGY — 6.54%
Energy Equipment & Services — 1.53% | |
Frank's International NV (l) | | | 319,700 | | | | 3,935,507 | | |
McDermott International, Inc. (a) | | | 1,179,000 | | | | 8,712,810 | | |
| | | | 12,648,317 | | |
Oil, Gas & Consumable Fuels — 5.01% | |
Cairn Energy PLC (a) (v) | | | 2,507,600 | | | | 7,285,833 | | |
Cobalt International Energy, Inc. (a) | | | 2,720,600 | | | | 3,319,132 | | |
Kosmos Energy Ltd. (a) | | | 1,491,600 | | | | 10,456,116 | | |
PBF Energy, Inc. | | | 302,900 | | | | 8,444,852 | | |
Rockhopper Exploration PLC (a) (v) | | | 5,087,900 | | | | 1,430,032 | | |
Whiting Petroleum Corp. (a) | | | 879,800 | | | | 10,575,196 | | |
| | | 41,511,161 | | |
TOTAL ENERGY | | | 54,159,478 | | |
| | Shares
Held | | Value | |
FINANCIALS — 27.49%
Banks — 12.47% | |
Associated Banc-Corp | | | 447,500 | | | $ | 11,053,250 | | |
The Bank of NT Butterfield & Son Ltd. | | | 225,800 | | | | 7,099,152 | | |
First BanCorp (a) | | | 2,112,900 | | | | 13,966,269 | | |
First Hawaiian, Inc. (l) | | | 356,700 | | | | 12,420,294 | | |
First Horizon National Corp. | | | 937,331 | | | | 18,755,993 | | |
Investors Bancorp, Inc. | | | 256,300 | | | | 3,575,385 | | |
KeyCorp | | | 450,704 | | | | 8,234,362 | | |
Popular, Inc. | | | 641,600 | | | | 28,114,912 | | |
| | | | 103,219,617 | | |
Capital Markets — 1.33% | |
Oppenheimer Holdings, Inc. | | | 592,700 | | | | 11,024,220 | | |
Consumer Finance — 1.03% | |
SLM Corp. (a) | | | 770,800 | | | | 8,494,216 | | |
Insurance — 11.48% | |
CNO Financial Group, Inc. | | | 1,017,900 | | | | 19,492,785 | | |
Enstar Group Ltd. (a) | | | 142,979 | | | | 28,266,948 | | |
Global Indemnity Ltd. (a) | | | 377,836 | | | | 14,437,114 | | |
Horace Mann Educators Corp. (c) | | | 767,500 | | | | 32,849,000 | | |
| | | | 95,045,847 | | |
Thrifts & Mortgage Finance — 1.18% | |
PHH Corp. (a) | | | 496,600 | | | | 7,528,456 | | |
Washington Federal, Inc. | | | 65,600 | | | | 2,253,360 | | |
| | | | 9,781,816 | | |
TOTAL FINANCIALS | | | 227,565,716 | | |
HEALTH CARE — 5.95%
Health Care Equipment & Supplies — 0.86% | |
Invacare Corp. | | | 549,000 | | | | 7,164,450 | | |
The accompanying notes are an integral part of these financial statements.
22
Schedule of Investments — December 31, 2016
Hotchkis & Wiley Small Cap Value Fund (Unaudited)
| | Shares
Held | | Value | |
Health Care Providers & Services — 4.73% | |
Hanger, Inc. (a) (o) | | | 1,996,200 | | | $ | 22,954,903 | | |
LifePoint Health, Inc. (a) | | | 285,300 | | | | 16,205,040 | | |
| | | | 39,159,943 | | |
Pharmaceuticals — 0.36% | |
Phibro Animal Health Corp. | | | 100,600 | | | | 2,947,580 | | |
TOTAL HEALTH CARE | | | 49,271,973 | | |
INDUSTRIALS — 24.35%
Aerospace & Defense — 0.42% | |
Embraer SA — ADR | | | 179,000 | | | | 3,445,750 | | |
Building Products — 2.54% | |
Masonite International Corp. (a) | | | 320,200 | | | | 21,069,160 | | |
Construction & Engineering — 6.86% | |
KBR, Inc. | | | 1,821,900 | | | | 30,407,511 | | |
Tutor Perini Corp. (a) | | | 942,600 | | | | 26,392,800 | | |
| | | | 56,800,311 | | |
Machinery — 7.31% | |
EnPro Industries, Inc. | | | 488,400 | | | | 32,898,624 | | |
Meritor, Inc. (a) | | | 979,400 | | | | 12,164,148 | | |
Miller Industries, Inc. | | | 532,700 | | | | 14,089,915 | | |
Navistar International Corp. (a) | | | 43,100 | | | | 1,352,047 | | |
| | | | 60,504,734 | | |
Marine — 2.16% | |
Matson, Inc. (c) | | | 505,100 | | | | 17,875,489 | | |
Professional Services — 1.00% | |
Hudson Global, Inc. (a) (o) | | | 2,187,600 | | | | 2,975,136 | | |
Korn/Ferry International | | | 180,900 | | | | 5,323,887 | | |
| | | | 8,299,023 | | |
Trading Companies & Distributors — 4.06% | |
Rush Enterprises, Inc. (a) (c) | | | 1,053,300 | | | | 33,600,270 | | |
TOTAL INDUSTRIALS | | | 201,594,737 | | |
INFORMATION TECHNOLOGY — 10.04%
Communications Equipment — 6.07% | |
ARRIS International PLC (a) | | | 1,264,400 | | | | 38,096,372 | | |
Extreme Networks, Inc. (a) | | | 2,411,400 | | | | 12,129,342 | | |
| | | | 50,225,714 | | |
Semiconductors & Semiconductor Equipment — 3.97% | |
Diodes, Inc. (a) | | | 680,200 | | | | 17,460,734 | | |
ON Semiconductor Corp. (a) | | | 1,208,900 | | | | 15,425,564 | | |
| | | | 32,886,298 | | |
TOTAL INFORMATION TECHNOLOGY | | | 83,112,012 | | |
MATERIALS — 3.18%
Chemicals — 1.45% | |
American Vanguard Corp. | | | 628,000 | | | | 12,026,200 | | |
| | Shares
Held | | Value | |
Metals & Mining — 1.73% | |
Noranda Aluminum Holding Corp. (a) (o) | | | 800,300 | | | $ | 19,047 | | |
Real Industry, Inc. (a) (o) | | | 2,334,908 | | | | 14,242,939 | | |
| | | | 14,261,986 | | |
TOTAL MATERIALS | | | 26,288,186 | | |
REAL ESTATE — 5.18%
Equity Real Estate Investment Trusts — 5.18% | |
The GEO Group, Inc. (c) | | | 716,996 | | | | 25,761,666 | | |
Granite Real Estate Investment Trust | | | 322,300 | | | | 10,787,381 | | |
Pebblebrook Hotel Trust | | | 98,500 | | | | 2,930,375 | | |
Seritage Growth Properties (l) | | | 78,600 | | | | 3,357,006 | | |
TOTAL REAL ESTATE | | | 42,836,428 | | |
UTILITIES — 4.63%
Electric Utilities — 3.52% | |
Great Plains Energy, Inc. | | | 611,200 | | | | 16,716,320 | | |
Portland General Electric Company | | | 285,700 | | | | 12,379,381 | | |
| | | | 29,095,701 | | |
Independent Power and Renewable Electricity
Producers — 1.11% | |
NRG Energy, Inc. | | | 750,399 | | | | 9,199,892 | | |
TOTAL UTILITIES | | | 38,295,593 | | |
Total common stocks
(Cost $710,622,529) | | | | | 820,624,232 | | |
Total long-term investments
(Cost $710,622,529) | | | | | 820,624,232 | | |
COLLATERAL FOR SECURITIES ON LOAN — 0.70% | |
Money Market Funds — 0.70% | |
Invesco Government & Agency Portfolio —
Institutional Class, 0.43%^ | | | 5,786,516 | | | | 5,786,516 | | |
Total collateral for securities on loan
(Cost $5,786,516) | | | | | 5,786,516 | | |
SHORT-TERM
INVESTMENTS — 0.11% | | Principal
Amount | | | |
Time Deposits — 0.11% | |
The Bank of Tokyo-Mitsubishi UFJ, Ltd.,
0.26%, 01/03/2017* | | $ | 924,023 | | | | 924,023 | | |
Total short-term investments
(Cost $924,023) | | | 924,023 | | |
Total investments — 99.95%
(Cost $717,333,068) | | | | | 827,334,771 | | |
Other assets in excess of liabilities — 0.05% | | | | | 417,116 | | |
Net assets — 100.00% | | $ | 827,751,887 | | |
(a) — Non-income producing security.
(c) — All or a portion of this security is segregated as collateral.
(l) — All or a portion of this security is on loan. The total market value of securities on loan was $5,650,058. The remaining contractual maturity of all of the securities lending transactions is overnight and continuous.
The accompanying notes are an integral part of these financial statements.
23
Schedule of Investments — December 31, 2016
Hotchkis & Wiley Small Cap Value Fund (Unaudited)
(o) — Affiliated issuer. See Note 6 in Notes to the Financial Statements.
(v) — Security was fair valued as a result of market movements following the close of local trading using a third-party vendor's proprietary fair value pricing model. The total market value of these securities was $8,715,865, which represented 1.05% of net assets. See Security Valuation in Note 1 in Notes to the Financial Statements.
^ — Rate shown is the 7-day yield as of December 31, 2016.
* — Invested through a cash management account administered by Brown Brothers Harriman & Co.
The accompanying notes are an integral part of these financial statements.
24
Schedule of Investments — December 31, 2016
Hotchkis & Wiley Small Cap Diversified Value Fund (Unaudited)

Largest Equity Holdings | | Percent of
net assets | |
CVR Energy, Inc. | | | 0.60 | % | |
CARBO Ceramics, Inc. | | | 0.57 | % | |
Kosmos Energy Ltd. | | | 0.55 | % | |
RigNet, Inc. | | | 0.54 | % | |
Carolina Financial Corp. | | | 0.53 | % | |
McDermott International, Inc. | | | 0.53 | % | |
VAALCO Energy, Inc. | | | 0.53 | % | |
Rush Enterprises, Inc. | | | 0.53 | % | |
Barrett Business Services, Inc. | | | 0.52 | % | |
Triumph Bancorp, Inc. | | | 0.51 | % | |
COMMON
STOCKS — 97.37% | | Shares
Held | | Value | |
CONSUMER DISCRETIONARY — 13.62%
Auto Components — 1.59% | |
American Axle & Manufacturing Holdings, Inc. (a) | | | 1,898 | | | $ | 36,631 | | |
Dana, Inc. | | | 3,708 | | | | 70,378 | | |
Modine Manufacturing Company (a) | | | 1,417 | | | | 21,113 | | |
Shiloh Industries, Inc. (a) | | | 2,513 | | | | 17,365 | | |
Standard Motor Products, Inc. | | | 431 | | | | 22,938 | | |
Strattec Security Corp. | | | 1,720 | | | | 69,316 | | |
Tenneco, Inc. (a) | | | 1,114 | | | | 69,592 | | |
| | | | 307,333 | | |
Automobiles — 0.36% | |
Thor Industries, Inc. | | | 690 | | | | 69,035 | | |
Distributors — 0.18% | |
Weyco Group, Inc. | | | 1,130 | | | | 35,369 | | |
Diversified Consumer Services — 0.62% | |
American Public Education, Inc. (a) | | | 703 | | | | 17,259 | | |
Capella Education Company | | | 239 | | | | 20,984 | | |
DeVry Education Group, Inc. | | | 764 | | | | 23,837 | | |
Sotheby's (a) | | | 1,446 | | | | 57,637 | | |
| | | | 119,717 | | |
Hotels, Restaurants & Leisure — 0.96% | |
ILG, Inc. | | | 4,255 | | | | 77,314 | | |
Marriott Vacations Worldwide Corp. | | | 218 | | | | 18,497 | | |
Speedway Motorsports, Inc. | | | 778 | | | | 16,859 | | |
Tropicana Entertainment, Inc. (a) | | | 2,408 | | | | 73,083 | | |
| | | | 185,753 | | |
| | Shares
Held | | Value | |
Household Durables — 3.00% | |
Century Communities, Inc. (a) | | | 896 | | | $ | 18,816 | | |
CSS Industries, Inc. | | | 1,416 | | | | 38,331 | | |
GoPro, Inc. (a) | | | 4,935 | | | | 42,984 | | |
Green Brick Partners, Inc. (a) | | | 5,652 | | | | 56,803 | | |
LGI Homes, Inc. (a) | | | 2,687 | | | | 77,198 | | |
M/I Homes, Inc. (a) | | | 3,129 | | | | 78,787 | | |
Taylor Morrison Home Corp. (a) | | | 3,173 | | | | 61,112 | | |
TRI Pointe Group, Inc. (a) | | | 6,550 | | | | 75,194 | | |
William Lyon Homes (a) | | | 3,029 | | | | 57,642 | | |
ZAGG, Inc. (a) | | | 10,041 | | | | 71,291 | | |
| | | | 578,158 | | |
Internet & Catalog Retail — 0.30% | |
Lands' End, Inc. (a) | | | 2,542 | | | | 38,511 | | |
PetMed Express, Inc. | | | 822 | | | | 18,964 | | |
| | | | 57,475 | | |
Leisure Products — 1.32% | |
Arctic Cat, Inc. (a) | | | 5,035 | | | | 75,626 | | |
Johnson Outdoors, Inc. | | | 1,820 | | | | 72,236 | | |
Malibu Boats, Inc. (a) | | | 3,442 | | | | 65,673 | | |
MCBC Holdings, Inc. | | | 2,800 | | | | 40,824 | | |
| | | | 254,359 | | |
Media — 1.28% | |
Entercom Communications Corp. | | | 1,359 | | | | 20,793 | | |
Harte-Hanks, Inc. (a) | | | 45,518 | | | | 68,732 | | |
Saga Communications, Inc. | | | 689 | | | | 34,657 | | |
Salem Media Group, Inc. | | | 9,387 | | | | 58,669 | | |
Townsquare Media, Inc. (a) | | | 6,140 | | | | 63,917 | | |
| | | | 246,768 | | |
Multiline Retail — 0.27% | |
Dillard's, Inc. | | | 831 | | | | 52,095 | | |
The accompanying notes are an integral part of these financial statements.
25
Schedule of Investments — December 31, 2016
Hotchkis & Wiley Small Cap Diversified Value Fund (Unaudited)
| | Shares
Held | | Value | |
Specialty Retail — 2.86% | |
Asbury Automotive Group, Inc. (a) | | | 237 | | | $ | 14,623 | | |
Barnes & Noble Education, Inc. (a) | | | 6,607 | | | | 75,782 | | |
Boot Barn Holdings, Inc. (a) | | | 1,458 | | | | 18,254 | | |
The Buckle, Inc. | | | 2,571 | | | | 58,619 | | |
Destination Maternity Corp. (a) | | | 7,903 | | | | 40,859 | | |
GameStop Corp. | | | 3,039 | | | | 76,765 | | |
Hibbett Sports, Inc. (a) | | | 795 | | | | 29,654 | | |
Lithia Motors, Inc. | | | 163 | | | | 15,783 | | |
Office Depot, Inc. | | | 14,875 | | | | 67,235 | | |
Sears Hometown and Outlet Stores, Inc. (a) | | | 15,773 | | | | 74,133 | | |
Sonic Automotive, Inc. | | | 3,494 | | | | 80,012 | | |
| | | | 551,719 | | |
Textiles, Apparel & Luxury Goods — 0.88% | |
Deckers Outdoor Corp. (a) | | | 700 | | | | 38,773 | | |
Iconix Brand Group, Inc. (a) | | | 1,735 | | | | 16,205 | | |
Movado Group, Inc. | | | 2,265 | | | | 65,118 | | |
Rocky Brands, Inc. | | | 3,045 | | | | 35,170 | | |
Steven Madden Ltd. (a) | | | 397 | | | | 14,193 | | |
| | | | 169,459 | | |
TOTAL CONSUMER DISCRETIONARY | | | 2,627,240 | | |
CONSUMER STAPLES — 1.03%
Food & Staples Retailing — 0.17% | |
United Natural Foods, Inc. (a) | | | 695 | | | | 33,165 | | |
Food Products — 0.11% | |
Omega Protein Corp. (a) | | | 805 | | | | 20,165 | | |
Personal Products — 0.58% | |
Medifast, Inc. | | | 505 | | | | 21,023 | | |
Nature's Sunshine Products, Inc. | | | 2,184 | | | | 32,760 | | |
Nu Skin Enterprises, Inc. | | | 800 | | | | 38,225 | | |
Nutraceutical International Corp. | | | 592 | | | | 20,690 | | |
| | | | 112,698 | | |
Tobacco — 0.17% | |
Universal Corp. | | | 513 | | | | 32,704 | | |
TOTAL CONSUMER STAPLES | | | 198,732 | | |
| | Shares
Held | | Value | |
ENERGY — 10.79%
Energy Equipment & Services — 4.19% | |
CARBO Ceramics, Inc. (a) | | | 10,501 | | | $ | 109,840 | | |
CSI Compressco LP | | | 2,416 | | | | 23,508 | | |
Dril-Quip, Inc. (a) | | | 1,260 | | | | 75,663 | | |
Geospace Technologies Corp. (a) | | | 3,634 | | | | 73,988 | | |
Gulf Island Fabrication, Inc. | | | 8,061 | | | | 95,926 | | |
Matrix Service Company (a) | | | 1,571 | | | | 35,662 | | |
McDermott International, Inc. (a) | | | 13,865 | | | | 102,462 | | |
Oil States International, Inc. (a) | | | 1,749 | | | | 68,211 | | |
RigNet, Inc. (a) | | | 4,514 | | | | 104,499 | | |
SEACOR Holdings, Inc. (a) | | | 813 | | | | 57,951 | | |
Tidewater, Inc. (a) | | | 10,372 | | | | 35,369 | | |
Unit Corp. (a) | | | 914 | | | | 24,559 | | |
| | | | 807,638 | | |
Oil, Gas & Consumable Fuels — 6.60% | |
Alon USA Energy, Inc. | | | 7,878 | | | | 89,652 | | |
Alon USA Partners LP | | | 7,828 | | | | 75,149 | | |
BP Prudhoe Bay Royalty Trust | | | 3,675 | | | | 87,281 | | |
Cobalt International Energy, Inc. (a) | | | 50,103 | | | | 61,126 | | |
CVR Energy, Inc. | | | 4,539 | | | | 115,244 | | |
CVR Refining LP (a) | | | 8,667 | | | | 90,137 | | |
Delek US Holdings, Inc. | | | 2,382 | | | | 57,335 | | |
Denbury Resources, Inc. (a) | | | 5,751 | | | | 21,164 | | |
Green Plains, Inc. | | | 2,875 | | | | 80,069 | | |
Kosmos Energy Ltd. (a) | | | 15,124 | | | | 106,018 | | |
Pacific Ethanol, Inc. (a) | | | 5,740 | | | | 54,530 | | |
Panhandle Oil and Gas, Inc. | | | 2,922 | | | | 68,813 | | |
Renewable Energy Group, Inc. (a) | | | 7,686 | | | | 74,554 | | |
REX American Resources Corp. (a) | | | 792 | | | | 78,210 | | |
RSP Permian, Inc. (a) | | | 1,009 | | | | 45,022 | | |
VAALCO Energy, Inc. (a) | | | 97,840 | | | | 101,754 | | |
Western Refining, Inc. | | | 1,794 | | | | 67,903 | | |
| | | | 1,273,961 | | |
TOTAL ENERGY | | | 2,081,599 | | |
The accompanying notes are an integral part of these financial statements.
26
Schedule of Investments — December 31, 2016
Hotchkis & Wiley Small Cap Diversified Value Fund (Unaudited)
| | Shares
Held | | Value | |
FINANCIALS — 29.24%
Banks — 18.87% | |
Access National Corp. | | | 851 | | | $ | 23,624 | | |
American National Bankshares, Inc. | | | 1,752 | | | | 60,970 | | |
Ames National Corp. | | | 1,168 | | | | 38,544 | | |
Associated Banc-Corp | | | 3,459 | | | | 85,437 | | |
BancFirst Corp. | | | 507 | | | | 47,176 | | |
The Bancorp, Inc. (a) | | | 10,274 | | | | 80,754 | | |
Bank of Marin Bancorp | | | 867 | | | | 60,473 | | |
Bar Harbor Bankshares | | | 484 | | | | 22,908 | | |
Blue Hills Bancorp, Inc. | | | 1,043 | | | | 19,556 | | |
Brookline Bancorp, Inc. | | | 1,315 | | | | 21,566 | | |
Bryn Mawr Bank Corp. | | | 564 | | | | 23,773 | | |
C&F Financial Corp. | | | 1,490 | | | | 74,277 | | |
Camden National Corp. | | | 2,074 | | | | 92,189 | | |
Carolina Financial Corp. | | | 3,337 | | | | 102,745 | | |
Cathay General Bancorp | | | 511 | | | | 19,433 | | |
Central Valley Community Bancorp | | | 4,144 | | | | 82,714 | | |
Chemical Financial Corp. | | | 387 | | | | 20,964 | | |
City Holding Company | | | 619 | | | | 41,844 | | |
Codorus Valley Bancorp, Inc. | | | 2,981 | | | | 85,255 | | |
Community Trust Bancorp, Inc. | | | 827 | | | | 41,019 | | |
Enterprise Bancorp, Inc. | | | 1,262 | | | | 47,401 | | |
First Bancorp | | | 2,247 | | | | 60,984 | | |
First BanCorp (a) | | | 13,240 | | | | 87,516 | | |
First Bancorp, Inc. | | | 791 | | | | 26,182 | | |
First Citizens BancShares, Inc. | | | 232 | | | | 82,360 | | |
First Financial Bancorp | | | 3,167 | | | | 90,101 | | |
First Financial Corp. | | | 1,735 | | | | 91,608 | | |
First Horizon National Corp. | | | 3,284 | | | | 65,713 | | |
First Interstate BancSystem, Inc. | | | 513 | | | | 21,828 | | |
Flushing Financial Corp. | | | 1,319 | | | | 38,765 | | |
Fulton Financial Corp. | | | 1,077 | | | | 20,248 | | |
Hancock Holding Company | | | 2,035 | | | | 87,709 | | |
Hanmi Financial Corp. | | | 1,136 | | | | 39,646 | | |
Heritage Financial Corp. | | | 968 | | | | 24,926 | | |
Hilltop Holdings, Inc. | | | 2,338 | | | | 69,672 | | |
Hope Bancorp, Inc. | | | 3,980 | | | | 87,122 | | |
| | Shares
Held | | Value | |
IBERIABANK Corp. | | | 558 | | | $ | 46,733 | | |
International Bancshares Corp. | | | 2,340 | | | | 95,472 | | |
Lakeland Bancorp, Inc. | | | 1,431 | | | | 27,905 | | |
LCNB Corp. | | | 895 | | | | 20,809 | | |
Merchants Bancshares, Inc. | | | 884 | | | | 47,913 | | |
National Bankshares, Inc. | | | 860 | | | | 37,367 | | |
Northrim BanCorp, Inc. | | | 2,570 | | | | 81,212 | | |
Orrstown Financial Services, Inc. | | | 3,380 | | | | 75,712 | | |
Peapack Gladstone Financial Corp. | | | 3,080 | | | | 95,110 | | |
Penns Woods Bancorp, Inc. | | | 382 | | | | 19,291 | | |
Peoples Bancorp, Inc. | | | 2,254 | | | | 73,165 | | |
People's Utah Bancorp | | | 881 | | | | 23,655 | | |
Popular, Inc. | | | 2,122 | | | | 92,986 | | |
Premier Financial Bancorp, Inc. | | | 4,236 | | | | 85,146 | | |
Republic Bancorp, Inc. | | | 2,302 | | | | 91,021 | | |
S&T Bancorp, Inc. | | | 567 | | | | 22,136 | | |
Sandy Spring Bancorp, Inc. | | | 517 | | | | 20,675 | | |
Shore Bancshares, Inc. | | | 5,126 | | | | 78,172 | | |
Sierra Bancorp | | | 776 | | | | 20,634 | | |
Southwest Bancorp, Inc. | | | 920 | | | | 26,680 | | |
State Bank Financial Corp. | | | 1,420 | | | | 38,141 | | |
Suffolk Bancorp | | | 1,158 | | | | 49,586 | | |
Summit Financial Group, Inc. | | | 1,814 | | | | 49,939 | | |
TCF Financial Corp. | | | 3,490 | | | | 68,369 | | |
Texas Capital Bancshares, Inc. (a) | | | 1,225 | | | | 96,040 | | |
TriCo Bancshares | | | 1,835 | | | | 62,720 | | |
Triumph Bancorp, Inc. (a) | | | 3,783 | | | | 98,925 | | |
Trustmark Corp. | | | 2,510 | | | | 89,482 | | |
Valley National Bancorp | | | 1,483 | | | | 17,262 | | |
| | | | 3,639,260 | | |
Capital Markets — 0.50% | |
Och-Ziff Capital Management Group LLC (a) | | | 10,271 | | | | 33,997 | | |
Oppenheimer Holdings, Inc. | | | 3,357 | | | | 62,440 | | |
| | | | 96,437 | | |
Consumer Finance — 0.87% | |
Nelnet, Inc. | | | 1,372 | | | | 69,629 | | |
SLM Corp. (a) | | | 8,811 | | | | 97,097 | | |
| | | | 166,726 | | |
The accompanying notes are an integral part of these financial statements.
27
Schedule of Investments — December 31, 2016
Hotchkis & Wiley Small Cap Diversified Value Fund (Unaudited)
| | Shares
Held | | Value | |
Insurance — 4.04% | |
Ambac Financial Group, Inc. (a) | | | 1,762 | | | $ | 39,645 | | |
American National Insurance Company | | | 253 | | | | 31,526 | | |
Aspen Insurance Holdings Ltd. | | | 608 | | | | 33,440 | | |
Crawford & Company | | | 3,548 | | | | 33,600 | | |
Employers Holdings, Inc. | | | 1,035 | | | | 40,986 | | |
Enstar Group Ltd. (a) | | | 183 | | | | 36,179 | | |
Global Indemnity Ltd. (a) | | | 2,199 | | | | 84,023 | | |
Greenlight Capital Re Ltd. (a) | | | 1,341 | | | | 30,575 | | |
Hallmark Financial Services, Inc. (a) | | | 2,594 | | | | 30,168 | | |
Horace Mann Educators Corp. | | | 1,831 | | | | 78,367 | | |
Kemper Corp. | | | 1,459 | | | | 64,634 | | |
MBIA, Inc. (a) | | | 4,325 | | | | 46,278 | | |
National Western Life Group, Inc. | | | 314 | | | | 97,590 | | |
The Navigators Group, Inc. | | | 346 | | | | 40,742 | | |
State Auto Financial Corp. | | | 1,278 | | | | 34,263 | | |
Third Point Reinsurance Ltd. (a) | | | 4,965 | | | | 57,346 | | |
| | | | 779,362 | | |
Mortgage Real Estate Investment Trusts — 1.49% | |
Altisource Residential Corp. | | | 3,343 | | | | 36,907 | | |
Arbor Realty Trust, Inc. | | | 7,755 | | | | 57,853 | | |
Ares Commercial Real Estate Corp. | | | 1,321 | | | | 18,137 | | |
Cherry Hill Mortgage Investment Corp. | | | 992 | | | | 18,044 | | |
Chimera Investment Corp. | | | 1,032 | | | | 17,565 | | |
Great Ajax Corp. | | | 2,630 | | | | 34,900 | | |
MFA Financial, Inc. | | | 1,966 | | | | 15,001 | | |
PennyMac Mortgage Investment Trust | | | 2,139 | | | | 35,015 | | |
Resource Capital Corp. | | | 4,189 | | | | 34,894 | | |
Sutherland Asset Management Corp. | | | 1,376 | | | | 18,507 | | |
| | | | 286,823 | | |
Thrifts & Mortgage Finance — 3.47% | |
Dime Community Bancshares, Inc. | | | 2,513 | | | | 50,511 | | |
ESSA Bancorp, Inc. | | | 3,223 | | | | 50,666 | | |
EverBank Financial Corp. | | | 3,978 | | | | 77,371 | | |
HomeStreet, Inc. (a) | | | 2,118 | | | | 66,929 | | |
OceanFirst Financial Corp. | | | 1,643 | | | | 49,339 | | |
PennyMac Financial Services, Inc. (a) | | | 1,870 | | | | 31,136 | | |
PHH Corp. (a) | | | 4,635 | | | | 70,267 | | |
Provident Financial Holdings, Inc. | | | 3,425 | | | | 69,254 | | |
Territorial Bancorp, Inc. | | | 1,673 | | | | 54,941 | | |
TrustCo Bank Corp. | | | 7,213 | | | | 63,114 | | |
Washington Federal, Inc. | | | 2,516 | | | | 86,424 | | |
| | | | 669,952 | | |
TOTAL FINANCIALS | | | 5,638,560 | | |
| | Shares
Held | | Value | |
HEALTH CARE — 1.69%
Health Care Equipment & Supplies — 0.63% | |
Anika Therapeutics, Inc. (a) | | | 319 | | | $ | 15,618 | | |
Exactech, Inc. (a) | | | 1,102 | | | | 30,085 | | |
LivaNova PLC (a) | | | 1,705 | | | | 76,674 | | |
| | | | 122,377 | | |
Health Care Providers & Services — 1.06% | |
Kindred Healthcare, Inc. | | | 9,909 | | | | 77,785 | | |
LifePoint Health, Inc. (a) | | | 1,352 | | | | 76,794 | | |
National HealthCare Corp. | | | 238 | | | | 18,038 | | |
Surgery Partners, Inc. (a) | | | 1,957 | | | | 31,018 | | |
| | | | 203,635 | | |
TOTAL HEALTH CARE | | | 326,012 | | |
INDUSTRIALS — 17.88%
Aerospace & Defense — 0.84% | |
Ducommun, Inc. (a) | | | 619 | | | | 15,822 | | |
LMI Aerospace, Inc. (a) | | | 4,442 | | | | 38,290 | | |
National Presto Industries, Inc. | | | 169 | | | | 17,982 | | |
Vectrus, Inc. (a) | | | 3,798 | | | | 90,582 | | |
| | | | 162,676 | | |
Air Freight & Logistics — 0.16% | |
Forward Air Corp. | | | 279 | | | | 13,219 | | |
Hub Group, Inc. (a) | | | 391 | | | | 17,106 | | |
| | | | 30,325 | | |
Building Products — 0.89% | |
CSW Industrials, Inc. (a) | | | 2,062 | | | | 75,985 | | |
Masonite International Corp. (a) | | | 1,186 | | | | 78,039 | | |
Quanex Building Products Corp. | | | 837 | | | | 16,991 | | |
| | | | 171,015 | | |
Commercial Services & Supplies — 2.06% | |
Atento SA (a) | | | 7,431 | | | | 56,476 | | |
The Brink's Company | | | 1,770 | | | | 73,012 | | |
Deluxe Corp. | | | 753 | | | | 53,922 | | |
Essendant, Inc. | | | 835 | | | | 17,452 | | |
McGrath RentCorp | | | 1,147 | | | | 44,951 | | |
NL Industries, Inc. (a) | | | 5,926 | | | | 48,297 | | |
Performant Financial Corp. (a) | | | 17,485 | | | | 41,090 | | |
Steelcase, Inc. | | | 790 | | | | 14,141 | | |
UniFirst Corp. | | | 257 | | | | 36,918 | | |
West Corp. | | | 479 | | | | 11,860 | | |
| | | | 398,119 | | |
The accompanying notes are an integral part of these financial statements.
28
Schedule of Investments — December 31, 2016
Hotchkis & Wiley Small Cap Diversified Value Fund (Unaudited)
| | Shares
Held | | Value | |
Construction & Engineering — 1.42% | |
KBR, Inc. | | | 4,385 | | | $ | 73,186 | | |
Orion Group Holdings, Inc. (a) | | | 7,453 | | | | 74,157 | | |
Primoris Services Corp. | | | 1,805 | | | | 41,118 | | |
Tutor Perini Corp. (a) | | | 3,045 | | | | 85,260 | | |
| | | | 273,721 | | |
Electrical Equipment — 0.80% | |
Allied Motion Technologies, Inc. | | | 1,594 | | | | 34,096 | | |
Babcock & Wilcox Enterprises, Inc. (a) | | | 697 | | | | 11,563 | | |
Power Solutions International, Inc. (a) | | | 9,506 | | | | 71,295 | | |
Preformed Line Products Company | | | 399 | | | | 23,190 | | |
Thermon Group Holdings, Inc. (a) | | | 801 | | | | 15,291 | | |
| | | | 155,435 | | |
Machinery — 5.92% | |
Chart Industries, Inc. (a) | | | 1,346 | | | | 48,483 | | |
Columbus McKinnon Corp. | | | 934 | | | | 25,255 | | |
The Eastern Company | | | 2,696 | | | | 56,346 | | |
Graham Corp. | | | 721 | | | | 15,970 | | |
The Greenbrier Companies, Inc. | | | 2,067 | | | | 85,884 | | |
Hardinge, Inc. | | | 3,169 | | | | 35,113 | | |
Harsco Corp. (a) | | | 4,079 | | | | 55,474 | | |
Hurco Companies, Inc. | | | 2,228 | | | | 73,747 | | |
Hyster-Yale Materials Handling, Inc. | | | 918 | | | | 58,541 | | |
Kadant, Inc. | | | 330 | | | | 20,196 | | |
LB Foster Company | | | 4,253 | | | | 57,841 | | |
Luxfer Holdings PLC — ADR | | | 2,688 | | | | 29,272 | | |
Meritor, Inc. (a) | | | 5,955 | | | | 73,961 | | |
Miller Industries, Inc. | | | 2,906 | | | | 76,864 | | |
Mueller Industries, Inc. | | | 497 | | | | 19,860 | | |
Navistar International Corp. (a) | | | 2,940 | | | | 92,227 | | |
NN, Inc. | | | 4,173 | | | | 79,496 | | |
Oshkosh Corp. | | | 717 | | | | 46,325 | | |
Supreme Industries, Inc. | | | 4,011 | | | | 62,973 | | |
Twin Disc, Inc. (a) | | | 2,632 | | | | 38,427 | | |
Wabash National Corp. (a) | | | 5,619 | | | | 88,893 | | |
| | | | 1,141,148 | | |
Marine — 0.40% | |
Matson, Inc. | | | 2,172 | | | | 76,867 | | |
| | Shares
Held | | Value | |
Professional Services — 4.03% | |
Barrett Business Services, Inc. | | | 1,559 | | | $ | 99,931 | | |
CBIZ, Inc. (a) | | | 2,847 | | | | 39,004 | | |
CRA International, Inc. | | | 2,454 | | | | 89,816 | | |
FTI Consulting, Inc. (a) | | | 731 | | | | 32,953 | | |
Heidrick & Struggles International, Inc. | | | 3,650 | | | | 88,148 | | |
Hill International, Inc. (a) | | | 13,388 | | | | 58,238 | | |
Kelly Services, Inc. | | | 2,479 | | | | 56,819 | | |
Korn/Ferry International | | | 3,088 | | | | 90,880 | | |
Resources Connection, Inc. | | | 2,975 | | | | 57,269 | | |
RPX Corp. (a) | | | 6,872 | | | | 74,218 | | |
TrueBlue, Inc. (a) | | | 3,663 | | | | 90,293 | | |
| | | | 777,569 | | |
Road & Rail — 0.31% | |
Roadrunner Transportation Systems, Inc. (a) | | | 3,689 | | | | 38,328 | | |
Saia, Inc. (a) | | | 498 | | | | 21,987 | | |
| | | | 60,315 | | |
Trading Companies & Distributors — 1.05% | |
Rush Enterprises, Inc. (a) | | | 3,184 | | | | 101,570 | | |
Titan Machinery, Inc. (a) | | | 4,465 | | | | 65,055 | | |
WESCO International, Inc. (a) | | | 526 | | | | 35,005 | | |
| | | | 201,630 | | |
TOTAL INDUSTRIALS | | | 3,448,820 | | |
INFORMATION TECHNOLOGY — 13.27%
Communications Equipment — 2.41% | |
ClearOne, Inc. | | | 4,470 | | | | 50,958 | | |
Comtech Telecommunications Corp. | | | 6,227 | | | | 73,790 | | |
Digi International, Inc. (a) | | | 4,969 | | | | 68,324 | | |
Extreme Networks, Inc. (a) | | | 16,686 | | | | 83,930 | | |
NETGEAR, Inc. (a) | | | 1,433 | | | | 77,884 | | |
Plantronics, Inc. | | | 951 | | | | 52,077 | | |
TESSCO Technologies, Inc. | | | 4,463 | | | | 58,019 | | |
| | | | 464,982 | | |
The accompanying notes are an integral part of these financial statements.
29
Schedule of Investments — December 31, 2016
Hotchkis & Wiley Small Cap Diversified Value Fund (Unaudited)
| | Shares
Held | | Value | |
Electronic Equipment, Instruments & Components — 5.90% | |
Anixter International, Inc. (a) | | | 968 | | | $ | 78,456 | | |
AVX Corp. | | | 2,134 | | | | 33,354 | | |
Benchmark Electronics, Inc. (a) | | | 2,739 | | | | 83,540 | | |
Control4 Corp. (a) | | | 5,494 | | | | 56,039 | | |
Daktronics, Inc. | | | 4,958 | | | | 53,051 | | |
ePlus, Inc. (a) | | | 711 | | | | 81,907 | | |
Insight Enterprises, Inc. (a) | | | 2,047 | | | | 82,781 | | |
InvenSense, Inc. (a) | | | 7,093 | | | | 90,718 | | |
Methode Electronics, Inc. | | | 999 | | | | 41,309 | | |
MTS Systems Corp. | | | 356 | | | | 20,185 | | |
Park Electrochemical Corp. | | | 2,840 | | | | 52,966 | | |
PC Connection, Inc. | | | 1,902 | | | | 53,427 | | |
PCM, Inc. (a) | | | 2,658 | | | | 59,805 | | |
Plexus Corp. (a) | | | 748 | | | | 40,422 | | |
Sanmina Corp. (a) | | | 1,252 | | | | 45,886 | | |
ScanSource, Inc. (a) | | | 1,350 | | | | 54,473 | | |
Tech Data Corp. (a) | | | 572 | | | | 48,437 | | |
TTM Technologies, Inc. (a) | | | 6,157 | | | | 83,919 | | |
Vishay Intertechnology, Inc. | | | 3,479 | | | | 56,360 | | |
Vishay Precision Group, Inc. (a) | | | 1,091 | | | | 20,620 | | |
| | | | 1,137,655 | | |
Internet Software & Services — 0.47% | |
DHI Group, Inc. (a) | | | 6,233 | | | | 38,956 | | |
RetailMeNot, Inc. (a) | | | 1,500 | | | | 13,950 | | |
Travelzoo, Inc. (a) | | | 3,984 | | | | 37,450 | | |
| | | | 90,356 | | |
IT Services — 0.72% | |
Computer Services, Inc. | | | 347 | | | | 13,776 | | |
Computer Task Group, Inc. | | | 13,012 | | | | 54,781 | | |
Datalink Corp. (a) | | | 6,145 | | | | 69,192 | | |
| | | | 137,749 | | |
Semiconductors & Semiconductor Equipment — 3.04% | |
Ambarella, Inc. (a) | | | 1,074 | | | | 58,136 | | |
Amkor Technology, Inc. (a) | | | 6,956 | | | | 73,386 | | |
Cabot Microelectronics Corp. | | | 717 | | | | 45,293 | | |
Cirrus Logic, Inc. (a) | | | 1,240 | | | | 70,110 | | |
Diodes, Inc. (a) | | | 3,254 | | | | 83,529 | | |
NVE Corp. | | | 518 | | | | 37,001 | | |
PDF Solutions, Inc. (a) | | | 2,103 | | | | 47,423 | | |
Photronics, Inc. (a) | | | 2,868 | | | | 32,408 | | |
Synaptics, Inc. (a) | | | 913 | | | | 48,919 | | |
Ultra Clean Holdings, Inc. (a) | | | 2,747 | | | | 26,646 | | |
Xcerra Corp. (a) | | | 8,277 | | | | 63,236 | | |
| | | | 586,087 | | |
| | Shares
Held | | Value | |
Software — 0.30% | |
Mentor Graphics Corp. | | | 652 | | | $ | 24,052 | | |
VASCO Data Security International, Inc. (a) | | | 2,467 | | | | 33,675 | | |
| | | | 57,727 | | |
Technology Hardware, Storage & Peripherals — 0.43% | |
Super Micro Computer, Inc. (a) | | | 2,979 | | | | 83,561 | | |
TOTAL INFORMATION TECHNOLOGY | | | 2,558,117 | | |
MATERIALS — 4.94%
Chemicals — 1.79% | |
American Vanguard Corp. | | | 3,696 | | | | 70,778 | | |
The Chemours Company | | | 1,574 | | | | 34,770 | | |
CVR Partners LP | | | 6,341 | | | | 38,109 | | |
FutureFuel Corp. | | | 2,496 | | | | 34,694 | | |
Huntsman Corp. | | | 2,187 | | | | 41,728 | | |
Innophos Holdings, Inc. | | | 762 | | | | 39,822 | | |
Innospec, Inc. | | | 664 | | | | 45,484 | | |
Minerals Technologies, Inc. | | | 516 | | | | 39,861 | | |
| | | | 345,246 | | |
Construction Materials — 0.10% | |
United States Lime & Minerals, Inc. | | | 247 | | | | 18,710 | | |
Containers & Packaging — 0.49% | |
Greif, Inc. | | | 440 | | | | 22,576 | | |
UFP Technologies, Inc. (a) | | | 2,839 | | | | 72,253 | | |
| | | | 94,829 | | |
Metals & Mining — 1.23% | |
Ampco-Pittsburgh Corp. | | | 3,075 | | | | 51,506 | | |
Century Aluminum Company (a) | | | 4,935 | | | | 42,244 | | |
Constellium NV (a) | | | 5,515 | | | | 32,539 | | |
Kaiser Aluminum Corp. | | | 489 | | | | 37,990 | | |
Real Industry, Inc. (a) | | | 12,150 | | | | 74,115 | | |
| | | | 238,394 | | |
Paper & Forest Products — 1.33% | |
Boise Cascade Company (a) | | | 3,266 | | | | 73,485 | | |
Domtar Corp. | | | 377 | | | | 14,714 | | |
KapStone Paper and Packaging Corp. | | | 2,883 | | | | 63,570 | | |
PH Glatfelter Company | | | 740 | | | | 17,679 | | |
Schweitzer-Mauduit International, Inc. | | | 1,899 | | | | 86,462 | | |
| | | | 255,910 | | |
TOTAL MATERIALS | | | 953,089 | | |
REAL ESTATE — 0.90%
Equity Real Estate Investment Trusts — 0.90% | |
The GEO Group, Inc. | | | 2,634 | | | | 94,640 | | |
Granite Real Estate Investment Trust | | | 2,332 | | | | 78,052 | | |
TOTAL REAL ESTATE | | | 172,692 | | |
The accompanying notes are an integral part of these financial statements.
30
Schedule of Investments — December 31, 2016
Hotchkis & Wiley Small Cap Diversified Value Fund (Unaudited)
| | Shares
Held | | Value | |
TELECOMMUNICATION SERVICES — 0.86%
Diversified Telecommunication Services — 0.86% | |
ATN International, Inc. | | | 501 | | | $ | 40,145 | | |
IDT Corp. | | | 4,142 | | | | 76,793 | | |
Inteliquent, Inc. | | | 2,091 | | | | 47,926 | | |
TOTAL TELECOMMUNICATION SERVICES | | | 164,864 | | |
UTILITIES — 3.15%
Electric Utilities — 1.50% | |
ALLETE, Inc. | | | 1,132 | | | | 72,663 | | |
El Paso Electric Company | | | 659 | | | | 30,644 | | |
The Empire District Electric Company | | | 870 | | | | 29,658 | | |
MGE Energy, Inc. | | | 287 | | | | 18,741 | | |
Otter Tail Corp. | | | 1,530 | | | | 62,424 | | |
PNM Resources, Inc. | | | 2,192 | | | | 75,186 | | |
| | | | 289,316 | | |
Gas Utilities — 0.79% | |
Northwest Natural Gas Company | | | 271 | | | | 16,206 | | |
ONE Gas, Inc. | | | 246 | | | | 15,734 | | |
South Jersey Industries, Inc. | | | 1,035 | | | | 34,869 | | |
Southwest Gas Corp. | | | 215 | | | | 16,473 | | |
Spire, Inc. | | | 219 | | | | 14,136 | | |
Star Gas Partners LP | | | 5,105 | | | | 54,931 | | |
| | | | 152,349 | | |
Independent Power and Renewable Electricity
Producers — 0.35% | |
Dynegy, Inc. (a) | | | 7,953 | | | | 67,282 | | |
Multi-Utilities — 0.51% | |
Avista Corp. | | | 1,724 | | | | 68,943 | | |
NorthWestern Corp. | | | 232 | | | | 13,194 | | |
Unitil Corp. | | | 348 | | | | 15,778 | | |
| | | | 97,915 | | |
TOTAL UTILITIES | | | 606,862 | | |
Total common stocks
(Cost $15,081,342) | | | | | 18,776,587 | | |
| | Shares
Held | | Value | |
INVESTMENT COMPANIES — 2.45% | |
Business Development Companies — 2.45% | |
Capitala Finance Corp. | | | 2,492 | | | $ | 32,222 | | |
Fifth Street Finance Corp. | | | 10,814 | | | | 58,071 | | |
Fifth Street Senior Floating Rate Corp. | | | 5,734 | | | | 49,943 | | |
Garrison Capital, Inc. | | | 3,870 | | | | 36,185 | | |
KCAP Financial, Inc. | | | 13,521 | | | | 53,814 | | |
Medley Capital Corp. | | | 4,203 | | | | 31,565 | | |
MVC Capital, Inc. | | | 8,016 | | | | 68,776 | | |
Prospect Capital Corp. | | | 4,068 | | | | 33,968 | | |
Stellus Capital Investment Corp. | | | 1,441 | | | | 17,378 | | |
TICC Capital Corp. | | | 6,097 | | | | 40,301 | | |
WhiteHorse Finance, Inc. | | | 4,192 | | | | 51,017 | | |
Total investment companies
(Cost $481,856) | | | 473,240 | | |
Total long-term investments
(Cost $15,563,198) | | | | | 19,249,827 | | |
SHORT-TERM
INVESTMENTS — 2.64% | | Principal
Amount | | | |
Time Deposits — 2.64% | |
The Bank of Tokyo-Mitsubishi UFJ, Ltd.,
0.26%, 01/03/2017* | | $ | 509,524 | | | | 509,524 | | |
Total short-term investments
(Cost $509,524) | | | 509,524 | | |
Total investments — 102.46%
(Cost $16,072,722) | | | | | 19,759,351 | | |
Liabilities in excess of other assets — (2.46)% | | | | | (474,769 | ) | |
Net assets — 100.00% | | $ | 19,284,582 | | |
(a) — Non-income producing security.
ADR — American Depositary Receipt
* — Invested through a cash management account administered by Brown Brothers Harriman & Co.
The accompanying notes are an integral part of these financial statements.
31
Schedule of Investments — December 31, 2016
Hotchkis & Wiley Global Value Fund (Unaudited)

* Based on country of risk.
Largest Equity Holdings | | Percent of
net assets | |
American International Group, Inc. | | | 4.92 | % | |
Danieli & C Officine Meccaniche SpA | | | 4.49 | % | |
Citigroup, Inc. | | | 3.45 | % | |
Zurich Insurance Group AG | | | 3.25 | % | |
Hewlett Packard Enterprise Company | | | 3.12 | % | |
Royal Mail PLC | | | 3.09 | % | |
Corning, Inc. | | | 2.88 | % | |
Telefonaktiebolaget LM Ericsson | | | 2.72 | % | |
BAE Systems PLC | | | 2.70 | % | |
Bank of America Corp. | | | 2.68 | % | |
COMMON
STOCKS — 99.09% | | Shares
Held | | Value | |
CONSUMER DISCRETIONARY — 9.69%
Auto Components — 2.29% | |
Adient PLC (a) | | | 1,229 | | | $ | 72,019 | | |
Magna International, Inc. | | | 2,051 | | | | 89,014 | | |
| | | | 161,033 | | |
Automobiles — 3.69% | |
Bayerische Motoren Werke AG (v) | | | 1,388 | | | | 106,002 | | |
General Motors Company | | | 2,961 | | | | 103,161 | | |
Honda Motor Company Ltd. (v) | | | 1,700 | | | | 49,632 | | |
| | | | 258,795 | | |
Media — 1.95% | |
Discovery Communications, Inc. — Class A (a) | | | 2,487 | | | | 68,169 | | |
Discovery Communications, Inc. — Class C (a) | | | 2,559 | | | | 68,530 | | |
| | | | 136,699 | | |
Specialty Retail — 1.76% | |
Bed Bath & Beyond, Inc. | | | 754 | | | | 30,643 | | |
Office Depot, Inc. | | | 20,633 | | | | 93,261 | | |
| | | | 123,904 | | |
TOTAL CONSUMER DISCRETIONARY | | | 680,431 | | |
CONSUMER STAPLES — 1.08%
Food & Staples Retailing — 1.08% | |
Tesco PLC (a) (v) | | | 29,795 | | | | 75,972 | | |
TOTAL CONSUMER STAPLES | | | 75,972 | | |
ENERGY — 10.52%
Energy Equipment & Services — 2.53% | |
WorleyParsons Ltd. (a) (v) | | | 25,547 | | | | 177,833 | | |
| | Shares
Held | | Value | |
Oil, Gas & Consumable Fuels — 7.99% | |
Cairn Energy PLC (a) (v) | | | 34,017 | | | $ | 98,836 | | |
Cobalt International Energy, Inc. (a) | | | 26,933 | | | | 32,858 | | |
Hess Corp. | | | 645 | | | | 40,177 | | |
Kosmos Energy Ltd. (a) | | | 6,438 | | | | 45,130 | | |
Marathon Oil Corp. | | | 6,287 | | | | 108,828 | | |
Ophir Energy PLC (a) (v) | | | 123,496 | | | | 146,168 | | |
Rockhopper Exploration PLC (a) (v) | | | 172,332 | | | | 48,437 | | |
Whiting Petroleum Corp. (a) | | | 3,403 | | | | 40,904 | | |
| | | | 561,338 | | |
TOTAL ENERGY | | | 739,171 | | |
FINANCIALS — 27.44%
Banks — 14.22% | |
Bank of America Corp. | | | 8,512 | | | | 188,115 | | |
Barclays PLC (v) | | | 47,300 | | | | 129,809 | | |
Citigroup, Inc. | | | 4,075 | | | | 242,177 | | |
Citizens Financial Group, Inc. | | | 992 | | | | 35,345 | | |
JPMorgan Chase & Company | | | 1,030 | | | | 88,879 | | |
Popular, Inc. | | | 1,655 | | | | 72,522 | | |
Societe Generale SA (v) | | | 2,037 | | | | 100,194 | | |
Standard Chartered PLC (a) (v) | | | 8,620 | | | | 70,296 | | |
Wells Fargo & Company | | | 1,294 | | | | 71,312 | | |
| | | | 998,649 | | |
Capital Markets — 1.56% | |
Credit Suisse Group AG (a) (v) | | | 7,641 | | | | 109,198 | | |
Consumer Finance — 1.60% | |
Capital One Financial Corp. | | | 725 | | | | 63,249 | | |
Santander Consumer USA Holdings, Inc. (a) | | | 3,654 | | | | 49,329 | | |
| | | | 112,578 | | |
The accompanying notes are an integral part of these financial statements.
32
Schedule of Investments — December 31, 2016
Hotchkis & Wiley Global Value Fund (Unaudited)
| | Shares
Held | | Value | |
Insurance — 10.06% | |
American International Group, Inc. | | | 5,289 | | | $ | 345,425 | | |
Willis Towers Watson PLC | | | 1,090 | | | | 133,285 | | |
Zurich Insurance Group AG (a) (v) | | | 830 | | | | 228,100 | | |
| | | | 706,810 | | |
TOTAL FINANCIALS | | | 1,927,235 | | |
HEALTH CARE — 6.73%
Health Care Providers & Services — 1.92% | |
Anthem, Inc. | | | 941 | | | | 135,288 | | |
Pharmaceuticals — 4.81% | |
GlaxoSmithKline PLC — ADR | | | 3,061 | | | | 117,879 | | |
KYORIN Holdings, Inc. (v) | | | 3,100 | | | | 66,337 | | |
Sanofi (v) | | | 1,897 | | | | 153,402 | | |
| | | | 337,618 | | |
TOTAL HEALTH CARE | | | 472,906 | | |
INDUSTRIALS — 19.06%
Aerospace & Defense — 4.12% | |
BAE Systems PLC (v) | | | 26,091 | | | | 189,775 | | |
Embraer SA — ADR | | | 5,173 | | | | 99,580 | | |
| | | | 289,355 | | |
Air Freight & Logistics — 3.09% | |
Royal Mail PLC (v) | | | 38,201 | | | | 217,151 | | |
Construction & Engineering — 0.56% | |
Bouygues SA (v) | | | 1,100 | | | | 39,379 | | |
Industrial Conglomerates — 2.04% | |
Koninklijke Philips NV (v) | | | 4,689 | | | | 143,352 | | |
Machinery — 9.25% | |
| CNH Industrial NV | | | 11,996 | | | | 104,245 | | |
Cummins, Inc. | | | 1,219 | | | | 166,601 | | |
Danieli & C Officine Meccaniche SpA (v) | | | 19,838 | | | | 315,696 | | |
Navistar International Corp. (a) | | | 2,014 | | | | 63,179 | | |
| | | | 649,721 | | |
TOTAL INDUSTRIALS | | | 1,338,958 | | |
INFORMATION TECHNOLOGY — 18.54%
Communications Equipment — 5.00% | |
ARRIS International PLC (a) | | | 5,322 | | | | 160,352 | | |
Telefonaktiebolaget LM Ericsson — ADR | | | 32,752 | | | | 190,944 | | |
| | | | 351,296 | | |
Electronic Equipment, Instruments & Components — 4.62% | |
Corning, Inc. | | | 8,329 | | | | 202,145 | | |
Nippon Electric Glass Company Ltd. (v) | | | 10,000 | | | | 53,954 | | |
TE Connectivity Ltd. | | | 992 | | | | 68,726 | | |
| | | | 324,825 | | |
Semiconductors & Semiconductor Equipment — 0.92% | |
Marvell Technology Group Ltd. | | | 4,647 | | | | 64,454 | | |
| | Shares
Held | | Value | |
Software — 4.88% | |
Microsoft Corp. | | | 2,772 | | | $ | 172,252 | | |
Oracle Corp. | | | 4,435 | | | | 170,526 | | |
| | | | 342,778 | | |
Technology Hardware, Storage & Peripherals — 3.12% | |
Hewlett Packard Enterprise Company | | | 9,468 | | | | 219,089 | | |
TOTAL INFORMATION TECHNOLOGY | | | 1,302,442 | | |
TELECOMMUNICATION SERVICES — 2.69%
Wireless Telecommunication Services — 2.69% | |
Orange Belgium SA (a) (v) | | | 1,640 | | | | 34,237 | | |
Vodafone Group PLC — ADR | | | 6,324 | | | | 154,496 | | |
TOTAL TELECOMMUNICATION SERVICES | | | 188,733 | | |
UTILITIES — 3.34%
Independent Power and Renewable Electricity
Producers — 3.34% | |
Calpine Corp. (a) | | | 14,177 | | | | 162,043 | | |
NRG Energy, Inc. | | | 5,938 | | | | 72,800 | | |
TOTAL UTILITIES | | | 234,843 | | |
Total common stocks
(Cost $6,479,233) | | | | | 6,960,691 | | |
Total long-term investments
(Cost $6,479,233) | | | | | 6,960,691 | | |
SHORT-TERM
INVESTMENTS — 1.17% | | Principal
Amount | | | |
Time Deposits — 1.17% | |
Bank of Montreal, 0.26%, 01/03/2017* | | $ | 81,813 | | | | 81,813 | | |
Total short-term investments
(Cost $81,813) | | | 81,813 | | |
Total investments — 100.26%
(Cost $6,561,046) | | | | | 7,042,504 | | |
Liabilities in excess of other assets — (0.26)% | | | | | (17,917 | ) | |
Net assets — 100.00% | | $ | 7,024,587 | | |
(a) — Non-income producing security.
(v) — Security was fair valued as a result of market movements following the close of local trading using a third-party vendor's proprietary fair value pricing model. The total market value of these securities was $2,553,760, which represented 36.35% of net assets. See Security Valuation in Note 1 in Notes to the Financial Statements.
ADR — American Depositary Receipt
* — Invested through a cash management account administered by Brown Brothers Harriman & Co.
The accompanying notes are an integral part of these financial statements.
33
Schedule of Investments — December 31, 2016
Hotchkis & Wiley International Value Fund (Unaudited)

* Based on country of risk.
Largest Equity Holdings | | Percent of
net assets | |
Danieli & C Officine Meccaniche SpA | | | 5.23 | % | |
Zurich Insurance Group AG | | | 5.00 | % | |
Global Indemnity Ltd. | | | 4.45 | % | |
BAE Systems PLC | | | 4.31 | % | |
ARRIS International PLC | | | 4.00 | % | |
Royal Mail PLC | | | 3.57 | % | |
Koninklijke Philips NV | | | 3.38 | % | |
WorleyParsons Ltd. | | | 3.27 | % | |
Barclays PLC | | | 3.12 | % | |
Sanofi | | | 2.98 | % | |
COMMON
STOCKS — 98.44% | | Shares
Held | | Value | |
CONSUMER DISCRETIONARY — 7.67%
Auto Components — 2.86% | |
Adient PLC (a) | | | 429 | | | $ | 25,139 | | |
Magna International, Inc. | | | 778 | | | | 33,765 | | |
| | | | 58,904 | | |
Automobiles — 2.19% | |
Bayerische Motoren Werke AG (v) | | | 399 | | | | 30,472 | | |
Honda Motor Company Ltd. (v) | | | 500 | | | | 14,598 | | |
| | | | 45,070 | | |
Household Durables — 0.77% | |
Metall Zug AG | | | 5 | | | | 15,904 | | |
Media — 0.59% | |
RTL Group SA | | | 166 | | | | 12,089 | | |
Specialty Retail — 1.26% | |
Kingfisher PLC (v) | | | 3,895 | | | | 16,782 | | |
Pendragon PLC (v) | | | 23,455 | | | | 9,009 | | |
| | | | 25,791 | | |
TOTAL CONSUMER DISCRETIONARY | | | 157,758 | | |
CONSUMER STAPLES — 1.63%
Food & Staples Retailing — 1.63% | |
Tesco PLC (a) (v) | | | 13,151 | | | | 33,533 | | |
TOTAL CONSUMER STAPLES | | | 33,533 | | |
ENERGY — 8.27%
Energy Equipment & Services — 3.27% | |
WorleyParsons Ltd. (a) (v) | | | 9,668 | | | | 67,299 | | |
Oil, Gas & Consumable Fuels — 5.00% | |
BowLeven PLC (a) | | | 27,898 | | | | 8,080 | | |
Cairn Energy PLC (a) (v) | | | 9,036 | | | | 26,254 | | |
Kosmos Energy Ltd. (a) | | | 3,274 | | | | 22,951 | | |
Ophir Energy PLC (a) (v) | | | 32,888 | | | | 38,926 | | |
Rockhopper Exploration PLC (a) (v) | | | 23,249 | | | | 6,534 | | |
| | | | 102,745 | | |
TOTAL ENERGY | | | 170,044 | | |
| | Shares
Held | | Value | |
FINANCIALS — 28.44%
Banks — 9.26% | |
Barclays PLC (v) | | | 23,365 | | | $ | 64,122 | | |
BNP Paribas SA (v) | | | 363 | | | | 23,101 | | |
ING Groep NV (v) | | | 1,777 | | | | 25,018 | | |
Societe Generale SA (v) | | | 1,148 | | | | 56,466 | | |
Standard Chartered PLC (a) (v) | | | 2,676 | | | | 21,823 | | |
| | | | 190,530 | | |
Capital Markets — 2.97% | |
Credit Suisse Group AG (a) (v) | | | 4,277 | | | | 61,123 | | |
Insurance — 16.21% | |
Enstar Group Ltd. (a) | | | 301 | | | | 59,508 | | |
Global Indemnity Ltd. (a) | | | 2,394 | | | | 91,475 | | |
RSA Insurance Group PLC (v) | | | 2,767 | | | | 19,954 | | |
Willis Towers Watson PLC | | | 488 | | | | 59,672 | | |
Zurich Insurance Group AG (a) (v) | | | 374 | | | | 102,783 | | |
| | | | 333,392 | | |
TOTAL FINANCIALS | | | 585,045 | | |
HEALTH CARE — 8.78%
Health Care Equipment & Supplies — 2.66% | |
Draegerwerk AG & Company KGaA (v) | | | 123 | | | | 54,613 | | |
Pharmaceuticals — 6.12% | |
GlaxoSmithKline PLC (v) | | | 2,360 | | | | 45,332 | | |
KYORIN Holdings, Inc. (v) | | | 900 | | | | 19,259 | | |
Sanofi (v) | | | 759 | | | | 61,377 | | |
| | | | 125,968 | | |
TOTAL HEALTH CARE | | | 180,581 | | |
INDUSTRIALS — 24.00%
Aerospace & Defense — 5.75% | |
BAE Systems PLC (v) | | | 12,197 | | | | 88,715 | | |
Embraer SA — ADR | | | 1,537 | | | | 29,587 | | |
| | | | 118,302 | | |
The accompanying notes are an integral part of these financial statements.
34
Schedule of Investments — December 31, 2016
Hotchkis & Wiley International Value Fund (Unaudited)
| | Shares
Held | | Value | |
Air Freight & Logistics — 3.57% | |
Royal Mail PLC (v) | | | 12,940 | | | $ | 73,556 | | |
Building Products — 1.29% | |
Masonite International Corp. (a) | | | 403 | | | | 26,517 | | |
Construction & Engineering — 1.61% | |
Bouygues SA (v) | | | 924 | | | | 33,079 | | |
Electrical Equipment — 0.73% | |
Eaton Corp. PLC | | | 223 | | | | 14,961 | | |
Industrial Conglomerates — 3.38% | |
Koninklijke Philips NV (v) | | | 2,277 | | | | 69,613 | | |
Machinery — 7.67% | |
| CNH Industrial NV | | | 3,742 | | | | 32,518 | | |
Danieli & C Officine Meccaniche SpA (v) | | | 6,763 | | | | 107,624 | | |
KSB AG (v) | | | 47 | | | | 17,566 | | |
| | | | 157,708 | | |
TOTAL INDUSTRIALS | | | 493,736 | | |
INFORMATION TECHNOLOGY — 14.33%
Communications Equipment — 8.79% | |
ARRIS International PLC (a) | | | 2,732 | | | | 82,315 | | |
Telefonaktiebolaget LM Ericsson — ADR | | | 6,391 | | | | 37,260 | | |
Telefonaktiebolaget LM Ericsson (v) | | | 10,454 | | | | 61,270 | | |
| | | | 180,845 | | |
Electronic Equipment, Instruments & Components — 4.45% | |
Nippon Electric Glass Company Ltd. (v) | | | 8,000 | | | | 43,164 | | |
TE Connectivity Ltd. | | | 698 | | | | 48,357 | | |
| | | | 91,521 | | |
Semiconductors & Semiconductor Equipment — 1.09% | |
Marvell Technology Group Ltd. | | | 1,616 | | | | 22,414 | | |
TOTAL INFORMATION TECHNOLOGY | | | 294,780 | | |
MATERIALS — 2.08%
Chemicals — 2.08% | |
Tikkurila Oyj (v) | | | 2,165 | | | | 42,769 | | |
TOTAL MATERIALS | | | 42,769 | | |
TELECOMMUNICATION SERVICES — 3.24%
Wireless Telecommunication Services — 3.24% | |
Orange Belgium SA (a) (v) | | | 771 | | | | 16,096 | | |
Vodafone Group PLC (v) | | | 20,545 | | | | 50,559 | | |
TOTAL TELECOMMUNICATION SERVICES | | | 66,655 | | |
Total common stocks
(Cost $1,887,771) | | | | | 2,024,901 | | |
Total long-term investments
(Cost $1,887,771) | | | | | 2,024,901 | | |
SHORT-TERM
INVESTMENTS — 2.94% | | Principal
Amount | | Value | |
Time Deposits — 2.94% | |
Standard Chartered Bank, 0.26%,
01/03/2017* | | $ | 60,422 | | | $ | 60,422 | | |
Total short-term investments
(Cost $60,422) | | | 60,422 | | |
Total investments — 101.38%
(Cost $1,948,193) | | | | | 2,085,323 | | |
Liabilities in excess of other assets — (1.38)% | | | | | (28,368 | ) | |
Net assets — 100.00% | | $ | 2,056,955 | | |
(a) — Non-income producing security.
(v) — Security was fair valued as a result of market movements following the close of local trading using a third-party vendor's proprietary fair value pricing model. The total market value of these securities was $1,402,389, which represented 68.18% of net assets. See Security Valuation in Note 1 in Notes to the Financial Statements.
ADR — American Depositary Receipt
The accompanying notes are an integral part of these financial statements.
35
Schedule of Investments — December 31, 2016
Hotchkis & Wiley Value Opportunities Fund (Unaudited)

Largest Holdings* | | Percent of
net assets | |
Bank of America Corp. | | | 6.83 | % | |
American International Group, Inc. | | | 5.85 | % | |
Telefonaktiebolaget LM Ericsson | | | 4.57 | % | |
Wells Fargo & Company | | | 4.54 | % | |
Microsoft Corp. | | | 4.32 | % | |
Danieli & C Officine Meccaniche SpA | | | 4.27 | % | |
Oracle Corp. | | | 4.18 | % | |
Hewlett Packard Enterprise Company | | | 4.10 | % | |
Citigroup, Inc. | | | 3.89 | % | |
Royal Mail PLC | | | 3.29 | % | |
* Excluding short-term securities.
COMMON
STOCKS — 87.65% | | Shares
Held | | Value | |
CONSUMER DISCRETIONARY — 10.09%
Auto Components — 0.52% | |
Magna International, Inc. | | | 60,400 | | | $ | 2,621,360 | | |
Automobiles — 1.69% | |
General Motors Company | | | 244,500 | | | | 8,518,380 | | |
Household Durables — 0.97% | |
TRI Pointe Group, Inc. (a) | | | 425,200 | | | | 4,881,296 | | |
Media — 4.70% | |
Discovery Communications, Inc. — Class A (a) | | | 506,700 | | | | 13,888,647 | | |
Discovery Communications, Inc. — Class C (a) | | | 363,000 | | | | 9,721,140 | | |
| | | | 23,609,787 | | |
Specialty Retail — 1.78% | |
Office Depot, Inc. (c) | | | 1,974,900 | | | | 8,926,548 | | |
Textiles, Apparel & Luxury Goods — 0.43% | |
JG Boswell Company | | | 3,401 | | | | 2,159,635 | | |
TOTAL CONSUMER DISCRETIONARY | | | 50,717,006 | | |
ENERGY — 8.11%
Energy Equipment & Services — 2.42% | |
Vantage Drilling International (a) (i) | | | 21,433 | | | | 2,218,316 | | |
WorleyParsons Ltd. (a) (c) (v) | | | 1,424,700 | | | | 9,917,362 | | |
| | | 12,135,678 | | |
Oil, Gas & Consumable Fuels — 5.69% | |
Cairn Energy PLC (a) (v) | | | 1,938,500 | | | | 5,632,312 | | |
Cobalt International Energy, Inc. (a) | | | 953,775 | | | | 1,163,606 | | |
Energy XXI Gulf Coast, Inc. (a) (f) (i) | | | 305,566 | | | | 8,417,460 | | |
Etablissements Maurel et Prom (a) (v) | | | 274,200 | | | | 1,215,668 | | |
InterOil Corp. (a) | | | 150,200 | | | | 7,146,516 | | |
Ophir Energy PLC (a) (v) | | | 3,788,500 | | | | 4,483,995 | | |
Rockhopper Exploration PLC (a) (v) | | | 1,919,100 | | | | 539,392 | | |
| | | 28,598,949 | | |
TOTAL ENERGY | | | 40,734,627 | | |
| | Shares
Held | | Value | |
FINANCIALS — 31.21%
Banks — 16.94% | |
Bank of America Corp. (c) | | | 1,551,600 | | | $ | 34,290,360 | | |
Citigroup, Inc. (c) | | | 329,100 | | | | 19,558,413 | | |
JPMorgan Chase & Company (c) | | | 97,900 | | | | 8,447,791 | | |
Wells Fargo & Company | | | 414,200 | | | | 22,826,562 | | |
| | | | 85,123,126 | | |
Capital Markets — 4.05% | |
The Goldman Sachs Group, Inc. | | | 48,200 | | | | 11,541,490 | | |
Motors Liquidation Company GUC Trust (a) | | | 1,048,100 | | | | 8,804,040 | | |
| | | | 20,345,530 | | |
Consumer Finance — 0.72% | |
Capital One Financial Corp. | | | 41,500 | | | | 3,620,460 | | |
Insurance — 9.50% | |
American International Group, Inc. (c) | | | 449,900 | | | | 29,382,969 | | |
Global Indemnity Ltd. (a) | | | 94,800 | | | | 3,622,308 | | |
Zurich Insurance Group AG (a) (v) | | | 53,500 | | | | 14,702,860 | | |
| | | | 47,708,137 | | |
TOTAL FINANCIALS | | | 156,797,253 | | |
HEALTH CARE — 2.22%
Health Care Providers & Services — 2.22% | |
Anthem, Inc. | | | 18,500 | | | | 2,659,745 | | |
Hanger, Inc. (a) | | | 738,000 | | | | 8,486,483 | | |
TOTAL HEALTH CARE | | | 11,146,228 | | |
INDUSTRIALS — 11.09%
Air Freight & Logistics — 3.29% | |
Royal Mail PLC (c) (v) | | | 2,911,200 | | | | 16,548,494 | | |
Building Products — 0.32% | |
Masonite International Corp. (a) | | | 24,000 | | | | 1,579,200 | | |
The accompanying notes are an integral part of these financial statements.
36
Schedule of Investments — December 31, 2016
Hotchkis & Wiley Value Opportunities Fund (Unaudited)
| | Shares
Held | | Value | |
Machinery — 5.94% | |
Danieli & C Officine Meccaniche SpA (c) (v) | | | 1,346,700 | | | $ | 21,430,940 | | |
EnPro Industries, Inc. | | | 94,600 | | | | 6,372,256 | | |
KSB AG (c) (v) | | | 5,473 | | | | 2,045,545 | | |
| | | | 29,848,741 | | |
Professional Services — 0.13% | |
Hudson Global, Inc. (a) | | | 481,700 | | | | 655,112 | | |
Trading Companies & Distributors — 1.41% | |
Rush Enterprises, Inc. (a) (c) | | | 222,700 | | | | 7,104,130 | | |
TOTAL INDUSTRIALS | | | 55,735,677 | | |
INFORMATION TECHNOLOGY — 23.17%
Communications Equipment — 7.60% | |
ARRIS International PLC (a) | | | 505,000 | | | | 15,215,650 | | |
Telefonaktiebolaget LM Ericsson — ADR | | | 3,940,900 | | | | 22,975,447 | | |
| | | | 38,191,097 | | |
Electronic Equipment, Instruments & Components — 2.97% | |
Corning, Inc. (c) | | | 489,500 | | | | 11,880,165 | | |
Nippon Electric Glass Company Ltd. (v) | | | 558,000 | | | | 3,010,667 | | |
| | | | 14,890,832 | | |
Software — 8.50% | |
Microsoft Corp. (c) | | | 348,900 | | | | 21,680,646 | | |
Oracle Corp. (c) | | | 546,200 | | | | 21,001,390 | | |
| | | | 42,682,036 | | |
Technology Hardware, Storage & Peripherals — 4.10% | |
Hewlett Packard Enterprise Company | | | 890,900 | | | | 20,615,426 | | |
TOTAL INFORMATION TECHNOLOGY | | | 116,379,391 | | |
MATERIALS — 0.72%
Metals & Mining — 0.72% | |
GHW Holdco LLC (Acquired 10/28/2016,
Cost $45,000) (a) (f) (i) (m) | | | 2 | | | | 45,000 | | |
Horsehead Holding LLC (a) (f) (i) | | | 4,688 | | | | 1,195,118 | | |
Real Industry, Inc. (a) | | | 389,782 | | | | 2,377,670 | | |
TOTAL MATERIALS | | | 3,617,788 | | |
REAL ESTATE — 1.04%
Equity Real Estate Investment Trusts — 1.04% | |
The GEO Group, Inc. | | | 145,100 | | | | 5,213,443 | | |
TOTAL REAL ESTATE | | | 5,213,443 | | |
Total common stocks
(Cost $409,209,739) | | | | | 440,341,413 | | |
INVESTMENT COMPANIES — 0.21% | |
Closed-End Funds — 0.21% | |
Boulder Growth & Income Fund, Inc. | | | 118,292 | | | | 1,057,531 | | |
Total investment companies
(Cost $649,324) | | | | | 1,057,531 | | |
PREFERRED
STOCKS — 0.40% | | Shares
Held | | Value | |
FINANCIALS — 0.40%
Thrifts & Mortgage Finance — 0.40% | |
Federal Home Loan Mortgage Corp. — Series K (a) | | | 33,900 | | | $ | 403,749 | | |
Federal Home Loan Mortgage Corp. — Series N (a) | | | 118,600 | | | | 1,383,469 | | |
Federal Home Loan Mortgage Corp. — Series S (a) | | | 18,700 | | | | 215,237 | | |
TOTAL FINANCIALS | | | 2,002,455 | | |
Total preferred stocks
(Cost $274,262) | | | | | 2,002,455 | | |
CORPORATE
BONDS — 7.71% | | Principal
Amount | | | |
CONSUMER DISCRETIONARY — 0.50%
Media — 0.50% | |
MDC Partners, Inc.
6.500%, 05/01/2024 (r) | | $ | 2,750,000 | | | | 2,488,750 | | |
TOTAL CONSUMER DISCRETIONARY | | | 2,488,750 | | |
ENERGY — 4.15%
Energy Equipment & Services — 0.00% | |
Vantage Drilling International — Escrow
7.500%, 11/01/2019 (a) (f) (i) | | | 12,000,000 | | | | 0 | | |
Oil, Gas & Consumable Fuels — 4.15% | |
Cobalt International Energy, Inc.
10.750%, 12/01/2021 (r) | | | 15,896,000 | | | | 15,411,172 | | |
7.750%, 12/01/2023 (r) | | | 9,708,000 | | | | 5,436,480 | | |
| | | | 20,847,652 | | |
TOTAL ENERGY | | | 20,847,652 | | |
MATERIALS — 3.06%
Chemicals — 2.84% | |
Iracore International Holdings, Inc.
9.500%, 06/01/2018
(Acquired 11/12/2014 — 06/19/2015,
Cost $21,250,780) (d) (i) (r) | | | 27,207,000 | | | | 14,283,675 | | |
Metals & Mining — 0.22% | |
New Day Aluminum LLC
10.000%, 10/28/2020
(Acquired 10/28/2016 — 12/31/2016,
Cost $343,523) (f) (i) (m) (p) | | | 1,131,366 | | | | 321,308 | | |
10.000%, 10/28/2020
(Acquired 10/28/2016 — 12/31/2016,
Cost $827,186) (f) (i) (m) (p) | | | 2,724,275 | | | | 773,694 | | |
Noranda Aluminum Acquisition Corp.
11.000%, 06/01/2019 (d) (f) (i) | | | 41,000 | | | | 0 | | |
| | | | 1,095,002 | | |
TOTAL MATERIALS | | | 15,378,677 | | |
Total corporate bonds
(Cost $44,496,131) | | | | | 38,715,079 | | |
TERM LOANS — 1.12% | |
ENERGY — 0.73%
Oil, Gas & Consumable Fuels — 0.73% | |
Lonestar Resources America, Inc.
12.000%, 12/31/2021 (f) (i) (p) | | | 4,000,000 | | | | 3,660,800 | | |
TOTAL ENERGY | | | 3,660,800 | | |
The accompanying notes are an integral part of these financial statements.
37
Schedule of Investments — December 31, 2016
Hotchkis & Wiley Value Opportunities Fund (Unaudited)
| | Principal
Amount | | Value | |
MATERIALS — 0.39%
Metals & Mining — 0.39% | |
New Day Aluminum LLC
8.000%, 10/28/2017
(Acquired 10/28/2016,
Cost $768,000) (f) (i) (m) | | $ | 768,000 | | | $ | 768,000 | | |
8.000%, 10/28/2017
(Acquired 10/28/2016,
Cost $1,200,000) (f) (i) (m) | | | 1,200,000 | | | | 1,200,000 | | |
TOTAL MATERIALS | | | 1,968,000 | | |
Total term loans
(Cost $5,642,662) | | | | | 5,628,800 | | |
PURCHASED PUT
OPTIONS — 0.09% | | Contracts
(100 shares
per contract) | | | |
ENERGY — 0.01%
Energy Equipment & Services — 0.01% | |
Patterson-UTI Energy, Inc. (a)
Expiration: January 2017,
Exercise Price: $24.00 | | | 2,000 | | | | 40,000 | | |
TOTAL ENERGY | | | 40,000 | | |
FINANCIALS — 0.08%
Capital Markets — 0.08% | |
WisdomTree Investments, Inc. (a) | |
Expiration: January 2017,
Exercise Price: $12.75 | | | 2,500 | | | | 406,250 | | |
TOTAL FINANCIALS | | | 406,250 | | |
Total purchased put options
(Cost $1,872,942) | | | 446,250 | | |
WARRANTS — 0.73% | | Shares
Held | | | |
CONSUMER DISCRETIONARY — 0.11%
Automobiles — 0.11% | |
General Motors Company (a)
Expiration: July 2019,
Exercise Price: $18.33 | | | 33,866 | | | | 580,125 | | |
TOTAL CONSUMER DISCRETIONARY | | | 580,125 | | |
ENERGY — 0.07%
Oil, Gas & Consumable Fuels — 0.07% | |
Comstock Resources, Inc. (a) (f) (i)
Expiration: September 2018,
Exercise Price: $0.01 | | | 5,913 | | | | 58,184 | | |
Lonestar Resources America, Inc. (a) (f) (i)
Expiration: December 2021,
Exercise Price: $5.00 | | | 80,000 | | | | 283,200 | | |
TOTAL ENERGY | | | 341,384 | | |
FINANCIALS — 0.55%
Insurance — 0.55% | |
American International Group, Inc. (a)
Expiration: January 2021,
Exercise Price: $44.43 | | | 117,400 | | | | 2,754,204 | | |
TOTAL FINANCIALS | | | 2,754,204 | | |
| | Shares
Held | | Value | |
Total warrants
(Cost $1,782,621) | | | | $ | 3,675,713 | | |
Total long-term investments
(Cost $463,927,681) | | | | | 491,867,241 | | |
SHORT TERM
INVESTMENTS — 0.00% | | Principal
Amount | | | |
Time Deposits — 0.00% | |
Brown Brothers Harriman & Co., 0.51%,
01/03/2017* | | AUD | 16 | | | | 12 | | |
Brown Brothers Harriman & Co., 0.05%,
01/03/2017* | | GBP | 27 | | | | 33 | | |
Total short-term investments
(Cost $47) | | | 45 | | |
Total investments — 97.91%
(Cost $463,927,728) | | | | | 491,867,286 | | |
Other assets in excess of liabilities — 2.09% | | | | | 10,496,422 | | |
Net assets — 100.00% | | $ | 502,363,708 | | |
(a) — Non-income producing security.
(c) — All or a portion of this security is segregated as collateral for futures contracts and unfunded loan commitments.
(d) — Issuer is currently in default on its regularly scheduled interest payments.
(f) — Security was fair valued under guidelines established by and under the general supervision and responsibility of the Trust's Board of Trustees. The total market value of these securities was $16,722,764, which represented 3.33% of net assets. See Security Valuation in Note 1 in Notes to the Financial Statements.
(i) — Illiquid security.
(m) — Restricted security. Purchased in a private placement transaction; resale to the public may require registration. The total market value of these securities was $3,108,002, which represented 0.62% of net assets.
(p) — Payment in-kind security.
(r) — Restricted security under Rule 144A of the Securities Act of 1933. Purchased in a private placement transaction; resale to the public may require registration or be limited to qualified institutional buyers. The total market value of these securities was $37,620,077, which represented 7.49% of net assets.
(v) — Security was fair valued as a result of market movements following the close of local trading using a third-party vendor's proprietary fair value pricing model. The total market value of these securities was $79,527,235, which represented 15.83% of net assets. See Security Valuation in Note 1 in Notes to the Financial Statements.
ADR — American Depositary Receipt
AUD — Australian Dollars
GBP — British Pounds
* — Invested through a cash management account administered by Brown Brothers Harriman & Co.
The accompanying notes are an integral part of these financial statements.
38
Schedule of Futures Contracts — December 31, 2016
Hotchkis & Wiley Value Opportunities Fund (Unaudited)
Description | | Number of
Contracts
Purchased (Sold) | | Expiration | | Notional
Amount
at Value | | Unrealized
Appreciation
(Depreciation) | |
Australian Dollar Currency Futures | | | (130 | ) | | March 2017 | | $ | (9,362,600 | ) | | $ | 372,566 | | |
Euro Fx Currency Futures | | | (40 | ) | | March 2017 | | | (5,287,000 | ) | | | 61,585 | | |
| | | | | | | $ | (14,649,600 | ) | | $ | 434,151 | | |
The accompanying notes are an integral part of these financial statements.
39
Schedule of Investments — December 31, 2016
Hotchkis & Wiley Capital Income Fund (Unaudited)
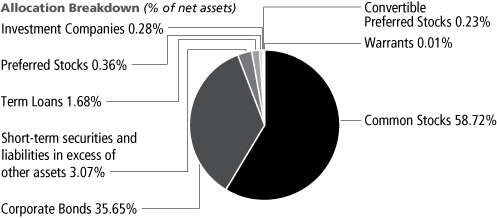
Largest Issuers | | Percent of
net assets | |
American International Group, Inc. | | | 2.49 | % | |
Danieli & C Officine Meccaniche SpA | | | 2.42 | % | |
Popular, Inc. | | | 2.23 | % | |
Citigroup, Inc. | | | 2.06 | % | |
BAE Systems PLC | | | 2.05 | % | |
Royal Mail PLC | | | 1.82 | % | |
Bank of America Corp. | | | 1.66 | % | |
Telefonaktiebolaget LM Ericsson | | | 1.66 | % | |
Vodafone Group PLC | | | 1.63 | % | |
Oracle Corp. | | | 1.63 | % | |
COMMON
STOCKS — 58.72% | | Shares
Held | | Value | |
CONSUMER DISCRETIONARY — 4.74%
Auto Components — 0.77% | |
Adient PLC (a) | | | 1,939 | | | $ | 113,625 | | |
Magna International, Inc. | | | 3,772 | | | | 163,705 | | |
| | | | 277,330 | | |
Automobiles — 1.13% | |
General Motors Company | | | 7,396 | | | | 257,676 | | |
General Motors Company — Escrow (a) (f) (i) | | | 4,600 | | | | 0 | | |
Honda Motor Company Ltd. — ADR | | | 5,061 | | | | 147,731 | | |
| | | | 405,407 | | |
Media — 1.10% | |
Discovery Communications, Inc. — Class A (a) | | | 3,635 | | | | 99,635 | | |
Discovery Communications, Inc. — Class C (a) | | | 10,984 | | | | 294,152 | | |
| | | | 393,787 | | |
Specialty Retail — 1.36% | |
Bed Bath & Beyond, Inc. | | | 2,447 | | | | 99,446 | | |
Office Depot, Inc. | | | 86,578 | | | | 391,333 | | |
| | | | 490,779 | | |
Textiles, Apparel & Luxury Goods — 0.38% | |
Quiksilver, Inc. (a) (f) (i) | | | 6,960 | | | | 137,669 | | |
TOTAL CONSUMER DISCRETIONARY | | | 1,704,972 | | |
CONSUMER STAPLES — 0.28%
Food & Staples Retailing — 0.28% | |
Tesco PLC — ADR (a) | | | 13,275 | | | | 100,757 | | |
TOTAL CONSUMER STAPLES | | | 100,757 | | |
ENERGY — 9.41%
Energy Equipment & Services — 1.58% | |
Vantage Drilling International (a) (i) | | | 363 | | | | 37,571 | | |
WorleyParsons Ltd. (a) (v) | | | 76,278 | | | | 530,972 | | |
| | | 568,543 | | |
| | Shares
Held | | Value | |
Oil, Gas & Consumable Fuels — 7.83% | |
BowLeven PLC (a) | | | 1,246,621 | | | $ | 361,041 | | |
Cairn Energy PLC — ADR (a) | | | 38,907 | | | | 224,882 | | |
Cobalt International Energy, Inc. (a) | | | 177,099 | | | | 216,061 | | |
Energy XXI Gulf Coast, Inc. (a) (f) (i) | | | 17,027 | | | | 469,050 | | |
Hess Corp. | | | 861 | | | | 53,632 | | |
InterOil Corp. (a) | | | 7,898 | | | | 375,787 | | |
Kosmos Energy Ltd. (a) | | | 10,572 | | | | 74,110 | | |
Marathon Oil Corp. | | | 6,368 | | | | 110,230 | | |
Murphy Oil Corp. | | | 3,306 | | | | 102,916 | | |
Ophir Energy PLC — ADR (a) | | | 210,834 | | | | 502,797 | | |
PetroQuest Energy, Inc. (a) | | | 1,984 | | | | 6,567 | | |
Prairie Provident Resources, Inc. (a) | | | 9,745 | | | | 5,301 | | |
Warren Resources, Inc. (a) (f) (i) | | | 1,559 | | | | 2,156 | | |
Whiting Petroleum Corp. (a) | | | 26,149 | | | | 314,311 | | |
| | | 2,818,841 | | |
TOTAL ENERGY | | | 3,387,384 | | |
FINANCIALS — 15.11%
Banks — 6.88% | |
Bank of America Corp. | | | 27,074 | | | | 598,335 | | |
Barclays PLC — ADR | | | 13,706 | | | | 150,766 | | |
Citigroup, Inc. | | | 12,457 | | | | 740,319 | | |
Citizens Financial Group, Inc. | | | 6,122 | | | | 218,127 | | |
Popular, Inc. | | | 15,230 | | | | 667,379 | | |
Societe Generale SA — ADR | | | 10,642 | | | | 104,504 | | |
| | | | 2,479,430 | | |
Capital Markets — 2.18% | |
Credit Suisse Group AG — ADR (a) | | | 10,734 | | | | 153,604 | | |
Fifth Street Asset Management, Inc. | | | 65,744 | | | | 440,484 | | |
Motors Liquidation Company GUC Trust (a) | | | 22,647 | | | | 190,235 | | |
| | | | 784,323 | | |
The accompanying notes are an integral part of these financial statements.
40
Schedule of Investments — December 31, 2016
Hotchkis & Wiley Capital Income Fund (Unaudited)
| | Shares
Held | | Value | |
Consumer Finance — 0.74% | |
Capital One Financial Corp. | | | 1,848 | | | $ | 161,219 | | |
Santander Consumer USA Holdings, Inc. (a) | | | 7,733 | | | | 104,396 | | |
| | | | 265,615 | | |
Insurance — 5.31% | |
American International Group, Inc. (c) | | | 13,726 | | | | 896,445 | | |
Global Indemnity Ltd. (a) | | | 5,858 | | | | 223,834 | | |
Willis Towers Watson PLC | | | 2,014 | | | | 246,272 | | |
Zurich Insurance Group AG — ADR | | | 19,812 | | | | 546,217 | | |
| | | | 1,912,768 | | |
TOTAL FINANCIALS | | | 5,442,136 | | |
HEALTH CARE — 3.29%
Health Care Providers & Services — 0.95% | |
Anthem, Inc. | | | 2,387 | | | | 343,179 | | |
Pharmaceuticals — 2.34% | |
GlaxoSmithKline PLC — ADR | | | 8,963 | | | | 345,165 | | |
KYORIN Holdings, Inc. (v) | | | 6,900 | | | | 147,655 | | |
Sanofi — ADR | | | 8,662 | | | | 350,291 | | |
| | | | 843,111 | | |
TOTAL HEALTH CARE | | | 1,186,290 | | |
INDUSTRIALS — 9.81%
Aerospace & Defense — 2.33% | |
BAE Systems PLC — ADR | | | 25,483 | | | | 739,772 | | |
Embraer SA — ADR | | | 5,133 | | | | 98,810 | | |
| | | | 838,582 | | |
Air Freight & Logistics — 1.82% | |
Royal Mail PLC — ADR | | | 57,383 | | | | 654,740 | | |
Industrial Conglomerates — 1.24% | |
Koninklijke Philips NV | | | 14,607 | | | | 446,536 | | |
Machinery — 4.09% | |
| CNH Industrial NV | | | 11,934 | | | | 103,706 | | |
Cummins, Inc. | | | 3,635 | | | | 496,795 | | |
Danieli & C Officine Meccaniche SpA — ADR | | | 54,538 | | | | 871,518 | | |
| | | | 1,472,019 | | |
Trading Companies & Distributors — 0.33% | |
Rush Enterprises, Inc. (a) | | | 3,792 | | | | 120,965 | | |
TOTAL INDUSTRIALS | | | 3,532,842 | | |
INFORMATION TECHNOLOGY — 10.44%
Communications Equipment — 3.24% | |
ARRIS International PLC (a) | | | 18,880 | | | | 568,855 | | |
Telefonaktiebolaget LM Ericsson — ADR | | | 102,586 | | | | 598,077 | | |
| | | | 1,166,932 | | |
| | Shares
Held | | Value | |
Electronic Equipment, Instruments & Components — 2.51% | |
Corning, Inc. (c) | | | 22,174 | | | $ | 538,163 | | |
Nippon Electric Glass Company Ltd. (v) | | | 30,000 | | | | 161,864 | | |
TE Connectivity Ltd. | | | 2,930 | | | | 202,990 | | |
| | | | 903,017 | | |
Semiconductors & Semiconductor Equipment — 0.29% | |
Marvell Technology Group Ltd. | | | 7,582 | | | | 105,162 | | |
Software — 3.01% | |
Microsoft Corp. (c) | | | 8,008 | | | | 497,617 | | |
Oracle Corp. | | | 15,229 | | | | 585,555 | | |
| | | | 1,083,172 | | |
Technology Hardware, Storage & Peripherals — 1.39% | |
Hewlett Packard Enterprise Company | | | 21,672 | | | | 501,490 | | |
TOTAL INFORMATION TECHNOLOGY | | | 3,759,773 | | |
MATERIALS — 0.61%
Metals & Mining — 0.61% | |
Horsehead Holding LLC (a) (f) (i) | | | 861 | | | | 219,496 | | |
TOTAL MATERIALS | | | 219,496 | | |
REAL ESTATE — 1.65%
Equity Real Estate Investment Trusts — 1.65% | |
The GEO Group, Inc. (c) | | | 10,889 | | | | 391,241 | | |
Granite Real Estate Investment Trust | | | 6,046 | | | | 202,360 | | |
TOTAL REAL ESTATE | | | 593,601 | | |
TELECOMMUNICATION SERVICES — 1.63%
Wireless Telecommunication Services — 1.63% | |
Vodafone Group PLC — ADR (c) | | | 24,084 | | | | 588,372 | | |
TOTAL TELECOMMUNICATION SERVICES | | | 588,372 | | |
UTILITIES — 1.75%
Independent Power and Renewable Electricity
Producers — 1.75% | |
Calpine Corp. (a) | | | 34,033 | | | | 388,997 | | |
NRG Energy, Inc. | | | 19,711 | | | | 241,657 | | |
TOTAL UTILITIES | | | 630,654 | | |
Total common stocks
(Cost $19,050,886) | | | | | 21,146,277 | | |
INVESTMENT COMPANIES — 0.28% | |
Business Development Companies — 0.28% | |
Fifth Street Senior Floating Rate Corp. | | | 11,712 | | | | 102,012 | | |
Total investment companies
(Cost $106,658) | | | | | 102,012 | | |
The accompanying notes are an integral part of these financial statements.
41
Schedule of Investments — December 31, 2016
Hotchkis & Wiley Capital Income Fund (Unaudited)
PREFERRED
STOCKS — 0.36% | | Shares
Held | | Value | |
FINANCIALS — 0.36%
Banks — 0.36% | |
Royal Bank of Scotland Group PLC, 6.600% | | | 5,113 | | | $ | 128,081 | | |
TOTAL FINANCIALS | | | 128,081 | | |
Total preferred stocks
(Cost $129,115) | | | | | 128,081 | | |
CONVERTIBLE PREFERRED STOCKS — 0.23% | |
ENERGY — 0.23%
Energy Equipment & Services — 0.23% | |
McDermott International, Inc., 6.250% (i) | | | 3,468 | | | | 83,613 | | |
TOTAL ENERGY | | | 83,613 | | |
Total convertible preferred stocks
(Cost $88,618) | | | | | 83,613 | | |
CORPORATE
BONDS — 35.65% | | Principal
Amount | | | |
CONSUMER DISCRETIONARY — 6.64%
Auto Components — 0.17% | |
Adient Global Holdings Ltd.
4.875%, 08/15/2026 (r) | | $ | 63,000 | | | | 61,898 | | |
Diversified Consumer Services — 0.29% | |
Sotheby's
5.250%, 10/01/2022 (r) | | | 106,000 | | | | 104,675 | | |
Hotels, Restaurants & Leisure — 1.40% | |
KFC Holding Company / Pizza Hut
Holdings LLC / Taco Bell of America LLC
5.250%, 06/01/2026 (r) | | | 64,000 | | | | 65,120 | | |
MGM Resorts International
7.750%, 03/15/2022 (c) | | | 56,000 | | | | 64,540 | | |
National CineMedia LLC
5.750%, 08/15/2026 | | | 50,000 | | | | 51,000 | | |
Rivers Pittsburgh Borrower LP / Rivers
Pittsburgh Finance Corp.
6.125%, 08/15/2021 (r) | | | 49,000 | | | | 50,225 | | |
Ruby Tuesday, Inc.
7.625%, 05/15/2020 (i) | | | 220,000 | | | | 210,099 | | |
Wynn Macau Ltd.
5.250%, 10/15/2021 (r) | | | 61,000 | | | | 61,763 | | |
| | | | 502,747 | | |
Household Durables — 0.36% | |
Weekley Homes LLC / Weekley Finance Corp.
6.000%, 02/01/2023 | | | 145,000 | | | | 129,775 | | |
Leisure Products — 0.42% | |
Apex Tool Group LLC
7.000%, 02/01/2021 (r) | | | 125,000 | | | | 112,499 | | |
MCE Finance Ltd.
5.000%, 02/15/2021 (r) | | | 39,000 | | | | 38,947 | | |
| | | | 151,446 | | |
| | Principal
Amount | | Value | |
Media — 3.35% | |
Altice Luxembourg SA
7.625%, 02/15/2025 (r) | | $ | 119,000 | | | $ | 125,396 | | |
Cable One, Inc.
5.750%, 06/15/2022 (r) | | | 50,000 | | | | 51,625 | | |
CCO Holdings LLC / CCO Holdings Capital Corp.
5.375%, 05/01/2025 (r) | | | 60,000 | | | | 61,950 | | |
5.750%, 02/15/2026 (r) | | | 110,000 | | | | 114,125 | | |
Harland Clarke Holdings Corp.
9.250%, 03/01/2021 (r) | | | 279,000 | | | | 246,565 | | |
LSC Communications, Inc.
8.750%, 10/15/2023 (r) | | | 35,000 | | | | 35,263 | | |
MDC Partners, Inc.
6.500%, 05/01/2024 (r) | | | 122,000 | | | | 110,410 | | |
SFR Group SA
6.000%, 05/15/2022 (r) | | | 113,000 | | | | 116,390 | | |
Townsquare Media, Inc.
6.500%, 04/01/2023 (r) | | | 134,000 | | | | 128,473 | | |
Virgin Media Finance PLC
6.375%, 04/15/2023 (r) | | | 84,000 | | | | 87,675 | | |
VTR Finance BV
6.875%, 01/15/2024 (r) | | | 124,000 | | | | 128,340 | | |
| | | | 1,206,212 | | |
Multiline Retail — 0.27% | |
JC Penney Corp., Inc.
5.875%, 07/01/2023 (r) | | | 94,000 | | | | 97,173 | | |
Specialty Retail — 0.38% | |
Chinos Intermediate Holdings A, Inc.
7.750%, 05/01/2019 (p) (r) | | | 83,709 | | | | 34,739 | | |
PetSmart, Inc.
7.125%, 03/15/2023 (r) | | | 99,000 | | | | 101,227 | | |
| | | | 135,966 | | |
TOTAL CONSUMER DISCRETIONARY | | | 2,389,892 | | |
CONSUMER STAPLES — 1.56%
Food Products — 0.57% | |
Pinnacle Operating Corp.
9.000%, 11/15/2020
(Acquired 09/13/2013 — 12/02/2016,
Cost $166,072) (i) (r) | | | 182,000 | | | | 80,990 | | |
TreeHouse Foods, Inc.
6.000%, 02/15/2024 (r) | | | 70,000 | | | | 73,675 | | |
Wells Enterprises, Inc.
6.750%, 02/01/2020 (r) | | | 50,000 | | | | 51,813 | | |
| | | | 206,478 | | |
The accompanying notes are an integral part of these financial statements.
42
Schedule of Investments — December 31, 2016
Hotchkis & Wiley Capital Income Fund (Unaudited)
| | Principal
Amount | | Value | |
Household Products — 0.99% | |
American Greetings Corp.
7.375%, 12/01/2021 (c) | | $ | 120,000 | | | $ | 122,850 | | |
Central Garden & Pet Company
6.125%, 11/15/2023 | | | 57,000 | | | | 60,420 | | |
FGI Operating Company LLC / FGI Finance, Inc.
7.875%, 05/01/2020 (i) | | | 200,000 | | | | 171,000 | | |
| | | | 354,270 | | |
TOTAL CONSUMER STAPLES | | | 560,748 | | |
ENERGY — 9.04%
Energy Equipment & Services — 2.94% | |
Atwood Oceanics, Inc.
6.500%, 02/01/2020 | | | 67,000 | | | | 61,640 | | |
Bellatrix Exploration Ltd.
8.500%, 05/15/2020
(Acquired 05/15/2015 — 03/03/2016,
Cost $96,787) (i) (r) | | | 105,000 | | | | 103,688 | | |
Callon Petroleum Company
6.125%, 10/01/2024 (r) | | | 50,000 | | | | 51,750 | | |
Globe Luxembourg SCA
9.625%, 05/01/2018 (r) | | | 169,000 | | | | 167,733 | | |
McDermott International, Inc.
8.000%, 05/01/2021 (r) | | | 219,000 | | | | 222,285 | | |
Noble Holding International Ltd.
7.750%, 01/15/2024 | | | 20,000 | | | | 18,862 | | |
PHI, Inc.
5.250%, 03/15/2019 | | | 129,000 | | | | 121,905 | | |
Shelf Drilling Holdings Ltd.
8.625%, 11/01/2018 (r) | | | 117,000 | | | | 98,865 | | |
Transocean, Inc.
9.000%, 07/15/2023 (r) | | | 79,000 | | | | 81,370 | | |
Unit Corp.
6.625%, 05/15/2021 | | | 135,000 | | | | 131,625 | | |
Vantage Drilling International — Escrow
7.500%, 11/01/2019 (a) (f) (i) | | | 2,000 | | | | 0 | | |
7.125%, 04/01/2023 (a) (f) (i) | | | 208,000 | | | | 0 | | |
| | | | 1,059,723 | | |
Oil, Gas & Consumable Fuels — 6.10% | |
American Midstream Partners LP /
American Midstream Finance Corp.
8.500%, 12/15/2021 (r) | | | 75,000 | | | | 74,625 | | |
Calumet Specialty Products Partners LP /
Calumet Finance Corp.
6.500%, 04/15/2021 | | | 127,000 | | | | 108,268 | | |
Cheniere Corpus Christi Holdings LLC
5.875%, 03/31/2025 (r) | | | 75,000 | | | | 76,805 | | |
Cobalt International Energy, Inc.
10.750%, 12/01/2021 (r) | | | 249,000 | | | | 241,405 | | |
7.750%, 12/01/2023 (r) | | | 152,000 | | | | 85,120 | | |
Comstock Resources, Inc.
10.000%, 03/15/2020 (p) | | | 132,000 | | | | 135,959 | | |
| | Principal
Amount | | Value | |
Holly Energy Partners LP / Holly
Energy Finance Corp.
6.000%, 08/01/2024 (r) | | $ | 98,000 | | | $ | 102,655 | | |
Kosmos Energy Ltd.
7.875%, 08/01/2021 (r) | | | 315,000 | | | | 314,999 | | |
Lonestar Resources America, Inc.
8.750%, 04/15/2019 (Acquired
09/01/2015 — 09/02/2015,
Cost $473,186) (i) (r) | | | 600,000 | | | | 551,999 | | |
Murphy Oil Corp.
6.875%, 08/15/2024 | | | 65,000 | | | | 69,388 | | |
Niska Gas Storage Ltd. / Niska
Gas Storage Canada Finance Corp.
6.500%, 04/01/2019 | | | 105,000 | | | | 106,050 | | |
PBF Logistics LP / PBF Logistics Finance Corp.
6.875%, 05/15/2023 | | | 75,000 | | | | 74,063 | | |
PetroQuest Energy, Inc.
10.000%, 02/15/2021
(Acquired 06/28/2013 — 12/06/2016,
Cost $103,896) (i) (p) (r) | | | 109,000 | | | | 77,390 | | |
Range Resources Corp.
5.000%, 08/15/2022 (r) | | | 45,000 | | | | 44,944 | | |
Sanchez Energy Corp.
6.125%, 01/15/2023 | | | 85,000 | | | | 81,175 | | |
Whiting Petroleum Corp.
5.750%, 03/15/2021 | | | 52,000 | | | | 52,044 | | |
| | | | 2,196,889 | | |
TOTAL ENERGY | | | 3,256,612 | | |
FINANCIALS — 1.67%
Banks — 0.99% | |
Lincoln Finance Ltd.
7.375%, 04/15/2021 (r) | | | 69,000 | | | | 73,744 | | |
Popular, Inc.
7.000%, 07/01/2019 | | | 132,000 | | | | 136,785 | | |
Societe Generale SA
7.375%, 12/29/2049 (b) (r) | | | 145,000 | | | | 145,119 | | |
| | | | 355,648 | | |
Consumer Finance — 0.68% | |
Ally Financial, Inc.
5.750%, 11/20/2025 | | | 135,000 | | | | 135,168 | | |
Credit Acceptance Corp.
6.125%, 02/15/2021 | | | 70,000 | | | | 71,050 | | |
7.375%, 03/15/2023 | | | 37,000 | | | | 38,203 | | |
| | | | 244,421 | | |
TOTAL FINANCIALS | | | 600,069 | | |
HEALTH CARE — 3.24%
Health Care Equipment & Supplies — 0.50% | |
Halyard Health, Inc.
6.250%, 10/15/2022 (c) | | | 104,000 | | | | 107,640 | | |
Hill-Rom Holdings, Inc.
5.750%, 09/01/2023 (r) | | | 71,000 | | | | 73,663 | | |
| | | | 181,303 | | |
The accompanying notes are an integral part of these financial statements.
43
Schedule of Investments — December 31, 2016
Hotchkis & Wiley Capital Income Fund (Unaudited)
| | Principal
Amount | | Value | |
Health Care Providers & Services — 1.46% | |
Centene Corp.
6.125%, 02/15/2024 | | $ | 65,000 | | | $ | 68,656 | | |
CHS / Community Health Systems, Inc.
5.125%, 08/01/2021 | | | 32,000 | | | | 29,760 | | |
6.875%, 02/01/2022 | | | 111,000 | | | | 77,700 | | |
DJO Finco, Inc. / DJO Finance LLC /
DJO Finance Corp.
8.125%, 06/15/2021 (r) | | | 149,000 | | | | 130,002 | | |
Tenet Healthcare Corp.
7.500%, 01/01/2022 (r) | | | 35,000 | | | | 36,575 | | |
6.750%, 06/15/2023 | | | 123,000 | | | | 108,547 | | |
Universal Hospital Services, Inc.
7.625%, 08/15/2020 | | | 75,000 | | | | 74,625 | | |
| | | | 525,865 | | |
Pharmaceuticals — 1.28% | |
AMAG Pharmaceuticals, Inc.
7.875%, 09/01/2023 (r) | | | 127,000 | | | | 127,635 | | |
Endo Ltd. / Endo Finance LLC / Endo Finco, Inc.
6.000%, 07/15/2023 (r) | | | 147,000 | | | | 129,728 | | |
Mallinckrodt International
Finance SA / Mallinckrodt CB LLC
5.750%, 08/01/2022 (r) | | | 134,000 | | | | 129,645 | | |
Valeant Pharmaceuticals International, Inc.
6.125%, 04/15/2025 (r) | | | 98,000 | | | | 73,990 | | |
| | | 460,998 | | |
TOTAL HEALTH CARE | | | 1,168,166 | | |
INDUSTRIALS — 6.06%
Aerospace & Defense — 0.70% | |
CBC Ammo LLC / CBC FinCo, Inc.
7.250%, 11/15/2021
(Acquired 04/09/2015 — 02/22/2016,
Cost $228,284) (i) (r) | | | 254,000 | | | | 250,825 | | |
Air Freight & Logistics — 0.31% | |
XPO Logistics, Inc.
6.500%, 06/15/2022 (r) | | | 104,000 | | | | 109,590 | | |
Building Products — 1.41% | |
Ashton Woods USA LLC / Ashton
Woods Finance Company
6.875%, 02/15/2021 (r) | | | 90,000 | | | | 87,075 | | |
Builders FirstSource, Inc.
5.625%, 09/01/2024 (r) | | | 95,000 | | | | 95,831 | | |
FBM Finance, Inc.
8.250%, 08/15/2021 (r) | | | 100,000 | | | | 106,000 | | |
Standard Industries, Inc.
6.000%, 10/15/2025 (r) | | | 124,000 | | | | 131,129 | | |
WESCO Distribution, Inc.
5.375%, 06/15/2024 (r) | | | 88,000 | | | | 88,440 | | |
| | | | 508,475 | | |
| | Principal
Amount | | Value | |
Commercial Services & Supplies — 0.84% | |
Ashtead Capital, Inc.
5.625%, 10/01/2024 (r) | | $ | 63,000 | | | $ | 66,308 | | |
Herc Rentals, Inc.
7.750%, 06/01/2024 (r) | | | 102,000 | | | | 107,738 | | |
Zachry Holdings, Inc.
7.500%, 02/01/2020 (r) | | | 126,000 | | | | 129,937 | | |
| | | | 303,983 | | |
Construction & Engineering — 0.54% | |
AECOM
5.875%, 10/15/2024 (c) | | | 113,000 | | | | 121,205 | | |
Tutor Perini Corp.
7.625%, 11/01/2018 | | | 73,000 | | | | 73,046 | | |
| | | | 194,251 | | |
Electrical Equipment — 0.37% | |
General Cable Corp.
5.750%, 10/01/2022 | | | 137,000 | | | | 133,575 | | |
Machinery — 0.92% | |
Cleaver-Brooks, Inc.
8.750%, 12/15/2019 (r) | | | 21,000 | | | | 21,971 | | |
Meritor, Inc.
6.250%, 02/15/2024 | | | 174,000 | | | | 171,390 | | |
Navistar International Corp.
8.250%, 11/01/2021 | | | 78,000 | | | | 79,170 | | |
Terex Corp.
6.000%, 05/15/2021 | | | 58,000 | | | | 59,523 | | |
| | | | 332,054 | | |
Professional Services — 0.29% | |
Enviva Partners LP / Enviva
Partners Finance Corp.
8.500%, 11/01/2021 (r) | | | 100,000 | | | | 104,500 | | |
Trading Companies & Distributors — 0.68% | |
Real Alloy Holding, Inc.
10.000%, 01/15/2019 (r) | | | 241,000 | | | | 244,013 | | |
TOTAL INDUSTRIALS | | | 2,181,266 | | |
INFORMATION TECHNOLOGY — 1.36%
Communications Equipment — 0.24% | |
CommScope Technologies Finance LLC
6.000%, 06/15/2025 (r) | | | 82,000 | | | | 87,330 | | |
Electronic Equipment, Instruments & Components — 0.53% | |
Micron Technology, Inc.
7.500%, 09/15/2023 (r) | | | 44,000 | | | | 48,840 | | |
5.500%, 02/01/2025 (c) | | | 51,000 | | | | 51,000 | | |
Sensata Technologies BV
5.625%, 11/01/2024 (r) | | | 85,000 | | | | 88,931 | | |
| | | | 188,771 | | |
The accompanying notes are an integral part of these financial statements.
44
Schedule of Investments — December 31, 2016
Hotchkis & Wiley Capital Income Fund (Unaudited)
| | Principal
Amount | | Value | |
Software — 0.31% | |
First Data Corp.
7.000%, 12/01/2023 (r) | | $ | 35,000 | | | $ | 37,363 | | |
PTC, Inc.
6.000%, 05/15/2024 | | | 71,000 | | | | 74,727 | | |
| | | | 112,090 | | |
Technology Hardware, Storage & Peripherals — 0.28% | |
Western Digital Corp.
7.375%, 04/01/2023 (r) | | | 61,000 | | | | 67,252 | | |
10.500%, 04/01/2024 (r) | | | 29,000 | | | | 34,365 | | |
| | | | 101,617 | | |
TOTAL INFORMATION TECHNOLOGY | | | 489,808 | | |
MATERIALS — 3.97%
Chemicals — 1.74% | |
The Chemours Company
7.000%, 05/15/2025 | | | 91,000 | | | | 90,090 | | |
Hexion, Inc.
6.625%, 04/15/2020 | | | 198,000 | | | | 176,220 | | |
Iracore International Holdings, Inc.
9.500%, 06/01/2018
(Acquired 05/08/2013 — 03/17/2015,
Cost $225,886) (d) (i) (r) | | | 226,000 | | | | 118,650 | | |
Platform Specialty Products Corp.
6.500%, 02/01/2022 (r) | | | 64,000 | | | | 64,800 | | |
Rayonier AM Products, Inc.
5.500%, 06/01/2024 (r) | | | 189,000 | | | | 177,659 | | |
| | | | 627,419 | | |
Containers & Packaging — 0.11% | |
Reynolds Group Issuer, Inc. /
Reynolds Group Issuer LLC
7.000%, 07/15/2024 (r) | | | 37,000 | | | | 39,382 | | |
Metals & Mining — 1.10% | |
Century Aluminum Company
7.500%, 06/01/2021 (r) | | | 80,000 | | | | 75,700 | | |
Kaiser Aluminum Corp.
5.875%, 05/15/2024 | | | 75,000 | | | | 77,813 | | |
New Day Aluminum LLC
10.000%, 10/28/2020
(Acquired 10/28/2016 — 12/31/2016,
Cost $18,095) (f) (i) (m) (p) | | | 59,596 | | | | 16,925 | | |
10.000%, 10/28/2020
(Acquired 10/28/2016 — 12/31/2016,
Cost $7,515) (f) (i) (m) (p) | | | 24,750 | | | | 7,029 | | |
Noranda Aluminum Acquisition Corp.
11.000%, 06/01/2019 (d) (f) (i) | | | 222,000 | | | | 0 | | |
Rain CII Carbon LLC / CII Carbon Corp.
8.000%, 12/01/2018 (r) | | | 103,000 | | | | 103,000 | | |
8.250%, 01/15/2021 (r) | | | 115,000 | | | | 114,425 | | |
| | | | 394,892 | | |
| | Principal
Amount | | Value | |
Paper & Forest Products — 1.02% | |
Appvion, Inc.
9.000%, 06/01/2020
(Acquired 11/13/2013 — 08/31/2015,
Cost $270,137) (i) (r) | | $ | 313,000 | | | $ | 176,845 | | |
Boise Cascade Company
5.625%, 09/01/2024 (r) | | | 65,000 | | | | 64,838 | | |
Neenah Paper, Inc.
5.250%, 05/15/2021
(Acquired 05/16/2013 — 05/02/2014,
Cost $124,095) (i) (r) | | | 124,000 | | | | 127,100 | | |
| | | | 368,783 | | |
TOTAL MATERIALS | | | 1,430,476 | | |
REAL ESTATE — 0.29%
Equity Real Estate Investment Trusts — 0.29% | |
The GEO Group, Inc.
5.875%, 10/15/2024 | | | 104,000 | | | | 103,090 | | |
TOTAL REAL ESTATE | | | 103,090 | | |
TELECOMMUNICATION SERVICES — 0.98%
Diversified Telecommunication Services — 0.46% | |
Communications Sales &
Leasing, Inc. / CSL Capital LLC
8.250%, 10/15/2023 | | | 156,000 | | | | 166,140 | | |
Wireless Telecommunication Services — 0.52% | |
Telesat Canada / Telesat LLC
8.875%, 11/15/2024 (r) | | | 110,000 | | | | 114,950 | | |
Wind Acquisition Finance SA
7.375%, 04/23/2021 (r) | | | 71,000 | | | | 74,018 | | |
| | | | 188,968 | | |
TOTAL TELECOMMUNICATION SERVICES | | | 355,108 | | |
UTILITIES — 0.84%
Independent Power and Renewable Electricity
Producers — 0.84% | |
Calpine Corp.
5.750%, 01/15/2025 | | | 109,000 | | | | 105,730 | | |
Dynegy, Inc.
7.625%, 11/01/2024 (c) | | | 117,000 | | | | 108,518 | | |
NRG Energy, Inc.
7.250%, 05/15/2026 (r) | | | 87,000 | | | | 87,000 | | |
TOTAL UTILITIES | | | 301,248 | | |
Total corporate bonds
(Cost $13,011,483) | | | | | 12,836,483 | | |
TERM LOANS — 1.68% | |
ENERGY — 1.40%
Energy Equipment & Services — 1.40% | |
Fieldwood Energy LLC
8.000%, 08/31/2020 (b) (p) | | | 80,218 | | | | 76,508 | | |
8.375%, 09/30/2020 (b) (p) | | | 108,296 | | | | 95,029 | | |
8.375%, 09/30/2020 (b) (p) | | | 181,704 | | | | 129,919 | | |
Jonah Energy LLC
7.500%, 05/12/2021 (b) (p) | | | 215,000 | | | | 204,250 | | |
TOTAL ENERGY | | | 505,706 | | |
The accompanying notes are an integral part of these financial statements.
45
Schedule of Investments — December 31, 2016
Hotchkis & Wiley Capital Income Fund (Unaudited)
| | Principal
Amount | | Value | |
UTILITIES — 0.28%
Electric Utilities — 0.28% | |
Vistra Operations Company LLC
5.000%, 08/04/2023 (b) (p) | | $ | 18,150 | | | $ | 18,395 | | |
5.000%, 08/04/2023 (b) (p) | | | 79,576 | | | | 80,652 | | |
TOTAL UTILITIES | | | 99,047 | | |
Total term loans
(Cost $637,637) | | | | | 604,753 | | |
WARRANTS — 0.01% | | Shares
Held | | | |
ENERGY — 0.01%
Oil, Gas & Consumable Fuels — 0.01% | |
Comstock Resources, Inc. (a) (f) (i)
Expiration: September 2018,
Exercise Price: $0.01 | | | 432 | | | | 4,251 | | |
TOTAL ENERGY | | | 4,251 | | |
Total warrants
(Cost $3,682) | | | | | 4,251 | | |
Total long-term investments
(Cost $33,028,079) | | | | | 34,905,470 | | |
SHORT-TERM
INVESTMENTS — 4.43% | | Principal
Amount | | | |
Time Deposits — 4.43% | |
Banco Santander SA,
0.26%, 01/03/2017* | | $ | 1,593,849 | | | | 1,593,849 | | |
Total short-term investments
(Cost $1,593,849) | | | | | 1,593,849 | | |
Total investments — 101.36%
(Cost $34,621,928) | | | | | 36,499,319 | | |
Liabilities in excess of other assets — (1.36)% | | | | | (488,161 | ) | |
Net assets — 100.00% | | $ | 36,011,158 | | |
(a) — Non-income producing security.
(b) — The coupon rate shown on variable rate securities represents the rate at December 31, 2016.
(c) — All or a portion of this security is segregated as collateral.
(d) — Issuer is currently in default on its regularly scheduled interest payments.
(f) — Security was fair valued under guidelines established by and under the general supervision and responsibility of the Trust's Board of Trustees. The total market value of these securities was $856,576, which represented 2.38% of net assets. See Security Valuation in Note 1 in Notes to the Financial Statements.
(i) — Illiquid security.
(m) — Restricted security. Purchased in a private placement transaction; resale to the public may require registration. The total market value of these securities was $23,954, which represented 0.07% of net assets.
(p) — Payment in-kind security.
(r) — Restricted security under Rule 144A of the Securities Act of 1933. Purchased in a private placement transaction; resale to the public may require registration or be limited to qualified institutional buyers. The total market value of these securities was $8,602,495, which represented 23.89% of net assets.
(v) — Security was fair valued as a result of market movements following the close of local trading using a third-party vendor's proprietary fair value pricing model. The total market value of these securities was $840,491, which represented 2.33% of net assets. See Security Valuation in Note 1 in Notes to the Financial Statements.
ADR — American Depositary Receipt
* — Invested through a cash management account administered by Brown Brothers Harriman & Co.
The accompanying notes are an integral part of these financial statements.
46
Schedule of Investments — December 31, 2016
Hotchkis & Wiley High Yield Fund (Unaudited)

Largest Issuers | | Percent of
net assets | |
HCA, Inc. | | | 1.35 | % | |
CCO Holdings LLC / CCO Holdings
Capital Corp. | | | 1.25 | % | |
McDermott International, Inc. | | | 1.11 | % | |
Rain CII Carbon LLC / CII Carbon Corp. | | | 1.06 | % | |
Fieldwood Energy LLC | | | 1.05 | % | |
Tenet Healthcare Corp. | | | 1.00 | % | |
Harland Clarke Holdings Corp. | | | 0.99 | % | |
Unit Corp. | | | 0.97 | % | |
Lonestar Resources America, Inc. | | | 0.95 | % | |
VTR Finance BV | | | 0.95 | % | |
CORPORATE
BONDS — 88.37% | | Principal
Amount | | Value | |
Advertising — 0.73% | |
MDC Partners, Inc.
6.500%, 05/01/2024 (r) | | $ | 21,027,000 | | | $ | 19,029,435 | | |
Aerospace/Defense — 0.83% | |
CBC Ammo LLC / CBC FinCo, Inc.
7.250%, 11/15/2021
(Acquired 04/09/2015 — 11/03/2016,
Cost $19,824,383) (i) (r) | | | 21,899,000 | | | | 21,625,262 | | |
Auto Parts & Equipment — 1.15% | |
Adient Global Holdings Ltd.
4.875%, 08/15/2026 (r) | | | 13,096,000 | | | | 12,866,820 | | |
Meritor, Inc.
6.250%, 02/15/2024 | | | 17,246,000 | | | | 16,987,310 | | |
| | | | 29,854,130 | | |
Automakers — 0.52% | |
Navistar International Corp.
8.250%, 11/01/2021 (c) | | | 13,197,000 | | | | 13,394,955 | | |
Banking — 1.29% | |
Popular, Inc.
7.000%, 07/01/2019 | | | 23,270,000 | | | | 24,113,537 | | |
Societe Generale SA
7.375%, 12/29/2049 (b) (r) | | | 9,334,000 | | | | 9,341,654 | | |
| | | | 33,455,191 | | |
Building & Construction — 3.76% | |
Ashton Woods USA LLC / Ashton
Woods Finance Company
6.875%, 02/15/2021 (r) | | | 17,835,000 | | | | 17,255,362 | | |
Tutor Perini Corp.
7.625%, 11/01/2018 | | | 13,798,000 | | | | 13,806,624 | | |
WCI Communities, Inc.
6.875%, 08/15/2021 | | | 17,900,000 | | | | 18,929,250 | | |
Weekley Homes LLC / Weekley Finance Corp.
6.000%, 02/01/2023 | | | 26,718,000 | | | | 23,912,610 | | |
Zachry Holdings, Inc.
7.500%, 02/01/2020 (r) | | | 22,978,000 | | | | 23,696,063 | | |
| | | | 97,599,909 | | |
| | Principal
Amount | | Value | |
Building Materials — 4.26% | |
Allegion PLC
5.875%, 09/15/2023 | | $ | 11,525,000 | | | $ | 12,274,125 | | |
Builders FirstSource, Inc.
5.625%, 09/01/2024 (r) | | | 16,745,000 | | | | 16,891,519 | | |
FBM Finance, Inc.
8.250%, 08/15/2021 (r) | | | 18,328,000 | | | | 19,427,680 | | |
RSI Home Products, Inc.
6.500%, 03/15/2023 (r) | | | 20,523,000 | | | | 21,549,150 | | |
Standard Industries, Inc.
6.000%, 10/15/2025 (r) | | | 18,986,000 | | | | 20,077,695 | | |
WESCO Distribution, Inc.
5.375%, 06/15/2024 (r) | | | 20,247,000 | | | | 20,348,235 | | |
| | | | 110,568,404 | | |
Cable & Satellite TV — 5.50% | |
Altice Luxembourg SA
7.625%, 02/15/2025 (r) | | | 22,007,000 | | | | 23,189,876 | | |
Cable One, Inc.
5.750%, 06/15/2022 (r) | | | 17,117,000 | | | | 17,673,303 | | |
CCO Holdings LLC / CCO Holdings Capital Corp.
5.375%, 05/01/2025 (r) | | | 14,042,000 | | | | 14,498,365 | | |
5.750%, 02/15/2026 (r) | | | 17,379,000 | | | | 18,030,712 | | |
SFR Group SA
6.000%, 05/15/2022 (r) | | | 21,234,000 | | | | 21,871,020 | | |
Virgin Media Finance PLC
6.375%, 04/15/2023 (r) | | | 21,680,000 | | | | 22,628,500 | | |
VTR Finance BV
6.875%, 01/15/2024 (r) | | | 23,755,000 | | | | 24,586,425 | | |
| | | | 142,478,201 | | |
The accompanying notes are an integral part of these financial statements.
47
Schedule of Investments — December 31, 2016
Hotchkis & Wiley High Yield Fund (Unaudited)
| | Principal
Amount | | Value | |
Chemicals — 3.11% | |
The Chemours Company
7.000%, 05/15/2025 | | $ | 16,747,000 | | | $ | 16,579,530 | | |
Hexion, Inc.
6.625%, 04/15/2020 (c) | | | 24,058,000 | | | | 21,411,620 | | |
Momentive Performance Materials, Inc.
3.880%, 10/24/2021 (c) | | | 25,222,000 | | | | 23,834,790 | | |
Momentive Performance Materials, Inc. — Escrow
8.875%, 10/15/2020 (a) (f) (i) | | | 24,222,000 | | | | 0 | | |
Platform Specialty Products Corp.
6.500%, 02/01/2022 (r) | | | 18,694,000 | | | | 18,927,675 | | |
| | | | 80,753,615 | | |
Consumer/Commercial/Lease Financing — 1.25% | |
Credit Acceptance Corp.
6.125%, 02/15/2021 | | | 19,234,000 | | | | 19,522,510 | | |
Lincoln Finance Ltd.
7.375%, 04/15/2021 (r) | | | 12,111,000 | | | | 12,943,631 | | |
| | | | 32,466,141 | | |
Department Stores — 0.74% | |
JC Penney Corp., Inc.
5.875%, 07/01/2023 (r) | | | 18,621,000 | | | | 19,249,459 | | |
Diversified Capital Goods — 1.72% | |
Apex Tool Group LLC
7.000%, 02/01/2021 (r) | | | 22,847,000 | | | | 20,562,300 | | |
General Cable Corp.
5.750%, 10/01/2022 | | | 24,720,000 | | | | 24,102,000 | | |
| | | | 44,664,300 | | |
Electric — Generation — 2.13% | |
Calpine Corp.
5.750%, 01/15/2025 | | | 20,255,000 | | | | 19,647,350 | | |
Dynegy, Inc.
7.625%, 11/01/2024 (c) | | | 20,386,000 | | | | 18,908,015 | | |
NRG Energy, Inc.
7.250%, 05/15/2026 (r) | | | 16,591,000 | | | | 16,591,000 | | |
| | | | 55,146,365 | | |
Electronics — 1.44% | |
Micron Technology, Inc.
7.500%, 09/15/2023 (r) | | | 8,253,000 | | | | 9,160,830 | | |
5.500%, 02/01/2025 (c) | | | 10,003,000 | | | | 10,003,000 | | |
Sensata Technologies BV
5.625%, 11/01/2024 (r) | | | 17,400,000 | | | | 18,204,750 | | |
| | | | 37,368,580 | | |
| | Principal
Amount | | Value | |
Energy — Exploration & Production — 7.62% | |
Bellatrix Exploration Ltd.
8.500%, 05/15/2020
(Acquired 05/15/2015 — 05/24/2016,
Cost $16,130,324) (i) (r) | | $ | 18,866,000 | | | $ | 18,630,175 | | |
Callon Petroleum Company
6.125%, 10/01/2024 (r) | | | 8,965,000 | | | | 9,278,775 | | |
Cobalt International Energy, Inc.
10.750%, 12/01/2021 (r) | | | 16,073,000 | | | | 15,582,774 | | |
7.750%, 12/01/2023 (r) | | | 9,815,000 | | | | 5,496,400 | | |
Comstock Resources, Inc.
10.000%, 03/15/2020 (p) | | | 20,382,000 | | | | 20,993,460 | | |
Kosmos Energy Ltd.
7.875%, 08/01/2021 (r) | | | 23,189,000 | | | | 23,189,000 | | |
Lonestar Resources America, Inc.
8.750%, 04/15/2019
(Acquired 09/03/2015 — 06/22/2016,
Cost $10,695,547) (i) (r) | | | 17,158,000 | | | | 15,785,360 | | |
Murphy Oil Corp.
6.875%, 08/15/2024 | | | 13,030,000 | | | | 13,909,525 | | |
PetroQuest Energy, Inc.
10.000%, 02/15/2021
(Acquired 08/12/2010 — 12/06/2016,
Cost $17,859,187) (i) (p) (r) | | | 19,833,000 | | | | 14,081,430 | | |
Range Resources Corp.
5.000%, 08/15/2022 (r) | | | 12,991,000 | | | | 12,974,761 | | |
Rice Energy, Inc.
6.250%, 05/01/2022 (c) | | | 18,467,000 | | | | 19,067,178 | | |
Sanchez Energy Corp.
6.125%, 01/15/2023 | | | 15,075,000 | | | | 14,396,625 | | |
Whiting Petroleum Corp.
5.750%, 03/15/2021 | | | 14,268,000 | | | | 14,279,985 | | |
| | | | 197,665,448 | | |
Environmental — 0.70% | |
Enviva Partners LP / Enviva Partners Finance Corp.
8.500%, 11/01/2021 (r) | | | 17,458,000 | | | | 18,243,610 | | |
Food — Wholesale — 2.53% | |
Pinnacle Operating Corp.
9.000%, 11/15/2020
(Acquired 09/13/2013 — 12/02/2016,
Cost $26,601,356) (i) (r) | | | 29,368,000 | | | | 13,068,760 | | |
Shearer's Foods LLC / Chip Finance Corp.
9.000%, 11/01/2019 (r) | | | 14,536,000 | | | | 15,208,290 | | |
TreeHouse Foods, Inc.
6.000%, 02/15/2024 (r) | | | 15,876,000 | | | | 16,709,490 | | |
Wells Enterprises, Inc.
6.750%, 02/01/2020 (r) | | | 19,971,000 | | | | 20,694,949 | | |
| | | | 65,681,489 | | |
The accompanying notes are an integral part of these financial statements.
48
Schedule of Investments — December 31, 2016
Hotchkis & Wiley High Yield Fund (Unaudited)
| | Principal
Amount | | Value | |
Forestry/Paper — 2.64% | |
Appvion, Inc.
9.000%, 06/01/2020
(Acquired 11/13/2013 — 04/07/2016,
Cost $15,160,152) (i) (r) | | $ | 20,035,000 | | | $ | 11,319,775 | | |
Boise Cascade Company
5.625%, 09/01/2024 (r) | | | 14,055,000 | | | | 14,019,862 | | |
Neenah Paper, Inc.
5.250%, 05/15/2021
(Acquired 05/16/2013 — 08/23/2016,
Cost $18,918,675) (i) (r) | | | 18,898,000 | | | | 19,370,450 | | |
Rayonier AM Products, Inc.
5.500%, 06/01/2024 (r) | | | 25,175,000 | | | | 23,664,500 | | |
| | | | 68,374,587 | | |
Gaming — 2.31% | |
MCE Finance Ltd.
5.000%, 02/15/2021 (r) | | | 6,599,000 | | | | 6,589,953 | | |
MGM Growth Properties Operating
Partnership LP / MGP Finance Co-Issuer, Inc.
5.625%, 05/01/2024 (r) | | | 6,270,000 | | | | 6,583,500 | | |
MGM Resorts International
7.750%, 03/15/2022 (c) | | | 13,607,000 | | | | 15,682,067 | | |
Rivers Pittsburgh Borrower LP / Rivers
Pittsburgh Finance Corp.
6.125%, 08/15/2021 (r) | | | 12,519,000 | | | | 12,831,975 | | |
Wynn Macau Ltd.
5.250%, 10/15/2021 (r) | | | 18,040,000 | | | | 18,265,500 | | |
| | | | 59,952,995 | | |
Gas Distribution — 3.11% | |
American Midstream Partners LP /
American Midstream Finance Corp.
8.500%, 12/15/2021 (r) | | | 12,645,000 | | | | 12,581,775 | | |
Cheniere Corpus Christi Holdings LLC
5.875%, 03/31/2025 (r) | | | 13,425,000 | | | | 13,748,005 | | |
Holly Energy Partners LP / Holly Energy
Finance Corp.
6.000%, 08/01/2024 (r) | | | 19,037,000 | | | | 19,941,257 | | |
Niska Gas Storage Ltd. / Niska Gas Storage
Canada Finance Corp.
6.500%, 04/01/2019 | | | 14,427,000 | | | | 14,571,270 | | |
PBF Logistics LP / PBF Logistics Finance Corp.
6.875%, 05/15/2023 | | | 19,977,000 | | | | 19,727,288 | | |
| | | | 80,569,595 | | |
| | Principal
Amount | | Value | |
Health Facilities — 3.13% | |
CHS / Community Health Systems, Inc.
5.125%, 08/01/2021 | | $ | 6,675,000 | | | $ | 6,207,750 | | |
6.875%, 02/01/2022 | | | 19,874,000 | | | | 13,911,800 | | |
HCA, Inc.
5.000%, 03/15/2024 | | | 4,985,000 | | | | 5,140,781 | | |
5.375%, 02/01/2025 | | | 29,729,000 | | | | 29,840,484 | | |
Tenet Healthcare Corp.
7.500%, 01/01/2022 (r) | | | 6,350,000 | | | | 6,635,750 | | |
6.750%, 06/15/2023 (c) | | | 21,903,000 | | | | 19,329,397 | | |
| | | | 81,065,962 | | |
Health Services — 0.54% | |
Universal Hospital Services, Inc.
7.625%, 08/15/2020 | | | 14,134,000 | | | | 14,063,330 | | |
Hotels — 0.55% | |
National CineMedia LLC
5.750%, 08/15/2026 | | | 14,082,000 | | | | 14,363,640 | | |
Machinery — 1.77% | |
Cleaver-Brooks, Inc.
8.750%, 12/15/2019 (r) | | | 18,594,000 | | | | 19,453,972 | | |
Manitowoc Foodservice, Inc.
9.500%, 02/15/2024 | | | 11,297,000 | | | | 13,076,277 | | |
Terex Corp.
6.000%, 05/15/2021 | | | 12,942,000 | | | | 13,281,728 | | |
| | | | 45,811,977 | | |
Managed Care — 0.52% | |
Centene Corp.
6.125%, 02/15/2024 | | | 12,805,000 | | | | 13,525,281 | | |
Media Content — 0.79% | |
Townsquare Media, Inc.
6.500%, 04/01/2023 (r) | | | 21,281,000 | | | | 20,403,159 | | |
Medical Products — 2.09% | |
DJO Finco, Inc. / DJO Finance LLC / DJO
Finance Corp.
8.125%, 06/15/2021 (r) | | | 15,140,000 | | | | 13,209,650 | | |
Halyard Health, Inc.
6.250%, 10/15/2022 | | | 21,015,000 | | | | 21,750,525 | | |
Hill-Rom Holdings, Inc.
5.750%, 09/01/2023 (r) | | | 18,525,000 | | | | 19,219,688 | | |
| | | | 54,179,863 | | |
The accompanying notes are an integral part of these financial statements.
49
Schedule of Investments — December 31, 2016
Hotchkis & Wiley High Yield Fund (Unaudited)
| | Principal
Amount | | Value | |
Metals/Mining Excluding Steel — 3.09% | |
Century Aluminum Company
7.500%, 06/01/2021 (r) | | $ | 21,324,000 | | | $ | 20,177,835 | | |
Kaiser Aluminum Corp.
5.875%, 05/15/2024 | | | 12,122,000 | | | | 12,576,575 | | |
New Day Aluminum LLC
10.000%, 10/28/2020
(Acquired 10/28/2016 — 12/31/2016,
Cost $116,183) (f) (i) (m) (p) | | | 382,639 | | | | 108,669 | | |
10.000%, 10/28/2020
(Acquired 10/28/2016 — 12/31/2016,
Cost $279,762) (f) (i) (m) (p) | | | 921,375 | | | | 261,671 | | |
Noranda Aluminum Acquisition Corp.
11.000%, 06/01/2019 (d) (f) (i) | | | 18,476,000 | | | | 0 | | |
Rain CII Carbon LLC / CII Carbon Corp.
8.000%, 12/01/2018 (r) | | | 12,175,000 | | | | 12,175,000 | | |
8.250%, 01/15/2021 (r) | | | 15,502,000 | | | | 15,424,490 | | |
Real Alloy Holding, Inc.
10.000%, 01/15/2019 (r) | | | 19,102,000 | | | | 19,340,775 | | |
| | | | 80,065,015 | | |
Oil Field Equipment & Services — 5.45% | |
Atwood Oceanics, Inc.
6.500%, 02/01/2020 | | | 10,186,000 | | | | 9,371,120 | | |
Globe Luxembourg SCA
9.625%, 05/01/2018 (r) | | | 15,363,000 | | | | 15,247,777 | | |
Iracore International Holdings, Inc.
9.500%, 06/01/2018
(Acquired 05/08/2013 — 04/14/2015,
Cost $16,977,066) (d) (i) (r) | | | 18,538,000 | | | | 9,732,450 | | |
McDermott International, Inc.
8.000%, 05/01/2021 (r) | | | 24,013,000 | | | | 24,373,195 | | |
Noble Holding International Ltd.
7.750%, 01/15/2024 | | | 3,345,000 | | | | 3,154,670 | | |
PHI, Inc.
5.250%, 03/15/2019 | | | 22,289,000 | | | | 21,063,105 | | |
Shelf Drilling Holdings Ltd.
8.625%, 11/01/2018 (r) | | | 21,407,000 | | | | 18,088,915 | | |
Transocean, Inc.
9.000%, 07/15/2023 (r) | | | 14,906,000 | | | | 15,353,180 | | |
Unit Corp.
6.625%, 05/15/2021 | | | 25,664,000 | | | | 25,022,400 | | |
Vantage Drilling International — Escrow
7.500%, 11/01/2019 (a) (f) (i) | | | 833,000 | | | | 0 | | |
7.125%, 04/01/2023 (a) (f) (i) | | | 28,058,000 | | | | 0 | | |
| | | | 141,406,812 | | |
Oil Refining & Marketing — 1.46% | |
Calumet Specialty Products
Partners LP / Calumet Finance Corp.
6.500%, 04/15/2021 | | | 24,559,000 | | | | 20,936,547 | | |
PBF Holding Company
LLC / PBF Finance Corp.
8.250%, 02/15/2020 (c) | | | 16,348,000 | | | | 16,777,135 | | |
| | | | 37,713,682 | | |
| | Principal
Amount | | Value | |
Packaging — 0.87% | |
Reynolds Group Issuer, Inc. / Reynolds
Group Issuer LLC
5.125%, 07/15/2023 (r) | | $ | 15,685,000 | | | $ | 15,959,488 | | |
7.000%, 07/15/2024 (r) | | | 6,126,000 | | | | 6,520,361 | | |
| | | | 22,479,849 | | |
Personal & Household Products — 2.31% | |
American Greetings Corp.
7.375%, 12/01/2021 (c) | | | 22,947,000 | | | | 23,491,991 | | |
Central Garden & Pet Company
6.125%, 11/15/2023 | | | 11,879,000 | | | | 12,591,740 | | |
FGI Operating Company LLC / FGI Finance, Inc.
7.875%, 05/01/2020 (i) | | | 16,801,000 | | | | 14,364,855 | | |
Vista Outdoor, Inc.
5.875%, 10/01/2023 | | | 8,980,000 | | | | 9,445,883 | | |
| | | | 59,894,469 | | |
Pharmaceuticals — 3.04% | |
AMAG Pharmaceuticals, Inc.
7.875%, 09/01/2023 (r) | | | 23,742,000 | | | | 23,860,710 | | |
Endo Ltd. / Endo Finance LLC / Endo Finco, Inc.
6.000%, 07/15/2023 (r) | | | 21,706,000 | | | | 19,155,545 | | |
Mallinckrodt International
Finance SA / Mallinckrodt CB LLC
5.750%, 08/01/2022 (r) | | | 22,211,000 | | | | 21,489,142 | | |
Valeant Pharmaceuticals International, Inc.
6.125%, 04/15/2025 (r) | | | 18,867,000 | | | | 14,244,585 | | |
| | | | 78,749,982 | | |
Printing & Publishing — 1.49% | |
Harland Clarke Holdings Corp.
9.250%, 03/01/2021 (r) | | | 28,913,000 | | | | 25,551,864 | | |
LSC Communications, Inc.
8.750%, 10/15/2023 (r) | | | 13,008,000 | | | | 13,105,560 | | |
| | | | 38,657,424 | | |
Recreation & Travel — 0.60% | |
Interval Acquisition Corp.
5.625%, 04/15/2023 | | | 15,271,000 | | | | 15,652,775 | | |
Restaurants — 1.29% | |
KFC Holding Company / Pizza Hut
Holdings LLC / Taco Bell of America LLC
5.250%, 06/01/2026 (r) | | | 14,761,000 | | | | 15,019,318 | | |
Ruby Tuesday, Inc.
7.625%, 05/15/2020 (i) | | | 19,287,000 | | | | 18,419,085 | | |
| | | | 33,438,403 | | |
Software/Services — 1.32% | |
PTC, Inc.
6.000%, 05/15/2024 | | | 14,681,000 | | | | 15,451,752 | | |
VeriSign, Inc.
5.250%, 04/01/2025 | | | 18,259,000 | | | | 18,761,123 | | |
| | | | 34,212,875 | | |
The accompanying notes are an integral part of these financial statements.
50
Schedule of Investments — December 31, 2016
Hotchkis & Wiley High Yield Fund (Unaudited)
| | Principal
Amount | | Value | |
Specialty Retail — 1.44% | |
Chinos Intermediate Holdings A, Inc.
7.750%, 05/01/2019 (p) (r) | | $ | 13,106,648 | | | $ | 5,439,259 | | |
CST Brands, Inc.
5.000%, 05/01/2023 | | | 11,175,000 | | | | 11,594,063 | | |
PetSmart, Inc.
7.125%, 03/15/2023 (r) | | | 19,797,000 | | | | 20,242,432 | | |
| | | | 37,275,754 | | |
Support — Services — 3.57% | |
AECOM
5.875%, 10/15/2024 (c) | | | 21,443,000 | | | | 22,999,976 | | |
Ashtead Capital, Inc.
5.625%, 10/01/2024 (r) | | | 12,089,000 | | | | 12,723,672 | | |
The GEO Group, Inc.
5.875%, 10/15/2024 | | | 19,840,000 | | | | 19,666,400 | | |
Herc Rentals, Inc.
7.750%, 06/01/2024 (r) | | | 19,590,000 | | | | 20,691,938 | | |
Sotheby's
5.250%, 10/01/2022 (r) | | | 16,637,000 | | | | 16,429,038 | | |
| | | | 92,511,024 | | |
Technology Hardware & Equipment — 2.11% | |
CDW LLC / CDW Finance Corp.
5.500%, 12/01/2024 | | | 17,575,000 | | | | 18,058,312 | | |
CommScope Technologies Finance LLC
6.000%, 06/15/2025 (r) | | | 15,905,000 | | | | 16,938,825 | | |
Western Digital Corp.
7.375%, 04/01/2023 (r) | | | 11,976,000 | | | | 13,203,540 | | |
10.500%, 04/01/2024 (r) | | | 5,526,000 | | | | 6,548,310 | | |
| | | | 54,748,987 | | |
Telecom — Satellite — 0.57% | |
Telesat Canada / Telesat LLC
8.875%, 11/15/2024 (r) | | | 14,100,000 | | | | 14,734,500 | | |
Telecom — Wireless — 0.62% | |
Wind Acquisition Finance SA
7.375%, 04/23/2021 (r) | | | 15,397,000 | | | | 16,051,373 | | |
Telecom — Wireline Integrated & Services — 1.65% | |
Communications Sales & Leasing, Inc. / CSL
Capital LLC
8.250%, 10/15/2023 | | | 21,660,000 | | | | 23,067,900 | | |
Sable International Finance Ltd.
6.875%, 08/01/2022 (r) | | | 18,757,000 | | | | 19,601,065 | | |
| | | | 42,668,965 | | |
Transport Infrastructure/Services — 0.76% | |
XPO Logistics, Inc.
6.500%, 06/15/2022 (r) | | | 18,562,000 | | | | 19,559,708 | | |
Total corporate bonds
(Cost $2,306,266,630) | | | | | 2,291,376,480 | | |
ASSET-BACKED
SECURITIES — 0.44% | | Principal
Amount | | Value | |
Air Transportation — 0.44% | |
U.S. Airways Pass Through Trust — Class B —
Series 2012-2
6.750%, 06/03/2021 | | $ | 10,446,327 | | | $ | 11,373,439 | | |
Total asset-backed securities
(Cost $10,963,384) | | | | | 11,373,439 | | |
CONVERTIBLE BONDS — 0.62% | |
Auto Parts & Equipment — 0.20% | |
Meritor, Inc.
7.875%, 03/01/2026 | | | 3,507,000 | | | | 5,087,342 | | |
Automakers — 0.42% | |
Navistar International Corp.
4.750%, 04/15/2019 | | | 10,986,000 | | | | 10,903,605 | | |
Total convertible bonds
(Cost $14,022,350) | | | | | 15,990,947 | | |
TERM LOANS — 2.92% | |
Electric — Generation — 0.61% | |
Vistra Operations Company LLC
5.000%, 08/04/2023 (b) (p) | | | 2,890,388 | | | | 2,929,467 | | |
5.000%, 08/04/2023 (b) (p) | | | 12,673,256 | | | | 12,844,598 | | |
| | | | 15,774,065 | | |
Energy — Exploration & Production — 2.04% | |
Fieldwood Energy LLC
8.000%, 08/31/2020 (b) (p) | | | 7,248,658 | | | | 6,913,408 | | |
8.375%, 09/30/2020 (b) (p) | | | 9,785,808 | | | | 8,587,047 | | |
8.375%, 09/30/2020 (b) (p) | | | 16,419,192 | | | | 11,739,722 | | |
Jonah Energy LLC
7.500%, 05/12/2021 (b) (p) | | | 18,315,210 | | | | 17,399,449 | | |
Lonestar Resources America, Inc.
12.000%, 12/31/2021 (f) (i) (p) | | | 9,000,000 | | | | 8,236,800 | | |
| | | | 52,876,426 | | |
Metals/Mining Excluding Steel — 0.05% | |
New Day Aluminum LLC
8.000%, 10/28/2017
(Acquired 10/28/2016,
Cost $512,000) (f) (i) (m) | | | 512,000 | | | | 512,000 | | |
8.000%, 10/28/2017
(Acquired 10/28/2016,
Cost $800,000) (f) (i) (m) | | | 800,000 | | | | 800,000 | | |
| | | | 1,312,000 | | |
Specialty Retail — 0.22% | |
J.Crew Group, Inc.
4.000%, 03/05/2021 (b) (p) | | | 10,308,722 | | | | 5,914,629 | | |
Total term loans
(Cost $82,153,408) | | | | | 75,877,120 | | |
The accompanying notes are an integral part of these financial statements.
51
Schedule of Investments — December 31, 2016
Hotchkis & Wiley High Yield Fund (Unaudited)
CONVERTIBLE
PREFERRED STOCKS — 0.16% | | Shares
Held | | Value | |
Oil Field Equipment & Services — 0.16% | |
McDermott International, Inc., 6.250% (i) | | | 178,219 | | | $ | 4,296,860 | | |
Total convertible preferred stocks
(Cost $4,532,955) | | | | | 4,296,860 | | |
PREFERRED STOCKS — 2.09% | |
Banking — 2.09% | |
Citigroup, Inc., 7.125% (b) | | | 618,289 | | | | 17,299,726 | | |
Countrywide Capital V, 7.000% | | | 550,820 | | | | 14,023,877 | | |
Royal Bank of Scotland Group PLC, 6.600% | | | 910,121 | | | | 22,798,531 | | |
Total preferred stocks
(Cost $50,110,307) | | | | | 54,122,134 | | |
COMMON STOCKS — 1.90% | |
Automakers — 0.00% | |
General Motors Company — Escrow (a) (f) (i) | | | 352,400 | | | | 0 | | |
Energy — Exploration & Production — 0.51% | |
Energy XXI Gulf Coast, Inc. (a) (f) (i) | | | 406,652 | | | | 11,202,080 | | |
PetroQuest Energy, Inc. (a) | | | 337,194 | | | | 1,116,112 | | |
Prairie Provident Resources, Inc. (a) | | | 1,296,150 | | | | 705,106 | | |
Warren Resources, Inc. (a) (f) (i) | | | 116,226 | | | | 160,740 | | |
| | | 13,184,038 | | |
Metals/Mining Excluding Steel — 0.75% | |
GHW Holdco LLC
(Acquired 10/28/2016,
Cost $30,000) (a) (f) (i) (m) | | | 1 | | | | 30,000 | | |
Horsehead Holding LLC (a) (f) (i) | | | 76,444 | | | | 19,487,968 | | |
| | | | 19,517,968 | | |
Oil Field Equipment & Services — 0.20% | |
Vantage Drilling International (a) (i) | | | 49,988 | | | | 5,173,758 | | |
Specialty Retail — 0.44% | |
Quiksilver, Inc. (a) (f) (i) | | | 582,983 | | | | 11,531,404 | | |
Total common stocks
(Cost $85,613,244) | | | | | 49,407,168 | | |
WARRANTS — 0.05% | |
Energy — Exploration & Production — 0.05% | |
Comstock Resources, Inc. (a) (f) (i)
Expiration: September 2018,
Exercise Price: $0.01 | | | 59,934 | | | | 589,751 | | |
Lonestar Resources America, Inc. (a) (f) (i)
Expiration: December 2021,
Exercise Price: $5.00 | | | 180,000 | | | | 637,200 | | |
Total warrants
(Cost $1,200,302) | | | | | 1,226,951 | | |
Total long-term investments
(Cost $2,554,862,580) | | | | | 2,503,671,099 | | |
SHORT-TERM
INVESTMENTS — 1.92% | | Principal
Amount | | Value | |
Time Deposits — 1.92% | |
Brown Brothers Harriman & Co.,
0.26%, 01/03/2017* | | $ | 49,751,831 | | | $ | 49,751,831 | | |
Total short-term investments
(Cost $49,751,831) | | | 49,751,831 | | |
Total investments — 98.47%
(Cost $2,604,614,411) | | | | | 2,553,422,930 | | |
Other assets in excess of liabilities — 1.53% | | | | | 39,557,316 | | |
Net assets — 100.00% | | $ | 2,592,980,246 | | |
(a) — Non-income producing security.
(b) — The coupon rate shown on variable rate securities represents the rate at December 31, 2016.
(c) — All or a portion of this security is segregated as collateral for credit default swap contracts and unfunded loan commitments.
(d) — Issuer is currently in default on its regularly scheduled interest payments.
(f) — Security was fair valued under guidelines established by and under the general supervision and responsibility of the Trust's Board of Trustees. The total market value of these securities was $53,558,283, which represented 2.07% of net assets. See Security Valuation in Note 1 in Notes to the Financial Statements.
(i) — Illiquid security.
(m) — Restricted security. Purchased in a private placement transaction; resale to the public may require registration. The total market value of these securities was $1,712,340, which represented 0.07% of net assets.
(p) — Payment in-kind security.
(r) — Restricted security under Rule 144A of the Securities Act of 1933. Purchased in a private placement transaction; resale to the public may require registration or be limited to qualified institutional buyers. The total market value of these securities was $1,383,993,116, which represented 53.37% of net assets.
* — Invested through a cash management account administered by Brown Brothers Harriman & Co.
The accompanying notes are an integral part of these financial statements.
52
Schedule of Credit Default Swap Contracts — December 31, 2016
Hotchkis & Wiley High Yield Fund (Unaudited)
CREDIT DEFAULT SWAP CONTRACTS — BUY PROTECTION(1) | |
Reference Entity | | Counterparty | | Receive
Fixed Rate | | Expiration
Date | | Notional
Amount(2) | | Premiums Paid
(Received) | | Value(3) | | Unrealized
Appreciation
(Depreciation) | |
Markit CDX.NA.HY.27 | | Goldman Sachs International(4) | | | 5.00 | % | | 12/20/21 | | $ | 12,550,000 | | | $ | (509,469 | ) | | $ | (799,017 | ) | | $ | (289,548 | ) | |
(1) The buyer of protection is obligated to pay the seller a periodic stream of payments over the term of the contract provided no event of default occurs. If a credit event occurs, as defined under the terms of that particular swap agreement, the seller will pay a net settlement amount in the form of cash or securities equal to the notional amount of the swap less the recovery value of the referenced entity or underlying securities comprising the referenced index.
(2) The maximum potential payment the Fund could receive as a buyer or pay as a seller of credit protection if a credit event occurs as defined under the terms of the swap agreement.
(3) The prices and resulting values for credit default swap agreements on credit indices serve as an indicator of the current status of the payment/performance risk and represent the likelihood of an expected liability (or profit) for the credit derivative should the notional amount of the swap agreement be closed/sold as of the period end. Increasing market values, in absolute terms when compared to the notional amount of the swap, represent a deterioration of the referenced entity's credit soundness and a greater likelihood or risk of default or other credit event occurring as defined under the terms of the agreement.
(4) Moody's rating of Goldman Sachs International, the counterparty, as of December 31, 2016 was A3.
The accompanying notes are an integral part of these financial statements.
53
Statements of Assets & Liabilities
DECEMBER 31, 2016 (UNAUDITED)
| | | Diversified Value
Fund | | Large Cap Value
Fund | | Mid-Cap Value
Fund | | Small Cap Value
Fund | | Small Cap
Diversified Value
Fund | |
Assets: | |
Long-term investments, at value* | |
Unaffiliated issuers | | $ | 128,239,543 | | | $ | 467,535,203 | | | $ | 2,094,856,922 | | | $ | 780,432,207 | | | $ | 19,249,827 | | |
Affiliated issuers | | | — | | | | — | | | | 67,459,125 | | | | 40,192,025 | | | | — | | |
Collateral for securities on loan* | | | — | | | | — | | | | 6,304,168 | | | | 5,786,516 | | | | — | | |
Short-term investments* | | | 182,134 | | | | 16,890,844 | | | | 26,879,532 | | | | 924,023 | | | | 509,524 | | |
Dividends and interest receivable | | | 169,912 | | | | 662,251 | | | | 2,265,418 | | | | 594,581 | | | | 22,948 | | |
Receivable for investments sold | | | — | | | | 11,783,202 | | | | — | | | | 18,641,031 | | | | — | | |
Receivable for Fund shares sold | | | 57,922 | | | | 974,174 | | | | 9,624,198 | | | | 1,265,487 | | | | 5,500 | | |
Receivable from Advisor | | | — | | | | — | | | | — | | | | — | | | | 808 | | |
Other assets | | | 31,623 | | | | 34,008 | | | | 89,426 | | | | 60,443 | | | | 16,978 | | |
Total assets | | $ | 128,681,134 | | | $ | 497,879,682 | | | $ | 2,207,478,789 | | | $ | 847,896,313 | | | $ | 19,805,585 | | |
Liabilities: | |
Collateral upon return of securities on loan | | $ | — | | | $ | — | | | $ | 6,304,168 | | | $ | 5,786,516 | | | $ | — | | |
Payable for investments purchased | | | — | | | | — | | | | 805,838 | | | | 1,292,045 | | | | 468,052 | | |
Payable for Fund shares repurchased | | | 130,350 | | | | 17,122,124 | | | | 5,947,796 | | | | 12,017,581 | | | | — | | |
Payable to Advisor | | | 56,452 | | | | 319,594 | | | | 1,404,618 | | | | 537,663 | | | | — | | |
Payable to Trustees | | | 4,014 | | | | 528 | | | | 808 | | | | — | | | | — | | |
Accrued distribution and service fees | | | 51,598 | | | | 235,120 | | | | 401,081 | | | | 136,460 | | | | 689 | | |
Accrued expenses and other liabilities | | | 117,219 | | | | 271,423 | | | | 861,810 | | | | 374,161 | | | | 52,262 | | |
Total liabilities | | $ | 359,633 | | | $ | 17,948,789 | | | $ | 15,726,119 | | | $ | 20,144,426 | | | $ | 521,003 | | |
Commitments and contingencies (Note 8) | | | | | | | | | | | |
Net assets | | $ | 128,321,501 | | | $ | 479,930,893 | | | $ | 2,191,752,670 | | | $ | 827,751,887 | | | $ | 19,284,582 | | |
Net Assets consist of: | |
Paid-in capital | | $ | 773,514,372 | | | $ | 1,537,264,212 | | | $ | 2,185,206,974 | | | $ | 755,884,279 | | | $ | 16,056,411 | | |
Undistributed net investment income (loss) | | | 1,461,998 | | | | 3,220,829 | | | | (8,222,370 | ) | | | (500,011 | ) | | | (20,239 | ) | |
Undistributed net realized gain (loss) | | | (612,832,569 | ) | | | (1,008,427,873 | ) | | | 40,444,725 | | | | (37,634,582 | ) | | | (438,222 | ) | |
Net unrealized appreciation (depreciation) of securities and
foreign currency transactions | | | (33,822,300 | ) | | | (52,126,275 | ) | | | (25,676,659 | ) | | | 110,002,201 | | | | 3,686,632 | | |
Net assets | | $ | 128,321,501 | | | $ | 479,930,893 | | | $ | 2,191,752,670 | | | $ | 827,751,887 | | | $ | 19,284,582 | | |
Calculation of Net Asset Value Per Share and
Public Offering Price Per Share — Class I | |
Net assets | | $ | 84,249,437 | | | $ | 298,111,515 | | | $ | 1,802,054,815 | | | $ | 704,505,581 | | | $ | 18,676,267 | | |
Shares outstanding (unlimited shares $0.001 par value authorized) | | | 5,196,965 | | | | 10,364,947 | | | | 48,309,644 | | | | 11,947,969 | | | | 1,597,524 | | |
Net asset value per share | | $ | 16.21 | | | $ | 28.76 | | | $ | 37.30 | | | $ | 58.96 | | | $ | 11.69 | | |
Calculation of Net Asset Value Per Share — Class A | |
Net assets | | $ | 41,110,154 | | | $ | 146,172,972 | | | $ | 313,538,886 | | | $ | 102,272,070 | | | $ | 608,315 | | |
Shares outstanding (unlimited shares $0.001 par value authorized) | | | 2,526,451 | | | | 5,108,084 | | | | 8,524,960 | | | | 1,743,562 | | | | 52,166 | | |
Net asset value per share | | $ | 16.27 | | | $ | 28.62 | | | $ | 36.78 | | | $ | 58.66 | | | $ | 11.66 | | |
Public Offering Price Per Share — Class A | |
(Net asset value per share divided by 0.9475) | | $ | 17.17 | | | $ | 30.21 | | | $ | 38.82 | | | $ | 61.91 | | | $ | 12.31 | | |
Calculation of Net Asset Value Per Share and
Public Offering Price Per Share — Class C | |
Net assets | | $ | 2,961,910 | | | $ | 20,454,300 | | | $ | 61,615,389 | | | $ | 20,974,236 | | | | | | |
Shares outstanding (unlimited shares $0.001 par value authorized) | | | 183,474 | | | | 728,241 | | | | 1,891,570 | | | | 423,219 | | | | | | |
Net asset value per share | | $ | 16.14 | | | $ | 28.09 | | | $ | 32.57 | | | $ | 49.56 | | | | | | |
Calculation of Net Asset Value Per Share and
Public Offering Price Per Share — Class R | |
Net assets | | | | | | $ | 15,192,106 | | | $ | 14,543,580 | | | | | | | | | | |
Shares outstanding (unlimited shares $0.001 par value authorized) | | | | | | | 528,221 | | | | 394,571 | | | | | | | | | | |
Net asset value per share | | | | | | $ | 28.76 | | | $ | 36.86 | | | | | | | | | | |
*Cost of long-term investments | |
Unaffiliated issuers | | $ | 162,061,843 | | | $ | 519,661,478 | | | $ | 2,059,072,906 | | | $ | 625,106,373 | | | $ | 15,563,198 | | |
Affiliated issuers | | | — | | | | — | | | | 128,899,539 | | | | 85,516,156 | | | | — | | |
*Cost of collateral for securities on loan | | | — | | | | — | | | | 6,304,168 | | | | 5,786,516 | | | | — | | |
*Cost of short-term investments | | | 182,134 | | | | 16,890,844 | | | | 26,879,536 | | | | 924,023 | | | | 509,524 | | |
The accompanying notes are an integral part of these financial statements.
54
Statements of Assets & Liabilities
DECEMBER 31, 2016 (UNAUDITED)
| | | Global Value
Fund | | International Value
Fund | | Value Opportunities
Fund | | Capital Income
Fund | | High Yield
Fund | |
Assets: | |
Long-term investments, at value* | | $ | 6,960,691 | | | $ | 2,024,901 | | | $ | 491,867,241 | | | $ | 34,905,470 | | | $ | 2,503,671,099 | | |
Short-term investments* | | | 81,813 | | | | 60,422 | | | | 45 | | | | 1,593,849 | | | | 49,751,831 | | |
Cash collateral for futures | | | — | | | | — | | | | 413,355 | | | | — | | | | — | | |
Dividends and interest receivable | | | 9,670 | | | | 4,729 | | | | 714,288 | | | | 279,095 | | | | 41,276,814 | | |
Receivable for investments sold | | | — | | | | — | | | | 3,066,980 | | | | — | | | | — | | |
Receivable from broker for credit default swap contracts | | | — | | | | — | | | | — | | | | — | | | | 1,171,160 | | |
Receivable for Fund shares sold | | | 3,608 | | | | — | | | | 10,444,819 | | | | 131,245 | | | | 7,341,233 | | |
Receivable from Advisor | | | 8,008 | | | | 6,746 | | | | — | | | | — | | | | — | | |
Other assets | | | 15,233 | | | | 842 | | | | 42,371 | | | | 7,209 | | | | 127,398 | | |
Total assets | | $ | 7,079,023 | | | $ | 2,097,640 | | | $ | 506,549,099 | | | $ | 36,916,868 | | | $ | 2,603,339,535 | | |
Liabilities: | |
Premiums received for credit default swap contracts | | $ | — | | | $ | — | | | $ | — | | | $ | — | | | $ | 509,469 | | |
Unrealized depreciation on credit default swap contracts | | | — | | | | — | | | | — | | | | — | | | | 289,548 | | |
Payable for investments purchased | | | — | | | | — | | | | — | | | | 787,607 | | | | 268,178 | | |
Payable for variation margin | | | — | | | | — | | | | 35,600 | | | | — | | | | — | | |
Payable for Fund shares repurchased | | | — | | | | — | | | | 888,574 | | | | 16,312 | | | | 3,884,930 | | |
Payable to Advisor | | | — | | | | — | | | | 313,574 | | | | 5,396 | | | | 1,113,351 | | |
Payable to Trustees | | | — | | | | — | | | | 200 | | | | 17 | | | | — | | |
Accrued distribution and service fees | | | 713 | | | | — | | | | 240,406 | | | | 8,941 | | | | 322,557 | | |
Distributions payable to shareholders | | | — | | | | — | | | | — | | | | 25,529 | | | | 3,305,259 | | |
Cash overdraft | | | — | | | | — | | | | 2,502,737 | | | | — | | | | — | | |
Accrued expenses and other liabilities | | | 53,723 | | | | 40,685 | | | | 204,300 | | | | 61,908 | | | | 665,997 | | |
Total liabilities | | $ | 54,436 | | | $ | 40,685 | | | $ | 4,185,391 | | | $ | 905,710 | | | $ | 10,359,289 | | |
Commitments and contingencies (Note 8) | | | | | | | | | | | |
Net assets | | $ | 7,024,587 | | | $ | 2,056,955 | | | $ | 502,363,708 | | | $ | 36,011,158 | | | $ | 2,592,980,246 | | |
Net Assets consist of: | |
Paid-in capital | | $ | 6,710,302 | | | $ | 1,927,168 | | | $ | 487,933,291 | | | $ | 37,981,226 | | | $ | 2,734,768,747 | | |
Undistributed net investment loss | | | (1,442 | ) | | | (5,016 | ) | | | (2,238,319 | ) | | | (28,034 | ) | | | (1,239,632 | ) | |
Undistributed net realized loss | | | (165,562 | ) | | | (2,201 | ) | | | (11,697,924 | ) | | | (3,819,331 | ) | | | (89,067,840 | ) | |
Net unrealized appreciation (depreciation) of: | |
Securities and foreign currency transactions | | | 481,289 | | | | 137,004 | | | | 27,932,509 | | | | 1,877,297 | | | | (51,191,481 | ) | |
Credit default swap contracts | | | — | | | | — | | | | — | | | | — | | | | (289,548 | ) | |
Futures contracts | | | — | | | | — | | | | 434,151 | | | | — | | | | — | | |
Net assets | | $ | 7,024,587 | | | $ | 2,056,955 | | | $ | 502,363,708 | | | $ | 36,011,158 | | | $ | 2,592,980,246 | | |
Calculation of Net Asset Value Per Share and
Public Offering Price Per Share — Class I | |
Net assets | | $ | 6,811,608 | | | $ | 2,056,955 | | | $ | 308,636,139 | | | $ | 15,017,107 | | | $ | 2,053,305,968 | | |
Shares outstanding (unlimited shares $0.001 par value authorized) | | | 574,585 | | | | 192,205 | | | | 11,564,153 | | | | 1,252,941 | | | | 170,999,122 | | |
Net asset value per share | | $ | 11.85 | | | $ | 10.70 | | | $ | 26.69 | | | $ | 11.99 | | | $ | 12.01 | | |
Calculation of Net Asset Value Per Share — Class A | |
Net assets | | $ | 212,979 | | | | | | | $ | 132,513,388 | | | $ | 20,994,051 | | | $ | 536,354,712 | | |
Shares outstanding (unlimited shares $0.001 par value authorized) | | | 17,976 | | | | | | | | 4,956,495 | | | | 1,686,058 | | | | 44,950,667 | | |
Net asset value per share | | $ | 11.85 | | | | | | | $ | 26.74 | | | $ | 12.45 | | | $ | 11.93 | | |
Public Offering Price Per Share — Class A | |
(Net asset value per share divided by 0.9475) | | $ | 12.51 | | | | | | | $ | 28.22 | | | | | | | | | | |
(Net asset value per share divided by 0.9525) | | | | | | | | | | | | | | $ | 13.07 | | | | | | |
(Net asset value per share divided by 0.9625) | | | | | | | | | | | | | | | | $ | 12.39 | | |
Calculation of Net Asset Value Per Share and
Public Offering Price Per Share — Class C | |
Net assets | | | | | | | | | | $ | 61,214,181 | | | | | | | $ | 3,319,566 | | |
Shares outstanding (unlimited shares $0.001 par value authorized) | | | | | | | | | | | 2,453,152 | | | | | | | | 276,404 | | |
Net asset value per share | | | | | | | | | | $ | 24.95 | | | | | | | $ | 12.01 | | |
*Cost of long-term investments | | $ | 6,479,233 | | | $ | 1,887,771 | | | $ | 463,927,681 | | | $ | 33,028,079 | | | $ | 2,554,862,580 | | |
*Cost of short-term investments | | | 81,813 | | | | 60,422 | | | | 47 | | | | 1,593,849 | | | | 49,751,831 | | |
The accompanying notes are an integral part of these financial statements.
55
Statements of Operations
FOR THE SIX MONTHS ENDED DECEMBER 31, 2016 (UNAUDITED)
| | | Diversified Value
Fund | | Large Cap Value
Fund | | Mid-Cap Value
Fund | | Small Cap Value
Fund | | Small Cap
Diversified Value
Fund | |
Investment income: | |
Dividends* | |
Unaffiliated issuers | | $ | 2,617,368 | | | $ | 5,977,346 | | | $ | 12,835,935 | | | $ | 5,161,843 | | | $ | 165,448 | | |
Affiliated issuers | | | — | | | | — | | | | — | | | | 215,322 | | | | — | | |
Interest | | | 1,385 | | | | 4,445 | | | | 11,887 | | | | 1,969 | | | | 203 | | |
Securities on loan, net | | | 7,244 | | | | 16,811 | | | | 15,339 | | | | 31,535 | | | | — | | |
Total income | | | 2,625,997 | | | | 5,998,602 | | | | 12,863,161 | | | | 5,410,669 | | | | 165,651 | | |
Expenses: | |
Advisory fees | | | 867,243 | | | | 1,814,876 | | | | 7,835,264 | | | | 3,075,018 | | | | 54,297 | | |
Professional fees and expenses | | | 21,318 | | | | 23,709 | | | | 55,351 | | | | 38,823 | | | | 13,356 | | |
Custodian fees and expenses | | | 18,142 | | | | 23,576 | | | | 95,153 | | | | 18,874 | | | | 2,722 | | |
Transfer agent fees and expenses | | | 254,569 | | | | 386,356 | | | | 2,065,682 | | | | 764,543 | | | | 11,738 | | |
Accounting fees and expenses | | | 16,516 | | | | 30,223 | | | | 119,541 | | | | 49,173 | | | | 33,421 | | |
Administration fees and expenses | | | 35,140 | | | | 73,208 | | | | 314,786 | | | | 123,907 | | | | 17,675 | | |
Trustees' fees and expenses | | | 16,414 | | | | 20,409 | | | | 86,737 | | | | 33,642 | | | | 624 | | |
Reports to shareholders | | | 21,901 | | | | 36,308 | | | | 129,449 | | | | 65,930 | | | | 829 | | |
Registration fees | | | 30,543 | | | | 34,195 | | | | 44,193 | | | | 58,550 | | | | 17,979 | | |
Distribution and service fees — Class A | | | 50,169 | | | | 180,245 | | | | 395,946 | | | | 131,822 | | | | 359 | | |
Distribution and service fees — Class C | | | 15,322 | | | | 102,910 | | | | 307,442 | | | | 102,073 | | | | — | | |
Distribution and service fees — Class R | | | — | | | | 34,653 | | | | 31,601 | | | | — | | | | — | | |
Other expenses | | | 13,562 | | | | 17,104 | | | | 63,031 | | | | 27,040 | | | | 2,210 | | |
Total expenses | | | 1,360,839 | | | | 2,777,772 | | | | 11,544,176 | | | | 4,489,395 | | | | 155,210 | | |
Fee waiver/expense reimbursement by Advisor (Note 2) | | | (196,840 | ) | | | — | | | | — | | | | — | | | | (79,670 | ) | |
Net expenses | | | 1,163,999 | | | | 2,777,772 | | | | 11,544,176 | | | | 4,489,395 | | | | 75,540 | | |
Net investment income | | | 1,461,998 | | | | 3,220,830 | | | | 1,318,985 | | | | 921,274 | | | | 90,111 | | |
Realized and Unrealized Gains (Losses): | |
Net realized gains (losses) from: | |
Sales of unaffiliated issuers | | | (23,787,785 | ) | | | 5,799,020 | | | | 83,210,229 | | | | 39,561,911 | | | | 199,143 | | |
Sales of affiliated issuers | | | — | | | | — | | | | (16,978,536 | ) | | | (1,733,285 | ) | | | — | | |
Foreign currency transactions | | | — | | | | — | | | | (36,506 | ) | | | 562 | | | | 6 | | |
Net realized gains (losses) | | | (23,787,785 | ) | | | 5,799,020 | | | | 66,195,187 | | | | 37,829,188 | | | | 199,149 | | |
Net change in unrealized appreciation of securities and
foreign currency transactions | | | 57,537,551 | | | | 65,509,985 | | | | 378,626,825 | | | | 157,400,417 | | | | 3,996,092 | | |
Net gains | | | 33,749,766 | | | | 71,309,005 | | | | 444,822,012 | | | | 195,229,605 | | | | 4,195,241 | | |
Net Increase in Net Assets Resulting from
Operations | | $ | 35,211,764 | | | $ | 74,529,835 | | | $ | 446,140,997 | | | $ | 196,150,879 | | | $ | 4,285,352 | | |
*Net of Foreign Taxes Withheld | | $ | 29,882 | | | $ | 65,672 | | | $ | 99,634 | | | $ | 69,526 | | | $ | 340 | | |
The accompanying notes are an integral part of these financial statements.
56
Statements of Operations
FOR THE SIX MONTHS ENDED DECEMBER 31, 2016 (UNAUDITED)
| | | Global Value
Fund | | International Value
Fund | | Value
Opportunities
Fund | | Capital Income
Fund | | High Yield
Fund | |
Investment income: | |
Dividends* | | $ | 40,568 | | | $ | 9,931 | | | $ | 2,761,106 | | | $ | 180,533 | | | $ | 2,150,917 | | |
Interest | | | 94 | | | | 31 | | | | 2,345,123 | | | | 628,356 | | | | 90,076,656 | | |
Securities on loan, net | | | — | | | | — | | | | 2,203 | | | | — | | | | — | | |
Total income | | | 40,662 | | | | 9,962 | | | | 5,108,432 | | | | 808,889 | | | | 92,227,573 | | |
Expenses: | |
Advisory fees | | | 23,805 | | | | 8,273 | | | | 1,755,581 | | | | 113,095 | | | | 7,174,586 | | |
Professional fees and expenses | | | 12,836 | | | | 11,716 | | | | 21,289 | | | | 13,363 | | | | 64,481 | | |
Custodian fees and expenses | | | 9,164 | | | | 8,165 | | | | 36,919 | | | | 13,190 | | | | 36,372 | | |
Transfer agent fees and expenses | | | 13,341 | | | | 1,803 | | | | 332,796 | | | | 24,675 | | | | 1,450,602 | | |
Accounting fees and expenses | | | 25,857 | | | | 21,538 | | | | 31,224 | | | | 34,113 | | | | 162,534 | | |
Administration fees and expenses | | | 15,857 | | | | 15,154 | | | | 70,916 | | | | 14,766 | | | | 392,880 | | |
Trustees' fees and expenses | | | 230 | | | | 77 | | | | 19,314 | | | | 1,494 | | | | 102,344 | | |
Reports to shareholders | | | 809 | | | | 707 | | | | 17,404 | | | | 2,189 | | | | 54,358 | | |
Registration fees | | | 17,124 | | | | 3,201 | | | | 40,619 | | | | 17,252 | | | | 54,412 | | |
Distribution and service fees — Class A | | | 167 | | | | — | | | | 162,667 | | | | 22,920 | | | | 736,794 | | |
Distribution and service fees — Class C | | | — | | | | — | | | | 308,911 | | | | — | | | | 14,916 | | |
Other expenses | | | 1,906 | | | | 1,478 | | | | 16,541 | | | | 2,645 | | | | 67,737 | | |
Total expenses | | | 121,096 | | | | 72,112 | | | | 2,814,181 | | | | 259,702 | | | | 10,312,016 | | |
Fee waiver/expense reimbursement by Advisor (Note 2) | | | (88,197 | ) | | | (50,419 | ) | | | — | | | | (97,588 | ) | | | (429,015 | ) | |
Fee waiver by Administrator (Note 2) | | | — | | | | (10,500 | ) | | | — | | | | — | | | | — | | |
Net expenses | | | 32,899 | | | | 11,193 | | | | 2,814,181 | | | | 162,114 | | | | 9,883,001 | | |
Net investment income (loss) | | | 7,763 | | | | (1,231 | ) | | | 2,294,251 | | | | 646,775 | | | | 82,344,572 | | |
Realized and Unrealized Gains (Losses): | |
Net realized gains (losses) from: | |
Sales of unaffiliated issuers | | | 96,224 | | | | 24,470 | | | | 2,260,242 | | | | (301,205 | ) | | | (29,501,122 | ) | |
Foreign currency transactions | | | (997 | ) | | | (625 | ) | | | (35,312 | ) | | | (779 | ) | | | — | | |
Credit default swap contracts | | | — | | | | — | | | | — | | | | — | | | | 125,098 | | |
Futures contracts | | | — | | | | — | | | | 1,481,345 | | | | — | | | | — | | |
Net realized gains (losses) | | | 95,227 | | | | 23,845 | | | | 3,706,275 | | | | (301,984 | ) | | | (29,376,024 | ) | |
Net change in unrealized appreciation (depreciation) of: | |
Securities and foreign currency transactions | | | 898,688 | | | | 228,421 | | | | 90,063,871 | | | | 4,802,115 | | | | 146,602,839 | | |
Credit default swap contracts | | | — | | | | — | | | | — | | | | — | | | | (520,399 | ) | |
Futures contracts | | | — | | | | — | | | | (905,662 | ) | | | — | | | | — | | |
Net change in unrealized appreciation | | | 898,688 | | | | 228,421 | | | | 89,158,209 | | | | 4,802,115 | | | | 146,082,440 | | |
Net gains | | | 993,915 | | | | 252,266 | | | | 92,864,484 | | | | 4,500,131 | | | | 116,706,416 | | |
Net Increase in Net Assets Resulting from
Operations | | $ | 1,001,678 | | | $ | 251,035 | | | $ | 95,158,735 | | | $ | 5,146,906 | | | $ | 199,050,988 | | |
*Net of Foreign Taxes Withheld | | $ | 746 | | | $ | 409 | | | $ | 33,005 | | | $ | 2,982 | | | $ | — | | |
The accompanying notes are an integral part of these financial statements.
57
Statements of Changes in Net Assets
| | | Diversified Value Fund | | Large Cap Value Fund | |
| | | Six months ended
December 31, 2016
(unaudited) | | Year ended
June 30, 2016 | | Six months ended
December 31, 2016
(unaudited) | | Year ended
June 30, 2016 | |
Operations: | |
Net investment income | | $ | 1,461,998 | | | $ | 6,840,691 | | | $ | 3,220,830 | | | $ | 8,826,123 | | |
Net realized gains (losses) | | | (23,787,785 | ) | | | 44,616,742 | | | | 5,799,020 | | | | 43,925,032 | | |
Net change in unrealized appreciation (depreciation) | | | 57,537,551 | | | | (97,729,229 | ) | | | 65,509,985 | | | | (103,150,578 | ) | |
Net increase (decrease) in net assets resulting from operations | | | 35,211,764 | | | | (46,271,796 | ) | | | 74,529,835 | | | | (50,399,423 | ) | |
Dividends and Distributions to Shareholders: | |
Net investment income: | |
Class I | | | (4,250,963 | ) | | | (6,169,631 | ) | | | (6,008,031 | ) | | | (6,843,779 | ) | |
Class A | | | (2,029,291 | ) | | | (475,579 | ) | | | (2,463,915 | ) | | | (1,999,075 | ) | |
Class C | | | (130,512 | ) | | | (8,797 | ) | | | (130,596 | ) | | | (90,520 | ) | |
Class R | | | — | | | | — | | | | (223,583 | ) | | | (131,889 | ) | |
Net realized gains: | |
Class I | | | — | | | | — | | | | — | | | | — | | |
Class A | | | — | | | | — | | | | — | | | | — | | |
Class C | | | — | | | | — | | | | — | | | | — | | |
Class R | | | — | | | | — | | | | — | | | | — | | |
Net decrease in net assets resulting from dividends and
distributions to shareholders | | | (6,410,766 | ) | | | (6,654,007 | ) | | | (8,826,125 | ) | | | (9,065,263 | ) | |
Capital Share Transactions (Note 5): | |
Net decrease in net assets resulting from capital share transactions | | | (284,385,698 | ) | | | (102,154,276 | ) | | | (68,046,412 | ) | | | (183,143,627 | ) | |
Net Assets: | |
Total decrease in net assets | | | (255,584,700 | ) | | | (155,080,079 | ) | | | (2,342,702 | ) | | | (242,608,313 | ) | |
Beginning of period | | | 383,906,201 | | | | 538,986,280 | | | | 482,273,595 | | | | 724,881,908 | | |
End of period | | $ | 128,321,501 | | | $ | 383,906,201 | | | $ | 479,930,893 | | | $ | 482,273,595 | | |
Undistributed net investment income | | $ | 1,461,998 | | | $ | 6,410,766 | | | $ | 3,220,829 | | | $ | 8,826,124 | | |
. | |
The accompanying notes are an integral part of these financial statements.
58
Statements of Changes in Net Assets
| | | Mid-Cap Value Fund | | Small Cap Value Fund | |
| | | Six months ended
December 31, 2016
(unaudited) | | Year ended
June 30, 2016 | | Six months ended
December 31, 2016
(unaudited) | | Year ended
June 30, 2016 | |
Operations: | |
Net investment income | | $ | 1,318,985 | | | $ | 16,657,049 | | | $ | 921,274 | | | $ | 2,461,172 | | |
Net realized gains (losses) | | | 66,195,187 | | | | 98,685,655 | | | | 37,829,188 | | | | (36,500,999 | ) | |
Net change in unrealized appreciation (depreciation) | | | 378,626,825 | | | | (518,722,360 | ) | | | 157,400,417 | | | | (157,245,043 | ) | |
Net increase (decrease) in net assets resulting from operations | | | 446,140,997 | | | | (403,379,656 | ) | | | 196,150,879 | | | | (191,284,870 | ) | |
Dividends and Distributions to Shareholders: | |
Net investment income: | |
Class I | | | (5,491,081 | ) | | | (8,441,105 | ) | | | (2,949,850 | ) | | | (2,304,482 | ) | |
Class A | | | (590,653 | ) | | | (458,979 | ) | | | — | | | | (172,473 | ) | |
Class C | | | — | | | | — | | | | — | | | | — | | |
Class R | | | (13,844 | ) | | | — | | | | — | | | | — | | |
Net realized gains: | |
Class I | | | (21,970,175 | ) | | | (241,166,879 | ) | | | — | | | | (83,903,099 | ) | |
Class A | | | (3,941,402 | ) | | | (53,451,452 | ) | | | — | | | | (16,251,914 | ) | |
Class C | | | (865,957 | ) | | | (14,053,381 | ) | | | — | | | | (3,320,258 | ) | |
Class R | | | (181,505 | ) | | | (1,893,363 | ) | | | — | | | | — | | |
Net decrease in net assets resulting from dividends and
distributions to shareholders | | | (33,054,617 | ) | | | (319,465,159 | ) | | | (2,949,850 | ) | | | (105,952,226 | ) | |
Capital Share Transactions (Note 5): | |
Net decrease in net assets resulting from capital share transactions | | | (278,874,892 | ) | | | (486,019,507 | ) | | | (198,511,150 | ) | | | (51,371,484 | ) | |
Net Assets: | |
Total increase (decrease) in net assets | | | 134,211,488 | | | | (1,208,864,322 | ) | | | (5,310,121 | ) | | | (348,608,580 | ) | |
Beginning of period | | | 2,057,541,182 | | | | 3,266,405,504 | | | | 833,062,008 | | | | 1,181,670,588 | | |
End of period | | $ | 2,191,752,670 | | | $ | 2,057,541,182 | | | $ | 827,751,887 | | | $ | 833,062,008 | | |
Undistributed net investment income (loss) | | $ | (8,222,370 | ) | | $ | (3,445,777 | ) | | $ | (500,011 | ) | | $ | 1,528,565 | | |
The accompanying notes are an integral part of these financial statements.
59
Statements of Changes in Net Assets
| | | Small Cap Diversified Value Fund | | Global Value Fund | |
| | | Six months ended
December 31, 2016
(unaudited) | | Year ended
June 30, 2016 | | Six months ended
December 31, 2016
(unaudited) | | Year ended
June 30, 2016 | |
Operations: | |
Net investment income | | $ | 90,111 | | | $ | 102,091 | | | $ | 7,763 | | | $ | 70,240 | | |
Net realized gains (losses) | | | 199,149 | | | | (847,614 | ) | | | 95,227 | | | | (156,568 | ) | |
Net change in unrealized appreciation (depreciation) | | | 3,996,092 | | | | (174,138 | ) | | | 898,688 | | | | (481,740 | ) | |
Net increase (decrease) in net assets resulting from operations | | | 4,285,352 | | | | (919,661 | ) | | | 1,001,678 | | | | (568,068 | ) | |
Dividends and Distributions to Shareholders: | |
Net investment income: | |
Class I | | | (145,133 | ) | | | (66,248 | ) | | | (54,261 | ) | | | (57,419 | ) | |
Class A | | | (1,679 | ) | | | (1,275 | ) | | | (1,332 | ) | | | (769 | ) | |
Net realized gains: | |
Class I | | | — | | | | (383,431 | ) | | | — | | | | (298,490 | ) | |
Class A | | | — | | | | (10,065 | ) | | | — | | | | (5,594 | ) | |
Net decrease in net assets resulting from dividends and
distributions to shareholders | | | (146,812 | ) | | | (461,019 | ) | | | (55,593 | ) | | | (362,272 | ) | |
Capital Share Transactions (Note 5): | |
Net increase (decrease) in net assets resulting from capital share transactions | | | 467,923 | | | | 591,725 | | | | 779,836 | | | | (24,916 | ) | |
Net Assets: | |
Total increase (decrease) in net assets | | | 4,606,463 | | | | (788,955 | ) | | | 1,725,921 | | | | (955,256 | ) | |
Beginning of period | | | 14,678,119 | | | | 15,467,074 | | | | 5,298,666 | | | | 6,253,922 | | |
End of period | | $ | 19,284,582 | | | $ | 14,678,119 | | | $ | 7,024,587 | | | $ | 5,298,666 | | |
Undistributed net investment income (loss) | | $ | (20,239 | ) | | $ | 36,462 | | | $ | (1,442 | ) | | $ | 46,388 | | |
The accompanying notes are an integral part of these financial statements.
60
Statements of Changes in Net Assets
| | | International Value Fund | | Value Opportunities Fund | |
| | | Six months ended
December 31, 2016
(unaudited) | | Period ended
June 30, 2016+ | | Six months ended
December 31, 2016
(unaudited) | | Year ended
June 30, 2016 | |
Operations: | |
Net investment income (loss) | | $ | (1,231 | ) | | $ | 28,698 | | | $ | 2,294,251 | | | $ | 14,420,305 | | |
Net realized gains (losses) | | | 23,845 | | | | 18,639 | | | | 3,706,275 | | | | (15,580,571 | ) | |
Net change in unrealized appreciation (depreciation) | | | 228,421 | | | | (91,417 | ) | | | 89,158,209 | | | | (66,041,108 | ) | |
Net increase (decrease) in net assets resulting from operations | | | 251,035 | | | | (44,080 | ) | | | 95,158,735 | | | | (67,201,374 | ) | |
Dividends and Distributions to Shareholders: | |
Net investment income: | |
Class I | | | (32,331 | ) | | | — | | | | (6,518,819 | ) | | | (5,431,109 | ) | |
Class A | | | — | | | | — | | | | (2,482,498 | ) | | | (2,859,531 | ) | |
Class C | | | — | | | | — | | | | (798,800 | ) | | | (725,496 | ) | |
Net realized gains: | |
Class I | | | (44,837 | ) | | | — | | | | — | | | | (38,107,828 | ) | |
Class A | | | — | | | | — | | | | — | | | | (23,383,446 | ) | |
Class C | | | — | | | | — | | | | — | | | | (10,200,196 | ) | |
Net decrease in net assets resulting from dividends and
distributions to shareholders | | | (77,168 | ) | | | — | | | | (9,800,117 | ) | | | (80,707,606 | ) | |
Capital Share Transactions (Note 5): | |
Net increase (decrease) in net assets resulting from
capital share transactions | | | 77,168 | | | | 1,850,000 | | | | (38,923,276 | ) | | | (37,649,901 | ) | |
Net Assets: | |
Total increase (decrease) in net assets | | | 251,035 | | | | 1,805,920 | | | | 46,435,342 | | | | (185,558,881 | ) | |
Beginning of period | | | 1,805,920 | | | | — | | | | 455,928,366 | | | | 641,487,247 | | |
End of period | | $ | 2,056,955 | | | $ | 1,805,920 | | | $ | 502,363,708 | | | $ | 455,928,366 | | |
Undistributed net investment income (loss) | | $ | (5,016 | ) | | $ | 28,546 | | | $ | (2,238,319 | ) | | $ | 5,267,547 | | |
+ The Fund commenced operations on December 31, 2015.
The accompanying notes are an integral part of these financial statements.
61
Statements of Changes in Net Assets
| | | Capital Income Fund | | High Yield Fund | |
| | | Six months ended
December 31, 2016
(unaudited) | | Year ended
June 30, 2016 | | Six months ended
December 31, 2016
(unaudited) | | Year ended
June 30, 2016 | |
Operations: | |
Net investment income | | $ | 646,775 | | | $ | 2,228,024 | | | $ | 82,344,572 | | | $ | 157,313,326 | | |
Net realized losses | | | (301,984 | ) | | | (2,154,092 | ) | | | (29,376,024 | ) | | | (58,478,698 | ) | |
Net change in unrealized appreciation (depreciation) | | | 4,802,115 | | | | (4,225,701 | ) | | | 146,082,440 | | | | (136,964,567 | ) | |
Net increase (decrease) in net assets resulting from operations | | | 5,146,906 | | | | (4,151,769 | ) | | | 199,050,988 | | | | (38,129,939 | ) | |
Dividends and Distributions to Shareholders: | |
Net investment income: | |
Class I | | | (379,751 | ) | | | (1,256,258 | ) | | | (64,971,702 | ) | | | (120,335,062 | ) | |
Class A | | | (393,267 | ) | | | (1,033,766 | ) | | | (18,247,319 | ) | | | (38,822,614 | ) | |
Class C | | | — | | | | — | | | | (81,025 | ) | | | (169,890 | ) | |
Net realized gains: | |
Class I | | | — | | | | (1,031,274 | ) | | | — | | | | (14,726,301 | ) | |
Class A | | | — | | | | (941,388 | ) | | | — | | | | (4,896,486 | ) | |
Class C | | | — | | | | — | | | | — | | | | (24,422 | ) | |
Net decrease in net assets resulting from dividends and
distributions to shareholders | | | (773,018 | ) | | | (4,262,686 | ) | | | (83,300,046 | ) | | | (178,974,775 | ) | |
Capital Share Transactions (Note 5): | |
Net decrease in net assets resulting from capital share transactions | | | (6,544,830 | ) | | | (29,759,548 | ) | | | (13,201,682 | ) | | | (38,677,984 | ) | |
Net Assets: | |
Total increase (decrease) in net assets | | | (2,170,942 | ) | | | (38,174,003 | ) | | | 102,549,260 | | | | (255,782,698 | ) | |
Beginning of period | | | 38,182,100 | | | | 76,356,103 | | | | 2,490,430,986 | | | | 2,746,213,684 | | |
End of period | | $ | 36,011,158 | | | $ | 38,182,100 | | | $ | 2,592,980,246 | | | $ | 2,490,430,986 | | |
Undistributed net investment income (loss) | | $ | (28,034 | ) | | $ | 98,209 | | | $ | (1,239,632 | ) | | $ | (284,158 | ) | |
The accompanying notes are an integral part of these financial statements.
62
Financial Highlights
The following per share data and ratios have been derived from information provided in the financial statements.
| | | | | Income (loss) from investment operations | | Dividends and distributions | |
Diversified Value Fund | | Net asset
value,
beginning
of period | | Net
investment
income1 | | Net gains
(losses) on
securities
(both
realized and
unrealized) | | Total from
investment
operations | | Dividends
(from net
investment
income) | | Distributions
(from
capital
gains) | | Total
distributions | |
Class I | |
Six months ended
12/31/2016* | | $ | 14.31 | | | $ | 0.10 | | | $ | 2.64 | | | $ | 2.74 | | | $ | (0.84 | ) | | $ | — | | | $ | (0.84 | ) | |
Year ended 6/30/2016 | | | 15.89 | | | | 0.22 | | | | (1.59 | ) | | | (1.37 | ) | | | (0.21 | ) | | | — | | | | (0.21 | ) | |
Year ended 6/30/2015 | | | 15.47 | | | | 0.19 | | | | 0.61 | | | | 0.80 | | | | (0.38 | ) | | | — | | | | (0.38 | ) | |
Year ended 6/30/2014 | | | 12.53 | | | | 0.38 | | | | 2.73 | | | | 3.11 | | | | (0.17 | ) | | | — | | | | (0.17 | ) | |
Year ended 6/30/2013 | | | 9.82 | | | | 0.16 | | | | 2.72 | | | | 2.88 | | | | (0.17 | ) | | | — | | | | (0.17 | ) | |
Year ended 6/30/2012 | | | 10.01 | | | | 0.16 | | | | (0.18 | ) | | | (0.02 | ) | | | (0.17 | ) | | | — | | | | (0.17 | ) | |
Class A | |
Six months ended
12/31/2016* | | | 14.36 | | | | 0.10 | | | | 2.63 | | | | 2.73 | | | | (0.82 | ) | | | — | | | | (0.82 | ) | |
Year ended 6/30/2016 | | | 15.92 | | | | 0.18 | | | | (1.59 | ) | | | (1.41 | ) | | | (0.15 | ) | | | — | | | | (0.15 | ) | |
Year ended 6/30/2015 | | | 15.50 | | | | 0.14 | | | | 0.63 | | | | 0.77 | | | | (0.35 | ) | | | — | | | | (0.35 | ) | |
Year ended 6/30/2014 | | | 12.57 | | | | 0.38 | | | | 2.70 | | | | 3.08 | | | | (0.15 | ) | | | — | | | | (0.15 | ) | |
Year ended 6/30/2013 | | | 9.86 | | | | 0.13 | | | | 2.72 | | | | 2.85 | | | | (0.14 | ) | | | — | | | | (0.14 | ) | |
Year ended 6/30/2012 | | | 10.03 | | | | 0.14 | | | | (0.18 | ) | | | (0.04 | ) | | | (0.13 | ) | | | — | | | | (0.13 | ) | |
Class C | |
Six months ended
12/31/2016* | | | 14.23 | | | | 0.03 | | | | 2.61 | | | | 2.64 | | | | (0.73 | ) | | | — | | | | (0.73 | ) | |
Year ended 6/30/2016 | | | 15.76 | | | | 0.07 | | | | (1.57 | ) | | | (1.50 | ) | | | (0.03 | ) | | | — | | | | (0.03 | ) | |
Year ended 6/30/2015 | | | 15.20 | | | | 0.03 | | | | 0.62 | | | | 0.65 | | | | (0.09 | ) | | | — | | | | (0.09 | ) | |
Year ended 6/30/2014 | | | 12.35 | | | | 0.17 | | | | 2.75 | | | | 2.92 | | | | (0.07 | ) | | | — | | | | (0.07 | ) | |
Year ended 6/30/2013 | | | 9.72 | | | | 0.05 | | | | 2.68 | | | | 2.73 | | | | (0.10 | ) | | | — | | | | (0.10 | ) | |
Year ended 6/30/2012 | | | 9.92 | | | | 0.07 | | | | (0.17 | ) | | | (0.10 | ) | | | (0.10 | ) | | | — | | | | (0.10 | ) | |
| | | | | Ratios to Average Net Assets | |
Diversified Value Fund | | Net asset
value, end
of period | | Total
return2 | | Net assets,
end of
period (in
thousands) | | Expenses,
net of
reimbursement/
waiver | | Expenses,
before
reimbursement/
waiver | | Net
investment
income | |
Class I | |
Six months ended
12/31/2016* | | $ | 16.21 | | | | 19.02 | % | | $ | 84,249 | | | | 0.95 | %3 | | | 1.10 | %3 | | | 1.28 | %3 | |
Year ended 6/30/2016 | | | 14.31 | | | | –8.59 | | | | 342,046 | | | | 0.95 | | | | 1.03 | | | | 1.52 | | |
Year ended 6/30/2015 | | | 15.89 | | | | 5.30 | | | | 481,815 | | | | 0.95 | | | | 0.99 | | | | 1.18 | | |
Year ended 6/30/2014 | | | 15.47 | | | | 24.98 | | | | 485,541 | | | | 0.95 | | | | 1.01 | | | | 2.72 | | |
Year ended 6/30/2013 | | | 12.53 | | | | 29.65 | | | | 367,963 | | | | 0.95 | | | | 1.06 | | | | 1.47 | | |
Year ended 6/30/2012 | | | 9.82 | | | | –0.01 | | | | 320,916 | | | | 0.95 | | | | 1.06 | | | | 1.73 | | |
Class A | |
Six months ended
12/31/2016* | | | 16.27 | | | | 18.87 | | | | 41,110 | | | | 1.203 | | | | 1.463 | | | | 1.233 | | |
Year ended 6/30/2016 | | | 14.36 | | | | –8.83 | | | | 38,527 | | | | 1.20 | | | | 1.28 | | | | 1.25 | | |
Year ended 6/30/2015 | | | 15.92 | | | | 5.07 | | | | 52,752 | | | | 1.20 | | | | 1.24 | | | | 0.92 | | |
Year ended 6/30/2014 | | | 15.50 | | | | 24.68 | | | | 59,173 | | | | 1.20 | | | | 1.26 | | | | 2.71 | | |
Year ended 6/30/2013 | | | 12.57 | | | | 29.25 | | | | 35,251 | | | | 1.20 | | | | 1.31 | | | | 1.21 | | |
Year ended 6/30/2012 | | | 9.86 | | | | –0.18 | | | | 34,731 | | | | 1.20 | | | | 1.31 | | | | 1.46 | | |
Class C | |
Six months ended
12/31/2016* | | | 16.14 | | | | 18.42 | | | | 2,962 | | | | 1.953 | | | | 2.213 | | | | 0.443 | | |
Year ended 6/30/2016 | | | 14.23 | | | | –9.51 | | | | 3,334 | | | | 1.95 | | | | 2.03 | | | | 0.51 | | |
Year ended 6/30/2015 | | | 15.76 | | | | 4.27 | | | | 4,419 | | | | 1.95 | | | | 1.99 | | | | 0.17 | | |
Year ended 6/30/2014 | | | 15.20 | | | | 23.70 | | | | 4,429 | | | | 1.95 | | | | 2.01 | | | | 1.28 | | |
Year ended 6/30/2013 | | | 12.35 | | | | 28.28 | | | | 11,815 | | | | 1.95 | | | | 2.06 | | | | 0.45 | | |
Year ended 6/30/2012 | | | 9.72 | | | | –0.92 | | | | 12,062 | | | | 1.95 | | | | 2.06 | | | | 0.73 | | |
| | | Six Months Ended | | Year Ended June 30, | |
| | | December 31, 2016* | | 2016 | | 2015 | | 2014 | | 2013 | | 2012 | |
Portfolio turnover rate | | | 12 | % | | | 35 | % | | | 38 | % | | | 33 | % | | | 44 | % | | | 42 | % | |
| | | | | Income (loss) from investment operations | | Dividends and distributions | |
Large Cap Value Fund | | Net asset
value,
beginning
of period | | Net
investment
income1 | | Net gains
(losses) on
securities
(both
realized and
unrealized) | | Total from
investment
operations | | Dividends
(from net
investment
income) | | Distributions
(from
capital
gains) | | Total
distributions | |
Class I | |
Six months ended
12/31/2016* | | $ | 25.06 | | | $ | 0.20 | | | $ | 4.06 | | | $ | 4.26 | | | $ | (0.56 | ) | | $ | — | | | $ | (0.56 | ) | |
Year ended 6/30/2016 | | | 27.21 | | | | 0.39 | | | | (2.15 | ) | | | (1.76 | ) | | | (0.39 | ) | | | — | | | | (0.39 | ) | |
Year ended 6/30/2015 | | | 26.65 | | | | 0.35 | | | | 0.99 | | | | 1.34 | | | | (0.78 | ) | | | — | | | | (0.78 | ) | |
Year ended 6/30/2014 | | | 21.35 | | | | 0.73 | | | | 4.88 | | | | 5.61 | | | | (0.31 | ) | | | — | | | | (0.31 | ) | |
Year ended 6/30/2013 | | | 16.80 | | | | 0.31 | | | | 4.69 | | | | 5.00 | | | | (0.45 | ) | | | — | | | | (0.45 | ) | |
Year ended 6/30/2012 | | | 16.96 | | | | 0.31 | | | | (0.13 | ) | | | 0.18 | | | | (0.34 | ) | | | — | | | | (0.34 | ) | |
Class A | |
Six months ended
12/31/2016* | | | 24.91 | | | | 0.16 | | | | 4.03 | | | | 4.19 | | | | (0.48 | ) | | | — | | | | (0.48 | ) | |
Year ended 6/30/2016 | | | 27.02 | | | | 0.33 | | | | (2.13 | ) | | | (1.80 | ) | | | (0.31 | ) | | | — | | | | (0.31 | ) | |
Year ended 6/30/2015 | | | 26.46 | | | | 0.27 | | | | 0.99 | | | | 1.26 | | | | (0.70 | ) | | | — | | | | (0.70 | ) | |
Year ended 6/30/2014 | | | 21.21 | | | | 0.73 | | | | 4.79 | | | | 5.52 | | | | (0.27 | ) | | | — | | | | (0.27 | ) | |
Year ended 6/30/2013 | | | 16.68 | | | | 0.26 | | | | 4.67 | | | | 4.93 | | | | (0.40 | ) | | | — | | | | (0.40 | ) | |
Year ended 6/30/2012 | | | 16.84 | | | | 0.26 | | | | (0.12 | ) | | | 0.14 | | | | (0.30 | ) | | | — | | | | (0.30 | ) | |
Class C | |
Six months ended
12/31/2016* | | | 24.29 | | | | 0.06 | | | | 3.91 | | | | 3.97 | | | | (0.17 | ) | | | — | | | | (0.17 | ) | |
Year ended 6/30/2016 | | | 26.30 | | | | 0.13 | | | | (2.06 | ) | | | (1.93 | ) | | | (0.08 | ) | | | — | | | | (0.08 | ) | |
Year ended 6/30/2015 | | | 25.96 | | | | 0.09 | | | | 0.94 | | | | 1.03 | | | | (0.69 | ) | | | — | | | | (0.69 | ) | |
Year ended 6/30/2014 | | | 20.72 | | | | 0.72 | | | | 4.52 | | | | 5.24 | | | | — | | | | — | | | | — | | |
Year ended 6/30/2013 | | | 16.26 | | | | 0.10 | | | | 4.58 | | | | 4.68 | | | | (0.22 | ) | | | — | | | | (0.22 | ) | |
Year ended 6/30/2012 | | | 16.48 | | | | 0.14 | | | | (0.12 | ) | | | 0.02 | | | | (0.24 | ) | | | — | | | | (0.24 | ) | |
Class R | |
Six months ended
12/31/2016* | | | 25.02 | | | | 0.13 | | | | 4.05 | | | | 4.18 | | | | (0.44 | ) | | | — | | | | (0.44 | ) | |
Year ended 6/30/2016 | | | 27.16 | | | | 0.28 | | | | (2.16 | ) | | | (1.88 | ) | | | (0.26 | ) | | | — | | | | (0.26 | ) | |
Year ended 6/30/2015 | | | 26.62 | | | | 0.22 | | | | 0.98 | | | | 1.20 | | | | (0.66 | ) | | | — | | | | (0.66 | ) | |
Year ended 6/30/2014 | | | 21.33 | | | | 0.60 | | | | 4.89 | | | | 5.49 | | | | (0.20 | ) | | | — | | | | (0.20 | ) | |
Year ended 6/30/2013 | | | 16.77 | | | | 0.21 | | | | 4.69 | | | | 4.90 | | | | (0.34 | ) | | | — | | | | (0.34 | ) | |
Year ended 6/30/2012 | | | 16.95 | | | | 0.23 | | | | (0.12 | ) | | | 0.11 | | | | (0.29 | ) | | | — | | | | (0.29 | ) | |
| | | | | Ratios to Average Net Assets | |
Large Cap Value Fund | | Net asset
value, end
of period | | Total
return2 | | Net assets,
end of
period (in
thousands) | | Expenses,
net of
reimbursement/
waiver | | Expenses,
before
reimbursement/
waiver | | Net
investment
income | |
Class I | |
Six months ended
12/31/2016* | | $ | 28.76 | | | | 16.95 | % | | $ | 298,112 | | | | 1.02 | %3 | | | 1.02 | %3 | | | 1.46 | %3 | |
Year ended 6/30/2016 | | | 25.06 | | | | –6.42 | | | | 305,282 | | | | 1.01 | | | | 1.01 | | | | 1.55 | | |
Year ended 6/30/2015 | | | 27.21 | | | | 5.17 | | | | 479,488 | | | | 0.99 | | | | 0.99 | | | | 1.30 | | |
Year ended 6/30/2014 | | | 26.65 | | | | 26.52 | | | | 500,102 | | | | 1.01 | | | | 1.01 | | | | 3.04 | | |
Year ended 6/30/2013 | | | 21.35 | | | | 30.48 | | | | 389,300 | | | | 1.05 | | | | 1.05 | | | | 1.68 | | |
Year ended 6/30/2012 | | | 16.80 | | | | 1.22 | | | | 316,081 | | | | 1.05 | | | | 1.05 | | | | 1.96 | | |
Class A | |
Six months ended
12/31/2016* | | | 28.62 | | | | 16.74 | | | | 146,173 | | | | 1.273 | | | | 1.273 | | | | 1.213 | | |
Year ended 6/30/2016 | | | 24.91 | | | | –6.62 | | | | 142,768 | | | | 1.26 | | | | 1.26 | | | | 1.33 | | |
Year ended 6/30/2015 | | | 27.02 | | | | 4.89 | | | | 191,665 | | | | 1.24 | | | | 1.24 | | | | 1.03 | | |
Year ended 6/30/2014 | | | 26.46 | | | | 26.22 | | | | 223,219 | | | | 1.26 | | | | 1.26 | | | | 3.02 | | |
Year ended 6/30/2013 | | | 21.21 | | | | 30.16 | | | | 156,303 | | | | 1.30 | | | | 1.30 | | | | 1.42 | | |
Year ended 6/30/2012 | | | 16.68 | | | | 0.99 | | | | 155,767 | | | | 1.30 | | | | 1.30 | | | | 1.66 | | |
Class C | |
Six months ended
12/31/2016* | | | 28.09 | | | | 16.31 | | | | 20,454 | | | | 2.023 | | | | 2.023 | | | | 0.463 | | |
Year ended 6/30/2016 | | | 24.29 | | | | –7.34 | | | | 21,038 | | | | 2.01 | | | | 2.01 | | | | 0.53 | | |
Year ended 6/30/2015 | | | 26.30 | | | | 4.10 | | | | 40,862 | | | | 1.99 | | | | 1.99 | | | | 0.34 | | |
Year ended 6/30/2014 | | | 25.96 | | | | 25.29 | | | | 25,765 | | | | 2.01 | | | | 2.01 | | | | 3.02 | | |
Year ended 6/30/2013 | | | 20.72 | | | | 29.12 | | | | 8,324 | | | | 2.05 | | | | 2.05 | | | | 0.59 | | |
Year ended 6/30/2012 | | | 16.26 | | | | 0.29 | | | | 23,891 | | | | 2.05 | | | | 2.05 | | | | 0.92 | | |
Class R | |
Six months ended
12/31/2016* | | | 28.76 | | | | 16.65 | | | | 15,192 | | | | 1.523 | | | | 1.523 | | | | 0.963 | | |
Year ended 6/30/2016 | | | 25.02 | | | | –6.88 | | | | 13,186 | | | | 1.51 | | | | 1.51 | | | | 1.12 | | |
Year ended 6/30/2015 | | | 27.16 | | | | 4.64 | | | | 12,867 | | | | 1.49 | | | | 1.49 | | | | 0.81 | | |
Year ended 6/30/2014 | | | 26.62 | | | | 25.91 | | | | 11,924 | | | | 1.51 | | | | 1.51 | | | | 2.51 | | |
Year ended 6/30/2013 | | | 21.33 | | | | 29.79 | | | | 9,571 | | | | 1.55 | | | | 1.55 | | | | 1.15 | | |
Year ended 6/30/2012 | | | 16.77 | | | | 0.80 | | | | 10,812 | | | | 1.55 | | | | 1.55 | | | | 1.42 | | |
| | | Six Months Ended | | Year Ended June 30, | |
| | | December 31, 2016* | | 2016 | | 2015 | | 2014 | | 2013 | | 2012 | |
Portfolio turnover rate | | | 14 | % | | | 39 | % | | | 39 | % | | | 57 | % | | | 41 | % | | | 59 | % | |
1 Net investment income per share has been calculated based on average shares outstanding during the period.
2 Total returns exclude the effects of sales charges. The Fund's investment advisor may have waived a portion of its advisory fee and/or reimbursed a portion of the Fund's expenses. Without such waiver and/or reimbursement, the Fund's performance would have been lower. Returns for periods less than one year are not annualized.
3 Annualized.
* Unaudited.
The accompanying notes are an integral part of these financial statements.
63
Financial Highlights
The following per share data and ratios have been derived from information provided in the financial statements.
| | | | | Income (loss) from investment operations | | Dividends and distributions | |
Mid-Cap Value Fund | | Net asset
value,
beginning
of period | | Net
investment
income
(loss)1 | | Net gains
(losses) on
securities
(both
realized and
unrealized) | | Total from
investment
operations | | Dividends
(from net
investment
income) | | Distributions
(from
capital
gains) | | Total
distributions | |
Class I | |
Six months ended
12/31/2016* | | $ | 30.55 | | | $ | 0.03 | | | $ | 7.29 | | | $ | 7.32 | | | $ | (0.11 | ) | | $ | (0.46 | ) | | $ | (0.57 | ) | |
Year ended 6/30/2016 | | | 40.43 | | | | 0.25 | | | | (5.54 | ) | | | (5.29 | ) | | | (0.16 | ) | | | (4.43 | ) | | | (4.59 | ) | |
Year ended 6/30/2015 | | | 45.15 | | | | 0.15 | | | | (0.63 | ) | | | (0.48 | ) | | | (0.27 | ) | | | (3.97 | ) | | | (4.24 | ) | |
Year ended 6/30/2014 | | | 35.36 | | | | 0.21 | | | | 9.71 | | | | 9.92 | | | | (0.13 | ) | | | — | | | | (0.13 | ) | |
Year ended 6/30/2013 | | | 26.02 | | | | 0.16 | | | | 9.31 | | | | 9.47 | | | | (0.13 | ) | | | — | | | | (0.13 | ) | |
Year ended 6/30/2012 | | | 24.96 | | | | 0.13 | | | | 0.95 | | | | 1.08 | | | | (0.02 | ) | | | — | | | | (0.02 | ) | |
Class A | |
Six months ended
12/31/2016* | | | 30.13 | | | | (0.01 | ) | | | 7.19 | | | | 7.18 | | | | (0.07 | ) | | | (0.46 | ) | | | (0.53 | ) | |
Year ended 6/30/2016 | | | 39.91 | | | | 0.16 | | | | (5.47 | ) | | | (5.31 | ) | | | (0.04 | ) | | | (4.43 | ) | | | (4.47 | ) | |
Year ended 6/30/2015 | | | 44.60 | | | | 0.04 | | | | (0.61 | ) | | | (0.57 | ) | | | (0.15 | ) | | | (3.97 | ) | | | (4.12 | ) | |
Year ended 6/30/2014 | | | 34.98 | | | | 0.12 | | | | 9.58 | | | | 9.70 | | | | (0.08 | ) | | | — | | | | (0.08 | ) | |
Year ended 6/30/2013 | | | 25.75 | | | | 0.09 | | | | 9.21 | | | | 9.30 | | | | (0.07 | ) | | | — | | | | (0.07 | ) | |
Year ended 6/30/2012 | | | 24.74 | | | | 0.07 | | | | 0.94 | | | | 1.01 | | | | — | | | | — | | | | — | | |
Class C | |
Six months ended
12/31/2016* | | | 26.78 | | | | (0.12 | ) | | | 6.37 | | | | 6.25 | | | | — | | | | (0.46 | ) | | | (0.46 | ) | |
Year ended 6/30/2016 | | | 36.24 | | | | (0.08 | ) | | | (4.95 | ) | | | (5.03 | ) | | | — | | | | (4.43 | ) | | | (4.43 | ) | |
Year ended 6/30/2015 | | | 41.04 | | | | (0.25 | ) | | | (0.58 | ) | | | (0.83 | ) | | | — | | | | (3.97 | ) | | | (3.97 | ) | |
Year ended 6/30/2014 | | | 32.39 | | | | (0.16 | ) | | | 8.85 | | | | 8.69 | | | | (0.04 | ) | | | — | | | | (0.04 | ) | |
Year ended 6/30/2013 | | | 23.97 | | | | (0.11 | ) | | | 8.53 | | | | 8.42 | | | | — | | | | — | | | | — | | |
Year ended 6/30/2012 | | | 23.20 | | | | (0.11 | ) | | | 0.88 | | | | 0.77 | | | | — | | | | — | | | | — | | |
Class R | |
Six months ended
12/31/2016* | | | 30.21 | | | | (0.05 | ) | | | 7.19 | | | | 7.14 | | | | (0.03 | ) | | | (0.46 | ) | | | (0.49 | ) | |
Year ended 6/30/2016 | | | 40.04 | | | | 0.09 | | | | (5.49 | ) | | | (5.40 | ) | | | — | | | | (4.43 | ) | | | (4.43 | ) | |
Year ended 6/30/2015 | | | 44.77 | | | | (0.07 | ) | | | (0.62 | ) | | | (0.69 | ) | | | (0.07 | ) | | | (3.97 | ) | | | (4.04 | ) | |
Year ended 6/30/2014 | | | 35.17 | | | | 0.02 | | | | 9.63 | | | | 9.65 | | | | (0.05 | ) | | | — | | | | (0.05 | ) | |
Year ended 6/30/2013 | | | 25.92 | | | | 0.03 | | | | 9.25 | | | | 9.28 | | | | (0.03 | ) | | | — | | | | (0.03 | ) | |
Year ended 6/30/2012 | | | 24.95 | | | | 0.004 | | | | 0.97 | | | | 0.97 | | | | — | | | | — | | | | — | | |
| | | | | Ratios to Average Net Assets | |
Mid-Cap Value Fund | | Net asset
value, end
of period | | Total
return2 | | Net assets,
end of
period (in
thousands) | | Expenses,
net of
reimbursement/
waiver | | Expenses,
before
reimbursement/
waiver | | Net
investment
income
(loss) | |
Class I | |
Six months ended
12/31/2016* | | $ | 37.30 | | | | 23.93 | % | | $ | 1,802,055 | | | | 1.03 | %3 | | | 1.03 | %3 | | | 0.20 | %3 | |
Year ended 6/30/2016 | | | 30.55 | | | | –13.23 | | | | 1,659,480 | | | | 1.02 | | | | 1.02 | | | | 0.75 | | |
Year ended 6/30/2015 | | | 40.43 | | | | –0.70 | | | | 2,492,532 | | | | 1.00 | | | | 1.00 | | | | 0.35 | | |
Year ended 6/30/2014 | | | 45.15 | | | | 28.10 | | | | 2,542,569 | | | | 1.01 | | | | 1.01 | | | | 0.52 | | |
Year ended 6/30/2013 | | | 35.36 | | | | 36.51 | | | | 1,627,378 | | | | 1.07 | | | | 1.07 | | | | 0.55 | | |
Year ended 6/30/2012 | | | 26.02 | | | | 4.33 | | | | 1,058,806 | | | | 1.10 | | | | 1.10 | | | | 0.54 | | |
Class A | |
Six months ended
12/31/2016* | | | 36.78 | | | | 23.79 | | | | 313,539 | | | | 1.283 | | | | 1.283 | | | | (0.06 | )3 | |
Year ended 6/30/2016 | | | 30.13 | | | | –13.45 | | | | 322,023 | | | | 1.27 | | | | 1.27 | | | | 0.48 | | |
Year ended 6/30/2015 | | | 39.91 | | | | –0.93 | | | | 626,544 | | | | 1.25 | | | | 1.25 | | | | 0.10 | | |
Year ended 6/30/2014 | | | 44.60 | | | | 27.78 | | | | 862,559 | | | | 1.26 | | | | 1.26 | | | | 0.29 | | |
Year ended 6/30/2013 | | | 34.98 | | | | 36.16 | | | | 406,949 | | | | 1.32 | | | | 1.32 | | | | 0.32 | | |
Year ended 6/30/2012 | | | 25.75 | | | | 4.08 | | | | 217,069 | | | | 1.35 | | | | 1.35 | | | | 0.28 | | |
Class C | |
Six months ended
12/31/2016* | | | 32.57 | | | | 23.30 | | | | 61,615 | | | | 2.033 | | | | 2.033 | | | | (0.81 | )3 | |
Year ended 6/30/2016 | | | 26.78 | | | | –14.09 | | | | 64,568 | | | | 2.02 | | | | 2.02 | | | | (0.27 | ) | |
Year ended 6/30/2015 | | | 36.24 | | | | –1.69 | | | | 128,647 | | | | 2.00 | | | | 2.00 | | | | (0.65 | ) | |
Year ended 6/30/2014 | | | 41.04 | | | | 26.84 | | | | 154,222 | | | | 2.01 | | | | 2.01 | | | | (0.45 | ) | |
Year ended 6/30/2013 | | | 32.39 | | | | 35.13 | | | | 62,638 | | | | 2.07 | | | | 2.07 | | | | (0.39 | ) | |
Year ended 6/30/2012 | | | 23.97 | | | | 3.32 | | | | 15,072 | | | | 2.10 | | | | 2.10 | | | | (0.53 | ) | |
Class R | |
Six months ended
12/31/2016* | | | 36.86 | | | | 23.61 | | | | 14,544 | | | | 1.533 | | | | 1.533 | | | | (0.29 | )3 | |
Year ended 6/30/2016 | | | 30.21 | | | | –13.64 | | | | 11,471 | | | | 1.52 | | | | 1.52 | | | | 0.26 | | |
Year ended 6/30/2015 | | | 40.04 | | | | –1.21 | | | | 18,683 | | | | 1.50 | | | | 1.50 | | | | (0.16 | ) | |
Year ended 6/30/2014 | | | 44.77 | | | | 27.47 | | | | 24,693 | | | | 1.51 | | | | 1.51 | | | | 0.05 | | |
Year ended 6/30/2013 | | | 35.17 | | | | 35.82 | | | | 9,746 | | | | 1.57 | | | | 1.57 | | | | 0.09 | | |
Year ended 6/30/2012 | | | 25.92 | | | | 3.89 | | | | 4,762 | | | | 1.60 | | | | 1.60 | | | | 0.02 | | |
| | | Six Months Ended | | Year Ended June 30, | |
| | | December 31, 2016* | | 2016 | | 2015 | | 2014 | | 2013 | | 2012 | |
Portfolio turnover rate | | | 18 | % | | | 42 | % | | | 54 | % | | | 55 | % | | | 66 | % | | | 72 | % | |
| | | | | Income (loss) from investment operations | | Dividends and distributions | |
Small Cap Value Fund | | Net asset
value,
beginning
of period | | Net
investment
income
(loss)1 | | Net gains
(losses) on
securities
(both
realized and
unrealized) | | Total from
investment
operations | | Dividends
(from net
investment
income) | | Distributions
(from
capital
gains) | | Total
distributions | |
Class I | |
Six months ended
12/31/2016* | | $ | 46.46 | | | $ | 0.07 | | | $ | 12.67 | | | $ | 12.74 | | | $ | (0.24 | ) | | $ | — | | | $ | (0.24 | ) | |
Year ended 6/30/2016 | | | 61.67 | | | | 0.17 | | | | (9.57 | ) | | | (9.40 | ) | | | (0.16 | ) | | | (5.65 | ) | | | (5.81 | ) | |
Year ended 6/30/2015 | | | 66.62 | | | | 0.27 | | | | 2.30 | | | | 2.57 | | | | (0.13 | ) | | | (7.39 | ) | | | (7.52 | ) | |
Year ended 6/30/2014 | | | 54.84 | | | | 0.13 | | | | 16.83 | | | | 16.96 | | | | (0.20 | ) | | | (4.98 | ) | | | (5.18 | ) | |
Year ended 6/30/2013 | | | 41.83 | | | | 0.32 | | | | 12.96 | | | | 13.28 | | | | (0.27 | ) | | | — | | | | (0.27 | ) | |
Year ended 6/30/2012 | | | 43.90 | | | | 0.29 | | | | (2.36 | ) | | | (2.07 | ) | | | — | | | | — | | | | — | | |
Class A | |
Six months ended
12/31/2016* | | | 46.09 | | | | 0.01 | | | | 12.56 | | | | 12.57 | | | | — | | | | — | | | | — | | |
Year ended 6/30/2016 | | | 61.27 | | | | 0.04 | | | | (9.51 | ) | | | (9.47 | ) | | | (0.06 | ) | | | (5.65 | ) | | | (5.71 | ) | |
Year ended 6/30/2015 | | | 66.26 | | | | 0.12 | | | | 2.28 | | | | 2.40 | | | | — | | | | (7.39 | ) | | | (7.39 | ) | |
Year ended 6/30/2014 | | | 54.67 | | | | (0.02 | ) | | | 16.75 | | | | 16.73 | | | | (0.16 | ) | | | (4.98 | ) | | | (5.14 | ) | |
Year ended 6/30/2013 | | | 41.67 | | | | 0.21 | | | | 12.91 | | | | 13.12 | | | | (0.12 | ) | | | — | | | | (0.12 | ) | |
Year ended 6/30/2012 | | | 43.84 | | | | 0.15 | | | | (2.32 | ) | | | (2.17 | ) | | | — | | | | — | | | | — | | |
Class C | |
Six months ended
12/31/2016* | | | 39.09 | | | | (0.16 | ) | | | 10.63 | | | | 10.47 | | | | — | | | | — | | | | — | | |
Year ended 6/30/2016 | | | 53.25 | | | | (0.30 | ) | | | (8.21 | ) | | | (8.51 | ) | | | — | | | | (5.65 | ) | | | (5.65 | ) | |
Year ended 6/30/2015 | | | 58.99 | | | | (0.32 | ) | | | 1.97 | | | | 1.65 | | | | — | | | | (7.39 | ) | | | (7.39 | ) | |
Year ended 6/30/2014 | | | 49.40 | | | | (0.43 | ) | | | 15.04 | | | | 14.61 | | | | (0.04 | ) | | | (4.98 | ) | | | (5.02 | ) | |
Year ended 6/30/2013 | | | 37.84 | | | | (0.14 | ) | | | 11.70 | | | | 11.56 | | | | — | | | | — | | | | — | | |
Year ended 6/30/2012 | | | 40.11 | | | | (0.10 | ) | | | (2.17 | ) | | | (2.27 | ) | | | — | | | | — | | | | — | | |
| | | | | Ratios to Average Net Assets | |
Small Cap Value Fund | | Net asset
value, end
of period | | Total
return2 | | Net assets,
end of
period (in
thousands) | | Expenses,
net of
reimbursement/
waiver | | Expenses,
before
reimbursement/
waiver | | Net
investment
income
(loss) | |
Class I | |
Six months ended
12/31/2016* | | $ | 58.96 | | | | 27.41 | % | | $ | 704,506 | | | | 1.04 | %3 | | | 1.04 | %3 | | | 0.28 | %3 | |
Year ended 6/30/2016 | | | 46.46 | | | | –15.63 | | | | 699,420 | | | | 1.04 | | | | 1.04 | | | | 0.33 | | |
Year ended 6/30/2015 | | | 61.67 | | | | 4.64 | | | | 951,911 | | | | 1.06 | | | | 1.06 | | | | 0.43 | | |
Year ended 6/30/2014 | | | 66.62 | | | | 32.40 | | | | 785,915 | | | | 0.99 | | | | 0.99 | | | | 0.21 | | |
Year ended 6/30/2013 | | | 54.84 | | | | 31.88 | | | | 452,702 | | | | 1.03 | | | | 1.03 | | | | 0.67 | | |
Year ended 6/30/2012 | | | 41.83 | | | | –4.72 | | | | 296,436 | | | | 1.09 | | | | 1.09 | | | | 0.73 | | |
Class A | |
Six months ended
12/31/2016* | | | 58.66 | | | | 27.25 | | | | 102,272 | | | | 1.293 | | | | 1.293 | | | | 0.033 | | |
Year ended 6/30/2016 | | | 46.09 | | | | –15.83 | | | | 113,335 | | | | 1.29 | | | | 1.29 | | | | 0.07 | | |
Year ended 6/30/2015 | | | 61.27 | | | | 4.37 | | | | 194,587 | | | | 1.31 | | | | 1.31 | | | | 0.19 | | |
Year ended 6/30/2014 | | | 66.26 | | | | 32.06 | | | | 204,205 | | | | 1.24 | | | | 1.24 | | | | (0.04 | ) | |
Year ended 6/30/2013 | | | 54.67 | | | | 31.55 | | | | 103,329 | | | | 1.28 | | | | 1.28 | | | | 0.43 | | |
Year ended 6/30/2012 | | | 41.67 | | | | –4.95 | | | | 39,803 | | | | 1.34 | | | | 1.34 | | | | 0.39 | | |
Class C | |
Six months ended
12/31/2016* | | | 49.56 | | | | 26.75 | | | | 20,974 | | | | 2.043 | | | | 2.043 | | | | (0.72 | )3 | |
Year ended 6/30/2016 | | | 39.09 | | | | –16.46 | | | | 20,308 | | | | 2.04 | | | | 2.04 | | | | (0.68 | ) | |
Year ended 6/30/2015 | | | 53.25 | | | | 3.60 | | | | 35,172 | | | | 2.06 | | | | 2.06 | | | | (0.58 | ) | |
Year ended 6/30/2014 | | | 58.99 | | | | 31.09 | | | | 43,161 | | | | 1.99 | | | | 1.99 | | | | (0.79 | ) | |
Year ended 6/30/2013 | | | 49.40 | | | | 30.55 | | | | 28,745 | | | | 2.03 | | | | 2.03 | | | | (0.31 | ) | |
Year ended 6/30/2012 | | | 37.84 | | | | –5.66 | | | | 10,970 | | | | 2.09 | | | | 2.09 | | | | (0.29 | ) | |
| | | Six Months Ended | | Year Ended June 30, | |
| | | December 31, 2016* | | 2016 | | 2015 | | 2014 | | 2013 | | 2012 | |
Portfolio turnover rate | | | 11 | % | | | 45 | % | | | 43 | % | | | 43 | % | | | 35 | % | | | 37 | % | |
1 Net investment income (loss) per share has been calculated based on average shares outstanding during the period.
2 Total returns exclude the effects of sales charges. The Fund's investment advisor may have waived a portion of its advisory fee and/or reimbursed a portion of the Fund's expenses. Without such waiver and/or reimbursement, the Fund's performance would have been lower. Returns for periods less than one year are not annualized.
3 Annualized.
4 Amount is less than $0.005.
* Unaudited.
The accompanying notes are an integral part of these financial statements.
64
Financial Highlights
The following per share data and ratios have been derived from information provided in the financial statements.
| | | | | Income (loss) from investment operations | | Dividends and distributions | |
Small Cap Diversified
Value Fund | | Net asset
value,
beginning
of period | | Net
investment
income1 | | Net gains
(losses) on
securities
(both
realized and
unrealized) | | Total from
investment
operations | | Dividends
(from net
investment
income) | | Distributions
(from
capital
gains) | | Total
distributions | |
Class I | |
Six months ended
12/31/2016* | | $ | 9.12 | | | $ | 0.06 | | | $ | 2.60 | | | $ | 2.66 | | | $ | (0.09 | ) | | $ | — | | | $ | (0.09 | ) | |
Year ended 6/30/2016 | | | 10.01 | | | | 0.06 | | | | (0.66 | ) | | | (0.60 | ) | | | (0.04 | ) | | | (0.25 | ) | | | (0.29 | ) | |
Year from 6/30/20144
to 6/30/2015 | | | 10.00 | | | | 0.05 | | | | 0.22 | | | | 0.27 | | | | (0.04 | ) | | | (0.22 | ) | | | (0.26 | ) | |
Class A | |
Six months ended
12/31/2016* | | | 9.09 | | | | 0.04 | | | | 2.60 | | | | 2.64 | | | | (0.07 | ) | | | — | | | | (0.07 | ) | |
Year ended 6/30/2016 | | | 10.00 | | | | 0.05 | | | | (0.68 | ) | | | (0.63 | ) | | | (0.03 | ) | | | (0.25 | ) | | | (0.28 | ) | |
Year from 6/30/20144
to 6/30/2015 | | | 10.00 | | | | 0.03 | | | | 0.22 | | | | 0.25 | | | | (0.03 | ) | | | (0.22 | ) | | | (0.25 | ) | |
| | | | | Ratios to Average Net Assets | |
Small Cap Diversified
Value Fund | | Net asset
value, end
of period | | Total
return2 | | Net assets,
end of
period (in
thousands) | | Expenses,
net of
reimbursement/
waiver | | Expenses,
before
reimbursement/
waiver | | Net
investment
income | |
Class I | |
Six months ended
12/31/2016* | | $ | 11.69 | | | | 29.17 | % | | $ | 18,676 | | | | 0.90 | %3 | | | 1.85 | %3 | | | 1.08 | %3 | |
Year ended 6/30/2016 | | | 9.12 | | | | –5.80 | | | | 14,446 | | | | 1.25 | | | | 2.13 | | | | 0.72 | | |
Year from 6/30/20144
to 6/30/2015 | | | 10.01 | | | | 2.93 | | | | 15,337 | | | | 1.25 | | | | 3.75 | | | | 0.48 | | |
Class A | |
Six months ended
12/31/2016* | | | 11.66 | | | | 28.98 | | | | 608 | | | | 1.153 | | | | 2.103 | | | | 0.843 | | |
Year ended 6/30/2016 | | | 9.09 | | | | –6.14 | | | | 232 | | | | 1.50 | | | | 2.38 | | | | 0.53 | | |
Year from 6/30/20144
to 6/30/2015 | | | 10.00 | | | | 2.71 | | | | 130 | | | | 1.50 | | | | 4.25 | | | | 0.29 | | |
| | | Six Months Ended | | Year Ended June 30, | |
| | | December 31, 2016* | | 2016 | | 2015 | |
Portfolio turnover rate | | | 8 | % | | | 89 | % | | | 40 | % | |
| | | | | Income (loss) from investment operations | | Dividends and distributions | |
Global Value Fund | | Net asset
value,
beginning
of period | | Net
investment
income1 | | Net gains
(losses) on
securities
(both
realized and
unrealized) | | Total from
investment
operations | | Dividends
(from net
investment
income) | | Distributions
(from
capital
gains) | | Total
distributions | |
Class I | |
Six months ended
12/31/2016* | | $ | 10.10 | | | $ | 0.01 | | | $ | 1.84 | | | $ | 1.85 | | | $ | (0.10 | ) | | $ | — | | | $ | (0.10 | ) | |
Year ended 6/30/2016 | | | 11.93 | | | | 0.13 | | | | (1.23 | ) | | | (1.10 | ) | | | (0.12 | ) | | | (0.61 | ) | | | (0.73 | ) | |
Year ended 6/30/2015 | | | 13.31 | | | | 0.14 | | | | (0.46 | ) | | | (0.32 | ) | | | (0.30 | ) | | | (0.76 | ) | | | (1.06 | ) | |
Year ended 6/30/2014 | | | 11.49 | | | | 0.41 | | | | 2.45 | | | | 2.86 | | | | (0.17 | ) | | | (0.87 | ) | | | (1.04 | ) | |
Period from
12/31/20124 to
6/30/2013 | | | 10.00 | | | | 0.12 | | | | 1.37 | | | | 1.49 | | | | — | | | | — | | | | — | | |
Class A | |
Six months ended
12/31/2016* | | | 10.09 | | | | 0.01 | | | | 1.83 | | | | 1.84 | | | | (0.08 | ) | | | — | | | | (0.08 | ) | |
Year ended 6/30/2016 | | | 11.91 | | | | 0.10 | | | | (1.23 | ) | | | (1.13 | ) | | | (0.08 | ) | | | (0.61 | ) | | | (0.69 | ) | |
Year ended 6/30/2015 | | | 13.29 | | | | 0.10 | | | | (0.45 | ) | | | (0.35 | ) | | | (0.27 | ) | | | (0.76 | ) | | | (1.03 | ) | |
Period from
8/30/20134 to
6/30/2014 | | | 11.85 | | | | 0.34 | | | | 2.13 | | | | 2.47 | | | | (0.16 | ) | | | (0.87 | ) | | | (1.03 | ) | |
| | | | | Ratios to Average Net Assets | |
Global Value Fund | | Net asset
value, end
of period | | Total
return2 | | Net assets,
end of
period (in
thousands) | | Expenses,
net of
reimbursement/
waiver | | Expenses,
before
reimbursement/
waiver | | Net
investment
income | |
Class I | |
Six months ended
12/31/2016* | | $ | 11.85 | | | | 18.25 | % | | $ | 6,812 | | | | 1.10 | %3 | | | 4.07 | %3 | | | 0.26 | %3 | |
Year ended 6/30/2016 | | | 10.10 | | | | –9.25 | | | | 5,199 | | | | 1.10 | | | | 4.14 | | | | 1.25 | | |
Year ended 6/30/2015 | | | 11.93 | | | | –1.98 | | | | 6,144 | | | | 1.10 | | | | 4.34 | | | | 1.11 | | |
Year ended 6/30/2014 | | | 13.31 | | | | 25.98 | | | | 3,867 | | | | 1.10 | | | | 6.26 | | | | 3.29 | | |
Period from
12/31/20124 to
6/30/2013 | | | 11.49 | | | | 14.90 | | | | 2,024 | | | | 1.103 | | | | 11.753 | | | | 2.223 | | |
Class A | |
Six months ended
12/31/2016* | | | 11.85 | | | | 18.21 | | | | 213 | | | | 1.353 | | | | 4.243 | | | | 0.103 | | |
Year ended 6/30/2016 | | | 10.09 | | | | –9.47 | | | | 100 | | | | 1.35 | | | | 4.39 | | | | 0.96 | | |
Year ended 6/30/2015 | | | 11.91 | | | | –2.22 | | | | 110 | | | | 1.35 | | | | 4.77 | | | | 0.79 | | |
Period from
8/30/20134 to
6/30/2014 | | | 13.29 | | | | 21.88 | | | | 137 | | | | 1.353 | | | | 6.583 | | | | 3.213 | | |
| | | Six Months Ended | | Year Ended June 30, | | Period December 31, 20124
through June 30, | |
| | | December 31, 2016* | | 2016 | | 2015 | | 2014 | | 2013 | |
Portfolio turnover rate | | | 22 | % | | | 52 | % | | | 42 | % | | | 52 | % | | | 38 | % | |
1 Net investment income per share has been calculated based on average shares outstanding during the period.
2 Total returns exclude the effects of sales charges. The Fund's investment advisor may have waived a portion of its advisory fee and/or reimbursed a portion of the Fund's expenses. Without such waiver and/or reimbursement, the Fund's performance would have been lower. Returns for periods less than one year are not annualized.
3 Annualized.
4 Commencement of operations.
* Unaudited.
The accompanying notes are an integral part of these financial statements.
65
Financial Highlights
The following per share data and ratios have been derived from information provided in the financial statements.
| | | | | Income (loss) from investment operations | | Dividends and distributions | |
International
Value Fund | | Net asset
value,
beginning
of period | | Net
investment
income
(loss)1 | | Net gains
(losses) on
securities
(both
realized and
unrealized) | | Total from
investment
operations | | Dividends
(from net
investment
income) | | Distributions
(from
capital
gains) | | Total
distributions | |
Class I | |
Six months ended
12/31/2016* | | $ | 9.76 | | | $ | (0.01 | ) | | $ | 1.36 | | | $ | 1.35 | | | $ | (0.17 | ) | | $ | (0.24 | ) | | $ | (0.41 | ) | |
Period from
12/31/20154 to
6/30/2016 | | | 10.00 | | | | 0.16 | | | | (0.40 | ) | | | (0.24 | ) | | | — | | | | — | | | | — | | |
| | | | | Ratios to Average Net Assets | |
International
Value Fund | | Net asset
value, end
of period | | Total
return2 | | Net assets,
end of
period (in
thousands) | | Expenses,
net of
reimbursement/
waiver | | Expenses,
before
reimbursement/
waiver | | Net
investment
income
(loss) | |
Class I | |
Six months ended
12/31/2016* | | $ | 10.70 | | | | 13.90 | % | | $ | 2,057 | | | | 1.15 | %3 | | | 7.41 | %3 | | | (0.13 | )%3 | |
Period from
12/31/20154 to
6/30/2016 | | | 9.76 | | | | –2.40 | | | | 1,806 | | | | 1.153 | | | | 12.673 | | | | 3.173 | | |
| | | Six Months Ended
December 31, 2016* | | Period December 31, 20154
through June 30, 2016 | |
Portfolio turnover rate | | | 18 | % | | | 17 | % | |
| | | | | Income (loss) from investment operations | | Dividends and distributions | |
Value Opportunities Fund | | Net asset
value,
beginning
of period | | Net
investment
income1 | | Net gains
(losses) on
securities
(both
realized and
unrealized) | | Total from
investment
operations | | Dividends
(from net
investment
income) | | Distributions
(from
capital
gains) | | Total
distributions | |
Class I | |
Six months ended
12/31/2016* | | $ | 22.21 | | | $ | 0.14 | | | $ | 4.93 | | | $ | 5.07 | | | $ | (0.59 | ) | | $ | — | | | $ | (0.59 | ) | |
Year ended 6/30/2016 | | | 29.13 | | | | 0.69 | | | | (3.68 | ) | | | (2.99 | ) | | | (0.49 | ) | | | (3.44 | ) | | | (3.93 | ) | |
Year ended 6/30/2015 | | | 29.88 | | | | 0.41 | | | | 1.35 | | | | 1.76 | | | | (0.42 | ) | | | (2.09 | ) | | | (2.51 | ) | |
Year ended 6/30/2014 | | | 25.46 | | | | 0.35 | | | | 5.91 | | | | 6.26 | | | | (0.23 | ) | | | (1.61 | ) | | | (1.84 | ) | |
Year ended 6/30/2013 | | | 20.44 | | | | 0.34 | | | | 6.00 | | | | 6.34 | | | | (0.38 | ) | | | (0.94 | ) | | | (1.32 | ) | |
Year ended 6/30/2012 | | | 21.12 | | | | 0.33 | | | | (0.48 | ) | | | (0.15 | ) | | | (0.14 | ) | | | (0.39 | ) | | | (0.53 | ) | |
Class A | |
Six months ended
12/31/2016* | | | 22.21 | | | | 0.12 | | | | 4.92 | | | | 5.04 | | | | (0.51 | ) | | | — | | | | (0.51 | ) | |
Year ended 6/30/2016 | | | 29.13 | | | | 0.63 | | | | (3.69 | ) | | | (3.06 | ) | | | (0.42 | ) | | | (3.44 | ) | | | (3.86 | ) | |
Year ended 6/30/2015 | | | 29.88 | | | | 0.34 | | | | 1.36 | | | | 1.70 | | | | (0.36 | ) | | | (2.09 | ) | | | (2.45 | ) | |
Year ended 6/30/2014 | | | 25.48 | | | | 0.25 | | | | 5.94 | | | | 6.19 | | | | (0.18 | ) | | | (1.61 | ) | | | (1.79 | ) | |
Year ended 6/30/2013 | | | 20.46 | | | | 0.28 | | | | 6.01 | | | | 6.29 | | | | (0.33 | ) | | | (0.94 | ) | | | (1.27 | ) | |
Year ended 6/30/2012 | | | 21.12 | | | | 0.28 | | | | (0.47 | ) | | | (0.19 | ) | | | (0.08 | ) | | | (0.39 | ) | | | (0.47 | ) | |
Class C | |
Six months ended
12/31/2016* | | | 20.68 | | | | 0.03 | | | | 4.56 | | | | 4.59 | | | | (0.32 | ) | | | — | | | | (0.32 | ) | |
Year ended 6/30/2016 | | | 27.41 | | | | 0.42 | | | | (3.47 | ) | | | (3.05 | ) | | | (0.24 | ) | | | (3.44 | ) | | | (3.68 | ) | |
Year ended 6/30/2015 | | | 28.31 | | | | 0.12 | | | | 1.27 | | | | 1.39 | | | | (0.20 | ) | | | (2.09 | ) | | | (2.29 | ) | |
Year ended 6/30/2014 | | | 24.28 | | | | 0.04 | | | | 5.65 | | | | 5.69 | | | | (0.05 | ) | | | (1.61 | ) | | | (1.66 | ) | |
Year ended 6/30/2013 | | | 19.50 | | | | 0.10 | | | | 5.73 | | | | 5.83 | | | | (0.11 | ) | | | (0.94 | ) | | | (1.05 | ) | |
Year ended 6/30/2012 | | | 20.21 | | | | 0.13 | | | | (0.45 | ) | | | (0.32 | ) | | | — | | | | (0.39 | ) | | | (0.39 | ) | |
| | | | | Ratios to Average Net Assets | |
Value Opportunities Fund | | Net asset
value, end
of period | | Total
return2 | | Net assets,
end of
period (in
thousands) | | Expenses,
net of
reimbursement/
waiver | | Expenses,
before
reimbursement/
waiver | | Net
investment
income | |
Class I | |
Six months ended
12/31/2016* | | $ | 26.69 | | | | 22.81 | % | | $ | 308,636 | | | | 1.00 | %3 | | | 1.00 | %3 | | | 1.15 | %3 | |
Year ended 6/30/2016 | | | 22.21 | | | | –10.48 | | | | 259,421 | | | | 1.00 | | | | 1.00 | | | | 2.80 | | |
Year ended 6/30/2015 | | | 29.13 | | | | 6.75 | | | | 363,363 | | | | 0.96 | | | | 0.96 | | | | 1.42 | | |
Year ended 6/30/2014 | | | 29.88 | | | | 25.67 | | | | 265,138 | | | | 0.99 | | | | 0.99 | | | | 1.25 | | |
Year ended 6/30/2013 | | | 25.46 | | | | 32.28 | | | | 105,332 | | | | 1.03 | | | | 1.03 | | | | 1.45 | | |
Year ended 6/30/2012 | | | 20.44 | | | | –0.20 | | | | 41,079 | | | | 1.10 | | | | 1.10 | | | | 1.73 | | |
Class A | |
Six months ended
12/31/2016* | | | 26.74 | | | | 22.69 | | | | 132,513 | | | | 1.253 | | | | 1.253 | | | | 0.973 | | |
Year ended 6/30/2016 | | | 22.21 | | | | –10.71 | | | | 132,870 | | | | 1.25 | | | | 1.25 | | | | 2.55 | | |
Year ended 6/30/2015 | | | 29.13 | | | | 6.47 | | | | 201,477 | | | | 1.21 | | | | 1.21 | | | | 1.19 | | |
Year ended 6/30/2014 | | | 29.88 | | | | 25.34 | | | | 165,608 | | | | 1.24 | | | | 1.24 | | | | 0.91 | | |
Year ended 6/30/2013 | | | 25.48 | | | | 31.98 | | | | 103,822 | | | | 1.28 | | | | 1.28 | | | | 1.22 | | |
Year ended 6/30/2012 | | | 20.46 | | | | –0.45 | | | | 32,022 | | | | 1.35 | | | | 1.35 | | | | 1.45 | | |
Class C | |
Six months ended
12/31/2016* | | | 24.95 | | | | 22.19 | | | | 61,214 | | | | 2.003 | | | | 2.003 | | | | 0.243 | | |
Year ended 6/30/2016 | | | 20.68 | | | | –11.37 | | | | 63,637 | | | | 2.00 | | | | 2.00 | | | | 1.84 | | |
Year ended 6/30/2015 | | | 27.41 | | | | 5.65 | | | | 76,647 | | | | 1.96 | | | | 1.96 | | | | 0.43 | | |
Year ended 6/30/2014 | | | 28.31 | | | | 24.44 | | | | 52,042 | | | | 1.99 | | | | 1.99 | | | | 0.17 | | |
Year ended 6/30/2013 | | | 24.28 | | | | 30.97 | | | | 24,728 | | | | 2.03 | | | | 2.03 | | | | 0.44 | | |
Year ended 6/30/2012 | | | 19.50 | | | | –1.22 | | | | 11,308 | | | | 2.10 | | | | 2.10 | | | | 0.69 | | |
| | | Six Months Ended | | Year Ended June 30, | |
| | | December 31, 2016* | | 2015 | | 2014 | | 2013 | | 2012 | | 2011 | |
Portfolio turnover rate | | | 48 | % | | | 62 | % | | | 101 | % | | | 45 | % | | | 98 | % | | | 123 | % | |
1 Net investment income (loss) per share has been calculated based on average shares outstanding during the period.
2 Total returns exclude the effects of sales charges. The Fund's investment advisor may have waived a portion of its advisory fee and/or reimbursed a portion of the Fund's expenses. Without such waiver and/or reimbursement, the Fund's performance would have been lower. Returns for periods less than one year are not annualized.
3 Annualized.
4 Commencement of operations.
* Unaudited.
The accompanying notes are an integral part of these financial statements.
66
Financial Highlights
The following per share data and ratios have been derived from information provided in the financial statements.
| | | | | Income (loss) from investment operations | | Dividends and distributions | |
Capital Income Fund | | Net asset
value,
beginning
of period | | Net
investment
income1 | | Net gains
(losses) on
securities
(both
realized and
unrealized) | | Total from
investment
operations | | Dividends
(from net
investment
income) | | Distributions
(from
capital
gains) | | Total
distributions | |
Class I | |
Six months ended
12/31/2016* | | $ | 10.56 | | | $ | 0.22 | | | $ | 1.48 | | | $ | 1.70 | | | $ | (0.27 | ) | | $ | — | | | $ | (0.27 | ) | |
Year ended 6/30/2016 | | | 12.22 | | | | 0.51 | | | | (1.13 | ) | | | (0.62 | ) | | | (0.54 | ) | | | (0.50 | ) | | | (1.04 | ) | |
Year ended 6/30/2015 | | | 12.85 | | | | 0.47 | | | | (0.38 | ) | | | 0.09 | | | | (0.52 | ) | | | (0.20 | ) | | | (0.72 | ) | |
Year ended 6/30/2014 | | | 11.83 | | | | 0.57 | | | | 1.64 | | | | 2.21 | | | | (0.51 | ) | | | (0.68 | ) | | | (1.19 | ) | |
Year ended 6/30/2013 | | | 10.57 | | | | 0.51 | | | | 1.38 | | | | 1.89 | | | | (0.50 | ) | | | (0.13 | ) | | | (0.63 | ) | |
Year ended 6/30/2012 | | | 10.37 | | | | 0.51 | | | | 0.25 | | | | 0.76 | | | | (0.48 | ) | | | (0.08 | ) | | | (0.56 | ) | |
Class A | |
Six months ended
12/31/2016* | | | 10.97 | | | | 0.21 | | | | 1.52 | | | | 1.73 | | | | (0.25 | ) | | | — | | | | (0.25 | ) | |
Year ended 6/30/2016 | | | 12.65 | | | | 0.50 | | | | (1.17 | ) | | | (0.67 | ) | | | (0.51 | ) | | | (0.50 | ) | | | (1.01 | ) | |
Year ended 6/30/2015 | | | 13.24 | | | | 0.44 | | | | (0.35 | ) | | | 0.09 | | | | (0.48 | ) | | | (0.20 | ) | | | (0.68 | ) | |
Year ended 6/30/2014 | | | 12.18 | | | | 0.61 | | | | 1.61 | | | | 2.22 | | | | (0.48 | ) | | | (0.68 | ) | | | (1.16 | ) | |
Year ended 6/30/2013 | | | 10.67 | | | | 0.50 | | | | 1.61 | | | | 2.11 | | | | (0.47 | ) | | | (0.13 | ) | | | (0.60 | ) | |
Year ended 6/30/2012 | | | 10.38 | | | | 0.51 | | | | 0.32 | | | | 0.83 | | | | (0.46 | ) | | | (0.08 | ) | | | (0.54 | ) | |
| | | | | Ratios to Average Net Assets | |
Capital Income Fund | | Net asset
value, end
of period | | Total
return2 | | Net assets,
end of
period (in
thousands) | | Expenses,
net of
reimbursement/
waiver | | Expenses,
before
reimbursement/
waiver | | Net
investment
income | |
Class I | |
Six months ended
12/31/2016* | | $ | 11.99 | | | | 16.22 | % | | $ | 15,017 | | | | 0.80 | %3 | | | 1.36 | %3 | | | 3.83 | %3 | |
Year ended 6/30/2016 | | | 10.56 | | | | –4.77 | | | | 20,873 | | | | 0.80 | | | | 1.18 | | | | 4.63 | | |
Year ended 6/30/2015 | | | 12.22 | | | | 0.69 | | | | 33,958 | | | | 0.80 | | | | 1.05 | | | | 3.75 | | |
Year ended 6/30/2014 | | | 12.85 | | | | 19.71 | | | | 21,399 | | | | 0.80 | | | | 1.34 | | | | 4.61 | | |
Year ended 6/30/2013 | | | 11.83 | | | | 18.45 | | | | 11,348 | | | | 0.80 | | | | 1.85 | | | | 4.51 | | |
Year ended 6/30/2012 | | | 10.57 | | | | 7.76 | | | | 8,588 | | | | 0.80 | | | | 2.81 | | | | 5.06 | | |
Class A | |
Six months ended
12/31/2016* | | | 12.45 | | | | 15.92 | | | | 20,994 | | | | 1.053 | | | | 1.613 | | | | 3.623 | | |
Year ended 6/30/2016 | | | 10.97 | | | | –4.99 | | | | 17,309 | | | | 1.05 | | | | 1.43 | | | | 4.36 | | |
Year ended 6/30/2015 | | | 12.65 | | | | 0.73 | | | | 42,398 | | | | 1.05 | | | | 1.30 | | | | 3.39 | | |
Year ended 6/30/2014 | | | 13.24 | | | | 19.17 | | | | 47,872 | | | | 1.05 | | | | 1.51 | | | | 4.76 | | |
Year ended 6/30/2013 | | | 12.18 | | | | 20.34 | | | | 13,782 | | | | 1.05 | | | | 1.99 | | | | 4.31 | | |
Year ended 6/30/2012 | | | 10.67 | | | | 8.37 | | | | 333 | | | | 1.05 | | | | 3.06 | | | | 4.93 | | |
| | | Six Months Ended | | Year Ended June 30, | |
| | | December 31, 2016* | | 2016 | | 2015 | | 2014 | | 2013 | | 2012 | |
Portfolio turnover rate | | | 27 | % | | | 93 | % | | | 62 | % | | | 53 | % | | | 65 | % | | | 38 | % | |
| | | | | Income (loss) from investment operations | | Dividends and distributions | |
High Yield Fund | | Net asset
value,
beginning
of period | | Net
investment
income1 | | Net gains
(losses) on
securities
(both
realized and
unrealized) | | Total from
investment
operations | | Dividends
(from net
investment
income) | | Distributions
(from
capital
gains) | | Total
distributions | |
Class I | |
Six months ended
12/31/2016* | | $ | 11.47 | | | $ | 0.38 | | | $ | 0.554 | | | $ | 0.93 | | | $ | (0.39 | ) | | $ | — | | | $ | (0.39 | ) | |
Year ended 6/30/2016 | | | 12.51 | | | | 0.76 | | | | (0.94 | )4 | | | (0.18 | ) | | | (0.77 | ) | | | (0.09 | ) | | | (0.86 | ) | |
Year ended 6/30/2015 | | | 13.37 | | | | 0.70 | | | | (0.75 | )4 | | | (0.05 | ) | | | (0.71 | ) | | | (0.10 | ) | | | (0.81 | ) | |
Year ended 6/30/2014 | | | 12.83 | | | | 0.76 | | | | 0.67 | | | | 1.43 | | | | (0.76 | ) | | | (0.13 | ) | | | (0.89 | ) | |
Year ended 6/30/2013 | | | 12.28 | | | | 0.80 | | | | 0.61 | | | | 1.41 | | | | (0.81 | ) | | | (0.05 | ) | | | (0.86 | ) | |
Year ended 6/30/2012 | | | 12.79 | | | | 0.94 | | | | (0.25 | ) | | | 0.69 | | | | (0.95 | ) | | | (0.25 | ) | | | (1.20 | ) | |
Class A | |
Six months ended
12/31/2016* | | | 11.40 | | | | 0.36 | | | | 0.544 | | | | 0.90 | | | | (0.37 | ) | | | — | | | | (0.37 | ) | |
Year ended 6/30/2016 | | | 12.43 | | | | 0.73 | | | | (0.94 | )4 | | | (0.21 | ) | | | (0.73 | ) | | | (0.09 | ) | | | (0.82 | ) | |
Year ended 6/30/2015 | | | 13.29 | | | | 0.67 | | | | (0.75 | )5 | | | (0.08 | ) | | | (0.68 | ) | | | (0.10 | ) | | | (0.78 | ) | |
Year ended 6/30/2014 | | | 12.75 | | | | 0.73 | | | | 0.66 | | | | 1.39 | | | | (0.72 | ) | | | (0.13 | ) | | | (0.85 | ) | |
Year ended 6/30/2013 | | | 12.21 | | | | 0.76 | | | | 0.60 | | | | 1.36 | | | | (0.77 | ) | | | (0.05 | ) | | | (0.82 | ) | |
Year ended 6/30/2012 | | | 12.73 | | | | 0.90 | | | | (0.26 | ) | | | 0.64 | | | | (0.91 | ) | | | (0.25 | ) | | | (1.17 | ) | |
Class C | |
Six months ended
12/31/2016* | | | 11.47 | | | | 0.32 | | | | 0.554 | | | | 0.87 | | | | (0.33 | ) | | | — | | | | (0.33 | ) | |
Year ended 6/30/2016 | | | 12.50 | | | | 0.65 | | | | (0.94 | )6 | | | (0.29 | ) | | | (0.65 | ) | | | (0.09 | ) | | | (0.74 | ) | |
Year ended 6/30/2015 | | | 13.36 | | | | 0.58 | | | | (0.76 | )4 | | | (0.18 | ) | | | (0.58 | ) | | | (0.10 | ) | | | (0.68 | ) | |
Year ended 6/30/2014 | | | 12.82 | | | | 0.62 | | | | 0.68 | | | | 1.30 | | | | (0.63 | ) | | | (0.13 | ) | | | (0.76 | ) | |
Period from
12/31/20127
to 6/30/2013 | | | 12.88 | | | | 0.30 | | | | (0.05 | ) | | | 0.25 | | | | (0.31 | ) | | | — | | | | (0.31 | ) | |
| | | | | Ratios to Average Net Assets | |
High Yield Fund | | Net asset
value, end
of period | | Total
return2 | | Net assets,
end of
period (in
thousands) | | Expenses,
net of
reimbursement/
waiver | | Expenses,
before
reimbursement/
waiver | | Net
investment
income | |
Class I | |
Six months ended
12/31/2016* | | $ | 12.01 | | | | 8.15 | % | | $ | 2,053,306 | | | | 0.70 | %3 | | | 0.73 | %3 | | | 6.37 | %3 | |
Year ended 6/30/2016 | | | 11.47 | | | | –1.12 | | | | 1,884,613 | | | | 0.70 | | | | 0.74 | | | | 6.59 | | |
Year ended 6/30/2015 | | | 12.51 | | | | –0.26 | | | | 2,060,504 | | | | 0.70 | | | | 0.73 | | | | 5.56 | | |
Year ended 6/30/2014 | | | 13.37 | | | | 11.51 | | | | 1,127,080 | | | | 0.70 | | | | 0.75 | | | | 5.82 | | |
Year ended 6/30/2013 | | | 12.83 | | | | 11.70 | | | | 686,718 | | | | 0.70 | | | | 0.75 | | | | 6.23 | | |
Year ended 6/30/2012 | | | 12.28 | | | | 6.02 | | | | 426,041 | | | | 0.70 | | | | 0.76 | | | | 7.76 | | |
Class A | |
Six months ended
12/31/2016* | | | 11.93 | | | | 7.96 | | | | 536,355 | | | | 0.953 | | | | 0.983 | | | | 6.133 | | |
Year ended 6/30/2016 | | | 11.40 | | | | –1.34 | | | | 603,081 | | | | 0.95 | | | | 0.99 | | | | 6.35 | | |
Year ended 6/30/2015 | | | 12.43 | | | | –0.54 | | | | 682,129 | | | | 0.95 | | | | 0.98 | | | | 5.31 | | |
Year ended 6/30/2014 | | | 13.29 | | | | 11.28 | | | | 607,104 | | | | 0.95 | | | | 1.00 | | | | 5.59 | | |
Year ended 6/30/2013 | | | 12.75 | | | | 11.37 | | | | 410,060 | | | | 0.95 | | | | 1.00 | | | | 5.91 | | |
Year ended 6/30/2012 | | | 12.21 | | | | 5.66 | | | | 105,472 | | | | 0.95 | | | | 1.01 | | | | 7.47 | | |
Class C | |
Six months ended
12/31/2016* | | | 12.01 | | | | 7.61 | | | | 3,320 | | | | 1.703 | | | | 1.733 | | | | 5.353 | | |
Year ended 6/30/2016 | | | 11.47 | | | | –2.02 | | | | 2,737 | | | | 1.70 | | | | 1.74 | | | | 5.61 | | |
Year ended 6/30/2015 | | | 12.50 | | | | –1.25 | | | | 3,581 | | | | 1.70 | | | | 1.73 | | | | 4.53 | | |
Year ended 6/30/2014 | | | 13.36 | | | | 10.40 | | | | 3,623 | | | | 1.70 | | | | 1.75 | | | | 4.72 | | |
Period from
12/31/20127
to 6/30/2013 | | | 12.82 | | | | 1.91 | | | | 812 | | | | 1.703 | | | | 1.743 | | | | 4.733 | | |
| | | Six Months Ended | | Year Ended June 30, | |
| | | December 31, 2016* | | 2016 | | 2015 | | 2014 | | 2013 | | 2012 | |
Portfolio turnover rate | | | 20 | % | | | 45 | % | | | 44 | % | | | 51 | % | | | 66 | % | | | 57 | % | |
1 Net investment income per share has been calculated based on average shares outstanding during the period.
2 Total returns exclude the effects of sales charges. The Fund's investment advisor may have waived a portion of its advisory fee and/or reimbursed a portion of the Fund's expenses. Without such waiver and/or reimbursement, the Fund's performance would have been lower. Returns for periods less than one year are not annualized.
3 Annualized.
4 Redemption fees per share were less than $0.005.
5 Includes redemption fees per share of $0.01.
6 Includes redemption fees per share of $0.02.
7 Commencement of operations.
* Unaudited.
The accompanying notes are an integral part of these financial statements.
67
Notes to the Financial Statements
DECEMBER 31, 2016 (UNAUDITED)
NOTE 1.
Organization. Hotchkis & Wiley Funds (the "Trust") is registered under the Investment Company Act of 1940, as amended (the "1940 Act"), as an open-end, management investment company. The Trust was organized as a Delaware statutory trust on July 23, 2001 and consists of ten series. The Hotchkis & Wiley Diversified Value Fund, the Hotchkis & Wiley Large Cap Value Fund, the Hotchkis & Wiley Mid-Cap Value Fund, the Hotchkis & Wiley Small Cap Value Fund, the Hotchkis & Wiley Small Cap Diversified Value Fund, the Hotchkis & Wiley Global Value Fund, the Hotchkis & Wiley International Value Fund, the Hotchkis & Wiley Capital Income Fund and the Hotchkis & Wiley High Yield Fund (collectively, the "H&W Funds") are each a diversified series and the Hotchkis & Wiley Value Opportunities Fund (together with the H&W Funds, hereafter referred to as the "Funds") is a non-diversified series of the Trust. The Trust was organized to acquire the assets and liabilities of the Mercury HW Large Cap Value Fund, the Mercury HW Mid-Cap Value Fund and the Mercury HW Small Cap Value Fund (the "Mercury HW Funds"). On February 4, 2002, the Mercury HW Funds were reorganized into the Trust through a non-taxable exchange. On August 28, 2009, the Hotchkis & Wiley Core Value Fund was renamed the Hotchkis & Wiley Diversified Value Fund and the Hotchkis & Wiley All Cap Value Fund was renamed the Hotchkis & Wiley Value Opportunities Fund.
The Large Cap Value Fund and Mid-Cap Value Fund have four classes of shares: Class I, Class A, Class C and Class R. The Diversified Value Fund, Small Cap Value Fund, Small Cap Diversified Value Fund, Global Value Fund, International Value Fund, Value Opportunities Fund, Capital Income Fund and High Yield Fund have three classes of shares: Class I, Class A and Class C. Class A shares are sold with a front-end sales charge. Class C shares may be subject to a contingent deferred sales charge. Class C shares are automatically converted to Class A shares approximately eight years after purchase and will then be subject to lower distribution and service fees. All classes of shares have identical voting, dividend, liquidation and other rights and the same terms and conditions, except that Class A, Class C and Class R shares bear certain expenses related to the distribution and servicing expenditures. Currently, the Small Cap Diversified Value Fund, Global Value Fund and Capital Income Fund are not offering Class C shares to investors and the International Value Fund is not offering Class A or Class C shares to investors.
Significant Accounting Policies. The Funds' financial statements have been prepared in conformity with accounting principles generally accepted in the United States of America ("U.S. GAAP"), which may require the use of management accruals and estimates. Actual results could differ from those estimates and those differences could be significant. Each Fund is an investment company and accordingly follows the investment company accounting and reporting guidance of the Financial Accounting Standards Board ("FASB") Accounting Standard Codification Topic 946 "Financial Services — Investment Companies". The following is a summary of significant accounting policies followed by the Funds.
Security Valuation. Portfolio securities that are listed on a securities exchange (whether domestic or foreign) or The Nasdaq Stock Market ("NSM") (including the Nasdaq National Market and the Nasdaq Small Cap Market) are valued at the last reported sale price (or official closing price) on that day as of the close of the New York Stock Exchange (which is generally 4:00 p.m. Eastern time), or, in the absence of recorded sales, at the average between the last bid and asked quotation on such exchange or NSM. Unlisted equity securities that are not included in NSM are valued at the last sale price, or if the last sale price is unavailable, at the average of the quoted bid and asked prices in the over-the-counter market. Fixed-income securities are generally valued on the basis of quotes obtained from an approved independent pricing service but may also be valued based on reported transactions on FINRA's Trade Reporting and Compliance Engine (TRACE) or quotations provided by a broker-dealer. The pricing services may provide a price determined by a matrix pricing method or other analytical pricing models. Investments quoted in foreign currency are valued daily in U.S. dollars on the basis of the foreign currency exchange rate prevailing at the time of valuation. Securities and other assets for which market quotations are not readily available are valued at their fair value as determined by Hotchkis & Wiley Capital Management, LLC (the "Advisor") under guidelines established by and under the general supervision and responsibility of the Trust's Board of Trustees (the "Board"). The Board has approved the use of a third-party vendor's proprietary fair value pricing model to assist in determining current valuation for foreign securities traded in markets that close prior to the New York Stock Exchange. When fair value pricing is employed, the value of the portfolio securities used to calculate the Funds' net asset values may differ from quoted or official closing prices.
The Trust has performed an analysis of all existing investments to determine the significance and character of all inputs to their fair value determination. Various inputs are used in determining the value of each Fund's investments. These inputs are summarized in the following three broad categories:
• Level 1 — Quoted unadjusted prices for identical instruments in active markets to which the Trust has access at the date of measurement.
• Level 2 — Other significant observable inputs (including quoted prices for similar instruments, interest rates, current yields, credit quality, prepayment speeds for mortgage related securities, collateral for asset-backed securities, foreign security indices, foreign exchange rates, fair value estimates for foreign securities, and changes in benchmark securities indices). Level 2 inputs are those in markets for which there are few transactions, the prices are not current, little public information exists or instances where prices vary substantially over time or among brokered market makers.
• Level 3 — Significant unobservable inputs including model derived valuations in which one or more significant inputs or significant value drivers are unobservable. Unobservable inputs are those inputs that reflect the Trust's own assumptions that market participants would use to price the asset or liability based on the best available information.
68
The following table presents the valuation levels of each Fund's assets as of December 31, 2016:
| | | Diversified
Value | | Large Cap
Value | | Mid-Cap
Value | | Small Cap
Value | | Small Cap
Diversified
Value | |
Level 1 — Quoted prices in an active market: | |
Common Stocks | | $ | 128,239,543 | | | $ | 467,535,203 | | | $ | 1,975,851,195 | | | $ | 811,908,367 | | | $ | 18,776,587 | | |
Investment Companies | | | — | | | | — | | | | — | | | | — | | | | 473,240 | | |
Money Market Funds | | | — | | | | — | | | | 6,304,168 | | | | 5,786,516 | | | | — | | |
Level 2 — Other significant observable market inputs: | |
Common Stocks: | |
Energy | | | — | | | | — | | | | 134,920,773 | | | | 8,715,865 | | | | — | | |
Industrials | | | — | | | | — | | | | 51,544,079 | | | | — | | | | — | | |
Time Deposits | | | 182,134 | | | | 16,890,844 | | | | 26,879,532 | | | | 924,023 | | | | 509,524 | | |
Level 3 — Significant unobservable inputs | | | — | | | | — | | | | — | | | | — | | | | — | | |
Total Investments | | $ | 128,421,677 | | | $ | 484,426,047 | | | $ | 2,195,499,747 | | | $ | 827,334,771 | | | $ | 19,759,351 | | |
| | Global
Value | | International
Value | | Value
Opportunities | | Capital
Income | | High Yield | |
Level 1 — Quoted prices in an active market: | |
Common Stocks | | $ | 4,406,931 | | | $ | 622,512 | | | $ | 348,938,284 | | | $ | 17,835,346 | | | $ | 1,116,112 | | |
Investment Companies | | | — | | | | — | | | | 1,057,531 | | | | 102,012 | | | | — | | |
Preferred Stocks | | | — | | | | — | | | | 618,986 | | | | 128,081 | | | | 54,122,134 | | |
Convertible Preferred Stocks | | | — | | | | — | | | | — | | | | 83,613 | | | | 4,296,860 | | |
Warrants | | | — | | | | — | | | | 3,334,329 | | | | — | | | | — | | |
Level 2 — Other significant observable market inputs: | |
Common Stocks: | |
Consumer Discretionary | | | 155,634 | | | | 70,861 | | | | — | | | | — | | | | — | | |
Consumer Staples | | | 75,972 | | | | 33,533 | | | | — | | | | — | | | | — | | |
Energy | | | 471,274 | | | | 139,013 | | | | 32,424,505 | | | | 1,772,729 | | | | — | | |
Energy — Exploration & Production | | | — | | | | — | | | | — | | | | — | | | | 11,362,820 | | |
Financials | | | 637,597 | | | | 374,390 | | | | 14,702,860 | | | | — | | | | — | | |
Health Care | | | 219,739 | | | | 180,581 | | | | — | | | | 147,655 | | | | — | | |
Industrials | | | 905,353 | | | | 390,153 | | | | 40,024,979 | | | | 871,518 | | | | — | | |
Information Technology | | | 53,954 | | | | 104,434 | | | | 3,010,667 | | | | 161,864 | | | | — | | |
Materials | | | — | | | | 42,769 | | | | 1,240,118 | | | | 219,496 | | | | — | | |
Metals/Mining Excluding Steel | | | — | | | | — | | | | — | | | | — | | | | 19,517,968 | | |
Oil Field Equipment & Services | | | — | | | | — | | | | — | | | | — | | | | 5,173,758 | | |
Oil Refining & Marketing | | | — | | | | — | | | | — | | | | — | | | | 705,106 | | |
Telecommunication Services | | | 34,237 | | | | 66,655 | | | | — | | | | — | | | | — | | |
Preferred Stocks: | |
Financials | | | — | | | | — | | | | 1,383,469 | | | | — | | | | — | | |
Corporate Bonds | | | — | | | | — | | | | 37,620,077 | | | | 12,812,529 | | | | 2,291,006,140 | | |
Asset-Backed Securities | | | — | | | | — | | | | — | | | | — | | | | 11,373,439 | | |
Convertible Bonds | | | — | | | | — | | | | — | | | | — | | | | 15,990,947 | | |
Term Loans | | | — | | | | — | | | | 5,628,800 | | | | 604,753 | | | | 75,877,120 | | |
Purchased Put Options | | | — | | | | — | | | | 446,250 | | | | — | | | | — | | |
Warrants | | | — | | | | — | | | | 341,384 | | | | 4,251 | | | | 1,226,951 | | |
Time Deposits | | | 81,813 | | | | 60,422 | | | | 45 | | | | 1,593,849 | | | | 49,751,831 | | |
Level 3 — Significant unobservable inputs: | |
Common Stocks: | |
Automakers | | | — | | | | — | | | | — | | | | — | | | | 0 | | |
Consumer Discretionary | | | — | | | | — | | | | — | | | | 137,669 | | | | — | | |
Specialty Retail | | | — | | | | — | | | | — | | | | — | | | | 11,531,404 | | |
Corporate Bonds | | | — | | | | — | | | | 1,095,002 | | | | 23,954 | | | | 370,340 | | |
Total Investments | | $ | 7,042,504 | | | $ | 2,085,323 | | | $ | 491,867,286 | | | $ | 36,499,319 | | | $ | 2,553,422,930 | | |
Other Financial Instruments | |
Level 1 — Quoted prices in an active market | | | | | | $ | — | | | | | | | $ | — | | |
Level 2 — Other significant observable market inputs: | |
Futures Contracts* | | | | | | | 434,151 | | | | | | | | — | | |
Credit Default Swap Contracts* | | | | | | | — | | | | | | | | (289,548 | ) | |
Level 3 — Significant unobservable inputs | | | | | | | | | — | | | | — | | |
Total Other Financial Instruments | | | | | | $ | 434,151 | | | | | | | $ | (289,548 | ) | |
* Futures contracts and credit default swap contracts are derivative instruments not reflected on the Schedule of Investments and are reflected at the unrealized appreciation (depreciation) on the instrument.
69
Please refer to the Schedule of Investments for additional information regarding the composition of the amounts listed above.
There were transfers from Level 1 to Level 2 of $1,430,032 in the Small Cap Value Fund, $48,437 in the Global Value Fund, $33,109 in the International Value Fund and $2,584,937 in the Value Opportunities Fund using market values as of December 31, 2016. The transfers were due to securities being fair valued as a result of market movements following the close of local trading on December 31, 2016. There were transfers from Level 2 to Level 1 of $13,776 in the Small Cap Diversified Value Fund using market values as of December 31, 2016. The transfers were due to increased trading volume on December 31, 2016. There were transfers from Level 2 to Level 1 of $12,089 in the International Value Fund using market values as of December 31, 2016. The transfers were due to securities being fair valued as a result of market movements following the close of local trading at the beginning of the reporting period. There were transfers from Level 2 to Level 3 of $0 in the Value Opportunities Fund, $0 in the Capital Income Fund and $0 in the High Yield Fund using market values as of December 31, 2016. The transfers were due to lack of observable inputs on December 31, 2016. There were no transfers into or out of Level 1 or Level 2 during the six months ended December 31, 2016 for the Diversified Value Fund, Large Cap Value Fund and Mid-Cap Value Fund. Transfers between Levels are recognized at the end of the reporting period.
Income and Expense Allocation. Common expenses incurred by the Trust which are not allocable to a specific Fund are allocated among the Funds based upon relative net assets or evenly, depending on the nature of the expenditure. For all Funds, except the Capital Income Fund and High Yield Fund, net investment income, other than class-specific expenses, and realized and unrealized gains and losses are allocated daily to each class of shares based upon the relative net asset value of outstanding shares of each class at the beginning of the day (after adjusting for the current day's capital share activity of the respective class). For the Capital Income Fund and High Yield Fund, net investment income, other than class-specific expenses, and realized and unrealized gains and losses are allocated daily to each class of shares based upon the relative net asset value of settled shares of each class at the beginning of the day (after adjusting for the current day's capital share activity of the respective class).
Dividends and Distributions to Shareholders. Dividends and distributions to shareholders are recorded on the ex-dividend date. Dividends from net investment income are declared daily and paid monthly for the Capital Income Fund and High Yield Fund and declared and paid annually for the Diversified Value Fund, Large Cap Value Fund, Mid-Cap Value Fund, Small Cap Value Fund, Small Cap Diversified Value Fund, Global Value Fund, International Value Fund and Value Opportunities Fund. Distributions of net realized capital gains, if any, will be declared and paid at least annually.
Security Transactions and Investment Income. Security and shareholder transactions are recorded on trade date. Realized gains and losses on sales of investments are calculated on the specifically identified cost basis of the securities. Dividend income, less foreign taxes withheld, if any, is recorded on the ex-dividend date. Interest income is recognized on the accrual basis. Market discounts, premiums and original issue discounts on fixed-income securities are amortized daily over the expected life of the security using the effective yield method. Return of capital distributions received from real estate investment trust ("REIT") securities are recorded as an adjustment to the cost of the security and thus may impact unrealized gains or losses on the security.
Securities purchased or sold on a when-issued, delayed delivery or forward commitment basis may have extended settlement periods. The value of the security purchased is subject to market fluctuations during this period. The Funds will segregate or "earmark" liquid assets until the settlement date or otherwise cover their position in an amount sufficient to meet the Funds' obligations.
Foreign Currency Transactions. Securities and other assets and liabilities denominated in foreign currencies are translated into U.S. dollar amounts at the date of valuation. Purchases and sales of securities and income and expense items denominated in foreign currencies are translated into U.S. dollar amounts on the respective dates of such transactions. The Funds isolate the portion of realized gains or losses resulting from changes in foreign exchange rates on securities from the fluctuations arising from changes in market prices of securities held. Reported net realized foreign exchange gains or losses arise from sales of securities, currency gains or losses realized between the trade and settlement dates on securities transactions and the difference between the amounts of dividends, interest and foreign withholding taxes recorded on the Funds' books and the U.S. dollar equivalent of the amounts actually received or paid.
Payment In-Kind Securities. Certain Funds may invest in payment in-kind securities. Payment in-kind securities give the issuer the option at each interest payment date of making interest payments in either cash or additional debt securities. Those additional debt securities usually have the same terms, including maturity dates and interest rates, and associated risks as the original bonds. The daily market quotations of the original bonds may include the accrued interest (referred to as a dirty price) and may require a pro-rata adjustment to interest receivable from the unrealized appreciation or depreciation of securities on the Statements of Assets & Liabilities.
Restricted and Illiquid Securities. The Funds may invest in securities that are subject to legal or contractual restrictions on resale or are illiquid. Restricted securities generally may be resold in transactions exempt from registration. An illiquid security is a security which cannot be disposed of promptly (within seven days) and in the usual course of business at approximately its fair value and includes repurchase agreements maturing in excess of seven days, time deposits with a withdrawal penalty, non-negotiable instruments and instruments for which no market exists. Disposal of these securities may involve time-consuming negotiations and expense, and prompt sale at the current valuation may be difficult.
Options. The Funds are subject to equity price risk in the normal course of pursuing their investment objectives. The Funds may purchase put options on securities to protect holdings in an underlying or related security against a substantial decline in market value. The Funds may purchase call options on securities and security indexes. A Fund may write a call or put option only if the option is "covered" by the Fund holding a position in the underlying securities or by other means which would permit immediate satisfaction of the Fund's obligation as writer of the option. Prior to exercise or expiration, an option may be closed by an offsetting purchase or sale of an option of the same series. The purchase and writing of options involves certain risks. If a put or call option purchased by a Fund is not sold when it has remaining value, and if the market price of the underlying security, in the case of a put, remains equal to or greater than the exercise price or, in the case of a call, remains less than or equal to the exercise price, the Fund will lose its entire investment in the option. There can be no assurance that a liquid market will exist when a Fund seeks to close out an option position. Furthermore, if trading restrictions or suspensions are imposed on the options markets, the Fund may be unable to close out a position. With options, there is minimal counterparty risk to the Funds since options are exchange traded and the exchange's clearinghouse, as counterparty to all exchange traded options, guarantees the options against default.
70
When a Fund purchases a put or call option, an amount equal to the premium paid is included on the Statements of Assets & Liabilities as an investment, and is subsequently adjusted to reflect the fair market value of the option. If an option expires on the stipulated expiration date or if the Fund enters into a closing sale transaction, a gain or loss is realized. If the Fund exercises a put option, a gain or loss is realized from the sale of the underlying security, and the proceeds from such sale are decreased by the premium originally paid. If the Fund exercises a call option, the cost of the security acquired is increased by the premium paid for the call.
Futures Contracts. The Value Opportunities Fund is subject to foreign currency exchange rate risk in the normal course of pursuing its investment objective. The Fund may use futures contracts to gain exposure to, or hedge against, changes in the value of foreign currencies. A futures contract provides for the future sale by one party and purchase by another party of an asset at a specified price on a specified date. Upon entering into such contracts, the Fund is required to deposit with the broker, either in cash or securities, an initial margin deposit in an amount equal to a certain percentage of the contract amount. Subsequent payments (variation margin) are made or received by the Fund each day, depending on the daily fluctuations in the value of the contract, and are recorded for financial statement purposes as unrealized gains or losses by the Fund. Upon entering into such contracts, the Fund bears the risk of exchange rates moving unexpectedly, in which case the Fund may not achieve the anticipated benefits of the futures contracts and may realize a loss. When a contract is closed, the Fund records a realized gain or loss equal to the difference between the proceeds from (or cost of) the closing transaction and the Fund's basis in the contract. With futures, there is minimal counterparty risk to the Fund since futures are exchange traded and the exchange's clearinghouse, as counterparty to all exchange traded futures, guarantees the futures against default. The use of futures contracts involves the risk of imperfect correlation in movements in the price of the futures contracts, exchange rates and the underlying hedged assets.
Credit Default Swap Contracts. The Value Opportunities Fund, Capital Income Fund and High Yield Fund may enter into credit default swap agreements for purposes of attempting to obtain a particular desired return at a lower cost to the Fund than if the Fund had invested directly in an instrument that yielded the desired return. The buyer in a credit default swap is obligated to pay the seller a periodic stream of payments over the term of the contract provided no event of default on an underlying reference obligation has occurred. In the event of default, the seller must pay the buyer a net settlement amount in the form of cash or securities equal to the notional amount of the swap less the recovery value of the referenced entity or underlying securities comprising the referenced index. Credit default swaps involve greater risks than if the Fund invested in the reference obligation directly. In addition to general market risks, credit default swaps are subject to illiquidity risk, counterparty risk and credit risk. The Fund's maximum risk of loss from counterparty risk, either as the protection seller or as the protection buyer, is the fair value of the contract. This risk is mitigated by having a master netting arrangement between the Fund and the counterparty and by the posting of collateral by the counterparty to the Fund to cover the Fund's exposure to the counterparty.
The Value Opportunities Fund, Capital Income Fund and High Yield Fund are party to an International Swap Dealers Association, Inc. Master Agreement ("ISDA Master Agreement") with each of Goldman Sachs International and JPMorgan Chase Bank, N.A. that governs transactions, such as over-the-counter swap contracts, entered into by the Funds and the counterparty. The ISDA Master Agreement contains provisions for general obligations, representations, agreements, collateral and events of default or termination. Events of termination include conditions that may entitle the counterparty to elect to terminate early and cause settlement of all outstanding transactions under the ISDA Master Agreement.
Upon entering into swap agreements, the Value Opportunities Fund, Capital Income Fund and High Yield Fund will either receive or pay an upfront payment based upon the difference between the current principal amount and the notional amount of the swap and whether the Fund is buying or selling protection. Upfront payments that are received are recorded as liabilities while upfront payments paid are recorded as assets. These payments remain on the books until the swap contract is closed. When entering into credit default swaps, the Fund will either deliver collateral to the counterparty or the counterparty will deliver collateral to the Fund. The amount of this collateral is calculated based upon the notional value and the current price of the swap. In the event of default, the Fund has recourse against any collateral posted to it by the counterparty. When entering into swap agreements as a seller, the notional amounts would be partially offset by any recovery values of the respective reference obligations, upfront payments received upon entering into the agreement, or net amounts received from the settlement of buy protection credit default swap agreements entered into by the Fund for the same reference entity. Unrealized appreciation or depreciation is recorded daily as the difference between the prior day and current day closing price.
Derivative Instruments. The following is a summary of the Funds' derivative instrument holdings categorized by primary risk exposure as of December 31, 2016:
Asset Derivatives
| | Location on Statements of
Assets & Liabilities | | Value
Opportunities | | High
Yield | |
Equity Contracts: | |
Purchased Put Options | | Long-term investments | | $ | 446,250 | | | $ | — | | |
Foreign Exchange Contracts: | |
| Futures Contracts | | Net unrealized appreciation of
futures contracts* | | | 434,151 | | | | — | | |
Liability Derivatives | |
| | Location on Statements of
Assets & Liabilities | | Value
Opportunities | | High
Yield | |
Credit Contracts: | |
Credit Default Swap Contracts
| | Premiums received for credit default
swap contracts | | $ | — | | | $ | 509,469 | | |
| | | Unrealized depreciation on credit
default swap contracts | | | — | | | | 289,548 | | |
* Includes cumulative appreciation of futures contracts as reported in the "Net Assets consist of:" section on the Statements of Assets & Liabilities.
71
The following is a summary of the Funds' realized gains and change in unrealized depreciation on derivative instruments recognized in the Statements of Operations categorized by primary risk exposure for the six months ended December 31, 2016:
Realized Gains on Derivatives
| | Value Opportunities | | High Yield | |
Credit Contracts: | |
Credit Default Swap Contracts | | $ | — | | | $ | 125,098 | | |
Equity Contracts: | |
Purchased Put Options | | | — | | | | — | | |
Foreign Exchange Contracts: | |
Futures Contracts | | | 1,481,345 | | | | — | | |
Change in Unrealized Depreciation on Derivatives | |
| | Value Opportunities | | High Yield | |
Credit Contracts: | |
Credit Default Swap Contracts | | $ | — | | | $ | (520,399 | ) | |
Equity Contracts: | |
Purchased Put Options | | | (1,407,750 | )* | | | — | | |
Foreign Exchange Contracts: | |
Futures Contracts | | | (905,662 | ) | | | — | | |
* Included with net change in unrealized appreciation (depreciation) of securities and foreign currency transactions
The following is a summary of the Funds' average quarterly balance of outstanding derivative instruments categorized by primary risk exposure for the six months ended December 31, 2016:
Average Quarterly Balance of Outstanding Derivatives
| | Value Opportunities | | High Yield | |
Credit Contracts: | |
Average Number of Contracts — Credit Default Swap Contracts | | | — | | | | 1 | | |
Average Notional Amount — Credit Default Swap Contracts | | $ | — | | | $ | 24,516,667 | | |
Equity Contracts: | |
Average Number of Contracts — Purchased Put Options | | | 4,500 | | | | — | | |
Average Market Value — Purchased Put Options | | $ | 1,206,333 | | | $ | — | | |
Foreign Exchange Contracts: | |
| Average Number of Contracts — Futures Contracts | | | 238 | | | | — | | |
Average Notional Amount — Futures Contracts | | $ | 21,459,201 | | | $ | — | | |
Offsetting Assets and Liabilities. The Funds are subject to various master netting arrangements, which govern the terms of certain transactions with counterparties. The arrangements allow the Funds to close out and net their total exposure to a counterparty in the event of a default with respect to all the transactions governed under a single agreement with a counterparty. For financial reporting purposes, the Funds do not offset financial assets and liabilities that are subject to master netting arrangements in the Statements of Assets & Liabilities.
The following is a summary of the arrangements subject to offsetting as of December 31, 2016:
| | | | | | | | | Gross Amounts Not Offset in the
Statements of Assets & Liabilities | |
| | Gross Amounts | | Gross Amounts
Offset in the
Statements of
Assets &
Liabilities | | Net Amounts
Presented in the
Statements of
Assets &
Liabilities | | Financial
Instruments | | Collateral
Pledged
(Received) | | Net Amount | |
Liabilities: | |
Credit Default Swap Contracts: | |
High Yield | | $ | 289,548 | | | $ | — | | | $ | 289,548 | | | $ | 289,548 | | | $ | — | | | $ | — | | |
Futures Contracts: | |
Value Opportunities | | | 35,600 | | | | — | | | | 35,600 | | | | — | | | | 35,600 | | | | — | | |
Securities Lending: | |
Mid-Cap Value | | | 6,304,168 | | | | — | | | | 6,304,168 | | | | 6,304,168 | | | | — | | | | — | | |
Small Cap Value | | | 5,786,516 | | | | — | | | | 5,786,516 | | | | 5,786,516 | | | | — | | | | — | | |
72
NOTE 2.
Fees and Transactions with Affiliates. The Trust has entered into Investment Advisory Agreements for each of the Funds with the Advisor, with which the officers and a Trustee of the Trust are affiliated. The Advisor is a limited liability company, the primary members of which are HWCap Holdings, a limited liability company with members who are current and former employees of the Advisor, and Stephens - H&W, LLC, a limited liability company whose primary member is SF Holding Corp., which is a diversified holding company. The Advisor is responsible for the management of the Funds' investments and provides the personnel, facilities, equipment and certain other services necessary to the operations of each Fund. The Advisor receives a fee, computed daily and payable monthly, at the annual rates presented below as applied to each Fund's daily net assets. The Advisor has contractually agreed to waive fees or reimburse regular operating expenses in excess of the annual rates presented below as applied to such Fund's daily net assets through October 31, 2017.
| | | Diversified
Value | | Large Cap
Value | | Mid-Cap
Value | | Small Cap
Value | | Small Cap
Diversified
Value | | Global
Value | | International
Value | | Value
Opportunities | | Capital
Income | | High
Yield | |
Annual Advisory
Fee Rate | | | 0.75 | %1 | | | 0.75 | %1 | | | 0.75 | %1 | | | 0.75 | % | | | 0.65 | % | | | 0.80 | % | | | 0.85 | % | | | 0.75 | % | | | 0.65 | % | | | 0.55 | % | |
Annual cap on
expenses — Class I | | | 0.95 | % | | | 1.05 | % | | | 1.15 | % | | | 1.25 | % | | | 0.90 | % | | | 1.10 | % | | | 1.15 | % | | | 1.25 | % | | | 0.80 | % | | | 0.70 | % | |
Annual cap on
expenses — Class A | | | 1.20 | % | | | 1.30 | % | | | 1.40 | % | | | 1.50 | % | | | 1.15 | % | | | 1.35 | % | | | 1.40 | % | | | 1.50 | % | | | 1.05 | % | | | 0.95 | % | |
Annual cap on
expenses — Class C | | | 1.95 | % | | | 2.05 | % | | | 2.15 | % | | | 2.25 | % | | | 1.90 | % | | | 2.10 | % | | | 2.15 | % | | | 2.25 | % | | | 1.80 | % | | | 1.70 | % | |
Annual cap on
expenses — Class R | | | N/A | | | | 1.55 | % | | | 1.65 | % | | | N/A | | | | N/A | | | | N/A | | | | N/A | | | | N/A | | | | N/A | | | | N/A | | |
1 The Annual Advisory Fee Rate is 0.75% for the first $5 billion in assets, 0.65% for the next $5 billion in assets and 0.60% for assets over $10 billion.
U.S. Bancorp Fund Services, LLC, the Funds' administrator, agreed to waive a portion of its administration and accounting fees during the International Value Fund's first twelve months of operations.
Quasar Distributors, LLC is the principal underwriter and distributor for the shares of the Funds ("Quasar" or the "Distributor"). The Distributor is affiliated with the Funds' transfer agent, fund accountant and administrator, U.S. Bancorp Fund Services, LLC. Pursuant to the Distribution Plan adopted by the Trust in accordance with Rule 12b-1 under the 1940 Act, the Funds pay the Distributor ongoing distribution and service fees. The fees are accrued daily at the annual rates based upon the average daily net assets of the shares as follows:
| | | Distribution and Service
Fee | |
Class A | | | 0.25 | % | |
Class C | | | 1.00 | % | |
Class R | | | 0.50 | % | |
Pursuant to separate agreements with the Distributor, selected dealers and other financial intermediaries also provide distribution services to the Funds. The ongoing distribution and service fee compensates the Distributor and selected dealers for providing distribution-related and shareholder services to Class A, Class C and Class R shareholders.
Certain selected dealers and other financial intermediaries charge a fee for shareholder accounting services and administrative services that they provide to the Funds on behalf of certain shareholders; the portion of this fee paid by the Funds is included within "Transfer agent fees and expenses" in the Statements of Operations.
Stephens Inc. is an affiliated broker-dealer of the Funds. For the six months ended December 31, 2016, Stephens Inc. did not receive any front-end sales charges for Class A shares.
The Funds are permitted to purchase securities from or sell securities to another Fund or affiliated person under procedures adopted by the Board. During the six months ended December 31, 2016, the Funds' purchases and sales of securities pursuant to Rule 17a-7 under the 1940 Act were as follows:
| | Diversified
Value | | Large Cap
Value | | Mid-Cap
Value | | Small Cap
Value | | Small Cap
Diversified
Value | | Global
Value | | International
Value | | Value
Opportunities | | Capital
Income | | High Yield | |
Purchases | | $ | — | | | $ | — | | | $ | — | | | $ | — | | | $ | — | | | $ | — | | | $ | — | | | $ | — | | | $ | — | | | $ | 9,291,290 | | |
Sales | | | — | | | | — | | | | — | | | | 475,735 | * | | | — | | | | — | | | | — | | | | 4,019,250 | * | | | 3,675,514 | * | | | 4,353,887 | * | |
* Resulted in a realized gain of $408,203 for the Value Opportunities Fund and a realized loss of $(1,448,083) for the Small Cap Value Fund, $(86,016) for the Capital Income Fund and $(125,943) for the High Yield Fund.
73
NOTE 3.
Investments. Purchases and sales of investment securities, excluding short-term investments, for the six months ended December 31, 2016 were as follows:
| | Diversified
Value | | Large Cap
Value | | Mid-Cap
Value | | Small Cap
Value | | Small Cap
Diversified
Value | | Global
Value | | International
Value | | Value
Opportunities | | Capital
Income | | High Yield | |
Purchases | | $ | 27,874,868 | | | $ | 65,420,034 | | | $ | 368,554,848 | | | $ | 88,868,800 | | | $ | 1,913,020 | | | $ | 1,937,430 | | | $ | 345,931 | | | $ | 219,427,587 | | | $ | 9,487,232 | | | $ | 520,386,033 | | |
Sales | | | 310,941,796 | | | | 148,506,046 | | | | 705,667,681 | | | | 278,737,935 | | | | 1,323,997 | | | | 1,287,037 | | | | 386,314 | | | | 269,082,508 | | | | 16,686,361 | | | | 491,210,748 | | |
The Funds did not have any purchases or sales of U.S. Government securities for the six months ended December 31, 2016.
NOTE 4.
Federal Income Taxes. It is each Fund's policy to comply with the requirements of the Internal Revenue Code applicable to regulated investment companies and each Fund intends to distribute substantially all of its investment company net taxable income and net capital gains to shareholders. Therefore, no federal income tax provision is required. Under the applicable foreign tax law, a withholding tax may be imposed on interest, dividends and capital gains at various rates.
Distributions paid to shareholders are based on net investment income and net realized gains determined on a tax basis, which may differ from net investment income and net realized gains for financial reporting purposes. The fiscal year in which amounts are distributed may differ from the year in which the net investment income and net realized gains are recorded by the Funds for financial reporting purposes. The Funds may utilize earnings and profits distributed to shareholders on redemptions of shares as part of the dividends paid deduction. Generally accepted accounting principles require that permanent financial reporting and tax differences be reclassified within the capital accounts.
The following information is presented on an income tax basis as of June 30, 2016:
| | | Diversified
Value | | Large Cap
Value | | Mid-Cap
Value | | Small Cap
Value | | Small Cap
Diversified
Value | | Global
Value | | International
Value | | Value
Opportunities | | Capital
Income | | High Yield | |
Tax cost of
investments | | $ | 470,934,545 | | | $ | 600,002,841 | | | $ | 2,478,267,171 | | | $ | 872,357,679 | | | $ | 14,829,087 | | | $ | 5,790,623 | | | $ | 1,910,019 | | | $ | 518,831,532 | | | $ | 41,770,724 | | | $ | 2,556,386,059 | | |
Gross unrealized
appreciation | | | 22,265,268 | | | | 18,153,306 | | | | 177,675,608 | | | | 99,453,470 | | | | 1,391,353 | | | | 445,535 | | | | 75,413 | | | | 30,871,476 | | | | 2,248,076 | | | | 47,974,738 | | |
Gross unrealized
depreciation | | | (114,590,593 | ) | | | (136,983,534 | ) | | | (600,429,637 | ) | | | (149,446,841 | ) | | | (1,677,255 | ) | | | (920,873 | ) | | | (171,613 | ) | | | (95,896,402 | ) | | | (6,366,618 | ) | | | (248,318,003 | ) | |
Net unrealized
depreciation | | | (92,325,325 | ) | | | (118,830,228 | ) | | | (422,754,029 | ) | | | (49,993,371 | ) | | | (285,902 | ) | | | (475,338 | ) | | | (96,200 | ) | | | (65,024,926 | ) | | | (4,118,542 | ) | | | (200,343,265 | ) | |
Distributable
ordinary income
(as of 6/30/16) | | | 6,410,766 | | | | 8,826,124 | | | | — | | | | 1,403,606 | | | | 47,852 | | | | 50,914 | | | | 52,402 | | | | 6,163,835 | | | | 201,332 | | | | 2,838,591 | | |
Distributable
long-term gains
(as of 6/30/16) | | | — | | | | — | | | | 16,229,261 | | | | — | | | | — | | | | — | | | | — | | | | — | | | | — | | | | — | | |
Total distributable
earnings | | | 6,410,766 | | | | 8,826,124 | | | | 16,229,261 | | | | 1,403,606 | | | | 47,852 | | | | 50,914 | | | | 52,402 | | | | 6,163,835 | | | | 201,332 | | | | 2,838,591 | | |
Other accumulated
losses | | | (588,079,310 | ) | | | (1,013,032,925 | ) | | | (15,916 | ) | | | (72,743,656 | ) | | | (672,319 | ) | | | (207,376 | ) | | | (282 | ) | | | (12,067,110 | ) | | | (2,426,746 | ) | | | (60,034,769 | ) | |
Total accumulated
losses | | $ | (673,993,869 | ) | | $ | (1,123,037,029 | ) | | $ | (406,540,684 | ) | | $ | (121,333,421 | ) | | $ | (910,369 | ) | | $ | (631,800 | ) | | $ | (44,080 | ) | | $ | (70,928,201 | ) | | $ | (6,343,956 | ) | | $ | (257,539,443 | ) | |
As of the close of business on December 31, 2010, in exchange for shares the Advisor transferred assets valued at $3,298,650 to the Capital Income Fund. As a result of the tax-deferred transfers, the Capital Income Fund acquired $30,179 of unrealized appreciation for tax purposes. As of June 30, 2016, the Capital Income Fund no longer held any securities relating to the transfers.
As of the close of business on December 31, 2012, in exchange for shares the Advisor transferred assets valued at $1,132,946 to the Global Value Fund. As a result of the tax-deferred transfers, the Global Value Fund acquired $50,230 of unrealized appreciation for tax purposes. As of June 30, 2016, the Global Value Fund held securities with $36,636 of net unrealized appreciation relating to the transfers.
As of the close of business on June 30, 2014, in exchange for shares Stephens Investment Holdings LLC transferred assets valued at $5,038,896 to the Small Cap Diversified Value Fund. As a result of the tax-deferred transfers, the Small Cap Diversified Value Fund acquired $592,438 of unrealized appreciation for tax purposes. As of June 30, 2016, the Small Cap Diversified Value Fund held securities with $137,277 of net unrealized appreciation relating to the transfers.
74
The tax components of distributions paid during the fiscal years ended June 30, 2016 and 2015, capital loss carryovers as of June 30, 2016, and any tax basis late year losses as of June 30, 2016, which are not recognized for tax purposes until the first day of the following fiscal year, are:
| | | June 30, 2016 | | June 30, 2015 | |
| | | Ordinary
Income
Distributions | | Long-Term
Capital Gains
Distributions | | Net Capital
Loss
Carryovers | | Capital Loss
Carryovers
Utilized | | Late
Year
Losses | | Ordinary
Income
Distributions | | Long-Term
Capital Gains
Distributions | |
Diversified Value | | $ | 6,654,007 | | | $ | — | | | $ | (588,079,310 | )1 | | $ | 45,494,662 | | | $ | — | | | $ | 12,803,931 | | | $ | — | | |
Large Cap Value | | | 9,065,263 | | | | — | | | | (1,013,032,925 | )2 | | | 43,985,617 | | | | — | | | | 21,717,397 | | | | — | | |
Mid-Cap Value | | | 55,712,891 | | | | 263,752,268 | | | | — | | | | — | | | | — | | | | 44,412,431 | | | | 266,887,010 | | |
Small Cap Value | | | 13,927,630 | | | | 92,024,596 | | | | — | | | | — | | | | 72,744,177 | | | | 20,071,822 | | | | 100,654,562 | | |
Small Cap Diversified Value | | | 106,389 | | | | 354,630 | | | | — | | | | — | | | | 660,933 | | | | 102,942 | | | | 42,529 | | |
Global Value | | | 149,795 | | | | 212,477 | | | | — | | | | — | | | | 207,308 | | | | 190,514 | | | | 215,575 | | |
International Value* | | | — | | | | — | | | | — | | | | — | | | | — | | | | — | | | | — | | |
Value Opportunities | | | 38,433,633 | | | | 42,273,973 | | | | (12,068,399 | )3 | | | — | | | | — | | | | 16,452,433 | | | | 30,736,003 | | |
Capital Income | | | 2,852,349 | | | | 1,410,337 | | | | — | | | | — | | | | 2,379,969 | | | | 3,371,754 | | | | 713,388 | | |
High Yield | | | 165,642,889 | | | | 13,331,886 | | | | — | | | | — | | | | 57,142,871 | | | | 124,042,629 | | | | 14,239,999 | | |
* The Fund commenced operations on December 31, 2015.
1 $346,542,049 expires on 6/30/2017 and $241,537,261 expires on 6/30/2018.
2 $570,436,487 expires on 6/30/2017 and $442,596,438 expires on 6/30/2018.
3 $10,130,130 is short-term with no expiration and $1,938,269 is long-term with no expiration.
As of and during the year ended June 30, 2016, the Funds did not have a liability for any unrecognized tax benefits. The Funds recognize interest and penalties, if any, related to unrecognized tax benefits as income tax expense in the Statements of Operations. During the year ended June 30, 2016, the Funds did not incur any interest or penalties. The tax years ended June 30, 2013 through June 30, 2016 remain open and subject to examination by tax jurisdictions.
NOTE 5.
Capital Share Transactions. Transactions in capital shares for each class were as follows:
| | Sales | | Reinvestment of
dividends
and distributions | | Redemptions | | Net increase (decrease) | |
| | Shares | | Amount | | Shares | | Amount | | Shares | | Amount | | Shares | | Amount | |
Six Months Ended December 31, 2016 | |
Diversified Value Fund | |
Class I | | | 316,989 | | | $ | 4,801,810 | | | | 244,219 | | | $ | 4,041,821 | | | | (19,271,926 | ) | | $ | (290,152,160 | ) | | | (18,710,718 | ) | | $ | (281,308,529 | ) | |
Class A | | | 40,468 | | | | 645,925 | | | | 54,517 | | | | 905,529 | | | | (251,737 | ) | | | (3,882,253 | ) | | | (156,752 | ) | | | (2,330,799 | ) | |
Class C | | | 10,413 | | | | 166,321 | | | | 4,952 | | | | 81,656 | | | | (66,176 | ) | | | (994,347 | ) | | | (50,811 | ) | | | (746,370 | ) | |
Total net increase
(decrease) | | | 367,870 | | | | 5,614,056 | | | | 303,688 | | | | 5,029,006 | | | | (19,589,839 | ) | | | (295,028,760 | ) | | | (18,918,281 | ) | | | (284,385,698 | ) | |
Large Cap Value Fund | |
Class I | | | 717,997 | | | | 19,613,104 | | | | 194,155 | | | | 5,706,224 | | | | (2,727,055 | ) | | | (73,662,097 | ) | | | (1,814,903 | ) | | | (48,342,769 | ) | |
Class A | | | 203,816 | | | | 5,597,070 | | | | 65,925 | | | | 1,927,647 | | | | (893,820 | ) | | | (23,787,862 | ) | | | (624,079 | ) | | | (16,263,145 | ) | |
Class C | | | 17,254 | | | | 458,599 | | | | 2,686 | | | | 77,122 | | | | (157,855 | ) | | | (4,087,662 | ) | | | (137,915 | ) | | | (3,551,941 | ) | |
Class R | | | 63,248 | | | | 1,759,978 | | | | 4,446 | | | | 130,667 | | | | (66,380 | ) | | | (1,779,202 | ) | | | 1,314 | | | | 111,443 | | |
Total net increase
(decrease) | | | 1,002,315 | | | | 27,428,751 | | | | 267,212 | | | | 7,841,660 | | | | (3,845,110 | ) | | | (103,316,823 | ) | | | (2,575,583 | ) | | | (68,046,412 | ) | |
Mid-Cap Value Fund | |
Class I | | | 4,119,979 | | | | 139,481,470 | | | | 667,636 | | | | 25,370,176 | | | | (10,792,908 | ) | | | (359,116,546 | ) | | | (6,005,293 | ) | | | (194,264,900 | ) | |
Class A | | | 526,830 | | | | 17,911,554 | | | | 79,503 | | | | 2,978,963 | | | | (2,768,435 | ) | | | (91,083,162 | ) | | | (2,162,102 | ) | | | (70,192,645 | ) | |
Class C | | | 35,697 | | | | 1,115,168 | | | | 19,068 | | | | 633,072 | | | | (574,139 | ) | | | (16,579,176 | ) | | | (519,374 | ) | | | (14,830,936 | ) | |
Class R | | | 126,487 | | | | 4,134,550 | | | | 2,932 | | | | 110,120 | | | | (114,590 | ) | | | (3,831,081 | ) | | | 14,829 | | | | 413,589 | | |
Total net increase
(decrease) | | | 4,808,993 | | | | 162,642,742 | | | | 769,139 | | | | 29,092,331 | | | | (14,250,072 | ) | | | (470,609,965 | ) | | | (8,671,940 | ) | | | (278,874,892 | ) | |
Small Cap Value Fund | |
Class I | | | 891,163 | | | | 46,649,434 | | | | 31,464 | | | | 1,872,419 | | | | (4,028,986 | ) | | | (206,812,589 | ) | | | (3,106,359 | ) | | | (158,290,736 | ) | |
Class A | | | 124,588 | | | | 6,555,291 | | | | — | | | | — | | | | (840,057 | ) | | | (42,661,060 | ) | | | (715,469 | ) | | | (36,105,769 | ) | |
Class C | | | 5,530 | | | | 243,073 | | | | — | | | | — | | | | (101,847 | ) | | | (4,357,718 | ) | | | (96,317 | ) | | | (4,114,645 | ) | |
Total net increase
(decrease) | | | 1,021,281 | | | | 53,447,798 | | | | 31,464 | | | | 1,872,419 | | | | (4,970,890 | ) | | | (253,831,367 | ) | | | (3,918,145 | ) | | | (198,511,150 | ) | |
75
| | | Sales | | Reinvestment of
dividends
and distributions | | Redemptions | | Net increase (decrease) | |
| | | Shares | | Amount | | Shares | | Amount | | Shares | | Amount | | Shares | | Amount | |
Six Months Ended December 31, 2016 | |
Small Cap Diversified Value Fund | |
Class I | | | 1,024 | | | $ | 10,305 | | | | 12,237 | | | $ | 145,133 | | | | (4 | ) | | $ | (47 | ) | | | 13,257 | | | $ | 155,391 | | |
Class A | | | 27,336 | | | | 320,755 | | | | 142 | | | | 1,679 | | | | (889 | ) | | | (9,902 | ) | | | 26,589 | | | | 312,532 | | |
Total net increase
(decrease) | | | 28,360 | | | | 331,060 | | | | 12,379 | | | | 146,812 | | | | (893 | ) | | | (9,949 | ) | | | 39,846 | | | | 467,923 | | |
Global Value Fund | |
Class I | | | 65,132 | | | | 750,581 | | | | 4,453 | | | | 53,569 | | | | (10,001 | ) | | | (112,715 | ) | | | 59,584 | | | | 691,435 | | |
Class A | | | 8,234 | | | | 89,995 | | | | 76 | | | | 911 | | | | (212 | ) | | | (2,505 | ) | | | 8,098 | | | | 88,401 | | |
Total net increase
(decrease) | | | 73,366 | | | | 840,576 | | | | 4,529 | | | | 54,480 | | | | (10,213 | ) | | | (115,220 | ) | | | 67,682 | | | | 779,836 | | |
International Value Fund | |
Class I | | | — | | | | — | | | | 7,205 | | | | 77,168 | | | | — | | | | — | | | | 7,205 | | | | 77,168 | | |
Total net increase | | | — | | | | — | | | | 7,205 | | | | 77,168 | | | | — | | | | — | | | | 7,205 | | | | 77,168 | | |
Value Opportunities Fund | |
Class I | | | 1,449,192 | | | | 36,524,026 | | | | 152,247 | | | | 4,107,620 | | | | (1,719,753 | ) | | | (41,602,146 | ) | | | (118,314 | ) | | | (970,500 | ) | |
Class A | | | 536,377 | | | | 13,610,045 | | | | 69,948 | | | | 1,890,685 | | | | (1,632,380 | ) | | | (39,553,256 | ) | | | (1,026,055 | ) | | | (24,052,526 | ) | |
Class C | | | 116,218 | | | | 2,685,547 | | | | 22,269 | | | | 562,082 | | | | (762,735 | ) | | | (17,147,879 | ) | | | (624,248 | ) | | | (13,900,250 | ) | |
Total net increase
(decrease) | | | 2,101,787 | | | | 52,819,618 | | | | 244,464 | | | | 6,560,387 | | | | (4,114,868 | ) | | | (98,303,281 | ) | | | (1,768,617 | ) | | | (38,923,276 | ) | |
Capital Income Fund | |
Class I | | | 92,895 | | | | 1,098,476 | | | | 22,185 | | | | 253,301 | | | | (838,296 | ) | | | (9,282,970 | ) | | | (723,216 | ) | | | (7,931,193 | ) | |
Class A | | | 327,704 | | | | 3,948,488 | | | | 26,397 | | | | 313,976 | | | | (246,094 | ) | | | (2,876,101 | ) | | | 108,007 | | | | 1,386,363 | | |
Total net increase
(decrease) | | | 420,599 | | | | 5,046,964 | | | | 48,582 | | | | 567,277 | | | | (1,084,390 | ) | | | (12,159,071 | ) | | | (615,209 | ) | | | (6,544,830 | ) | |
High Yield Fund | |
Class I | | | 29,355,855 | | | | 348,911,572 | | | | 4,050,576 | | | | 48,172,200 | | | | (26,652,201 | ) | | | (316,977,502 | )1 | | | 6,754,230 | | | | 80,106,270 | | |
Class A | | | 3,005,334 | | | | 35,153,764 | | | | 1,504,952 | | | | 17,779,189 | | | | (12,458,728 | ) | | | (146,698,294 | )1 | | | (7,948,442 | ) | | | (93,765,341 | ) | |
Class C | | | 77,821 | | | | 927,915 | | | | 3,445 | | | | 40,973 | | | | (43,424 | ) | | | (511,499 | )1 | | | 37,842 | | | | 457,389 | | |
Total net increase
(decrease) | | | 32,439,010 | | | | 384,993,251 | | | | 5,558,973 | | | | 65,992,362 | | | | (39,154,353 | ) | | | (464,187,295 | ) | | | (1,156,370 | ) | | | (13,201,682 | ) | |
Year Ended June 30, 2016 | |
Diversified Value Fund | |
Class I | | | 3,317,230 | | | | 48,184,171 | | | | 433,133 | | | | 6,111,503 | | | | (10,164,956 | ) | | | (146,815,271 | ) | | | (6,414,593 | ) | | | (92,519,597 | ) | |
Class A | | | 198,601 | | | | 2,883,002 | | | | 16,810 | | | | 238,372 | | | | (845,931 | ) | | | (12,096,434 | ) | | | (630,520 | ) | | | (8,975,060 | ) | |
Class C | | | 69,997 | | | | 993,478 | | | | 441 | | | | 6,229 | | | | (116,535 | ) | | | (1,659,326 | ) | | | (46,097 | ) | | | (659,619 | ) | |
Total net increase
(decrease) | | | 3,585,828 | | | | 52,060,651 | | | | 450,384 | | | | 6,356,104 | | | | (11,127,422 | ) | | | (160,571,031 | ) | | | (7,091,210 | ) | | | (102,154,276 | ) | |
Large Cap Value Fund | |
Class I | | | 2,854,379 | | | | 71,009,801 | | | | 267,389 | | | | 6,476,172 | | | | (8,562,979 | ) | | | (211,916,899 | ) | | | (5,441,211 | ) | | | (134,430,926 | ) | |
Class A | | | 731,231 | | | | 18,228,374 | | | | 65,397 | | | | 1,576,071 | | | | (2,157,156 | ) | | | (53,132,493 | ) | | | (1,360,528 | ) | | | (33,328,048 | ) | |
Class C | | | 210,807 | | | | 5,156,094 | | | | 2,073 | | | | 48,923 | | | | (900,414 | ) | | | (21,926,147 | ) | | | (687,534 | ) | | | (16,721,130 | ) | |
Class R | | | 163,071 | | | | 4,110,743 | | | | 3,040 | | | | 73,717 | | | | (112,893 | ) | | | (2,847,983 | ) | | | 53,218 | | | | 1,336,477 | | |
Total net increase
(decrease) | | | 3,959,488 | | | | 98,505,012 | | | | 337,899 | | | | 8,174,883 | | | | (11,733,442 | ) | | | (289,823,522 | ) | | | (7,436,055 | ) | | | (183,143,627 | ) | |
Mid-Cap Value Fund | |
Class I | | | 10,396,737 | | | | 344,873,822 | | | | 7,474,912 | | | | 231,199,037 | | | | (25,201,030 | ) | | | (849,945,718 | ) | | | (7,329,381 | ) | | | (273,872,859 | ) | |
Class A | | | 1,736,617 | | | | 56,614,843 | | | | 1,244,368 | | | | 38,002,986 | | | | (7,992,868 | ) | | | (270,837,312 | ) | | | (5,011,883 | ) | | | (176,219,483 | ) | |
Class C | | | 205,166 | | | | 5,764,927 | | | | 305,016 | | | | 8,314,737 | | | | (1,648,635 | ) | | | (47,167,695 | ) | | | (1,138,453 | ) | | | (33,088,031 | ) | |
Class R | | | 130,635 | | | | 4,226,831 | | | | 35,959 | | | | 1,102,498 | | | | (253,395 | ) | | | (8,168,463 | ) | | | (86,801 | ) | | | (2,839,134 | ) | |
Total net increase
(decrease) | | | 12,469,155 | | | | 411,480,423 | | | | 9,060,255 | | | | 278,619,258 | | | | (35,095,928 | ) | | | (1,176,119,188 | ) | | | (13,566,518 | ) | | | (486,019,507 | ) | |
76
| | | Sales | | Reinvestment of
dividends
and distributions | | Redemptions | | Net increase (decrease) | |
| | | Shares | | Amount | | Shares | | Amount | | Shares | | Amount | | Shares | | Amount | |
Year Ended June 30, 2016 | |
Small Cap Value Fund | |
Class I | | | 7,052,652 | | | $ | 347,910,877 | | | | 1,199,125 | | | $ | 58,061,643 | | | | (8,633,234 | ) | | $ | (416,135,695 | ) | | | (381,457 | ) | | $ | (10,163,175 | ) | |
Class A | | | 774,987 | | | | 39,684,374 | | | | 239,836 | | | | 11,536,114 | | | | (1,731,886 | ) | | | (86,370,513 | ) | | | (717,063 | ) | | | (35,150,025 | ) | |
Class C | | | 52,961 | | | | 2,232,758 | | | | 49,001 | | | | 2,007,100 | | | | (242,921 | ) | | | (10,298,142 | ) | | | (140,959 | ) | | | (6,058,284 | ) | |
Total net increase
(decrease) | | | 7,880,600 | | | | 389,828,009 | | | | 1,487,962 | | | | 71,604,857 | | | | (10,608,041 | ) | | | (512,804,350 | ) | | | (1,239,479 | ) | | | (51,371,484 | ) | |
Small Cap Diversified Value Fund | |
Class I | | | 517 | | | | 4,500 | | | | 51,926 | | | | 449,679 | | | | — | | | | — | | | | 52,443 | | | | 454,179 | | |
Class A | | | 32,973 | | | | 296,818 | | | | 1,311 | | | | 11,340 | | | | (21,698 | ) | | | (170,612 | ) | | | 12,586 | | | | 137,546 | | |
Total net increase
(decrease) | | | 33,490 | | | | 301,318 | | | | 53,237 | | | | 461,019 | | | | (21,698 | ) | | | (170,612 | ) | | | 65,029 | | | | 591,725 | | |
Global Value Fund | |
Class I | | | 38,923 | | | | 385,881 | | | | 34,821 | | | | 350,644 | | | | (73,837 | ) | | | (770,954 | ) | | | (93 | ) | | | (34,429 | ) | |
Class A | | | 4,574 | | | | 54,500 | | | | 632 | | | | 6,363 | | | | (4,541 | ) | | | (51,350 | ) | | | 665 | | | | 9,513 | | |
Total net increase
(decrease) | | | 43,497 | | | | 440,381 | | | | 35,453 | | | | 357,007 | | | | (78,378 | ) | | | (822,304 | ) | | | 572 | | | | (24,916 | ) | |
International Value Fund | |
Class I* | | | 185,000 | | | | 1,850,000 | | | | — | | | | — | | | | — | | | | — | | | | 185,000 | | | | 1,850,000 | | |
Total net increase | | | 185,000 | | | | 1,850,000 | | | | — | | | | — | | | | — | | | | — | | | | 185,000 | | | | 1,850,000 | | |
Value Opportunities Fund | |
Class I | | | 6,224,607 | | | | 146,625,457 | | | | 1,386,534 | | | | 31,294,079 | | | | (8,402,848 | ) | | | (202,186,335 | ) | | | (791,707 | ) | | | (24,266,799 | ) | |
Class A | | | 2,520,450 | | | | 62,463,721 | | | | 923,754 | | | | 20,876,846 | | | | (4,379,214 | ) | | | (104,040,654 | ) | | | (935,010 | ) | | | (20,700,087 | ) | |
Class C | | | 1,130,976 | | | | 25,896,105 | | | | 357,550 | | | | 7,555,041 | | | | (1,207,959 | ) | | | (26,134,161 | ) | | | 280,567 | | | | 7,316,985 | | |
Total net increase
(decrease) | | | 9,876,033 | | | | 234,985,283 | | | | 2,667,838 | | | | 59,725,966 | | | | (13,990,021 | ) | | | (332,361,150 | ) | | | (1,446,150 | ) | | | (37,649,901 | ) | |
Capital Income Fund | |
Class I | | | 1,215,224 | | | | 12,791,570 | | | | 123,284 | | | | 1,298,726 | | | | (2,140,130 | ) | | | (22,641,968 | ) | | | (801,622 | ) | | | (8,551,672 | ) | |
Class A | | | 222,282 | | | | 2,587,747 | | | | 151,923 | | | | 1,665,925 | | | | (2,146,619 | ) | | | (25,461,548 | ) | | | (1,772,414 | ) | | | (21,207,876 | ) | |
Total net increase
(decrease) | | | 1,437,506 | | | | 15,379,317 | | | | 275,207 | | | | 2,964,651 | | | | (4,286,749 | ) | | | (48,103,516 | ) | | | (2,574,036 | ) | | | (29,759,548 | ) | |
High Yield Fund | |
Class I | | | 80,876,907 | | | | 913,506,545 | | | | 8,465,846 | | | | 96,527,439 | | | | (89,864,300 | ) | | | (1,024,179,236 | )2 | | | (521,547 | ) | | | (14,145,252 | ) | |
Class A | | | 6,022,934 | | | | 69,227,333 | | | | 3,778,823 | | | | 42,813,270 | | | | (11,775,052 | ) | | | (136,040,881 | )2 | | | (1,973,295 | ) | | | (24,000,278 | ) | |
Class C | | | 118,272 | | | | 1,354,929 | | | | 8,872 | | | | 100,887 | | | | (175,143 | ) | | | (1,988,270 | )2 | | | (47,999 | ) | | | (532,454 | ) | |
Total net increase
(decrease) | | | 87,018,113 | | | | 984,088,807 | | | | 12,253,541 | | | | 139,441,596 | | | | (101,814,495 | ) | | | (1,162,208,387 | ) | | | (2,542,841 | ) | | | (38,677,984 | ) | |
* Commenced operations on December 31, 2015.
1 Net of redemption fees of $49,058 for Class I, $13,861 for Class A and $596 for Class C.
2 Net of redemption fees of $388,363 for Class I, $23,885 for Class A and $3,989 for Class C.
NOTE 6.
Investments in Affiliated Issuers. An issuer in which a Fund's holdings represent 5% or more of the outstanding voting securities of the issuer is an "affiliated" issuer as defined in the 1940 Act. A schedule of each Fund's investments in securities of affiliated issuers held during the six months ended December 31, 2016, is set forth below:
Mid-Cap Value Fund
| Issuer Name | | Share Balance
At July 1, 2016 | | Additions | | Reductions | | Share Balance
At December 31, 2016 | | Dividend
Income | | Value At
December 31, 2016 | |
Navistar International Corp.+ | | | 4,648,000 | | | | — | | | | 3,249,000 | | | | 1,399,000 | | | $ | — | | | $ | 43,886,630 | | |
Ophir Energy PLC | | | 57,905,300 | | | | — | | | | 909,500 | | | | 56,995,800 | | | | — | | | | 67,459,125 | | |
+ Issuer was not an affiliate as of December 31, 2016
77
Small Cap Value Fund
| Issuer Name | | Share Balance
At July 1, 2016 | | Additions | | Reductions | | Share Balance
At December 31, 2016 | | Dividend
Income | | Value At
December 31, 2016 | |
Hanger, Inc. | | | 2,056,100 | | | | — | | | | 59,900 | | | | 1,996,200 | | | $ | — | | | $ | 22,954,903 | | |
Hudson Global, Inc. | | | 2,216,400 | | | | — | | | | 28,800 | | | | 2,187,600 | | | | — | | | | 2,975,136 | | |
Miller Industries, Inc.+ | | | 707,800 | | | | — | | | | 175,100 | | | | 532,700 | | | | 215,322 | | | | 14,089,915 | | |
Noranda Aluminum Holding Corp. | | | 450,000 | | | | 350,300 | | | | — | | | | 800,300 | | | | — | | | | 19,047 | | |
Real Industry, Inc. | | | 2,420,708 | | | | — | | | | 85,800 | | | | 2,334,908 | | | | — | | | | 14,242,939 | | |
Rush Enterprises, Inc.+ | | | 1,861,400 | | | | — | | | | 808,100 | | | | 1,053,300 | | | | — | | | | 33,600,270 | | |
| | | | | | | | | | $ | 215,322 | | | | | | |
+ Issuer was not an affiliate as of December 31, 2016
NOTE 7.
Securities Lending. Effective December 2007, the Funds entered into a securities lending arrangement with Brown Brothers Harriman & Co. (the "Custodian"). Under the securities lending agreement, the Custodian is authorized to loan securities on behalf of the Funds to approved brokers. In exchange, the Funds receive cash collateral in the amount of at least 102% of the value of the securities loaned plus accrued interest. The total market value of securities on loan for each Fund is disclosed on the Schedule of Investments. The cash collateral is invested in short-term instruments as noted on the Schedule of Investments. Income earned from these investments is included in "Securities on loan" on the Statements of Operations and is allocated to each Fund based on each Fund's proportion of the total cash collateral received. Securities lending involves counterparty risks, including the risk that the loaned securities may not be returned in a timely manner or at all. Subject to certain conditions, the Custodian has agreed to indemnify the Funds from losses resulting from a borrower's failure to return a loaned security. In addition, the Funds bear the risk of loss associated with the investment of cash collateral received.
A portion of the income generated by the investment of the collateral, net of any rebates paid by the Custodian to borrowers, is remitted to the Custodian as lending agent, and the remainder is paid to the applicable Fund.
NOTE 8.
Commitments and Contingencies. Under the Trust's organizational documents and indemnification agreements between each independent Trustee and the Trust, its officers and Trustees are indemnified against certain liability arising out of the performance of their duties to the Trust. In addition, in the normal course of business the Trust enters into contracts that contain a variety of representations and warranties, which provide general indemnifications. The Funds' maximum exposure under these arrangements is unknown, as this would involve future claims that may be made against the Funds. However, based on experience, the Funds expect the risk of loss to be remote.
Bridge loan commitments may obligate a Fund to furnish temporary financing to a borrower until permanent financing can be arranged. At December 31, 2016, the Funds did not have any outstanding bridge loan commitments.
Unfunded loan commitments are contractual obligations for funding to a borrower. At December 31, 2016, the Value Opportunities Fund and High Yield Fund had outstanding unfunded loan commitments of $1,000,000 and $1,000,000, respectively.
NOTE 9.
Risk Factors. Investing in a Fund may involve certain risks including, but not limited to, those described below.
Lower rated debt securities generally have higher rates of interest and involve greater risk of default or price changes due to changes in the issuer's creditworthiness than higher rated debt securities. The market prices of these securities may fluctuate more than higher quality securities and may decline significantly in periods of general economic difficulty. There may be little trading in the secondary market for particular debt securities, which may make them more difficult to value or sell.
The prices of, and the income generated by, most debt securities held by a Fund may be affected by changing interest rates and by changes in the effective maturities and credit ratings of these securities. For example, the prices of debt securities in a Fund's portfolio generally will decline when interest rates rise and increase when interest rates fall. In addition, falling interest rates may cause an issuer to redeem, "call" or refinance a security before its stated maturity, which may result in the Fund having to reinvest the proceeds in lower yielding securities. Debt securities are also subject to credit risk, which is the possibility that the credit strength of an issuer will weaken and/or an issuer of a debt security will fail to make timely payments of principal or interest and the security will go into default. Longer maturity debt securities generally have higher rates of interest and may be subject to greater price fluctuations than shorter maturity debt securities.
Certain Funds may invest in foreign (non-U.S.) securities and may experience more rapid and extreme changes in value than a fund that invests exclusively in securities of U.S. companies. The securities markets of many foreign countries are relatively small, with a limited number of companies representing a small number of industries. Additionally, reporting, accounting and auditing standards of foreign countries differ, in some cases significantly, from U.S. standards. Also, nationalization, expropriation or confiscatory taxation, currency blockage, political changes or diplomatic developments could adversely affect a Fund's investments in a foreign country.
The Funds are subject to management risk because each Fund is an actively managed investment portfolio. Consequently, the Funds are subject to the risks that the methods and analysis employed by the Advisor may not produce the desired results and result in losses to the Funds.
The prices of, and the income generated by, the common stocks and other equity securities held by a Fund may decline in response to certain events taking place around the world, including those directly involving the issuers whose securities are owned by the Fund; conditions affecting the general
78
economy; overall market changes; local, regional or global political, social or economic instability; governmental or governmental agency responses to economic conditions; and currency, interest rate and commodity price fluctuations.
Certain funds, accounts, individuals or affiliates may from time to time own (beneficially or of record) or control a significant percentage of a Fund's shares. Redemptions by these entities of their holdings in the Fund may impact the Fund's liquidity and net asset value ("NAV"). These redemptions may also force the Fund to sell securities.
NOTE 10.
Regulatory Changes. In October 2016, the Securities and Exchange Commission adopted new rules and amended existing rules (together, "final rules") intended to modernize the reporting and disclosure of information by registered investment companies. In part, the final rules amend Regulation S-X and require standardized, enhanced disclosure about derivatives in investment company financial statements, as well as other amendments. The compliance date for the amendments to Regulation S-X is August 1, 2017. Management is currently evaluating the impact that the adoption of the amendments to Regulation S-X will have on the financial statements and related disclosures.
NOTE 11.
Subsequent Events. Management has evaluated subsequent events in the preparation of the Funds' financial statements and has determined that there are no events that require recognition or disclosure in the financial statements.
NOTE 12.(UNAUDITED)
Federal Tax Disclosure. The Funds designated as long-term capital gain dividends, pursuant to Internal Revenue Code Section 852(b)(3), the amount necessary to reduce the earnings and profits of the Funds related to net capital gains to zero for the tax year ended June 30, 2016.
For the year ended June 30, 2016, the following percentages of ordinary distributions paid qualify for the dividend received deduction available to corporate shareholders: Diversified Value Fund — 100.00%, Large Cap Value Fund — 100.00%, Mid-Cap Value Fund — 69.24%, Small Cap Value Fund — 62.90%, Small Cap Diversified Value Fund — 94.67%, Global Value Fund — 31.56%, International Value Fund — 0.00%, Value Opportunities Fund — 15.78%, Capital Income Fund — 23.39%, High Yield Fund — 3.47%.
For the year ended June 30, 2016, the following percentages of ordinary distributions paid are designated as qualified dividend income under the Jobs and Growth Tax Relief Reconciliation Act of 2003: Diversified Value Fund — 100.00%, Large Cap Value Fund — 100.00%, Mid-Cap Value Fund — 75.18%, Small Cap Value Fund — 94.08%, Small Cap Diversified Value Fund — 95.12%, Global Value Fund — 99.08%, International Value Fund — 0.00%, Value Opportunities Fund — 28.45%, Capital Income Fund — 38.02%, High Yield Fund — 3.47%. Shareholders should consult their tax advisors.
For the year ended June 30, 2016, the Global Value Fund and International Value Fund earned foreign source income of $52,463 and $30,079, respectively, and paid foreign taxes of $5,608 and $2,630, respectively, which each Fund intends to pass through to shareholders pursuant to Section 853 of the Internal Revenue Code.
Additional Information Applicable to Foreign Shareholders Only. For the year ended June 30, 2016, the Funds designate the following percentages of ordinary distributions paid as interest-related dividends under Internal Revenue Code Section 871(k)(1)(c): Diversified Value Fund — 0.02%, Large Cap Value Fund — 0.02%, Mid-Cap Value Fund — 4.00%, Small Cap Value Fund — 0.03%, Small Cap Diversified Value Fund — 0.07%, Global Value Fund — 0.03%, International Value Fund — 0.00%, Value Opportunities Fund — 20.18%, Capital Income Fund — 56.87%, High Yield Fund — 90.57%. For the year ended June 30, 2016, the following percentages of ordinary income distributions paid are designated as short-term capital gain distributions under Internal Revenue Code Section 871(k)(2)(c): Diversified Value Fund — 0.00%, Large Cap Value Fund — 0.00%, Mid-Cap Value Fund — 57.42%, Small Cap Value Fund — 71.79%, Small Cap Diversified Value Fund — 22.90%, Global Value Fund — 61.15%, International Value Fund — 0.00%, Value Opportunities Fund — 71.24%, Capital Income Fund — 19.71%, High Yield Fund — 3.41%.
79
Fund Expense Examples (Unaudited)
As a mutual fund shareholder, you incur two types of costs: (1) transaction costs such as initial sales charges (loads) on purchase payments and contingent deferred sales charges and redemption fees on redemptions and (2) ongoing costs, including management fees, distribution and service (12b-1) fees and other fund expenses. The following examples are intended to help you understand your ongoing costs (in dollars) of investing in the Funds and to compare these costs with the ongoing costs of investing in other mutual funds. The examples are based on an investment of $1,000 invested at the beginning of the most recent six-month period and held for the entire period (July 1, 2016 – December 31, 2016).
The table below illustrates the Funds' costs in two ways:
Based on actual fund returns. This section provides information about actual account values and actual expenses. You may use the information in this section, together with the amount you invested, to estimate the expenses that you paid over the period. Simply divide your account value by $1,000 (for example, an $8,600 account value divided by $1,000 = 8.6), then multiply the result by the number in the section under the heading entitled "Expenses Paid During Period" to estimate the expenses you paid on your account during this period.
Based on hypothetical 5% yearly returns. This section provides information about hypothetical account values and hypothetical expenses based on the Funds' actual expense ratios and an assumed rate of return of 5% per year before expenses, which is not the Funds' actual return. The hypothetical account values and expenses may not be used to estimate the actual ending account balance or expenses you paid for the period. You may use this information to compare the ongoing costs of investing in the Funds and other funds. To do so, compare this 5% hypothetical example with the 5% hypothetical examples that appear in the shareholder reports of the other funds.
Please note that the expenses shown in the table are meant to highlight your ongoing costs only and do not reflect any transactional costs, such as sales charges (loads). Therefore, the second section is useful in comparing ongoing costs only, and will not help you determine the relative total costs of owning different funds. In addition, if these transactional costs were included, your costs would have been higher.
The calculations assume no shares were bought or sold during the period. Your actual costs may have been higher or lower, depending on the amount of your investment and the timing of any purchases or redemptions.
| | Based on Actual Fund Returns | | Based on Hypothetical 5% Yearly Returns | | | |
| | Beginning
Account Value
7/1/16 | | Ending
Account Value
12/31/16 | | Expenses Paid
During Period*
7/1/16 - 12/31/16 | | Beginning
Account Value
7/1/16 | | Ending
Account Value
12/31/16 | | Expenses Paid
During Period*
7/1/16 - 12/31/16 | | Annualized
Expense Ratio | |
Diversified Value Fund | |
Class I | | $ | 1,000.00 | | | $ | 1,190.20 | | | $ | 5.24 | | | $ | 1,000.00 | | | $ | 1,020.42 | | | $ | 4.84 | | | | 0.95 | % | |
Class A | | | 1,000.00 | | | | 1,188.70 | | | | 6.62 | | | | 1,000.00 | | | | 1,019.16 | | | | 6.11 | | | | 1.20 | | |
Class C | | | 1,000.00 | | | | 1,184.20 | | | | 10.74 | | | | 1,000.00 | | | | 1,015.38 | | | | 9.91 | | | | 1.95 | | |
Large Cap Value Fund | |
Class I | | | 1,000.00 | | | | 1,169.50 | | | | 5.58 | | | | 1,000.00 | | | | 1,020.06 | | | | 5.19 | | | | 1.02 | | |
Class A | | | 1,000.00 | | | | 1,167.40 | | | | 6.94 | | | | 1,000.00 | | | | 1,018.80 | | | | 6.46 | | | | 1.27 | | |
Class C | | | 1,000.00 | | | | 1,163.10 | | | | 11.01 | | | | 1,000.00 | | | | 1,015.02 | | | | 10.26 | | | | 2.02 | | |
Class R | | | 1,000.00 | | | | 1,166.50 | | | | 8.30 | | | | 1,000.00 | | | | 1,017.54 | | | | 7.73 | | | | 1.52 | | |
Mid-Cap Value Fund | |
Class I | | | 1,000.00 | | | | 1,239.30 | | | | 5.81 | | | | 1,000.00 | | | | 1,020.01 | | | | 5.24 | | | | 1.03 | | |
Class A | | | 1,000.00 | | | | 1,237.90 | | | | 7.22 | | | | 1,000.00 | | | | 1,018.75 | | | | 6.51 | | | | 1.28 | | |
Class C | | | 1,000.00 | | | | 1,233.00 | | | | 11.43 | | | | 1,000.00 | | | | 1,014.97 | | | | 10.31 | | | | 2.03 | | |
Class R | | | 1,000.00 | | | | 1,236.10 | | | | 8.62 | | | | 1,000.00 | | | | 1,017.49 | | | | 7.78 | | | | 1.53 | | |
Small Cap Value Fund | |
Class I | | | 1,000.00 | | | | 1,274.10 | | | | 5.96 | | | | 1,000.00 | | | | 1,019.96 | | | | 5.30 | | | | 1.04 | | |
Class A | | | 1,000.00 | | | | 1,272.50 | | | | 7.39 | | | | 1,000.00 | | | | 1,018.70 | | | | 6.56 | | | | 1.29 | | |
Class C | | | 1,000.00 | | | | 1,267.50 | | | | 11.66 | | | | 1,000.00 | | | | 1,014.92 | | | | 10.36 | | | | 2.04 | | |
Small Cap Diversified Value Fund | |
Class I | | | 1,000.00 | | | | 1,291.70 | | | | 5.20 | | | | 1,000.00 | | | | 1,020.67 | | | | 4.58 | | | | 0.90 | | |
Class A | | | 1,000.00 | | | | 1,289.80 | | | | 6.64 | | | | 1,000.00 | | | | 1,019.41 | | | | 5.85 | | | | 1.15 | | |
Global Value Fund | |
Class I | | | 1,000.00 | | | | 1,182.50 | | | | 6.05 | | | | 1,000.00 | | | | 1,019.66 | | | | 5.60 | | | | 1.10 | | |
Class A | | | 1,000.00 | | | | 1,182.10 | | | | 7.43 | | | | 1,000.00 | | | | 1,018.40 | | | | 6.87 | | | | 1.35 | | |
International Value Fund | |
Class I | | | 1,000.00 | | | | 1,139.00 | | | | 6.20 | | | | 1,000.00 | | | | 1,019.41 | | | | 5.85 | | | | 1.15 | | |
80
Fund Expense Examples (Unaudited)
| | Based on Actual Fund Returns | | Based on Hypothetical 5% Yearly Returns | | | |
| | Beginning
Account Value
7/1/16 | | Ending
Account Value
12/31/16 | | Expenses Paid
During Period*
7/1/16 - 12/31/16 | | Beginning
Account Value
7/1/16 | | Ending
Account Value
12/31/16 | | Expenses Paid
During Period*
7/1/16 - 12/31/16 | | Annualized
Expense Ratio | |
Value Opportunities Fund | |
Class I | | $ | 1,000.00 | | | $ | 1,228.10 | | | $ | 5.62 | | | $ | 1,000.00 | | | $ | 1,020.16 | | | $ | 5.09 | | | | 1.00 | % | |
Class A | | | 1,000.00 | | | | 1,226.90 | | | | 7.02 | | | | 1,000.00 | | | | 1,018.90 | | | | 6.36 | | | | 1.25 | | |
Class C | | | 1,000.00 | | | | 1,221.90 | | | | 11.20 | | | | 1,000.00 | | | | 1,015.12 | | | | 10.16 | | | | 2.00 | | |
Capital Income Fund | |
Class I | | | 1,000.00 | | | | 1,162.20 | | | | 4.36 | | | | 1,000.00 | | | | 1,021.17 | | | | 4.08 | | | | 0.80 | | |
Class A | | | 1,000.00 | | | | 1,159.20 | | | | 5.71 | | | | 1,000.00 | | | | 1,019.91 | | | | 5.35 | | | | 1.05 | | |
High Yield Fund | |
Class I | | | 1,000.00 | | | | 1,081.50 | | | | 3.67 | | | | 1,000.00 | | | | 1,021.68 | | | | 3.57 | | | | 0.70 | | |
Class A | | | 1,000.00 | | | | 1,079.60 | | | | 4.98 | | | | 1,000.00 | | | | 1,020.42 | | | | 4.84 | | | | 0.95 | | |
Class C | | | 1,000.00 | | | | 1,076.10 | | | | 8.90 | | | | 1,000.00 | | | | 1,016.64 | | | | 8.64 | | | | 1.70 | | |
* Expenses are equal to the Funds' annualized expense ratio by class multiplied by the average account value over the period, multiplied by the number of days in the most recent fiscal half-year (184), then divided by the number of days in the most recent fiscal year (365).
81
Information about the Funds
ADVISOR
Hotchkis & Wiley Capital Management, LLC
725 South Figueroa Street, 39th Floor
Los Angeles, California 90017
LEGAL COUNSEL
Vedder Price P.C.
222 North LaSalle Street
Chicago, Illinois 60601
INDEPENDENT REGISTERED PUBLIC ACCOUNTING FIRM
Deloitte & Touche LLP
695 Town Center Drive, Suite 1200
Costa Mesa, CA 92626
DISTRIBUTOR
Quasar Distributors, LLC
615 East Michigan Street
Milwaukee, Wisconsin 53202
ADMINISTRATOR AND TRANSFER AGENT
U.S. Bancorp Fund Services, LLC
615 East Michigan Street
Milwaukee, Wisconsin 53202
CUSTODIAN
Brown Brothers Harriman & Co.
50 Post Office Square
Boston, Massachusetts 02110
This report is for the information of shareholders of the Hotchkis & Wiley Funds, but may also be used as sales literature when preceded or accompanied by a current prospectus, which gives details about charges, expenses, investment objectives and operating policies of the Funds.
A description of the policies and procedures that the Funds use to determine how to vote proxies relating to portfolio securities is included in the Statement of Additional Information, which is available without charge, upon request, by calling 1-866-HW-FUNDS (1-866-493-8637) and on the Securities and Exchange Commission's ("SEC") website at http://www.sec.gov.
Information regarding how the Funds voted proxies relating to portfolio securities during the most recent 12-month period ended June 30 is available without charge on the Funds' website at www.hwcm.com and on the SEC's website at http://www.sec.gov.
Hotchkis & Wiley Funds files a complete schedule of portfolio holdings with the SEC for the first and third quarters of each fiscal year on Form N-Q. The Funds' Forms N-Q are available free of charge on the SEC's website at http://www.sec.gov. You may also review or, for a fee, copy the forms at the SEC's Public Reference Room in Washington, D.C. (1-800-SEC-0330). The Forms N-Q are also available on the Funds' website at www.hwcm.com.
725 SOUTH FIGUEROA STREET, 39th Floor
LOS ANGELES, CALIFORNIA 90017-5439
www.hwcm.com
1.866.HW.FUNDS (1.866.493.8637)
Item 2. Code of Ethics.
Not applicable for semi-annual reports.
Item 3. Audit Committee Financial Expert.
Not applicable for semi-annual reports.
Item 4. Principal Accountant Fees and Services.
Not applicable for semi-annual reports.
Item 5. Audit Committee of Listed Registrants.
Not applicable to registrants who are not listed issuers (as defined in Rule 10A-3 under the Securities Exchange Act of 1934).
Item 6. Investments.
Schedule of Investments is included as part of the report to shareholders filed under Item 1 of this Form.
Item 7. Disclosure of Proxy Voting Policies and Procedures for Closed-End Management Investment Companies.
Not applicable to open-end investment companies.
Item 8. Portfolio Managers of Closed-End Management Investment Companies.
Not applicable to open-end investment companies.
Item 9. Purchases of Equity Securities by Closed-End Management Investment Company and Affiliated Purchasers.
Not applicable to open-end investment companies.
Item 10. Submission of Matters to a Vote of Security Holders.
The identification and recommendation of individuals for Board membership is the responsibility of the Nominating and Governance Committee. Shareholders may submit suggestions for candidates by forwarding their correspondence by U.S. mail or other courier service to the registrant’s Secretary for the attention of the Chairman of the Nominating and Governance Committee, 725 South Figueroa Street, 39th Floor, Los Angeles, CA 90017-5439.
Item 11. Controls and Procedures.
(a) The registrant’s President / Principal Executive Officer and Treasurer / Principal Financial Officer have reviewed the registrant’s disclosure controls and procedures (as defined in Rule 30a-3(c) under the Investment Company Act of 1940 (the “Act”)) as of a date within 90 days of the filing of this report, as required by Rule 30a-3(b) under the Act and Rules 13a-15(b) or 15d-15(b) under the Securities Exchange Act of 1934. Based on their review, such officers have concluded that the disclosure controls and procedures are effective in ensuring that information required to be disclosed in this report is appropriately recorded, processed, summarized and reported and made known to them by others within the registrant and by the registrant’s service provider.
(b) There were no changes in the registrant’s internal control over financial reporting (as defined in Rule 30a-3(d) under the Act) that occurred during the second fiscal quarter of the period covered by this report that has materially affected, or is reasonably likely to materially affect, the registrant’s internal control over financial reporting.
Item 12. Exhibits.
(a) (1) Any code of ethics or amendment thereto, that is the subject of the disclosure required by Item 2, to the extent that the registrant intends to satisfy Item 2 requirements through filing an exhibit. Not Applicable.
(2) A separate certification for each principal executive officer and principal financial officer pursuant to Section 302 of the Sarbanes-Oxley Act of 2002. Filed herewith.
(3) Any written solicitation to purchase securities under Rule 23c-1 under the Act sent or given during the period covered by the report by or on behalf of the registrant to 10 or more persons. Not applicable to open-end investment companies.
(b) Certifications pursuant to Section 906 of the Sarbanes-Oxley Act of 2002. Furnished herewith.
2
SIGNATURES
Pursuant to the requirements of the Securities Exchange Act of 1934 and the Investment Company Act of 1940, the registrant has duly caused this report to be signed on its behalf by the undersigned, thereunto duly authorized.
(Registrant) | Hotchkis & Wiley Funds | |
| | |
By (Signature and Title) | /s/ Anna Marie Lopez | |
| Anna Marie Lopez, President / Principal Executive Officer |
| |
Date | February 27, 2017 | |
| | | | | |
Pursuant to the requirements of the Securities Exchange Act of 1934 and the Investment Company Act of 1940, this report has been signed below by the following persons on behalf of the registrant and in the capacities and on the dates indicated.
By (Signature and Title) | /s/ Anna Marie Lopez | |
| Anna Marie Lopez, President / Principal Executive Officer |
| |
Date | February 27, 2017 | |
|
By (Signature and Title) | /s/ James Menvielle | |
| James Menvielle, Treasurer / Principal Financial Officer |
|
Date | February 27, 2017 | |
| | | |
3