UNITED STATES
SECURITIES AND EXCHANGE COMMISSION
Washington, D.C. 20549
FORM N-CSR
CERTIFIED SHAREHOLDER REPORT OF REGISTERED
MANAGEMENT INVESTMENT COMPANIES
Investment Company Act file number | 811-10487 |
|
Hotchkis & Wiley Funds |
(Exact name of registrant as specified in charter) |
|
601 South Figueroa Street, 39th Floor Los Angeles, California | | 90017-5704 |
(Address of principal executive offices) | | (Zip code) |
|
Anna Marie Lopez 601 South Figueroa Street, 39th Floor Los Angeles, California 90017-5704 |
(Name and address of agent for service) |
|
Copy to: Maureen A. Miller, Esq. Joseph M. Mannon, Esq. Vedder Price P.C. 222 North LaSalle Street, 26th Floor Chicago, IL 60601 |
(Counsel for the registrant) |
|
Registrant’s telephone number, including area code: | (213) 430-1000 | |
|
Date of fiscal year end: | June 30, 2020 | |
|
Date of reporting period: | December 31, 2019 | |
| | | | | | | | |
Item 1. Reports to Stockholders.

Hotchkis & Wiley Funds
Semi-annual Report
DECEMBER 31, 2019
DIVERSIFIED VALUE FUND
LARGE CAP VALUE FUND
MID-CAP VALUE FUND
SMALL CAP VALUE FUND
SMALL CAP DIVERSIFIED VALUE FUND
GLOBAL VALUE FUND
INTERNATIONAL VALUE FUND
VALUE OPPORTUNITIES FUND
CAPITAL INCOME FUND
HIGH YIELD FUND
Beginning on January 1, 2021, as permitted by regulations adopted by the Securities and Exchange Commission, paper copies of the Funds' shareholder reports will no longer be sent by mail, unless you specifically request paper copies of the reports from the Funds or from your financial intermediary (such as a broker-dealer or bank). Instead, the reports will be made available on a website, and you will be notified by mail each time a report is posted and provided with a website link to access the report. | |
If you already elected to receive shareholder reports electronically, you will not be affected by this change and you need not take any action. You may elect to receive shareholder reports and other communications electronically from the Funds by contacting your financial intermediary or, if you invest directly with a Fund, by calling 1-866-HW-FUNDS (1-866-493-8637). | |
You may elect to receive all future reports in paper free of charge. You can request to continue receiving paper copies of your shareholder reports by contacting your financial intermediary or, if you invest directly with a Fund, by calling 1-866-HW-FUNDS (1-866-493-8637) to let the Fund know of your request. Your election to receive reports in paper will apply to all funds held in your account. | |

SHAREHOLDER LETTER | | | 1 | | |
FUND INFORMATION | | | 4 | | |
FUND PERFORMANCE DATA | | | 6 | | |
SCHEDULE OF INVESTMENTS: | |
DIVERSIFIED VALUE FUND | | | 16 | | |
LARGE CAP VALUE FUND | | | 18 | | |
MID-CAP VALUE FUND | | | 20 | | |
SMALL CAP VALUE FUND | | | 22 | | |
SMALL CAP DIVERSIFIED VALUE FUND | | | 24 | | |
GLOBAL VALUE FUND | | | 30 | | |
INTERNATIONAL VALUE FUND | | | 32 | | |
VALUE OPPORTUNITIES FUND | | | 34 | | |
| CAPITAL INCOME FUND | | | 38 | | |
| HIGH YIELD FUND | | | 45 | | |
| STATEMENTS OF ASSETS & LIABILITIES | | | 51 | | |
| STATEMENTS OF OPERATIONS | | | 53 | | |
| STATEMENTS OF CHANGES IN NET ASSETS | | | 55 | | |
| FINANCIAL HIGHLIGHTS | | | 60 | | |
| NOTES TO THE FINANCIAL STATEMENTS | | | 65 | | |
| FUND EXPENSE EXAMPLES | | | 80 | | |
INFORMATION ABOUT THE FUNDS | | | BACK COVER | | |
DEAR SHAREHOLDER:
The following investment review and shareholder report relates to the activities of the Hotchkis & Wiley Funds for the six months ended December 31, 2019.
OVERVIEW
In the six-month period ended December 31, 2019, the S&P 500® Index (equity market) returned +10.9%, the MSCI World Index returned +9.1%, and the ICE BofAML U.S. High Yield Index (high yield market) returned +3.9%. For much of the period, the United States engaged in a trade war with China, its largest global trading partner. Near the end of the year, the U.S. House of Representatives impeached the President for just the third time in history. The uncertain path of Brexit was the major political story in Europe, though the UK's Conservative party election victory removed a "worst case" economic scenario. Equity and high yield markets largely shrugged off the tumultuous geopolitical landscape and performed well in the second half of calendar year 2019.
Equity markets' price-to-earnings (P/E) ratios expanded in the period, explaining essentially all of the markets' performance. Equities as a group trade at valuations higher than historical averages; the forward P/E on the MSCI World Index is about 15% above its 20-year average. Interest rates, however, are considerably lower than historical averages. The 10-year U.S. treasury yield is just 1.9% compared to its 20-year average of 3.4%; the 10- year UK Gilt yield is 0.8% compared to its 20-year average of 3.3%; the 10-year German Bund yield is –0.2% compared to its 20-year average of 2.6%.
Information technology was the top-performing global equity sector, by a large margin, returning +17%, though nearly all sectors delivered positive performance. Energy was the lone exception, returning –1%. Over the past 3 years, energy was the MSCI World Index's worst-performing sector, returning +1% compared to the overall index return of +43%, cumulatively. The second-worst performing sector during this time was financials with a +30% return. The MSCI World Growth Index outperformed the MSCI World Value Index (+10.4% vs. +7.9%). Global growth outperformed value in 9 of the last 10 calendar years with cumulative outperformance of more than 70% (+186% vs. +112%, or +11.1% vs. +7.8% annualized). Nearly all of this occurred in the last three years. The lopsided performance has resulted in a wider-than-normal valuation spread between growth and value. Over the past 20 years, the average forward P/E for the MSCI World Growth Index has been 5.0x above that of the MSCI World Value Index. As of December 31, 2019, the forward P/E for the growth and value indices were 25.4x and 14.2x, respectively, or a spread of 11.2x. Over the past 20 years, this valuation gap has been wider only 6% of the time (and only during the tech/internet bubble). Using price-to-book instead of price-to-earnings, the current valuation gap has been exceeded only 5% of the time historically, with the tech/internet bubble again representing the lone exception.
In the high yield market, yields fell and the spread over treasuries narrowed in the period. At year end, the yield-to-worst for the ICE BofAML U.S. High Yield Index was 5.41%, which represented a spread over treasuries of 360 basis points. Yields and spreads for low rated credits increased ever so slightly, however, further widening the valuation gap relative to higher rated credits. Yields and spreads declined less for small/mid cap credits than for large caps, further extending small/mid caps' yield/spread advantage. The high yield market's
default rate, including distressed exchanges, was 2.86% at year end, an increase of about one percentage point from a year ago but below the long-term average of 3.44%. The default rate would have been just 1.26% without the energy and metals & mining sectors. The default rate for the energy sector was about 11%, by far the highest among all sectors. Unsurprisingly, energy was the also the worst-performing sector in the high yield market by a large margin, returning –1.9% in the six-month period ended December 31, 2019; all other sectors returned between +3% and +9%.
While the overall global equity and high yield markets appear fairly/fully valued compared to history, we believe the valuation disparities across both markets create an investment environment highly conducive to long-term focused active management, particularly in relative terms. The Funds exhibit considerable valuation/spread advantages and consist of good underlying businesses which leaves us confident about the portfolios' prospects.
HOTCHKIS & WILEY DIVERSIFIED VALUE FUND
The Fund's Class I shares had a total return of 8.19% for the six-month period ended December 31, 2019 compared to the Russell 1000® Value Index return of 8.86%.
The Fund underperformed the Russell 1000® Value Index in the six-month period ended December 31, 2019. Growth outperformed value, which is a stylistic headwind for the Fund considering it trades at a valuation discount to the value index. The Fund's average weight to stocks that began the period with a market capitalization of more than $100 billion was 28% compared to 39% for the Russell 1000® Value. This underweight hurt as mega cap stocks outperformed the overall index. Stock selection in information technology, consumer discretionary, and communication services detracted from performance. Positive stock selection in health care, energy, financials, and utilities helped relative performance in the period. The largest detractors to relative performance in the period were Corning, Oracle, AIG, Apache, and General Motors; the largest positive contributors were State Street, Microsoft, Wells Fargo, PPL, and Vodafone.
HOTCHKIS & WILEY LARGE CAP VALUE FUND
The Fund's Class I shares had a total return of 8.14% for the six-month period ended December 31, 2019 compared to the Russell 1000® Value Index return of 8.86%.
The Fund underperformed the Russell 1000® Value index during the six-month period ended December 31, 2019. The Fund trades at a valuation discount to the value index, so periods when growth outperforms value typically represent a performance headwind. The Russell 1000® Growth outperformed the Russell 1000® Value by 3.4% over the period which hurt relative performance. Stock selection in information technology, consumer discretionary, and communication services detracted from performance over the six months. Positive stock selection in health care, financials, utilities, and energy helped relative performance in the period. The largest detractors to relative performance it the period were Corning, Oracle, AIG, Apache, and General Motors; the largest positive contributors were State Street, Microsoft, Wells Fargo, Vodafone, and PPL.
1
HOTCHKIS & WILEY MID-CAP VALUE FUND
The Fund's Class I shares had a total return of 0.71% for the six-month period ended December 31, 2019 compared to the Russell Midcap® Value Index return of 7.66%.
The Fund underperformed the Russell Midcap® Value Index in the six-month period ended December 31, 2019. Throughout the period, there was an unusually strong correlation between company size and performance within the mid cap market, as larger market cap companies outperformed smaller market cap companies. This had a large negative effect on relative performance. For example, Russell Midcap® Value stocks that began the period with a market cap over $20 billion returned more than +12% while stocks that began the period with a market cap under $5 billion returned –1.6%. The portfolio's average weight in the larger cap group was 12% compared to 30% for the index, while the portfolio's average weight in the smaller group was 51% compared to 11% for the index; the smaller cap bias was an insurmountable headwind during the six months. The overweight and stock selection in energy was a large detractor in the period, along with stock selection in industrials and information technology. Positive stock selection in consumer discretionary, financials, and utilities helped relative performance. The largest detractors to relative performance in the period were Whiting Petroleum, McDermott International, Mallinckrodt, Kosmos Energy, and C&J Energy Services; the largest positive contributors were Bed Bath & Beyond, Office Depot, NexTier Oilfield Solutions, Cairn Energy, and Royal Mail.
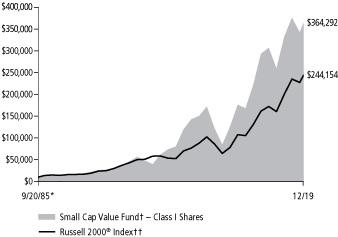
HOTCHKIS & WILEY SMALL CAP VALUE FUND
The Fund's Class I shares had a total return of 6.39% for the six-month period ended December 31, 2019 compared to the Russell 2000® Value Index return of 7.87%.
The Fund underperformed the Russell 2000® Value index during the six-month period ended December 31, 2019. The overweight position and stock selection in energy detracted from performance, along with stock selection in real estate, information technology, and industrials. Positive stock selection in consumer discretionary, financials, and health care helped relative performance. The largest detractors to relative performance in the period were Seritage Growth Properties, Whiting Petroleum, Resideo Technologies, GEO Group, and Avnet; the largest positive contributors were Hanger, Office Depot, Masonite International, Sonic Automotive, and Diodes.
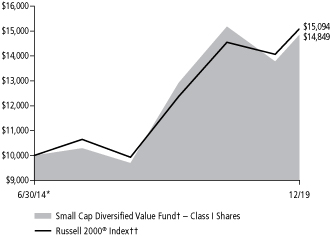
HOTCHKIS & WILEY SMALL CAP DIVERSIFIED VALUE FUND
The Fund's Class I shares had a total return of 7.78% for the six-month period ended December 31, 2019 compared to the Russell 2000® Value Index return of 7.87%.
The Fund underperformed the Russell 2000® Value in the six-month period ended December 31, 2019. Over the course of the six months, there was an unusually strong correlation between company size and performance, with larger market cap companies outperforming smaller market cap companies. Stocks in the Russell 2000® Value that began the period with a market cap of less than $1 billion returned –1% while stocks with a market cap of more than $1 billion returned
+11%. The portfolio's average weight in the smaller market cap group was 42% compared to 26% for the index, and the average weight in the larger market cap group was 55% compared to 74% for the index (portfolio cash averaged 2%). The smaller cap bias had a large negative effect on relative performance. Positive stock selection compensated for this effect, with consumer discretionary, financials, energy, and health care being the largest contributors. Stock selection in real estate, information technology and consumer staples hurt relative performance.
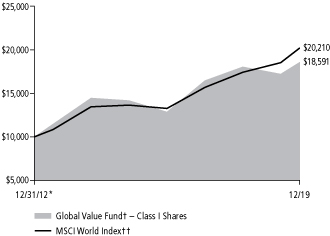
HOTCHKIS & WILEY GLOBAL VALUE FUND
The Fund's Class I shares had a total return of 7.91% for the six-month period ended December 31, 2019 compared to the MSCI World Index return of 9.14%.
The Fund underperformed the MSCI World Index over the six-month period ended December 31, 2019. Two stylistic headwinds explain all the underperformance relative to the broad benchmark. First, value lagged growth, so our value focused approach was a considerable headwind relative to the broad/core benchmark (the Fund performed in line with the MSCI World Value Index of 7.85%). Second, there was a strong correlation between company size and performance, with larger market cap companies outperforming smaller market cap companies. MSCI World Index stocks that began the period with a market cap under $10 billion returned about +2.5% over the six months, while stocks with a market cap over $100 billion returned about +12%. The portfolio's average weight in the smaller cap group was 21% compared to 8% for the index, while the portfolio's average weight in the larger cap group was 18% compared to 41% for the index. From a sector perspective, stock selection in information technology, energy, real estate, and consumer staples hurt relative performance. Positive stock selection in financials, communication services, and health care helped. The largest detractors to relative performance in the period were Whiting Petroleum, AIG, Corning, Oracle, and Seritage Growth Properties; the largest positive contributors were Societe Generale, Royal Mail, BAE Systems, Vodafone, and Barclays.
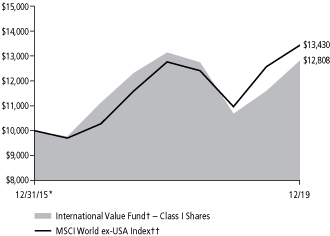
HOTCHKIS & WILEY INTERNATIONAL VALUE FUND
The Fund's Class I shares had a total return of 10.51% for the six-month period ended December 31, 2019 compared to the MSCI World ex-USA Index return of 6.85%.
The Fund outperformed the MSCI World ex-USA Index over the six-month period ended December 31, 2019. International growth outperformed value and international small caps outperformed large caps, both of which presented a brisk performance headwind for the Fund. Positive stock selection across an array of sectors more than made up for the stylistic headwinds. Stock selection was positive or neutral in 9 of the 11 GIGS® sectors, and was particularly helpful in financials. The overweight position in energy and stock selection in consumer staples and information technology detracted from performance. The largest positive contributors to relative performance in the period were Societe Generate, BAE Systems, Royal Mail, Vodafone, and BNP Paribas; the largest detractors were Embraer, Frank's International, Ericsson, Heineken, and Danieli.
2
HOTCHKIS & WILEY VALUE OPPORTUNITIES FUND
The Fund's Class I shares had a total return of 5.67% for the six-month period ended December 31, 2019 compared to the Russell 3000® Value Index return of 8.80%.
The Fund underperformed the Russell 3000® Value Index during the six-month period ended December 31, 2019. The portfolio's non-equity exposure was the largest performance detractor, as select fixed income securities and put options underperformed. The Fund's small cap bias was also a headwind as large caps outperformed small caps; the Fund averaged a 15% weight in stocks below $3 billion compared to 6% for the index and 27% in stocks over $100 billion compared to 36% for the index. Security selection in consumer discretionary, information technology, and real estate hurt relative performance; positive security selection in energy, financials, and health care helped. The largest detractors to relative performance in the period were Tesla put options, Seritage Growth Properties, Motors Liquidation Trust, Oracle, and Corning; the largest positive contributors were Microsoft, Royal Mail, Vodafone, Cairn Energy, and Office Depot.
HOTCHKIS & WILEY CAPITAL INCOME FUND
The Fund's Class Ishares had a total return of 3.98% for the six-month period ended December 31, 2019 compared to the 50/50 blended benchmark of the S&P 500® Index and the ICE BofAML U.S. Corporate, Government and Mortgage Index return of 6.71%.
The Fund underperformed the 50/50 blended benchmark over the six-month period ended December 31, 2019. The Fund's average equity exposure over the period was 56% with the remaining 44% invested in high yield credits; the long-term target is 50% in each. The equity overweight helped as equities outperformed bonds over the six months. The equity portion of the Fund underperformed the S&P 500® Index in the period as the value bias and outsized exposure to small and mid cap equities hurt. The overweight and stock selection in energy detracted from performance along with stock selection in information technology and real estate. Positive stock selection in financials, industrials, and consumer discretionary helped relative performance. The high yield portion of the Fund underperformed the ICE BofAML U.S. Corporate, Government and Mortgage Index and the ICE BofAML U.S. High Yield Index over the period. Relative to the high yield index, the Fund's small/mid cap bias hurt relative performance as larger cap credits outperformed. The overweight and credit selection in energy was a considerable detractor in the period, along with credit selection in media, consumer goods, and services. Positive credit selection in leisure, automotive, and capital goods helped relative performance.
HOTCHKIS & WILEY HIGH YIELD FUND
The Fund's Class I shares had a total return of 1.62% for the six-month period ended December 31, 2019 compared to the ICE BofAML BB-B U.S. High Yield Constrained return of 4.29%.
The Fund underperformed the ICE BofAML BB-B U.S. High Yield Constrained Index over the six-month period ended December 31, 2019. The Fund is overweight small and mid cap credits and underweight large cap credits. This hurt relative performance as large cap credits
outperformed small and mid caps. Credit selection in energy was the largest performance detractor in the period as select exploration & production and oilfield service credits underperformed. Credit selection in consumer goods and services along with the underweight in telecommunications also hurt performance. Positive credit selection in automotive, leisure, and capital goods helped relative performance.
CONCLUSION
We appreciate your continued support of the Hotchkis & Wiley Funds, and we look forward to serving your investment needs in the future.
Sincerely,

| | 
| | 
| |
Anna Marie Lopez
President | | George Davis
Fund Manager | | Scott McBride
Fund Manager | |

| | 
| | 
| |
Patty McKenna
Fund Manager | | James Miles
Fund Manager | | Stan Majcher
Fund Manager | |

| | 
| | 
| |
David Green
Fund Manager | | Judd Peters
Fund Manager | | Ray Kennedy
Fund Manager | |

| | 
| | 
| |
Mark Hudoff
Fund Manager | | Patrick Meegan
Fund Manager | | Scott Rosenthal
Fund Manager | |

| | 
| | 
| |
Richard Mak
Fund Manager | | Ryan Thomes
Fund Manager | | Noah Mayer
Fund Manager | |

| | | | | |
Hunter Doble
Fund Manager | | | | | |
3
ABOUT FUND PERFORMANCE
The Diversified Value Fund, Large Cap Value Fund, Mid-Cap Value Fund, Small Cap Value Fund, Small Cap Diversified Value Fund, Global Value Fund, International Value Fund, Value Opportunities Fund, Capital Income Fund and High Yield Fund have four classes of shares. Each share class has its own sales charge and expense structure, allowing you to invest in the way that best suits your needs. Currently, the International Value Fund is not offering Class A shares to investors; the Small Cap Diversified Value Fund, Global Value Fund, International Value Fund and Capital Income Fund are not offering Class C shares to investors; and the Diversified Value Fund, Global Value Fund, International Value Fund and Capital Income Fund are not offering Class Z shares to investors.
Class I shares have no initial sales charge and bear no ongoing distribution and service fees under a 12b-1 plan. Class I shares are available only to eligible investors.
Class A shares incur a maximum initial sales charge of 5.25% for the Diversified Value Fund, Large Cap Value Fund, Mid-Cap Value Fund, Small Cap Value Fund, Small Cap Diversified Value Fund, Global Value Fund, International Value Fund and Value Opportunities Fund, 4.75% for the Capital Income Fund and 3.75% for the High Yield Fund and an annual distribution and service fee of 0.25%.
Class C shares are subject to an annual distribution and service fee of 1.00%. In addition, Class C shares are subject to a 1.00% contingent deferred sales charge (CDSC) if redeemed within one year after purchase. Class C shares automatically convert to Class A shares approximately eight years after purchase and will then be subject to lower annual distribution and service fees.
Class Z shares have no initial sales charge and bear no ongoing distribution and service fees under a 12b-1 plan. Class Z shares are available only to eligible investors (provided that no compensation, administrative payments, sub-transfer agency payments and service payments are required).
FUND RISKS
Mutual fund investing involves risk; loss of principal is possible. The Mid-Cap Value Fund, Small Cap Value Fund, Small Cap Diversified Value Fund, Global Value Fund, International Value Fund and Value Opportunities Fund invest in small- and medium-capitalization companies which tend to have limited liquidity and greater price volatility than large-capitalization companies. The Value Opportunities Fund is a non-diversified fund which involves greater risk than investing in diversified funds, such as business risk, significant stock price fluctuations and sector concentration. Growth stocks typically are more volatile than value stocks; however, value stocks have a lower expected growth rate in earnings and sales. The Value Opportunities Fund, Capital Income Fund and High Yield Fund invest in debt securities that decrease in value when interest rates rise. This risk is usually greater for longer-term debt securities. Investment by the Value Opportunities Fund, Capital Income Fund and High Yield Fund in lower-rated and non-rated securities presents a greater risk of loss to principal and interest than higher-rated securities. The Value Opportunities Fund, Capital Income Fund and High Yield Fund may utilize derivative instruments, which derive their performance from the performance of an
underlying asset, index, interest rate or currency exchange rate. Derivatives can be volatile and involve various types and degrees of risks. Depending upon the characteristics of particular derivatives, they can suddenly become illiquid. Investments by the Capital Income Fund and High Yield Fund in asset-backed and mortgage-backed securities include additional risks that investors should be aware of such as credit risk, prepayment risk, possible illiquidity and default, as well as increased susceptibility to adverse economic developments. The Funds may invest in foreign securities, including developed and emerging markets, which involve greater volatility and political, economic, and currency risks.
MARKET INDEXES
The following are definitions for indexes used in the shareholder letter and the fund performance data on the following pages. These indexes are unmanaged and include the reinvestment of dividends, but do not reflect the payment of transaction costs and advisory and other fees associated with an investment in the Funds. The securities that comprise these indexes may differ substantially from the securities in the Funds' portfolios. The Funds' value disciplines may prevent or restrict investments in the benchmark indexes. It is not possible to invest directly in an index. Each index named is not the only index which may be used to characterize performance of a specific Fund and other indexes may portray different comparative performance.
S&P 500® Index, a capital weighted, unmanaged index, represents the aggregate market value of the common equity of 500 stocks primarily traded on the New York Stock Exchange.
Russell 1000® Index, an unmanaged index, measures the performance of the 1,000 largest companies in the Russell 3000® Index.
Russell 1000® Growth Index measures the performance of those Russell 1000® companies with higher price-to-book ratios and higher forecasted growth values.
Russell 1000® Value Index measures the performance of those Russell 1000® companies with lower price-to-book ratios and lower forecasted growth values.
Russell Midcap® Index, an unmanaged index, measures the performance of the 800 smallest companies in the Russell 1000® Index.
Russell Midcap® Value Index measures the performance of those Russell Midcap® companies with lower price-to-book ratios and lower forecasted growth values.
Russell 2000® Index, an unmanaged index, measures the performance of the 2,000 smallest companies in the Russell 3000® Index.
Russell 2000® Value Index measures the performance of those Russell 2000® companies with lower price-to-book ratios and lower forecasted growth values.
Russell 3000® Index, an unmanaged index, is comprised of the 3,000 largest U.S. companies based on total market capitalization, which represents approximately 98% of the investable U.S. equity market.
Russell 3000® Value Index measures the performance of those Russell 3000® companies with lower price-to-book ratios and lower forecasted growth values.
4
MSCI World Index is a free float-adjusted weighted index capturing large and mid cap representation across 23 Developed Markets (DM) countries.
MSCI World Growth Index is the growth investment style of the MSCI World Index. The growth investment style characteristics for index construction are defined using five variables: long-term forward EPS growth rate, short-term forward EPS growth rate, current internal growth rate and long-term historical EPS growth trend and long-term historical sales per share growth trend.
MSCI World Value Index is the value investment style of the MSCI World Index. The value investment style characteristics for index construction are defined using three variables: book value to price, 12-month forward earnings to price and dividend yield.
MSCI World ex-USA Index is a free float-adjusted weighted index capturing large and mid cap representation across 22 of 23 Developed Markets (DM) countries, excluding the United States.
ICE BofAML U.S. Corporate, Government and Mortgage Index is a broad-based measure of the total rate of return performance of the U.S. investment grade bond markets. The Index is a capitalization weighted aggregation of outstanding U.S. Treasury, agency and supranational, mortgage pass-through, and investment grade corporate bonds meeting specified selection criteria.
ICE BofAML BB-B U.S. High Yield Constrained Index contains all securities in the ICE BofAML U.S. High Yield Index rated BB+ through B- by S&P (or equivalent as rated by Moody's or Fitch), but caps issuer exposure at 2%. Index constituents are capitalization-weighted, based on their current amount outstanding, provided the total allocation to an individual issuer does not exceed 2%.
ICE BofAML U.S. High Yield Index tracks the performance of below investment grade, but not in default, U.S. dollar-denominated corporate bonds publicly issued in the U.S. domestic market, and includes issues with a credit rating of BBB or below, as rated by Moody's and S&P.
DISCLOSURE
Past performance does not guarantee future results.
The shareholder letter reflects opinions of Fund managers as of December 31, 2019. They are subject to change and any forecasts made cannot be guaranteed. The Funds might not continue to hold any securities mentioned and have no obligation to disclose purchases or sales in these securities. Please refer to the Schedule of Investments in this report for a complete list of Fund holdings for December 31, 2019. Indexes do not incur expenses or sales loads and are not available for investment.
The Global Industry Classification Standard (GICS®) was developed by MSCI, an independent provider of global indices and benchmark-related products and services, and Standard & Poor's (S&P), an independent international financial data and investment services company. The GICS methodology has been widely accepted as an industry analysis framework for investment research, portfolio management and asset allocation. The GICS structure consists of 11 sectors, 24 industry groups, 69 industries and 158 sub-industries. Each stock that is classified will have a coding at all four of these levels.
Investing in value stocks presents the risk that value stocks may fall out of favor with investors and underperform other asset types during a given period.
Each type of asset class or investment product has a different risk-return profile, which should be considered when investing. All investments contain risk and may lose value.
Basis point (bp) is a unit equal to 1/100th of 1% (0.01%) and is used to denote the change in a financial instrument.
Book value is the net asset value of a company, calculated by subtracting total liabilities from total assets.
Market capitalization of a company is calculated by multiplying the number of outstanding shares by the current market price of a share.
Price-to-book (P/B) is the price of a stock dividend by its book value.
Price-to-earnings (P/E) is calculated by dividing the current price of a stock by the company's trailing 12 months' earnings per share.
Yield-to-worst is the lowest possible yield from owning a bond considering all potential call dates prior to maturity.
Credit Quality weights by rating were derived from the highest bond rating as determined by S&P, Moody's or Fitch. Bond ratings are grades given to bonds that indicate their credit quality as determined by private independent rating services such as S&P, Moody's and Fitch. These firms evaluate a bond issuer's financial strength, or its ability to pay a bond's principal and interest in a timely fashion. Ratings are expressed as letters ranging from 'AAA', which is the highest grade, to 'D', which is the lowest grade. In limited situations when none of the three rating agencies have issued a formal rating, the Advisor will classify the security as nonrated.
During the six months ended December 31, 2019, the Value Opportunities Fund held futures contracts, which resulted in unrealized gains, and purchased put options, which resulted in unrealized losses, and the Capital Income Fund and High Yield Fund held credit default swap contracts, which resulted in realized gains to each Fund.
5
DIVERSIFIED VALUE FUND
Total Return Based on a $10,000 Investment

Comparative Results†††
For Periods ended December 31, 2019 | | Six Months | | 1 Year | | 5 Years | | 10 Years | | Since
8/30/04* | |
Class I | |
Average annual total return | | | 8.19 | % | | | 29.26 | % | | | 7.58 | % | | | 11.60 | % | | | 7.33 | % | |
Class A | |
Average annual total return (with sales charge) | | | 2.43 | % | | | 22.15 | % | | | 6.18 | % | | | 10.71 | % | | | 6.69 | % | |
Average annual total return (without sales charge) | | | 8.10 | % | | | 28.92 | % | | | 7.33 | % | | | 11.32 | % | | | 7.07 | % | |
Class C | |
Average annual total return (with CDSC) | | | 6.72 | % | | | 27.04 | % | | | 6.52 | % | | | 10.48 | % | | | 6.28 | % | |
Average annual total return (without CDSC) | | | 7.72 | % | | | 28.04 | % | | | 6.52 | % | | | 10.48 | % | | | 6.28 | % | |
S&P 500® Index†† | |
Average annual total return | | | 10.92 | % | | | 31.49 | % | | | 11.70 | % | | | 13.56 | % | | | 9.53 | % | |
Russell 1000® Index†† | |
Average annual total return | | | 10.59 | % | | | 31.43 | % | | | 11.48 | % | | | 13.54 | % | | | 9.70 | % | |
Russell 1000® Value Index†† | |
Average annual total return | | | 8.86 | % | | | 26.54 | % | | | 8.29 | % | | | 11.80 | % | | | 8.31 | % | |
Average annual total returns with sales charge and CDSC shown for Class A and Class C shares, respectively, have been adjusted to reflect the applicable sales charges of each specific class. Returns for Class A reflect the maximum initial sales charge of 5.25%. Class C shares have no adjustment for sales charges, but redemptions within one year of purchase may be subject to a CDSC of 1%. Average annual total returns without sales charge or CDSC do not reflect the sales charges. Had the sales charge or CDSC been included, the Fund's returns would have been lower.
† The Fund invests primarily in equity securities of companies with market capitalizations similar to the Russell 1000® Index.
†† See index descriptions in the Fund Information section.
††† Fund returns during certain periods shown reflect a fee waiver and/or expense reimbursement. Without waiver/reimbursement, returns would have been lower. Returns shown include the reinvestment of all dividends. Returns for periods less than one year are not annualized.
* Commencement of Class I, Class A and Class C.
Past performance is not indicative of future results and the graph and table do not reflect the deduction of taxes that a shareholder would pay on Fund distributions or the redemption of Fund shares.
6
LARGE CAP VALUE FUND
Total Return Based on a $10,000 Investment

Comparative Results†††
For Periods ended December 31, 2019 | | Six Months | | 1 Year | | 5 Years | | 10 Years | | Since
6/24/87* | |
Class I | |
Average annual total return | | | 8.14 | % | | | 29.12 | % | | | 7.76 | % | | | 12.14 | % | | | 9.12 | % | |
Class A | |
Average annual total return (with sales charge) | | | 2.28 | % | | | 21.97 | % | | | 6.33 | % | | | 11.25 | % | | | 8.69 | % | |
Average annual total return (without sales charge) | | | 7.95 | % | | | 28.73 | % | | | 7.48 | % | | | 11.85 | % | | | 8.87 | % | |
Class C | |
Average annual total return (with CDSC) | | | 6.63 | % | | | 26.87 | % | | | 6.70 | % | | | 11.03 | % | | | 8.05 | % | |
Average annual total return (without CDSC) | | | 7.63 | % | | | 27.87 | % | | | 6.70 | % | | | 11.03 | % | | | 8.05 | % | |
Class Z | |
Average annual total return | | | 8.18 | % | | | 29.17 | % | | | 7.77 | % | | | 12.15 | % | | | 9.12 | % | |
S&P 500® Index†† | |
Average annual total return | | | 10.92 | % | | | 31.49 | % | | | 11.70 | % | | | 13.56 | % | | | 9.93 | % | |
Russell 1000® Index†† | |
Average annual total return | | | 10.59 | % | | | 31.43 | % | | | 11.48 | % | | | 13.54 | % | | | 10.02 | % | |
Russell 1000® Value Index†† | |
Average annual total return | | | 8.86 | % | | | 26.54 | % | | | 8.29 | % | | | 11.80 | % | | | n/a | | |
Returns shown for Class A, Class C, and Class Z shares for the periods prior to their inception are derived from the historical performance of Class I shares of the Fund during such periods and have been adjusted to reflect the higher total annual operating expenses of Class A and Class C shares. (Inception dates: Class A — 10/26/01; Class C — 2/4/02; Class Z — 9/30/19.)
Average annual total returns with sales charge and CDSC shown for Class A and Class C shares, respectively, have been adjusted to reflect the applicable sales charges of each specific class. Returns for Class A reflect the maximum initial sales charge of 5.25%. Class C shares have no adjustment for sales charges, but redemptions within one year of purchase may be subject to a CDSC of 1%. Average annual total returns without sales charge or CDSC do not reflect the sales charges. Had the sales charge or CDSC been included, the Fund's returns would have been lower.
† The Fund invests primarily in equity securities of companies with market capitalizations similar to the Russell 1000® Index.
†† See index descriptions in the Fund Information section.
††† Fund returns during certain periods shown reflect a fee waiver and/or expense reimbursement. Without waiver/reimbursement, returns would have been lower. Returns shown include the reinvestment of all dividends. Returns for periods less than one year are not annualized.
* Commencement of Class I.
Past performance is not indicative of future results and the graph and table do not reflect the deduction of taxes that a shareholder would pay on Fund distributions or the redemption of Fund shares.
7
MID-CAP VALUE FUND
Total Return Based on a $10,000 Investment

Comparative Results†††
For Periods ended December 31, 2019 | | Six Months | | 1 Year | | 5 Years | | 10 Years | | Since
1/2/97* | |
Class I | |
Average annual total return | | | 0.71 | % | | | 12.92 | % | | | 0.78 | % | | | 10.35 | % | | | 10.73 | % | |
Class A | |
Average annual total return (with sales charge) | | | –4.68 | % | | | 6.77 | % | | | –0.54 | % | | | 9.48 | % | | | 10.20 | % | |
Average annual total return (without sales charge) | | | 0.60 | % | | | 12.69 | % | | | 0.54 | % | | | 10.08 | % | | | 10.46 | % | |
Class C | |
Average annual total return (with CDSC) | | | –0.77 | % | | | 10.84 | % | | | –0.22 | % | | | 9.26 | % | | | 9.66 | % | |
Average annual total return (without CDSC) | | | 0.23 | % | | | 11.84 | % | | | –0.22 | % | | | 9.26 | % | | | 9.66 | % | |
Class Z | |
Average annual total return | | | 0.75 | % | | | 12.97 | % | | | 0.79 | % | | | 10.35 | % | | | 10.73 | % | |
Russell Midcap® Index†† | |
Average annual total return | | | 7.58 | % | | | 30.54 | % | | | 9.33 | % | | | 13.19 | % | | | 10.31 | % | |
Russell Midcap® Value Index†† | |
Average annual total return | | | 7.66 | % | | | 27.06 | % | | | 7.62 | % | | | 12.41 | % | | | 10.30 | % | |
Returns shown for Class A, Class C, and Class Z shares for the periods prior to their inception are derived from the historical performance of Class I shares of the Fund during such periods and have been adjusted to reflect the higher total annual operating expenses of Class A and Class C shares. (Inception dates: Class A, Class C — 1/2/01; Class Z — 9/30/19.)
Average annual total returns with sales charge and CDSC shown for Class A and Class C shares, respectively, have been adjusted to reflect the applicable sales charges of each specific class. Returns for Class A reflect the maximum initial sales charge of 5.25%. Class C shares have no adjustment for sales charges, but redemptions within one year of purchase may be subject to a CDSC of 1%. Average annual total returns without sales charge or CDSC do not reflect the sales charges. Had the sales charge or CDSC been included, the Fund's returns would have been lower.
† The Fund invests primarily in equity securities of companies with market capitalizations similar to the Russell Midcap® Index.
†† See index descriptions in the Fund Information section.
††† Fund returns during certain periods shown reflect a fee waiver and/or expense reimbursement. Without waiver/reimbursement, returns would have been lower. Returns shown include the reinvestment of all dividends. Returns for periods less than one year are not annualized.
* Commencement of Class I.
Past performance is not indicative of future results and the graph and table do not reflect the deduction of taxes that a shareholder would pay on Fund distributions or the redemption of Fund shares.
8
SMALL CAP VALUE FUND
Total Return Based on a $10,000 Investment
Comparative Results†††
For Periods ended December 31, 2019 | | Six Months | | 1 Year | | 5 Years | | 10 Years | | Since
9/20/85* | |
Class I | |
Average annual total return | | | 6.39 | % | | | 20.40 | % | | | 3.85 | % | | | 11.97 | % | | | 11.06 | % | |
Class A | |
Average annual total return (with sales charge) | | | 0.69 | % | | | 13.82 | % | | | 2.48 | % | | | 11.09 | % | | | 10.63 | % | |
Average annual total return (without sales charge) | | | 6.28 | % | | | 20.13 | % | | | 3.60 | % | | | 11.69 | % | | | 10.81 | % | |
Class C | |
Average annual total return (with CDSC) | | | 4.89 | % | | | 18.25 | % | | | 2.82 | % | | | 10.86 | % | | | 10.01 | % | |
Average annual total return (without CDSC) | | | 5.89 | % | | | 19.25 | % | | | 2.82 | % | | | 10.86 | % | | | 10.01 | % | |
Class Z | |
Average annual total return | | | 6.43 | % | | | 20.45 | % | | | 3.86 | % | | | 11.97 | % | | | 11.06 | % | |
Russell 2000® Index†† | |
Average annual total return | | | 7.30 | % | | | 25.53 | % | | | 8.23 | % | | | 11.83 | % | | | 9.76 | % | |
Russell 2000® Value Index†† | |
Average annual total return | | | 7.87 | % | | | 22.39 | % | | | 6.99 | % | | | 10.56 | % | | | n/a | | |
Returns shown for Class A, Class C, and Class Z shares for the periods prior to their inception are derived from the historical performance of Class I shares of the Fund during such periods and have been adjusted to reflect the higher total annual operating expenses of Class A and Class C shares. (Inception dates: Class A — 10/6/00; Class C — 2/4/02; Class Z — 9/30/19.)
Average annual total returns with sales charge and CDSC shown for Class A and Class C shares, respectively, have been adjusted to reflect the applicable sales charges of each specific class. Returns for Class A reflect the maximum initial sales charge of 5.25%. Class C shares have no adjustment for sales charges, but redemptions within one year of purchase may be subject to a CDSC of 1%. Average annual total returns without sales charge or CDSC do not reflect the sales charges. Had the sales charge or CDSC been included, the Fund's returns would have been lower.
† The Fund invests primarily in equity securities of companies with market capitalizations similar to the Russell 2000® Index.
†† See index descriptions in the Fund Information section.
††† Fund returns during certain periods shown reflect a fee waiver and/or expense reimbursement. Without waiver/reimbursement, returns would have been lower. Returns shown include the reinvestment of all dividends. Returns for periods less than one year are not annualized.
* Commencement of Class I.
Past performance is not indicative of future results and the graph and table do not reflect the deduction of taxes that a shareholder would pay on Fund distributions or the redemption of Fund shares.
9
SMALL CAP DIVERSIFIED VALUE FUND
Total Return Based on a $10,000 Investment
Comparative Results†††
For Periods ended December 31, 2019 | | Six Months | | 1 Year | | 5 Years | | Since
6/30/14* | |
Class I | |
Average annual total return | | | 7.78 | % | | | 21.66 | % | | | 7.65 | % | | | 7.45 | % | |
Class A | |
Average annual total return (with sales charge) | | | 1.91 | % | | | 15.05 | % | | | 6.24 | % | | | 6.13 | % | |
Average annual total return (without sales charge) | | | 7.60 | % | | | 21.39 | % | | | 7.39 | % | | | 7.17 | % | |
Class Z | |
Average annual total return | | | 7.80 | % | | | 21.69 | % | | | 7.65 | % | | | 7.45 | % | |
Russell 2000® Index†† | |
Average annual total return | | | 7.30 | % | | | 25.53 | % | | | 8.23 | % | | | 7.77 | % | |
Russell 2000® Value Index†† | |
Average annual total return | | | 7.87 | % | | | 22.39 | % | | | 6.99 | % | | | 6.33 | % | |
Returns shown for Class Z shares for the periods prior to its inception are derived from the historical performance of Class I shares of the Fund during such periods. (Inception date: Class Z — 9/30/19.)
Average annual total returns with sales charge shown for Class A shares have been adjusted to reflect the applicable sales charge of the class. Returns for Class A reflect the maximum initial sales charge of 5.25%. Average annual total returns without sales charge do not reflect the sales charge. Had the sales charge been included, the Fund's returns would have been lower.
† The Fund invests primarily in equity securities of companies with market capitalizations similar to the Russell 2000® Index.
†† See index descriptions in the Fund Information section.
††† Fund returns during certain periods shown reflect a fee waiver and/or expense reimbursement. Without waiver/reimbursement, returns would have been lower. Returns shown include the reinvestment of all dividends. Returns for periods less than one year are not annualized.
* Commencement of Class I and Class A.
Past performance is not indicative of future results and the graph and table do not reflect the deduction of taxes that a shareholder would pay on Fund distributions or the redemption of Fund shares.
10
GLOBAL VALUE FUND
Total Return Based on a $10,000 Investment
Comparative Results†††
For Periods ended December 31, 2019 | | Six Months | | 1 Year | | 5 Years | | Since
12/31/12* | |
Class I | |
Average annual total return | | | 7.91 | % | | | 24.52 | % | | | 5.91 | % | | | 9.26 | % | |
Class A | |
Average annual total return (with sales charge) | | | 2.14 | % | | | 17.68 | % | | | 4.54 | % | | | 8.17 | % | |
Average annual total return (without sales charge) | | | 7.80 | % | | | 24.26 | % | | | 5.67 | % | | | 9.00 | % | |
MSCI World Index†† | |
Average annual total return | | | 9.14 | % | | | 27.67 | % | | | 8.74 | % | | | 10.58 | % | |
Returns shown for Class A shares for the periods prior to its inception are derived from the historical performance of Class I shares of the Fund during such periods and have been adjusted to reflect the higher total annual operating expenses of the class. (Inception date: Class A — 8/30/13.)
Average annual total returns with sales charge shown for Class A shares have been adjusted to reflect the applicable sales charge of the class. Returns for Class A reflect the maximum initial sales charge of 5.25%. Average annual total returns without sales charge do not reflect the sales charge. Had the sales charge been included, the Fund's returns would have been lower.
† The Fund invests primarily in U.S. and non-U.S. companies.
†† See index description in the Fund Information section.
††† Fund returns during certain periods shown reflect a fee waiver and/or expense reimbursement. Without waiver/reimbursement, returns would have been lower. Returns shown include the reinvestment of all dividends. Returns for periods less than one year are not annualized.
* Commencement of Class I.
Past performance is not indicative of future results and the graph and table do not reflect the deduction of taxes that a shareholder would pay on Fund distributions or the redemption of Fund shares.
11
INTERNATIONAL VALUE FUND
Total Return Based on a $10,000 Investment
Comparative Results†††
For Periods ended December 31, 2019 | | Six Months | | 1 Year | | Since
12/31/15* | |
Class I | |
Average annual total return | | | 10.51 | % | | | 19.96 | % | | | 6.38 | % | |
MSCI World ex-USA Index†† | |
Average annual total return | | | 6.85 | % | | | 22.49 | % | | | 7.65 | % | |
† The Fund invests primarily in non-U.S. companies.
†† See index description in the Fund Information section.
††† Fund returns during certain periods shown reflect a fee waiver and/or expense reimbursement. Without waiver/reimbursement, returns would have been lower. Returns shown include the reinvestment of all dividends. Returns for periods less than one year are not annualized.
* Commencement of Class I.
Past performance is not indicative of future results and the graph and table do not reflect the deduction of taxes that a shareholder would pay on Fund distributions or the redemption of Fund shares.
12
VALUE OPPORTUNITIES FUND
Total Return Based on a $10,000 Investment
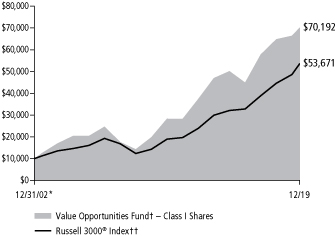
Comparative Results†††
For Periods ended December 31, 2019 | | Six Months | | 1 Year | | 5 Years | | 10 Years | | Since
12/31/02* | |
Class I | |
Average annual total return | | | 5.67 | % | | | 25.57 | % | | | 8.00 | % | | | 13.72 | % | | | 12.15 | % | |
Class A | |
Average annual total return (with sales charge) | | | 0.00 | % | | | 18.67 | % | | | 6.57 | % | | | 12.83 | % | | | 11.56 | % | |
Average annual total return (without sales charge) | | | 5.55 | % | | | 25.23 | % | | | 7.73 | % | | | 13.44 | % | | | 11.92 | % | |
Class C | |
Average annual total return (with CDSC) | | | 4.16 | % | | | 23.34 | % | | | 6.94 | % | | | 12.59 | % | | | 11.07 | % | |
Average annual total return (without CDSC) | | | 5.16 | % | | | 24.34 | % | | | 6.94 | % | | | 12.59 | % | | | 11.07 | % | |
Class Z | |
Average annual total return | | | 5.70 | % | | | 25.60 | % | | | 8.01 | % | | | 13.72 | % | | | 12.15 | % | |
Russell 3000® Index†† | |
Average annual total return | | | 10.37 | % | | | 31.02 | % | | | 11.24 | % | | | 13.42 | % | | | 10.39 | % | |
Russell 3000® Value Index†† | |
Average annual total return | | | 8.80 | % | | | 26.26 | % | | | 8.20 | % | | | 11.71 | % | | | 9.37 | % | |
Returns shown for Class C and Class Z shares for the periods prior to their inception are derived from the historical performance of Class I shares of the Fund during such periods and have been adjusted to reflect the higher total annual operating expenses of Class C shares. (Inception dates: Class C — 8/28/03; Class Z — 9/30/19.)
Average annual total returns with sales charge and CDSC shown for Class A and Class C shares, respectively, have been adjusted to reflect the applicable sales charges of each specific class. Returns for Class A reflect the maximum initial sales charge of 5.25%. Class C shares have no adjustment for sales charges, but redemptions within one year of purchase may be subject to a CDSC of 1%. Average annual total returns without sales charge or CDSC do not reflect the sales charge. Had the sales charge or CDSC been included, the Fund's returns would have been lower.
† The Fund invests primarily in securities of companies with strong capital appreciation potential.
†† See index descriptions in the Fund Information section.
††† Fund returns during certain periods shown reflect a fee waiver and/or expense reimbursement. Without waiver/reimbursement, returns would have been lower. Returns shown include the reinvestment of all dividends. Returns for periods less than one year are not annualized.
* Commencement of Class I and Class A.
Past performance is not indicative of future results and the graph and table do not reflect the deduction of taxes that a shareholder would pay on Fund distributions or the redemption of Fund shares.
13
CAPITAL INCOME FUND
Total Return Based on a $10,000 Investment
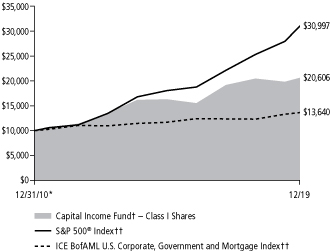
Comparative Results†††
For Periods ended December 31, 2019 | | Six Months | | 1 Year | | 5 Years | | Since
12/31/10* | |
Class I | |
Average annual total return | | | 3.98 | % | | | 16.26 | % | | | 4.96 | % | | | 8.36 | % | |
Class A | |
Average annual total return (with sales charge) | | | –1.04 | % | | | 10.57 | % | | | 3.75 | % | | | 7.87 | % | |
Average annual total return (without sales charge) | | | 3.93 | % | | | 16.10 | % | | | 4.77 | % | | | 8.45 | % | |
S&P 500® Index†† | |
Average annual total return | | | 10.92 | % | | | 31.49 | % | | | 11.70 | % | | | 13.39 | % | |
ICE BofAML U.S. Corporate, Government and Mortgage Index†† | |
Average annual total return | | | 2.52 | % | | | 8.96 | % | | | 3.11 | % | | | 3.51 | % | |
Returns shown for Class A shares for the periods prior to its inception are derived from the historical performance of Class I shares of the Fund during such periods and have been adjusted to reflect the higher total annual operating expenses of the class. (Inception date: Class A — 2/28/11.)
Average annual total returns with sales charge shown for Class A shares have been adjusted to reflect the applicable sales charge of the class. Returns for Class A reflect the maximum initial sales charge of 4.75%. Average annual total returns without sales charge do not reflect the sales charge. Had the sales charge been included, the Fund's returns would have been lower.
† The Fund invests primarily in dividend-paying equities and high yield fixed income securities.
†† See index descriptions in the Fund Information section.
††† Fund returns during certain periods shown reflect a fee waiver and/or expense reimbursement. Without waiver/reimbursement, returns would have been lower. Returns shown include the reinvestment of all dividends. Returns for periods less than one year are not annualized.
* Commencement of Class I.
Past performance is not indicative of future results and the graph and table do not reflect the deduction of taxes that a shareholder would pay on Fund distributions or the redemption of Fund shares.
14
HIGH YIELD FUND
Total Return Based on a $10,000 Investment
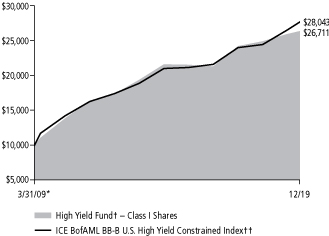
Comparative Results†††
For Periods ended December 31, 2019 | | Six Months | | 1 Year | | 5 Years | | 10 Years | | Since
3/31/09* | |
Class I | |
Average annual total return | | | 1.62 | % | | | 9.57 | % | | | 4.93 | % | | | 7.22 | % | | | 9.57 | % | |
Class A | |
Average annual total return (with sales charge) | | | –2.30 | % | | | 5.24 | % | | | 3.86 | % | | | 6.53 | % | | | 8.84 | % | |
Average annual total return (without sales charge) | | | 1.48 | % | | | 9.32 | % | | | 4.66 | % | | | 6.94 | % | | | 9.23 | % | |
Class C | |
Average annual total return (with CDSC) | | | 0.15 | % | | | 7.52 | % | | | 3.89 | % | | | 6.14 | % | | | 8.47 | % | |
Average annual total return (without CDSC) | | | 1.14 | % | | | 8.52 | % | | | 3.89 | % | | | 6.14 | % | | | 8.47 | % | |
Class Z | |
Average annual total return | | | 1.67 | % | | | 9.77 | % | | | 4.97 | % | | | 7.24 | % | | | 9.59 | % | |
ICE BofAML BB-B U.S. High Yield Constrained Index†† | |
Average annual total return | | | 4.30 | % | | | 15.10 | % | | | 6.11 | % | | | 7.40 | % | | | 10.06 | % | |
Returns shown for Class A, Class C, and Class Z shares for the periods prior to their inception are derived from the historical performance of Class I shares of the Fund during such periods and have been adjusted to reflect the higher total annual operating expenses of Class A and Class C shares. (Inception dates: Class A — 5/29/09; Class C — 12/31/12; Class Z — 3/29/18.)
Average annual total returns with sales charge and CDSC shown for Class A and Class C shares, respectively, have been adjusted to reflect the applicable sales charges of each specific class. Returns for Class A reflect the maximum initial sales charge of 3.75%. Class C shares have no adjustment for sales charges, but redemptions within one year of purchase may be subject to a CDSC of 1%. Average annual total returns without sales charge or CDSC do not reflect the sales charges. Had the sales charge or CDSC been included, the Fund's returns would have been lower.
† The Fund invests primarily in high yield securities.
†† See index description in the Fund Information section.
††† Fund returns during certain periods shown reflect a fee waiver and/or expense reimbursement. Without waiver/reimbursement, returns would have been lower. Returns shown include the reinvestment of all dividends. Returns for periods less than one year are not annualized.
* Commencement of Class I.
Past performance is not indicative of future results and the graph and table do not reflect the deduction of taxes that a shareholder would pay on Fund distributions or the redemption of Fund shares.
15
Schedule of Investments — December 31, 2019
Hotchkis & Wiley Diversified Value Fund (Unaudited)
Largest Equity Holdings | | Percent of
net assets | |
General Electric Company | | | 4.87 | % | |
Wells Fargo & Company | | | 4.53 | % | |
American International Group, Inc. | | | 4.30 | % | |
Microsoft Corp. | | | 3.95 | % | |
Citigroup, Inc. | | | 3.45 | % | |
Oracle Corp. | | | 2.96 | % | |
The Goldman Sachs Group, Inc. | | | 2.92 | % | |
General Motors Company | | | 2.67 | % | |
Corning, Inc. | | | 2.18 | % | |
PPL Corp. | | | 2.18 | % | |
COMMON
STOCKS — 99.58% | | Shares
Held | | Value | |
COMMUNICATION SERVICES — 10.19%
Interactive Media & Services — 1.45% | |
Alphabet, Inc. (a) | | | 1,100 | | | $ | 1,473,329 | | |
Media — 7.02% | |
Comcast Corp. | | | 40,600 | | | | 1,825,782 | | |
Discovery, Inc. (a) | | | 66,500 | | | | 2,027,585 | | |
The Interpublic Group of Companies, Inc. | | | 22,000 | | | | 508,200 | | |
News Corp. | | | 95,000 | | | | 1,343,300 | | |
Omnicom Group, Inc. | | | 6,300 | | | | 510,426 | | |
ViacomCBS, Inc. | | | 21,500 | | | | 902,355 | | |
| | | | 7,117,648 | | |
Wireless Telecommunication Services — 1.72% | |
Vodafone Group PLC — ADR | | | 90,463 | | | | 1,748,650 | | |
TOTAL COMMUNICATION SERVICES | | | 10,339,627 | | |
CONSUMER DISCRETIONARY — 6.28%
Auto Components — 2.86% | |
Adient PLC (a) | | | 27,774 | | | | 590,198 | | |
The Goodyear Tire & Rubber Company | | | 52,800 | | | | 821,304 | | |
Magna International, Inc. | | | 27,200 | | | | 1,491,648 | | |
| | | | 2,903,150 | | |
Automobiles — 3.42% | |
General Motors Company | | | 73,900 | | | | 2,704,740 | | |
Harley-Davidson, Inc. | | | 20,600 | | | | 766,114 | | |
| | | | 3,470,854 | | |
TOTAL CONSUMER DISCRETIONARY | | | 6,374,004 | | |
CONSUMER STAPLES — 2.09%
Food Products — 0.73% | |
Mondelez International, Inc. | | | 13,500 | | | | 743,580 | | |
Personal Products — 1.36% | |
Unilever PLC — ADR | | | 24,100 | | | | 1,377,797 | | |
TOTAL CONSUMER STAPLES | | | 2,121,377 | | |
| | | Shares
Held | |
Value | |
ENERGY — 12.47%
Energy Equipment & Services — 3.34% | |
Halliburton Company | | | 57,700 | | | $ | 1,411,919 | | |
National Oilwell Varco, Inc. | | | 79,000 | | | | 1,978,950 | | |
| | | | 3,390,869 | | |
Oil, Gas & Consumable Fuels — 9.13% | |
Apache Corp. | | | 61,400 | | | | 1,571,226 | | |
Hess Corp. | | | 27,500 | | | | 1,837,275 | | |
Kosmos Energy Ltd. | | | 65,200 | | | | 371,640 | | |
Marathon Oil Corp. | | | 129,700 | | | | 1,761,326 | | |
Marathon Petroleum Corp. | | | 14,422 | | | | 868,925 | | |
Murphy Oil Corp. | | | 45,800 | | | | 1,227,440 | | |
Royal Dutch Shell PLC — ADR | | | 27,462 | | | | 1,619,709 | | |
| | | | 9,257,541 | | |
TOTAL ENERGY | | | 12,648,410 | | |
FINANCIALS — 28.30%
Banks — 12.12% | |
Bank of America Corp. | | | 46,722 | | | | 1,645,549 | | |
CIT Group, Inc. | | | 10,000 | | | | 456,300 | | |
Citigroup, Inc. | | | 43,774 | | | | 3,497,105 | | |
Citizens Financial Group, Inc. | | | 38,900 | | | | 1,579,729 | | |
Fifth Third Bancorp | | | 17,000 | | | | 522,580 | | |
Wells Fargo & Company | | | 85,434 | | | | 4,596,349 | | |
| | | | 12,297,612 | | |
Capital Markets — 5.90% | |
The Bank of New York Mellon Corp. | | | 19,900 | | | | 1,001,567 | | |
The Goldman Sachs Group, Inc. | | | 12,900 | | | | 2,966,097 | | |
Morgan Stanley | | | 20,000 | | | | 1,022,400 | | |
State Street Corp. | | | 12,600 | | | | 996,660 | | |
| | | | 5,986,724 | | |
The accompanying notes are an integral part of these financial statements.
16
Schedule of Investments — December 31, 2019
Hotchkis & Wiley Diversified Value Fund (Unaudited)
| | Shares
Held | | Value | |
Consumer Finance — 2.98% | |
Capital One Financial Corp. | | | 20,100 | | | $ | 2,068,491 | | |
Discover Financial Services | | | 11,200 | | | | 949,984 | | |
| | | | 3,018,475 | | |
Diversified Financial Services — 1.50% | |
AXA Equitable Holdings, Inc. | | | 61,200 | | | | 1,516,536 | | |
Insurance — 5.80% | |
American International Group, Inc. | | | 85,000 | | | | 4,363,050 | | |
The Travelers Companies, Inc. | | | 11,100 | | | | 1,520,145 | | |
| | | | 5,883,195 | | |
TOTAL FINANCIALS | | | 28,702,542 | | |
HEALTH CARE — 8.97%
Biotechnology — 0.62% | |
Biogen, Inc. (a) | | | 2,100 | | | | 623,133 | | |
Health Care Equipment & Supplies — 2.32% | |
Medtronic PLC | | | 15,882 | | | | 1,801,813 | | |
Zimmer Biomet Holdings, Inc. | | | 3,700 | | | | 553,816 | | |
| | | | 2,355,629 | | |
Health Care Providers & Services — 3.68% | |
Anthem, Inc. | | | 4,900 | | | | 1,479,947 | | |
Centene Corp. (a) | | | 10,700 | | | | 672,709 | | |
HCA Healthcare, Inc. | | | 3,700 | | | | 546,897 | | |
UnitedHealth Group, Inc. | | | 3,500 | | | | 1,028,930 | | |
| | | | 3,728,483 | | |
Pharmaceuticals — 2.35% | |
GlaxoSmithKline PLC — ADR | | | 33,400 | | | | 1,569,466 | | |
Sanofi — ADR | | | 16,300 | | | | 818,260 | | |
| | | | 2,387,726 | | |
TOTAL HEALTH CARE | | | 9,094,971 | | |
INDUSTRIALS — 12.70%
Aerospace & Defense — 0.31% | |
Embraer SA — ADR (a) | | | 16,400 | | | | 319,636 | | |
Air Freight & Logistics — 1.03% | |
FedEx Corp. | | | 6,900 | | | | 1,043,349 | | |
Building Products — 0.66% | |
Johnson Controls International PLC | | | 16,447 | | | | 669,557 | | |
Construction & Engineering — 0.43% | |
Fluor Corp. | | | 23,000 | | | | 434,240 | | |
Electrical Equipment — 0.76% | |
Eaton Corp. PLC | | | 8,100 | | | | 767,232 | | |
Industrial Conglomerates — 4.87% | |
General Electric Company | | | 442,900 | | | | 4,942,764 | | |
Machinery — 4.64% | |
| CNH Industrial NV | | | 183,300 | | | | 2,016,300 | | |
Cummins, Inc. | | | 12,300 | | | | 2,201,208 | | |
| | Shares
Held | | Value | |
PACCAR, Inc. | | | 6,200 | | | $ | 490,420 | | |
| | | | 4,707,928 | | |
TOTAL INDUSTRIALS | | | 12,884,706 | | |
INFORMATION TECHNOLOGY — 14.02%
Communications Equipment — 1.06% | |
Telefonaktiebolaget LM Ericsson — ADR | | | 122,400 | | | | 1,074,672 | | |
Electronic Equipment, Instruments & Components — 2.91% | |
Corning, Inc. | | | 76,000 | | | | 2,212,360 | | |
TE Connectivity Ltd. | | | 7,700 | | | | 737,968 | | |
| | | | 2,950,328 | | |
Semiconductors & Semiconductor Equipment — 0.76% | |
Texas Instruments, Inc. | | | 6,000 | | | | 769,740 | | |
Software — 7.16% | |
Microsoft Corp. | | | 25,400 | | | | 4,005,580 | | |
Oracle Corp. | | | 56,700 | | | | 3,003,966 | | |
Teradata Corp. (a) | | | 9,500 | | | | 254,315 | | |
| | | | 7,263,861 | | |
Technology Hardware, Storage & Peripherals — 2.13% | |
Hewlett Packard Enterprise Company | | | 136,000 | | | | 2,156,960 | | |
TOTAL INFORMATION TECHNOLOGY | | | 14,215,561 | | |
MATERIALS — 1.39%
Containers & Packaging — 1.39% | |
International Paper Company | | | 30,600 | | | | 1,409,130 | | |
TOTAL MATERIALS | | | 1,409,130 | | |
UTILITIES — 3.17%
Electric Utilities — 3.17% | |
PPL Corp. | | | 61,600 | | | | 2,210,208 | | |
The Southern Company | | | 15,800 | | | | 1,006,460 | | |
TOTAL UTILITIES | | | 3,216,668 | | |
Total common stocks
(Cost $102,753,950) | | | | | 101,006,996 | | |
Total long-term investments
(Cost $102,753,950) | | | | | 101,006,996 | | |
SHORT-TERM
INVESTMENTS — 0.30% | | Principal
Amount | | | |
Time Deposits — 0.30% | |
Banco Santander SA, 1.56%, 01/02/2020* | | $ | 306,207 | | | | 306,207 | | |
Total short-term investments
(Cost $306,207) | | | 306,207 | | |
Total investments — 99.88%
(Cost $103,060,157) | | | | | 101,313,203 | | |
Other assets in excess of liabilities — 0.12% | | | | | 124,600 | | |
Net assets — 100.00% | | $ | 101,437,803 | | |
(a) — Non-income producing security.
ADR — American Depositary Receipt
* — Invested through a cash management account administered by Brown Brothers Harriman & Co.
The accompanying notes are an integral part of these financial statements.
17
Schedule of Investments — December 31, 2019
Hotchkis & Wiley Large Cap Value Fund (Unaudited)

Largest Equity Holdings | | Percent of
net assets | |
General Electric Company | | | 5.16 | % | |
Wells Fargo & Company | | | 4.75 | % | |
Microsoft Corp. | | | 4.63 | % | |
American International Group, Inc. | | | 4.58 | % | |
Citigroup, Inc. | | | 3.68 | % | |
The Goldman Sachs Group, Inc. | | | 3.47 | % | |
Oracle Corp. | | | 3.47 | % | |
General Motors Company | | | 3.03 | % | |
Comcast Corp. | | | 2.57 | % | |
Corning, Inc. | | | 2.44 | % | |
COMMON
STOCKS — 99.80% | | Shares
Held | | Value | |
COMMUNICATION SERVICES — 7.44%
Media — 5.45% | |
Comcast Corp. | | | 294,700 | | | $ | 13,252,659 | | |
Discovery, Inc. (a) | | | 338,000 | | | | 10,305,620 | | |
ViacomCBS, Inc. | | | 108,000 | | | | 4,532,760 | | |
| | | | 28,091,039 | | |
Wireless Telecommunication Services — 1.99% | |
Vodafone Group PLC — ADR | | | 529,844 | | | | 10,241,885 | | |
TOTAL COMMUNICATION SERVICES | | | 38,332,924 | | |
CONSUMER DISCRETIONARY — 6.27%
Auto Components — 2.52% | |
Adient PLC (a) | | | 191,891 | | | | 4,077,684 | | |
Magna International, Inc. | | | 162,500 | | | | 8,911,500 | | |
| | | | 12,989,184 | | |
Automobiles — 3.75% | |
General Motors Company | | | 426,300 | | | | 15,602,580 | | |
Harley-Davidson, Inc. | | | 99,900 | | | | 3,715,281 | | |
| | | | 19,317,861 | | |
TOTAL CONSUMER DISCRETIONARY | | | 32,307,045 | | |
CONSUMER STAPLES — 2.74%
Beverages — 0.67% | |
PepsiCo, Inc. | | | 25,500 | | | | 3,485,085 | | |
Food Products — 0.72% | |
Mondelez International, Inc. | | | 67,100 | | | | 3,695,868 | | |
Personal Products — 1.35% | |
Unilever PLC — ADR | | | 121,400 | | | | 6,940,438 | | |
TOTAL CONSUMER STAPLES | | | 14,121,391 | | |
ENERGY — 13.02%
Energy Equipment & Services — 3.02% | |
Halliburton Company | | | 122,700 | | | | 3,002,469 | | |
National Oilwell Varco, Inc. | | | 500,900 | | | | 12,547,545 | | |
| | | | 15,550,014 | | |
| | Shares
Held | | Value | |
Oil, Gas & Consumable Fuels — 10.00% | |
Apache Corp. | | | 306,100 | | | $ | 7,833,099 | | |
Hess Corp. | | | 152,500 | | | | 10,188,525 | | |
Marathon Oil Corp. | | | 693,100 | | | | 9,412,298 | | |
Marathon Petroleum Corp. | | | 72,393 | | | | 4,361,678 | | |
Murphy Oil Corp. | | | 379,300 | | | | 10,165,240 | | |
Royal Dutch Shell PLC — ADR | | | 161,372 | | | | 9,517,721 | | |
| | | | 51,478,561 | | |
TOTAL ENERGY | | | 67,028,575 | | |
FINANCIALS — 30.07%
Banks — 13.19% | |
Bank of America Corp. | | | 341,549 | | | | 12,029,356 | | |
Citigroup, Inc. | | | 237,288 | | | | 18,956,938 | | |
Citizens Financial Group, Inc. | | | 308,100 | | | | 12,511,941 | | |
Wells Fargo & Company | | | 454,263 | | | | 24,439,349 | | |
| | | | 67,937,584 | | |
Capital Markets — 5.44% | |
The Goldman Sachs Group, Inc. | | | 77,800 | | | | 17,888,554 | | |
State Street Corp. | | | 128,200 | | | | 10,140,620 | | |
| | | | 28,029,174 | | |
Consumer Finance — 3.63% | |
Capital One Financial Corp. | | | 114,800 | | | | 11,814,068 | | |
Discover Financial Services | | | 80,900 | | | | 6,861,938 | | |
| | | | 18,676,006 | | |
Diversified Financial Services — 1.50% | |
AXA Equitable Holdings, Inc. | | | 311,100 | | | | 7,709,058 | | |
Insurance — 6.31% | |
American International Group, Inc. | | | 459,100 | | | | 23,565,603 | | |
The Travelers Companies, Inc. | | | 65,100 | | | | 8,915,445 | | |
| | | | 32,481,048 | | |
TOTAL FINANCIALS | | | 154,832,870 | | |
The accompanying notes are an integral part of these financial statements.
18
Schedule of Investments — December 31, 2019
Hotchkis & Wiley Large Cap Value Fund (Unaudited)
| | Shares
Held | | Value | |
HEALTH CARE — 8.96%
Health Care Equipment & Supplies — 3.64% | |
Koninklijke Philips NV (l) | | | 49,737 | | | $ | 2,427,166 | | |
Medtronic PLC | | | 95,100 | | | | 10,789,095 | | |
Zimmer Biomet Holdings, Inc. | | | 36,900 | | | | 5,523,192 | | |
| | | | 18,739,453 | | |
Health Care Providers & Services — 2.99% | |
Anthem, Inc. | | | 31,500 | | | | 9,513,945 | | |
UnitedHealth Group, Inc. | | | 20,000 | | | | 5,879,600 | | |
| | | | 15,393,545 | | |
Pharmaceuticals — 2.33% | |
GlaxoSmithKline PLC — ADR | | | 167,100 | | | | 7,852,029 | | |
Sanofi — ADR | | | 82,800 | | | | 4,156,560 | | |
| | | | 12,008,589 | | |
TOTAL HEALTH CARE | | | 46,141,587 | | |
INDUSTRIALS — 11.40%
Aerospace & Defense — 0.46% | |
Embraer SA — ADR (a) | | | 123,000 | | | | 2,397,270 | | |
Building Products — 0.86% | |
Johnson Controls International PLC | | | 108,319 | | | | 4,409,666 | | |
Industrial Conglomerates — 5.16% | |
General Electric Company | | | 2,379,900 | | | | 26,559,684 | | |
Machinery — 4.92% | |
| CNH Industrial NV | | | 979,900 | | | | 10,778,900 | | |
Cummins, Inc. | | | 65,400 | | | | 11,703,984 | | |
PACCAR, Inc. | | | 36,100 | | | | 2,855,510 | | |
| | | | 25,338,394 | | |
TOTAL INDUSTRIALS | | | 58,705,014 | | |
INFORMATION TECHNOLOGY — 15.05%
Communications Equipment — 1.32% | |
Telefonaktiebolaget LM Ericsson — ADR | | | 772,500 | | | | 6,782,550 | | |
Electronic Equipment, Instruments & Components — 2.44% | |
Corning, Inc. | | | 431,300 | | | | 12,555,143 | | |
Semiconductors & Semiconductor Equipment — 0.96% | |
Texas Instruments, Inc. | | | 38,400 | | | | 4,926,336 | | |
Software — 8.09% | |
Microsoft Corp. | | | 151,100 | | | | 23,828,470 | | |
Oracle Corp. | | | 337,100 | | | | 17,859,558 | | |
| | | | 41,688,028 | | |
Technology Hardware, Storage & Peripherals — 2.24% | |
Hewlett Packard Enterprise Company | | | 727,100 | | | | 11,531,806 | | |
TOTAL INFORMATION TECHNOLOGY | | | 77,483,863 | | |
| | Shares
Held | | Value | |
MATERIALS — 1.60%
Containers & Packaging — 1.60% | |
International Paper Company | | | 179,200 | | | $ | 8,252,160 | | |
TOTAL MATERIALS | | | 8,252,160 | | |
UTILITIES — 3.25%
Electric Utilities — 3.25% | |
PPL Corp. | | | 324,200 | | | | 11,632,296 | | |
The Southern Company | | | 80,500 | | | | 5,127,850 | | |
TOTAL UTILITIES | | | 16,760,146 | | |
Total common stocks
(Cost $494,678,372) | | | | | 513,965,575 | | |
Total long-term investments
(Cost $494,678,372) | | | | | 513,965,575 | | |
COLLATERAL FOR SECURITIES ON LOAN — 0.15%
Money Market Funds — 0.15% | |
Invesco Government & Agency
Portfolio — Institutional Class, 1.51%^ | | | 755,000 | | | | 755,000 | | |
Total collateral for securities
on loan (Cost $755,000) | | | | | 755,000 | | |
SHORT-TERM
INVESTMENTS — 0.67% | | Principal
Amount | | | |
Time Deposits — 0.67% | |
Banco Santander SA, 1.56%, 01/02/2020* | | $ | 3,443,771 | | | | 3,443,771 | | |
Total short-term investments
(Cost $3,443,771) | | | 3,443,771 | | |
Total investments — 100.62%
(Cost $498,877,143) | | | | | 518,164,346 | | |
Liabilities in excess of other assets — (0.62)% | | | | | (3,174,098 | ) | |
Net assets — 100.00% | | $ | 514,990,248 | | |
(a) — Non-income producing security.
(l) — All or a portion of this security is on loan. The total market value of securities on loan was $736,578. The remaining contractual maturity of all of the securities lending transactions is overnight and continuous.
ADR — American Depositary Receipt
^ — Rate shown is the 7-day yield as of December 31, 2019.
* — Invested through a cash management account administered by Brown Brothers Harriman & Co.
The accompanying notes are an integral part of these financial statements.
19
Schedule of Investments — December 31, 2019
Hotchkis & Wiley Mid-Cap Value Fund (Unaudited)

Largest Equity Holdings | | Percent of
net assets | |
Cairn Energy PLC | | | 4.61 | % | |
Citizens Financial Group, Inc. | | | 4.25 | % | |
Kosmos Energy Ltd. | | | 4.21 | % | |
Popular, Inc. | | | 3.48 | % | |
The Goodyear Tire & Rubber Company | | | 3.42 | % | |
CNO Financial Group, Inc. | | | 3.20 | % | |
CIT Group, Inc. | | | 2.95 | % | |
Royal Mail PLC | | | 2.92 | % | |
Embraer SA | | | 2.76 | % | |
Office Depot, Inc. | | | 2.61 | % | |
COMMON
STOCKS — 97.83% | | Shares
Held | | Value | |
COMMUNICATION SERVICES — 5.58%
Media — 5.58% | |
Discovery, Inc. (a) | | | 779,100 | | | $ | 23,754,759 | | |
The Interpublic Group of Companies, Inc. | | | 308,700 | | | | 7,130,970 | | |
News Corp. | | | 1,068,500 | | | | 15,108,590 | | |
ViacomCBS, Inc. | | | 167,300 | | | | 7,021,581 | | |
TOTAL COMMUNICATION SERVICES | | | 53,015,900 | | |
CONSUMER DISCRETIONARY — 14.07%
Auto Components — 7.26% | |
Adient PLC (a) | | | 740,300 | | | | 15,731,375 | | |
The Goodyear Tire & Rubber Company | | | 2,088,600 | | | | 32,488,173 | | |
Magna International, Inc. | | | 380,300 | | | | 20,855,652 | | |
| | | | 69,075,200 | | |
Automobiles — 0.53% | |
Harley-Davidson, Inc. | | | 134,800 | | | | 5,013,212 | | |
Household Durables — 1.68% | |
TRI Pointe Group, Inc. (a) | | | 1,023,700 | | | | 15,949,246 | | |
Specialty Retail — 4.60% | |
Bed Bath & Beyond, Inc. | | | 1,094,900 | | | | 18,941,770 | | |
Office Depot, Inc. | | | 9,067,050 | | | | 24,843,717 | | |
| | | | 43,785,487 | | |
TOTAL CONSUMER DISCRETIONARY | | | 133,823,145 | | |
CONSUMER STAPLES — 1.85%
Food Products — 1.85% | |
Bunge Ltd. | | | 306,300 | | | | 17,627,565 | | |
TOTAL CONSUMER STAPLES | | | 17,627,565 | | |
ENERGY — 18.32%
Energy Equipment & Services — 3.80% | |
Frank's International NV (a) | | | 907,900 | | | | 4,693,843 | | |
Halliburton Company | | | 230,800 | | | | 5,647,676 | | |
National Oilwell Varco, Inc. | | | 204,000 | | | | 5,110,200 | | |
NexTier Oilfield Solutions, Inc. (a) | | | 2,823,565 | | | | 18,917,886 | | |
| | Shares
Held | | Value | |
Superior Energy Services, Inc. (a) | | | 350,810 | | | $ | 1,757,558 | | |
| | | | 36,127,163 | | |
Oil, Gas & Consumable Fuels — 14.52% | |
Apache Corp. | | | 891,400 | | | | 22,810,926 | | |
Cairn Energy PLC (a) (v) | | | 16,026,800 | | | | 43,845,337 | | |
Cenovus Energy, Inc. | | | 432,200 | | | | 4,386,830 | | |
Equitrans Midstream Corp. | | | 400,500 | | | | 5,350,680 | | |
Hess Corp. | | | 37,200 | | | | 2,485,332 | | |
Kosmos Energy Ltd. | | | 7,030,120 | | | | 40,071,684 | | |
Murphy Oil Corp. | | | 190,000 | | | | 5,092,000 | | |
Whiting Petroleum Corp. (a) (l) | | | 1,909,025 | | | | 14,012,243 | | |
| | | | 138,055,032 | | |
TOTAL ENERGY | | | 174,182,195 | | |
FINANCIALS — 23.75%
Banks — 12.42% | |
CIT Group, Inc. | | | 614,424 | | | | 28,036,167 | | |
Citizens Financial Group, Inc. | | | 996,000 | | | | 40,447,560 | | |
Fifth Third Bancorp | | | 229,000 | | | | 7,039,460 | | |
First Horizon National Corp. | | | 427,500 | | | | 7,079,400 | | |
KeyCorp | | | 116,500 | | | | 2,357,960 | | |
Popular, Inc. | | | 563,400 | | | | 33,099,750 | | |
| | | | 118,060,297 | | |
Capital Markets — 1.96% | |
Evercore, Inc. | | | 89,800 | | | | 6,713,448 | | |
Lazard Ltd. | | | 122,000 | | | | 4,875,120 | | |
State Street Corp. | | | 89,400 | | | | 7,071,540 | | |
| | | | 18,660,108 | | |
Consumer Finance — 2.24% | |
Discover Financial Services | | | 137,000 | | | | 11,620,340 | | |
SLM Corp. | | | 1,090,700 | | | | 9,718,137 | | |
| | | | 21,338,477 | | |
The accompanying notes are an integral part of these financial statements.
20
Schedule of Investments — December 31, 2019
Hotchkis & Wiley Mid-Cap Value Fund (Unaudited)
| | Shares
Held | | Value | |
Diversified Financial Services — 1.95% | |
AXA Equitable Holdings, Inc. | | | 749,400 | | | $ | 18,570,132 | | |
Insurance — 5.18% | |
Alleghany Corp. (a) | | | 5,900 | | | | 4,717,463 | | |
CNO Financial Group, Inc. | | | 1,676,800 | | | | 30,400,384 | | |
Enstar Group Ltd. (a) | | | 68,100 | | | | 14,087,166 | | |
| | | | 49,205,013 | | |
TOTAL FINANCIALS | | | 225,834,027 | | |
HEALTH CARE — 2.38%
Health Care Equipment & Supplies — 0.50% | |
Zimmer Biomet Holdings, Inc. | | | 31,900 | | | | 4,774,792 | | |
Health Care Providers & Services — 1.88% | |
Centene Corp. (a) | | | 284,100 | | | | 17,861,367 | | |
TOTAL HEALTH CARE | | | 22,636,159 | | |
INDUSTRIALS — 14.99%
Aerospace & Defense — 2.76% | |
Embraer SA — ADR (a) | | | 1,348,300 | | | | 26,278,367 | | |
Air Freight & Logistics — 2.92% | |
Royal Mail PLC (v) | | | 9,216,900 | | | | 27,719,680 | | |
Airlines — 0.57% | |
JetBlue Airways Corp. (a) | | | 288,900 | | | | 5,408,208 | | |
Construction & Engineering — 2.01% | |
Fluor Corp. | | | 1,012,700 | | | | 19,119,776 | | |
Machinery — 3.54% | |
| CNH Industrial NV | | | 1,492,900 | | | | 16,421,900 | | |
Navistar International Corp. (a) | | | 594,600 | | | | 17,207,724 | | |
| | | | 33,629,624 | | |
Road & Rail — 3.19% | |
AMERCO | | | 62,200 | | | | 23,376,004 | | |
Avis Budget Group, Inc. (a) | | | 216,500 | | | | 6,979,960 | | |
| | | | 30,355,964 | | |
TOTAL INDUSTRIALS | | | 142,511,619 | | |
INFORMATION TECHNOLOGY — 9.87%
Communications Equipment — 2.05% | |
CommScope Holding Company, Inc. (a) | | | 878,000 | | | | 12,458,820 | | |
Telefonaktiebolaget LM Ericsson — ADR | | | 800,800 | | | | 7,031,024 | | |
| | | | 19,489,844 | | |
Electronic Equipment, Instruments & Components — 5.30% | |
Arrow Electronics, Inc. (a) | | | 230,400 | | | | 19,524,096 | | |
Avnet, Inc. | | | 225,400 | | | | 9,565,976 | | |
Corning, Inc. | | | 732,500 | | | | 21,323,075 | | |
| | | | 50,413,147 | | |
Technology Hardware, Storage & Peripherals — 2.52% | |
Hewlett Packard Enterprise Company | | | 1,506,800 | | | | 23,897,848 | | |
TOTAL INFORMATION TECHNOLOGY | | | 93,800,839 | | |
| | Shares
Held | | Value | |
REAL ESTATE — 1.29%
Equity Real Estate Investment Trusts — 1.29% | |
Colony Capital, Inc. | | | 1,471,700 | | | $ | 6,990,575 | | |
The GEO Group, Inc. | | | 316,450 | | | | 5,256,234 | | |
TOTAL REAL ESTATE | | | 12,246,809 | | |
UTILITIES — 5.73%
Electric Utilities — 1.49% | |
PPL Corp. | | | 395,900 | | | | 14,204,892 | | |
Independent Power and Renewable Electricity
Producers — 4.24% | |
NRG Energy, Inc. | | | 477,000 | | | | 18,960,750 | | |
Vistra Energy Corp. | | | 929,000 | | | | 21,357,710 | | |
| | | | 40,318,460 | | |
TOTAL UTILITIES | | | 54,523,352 | | |
Total common stocks
(Cost $984,692,917) | | | | | 930,201,610 | | |
Total long-term investments
(Cost $984,692,917) | | | | | 930,201,610 | | |
COLLATERAL FOR SECURITIES ON LOAN — 0.19% | |
Money Market Funds — 0.01% | |
Invesco Government & Agency Portfolio —
Institutional Class, 1.51%^ | | | 1,790,955 | | | | 1,790,955 | | |
Total collateral for securities on loan
(Cost $1,790,955) | | | | | 1,790,955 | | |
SHORT-TERM
INVESTMENTS — 2.36% | | Principal
Amount | | | |
Time Deposits — 2.36% | |
Brown Brothers Harriman & Co.,
0.36%, 01/02/2020* | | GBP | 251 | | | | 332 | | |
Citigroup, Inc., 1.56%, 01/02/2020* | | $ | 22,487,176 | | | | 22,487,176 | | |
Total short-term investments
(Cost $22,487,483) | | | 22,487,508 | | |
Total investments — 100.38%
(Cost $1,008,971,355) | | | 954,480,073 | | |
Liabilities in excess of other assets — (0.38)% | | | | | (3,628,963 | ) | |
Net assets — 100.00% | | $ | 950,851,110 | | |
(a) — Non-income producing security.
(l) — All or a portion of this security is on a loan. The total market value of securities on loan was $1,729,956. The remaining contractual maturity of all of the securities lending transactions is overnight and continuous.
(v) — Security was fair valued as a result of market movements following the close of local trading using a third-party vendor's proprietary fair value pricing model. The total market value of these securities was $71,565,017, which represented 7.53% of net assets. See Security Valuation in Note 1 in Notes to the Financial Statements.
ADR — American Depositary Receipt
GBP — British Pound
^ — Rate shown is the 7-day yield as of December 31, 2019.
* — Invested through a cash management account administered by Brown Brothers Harriman & Co.
The accompanying notes are an integral part of these financial statements.
21
Schedule of Investments — December 31, 2019
Hotchkis & Wiley Small Cap Value Fund (Unaudited)
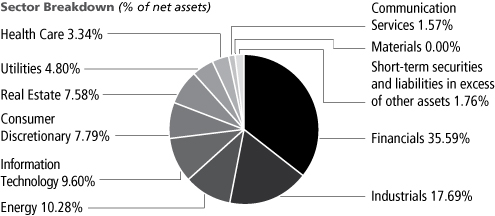
Largest Equity Holdings | | Percent of
net assets | |
Enstar Group Ltd. | | | 6.00 | % | |
Seritage Growth Properties | | | 5.51 | % | |
The Bank of NT Butterfield & Son Ltd. | | | 4.72 | % | |
First Hawaiian, Inc. | | | 4.48 | % | |
Popular, Inc. | | | 4.33 | % | |
Arrow Electronics, Inc. | | | 3.44 | % | |
Hanger, Inc. | | | 3.34 | % | |
Office Depot, Inc. | | | 3.26 | % | |
Frank's International NV | | | 3.20 | % | |
Evercore, Inc. | | | 2.99 | % | |
COMMON
STOCKS — 98.24% | | Shares
Held | | Value | |
COMMUNICATION SERVICES — 1.57%
Media — 1.57% | |
MDC Partners, Inc. (a) (o) | | | 3,976,000 | | | $ | 11,053,280 | | |
TOTAL COMMUNICATION SERVICES | | | 11,053,280 | | |
CONSUMER DISCRETIONARY — 7.79%
Household Durables — 0.87% | |
TRI Pointe Group, Inc. (a) | | | 391,600 | | | | 6,101,128 | | |
Specialty Retail — 6.92% | |
Bed Bath & Beyond, Inc. | | | 309,600 | | | | 5,356,080 | | |
Group 1 Automotive, Inc. | | | 46,500 | | | | 4,650,000 | | |
Office Depot, Inc. | | | 8,361,900 | | | | 22,911,606 | | |
Sonic Automotive, Inc. | | | 508,100 | | | | 15,751,100 | | |
| | | | 48,668,786 | | |
TOTAL CONSUMER DISCRETIONARY | | | 54,769,914 | | |
ENERGY — 10.28%
Energy Equipment & Services — 4.58% | |
Frank's International NV (a) | | | 4,352,400 | | | | 22,501,908 | | |
NexTier Oilfield Solutions, Inc. (a) | | | 1,003,337 | | | | 6,722,358 | | |
Nine Energy Service, Inc. (a) | | | 276,000 | | | | 2,158,320 | | |
Quintana Energy Services, Inc. (a) | | | 277,700 | | | | 780,337 | | |
| | | | 32,162,923 | | |
Oil, Gas & Consumable Fuels — 5.70% | |
Altus Midstream Company (a) | | | 2,089,600 | | | | 5,976,256 | | |
Berry Petroleum Corp. | | | 294,300 | | | | 2,775,249 | | |
Cairn Energy PLC (a) (v) | | | 734,400 | | | | 2,009,136 | | |
Equitrans Midstream Corp. | | | 435,700 | | | | 5,820,952 | | |
Kosmos Energy Ltd. | | | 2,095,500 | | | | 11,944,350 | | |
Range Resources Corp. (l) | | | 964,800 | | | | 4,679,280 | | |
Rockhopper Exploration PLC (a) | | | 5,054,700 | | | | 1,000,308 | | |
Talos Energy, Inc. (a) | | | 62,200 | | | | 1,875,330 | | |
Whiting Petroleum Corp. (a) (l) | | | 545,525 | | | | 4,004,153 | | |
| | | | 40,085,014 | | |
TOTAL ENERGY | | | 72,247,937 | | |
| | Shares
Held | | Value | |
FINANCIALS — 35.59%
Banks — 17.65% | |
Associated Banc-Corp | | | 286,400 | | | $ | 6,312,256 | | |
The Bank of NT Butterfield & Son Ltd. | | | 896,000 | | | | 33,169,920 | | |
First Hawaiian, Inc. | | | 1,091,700 | | | | 31,495,545 | | |
First Horizon National Corp. | | | 1,183,931 | | | | 19,605,897 | | |
Investors Bancorp, Inc. | | | 258,000 | | | | 3,074,070 | | |
Popular, Inc. | | | 517,900 | | | | 30,426,625 | | |
| | | | 124,084,313 | | |
Capital Markets — 5.42% | |
Brightsphere Investment Group, Inc. | | | 259,400 | | | | 2,651,068 | | |
Evercore, Inc. | | | 281,000 | | | | 21,007,560 | | |
Lazard Ltd. | | | 56,000 | | | | 2,237,760 | | |
Stifel Financial Corp. | | | 200,900 | | | | 12,184,585 | | |
| | | | 38,080,973 | | |
Consumer Finance — 1.41% | |
SLM Corp. | | | 1,111,600 | | | | 9,904,356 | | |
Insurance — 10.53% | |
CNO Financial Group, Inc. | | | 1,123,700 | | | | 20,372,681 | | |
Enstar Group Ltd. (a) | | | 203,879 | | | | 42,174,410 | | |
Global Indemnity Ltd. | | | 388,336 | | | | 11,506,396 | | |
| | | | 74,053,487 | | |
Thrifts & Mortgage Finance — 0.58% | |
Luther Burbank Corp. | | | 251,200 | | | | 2,896,336 | | |
TFS Financial Corp. | | | 61,700 | | | | 1,214,256 | | |
| | | | 4,110,592 | | |
TOTAL FINANCIALS | | | 250,233,721 | | |
HEALTH CARE — 3.34%
Health Care Providers & Services — 3.34% | |
Hanger, Inc. (a) | | | 851,300 | | | | 23,504,393 | | |
TOTAL HEALTH CARE | | | 23,504,393 | | |
The accompanying notes are an integral part of these financial statements.
22
Schedule of Investments — December 31, 2019
Hotchkis & Wiley Small Cap Value Fund (Unaudited)
| | Shares
Held | | Value | |
INDUSTRIALS — 17.69%
Aerospace & Defense — 2.22% | |
Embraer SA — ADR (a) | | | 802,000 | | | $ | 15,630,980 | | |
Building Products — 4.16% | |
Armstrong Flooring, Inc. (a) | | | 575,000 | | | | 2,455,250 | | |
Masonite International Corp. (a) | | | 126,700 | | | | 9,149,007 | | |
Resideo Technologies, Inc. (a) | | | 1,479,280 | | | | 17,647,810 | | |
| | | | 29,252,067 | | |
Commercial Services & Supplies — 0.32% | |
Quad/Graphics, Inc. | | | 474,700 | | | | 2,216,849 | | |
Construction & Engineering — 3.01% | |
Fluor Corp. | | | 928,300 | | | | 17,526,304 | | |
Tutor Perini Corp. (a) | | | 280,200 | | | | 3,603,372 | | |
| | | | 21,129,676 | | |
Machinery — 3.14% | |
EnPro Industries, Inc. | | | 130,600 | | | | 8,734,528 | | |
Miller Industries, Inc. | | | 233,100 | | | | 8,655,003 | | |
Navistar International Corp. (a) | | | 161,700 | | | | 4,679,598 | | |
| | | | 22,069,129 | | |
Marine — 2.85% | |
Matson, Inc. | | | 490,700 | | | | 20,020,560 | | |
Professional Services — 0.70% | |
Hudson Global, Inc. (a) (o) | | | 218,760 | | | | 2,614,182 | | |
Korn Ferry | | | 54,800 | | | | 2,323,520 | | |
| | | | 4,937,702 | | |
Trading Companies & Distributors — 1.29% | |
Rush Enterprises, Inc. | | | 195,400 | | | | 9,086,100 | | |
TOTAL INDUSTRIALS | | | 124,343,063 | | |
INFORMATION TECHNOLOGY — 9.60%
Communications Equipment — 1.06% | |
Casa Systems, Inc. (a) | | | 206,500 | | | | 844,585 | | |
CommScope Holding Company, Inc. (a) | | | 466,700 | | | | 6,622,473 | | |
| | | | 7,467,058 | | |
Electronic Equipment, Instruments & Components — 4.94% | |
Arrow Electronics, Inc. (a) | | | 285,600 | | | | 24,201,744 | | |
Avnet, Inc. | | | 128,800 | | | | 5,466,272 | | |
Belden, Inc. | | | 91,700 | | | | 5,043,500 | | |
| | | | 34,711,516 | | |
IT Services — 1.65% | |
KBR, Inc. | | | 380,200 | | | | 11,596,100 | | |
Semiconductors & Semiconductor Equipment — 1.95% | |
Diodes, Inc. (a) | | | 243,700 | | | | 13,737,369 | | |
TOTAL INFORMATION TECHNOLOGY | | | 67,512,043 | | |
MATERIALS — 0.00%
Metals & Mining — 0.00% | |
Noranda Aluminum Holding Corp. (a) (i) (o) | | | 800,300 | | | | 2,881 | | |
TOTAL MATERIALS | | | 2,881 | | |
| | Shares
Held | | Value | |
REAL ESTATE — 7.58%
Equity Real Estate Investment Trusts — 7.58% | |
Colony Capital, Inc. | | | 1,367,700 | | | $ | 6,496,575 | | |
The GEO Group, Inc. | | | 482,844 | | | | 8,020,039 | | |
Seritage Growth Properties (l) | | | 966,900 | | | | 38,753,352 | | |
TOTAL REAL ESTATE | | | 53,269,966 | | |
UTILITIES — 4.80%
Electric Utilities — 2.51% | |
Portland General Electric Company | | | 316,200 | | | | 17,640,798 | | |
Multi-Utilities — 2.29% | |
Avista Corp. | | | 334,400 | | | | 16,081,296 | | |
TOTAL UTILITIES | | | 33,722,094 | | |
Total common stocks
(Cost $671,173,754) | | | | | 690,659,292 | | |
Total long-term investments
(Cost $671,173,754) | | | | | 690,659,292 | | |
COLLATERAL FOR SECURITIES ON LOAN — 1.48% | |
Money Market Funds — 1.48% | |
Invesco Government & Agency
Portfolio — Institutional Class, 1.51%^ | | | 10,420,489 | | | | 10,420,489 | | |
Total collateral for securities on loan
(Cost $10,420,489) | | | | | 10,420,489 | | |
SHORT-TERM
INVESTMENTS — 1.72% | | Principal
Amount | | | |
Time Deposits — 1.72% | |
Banco Santander SA, 1.56%, 01/02/2020* | | $ | 12,124,744 | | | | 12,124,744 | | |
Brown Brothers Harriman & Co.,
0.82%, 01/02/2020* | | CAD | 115 | | | | 88 | | |
Total short-term investments
(Cost $12,124,828) | | | 12,124,832 | | |
Total investments — 101.44%
(Cost $693,719,072) | | | 713,204,613 | | |
Liabilities in excess of other assets — (1.44)% | | | | | (10,142,087 | ) | |
Net assets — 100.00% | | $ | 703,062,526 | | |
(a) — Non-income producing security.
(i) — Illiquid security. The total market value of these securities was $2,881, which represented 0.00% of net assets.
(l) — All or a portion of this security is on loan. The total market value of securities on loan was $10,174,965. The remaining contractual maturity of all of the securities lending transactions is overnight and continuous.
(o) — Affiliated issuer. See Note 6 in Notes to the Financial Statements.
(v) — Security was fair valued as a result of market movements following the close of local trading using a third-party vendor's proprietary fair value pricing model. The total market value of these securities was $2,009,136, which represented 0.29% of net assets. See Security Valuation in Note 1 in Notes to Financial Statements.
ADR — American Depositary Receipt
CAD — Canadian Dollar
^ — Rate shown is the 7-day yield as of December 31, 2019.
* — Invested through a cash management account administered by Brown Brothers Harriman & Co.
The accompanying notes are an integral part of these financial statements.
23
Schedule of Investments — December 31, 2019
Hotchkis & Wiley Small Cap Diversified Value Fund (Unaudited)

Largest Equity Holdings | | Percent of
net assets | |
Bonanza Creek Energy, Inc. | | | 0.47 | % | |
Meritor, Inc. | | | 0.45 | % | |
National Western Life Group, Inc. | | | 0.45 | % | |
W&T Offshore, Inc. | | | 0.44 | % | |
Apergy Corp. | | | 0.44 | % | |
Diodes, Inc. | | | 0.43 | % | |
Super Micro Computer, Inc. | | | 0.43 | % | |
Renewable Energy Group, Inc. | | | 0.43 | % | |
Blue Bird Corp. | | | 0.43 | % | |
SRC Energy, Inc. | | | 0.43 | % | |
COMMON
STOCKS — 96.22% | | Shares
Held | | Value | |
COMMUNICATION SERVICES — 1.16%
Media — 1.16% | |
Emerald Expositions Events, Inc. | | | 36,610 | | | $ | 386,236 | | |
Entravision Communications Corp. | | | 95,165 | | | | 249,332 | | |
Meredith Corp. | | | 6,995 | | | | 227,128 | | |
MSG Networks, Inc. (a) | | | 31,129 | | | | 541,644 | | |
TEGNA, Inc. | | | 7,967 | | | | 132,969 | | |
TOTAL COMMUNICATION SERVICES | | | 1,537,309 | | |
CONSUMER DISCRETIONARY — 13.39%
Auto Components — 1.47% | |
Adient PLC (a) | | | 21,995 | | | | 467,394 | | |
Cooper Tire & Rubber Company | | | 17,359 | | | | 499,071 | | |
The Goodyear Tire & Rubber Company | | | 30,710 | | | | 477,694 | | |
Motorcar Parts of America, Inc. (a) | | | 17,269 | | | | 380,436 | | |
Visteon Corp. (a) | | | 1,400 | | | | 121,226 | | |
| | | | 1,945,821 | | |
Automobiles — 0.31% | |
Thor Industries, Inc. | | | 5,500 | | | | 408,595 | | |
Distributors — 0.34% | |
Funko, Inc. (a) | | | 26,100 | | | | 447,876 | | |
Diversified Consumer Services — 0.08% | |
Regis Corp. (a) | | | 6,100 | | | | 109,007 | | |
Hotels, Restaurants & Leisure — 0.95% | |
Brinker International, Inc. | | | 5,770 | | | | 242,340 | | |
Hilton Grand Vacations, Inc. (a) | | | 14,252 | | | | 490,126 | | |
Twin River Worldwide Holdings, Inc. | | | 20,500 | | | | 525,825 | | |
| | | | 1,258,291 | | |
Household Durables — 3.74% | |
Century Communities, Inc. (a) | | | 17,696 | | | | 483,986 | | |
Ethan Allen Interiors, Inc. | | | 28,525 | | | | 543,686 | | |
Flexsteel Industries, Inc. | | | 6,314 | | | | 125,775 | | |
Green Brick Partners, Inc. (a) | | | 10,720 | | | | 123,066 | | |
| | Shares
Held | | Value | |
Hamilton Beach Brands Holding Company | | | 5,000 | | | $ | 95,500 | | |
Hooker Furniture Corp. | | | 20,375 | | | | 523,434 | | |
iRobot Corp. (a) | | | 5,200 | | | | 263,276 | | |
La-Z-Boy, Inc. | | | 12,200 | | | | 384,056 | | |
LGI Homes, Inc. (a) | | | 5,013 | | | | 354,168 | | |
M/I Homes, Inc. (a) | | | 3,023 | | | | 118,955 | | |
Meritage Homes Corp. (a) | | | 3,929 | | | | 240,101 | | |
Taylor Morrison Home Corp. (a) | | | 21,810 | | | | 476,767 | | |
TRI Pointe Group, Inc. (a) | | | 24,041 | | | | 374,559 | | |
Tupperware Brands Corp. (a) | | | 33,462 | | | | 287,104 | | |
ZAGG, Inc. (a) | | | 68,179 | | | | 552,931 | | |
| | | | 4,947,364 | | |
Internet & Catalog Retail — 0.37% | |
Duluth Holdings, Inc. (a) | | | 9,100 | | | | 95,823 | | |
PetMed Express, Inc. | | | 16,500 | | | | 388,080 | | |
| | | | 483,903 | | |
Leisure Products — 0.35% | |
Johnson Outdoors, Inc. | | | 4,900 | | | | 375,830 | | |
Nautilus, Inc. (a) | | | 53,880 | | | | 94,290 | | |
| | | | 470,120 | | |
Multiline Retail — 0.23% | |
Big Lots, Inc. | | | 5,800 | | | | 166,576 | | |
Dillard's, Inc. | | | 1,800 | | | | 132,264 | | |
| | | | 298,840 | | |
Specialty Retail — 4.07% | |
American Eagle Outfitters, Inc. | | | 25,600 | | | | 376,320 | | |
Asbury Automotive Group, Inc. (a) | | | 2,164 | | | | 241,914 | | |
Bed Bath & Beyond, Inc. | | | 9,014 | | | | 155,942 | | |
Camping World Holdings, Inc. | | | 19,000 | | | | 280,060 | | |
The Children's Place, Inc. | | | 6,500 | | | | 406,380 | | |
Designer Brands, Inc. | | | 25,100 | | | | 395,074 | | |
The accompanying notes are an integral part of these financial statements.
24
Schedule of Investments — December 31, 2019
Hotchkis & Wiley Small Cap Diversified Value Fund (Unaudited)
| | Shares
Held | | Value | |
Genesco, Inc. (a) | | | 2,600 | | | $ | 124,592 | | |
Group 1 Automotive, Inc. | | | 4,628 | | | | 462,800 | | |
Haverty Furniture Companies, Inc. | | | 18,398 | | | | 370,904 | | |
Hibbett Sports, Inc. (a) | | | 14,173 | | | | 397,411 | | |
Lithia Motors, Inc. | | | 2,392 | | | | 351,624 | | |
Office Depot, Inc. | | | 154,716 | | | | 423,922 | | |
Sonic Automotive, Inc. | | | 15,450 | | | | 478,949 | | |
Sportsman's Warehouse Holdings, Inc. (a) | | | 31,352 | | | | 251,757 | | |
Tilly's, Inc. | | | 21,600 | | | | 264,600 | | |
Urban Outfitters, Inc. (a) | | | 9,810 | | | | 272,424 | | |
Zumiez, Inc. (a) | | | 3,500 | | | | 120,890 | | |
| | | | 5,375,563 | | |
Textiles, Apparel & Luxury Goods — 1.48% | |
Fossil Group, Inc. (a) | | | 49,200 | | | | 387,696 | | |
G-III Apparel Group Ltd. (a) | | | 12,000 | | | | 402,000 | | |
Movado Group, Inc. | | | 24,462 | | | | 531,804 | | |
Rocky Brands, Inc. | | | 4,500 | | | | 132,435 | | |
Unifi, Inc. (a) | | | 5,200 | | | | 131,352 | | |
Vera Bradley, Inc. (a) | | | 31,800 | | | | 375,240 | | |
| | | | 1,960,527 | | |
TOTAL CONSUMER DISCRETIONARY | | | 17,705,907 | | |
CONSUMER STAPLES — 1.89%
Food & Staples Retailing — 0.17% | |
Village Super Market, Inc. | | | 9,686 | | | | 224,715 | | |
Household Products — 0.28% | |
Energizer Holdings, Inc. | | | 7,500 | | | | 376,650 | | |
Personal Products — 1.03% | |
Medifast, Inc. | | | 2,800 | | | | 306,824 | | |
Nu Skin Enterprises, Inc. | | | 12,950 | | | | 530,691 | | |
USANA Health Sciences, Inc. (a) | | | 6,600 | | | | 518,430 | | |
| | | | 1,355,945 | | |
Tobacco — 0.41% | |
Universal Corp. | | | 9,600 | | | | 547,776 | | |
TOTAL CONSUMER STAPLES | | | 2,505,086 | | |
ENERGY — 11.23%
Energy Equipment & Services — 4.10% | |
Apergy Corp. (a) | | | 17,300 | | | | 584,393 | | |
Cactus, Inc. | | | 11,830 | | | | 406,006 | | |
Frank's International NV (a) | | | 96,820 | | | | 500,559 | | |
Liberty Oilfield Services, Inc. | | | 48,100 | | | | 534,872 | | |
Matrix Service Company (a) | | | 16,800 | | | | 384,384 | | |
Newpark Resources, Inc. (a) | | | 64,340 | | | | 403,412 | | |
NexTier Oilfield Solutions, Inc. (a) | | | 82,308 | | | | 551,464 | | |
Nine Energy Service, Inc. (a) | | | 18,900 | | | | 147,798 | | |
ProPetro Holding Corp. (a) | | | 49,400 | | | | 555,750 | | |
| | Shares
Held | | Value | |
RPC, Inc. | | | 81,200 | | | $ | 425,488 | | |
SEACOR Holdings, Inc. (a) | | | 2,900 | | | | 125,135 | | |
Select Energy Services, Inc. (a) | | | 28,200 | | | | 261,696 | | |
Solaris Oilfield Infrastructure, Inc. | | | 39,000 | | | | 546,000 | | |
| | | | 5,426,957 | | |
Oil, Gas & Consumable Fuels — 7.13% | |
Altus Midstream Company (a) | | | 139,600 | | | | 399,256 | | |
Berry Petroleum Corp. | | | 57,270 | | | | 540,056 | | |
Bonanza Creek Energy, Inc. (a) | | | 26,830 | | | | 626,212 | | |
Callon Petroleum Company (a) | | | 86,931 | | | | 419,877 | | |
Centennial Resource Development, Inc. (a) | | | 121,000 | | | | 559,020 | | |
CNX Midstream Partners LP | | | 25,610 | | | | 421,541 | | |
Delek US Holdings, Inc. | | | 11,240 | | | | 376,877 | | |
Earthstone Energy, Inc. (a) | | | 87,087 | | | | 551,261 | | |
Hoegh LNG Partners LP | | | 8,160 | | | | 127,541 | | |
Kosmos Energy Ltd. | | | 95,613 | | | | 544,994 | | |
Magnolia Oil & Gas Corp. (a) | | | 42,200 | | | | 530,876 | | |
Noble Midstream Partners LP | | | 15,840 | | | | 420,710 | | |
Oasis Midstream Partners LP | | | 22,850 | | | | 379,082 | | |
Par Pacific Holdings, Inc. (a) | | | 10,070 | | | | 234,027 | | |
PBF Energy, Inc. | | | 11,940 | | | | 374,558 | | |
Range Resources Corp. | | | 89,500 | | | | 434,075 | | |
Renewable Energy Group, Inc. (a) | | | 21,139 | | | | 569,696 | | |
REX American Resources Corp. (a) | | | 6,178 | | | | 506,349 | | |
SRC Energy, Inc. (a) | | | 136,700 | | | | 563,204 | | |
Talos Energy, Inc. (a) | | | 4,500 | | | | 135,675 | | |
W&T Offshore, Inc. (a) | | | 105,500 | | | | 586,580 | | |
World Fuel Services Corp. | | | 2,844 | | | | 123,486 | | |
| | | | 9,424,953 | | |
TOTAL ENERGY | | | 14,851,910 | | |
FINANCIALS — 33.83%
Banks — 19.83% | |
1st Source Corp. | | | 4,966 | | | | 257,636 | | |
Amalgamated Bank | | | 13,900 | | | | 270,355 | | |
Associated Banc-Corp | | | 23,300 | | | | 513,532 | | |
BankUnited, Inc. | | | 14,010 | | | | 512,206 | | |
Bar Harbor Bankshares | | | 9,816 | | | | 249,228 | | |
Boston Private Financial Holdings, Inc. | | | 43,850 | | | | 527,516 | | |
Bridge Bancorp, Inc. | | | 11,570 | | | | 387,942 | | |
Brookline Bancorp, Inc. | | | 15,566 | | | | 256,216 | | |
Bryn Mawr Bank Corp. | | | 6,380 | | | | 263,111 | | |
Cadence BanCorp | | | 14,900 | | | | 270,137 | | |
Camden National Corp. | | | 5,616 | | | | 258,673 | | |
Carolina Financial Corp. | | | 5,986 | | | | 258,775 | | |
Cathay General Bancorp | | | 13,232 | | | | 503,478 | | |
The accompanying notes are an integral part of these financial statements.
25
Schedule of Investments — December 31, 2019
Hotchkis & Wiley Small Cap Diversified Value Fund (Unaudited)
| | Shares
Held | | Value | |
City Holding Company | | | 3,100 | | | $ | 254,045 | | |
Community Trust Bancorp, Inc. | | | 8,310 | | | | 387,578 | | |
ConnectOne Bancorp, Inc. | | | 15,400 | | | | 396,088 | | |
CrossFirst Bankshares, Inc. (a) | | | 6,400 | | | | 92,288 | | |
Customers Bancorp, Inc. (a) | | | 21,344 | | | | 508,201 | | |
Dime Community Bancshares, Inc. | | | 24,713 | | | | 516,255 | | |
Eagle Bancorp, Inc. | | | 10,630 | | | | 516,937 | | |
Equity Bancshares, Inc. (a) | | | 16,600 | | | | 512,442 | | |
FB Financial Corp. | | | 3,200 | | | | 126,688 | | |
Financial Institutions, Inc. | | | 7,831 | | | | 251,375 | | |
First BanCorp | | | 47,786 | | | | 506,054 | | |
First Business Financial Services, Inc. | | | 5,035 | | | | 132,572 | | |
First Financial Bancorp | | | 10,150 | | | | 258,216 | | |
First Financial Corp. | | | 8,363 | | | | 382,356 | | |
First Hawaiian, Inc. | | | 17,370 | | | | 501,125 | | |
First Internet Bancorp | | | 11,269 | | | | 267,188 | | |
First Mid Bancshares, Inc. | | | 7,172 | | | | 252,813 | | |
First Midwest Bancorp, Inc. | | | 16,700 | | | | 385,102 | | |
The First of Long Island Corp. | | | 15,380 | | | | 385,730 | | |
Flushing Financial Corp. | | | 22,168 | | | | 478,940 | | |
FNB Corp. | | | 30,370 | | | | 385,699 | | |
Franklin Financial Network, Inc. | | | 11,040 | | | | 379,003 | | |
Fulton Financial Corp. | | | 28,740 | | | | 500,938 | | |
German American Bancorp, Inc. | | | 3,600 | | | | 128,232 | | |
Great Southern Bancorp, Inc. | | | 8,110 | | | | 513,525 | | |
Great Western Bancorp, Inc. | | | 14,296 | | | | 496,643 | | |
Hancock Whitney Corp. | | | 6,000 | | | | 263,280 | | |
Hanmi Financial Corp. | | | 25,167 | | | | 503,214 | | |
HBT Financial, Inc. (a) | | | 5,000 | | | | 94,950 | | |
Heartland Financial USA, Inc. | | | 7,800 | | | | 387,972 | | |
Heritage Financial Corp. | | | 9,100 | | | | 257,530 | | |
Hilltop Holdings, Inc. | | | 14,927 | | | | 372,130 | | |
Home BancShares, Inc. | | | 13,200 | | | | 259,512 | | |
HomeTrust Bancshares, Inc. | | | 4,729 | | | | 126,879 | | |
Hope Bancorp, Inc. | | | 33,683 | | | | 500,529 | | |
Horizon Bancorp, Inc. | | | 6,600 | | | | 125,400 | | |
IBERIABANK Corp. | | | 3,410 | | | | 255,170 | | |
International Bancshares Corp. | | | 8,736 | | | | 376,260 | | |
Investors Bancorp, Inc. | | | 42,264 | | | | 503,576 | | |
Lakeland Bancorp, Inc. | | | 22,320 | | | | 387,922 | | |
Live Oak Bancshares, Inc. | | | 25,755 | | | | 489,603 | | |
Metropolitan Bank Holding Corp. (a) | | | 5,400 | | | | 260,442 | | |
Midland States Bancorp, Inc. | | | 17,713 | | | | 512,968 | | |
MidWestOne Financial Group, Inc. | | | 7,094 | | | | 257,016 | | |
Northrim BanCorp, Inc. | | | 3,344 | | | | 128,075 | | |
| | Shares
Held | | Value | |
Old National Bancorp | | | 6,874 | | | $ | 125,725 | | |
Orrstown Financial Services, Inc. | | | 5,679 | | | | 128,459 | | |
Pacific Premier Bancorp, Inc. | | | 7,670 | | | | 250,080 | | |
Park National Corp. | | | 2,440 | | | | 249,807 | | |
Peapack Gladstone Financial Corp. | | | 16,636 | | | | 514,052 | | |
Peoples Bancorp, Inc. | | | 3,700 | | | | 128,242 | | |
RBB Bancorp | | | 11,232 | | | | 237,781 | | |
Renasant Corp. | | | 7,100 | | | | 251,482 | | |
Republic Bancorp, Inc. | | | 5,510 | | | | 257,868 | | |
Sandy Spring Bancorp, Inc. | | | 13,975 | | | | 529,372 | | |
South Plains Financial, Inc. | | | 6,100 | | | | 127,307 | | |
South State Corp. | | | 1,500 | | | | 130,125 | | |
Southern National Bancorp of Virginia, Inc. | | | 15,406 | | | | 251,888 | | |
Texas Capital Bancshares, Inc. (a) | | | 8,590 | | | | 487,654 | | |
Towne Bank | | | 4,380 | | | | 121,852 | | |
TriCo Bancshares | | | 9,494 | | | | 387,450 | | |
Trustmark Corp. | | | 7,201 | | | | 248,507 | | |
UMB Financial Corp. | | | 3,720 | | | | 255,341 | | |
Umpqua Holdings Corp. | | | 22,030 | | | | 389,931 | | |
Univest Financial Corp. | | | 4,730 | | | | 126,669 | | |
Washington Trust Bancorp, Inc. | | | 4,800 | | | | 258,192 | | |
West Bancorporation, Inc. | | | 5,249 | | | | 134,532 | | |
Wintrust Financial Corp. | | | 7,350 | | | | 521,115 | | |
| | | | 26,220,697 | | |
Capital Markets — 3.97% | |
AllianceBernstein Holding LP | | | 8,554 | | | | 258,844 | | |
Artisan Partners Asset Management, Inc. | | | 12,300 | | | | 397,536 | | |
Brightsphere Investment Group, Inc. | | | 25,313 | | | | 258,699 | | |
Cowen, Inc. (a) | | | 24,700 | | | | 389,025 | | |
Evercore, Inc. | | | 3,400 | | | | 254,184 | | |
GAIN Capital Holdings, Inc. | | | 31,030 | | | | 122,569 | | |
GAMCO Investors, Inc. | | | 6,886 | | | | 134,208 | | |
Greenhill & Company, Inc. | | | 22,225 | | | | 379,603 | | |
INTL FCStone, Inc. (a) | | | 6,200 | | | | 302,746 | | |
Legg Mason, Inc. | | | 13,897 | | | | 499,041 | | |
Oppenheimer Holdings, Inc. | | | 8,921 | | | | 245,149 | | |
Sculptor Capital Management, Inc. | | | 11,511 | | | | 254,393 | | |
Victory Capital Holdings, Inc. | | | 22,627 | | | | 474,488 | | |
Virtu Financial, Inc. | | | 15,800 | | | | 252,642 | | |
Virtus Investment Partners, Inc. | | | 3,300 | | | | 401,676 | | |
Waddell & Reed Financial, Inc. | | | 15,018 | | | | 251,101 | | |
Westwood Holdings Group, Inc. | | | 12,380 | | | | 366,696 | | |
| | | | 5,242,600 | | |
The accompanying notes are an integral part of these financial statements.
26
Schedule of Investments — December 31, 2019
Hotchkis & Wiley Small Cap Diversified Value Fund (Unaudited)
| | Shares
Held | | Value | |
Consumer Finance — 0.65% | |
Navient Corp. | | | 35,220 | | | $ | 481,809 | | |
SLM Corp. | | | 42,550 | | | | 379,121 | | |
| | | | 860,930 | | |
Diversified Financial Services — 0.34% | |
FGL Holdings | | | 41,800 | | | | 445,170 | | |
Insurance — 4.65% | |
Ambac Financial Group, Inc. (a) | | | 23,887 | | | | 515,243 | | |
American Equity Investment Life Holding Company | | | 12,626 | | | | 377,896 | | |
Argo Group International Holdings Ltd. | | | 3,900 | | | | 256,425 | | |
CNO Financial Group, Inc. | | | 27,186 | | | | 492,882 | | |
Employers Holdings, Inc. | | | 11,835 | | | | 494,111 | | |
Enstar Group Ltd. (a) | | | 1,249 | | | | 258,368 | | |
Global Indemnity Ltd. | | | 9,048 | | | | 268,092 | | |
Horace Mann Educators Corp. | | | 11,114 | | | | 485,237 | | |
MBIA, Inc. (a) | | | 39,876 | | | | 370,847 | | |
National Western Life Group, Inc. | | | 2,035 | | | | 591,940 | | |
ProAssurance Corp. | | | 13,367 | | | | 483,083 | | |
State Auto Financial Corp. | | | 4,200 | | | | 130,284 | | |
Stewart Information Services Corp. | | | 12,201 | | | | 497,679 | | |
Third Point Reinsurance Ltd. (a) | | | 52,278 | | | | 549,965 | | |
United Fire Group, Inc. | | | 8,600 | | | | 376,078 | | |
| | | | 6,148,130 | | |
Mortgage Real Estate Investment Trusts — 0.65% | |
Colony Credit Real Estate, Inc. | | | 36,782 | | | | 484,051 | | |
Great Ajax Corp. | | | 25,250 | | | | 373,953 | | |
| | | | 858,004 | | |
Thrifts & Mortgage Finance — 3.74% | |
Bridgewater Bancshares, Inc. (a) | | | 9,300 | | | | 128,154 | | |
Capitol Federal Financial, Inc. | | | 9,043 | | | | 124,160 | | |
Federal Agricultural Mortgage Corp. | | | 3,000 | | | | 250,500 | | |
First Defiance Financial Corp. | | | 8,380 | | | | 263,886 | | |
FS Bancorp, Inc. | | | 2,200 | | | | 140,338 | | |
Hingham Institution for Savings | | | 1,310 | | | | 275,362 | | |
HomeStreet, Inc. (a) | | | 15,878 | | | | 539,853 | | |
Luther Burbank Corp. | | | 21,945 | | | | 253,026 | | |
Merchants Bancorp | | | 14,360 | | | | 283,036 | | |
Meridian Bancorp, Inc. | | | 6,270 | | | | 125,964 | | |
Northfield Bancorp, Inc. | | | 22,307 | | | | 378,327 | | |
OceanFirst Financial Corp. | | | 10,310 | | | | 263,317 | | |
Southern Missouri Bancorp, Inc. | | | 3,359 | | | | 128,851 | | |
Sterling Bancorp, Inc. | | | 34,992 | | | | 283,435 | | |
Territorial Bancorp, Inc. | | | 4,032 | | | | 124,750 | | |
TrustCo Bank Corp. | | | 43,564 | | | | 377,700 | | |
Washington Federal, Inc. | | | 13,544 | | | | 496,388 | | |
| | Shares
Held | | Value | |
Waterstone Financial, Inc. | | | 13,373 | | | $ | 254,488 | | |
WSFS Financial Corp. | | | 5,900 | | | | 259,541 | | |
| | | | 4,951,076 | | |
TOTAL FINANCIALS | | | 44,726,607 | | |
HEALTH CARE — 1.79%
Health Care Providers & Services — 1.43% | |
Hanger, Inc. (a) | | | 18,900 | | | | 521,829 | | |
Magellan Health, Inc. (a) | | | 6,506 | | | | 509,095 | | |
MEDNAX, Inc. (a) | | | 18,100 | | | | 502,999 | | |
Patterson Companies, Inc. | | | 17,200 | | | | 352,256 | | |
| | | | 1,886,179 | | |
Pharmaceuticals — 0.36% | |
Taro Pharmaceutical Industries Ltd. (a) | | | 5,400 | | | | 474,822 | | |
TOTAL HEALTH CARE | | | 2,361,001 | | |
INDUSTRIALS — 17.43%
Aerospace & Defense — 1.15% | |
AAR Corp. | | | 8,450 | | | | 381,095 | | |
Moog, Inc. | | | 1,400 | | | | 119,462 | | |
National Presto Industries, Inc. | | | 5,714 | | | | 505,060 | | |
Vectrus, Inc. (a) | | | 10,155 | | | | 520,546 | | |
| | | | 1,526,163 | | |
Airlines — 0.49% | |
Hawaiian Holdings, Inc. | | | 8,310 | | | | 243,400 | | |
Spirit Airlines, Inc. (a) | | | 9,900 | | | | 399,069 | | |
| | | | 642,469 | | |
Building Products — 1.94% | |
Apogee Enterprises, Inc. | | | 9,666 | | | | 314,145 | | |
Armstrong Flooring, Inc. (a) | | | 67,695 | | | | 289,058 | | |
Caesarstone Ltd. | | | 32,622 | | | | 491,614 | | |
Insteel Industries, Inc. | | | 22,300 | | | | 479,227 | | |
Masonite International Corp. (a) | | | 6,941 | | | | 501,209 | | |
Resideo Technologies, Inc. (a) | | | 41,500 | | | | 495,095 | | |
| | | | 2,570,348 | | |
Commercial Services & Supplies — 1.54% | |
ACCO Brands Corp. | | | 40,309 | | | | 377,292 | | |
Deluxe Corp. | | | 5,065 | | | | 252,845 | | |
Ennis, Inc. | | | 24,717 | | | | 535,124 | | |
Herman Miller, Inc. | | | 2,714 | | | | 113,038 | | |
Interface, Inc. | | | 21,900 | | | | 363,321 | | |
Knoll, Inc. | | | 4,586 | | | | 115,842 | | |
Steelcase, Inc. | | | 13,335 | | | | 272,834 | | |
| | | | 2,030,296 | | |
Construction & Engineering — 2.08% | |
Arcosa, Inc. | | | 3,300 | | | | 147,015 | | |
Comfort Systems USA, Inc. | | | 5,100 | | | | 254,235 | | |
The accompanying notes are an integral part of these financial statements.
27
Schedule of Investments — December 31, 2019
Hotchkis & Wiley Small Cap Diversified Value Fund (Unaudited)
| | Shares
Held | | Value | |
Fluor Corp. | | | 28,900 | | | $ | 545,632 | | |
MYR Group, Inc. (a) | | | 11,244 | | | | 366,442 | | |
Primoris Services Corp. | | | 16,473 | | | | 366,360 | | |
Sterling Construction Company, Inc. (a) | | | 17,600 | | | | 247,808 | | |
Tutor Perini Corp. (a) | | | 33,221 | | | | 427,222 | | |
Valmont Industries, Inc. | | | 2,616 | | | | 391,824 | | |
| | | | 2,746,538 | | |
Electrical Equipment — 1.59% | |
AZZ, Inc. | | | 8,500 | | | | 390,575 | | |
Encore Wire Corp. | | | 2,166 | | | | 124,328 | | |
EnerSys | | | 6,910 | | | | 517,076 | | |
GrafTech International Ltd. | | | 40,180 | | | | 466,892 | | |
Preformed Line Products Company | | | 3,727 | | | | 224,924 | | |
Thermon Group Holdings, Inc. (a) | | | 14,183 | | | | 380,104 | | |
| | | | 2,103,899 | | |
Machinery — 4.17% | |
Astec Industries, Inc. | | | 12,500 | | | | 525,000 | | |
Blue Bird Corp. (a) | | | 24,640 | | | | 564,749 | | |
Commercial Vehicle Group, Inc. (a) | | | 34,430 | | | | 218,631 | | |
EnPro Industries, Inc. | | | 7,660 | | | | 512,301 | | |
Graham Corp. | | | 11,689 | | | | 255,755 | | |
The Greenbrier Companies, Inc. | | | 16,799 | | | | 544,792 | | |
Hillenbrand, Inc. | | | 15,220 | | | | 506,978 | | |
Hyster-Yale Materials Handling, Inc. | | | 3,927 | | | | 231,536 | | |
Kennametal, Inc. | | | 6,700 | | | | 247,163 | | |
Meritor, Inc. (a) | | | 22,813 | | | | 597,471 | | |
Miller Industries, Inc. | | | 7,100 | | | | 263,623 | | |
Mueller Water Products, Inc. | | | 10,700 | | | | 128,186 | | |
Navistar International Corp. (a) | | | 15,936 | | | | 461,188 | | |
Wabash National Corp. | | | 31,482 | | | | 462,471 | | |
| | | | 5,519,844 | | |
Marine — 0.41% | |
Matson, Inc. | | | 13,213 | | | | 539,090 | | |
Professional Services — 2.43% | |
BG Staffing, Inc. | | | 12,060 | | | | 263,993 | | |
GP Strategies Corp. (a) | | | 19,583 | | | | 259,083 | | |
Heidrick & Struggles International, Inc. | | | 11,300 | | | | 367,250 | | |
InnerWorkings, Inc. (a) | | | 51,702 | | | | 284,878 | | |
Kelly Services, Inc. | | | 22,550 | | | | 509,179 | | |
Kforce, Inc. | | | 3,200 | | | | 127,040 | | |
Korn Ferry | | | 12,656 | | | | 536,615 | | |
Resources Connection, Inc. | | | 29,385 | | | | 479,857 | | |
TrueBlue, Inc. (a) | | | 15,900 | | | | 382,554 | | |
| | | | 3,210,449 | | |
| | Shares
Held | | Value | |
Road & Rail — 0.67% | |
Covenant Transportation Group, Inc. (a) | | | 29,250 | | | $ | 378,056 | | |
Universal Logistics Holdings, Inc. | | | 20,070 | | | | 380,528 | | |
Werner Enterprises, Inc. | �� | | 3,460 | | | | 125,909 | | |
| | | | 884,493 | | |
Trading Companies & Distributors — 0.96% | |
DXP Enterprises, Inc. (a) | | | 9,200 | | | | 366,252 | | |
Rush Enterprises, Inc. | | | 10,398 | | | | 483,507 | | |
WESCO International, Inc. (a) | | | 7,065 | | | | 419,590 | | |
| | | | 1,269,349 | | |
TOTAL INDUSTRIALS | | | 23,042,938 | | |
INFORMATION TECHNOLOGY — 6.28%
Communications Equipment — 0.63% | |
Casa Systems, Inc. (a) | | | 35,800 | | | | 146,422 | | |
CommScope Holding Company, Inc. (a) | | | 18,100 | | | | 256,839 | | |
Plantronics, Inc. | | | 15,800 | | | | 431,972 | | |
| | | | 835,233 | | |
Electronic Equipment, Instruments & Components — 3.21% | |
Anixter International, Inc. (a) | | | 2,868 | | | | 264,143 | | |
AVX Corp. | | | 18,627 | | | | 381,295 | | |
Belden, Inc. | | | 9,300 | | | | 511,500 | | |
ePlus, Inc. (a) | | | 1,500 | | | | 126,435 | | |
Insight Enterprises, Inc. (a) | | | 3,768 | | | | 264,853 | | |
Kimball Electronics, Inc. (a) | | | 21,600 | | | | 379,080 | | |
Methode Electronics, Inc. | | | 6,559 | | | | 258,097 | | |
PC Connection, Inc. | | | 5,506 | | | | 273,428 | | |
Plexus Corp. (a) | | | 4,856 | | | | 373,621 | | |
Sanmina Corp. (a) | | | 15,395 | | | | 527,124 | | |
ScanSource, Inc. (a) | | | 13,353 | | | | 493,393 | | |
Vishay Intertechnology, Inc. | | | 18,426 | | | | 392,290 | | |
| | | | 4,245,259 | | |
IT Services — 1.12% | |
Cass Information Systems, Inc. | | | 6,700 | | | | 386,857 | | |
CSG Systems International, Inc. | | | 6,910 | | | | 357,800 | | |
NIC, Inc. | | | 16,473 | | | | 368,172 | | |
Unisys Corp. (a) | | | 31,000 | | | | 367,660 | | |
| | | | 1,480,489 | | |
Semiconductors & Semiconductor Equipment — 0.51% | |
Diodes, Inc. (a) | | | 10,179 | | | | 573,790 | | |
NVE Corp. | | | 1,400 | | | | 99,960 | | |
| | | | 673,750 | | |
Software — 0.38% | |
Ebix, Inc. | | | 14,880 | | | | 497,141 | | |
The accompanying notes are an integral part of these financial statements.
28
Schedule of Investments — December 31, 2019
Hotchkis & Wiley Small Cap Diversified Value Fund (Unaudited)
| | Shares
Held | | Value | |
Technology Hardware, Storage & Peripherals — 0.43% | |
Super Micro Computer, Inc. (a) | | | 23,800 | | | $ | 571,676 | | |
TOTAL INFORMATION TECHNOLOGY | | | 8,303,548 | | |
MATERIALS — 3.95%
Chemicals — 1.85% | |
American Vanguard Corp. | | | 21,429 | | | | 417,223 | | |
Cabot Corp. | | | 7,760 | | | | 368,755 | | |
FutureFuel Corp. | | | 21,230 | | | | 263,040 | | |
Livent Corp. (a) | | | 42,700 | | | | 365,085 | | |
Minerals Technologies, Inc. | | | 6,694 | | | | 385,775 | | |
PolyOne Corp. | | | 3,990 | | | | 146,792 | | |
Trinseo SA | | | 13,350 | | | | 496,753 | | |
| | | | 2,443,423 | | |
Containers & Packaging — 0.10% | |
Silgan Holdings, Inc. | | | 4,100 | | | | 127,428 | | |
Metals & Mining — 1.43% | |
Century Aluminum Company (a) | | | 49,100 | | | | 368,987 | | |
Cleveland-Cliffs, Inc. | | | 43,140 | | | | 362,376 | | |
Kaiser Aluminum Corp. | | | 2,197 | | | | 243,625 | | |
Schnitzer Steel Industries, Inc. | | | 5,500 | | | | 119,240 | | |
Warrior Met Coal, Inc. | | | 18,800 | | | | 397,244 | | |
Worthington Industries, Inc. | | | 9,450 | | | | 398,601 | | |
| | | | 1,890,073 | | |
Paper & Forest Products — 0.57% | |
Domtar Corp. | | | 9,800 | | | | 374,752 | | |
Mercer International, Inc. | | | 30,750 | | | | 378,225 | | |
| | | | 752,977 | | |
TOTAL MATERIALS | | | 5,213,901 | | |
REAL ESTATE — 1.19%
Equity Real Estate Investment Trusts — 1.19% | |
Colony Capital, Inc. | | | 111,172 | | | | 528,067 | | |
Pebblebrook Hotel Trust | | | 19,400 | | | | 520,114 | | |
Seritage Growth Properties | | | 12,938 | | | | 518,555 | | |
TOTAL REAL ESTATE | | | 1,566,736 | | |
UTILITIES — 4.08%
Electric Utilities — 1.55% | |
ALLETE, Inc. | | | 6,476 | | | | 525,657 | | |
El Paso Electric Company | | | 7,354 | | | | 499,263 | | |
Otter Tail Corp. | | | 9,800 | | | | 502,642 | | |
PNM Resources, Inc. | | | 10,302 | | | | 522,414 | | |
| | | | 2,049,976 | | |
Gas Utilities — 1.75% | |
South Jersey Industries, Inc. | | | 15,844 | | | | 522,535 | | |
Southwest Gas Holdings, Inc. | | | 6,800 | | | | 516,596 | | |
Spire, Inc. | | | 6,393 | | | | 532,601 | | |
| | Shares
Held | | Value | |
Star Group LP | | | 26,060 | | | $ | 246,528 | | |
Suburban Propane Partners LP | | | 22,737 | | | | 496,803 | | |
| | | | 2,315,063 | | |
Multi-Utilities — 0.78% | |
Avista Corp. | | | 10,461 | | | | 503,069 | | |
NorthWestern Corp. | | | 7,303 | | | | 523,407 | | |
| | | | 1,026,476 | | |
TOTAL UTILITIES | | | 5,391,515 | | |
Total common stocks
(Cost $119,217,621) | | | | | 127,206,458 | | |
Total long-term investments
(Cost $119,217,621) | | | | | 127,206,458 | | |
SHORT-TERM
INVESTMENTS — 1.36% | | Principal
Amount | | | |
Time Deposits — 1.36% | |
Banco Santander SA, 1.56%, 01/02/2020* | | $ | 1,797,091 | | | | 1,797,091 | | |
Total short-term investments
(Cost $1,797,091) | | | 1,797,091 | | |
Total investments — 97.58%
(Cost $121,014,712) | | | 129,003,549 | | |
Other assets in excess of liabilities — 2.42% | | | | | 3,202,999 | | |
Net assets — 100.00% | | $ | 132,206,548 | | |
(a) — Non-income producing security.
* — Invested through a cash management account administered by Brown Brothers Harriman & Co.
The accompanying notes are an integral part of these financial statements.
29
Schedule of Investments — December 31, 2019
Hotchkis & Wiley Global Value Fund (Unaudited)
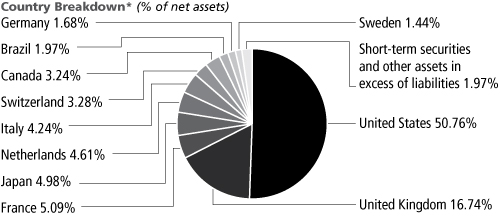
* Based on country of risk
Largest Equity Holdings | | Percent of
net assets | |
General Electric Company | | | 5.45 | % | |
American International Group, Inc. | | | 4.20 | % | |
Wells Fargo & Company | | | 4.05 | % | |
Microsoft Corp. | | | 3.72 | % | |
BAE Systems PLC | | | 3.03 | % | |
Oracle Corp. | | | 2.71 | % | |
The Goldman Sachs Group, Inc. | | | 2.48 | % | |
Magna International, Inc. | | | 2.41 | % | |
Societe Generale SA | | | 2.40 | % | |
Tokio Marine Holdings, Inc. | | | 2.39 | % | |
COMMON
STOCKS — 98.03% | | Shares
Held | | Value | |
COMMUNICATION SERVICES — 6.12%
Media — 4.04% | |
Discovery, Inc. (a) | | | 26,550 | | | $ | 809,509.00 | | |
News Corp. | | | 57,800 | | | | 817,292 | | |
| | | | 1,626,801 | | |
Wireless Telecommunication Services — 2.08% | |
Vodafone Group PLC — ADR | | | 43,372 | | | | 838,381 | | |
TOTAL COMMUNICATION SERVICES | | | 2,465,182 | | |
CONSUMER DISCRETIONARY — 7.13%
Auto Components — 2.86% | |
Adient PLC (a) | | | 8,531 | | | | 181,284 | | |
Magna International, Inc. | | | 17,711 | | | | 971,271 | | |
| | | | 1,152,555 | | |
Automobiles — 2.60% | |
Bayerische Motoren Werke AG (v) | | | 4,697 | | | | 289,158 | | |
General Motors Company | | | 20,745 | | | | 759,267 | | |
| | | | 1,048,425 | | |
Household Durables — 1.03% | |
Haseko Corp. (v) | | | 30,700 | | | | 412,112 | | |
Specialty Retail — 0.64% | |
Kingfisher PLC (v) | | | 89,802 | | | | 258,518 | | |
TOTAL CONSUMER DISCRETIONARY | | | 2,871,610 | | |
CONSUMER STAPLES — 4.60%
Beverages — 1.54% | |
Heineken Holding NV (v) | | | 6,387 | | | | 620,771 | | |
Food & Staples Retailing — 0.92% | |
Tesco PLC (v) | | | 109,314 | | | | 369,444 | | |
Household Products — 0.95% | |
Henkel AG & Company KGaA (v) | | | 4,100 | | | | 385,371 | | |
Personal Products — 1.19% | |
Unilever PLC (v) | | | 8,356 | | | | 478,323 | | |
TOTAL CONSUMER STAPLES | | | 1,853,909 | | �� |
| | Shares
Held | | Value | |
ENERGY — 8.66%
Energy Equipment & Services — 3.57% | |
Frank's International NV (a) | | | 95,316 | | | $ | 492,784 | | |
National Oilwell Varco, Inc. | | | 37,669 | | | | 943,608 | | |
| | | | 1,436,392 | | |
Oil, Gas & Consumable Fuels — 5.09% | |
Apache Corp. | | | 14,202 | | | | 363,429 | | |
Cairn Energy PLC (a) (v) | | | 172,490 | | | | 471,890 | | |
Cenovus Energy, Inc. | | | 32,900 | | | | 334,434 | | |
Kosmos Energy Ltd. | | | 86,388 | | | | 492,412 | | |
Royal Dutch Shell PLC — ADR | | | 6,600 | | | | 389,268 | | |
| | | | 2,051,433 | | |
TOTAL ENERGY | | | 3,487,825 | | |
FINANCIALS — 29.13%
Banks — 16.78% | |
ABN AMRO Bank NV (r) (v) | | | 23,700 | | | | 431,966 | | |
Barclays PLC (v) | | | 203,576 | | | | 485,425 | | |
BNP Paribas SA (v) | | | 11,556 | | | | 686,870 | | |
Citigroup, Inc. | | | 5,304 | | | | 423,737 | | |
Citizens Financial Group, Inc. | | | 10,800 | | | | 438,588 | | |
Credito Valtellinese SpA (a) (v) | | | 5,110,669 | | | | 408,418 | | |
ING Groep NV (v) | | | 34,656 | | | | 416,651 | | |
Royal Bank of Scotland Group PLC (v) | | | 59,400 | | | | 190,553 | | |
Societe Generale SA (v) | | | 27,693 | | | | 966,434 | | |
UniCredit SpA (v) | | | 46,600 | | | | 681,154 | | |
Wells Fargo & Company | | | 30,330 | | | | 1,631,754 | | |
| | | | 6,761,550 | | |
Capital Markets — 4.27% | |
Credit Suisse Group AG (a) (v) | | | 53,164 | | | | 718,654 | | |
The Goldman Sachs Group, Inc. | | | 4,354 | | | | 1,001,115 | | |
| | | | 1,719,769 | | |
The accompanying notes are an integral part of these financial statements.
30
Schedule of Investments — December 31, 2019
Hotchkis & Wiley Global Value Fund (Unaudited)
| | Shares
Held | | Value | |
Insurance — 8.08% | |
American International Group, Inc. | | | 32,969 | | | $ | 1,692,299 | | |
Tokio Marine Holdings, Inc. (v) | | | 17,200 | | | | 963,008 | | |
Zurich Insurance Group AG (v) | | | 1,471 | | | | 603,403 | | |
| | | | 3,258,710 | | |
TOTAL FINANCIALS | | | 11,740,029 | | |
HEALTH CARE — 5.74%
Health Care Equipment & Supplies — 1.44% | |
Medtronic PLC | | | 5,100 | | | | 578,595 | | |
Health Care Providers & Services — 2.97% | |
Anthem, Inc. | | | 2,015 | | | | 608,590 | | |
UnitedHealth Group, Inc. | | | 2,000 | | | | 587,960 | | |
| | | | 1,196,550 | | |
Pharmaceuticals — 1.33% | |
GlaxoSmithKline PLC — ADR | | | 11,419 | | | | 536,579 | | |
TOTAL HEALTH CARE | | | 2,311,724 | | |
INDUSTRIALS — 21.30%
Aerospace & Defense — 5.99% | |
Airbus SE (v) | | | 2,700 | | | | 396,268 | | |
BAE Systems PLC (v) | | | 163,159 | | | | 1,221,631 | | |
Embraer SA — ADR (a) | | | 40,753 | | | | 794,276 | | |
| | | | 2,412,175 | | |
Air Freight & Logistics — 2.37% | |
Royal Mail PLC (v) | | | 317,987 | | | | 956,341 | | |
Industrial Conglomerates — 5.45% | |
General Electric Company | | | 196,772 | | | | 2,195,976 | | |
Machinery — 5.93% | |
| CNH Industrial NV | | | 85,382 | | | | 939,202 | | |
Cummins, Inc. | | | 3,329 | | | | 595,758 | | |
Danieli & C Officine Meccaniche SpA | | | 54,560 | | | | 618,122 | | |
Navistar International Corp. (a) | | | 8,192 | | | | 237,077 | | |
| | | | 2,390,159 | | |
Road & Rail — 1.56% | |
AMERCO | | | 1,672 | | | | 628,371 | | |
TOTAL INDUSTRIALS | | | 8,583,022 | | |
INFORMATION TECHNOLOGY — 13.18%
Communications Equipment — 1.44% | |
Telefonaktiebolaget LM Ericsson — ADR | | | 66,072 | | | | 580,112 | | |
Electronic Equipment, Instruments & Components — 3.62% | |
Corning, Inc. | | | 28,373 | | | | 825,938 | | |
Hitachi Ltd. (v) | | | 15,000 | | | | 632,936 | | |
| | | | 1,458,874 | | |
| | Shares
Held | | Value | |
Software — 6.43% | |
Microsoft Corp. | | | 9,513 | | | $ | 1,500,200 | | |
Oracle Corp. | | | 20,575 | | | | 1,090,063 | | |
| | | | 2,590,263 | | |
Technology Hardware, Storage & Peripherals — 1.69% | |
Hewlett Packard Enterprise Company | | | 43,087 | | | | 683,360 | | |
TOTAL INFORMATION TECHNOLOGY | | | 5,312,609 | | |
REAL ESTATE — 2.17%
Equity Real Estate Investment Trusts — 2.17% | |
Seritage Growth Properties | | | 21,843 | | | | 875,467 | | |
TOTAL REAL ESTATE | | | 875,467 | | |
Total common stocks
(Cost $35,994,348) | | | 39,501,377 | | |
Total long-term investments
(Cost $35,994,348) | | | | | 39,501,377 | | |
SHORT-TERM
INVESTMENTS — 1.65% | | Principal
Amount | | | |
Time Deposits — 1.65% | |
Banco Santander SA,
1.56%, 01/02/2020* | | $ | 665,906 | | | | 665,906 | | |
Brown Brothers Harriman & Co.,
0.82%, 01/02/2020* | | CAD | 1,748 | | | | 1,346 | | |
Brown Brothers Harriman & Co.,
0.36%, 01/02/2020* | | GBP | 2 | | | | 3 | | |
Total short-term investments
(Cost $667,255) | | | 667,255 | | |
Total investments — 99.68%
(Cost $36,661,603) | | | 40,168,632 | | |
Other assets in excess of liabilities — 0.32% | | | | | 127,782 | | |
Net assets — 100.00% | | $ | 40,296,414 | | |
(a) — Non-income producing security.
(r) — Rule 144A security of the Securities Act of 1933. Purchased in a private placement transaction; resale to the public may require registration or be limited to qualified institutional buyers. The total market value of these securities was $431,966, which represented 1.07% of net assets.
(v) — Security was fair valued as a result of market movements following the close of local trading using a third-party vendor's proprietary fair value pricing model. The total market value of these securities was $13,045,299, which represented 32.37% of net assets. See Security Valuation in Note 1 in Notes to the Financial Statements.
ADR — American Depositary Receipt
CAD — Canadian Dollar
GBP — British Pound
* — Invested through a cash management account administered by Brown Brothers Harriman & Co.
The accompanying notes are an integral part of these financial statements.
31
Schedule of Investments — December 31, 2019
Hotchkis & Wiley International Value Fund (Unaudited)

* Based on country of risk
Largest Equity Holdings | | Percent of
net assets | |
BAE Systems PLC | | | 3.94 | % | |
Tokio Marine Holdings, Inc. | | | 3.91 | % | |
Royal Mail PLC | | | 3.28 | % | |
| CNH Industrial NV | | | 3.26 | % | |
Embraer SA | | | 3.23 | % | |
Enstar Group Ltd. | | | 3.12 | % | |
Magna International, Inc. | | | 2.92 | % | |
Societe Generale SA | | | 2.88 | % | |
Frank's International NV | | | 2.86 | % | |
Vodafone Group PLC | | | 2.67 | % | |
COMMON
STOCKS — 99.20% | | Shares
Held | | Value | |
COMMUNICATION SERVICES — 3.08%
Media — 0.41% | |
RTL Group SA (v) | | | 216 | | | $ | 10,643 | | |
Wireless Telecommunication Services — 2.67% | |
Vodafone Group PLC (v) | | | 35,446 | | | | 68,814 | | |
TOTAL COMMUNICATION SERVICES | | | 79,457 | | |
CONSUMER DISCRETIONARY — 7.61%
Auto Components — 2.92% | |
Magna International, Inc. | | | 1,372 | | | | 75,240 | | |
Automobiles — 1.53% | |
Bayerische Motoren Werke AG (v) | | | 641 | | | | 39,461 | | |
Household Durables — 1.72% | |
Haseko Corp. (v) | | | 3,300 | | | | 44,299 | | |
Leisure Products — 0.56% | |
Sega Sammy Holdings, Inc. (v) | | | 1,000 | | | | 14,480 | | |
Specialty Retail — 0.88% | |
Kingfisher PLC (v) | | | 7,866 | | | | 22,644 | | |
TOTAL CONSUMER DISCRETIONARY | | | 196,124 | | |
CONSUMER STAPLES — 8.87%
Beverages — 3.04% | |
Britvic PLC (v) | | | 2,100 | | | | 25,168 | | |
Heineken Holding NV (v) | | | 547 | | | | 53,165 | | |
| | | | 78,333 | | |
Food & Staples Retailing — 0.97% | |
Tesco PLC (v) | | | 7,396 | | | | 24,996 | | |
Food Products — 1.38% | |
Ezaki Glico Company Ltd. (v) | | | 800 | | | | 35,667 | | |
Household Products — 1.82% | |
Henkel AG & Company KGaA (v) | | | 500 | | | | 46,996 | | |
Personal Products — 1.30% | |
Unilever PLC (v) | | | 588 | | | | 33,659 | | |
| | Shares
Held | | Value | |
Tobacco — 0.36% | |
Scandinavian Tobacco Group (r) | | | 757 | | | $ | 9,233 | | |
TOTAL CONSUMER STAPLES | | | 228,884 | | |
ENERGY — 11.28%
Energy Equipment & Services — 4.20% | |
Frank's International NV (a) | | | 14,257 | | | | 73,709 | | |
Subsea 7 SA (v) | | | 2,900 | | | | 34,693 | | |
| | | | 108,402 | | |
Oil, Gas & Consumable Fuels — 7.08% | |
Cairn Energy PLC (a) (v) | | | 23,436 | | | | 64,115 | | |
Cenovus Energy, Inc. | | | 4,000 | | | | 40,661 | | |
Kosmos Energy Ltd. | | | 5,768 | | | | 32,877 | | |
Royal Dutch Shell PLC (v) | | | 1,527 | | | | 45,024 | | |
| | | | 182,677 | | |
TOTAL ENERGY | | | 291,079 | | |
FINANCIALS — 30.10%
Banks — 16.44% | |
ABN AMRO Bank NV (r) (v) | | | 2,200 | | | | 40,098 | | |
Barclays PLC (v) | | | 21,117 | | | | 50,353 | | |
BNP Paribas SA (v) | | | 1,004 | | | | 59,676 | | |
Credito Valtellinese SpA (a) (v) | | | 620,067 | | | | 49,553 | | |
ING Groep NV (v) | | | 3,267 | | | | 39,277 | | |
Royal Bank of Scotland Group PLC (v) | | | 15,400 | | | | 49,403 | | |
Societe Generale SA (v) | | | 2,131 | | | | 74,369 | | |
UniCredit SpA (v) | | | 4,200 | | | | 61,391 | | |
| | | | 424,120 | | |
Capital Markets — 2.07% | |
Credit Suisse Group AG (a) (v) | | | 3,948 | | | | 53,368 | | |
Insurance — 11.59% | |
Aviva PLC (v) | | | 2,280 | | | | 12,655 | | |
Enstar Group Ltd. (a) | | | 389 | | | | 80,468 | | |
Global Indemnity Ltd. | | | 968 | | | | 28,682 | | |
The accompanying notes are an integral part of these financial statements.
32
Schedule of Investments — December 31, 2019
Hotchkis & Wiley International Value Fund (Unaudited)
| | Shares
Held | | Value | |
RSA Insurance Group PLC (v) | | | 4,926 | | | $ | 36,920 | | |
Tokio Marine Holdings, Inc. (v) | | | 1,800 | | | | 100,779 | | |
Zurich Insurance Group AG (v) | | | 96 | | | | 39,379 | | |
| | | | 298,883 | | |
TOTAL FINANCIALS | | | 776,371 | | |
HEALTH CARE — 8.47%
Health Care Equipment & Supplies — 3.38% | |
Koninklijke Philips NV (v) | | | 948 | | | | 46,342 | | |
Medtronic PLC | | | 360 | | | | 40,842 | | |
| | | | 87,184 | | |
Pharmaceuticals — 5.09% | |
Bayer AG (v) | | | 760 | | | | 61,786 | | |
GlaxoSmithKline PLC (v) | | | 2,309 | | | | 54,255 | | |
Sanofi (v) | | | 153 | | | | 15,365 | | |
| | | | 131,406 | | |
TOTAL HEALTH CARE | | | 218,590 | | |
INDUSTRIALS — 21.17%
Aerospace & Defense — 9.44% | |
Airbus SE (v) | | | 400 | | | | 58,706 | | |
BAE Systems PLC (v) | | | 13,575 | | | | 101,640 | | |
Embraer SA — ADR (a) | | | 4,269 | | | | 83,203 | | |
| | | | 243,549 | | |
Air Freight & Logistics — 3.28% | |
Royal Mail PLC (v) | | | 28,129 | | | | 84,598 | | |
Construction & Engineering — 0.43% | |
Bouygues SA (v) | | | 261 | | | | 11,126 | | |
Industrial Conglomerates — 2.13% | |
Siemens AG (v) | | | 420 | | | | 54,849 | | |
Machinery — 5.66% | |
| CNH Industrial NV (v) | | | 1,759 | | | | 19,314 | | |
| CNH Industrial NV | | | 7,653 | | | | 84,182 | | |
Danieli & C Officine Meccaniche SpA | | | 3,747 | | | | 42,451 | | |
| | | | 145,947 | | |
Professional Services — 0.23% | |
Hudson Global, Inc. (a) | | | 499 | | | | 5,963 | | |
TOTAL INDUSTRIALS | | | 546,032 | | |
INFORMATION TECHNOLOGY — 7.21%
Communications Equipment — 2.01% | |
Telefonaktiebolaget LM Ericsson (v) | | | 5,944 | | | | 51,938 | | |
Electronic Equipment, Instruments & Components — 3.98% | |
Hitachi Ltd. (v) | | | 1,300 | | | | 54,854 | | |
Nippon Electric Glass Company Ltd. (v) | | | 1,100 | | | | 24,420 | | |
TE Connectivity Ltd. | | | 245 | | | | 23,481 | | |
| | | | 102,755 | | |
| | Shares
Held | | Value | |
Semiconductors & Semiconductor Equipment — 1.22% | |
Taiwan Semiconductor Manufacturing
Company Ltd. — ADR | | | 540 | | | $ | 31,374 | | |
TOTAL INFORMATION TECHNOLOGY | | | 186,067 | | |
MATERIALS — 1.41%
Chemicals — 1.41% | |
Tikkurila Oyj | | | 2,253 | | | | 36,291 | | |
TOTAL MATERIALS | | | 36,291 | | |
Total common stocks
(Cost $2,448,438) | | | | | 2,558,895 | | |
Total long-term investments
(Cost $2,448,438) | | | | | 2,558,895 | | |
SHORT-TERM
INVESTMENTS — 1.26% | | Principal
Amount | | | |
Time Deposits — 1.26% | |
Banco Santander SA, 1.56%, 01/02/2020* | | $ | 32,401 | | | | 32,401 | | |
Total short-term investments
(Cost $32,401) | | | 32,401 | | |
Total investments — 100.46%
(Cost $2,480,839) | | | 2,591,296 | | |
Liabilities in excess of other assets — (0.46)% | | | | | (11,819 | ) | |
Net assets — 100.00% | | $ | 2,579,477 | | |
(a) — Non-income producing security.
(r) — Rule 144A security of the Securities Act of 1933. Purchased in a private placement transaction; resale to the public may require registration or be limited to qualified institutional buyers. The total market value of these securities was $49,331, which represented 1.91% of net assets.
(v) — Security was fair valued as a result of market movements following the close of local trading using a third-party vendor's proprietary fair value pricing model. The total market value of these securities was $1,870,238, which represented 72.50% of net assets. See Security Valuation in Note 1 in Notes to the Financial Statements.
ADR — American Depositary Receipt
The accompanying notes are an integral part of these financial statements.
33
Schedule of Investments — December 31, 2019
Hotchkis & Wiley Value Opportunities Fund (Unaudited)
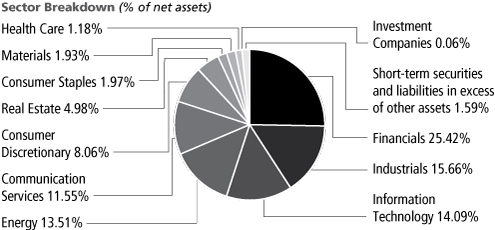
Largest Holdings* | | Percent of
net assets | |
Microsoft Corp. | | | 7.04 | % | |
General Electric Company | | | 6.69 | % | |
Wells Fargo & Company | | | 4.48 | % | |
Bank of America Corp. | | | 4.05 | % | |
Oracle Corp. | | | 4.02 | % | |
Seritage Growth Properties | | | 3.97 | % | |
The Goldman Sachs Group, Inc. | | | 3.95 | % | |
American International Group, Inc. | | | 3.93 | % | |
Morgan Stanley | | | 3.57 | % | |
National Oilwell Varco, Inc. | | | 3.43 | % | |
* Excluding short-term securities.
COMMON
STOCKS — 89.85% | | Shares
Held | | Value | |
COMMUNICATION SERVICES — 11.55%
Interactive Media & Services — 2.11% | |
Alphabet, Inc. (a) | | | 12,300 | | | $ | 16,474,497 | | |
Media — 7.55% | |
Comcast Corp. | | | 309,600 | | | | 13,922,712 | | |
Discovery, Inc. (a) | | | 428,800 | | | | 13,074,112 | | |
News Corp. | | | 1,677,100 | | | | 23,714,194 | | |
ViacomCBS, Inc. | | | 197,400 | | | | 8,284,878 | | |
| | | | 58,995,896 | | |
Wireless Telecommunication Services — 1.89% | |
Vodafone Group PLC — ADR | | | 763,300 | | | | 14,754,589 | | |
TOTAL COMMUNICATION SERVICES | | | 90,224,982 | | |
CONSUMER DISCRETIONARY — 3.92%
Automobiles — 2.60% | |
General Motors Company | | | 554,066 | | | | 20,278,816 | | |
Specialty Retail — 1.06% | |
Office Depot, Inc. (c) | | | 3,029,600 | | | | 8,301,104 | | |
Textiles, Apparel & Luxury Goods — 0.26% | |
JG Boswell Company | | | 3,401 | | | | 2,040,600 | | |
TOTAL CONSUMER DISCRETIONARY | | | 30,620,520 | | |
CONSUMER STAPLES — 1.97%
Beverages — 0.51% | |
PepsiCo, Inc. | | | 29,200 | | | | 3,990,764 | | |
Household Products — 1.46% | |
Henkel AG & Company KGaA (v) | | | 121,500 | | | | 11,420,144 | | |
TOTAL CONSUMER STAPLES | | | 15,410,908 | | |
ENERGY — 12.16%
Energy Equipment & Services — 5.04% | |
Frank's International NV (a) | | | 2,435,300 | | | | 12,590,501 | | |
National Oilwell Varco, Inc. | | | 1,070,300 | | | | 26,811,015 | | |
| | | | 39,401,516 | | |
| | Shares
Held | | Value | |
Oil, Gas & Consumable Fuels — 7.12% | |
Apache Corp. | | | 478,100 | | | $ | 12,234,579 | | |
Cairn Energy PLC (a) (v) | | | 6,800,500 | | | | 18,604,476 | | |
Equitrans Midstream Corp. | | | 122,300 | | | | 1,633,928 | | |
Hess Corp. | | | 66,600 | | | | 4,449,546 | | |
Kosmos Energy Ltd. | | | 563,700 | | | | 3,213,090 | | |
Rockhopper Exploration PLC (a) | | | 5,048,100 | | | | 999,001 | | |
Royal Dutch Shell PLC — ADR | | | 246,000 | | | | 14,509,080 | | |
| | | | 55,643,700 | | |
TOTAL ENERGY | | | 95,045,216 | | |
FINANCIALS — 24.88%
Banks — 10.52% | |
Bank of America Corp. (c) | | | 897,600 | | | | 31,613,472 | | |
Citigroup, Inc. (c) | | | 194,800 | | | | 15,562,572 | | |
Wells Fargo & Company | | | 650,900 | | | | 35,018,420 | | |
| | | | 82,194,464 | | |
Capital Markets — 9.37% | |
The Goldman Sachs Group, Inc. | | | 134,400 | | | | 30,902,592 | | |
Morgan Stanley | | | 545,700 | | | | 27,896,184 | | |
Motors Liquidation Company GUC Trust (a) (i) (o) | | | 1,623,100 | | | | 14,364,435 | | |
| | | | 73,163,211 | | |
Insurance ��� 4.99% | |
American International Group, Inc. (c) | | | 598,600 | | | | 30,726,138 | | |
Enstar Group Ltd. (a) | | | 25,100 | | | | 5,192,186 | | |
Global Indemnity Ltd. | | | 104,400 | | | | 3,093,372 | | |
| | | | 39,011,696 | | |
TOTAL FINANCIALS | | | 194,369,371 | | |
HEALTH CARE — 1.18%
Health Care Equipment & Supplies — 1.18% | |
Medtronic PLC | | | 81,200 | | | | 9,212,140 | | |
TOTAL HEALTH CARE | | | 9,212,140 | | |
The accompanying notes are an integral part of these financial statements.
34
Schedule of Investments — December 31, 2019
Hotchkis & Wiley Value Opportunities Fund (Unaudited)
| | Shares
Held | | Value | |
INDUSTRIALS — 14.08%
Air Freight & Logistics — 3.16% | |
Royal Mail PLC (c) (v) | | | 8,211,500 | | | $ | 24,695,955 | | |
Industrial Conglomerates — 6.70% | |
General Electric Company | | | 4,687,500 | | | | 52,312,500 | | |
Machinery — 0.83% | |
Danieli & C Officine Meccaniche SpA (c) | | | 572,600 | | | | 6,487,112 | | |
Professional Services — 0.07% | |
Hudson Global, Inc. (a) | | | 48,170 | | | | 575,631 | | |
Road & Rail — 3.32% | |
AMERCO | | | 69,000 | | | | 25,931,580 | | |
TOTAL INDUSTRIALS | | | 110,002,778 | | |
INFORMATION TECHNOLOGY — 14.09%
Electronic Equipment, Instruments & Components — 1.61% | |
Corning, Inc. | | | 432,300 | | | | 12,584,253 | | |
Software — 11.06% | |
Microsoft Corp. (c) | | | 349,100 | | | | 55,053,070 | | |
Oracle Corp. (c) | | | 592,800 | | | | 31,406,544 | | |
| | | | 86,459,614 | | |
Technology Hardware, Storage & Peripherals — 1.42% | |
Hewlett Packard Enterprise Company | | | 697,500 | | | | 11,062,350 | | |
TOTAL INFORMATION TECHNOLOGY | | | 110,106,217 | | |
MATERIALS — 1.51%
Chemicals — 1.23% | |
Iracore Investments Holdings, Inc. — Class A
(Acquired 04/13/2017,
Cost $6,892,250) (a) (f) (i) (m) (o) (u) | | | 32,422 | | | | 9,602,748 | | |
Metals & Mining — 0.28% | |
American Zinc Recycling LLC (Acquired
07/24/2014 — 12/10/2019,
Cost $7,951,436) (a) (f) (i) (m) (u) | | | 7,042 | | | | 2,228,253 | | |
TOTAL MATERIALS | | | 11,831,001 | | |
REAL ESTATE — 4.51%
Equity Real Estate Investment Trusts — 3.97% | |
Seritage Growth Properties (l) | | | 773,100 | | | | 30,985,848 | | |
Real Estate Management & Development — 0.54% | |
Maui Land & Pineapple Company, Inc. (a) | | | 377,300 | | | | 4,244,625 | | |
TOTAL REAL ESTATE | | | 35,230,473 | | |
Total common stocks
(Cost $633,982,677) | | | | | 702,053,606 | | |
PREFERRED STOCKS — 0.39% | |
FINANCIALS — 0.39%
Thrifts & Mortgage Finance — 0.39% | |
Federal Home Loan Mortgage Corp. —
Series K (a) | | | 33,900 | | | | 657,491 | | |
Federal Home Loan Mortgage Corp. —
Series N (a) (i) | | | 118,600 | | | | 2,074,314 | | |
| | Shares
Held | | Value | |
Federal Home Loan Mortgage Corp. —
Series S (a) | | | 18,700 | | | $ | 329,120 | | |
TOTAL FINANCIALS | | | 3,060,925 | | |
Total preferred stocks
(Cost $274,262) | | | | | 3,060,925 | | |
CORPORATE
BONDS — 3.60% | | Principal
Amount | | | |
CONSUMER DISCRETIONARY — 1.55%
Multiline Retail — 1.55% | |
JC Penney Corp., Inc.
5.875%, 07/01/2023 (r) | | $ | 14,080,000 | | | | 12,108,659 | | |
TOTAL CONSUMER DISCRETIONARY | | | 12,108,659 | | |
INDUSTRIALS — 1.58%
Industrial Conglomerates — 1.58% | |
General Electric Company
5.000% (Fixed until 01/21/2021, then
3 Month LIBOR USD + 3.330%), Perpetual | | | 12,605,000 | | | | 12,365,253 | | |
TOTAL INDUSTRIALS | | | 12,365,253 | | |
REAL ESTATE — 0.47%
Equity Real Estate Investment Trusts — 0.47% | |
The GEO Group, Inc.
5.875%, 10/15/2024 | | | 4,030,000 | | | | 3,668,973 | | |
TOTAL REAL ESTATE | | | 3,668,973 | | |
Total corporate bonds
(Cost $25,853,100) | | | | | 28,142,885 | | |
TERM LOANS — 3.51% | |
CONSUMER DISCRETIONARY — 1.74%
Specialty Retail — 1.74% | |
Ascena Retail Group, Inc.
6.250% (1 Month LIBOR USD + 4.500%),
08/21/2022 (Acquired
07/10/2019 — 11/04/2019,
Cost $13,126,661) (b) (m) | | | 19,870,000 | | | | 13,610,950 | | |
TOTAL CONSUMER DISCRETIONARY | | | 13,610,950 | | |
ENERGY — 1.35%
Energy Equipment & Services — 1.35% | |
McDermott Technology Americas, Inc.
TBD, 10/21/2021 (Acquired
11/13/2019 — 11/20/2019,
Cost $5,632,115) (e) (m) | | | 5,500,000 | | | | 5,808,750 | | |
TBD, 05/12/2025 (Acquired
11/05/2019 — 11/06/2019,
Cost $4,535,958) (e) (m) | | | 7,979,695 | | | | 4,739,939 | | |
TOTAL ENERGY | | | 10,548,689 | | |
MATERIALS — 0.42%
Chemicals — 0.42% | |
Iracore International Holdings, Inc.
11.250% (1 Month LIBOR USD + 9.000%),
04/13/2021 (Acquired 04/13/2017,
Cost $3,272,683) (b) (f) (m) (u) | | | 3,272,683 | | | | 3,272,683 | | |
TOTAL MATERIALS | | | 3,272,683 | | |
Total term loans
(Cost $26,567,417) | | | | | 27,432,322 | | |
The accompanying notes are an integral part of these financial statements.
35
Schedule of Investments — December 31, 2019
Hotchkis & Wiley Value Opportunities Fund (Unaudited)
PURCHASED
PUT OPTIONS —
0.91% | | Contracts
(100 shares
per contract) | | Notional
Amount | | Value | |
CONSUMER DISCRETIONARY — 0.85%
Automobiles — 0.85% | |
Tesla, Inc. (a)
Expiration: June 2020,
Exercise Price: $270.00 | | | 50 | | | $ | 2,091,650 | | | $ | 38,950 | | |
Expiration: January 2021,
Exercise Price: $300.00 | | | 50 | | | | 2,091,650 | | | | 136,350 | | |
Expiration: January 2021,
Exercise Price: $450.00 | | | 210 | | | | 8,784,930 | | | | 2,051,280 | | |
Expiration: January 2021,
Exercise Price: $500.00 | | | 355 | | | | 14,850,715 | | | | 4,383,185 | | |
| TOTAL CONSUMER DISCRETIONARY | | | 6,609,765 | | |
INVESTMENT COMPANIES — 0.06%
Exchange Traded Funds — 0.06% | |
iShares China Large-Cap ETF (a)
Expiration: January 2020,
Exercise Price: $40.00 | | | 3,000 | | | | 13,089,000 | | | | 12,000 | | |
Expiration: January 2021,
Exercise Price: $40.00 | | | 2,100 | | | | 9,162,300 | | | | 452,550 | | |
TOTAL INVESTMENT COMPANIES | | | 464,550 | | |
Total purchased put options
(Cost $15,513,397) | | | | | | | 7,074,315 | | |
WARRANTS — 0.15% | | | | Shares
Held | | | |
ENERGY — 0.00%
Oil, Gas & Consumable Fuels — 0.00% | |
Lonestar Resources America, Inc.
(Acquired 09/30/2016,
Cost $339,200) (a) (f) (i) (m)
Expiration: December 2021,
Exercise Price: $5.00 | | | | | 80,000 | | | | 0 | | |
| TOTAL ENERGY | | | 0 | | |
FINANCIALS — 0.15%
Insurance — 0.15% | |
American International Group, Inc. (a)
Expiration: January 2021,
Exercise Price: $42.94 | | | | | 117,400 | | | | 1,206,872 | | |
TOTAL FINANCIALS | | | 1,206,872 | | |
Total warrants
(Cost $1,226,559) | | | | | | | 1,206,872 | | |
Total long-term investments
(Cost $703,417,412) | | | | | | | 768,970,925 | | |
COLLATERAL FOR SECURITIES ON LOAN — 1.93% | |
Money Market Funds — 1.93% | |
Invesco Government & Agency Portfolio —
Institutional Class, 1.51%^ | | | 15,057,125 | | | | 15,057,125 | | |
Total collateral for securities on loan
(Cost $15,057,125) | | | | | 15,057,125 | | |
SHORT-TERM
INVESTMENTS — 2.94% | | Principal
Amount | | Value | |
Time Deposits — 2.94% | |
Banco Bilbao Vizcaya Argentaria SA,
1.56%, 01/02/2020* | | $ | 22,964,944 | | | $ | 22,964,944 | | |
Brown Brothers Harriman & Co.,
0.32%, 01/02/2020* | | AUD | 41 | | | | 29 | | |
Brown Brothers Harriman & Co.,
0.82%, 01/02/2020* CAD | | | 96 | | | | 74 | | |
Brown Brothers Harriman & Co.,
0.36%, 01/02/2020* GBP | | | 142 | | | | 187 | | |
Total short-term investments
(Cost $22,965,220) | | | 22,965,234 | | |
Total investments — 103.28%
(Cost $741,439,757) | | | 806,993,284 | | |
Liabilities in excess of other assets — (3.28)% | | | | | (25,594,233 | ) | |
Net assets — 100.00% | | $ | 781,399,051 | | |
(a) — Non-income producing security.
(b) — The coupon rate shown on variable rate securities represents the rate at December 31, 2019.
(c) — All or a portion of this security is segregated as collateral for delayed delivery securities, futures contracts, purchased put options and/or unfunded loan commitments.
(e) — Delayed delivery security.
(f) — Security was fair valued under guidelines established by and under the general supervision and responsibility of the Trust's Board of Trustees. The total market value of these securities was $15,103,684, which represented 1.93% of net assets. See Security Valuation in Note 1 in Notes to the Financial Statements.
(i) — Illiquid security. The total market value of these securities was $28,269,750, which represented 3.62% of net assets.
(l) — All or a portion of this security is on loan. The total market value of securities on loan was $14,754,135. The remaining contractual maturity of all of the securities lending transactions is overnight and continuous.
(m) — Restricted security. Purchased in a private placement transaction; resale to the public may require registration. The total market value of these securities was $39,263,323, which represented 5.02% of net assets.
(o) — Affiliated issuer. See Note 6 in Notes to the Financial Statements.
(r) — Rule 144A security of the Securities Act of 1933. Purchased in a private placement transaction; resale to the public may require registration or be limited to qualified institutional buyers. The total market value of these securities was $12,108,659, which represented 1.55% of net assets.
(u) — Value determined using significant unobservable inputs.
(v) — Security was fair valued as a result of market movements following the close of local trading using a third-party vendor's proprietary fair value pricing model. The total market value of these securities was $54,720,575, which represented 7.00% of net assets. See Security Valuation in Note 1 in Notes to the Financial Statements.
The accompanying notes are an integral part of these financial statements.
36
Schedule of Investments — December 31, 2019
Hotchkis & Wiley Value Opportunities Fund (Unaudited)
ADR — American Depositary Receipt
AUD — Australian Dollar
CAD — Canadian Dollar
GBP — British Pound
LIBOR — London Interbank Offered Rate
TBD — To be determined.
USD — United States Dollar
^ — Rate shown is the 7-day yield as of December 31, 2019.
* — Invested through a cash management account administered by Brown Brothers Harriman & Co.
Schedule of Futures Contracts — December 31, 2019
Hotchkis & Wiley Value Opportunities Fund (Unaudited)
Description | | Number of
Contracts
Purchased (Sold) | | Expiration | | Notional
Amount | | Value/Unrealized
Appreciation
(Depreciation) | |
British Pound Currency Futures | | | (150 | ) | | March 2020 | | $ | (12,461,250 | ) | | $ | 79,070 | | |
The accompanying notes are an integral part of these financial statements.
37
Schedule of Investments — December 31, 2019
Hotchkis & Wiley Capital Income Fund (Unaudited)

Largest Issuers | | Percent of
net assets | |
General Electric Company | | | 3.29 | % | |
American International Group, Inc. | | | 2.37 | % | |
Wells Fargo & Company | | | 2.35 | % | |
Office Depot, Inc. | | | 2.02 | % | |
The Goldman Sachs Group, Inc. | | | 1.96 | % | |
Seritage Growth Properties | | | 1.90 | % | |
American Zinc Recycling LLC | | | 1.82 | % | |
Royal Mail PLC | | | 1.78 | % | |
BAE Systems PLC | | | 1.77 | % | |
Magna International, Inc. | | | 1.66 | % | |
COMMON
STOCKS — 60.69% | | Shares
Held | | Value | |
COMMUNICATION SERVICES — 3.60%
Media — 2.31% | |
Discovery, Inc. (a) | | | 11,303 | | | $ | 344,628 | | |
MDC Partners, Inc. (a) | | | 43,037 | | | | 119,643 | | |
ViacomCBS, Inc. | | | 1,312 | | | | 55,065 | | |
| | | | 519,336 | | |
Wireless Telecommunication Services — 1.29% | |
Vodafone Group PLC — ADR (c) | | | 14,993 | | | | 289,815 | | |
TOTAL COMMUNICATION SERVICES | | | 809,151 | | |
CONSUMER DISCRETIONARY — 7.09%
Auto Components — 2.06% | |
Adient PLC (a) | | | 4,232 | | | | 89,930 | | |
Magna International, Inc. | | | 6,797 | | | | 372,747 | | |
| | | | 462,677 | | |
Automobiles — 1.42% | |
General Motors Company | | | 8,744 | | | | 320,030 | | |
General Motors Company — Escrow
(Acquired 12/31/2010,
Cost $0) (a) (f) (i) (m) (u) | | | 4,600 | | | | 0 | | |
| | | | 320,030 | | |
Specialty Retail — 2.48% | |
Bed Bath & Beyond, Inc. | | | 5,375 | | | | 92,988 | | |
Kingfisher PLC — ADR | | | 11,333 | | | | 64,938 | | |
Office Depot, Inc. | | | 145,306 | | | | 398,139 | | |
| | | | 556,065 | | |
Textiles, Apparel & Luxury Goods — 1.13% | |
Quiksilver, Inc. (Acquired 07/11/2013 —
05/12/2016,
Cost $351,163) (a) (f) (i) (m) (u) | | | 6,960 | | | | 253,274 | | |
TOTAL CONSUMER DISCRETIONARY | | | 1,592,046 | | |
CONSUMER STAPLES — 0.33%
Food & Staples Retailing — 0.33% | |
Tesco PLC — ADR | | | 7,394 | | | | 74,517 | | |
TOTAL CONSUMER STAPLES | | | 74,517 | | |
| | Shares
Held | | Value | |
ENERGY — 6.41%
Energy Equipment & Services — 1.46% | |
Fieldwood Energy, Inc.
(Acquired 05/03/2018,
Cost $34,085) (a) (i) (m) | | | 1,461 | | | $ | 29,220 | | |
Fieldwood Energy, Inc. (a) (i) | | | 395 | | | | 7,900 | | |
Frank's International NV (a) | | | 13,089 | | | | 67,670 | | |
NexTier Oilfield Solutions, Inc. (a) | | | 20,508 | | | | 137,403 | | |
Nine Energy Service, Inc. (a) | | | 2,229 | | | | 17,431 | | |
Quintana Energy Services, Inc. (a) | | | 24,095 | | | | 67,707 | | |
| | | | 327,331 | | |
Oil, Gas & Consumable Fuels — 4.95% | |
Apache Corp. | | | 5,920 | | | | 151,493 | | |
Bellatrix Exploration Ltd. (a) (f) (i) (u) | | | 1,767 | | | | 2 | | |
Cairn Energy PLC — ADR (a) | | | 60,486 | | | | 331,462 | | |
Cenovus Energy, Inc. | | | 6,980 | | | | 70,847 | | |
Equitrans Midstream Corp. | | | 3,700 | | | | 49,432 | | |
Kosmos Energy Ltd. | | | 42,306 | | | | 241,144 | | |
Murphy Oil Corp. | | | 2,467 | | | | 66,116 | | |
PetroQuest Energy, Inc. (a) (i) | | | 4,513 | | | | 0 | | |
Rockhopper Exploration PLC (a) | | | 104,917 | | | | 20,763 | | |
Warren Resources, Inc.
(Acquired 11/23/2016,
Cost $2,157) (a) (f) (i) (m) (u) | | | 1,559 | | | | 16 | | |
Whiting Petroleum Corp. (a) | | | 24,681 | | | | 181,159 | | |
| | | | 1,112,434 | | |
TOTAL ENERGY | | | 1,439,765 | | |
FINANCIALS — 20.25%
Banks — 10.39% | |
ABN AMRO Bank NV — ADR (a) | | | 3,690 | | | | 66,973 | | |
Bank of America Corp. | | | 4,579 | | | | 161,272 | | |
Barclays PLC — ADR | | | 19,249 | | | | 183,250 | | |
BNP Paribas SA — ADR | | | 3,477 | | | | 103,232 | | |
Citigroup, Inc. | | | 4,493 | | | | 358,946 | | |
The accompanying notes are an integral part of these financial statements.
38
Schedule of Investments — December 31, 2019
Hotchkis & Wiley Capital Income Fund (Unaudited)
| | Shares
Held | | Value | |
Citizens Financial Group, Inc. | | | 5,854 | | | $ | 237,731 | | |
Credito Valtellinese SpA (a) (v) | | | 2,353,689 | | | | 188,094 | | |
Popular, Inc. | | | 2,972 | | | | 174,605 | | |
Societe Generale SA — ADR | | | 38,161 | | | | 266,593 | | |
UniCredit SpA — ADR | | | 8,880 | | | | 64,380 | | |
Wells Fargo & Company | | | 9,800 | | | | 527,239 | | |
| | | | 2,332,315 | | |
Capital Markets — 5.38% | |
Credit Suisse Group AG — ADR (a) | | | 10,570 | | | | 142,167 | | |
Fifth Street Asset Management, Inc. (a) (i) | | | 176,631 | | | | 294,974 | | |
The Goldman Sachs Group, Inc. | | | 1,915 | | | | 440,315 | | |
Motors Liquidation Company GUC Trust (a) | | | 37,448 | | | | 331,415 | | |
| | | | 1,208,871 | | |
Consumer Finance — 0.62% | |
Capital One Financial Corp. | | | 1,361 | | | | 140,061 | | |
Insurance — 3.86% | |
American International Group, Inc. (c) | | | 10,385 | | | | 533,063 | | |
Global Indemnity Ltd. | | | 1,897 | | | | 56,208 | | |
Tokio Marine Holdings, Inc. — ADR | | | 3,264 | | | | 181,935 | | |
Zurich Insurance Group AG — ADR | | | 2,303 | | | | 94,423 | | |
| | | | 865,629 | | |
TOTAL FINANCIALS | | | 4,546,876 | | |
HEALTH CARE — 1.65%
Health Care Equipment & Supplies — 0.57% | |
Medtronic PLC | | | 1,130 | | | | 128,199 | | |
Health Care Providers & Services — 0.47% | |
Anthem, Inc. | | | 350 | | | | 105,711 | | |
Pharmaceuticals — 0.61% | |
GlaxoSmithKline PLC — ADR | | | 2,888 | | | | 135,706 | | |
TOTAL HEALTH CARE | | | 369,616 | | |
INDUSTRIALS — 11.30%
Aerospace & Defense — 2.24% | |
BAE Systems PLC — ADR | | | 13,121 | | | | 397,304 | | |
Embraer SA — ADR (a) | | | 5,413 | | | | 105,499 | | |
| | | | 502,803 | | |
Air Freight & Logistics — 1.78% | |
Royal Mail PLC — ADR | | | 67,092 | | | | 399,533 | | |
Commercial Services & Supplies — 0.24% | |
Quad/Graphics, Inc. | | | 11,478 | | | | 53,602 | | |
Construction & Engineering — 0.46% | |
Fluor Corp. | | | 3,490 | | | | 65,891 | | |
Tutor Perini Corp. (a) | | | 3,020 | | | | 38,837 | | |
| | | | 104,728 | | |
Industrial Conglomerates — 2.70% | |
General Electric Company | | | 54,325 | | | | 606,268 | | |
| | Shares
Held | | Value | |
Machinery — 2.33% | |
| CNH Industrial NV | | | 17,040 | | | $ | 187,440 | | |
Cummins, Inc. | | | 766 | | | | 137,083 | | |
Danieli & C Officine Meccaniche SpA — ADR | | | 17,635 | | | | 198,306 | | |
| | | | 522,829 | | |
Marine — 0.30% | |
Matson, Inc. | | | 1,635 | | | | 66,708 | | |
Professional Services — 0.27% | |
Hudson Global, Inc. (a) | | | 5,156 | | | | 61,614 | | |
Road & Rail — 0.44% | |
AMERCO | | | 265 | | | | 99,592 | | |
Trading Companies & Distributors — 0.54% | |
RA Parent, Inc.
(Acquired 12/23/2014 — 01/18/2018,
Cost $192,714) (a) (f) (i) (m) (u) | | | 3 | | | | 120,748 | | |
TOTAL INDUSTRIALS | | | 2,538,425 | | |
INFORMATION TECHNOLOGY — 5.85%
Communications Equipment — 0.60% | |
Telefonaktiebolaget LM Ericsson — ADR | | | 15,246 | | | | 133,860 | | |
Electronic Equipment, Instruments & Components — 1.13% | |
Corning, Inc. (c) | | | 8,734 | | | | 254,247 | | |
IT Services — 0.28% | |
KBR, Inc. | | | 2,060 | | | | 62,830 | | |
Software — 2.66% | |
Microsoft Corp. (c) | | | 1,995 | | | | 314,611 | | |
Oracle Corp. | | | 5,339 | | | | 282,860 | | |
| | | | 597,471 | | |
Technology Hardware, Storage & Peripherals — 1.18% | |
Hewlett Packard Enterprise Company | | | 16,753 | | | | 265,703 | | |
TOTAL INFORMATION TECHNOLOGY | | | 1,314,111 | | |
MATERIALS — 2.31%
Chemicals — 0.49% | |
Hexion Holdings Corp. (a) | | | 2,489 | | | | 29,992 | | |
Iracore Investments Holdings, Inc. — Class A
(Acquired 04/13/2017,
Cost $57,250) (a) (f) (i) (m) (u) | | | 269 | | | | 79,673 | | |
| | | | 109,665 | | |
Metals & Mining — 1.82% | |
American Zinc Recycling LLC
(Acquired 07/19/2012 — 12/10/2019,
Cost $486,956) (a) (f) (i) (m) (u) | | | 1,292 | | | | 408,741 | | |
TOTAL MATERIALS | | | 518,406 | | |
REAL ESTATE — 1.90%
Equity Real Estate Investment Trusts — 1.90% | |
Seritage Growth Properties | | | 10,649 | | | | 426,812 | | |
TOTAL REAL ESTATE | | | 426,812 | | |
Total common stocks
(Cost $13,175,302) | | | | | 13,629,725 | | |
The accompanying notes are an integral part of these financial statements.
39
Schedule of Investments — December 31, 2019
Hotchkis & Wiley Capital Income Fund (Unaudited)
PREFERRED
STOCKS — 0.00% | | Shares
Held | | Value | |
CONSUMER STAPLES — 0.00%
Food Products — 0.00% | |
Pinnacle Agriculture Enterprises LLC
(Acquired 03/10/2017,
Cost $69,351) (a) (f) (i) (m) (u) | | | 94,387 | | | $ | 0 | | |
TOTAL CONSUMER STAPLES | | | 0 | | |
Total preferred stocks
(Cost $69,351) | | | | | 0 | | |
CONVERTIBLE
BONDS — 0.35% | | Principal
Amount | |
REAL ESTATE — 0.35%
Equity Real Estate Investment Trusts — 0.35% | |
Colony Capital, Inc.
3.875%, 01/15/2021 | | $ | 80,000 | | | | 79,000 | | |
TOTAL REAL ESTATE | | | 79,000 | | |
Total convertible bonds
(Cost $77,873) | | | | | 79,000 | | |
CORPORATE BONDS — 32.50% | |
COMMUNICATION SERVICES — 2.82%
Media — 2.67% | |
CCO Holdings LLC / CCO Holdings Capital Corp.
5.375%, 06/01/2029 (r) | | | 90,000 | | | | 96,241 | | |
Harland Clarke Holdings Corp.
9.250%, 03/01/2021 (r) | | | 58,000 | | | | 57,348 | | |
8.375%, 08/15/2022 (r) | | | 38,000 | | | | 31,077 | | |
MDC Partners, Inc.
6.500%, 05/01/2024 (r) | | | 82,000 | | | | 74,415 | | |
Meredith Corp.
6.875%, 02/01/2026 | | | 61,000 | | | | 63,595 | | |
Salem Media Group, Inc.
6.750%, 06/01/2024 (r) | | | 103,000 | | | | 95,275 | | |
Townsquare Media, Inc.
6.500%, 04/01/2023 (r) | | | 81,000 | | | | 82,451 | | |
Virgin Media Secured Finance PLC
5.500%, 05/15/2029 (r) | | | 50,000 | | | | 53,030 | | |
Ziggo BV
4.875%, 01/15/2030 (r) | | | 45,000 | | | | 46,558 | | |
| | | | 599,990 | | |
Wireless Telecommunication Services — 0.15% | |
Telesat Canada / Telesat LLC
6.500%, 10/15/2027 (r) | | | 33,000 | | | | 34,464 | | |
TOTAL COMMUNICATION SERVICES | | | 634,454 | | |
CONSUMER DISCRETIONARY — 5.89%
Auto Components — 1.04% | |
Adient Global Holdings Ltd.
4.875%, 08/15/2026 (r) | | | 69,000 | | | | 61,757 | | |
Adient US LLC
7.000%, 05/15/2026 (r) | | | 35,000 | | | | 38,216 | | |
Delphi Technologies PLC
5.000%, 10/01/2025 (r) | | | 73,000 | | | | 67,707 | | |
| | Principal
Amount | | Value | |
The Goodyear Tire & Rubber Company
4.875%, 03/15/2027 | | $ | 63,000 | | | $ | 65,321 | | |
| | | | 233,001 | | |
Hotels, Restaurants & Leisure — 2.48% | |
Boyd Gaming Corp.
6.000%, 08/15/2026 | | | 57,000 | | | | 61,366 | | |
International Game Technology PLC
6.250%, 01/15/2027 (r) | | | 5,000 | | | | 5,634 | | |
Jacobs Entertainment, Inc.
7.875%, 02/01/2024 (r) | | | 71,000 | | | | 75,467 | | |
MGM China Holdings Ltd.
5.875%, 05/15/2026 (r) | | | 45,000 | | | | 47,784 | | |
National CineMedia LLC
5.750%, 08/15/2026 | | | 75,000 | | | | 73,526 | | |
5.875%, 04/15/2028 (r) | | | 15,000 | | | | 15,980 | | |
Penn National Gaming, Inc.
5.625%, 01/15/2027 (r) | | | 85,000 | | | | 90,071 | | |
Twin River Worldwide Holdings, Inc.
6.750%, 06/01/2027 (r) | | | 65,000 | | | | 68,110 | | |
Wyndham Destinations, Inc.
4.625%, 03/01/2030 (r) | | | 23,000 | | | | 23,101 | | |
Wynn Macau Ltd.
5.500%, 10/01/2027 (r) | | | 69,000 | | | | 71,920 | | |
Yum! Brands, Inc.
4.750%, 01/15/2030 (r) | | | 23,000 | | | | 24,135 | | |
| | | | 557,094 | | |
Household Durables — 0.94% | |
TopBuild Corp.
5.625%, 05/01/2026 (r) | | | 65,000 | | | | 68,110 | | |
TRI Pointe Group, Inc.
5.250%, 06/01/2027 | | | 64,000 | | | | 67,062 | | |
Weekley Homes LLC / Weekley Finance Corp.
6.000%, 02/01/2023 | | | 76,000 | | | | 76,317 | | |
| | | | 211,489 | | |
Leisure Products — 0.23% | |
Vista Outdoor, Inc.
5.875%, 10/01/2023 | | | 55,000 | | | | 52,807 | | |
Multiline Retail — 0.41% | |
JC Penney Corp., Inc.
5.875%, 07/01/2023 (r) | | | 106,000 | | | | 91,159 | | |
Specialty Retail — 0.52% | |
Liberty Interactive LLC
8.250%, 02/01/2030 | | | 70,000 | | | | 69,255 | | |
Parkland Fuel Corp.
5.875%, 07/15/2027 (r) | | | 45,000 | | | | 48,233 | | |
| | | | 117,488 | | |
Textiles, Apparel & Luxury Goods — 0.27% | |
Eagle Intermediate Global Holding BV /
Ruyi US Finance LLC
7.500%, 05/01/2025 (r) | | | 75,000 | | | | 60,219 | | |
TOTAL CONSUMER DISCRETIONARY | | | 1,323,257 | | |
The accompanying notes are an integral part of these financial statements.
40
Schedule of Investments — December 31, 2019
Hotchkis & Wiley Capital Income Fund (Unaudited)
| | Principal
Amount | | Value | |
CONSUMER STAPLES — 0.56%
Food Products — 0.34% | |
Pinnacle Operating Corp.
9.000%, 05/15/2023 (f) (i) (r) (u) | | $ | 135,499 | | | $ | 77,235 | | |
Household Products — 0.22% | |
Energizer Holdings, Inc.
6.375%, 07/15/2026 (r) | | | 46,000 | | | | 49,075 | | |
TOTAL CONSUMER STAPLES | | | 126,310 | | |
ENERGY — 6.03%
Energy Equipment & Services — 2.75% | |
Apergy Corp.
6.375%, 05/01/2026 | | | 75,000 | | | | 79,339 | | |
Exterran Energy Solutions LP / EES Finance Corp.
8.125%, 05/01/2025 | | | 77,000 | | | | 76,069 | | |
Jonah Energy LLC / Jonah Energy Finance Corp.
7.250%, 10/15/2025 (i) (r) | | | 94,000 | | | | 27,965 | | |
Moss Creek Resources Holdings, Inc.
7.500%, 01/15/2026 (r) | | | 103,000 | | | | 78,573 | | |
Nine Energy Service, Inc.
8.750%, 11/01/2023 (r) | | | 80,000 | | | | 65,060 | | |
SESI LLC
7.750%, 09/15/2024 | | | 80,000 | | | | 53,433 | | |
Shelf Drilling Holdings Ltd.
8.250%, 02/15/2025 (r) | | | 94,000 | | | | 89,769 | | |
Transocean Poseidon Ltd.
6.875%, 02/01/2027 (r) | | | 30,000 | | | | 31,870 | | |
Transocean, Inc.
9.000%, 07/15/2023 (r) | | | 51,000 | | | | 53,975 | | |
Ultra Resources, Inc.
7.125%, 04/15/2025 (i) (r) | | | 131,000 | | | | 9,170 | | |
Unit Corp.
6.625%, 05/15/2021 | | | 95,000 | | | | 52,464 | | |
| | | | 617,687 | | |
Oil, Gas & Consumable Fuels — 3.28% | |
American Midstream Partners LP / American
Midstream Finance Corp.
9.500%, 12/15/2021 (r) | | | 86,000 | | | | 81,089 | | |
Bellatrix Exploration Ltd.
8.500%, 09/11/2023 (f) (i) (u) | | | 60,000 | | | | 54,000 | | |
3.000% Cash and 9.500% PIK,
12/15/2023 (f) (i) (p) (u) | | | 65,000 | | | | 16,250 | | |
Callon Petroleum Company
6.375%, 07/01/2026 | | | 69,000 | | | | 70,204 | | |
Enviva Partners LP / Enviva Partners Finance Corp.
6.500%, 01/15/2026 (r) | | | 65,000 | | | | 69,753 | | |
GasLog Ltd.
8.875%, 03/22/2022 | | | 58,000 | | | | 59,831 | | |
HighPoint Operating Corp.
8.750%, 06/15/2025 | | | 94,000 | | | | 86,010 | | |
Lonestar Resources America, Inc.
11.250%, 01/01/2023 (r) | | | 76,000 | | | | 52,250 | | |
PBF Holding Company LLC / PBF Finance Corp.
7.250%, 06/15/2025 | | | 59,000 | | | | 63,106 | | |
| | Principal
Amount | | Value | |
PBF Logistics LP / PBF Logistics Finance Corp.
6.875%, 05/15/2023 | | $ | 52,000 | | | $ | 53,689 | | |
PetroQuest Energy, Inc.
10.000% PIK, 02/15/2024 (f) (p) (u) | | | 42,679 | | | | 6,402 | | |
Rockpoint Gas Storage Canada Ltd.
7.000%, 03/31/2023 (r) | | | 95,000 | | | | 93,615 | | |
Whiting Petroleum Corp.
6.625%, 01/15/2026 | | | 45,000 | | | | 30,780 | | |
| | | | 736,979 | | |
TOTAL ENERGY | | | 1,354,666 | | |
FINANCIALS — 1.18%
Banks — 0.86% | |
BNP Paribas SA
6.625% (Fixed until 03/24/2024, then 5 Year
Swap Rate USD + 4.149%),
Perpetual (r) | | | 60,000 | | | | 64,843 | | |
Park Aerospace Holdings Ltd.
5.250%, 08/15/2022 (r) | | | 45,000 | | | | 48,070 | | |
Societe Generale SA
7.375% (Fixed until 09/12/2021, then 5 Year
Swap Rate USD + 6.238%),
Perpetual (r) | | | 75,000 | | | | 79,632 | | |
| | | | 192,545 | | |
Consumer Finance — 0.24% | |
Credit Acceptance Corp.
6.625%, 03/15/2026 (r) | | | 50,000 | | | | 54,181 | | |
Insurance — 0.08% | |
CNO Financial Group, Inc.
5.250%, 05/30/2029 | | | 16,000 | | | | 17,906 | | |
TOTAL FINANCIALS | | | 264,632 | | |
HEALTH CARE — 2.96%
Health Care Providers & Services — 2.05% | |
CHS / Community Health Systems, Inc.
8.000%, 03/15/2026 (r) | | | 90,000 | | | | 92,869 | | |
8.000%, 12/15/2027 (r) | | | 10,000 | | | | 10,125 | | |
6.875%, 04/01/2028 (r) | | | 25,000 | | | | 14,343 | | |
DaVita, Inc.
5.000%, 05/01/2025 | | | 66,000 | | | | 68,035 | | |
HCA, Inc.
5.875%, 02/01/2029 | | | 140,000 | | | | 162,050 | | |
Tenet Healthcare Corp.
6.250%, 02/01/2027 (r) | | | 50,000 | | | | 53,875 | | |
5.125%, 11/01/2027 (r) | | | 55,000 | | | | 58,163 | | |
| | | | 459,460 | | |
Pharmaceuticals — 0.91% | |
Bausch Health Companies, Inc.
5.000%, 01/30/2028 (r) | | | 10,000 | | | | 10,289 | | |
7.250%, 05/30/2029 (r) | | | 71,000 | | | | 81,248 | | |
5.250%, 01/30/2030 (r) | | | 10,000 | | | | 10,395 | | |
Endo Dac / Endo Finance LLC / Endo Finco, Inc.
6.000%, 07/15/2023 (r) | | | 88,000 | | | | 63,799 | | |
The accompanying notes are an integral part of these financial statements.
41
Schedule of Investments — December 31, 2019
Hotchkis & Wiley Capital Income Fund (Unaudited)
| | Principal
Amount | | Value | |
Mallinckrodt International
Finance SA / Mallinckrodt CB LLC
5.625%, 10/15/2023 (i) (r) | | $ | 100,000 | | | $ | 38,292 | | |
| | | | 204,023 | | |
TOTAL HEALTH CARE | | | 663,483 | | |
INDUSTRIALS — 6.65%
Aerospace & Defense — 0.57% | |
F-Brasile SpA / F-Brasile US LLC
7.375%, 08/15/2026 (r) | | | 55,000 | | | | 58,300 | | |
TransDigm, Inc.
6.250%, 03/15/2026 (r) | | | 65,000 | | | | 70,491 | | |
| | | | 128,791 | | |
Air Freight & Logistics — 0.25% | |
XPO Logistics, Inc.
6.750%, 08/15/2024 (r) | | | 51,000 | | | | 55,510 | | |
Building Products — 1.37% | |
Ashton Woods USA LLC / Ashton Woods
Finance Company
6.750%, 08/01/2025 (r) | | | 70,000 | | | | 71,779 | | |
Builders FirstSource, Inc.
6.750%, 06/01/2027 (r) | | | 55,000 | | | | 60,450 | | |
Masonite International Corp.
5.750%, 09/15/2026 (r) | | | 55,000 | | | | 58,594 | | |
Resideo Funding, Inc.
6.125%, 11/01/2026 (r) | | | 40,000 | | | | 40,401 | | |
Standard Industries, Inc.
6.000%, 10/15/2025 (r) | | | 73,000 | | | | 76,924 | | |
| | | | 308,148 | | |
Commercial Services & Supplies — 1.55% | |
Aptim Corp.
7.750%, 06/15/2025 (r) | | | 105,000 | | | | 63,306 | | |
Ashtead Capital, Inc.
4.250%, 11/01/2029 (r) | | | 50,000 | | | | 51,188 | | |
Herc Holdings, Inc.
5.500%, 07/15/2027 (r) | | | 63,000 | | | | 66,467 | | |
LSC Communications, Inc.
8.750%, 10/15/2023 (r) | | | 47,000 | | | | 25,517 | | |
Matthews International Corp.
5.250%, 12/01/2025 (r) | | | 76,000 | | | | 76,221 | | |
Vizient, Inc.
6.250%, 05/15/2027 (r) | | | 60,000 | | | | 64,371 | | |
| | | | 347,070 | | |
Construction & Engineering — 0.22% | |
Tutor Perini Corp.
6.875%, 05/01/2025 (r) | | | 51,000 | | | | 49,343 | | |
Industrial Conglomerates — 0.59% | |
General Electric Company
5.000% (Fixed until 01/21/2021,
then 3 Month LIBOR USD + 3.330%),
Perpetual | | | 135,000 | | | | 132,432 | | |
| | Principal
Amount | | Value | |
Machinery — 1.84% | |
Cleaver-Brooks, Inc.
7.875%, 03/01/2023 (r) | | $ | 60,000 | | | $ | 60,025 | | |
EnPro Industries, Inc.
5.750%, 10/15/2026 | | | 60,000 | | | | 64,071 | | |
Meritor, Inc.
6.250%, 02/15/2024 | | | 52,000 | | | | 53,436 | | |
Navistar International Corp.
6.625%, 11/01/2025 (r) | | | 78,000 | | | | 79,625 | | |
Stevens Holding Company, Inc.
6.125%, 10/01/2026 (r) | | | 80,000 | | | | 87,628 | | |
Titan International, Inc.
6.500%, 11/30/2023 | | | 80,000 | | | | 68,633 | | |
| | | | 413,418 | | |
Trading Companies & Distributors — 0.26% | |
Beacon Roofing Supply, Inc.
4.875%, 11/01/2025 (r) | | | 59,000 | | | | 59,418 | | |
TOTAL INDUSTRIALS | | | 1,494,130 | | |
INFORMATION TECHNOLOGY — 1.97%
Communications Equipment — 0.53% | |
CommScope Technologies LLC
6.000%, 06/15/2025 (r) | | | 76,000 | | | | 76,275 | | |
CommScope, Inc.
6.000%, 03/01/2026 (r) | | | 40,000 | | | | 42,625 | | |
| | | | 118,900 | | |
Electronic Equipment, Instruments & Components — 0.29% | |
Ingram Micro, Inc.
5.450%, 12/15/2024 | | | 63,000 | | | | 66,182 | | |
Semiconductors & Semiconductor Equipment — 0.39% | |
Qorvo, Inc.
5.500%, 07/15/2026 | | | 71,000 | | | | 75,748 | | |
4.375%, 10/15/2029 (r) | | | 12,000 | | | | 12,593 | | |
| | | | 88,341 | | |
Software — 0.52% | |
Fair Isaac Corp.
4.000%, 06/15/2028 (r) | | | 8,000 | | | | 8,080 | | |
j2 Cloud Services LLC / j2 Cloud
Co-Obligor, Inc.
6.000%, 07/15/2025 (r) | | | 45,000 | | | | 47,794 | | |
Nuance Communications, Inc.
5.625%, 12/15/2026 | | | 56,000 | | | | 59,811 | | |
| | | | 115,685 | | |
Technology Hardware, Storage & Peripherals — 0.24% | |
NCR Corp.
6.125%, 09/01/2029 (r) | | | 50,000 | | | | 54,349 | | |
TOTAL INFORMATION TECHNOLOGY | | | 443,457 | | |
MATERIALS — 3.68%
Chemicals — 1.42% | |
Atotech Alpha 3 BV / Alpha US Bidco, Inc.
6.250%, 02/01/2025 (r) | | | 73,000 | | | | 75,190 | | |
The accompanying notes are an integral part of these financial statements.
42
Schedule of Investments — December 31, 2019
Hotchkis & Wiley Capital Income Fund (Unaudited)
| | Principal
Amount | | Value | |
The Chemours Company
7.000%, 05/15/2025 | | $ | 45,000 | | | $ | 45,431 | | |
Element Solutions, Inc.
5.875%, 12/01/2025 (r) | | | 61,000 | | | | 63,973 | | |
Rayonier AM Products, Inc.
5.500%, 06/01/2024 (r) | | | 134,000 | | | | 101,226 | | |
Trinseo Materials Operating SCA /
Trinseo Materials Finance, Inc.
5.375%, 09/01/2025 (r) | | | 32,000 | | | | 32,080 | | |
| | | | 317,900 | | |
Containers & Packaging — 0.28% | |
Plastipak Holdings, Inc.
6.250%, 10/15/2025 (r) | | | 74,000 | | | | 64,007 | | |
Metals & Mining — 0.90% | |
Allegheny Technologies, Inc.
5.875%, 12/01/2027 | | | 50,000 | | | | 52,525 | | |
Grinding Media, Inc. / Moly-Cop AltaSteel Ltd.
7.375%, 12/15/2023 (r) | | | 69,000 | | | | 70,466 | | |
Rain CII Carbon LLC / CII Carbon Corp.
7.250%, 04/01/2025 (r) | | | 81,000 | | | | 78,927 | | |
| | | | 201,918 | | |
Paper & Forest Products — 1.08% | |
Boise Cascade Company
5.625%, 09/01/2024 (r) | | | 65,000 | | | | 67,789 | | |
Mercer International, Inc.
7.375%, 01/15/2025 | | | 95,000 | | | | 102,540 | | |
Schweitzer-Mauduit International, Inc.
6.875%, 10/01/2026 (r) | | | 66,000 | | | | 71,303 | | |
| | | | 241,632 | | |
TOTAL MATERIALS | | | 825,457 | | |
REAL ESTATE — 0.41%
Equity Real Estate Investment Trusts — 0.41% | |
The GEO Group, Inc.
5.875%, 10/15/2024 | | | 91,000 | | | | 82,848 | | |
6.000%, 04/15/2026 | | | 9,000 | | | | 8,010 | | |
| | | | 90,858 | | |
TOTAL REAL ESTATE | | | 90,858 | | |
UTILITIES — 0.35%
Electric Utilities — 0.25% | |
Vistra Operations Company LLC
5.000%, 07/31/2027 (r) | | | 55,000 | | | | 57,576 | | |
Independent Power and Renewable Electricity
Producers — 0.10% | |
NRG Energy, Inc.
5.250%, 06/15/2029 (r) | | | 20,000 | | | | 21,662 | | |
TOTAL UTILITIES | | | 79,238 | | |
Total corporate bonds
(Cost $7,733,764) | | | | | 7,299,942 | | |
TERM
LOANS — 4.40% | | Principal
Amount | | Value | |
CONSUMER DISCRETIONARY — 1.06%
Specialty Retail — 0.73% | |
Office Depot, Inc.
6.972% (1 Month LIBOR USD + 5.250%),
11/08/2022 (Acquired 11/03/2017 — 04/08/2019,
Cost $54,844) (b) (m) | | $ | 55,494 | | | $ | 56,049 | | |
PetSmart, Inc.
5.770% (1 Month LIBOR USD + 4.000%),
03/11/2022 (Acquired 10/01/2018 —
01/02/2019, Cost $94,450) (b) (m) | | | 108,167 | | | | 107,226 | | |
| | | | 163,275 | | |
Textiles, Apparel & Luxury Goods — 0.33% | |
Boardriders, Inc.
8.202% (1 Month LIBOR USD + 6.500%),
04/23/2024 (Acquired 03/21/2018,
Cost $77,522) (b) (m) | | | 78,800 | | | | 73,897 | | |
TOTAL CONSUMER DISCRETIONARY | | | 237,172 | | |
CONSUMER STAPLES — 0.27%
Food Products — 0.27% | |
WEI Sales LLC
4.702% (1 Month LIBOR USD + 3.000%),
03/31/2025 (Acquired 09/23/2019,
Cost $59,547) (b) (m) | | | 59,696 | | | | 60,069 | | |
TOTAL CONSUMER STAPLES | | | 60,069 | | |
ENERGY — 0.80%
Energy Equipment & Services — 0.63% | |
Fieldwood Energy LLC
7.506% (3 Month LIBOR USD + 5.250%),
04/11/2022 (Acquired 04/11/2018 —
09/06/2019, Cost $93,336) (b) (m) | | | 95,218 | | | | 80,076 | | |
9.506% (3 Month LIBOR USD + 7.250%),
04/11/2023 (Acquired 04/11/2018,
Cost $105,407) (b) (m) | | | 108,296 | | | | 62,338 | | |
| | | | 142,414 | | |
Oil, Gas & Consumable Fuels — 0.17% | |
International Seaways Operating Corp.
7.700% (1 Month LIBOR USD + 6.000%),
06/22/2022 (Acquired 06/20/2017,
Cost $37,037) (b) (m) | | | 37,464 | | | | 37,651 | | |
TOTAL ENERGY | | | 180,065 | | |
HEALTH CARE — 0.57%
Health Care Providers & Services — 0.52% | |
Versant Health Holdco, Inc.
8.460% (1 Month LIBOR USD + 6.750%),
12/01/2025 (Acquired 11/02/2017 —
01/30/2018, Cost $114,524) (b) (m) | | | 115,000 | | | | 115,575 | | |
Pharmaceuticals — 0.05% | |
Mallinckrodt International Finance SA
TBD, 02/24/2025 (Acquired 12/23/2019,
Cost $12,225) (e) (m) | | | 15,000 | | | | 12,256 | | |
TOTAL HEALTH CARE | | | 127,831 | | |
The accompanying notes are an integral part of these financial statements.
43
Schedule of Investments — December 31, 2019
Hotchkis & Wiley Capital Income Fund (Unaudited)
| | Principal
Amount | | Value | |
INDUSTRIALS — 0.73%
Commercial Services & Supplies — 0.44% | |
Brookfield WEC Holdings, Inc.
5.202% (1 Month LIBOR USD + 3.500%),
08/01/2025 (Acquired 07/26/2018 —
06/25/2019, Cost $48,182) (b) (m) | | $ | 48,310 | | | $ | 48,718 | | |
Drive Chassis Holdco LLC
10.588% (3 Month LIBOR USD + 8.250%),
04/10/2026 (Acquired 04/12/2019 —
05/16/2019, Cost $52,460) (b) (m) | | | 55,000 | | | | 50,737 | | |
| | | | 99,455 | | |
Machinery — 0.29% | |
Granite US Holdings Corp.
7.354% (3 Month LIBOR USD + 5.250%),
09/25/2026 (Acquired 09/25/2019,
Cost $62,932) (b) (m) | | | 64,838 | | | | 65,162 | | |
TOTAL INDUSTRIALS | | | 164,617 | | |
INFORMATION TECHNOLOGY — 0.29%
Software — 0.29% | |
The Dun & Bradstreet Corp.
6.700% (1 Month LIBOR USD + 5.000%),
02/06/2026 (Acquired 02/01/2019 —
02/05/2019, Cost $64,170) (b) (m) | | | 65,000 | | | | 65,650 | | |
TOTAL INFORMATION TECHNOLOGY | | | 65,650 | | |
MATERIALS — 0.68%
Chemicals — 0.68% | |
Hexion, Inc.
5.600% (3 Month LIBOR USD + 3.500%),
07/01/2026 (Acquired 06/27/2019 —
07/10/2019, Cost $64,486) (b) (m) | | | 64,675 | | | | 65,079 | | |
Iracore International Holdings, Inc.
11.250% (1 Month LIBOR USD + 9.000%),
04/13/2021 (Acquired 04/13/2017,
Cost $27,184) (b) (f) (m) (u) | | | 27,184 | | | | 27,184 | | |
Momentive Performance Materials USA LLC
4.960% (1 Month LIBOR USD + 3.250%),
05/15/2024 (Acquired 04/18/2019 —
04/23/2019, Cost $60,511) (b) (m) | | | 60,695 | | | | 60,487 | | |
| | | | 152,750 | | |
TOTAL MATERIALS | | | 152,750 | | |
Total term loans
(Cost $1,028,817) | | | | | 988,154 | | |
Total long-term investments
(Cost $22,085,107) | | | | | 21,996,821 | | |
SHORT-TERM
INVESTMENTS — 1.86% | | Shares
Held | | | |
Money Market Funds — 1.46% | |
JPMorgan U.S. Government Money
Market Fund — Class IM, 1.08%^ | | | 326,695 | | | | 326,694 | | |
| | Principal
Amount | | Value | |
Time Deposits — 0.40% | |
Banco Santander SA, 1.56%, 01/02/2020* | | $ | 90,262 | | | $ | 90,262 | | |
Total short-term investments
(Cost $416,956) | | | 416,956 | | |
Total investments — 99.80%
(Cost $22,502,063) | | | 22,413,777 | | |
Other assets in excess of liabilities — 0.20% | | | | | 45,277 | | |
Net assets — 100.00% | | $ | 22,459,054 | | |
(a) — Non-income producing security.
(b) — The coupon rate shown on variable rate securities represents the rate at December 31, 2019.
(c) — All or a portion of this security is segregated as collateral for delayed delivery securities.
(e) — Delayed delivery security.
(f) — Security was fair valued under guidelines established by and under the general supervision and responsibility of the Trust's Board of Trustees. The total market value of these securities was $1,043,525, which represented 4.65% of net assets. See Security Valuation in Note 1 in Notes to the Financial Statements.
(i) — Illiquid security. The total market value of these securities was $1,417,460, which represented 6.31% of net assets.
(m) — Restricted security. Purchased in a private placement transaction; resale to the public may require registration. The total market value of these securities was $1,879,826, which represented 8.37% of net assets.
(p) — Payment in-kind (PIK) security.
(r) — Rule 144A security of the Securities Act of 1933. Purchased in a private placement transaction; resale to the public may require registration or be limited to qualified institutional buyers. The total market value of these securities was $5,009,458, which represented 22.30% of net assets.
(u) — Value determined using significant unobservable inputs.
(v) — Security was fair valued as a result of market movements following the close of local trading using a third-party vendor's proprietary fair value pricing model. The total market value of these securities was $188,094, which represented 0.84% of net assets. See Security Valuation in Note 1 in Notes to the Financial Statements.
ADR — American Depositary Receipt
LIBOR — London Interbank Offered Rate
TBD — To be determined.
USD — United States Dollar
^ — Rate shown is the 7-day yield as of December 31, 2019.
* — Invested through a cash management account administered by Brown Brothers Harriman & Co.
The accompanying notes are an integral part of these financial statements.
44
Schedule of Investments — December 31, 2019
Hotchkis & Wiley High Yield Fund (Unaudited)
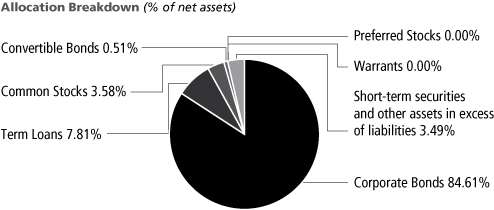
Largest Issuers | | Percent of
net assets | |
Charter Communications, Inc. (includes
CCO Holdings LLC / CCO Holdings
Capital Corp. and Charter
Communications Operating LLC /
Charter Communications
Operating Capital) | | | 2.49 | % | |
General Electric Company | | | 1.87 | % | |
HCA, Inc. | | | 1.66 | % | |
American Zinc Recycling LLC | | | 1.54 | % | |
Boardriders, Inc. (includes
Boardriders, Inc. and Quiksilver, Inc.) | | | 1.15 | % | |
Tenet Healthcare Corp. | | | 1.12 | % | |
CommScope Holding Company, Inc.
(includes CommScope, Inc. and
CommScope Technologies LLC) | | | 1.11 | % | |
Adient PLC (includes Adient Global
Holdings Ltd. and Adient US LLC) | | | 1.08 | % | |
CHS / Community Health Systems, Inc. | | | 1.06 | % | |
Bausch Health Companies, Inc. | | | 1.04 | % | |
CORPORATE
BONDS — 84.61% | | Principal
Amount | | Value | |
Advertising — 0.84% | |
MDC Partners, Inc.
6.500%, 05/01/2024 (r) | | $ | 21,726,000 | | | $ | 19,716,345 | | |
Aerospace/Defense — 1.27% | |
F-Brasile SpA / F-Brasile US LLC
7.375%, 08/15/2026 (r) | | | 12,860,000 | | | | 13,631,600 | | |
TransDigm, Inc.
6.250%, 03/15/2026 (r) | | | 15,120,000 | | | | 16,397,398 | | |
| | | | 30,028,998 | | |
Auto Parts & Equipment — 3.61% | |
Adient Global Holdings Ltd.
4.875%, 08/15/2026 (r) | | | 16,601,000 | | | | 14,858,310 | | |
Adient US LLC
7.000%, 05/15/2026 (r) | | | 9,705,000 | | | | 10,596,637 | | |
Delphi Technologies PLC
5.000%, 10/01/2025 (r) | | | 20,657,000 | | | | 19,159,368 | | |
The Goodyear Tire & Rubber Company
4.875%, 03/15/2027 | | | 14,221,000 | | | | 14,745,044 | | |
Meritor, Inc.
6.250%, 02/15/2024 | | | 10,252,000 | | | | 10,535,109 | | |
Panther BF Aggregator 2 LP / Panther
Finance Company, Inc.
6.250%, 05/15/2026 (r) | | | 14,268,000 | | | | 15,400,508 | | |
| | | | 85,294,976 | | |
Automakers — 0.74% | |
Navistar International Corp.
6.625%, 11/01/2025 (r) | | | 17,018,000 | | | | 17,372,570 | | |
Banking — 1.38% | |
BNP Paribas SA
6.625% (Fixed until 03/24/2024, then
5 Year Swap Rate USD + 4.149%), Perpetual (r) | | | 13,385,000 | | | | 14,465,370 | | |
| | Principal
Amount | | Value | |
Societe Generale SA
7.375% (Fixed until 09/12/2021,
then 5 Year Swap Rate USD + 6.238%),
Perpetual (r) | | $ | 17,027,000 | | | $ | 18,078,843 | | |
| | | | 32,544,213 | | |
Building & Construction — 3.29% | |
Ashton Woods USA LLC / Ashton Woods
Finance Company
6.750%, 08/01/2025 (r) | | | 16,749,000 | | | | 17,174,676 | | |
TopBuild Corp.
5.625%, 05/01/2026 (r) | | | 15,573,000 | | | | 16,318,129 | | |
TRI Pointe Group, Inc.
5.250%, 06/01/2027 | | | 14,842,000 | | | | 15,552,153 | | |
Tutor Perini Corp.
6.875%, 05/01/2025 (r) | | | 11,978,000 | | | | 11,588,715 | | |
Weekley Homes LLC / Weekley Finance Corp.
6.000%, 02/01/2023 | | | 17,014,000 | | | | 17,084,863 | | |
| | | | 77,718,536 | | |
Building Materials — 3.60% | |
Beacon Roofing Supply, Inc.
4.875%, 11/01/2025 (r) | | | 16,212,000 | | | | 16,326,862 | | |
4.500%, 11/15/2026 (r) | | | 2,685,000 | | | | 2,768,906 | | |
Builders FirstSource, Inc.
6.750%, 06/01/2027 (r) | | | 13,780,000 | | | | 15,145,564 | | |
Masonite International Corp.
5.750%, 09/15/2026 (r) | | | 14,818,000 | | | | 15,786,319 | | |
Resideo Funding, Inc.
6.125%, 11/01/2026 (r) | | | 3,782,000 | | | | 3,819,915 | | |
Standard Industries, Inc.
6.000%, 10/15/2025 (r) | | | 17,038,000 | | | | 17,953,622 | | |
WESCO Distribution, Inc.
5.375%, 06/15/2024 | | | 12,660,000 | | | | 13,171,654 | | |
| | | | 84,972,842 | | |
The accompanying notes are an integral part of these financial statements.
45
Schedule of Investments — December 31, 2019
Hotchkis & Wiley High Yield Fund (Unaudited)
| | Principal
Amount | | Value | |
Cable & Satellite TV — 6.37% | |
CCO Holdings LLC / CCO
Holdings Capital Corp.
5.375%, 06/01/2029 (r) | | $ | 43,880,000 | | | $ | 46,923,078 | | |
Charter Communications
Operating LLC / Charter
Communications Operating Capital
4.200%, 03/15/2028 | | | 11,215,000 | | | | 11,951,599 | | |
CSC Holdings LLC
6.500%, 02/01/2029 (r) | | | 21,655,000 | | | | 24,185,928 | | |
Telenet Finance Luxembourg
5.500%, 03/01/2028 (r) | | | 19,200,000 | | | | 20,668,800 | | |
Virgin Media Secured Finance PLC
5.500%, 05/15/2029 (r) | | | 17,157,000 | | | | 18,196,714 | | |
VTR Finance BV
6.875%, 01/15/2024 (r) | | | 14,900,000 | | | | 15,266,317 | | |
Ziggo BV
4.875%, 01/15/2030 (r) | | | 12,640,000 | | | | 13,077,755 | | |
| | | | 150,270,191 | | |
Chemicals — 2.61% | |
Atotech Alpha 3 BV / Alpha US Bidco, Inc.
6.250%, 02/01/2025 (r) | | | 19,062,000 | | | | 19,633,860 | | |
The Chemours Company
7.000%, 05/15/2025 | | | 10,742,000 | | | | 10,844,962 | | |
Element Solutions, Inc.
5.875%, 12/01/2025 (r) | | | 14,398,000 | | | | 15,099,758 | | |
Trinseo Materials Operating
SCA / Trinseo Materials Finance, Inc.
5.375%, 09/01/2025 (r) | | | 9,452,000 | | | | 9,475,630 | | |
Univar Solutions USA, Inc.
5.125%, 12/01/2027 (r) | | | 6,325,000 | | | | 6,613,610 | | |
| | | | 61,667,820 | | |
Consumer/Commercial/Lease Financing — 1.99% | |
Credit Acceptance Corp.
6.625%, 03/15/2026 (r) | | | 13,200,000 | | | | 14,303,817 | | |
DAE Funding LLC
5.000%, 08/01/2024 (r) | | | 17,461,000 | | | | 18,376,487 | | |
Park Aerospace Holdings Ltd.
5.500%, 02/15/2024 (r) | | | 12,938,000 | | | | 14,220,932 | | |
| | | | 46,901,236 | | |
Department Stores — 0.77% | |
JC Penney Corp., Inc.
5.875%, 07/01/2023 (r) | | | 21,273,000 | | | | 18,294,567 | | |
Diversified Capital Goods — 3.28% | |
EnPro Industries, Inc.
5.750%, 10/15/2026 | | | 14,255,000 | | | | 15,222,166 | | |
General Electric Company
4.500%, 03/11/2044 | | | 9,425,000 | | | | 10,314,532 | | |
5.000% (Fixed until 01/21/2021,
then 3 Month LIBOR USD + 3.330%),
Perpetual | | | 34,593,000 | | | | 33,935,041 | | |
| | Principal
Amount | | Value | |
Matthews International Corp.
5.250%, 12/01/2025 (r) | | $ | 17,950,000 | | | $ | 18,002,324 | | |
| | | | 77,474,063 | | |
Electric — Generation — 1.41% | |
NRG Energy, Inc.
7.250%, 05/15/2026 | | | 11,871,000 | | | | 12,991,029 | | |
5.250%, 06/15/2029 (r) | | | 4,845,000 | | | | 5,247,619 | | |
Vistra Operations Company LLC
5.000%, 07/31/2027 (r) | | | 14,385,000 | | | | 15,058,650 | | |
| | | | 33,297,298 | | |
Electronics — 1.41% | |
Qorvo, Inc.
5.500%, 07/15/2026 | | | 17,763,000 | | | | 18,950,883 | | |
4.375%, 10/15/2029 (r) | | | 3,512,000 | | | | 3,685,405 | | |
Sensata Technologies BV
5.625%, 11/01/2024 (r) | | | 9,627,000 | | | | 10,738,100 | | |
| | | | 33,374,388 | | |
Energy — Exploration & Production — 4.08% | |
Bellatrix Exploration Ltd.
3.000% Cash and 9.500% PIK,
12/15/2023 (f) (i) (p) (u) | | | 8,076,000 | | | | 2,019,000 | | |
8.500%, 09/11/2023 (f) (i) (u) | | | 7,411,000 | | | | 6,669,900 | | |
Callon Petroleum Company
6.375%, 07/01/2026 | | | 14,153,000 | | | | 14,400,005 | | |
HighPoint Operating Corp.
8.750%, 06/15/2025 | | | 16,375,000 | | | | 14,983,125 | | |
Jonah Energy LLC / Jonah Energy Finance Corp.
7.250%, 10/15/2025 (i) (r) | | | 21,084,000 | | | | 6,272,490 | | |
Lonestar Resources America, Inc.
11.250%, 01/01/2023 (r) | | | 16,372,000 | | | | 11,255,750 | | |
Moss Creek Resources Holdings, Inc.
7.500%, 01/15/2026 (r) | | | 22,650,000 | | | | 17,278,496 | | |
PetroQuest Energy, Inc.
10.000% PIK, 02/15/2024 (f) (p) (u) | | | 6,888,422 | | | | 1,033,263 | | |
Ultra Resources, Inc.
7.125%, 04/15/2025 (i) (r) | | | 18,411,000 | | | | 1,288,770 | | |
Unit Corp.
6.625%, 05/15/2021 | | | 24,034,000 | | | | 13,272,777 | | |
Whiting Petroleum Corp.
6.625%, 01/15/2026 | | | 11,616,000 | | | | 7,945,402 | | |
| | | | 96,418,978 | | |
Food — Wholesale — 0.92% | |
Pinnacle Operating Corp.
9.000%, 05/15/2023 (f) (i) (r) (u) | | | 21,872,134 | | | | 12,467,116 | | |
TreeHouse Foods, Inc.
6.000%, 02/15/2024 (r) | | | 8,991,000 | | | | 9,335,670 | | |
| | | | 21,802,786 | | |
Forestry/Paper — 4.67% | |
Boise Cascade Company
5.625%, 09/01/2024 (r) | | | 16,034,000 | | | | 16,722,099 | | |
The accompanying notes are an integral part of these financial statements.
46
Schedule of Investments — December 31, 2019
Hotchkis & Wiley High Yield Fund (Unaudited)
| | Principal
Amount | | Value | |
Enviva Partners LP / Enviva
Partners Finance Corp.
6.500%, 01/15/2026 (r) | | $ | 12,510,000 | | | $ | 13,424,856 | | |
Mercer International, Inc.
7.375%, 01/15/2025 | | | 18,975,000 | | | | 20,480,951 | | |
Neenah, Inc.
5.250%, 05/15/2021 (r) | | | 17,803,000 | | | | 17,847,508 | | |
Rayonier AM Products, Inc.
5.500%, 06/01/2024 (r) | | | 28,078,000 | | | | 21,210,542 | | |
Schweitzer-Mauduit International, Inc.
6.875%, 10/01/2026 (r) | | | 18,947,000 | | | | 20,469,344 | | |
| | | | 110,155,300 | | |
Gaming — 3.60% | |
Boyd Gaming Corp.
6.000%, 08/15/2026 | | | 13,518,000 | | | | 14,553,445 | | |
International Game Technology PLC
6.250%, 01/15/2027 (r) | | | 13,854,000 | | | | 15,611,380 | | |
Jacobs Entertainment, Inc.
7.875%, 02/01/2024 (r) | | | 18,064,000 | | | | 19,200,496 | | |
Penn National Gaming, Inc.
5.625%, 01/15/2027 (r) | | | 17,560,000 | | | | 18,607,498 | | |
Wynn Macau Ltd.
5.500%, 10/01/2027 (r) | | | 16,362,000 | | | | 17,054,481 | | |
| | | | 85,027,300 | | |
Gas Distribution — 2.52% | |
American Midstream Partners LP /
American Midstream Finance Corp.
9.500%, 12/15/2021 (r) | | | 18,226,000 | | | | 17,185,295 | | |
Holly Energy Partners LP /
Holly Energy Finance Corp.
6.000%, 08/01/2024 (r) | | | 10,842,000 | | | | 11,329,782 | | |
PBF Logistics LP / PBF Logistics
Finance Corp.
6.875%, 05/15/2023 | | | 12,687,000 | | | | 13,099,201 | | |
Rockpoint Gas Storage Canada Ltd.
7.000%, 03/31/2023 (r) | | | 18,170,000 | | | | 17,904,990 | | |
| | | | 59,519,268 | | |
Health Facilities — 3.84% | |
CHS / Community Health Systems, Inc.
8.000%, 03/15/2026 (r) | | | 18,205,000 | | | | 18,785,266 | | |
8.000%, 12/15/2027 (r) | | | 2,612,000 | | | | 2,644,650 | | |
6.875%, 04/01/2028 (i) (r) | | | 6,346,000 | | | | 3,640,891 | | |
HCA, Inc.
5.875%, 02/01/2029 (c) | | | 33,920,000 | | | | 39,262,400 | | |
Tenet Healthcare Corp.
6.250%, 02/01/2027 (c) (r) | | | 12,065,000 | | | | 13,000,037 | | |
5.125%, 11/01/2027 (r) | | | 12,670,000 | | | | 13,398,525 | | |
| | | | 90,731,769 | | |
Health Services — 0.70% | |
DaVita, Inc.
5.000%, 05/01/2025 (c) | | | 16,071,000 | | | | 16,566,549 | | |
| | Principal
Amount | | Value | |
Hotels — 0.77% | |
Wyndham Destinations, Inc.
4.625%, 03/01/2030 (r) | | $ | 6,044,000 | | | $ | 6,070,443 | | |
Wyndham Hotels & Resorts, Inc.
5.375%, 04/15/2026 (r) | | | 11,386,000 | | | | 12,038,674 | | |
| | | | 18,109,117 | | |
Life Insurance — 0.65% | |
CNO Financial Group, Inc.
5.250%, 05/30/2029 | | | 13,725,000 | | | | 15,359,613 | | |
Machinery — 1.47% | |
Cleaver-Brooks, Inc.
7.875%, 03/01/2023 (r) | | | 14,033,000 | | | | 14,038,823 | | |
Itron, Inc.
5.000%, 01/15/2026 (r) | | | 11,567,000 | | | | 12,019,241 | | |
Welbilt, Inc.
9.500%, 02/15/2024 | | | 8,155,000 | | | | 8,668,072 | | |
| | | | 34,726,136 | | |
Managed Care — 1.26% | |
Centene Corp.
5.375%, 06/01/2026 (r) | | | 12,386,000 | | | | 13,167,557 | | |
WellCare Health Plans, Inc.
5.375%, 08/15/2026 (r) | | | 15,497,000 | | | | 16,532,974 | | |
| | | | 29,700,531 | | |
Media — Diversified — 0.94% | |
National CineMedia LLC
5.750%, 08/15/2026 | | | 18,901,000 | | | | 18,529,548 | | |
5.875%, 04/15/2028 (r) | | | 3,475,000 | | | | 3,702,083 | | |
| | | | 22,231,631 | | |
Media Content — 1.63% | |
Salem Media Group, Inc.
6.750%, 06/01/2024 (r) | | | 20,046,000 | | | | 18,542,550 | | |
Townsquare Media, Inc.
6.500%, 04/01/2023 (r) | | | 19,574,000 | | | | 19,924,668 | | |
| | | | 38,467,218 | | |
Medical Products — 0.28% | |
Avanos Medical, Inc.
6.250%, 10/15/2022 | | | 6,565,000 | | | | 6,673,730 | | |
Metals/Mining Excluding Steel — 2.12% | |
Century Aluminum Company
7.500%, 06/01/2021 (r) | | | 2,174,000 | | | | 2,136,825 | | |
Grinding Media, Inc. / Moly-Cop AltaSteel Ltd.
7.375%, 12/15/2023 (r) | | | 18,022,000 | | | | 18,404,787 | | |
Kaiser Aluminum Corp.
4.625%, 03/01/2028 (r) | | | 9,485,000 | | | | 9,749,157 | | |
Rain CII Carbon LLC / CII Carbon Corp.
7.250%, 04/01/2025 (r) | | | 20,169,000 | | | | 19,652,875 | | |
| | | | 49,943,644 | | |
The accompanying notes are an integral part of these financial statements.
47
Schedule of Investments — December 31, 2019
Hotchkis & Wiley High Yield Fund (Unaudited)
| | Principal
Amount | | Value | |
Oil Field Equipment & Services — 3.37% | |
Exterran Energy Solutions LP / EES Finance Corp.
8.125%, 05/01/2025 | | $ | 16,024,000 | | | $ | 15,830,350 | | |
Nine Energy Service, Inc.
8.750%, 11/01/2023 (r) | | | 19,930,000 | | | | 16,208,072 | | |
SESI LLC
7.750%, 09/15/2024 | | | 17,044,000 | | | | 11,383,943 | | |
Shelf Drilling Holdings Ltd.
8.250%, 02/15/2025 (r) | | | 21,192,000 | | | | 20,238,148 | | |
Transocean, Inc.
9.000%, 07/15/2023 (r) | | | 14,951,000 | | | | 15,823,167 | | |
| | | | 79,483,680 | | |
Oil Refining & Marketing — 0.62% | |
PBF Holding Company LLC / PBF Finance Corp.
7.250%, 06/15/2025 | | | 13,584,000 | | | | 14,529,243 | | |
Packaging — 0.72% | |
Plastipak Holdings, Inc.
6.250%, 10/15/2025 (r) | | | 19,645,000 | | | | 16,992,139 | | |
Personal & Household Products — 1.65% | |
Energizer Holdings, Inc.
6.375%, 07/15/2026 (r) | | | 10,913,000 | | | | 11,642,534 | | |
Prestige Brands, Inc.
6.375%, 03/01/2024 (r) | | | 11,974,000 | | | | 12,477,926 | | |
Vista Outdoor, Inc.
5.875%, 10/01/2023 | | | 15,524,000 | | | | 14,904,980 | | |
| | | | 39,025,440 | | |
Pharmaceuticals — 1.93% | |
Bausch Health Companies, Inc.
5.000%, 01/30/2028 (r) | | | 1,865,000 | | | | 1,918,880 | | |
7.250%, 05/30/2029 (r) | | | 18,048,000 | | | | 20,653,229 | | |
5.250%, 01/30/2030 (r) | | | 1,865,000 | | | | 1,938,667 | | |
Endo Dac / Endo Finance LLC /
Endo Finco, Inc.
6.000%, 07/15/2023 (r) | | | 18,180,000 | | | | 13,180,318 | | |
Mallinckrodt International
Finance SA / Mallinckrodt CB LLC
5.625%, 10/15/2023 (i) (r) | | | 20,263,000 | | | | 7,759,007 | | |
| | | | 45,450,101 | | |
Printing & Publishing — 1.74% | |
Harland Clarke Holdings Corp.
9.250%, 03/01/2021 (r) | | | 12,323,000 | | | | 12,184,366 | | |
8.375%, 08/15/2022 (r) | | | 7,486,000 | | | | 6,122,141 | | |
LSC Communications, Inc.
8.750%, 10/15/2023 (i) (r) | | | 10,050,000 | | | | 5,456,296 | | |
Meredith Corp.
6.875%, 02/01/2026 | | | 16,504,000 | | | | 17,206,204 | | |
| | | | 40,969,007 | | |
Recreation & Travel — 0.14% | |
VOC Escrow Ltd.
5.000%, 02/15/2028 (r) | | | 3,250,000 | | | | 3,410,388 | | |
| | Principal
Amount | | Value | |
Restaurants — 0.55% | |
Yum! Brands, Inc.
4.750%, 01/15/2030 (r) | | $ | 12,333,000 | | | $ | 12,941,634 | | |
Software/Services — 2.05% | |
Fair Isaac Corp.
4.000%, 06/15/2028 (r) | | | 11,644,000 | | | | 11,760,440 | | |
j2 Cloud Services LLC / j2 Cloud
Co-Obligor, Inc.
6.000%, 07/15/2025 (r) | | | 10,209,000 | | | | 10,842,826 | | |
Nuance Communications, Inc.
5.625%, 12/15/2026 | | | 14,269,000 | | | | 15,240,112 | | |
VeriSign, Inc.
5.250%, 04/01/2025 | | | 9,486,000 | | | | 10,476,291 | | |
| | | | 48,319,669 | | |
Specialty Retail — 2.44% | |
Eagle Intermediate Global Holding BV /
Ruyi US Finance LLC
7.500%, 05/01/2025 (r) | | | 15,313,000 | | | | 12,295,037 | | |
Liberty Interactive LLC
8.250%, 02/01/2030 | | | 18,167,000 | | | | 17,973,522 | | |
Murphy Oil USA, Inc.
5.625%, 05/01/2027 | | | 13,424,000 | | | | 14,435,465 | | |
Parkland Fuel Corp.
5.875%, 07/15/2027 (r) | | | 11,965,000 | | | | 12,824,685 | | |
| | | | 57,528,709 | | |
Support — Services — 3.68% | |
AECOM
5.125%, 03/15/2027 | | | 11,090,000 | | | | 11,953,329 | | |
Aptim Corp.
7.750%, 06/15/2025 (i) (r) | | | 21,453,000 | | | | 12,934,336 | | |
Ashtead Capital, Inc.
4.250%, 11/01/2029 (r) | | | 11,580,000 | | | | 11,855,025 | | |
The GEO Group, Inc.
5.875%, 10/15/2024 | | | 20,279,000 | | | | 18,462,306 | | |
6.000%, 04/15/2026 | | | 1,743,000 | | | | 1,551,313 | | |
Herc Holdings, Inc.
5.500%, 07/15/2027 (r) | | | 15,512,000 | | | | 16,365,548 | | |
Vizient, Inc.
6.250%, 05/15/2027 (r) | | | 12,785,000 | | | | 13,716,355 | | |
| | | | 86,838,212 | | |
Technology Hardware & Equipment — 2.05% | |
CommScope, Inc.
6.000%, 03/01/2026 (r) | | | 8,540,000 | | | | 9,100,429 | | |
CommScope Technologies LLC
6.000%, 06/15/2025 (r) | | | 16,981,000 | | | | 17,042,641 | | |
Ingram Micro, Inc.
5.450%, 12/15/2024 | | | 16,748,000 | | | | 17,594,009 | | |
NCR Corp.
6.125%, 09/01/2029 (r) | | | 4,290,000 | | | | 4,663,102 | | |
| | | | 48,400,181 | | |
The accompanying notes are an integral part of these financial statements.
48
Schedule of Investments — December 31, 2019
Hotchkis & Wiley High Yield Fund (Unaudited)
| | Principal
Amount | | Value | |
Telecom — Satellite — 0.51% | |
Telesat Canada / Telesat LLC
6.500%, 10/15/2027 (r) | | $ | 11,606,000 | | | $ | 12,120,726 | | |
Transport Infrastructure/Services — 1.14% | |
GasLog Ltd.
8.875%, 03/22/2022 | | | 13,138,000 | | | | 13,552,662 | | |
XPO Logistics, Inc.
6.750%, 08/15/2024 (r) | | | 12,369,000 | | | | 13,462,852 | | |
| | | | 27,015,514 | | |
Total corporate bonds
(Cost $2,051,229,300) | | | | | 1,997,386,256 | | |
CONVERTIBLE BONDS — 0.51% | |
REITs — 0.51% | |
Colony Capital, Inc.
3.875%, 01/15/2021 | | | 12,140,000 | | | | 11,988,213 | | |
Total convertible bonds
(Cost $11,962,175) | | | | | 11,988,213 | | |
TERM LOANS — 7.81% | |
Chemicals — 1.18% | |
Hexion, Inc.
5.600% (3 Month LIBOR USD + 3.500%),
07/01/2026 (Acquired 06/27/2019 —
07/10/2019, Cost $12,982,345) (b) (m) | | | 13,024,550 | | | | 13,105,953 | | |
Momentive Performance Materials USA LLC
4.960% (1 Month LIBOR USD + 3.250%),
05/15/2024 (Acquired 04/18/2019 —
07/12/2019, Cost $14,817,426) (b) (m) | | | 14,865,300 | | | | 14,814,238 | | |
| | | | 27,920,191 | | |
Energy — Exploration & Production — 0.73% | |
Fieldwood Energy LLC
7.506% (3 Month LIBOR USD + 5.250%),
04/11/2022 (Acquired 04/11/2018 —
09/16/2019, Cost $13,015,993) (b) (m) | | | 13,763,658 | | | | 11,574,824 | | |
9.506% (3 Month LIBOR USD + 7.250%),
04/11/2023 (Acquired 04/11/2018,
Cost $9,524,816) (b) (m) | | | 9,785,808 | | | | 5,632,956 | | |
| | | | 17,207,780 | | |
Food — Wholesale — 0.66% | |
WEI Sales LLC
4.702% (1 Month LIBOR USD + 3.000%),
03/31/2025 (Acquired 09/23/2019 —
12/19/2019, Cost $15,360,995) (b) (e) (m) | | | 15,392,321 | | | | 15,488,523 | | |
Machinery — 0.70% | |
Granite US Holdings Corp.
7.354% (3 Month LIBOR USD + 5.250%),
09/25/2026 (Acquired 09/25/2019,
Cost $15,984,684) (b) (m) | | | 16,468,725 | | | | 16,551,069 | | |
Managed Care — 0.52% | |
Versant Health Holdco, Inc.
4.702% (1 Month LIBOR USD + 3.000%),
12/02/2024 (Acquired 11/02/2017 —
01/10/2019, Cost $12,190,616) (b) (m) | | | 12,292,071 | | | | 12,330,545 | | |
| | Principal
Amount | | Value | |
Oil Field Equipment & Services — 0.09% | |
Iracore International Holdings, Inc.
11.250% (1 Month LIBOR USD + 9.000%),
04/13/2021 (Acquired 04/13/2017,
Cost $2,229,945) (b) (f) (m) (u) | | $ | 2,229,945 | | | $ | 2,229,945 | | |
Pharmaceuticals — 0.11% | |
Mallinckrodt International Finance SA
TBD, 02/24/2025 (Acquired 12/23/2019,
Cost $2,572,830) (e) (m) | | | 3,156,847 | | | | 2,579,412 | | |
Software/Services — 0.68% | |
The Dun & Bradstreet Corp.
6.700% (1 Month LIBOR USD + 5.000%),
02/06/2026 (Acquired 02/01/2019 —
03/12/2019, Cost $15,622,625) (b) (m) | | | 15,785,000 | | | | 15,942,850 | | |
Specialty Retail — 1.72% | |
Ascena Retail Group, Inc.
6.250% (1 Month LIBOR USD + 4.500%),
08/21/2022 (Acquired 07/15/2019 —
11/04/2019, Cost $9,073,144) (b) (m) | | | 14,130,000 | | | | 9,679,050 | | |
Boardriders, Inc.
8.202% (1 Month LIBOR USD + 6.500%),
04/23/2024 (Acquired 03/21/2018,
Cost $6,299,447) (b) (m) | | | 6,403,344 | | | | 6,004,928 | | |
Office Depot, Inc.
6.972% (1 Month LIBOR USD + 5.250%),
11/08/2022 (Acquired 11/03/2017,
Cost $6,310,863) (b) (m) | | | 6,434,157 | | | | 6,498,498 | | |
PetSmart, Inc.
5.770% (1 Month LIBOR USD + 4.000%),
03/11/2022 (Acquired 10/01/2018 —
01/02/2019, Cost $16,266,461) (b) (m) | | | 18,693,594 | | | | 18,530,960 | | |
| | | | 40,713,436 | | |
Support — Services — 1.03% | |
Brookfield WEC Holdings, Inc.
5.202% (1 Month LIBOR USD + 3.500%),
08/01/2025 (Acquired 07/26/2018 —
06/25/2019, Cost $13,559,737) (b) (m) | | | 13,551,941 | | | | 13,666,251 | | |
Drive Chassis Holdco LLC
10.588% (3 Month LIBOR USD + 8.250%),
04/10/2026 (Acquired 04/12/2019 —
05/16/2019, Cost $10,894,201) (b) (m) | | | 11,415,000 | | | | 10,530,338 | | |
| | | | 24,196,589 | | |
Transportation Excluding Air/Rail — 0.39% | |
International Seaways Operating Corp.
7.700% (1 Month LIBOR USD + 6.000%),
06/22/2022 (Acquired 06/20/2017 —
07/20/2017, Cost $9,166,315) (b) (m) | | | 9,272,691 | | | | 9,319,054 | | |
Total term loans
(Cost $185,872,443) | | | | | 184,479,394 | | |
The accompanying notes are an integral part of these financial statements.
49
Schedule of Investments — December 31, 2019
Hotchkis & Wiley High Yield Fund (Unaudited)
PREFERRED
STOCKS — 0.00% | | Shares
Held | | Value | |
Food — Wholesale — 0.00% | |
Pinnacle Agriculture Enterprises LLC
(Acquired 03/10/2017,
Cost $11,192,395) (a) (f) (i) (m) (u) | | | 15,232,907 | | | $ | 0 | | |
Total preferred stocks
(Cost $11,192,395) | | | | | 0 | | |
COMMON STOCKS — 3.58% | |
Automakers — 0.00% | |
General Motors Company — Escrow
(Acquired 11/17/2009 — 04/06/2011,
Cost $0) (a) (f) (i) (m) (u) | | | 352,400 | | | | 0 | | |
Chemicals — 0.26% | |
Hexion Holdings Corp. (a) | | | 518,808 | | | | 6,251,636 | | |
Energy — Exploration & Production — 0.12% | |
Bellatrix Exploration Ltd. (a) (f) (i) (u) | | | 434,305 | | | | 435 | | |
Fieldwood Energy, Inc. (a) (i) | | | 30,033 | | | | 600,660 | | |
Fieldwood Energy, Inc.
(Acquired 05/03/2018,
Cost $2,595,252) (a) (i) (m) | | | 111,241 | | | | 2,224,820 | | |
PetroQuest Energy, Inc. (a) (i) (o) | | | 728,495 | | | | 0 | | |
Warren Resources, Inc.
(Acquired 11/23/2016,
Cost $160,767) (a) (f) (i) (m) (u) | | | 116,226 | | | | 1,162 | | |
| | | | 2,827,077 | | |
Metals/Mining Excluding Steel — 2.02% | |
American Zinc Recycling LLC
(Acquired 07/19/2012 — 12/10/2019,
Cost $43,120,109) (a) (f) (i) (m) (o) (u) | | | 114,835 | | | | 36,335,097 | | |
RA Parent, Inc.
(Acquired 12/23/2014 — 08/09/2019,
Cost $17,853,515) (a) (f) (i) (m) (o) (u) | | | 288 | | | | 11,345,934 | | |
| | | | 47,681,031 | | |
Oil Field Equipment & Services — 0.28% | |
Iracore Investments Holdings, Inc. — Class A
(Acquired 04/13/2017,
Cost $4,696,250) (a) (f) (i) (m) (o) (u) | | | 22,092 | | | | 6,543,209 | | |
Specialty Retail — 0.90% | |
Quiksilver, Inc.
(Acquired 07/11/2013 — 08/09/2019,
Cost $28,586,327) (a) (f) (i) (m) (u) | | | 582,983 | | | | 21,214,751 | | |
Total common stocks
(Cost $126,838,752) | | | | | 84,517,704 | | |
WARRANTS — 0.00% | |
Energy — Exploration & Production — 0.00% | |
Lonestar Resources America, Inc.
(Acquired 08/19/2016 — 09/30/2016,
Cost $763,200) (a) (f) (i) (m)
Expiration: December 2021,
Exercise Price $5.00 | | | 180,000 | | | | 0 | | |
Total warrants
(Cost $763,200) | | | | | 0 | | |
Total long-term investments
(Cost $2,387,858,265) | | | | | 2,278,371,567 | | |
SHORT-TERM
INVESTMENTS — 2.31% | | Shares
Held | | Value | |
Money Market Funds — 1.28% | |
JPMorgan U.S. Government Money Market
Fund — Class IM, 1.08%^ | | | 30,147,755 | | | $ | 30,147,755 | | |
Time
Deposits — 1.03% | | Principal
Amount | | | |
Banco Santander SA, 1.56%,
01/02/2020* | | $ | 24,422,157 | | | | 24,422,157 | | |
Total short-term investments
(Cost $54,569,912) | | | 54,569,912 | | |
Total investments — 98.82%
(Cost $2,442,428,177) | | | 2,332,941,479 | | |
Other assets in excess of liabilities — 1.18% | | | | | 27,875,730 | | |
Net assets — 100.00% | | $ | 2,360,817,209 | | |
(a) — Non-income producing security.
(b) — The coupon rate shown on variable rate securities represents the rate at December 31, 2019.
(c) — All or a portion of this security is segregated as collateral for delayed delivery securities.
(e) — Delayed delivery security.
(f) — Security was fair valued under guidelines established by and under the general supervision and responsibility of the Trust's Board of Trustees. The total market value of these securities was $99,859,812, which represented 4.23% of net assets. See Security Valuation in Note 1 in Notes to the Financial Statements.
(i) — Illiquid security. The total market value of these securities was $136,773,874, which represented 5.79% of net assets.
(m) — Restricted security. Purchased in a private placement transaction; resale to the public may require registration. The total market value of these securities was $262,144,367, which represented 11.10% of net assets.
(o) — Affiliated issuer. See Note 6 in Notes to the Financial Statements.
(p) — Payment in-kind (PIK) security.
(r) — Rule 144A security of the Securities Act of 1933. Purchased in a private placement transaction; resale to the public may require registration or be limited to qualified institutional buyers. The total market value of these securities was $1,403,476,511, which represented 59.45% of net assets.
(u) — Value determined using significant unobservable inputs.
LIBOR — London Interbank Offered Rate
TBD — To be determined.
USD — United States Dollar
^ — Rate shown is the 7-day yield as of December 31, 2019.
* — Invested through a cash management account administered by Brown Brothers Harriman & Co.
The accompanying notes are an integral part of these financial statements.
50
Statements of Assets & Liabilities
DECEMBER 31, 2019 (UNAUDITED)
| | | Diversified Value
Fund | | Large Cap Value
Fund | | Mid-Cap Value
Fund | | Small Cap Value
Fund | | Small Cap
Diversified Value
Fund | |
Assets: | |
Long-term investments, at value* | |
Unaffiliated issuers | | $ | 101,006,996 | | | $ | 513,965,575 | | | $ | 930,201,610 | | | $ | 676,988,949 | | | $ | 127,206,458 | | |
Affiliated issuers | | | — | | | | — | | | | — | | | | 13,670,343 | | | | — | | |
Collateral for securities on loan* | | | — | | | | 755,000 | | | | 1,790,955 | | | | 10,420,489 | | | | — | | |
Short-term investments* | | | 306,207 | | | | 3,443,771 | | | | 22,487,508 | | | | 12,124,832 | | | | 1,797,091 | | |
Cash | | | 278 | | | | 6,038 | | | | 20,955 | | | | 10,165 | | | | 2,595 | | |
Dividends and interest receivable | | | 169,879 | | | | 915,716 | | | | 2,453,694 | | | | 876,630 | | | | 139,387 | | |
Receivable for investments sold | | | 109,362 | | | | — | | | | 2,606,194 | | | | 1,474,997 | | | | 23,088 | | |
Receivable for Fund shares sold | | | 54,181 | | | | 774,619 | | | | 637,019 | | | | 1,025,992 | | | | 3,241,063 | | |
Other assets | | | 25,601 | | | | 44,315 | | | | 60,838 | | | | 49,767 | | | | 22,023 | | |
Total assets | | $ | 101,672,504 | | | $ | 519,905,034 | | | $ | 960,258,773 | | | $ | 716,642,164 | | | $ | 132,431,705 | | |
Liabilities: | |
Collateral upon return of securities on loan | | $ | — | | | $ | 755,000 | | | $ | 1,790,955 | | | $ | 10,420,489 | | | $ | — | | |
Payable for investments purchased | | | 20,433 | | | | 250,309 | | | | 1,714,887 | | | | 1,357,380 | | | | 97,641 | | |
Payable for Fund shares repurchased | | | 62,003 | | | | 3,164,682 | | | | 4,483,559 | | | | 923,086 | | | | 15,466 | | |
Payable to Advisor | | | 37,429 | | | | 303,824 | | | | 615,233 | | | | 442,680 | | | | 55,341 | | |
Payable to Trustees | | | — | | | | — | | | | 777 | | | | — | | | | — | | |
Accrued distribution and service fees | | | 46,730 | | | | 199,972 | | | | 200,388 | | | | 74,705 | | | | 2,566 | | |
Accrued expenses and other liabilities | | | 68,106 | | | | 240,999 | | | | 601,864 | | | | 361,298 | | | | 54,143 | | |
Total liabilities | | | 234,701 | | | | 4,914,786 | | | | 9,407,663 | | | | 13,579,638 | | | | 225,157 | | |
Commitments and contingencies (Note 8) | |
Net assets | | $ | 101,437,803 | | | $ | 514,990,248 | | | $ | 950,851,110 | | | $ | 703,062,526 | | | $ | 132,206,548 | | |
Net Assets consist of: | |
Paid-in capital | | $ | 134,974,719 | | | $ | 502,037,735 | | | $ | 1,140,456,817 | | | $ | 693,631,954 | | | $ | 128,070,834 | | |
Total distributable earnings (losses) | | $ | (33,536,916 | ) | | $ | 12,952,513 | | | $ | (189,605,707 | ) | | $ | 9,430,572 | | | $ | 4,135,714 | | |
Net assets | | $ | 101,437,803 | | | $ | 514,990,248 | | | $ | 950,851,110 | | | $ | 703,062,526 | | | $ | 132,206,548 | | |
Calculation of Net Asset Value Per Share and
Public Offering Price Per Share — Class I | |
Net assets | | $ | 63,467,298 | | | $ | 385,177,397 | | | $ | 801,312,644 | | | $ | 656,223,672 | | | $ | 129,482,890 | | |
Shares outstanding (unlimited shares $0.001 par value authorized) | | | 3,160,426 | | | | 10,873,572 | | | | 24,430,597 | | | | 12,152,196 | | | | 12,017,677 | | |
Net asset value per share | | $ | 20.08 | | | $ | 35.42 | | | $ | 32.80 | | | $ | 54.00 | | | $ | 10.77 | | |
Calculation of Net Asset Value Per Share — Class A | |
Net assets | | $ | 36,022,091 | | | $ | 115,114,832 | | | $ | 131,883,482 | | | $ | 40,603,753 | | | $ | 2,669,431 | | |
Shares outstanding (unlimited shares $0.001 par value authorized) | | | 1,785,684 | | | | 3,261,932 | | | | 4,078,153 | | | | 754,849 | | | | 248,693 | | |
Net asset value per share | | $ | 20.17 | | | $ | 35.29 | | | $ | 32.34 | | | $ | 53.79 | | | $ | 10.73 | | |
Public Offering Price Per Share — Class A | |
(Net asset value per share divided by 0.9475) | | $ | 21.29 | | | $ | 37.25 | | | $ | 34.13 | | | $ | 56.77 | | | $ | 11.32 | | |
Calculation of Net Asset Value Per Share and
Public Offering Price Per Share — Class C | |
Net assets | | $ | 1,948,414 | | | $ | 14,643,640 | | | $ | 17,600,600 | | | $ | 6,180,728 | | | | | | |
Shares outstanding (unlimited shares $0.001 par value authorized) | | | 96,941 | | | | 420,020 | | | | 625,365 | | | | 142,804 | | | | | | |
Net asset value per share | | $ | 20.10 | | | $ | 34.86 | | | $ | 28.14 | | | $ | 43.28 | | | | | | |
Calculation of Net Asset Value Per Share and
Public Offering Price Per Share — Class Z | |
Net assets | | | | | | $ | 54,379 | | | $ | 54,384 | | | $ | 54,373 | | | $ | 54,227 | | |
Shares outstanding (unlimited shares $0.001 par value authorized) | | | | | | | 1,536 | | | | 1,659 | | | | 1,007 | | | | 5,035 | | |
Net asset value per share | | | | | | $ | 35.41 | + | | $ | 32.78 | | | $ | 53.97 | + | | $ | 10.77 | | |
*Cost of long-term investments | |
Unaffiliated issuers | | $ | 102,753,950 | | | $ | 494,678,372 | | | $ | 984,692,917 | | | $ | 626,362,985 | | | $ | 119,217,621 | | |
Affiliated issuers | | | — | | | | — | | | | — | | | | 44,810,769 | | | | — | | |
*Cost of collateral for securities on loan | | | — | | | | 755,000 | | | | 1,790,955 | | | | 10,420,489 | | | | — | | |
*Cost of short-term investments | | | 306,207 | | | | 3,443,771 | | | | 22,487,483 | | | | 12,124,828 | | | | 1,797,091 | | |
+ Net asset value per share does not recalculate due to rounding and fractional shares outstanding.
The accompanying notes are an integral part of these financial statements.
51
Statements of Assets & Liabilities
DECEMBER 31, 2019 (UNAUDITED)
| | | Global Value
Fund | | International Value
Fund | | Value Opportunities
Fund | | Capital Income
Fund | | High Yield
Fund | |
Assets: | | | |
Long-term investments, at value* | |
Unaffiliated issuers | | $ | 39,501,377 | | | $ | 2,558,895 | | | $ | 745,003,742 | | | $ | 21,996,821 | | | $ | 2,224,147,327 | | |
Affiliated issuers | | | — | | | | — | | | | 23,967,183 | | | | — | | | | 54,224,240 | | |
Collateral for securities on loan* | | | — | | | | — | | | | 15,057,125 | | | | — | | | | — | | |
Short-term investments* | | | 667,255 | | | | 32,401 | | | | 22,965,234 | | | | 416,956 | | | | 54,569,912 | | |
Cash | | | 849 | | | | 24 | | | | 26,275 | | | | 67 | | | | 13,203 | | |
Cash denominated in foreign currencies# | | | — | | | | 164 | | | | — | | | | — | | | | — | | |
Cash collateral for futures | | | — | | | | — | | | | 398,847 | | | | — | | | | — | | |
Cash collateral for options | | | — | | | | — | | | | 2,162 | | | | — | | | | — | | |
Dividends and interest receivable | | | 91,018 | | | | 12,259 | | | | 2,131,275 | | | | 172,445 | | | | 35,517,074 | | |
Receivable for investments sold | | | 34,870 | | | | 2,286 | | | | 2,937,530 | | | | 36,754 | | | | 6,049,416 | | |
Receivable for Fund shares sold | | | 41,621 | | | | — | | | | 1,719,635 | | | | 7,221 | | | | 5,739,889 | | |
Receivable from Advisor | | | — | | | | 8,544 | | | | — | | | | 845 | | | | — | | |
Other assets | | | 21,194 | | | | 2,690 | | | | 60,818 | | | | 7,306 | | | | 133,089 | | |
Total assets | | $ | 40,358,184 | | | $ | 2,617,263 | | | $ | 814,269,826 | | | $ | 22,638,415 | | | $ | 2,380,394,150 | | |
Liabilities: | | | |
Collateral upon return of securities on loan | | $ | — | | | $ | — | | | $ | 15,057,125 | | | $ | — | | | $ | — | | |
Payable for investments purchased | | | — | | | | — | | | | 15,625,289 | | | | 85,304 | | | | 4,549,793 | | |
Payable for variation margin | | | — | | | | — | | | | 139,688 | | | | — | | | | — | | |
Payable for Fund shares repurchased | | | — | | | | — | | | | 1,058,836 | | | | 26,223 | | | | 10,977,632 | | |
Payable to Advisor | | | 16,621 | | | | — | | | | 487,822 | | | | — | | | | 1,016,870 | | |
Payable to Trustees | | | — | | | | — | | | | — | | | | 45 | | | | 2,510 | | |
Accrued distribution and service fees | | | 1,265 | | | | — | | | | 191,455 | | | | 5,983 | | | | 105,874 | | |
Distributions payable to shareholders | | | — | | | | — | | | | — | | | | 9,136 | | | | 2,113,552 | | |
Cash overdraft | | | 5 | | | | — | | | | 76 | | | | — | | | | — | | |
Accrued expenses and other liabilities | | | 43,879 | | | | 37,786 | | | | 310,484 | | | | 52,670 | | | | 810,710 | | |
Total liabilities | | | 61,770 | | | | 37,786 | | | | 32,870,775 | | | | 179,361 | | | | 19,576,941 | | |
Commitments and contingencies (Note 8) | |
Net assets | | $ | 40,296,414 | | | $ | 2,579,477 | | | $ | 781,399,051 | | | $ | 22,459,054 | | | $ | 2,360,817,209 | | |
Net Assets consist of: | | | |
Paid-in capital | | $ | 37,255,704 | | | $ | 2,508,707 | | | $ | 712,556,197 | | | $ | 23,749,171 | | | $ | 2,619,316,074 | | |
Total distributable earnings (losses) | | $ | 3,040,710 | | | $ | 70,770 | | | $ | 68,842,854 | | | $ | (1,290,117 | ) | | $ | (258,498,865 | ) | |
Net assets | | $ | 40,296,414 | | | $ | 2,579,477 | | | $ | 781,399,051 | | | $ | 22,459,054 | | | $ | 2,360,817,209 | | |
Calculation of Net Asset Value Per Share and
Public Offering Price Per Share — Class I | | | |
Net assets | | $ | 40,076,377 | | | $ | 2,579,477 | | | $ | 595,394,280 | | | $ | 10,768,558 | | | $ | 1,696,946,863 | | |
Shares outstanding (unlimited shares $0.001 par value authorized) | | | 3,298,781 | | | | 247,034 | | | | 20,546,393 | | | | 880,322 | | | | 147,180,517 | | |
Net asset value per share | | $ | 12.15 | | | $ | 10.44 | | | $ | 28.98 | | | $ | 12.23 | | | $ | 11.53 | | |
Calculation of Net Asset Value Per Share — Class A | | | |
Net assets | | $ | 220,037 | | | | | | | $ | 121,473,908 | | | $ | 11,690,496 | | | $ | 196,150,989 | | |
Shares outstanding (unlimited shares $0.001 par value authorized) | | | 18,093 | | | | | | | | 4,178,493 | | | | 914,378 | | | | 17,114,222 | | |
Net asset value per share | | $ | 12.16 | | | | | | | $ | 29.07 | | | $ | 12.79 | | | $ | 11.46 | | |
Public Offering Price Per Share — Class A | | | |
(Net asset value per share divided by 0.9475) | | $ | 12.83 | | | | | | | $ | 30.68 | | | | | | | | | | |
(Net asset value per share divided by 0.9525) | | | | | | | | | | | | | | $ | 13.43 | | | | | | |
(Net asset value per share divided by 0.9625) | | | | | | | | | | | | | | | | | | $ | 11.91 | | |
Calculation of Net Asset Value Per Share and
Public Offering Price Per Share — Class C | | | |
Net assets | | | | | | | | | | $ | 43,775,430 | | | | | | | $ | 3,470,045 | | |
Shares outstanding (unlimited shares $0.001 par value authorized) | | | | | | | | | | | 1,629,348 | | | | | | | | 301,151 | | |
Net asset value per share | | | | | | | | | | $ | 26.87 | | | | | | | $ | 11.52 | | |
Calculation of Net Asset Value Per Share and
Public Offering Price Per Share — Class Z | | | |
Net assets | | | | | | | | | | $ | 20,755,433 | | | | | | | $ | 464,249,312 | | |
Shares outstanding (unlimited shares $0.001 par value authorized) | | | | | | | | | | | 716,531 | | | | | | | | 40,243,539 | | |
Net asset value per share | | | | | | | | | | $ | 28.97 | | | | | | | $ | 11.54 | | |
*Cost of long-term investments | | | |
Unaffiliated issuers | | $ | 35,994,348 | | | $ | 2,448,438 | | | $ | 682,087,688 | | | $ | 22,085,107 | | | $ | 2,307,222,875 | | |
Affiliated issuers | | | — | | | | — | | | | 21,329,724 | | | | — | | | | 80,635,390 | | |
*Cost of collateral for securities on loan | | | — | | | | — | | | | 15,057,125 | | | | — | | | | — | | |
*Cost of short-term investments | | | 667,255 | | | | 32,401 | | | | 22,965,220 | | | | 416,956 | | | | 54,569,912 | | |
#Cost of cash denominated in foreign currencies | | $ | — | | | $ | 163 | | | $ | — | | | $ | — | | | $ | — | | |
The accompanying notes are an integral part of these financial statements.
52
Statements of Operations
FOR THE SIX MONTHS ENDED DECEMBER 31, 2019 (UNAUDITED)
| | | Diversified Value
Fund | | Large Cap Value
Fund | | Mid-Cap Value
Fund | | Small Cap Value
Fund | | Small Cap
Diversified Value
Fund | |
Investment income: | |
Dividends* | |
Unaffiliated issuers | | $ | 1,230,890 | | | $ | 6,067,260 | | | $ | 15,303,918 | | | $ | 6,530,565 | | | $ | 1,092,758 | | |
Interest | | | 4,287 | | | | 50,030 | | | | 207,425 | | | | 123,908 | | | | 19,831 | | |
Securities on loan, net | | | — | | | | 1,240 | | | | 115,675 | | | | 77,687 | | | | — | | |
Total income | | | 1,235,177 | | | | 6,118,530 | | | | 15,627,018 | | | | 6,732,160 | | | | 1,112,589 | | |
Expenses: | |
Advisory fees | | | 346,264 | | | | 1,729,115 | | | | 3,947,874 | | | | 2,604,970 | | | | 353,373 | | |
Professional fees and expenses | | | 13,059 | | | | 21,913 | | | | 40,164 | | | | 25,906 | | | | 11,218 | | |
Custodian fees and expenses | | | 3,094 | | | | 7,159 | | | | 18,045 | | | | 9,958 | | | | 14,591 | | |
Transfer agent fees and expenses | | | 58,994 | | | | 363,278 | | | | 1,014,062 | | | | 680,723 | | | | 34,638 | | |
Accounting fees and expenses | | | 13,004 | | | | 29,252 | | | | 70,524 | | | | 42,021 | | | | 17,870 | | |
Administration fees and expenses | | | 22,057 | | | | 79,029 | | | | 189,951 | | | | 112,719 | | | | 22,841 | | |
Trustees' fees and expenses | | | 4,118 | | | | 20,122 | | | | 48,967 | | | | 29,518 | | | | 3,863 | | |
Reports to shareholders | | | 3,880 | | | | 13,594 | | | | 77,001 | | | | 49,711 | | | | 1,961 | | |
Registration fees | | | 25,450 | | | | 43,940 | | | | 42,115 | | | | 37,956 | | | | 24,110 | | |
Distribution and service fees — Class A | | | 44,108 | | | | 144,905 | | | | 170,870 | | | | 51,366 | | | | 3,245 | | |
Distribution and service fees — Class C | | | 10,018 | | | | 72,090 | | | | 97,801 | | | | 32,901 | | | | — | | |
Distribution and service fees — Class R | | | — | | | | 3,969 | | | | 3,193 | | | | — | | | | — | | |
Other expenses | | | 5,536 | | | | 15,169 | | | | 46,964 | | | | 24,058 | | | | 4,161 | | |
Total expenses | | | 549,582 | | | | 2,543,535 | | | | 5,767,531 | | | | 3,701,807 | | | | 491,871 | | |
Fee waiver/expense reimbursement by Advisor (Note 2) | | | (99,723 | ) | | | — | | | | — | | | | — | | | | (36,186 | ) | |
Net expenses | | | 449,859 | | | | 2,543,535 | | | | 5,767,531 | | | | 3,701,807 | | | | 455,685 | | |
Net investment income | | | 785,318 | | | | 3,574,995 | | | | 9,859,487 | | | | 3,030,353 | | | | 656,904 | | |
Realized and Unrealized Gains (Losses): | |
Net realized gains (losses) from: | |
Sales of unaffiliated issuers | | | (2,558,731 | ) | | | (2,122,460 | ) | | | (76,869,135 | ) | | | 576,188 | | | | (510,551 | ) | |
Foreign currency transactions | | | — | | | | — | | | | (66,942 | ) | | | — | | | | — | | |
Net realized gains (losses) | | | (2,558,731 | ) | | | (2,122,460 | ) | | | (76,936,077 | ) | | | 576,188 | | | | (510,551 | ) | |
Net change in unrealized appreciation of: | |
Securities of unaffiliated issuers and foreign currency transactions | | | 9,576,377 | | | | 38,157,892 | | | | 59,628,046 | | | | 38,039,400 | | | | 8,244,624 | | |
Securities of affiliated issuers | | | — | | | | — | | | | — | | | | 908,470 | | | | — | | |
Net change in unrealized appreciation | | | 9,576,377 | | | | 38,157,892 | | | | 59,628,046 | | | | 38,947,870 | | | | 8,244,624 | | |
Net gains (losses) | | | 7,017,646 | | | | 36,035,432 | | | | (17,308,031 | ) | | | 39,524,058 | | | | 7,734,073 | | |
Net Increase (Decrease) in Net Assets Resulting
from Operations | | $ | 7,802,964 | | | $ | 39,610,427 | | | $ | (7,448,544 | ) | | $ | 42,554,411 | | | $ | 8,390,977 | | |
*Net of Foreign Taxes Withheld | | $ | 9,863 | | | $ | 56,533 | | | $ | 117,289 | | | $ | 46,611 | | | $ | 1,217 | | |
The accompanying notes are an integral part of these financial statements.
53
Statements of Operations
FOR THE SIX MONTHS ENDED DECEMBER 31, 2019 (UNAUDITED)
| | | Global Value
Fund | | International Value
Fund | | Value
Opportunities
Fund | | Capital Income
Fund | | High Yield
Fund | |
Investment income: | |
Dividends* | |
Unaffiliated issuers | | $ | 466,358 | | | $ | 30,309 | | | $ | 7,950,092 | | | $ | 179,496 | | | $ | — | | |
Interest | | | 6,965 | | | | 184 | | | | 2,988,190 | | | | 353,418 | | | | 81,337,244 | | |
Securities on loan, net | | | — | | | | — | | | | 24,607 | | | | — | | | | — | | |
Total income | | | 473,323 | | | | 30,493 | | | | 10,962,889 | | | | 532,914 | | | | 81,337,244 | | |
Expenses: | |
Advisory fees | | | 149,309 | | | | 9,562 | | | | 2,842,758 | | | | 76,249 | | | | 6,732,612 | | |
Professional fees and expenses | | | 10,074 | | | | 8,083 | | | | 25,709 | | | | 9,797 | | | | 74,013 | | |
Custodian fees and expenses | | | 7,777 | | | | 8,628 | | | | 13,379 | | | | 9,632 | | | | 34,106 | | |
Transfer agent fees and expenses | | | 22,133 | | | | 109 | | | | 476,892 | | | | 10,053 | | | | 1,221,521 | | |
Accounting fees and expenses | | | 14,029 | | | | 15,439 | | | | 44,687 | | | | 27,234 | | | | 157,581 | | |
Administration fees and expenses | | | 19,958 | | | | 19,958 | | | | 118,826 | | | | 20,854 | | | | 383,866 | | |
Trustees' fees and expenses | | | 1,619 | | | | 96 | | | | 31,401 | | | | 1,092 | | | | 108,755 | | |
Reports to shareholders | | | 811 | | | | 474 | | | | 18,969 | | | | 1,591 | | | | 82,217 | | |
Registration fees | | | 24,852 | | | | 4,465 | | | | 34,638 | | | | 19,112 | | | | 53,058 | | |
Distribution and service fees — Class A | | | 261 | | | | — | | | | 157,406 | | | | 14,972 | | | | 300,922 | | |
Distribution and service fees — Class C | | | — | | | | — | | | | 224,523 | | | | — | | | | 17,618 | | |
Other expenses | | | 2,858 | | | | 2,061 | | | | 22,612 | | | | 3,188 | | | | 79,645 | | |
Total expenses | | | 253,681 | | | | 68,875 | | | | 4,011,800 | | | | 193,774 | | | | 9,245,914 | | |
Fee waiver/expense reimbursement by Advisor (Note 2) | | | (64,295 | ) | | | (57,517 | ) | | | — | | | | (84,446 | ) | | | (574,025 | ) | |
Net expenses | | | 189,386 | | | | 11,358 | | | | 4,011,800 | | | | 109,328 | | | | 8,671,889 | | |
Net investment income | | | 283,937 | | | | 19,135 | | | | 6,951,089 | | | | 423,586 | | | | 72,665,355 | | |
Realized and Unrealized Gains (Losses): | |
Net realized gains (losses) from: | |
Sales of unaffiliated issuers | | | (596,411 | ) | | | (42,432 | ) | | | 840,937 | | | | (477,111 | ) | | | (20,734,136 | ) | |
Sales of affiliated issuers | | | — | | | | — | | | | — | | | | — | | | | (2,860,318 | ) | |
Foreign currency transactions | | | (3,728 | ) | | | (278 | ) | | | (38,541 | ) | | | 7 | | | | — | | |
Credit default swap contracts | | | — | | | | — | | | | — | | | | 2,203 | | | | 523,107 | | |
Net realized gains (losses) | | | (600,139 | ) | | | (42,710 | ) | | | 802,396 | | | | (474,901 | ) | | | (23,071,347 | ) | |
Net change in unrealized appreciation (depreciation) of: | |
Securities of unaffiliated issuers and foreign currency transactions | | | 3,353,123 | | | | 269,360 | | | | 32,405,746 | | | | 793,509 | | | | (15,982,019 | ) | |
Securities of affiliated issuers | | | — | | | | — | | | | 1,497,963 | | | | — | | | | 2,765,226 | | |
Futures contracts | | | — | | | | — | | | | 79,070 | | | | — | | | | — | | |
Net change in unrealized appreciation (depreciation) | | | 3,353,123 | | | | 269,360 | | | | 33,982,779 | | | | 793,509 | | | | (13,216,793 | ) | |
Net gains (losses) | | | 2,752,984 | | | | 226,650 | | | | 34,785,175 | | | | 318,608 | | | | (36,288,140 | ) | |
Net Increase in Net Assets Resulting from
Operations | | $ | 3,036,921 | | | $ | 245,785 | | | $ | 41,736,264 | | | $ | 742,194 | | | $ | 36,377,215 | | |
*Net of Foreign Taxes Withheld | | $ | 10,620 | | | $ | 1,365 | | | $ | 16,246 | | | $ | 2,340 | | | $ | 97,266 | | |
The accompanying notes are an integral part of these financial statements.
54
Statements of Changes in Net Assets
| | | Diversified Value Fund | | Large Cap Value Fund | |
| | | Six months ended
December 31, 2019
(unaudited) | | Year ended
June 30, 2019 | | Six months ended
December 31, 2019
(unaudited) | | Year ended
June 30, 2019 | |
Operations: | |
Net investment income | | $ | 785,318 | | | $ | 1,550,733 | | | $ | 3,574,995 | | | $ | 6,444,583 | | |
Net realized gains (losses) | | | (2,558,731 | ) | | | (1,011,217 | ) | | | (2,122,460 | ) | | | 1,387,346 | | |
Net change in unrealized appreciation | | | 9,576,377 | | | | 1,115,378 | | | | 38,157,892 | | | | 8,598,262 | | |
Net increase in net assets resulting from operations | | | 7,802,964 | | | | 1,654,894 | | | | 39,610,427 | | | | 16,430,191 | | |
Dividends and Distributions to Shareholders: | |
Class I | | | (1,144,319 | ) | | | (841,971 | ) | | | (6,189,225 | ) | | | (8,588,072 | ) | |
Class A | | | (560,184 | ) | | | (432,249 | ) | | | (1,587,986 | ) | | | (3,158,756 | ) | |
Class C | | | (11,349 | ) | | | (6,014 | ) | | | (89,931 | ) | | | (247,825 | ) | |
Class R | | | — | | | | — | | | | — | | | | (118,525 | ) | |
Class Z | | | — | | | | — | | | | (901 | ) | | | — | | |
Net decrease in net assets resulting from dividends and distributions
to shareholders | | | (1,715,852 | ) | | | (1,280,234 | ) | | | (7,868,043 | ) | | | (12,113,178 | ) | |
Capital Share Transactions: | |
Net increase (decrease) in net assets resulting from capital
share transactions | | | (5,930,085 | ) | | | (6,810,441 | ) | | | (10,455,756 | ) | | | 60,132,345 | | |
Net Assets: | |
Total increase (decrease) in net assets | | | 157,027 | | | | (6,435,781 | ) | | | 21,286,628 | | | | 64,449,358 | | |
Beginning of period | | | 101,280,776 | | | | 107,716,557 | | | | 493,703,620 | | | | 429,254,262 | | |
End of period | | $ | 101,437,803 | | | $ | 101,280,776 | | | $ | 514,990,248 | | | $ | 493,703,620 | | |
The accompanying notes are an integral part of these financial statements.
55
Statements of Changes in Net Assets
| | | Mid-Cap Value Fund | | Small Cap Value Fund | |
| | | Six months ended
December 31, 2019
(unaudited) | | Year ended
June 30, 2019 | | Six months ended
December 31, 2019
(unaudited) | | Year ended
June 30, 2019 | |
Operations: | |
Net investment income | | $ | 9,859,487 | | | $ | 9,792,514 | | | $ | 3,030,353 | | | $ | 4,338,089 | | |
Net realized gains (losses) | | | (76,936,077 | ) | | | 4,463,302 | | | | 576,188 | | | | 41,626,602 | | |
Net change in unrealized appreciation (depreciation) | | | 59,628,046 | | | | (266,939,826 | ) | | | 38,947,870 | | | | (122,340,023 | ) | |
Net increase (decrease) in net assets resulting from operations | | | (7,448,544 | ) | | | (252,684,010 | ) | | | 42,554,411 | | | | (76,375,332 | ) | |
Dividends and Distributions to Shareholders: | |
Class I | | | (13,255,008 | ) | | | (34,995,716 | ) | | | (31,165,371 | ) | | | (53,561,823 | ) | |
Class A | | | (1,554,115 | ) | | | (4,637,879 | ) | | | (1,811,115 | ) | | | (4,070,454 | ) | |
Class C | | | (28,184 | ) | | | (685,095 | ) | | | (300,174 | ) | | | (973,465 | ) | |
Class R | | | — | | | | (106,553 | ) | | | — | | | | — | | |
Class Z | | | (908 | ) | | | — | | | | (2,581 | ) | | | — | | |
Net decrease in net assets resulting from dividends and distributions
to shareholders | | | (14,838,215 | ) | | | (40,425,243 | ) | | | (33,279,241 | ) | | | (58,605,742 | ) | |
Capital Share Transactions: | |
Net increase (decrease) in net assets resulting from capital
share transactions | | | (259,331,804 | ) | | | (359,566,836 | ) | | | (28,339,668 | ) | | | 57,162,046 | | |
Net Assets: | |
Total decrease in net assets | | | (281,618,563 | ) | | | (652,676,089 | ) | | | (19,064,498 | ) | | | (77,819,028 | ) | |
Beginning of period | | | 1,232,469,673 | | | | 1,885,145,762 | | | | 722,127,024 | | | | 799,946,052 | | |
End of period | | $ | 950,851,110 | | | $ | 1,232,469,673 | | | $ | 703,062,526 | | | $ | 722,127,024 | | |
The accompanying notes are an integral part of these financial statements.
56
Statements of Changes in Net Assets
| | | Small Cap Diversified Value Fund | | Global Value Fund | |
| | | Six months ended
December 31, 2019
(unaudited) | |
Year ended
June 30, 2019 | | Six months ended
December 31, 2019
(unaudited) | |
Year ended
June 30, 2019 | |
Operations: | |
Net investment income | | $ | 656,904 | | | $ | 512,450 | | | $ | 283,937 | | | $ | 403,567 | | |
Net realized gains (losses) | | | (510,551 | ) | | | (2,884,366 | ) | | | (600,139 | ) | | | 792,594 | | |
Net change in unrealized appreciation (depreciation) | | | 8,244,624 | | | | (1,767,303 | ) | | | 3,353,123 | | | | (677,274 | ) | |
Net increase (decrease) in net assets resulting from operations | | | 8,390,977 | | | | (4,139,219 | ) | | | 3,036,921 | | | | 518,887 | | |
Dividends and Distributions to Shareholders: | |
Class I | | | (1,088,093 | ) | | | (2,939,252 | ) | | | (1,021,238 | ) | | | (703,103 | ) | |
Class A | | | (15,269 | ) | | | (241,524 | ) | | | (4,267 | ) | | | (22,566 | ) | |
Class Z | | | (478 | ) | | | — | | | | — | | | | — | | |
Net decrease in net assets resulting from dividends and distributions
to shareholders | | | (1,103,840 | ) | | | (3,180,776 | ) | | | (1,025,505 | ) | | | (725,669 | ) | |
Capital Share Transactions: | |
Net increase (decrease) in net assets resulting from capital
share transactions | | | 26,639,653 | | | | 62,637,044 | | | | (1,701,834 | ) | | | 30,475,137 | | |
Net Assets: | |
Total increase in net assets | | | 33,926,790 | | | | 55,317,049 | | | | 309,582 | | | | 30,268,355 | | |
Beginning of period | | | 98,279,758 | | | | 42,962,709 | | | | 39,986,832 | | | | 9,718,477 | | |
End of period | | $ | 132,206,548 | | | $ | 98,279,758 | | | $ | 40,296,414 | | | $ | 39,986,832 | | |
The accompanying notes are an integral part of these financial statements.
57
Statements of Changes in Net Assets
| | | International Value Fund | | Value Opportunities Fund | |
| | | Six months ended
December 31, 2019
(unaudited) | | Year ended
June 30, 2019 | | Six months ended
December 31, 2019
(unaudited) | | Year ended
June 30, 2019 | |
Operations: | |
Net investment income | | $ | 19,135 | | | $ | 43,772 | | | $ | 6,951,089 | | | $ | 6,418,204 | | |
Net realized gains (losses) | | | (42,710 | ) | | | 66,763 | | | | 802,396 | | | | 23,302,826 | | |
Net change in unrealized appreciation (depreciation) | | | 269,360 | | | | (340,896 | ) | | | 33,982,779 | | | | (14,238,599 | ) | |
Net increase (decrease) in net assets resulting from operations | | | 245,785 | | | | (230,361 | ) | | | 41,736,264 | | | | 15,482,431 | | |
Dividends and Distributions to Shareholders: | |
Class I | | | (83,874 | ) | | | (158,651 | ) | | | (13,690,904 | ) | | | (44,528,454 | ) | |
Class A | | | — | | | | — | | | | (2,494,397 | ) | | | (10,845,972 | ) | |
Class C | | | — | | | | — | | | | (667,331 | ) | | | (4,078,762 | ) | |
Class Z | | | — | | | | — | | | | (488,111 | ) | | | — | | |
Net decrease in net assets resulting from dividends and distributions
to shareholders | | | (83,874 | ) | | | (158,651 | ) | | | (17,340,743 | ) | | | (59,453,188 | ) | |
Capital Share Transactions: | |
Net increase (decrease) in net assets resulting from capital
share transactions | | | 83,874 | | | | 180,153 | | | | (9,164,727 | ) | | | 171,006,963 | | |
Net Assets: | |
Total increase (decrease) in net assets | | | 245,785 | | | | (208,859 | ) | | | 15,230,794 | | | | 127,036,206 | | |
Beginning of period | | | 2,333,692 | | | | 2,542,551 | | | | 766,168,257 | | | | 639,132,051 | | |
End of period | | $ | 2,579,477 | | | $ | 2,333,692 | | | $ | 781,399,051 | | | $ | 766,168,257 | | |
The accompanying notes are an integral part of these financial statements.
58
Statements of Changes in Net Assets
| | | Capital Income Fund | | High Yield Fund | |
| | | Six months ended
December 31, 2019
(unaudited) | | Year ended
June 30, 2019 | | Six months ended
December 31, 2019
(unaudited) | | Year ended
June 30, 2019 | |
Operations: | |
Net investment income | | $ | 423,586 | | | $ | 1,030,157 | | | $ | 72,665,355 | | | $ | 153,981,978 | | |
Net realized gains (losses) | | | (474,901 | ) | | | 430,217 | | | | (23,071,347 | ) | | | (12,074,620 | ) | |
Net change in unrealized appreciation (depreciation) | | | 793,509 | | | | (2,714,234 | ) | | | (13,216,793 | ) | | | (40,173,551 | ) | |
Net increase (decrease) in net assets resulting from operations | | | 742,194 | | | | (1,253,860 | ) | | | 36,377,215 | | | | 101,733,807 | | |
Dividends and Distributions to Shareholders: | |
Class I | | | (254,352 | ) | | | (555,328 | ) | | | (52,737,187 | ) | | | (108,086,396 | ) | |
Class A | | | (243,334 | ) | | | (436,467 | ) | | | (6,820,342 | ) | | | (23,855,338 | ) | |
Class C | | | — | | | | — | | | | (88,100 | ) | | | (164,548 | ) | |
Class Z | | | — | | | | — | | | | (12,981,446 | ) | | | (21,885,321 | ) | |
Net decrease in net assets resulting from dividends and distributions
to shareholders | | | (497,686 | ) | | | (991,795 | ) | | | (72,627,075 | ) | | | (153,991,603 | ) | |
Capital Share Transactions: | |
Net decrease in net assets resulting from capital share transactions | | | (4,478,990 | ) | | | (7,876,013 | ) | | | (136,949,434 | ) | | | (131,154,496 | ) | |
Net Assets: | |
Total decrease in net assets | | | (4,234,482 | ) | | | (10,121,668 | ) | | | (173,199,294 | ) | | | (183,412,292 | ) | |
Beginning of period | | | 26,693,536 | | | | 36,815,204 | | | | 2,534,016,503 | | | | 2,717,428,795 | | |
End of period | | $ | 22,459,054 | | | $ | 26,693,536 | | | $ | 2,360,817,209 | | | $ | 2,534,016,503 | | |
The accompanying notes are an integral part of these financial statements.
59
Financial Highlights
The following per share data and ratios have been derived from information provided in the financial statements.
| | | | | Income (loss) from investment operations | | Dividends and distributions | |
Diversified Value Fund | | Net asset
value,
beginning
of period | | Net
investment
income1 | | Net gains
(losses) on
securities
(both
realized and
unrealized) | | Total from
investment
operations | | Dividends
(from net
investment
income) | | Distributions
(from
capital
gains) | | Total
distributions | |
Class I | |
Six months ended
12/31/2019* | | $ | 18.90 | | | $ | 0.16 | | | $ | 1.39 | | | $ | 1.55 | | | $ | (0.37 | ) | | $ | — | | | $ | (0.37 | ) | |
Year ended 6/30/2019 | | | 18.80 | | | | 0.30 | | | | 0.06 | | | | 0.36 | | | | (0.26 | ) | | | — | | | | (0.26 | ) | |
Year ended 6/30/2018 | | | 17.43 | | | | 0.23 | | | | 1.48 | | | | 1.71 | | | | (0.34 | ) | | | — | | | | (0.34 | ) | |
Year ended 6/30/2017 | | | 14.31 | | | | 0.19 | | | | 3.77 | | | | 3.96 | | | | (0.84 | ) | | | — | | | | (0.84 | ) | |
Year ended 6/30/2016 | | | 15.89 | | | | 0.22 | | | | (1.59 | ) | | | (1.37 | ) | | | (0.21 | ) | | | — | | | | (0.21 | ) | |
Year ended 6/30/2015 | | | 15.47 | | | | 0.19 | | | | 0.61 | | | | 0.80 | | | | (0.38 | ) | | | — | | | | (0.38 | ) | |
Class A | |
Six months ended
12/31/2019* | | | 18.95 | | | | 0.14 | | | | 1.39 | | | | 1.53 | | | | (0.31 | ) | | | — | | | | (0.31 | ) | |
Year ended 6/30/2019 | | | 18.85 | | | | 0.26 | | | | 0.05 | | | | 0.31 | | | | (0.21 | ) | | | — | | | | (0.21 | ) | |
Year ended 6/30/2018 | | | 17.47 | | | | 0.19 | | | | 1.49 | | | | 1.68 | | | | (0.30 | ) | | | — | | | | (0.30 | ) | |
Year ended 6/30/2017 | | | 14.36 | | | | 0.16 | | | | 3.77 | | | | 3.93 | | | | (0.82 | ) | | | — | | | | (0.82 | ) | |
Year ended 6/30/2016 | | | 15.92 | | | | 0.18 | | | | (1.59 | ) | | | (1.41 | ) | | | (0.15 | ) | | | — | | | | (0.15 | ) | |
Year ended 6/30/2015 | | | 15.50 | | | | 0.14 | | | | 0.63 | | | | 0.77 | | | | (0.35 | ) | | | — | | | | (0.35 | ) | |
Class C | |
Six months ended
12/31/2019* | | | 18.77 | | | | 0.07 | | | | 1.38 | | | | 1.45 | | | | (0.12 | ) | | | — | | | | (0.12 | ) | |
Year ended 6/30/2019 | | | 18.64 | | | | 0.12 | | | | 0.06 | | | | 0.18 | | | | (0.05 | ) | | | — | | | | (0.05 | ) | |
Year ended 6/30/2018 | | | 17.27 | | | | 0.04 | | | | 1.48 | | | | 1.52 | | | | (0.15 | ) | | | — | | | | (0.15 | ) | |
Year ended 6/30/2017 | | | 14.23 | | | | 0.04 | | | | 3.73 | | | | 3.77 | | | | (0.73 | ) | | | — | | | | (0.73 | ) | |
Year ended 6/30/2016 | | | 15.76 | | | | 0.07 | | | | (1.57 | ) | | | (1.50 | ) | | | (0.03 | ) | | | — | | | | (0.03 | ) | |
Year ended 6/30/2015 | | | 15.20 | | | | 0.03 | | | | 0.62 | | | | 0.65 | | | | (0.09 | ) | | | — | | | | (0.09 | ) | |
| | | | | Ratios to Average Net Assets | |
Diversified Value Fund | | Net asset
value, end
of period | | Total
return2 | | Net assets,
end of
period (in
thousands) | | Expenses,
net of
reimbursement/
waiver | | Expenses,
before
reimbursement/
waiver | | Net
investment
income | |
Class I | |
Six months ended
12/31/2019* | | $ | 20.08 | | | | 8.19 | % | | $ | 63,467 | | | | 0.80 | %3 | | | 1.01 | %3 | | | 1.69 | %3 | |
Year ended 6/30/2019 | | | 18.90 | | | | 2.08 | | | | 63,333 | | | | 0.83 | | | | 0.99 | | | | 1.65 | | |
Year ended 6/30/2018 | | | 18.80 | | | | 9.81 | | | | 65,503 | | | | 0.95 | | | | 1.02 | | | | 1.25 | | |
Year ended 6/30/2017 | | | 17.43 | | | | 28.05 | | | | 68,260 | | | | 0.95 | | | | 1.09 | | | | 1.21 | | |
Year ended 6/30/2016 | | | 14.31 | | | | –8.59 | | | | 342,046 | | | | 0.95 | | | | 1.03 | | | | 1.52 | | |
Year ended 6/30/2015 | | | 15.89 | | | | 5.30 | | | | 481,815 | | | | 0.95 | | | | 0.99 | | | | 1.18 | | |
Class A | |
Six months ended
12/31/2019* | | | 20.17 | | | | 8.10 | | | | 36,022 | | | | 1.053 | | | | 1.233 | | | | 1.443 | | |
Year ended 6/30/2019 | | | 18.95 | | | | 1.78 | | | | 35,807 | | | | 1.08 | | | | 1.24 | | | | 1.39 | | |
Year ended 6/30/2018 | | | 18.85 | | | | 9.57 | | | | 39,616 | | | | 1.20 | | | | 1.27 | | | | 1.00 | | |
Year ended 6/30/2017 | | | 17.47 | | | | 27.71 | | | | 41,084 | | | | 1.20 | | | | 1.34 | | | | 1.00 | | |
Year ended 6/30/2016 | | | 14.36 | | | | –8.83 | | | | 38,527 | | | | 1.20 | | | | 1.28 | | | | 1.25 | | |
Year ended 6/30/2015 | | | 15.92 | | | | 5.07 | | | | 52,752 | | | | 1.20 | | | | 1.24 | | | | 0.92 | | |
Class C | |
Six months ended
12/31/2019* | | | 20.10 | | | | 7.72 | | | | 1,948 | | | | 1.803 | | | | 1.973 | | | | 0.693 | | |
Year ended 6/30/2019 | | | 18.77 | | | | 0.98 | | | | 2,141 | | | | 1.83 | | | | 1.99 | | | | 0.64 | | |
Year ended 6/30/2018 | | | 18.64 | | | | 8.77 | | | | 2,598 | | | | 1.95 | | | | 2.02 | | | | 0.25 | | |
Year ended 6/30/2017 | | | 17.27 | | | | 26.78 | | | | 2,817 | | | | 1.95 | | | | 2.09 | | | | 0.23 | | |
Year ended 6/30/2016 | | | 14.23 | | | | –9.51 | | | | 3,334 | | | | 1.95 | | | | 2.03 | | | | 0.51 | | |
Year ended 6/30/2015 | | | 15.76 | | | | 4.27 | | | | 4,419 | | | | 1.95 | | | | 1.99 | | | | 0.17 | | |
| | | Six Months Ended | | Year Ended June 30, | |
| | | December 31, 2019* | | 2019 | | 2018 | | 2017 | | 2016 | | 2015 | |
Portfolio turnover rate | | | 11 | % | | | 26 | % | | | 28 | % | | | 25 | % | | | 35 | % | | | 38 | % | |
| | | | | Income (loss) from investment operations | | Dividends and distributions | |
Large Cap Value Fund | | Net asset
value,
beginning
of period | | Net
investment
income1 | | Net gains
(losses) on
securities
(both
realized and
unrealized) | | Total from
investment
operations | | Dividends
(from net
investment
income) | | Distributions
(from
capital
gains) | | Total
distributions | |
Class I | |
Six months ended
12/31/2019* | | $ | 33.29 | | | $ | 0.26 | | | $ | 2.44 | | | $ | 2.70 | | | $ | (0.57 | ) | | $ | — | | | $ | (0.57 | ) | |
Year ended 6/30/2019 | | | 33.57 | | | | 0.51 | | | | 0.19 | | | | 0.70 | | | | (0.64 | ) | | | (0.34 | ) | | | (0.98 | ) | |
Year ended 6/30/2018 | | | 31.04 | | | | 0.42 | | | | 2.67 | | | | 3.09 | | | | (0.56 | ) | | | — | | | | (0.56 | ) | |
Year ended 6/30/2017 | | | 25.06 | | | | 0.39 | | | | 6.15 | | | | 6.54 | | | | (0.56 | ) | | | — | | | | (0.56 | ) | |
Year ended 6/30/2016 | | | 27.21 | | | | 0.39 | | | | (2.15 | ) | | | (1.76 | ) | | | (0.39 | ) | | | — | | | | (0.39 | ) | |
Year ended 6/30/2015 | | | 26.65 | | | | 0.35 | | | | 0.99 | | | | 1.34 | | | | (0.78 | ) | | | — | | | | (0.78 | ) | |
Class A | |
Six months ended
12/31/2019* | | | 33.14 | | | | 0.21 | | | | 2.42 | | | | 2.63 | | | | (0.48 | ) | | | — | | | | (0.48 | ) | |
Year ended 6/30/2019 | | | 33.36 | | | | 0.41 | | | | 0.22 | | | | 0.63 | | | | (0.51 | ) | | | (0.34 | ) | | | (0.85 | ) | |
Year ended 6/30/2018 | | | 30.85 | | | | 0.34 | | | | 2.65 | | | | 2.99 | | | | (0.48 | ) | | | — | | | | (0.48 | ) | |
Year ended 6/30/2017 | | | 24.91 | | | | 0.32 | | | | 6.10 | | | | 6.42 | | | | (0.48 | ) | | | — | | | | (0.48 | ) | |
Year ended 6/30/2016 | | | 27.02 | | | | 0.33 | | | | (2.13 | ) | | | (1.80 | ) | | | (0.31 | ) | | | — | | | | (0.31 | ) | |
Year ended 6/30/2015 | | | 26.46 | | | | 0.27 | | | | 0.99 | | | | 1.26 | | | | (0.70 | ) | | | — | | | | (0.70 | ) | |
Class C | |
Six months ended
12/31/2019* | | | 32.59 | | | | 0.10 | | | | 2.38 | | | | 2.48 | | | | (0.21 | ) | | | — | | | | (0.21 | ) | |
Year ended 6/30/2019 | | | 32.68 | | | | 0.17 | | | | 0.25 | | | | 0.42 | | | | (0.17 | ) | | | (0.34 | ) | | | (0.51 | ) | |
Year ended 6/30/2018 | | | 30.16 | | | | 0.08 | | | | 2.61 | | | | 2.69 | | | | (0.17 | ) | | | — | | | | (0.17 | ) | |
Year ended 6/30/2017 | | | 24.29 | | | | 0.10 | | | | 5.94 | | | | 6.04 | | | | (0.17 | ) | | | — | | | | (0.17 | ) | |
Year ended 6/30/2016 | | | 26.30 | | | | 0.13 | | | | (2.06 | ) | | | (1.93 | ) | | | (0.08 | ) | | | — | | | | (0.08 | ) | |
Year ended 6/30/2015 | | | 25.96 | | | | 0.09 | | | | 0.94 | | | | 1.03 | | | | (0.69 | ) | | | — | | | | (0.69 | ) | |
Class Z | |
Period from
9/30/20194 to
12/31/2019 | | | 33.12 | | | | 0.15 | | | | 2.74 | | | | 2.89 | | | | (0.60 | ) | | | — | | | | (0.60 | ) | |
| | | | | Ratios to Average Net Assets | |
Large Cap Value Fund | | Net asset
value, end
of period | | Total
return2 | | Net assets,
end of
period (in
thousands) | | Expenses,
net of
reimbursement/
waiver | | Expenses,
before
reimbursement/
waiver | | Net
investment
income | |
Class I | |
Six months ended
12/31/2019* | | $ | 35.42 | | | | 8.14 | % | | $ | 385,177 | | | | 0.94 | %3 | | | 0.94 | %3 | | | 1.54 | %3 | |
Year ended 6/30/2019 | | | 33.29 | | | | 2.51 | | | | 357,191 | | | | 0.95 | | | | 0.95 | | | | 1.56 | | |
Year ended 6/30/2018 | | | 33.57 | | | | 10.01 | | | | 276,930 | | | | 1.00 | | | | 1.00 | | | | 1.28 | | |
Year ended 6/30/2017 | | | 31.04 | | | | 26.22 | | | | 269,714 | | | | 0.99 | | | | 0.99 | | | | 1.38 | | |
Year ended 6/30/2016 | | | 25.06 | | | | –6.42 | | | | 305,282 | | | | 1.01 | | | | 1.01 | | | | 1.55 | | |
Year ended 6/30/2015 | | | 27.21 | | | | 5.17 | | | | 479,488 | | | | 0.99 | | | | 0.99 | | | | 1.30 | | |
Class A | |
Six months ended
12/31/2019* | | | 35.29 | | | | 7.95 | | | | 115,115 | | | | 1.193 | | | | 1.193 | | | | 1.273 | | |
Year ended 6/30/2019 | | | 33.14 | | | | 2.24 | | | | 116,354 | | | | 1.20 | | | | 1.20 | | | | 1.26 | | |
Year ended 6/30/2018 | | | 33.36 | | | | 9.72 | | | | 131,276 | | | | 1.25 | | | | 1.25 | | | | 1.03 | | |
Year ended 6/30/2017 | | | 30.85 | | | | 25.88 | | | | 135,349 | | | | 1.24 | | | | 1.24 | | | | 1.13 | | |
Year ended 6/30/2016 | | | 24.91 | | | | –6.62 | | | | 142,768 | | | | 1.26 | | | | 1.26 | | | | 1.33 | | |
Year ended 6/30/2015 | | | 27.02 | | | | 4.89 | | | | 191,665 | | | | 1.24 | | | | 1.24 | | | | 1.03 | | |
Class C | |
Six months ended
12/31/2019* | | | 34.86 | | | | 7.63 | | | | 14,644 | | | | 1.883 | | | | 1.883 | | | | 0.603 | | |
Year ended 6/30/2019 | | | 32.59 | | | | 1.49 | | | | 14,948 | | | | 1.95 | | | | 1.95 | | | | 0.55 | | |
Year ended 6/30/2018 | | | 32.68 | | | | 8.92 | | | | 14,161 | | | | 2.00 | | | | 2.00 | | | | 0.26 | | |
Year ended 6/30/2017 | | | 30.16 | | | | 24.92 | | | | 17,250 | | | | 1.99 | | | | 1.99 | | | | 0.38 | | |
Year ended 6/30/2016 | | | 24.29 | | | | –7.34 | | | | 21,038 | | | | 2.01 | | | | 2.01 | | | | 0.53 | | |
Year ended 6/30/2015 | | | 26.30 | | | | 4.10 | | | | 40,862 | | | | 1.99 | | | | 1.99 | | | | 0.34 | | |
Class Z | |
Period from
9/30/20194 to
12/31/2019 | | | 35.41 | | | | 8.73 | | | | 54 | | | | 0.813 | | | | 0.813 | | | | 1.733 | | |
| | | Six Months Ended | | Year Ended June 30, | |
| | | December 31, 2019* | | 2019 | | 2018 | | 2017 | | 2016 | | 2015 | |
Portfolio turnover rate | | | 8 | % | | | 23 | % | | | 41 | % | | | 27 | % | | | 39 | % | | | 39 | % | |
1 Net investment income per share has been calculated based on average shares outstanding during the period.
2 Total returns exclude the effects of sales charges. The Fund's investment advisor may have waived a portion of its advisory fee and/or reimbursed a portion of the Fund's expenses. Without such waiver and/or reimbursement, the Fund's performance would have been lower. Returns for periods less than one year are not annualized.
3 Annualized.
4 Commencement of operations.
* Unaudited
The accompanying notes are an integral part of these financial statements.
60
Financial Highlights
The following per share data and ratios have been derived from information provided in the financial statements.
| | | | | Income (loss) from investment operations | | Dividends and distributions | |
Mid-Cap Value Fund | | Net asset
value,
beginning
of period | | Net
investment
income
(loss)1 | | Net gains
(losses) on
securities
(both
realized and
unrealized) | | Total from
investment
operations | | Dividends
(from net
investment
income) | | Distributions
(from
capital
gains) | | Total
distributions | |
Class I | |
Six months ended
12/31/2019* | | $ | 33.10 | | | $ | 0.30 | | | $ | (0.08 | ) | | $ | 0.22 | | | $ | (0.52 | ) | | $ | — | | | $ | (0.52 | ) | |
Year ended 6/30/2019 | | | 39.68 | | | | 0.24 | | | | (5.94 | ) | | | (5.70 | ) | | | (0.33 | ) | | | (0.55 | ) | | | (0.88 | ) | |
Year ended 6/30/2018 | | | 37.13 | | | | 0.11 | | | | 4.96 | | | | 5.07 | | | | (0.15 | ) | | | (2.37 | ) | | | (2.52 | ) | |
Year ended 6/30/2017 | | | 30.55 | | | | 0.10 | | | | 7.05 | | | | 7.15 | | | | (0.11 | ) | | | (0.46 | ) | | | (0.57 | ) | |
Year ended 6/30/2016 | | | 40.43 | | | | 0.25 | | | | (5.54 | ) | | | (5.29 | ) | | | (0.16 | ) | | | (4.43 | ) | | | (4.59 | ) | |
Year ended 6/30/2015 | | | 45.15 | | | | 0.15 | | | | (0.63 | ) | | | (0.48 | ) | | | (0.27 | ) | | | (3.97 | ) | | | (4.24 | ) | |
Class A | |
Six months ended
12/31/2019* | | | 32.53 | | | | 0.27 | | | | (0.08 | ) | | | 0.19 | | | | (0.38 | ) | | | — | | | | (0.38 | ) | |
Year ended 6/30/2019 | | | 39.03 | | | | 0.15 | | | | (5.82 | ) | | | (5.67 | ) | | | (0.28 | ) | | | (0.55 | ) | | | (0.83 | ) | |
Year ended 6/30/2018 | | | 36.57 | | | | 0.01 | | | | 4.88 | | | | 4.89 | | | | (0.06 | ) | | | (2.37 | ) | | | (2.43 | ) | |
Year ended 6/30/2017 | | | 30.13 | | | | 0.01 | | | | 6.96 | | | | 6.97 | | | | (0.07 | ) | | | (0.46 | ) | | | (0.53 | ) | |
Year ended 6/30/2016 | | | 39.91 | | | | 0.16 | | | | (5.47 | ) | | | (5.31 | ) | | | (0.04 | ) | | | (4.43 | ) | | | (4.47 | ) | |
Year ended 6/30/2015 | | | 44.60 | | | | 0.04 | | | | (0.61 | ) | | | (0.57 | ) | | | (0.15 | ) | | | (3.97 | ) | | | (4.12 | ) | |
Class C | |
Six months ended
12/31/2019* | | | 28.12 | | | | 0.14 | | | | (0.08 | ) | | | 0.06 | | | | (0.04 | ) | | | — | | | | (0.04 | ) | |
Year ended 6/30/2019 | | | 33.93 | | | | (0.10 | ) | | | (5.05 | ) | | | (5.15 | ) | | | (0.11 | ) | | | (0.55 | ) | | | (0.66 | ) | |
Year ended 6/30/2018 | | | 32.26 | | | | (0.24 | ) | | | 4.28 | | | | 4.04 | | | | — | | | | (2.37 | ) | | | (2.37 | ) | |
Year ended 6/30/2017 | | | 26.78 | | | | (0.23 | ) | | | 6.17 | | | | 5.94 | | | | — | | | | (0.46 | ) | | | (0.46 | ) | |
Year ended 6/30/2016 | | | 36.24 | | | | (0.08 | ) | | | (4.95 | ) | | | (5.03 | ) | | | — | | | | (4.43 | ) | | | (4.43 | ) | |
Year ended 6/30/2015 | | | 41.04 | | | | (0.25 | ) | | | (0.58 | ) | | | (0.83 | ) | | | — | | | | (3.97 | ) | | | (3.97 | ) | |
Class Z | |
Period from 9/30/20194
to 12/31/2019 | | | 30.67 | | | | 0.17 | | | | 2.50 | | | | 2.67 | | | | (0.56 | ) | | | — | | | | (0.56 | ) | |
| | | | | Ratios to Average Net Assets | |
Mid-Cap Value Fund | | Net asset
value, end
of period | | Total
return2 | | Net assets,
end of
period (in
thousands) | | Expenses,
net of
reimbursement/
waiver | | Expenses,
before
reimbursement/
waiver | | Net
investment
income
(loss) | |
Class I | |
Six months ended
12/31/2019* | | $ | 32.80 | | | | 0.71 | % | | $ | 801,313 | | | | 1.06 | %3 | | | 1.06 | %3 | | | 1.91 | %3 | |
Year ended 6/30/2019 | | | 33.10 | | | | –14.29 | | | | 1,044,280 | | | | 1.00 | | | | 1.00 | | | | 0.67 | | |
Year ended 6/30/2018 | | | 39.68 | | | | 14.32 | | | | 1,609,002 | | | | 0.99 | | | | 0.99 | | | | 0.28 | | |
Year ended 6/30/2017 | | | 37.13 | | | | 23.37 | | | | 1,675,920 | | | | 1.03 | | | | 1.03 | | | | 0.28 | | |
Year ended 6/30/2016 | | | 30.55 | | | | –13.23 | | | | 1,659,480 | | | | 1.02 | | | | 1.02 | | | | 0.75 | | |
Year ended 6/30/2015 | | | 40.43 | | | | –0.70 | | | | 2,492,532 | | | | 1.00 | | | | 1.00 | | | | 0.35 | | |
Class A | |
Six months ended
12/31/2019* | | | 32.34 | | | | 0.60 | | | | 131,883 | | | | 1.233 | | | | 1.233 | | | | 1.763 | | |
Year ended 6/30/2019 | | | 32.53 | | | | –14.48 | | | | 159,676 | | | | 1.25 | | | | 1.25 | | | | 0.43 | | |
Year ended 6/30/2018 | | | 39.03 | | | | 14.05 | | | | 230,105 | | | | 1.24 | | | | 1.24 | | | | 0.03 | | |
Year ended 6/30/2017 | | | 36.57 | | | | 23.05 | | | | 274,787 | | | | 1.28 | | | | 1.28 | | | | 0.02 | | |
Year ended 6/30/2016 | | | 30.13 | | | | –13.45 | | | | 322,023 | | | | 1.27 | | | | 1.27 | | | | 0.48 | | |
Year ended 6/30/2015 | | | 39.91 | | | | –0.93 | | | | 626,544 | | | | 1.25 | | | | 1.25 | | | | 0.10 | | |
Class C | |
Six months ended
12/31/2019* | | | 28.14 | | | | 0.23 | | | | 17,601 | | | | 1.973 | | | | 1.973 | | | | 1.023 | | |
Year ended 6/30/2019 | | | 28.12 | | | | –15.15 | | | | 24,447 | | | | 2.00 | | | | 2.00 | | | | (0.33 | ) | |
Year ended 6/30/2018 | | | 33.93 | | | | 13.20 | | | | 39,383 | | | | 1.99 | | | | 1.99 | | | | (0.72 | ) | |
Year ended 6/30/2017 | | | 32.26 | | | | 22.13 | | | | 50,612 | | | | 2.03 | | | | 2.03 | | | | (0.74 | ) | |
Year ended 6/30/2016 | | | 26.78 | | | | –14.09 | | | | 64,568 | | | | 2.02 | | | | 2.02 | | | | (0.27 | ) | |
Year ended 6/30/2015 | | | 36.24 | | | | –1.69 | | | | 128,647 | | | | 2.00 | | | | 2.00 | | | | (0.65 | ) | |
Class Z | |
Period from 9/30/20194
to 12/31/2019 | | | 32.78 | | | | 8.73 | | | | 54 | | | | 0.863 | | | | 0.863 | | | | 2.193 | | |
| | | Six Months Ended | | Year Ended June 30, | |
| | | December 31, 2019* | | 2019 | | 2018 | | 2017 | | 2016 | | 2015 | |
Portfolio turnover rate | | | 12 | % | | | 34 | % | | | 32 | % | | | 37 | % | | | 42 | % | | | 54 | % | |
| | | | | Income (loss) from investment operations | | Dividends and distributions | |
Small Cap Value Fund | | Net asset
value,
beginning
of period | | Net
investment
income
(loss)1 | | Net gains
(losses) on
securities
(both
realized and
unrealized) | | Total from
investment
operations | | Dividends
(from net
investment
income) | | Distributions
(from
capital
gains) | | Total
distributions | |
Class I | |
Six months ended
12/31/2019* | | $ | 53.27 | | | $ | 0.23 | | | $ | 3.14 | | | $ | 3.37 | | | $ | (0.48 | ) | | $ | (2.16 | ) | | $ | (2.64 | ) | |
Year ended 6/30/2019 | | | 63.89 | | | | 0.35 | | | | (6.34 | ) | | | (5.99 | ) | | | (0.33 | ) | | | (4.30 | ) | | | (4.63 | ) | |
Year ended 6/30/2018 | | | 59.31 | | | | 0.29 | | | | 7.35 | | | | 7.64 | | | | (0.28 | ) | | | (2.78 | ) | | | (3.06 | ) | |
Year ended 6/30/2017 | | | 46.46 | | | | 0.19 | | | | 12.90 | | | | 13.09 | | | | (0.24 | ) | | | — | | | | (0.24 | ) | |
Year ended 6/30/2016 | | | 61.67 | | | | 0.17 | | | | (9.57 | ) | | | (9.40 | ) | | | (0.16 | ) | | | (5.65 | ) | | | (5.81 | ) | |
Year ended 6/30/2015 | | | 66.62 | | | | 0.27 | | | | 2.30 | | | | 2.57 | | | | (0.13 | ) | | | (7.39 | ) | | | (7.52 | ) | |
Class A | |
Six months ended
12/31/2019* | | | 52.98 | | | | 0.18 | | | | 3.11 | | | | 3.29 | | | | (0.32 | ) | | | (2.16 | ) | | | (2.48 | ) | |
Year ended 6/30/2019 | | | 63.49 | | | | 0.18 | | | | (6.26 | ) | | | (6.08 | ) | | | (0.13 | ) | | | (4.30 | ) | | | (4.43 | ) | |
Year ended 6/30/2018 | | | 58.93 | | | | 0.12 | | | | 7.32 | | | | 7.44 | | | | (0.10 | ) | | | (2.78 | ) | | | (2.88 | ) | |
Year ended 6/30/2017 | | | 46.09 | | | | 0.05 | | | | 12.79 | | | | 12.84 | | | | — | | | | — | | | | — | | |
Year ended 6/30/2016 | | | 61.27 | | | | 0.04 | | | | (9.51 | ) | | | (9.47 | ) | | | (0.06 | ) | | | (5.65 | ) | | | (5.71 | ) | |
Year ended 6/30/2015 | | | 66.26 | | | | 0.12 | | | | 2.28 | | | | 2.40 | | | | — | | | | (7.39 | ) | | | (7.39 | ) | |
Class C | |
Six months ended
12/31/2019* | | | 42.94 | | | | (0.01 | ) | | | 2.51 | | | | 2.50 | | | | — | | | | (2.16 | ) | | | (2.16 | ) | |
Year ended 6/30/2019 | | | 52.65 | | | | (0.21 | ) | | | (5.20 | ) | | | (5.41 | ) | | | — | | | | (4.30 | ) | | | (4.30 | ) | |
Year ended 6/30/2018 | | | 49.60 | | | | (0.28 | ) | | | 6.11 | | | | 5.83 | | | | — | | | | (2.78 | ) | | | (2.78 | ) | |
Year ended 6/30/2017 | | | 39.09 | | | | (0.30 | ) | | | 10.81 | | | | 10.51 | | | | — | | | | — | | | | — | | |
Year ended 6/30/2016 | | | 53.25 | | | | (0.30 | ) | | | (8.21 | ) | | | (8.51 | ) | | | — | | | | (5.65 | ) | | | (5.65 | ) | |
Year ended 6/30/2015 | | | 58.99 | | | | (0.32 | ) | | | 1.97 | | | | 1.65 | | | | — | | | | (7.39 | ) | | | (7.39 | ) | |
Class Z | |
Period from 9/30/20194
to 12/31/2019 | | | 52.15 | | | | 0.17 | | | | 4.34 | | | | 4.51 | | | | (0.53 | ) | | | (2.16 | ) | | | (2.69 | ) | |
| | | | | Ratios to Average Net Assets | |
Small Cap Value Fund | | Net asset
value, end
of period | | Total
return2 | | Net assets,
end of
period (in
thousands) | | Expenses,
net of
reimbursement/
waiver | | Expenses,
before
reimbursement/
waiver | | Net
investment
income
(loss) | |
Class I | |
Six months ended
12/31/2019* | | $ | 54.00 | | | | 6.39 | % | | $ | 656,224 | | | | 1.05 | %3 | | | 1.05 | %3 | | | 0.89 | %3 | |
Year ended 6/30/2019 | | | 53.27 | | | | –8.97 | | | | 670,391 | | | | 1.03 | | | | 1.03 | | | | 0.61 | | |
Year ended 6/30/2018 | | | 63.89 | | | | 13.33 | | | | 715,194 | | | | 1.02 | | | | 1.02 | | | | 0.47 | | |
Year ended 6/30/2017 | | | 59.31 | | | | 28.15 | | | | 669,810 | | | | 1.04 | | | | 1.04 | | | | 0.35 | | |
Year ended 6/30/2016 | | | 46.46 | | | | –15.63 | | | | 699,420 | | | | 1.04 | | | | 1.04 | | | | 0.33 | | |
Year ended 6/30/2015 | | | 61.67 | | | | 4.64 | | | | 951,911 | | | | 1.06 | | | | 1.06 | | | | 0.43 | | |
Class A | |
Six months ended
12/31/2019* | | | 53.79 | | | | 6.28 | | | | 40,604 | | | | 1.253 | | | | 1.253 | | | | 0.683 | | |
Year ended 6/30/2019 | | | 52.98 | | | | –9.20 | | | | 44,240 | | | | 1.28 | | | | 1.28 | | | | 0.32 | | |
Year ended 6/30/2018 | | | 63.49 | | | | 13.05 | | | | 70,928 | | | | 1.27 | | | | 1.27 | | | | 0.20 | | |
Year ended 6/30/2017 | | | 58.93 | | | | 27.83 | | | | 89,795 | | | | 1.29 | | | | 1.29 | | | | 0.09 | | |
Year ended 6/30/2016 | | | 46.09 | | | | –15.83 | | | | 113,335 | | | | 1.29 | | | | 1.29 | | | | 0.07 | | |
Year ended 6/30/2015 | | | 61.27 | | | | 4.37 | | | | 194,587 | | | | 1.31 | | | | 1.31 | | | | 0.19 | | |
Class C | |
Six months ended
12/31/2019* | | | 43.28 | | | | 5.89 | | | | 6,181 | | | | 1.953 | | | | 1.953 | | | | (0.04 | )3 | |
Year ended 6/30/2019 | | | 42.94 | | | | –9.86 | | | | 7,496 | | | | 2.03 | | | | 2.03 | | | | (0.44 | ) | |
Year ended 6/30/2018 | | | 52.65 | | | | 12.21 | | | | 13,824 | | | | 2.02 | | | | 2.02 | | | | (0.55 | ) | |
Year ended 6/30/2017 | | | 49.60 | | | | 26.85 | | | | 17,084 | | | | 2.04 | | | | 2.04 | | | | (0.66 | ) | |
Year ended 6/30/2016 | | | 39.09 | | | | –16.46 | | | | 20,308 | | | | 2.04 | | | | 2.04 | | | | (0.68 | ) | |
Year ended 6/30/2015 | | | 53.25 | | | | 3.60 | | | | 35,172 | | | | 2.06 | | | | 2.06 | | | | (0.58 | ) | |
Class Z | |
Period from 9/30/20194
to 12/31/2019 | | | 53.97 | | | | 8.72 | | | | 54 | | | | 0.853 | | | | 0.853 | | | | 1.253 | | |
| | | Six Months Ended | | Year Ended June 30, | |
| | | December 31, 2019* | | 2019 | | 2018 | | 2017 | | 2016 | | 2015 | |
Portfolio turnover rate | | | 16 | % | | | 40 | % | | | 29 | % | | | 29 | % | | | 45 | % | | | 43 | % | |
1 Net investment income (loss) per share has been calculated based on average shares outstanding during the period.
2 Total returns exclude the effects of sales charges. The Fund's investment advisor may have waived a portion of its advisory fee and/or reimbursed a portion of the Fund's expenses. Without such waiver and/or reimbursement, the Fund's performance would have been lower. Returns for periods less than one year are not annualized.
3 Annualized.
4 Commencement of operations.
* Unaudited
The accompanying notes are an integral part of these financial statements.
61
Financial Highlights
The following per share data and ratios have been derived from information provided in the financial statements.
| | | | | Income (loss) from investment operations | | Dividends and distributions | |
Small Cap Diversified
Value Fund | | Net asset
value,
beginning
of period | | Net
investment
income1 | | Net gains
(losses) on
securities
(both
realized and
unrealized) | | Total from
investment
operations | | Dividends
(from net
investment
income) | | Distributions
(from
capital
gains) | | Total
distributions | |
Class I | |
Six months ended
12/31/2019* | | $ | 10.08 | | | $ | 0.06 | | | $ | 0.72 | | | $ | 0.78 | | | $ | (0.09 | ) | | $ | — | | | $ | (0.09 | ) | |
Year ended 6/30/2019 | | | 12.21 | | | | 0.10 | | | | (1.30 | ) | | | (1.20 | ) | | | (0.08 | ) | | | (0.85 | ) | | | (0.93 | ) | |
Year ended 6/30/2018 | | | 12.06 | | | | 0.10 | | | | 1.85 | | | | 1.95 | | | | (0.05 | ) | | | (1.75 | ) | | | (1.80 | ) | |
Year ended 6/30/2017 | | | 9.12 | | | | 0.09 | | | | 2.94 | | | | 3.03 | | | | (0.09 | ) | | | — | | | | (0.09 | ) | |
Year ended 6/30/2016 | | | 10.01 | | | | 0.06 | | | | (0.66 | ) | | | (0.60 | ) | | | (0.04 | ) | | | (0.25 | ) | | | (0.29 | ) | |
Year ended 6/30/2015 | | | 10.00 | | | | 0.05 | | | | 0.22 | | | | 0.27 | | | | (0.04 | ) | | | (0.22 | ) | | | (0.26 | ) | |
Class A | |
Six months ended
12/31/2019* | | | 10.03 | | | | 0.05 | | | | 0.71 | | | | 0.76 | | | | (0.06 | ) | | | — | | | | (0.06 | ) | |
Year ended 6/30/2019 | | | 12.14 | | | | 0.06 | | | | (1.26 | ) | | | (1.20 | ) | | | (0.06 | ) | | | (0.85 | ) | | | (0.91 | ) | |
Year ended 6/30/2018 | | | 12.01 | | | | 0.07 | | | | 1.84 | | | | 1.91 | | | | (0.03 | ) | | | (1.75 | ) | | | (1.78 | ) | |
Year ended 6/30/2017 | | | 9.09 | | | | 0.06 | | | | 2.93 | | | | 2.99 | | | | (0.07 | ) | | | — | | | | (0.07 | ) | |
Year ended 6/30/2016 | | | 10.00 | | | | 0.05 | | | | (0.68 | ) | | | (0.63 | ) | | | (0.03 | ) | | | (0.25 | ) | | | (0.28 | ) | |
Year ended 6/30/2015 | | | 10.00 | | | | 0.03 | | | | 0.22 | | | | 0.25 | | | | (0.03 | ) | | | (0.22 | ) | | | (0.25 | ) | |
Class Z | |
Period from
9/30/20194 to
12/31/2019 | | | 10.02 | | | | 0.03 | | | | 0.82 | | | | 0.85 | | | | (0.10 | ) | | | — | | | | (0.10 | ) | |
| | | | | Ratios to Average Net Assets | |
Small Cap Diversified
Value Fund | | Net asset
value, end
of period | | Total
return2 | | Net assets,
end of
period (in
thousands) | | Expenses,
net of
reimbursement/
waiver | | Expenses,
before
reimbursement/
waiver | | Net
investment
income | |
Class I | |
Six months ended
12/31/2019* | | $ | 10.77 | | | | 7.78 | % | | $ | 129,483 | | | | 0.83 | %3 | | | 0.90 | %3 | | | 1.22 | %3 | |
Year ended 6/30/2019 | | | 10.08 | | | | –9.23 | | | | 95,405 | | | | 0.90 | | | | 1.06 | | | | 0.91 | | |
Year ended 6/30/2018 | | | 12.21 | | | | 17.48 | | | | 40,128 | | | | 0.90 | | | | 1.45 | | | | 0.80 | | |
Year ended 6/30/2017 | | | 12.06 | | | | 33.26 | | | | 19,265 | | | | 0.90 | | | | 1.70 | | | | 0.86 | | |
Year ended 6/30/2016 | | | 9.12 | | | | –5.80 | | | | 14,446 | | | | 1.25 | | | | 2.13 | | | | 0.72 | | |
Year ended 6/30/2015 | | | 10.01 | | | | 2.93 | | | | 15,337 | | | | 1.25 | | | | 3.75 | | | | 0.48 | | |
Class A | |
Six months ended
12/31/2019* | | | 10.73 | | | | 7.60 | | | | 2,669 | | | | 1.093 | | | | 1.173 | | | | 0.933 | | |
Year ended 6/30/2019 | | | 10.03 | | | | –9.35 | | | | 2,875 | | | | 1.15 | | | | 1.36 | | | | 0.55 | | |
Year ended 6/30/2018 | | | 12.14 | | | | 17.18 | | | | 2,835 | | | | 1.15 | | | | 1.70 | | | | 0.58 | | |
Year ended 6/30/2017 | | | 12.01 | | | | 32.86 | | | | 721 | | | | 1.15 | | | | 1.89 | | | | 0.55 | | |
Year ended 6/30/2016 | | | 9.09 | | | | –6.14 | | | | 232 | | | | 1.50 | | | | 2.38 | | | | 0.53 | | |
Year ended 6/30/2015 | | | 10.00 | | | | 2.71 | | | | 130 | | | | 1.50 | | | | 4.25 | | | | 0.29 | | |
Class Z | |
Period from
9/30/20194 to
12/31/2019 | | | 10.77 | | | | 8.45 | | | | 54 | | | | 0.803 | | | | 0.823 | | | | 1.293 | | |
| | | Six Months Ended | | Year Ended June 30, | |
| | | December 31, 2019* | | 2019 | | 2018 | | 2017 | | 2016 | | 2015 | |
Portfolio turnover rate | | | 37 | % | | | 84 | % | | | 95 | % | | | 58 | % | | | 89 | % | | | 40 | % | |
| | | | | Income (loss) from investment operations | | Dividends and distributions | |
Global Value Fund | | Net asset
value,
beginning
of period | | Net
investment
income1 | | Net gains
(losses) on
securities
(both
realized and
unrealized) | | Total from
investment
operations | | Dividends
(from net
investment
income) | | Distributions
(from
capital
gains) | | Total
distributions | |
Class I | |
Six months ended
12/31/2019* | | $ | 11.55 | | | $ | 0.08 | | | $ | 0.83 | | | $ | 0.91 | | | $ | (0.13 | ) | | $ | (0.18 | ) | | $ | (0.31 | ) | |
Year ended 6/30/2019 | | | 13.30 | | | | 0.23 | | | | (0.94 | ) | | | (0.71 | ) | | | (0.14 | ) | | | (0.90 | ) | | | (1.04 | ) | |
Year ended 6/30/2018 | | | 12.82 | | | | 0.11 | | | | 1.09 | | | | 1.20 | | | | (0.13 | ) | | | (0.59 | ) | | | (0.72 | ) | |
Year ended 6/30/2017 | | | 10.10 | | | | 0.12 | | | | 2.70 | | | | 2.82 | | | | (0.10 | ) | | | — | | | | (0.10 | ) | |
Year ended 6/30/2016 | | | 11.93 | | | | 0.13 | | | | (1.23 | ) | | | (1.10 | ) | | | (0.12 | ) | | | (0.61 | ) | | | (0.73 | ) | |
Year ended 6/30/2015 | | | 13.31 | | | | 0.14 | | | | (0.46 | ) | | | (0.32 | ) | | | (0.30 | ) | | | (0.76 | ) | | | (1.06 | ) | |
Class A | |
Six months ended
12/31/2019* | | | 11.55 | | | | 0.07 | | | | 0.83 | | | | 0.90 | | | | (0.11 | ) | | | (0.18 | ) | | | (0.29 | ) | |
Year ended 6/30/2019 | | | 13.28 | | | | 0.09 | | | | (0.83 | ) | | | (0.74 | ) | | | (0.09 | ) | | | (0.90 | ) | | | (0.99 | ) | |
Year ended 6/30/2018 | | | 12.80 | | | | 0.07 | | | | 1.10 | | | | 1.17 | | | | (0.10 | ) | | | (0.59 | ) | | | (0.69 | ) | |
Year ended 6/30/2017 | | | 10.09 | | | | 0.14 | | | | 2.65 | | | | 2.79 | | | | (0.08 | ) | | | — | | | | (0.08 | ) | |
Year ended 6/30/2016 | | | 11.91 | | | | 0.10 | | | | (1.23 | ) | | | (1.13 | ) | | | (0.08 | ) | | | (0.61 | ) | | | (0.69 | ) | |
Year ended 6/30/2015 | | | 13.29 | | | | 0.10 | | | | (0.45 | ) | | | (0.35 | ) | | | (0.27 | ) | | | (0.76 | ) | | | (1.03 | ) | |
| | | | | Ratios to Average Net Assets | |
Global Value Fund | | Net asset
value, end
of period | | Total
return2 | | Net assets,
end of
period (in
thousands) | | Expenses,
net of
reimbursement/
waiver | | Expenses,
before
reimbursement/
waiver | | Net
investment
income | |
Class I | |
Six months ended
12/31/2019* | | $ | 12.15 | | | | 7.91 | % | | $ | 40,076 | | | | 0.95 | %3 | | | 1.27 | %3 | | | 1.43 | %3 | |
Year ended 6/30/2019 | | | 11.55 | | | | –4.57 | | | | 39,749 | | | | 0.96 | | | | 1.62 | | | | 2.02 | | |
Year ended 6/30/2018 | | | 13.30 | | | | 9.59 | | | | 8,987 | | | | 1.10 | | | | 2.87 | | | | 0.83 | | |
Year ended 6/30/2017 | | | 12.82 | | | | 27.93 | | | | 7,694 | | | | 1.10 | | | | 3.37 | | | | 1.00 | | |
Year ended 6/30/2016 | | | 10.10 | | | | –9.25 | | | | 5,199 | | | | 1.10 | | | | 4.14 | | | | 1.25 | | |
Year ended 6/30/2015 | | | 11.93 | | | | –1.98 | | | | 6,144 | | | | 1.10 | | | | 4.34 | | | | 1.11 | | |
Class A | |
Six months ended
12/31/2019* | | | 12.16 | | | | 7.80 | | | | 220 | | | | 1.203 | | | | 1.523 | | | | 1.143 | | |
Year ended 6/30/2019 | | | 11.55 | | | | –4.85 | | | | 238 | | | | 1.24 | | | | 2.64 | | | | 0.72 | | |
Year ended 6/30/2018 | | | 13.28 | | | | 9.36 | | | | 732 | | | | 1.35 | | | | 3.12 | | | | 0.55 | | |
Year ended 6/30/2017 | | | 12.80 | | | | 27.69 | | | | 436 | | | | 1.35 | | | | 3.37 | | | | 1.19 | | |
Year ended 6/30/2016 | | | 10.09 | | | | –9.47 | | | | 100 | | | | 1.35 | | | | 4.39 | | | | 0.96 | | |
Year ended 6/30/2015 | | | 11.91 | | | | –2.22 | | | | 110 | | | | 1.35 | | | | 4.77 | | | | 0.79 | | |
| | | Six Months Ended | | Year Ended June 30, | |
| | | December 31, 2019* | | 2019 | | 2018 | | 2017 | | 2016 | | 2015 | |
Portfolio turnover rate | | | 14 | % | | | 36 | % | | | 43 | % | | | 38 | % | | | 52 | % | | | 42 | % | |
1 Net investment income per share has been calculated based on average shares outstanding during the period.
2 Total returns exclude the effects of sales charges. The Fund's investment advisor may have waived a portion of its advisory fee and/or reimbursed a portion of the Fund's expenses. Without such waiver and/or reimbursement, the Fund's performance would have been lower. Returns for periods less than one year are not annualized.
3 Annualized.
4 Commencement of operations.
* Unaudited
The accompanying notes are an integral part of these financial statements.
62
Financial Highlights
The following per share data and ratios have been derived from information provided in the financial statements.
| | | | | Income (loss) from investment operations | | Dividends and distributions | |
International Value Fund | | Net asset
value,
beginning
of period | | Net
investment
income1 | | Net gains
(losses) on
securities
(both
realized and
unrealized) | | Total from
investment
operations | | Dividends
(from net
investment
income) | | Distributions
(from
capital
gains) | | Total
distributions | |
Class I | |
Six months ended
12/31/2019* | | $ | 9.77 | | | $ | 0.08 | | | $ | 0.94 | | | $ | 1.02 | | | $ | (0.19 | ) | | $ | (0.16 | ) | | $ | (0.35 | ) | |
Year ended 6/30/2019 | | | 11.57 | | | | 0.19 | | | | (1.27 | ) | | | (1.08 | ) | | | (0.14 | ) | | | (0.58 | ) | | | (0.72 | ) | |
Year ended 6/30/2018 | | | 11.85 | | | | 0.11 | | | | 0.31 | | | | 0.42 | | | | (0.13 | ) | | | (0.57 | ) | | | (0.70 | ) | |
Year ended 6/30/2017 | | | 9.76 | | | | 0.12 | | | | 2.38 | | | | 2.50 | | | | (0.17 | ) | | | (0.24 | ) | | | (0.41 | ) | |
Period from
12/31/20154 to
6/30/2016 | | | 10.00 | | | | 0.16 | | | | (0.40 | ) | | | (0.24 | ) | | | — | | | | — | | | | — | | |
| | | | | Ratios to Average Net Assets | |
International Value Fund | | Net asset
value, end
of period | | Total
return2 | | Net assets,
end of
period (in
thousands) | | Expenses,
net of
reimbursement/
waiver | | Expenses,
before
reimbursement/
waiver | | Net
investment
income | |
Class I | |
Six months ended
12/31/2019* | | $ | 10.44 | | | | 10.51 | % | | $ | 2,579 | | | | 0.95 | %3 | | | 5.76 | %3 | | | 1.60 | %3 | |
Year ended 6/30/2019 | | | 9.77 | | | | –9.04 | | | | 2,334 | | | | 0.99 | | | | 5.94 | | | | 1.85 | | |
Year ended 6/30/2018 | | | 11.57 | | | | 3.50 | | | | 2,543 | | | | 1.15 | | | | 6.01 | | | | 0.90 | | |
Year ended 6/30/2017 | | | 11.85 | | | | 26.14 | | | | 2,422 | | | | 1.15 | | | | 7.36 | | | | 1.12 | | |
Period from
12/31/20154 to
6/30/2016 | | | 9.76 | | | | –2.40 | | | | 1,806 | | | | 1.153 | | | | 12.673 | | | | 3.173 | | |
| | | Six Months Ended
December 31, | |
Year Ended June 30, | | Period December 31, 20154
through June 30, | |
| | | 2019* | | 2019 | | 2018 | | 2017 | | 2016 | |
Portfolio turnover rate | | | 12 | % | | | 42 | % | | | 33 | % | | | 34 | % | | | 17 | % | |
| | | | | Income (loss) from investment operations | | Dividends and distributions | |
Value Opportunities
Fund | | Net asset
value,
beginning
of period | | Net
investment
income1 | | Net gains
(losses) on
securities
(both
realized and
unrealized) | | Total from
investment
operations | | Dividends
(from net
investment
income) | | Distributions
(from
capital
gains) | | Total
distributions | |
Class I | |
Six months ended
12/31/2019* | | $ | 28.08 | | | $ | 0.27 | | | $ | 1.31 | | | $ | 1.58 | | | $ | (0.32 | ) | | $ | (0.36 | ) | | $ | (0.68 | ) | |
Year ended 6/30/2019 | | | 30.38 | | | | 0.30 | | | | 0.09 | | | | 0.39 | | | | (0.31 | ) | | | (2.38 | ) | | | (2.69 | ) | |
Year ended 6/30/2018 | | | 27.99 | | | | 0.40 | | | | 2.93 | | | | 3.33 | | | | (0.53 | ) | | | (0.41 | ) | | | (0.94 | ) | |
Year ended 6/30/2017 | | | 22.21 | | | | 0.38 | | | | 5.99 | | | | 6.37 | | | | (0.59 | ) | | | — | | | | (0.59 | ) | |
Year ended 6/30/2016 | | | 29.13 | | | | 0.69 | | | | (3.68 | ) | | | (2.99 | ) | | | (0.49 | ) | | | (3.44 | ) | | | (3.93 | ) | |
Year ended 6/30/2015 | | | 29.88 | | | | 0.41 | | | | 1.35 | | | | 1.76 | | | | (0.42 | ) | | | (2.09 | ) | | | (2.51 | ) | |
Class A | |
Six months ended
12/31/2019* | | | 28.12 | | | | 0.24 | | | | 1.31 | | | | 1.55 | | | | (0.24 | ) | | | (0.36 | ) | | | (0.60 | ) | |
Year ended 6/30/2019 | | | 30.40 | | | | 0.22 | | | | 0.10 | | | | 0.32 | | | | (0.22 | ) | | | (2.38 | ) | | | (2.60 | ) | |
Year ended 6/30/2018 | | | 28.00 | | | | 0.31 | | | | 2.95 | | | | 3.26 | | | | (0.45 | ) | | | (0.41 | ) | | | (0.86 | ) | |
Year ended 6/30/2017 | | | 22.21 | | | | 0.31 | | | | 5.99 | | | | 6.30 | | | | (0.51 | ) | | | — | | | | (0.51 | ) | |
Year ended 6/30/2016 | | | 29.13 | | | | 0.63 | | | | (3.69 | ) | | | (3.06 | ) | | | (0.42 | ) | | | (3.44 | ) | | | (3.86 | ) | |
Year ended 6/30/2015 | | | 29.88 | | | | 0.34 | | | | 1.36 | | | | 1.70 | | | | (0.36 | ) | | | (2.09 | ) | | | (2.45 | ) | |
Class C | |
Six months ended
12/31/2019* | | | 25.94 | | | | 0.13 | | | | 1.20 | | | | 1.33 | | | | (0.04 | ) | | | (0.36 | ) | | | (0.40 | ) | |
Year ended 6/30/2019 | | | 28.22 | | | | 0.01 | | | | 0.10 | | | | 0.11 | | | | (0.01 | ) | | | (2.38 | ) | | | (2.39 | ) | |
Year ended 6/30/2018 | | | 26.04 | | | | 0.08 | | | | 2.74 | | | | 2.82 | | | | (0.23 | ) | | | (0.41 | ) | | | (0.64 | ) | |
Year ended 6/30/2017 | | | 20.68 | | | | 0.11 | | | | 5.57 | | | | 5.68 | | | | (0.32 | ) | | | — | | | | (0.32 | ) | |
Year ended 6/30/2016 | | | 27.41 | | | | 0.42 | | | | (3.47 | ) | | | (3.05 | ) | | | (0.24 | ) | | | (3.44 | ) | | | (3.68 | ) | |
Year ended 6/30/2015 | | | 28.31 | | | | 0.12 | | | | 1.27 | | | | 1.39 | | | | (0.20 | ) | | | (2.09 | ) | | | (2.29 | ) | |
Class Z | |
Period from
9/30/20194 to
12/31/2019 | | | 27.79 | | | | 0.14 | | | | 1.74 | | | | 1.88 | | | | (0.34 | ) | | | (0.36 | ) | | | (0.70 | ) | |
| | | | | Ratios to Average Net Assets | |
Value Opportunities
Fund | | Net asset
value, end
of period | | Total
return2 | | Net assets,
end of
period (in
thousands) | | Expenses,
net of
reimbursement/
waiver | | Expenses,
before
reimbursement/
waiver | | Net
investment
income | |
Class I | |
Six months ended
12/31/2019* | | $ | 28.98 | | | | 5.67 | % | | $ | 595,394 | | | | 0.96 | %3 | | | 0.96 | %3 | | | 1.93 | %3 | |
Year ended 6/30/2019 | | | 28.08 | | | | 2.45 | | | | 588,097 | | | | 0.96 | | | | 0.96 | | | | 1.05 | | |
Year ended 6/30/2018 | | | 30.38 | | | | 12.11 | | | | 453,184 | | | | 0.97 | | | | 0.97 | | | | 1.36 | | |
Year ended 6/30/2017 | | | 27.99 | | | | 28.79 | | | | 347,924 | | | | 0.99 | | | | 0.99 | | | | 1.46 | | |
Year ended 6/30/2016 | | | 22.21 | | | | –10.48 | | | | 259,421 | | | | 1.00 | | | | 1.00 | | | | 2.80 | | |
Year ended 6/30/2015 | | | 29.13 | | | | 6.75 | | | | 363,363 | | | | 0.96 | | | | 0.96 | | | | 1.42 | | |
Class A | |
Six months ended
12/31/2019* | | | 29.07 | | | | 5.55 | | | | 121,474 | | | | 1.213 | | | | 1.213 | | | | 1.683 | | |
Year ended 6/30/2019 | | | 28.12 | | | | 2.18 | | | | 131,050 | | | | 1.21 | | | | 1.21 | | | | 0.77 | | |
Year ended 6/30/2018 | | | 30.40 | | | | 11.84 | | | | 136,325 | | | | 1.22 | | | | 1.22 | | | | 1.07 | | |
Year ended 6/30/2017 | | | 28.00 | | | | 28.47 | | | | 136,525 | | | | 1.24 | | | | 1.24 | | | | 1.21 | | |
Year ended 6/30/2016 | | | 22.21 | | | | –10.71 | | | | 132,870 | | | | 1.25 | | | | 1.25 | | | | 2.55 | | |
Year ended 6/30/2015 | | | 29.13 | | | | 6.47 | | | | 201,477 | | | | 1.21 | | | | 1.21 | | | | 1.19 | | |
Class C | |
Six months ended
12/31/2019* | | | 26.87 | | | | 5.16 | | | | 43,775 | | | | 1.913 | | | | 1.913 | | | | 0.993 | | |
Year ended 6/30/2019 | | | 25.94 | | | | 1.44 | | | | 47,021 | | | | 1.96 | | | | 1.96 | | | | 0.02 | | |
Year ended 6/30/2018 | | | 28.22 | | | | 10.99 | | | | 49,624 | | | | 1.97 | | | | 1.97 | | | | 0.30 | | |
Year ended 6/30/2017 | | | 26.04 | | | | 27.53 | | | | 57,953 | | | | 1.99 | | | | 1.99 | | | | 0.46 | | |
Year ended 6/30/2016 | | | 20.68 | | | | –11.37 | | | | 63,637 | | | | 2.00 | | | | 2.00 | | | | 1.84 | | |
Year ended 6/30/2015 | | | 27.41 | | | | 5.65 | | | | 76,647 | | | | 1.96 | | | | 1.96 | | | | 0.43 | | |
Class Z | |
Period from
9/30/20194 to
12/31/2019 | | | 28.97 | | | | 6.80 | | | | 20,755 | | | | 0.843 | | | | 0.843 | | | | 1.933 | | |
| | | Six Months Ended | | Year Ended June 30, | |
| | | December 31, 2019* | | 2019 | | 2018 | | 2017 | | 2016 | | 2015 | |
Portfolio turnover rate | | | 16 | % | | | 60 | % | | | 55 | % | | | 83 | % | | | 62 | % | | | 101 | % | |
1 Net investment income per share has been calculated based on average shares outstanding during the period.
2 Total returns exclude the effects of sales charges. The Fund's investment advisor may have waived a portion of its advisory fee and/or reimbursed a portion of the Fund's expenses. Without such waiver and/or reimbursement, the Fund's performance would have been lower. Returns for periods less than one year are not annualized.
3 Annualized.
4 Commencement of operations.
* Unaudited
The accompanying notes are an integral part of these financial statements.
63
Financial Highlights
The following per share data and ratios have been derived from information provided in the financial statements.
| | | | | Income (loss) from investment operations | | Dividends and distributions | |
Capital Income Fund | | Net asset
value,
beginning
of period | | Net
investment
income1 | | Net gains
(losses) on
securities
(both
realized and
unrealized) | | Total from
investment
operations | | Dividends
(from net
investment
income) | | Distributions
(from
capital
gains) | | Total
distributions | |
Class I | |
Six months ended
12/31/2019* | | $ | 12.03 | | | $ | 0.22 | | | $ | 0.25 | | | $ | 0.47 | | | $ | (0.27 | ) | | $ | — | | | $ | (0.27 | ) | |
Year ended 6/30/2019 | | | 12.84 | | | | 0.41 | | | | (0.81 | ) | | | (0.40 | ) | | | (0.41 | ) | | | — | | | | (0.41 | ) | |
Year ended 6/30/2018 | | | 12.51 | | | | 0.45 | | | | 0.37 | | | | 0.82 | | | | (0.49 | ) | | | — | | | | (0.49 | ) | |
Year ended 6/30/2017 | | | 10.56 | | | | 0.45 | | | | 2.00 | | | | 2.45 | | | | (0.50 | ) | | | — | | | | (0.50 | ) | |
Year ended 6/30/2016 | | | 12.22 | | | | 0.51 | | | | (1.13 | ) | | | (0.62 | ) | | | (0.54 | ) | | | (0.50 | ) | | | (1.04 | ) | |
Year ended 6/30/2015 | | | 12.85 | | | | 0.47 | | | | (0.38 | ) | | | 0.09 | | | | (0.52 | ) | | | (0.20 | ) | | | (0.72 | ) | |
Class A | |
Six months ended
12/31/2019* | | | 12.56 | | | | 0.22 | | | | 0.27 | | | | 0.49 | | | | (0.26 | ) | | | — | | | | (0.26 | ) | |
Year ended 6/30/2019 | | | 13.36 | | | | 0.40 | | | | (0.83 | ) | | | (0.43 | ) | | | (0.37 | ) | | | — | | | | (0.37 | ) | |
Year ended 6/30/2018 | | | 13.01 | | | | 0.43 | | | | 0.38 | | | | 0.81 | | | | (0.46 | ) | | | — | | | | (0.46 | ) | |
Year ended 6/30/2017 | | | 10.97 | | | | 0.44 | | | | 2.07 | | | | 2.51 | | | | (0.47 | ) | | | — | | | | (0.47 | ) | |
Year ended 6/30/2016 | | | 12.65 | | | | 0.50 | | | | (1.17 | ) | | | (0.67 | ) | | | (0.51 | ) | | | (0.50 | ) | | | (1.01 | ) | |
Year ended 6/30/2015 | | | 13.24 | | | | 0.44 | | | | (0.35 | ) | | | 0.09 | | | | (0.48 | ) | | | (0.20 | ) | | | (0.68 | ) | |
| | | | | Ratios to Average Net Assets | |
Capital Income Fund | | Net asset
value, end
of period | | Total
return2 | | Net assets,
end of
period (in
thousands) | | Expenses,
net of
reimbursement/
waiver | | Expenses,
before
reimbursement/
waiver | | Net
investment
income | |
Class I | |
Six months ended
12/31/2019* | | $ | 12.23 | | | | 3.98 | % | | $ | 10,769 | | | | 0.80 | %3 | | | 1.50 | %3 | | | 3.74 | %3 | |
Year ended 6/30/2019 | | | 12.03 | | | | –3.13 | | | | 13,804 | | | | 0.80 | | | | 1.35 | | | | 3.37 | | |
Year ended 6/30/2018 | | | 12.84 | | | | 6.71 | | | | 20,005 | | | | 0.80 | | | | 1.26 | | | | 3.55 | | |
Year ended 6/30/2017 | | | 12.51 | | | | 23.54 | | | | 20,582 | | | | 0.80 | | | | 1.27 | | | | 3.83 | | |
Year ended 6/30/2016 | | | 10.56 | | | | –4.77 | | | | 20,873 | | | | 0.80 | | | | 1.18 | | | | 4.63 | | |
Year ended 6/30/2015 | | | 12.22 | | | | 0.69 | | | | 33,958 | | | | 0.80 | | | | 1.05 | | | | 3.75 | | |
Class A | |
Six months ended
12/31/2019* | | | 12.79 | | | | 3.93 | | | | 11,690 | | | | 1.053 | | | | 1.793 | | | | 3.493 | | |
Year ended 6/30/2019 | | | 12.56 | | | | –3.17 | | | | 12,890 | | | | 1.05 | | | | 1.60 | | | | 3.16 | | |
Year ended 6/30/2018 | | | 13.36 | | | | 6.34 | | | | 16,810 | | | | 1.05 | | | | 1.51 | | | | 3.28 | | |
Year ended 6/30/2017 | | | 13.01 | | | | 23.17 | | | | 21,171 | | | | 1.05 | | | | 1.52 | | | | 3.56 | | |
Year ended 6/30/2016 | | | 10.97 | | | | –4.99 | | | | 17,309 | | | | 1.05 | | | | 1.43 | | | | 4.36 | | |
Year ended 6/30/2015 | | | 12.65 | | | | 0.73 | | | | 42,398 | | | | 1.05 | | | | 1.30 | | | | 3.39 | | |
| | | Six Months Ended | | Year Ended June 30, | |
| | | December 31, 2019* | | 2019 | | 2018 | | 2017 | | 2016 | | 2015 | |
Portfolio turnover rate | | | 12 | % | | | 43 | % | | | 46 | % | | | 71 | % | | | 93 | % | | | 62 | % | |
| | | | | Income (loss) from investment operations | | Dividends and distributions | |
High Yield Fund | | Net asset
value,
beginning
of period | | Net
investment
income1 | | Net gains
(losses) on
securities
(both
realized and
unrealized) | | Total from
investment
operations | | Dividends
(from net
investment
income) | | Distributions
(from
capital
gains) | | Total
distributions | |
Class I | |
Six months ended
12/31/2019* | | $ | 11.69 | | | $ | 0.34 | | | $ | (0.16 | )4 | | $ | 0.18 | | | $ | (0.34 | ) | | $ | — | | | $ | (0.34 | ) | |
Year ended 6/30/2019 | | | 11.90 | | | | 0.69 | | | | (0.21 | )4 | | | 0.48 | | | | (0.69 | ) | | | — | | | | (0.69 | ) | |
Year ended 6/30/2018 | | | 12.26 | | | | 0.72 | | | | (0.37 | )4 | | | 0.35 | | | | (0.71 | ) | | | — | | | | (0.71 | ) | |
Year ended 6/30/2017 | | | 11.47 | | | | 0.75 | | | | 0.794 | | | | 1.54 | | | | (0.75 | ) | | | — | | | | (0.75 | ) | |
Year ended 6/30/2016 | | | 12.51 | | | | 0.76 | | | | (0.94 | )4 | | | (0.18 | ) | | | (0.77 | ) | | | (0.09 | ) | | | (0.86 | ) | |
Year ended 6/30/2015 | | | 13.37 | | | | 0.70 | | | | (0.75 | )4 | | | (0.05 | ) | | | (0.71 | ) | | | (0.10 | ) | | | (0.81 | ) | |
Class A | |
Six months ended
12/31/2019* | | | 11.62 | | | | 0.33 | | | | (0.16 | )4 | | | 0.17 | | | | (0.33 | ) | | | — | | | | (0.33 | ) | |
Year ended 6/30/2019 | | | 11.83 | | | | 0.65 | | | | (0.20 | )4 | | | 0.45 | | | | (0.66 | ) | | | — | | | | (0.66 | ) | |
Year ended 6/30/2018 | | | 12.18 | | | | 0.69 | | | | (0.37 | )5 | | | 0.32 | | | | (0.67 | ) | | | — | | | | (0.67 | ) | |
Year ended 6/30/2017 | | | 11.40 | | | | 0.72 | | | | 0.784 | | | | 1.50 | | | | (0.72 | ) | | | — | | | | (0.72 | ) | |
Year ended 6/30/2016 | | | 12.43 | | | | 0.73 | | | | (0.94 | )4 | | | (0.21 | ) | | | (0.73 | ) | | | (0.09 | ) | | | (0.82 | ) | |
Year ended 6/30/2015 | | | 13.29 | | | | 0.67 | | | | (0.75 | )5 | | | (0.08 | ) | | | (0.68 | ) | | | (0.10 | ) | | | (0.78 | ) | |
Class C | |
Six months ended
12/31/2019* | | | 11.68 | | | | 0.29 | | | | (0.16 | ) | | | 0.13 | | | | (0.29 | ) | | | — | | | | (0.29 | ) | |
Year ended 6/30/2019 | | | 11.89 | | | | 0.57 | | | | (0.21 | ) | | | 0.36 | | | | (0.57 | ) | | | — | | | | (0.57 | ) | |
Year ended 6/30/2018 | | | 12.26 | | | | 0.60 | | | | (0.38 | )4 | | | 0.22 | | | | (0.59 | ) | | | — | | | | (0.59 | ) | |
Year ended 6/30/2017 | | | 11.47 | | | | 0.63 | | | | 0.794 | | | | 1.42 | | | | (0.63 | ) | | | — | | | | (0.63 | ) | |
Year ended 6/30/2016 | | | 12.50 | | | | 0.65 | | | | (0.94 | )6 | | | (0.29 | ) | | | (0.65 | ) | | | (0.09 | ) | | | (0.74 | ) | |
Year ended 6/30/2015 | | | 13.36 | | | | 0.58 | | | | (0.76 | )4 | | | (0.18 | ) | | | (0.58 | ) | | | (0.10 | ) | | | (0.68 | ) | |
Class Z | |
Six months ended
12/31/2019* | | | 11.70 | | | | 0.35 | | | | (0.16 | )4 | | | 0.19 | | | | (0.35 | ) | | | — | | | | (0.35 | ) | |
Year ended 6/30/2019 | | | 11.90 | | | | 0.70 | | | | (0.20 | ) | | | 0.50 | | | | (0.70 | ) | | | — | | | | (0.70 | ) | |
Period from 3/29/20187
to 6/30/2018 | | | 12.00 | | | | 0.18 | | | | (0.11 | ) | | | 0.07 | | | | (0.17 | ) | | | — | | | | (0.17 | ) | |
| | | | | Ratios to Average Net Assets | |
High Yield Fund | | Net asset
value, end
of period | | Total
return2 | | Net assets,
end of
period (in
thousands) | | Expenses,
net of
reimbursement/
waiver | | Expenses,
before
reimbursement/
waiver | | Net
investment
income | |
Class I | |
Six months ended
12/31/2019* | | $ | 11.53 | | | | 1.62 | % | | $ | 1,696,947 | | | | 0.70 | %3 | | | 0.75 | %3 | | | 5.95 | %3 | |
Year ended 6/30/2019 | | | 11.69 | | | | 4.19 | | | | 1,825,782 | | | | 0.70 | | | | 0.75 | | | | 5.87 | | |
Year ended 6/30/2018 | | | 11.90 | | | | 2.87 | | | | 1,918,320 | | | | 0.70 | | | | 0.74 | | | | 5.93 | | |
Year ended 6/30/2017 | | | 12.26 | | | | 13.75 | | | | 2,091,104 | | | | 0.70 | | | | 0.74 | | | | 6.22 | | |
Year ended 6/30/2016 | | | 11.47 | | | | –1.12 | | | | 1,884,613 | | | | 0.70 | | | | 0.74 | | | | 6.59 | | |
Year ended 6/30/2015 | | | 12.51 | | | | –0.26 | | | | 2,060,504 | | | | 0.70 | | | | 0.73 | | | | 5.56 | | |
Class A | |
Six months ended
12/31/2019* | | | 11.46 | | | | 1.48 | | | | 196,151 | | | | 0.953 | | | | 1.023 | | | | 5.673 | | |
Year ended 6/30/2019 | | | 11.62 | | | | 3.92 | | | | 303,367 | | | | 0.95 | | | | 1.00 | | | | 5.62 | | |
Year ended 6/30/2018 | | | 11.83 | | | | 2.68 | | | | 466,960 | | | | 0.95 | | | | 0.99 | | | | 5.69 | | |
Year ended 6/30/2017 | | | 12.18 | | | | 13.42 | | | | 566,806 | | | | 0.95 | | | | 0.99 | | | | 5.99 | | |
Year ended 6/30/2016 | | | 11.40 | | | | –1.34 | | | | 603,081 | | | | 0.95 | | | | 0.99 | | | | 6.35 | | |
Year ended 6/30/2015 | | | 12.43 | | | | –0.54 | | | | 682,129 | | | | 0.95 | | | | 0.98 | | | | 5.31 | | |
Class C | |
Six months ended
12/31/2019* | | | 11.52 | | | | 1.14 | | | | 3,470 | | | | 1.643 | | | | 1.683 | | | | 5.013 | | |
Year ended 6/30/2019 | | | 11.68 | | | | 3.15 | | | | 3,599 | | | | 1.70 | | | | 1.75 | | | | 4.88 | | |
Year ended 6/30/2018 | | | 11.89 | | | | 1.76 | | | | 3,380 | | | | 1.70 | | | | 1.74 | | | | 4.93 | | |
Year ended 6/30/2017 | | | 12.26 | | | | 12.62 | | | | 3,010 | | | | 1.70 | | | | 1.74 | | | | 5.22 | | |
Year ended 6/30/2016 | | | 11.47 | | | | –2.02 | | | | 2,737 | | | | 1.70 | | | | 1.74 | | | | 5.61 | | |
Year ended 6/30/2015 | | | 12.50 | | | | –1.25 | | | | 3,581 | | | | 1.70 | | | | 1.73 | | | | 4.53 | | |
Class Z | |
Six months ended
12/31/2019* | | | 11.54 | | | | 1.67 | | | | 464,249 | | | | 0.603 | | | | 0.643 | | | | 6.053 | | |
Year ended 6/30/2019 | | | 11.70 | | | | 4.38 | | | | 401,268 | | | | 0.60 | | | | 0.65 | | | | 5.99 | | |
Period from 3/29/20187
to 6/30/2018 | | | 11.90 | | | | 0.59 | | | | 328,769 | | | | 0.603 | | | | 0.703 | | | | 6.543 | | |
| | | Six Months Ended | | Year Ended June 30, | |
| | | December 31, 2019* | | 2019 | | 2018 | | 2017 | | 2016 | | 2015 | |
Portfolio turnover rate | | | 23 | % | | | 41 | % | | | 38 | % | | | 46 | % | | | 45 | % | | | 44 | % | |
1 Net investment income per share has been calculated based on average shares outstanding during the period.
2 Total returns exclude the effects of sales charges. The Fund's investment advisor may have waived a portion of its advisory fee and/or reimbursed a portion of the Fund's expenses. Without such waiver and/or reimbursement, the Fund's performance would have been lower. Returns for periods less than one year are not annualized.
3 Annualized.
4 Redemption fees per share were less than $0.005.
5 Includes redemption fees per share of $0.01.
6 Includes redemption fees per share of $0.02.
7 Commencement of operations.
* Unaudited
The accompanying notes are an integral part of these financial statements.
64
Notes to the Financial Statements
DECEMBER 31, 2019 (UNAUDITED)
NOTE 1.
Organization. Hotchkis & Wiley Funds (the "Trust") is registered under the Investment Company Act of 1940, as amended (the "1940 Act"), as an open-end, management investment company. The Trust was organized as a Delaware statutory trust on July 23, 2001 and consists of ten series. The Hotchkis & Wiley Diversified Value Fund, the Hotchkis & Wiley Large Cap Value Fund, the Hotchkis & Wiley Mid-Cap Value Fund, the Hotchkis & Wiley Small Cap Value Fund, the Hotchkis & Wiley Small Cap Diversified Value Fund, the Hotchkis & Wiley Global Value Fund, the Hotchkis & Wiley International Value Fund, the Hotchkis & Wiley Capital Income Fund and the Hotchkis & Wiley High Yield Fund (collectively, the "H&W Funds") are each a diversified series and the Hotchkis & Wiley Value Opportunities Fund (together with the H&W Funds, hereafter referred to as the "Funds") is a non-diversified series of the Trust. The Trust was organized to acquire the assets and liabilities of the Mercury HW Large Cap Value Fund, the Mercury HW Mid-Cap Value Fund and the Mercury HW Small Cap Value Fund (the "Mercury HW Funds"). On February 4, 2002, the Mercury HW Funds were reorganized into the Trust through a non-taxable exchange. On August 28, 2009, the Hotchkis & Wiley Core Value Fund was renamed the Hotchkis & Wiley Diversified Value Fund and the Hotchkis & Wiley All Cap Value Fund was renamed the Hotchkis & Wiley Value Opportunities Fund.
The Diversified Value Fund, Large Cap Value Fund, Mid-Cap Value Fund, Small Cap Value Fund, Small Cap Diversified Value Fund, Global Value Fund, International Value Fund, Value Opportunities Fund, Capital Income Fund and High Yield Fund have four classes of shares: Class I, Class A, Class C and Class Z. Class A shares are sold with a front-end sales charge. Class C shares may be subject to a contingent deferred sales charge. Class C shares are automatically converted to Class A shares approximately eight years after purchase and will then be subject to lower distribution and service fees. All classes have identical voting, dividend, liquidation and other rights and the same terms and conditions, except that Class A and Class C shares bear certain expenses related to the distribution and servicing expenditures. Currently, the International Value Fund is not offering Class A shares to investors; the Small Cap Diversified Value Fund, Global Value Fund, International Value Fund and Capital Income Fund are not offering Class C shares to investors; and the Diversified Value Fund, Global Value Fund, International Value Fund and Capital Income Fund are not offering Class Z shares to investors. Effective August 29, 2019, Class R shares converted to Class A shares for the Large Cap Value Fund and Mid-Cap Value Fund.
Significant Accounting Policies. The Funds' financial statements have been prepared in conformity with accounting principles generally accepted in the United States of America ("U.S. GAAP"), which may require the use of management accruals and estimates. Actual results could differ from those estimates and those differences could be significant. Each Fund is an investment company and accordingly follows the investment company accounting and reporting guidance of the Financial Accounting Standards Board ("FASB") Accounting Standard Codification Topic 946 "Financial Services — Investment Companies". The following is a summary of significant accounting policies followed by the Funds.
Security Valuation. Portfolio securities that are listed on a securities exchange (whether domestic or foreign) or The Nasdaq Stock Market ("NSM") (including the Nasdaq National Market and the Nasdaq Small Cap Market) are valued at the last reported sale price (or official closing price) on that day as of the close of the New York Stock Exchange (which is generally 4:00 p.m. Eastern time), or, in the absence of recorded sales, at the average of the last bid and asked quotation on such exchange or NSM. Unlisted equity securities that are not included in NSM are valued at the last sale price, or if the last sale price is unavailable, at the average of the quoted bid and asked prices in the over-the-counter market. Fixed-income securities are generally valued on the basis of quotes obtained from an approved independent pricing service but may also be valued based on reported transactions on FINRA's Trade Reporting and Compliance Engine (TRACE) or quotations provided by a broker-dealer. The pricing services may provide a price determined by a matrix pricing method or other analytical pricing models. Investments quoted in foreign currency are valued daily in U.S. dollars on the basis of the foreign currency exchange rate prevailing at the time of valuation. Securities and other assets for which market quotations are not readily available are valued at their fair value as determined by Hotchkis & Wiley Capital Management, LLC (the "Advisor") under guidelines established by and under the general supervision and responsibility of the Trust's Board of Trustees (the "Board"). The Board has approved the use of a third-party vendor's proprietary fair value pricing model to assist in determining current valuation for foreign securities traded in markets that close prior to the New York Stock Exchange. When fair value pricing is employed, the value of the portfolio securities used to calculate the Funds' net asset values may differ from quoted or official closing prices.
The Trust has performed an analysis of all existing investments to determine the significance and character of all inputs to their fair value determination. Various inputs are used in determining the value of each Fund's investments. These inputs are summarized in the following three broad categories:
• Level 1 — Quoted unadjusted prices for identical instruments in active markets to which the Trust has access at the date of measurement.
• Level 2 — Other significant observable inputs (including quoted prices for similar instruments, interest rates, current yields, credit quality, prepayment speeds for mortgage related securities, collateral for asset-backed securities, foreign security indices, foreign exchange rates, fair value estimates for foreign securities, and changes in benchmark securities indices). Level 2 inputs are those in markets for which there are few transactions, the prices are not current, little public information exists or instances where prices vary substantially over time or among brokered market makers.
• Level 3 — Significant unobservable inputs including model derived valuations in which one or more significant inputs or significant value drivers are unobservable. Unobservable inputs are those inputs that reflect the Trust's own assumptions that market participants would use to price the asset or liability based on the best available information.
65
The following table presents the valuation levels of each Fund's assets as of December 31, 2019:
| | Diversified
Value | | Large Cap
Value | | Mid-Cap
Value | | Small Cap
Value | | Small Cap
Diversified
Value | |
Level 1 — Quoted prices in an active market: | |
Common Stocks | | $ | 101,006,996 | | | $ | 513,965,575 | | | $ | 858,636,593 | | | $ | 688,650,156 | | | $ | 127,206,458 | | |
Money Market Funds | | | — | | | | 755,000 | | | | 1,790,955 | | | | 10,420,489 | | | | — | | |
Time Deposits | | | 306,207 | | | | 3,443,771 | | | | 22,487,508 | | | | 12,124,832 | | | | 1,797,091 | | |
Level 2 — Other significant observable market inputs: | |
Common Stocks: | |
Energy | | | — | | | | — | | | | 43,845,337 | | | | 2,009,136 | | | | — | | |
Industrials | | | — | | | | — | | | | 27,719,680 | | | | — | | | | — | | |
Level 3 — Significant unobservable inputs | | | — | | | | — | | | | — | | | | — | | | | — | | |
Total Investments | | $ | 101,313,203 | | | $ | 518,164,346 | | | $ | 954,480,073 | | | $ | 713,204,613 | | | $ | 129,003,549 | | |
| | Global
Value | | International
Value | | Value
Opportunities | | Capital
Income | | High Yield | |
Level 1 — Quoted prices in an active market: | |
Common Stocks | | $ | 26,456,078 | | | $ | 688,657 | | | $ | 635,502,030 | | | $ | 12,012,289 | | | $ | 6,251,636 | | |
Preferred Stocks | | | — | | | | — | | | | 2,403,434 | | | | — | | | | — | | |
Purchased Put Options | | | — | | | | — | | | | 6,621,765 | | | | — | | | | — | | |
Warrants | | | — | | | | — | | | | 1,206,872 | | | | — | | | | — | | |
Money Market Funds | | | — | | | | — | | | | 15,057,125 | | | | 326,694 | | | | 30,147,755 | | |
Time Deposits | | | 667,255 | | | | 32,401 | | | | 22,965,234 | | | | 90,262 | | | | 24,422,157 | | |
Level 2 — Other significant observable market inputs: | |
Common Stocks: | |
Communication Services | | | — | | | | 79,457 | | | | — | | | | — | | | | — | | |
Consumer Discretionary | | | 959,788 | | | | 120,884 | | | | — | | | | — | | | | — | | |
Consumer Staples | | | 1,853,909 | | | | 219,651 | | | | 11,420,144 | | | | — | | | | — | | |
Energy | | | 471,890 | | | | 143,832 | | | | 18,604,476 | | | | 368,582 | | | | — | | |
Energy — Exploration & Production | | | — | | | | — | | | | ��� | | | | — | | | | 2,825,480 | | |
Financials | | | 6,552,536 | | | | 667,221 | | | | — | | | | 188,094 | | | | — | | |
Health Care | | | — | | | | 177,748 | | | | — | | | | — | | | | — | | |
Industrials | | | 2,574,240 | | | | 330,233 | | | | 24,695,955 | | | | 198,306 | | | | — | | |
Information Technology | | | 632,936 | | | | 131,212 | | | | — | | | | — | | | | — | | |
Preferred Stocks: | |
Financials | | | — | | | | — | | | | 657,491 | | | | — | | | | — | | |
Convertible Bonds | | | — | | | | — | | | | — | | | | 79,000 | | | | 11,988,213 | | |
Corporate Bonds | | | — | | | | — | | | | 28,142,885 | | | | 7,146,055 | | | | 1,975,196,977 | | |
Term Loans | | | — | | | | — | | | | 24,159,639 | | | | 960,970 | | | | 182,249,449 | | |
Purchased Put Options | | | — | | | | — | | | | 452,550 | | | | — | | | | — | | |
Warrants | | | — | | | | — | | | | 0 | | | | — | | | | 0 | | |
Level 3 — Significant unobservable inputs: | |
Common Stocks: | |
Automakers | | | — | | | | — | | | | — | | | | — | | | | 0 | | |
Consumer Discretionary | | | — | | | | — | | | | — | | | | 253,274 | | | | — | | |
Energy | | | — | | | | — | | | | — | | | | 18 | | | | — | | |
Energy — Exploration & Production | | | — | | | | — | | | | — | | | | — | | | | 1,597 | | |
Industrials | | | — | | | | — | | | | — | | | | 120,748 | | | | — | | |
Materials | | | — | | | | — | | | | 11,831,001 | | | | 488,414 | | | | — | | |
Metals/Mining Excluding Steel | | | — | | | | — | | | | — | | | | — | | | | 47,681,031 | | |
Oil Field Equipment & Services | | | — | | | | — | | | | — | | | | — | | | | 6,543,209 | | |
Specialty Retail | | | — | | | | — | | | | — | | | | — | | | | 21,214,751 | | |
Preferred Stocks: | |
Consumer Staples | | | — | | | | — | | | | — | | | | 0 | | | | — | | |
Food — Wholesale | | | — | | | | — | | | | — | | | | — | | | | 0 | | |
Corporate Bonds | | | — | | | | — | | | | — | | | | 153,887 | | | | 22,189,279 | | |
Term Loans | | | — | | | | — | | | | 3,272,683 | | | | 27,184 | | | | 2,229,945 | | |
Total Investments | | $ | 40,168,632 | | | $ | 2,591,296 | | | $ | 806,993,284 | | | $ | 22,413,777 | | | $ | 2,332,941,479 | | |
Other Financial Instruments | |
Level 1 — Quoted prices in an active market: | |
Futures Contracts* | | | | | | $ | 79,070 | | | | | | | | | | |
Level 2 — Other significant observable market inputs | | | | | | | — | | | | | | | | | | |
Level 3 — Significant unobservable inputs | | | | | | | — | | | | | | | | | | |
Total Other Financial Instruments | | | | | | $ | 79,070 | | | | | | | | | | |
* Futures contracts are derivative instruments not reflected on the Schedule of Investments and are reflected at the unrealized appreciation (depreciation) on the instrument.
66
Please refer to the Schedule of Investments for additional information regarding the composition of the amounts listed above.
The following table provides information about the Level 3 values, as well as their inputs, as of December 31, 2019:
| | Fair Value at
December 31,
2019 | |
Valuation
Techniques | |
Unobservable
Inputs | |
Input
Values | | Impact to
Valuation from an
Increase to Input | |
Value Opportunities | |
| Common Stocks | | $ | 11,831,001
| | | Market comparable
companies | | EBIT multiple
| | 4x - 10x
| | Increase
| |
Term Loans | | | 3,272,683 | | | Market quote (stale) | | N/A | | $100.00 | | Increase | |
| | $ | 15,103,684 | | | | | | | | | | |
Capital Income | |
Common Stocks:
| | $ | 253,274
| | | Calculation of enterprise
value using:
Discounted cash flows
Market comparable
companies
Transaction analysis | |
Yield (Discount rate of cash flows)
EBITDA multiple
Guideline transactions | | 9.75% - 11.75%
6x - 8x
$499 Million - $602 Million | |
Decrease
Increase
Increase | |
| | | 2 | | | Estimated recovery value | | Probability of asset recovery | | $0 | | Increase | |
| | | 16 | | | Last traded price (stale) | | N/A | | $0.01 | | Increase | |
| | | | 609,162 | | | Market comparable
companies | |
EBIT multiple | | 4x - 10x | |
Increase | |
Total Common Stocks | | | 862,454 | | | | | | | | | | |
Preferred Stocks | | | 0 | | | Calculation of enterprise | | | | | | | |
| | | | | | | value using:
Market comparable
companies
Transaction analysis | |
EBITDA multiple
EBITDA multiple | | 12x - 13x
6x - 9x | |
Increase
Increase | |
Corporate Bonds | | | 153,887 | | | Estimated recovery value | | N/A | | $15.00 - $90.00 | | Increase | |
Term Loans | | | 27,184 | | | Market quote (stale) | | N/A | | $100.00 | | Increase | |
| | $ | 1,043,525 | | | | | | | | | | |
High Yield | |
Common Stocks:
| | $ | 21,214,751
| | | Calculation of enterprise
value using:
Discounted cash flows
Market comparable
companies
Transaction analysis | |
Yield (Discount rate of cash flows)
EBITDA multiple
Guideline transactions | | 9.75% - 11.75%
6x - 8x
$499 Million - $602 Million | |
Decrease
Increase
Increase | |
| | | 435 | | | Estimated recovery value | | Probability of asset recovery | | $0 | | Increase | |
| | | 1,162 | | | Last traded price (stale) | | N/A | | $0.01 | | Increase | |
| | | 54,224,240 | | | Market comparable
companies | |
EBIT multiple | | 4x - 10x | |
Increase | |
Total Common Stocks | | | 75,440,588 | | | | | | | | | | |
Preferred Stocks | | | 0 | | | Calculation of enterprise | | | | | | | |
| | | | | | | value using:
Market comparable
companies | |
EBITDA multiple | | 12x - 13x | |
Increase | |
| | | | | | Transaction analysis | | EBITDA multiple | | 6x - 9x | | Increase | |
Corporate Bonds | | | 22,189,279 | | | Estimated recovery value | | N/A | | $15.00 - $90.00 | | Increase | |
Term Loans | | | 2,229,945 | | | Market quote (stale) | | N/A | | $100.00 | | Increase | |
| | $ | 99,859,812 | | | | | | | | | | |
67
The following is a reconciliation of Level 3 assets for which significant unobservable inputs were used to determine fair value:
| | Value Opportunities | |
| | Common
Stocks | | Term
Loans | | Total | |
Balance at June 30, 2019 | | $ | 7,053,582 | | | $ | 3,802,486 | | | $ | 10,856,068 | | |
Purchases | | | 451,436 | | | | — | | | | 451,436 | | |
Sales | | | — | | | | (529,803 | ) | | | (529,803 | ) | |
Accrued discounts (premiums) | | | — | | | | — | | | | — | | |
Realized gains (losses) | | | — | | | | — | | | | — | | |
Change in unrealized appreciation
(depreciation) | | | 4,325,983 | | | | — | | | | 4,325,983 | | |
Transfers into Level 3 | | | — | | | | — | | | | — | | |
Balance at December 31, 2019 | | $ | 11,831,001 | | | $ | 3,272,683 | | | $ | 15,103,684 | | |
Change in unrealized appreciation
(depreciation) for Level 3 assets
held at December 31, 2019 | | $ | 4,325,983 | | | $ | — | | | $ | 4,325,983 | | |
| | Capital Income | |
| | Common
Stocks | | Preferred
Stocks | | Corporate
Bonds | | Term
Loans | | Total | |
Balance at June 30, 2019 | | $ | 722,262 | | | $ | 45,589 | | | $ | 86,500 | | | $ | 31,585 | | | $ | 885,936 | | |
Purchases | | | 82,799 | | | | — | | | | — | | | | — | | | | 82,799 | | |
Sales | | | — | | | | — | | | | — | | | | (4,401 | ) | | | (4,401 | ) | |
Accrued discounts (premiums) | | | — | | | | — | | | | (155 | ) | | | — | | | | (155 | ) | |
Realized gains (losses) | | | — | | | | — | | | | — | | | | — | | | | — | | |
Change in unrealized appreciation
(depreciation) | | | 57,391 | | | | (45,589 | ) | | | (16,095 | ) | | | — | | | | (4,293 | ) | |
Transfers into Level 3 | | | 2 | | | | — | | | | 83,637 | | | | — | | | | 83,639 | | |
Balance at December 31, 2019 | | $ | 862,454 | | | $ | 0 | | | $ | 153,887 | | | $ | 27,184 | | | $ | 1,043,525 | | |
Change in unrealized appreciation
(depreciation) for Level 3 assets
held at December 31, 2019 | | $ | 57,391 | | | $ | (45,589 | ) | | $ | (16,095 | ) | | $ | — | | | $ | (4,293 | ) | |
| | High Yield | |
| | Common
Stocks | | Preferred
Stocks | | Corporate
Bonds | | Term
Loans | | Total | |
Balance at June 30, 2019 | | $ | 63,227,625 | | | $ | 7,357,494 | | | $ | 10,707,900 | | | $ | 2,590,943 | | | $ | 83,883,962 | | |
Purchases | | | 7,361,569 | | | | — | | | | — | | | | — | | | | 7,361,569 | | |
Sales | | | — | | | | — | | | | — | | | | (360,998 | ) | | | (360,998 | ) | |
Accrued discounts (premiums) | | | — | | | | — | | | | — | | | | — | | | | — | | |
Realized gains (losses) | | | — | | | | — | | | | — | | | | — | | | | — | | |
Change in unrealized appreciation
(depreciation) | | | 4,850,959 | | | | (7,357,494 | ) | | | (2,019,000 | ) | | | — | | | | (4,525,535 | ) | |
Transfers into Level 3 | | | 435 | | | | — | | | | 13,500,379 | | | | — | | | | 13,500,814 | | |
Balance at December 31, 2019 | | $ | 75,440,588 | | | $ | 0 | | | $ | 22,189,279 | | | $ | 2,229,945 | | | $ | 99,859,812 | | |
Change in unrealized appreciation
(depreciation) for Level 3 assets
held at December 31, 2019 | | $ | 4,850,959 | | | $ | (7,357,494 | ) | | $ | (2,019,000 | ) | | $ | — | | | $ | (4,525,535 | ) | |
68
Income and Expense Allocation. Common expenses incurred by the Trust which are not allocable to a specific Fund are allocated among the Funds based upon relative net assets or evenly, depending on the nature of the expenditure. For all Funds, except the Capital Income Fund and High Yield Fund, net investment income, other than class-specific expenses, and realized and unrealized gains and losses are allocated daily to each class of shares based upon the relative net asset value of outstanding shares of each class at the beginning of the day (after adjusting for the current day's capital share activity of the respective class). For the Capital Income Fund and High Yield Fund, net investment income, other than class-specific expenses, and realized and unrealized gains and losses are allocated daily to each class of shares based upon the relative net asset value of settled shares of each class at the beginning of the day (after adjusting for the current day's capital share activity of the respective class).
Dividends and Distributions to Shareholders. Dividends and distributions to shareholders are recorded on the ex-dividend date. Dividends from net investment income are declared daily and paid monthly for the Capital Income Fund and High Yield Fund and declared and paid annually for the Diversified Value Fund, Large Cap Value Fund, Mid-Cap Value Fund, Small Cap Value Fund, Small Cap Diversified Value Fund, Global Value Fund, International Value Fund and Value Opportunities Fund. Distributions of net realized capital gains, if any, will be declared and paid at least annually.
Security Transactions and Investment Income. Security and shareholder transactions are recorded on trade date. Realized gains and losses on sales of investments are calculated on the specifically identified cost basis of the securities. Dividend income, less foreign taxes withheld, if any, is recorded on the ex-dividend date. Interest income is recognized on the accrual basis. Market discounts, premiums and original issue discounts on fixed-income securities are amortized daily over the expected life of the security using the effective yield method. Return of capital distributions received from real estate investment trust ("REIT") securities are recorded as an adjustment to the cost of the security and thus may impact unrealized gains or losses on the security.
Securities purchased or sold on a when-issued, delayed delivery or forward commitment basis may have extended settlement periods. The value of the security purchased is subject to market fluctuations during this period. The Funds will segregate or "earmark" liquid assets until the settlement date or otherwise cover their position in an amount sufficient to meet the Funds' obligations.
Foreign Currency Transactions. Securities and other assets and liabilities denominated in foreign currencies are translated into U.S. dollar amounts at the date of valuation. Purchases and sales of securities and income and expense items denominated in foreign currencies are translated into U.S. dollar amounts on the respective dates of such transactions. The Funds isolate the portion of realized gains or losses and do not isolate the portion of unrealized appreciation or depreciation resulting from changes in foreign exchange rates on securities from the fluctuations arising from changes in market prices of securities held. Reported net realized foreign exchange gains or losses arise from sales of securities, currency gains or losses realized between the trade and settlement dates on securities transactions and the difference between the amounts of dividends, interest and foreign withholding taxes recorded on the Funds' books and the U.S. dollar equivalent of the amounts actually received or paid.
Payment In-Kind Securities. Certain Funds may invest in payment in-kind securities. Payment in-kind securities give the issuer the option at each interest payment date of making interest payments in either cash or additional debt securities. Those additional debt securities usually have the same terms, including maturity dates and interest rates, and associated risks as the original bonds. The daily market quotations of the original bonds may include the accrued interest (referred to as a dirty price) and may require a pro-rata adjustment to interest receivable from the unrealized appreciation or depreciation of securities on the Statements of Assets & Liabilities.
Restricted and Illiquid Securities. The Funds may invest in securities that are subject to legal or contractual restrictions on resale or are illiquid. Restricted securities generally may be resold in transactions exempt from registration. An illiquid security is an investment that a Fund reasonably expects cannot be sold or disposed of in current market conditions in seven calendar days or less without the sale or disposition significantly changing the market value of the investment. Disposal of these securities may involve time-consuming negotiations and expense, and prompt sale at the current valuation may be difficult.
Options. The Funds are subject to equity price risk in the normal course of pursuing their investment objectives. The Funds may purchase put options on securities to protect holdings in an underlying or related security against a substantial decline in market value. The Funds may purchase call options on securities and security indexes. A Fund may write a call or put option only if the option is "covered" by the Fund holding a position in the underlying securities or by other means which would permit immediate satisfaction of the Fund's obligation as writer of the option. Prior to exercise or expiration, an option may be closed by an offsetting purchase or sale of an option of the same series. The purchase and writing of options involves certain risks. If a put or call option purchased by a Fund is not sold when it has remaining value, and if the market price of the underlying security, in the case of a put, remains equal to or greater than the exercise price or, in the case of a call, remains less than or equal to the exercise price, the Fund will lose its entire investment in the option. There can be no assurance that a liquid market will exist when a Fund seeks to close out an option position. Furthermore, if trading restrictions or suspensions are imposed on the options markets, the Fund may be unable to close out a position. With options, there is minimal counterparty risk to the Funds since options are exchange traded and the exchange's clearinghouse, as counterparty to all exchange traded options, guarantees the options against default.
When a Fund purchases a put or call option, an amount equal to the premium paid is included on the Statements of Assets & Liabilities as an investment, and is subsequently adjusted to reflect the fair market value of the option. If an option expires on the stipulated expiration date or if the Fund enters into a closing sale transaction, a gain or loss is realized. If the Fund exercises a put option, a gain or loss is realized from the sale of the underlying security, and the proceeds from such sale are decreased by the premium originally paid. If the Fund exercises a call option, the cost of the security acquired is increased by the premium paid for the call.
Futures Contracts. The Value Opportunities Fund is subject to foreign currency exchange rate risk in the normal course of pursuing its investment objective. The Fund may use futures contracts to gain exposure to, or hedge against, changes in the value of foreign currencies. A futures contract provides for the future sale by one party and purchase by another party of an asset at a specified price on a specified date. Upon entering into such
69
contracts, the Fund is required to deposit with the broker, either in cash or securities, an initial margin deposit in an amount equal to a certain percentage of the contract amount. Subsequent payments (variation margin) are made or received by the Fund each day, depending on the daily fluctuations in the value of the contract, and are recorded for financial statement purposes as unrealized gains or losses by the Fund. Upon entering into such contracts, the Fund bears the risk of exchange rates moving unexpectedly, in which case the Fund may not achieve the anticipated benefits of the futures contracts and may realize a loss. When a contract is closed, the Fund records a realized gain or loss equal to the difference between the proceeds from (or cost of) the closing transaction and the Fund's basis in the contract. With futures, there is minimal counterparty risk to the Fund since futures are exchange traded and the exchange's clearinghouse, as counterparty to all exchange traded futures, guarantees the futures against default. The use of futures contracts involves the risk of imperfect correlation in movements in the price of the futures contracts, exchange rates and the underlying hedged assets.
Credit Default Swap Contracts. The Value Opportunities Fund, Capital Income Fund and High Yield Fund may enter into credit default swap agreements for purposes of attempting to obtain a particular desired return at a lower cost to the Fund than if the Fund had invested directly in an instrument that yielded the desired return. The buyer in a credit default swap is obligated to pay the seller a periodic stream of payments over the term of the contract provided no event of default on an underlying reference obligation has occurred. In the event of default, the seller must pay the buyer a net settlement amount in the form of cash or securities equal to the notional amount of the swap less the recovery value of the referenced entity or underlying securities comprising the referenced index. Credit default swaps involve greater risks than if the Fund invested in the reference obligation directly. In addition to general market risks, credit default swaps are subject to illiquidity risk, counterparty risk and credit risk. The Fund's maximum risk of loss from counterparty risk, either as the protection seller or as the protection buyer, is the fair value of the contract. This risk is mitigated by having a master netting arrangement between the Fund and the counterparty and by the posting of collateral by the counterparty to the Fund to cover the Fund's exposure to the counterparty.
The Advisor, on behalf of the Value Opportunities Fund, Capital Income Fund and High Yield Fund, is party to an International Swap Dealers Association, Inc. Master Agreement ("ISDA Master Agreement") with each of Goldman Sachs International and JPMorgan Chase Bank, N.A. that governs transactions, such as over-the-counter swap contracts, entered into by the Funds and the counterparty. The ISDA Master Agreement contains provisions for general obligations, representations, agreements, collateral and events of default or termination. Events of termination include conditions that may entitle the counterparty to elect to terminate early and cause settlement of all outstanding transactions under the ISDA Master Agreement.
Upon entering into swap agreements, the Value Opportunities Fund, Capital Income Fund and High Yield Fund will either receive or pay an upfront payment based upon the difference between the current principal amount and the notional amount of the swap and whether the Fund is buying or selling protection. Upfront payments that are received are recorded as liabilities while upfront payments paid are recorded as assets. These payments remain on the books until the swap contract is closed. When entering into credit default swaps, the Fund will either deliver collateral to the counterparty or the counterparty will deliver collateral to the Fund. The amount of this collateral is calculated based upon the notional value and the current price of the swap. In the event of default, the Fund has recourse against any collateral posted to it by the counterparty. When entering into swap agreements as a seller, the notional amounts would be partially offset by any recovery values of the respective reference obligations, upfront payments received upon entering into the agreement, or net amounts received from the settlement of buy protection credit default swap agreements entered into by the Fund for the same reference entity. Unrealized appreciation or depreciation is recorded daily as the difference between the prior day and current day closing price.
Derivative Instruments. The Funds have adopted authoritative standards regarding disclosures about derivatives and how they affect the Funds' Statements of Assets & Liabilities and Statements of Operations.
The following is a summary of the Funds' derivative instrument holdings categorized by primary risk exposure as of December 31, 2019:
Asset Derivatives
| | Location on Statements of
Assets & Liabilities | | Value
Opportunities | |
Equity Contracts: | |
Purchased Put Options | | Long-term investments | | $ | 7,074,315 | | |
Foreign Exchange Contracts: | |
Futures Contracts | | Total distributable earnings (losses)* | | | 79,070 | | |
* Includes cumulative appreciation of futures contracts as reported in the Schedule of Futures Contracts.
The following is a summary of the Funds' realized gains (losses) and change in unrealized appreciation (depreciation) on derivative instruments recognized in the Statements of Operations categorized by primary risk exposure for the six months ended December 31, 2019:
Realized Gains (Losses) on Derivatives
| | Value Opportunities | | Capital Income | | High Yield | |
Credit Contracts: | |
Credit Default Swap Contracts | | $ | — | | | $ | 2,203 | | | $ | 523,107 | | |
70
Change in Unrealized Appreciation (Depreciation) on Derivatives
| | Value Opportunities | |
Equity Contracts: | |
Purchased Put Options | | $ | (9,771,988 | )* | |
Foreign Exchange Contracts: | |
Futures Contracts | | | 79,070 | | |
* Included with net change in unrealized appreciation (depreciation) of securities of unaffiliated issuers and foreign currency transactions.
The following is a summary of the Funds' average quarterly balance of outstanding derivative instruments categorized by primary risk exposure for the six months ended December 31, 2019:
Average Quarterly Balance of Outstanding Derivatives
| | Value Opportunities | | Capital Income | | High Yield | |
Credit Contracts: | |
Average Number of Contracts — Credit Default Swap Contracts | | | — | | | | — | | | | — | | |
Average Notional Amount — Credit Default Swap Contracts | | $ | — | | | $ | — | | | $ | — | | |
Equity Contracts: | |
Average Number of Contracts — Purchased Put Options | | | 5,718 | | | | — | | | | — | | |
Average Notional Amount — Purchased Put Options | | $ | 39,976,817 | | | $ | — | | | $ | — | | |
Foreign Exchange Contracts: | |
Average Number of Contracts — Futures Contracts | | | 50 | | | | — | | | | — | | |
Average Notional Amount — Futures Contracts | | $ | 4,153,750 | | | $ | — | | | $ | — | | |
Offsetting Assets and Liabilities. The Funds are subject to various master netting arrangements, which govern the terms of certain transactions with counterparties. The arrangements allow the Funds to close out and net their total exposure to a counterparty in the event of a default with respect to all the transactions governed under a single agreement with a counterparty. For financial reporting purposes, the Funds do not offset financial assets and liabilities that are subject to master netting arrangements in the Statements of Assets & Liabilities.
The following is a summary of the arrangements subject to offsetting as of December 31, 2019:
| |
| | Gross Amounts Not Offset in the
Statements of Assets & Liabilities | |
| | Gross Amounts Presented in the
Statements of Assets & Liabilities | | Financial
Instruments | | Collateral
Received* | | Net Amount | |
Securities Lending: | |
Large Cap Value | | $ | 736,578 | | | $ | — | | | $ | (736,578 | ) | | $ | — | | |
Mid-Cap Value | | | 1,729,956 | | | | — | | | | (1,729,956 | ) | | | — | | |
Small Cap Value | | | 10,174,965 | | | | — | | | | (10,174,965 | ) | | | — | | |
Value Opportunities | | | 14,754,135 | | | | — | | | | (14,754,135 | ) | | | — | | |
* Actual collateral received is greater than the amount shown due to overcollateralization.
NOTE 2.
Fees and Transactions with Affiliates. The Trust has entered into Investment Advisory Agreements for each of the Funds with the Advisor, with which the officers and a Trustee of the Trust are affiliated. The Advisor is a limited liability company, the primary members of which are HWCap Holdings, a limited liability company with members who are current and former employees of the Advisor, and Stephens - H&W, LLC, a limited liability company whose primary member is SF Holding Corp., which is a diversified holding company. The Advisor is responsible for the management of the Funds' investments and provides the personnel, facilities, equipment and certain other services necessary to the operations of each Fund. The Advisor receives a fee, computed daily and payable monthly, at the annual rates presented below as applied to each Fund's daily net assets. The Advisor has contractually agreed to waive fees or reimburse regular operating expenses in excess of the annual rates presented below as applied to such Fund's daily net assets through August 29, 2020.
| | | Diversified
Value | | Large Cap
Value | | Mid-Cap
Value | | Small Cap
Value | | Small Cap
Diversified
Value | | Global
Value | | International
Value | | Value
Opportunities | | Capital
Income | | High
Yield | |
Annual Advisory
Fee Rate | | | 0.70 | %1 | | | 0.70 | %2 | | | 0.75 | %3 | | | 0.75 | % | | | 0.65 | % | | | 0.75 | % | | | 0.80 | % | | | 0.75 | % | | | 0.65 | % | | | 0.55 | % | |
Annual cap on
expenses — Class I | | | 0.80 | % | | | 0.95 | % | | | 1.15 | % | | | 1.25 | % | | | 0.80 | % | | | 0.95 | % | | | 0.95 | % | | | 1.25 | % | | | 0.80 | % | | | 0.70 | % | |
Annual cap on
expenses — Class A | | | 1.05 | % | | | 1.20 | % | | | 1.40 | % | | | 1.50 | % | | | 1.05 | % | | | 1.20 | % | | | 1.20 | % | | | 1.50 | % | | | 1.05 | % | | | 0.95 | % | |
71
| | | Diversified
Value | | Large Cap
Value | | Mid-Cap
Value | | Small Cap
Value | | Small Cap
Diversified
Value | | Global
Value | | International
Value | | Value
Opportunities | | Capital
Income | | High
Yield | |
Annual cap on
expenses — Class C | | | 1.80 | % | | | 1.95 | % | | | 2.15 | % | | | 2.25 | % | | | 1.80 | % | | | 1.95 | % | | | 1.95 | % | | | 2.25 | % | | | 1.80 | % | | | 1.70 | % | |
Annual cap on
expenses — Class Z | | | 0.80 | % | | | 0.95 | % | | | 1.15 | % | | | 1.25 | % | | | 0.80 | % | | | 0.95 | % | | | 0.95 | % | | | 1.25 | % | | | 0.80 | % | | | 0.60 | % | |
1 The Annual Advisory Fee Rate is 0.70% for the first $250 million in assets, 0.60% for the next $250 million in assets and 0.50% thereafter.
2 The Annual Advisory Fee Rate is 0.70% for the first $500 million in assets, 0.60% for the next $500 million in assets and 0.55% thereafter.
3 The Annual Advisory Fee Rate is 0.75% for the first $5 billion in assets, 0.65% for the next $5 billion in assets and 0.60% for assets over $10 billion.
The following rates were effective prior to August 29, 2019:
| | Small Cap
Diversified Value | |
Annual cap on expenses — Class I | | | 0.90 | % | |
Annual cap on expenses — Class A | | | 1.15 | % | |
Annual cap on expenses — Class C | | | 1.90 | % | |
Annual cap on expenses — Class Z | | | 0.90 | % | |
Quasar Distributors, LLC is the principal underwriter and distributor for the shares of the Funds ("Quasar" or the "Distributor"). The Distributor is affiliated with the Funds' transfer agent, fund accountant and administrator, U.S. Bancorp Fund Services, LLC, doing business as U.S. Bank Global Fund Services. Pursuant to the Distribution Plan adopted by the Trust in accordance with Rule 12b-1 under the 1940 Act, the Funds pay the Distributor ongoing distribution and service fees. The fees are accrued daily at the annual rates based upon the average daily net assets of the shares as follows:
| | | Distribution and Service
Fee | |
Class A | | | 0.25 | % | |
Class C | | | 1.00 | % | |
Class R1 | | | 0.50 | % | |
1 Effective August 29, 2019, Class R shares converted to Class A shares for the Large Cap Value Fund and Mid-Cap Value Fund.
Pursuant to separate agreements with the Distributor, selected dealers and other financial intermediaries also provide distribution services to the Funds. The ongoing distribution and service fee compensates the Distributor and selected dealers for providing distribution-related and shareholder services to Class A and Class C shareholders.
Certain selected dealers and other financial intermediaries charge a fee for shareholder accounting services and administrative services that they provide to the Funds on behalf of certain shareholders; the portion of this fee paid by the Funds is included within "Transfer agent fees and expenses" in the Statements of Operations. Class Z shares are not subject to these fees.
The Funds are permitted to purchase securities from or sell securities to another Fund or affiliated person under procedures adopted by the Board. During the six months ended December 31, 2019, the Funds' did not have any of the these purchases and sales.
NOTE 3.
Investments. Purchases and sales of investment securities, excluding short-term investments, for the six months ended December 31, 2019 were as follows:
| | Diversified
Value | | Large Cap
Value | | Mid-Cap
Value | | Small Cap
Value | | Small Cap
Diversified
Value | | Global
Value | | International
Value | | Value
Opportunities | | Capital
Income | | High Yield | |
Purchases | | $ | 11,160,336 | | | $ | 39,175,534 | | | $ | 127,499,769 | | | $ | 106,679,760 | | | $ | 65,197,354 | | | $ | 5,323,160 | | | $ | 287,066 | | | $ | 118,312,057 | | | $ | 2,904,307 | | | $ | 547,758,243 | | |
Sales | | | 17,670,954 | | | | 43,695,837 | | | | 378,239,894 | | | | 152,741,599 | | | | 38,892,298 | | | | 7,138,895 | | | | 302,096 | | | | 125,516,883 | | | | 7,532,609 | | | | 687,305,146 | | |
The Funds did not have any purchases or sales of U.S. Government securities for the six months ended December 31, 2019.
NOTE 4.
Federal Income Taxes. It is each Fund's policy to comply with the requirements of the Internal Revenue Code applicable to regulated investment companies and each Fund intends to distribute substantially all of its investment company net taxable income and net capital gains to shareholders. Therefore, no federal income tax provision is required. Under the applicable foreign tax law, a withholding tax may be imposed on interest, dividends and capital gains at various rates.
Distributions paid to shareholders are based on net investment income and net realized gains determined on a tax basis, which may differ from net investment income and net realized gains for financial reporting purposes. The fiscal year in which amounts are distributed may differ from the year in which the net investment income and net realized gains are recorded by the Funds for financial reporting purposes. The Funds may utilize earnings and profits distributed to shareholders on redemptions of shares as part of the dividends paid deduction. Generally accepted accounting principles require that permanent financial reporting and tax differences be reclassified within the capital accounts.
72
The following information is presented on an income tax basis as of June 30, 2019:
| | | Diversified
Value | | Large Cap
Value | | Mid-Cap
Value | | Small Cap
Value | | Small Cap
Diversified
Value | | Global
Value | | International
Value | | Value
Opportunities | | Capital
Income | | High Yield | |
Tax cost of
investments | | $ | 112,408,698 | | | $ | 502,093,564 | | | $ | 1,339,609,110 | | | $ | 719,067,701 | | | $ | 95,008,738 | | | $ | 38,557,133 | | | $ | 2,522,049 | | | $ | 710,541,784 | | | $ | 27,763,862 | | | $ | 2,568,144,572 | | |
Gross unrealized
appreciation | | | 11,750,360 | | | | 57,544,904 | | | | 159,900,099 | | | | 91,090,843 | | | | 5,910,733 | | | | 2,590,828 | | | | 172,441 | | | | 95,619,743 | | | | 2,477,104 | | | | 83,797,463 | | |
Gross unrealized
depreciation | | | (23,644,885 | ) | | | (77,182,580 | ) | | | (300,368,811 | ) | | | (112,145,760 | ) | | | (7,642,129 | ) | | | (2,587,009 | ) | | | (347,452 | ) | | | (65,578,316 | ) | | | (3,879,833 | ) | | | (182,491,894 | ) | |
Net unrealized
appreciation
(depreciation) | | | (11,894,525 | ) | | | (19,637,676 | ) | | | (140,468,712 | ) | | | (21,054,917 | ) | | | (1,731,396 | ) | | | 3,819 | | | | (175,011 | ) | | | 30,041,427 | | | | (1,402,729 | ) | | | (98,694,431 | ) | |
Distributable
ordinary income
(as of 6/30/19)* | | | 1,715,852 | | | | 4,191,521 | | | | 9,706,100 | | | | 8,384,797 | | | | 327,456 | | | | 864,609 | | | | 52,271 | | | | 10,774,747 | | | | 168,631 | | | | 1,353,992 | | |
Distributable
long-term gains
(as of 6/30/19) | | | — | | | | — | | | | — | | | | 12,825,522 | | | | — | | | | 160,866 | | | | 31,599 | | | | 3,631,159 | | | | — | | | | — | | |
Total distributable
earnings | | | 1,715,852 | | | | 4,191,521 | | | | 9,706,100 | | | | 21,210,319 | | | | 327,456 | | | | 1,025,475 | | | | 83,870 | | | | 14,405,906 | | | | 168,631 | | | | 1,353,992 | | |
Other accumulated
losses | | | (29,445,355 | ) | | | (3,343,716 | ) | | | (36,556,336 | ) | | | — | | | | (1,747,483 | ) | | | — | | | | — | | | | — | | | | (300,527 | ) | | | (124,908,566 | ) | |
Total accumulated
gains (losses) | | $ | (39,624,028 | ) | | $ | (18,789,871 | ) | | $ | (167,318,948 | ) | | $ | 155,402 | | | $ | (3,151,423 | ) | | $ | 1,029,294 | | | $ | (91,141 | ) | | $ | 44,447,333 | | | $ | (1,534,625 | ) | | $ | (222,249,005 | ) | |
* Includes distributable short-term gains of $4,756,826 for the Small Cap Value Fund, $436,859 for the Global Value Fund, $7,687 for the International Value Fund and $5,926,452 for the Value Opportunities Fund.
As of the close of business on December 31, 2012, in exchange for shares the Advisor transferred assets valued at $1,132,946 to the Global Value Fund. As a result of the tax-deferred transfers, the Global Value Fund acquired $50,230 of unrealized appreciation for tax purposes. As of June 30, 2019, the Global Value Fund held securities with $4,278 of net unrealized appreciation relating to the transfers.
As of the close of business on June 30, 2014, in exchange for shares Stephens Investment Holdings LLC transferred assets valued at $5,038,896 to the Small Cap Diversified Value Fund. As a result of the tax-deferred transfers, the Small Cap Diversified Value Fund acquired $592,438 of unrealized appreciation for tax purposes. As of June 30, 2019, the Small Cap Diversified Value Fund held securities with $36,516 of net unrealized appreciation relating to the transfers.
The tax components of distributions paid during the fiscal years ended June 30, 2019 and 2018, capital loss carryovers as of June 30, 2019, and any tax basis late year losses as of June 30, 2019, which are not recognized for tax purposes until the first day of the following fiscal year, are:
| | | June 30, 2019 | | June 30, 2018 | |
| | | Ordinary
Income
Distributions | | Long-Term
Capital Gains
Distributions | | Net Capital
Loss
Carryovers | | Capital Loss
Carryovers
Utilized | | Late
Year
Losses | | Ordinary
Income
Distributions | | Long-Term
Capital Gains
Distributions | |
Diversified Value | | $ | 1,280,234 | | | $ | — | | | $ | 29,445,3551 | | | $ | — | | | $ | — | | | $ | 1,972,008 | | | $ | — | | |
Large Cap Value | | | 8,139,522 | | | | 3,973,656 | | | | — | | | | — | | | | 3,343,7164 | | | | 5,847,545 | | | | — | | |
Mid-Cap Value | | | 22,954,934 | | | | 17,470,309 | | | | — | | | | — | | | | 36,556,3365 | | | | 7,015,174 | | | | 115,849,489 | | |
Small Cap Value | | | 14,330,987 | | | | 44,274,755 | | | | — | | | | — | | | | — | | | | 7,785,649 | | | | 30,558,275 | | |
Small Cap Diversified Value | | | 1,723,003 | | | | 1,457,773 | | | | — | | | | — | | | | 1,743,1926 | | | | 1,255,591 | | | | 2,330,107 | | |
Global Value | | | 180,054 | | | | 545,615 | | | | — | | | | — | | | | — | | | | 141,786 | | | | 315,963 | | |
International Value | | | 38,921 | | | | 119,730 | | | | — | | | | — | | | | — | | | | 31,134 | | | | 113,434 | | |
Value Opportunities | | | 24,999,077 | | | | 34,454,111 | | | | — | | | | — | | | | — | | | | 10,183,262 | | | | 7,767,590 | | |
Capital Income | | | 991,795 | | | | — | | | | 287,1322 | | | | — | | | | — | | | | 1,450,914 | | | | — | | |
High Yield | | | 153,991,603 | | | | — | | | | 122,941,3953 | | | | — | | | | — | | | | 157,623,296 | | | | — | | |
1 Long-term with no expiration.
2 Short-term with no expiration.
3 $914,699 is short-term with no expiration and $122,026,696 is long-term with no expiration.
4 $19,266 is short-term post-October loss and $3,324,450 is long-term post-October loss.
5 Short-term post-October loss.
6 $1,696,315 is short-term post-October loss and $37,877 is long-term post-October loss.
73
As of and during the year ended June 30, 2019, the Funds did not have a liability for any unrecognized tax benefits. The Funds recognize interest and penalties, if any, related to unrecognized tax benefits as income tax expense in the Statements of Operations. During the year ended June 30, 2019, the Funds did not incur any interest or penalties. The tax years ended June 30, 2016 through June 30, 2019 remain open and subject to examination by tax jurisdictions.
NOTE 5.
Capital Share Transactions. Transactions in capital shares for each class were as follows:
| | | Sales | | Reinvestment of
dividends
and distributions | | Redemptions | | Net increase (decrease) | |
| | | Shares | | Amount | | Shares | | Amount | | Shares | | Amount | | Shares | | Amount | |
Six Months Ended December 31, 2019 | |
Diversified Value Fund | |
Class I | | | 57,855 | | | $ | 1,091,712 | | | | 53,943 | | | $ | 1,075,088 | | | | (303,152 | ) | | $ | (5,807,047 | ) | | | (191,354 | ) | | $ | (3,640,247 | ) | |
Class A | | | 21,968 | | | | 424,584 | | | | 11,172 | | | | 223,673 | | | | (136,586 | ) | | | (2,618,892 | ) | | | (103,446 | ) | | | (1,970,635 | ) | |
Class C | | | 280 | | | | 5,346 | | | | 496 | | | | 9,899 | | | | (17,871 | ) | | | (334,448 | ) | | | (17,095 | ) | | | (319,203 | ) | |
Total net increase
(decrease) | | | 80,103 | | | | 1,521,642 | | | | 65,611 | | | | 1,308,660 | | | | (457,609 | ) | | | (8,760,387 | ) | | | (311,895 | ) | | | (5,930,085 | ) | |
Large Cap Value Fund | |
Class I | | | 1,251,111 | | | | 41,223,941 | | | | 158,415 | | | | 5,563,526 | | | | (1,266,521 | ) | | | (42,294,972 | ) | | | 143,005 | | | | 4,492,495 | | |
Class A (Note 10) | | | 466,626 | | | | 15,523,921 | | | | 35,625 | | | | 1,246,516 | | | | (751,474 | ) | | | (25,562,250 | ) | | | (249,223 | ) | | | (8,791,813 | ) | |
Class C | | | 6,721 | | | | 224,415 | | | | 1,905 | | | | 65,888 | | | | (47,245 | ) | | | (1,532,455 | ) | | | (38,619 | ) | | | (1,242,152 | ) | |
Class R (Note 10) | | | 3,653 | | | | 116,790 | | | | — | | | | — | | | | (159,160 | ) | | | (5,081,991 | ) | | | (155,507 | ) | | | (4,965,201 | ) | |
Class Z | | | 1,510 | | | | 50,014 | | | | 26 | | | | 901 | | | | — | | | | — | | | | 1,536 | | | | 50,915 | | |
Total net increase
(decrease) | | | 1,729,621 | | | | 57,139,081 | | | | 195,971 | | | | 6,876,831 | | | | (2,224,400 | ) | | | (74,471,668 | ) | | | (298,808 | ) | | | (10,455,756 | ) | |
Mid-Cap Value Fund | |
Class I | | | 2,160,194 | | | | 67,145,201 | | | | 384,208 | | | | 12,359,978 | | | | (9,660,191 | ) | | | (303,251,490 | ) | | | (7,115,789 | ) | | | (223,746,311 | ) | |
Class A (Note 10) | | | 529,463 | | | | 16,123,867 | | | | 29,051 | | | | 921,797 | | | | (1,389,659 | ) | | | (42,847,829 | ) | | | (831,145 | ) | | | (25,802,165 | ) | |
Class C | | | 12,751 | | | | 342,357 | | | | 776 | | | | 21,420 | | | | (257,470 | ) | | | (6,671,549 | ) | | | (243,943 | ) | | | (6,307,772 | ) | |
Class R (Note 10) | | | 4,076 | | | | 126,658 | | | | — | | | | — | | | | (128,982 | ) | | | (3,653,136 | ) | | | (124,906 | ) | | | (3,526,478 | ) | |
Class Z | | | 1,631 | | | | 50,014 | | | | 28 | | | | 908 | | | | — | | | | — | | | | 1,659 | | | | 50,922 | | |
Total net increase
(decrease) | | | 2,708,115 | | | | 83,788,097 | | | | 414,063 | | | | 13,304,103 | | | | (11,436,302 | ) | | | (356,424,004 | ) | | | (8,314,124 | ) | | | (259,331,804 | ) | |
Small Cap Value Fund | |
Class I | | | 1,072,644 | | | | 55,908,313 | | | | 319,026 | | | | 17,010,444 | | | | (1,823,285 | ) | | | (95,866,191 | ) | | | (431,615 | ) | | | (22,947,434 | ) | |
Class A | | | 66,029 | | | | 3,429,847 | | | | 21,584 | | | | 1,146,521 | | | | (167,757 | ) | | | (8,715,431 | ) | | | (80,144 | ) | | | (4,139,063 | ) | |
Class C | | | 3,694 | | | | 155,786 | | | | 5,383 | | | | 230,191 | | | | (40,849 | ) | | | (1,691,743 | ) | | | (31,772 | ) | | | (1,305,766 | ) | |
Class Z | | | 959 | | | | 50,014 | | | | 48 | | | | 2,581 | | | | — | | | | — | | | | 1,007 | | | | 52,595 | | |
Total net increase
(decrease) | | | 1,143,326 | | | | 59,543,960 | | | | 346,041 | | | | 18,389,737 | | | | (2,031,891 | ) | | | (106,273,365 | ) | | | (542,524 | ) | | | (28,339,668 | ) | |
Small Cap Diversified Value Fund | |
Class I | | | 4,631,340 | | | | 46,981,703 | | | | 101,881 | | | | 1,088,093 | | | | (2,178,499 | ) | | | (21,112,966 | ) | | | 2,554,722 | | | | 26,956,830 | | |
Class A | | | 27,499 | | | | 274,873 | | | | 1,352 | | | | 14,382 | | | | (66,883 | ) | | | (656,910 | ) | | | (38,032 | ) | | | (367,655 | ) | |
Class Z | | | 4,990 | | | | 50,000 | | | | 45 | | | | 478 | | | | — | | | | — | | | | 5,035 | | | | 50,478 | | |
Total net increase
(decrease) | | | 4,663,829 | | | | 47,306,576 | | | | 103,278 | | | | 1,102,953 | | | | (2,245,382 | ) | | | (21,769,876 | ) | | | 2,521,725 | | | | 26,639,653 | | |
Global Value Fund | |
Class I | | | 132,860 | | | | 1,536,496 | | | | 77,760 | | | | 936,235 | | | | (353,475 | ) | | | (4,147,049 | ) | | | (142,855 | ) | | | (1,674,318 | ) | |
Class A | | | 4,269 | | | | 51,420 | | | | 354 | | | | 4,267 | | | | (7,119 | ) | | | (83,203 | ) | | | (2,496 | ) | | | (27,516 | ) | |
Total net increase
(decrease) | | | 137,129 | | | | 1,587,916 | | | | 78,114 | | | | 940,502 | | | | (360,594 | ) | | | (4,230,252 | ) | | | (145,351 | ) | | | (1,701,834 | ) | |
International Value Fund | |
Class I | | | — | | | | — | | | | 8,159 | | | | 83,874 | | | | — | | | | — | | | | 8,159 | | | | 83,874 | | |
Total net increase | | | — | | | | — | | | | 8,159 | | | | 83,874 | | | | — | | | | — | | | | 8,159 | | | | 83,874 | | |
74
| | Sales | | Reinvestment of
dividends
and distributions | | Redemptions | | Net increase (decrease) | |
| | Shares | | Amount | | Shares | | Amount | | Shares | | Amount | | Shares | | Amount | |
Six Months Ended December 31, 2019 | |
Value Opportunities Fund | |
Class I | | | 1,627,683 | | | $ | 45,493,383 | | | | 346,569 | | | $ | 9,884,142 | | | | (2,372,679 | ) | | $ | (65,984,588 | ) | | | (398,427 | ) | | $ | (10,607,063 | ) | |
Class A | | | 337,129 | | | | 9,299,576 | | | | 64,990 | | | | 1,860,010 | | | | (883,443 | ) | | | (24,953,508 | ) | | | (481,324 | ) | | | (13,793,922 | ) | |
Class C | | | 67,512 | | | | 1,744,311 | | | | 20,419 | | | | 540,288 | | | | (271,553 | ) | | | (6,973,076 | ) | | | (183,622 | ) | | | (4,688,477 | ) | |
Class Z | | | 699,410 | | | | 19,436,623 | | | | 17,121 | | | | 488,112 | | | | — | | | | — | | | | 716,531 | | | | 19,924,735 | | |
Total net increase
(decrease) | | | 2,731,734 | | | | 75,973,893 | | | | 449,099 | | | | 12,772,552 | | | | (3,527,675 | ) | | | (97,911,172 | ) | | | (346,842 | ) | | | (9,164,727 | ) | |
Capital Income Fund | |
Class I | | | 12,173 | | | | 142,336 | | | | 19,052 | | | | 226,466 | | | | (298,453 | ) | | | (3,459,352 | ) | | | (267,228 | ) | | | (3,090,550 | ) | |
Class A | | | 8,254 | | | | 101,335 | | | | 14,748 | | | | 183,225 | | | | (134,838 | ) | | | (1,673,000 | ) | | | (111,836 | ) | | | (1,388,440 | ) | |
Total net increase
(decrease) | | | 20,427 | | | | 243,671 | | | | 33,800 | | | | 409,691 | | | | (433,291 | ) | | | (5,132,352 | ) | | | (379,064 | ) | | | (4,478,990 | ) | |
High Yield Fund | |
Class I | | | 21,726,321 | | | | 249,307,779 | | | | 4,314,061 | | | | 49,457,930 | | | | (35,043,337 | ) | | | (400,861,355 | )1 | | | (9,002,955 | ) | | | (102,095,646 | ) | |
Class A | | | 639,148 | | | | 7,280,523 | | | | 579,681 | | | | 6,610,462 | | | | (10,213,055 | ) | | | (116,726,951 | )1 | | | (8,994,226 | ) | | | (102,835,966 | ) | |
Class C | | | 12,794 | | | | 146,308 | | | | 6,004 | | | | 68,784 | | | | (25,742 | ) | | | (293,656 | ) | | | (6,944 | ) | | | (78,564 | ) | |
Class Z | | | 8,235,840 | | | | 94,612,237 | | | | 312,759 | | | | 3,587,004 | | | | (2,615,889 | ) | | | (30,138,499 | )1 | | | 5,932,710 | | | | 68,060,742 | | |
Total net increase
(decrease) | | | 30,614,103 | | | | 351,346,847 | | | | 5,212,505 | | | | 59,724,180 | | | | (47,898,023 | ) | | | (548,020,461 | ) | | | (12,071,415 | ) | | | (136,949,434 | ) | |
Year Ended June 30, 2019 | |
Diversified Value Fund | |
Class I | | | 230,995 | | | | 4,308,636 | | | | 47,595 | | | | 793,407 | | | | (410,190 | ) | | | (7,597,837 | ) | | | (131,600 | ) | | | (2,495,794 | ) | |
Class A | | | 139,026 | | | | 2,546,023 | | | | 11,487 | | | | 192,296 | | | | (362,761 | ) | | | (6,593,112 | ) | | | (212,248 | ) | | | (3,854,793 | ) | |
Class C | | | 11,123 | | | | 193,059 | | | | 279 | | | | 4,644 | | | | (36,751 | ) | | | (657,557 | ) | | | (25,349 | ) | | | (459,854 | ) | |
Total net increase
(decrease) | | | 381,144 | | | | 7,047,718 | | | | 59,361 | | | | 990,347 | | | | (809,702 | ) | | | (14,848,506 | ) | | | (369,197 | ) | | | (6,810,441 | ) | |
Large Cap Value Fund | |
Class I | | | 4,188,167 | | | | 130,285,912 | | | | 262,252 | | | | 7,694,461 | | | | (1,969,489 | ) | | | (62,799,204 | ) | | | 2,480,930 | | | | 75,181,169 | | |
Class A | | | 268,996 | | | | 8,557,570 | | | | 85,814 | | | | 2,510,069 | | | | (779,122 | ) | | | (25,161,630 | ) | | | (424,312 | ) | | | (14,093,991 | ) | |
Class C | | | 128,124 | | | | 3,936,925 | | | | 6,237 | | | | 180,130 | | | | (109,077 | ) | | | (3,429,075 | ) | | | 25,284 | | | | 687,980 | | |
Class R | | | 27,362 | | | | 881,858 | | | | 1,823 | | | | 54,002 | | | | (78,923 | ) | | | (2,578,673 | ) | | | (49,738 | ) | | | (1,642,813 | ) | |
Total net increase
(decrease) | | | 4,612,649 | | | | 143,662,265 | | | | 356,126 | | | | 10,438,662 | | | | (2,936,611 | ) | | | (93,968,582 | ) | | | 2,032,164 | | | | 60,132,345 | | |
Mid-Cap Value Fund | |
Class I | | | 5,685,098 | | | | 200,404,082 | | | | 992,963 | | | | 31,933,680 | | | | (15,684,749 | ) | | | (547,940,675 | ) | | | (9,006,688 | ) | | | (315,602,913 | ) | |
Class A | | | 630,763 | | | | 22,273,194 | | | | 92,293 | | | | 2,920,139 | | | | (1,709,764 | ) | | | (58,842,995 | ) | | | (986,708 | ) | | | (33,649,662 | ) | |
Class C | | | 74,641 | | | | 2,191,937 | | | | 19,489 | | | | 535,374 | | | | (385,659 | ) | | | (11,453,424 | ) | | | (291,529 | ) | | | (8,726,113 | ) | |
Class R | | | 29,227 | | | | 1,012,997 | | | | 1,255 | | | | 39,820 | | | | (76,148 | ) | | | (2,640,965 | ) | | | (45,666 | ) | | | (1,588,148 | ) | |
Total net increase
(decrease) | | | 6,419,729 | | | | 225,882,210 | | | | 1,106,000 | | | | 35,429,013 | | | | (17,856,320 | ) | | | (620,878,059 | ) | | | (10,330,591 | ) | | | (359,566,836 | ) | |
Small Cap Value Fund | |
Class I | | | 3,712,196 | | | | 211,303,635 | | | | 585,859 | | | | 29,544,854 | | | | (2,907,640 | ) | | | (163,391,226 | ) | | | 1,390,415 | | | | 77,457,263 | | |
Class A | | | 216,885 | | | | 11,849,207 | | | | 50,148 | | | | 2,518,416 | | | | (549,145 | ) | | | (30,599,733 | ) | | | (282,112 | ) | | | (16,232,110 | ) | |
Class C | | | 8,392 | | | | 362,222 | | | | 18,263 | | | | 746,424 | | | | (114,623 | ) | | | (5,171,753 | ) | | | (87,968 | ) | | | (4,063,107 | ) | |
Total net increase
(decrease) | | | 3,937,473 | | | | 223,515,064 | | | | 654,270 | | | | 32,809,694 | | | | (3,571,408 | ) | | | (199,162,712 | ) | | | 1,020,335 | | | | 57,162,046 | | |
Small Cap Diversified Value Fund | |
Class I | | | 6,873,443 | | | | 70,018,521 | | | | 311,362 | | | | 2,939,253 | | | | (1,009,533 | ) | | | (11,095,154 | ) | | | 6,175,272 | | | | 61,862,620 | | |
Class A | | | 342,620 | | | | 3,855,009 | | | | 25,056 | | | | 235,526 | | | | (314,426 | ) | | | (3,316,111 | ) | | | 53,250 | | | | 774,424 | | |
Total net increase
(decrease) | | | 7,216,063 | | | | 73,873,530 | | | | 336,418 | | | | 3,174,779 | | | | (1,323,959 | ) | | | (14,411,265 | ) | | | 6,228,522 | | | | 62,637,044 | | |
75
| | | Sales | | Reinvestment of
dividends
and distributions | | Redemptions | | Net increase (decrease) | |
| | | Shares | | Amount | | Shares | | Amount | | Shares | | Amount | | Shares | | Amount | |
Year Ended June 30, 2019 | |
Global Value Fund | |
Class I | | | 2,725,481 | | | $ | 30,504,644 | | | | 67,154 | | | $ | 703,103 | | | | (26,507 | ) | | $ | (289,500 | ) | | | 2,766,128 | | | $ | 30,918,247 | | |
Class A | | | 8,904 | | | | 104,856 | | | | 2,046 | | | | 21,466 | | | | (45,473 | ) | | | (569,432 | ) | | | (34,523 | ) | | | (443,110 | ) | |
Total net increase
(decrease) | | | 2,734,385 | | | | 30,609,500 | | | | 69,200 | | | | 724,569 | | | | (71,980 | ) | | | (858,932 | ) | | | 2,731,605 | | | | 30,475,137 | | |
International Value Fund | |
Class I | | | 2,001 | | | | 21,502 | | | | 17,096 | | | | 158,651 | | | | — | | | | — | | | | 19,097 | | | | 180,153 | | |
Total net increase | | | 2,001 | | | | 21,502 | | | | 17,096 | | | | 158,651 | | | | — | | | | — | | | | 19,097 | | | | 180,153 | | |
Value Opportunities Fund | |
Class I | | | 9,090,629 | | | | 251,316,538 | | | | 1,402,218 | | | | 34,817,068 | | | | (4,463,690 | ) | | | (118,644,551 | ) | | | 6,029,157 | | | | 167,489,055 | | |
Class A | | | 1,882,824 | | | | 50,960,135 | | | | 334,897 | | | | 8,338,932 | | | | (2,041,709 | ) | | | (56,772,144 | ) | | | 176,012 | | | | 2,526,923 | | |
Class C | | | 338,598 | | | | 8,564,899 | | | | 141,075 | | | | 3,253,197 | | | | (424,959 | ) | | | (10,827,111 | ) | | | 54,714 | | | | 990,985 | | |
Total net increase
(decrease) | | | 11,312,051 | | | | 310,841,572 | | | | 1,878,190 | | | | 46,409,197 | | | | (6,930,358 | ) | | | (186,243,806 | ) | | | 6,259,883 | | | | 171,006,963 | | |
Capital Income Fund | |
Class I | | | 232,522 | | | | 2,958,701 | | | | 37,411 | | | | 455,601 | | | | (680,969 | ) | | | (8,351,275 | ) | | | (411,036 | ) | | | (4,936,973 | ) | |
Class A | | | 76,893 | | | | 965,650 | | | | 26,243 | | | | 332,136 | | | | (335,100 | ) | | | (4,236,826 | ) | | | (231,964 | ) | | | (2,939,040 | ) | |
Total net increase
(decrease) | | | 309,415 | | | | 3,924,351 | | | | 63,654 | | | | 787,737 | | | | (1,016,069 | ) | | | (12,588,101 | ) | | | (643,000 | ) | | | (7,876,013 | ) | |
High Yield Fund | |
Class I | | | 59,726,649 | | | | 696,746,581 | | | | 8,497,900 | | | | 99,162,717 | | | | (73,286,129 | ) | | | (851,438,038 | )2 | | | (5,061,580 | ) | | | (55,528,740 | ) | |
Class A | | | 2,183,160 | | | | 25,565,215 | | | | 2,014,600 | | | | 23,371,432 | | | | (17,577,424 | ) | | | (203,487,210 | )2 | | | (13,379,664 | ) | | | (154,550,563 | ) | |
Class C | | | 60,123 | | | | 695,682 | | | | 10,901 | | | | 127,097 | | | | (47,068 | ) | | | (552,304 | ) | | | 23,956 | | | | 270,475 | | |
Class Z | | | 8,481,470 | | | | 99,725,152 | | | | 389,944 | | | | 4,549,457 | | | | (2,180,399 | ) | | | (25,620,277 | ) | | | 6,691,015 | | | | 78,654,332 | | |
Total net increase
(decrease) | | | 70,451,402 | | | | 822,732,630 | | | | 10,913,345 | | | | 127,210,703 | | | | (93,091,020 | ) | | | (1,081,097,829 | ) | | | (11,726,273 | ) | | | (131,154,496 | ) | |
1 Net of redemption fees of $16,454 for Class I, $3,201 for Class A and $4,748 for Class Z. Effective September 30, 2019 the redemption fee was removed.
2 Net of redemption fees of $93,924 for Class I and $13,454 for Class A.
NOTE 6.
Investments in Affiliated Issuers. An issuer in which a Fund's holdings represent 5% or more of the outstanding voting securities of the issuer is an "affiliated" issuer as defined in the 1940 Act. A schedule of each Fund's investments in securities of affiliated issuers held during the six months ended December 31, 2019, is set forth below:
Small Cap Value Fund
| Issuer Name | | Value at
July 1, 2019 | | Purchases | | Sales | | Net Realized
Gains (Losses) | | Net Change in
Unrealized
Appreciation
(Depreciation) | | Value at
December 31,
2019 | | Dividends | | Shares
Held at
December 31,
2019 | |
Hudson Global, Inc. | | $ | 2,723,562 | | | $ | — | | | $ | — | | | $ | — | | | $ | (109,380 | ) | | $ | 2,614,182 | | | $ | — | | | | 218,760 | | |
MDC Partners, Inc. | | | 9,294,768 | | | | 734,340 | | | | — | | | | — | | | | 1,024,172 | | | | 11,053,280 | | | | — | | | | 3,976,000 | | |
Noranda Aluminum
Holding Corp. | | | 9,203 | | | | — | | | | — | | | | — | | | | (6,322 | ) | | | 2,881 | | | | — | | | | 800,300 | | |
| | | $ | 12,027,533 | | | $ | 734,340 | | | $ | — | | | $ | — | | | $ | 908,470 | | | $ | 13,670,343 | | | $ | — | | | | | | |
76
Value Opportunities Fund
| Issuer Name | | Value at
July 1, 2019 | | Purchases | | Sales | | Net Realized
Gains (Losses) | | Net Change in
Unrealized
Appreciation
(Depreciation) | | Value at
December 31,
2019 | | Dividends | | Shares
Held at
December 31,
2019 | |
Iracore Investments
Holdings, Inc. | | $ | 5,264,360 | | | $ | — | | | $ | — | | | $ | — | | | $ | 4,338,388 | | | $ | 9,602,748 | | | $ | — | | | | 32,422 | | |
Motors Liquidation
Company GUC Trust | | | 17,204,860 | | | | — | | | | — | | | | — | | | | (2,840,425 | ) | | | 14,364,435 | | | | — | | | | 1,623,100 | | |
| | $ | 22,469,220 | | | $ | — | | | $ | — | | | $ | — | | | $ | 1,497,963 | | | $ | 23,967,183 | | | $ | — | | | | | | |
High Yield Fund
| Issuer Name | | Value at
July 1, 2019 | | Purchases | | Sales | | Net Realized
Gains (Losses) | | Net Change in
Unrealized
Appreciation
(Depreciation) | | Value at
December 31,
2019 | | Dividends | | Shares
Held at
December 31,
2019 | |
American Zinc
Recycling LLC | | $ | 29,175,617 | | | $ | 7,361,568 | | | $ | — | | | $ | — | | | $ | (202,088 | ) | | $ | 36,335,097 | | | $ | — | | | | 114,835 | | |
Bellatrix Exploration
Ltd.+ | | | 1,612,791 | | | | — | | | | (814,034 | ) | | | (2,860,318 | ) | | | 2,061,996 | | | | 435 | | | | — | | | | 434,305 | | |
Iracore Investments
Holdings, Inc. | | | 3,587,078 | | | | — | | | | — | | | | — | | | | 2,956,131 | | | | 6,543,209 | | | | — | | | | 22,092 | | |
PetroQuest Energy, Inc. | | | 2,913,980 | | | | — | | | | — | | | | — | | | | (2,913,980 | ) | | | 0 | | | | — | | | | 728,495 | | |
RA Parent, Inc. | | | 10,482,767 | | | | — | | | | — | | | | — | | | | 863,167 | | | | 11,345,934 | | | | — | | | | 288 | | |
| | $ | 47,772,233 | | | $ | 7,361,568 | | | $ | (814,034 | ) | | $ | (2,860,318 | ) | | $ | 2,765,226 | | | $ | 54,224,675 | | | $ | — | | | | | | |
+ Issuer was not an affiliate as of December 31, 2019.
NOTE 7.
Securities Lending. Effective December 2007, the Funds entered into a securities lending arrangement with Brown Brothers Harriman & Co. (the "Custodian"). Under the securities lending agreement, the Custodian is authorized to loan securities on behalf of the Funds to approved brokers. In exchange, the Funds receive cash collateral in the amount of at least 102% of the value of the securities loaned plus accrued interest. The total market value of securities on loan for each Fund is disclosed on the Schedule of Investments. The cash collateral is invested in short-term instruments as noted on the Schedule of Investments. Income earned from these investments is included in "Securities on loan, net" on the Statements of Operations and is allocated to each Fund based on each Fund's proportion of the total cash collateral received. Securities lending involves counterparty risks, including the risk that the loaned securities may not be returned in a timely manner or at all. Subject to certain conditions, the Custodian has agreed to indemnify the Funds from losses resulting from a borrower's failure to return a loaned security. In addition, the Funds bear the risk of loss associated with the investment of cash collateral received.
A portion of the income generated by the investment of the collateral, net of any rebates paid by the Custodian to borrowers, is remitted to the Custodian as lending agent, and the remainder is paid to the applicable Fund.
NOTE 8.
Commitments and Contingencies. Under the Trust's organizational documents and indemnification agreements between each independent Trustee and the Trust, its officers and Trustees are indemnified against certain liability arising out of the performance of their duties to the Trust. In addition, in the normal course of business the Trust enters into contracts that contain a variety of representations and warranties, which provide general indemnifications. The Funds' maximum exposure under these arrangements is unknown, as this would involve future claims that may be made against the Funds. However, based on experience, the Funds expect the risk of loss to be remote.
Bridge loan commitments may obligate a Fund to furnish temporary financing to a borrower until permanent financing can be arranged. At December 31, 2019, the Funds did not have any outstanding bridge loan commitments.
Unfunded loan commitments are contractual obligations for funding to a borrower. At December 31, 2019, the Value Opportunities Fund had an outstanding unfunded loan commitment of $7,500,000.
NOTE 9.
Risk Factors. Investing in a Fund may involve certain risks including, but not limited to, those described below.
Lower rated debt securities generally have higher rates of interest and involve greater risk of default or price changes due to changes in the issuer's creditworthiness than higher rated debt securities. The market prices of these securities may fluctuate more than higher quality securities and may decline significantly in periods of general economic difficulty. There may be little trading in the secondary market for particular debt securities, which may make them more difficult to value or sell.
77
The prices of, and the income generated by, most debt securities held by a Fund may be affected by changing interest rates and by changes in the effective maturities and credit ratings of these securities. For example, the prices of debt securities in a Fund's portfolio generally will decline when interest rates rise and increase when interest rates fall. In addition, falling interest rates may cause an issuer to redeem, "call" or refinance a security before its stated maturity, which may result in the Fund having to reinvest the proceeds in lower yielding securities. Debt securities are also subject to credit risk, which is the possibility that the credit strength of an issuer will weaken and/or an issuer of a debt security will fail to make timely payments of principal or interest and the security will go into default. Longer maturity debt securities generally have higher rates of interest and may be subject to greater price fluctuations than shorter maturity debt securities.
Certain Funds may invest in foreign (non-U.S.) securities and may experience more rapid and extreme changes in value than a fund that invests exclusively in securities of U.S. companies. The securities markets of many foreign countries are relatively small, with a limited number of companies representing a small number of industries. Additionally, reporting, accounting and auditing standards of foreign countries differ, in some cases significantly, from U.S. standards. Also, nationalization, expropriation or confiscatory taxation, currency blockage, political changes or diplomatic developments could adversely affect a Fund's investments in a foreign country.
The Funds are subject to management risk because each Fund is an actively managed investment portfolio. Consequently, the Funds are subject to the risks that the methods and analysis employed by the Advisor may not produce the desired results and result in losses to the Funds.
The prices of, and the income generated by, the common stocks and other equity securities held by a Fund may decline in response to certain events taking place around the world, including those directly involving the issuers whose securities are owned by the Fund; conditions affecting the general economy; overall market changes; local, regional or global political, social or economic instability; governmental or governmental agency responses to economic conditions; and currency, interest rate and commodity price fluctuations.
Certain funds, accounts, individuals or affiliates may from time to time own (beneficially or of record) or control a significant percentage of a Fund's shares. Redemptions by these entities of their holdings in the Fund may impact the Fund's liquidity and net asset value ("NAV"). These redemptions may also force the Fund to sell securities.
NOTE 10.
Class R Shares. The Board approved closing the Class R shares of the Large Cap Value Fund and Mid-Cap Value Fund and converting Class R shares to Class A shares of each respective Fund effective on August 29, 2019 (the "Conversion"). The Conversion was accomplished by a tax-free exchange of Class R shares for Class A shares in the following amounts and at the following conversion ratios:
| | Class R Prior to Conversion | | | |
| | Dollars | | Shares | | Conversion Ratio | | Class A Shares | |
Large Cap Value | | $ | 4,553,437 | | | | 143,415 | | | | 1.010825 | | | | 144,968 | | |
Mid-Cap Value | | | 3,425,121 | | | | 121,286 | | | | 1.000354 | | | | 121,329 | | |
NOTE 11.
New Accounting Pronouncements. In March 2017, the FASB issued Accounting Standards Update ("ASU") No. 2017-08, Receivables — Nonrefundable Fees and Other Costs (Subtopic 310-20): Premium Amortization on Purchased Callable Debt Securities. The amendments in the ASU shorten the amortization period for certain callable debt securities, held at a premium, to be amortized to the earliest call date. The ASU does not require an accounting change for securities held at a discount, which continues to be amortized to maturity. The ASU is effective for fiscal years and interim periods within those fiscal years beginning after December 15, 2018. Management has evaluated this provision and there was no material impact on the Funds' financial statements.
In August 2018, FASB issued ASU No. 2018-13, Fair Value Measurement (Topic 820): Disclosure Framework — Changes to the Disclosure Requirements for Fair Value Measurement. The primary focus of ASU No. 2018-13 is to improve the effectiveness of the disclosure requirements for fair value measurements. In general, the amendments in ASU No. 2018-13 are effective for all entities for fiscal years and interim periods within those fiscal years, beginning after December 15, 2019. An entity is permitted to early adopt all or portions of ASU No. 2018-13. Management has implemented portions of the amendments and there was no material impact on the Funds' financial statements. Management is currently evaluating the impact of the additional disclosure requirements.
NOTE 12.
Subsequent Events. On November 25, 2019, U.S. Bancorp, the parent company of Quasar, announced that it had signed a purchase agreement to sell Quasar to Foreside Financial Group, LLC ("Foreside") such that Quasar will become a wholly-owned broker-dealer subsidiary of Foreside. The transaction is expected to close by the end of March 2020. The Board approved Quasar to remain as the Funds' distributor at the close of the transaction.
Management has evaluated subsequent events in the preparation of the Funds' financial statements and has determined that there are no additional events that require recognition or disclosure in the financial statements.
NOTE 13.
Federal Tax Disclosure. The Funds designated as long-term capital gain dividends, pursuant to Internal Revenue Code Section 852(b)(3), the amount necessary to reduce the earnings and profits of the Funds related to net capital gains to zero for the tax year ended June 30, 2019.
For the year ended June 30, 2019, the following percentages of ordinary distributions paid qualify for the dividend received deduction available to corporate shareholders: Diversified Value Fund — 100.00%, Large Cap Value Fund — 100.00%, Mid-Cap Value Fund — 58.49%, Small Cap Value
78
Fund — 43.65%, Small Cap Diversified Value Fund — 27.01%, Global Value Fund — 25.77%, International Value Fund — 0.00%, Value Opportunities Fund — 30.53%, Capital Income Fund — 16.90%, High Yield Fund — 0.21%.
For the year ended June 30, 2019, the following percentages of ordinary distributions paid are designated as qualified dividend income under the Jobs and Growth Tax Relief Reconciliation Act of 2003: Diversified Value Fund — 100.00%, Large Cap Value Fund — 100.00%, Mid-Cap Value Fund — 66.82%, Small Cap Value Fund — 54.56%, Small Cap Diversified Value Fund — 27.30%, Global Value Fund — 74.53%, International Value Fund — 100.00%, Value Opportunities Fund — 44.18%, Capital Income Fund — 35.12%, High Yield Fund — 0.21%. Shareholders should consult their tax advisors.
For the year ended June 30, 2019, the Global Value Fund and International Value Fund earned foreign source income of $455,929 and $71,885, respectively, and paid foreign taxes of $40,415 and $5,473, respectively, which each Fund intends to pass through to shareholders pursuant to Section 853 of the Internal Revenue Code.
Additional Information Applicable to Foreign Shareholders Only. For the year ended June 30, 2019, the Funds designate the following percentages of ordinary distributions paid as interest-related dividends under Internal Revenue Code Section 871(k)(1)(c): Diversified Value Fund — 0.23%, Large Cap Value Fund — 0.81%, Mid-Cap Value Fund — 0.63%, Small Cap Value Fund — 0.57%, Small Cap Diversified Value Fund — 0.56%, Global Value Fund — 0.51%, International Value Fund — 0.46%, Value Opportunities Fund — 6.68%, Capital Income Fund — 61.47%, High Yield Fund — 91.33%.
For the year ended June 30, 2019, the following percentages of ordinary income distributions paid are designated as short-term capital gain distributions under Internal Revenue Code Section 871(k)(2)(c): Diversified Value Fund — 0.00%, Large Cap Value Fund — 6.41%, Mid-Cap Value Fund — 34.86%, Small Cap Value Fund — 72.48%, Small Cap Diversified Value Fund — 79.73%, Global Value Fund — 47.83%, International Value Fund — 22.18%, Value Opportunities Fund — 75.67%, Capital Income Fund — 0.00%, High Yield Fund — 0.00%.
79
Fund Expense Examples (Unaudited)
As a mutual fund shareholder, you incur two types of costs: (1) transaction costs such as initial sales charges (loads) on purchase payments and contingent deferred sales charges and redemption fees on redemptions and (2) ongoing costs, including management fees, distribution and service (12b-1) fees and other fund expenses. The following examples are intended to help you understand your ongoing costs (in dollars) of investing in the Funds and to compare these costs with the ongoing costs of investing in other mutual funds. The examples are based on an investment of $1,000 invested at the beginning of the most recent six-month period and held for the entire period (July 1, 2019 – December 31, 2019).
The table below illustrates the Funds' costs in two ways:
Based on actual fund returns. This section provides information about actual account values and actual expenses. You may use the information in this section, together with the amount you invested, to estimate the expenses that you paid over the period. Simply divide your account value by $1,000 (for example, an $8,600 account value divided by $1,000 = 8.6), then multiply the result by the number in the section under the heading entitled "Expenses Paid During Period" to estimate the expenses you paid on your account during this period.
Based on hypothetical 5% yearly returns. This section provides information about hypothetical account values and hypothetical expenses based on the Funds' actual expense ratios and an assumed rate of return of 5% per year before expenses, which is not the Funds' actual return. The hypothetical account values and expenses may not be used to estimate the actual ending account balance or expenses you paid for the period. You may use this information to compare the ongoing costs of investing in the Funds and other funds. To do so, compare this 5% hypothetical example with the 5% hypothetical examples that appear in the shareholder reports of the other funds.
Please note that the expenses shown in the table are meant to highlight your ongoing costs only and do not reflect any transactional costs, such as sales charges (loads). Therefore, the second section is useful in comparing ongoing costs only, and will not help you determine the relative total costs of owning different funds. In addition, if these transactional costs were included, your costs would have been higher.
The calculations assume no shares were bought or sold during the period. Your actual costs may have been higher or lower, depending on the amount of your investment and the timing of any purchases or redemptions.
| | Based on Actual Fund Returns | | Based on Hypothetical 5% Yearly Returns | |
| | Beginning
Account Value
7/1/19 | | Ending
Account Value
12/31/19 | | Expenses Paid
During Period*
7/1/19 - 12/31/19 | | Beginning
Account Value
7/1/19 | | Ending
Account Value
12/31/19 | | Expenses Paid
During Period*
7/1/19 - 12/31/19 | | Annualized
Expense Ratio | |
Diversified Value Fund | |
Class I | | $ | 1,000.00 | | | $ | 1,081.90 | | | $ | 4.19 | | | $ | 1,000.00 | | | $ | 1,021.11 | | | $ | 4.06 | | | | 0.80 | % | |
Class A | | | 1,000.00 | | | | 1,081.00 | | | | 5.49 | | | | 1,000.00 | | | | 1,019.86 | | | | 5.33 | | | | 1.05 | | |
Class C | | | 1,000.00 | | | | 1,077.20 | | | | 9.40 | | | | 1,000.00 | | | | 1,016.09 | | | | 9.12 | | | | 1.80 | | |
Large Cap Value Fund | |
Class I | | | 1,000.00 | | | | 1,081.40 | | | | 4.92 | | | | 1,000.00 | | | | 1,020.41 | | | | 4.77 | | | | 0.94 | | |
Class A | | | 1,000.00 | | | | 1,079.50 | | | | 6.22 | | | | 1,000.00 | | | | 1,019.15 | | | | 6.04 | | | | 1.19 | | |
Class C | | | 1,000.00 | | | | 1,076.30 | | | | 9.81 | | | | 1,000.00 | | | | 1,015.69 | | | | 9.53 | | | | 1.88 | | |
Class Z | | | 1,000.00 | | | | 1,087.30 | | | | 2.12 | ** | | | 1,000.00 | | | | 1,021.06 | | | | 4.12 | | | | 0.81 | | |
Mid-Cap Value Fund | |
Class I | | | 1,000.00 | | | | 1,007.10 | | | | 5.35 | | | | 1,000.00 | | | | 1,019.81 | | | | 5.38 | | | | 1.06 | | |
Class A | | | 1,000.00 | | | | 1,006.00 | | | | 6.20 | | | | 1,000.00 | | | | 1,018.95 | | | | 6.24 | | | | 1.23 | | |
Class C | | | 1,000.00 | | | | 1,002.30 | | | | 9.92 | | | | 1,000.00 | | | | 1,015.23 | | | | 9.98 | | | | 1.97 | | |
Class Z | | | 1,000.00 | | | | 1,087.30 | | | | 2.26 | ** | | | 1,000.00 | | | | 1,020.81 | | | | 4.37 | | | | 0.86 | | |
Small Cap Value Fund | |
Class I | | | 1,000.00 | | | | 1,063.90 | | | | 5.45 | | | | 1,000.00 | | | | 1,019.86 | | | | 5.33 | | | | 1.05 | | |
Class A | | | 1,000.00 | | | | 1,062.80 | | | | 6.48 | | | | 1,000.00 | | | | 1,018.85 | | | | 6.34 | | | | 1.25 | | |
Class C | | | 1,000.00 | | | | 1,058.90 | | | | 10.09 | | | | 1,000.00 | | | | 1,015.33 | | | | 9.88 | | | | 1.95 | | |
Class Z | | | 1,000.00 | | | | 1,087.20 | | | | 2.23 | ** | | | 1,000.00 | | | | 1,020.86 | | | | 4.32 | | | | 0.85 | | |
Small Cap Diversified Value Fund | |
Class I | | | 1,000.00 | | | | 1,077.80 | | | | 4.33 | | | | 1,000.00 | | | | 1,020.96 | | | | 4.22 | | | | 0.83 | | |
Class A | | | 1,000.00 | | | | 1,076.00 | | | | 5.69 | | | | 1,000.00 | | | | 1,019.66 | | | | 5.53 | | | | 1.09 | | |
Class Z | | | 1,000.00 | | | | 1,084.50 | | | | 2.10 | ** | | | 1,000.00 | | | | 1,021.11 | | | | 4.06 | | | | 0.80 | | |
Global Value Fund | |
Class I | | | 1,000.00 | | | | 1,079.10 | | | | 4.96 | | | | 1,000.00 | | | | 1,020.36 | | | | 4.82 | | | | 0.95 | | |
Class A | | | 1,000.00 | | | | 1,078.00 | | | | 6.27 | | | | 1,000.00 | | | | 1,019.10 | | | | 6.09 | | | | 1.20 | | |
80
Fund Expense Examples (Unaudited)
| | Based on Actual Fund Returns | | Based on Hypothetical 5% Yearly Returns | |
| | Beginning
Account Value
7/1/19 | | Ending
Account Value
12/31/19 | | Expenses Paid
During Period*
7/1/19 - 12/31/19 | | Beginning
Account Value
7/1/19 | | Ending
Account Value
12/31/19 | | Expenses Paid
During Period*
7/1/19 - 12/31/19 | | Annualized
Expense Ratio | |
International Value Fund | |
Class I | | $ | 1,000.00 | | | $ | 1,105.10 | | | $ | 5.03 | | | $ | 1,000.00 | | | $ | 1,020.36 | | | $ | 4.82 | | | | 0.95 | % | |
Value Opportunities Fund | |
Class I | | | 1,000.00 | | | | 1,056.70 | | | | 4.96 | | | | 1,000.00 | | | | 1,020.31 | | | | 4.88 | | | | 0.96 | | |
Class A | | | 1,000.00 | | | | 1,055.50 | | | | 6.25 | | | | 1,000.00 | | | | 1,019.05 | | | | 6.14 | | | | 1.21 | | |
Class C | | | 1,000.00 | | | | 1,051.60 | | | | 9.85 | | | | 1,000.00 | | | | 1,015.53 | | | | 9.68 | | | | 1.91 | | |
Class Z | | | 1,000.00 | | | | 1,068.00 | | | | 2.18 | ** | | | 1,000.00 | | | | 1,020.91 | | | | 4.27 | | | | 0.84 | | |
Capital Income Fund | |
Class I | | | 1,000.00 | | | | 1,039.80 | | | | 4.10 | | | | 1,000.00 | | | | 1,021.11 | | | | 4.06 | | | | 0.80 | | |
Class A | | | 1,000.00 | | | | 1,039.30 | | | | 5.38 | | | | 1,000.00 | | | | 1,019.86 | | | | 5.33 | | | | 1.05 | | |
High Yield Fund | |
Class I | | | 1,000.00 | | | | 1,016.20 | | | | 3.55 | | | | 1,000.00 | | | | 1,021.62 | | | | 3.56 | | | | 0.70 | | |
Class A | | | 1,000.00 | | | | 1,014.80 | | | | 4.81 | | | | 1,000.00 | | | | 1,020.36 | | | | 4.82 | | | | 0.95 | | |
Class C | | | 1,000.00 | | | | 1,011.40 | | | | 8.29 | | | | 1,000.00 | | | | 1,016.89 | | | | 8.31 | | | | 1.64 | | |
Class Z | | | 1,000.00 | | | | 1,016.70 | | | | 3.04 | | | | 1,000.00 | | | | 1,022.12 | | | | 3.05 | | | | 0.60 | | |
* Expenses are equal to the Funds' annualized expense ratio by class multiplied by the average account value over the period, multiplied by the number of days in the most recent fiscal half-year (184), then divided by the number of days in the most recent fiscal year (366).
** Actual expenses are equal to the Fund's annualized expense ratio for Class Z multiplied by the average account value over the period, multiplied by 92/366 (to reflect the commencement of operations to December 31, 2019).
81
Information about the Funds
ADVISOR
Hotchkis & Wiley Capital Management, LLC
601 South Figueroa Street, 39th Floor
Los Angeles, California 90017
LEGAL COUNSEL
Vedder Price P.C.
222 North LaSalle Street
Chicago, Illinois 60601
INDEPENDENT REGISTERED PUBLIC ACCOUNTING FIRM
Deloitte & Touche LLP
555 West 5th Street
Los Angeles, California 90013
DISTRIBUTOR
Quasar Distributors, LLC
777 East Wisconsin Avenue, 6th Floor
Milwaukee, Wisconsin 53202
ADMINISTRATOR AND TRANSFER AGENT
U.S. Bancorp Fund Services, LLC
615 East Michigan Street
Milwaukee, Wisconsin 53202
CUSTODIAN
Brown Brothers Harriman & Co.
50 Post Office Square
Boston, Massachusetts 02110
This report is for the information of shareholders of the Hotchkis & Wiley Funds, but may also be used as sales literature when preceded or accompanied by a current prospectus, which gives details about charges, expenses, investment objectives and operating policies of the Funds.
A description of the policies and procedures that the Funds use to determine how to vote proxies relating to portfolio securities is included in the Statement of Additional Information, which is available without charge, upon request, by calling 1-866-HW-FUNDS (1-866-493-8637) and on the Securities and Exchange Commission's ("SEC") website at http://www.sec.gov.
Information regarding how the Funds voted proxies relating to portfolio securities during the most recent 12-month period ended June 30 is available without charge on the Funds' website at www.hwcm.com and on the SEC's website at http://www.sec.gov.
Hotchkis & Wiley Funds files a complete schedule of portfolio holdings with the SEC for the first and third quarters of each fiscal year on Form N-PORT. The Funds' Forms N-PORT are available free of charge on the SEC's website at http://www.sec.gov.
601 SOUTH FIGUEROA STREET, 39th Floor
LOS ANGELES, CALIFORNIA 90017-5439
www.hwcm.com
1.866.HW.FUNDS (1.866.493.8637)
Item 2. Code of Ethics.
Not applicable for semi-annual reports.
Item 3. Audit Committee Financial Expert.
Not applicable for semi-annual reports.
Item 4. Principal Accountant Fees and Services.
Not applicable for semi-annual reports.
Item 5. Audit Committee of Listed Registrants.
Not applicable to registrants who are not listed issuers (as defined in Rule 10A-3 under the Securities Exchange Act of 1934).
Item 6. Investments.
Schedule of Investments is included as part of the report to shareholders filed under Item 1 of this Form.
Item 7. Disclosure of Proxy Voting Policies and Procedures for Closed-End Management Investment Companies.
Not applicable to open-end investment companies.
Item 8. Portfolio Managers of Closed-End Management Investment Companies.
Not applicable to open-end investment companies.
Item 9. Purchases of Equity Securities by Closed-End Management Investment Company and Affiliated Purchasers.
Not applicable to open-end investment companies.
Item 10. Submission of Matters to a Vote of Security Holders.
The identification and recommendation of individuals for Board membership is the responsibility of the Nominating and Governance Committee. Shareholders may submit suggestions for candidates by forwarding their correspondence by U.S. mail or other courier service to the registrant’s Secretary for the attention of the Chair of the Nominating and Governance Committee, 601 South Figueroa Street, 39th Floor, Los Angeles, CA 90017-5704.
Item 11. Controls and Procedures.
(a) The registrant’s President / Principal Executive Officer and Treasurer / Principal Financial Officer have reviewed the registrant’s disclosure controls and procedures (as defined in Rule 30a-3(c) under the Investment Company Act of 1940 (the “Act”)) as of a date within 90 days of the filing of this report, as required by Rule 30a-3(b) under the Act and Rules 13a-15(b) or 15d-15(b) under the Securities Exchange Act of 1934. Based on their review, such officers have concluded that the disclosure controls and procedures are effective in ensuring that information required to be disclosed in this report is appropriately recorded, processed, summarized and reported and made known to them by others within the registrant and by the registrant’s service provider.
(b) There were no changes in the registrant’s internal control over financial reporting (as defined in Rule 30a-3(d) under the Act) that occurred during the second fiscal quarter of the period covered by this report that have materially affected, or are reasonably likely to materially affect, the registrant’s internal control over financial reporting.
Item 12. Disclosure of Securities Lending Activities for Closed-End Management Investment Companies.
Not applicable to open-end investment companies.
Item 13. Exhibits.
(a) (1) Any code of ethics or amendment thereto, that is the subject of the disclosure required by Item 2, to the extent that the registrant intends to satisfy Item 2 requirements through filing an exhibit. Not applicable.
(2) A separate certification for each principal executive officer and principal financial officer pursuant to Section 302 of the Sarbanes-Oxley Act of 2002. Filed herewith.
(3) Any written solicitation to purchase securities under Rule 23c-1 under the Act sent or given during the period covered by the report by or on behalf of the registrant to 10 or more persons. Not applicable to open-end investment companies.
(4) Change in the registrant’s independent public accountant. There was no change in the registrant’s independent public accountant for the period covered by this report.
(b) Certifications pursuant to Section 906 of the Sarbanes-Oxley Act of 2002. Furnished herewith.
2
SIGNATURES
Pursuant to the requirements of the Securities Exchange Act of 1934 and the Investment Company Act of 1940, the registrant has duly caused this report to be signed on its behalf by the undersigned, thereunto duly authorized.
(Registrant) | Hotchkis & Wiley Funds | |
|
By (Signature and Title) | /s/ Anna Marie Lopez | |
| Anna Marie Lopez, President / Principal Executive Officer |
|
Date | 2/27/20 | |
| | | | |
Pursuant to the requirements of the Securities Exchange Act of 1934 and the Investment Company Act of 1940, this report has been signed below by the following persons on behalf of the registrant and in the capacities and on the dates indicated.
By (Signature and Title) | /s/ Anna Marie Lopez | |
| Anna Marie Lopez, President / Principal Executive Officer |
|
Date | 2/27/20 | |
|
By (Signature and Title) | /s/ James Menvielle | |
| James Menvielle, Treasurer / Principal Financial Officer |
|
Date | 2/27/20 | |
| | | |
3