UNITED STATES
SECURITIES AND EXCHANGE COMMISSION
Washington, D.C. 20549
FORM N-CSR
CERTIFIED SHAREHOLDER REPORT OF REGISTERED
MANAGEMENT INVESTMENT COMPANIES
Investment Company Act file number | 811-10487 |
|
Hotchkis & Wiley Funds |
(Exact name of registrant as specified in charter) |
|
725 South Figueroa Street, 39th Floor
Los Angeles, California | |
90017-5439
|
(Address of principal executive offices) | | (Zip code) |
|
Anna Marie Lopez Hotchkis & Wiley Capital Management, LLC 725 South Figueroa Street, 39th Floor Los Angeles, California 90017-5439 |
(Name and address of agent for service) |
|
Copies to: Maureen A. Miller, Esq. Joseph M. Mannon, Esq. Vedder Price P.C. 222 North LaSalle Street, 26th Floor Chicago, Illinois 60601 |
(Counsel for the registrant) |
|
Registrant’s telephone number, including area code: | (213) 430-1000 | |
|
Date of fiscal year end: | June 30, 2018 | |
|
Date of reporting period: | June 30, 2018 | |
| | | | | | | | |
Item 1. Reports to Stockholders.

Hotchkis & Wiley Funds
Annual Report
JUNE 30, 2018
DIVERSIFIED VALUE FUND
LARGE CAP VALUE FUND
MID-CAP VALUE FUND
SMALL CAP VALUE FUND
SMALL CAP DIVERSIFIED VALUE FUND
GLOBAL VALUE FUND
INTERNATIONAL VALUE FUND
VALUE OPPORTUNITIES FUND
CAPITAL INCOME FUND
HIGH YIELD FUND

SHAREHOLDER LETTER | | | 1 | | |
| FUND INFORMATION | | | 4 | | |
| FUND PERFORMANCE DATA | | | 6 | | |
SCHEDULE OF INVESTMENTS: | |
| DIVERSIFIED VALUE FUND | | | 16 | | |
| LARGE CAP VALUE FUND | | | 18 | | |
| MID-CAP VALUE FUND | | | 20 | | |
| SMALL CAP VALUE FUND | | | 22 | | |
| SMALL CAP DIVERSIFIED VALUE FUND | | | 24 | | |
| GLOBAL VALUE FUND | | | 31 | | |
| INTERNATIONAL VALUE FUND | | | 33 | | |
| VALUE OPPORTUNITIES FUND | | | 35 | | |
| CAPITAL INCOME FUND | | | 39 | | |
| HIGH YIELD FUND | | | 47 | | |
| STATEMENTS OF ASSETS & LIABILITIES | | | 53 | | |
| STATEMENTS OF OPERATIONS | | | 55 | | |
| STATEMENTS OF CHANGES IN NET ASSETS | | | 57 | | |
| FINANCIAL HIGHLIGHTS | | | 62 | | |
| NOTES TO THE FINANCIAL STATEMENTS | | | 67 | | |
| REPORT OF INDEPENDENT REGISTERED PUBLIC ACCOUNTING FIRM | | | 83 | | |
| FUND EXPENSE EXAMPLES | | | 84 | | |
BOARD CONSIDERATIONS IN APPROVING CONTINUATION OF
INVESTMENT ADVISORY AGREEMENTS | | | 86 | | |
| MANAGEMENT | | | 88 | | |
INFORMATION ABOUT THE FUNDS | | | BACK COVER | | |
DEAR SHAREHOLDER:
The following investment review and annual report relates to the activities of the Hotchkis & Wiley Funds for the twelve-month period ended June 30, 2018.
OVERVIEW
The S&P 500® Index returned +14.4% and the Russell Developed Index returned +12.1% (in US dollar terms) over the twelve-month period ended June 30, 2018. The positive performance from global equities suggests that for the time being, investors are choosing to focus on strong corporate earnings as opposed to trade war risks and geopolitical tensions. Global earnings grew more than +30% year-over-year in the most recently reported quarter, with many companies reporting earnings growth of more than 50% from a year ago. Interestingly, the composition of this fastest-growing cohort was broadly distributed across sectors even though stock performance across sectors has varied significantly.
There were large performance differences between sectors, with information technology, energy, and consumer discretionary leading the way and non-cyclical sectors lagging. Globally, growth outperformed value over the past 12 months, which poses a challenge to our value-focused investment approach. Fortunately, markets move in cycles, and this headwind can shift into a tailwind when value comes back into vogue.
The valuation of broad equity markets across the globe appears above average, but this is heavily influenced by certain market segments that we view as considerably overvalued. Valuation spreads are wide. In light of value's underperformance, we are often asked what would serve as the catalyst to bring value back into vogue; unfortunately we do not have a definitive answer. A rise in interest rates should favor value stocks, which are shorter duration instruments than growth stocks. An economic slowdown could favor value if the revenue/earnings projections for growth stocks fail to live up to the rosy expectations embedded in the elevated valuation multiples. Perhaps the "catalyst" will be investors' eventual recognition of the wide valuation disparity across equity markets, as has often been the case. While the timing is uncertain, we are confident that the cycle will shift in favor of value once again.
The ICE BofAML U.S. High Yield Index ((high yield market) one-year return posted a gain of 2.53%) was positive but only slightly so. After several rate hikes, the Federal Funds Target Rate now stands at 2.0%, and the yield curve has flattened but is not inverted. Lower rated high yield credits absorbed the rate hikes better than the BB- rated cohort, and thus outperformed over the twelve-month period. The broad high yield market closed the period with a yield-to-worst of 6.53% and a spread over treasuries of 371 basis points — modestly higher than one year ago.
While credit valuations are not overly exciting, the high yield market continued to demonstrate signs of good health. The trailing 12 month default rate closed just above 2% as of June 30, well below its long-term average. Revenue and profits continued to grow at a modest yet decidedly positive pace. The overall high yield market has shrunk as fund flows have been negative, particularly in high yield ETFs, and most new issuance coming to market has been for refinancing. Leverage has shown nascent signs of rising but this has not worried rating
agencies, whose upgrades have considerably outpaced downgrades. Also, despite lower inventories at primary dealers — the byproduct of a more stringent regulatory environment — liquidity across the high yield market has continued to improve.
HOTCHKIS & WILEY DIVERSIFIED VALUE FUND
The Fund's Class I shares had a total return of 9.81% for the one year ended June 30, 2018 compared to the Russell 1000® Value Index return of 6.77%.
The Fund's Class I shares outperformed the Russell 1000® Value Index over the twelve-month period. The overweight position in energy, which was the Fund's and the market's top-performing sector, helped relative performance but not as much as positive stock selection in the sector helped. The Fund's energy stocks returned +42% compared to +23% for the index's energy stocks. Positive stock selection in consumer staples and health care also helped performance, along with the overweight exposure to information technology. Stock selection in consumer discretionary, financials, and information technology were performance detractors. The largest positive contributors to relative performance were Marathon Oil, Microsoft, Hess, Hewlett Packard Enterprise, and Royal Dutch Shell; the largest detractors were AIG, Johnson Controls, Oracle, Goodyear Tire, and Cummins.
HOTCHKIS & WILEY LARGE CAP VALUE FUND
The Fund's Class I shares had a total return of 10.01% for the one year ended June 30, 2018 compared to the Russell 1000® Value Index return of 6.77%.
The Fund's Class I shares outperformed the Russell 1000® Value Index over the twelve-month period. The exposure to energy was the largest positive contributor in the period, as both the overweight allocation and positive stock selection worked in the Fund's favor. Positive stock selection in consumer staples and health care also helped, as did the overweight position in information technology — the market's best performing sector after energy. Stock selection in financials, information technology, and materials hurt performance relative to the benchmark. The largest individual contributors to relative performance were Marathon Oil, Microsoft, Hess, Hewlett Packard Enterprise, and General Electric; the largest detractors were AIG, Johnson Controls, Oracle, Vodafone, and Cummins.
HOTCHKIS & WILEY MID-CAP VALUE FUND
The Fund's Class I shares had a total return of 14.32% for the one year ended June 30, 2018 compared to the Russell Midcap® Value Index return of 7.60%.
The Fund's Class I shares outperformed the Russell Midcap® Value Index over the twelve-month period. Positive stock selection in industrials, utilities, and financials contributed to the outperformance, along with the overweight exposures to energy and information technology. Stock selection in health care and consumer discretionary detracted from performance, as did the lack of exposure to materials. The largest individual positive contributors were Whiting Petroleum, NRG Energy, Cairn Energy, Kohl's, and Navistar; the largest detractors were Office Depot, Ophir Energy, Goodyear Tire, Bed Bath & Beyond, and ARRIS International.
1
HOTCHKIS & WILEY SMALL CAP VALUE FUND
The Fund's Class I shares had a total return of 13.33% for the one year ended June 30, 2018 compared to the Russell 2000® Value Index return of 13.10%.
Over the twelve-month period, the Fund's Class I shares outperformed the Russell 2000® Value Index. The Fund was overweight energy, which was among the market's best performing sectors. The Fund's energy positions also outperformed the index's energy positions. This overweight and positive stock selection combined lead to the Fund's outperformance over the period. Positive stock selection in financials and the overweight position in industrials also helped. Stock selection in consumer discretionary and industrials detracted from performance, as did the underweight exposure to health care which was the index's top performer. The largest individual positive contributors to relative performance were Whiting Petroleum, TCF Financial, Matson, Oppenheimer Holdings, and PBF Energy; the largest detractors were Office Depot, WestJet Airlines, ARRIS International, Elah Holdings, and Tutor Perini.
HOTCHKIS & WILEY SMALL CAP DIVERSIFIED VALUE FUND
The Fund's Class I shares had a total return of 17.48% for the one year ended June 30, 2018 compared to the Russell 2000® Value Index return of 13.10%.
The Fund's Class I shares outperformed the Russell 2000® Value Index over the twelve-month period, largely due to positive stock selection. Stock selection was positive in 9 of the 11 GICS® sectors over the course of the year. It was most positive in energy, financials, and industrials. The Fund was overweight stocks with a market cap of less than $1 billion, which outperformed the rest of the market and thus helped relative performance. The underweight position and stock selection in health care detracted from performance.
HOTCHKIS & WILEY GLOBAL VALUE FUND
The Fund's Class I shares had a total return of 9.59% for the one year ended June 30, 2018 compared to the Russell Developed Index return of 12.09%.
Over the twelve-month period, the Fund's Class I shares underperformed the Russell Developed Index. The Fund's value approach was a large headwind during the year as global growth stocks outperformed global value stocks by a wide margin. Large cap growth constituents in information technology and consumer discretionary led the market, and our absence in these position hurt relative performance. The overweight position in financials also detracted from returns. The overweight position and positive stock selection in energy helped relative performance in the year, along with positive stock selection in consumer staples. The largest individual detractors to relative performance were AIG, WestJet Airlines, Ophir Energy, Office Depot, and ARRIS International; the largest positive contributors were Whiting Petroleum, Hewlett Packard Enterprise, Royal Mail, Tesco, and Marathon Oil.
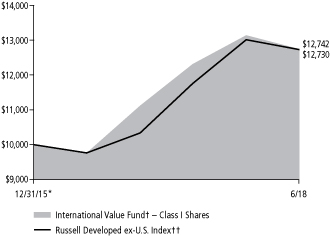
HOTCHKIS & WILEY INTERNATIONAL VALUE FUND
The Fund's Class I shares had a total return of 3.50% for the one year ended June 30, 2018 compared to the Russell Developed ex-U.S. Index return of 8.29%.
The Fund's Class I shares underperformed the Russell Developed ex-U.S. Index over the twelve-month period. International growth stocks outperformed international value stocks by a large magnitude, which presented a brisk headwind for our value approach compared to our core benchmark. The underweight allocation and stock selection in materials also detracted from performance, along with stock selection in information technology and consumer discretionary. Positive stock selection in consumer staples and the overweight positions in both information technology and energy helped relative performance. The largest individual detractors to relative performance were WestJet Airlines, Ophir Energy, ARRIS International, Societe Generale, and Draegerwerk; the largest positive contributors were Tesco, Royal Mail, Embraer, WorleyParsons, and Frank's International.
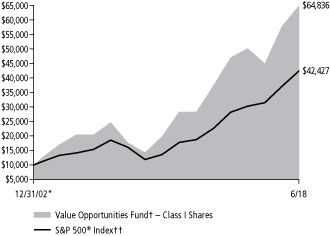
HOTCHKIS & WILEY VALUE OPPORTUNITIES FUND
The Fund's Class I shares had a total return of 12.11% for the one year ended June 30, 2018 compared to the S&P 500® Index return of 14.37%.
Over the twelve-month period, the Fund's Class I shares underperformed the S&P 500® Index. The Fund's value focus hurt performance relative to the core benchmark as a handful of large growth stocks that we did not own led the market. Accordingly, our positions in consumer discretionary and information technology lagged the S&P 500® Index's performance in these sectors. The overweight exposure and stock selection in financials also detracted from performance. The overweight allocation and positive security selection in energy helped performance over the period. Positive security selection in consumer staples and health care were also meaningful positive contributors. The largest individual detractors to relative performance were AIG, WestJet Airlines, Office Depot, Oracle, and ARRIS International; the largest positive contributors were Whiting Petroleum, Hewlett Packard Enterprise, Royal Mail, GEO Group, and National Oilwell Varco.
HOTCHKIS & WILEY CAPITAL INCOME FUND
The Fund's Class I shares had a total return of 6.71% for the one year ended June 30, 2018, compared to the 50/50 blended benchmark of the S&P 500® Index and the ICE BofAML U.S. Corporate, Government and Mortgage Index return of 6.86%.
The Fund underperformed the 50/50 blended benchmark over the twelve-month period. The Fund's average equity weight over the twelve-month period was 56% versus a long-term target of 50%. This helped performance as equities outperformed both investment grade and high yield bonds.
The equity portion of the Fund underperformed the S&P 500® Index over the period. The primary reason for the underperformance was the significant outperformance of growth over value, which is not a conducive environment for our value centric process. We did not hold a handful of richly valued growth stocks in the consumer discretionary and information technology sectors that were significant drivers of the index's performance. Stock selection in financials and the underweight allocation to information technology hurt relative returns. Positive stock selection in consumer staples, industrials, and utilities helped relative performance. The overweight allocation to energy and underweight allocation to health care also helped. The largest individual detractors to relative performance were Energy XXI Gulf Coast,
2
WestJet Airlines, Office Depot, Ophir Energy, and AIG; the largest positive contributors were Whiting Petroleum, Royal Mail, Hewlett Packard Enterprise, Matson, and Kosmos Energy.
The fixed income portion of the Fund outperformed the ICE BofAML U.S. Corporate, Government and Mortgage Index as high yield bonds outperformed investment grade bonds over the period. The fixed income portion of the Fund also outperformed the ICE BofAML U.S. High Yield Index over the twelve-month period. Positive credit selection and the underweight in BB-rated credits both helped relative performance. Credit selection was strongest in basic industry, retail, and automotive. The overweight allocation to energy also helped. Credit selection in consumer goods detracted from performance.
HOTCHKIS & WILEY HIGH YIELD FUND
The Fund's Class I shares had a total return of 2.87% for the one year ended June 30, 2018 compared to the ICE BofAML BB-B U.S. High Yield Constrained Index return of 1.86%.
The Fund's Class I shares outperformed the ICE BofAML BB-B U.S. High Yield Constrained Index over the twelve-month period. The Fund's underweight to BB-rated securities and overweight to B-rated credits helped relative performance as the highest rated credits underperformed. Positive credit selection was the primary driver of outperformance, and was particularly strong in basic industry, retail, and banking. The overweight allocation to energy also helped. Credit selection and the overweight in consumer goods detracted from performance.
CONCLUSION
We appreciate your continued support of the Hotchkis & Wiley Funds, and we look forward to serving your investment needs in the future.
Sincerely,

| | 
| | 
| | 
| |
Anna Marie Lopez
President | | George Davis
Fund Manager | | Sheldon Lieberman
Fund Manager | | Patty McKenna
Fund Manager | |

| | 
| | 
| | 
| |
James Miles
Fund Manager | | Stan Majcher
Fund Manager | | David Green
Fund Manager | | Scott McBride
Fund Manager | |

| | 
| | 
| | 
| |
Judd Peters
Fund Manager | | Ray Kennedy
Fund Manager | | Mark Hudoff
Fund Manager | | Patrick Meegan
Fund Manager | |

| | 
| | 
| | 
| |
Scott Rosenthal
Fund Manager | | Richard Mak
Fund Manager | | Ryan Thomes
Fund Manager | | Noah Mayer
Fund Manager | |
3
ABOUT FUND PERFORMANCE
The Large Cap Value Fund, Mid-Cap Value Fund and High Yield Fund have five classes of shares. The Diversified Value Fund, Small Cap Value Fund, Small Cap Diversified Value Fund, Global Value Fund, International Value Fund, Value Opportunities Fund and Capital Income Fund have four classes of shares. Each share class has its own sales charge and expense structure, allowing you to invest in the way that best suits your needs. Currently, the Small Cap Diversified Value Fund, Global Value Fund and Capital Income Fund are not offering Class C shares to investors, the International Value Fund is not offering Class A or Class C shares to investors and the Funds are not offering Class T shares to investors.
Class I shares have no initial sales charge and bear no ongoing distribution and service fees under a 12b-1 plan. Class I shares are available only to eligible investors.
Class A shares incur a maximum initial sales charge of 5.25% for the Diversified Value Fund, Large Cap Value Fund, Mid-Cap Value Fund, Small Cap Value Fund, Small Cap Diversified Value Fund, Global Value Fund, International Value Fund and Value Opportunities Fund, 4.75% for the Capital Income Fund and 3.75% for the High Yield Fund and an annual distribution and service fee of 0.25%.
Class C shares are subject to an annual distribution and service fee of 1.00%. In addition, Class C shares are subject to a 1.00% contingent deferred sales charge (CDSC) if redeemed within one year after purchase. Class C shares automatically convert to Class A shares approximately eight years after purchase and will then be subject to lower annual distribution and service fees.
Class R shares have no initial sales charge or CDSC and are subject to an annual distribution and service fee of 0.50%. Class R shares are offered only by the Large Cap Value Fund and Mid-Cap Value Fund and are available only to certain retirement plans.
Class T shares incur a maximum initial sales charge of 2.50% and an annual distribution and service fee of 0.25%.
Class Z shares have no initial sales charge and bear no ongoing distribution and service fees under a 12b-1 plan. Class Z shares are offered only by the High Yield Fund and are available only to eligible investors (provided that no compensation, administrative payments, sub-transfer agency payments and service payments are required).
FUND RISKS
Mutual fund investing involves risk; loss of principal is possible. The Mid-Cap Value Fund, Small Cap Value Fund, Small Cap Diversified Value Fund, Global Value Fund, International Value Fund and Value Opportunities Fund invest in small- and medium-capitalization companies which tend to have limited liquidity and greater price volatility than large-capitalization companies. The Value Opportunities Fund is a non-diversified fund which involves greater risk than investing in diversified funds, such as business risk, significant stock price fluctuations and sector concentration. Growth stocks typically are more volatile than value stocks; however, value stocks have a lower expected growth rate in earnings and sales. The Value Opportunities Fund, Capital Income Fund and High Yield Fund invest in debt securities that decrease in value when interest rates rise. This risk is usually greater for longer-term debt securities. Investment by the Value Opportunities Fund, Capital Income Fund and High Yield Fund in lower-rated and non-rated securities presents a greater risk of loss to principal and
interest than higher-rated securities. The Value Opportunities Fund, Capital Income Fund and High Yield Fund may utilize derivative instruments, which derive their performance from the performance of an underlying asset, index, interest rate or currency exchange rate. Derivatives can be volatile and involve various types and degrees of risks. Depending upon the characteristics of particular derivatives, they can suddenly become illiquid. Investments by the Capital Income Fund and High Yield Fund in asset-backed and mortgage-backed securities include additional risks that investors should be aware of such as credit risk, prepayment risk, possible illiquidity and default, as well as increased susceptibility to adverse economic developments. The Funds may invest in foreign securities, including developed and emerging markets, which involve greater volatility and political, economic, and currency risks.
MARKET INDEXES
The following are definitions for indexes used in the shareholder letter and the fund performance data on the following pages. These indexes are unmanaged and include the reinvestment of dividends, but do not reflect the payment of transaction costs and advisory and other fees associated with an investment in the Funds. The securities that comprise these indexes may differ substantially from the securities in the Funds' portfolios. The Funds' value disciplines may prevent or restrict investments in the benchmark indexes. It is not possible to invest directly in an index. Each index named is not the only index which may be used to characterize performance of a specific Fund and other indexes may portray different comparative performance.
S&P 500® Index, a capital weighted, unmanaged index, represents the aggregate market value of the common equity of 500 stocks primarily traded on the New York Stock Exchange.
Russell 1000® Index, an unmanaged index, measures the performance of the 1,000 largest companies in the Russell 3000® Index.
Russell 1000® Value Index measures the performance of those Russell 1000® companies with lower price-to-book ratios and lower forecasted growth values.
Russell Midcap® Index, an unmanaged index, measures the performance of the 800 smallest companies in the Russell 1000® Index.
Russell Midcap® Value Index measures the performance of those Russell Midcap® companies with lower price-to-book ratios and lower forecasted growth values.
Russell 2000® Index, an unmanaged index, measures the performance of the 2,000 smallest companies in the Russell 3000® Index.
Russell 2000® Value Index measures the performance of those Russell 2000® companies with lower price-to-book ratios and lower forecasted growth values.
Russell 3000® Index, an unmanaged index, is comprised of the 3,000 largest U.S. companies based on total market capitalization, which represents approximately 98% of the investable U.S. equity market.
Russell 3000® Value Index measures the performance of those Russell 3000® companies with lower price-to-book ratios and lower forecasted growth values.
Russell Developed Index measures the performance of the investable securities in developed countries globally across all market capitalization ranges.
4
Russell Developed ex-U.S. Index measures the performance of the investable securities in developed countries globally across all market capitalization ranges, excluding U.S. securities.
ICE BofAML U.S. Corporate, Government and Mortgage Index is a broad-based measure of the total rate of return performance of the U.S. investment grade bond markets. The Index is a capitalization weighted aggregation of outstanding U.S. Treasury, agency and supranational, mortgage pass-through, and investment grade corporate bonds meeting specified selection criteria.
ICE BofAML BB-B U.S. High Yield Constrained Index contains all securities in the ICE BofAML U.S. High Yield Index rated BB+ through B- by S&P (or equivalent as rated by Moody's or Fitch), but caps issuer exposure at 2%. Index constituents are capitalization-weighted, based on their current amount outstanding, provided the total allocation to an individual issuer does not exceed 2%.
ICE BofAML U.S. High Yield Index tracks the performance of below investment grade, but not in default, U.S. dollar-denominated corporate bonds publicly issued in the U.S. domestic market, and includes issues with a credit rating of BBB or below, as rated by Moody's and S&P.
DISCLOSURE
Past performance does not guarantee future results.
The shareholder letter reflects opinions of Fund managers as of June 30, 2018. They are subject to change and any forecasts made cannot be guaranteed. The Funds might not continue to hold any securities mentioned and have no obligation to disclose purchases or sales in these securities. Please refer to the Schedule of Investments in this report for a complete list of Fund holdings for June 30, 2018. Indexes do not incur expenses or sales loads and are not available for investment.
The Global Industry Classification Standard (GICS®) was developed by MSCI, an independent provider of global indices and benchmark-related products and services, and Standard & Poor's (S&P), an independent international financial data and investment services company. The GICS methodology has been widely accepted as an industry analysis framework for investment research, portfolio management and asset allocation. The GICS structure consists of 11 sectors, 24 industry groups, 68 industries and 157 sub-industries. Each stock that is classified will have a coding at all four of these levels.
Investing in value stocks presents the risk that value stocks may fall out of favor with investors and underperform other asset types during a given period.
Each type of asset class or investment product has a different risk-return profile, which should be considered when investing. All investments contain risk and may lose value.
Earnings growth is not representative of the Fund's future performance.
Yield-to-Worst is the lowest possible yield from owning a bond considering all potential call dates prior to maturity.
Earnings Per Share (EPS) is the portion of a company's profit allocated to each shareholder. It is calculated based on Net Income Available for Common Shareholders divided by the Basic Weighted Average Shares Outstanding.
A basis point is one hundredth of one percent (0.01%).
Market Capitalization of a company is calculated by multiplying the number of outstanding shares by the current market price of a share.
Spread is the percentage point difference between yields of various classes of bonds compared to treasury bonds.
Investment grade indicates that a municipal or corporate bond has a relatively low risk of default.
Credit Quality weights by rating were derived from the highest bond rating as determined by S&P, Moody's or Fitch. Bond ratings are grades given to bonds that indicate their credit quality as determined by private independent rating services such as S&P, Moody's and Fitch. These firms evaluate a bond issuer's financial strength, or its ability to pay a bond's principal and interest in a timely fashion. Ratings are expressed as letters ranging from 'AAA', which is the highest grade, to 'D', which is the lowest grade. In limited situations when none of the three rating agencies have issued a formal rating, the Advisor will classify the security as nonrated.
During the year ended June 30, 2018, the Value Opportunities Fund held futures contracts, which resulted in realized and unrealized gains, and purchased put options, which resulted in unrealized losses, and the Capital Income Fund and High Yield Fund held credit default swap contracts, which resulted in realized and unrealized losses to each Fund.
5
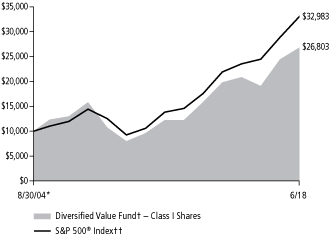
DIVERSIFIED VALUE FUND
Total Return Based on a $10,000 Investment
Comparative Results†††
For Periods ended June 30, 2018 | | 1 Year | | 5 Years | | 10 Years | | Since
8/30/04* | |
Class I | |
Average annual total return | | | 9.81 | % | | | 11.08 | % | | | 9.59 | % | | | 7.39 | % | |
Class A | |
Average annual total return (with sales charge) | | | 3.81 | % | | | 9.62 | % | | | 8.73 | % | | | 6.71 | % | |
Average annual total return (without sales charge) | | | 9.57 | % | | | 10.82 | % | | | 9.32 | % | | | 7.12 | % | |
Class C | |
Average annual total return (with CDSC) | | | 7.77 | % | | | 9.99 | % | | | 8.53 | % | | | 6.34 | % | |
Average annual total return (without CDSC) | | | 8.77 | % | | | 9.99 | % | | | 8.53 | % | | | 6.34 | % | |
S&P 500® Index†† | |
Average annual total return | | | 14.37 | % | | | 13.42 | % | | | 10.17 | % | | | 9.01 | % | |
Russell 1000® Index†† | |
Average annual total return | | | 14.54 | % | | | 13.37 | % | | | 10.20 | % | | | 9.25 | % | |
Russell 1000® Value Index†† | |
Average annual total return | | | 6.77 | % | | | 10.34 | % | | | 8.49 | % | | | 7.94 | % | |
Average annual total returns with sales charge and CDSC shown for Class A and Class C shares, respectively, have been adjusted to reflect the applicable sales charges of each specific class. Returns for Class A reflect the maximum initial sales charge of 5.25%. Class C shares have no adjustment for sales charges, but redemptions within one year of purchase may be subject to a CDSC of 1%. Average annual total returns without sales charge or CDSC do not reflect the sales charges. Had the sales charge or CDSC been included, the Fund's returns would have been lower.
† The Fund invests primarily in equity securities of companies with market capitalizations similar to the Russell 1000® Index.
†† See index descriptions in the Fund Information section.
††† Fund returns during certain periods shown reflect a fee waiver and/or expense reimbursement. Without waiver/reimbursement, returns would have been lower. Returns shown include the reinvestment of all dividends.
* Commencement of Class I, Class A and Class C.
Past performance is not indicative of future results and the graph and table do not reflect the deduction of taxes that a shareholder would pay on Fund distributions or the redemption of Fund shares.
6
LARGE CAP VALUE FUND
Total Return Based on a $10,000 Investment

Comparative Results†††
For Periods ended June 30, 2018 | | 1 Year | | 5 Years | | 10 Years | | Since
6/24/87* | |
Class I | |
Average annual total return | | | 10.01 | % | | | 11.57 | % | | | 9.71 | % | | | 9.22 | % | |
Class A | |
Average annual total return (with sales charge) | | | 3.96 | % | | | 10.10 | % | | | 8.84 | % | | | 8.78 | % | |
Average annual total return (without sales charge) | | | 9.72 | % | | | 11.30 | % | | | 9.43 | % | | | 8.97 | % | |
Class C | |
Average annual total return (with CDSC) | | | 7.92 | % | | | 10.46 | % | | | 8.66 | % | | | 8.15 | % | |
Average annual total return (without CDSC) | | | 8.92 | % | | | 10.46 | % | | | 8.66 | % | | | 8.15 | % | |
Class R | |
Average annual total return | | | 9.47 | % | | | 11.02 | % | | | 9.17 | % | | | 8.69 | % | |
S&P 500® Index†† | |
Average annual total return | | | 14.37 | % | | | 13.42 | % | | | 10.17 | % | | | 9.75 | % | |
Russell 1000® Index†† | |
Average annual total return | | | 14.54 | % | | | 13.37 | % | | | 10.20 | % | | | 9.84 | % | |
Russell 1000® Value Index†† | |
Average annual total return | | | 6.77 | % | | | 10.34 | % | | | 8.49 | % | | | n/a | | |
Returns shown for Class A, Class C, and Class R shares for the periods prior to their inception are derived from the historical performance of Class I shares of the Fund during such periods and have been adjusted to reflect the higher total annual operating expenses of each specific class. (Inception dates: Class A — 10/26/01; Class C — 2/4/02; Class R — 8/28/03.)
Average annual total returns with sales charge and CDSC shown for Class A and Class C shares, respectively, have been adjusted to reflect the applicable sales charges of each specific class. Returns for Class A reflect the maximum initial sales charge of 5.25%. Class C shares have no adjustment for sales charges, but redemptions within one year of purchase may be subject to a CDSC of 1%. Average annual total returns without sales charge or CDSC do not reflect the sales charges. Had the sales charge or CDSC been included, the Fund's returns would have been lower.
† The Fund invests primarily in equity securities of companies with market capitalizations similar to the Russell 1000® Index.
†† See index descriptions in the Fund Information section.
††† Fund returns during certain periods shown reflect a fee waiver and/or expense reimbursement. Without waiver/reimbursement, returns would have been lower. Returns shown include the reinvestment of all dividends.
* Commencement of Class I.
Past performance is not indicative of future results and the graph and table do not reflect the deduction of taxes that a shareholder would pay on Fund distributions or the redemption of Fund shares.
7
MID-CAP VALUE FUND
Total Return Based on a $10,000 Investment

Comparative Results†††
For Periods ended June 30, 2018 | | 1 Year | | 5 Years | | 10 Years | | Since
1/2/97* | |
Class I | |
Average annual total return | | | 14.32 | % | | | 9.26 | % | | | 12.50 | % | | | 12.29 | % | |
Class A | |
Average annual total return (with sales charge) | | | 8.05 | % | | | 7.81 | % | | | 11.61 | % | | | 11.73 | % | |
Average annual total return (without sales charge) | | | 14.05 | % | | | 8.98 | % | | | 12.22 | % | | | 12.01 | % | |
Class C | |
Average annual total return (with CDSC) | | | 12.20 | % | | | 8.17 | % | | | 11.45 | % | | | 11.21 | % | |
Average annual total return (without CDSC) | | | 13.20 | % | | | 8.17 | % | | | 11.45 | % | | | 11.21 | % | |
Class R | |
Average annual total return | | | 13.74 | % | | | 8.71 | % | | | 11.94 | % | | | 11.80 | % | |
Russell Midcap® Index†† | |
Average annual total return | | | 12.33 | % | | | 12.22 | % | | | 10.23 | % | | | 10.30 | % | |
Russell Midcap® Value Index†† | |
Average annual total return | | | 7.60 | % | | | 11.27 | % | | | 10.06 | % | | | 10.49 | % | |
Returns shown for Class A, Class C, and Class R shares for the periods prior to their inception are derived from the historical performance of Class I shares of the Fund during such periods and have been adjusted to reflect the higher total annual operating expenses of each specific class. (Inception dates: Class A, Class C — 1/2/01; Class R — 8/28/03.)
Average annual total returns with sales charge and CDSC shown for Class A and Class C shares, respectively, have been adjusted to reflect the applicable sales charges of each specific class. Returns for Class A reflect the maximum initial sales charge of 5.25%. Class C shares have no adjustment for sales charges, but redemptions within one year of purchase may be subject to a CDSC of 1%. Average annual total returns without sales charge or CDSC do not reflect the sales charges. Had the sales charge or CDSC been included, the Fund's returns would have been lower.
† The Fund invests primarily in equity securities of companies with market capitalizations similar to the Russell Midcap® Index.
†† See index descriptions in the Fund Information section.
††† Fund returns during certain periods shown reflect a fee waiver and/or expense reimbursement. Without waiver/reimbursement, returns would have been lower. Returns shown include the reinvestment of all dividends.
* Commencement of Class I.
Past performance is not indicative of future results and the graph and table do not reflect the deduction of taxes that a shareholder would pay on Fund distributions or the redemption of Fund shares.
8
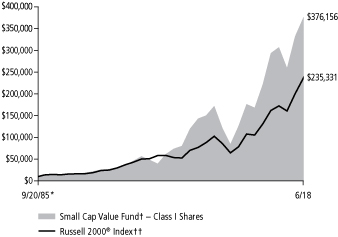
SMALL CAP VALUE FUND
Total Return Based on a $10,000 Investment
Comparative Results†††
For Periods ended June 30, 2018 | | 1 Year | | 5 Years | | 10 Years | | Since
9/20/85* | |
Class I | |
Average annual total return | | | 13.33 | % | | | 11.17 | % | | | 11.95 | % | | | 11.70 | % | |
Class A | |
Average annual total return (with sales charge) | | | 7.10 | % | | | 9.70 | % | | | 11.06 | % | | | 11.27 | % | |
Average annual total return (without sales charge) | | | 13.05 | % | | | 10.89 | % | | | 11.67 | % | | | 11.45 | % | |
Class C | |
Average annual total return (with CDSC) | | | 11.21 | % | | | 10.06 | % | | | 10.89 | % | | | 10.65 | % | |
Average annual total return (without CDSC) | | | 12.21 | % | | | 10.06 | % | | | 10.89 | % | | | 10.65 | % | |
Russell 2000® Index†† | |
Average annual total return | | | 17.57 | % | | | 12.46 | % | | | 10.60 | % | | | 10.12 | % | |
Russell 2000® Value Index†† | |
Average annual total return | | | 13.10 | % | | | 11.18 | % | | | 9.88 | % | | | n/a | | |
Returns shown for Class A and Class C shares for the periods prior to their inception are derived from the historical performance of Class I shares of the Fund during such periods and have been adjusted to reflect the higher total annual operating expenses of each specific class. (Inception dates: Class A — 10/6/00; Class C — 2/4/02.)
Average annual total returns with sales charge and CDSC shown for Class A and Class C shares, respectively, have been adjusted to reflect the applicable sales charges of each specific class. Returns for Class A reflect the maximum initial sales charge of 5.25%. Class C shares have no adjustment for sales charges, but redemptions within one year of purchase may be subject to a CDSC of 1%. Average annual total returns without sales charge or CDSC do not reflect the sales charges. Had the sales charge or CDSC been included, the Fund's returns would have been lower.
† The Fund invests primarily in equity securities of companies with market capitalizations similar to the Russell 2000® Index.
†† See index descriptions in the Fund Information section.
††† Fund returns during certain periods shown reflect a fee waiver and/or expense reimbursement. Without waiver/reimbursement, returns would have been lower. Returns shown include the reinvestment of all dividends.
* Commencement of Class I.
Past performance is not indicative of future results and the graph and table do not reflect the deduction of taxes that a shareholder would pay on Fund distributions or the redemption of Fund shares.
9
SMALL CAP DIVERSIFIED VALUE FUND
Total Return Based on a $10,000 Investment

Comparative Results†††
For Periods ended June 30, 2018 | | 1 Year | | Since
6/30/14* | |
Class I | |
Average annual total return | | | 17.48 | % | | | 11.00 | % | |
Class A | |
Average annual total return (with sales charge) | | | 10.98 | % | | | 9.21 | % | |
Average annual total return (without sales charge) | | | 17.18 | % | | | 10.68 | % | |
Russell 2000® Index†† | |
Average annual total return | | | 17.57 | % | | | 9.83 | % | |
Russell 2000® Value Index†† | |
Average annual total return | | | 13.10 | % | | | 8.51 | % | |
Average annual total returns with sales charge shown for Class A shares have been adjusted to reflect the applicable sales charge of the class. Returns for Class A reflect the maximum initial sales charge of 5.25%. Average annual total returns without sales charge do not reflect the sales charge. Had the sales charge been included, the Fund's returns would have been lower.
† The Fund invests primarily in equity securities of companies with market capitalizations similar to the Russell 2000® Index.
†† See index descriptions in the Fund Information section.
††† Fund returns during certain periods shown reflect a fee waiver and/or expense reimbursement. Without waiver/reimbursement, returns would have been lower. Returns shown include the reinvestment of all dividends.
* Commencement of Class I and Class A.
Past performance is not indicative of future results and the graph and table do not reflect the deduction of taxes that a shareholder would pay on Fund distributions or the redemption of Fund shares.
10
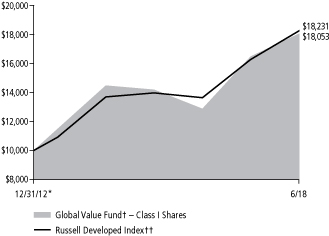
GLOBAL VALUE FUND
Total Return Based on a $10,000 Investment
Comparative Results†††
For Periods ended June 30, 2018 | | 1 Year | | 5 Years | | Since
12/31/12* | |
Class I | |
Average annual total return | | | 9.59 | % | | | 9.46 | % | | | 11.35 | % | |
Class A | |
Average annual total return (with sales charge) | | | 3.61 | % | | | 8.03 | % | | | 10.01 | % | |
Average annual total return (without sales charge) | | | 9.36 | % | | | 9.20 | % | | | 11.09 | % | |
Russell Developed Index†† | |
Average annual total return | | | 12.09 | % | | | 10.81 | % | | | 11.54 | % | |
Returns shown for Class A shares for the periods prior to its inception are derived from the historical performance of Class I shares of the Fund during such periods and have been adjusted to reflect the higher total annual operating expenses of the class. (Inception date: Class A — 8/30/13.)
Average annual total returns with sales charge shown for Class A shares have been adjusted to reflect the applicable sales charge of the class. Returns for Class A reflect the maximum initial sales charge of 5.25%. Average annual total returns without sales charge do not reflect the sales charge. Had the sales charge been included, the Fund's returns would have been lower.
† The Fund invests primarily in U.S. and non-U.S. companies.
†† See index description in the Fund Information section.
††† Fund returns during certain periods shown reflect a fee waiver and/or expense reimbursement. Without waiver/reimbursement, returns would have been lower. Returns shown include the reinvestment of all dividends.
* Commencement of Class I.
Past performance is not indicative of future results and the graph and table do not reflect the deduction of taxes that a shareholder would pay on Fund distributions or the redemption of Fund shares.
11
INTERNATIONAL VALUE FUND
Total Return Based on a $10,000 Investment
Comparative Results†††
For Periods ended June 30, 2018 | | 1 Year | | Since
12/31/15* | |
Class I | |
Average annual total return | | | 3.50 | % | | | 10.18 | % | |
Russell Developed ex-U.S. Index†† | |
Average annual total return | | | 8.29 | % | | | 10.14 | % | |
† The Fund invests primarily in non-U.S. companies.
†† See index description in the Fund Information section.
††† Fund returns during certain periods shown reflect a fee waiver and/or expense reimbursement. Without waiver/reimbursement, returns would have been lower. Returns shown include the reinvestment of all dividends.
* Commencement of Class I.
Past performance is not indicative of future results and the graph and table do not reflect the deduction of taxes that a shareholder would pay on Fund distributions or the redemption of Fund shares.
12
VALUE OPPORTUNITIES FUND
Total Return Based on a $10,000 Investment
Comparative Results†††
For Periods ended June 30, 2018 | | 1 Year | | 5 Years | | 10 Years | | Since
12/31/02* | |
Class I | |
Average annual total return | | | 12.11 | % | | | 11.63 | % | | | 13.91 | % | | | 12.82 | % | |
Class A | |
Average annual total return (with sales charge) | | | 5.98 | % | | | 10.16 | % | | | 13.02 | % | | | 12.21 | % | |
Average annual total return (without sales charge) | | | 11.84 | % | | | 11.35 | % | | | 13.63 | % | | | 12.60 | % | |
Class C | |
Average annual total return (with CDSC) | | | 9.99 | % | | | 10.53 | % | | | 12.83 | % | | | 11.73 | % | |
Average annual total return (without CDSC) | | | 10.99 | % | | | 10.53 | % | | | 12.83 | % | | | 11.73 | % | |
S&P 500® Index†† | |
Average annual total return | | | 14.37 | % | | | 13.42 | % | | | 10.17 | % | | | 9.77 | % | |
Returns shown for Class C shares for the periods prior to its inception are derived from the historical performance of Class I shares of the Fund during such periods and have been adjusted to reflect the higher total annual operating expenses of the class. (Inception date: Class C — 8/28/03.)
Average annual total returns with sales charge and CDSC shown for Class A and Class C shares, respectively, have been adjusted to reflect the applicable sales charges of each specific class. Returns for Class A reflect the maximum initial sales charge of 5.25%. Class C shares have no adjustment for sales charges, but redemptions within one year of purchase may be subject to a CDSC of 1%. Average annual total returns without sales charge or CDSC do not reflect the sales charge. Had the sales charge or CDSC been included, the Fund's returns would have been lower.
† The Fund invests primarily in securities of companies with strong capital appreciation potential.
†† See index description in the Fund Information section.
††† Fund returns during certain periods shown reflect a fee waiver and/or expense reimbursement. Without waiver/reimbursement, returns would have been lower. Returns shown include the reinvestment of all dividends.
* Commencement of Class I and Class A.
Past performance is not indicative of future results and the graph and table do not reflect the deduction of taxes that a shareholder would pay on Fund distributions or the redemption of Fund shares.
13
CAPITAL INCOME FUND
Total Return Based on a $10,000 Investment

Comparative Results†††
For Periods ended June 30, 2018 | | 1 Year | | 5 Years | | Since
12/31/10* | |
Class I | |
Average annual total return | | | 6.71 | % | | | 8.64 | % | | | 10.02 | % | |
Class A | |
Average annual total return (with sales charge) | | | 1.28 | % | | | 7.30 | % | | | 9.43 | % | |
Average annual total return (without sales charge) | | | 6.34 | % | | | 8.36 | % | | | 10.14 | % | |
S&P 500® Index†† | |
Average annual total return | | | 14.37 | % | | | 13.42 | % | | | 13.18 | % | |
ICE BofAML U.S. Corporate, Government and Mortgage Index†† | |
Average annual total return | | | –0.40 | % | | | 2.34 | % | | | 2.81 | % | |
Returns shown for Class A shares for the periods prior to its inception are derived from the historical performance of Class I shares of the Fund during such periods and have been adjusted to reflect the higher total annual operating expenses of the class. (Inception date: Class A — 2/28/11.)
Average annual total returns with sales charge shown for Class A shares have been adjusted to reflect the applicable sales charge of the class. Returns for Class A reflect the maximum initial sales charge of 4.75%. Average annual total returns without sales charge do not reflect the sales charge. Had the sales charge been included, the Fund's returns would have been lower.
† The Fund invests primarily in dividend-paying equities and high yield fixed income securities.
†† See index descriptions in the Fund Information section.
††† Fund returns during certain periods shown reflect a fee waiver and/or expense reimbursement. Without waiver/reimbursement, returns would have been lower. Returns shown include the reinvestment of all dividends.
* Commencement of Class I.
Past performance is not indicative of future results and the graph and table do not reflect the deduction of taxes that a shareholder would pay on Fund distributions or the redemption of Fund shares.
14
HIGH YIELD FUND
Total Return Based on a $10,000 Investment

Comparative Results†††
For Periods ended June 30, 2018 | | 1 Year | | 5 Years | | Since
3/31/09* | |
Class I | |
Average annual total return | | | 2.87 | % | | | 5.17 | % | | | 10.52 | % | |
Class A | |
Average annual total return (with sales charge) | | | –1.13 | % | | | 4.12 | % | | | 9.72 | % | |
Average annual total return (without sales charge) | | | 2.68 | % | | | 4.92 | % | | | 10.17 | % | |
Class C | |
Average annual total return (with CDSC) | | | 0.76 | % | | | 4.13 | % | | | 9.41 | % | |
Average annual total return (without CDSC) | | | 1.76 | % | | | 4.13 | % | | | 9.41 | % | |
Class Z | |
Average annual total return | | | 2.93 | % | | | 5.27 | % | | | 10.63 | % | |
ICE BofAML BB-B U.S. High Yield Constrained Index†† | |
Average annual total return | | | 1.85 | % | | | 5.33 | % | | | 10.30 | % | |
Returns shown for Class A, Class C and Class Z shares for the periods prior to their inception are derived from the historical performance of Class I shares of the Fund during such periods and have been adjusted to reflect the higher total annual operating expenses of Class A and Class C shares and lower total annual operating expenses of Class Z shares. (Inception dates: Class A — 5/29/09; Class C — 12/31/12; Class Z — 3/29/18.)
Average annual total returns with sales charge and CDSC shown for Class A and Class C shares, respectively, have been adjusted to reflect the applicable sales charges of each specific class. Returns for Class A reflect the maximum initial sales charge of 3.75%. Class C shares have no adjustment for sales charges, but redemptions within one year of purchase may be subject to a CDSC of 1%. Average annual total returns without sales charge or CDSC do not reflect the sales charges. Had the sales charge or CDSC been included, the Fund's returns would have been lower. Effective August 29, 2014, the Fund imposes a 2.00% redemption fee on shares that are redeemed or exchanged if they have been held for 90 days or less. Returns shown do not reflect the imposition of the redemption fee. Had the redemption fee been included, the Fund's returns would have been lower.
† The Fund invests primarily in high yield securities.
†† See index description in the Fund Information section.
††† Fund returns during certain periods shown reflect a fee waiver and/or expense reimbursement. Without waiver/reimbursement, returns would have been lower. Returns shown include the reinvestment of all dividends.
* Commencement of Class I.
Past performance is not indicative of future results and the graph and table do not reflect the deduction of taxes that a shareholder would pay on Fund distributions or the redemption of Fund shares.
15
Schedule of Investments — June 30, 2018
Hotchkis & Wiley Diversified Value Fund
Largest Equity Holdings | | Percent of
net assets | |
American International Group, Inc. | | | 4.93 | % | |
Wells Fargo & Company | | | 3.98 | % | |
Citigroup, Inc. | | | 3.85 | % | |
Hewlett Packard Enterprise Company | | | 3.83 | % | |
Apache Corp. | | | 3.49 | % | |
Oracle Corp. | | | 3.47 | % | |
Marathon Oil Corp. | | | 3.02 | % | |
Microsoft Corp. | | | 3.01 | % | |
Hess Corp. | | | 2.88 | % | |
Discovery, Inc. - Class C | | | 2.58 | % | |
COMMON
STOCKS — 99.60% | | Shares
Held | | Value | |
CONSUMER DISCRETIONARY — 13.62%
Auto Components — 2.76% | |
Adient PLC | | | 19,174 | | | $ | 943,169 | | |
The Goodyear Tire & Rubber Company | | | 44,500 | | | | 1,036,405 | | |
Magna International, Inc. | | | 17,100 | | | | 994,023 | | |
| | | | 2,973,597 | | |
Automobiles — 3.13% | |
General Motors Company | | | 65,400 | | | | 2,576,760 | | |
Harley-Davidson, Inc. | | | 19,000 | | | | 799,520 | | |
| | | | 3,376,280 | | |
Media — 7.32% | |
CBS Corp. | | | 24,900 | | | | 1,399,878 | | |
Comcast Corp. | | | 68,400 | | | | 2,244,204 | | |
Discovery, Inc. — Class A (a) (l) | | | 15,500 | | | | 426,250 | | |
Discovery, Inc. — Class C (a) | | | 109,000 | | | | 2,779,500 | | |
The Interpublic Group of Companies, Inc. | | | 22,500 | | | | 527,400 | | |
Omnicom Group, Inc. | | | 6,600 | | | | 503,382 | | |
| | | | 7,880,614 | | |
Specialty Retail — 0.41% | |
Bed Bath & Beyond, Inc. | | | 22,300 | | | | 444,328 | | |
TOTAL CONSUMER DISCRETIONARY | | | 14,674,819 | | |
CONSUMER STAPLES — 4.57%
Beverages — 1.60% | |
PepsiCo, Inc. | | | 15,800 | | | | 1,720,146 | | |
Food Products — 1.94% | |
Kellogg Company | | | 8,300 | | | | 579,921 | | |
Mondelez International, Inc. | | | 36,900 | | | | 1,512,900 | | |
| | | | 2,092,821 | | |
Personal Products — 1.03% | |
Unilever PLC — ADR | | | 20,000 | | | | 1,105,600 | | |
TOTAL CONSUMER STAPLES | | | 4,918,567 | | |
| | Shares
Held | | Value | |
ENERGY — 15.12%
Energy Equipment & Services — 1.37% | |
National Oilwell Varco, Inc. | | | 34,100 | | | $ | 1,479,940 | | |
Oil, Gas & Consumable Fuels — 13.75% | |
Andeavor | | | 6,000 | | | | 787,080 | | |
Apache Corp. | | | 80,500 | | | | 3,763,375 | | |
Hess Corp. | | | 46,400 | | | | 3,103,696 | | |
Kosmos Energy Ltd. (a) | | | 75,900 | | | | 627,693 | | |
Marathon Oil Corp. | | | 155,700 | | | | 3,247,902 | | |
Murphy Oil Corp. | | | 47,400 | | | | 1,600,698 | | |
Royal Dutch Shell PLC — ADR | | | 24,262 | | | | 1,679,658 | | |
| | | | 14,810,102 | | |
TOTAL ENERGY | | | 16,290,042 | | |
FINANCIALS — 28.41%
Banks — 13.33% | |
Bank of America Corp. | | | 84,622 | | | | 2,385,494 | | |
CIT Group, Inc. | | | 10,500 | | | | 529,305 | | |
Citigroup, Inc. | | | 61,974 | | | | 4,147,300 | | |
Citizens Financial Group, Inc. | | | 31,900 | | | | 1,240,910 | | |
JPMorgan Chase & Company | | | 17,000 | | | | 1,771,400 | | |
Wells Fargo & Company | | | 77,334 | | | | 4,287,397 | | |
| | | | 14,361,806 | | |
Capital Markets — 3.36% | |
The Bank of New York Mellon Corp. | | | 9,800 | | | | 528,514 | | |
The Goldman Sachs Group, Inc. | | | 7,300 | | | | 1,610,161 | | |
Morgan Stanley | | | 10,000 | | | | 474,000 | | |
State Street Corp. | | | 10,800 | | | | 1,005,372 | | |
| | | | 3,618,047 | | |
Consumer Finance — 4.41% | |
Ally Financial, Inc. | | | 30,100 | | | | 790,727 | | |
Capital One Financial Corp. | | | 25,500 | | | | 2,343,450 | | |
Discover Financial Services | | | 23,000 | | | | 1,619,430 | | |
| | | | 4,753,607 | | |
The accompanying notes are an integral part of these financial statements.
16
Schedule of Investments — June 30, 2018
Hotchkis & Wiley Diversified Value Fund
| | Shares
Held | | Value | |
Diversified Financial Services — 1.05% | |
AXA Equitable Holdings, Inc. (a) | | | 54,800 | | | $ | 1,129,428 | | |
Insurance — 6.26% | |
American International Group, Inc. | | | 100,200 | | | | 5,312,604 | | |
The Travelers Companies, Inc. | | | 11,700 | | | | 1,431,378 | | |
| | | | 6,743,982 | | |
TOTAL FINANCIALS | | | 30,606,870 | | |
HEALTH CARE — 7.75%
Biotechnology — 0.78% | |
Biogen, Inc. (a) | | | 2,900 | | | | 841,696 | | |
Health Care Equipment & Supplies — 2.54% | |
Koninklijke Philips NV | | | 14,066 | | | | 594,570 | | |
Medtronic PLC | | | 18,882 | | | | 1,616,488 | | |
Zimmer Biomet Holdings, Inc. | | | 4,700 | | | | 523,768 | | |
| | | | 2,734,826 | | |
Health Care Providers & Services — 1.53% | |
Anthem, Inc. | | | 6,900 | | | | 1,642,407 | | |
Pharmaceuticals — 2.90% | |
GlaxoSmithKline PLC — ADR | | | 42,500 | | | | 1,713,175 | | |
Sanofi — ADR | | | 35,300 | | | | 1,412,353 | | |
| | | | 3,125,528 | | |
TOTAL HEALTH CARE | | | 8,344,457 | | |
INDUSTRIALS — 9.00%
Aerospace & Defense — 0.38% | |
Embraer SA — ADR | | | 16,400 | | | | 408,360 | | |
Building Products — 2.24% | |
Johnson Controls International PLC | | | 72,147 | | | | 2,413,317 | | |
Electrical Equipment — 0.73% | |
Eaton Corp. PLC | | | 10,600 | | | | 792,244 | | |
Industrial Conglomerates — 1.84% | |
General Electric Company | | | 145,700 | | | | 1,982,977 | | |
Machinery — 3.81% | |
| CNH Industrial NV | | | 171,400 | | | | 1,804,842 | | |
Cummins, Inc. | | | 13,200 | | | | 1,755,600 | | |
PACCAR, Inc. | | | 8,700 | | | | 539,052 | | |
| | | | 4,099,494 | | |
TOTAL INDUSTRIALS | | | 9,696,392 | | |
INFORMATION TECHNOLOGY — 15.59%
Communications Equipment — 2.17% | |
Telefonaktiebolaget LM Ericsson — ADR | | | 305,200 | | | | 2,340,884 | | |
Electronic Equipment, Instruments & Components — 2.60% | |
Corning, Inc. | | | 83,900 | | | | 2,308,089 | | |
TE Connectivity Ltd. | | | 5,500 | | | | 495,330 | | |
| | | | 2,803,419 | | |
| | Shares
Held | | Value | |
IT Services — 0.51% | |
Teradata Corp. (a) | | | 13,500 | | | $ | 542,025 | | |
Software — 6.48% | |
Microsoft Corp. | | | 32,900 | | | | 3,244,269 | | |
Oracle Corp. | | | 84,800 | | | | 3,736,288 | | |
| | | | 6,980,557 | | |
Technology Hardware, Storage & Peripherals — 3.83% | |
Hewlett Packard Enterprise Company | | | 282,600 | | | | 4,128,786 | | |
TOTAL INFORMATION TECHNOLOGY | | | 16,795,671 | | |
MATERIALS — 1.16%
Containers & Packaging — 1.16% | |
International Paper Company | | | 23,900 | | | | 1,244,712 | | |
TOTAL MATERIALS | | | 1,244,712 | | |
TELECOMMUNICATION SERVICES — 2.16%
Wireless Telecommunication Services — 2.16% | |
Vodafone Group PLC — ADR | | | 95,663 | | | | 2,325,568 | | |
TOTAL TELECOMMUNICATION SERVICES | | | 2,325,568 | | |
UTILITIES — 2.22%
Electric Utilities — 2.22% | |
PPL Corp. | | | 41,400 | | | | 1,181,970 | | |
The Southern Company | | | 26,100 | | | | 1,208,691 | | |
TOTAL UTILITIES | | | 2,390,661 | | |
Total common stocks
(Cost $119,726,468) | | | | | 107,287,759 | | |
Total long-term investments
(Cost $119,726,468) | | | | | 107,287,759 | | |
COLLATERAL FOR SECURITIES ON LOAN — 0.39% | |
Money Market Funds — 0.39% | |
Invesco Government & Agency Portfolio —
Institutional Class, 1.81%^ | | | 416,970 | | | | 416,970 | | |
Total collateral for securities on loan
(Cost $416,970) | | | 416,970 | | |
Total investments — 99.99%
(Cost $120,143,438) | | | | | 107,704,729 | | |
Other assets in excess of liabilities — 0.01% | | | | | 11,828 | | |
Net assets — 100.00% | | $ | 107,716,557 | | |
(a) — Non-income producing security.
(l) — All or a portion of this security is on a loan. The total market value of securities on loan was $408,688. The remaining contractual maturity of all of the securities lending transactions is overnight and continuous.
ADR — American Depositary Receipt
^ — Rate shown is the 7-day yield as of June 30, 2018.
The accompanying notes are an integral part of these financial statements.
17
Schedule of Investments — June 30, 2018
Hotchkis & Wiley Large Cap Value Fund

Largest Equity Holdings | | Percent of
net assets | |
American International Group, Inc. | | | 4.83 | % | |
Wells Fargo & Company | | | 4.26 | % | |
Citigroup, Inc. | | | 4.07 | % | |
Hewlett Packard Enterprise Company | | | 3.77 | % | |
Oracle Corp. | | | 3.65 | % | |
Apache Corp. | | | 3.26 | % | |
Microsoft Corp. | | | 2.97 | % | |
Marathon Oil Corp. | | | 2.92 | % | |
Hess Corp. | | | 2.74 | % | |
Discovery, Inc. - Class C | | | 2.62 | % | |
COMMON
STOCKS — 98.21% | | Shares
Held | | Value | |
CONSUMER DISCRETIONARY — 12.28%
Auto Components — 2.17% | |
Adient PLC | | | 88,191 | | | $ | 4,338,115 | | |
Magna International, Inc. | | | 86,100 | | | | 5,004,993 | | |
| | | | 9,343,108 | | |
Automobiles — 3.13% | |
General Motors Company | | | 258,300 | | | | 10,177,020 | | |
Harley-Davidson, Inc. | | | 77,300 | | | | 3,252,784 | | |
| | | | 13,429,804 | | |
Media — 6.43% | |
CBS Corp. | | | 102,500 | | | | 5,762,550 | | |
Comcast Corp. | | | 271,300 | | | | 8,901,353 | | |
Discovery, Inc. — Class A (a) (l) | | | 61,500 | | | | 1,691,250 | | |
Discovery, Inc. — Class C (a) | | | 440,800 | | | | 11,240,400 | | |
| | | | 27,595,553 | | |
Specialty Retail — 0.55% | |
Bed Bath & Beyond, Inc. | | | 118,300 | | | | 2,357,128 | | |
TOTAL CONSUMER DISCRETIONARY | | | 52,725,593 | | |
CONSUMER STAPLES — 4.14%
Beverages — 1.69% | |
PepsiCo, Inc. | | | 66,400 | | | | 7,228,968 | | |
Food Products — 1.44% | |
Mondelez International, Inc. | | | 150,900 | | | | 6,186,900 | | |
Personal Products — 1.01% | |
Unilever PLC — ADR | | | 78,700 | | | | 4,350,536 | | |
TOTAL CONSUMER STAPLES | | | 17,766,404 | | |
ENERGY — 15.06%
Energy Equipment & Services — 1.32% | |
National Oilwell Varco, Inc. | | | 130,600 | | | | 5,668,040 | | |
| | Shares
Held | | Value | |
Oil, Gas & Consumable Fuels — 13.74% | |
Andeavor | | | 23,600 | | | $ | 3,095,848 | | |
Apache Corp. | | | 299,400 | | | | 13,996,950 | | |
Hess Corp. | | | 176,000 | | | | 11,772,640 | | |
Marathon Oil Corp. | | | 601,800 | | | | 12,553,548 | | |
Murphy Oil Corp. | | | 290,900 | | | | 9,823,693 | | |
Royal Dutch Shell PLC — ADR | | | 111,372 | | | | 7,710,284 | | |
| | | | 58,952,963 | | |
TOTAL ENERGY | | | 64,621,003 | | |
FINANCIALS — 28.02%
Banks — 13.53% | |
Bank of America Corp. | | | 333,749 | | | | 9,408,384 | | |
Citigroup, Inc. | | | 261,188 | | | | 17,478,701 | | |
Citizens Financial Group, Inc. | | | 104,000 | | | | 4,045,600 | | |
JPMorgan Chase & Company | | | 85,100 | | | | 8,867,420 | | |
Wells Fargo & Company | | | 329,563 | | | | 18,270,973 | | |
| | | | 58,071,078 | | |
Capital Markets — 3.15% | |
The Goldman Sachs Group, Inc. | | | 38,300 | | | | 8,447,831 | | |
State Street Corp. | | | 54,700 | | | | 5,092,023 | | |
| | | | 13,539,854 | | |
Consumer Finance — 4.10% | |
Capital One Financial Corp. | | | 111,900 | | | | 10,283,610 | | |
Discover Financial Services | | | 103,900 | | | | 7,315,599 | | |
| | | | 17,599,209 | | |
Diversified Financial Services — 0.97% | |
AXA Equitable Holdings, Inc. (a) | | | 201,700 | | | | 4,157,037 | | |
Insurance — 6.27% | |
American International Group, Inc. | | | 391,200 | | | | 20,741,424 | | |
The Travelers Companies, Inc. | | | 50,300 | | | | 6,153,702 | | |
| | | | 26,895,126 | | |
TOTAL FINANCIALS | | | 120,262,304 | | |
The accompanying notes are an integral part of these financial statements.
18
Schedule of Investments — June 30, 2018
Hotchkis & Wiley Large Cap Value Fund
| | Shares
Held | | Value | |
HEALTH CARE — 7.79%
Health Care Equipment & Supplies — 3.26% | |
Koninklijke Philips NV | | | 80,666 | | | $ | 3,409,752 | | |
Medtronic PLC | | | 77,900 | | | | 6,669,019 | | |
Zimmer Biomet Holdings, Inc. | | | 35,100 | | | | 3,911,544 | | |
| | | | 13,990,315 | | |
Health Care Providers & Services — 1.57% | |
Anthem, Inc. | | | 28,300 | | | | 6,736,249 | | |
Pharmaceuticals — 2.96% | |
GlaxoSmithKline PLC — ADR | | | 180,200 | | | | 7,263,862 | | |
Sanofi — ADR | | | 136,100 | | | | 5,445,361 | | |
| | | | 12,709,223 | | |
TOTAL HEALTH CARE | | | 33,435,787 | | |
INDUSTRIALS — 8.71%
Aerospace & Defense — 0.51% | |
Embraer SA — ADR | | | 88,500 | | | | 2,203,650 | | |
Building Products — 2.43% | |
Johnson Controls International PLC | | | 311,319 | | | | 10,413,620 | | |
Industrial Conglomerates — 1.72% | |
General Electric Company | | | 543,000 | | | | 7,390,230 | | |
Machinery — 4.05% | |
| CNH Industrial NV (l) | | | 676,900 | | | | 7,127,757 | | |
Cummins, Inc. | | | 61,200 | | | | 8,139,600 | | |
PACCAR, Inc. | | | 34,300 | | | | 2,125,228 | | |
| | | | 17,392,585 | | |
TOTAL INDUSTRIALS | | | 37,400,085 | | |
INFORMATION TECHNOLOGY — 16.53%
Communications Equipment — 3.99% | |
ARRIS International PLC (a) | | | 265,900 | | | | 6,499,925 | | |
Telefonaktiebolaget LM Ericsson — ADR | | | 1,384,900 | | | | 10,622,183 | | |
| | | | 17,122,108 | | |
Electronic Equipment, Instruments & Components — 2.15% | |
Corning, Inc. | | | 335,400 | | | | 9,226,854 | | |
Software — 6.62% | |
Microsoft Corp. | | | 129,200 | | | | 12,740,412 | | |
Oracle Corp. | | | 356,000 | | | | 15,685,360 | | |
| | | | 28,425,772 | | |
Technology Hardware, Storage & Peripherals — 3.77% | |
Hewlett Packard Enterprise Company | | | 1,106,400 | | | | 16,164,504 | | |
TOTAL INFORMATION TECHNOLOGY | | | 70,939,238 | | |
| | Shares
Held | | Value | |
MATERIALS — 1.58%
Containers & Packaging — 1.58% | |
International Paper Company | | | 130,500 | | | $ | 6,796,440 | | |
TOTAL MATERIALS | | | 6,796,440 | | |
TELECOMMUNICATION SERVICES — 2.49%
Wireless Telecommunication Services — 2.49% | |
Vodafone Group PLC — ADR | | | 439,544 | | | | 10,685,315 | | |
TOTAL TELECOMMUNICATION SERVICES | | | 10,685,315 | | |
UTILITIES — 1.61%
Electric Utilities — 1.61% | |
PPL Corp. | | | 160,400 | | | | 4,579,420 | | |
The Southern Company | | | 50,700 | | | | 2,347,917 | | |
TOTAL UTILITIES | | | 6,927,337 | | |
Total common stocks
(Cost $449,028,457) | | | | | 421,559,506 | | |
Total long-term investments
(Cost $449,028,457) | | | | | 421,559,506 | | |
COLLATERAL FOR SECURITIES ON LOAN — 0.39% | |
Money Market Funds — 0.39% | |
Invesco Government & Agency Portfolio —
Institutional Class, 1.81%^ | | | 1,663,360 | | | | 1,663,360 | | |
Total collateral for securities on loan
(Cost $1,663,360) | | | 1,663,360 | | |
SHORT-TERM
INVESTMENTS — 1.64% | | Principal
Amount | | | |
Time Deposits — 1.64% | |
Banco Santander SA,
1.27%, 07/02/2018* | | $ | 7,045,829 | | | | 7,045,829 | | |
Total short-term investments
(Cost $7,045,829) | | | 7,045,829 | | |
Total investments — 100.24%
(Cost $457,737,646) | | | | | 430,268,695 | | |
Liabilities in excess of other assets — (0.24)% | | | | | (1,014,433 | ) | |
Net assets — 100.00% | | $ | 429,254,262 | | |
(a) — Non-income producing security.
(l) — All or a portion of this security is on loan. The total market value of securities on loan was $1,628,643. The remaining contractual maturity of all of the securities lending transactions is overnight and continuous.
ADR — American Depositary Receipt
^ — Rate shown is the 7-day yield as of June 30, 2018.
* — Invested through a cash management account administered by Brown Brothers Harriman & Co.
The accompanying notes are an integral part of these financial statements.
19
Schedule of Investments — June 30, 2018
Hotchkis & Wiley Mid-Cap Value Fund

Largest Equity Holdings | | Percent of
net assets | |
Popular, Inc. | | | 5.13 | % | |
Whiting Petroleum Corp. | | | 5.08 | % | |
Hewlett Packard Enterprise Company | | | 4.24 | % | |
ARRIS International PLC | | | 4.05 | % | |
Telefonaktiebolaget LM Ericsson | | | 3.47 | % | |
Cairn Energy PLC | | | 3.37 | % | |
Kosmos Energy Ltd. | | | 3.29 | % | |
Discovery, Inc. - Class C | | | 3.12 | % | |
CIT Group, Inc. | | | 3.06 | % | |
Citizens Financial Group, Inc. | | | 2.91 | % | |
COMMON
STOCKS — 98.62% | | Shares
Held | | Value | |
CONSUMER DISCRETIONARY — 17.08%
Auto Components — 4.83% | |
Adient PLC | | | 302,800 | | | $ | 14,894,732 | | |
The Goodyear Tire & Rubber Company | | | 2,164,700 | | | | 50,415,863 | | |
Magna International, Inc. | | | 442,200 | | | | 25,705,086 | | |
| | | | 91,015,681 | | |
Household Durables — 2.42% | |
TRI Pointe Group, Inc. (a) | | | 2,795,700 | | | | 45,737,652 | | |
Media — 5.22% | |
CBS Corp. | | | 187,300 | | | | 10,530,006 | | |
Discovery, Inc. — Class A (a) (l) | | | 403,700 | | | | 11,101,750 | | |
Discovery, Inc. — Class C (a) | | | 2,309,400 | | | | 58,889,700 | | |
News Corp. | | | 1,150,500 | | | | 17,832,750 | | |
| | | | 98,354,206 | | |
Multiline Retail — 0.48% | |
Kohl's Corp. | | | 124,100 | | | | 9,046,890 | | |
Specialty Retail — 4.13% | |
Bed Bath & Beyond, Inc. | | | 1,750,800 | | | | 34,884,690 | | |
Office Depot, Inc. | | | 16,862,500 | | | | 42,999,375 | | |
| | | | 77,884,065 | | |
TOTAL CONSUMER DISCRETIONARY | | | 322,038,494 | | |
CONSUMER STAPLES — 1.56%
Food Products — 1.56% | |
Bunge Ltd. | | | 421,900 | | | | 29,410,649 | | |
TOTAL CONSUMER STAPLES | | | 29,410,649 | | |
ENERGY — 23.37%
Energy Equipment & Services — 6.87% | |
C&J Energy Services, Inc. (a) | | | 1,382,400 | | | | 32,624,640 | | |
Frank's International NV (a) | | | 1,463,800 | | | | 11,417,640 | | |
McDermott International, Inc. (a) | | | 761,033 | | | | 14,954,305 | | |
Superior Energy Services, Inc. (a) | | | 3,232,600 | | | | 31,485,524 | | |
Weatherford International PLC (a) (l) | | | 11,876,300 | | | | 39,073,027 | | |
| | | | 129,555,136 | | |
| | Shares
Held | | Value | |
Oil, Gas & Consumable Fuels — 16.50% | |
Apache Corp. | | | 230,400 | | | $ | 10,771,200 | | |
Cairn Energy PLC (a) (v) | | | 19,353,700 | | | | 63,549,008 | | |
Hess Corp. | | | 77,300 | | | | 5,170,597 | | |
Kosmos Energy Ltd. (a) | | | 7,503,400 | | | | 62,053,118 | | |
Marathon Oil Corp. | | | 222,200 | | | | 4,635,092 | | |
Murphy Oil Corp. | | | 595,800 | | | | 20,120,166 | | |
Ophir Energy PLC (a) (o) | | | 56,578,900 | | | | 37,708,315 | | |
Sanchez Energy Corp. (a) (l) | | | 2,483,700 | | | | 11,226,324 | | |
Whiting Petroleum Corp. (a) | | | 1,817,425 | | | | 95,814,646 | | |
| | | | 311,048,466 | | |
TOTAL ENERGY | | | 440,603,602 | | |
FINANCIALS — 21.18%
Banks — 11.32% | |
CIT Group, Inc. | | | 1,144,224 | | | | 57,680,332 | | |
Citizens Financial Group, Inc. | | | 1,410,300 | | | | 54,860,670 | | |
Fifth Third Bancorp | | | 142,700 | | | | 4,095,490 | | |
Popular, Inc. | | | 2,140,500 | | | | 96,772,005 | | |
| | | | 213,408,497 | | |
Consumer Finance — 5.64% | |
Ally Financial, Inc. | | | 977,700 | | | | 25,684,179 | | |
Discover Financial Services | | | 315,300 | | | | 22,200,273 | | |
Santander Consumer USA Holdings, Inc. | | | 1,092,200 | | | | 20,850,098 | | |
SLM Corp. (a) | | | 1,243,600 | | | | 14,239,220 | | |
Synchrony Financial | | | 702,000 | | | | 23,432,760 | | |
| | | | 106,406,530 | | |
Diversified Financial Services — 1.04% | |
AXA Equitable Holdings, Inc. (a) | | | 951,900 | | | | 19,618,659 | | |
The accompanying notes are an integral part of these financial statements.
20
Schedule of Investments — June 30, 2018
Hotchkis & Wiley Mid-Cap Value Fund
| | Shares
Held | | Value | |
Insurance — 3.18% | |
Alleghany Corp. | | | 16,800 | | | $ | 9,659,496 | | |
CNO Financial Group, Inc. | | | 1,863,600 | | | | 35,482,944 | | |
Enstar Group Ltd. (a) | | | 71,100 | | | | 14,739,030 | | |
| | | | 59,881,470 | | |
TOTAL FINANCIALS | | | 399,315,156 | | |
HEALTH CARE — 2.23%
Health Care Equipment & Supplies — 0.48% | |
Zimmer Biomet Holdings, Inc. | | | 80,600 | | | | 8,982,064 | | |
Health Care Providers & Services — 0.21% | |
LifePoint Health, Inc. (a) | | | 82,100 | | | | 4,006,480 | | |
Pharmaceuticals — 1.54% | |
Mallinckrodt PLC (a) (l) | | | 1,555,400 | | | | 29,023,764 | | |
TOTAL HEALTH CARE | | | 42,012,308 | | |
INDUSTRIALS — 10.66%
Aerospace & Defense — 1.58% | |
Embraer SA — ADR | | | 1,196,800 | | | | 29,800,320 | | |
Air Freight & Logistics — 1.42% | |
Royal Mail PLC (v) | | | 4,023,100 | | | | 26,765,349 | | |
Construction & Engineering — 1.88% | |
Fluor Corp. | | | 208,300 | | | | 10,160,874 | | |
KBR, Inc. | | | 1,408,800 | | | | 25,245,696 | | |
| | | | 35,406,570 | | |
Machinery — 3.78% | |
Allison Transmission Holdings, Inc. | | | 231,500 | | | | 9,373,435 | | |
Cummins, Inc. | | | 134,000 | | | | 17,822,000 | | |
Navistar International Corp. (a) | | | 1,082,200 | | | | 44,067,184 | | |
| | | | 71,262,619 | | |
Road & Rail — 2.00% | |
AMERCO | | | 79,600 | | | | 28,349,540 | | |
Avis Budget Group, Inc. (a) | | | 287,400 | | | | 9,340,500 | | |
| | | | 37,690,040 | | |
TOTAL INDUSTRIALS | | | 200,924,898 | | |
INFORMATION TECHNOLOGY — 16.24%
Communications Equipment — 7.52% | |
ARRIS International PLC (a) | | | 3,118,600 | | | | 76,234,177 | | |
Telefonaktiebolaget LM Ericsson — ADR | | | 8,537,900 | | | | 65,485,693 | | |
| | | | 141,719,870 | | |
Electronic Equipment, Instruments & Components — 4.01% | |
Avnet, Inc. | | | 983,000 | | | | 42,160,870 | | |
Corning, Inc. | | | 1,215,500 | | | | 33,438,405 | | |
| | | | 75,599,275 | | |
IT Services — 0.47% | |
Teradata Corp. (a) | | | 222,300 | | | | 8,925,345 | | |
Technology Hardware, Storage & Peripherals — 4.24% | |
Hewlett Packard Enterprise Company | | | 5,465,100 | | | | 79,845,111 | | |
TOTAL INFORMATION TECHNOLOGY | | | 306,089,601 | | |
| | Shares
Held | | Value | |
REAL ESTATE — 3.34%
Equity Real Estate Investment Trusts — 3.34% | |
Colony Capital, Inc. | | | 1,671,900 | | | $ | 10,432,656 | | |
The GEO Group, Inc. | | | 1,910,050 | | | | 52,602,777 | | |
TOTAL REAL ESTATE | | | 63,035,433 | | |
UTILITIES — 2.96%
Electric Utilities — 0.70% | |
PPL Corp. | | | 463,100 | | | | 13,221,505 | | |
Independent Power and Renewable Electricity
Producers — 2.26% | |
NRG Energy, Inc. | | | 1,385,500 | | | | 42,534,850 | | |
TOTAL UTILITIES | | | 55,756,355 | | |
Total common stocks
(Cost $1,706,355,486) | | | | | 1,859,186,496 | | |
Total long-term investments
(Cost $1,706,355,486) | | | | | 1,859,186,496 | | |
COLLATERAL FOR SECURITIES ON LOAN — 1.55% | |
Money Market Funds — 1.55% | |
Invesco Government & Agency Portfolio —
Institutional Class, 1.81%^ | | | 29,260,359 | | | | 29,260,359 | | |
Total collateral for securities on loan
(Cost $29,260,359) | | | 29,260,359 | | |
SHORT-TERM
INVESTMENTS — 1.95% | | Principal
Amount | | | |
Time Deposits — 1.95% | |
Banco Santander SA,
1.27%, 07/02/2018* | | $ | 9,146,249 | | | | 9,146,249 | | |
Barclays PLC, 1.27%, 07/02/2018* | | | 27,551,600 | | | | 27,551,600 | | |
Brown Brothers Harriman & Co.,
0.23%, 07/02/2018* | | GBP | 68 | | | | 89 | | |
Total short-term investments
(Cost $36,697,938) | | | 36,697,938 | | |
Total investments — 102.12%
(Cost $1,772,313,783) | | | | | 1,925,144,793 | | |
Liabilities in excess of other assets — (2.12)% | | | | | (39,999,031 | ) | |
Net assets — 100.00% | | $ | 1,885,145,762 | | |
(a) — Non-income producing security.
(l) — All or a portion of this security is on a loan. The total market value of securities on loan was $28,571,388. The remaining contractual maturity of all of the securities lending transactions is overnight and continuous.
(o) — Affiliated issuer. See Note 6 in Notes to the Financial Statements.
(v) — Security was fair valued as a result of market movements following the close of local trading using a third-party vendor's proprietary fair value pricing model. The total market value of these securities was $90,314,357, which represented 4.79% of net assets. See Security Valuation in Note 1 in Notes to the Financial Statements.
ADR — American Depositary Receipt
GBP — British Pound
^ — Rate shown is the 7-day yield as of June 30, 2018.
* — Invested through a cash management account administered by Brown Brothers Harriman & Co.
The accompanying notes are an integral part of these financial statements.
21
Schedule of Investments — June 30, 2018
Hotchkis & Wiley Small Cap Value Fund
Largest Equity Holdings | | Percent of
net assets | |
Whiting Petroleum Corp. | | | 6.48 | % | |
Seritage Growth Properties | | | 5.09 | % | |
ARRIS International PLC | | | 4.57 | % | |
Enstar Group Ltd. | | | 4.43 | % | |
Matson, Inc. | | | 3.73 | % | |
Frank's International NV | | | 3.32 | % | |
Popular, Inc. | | | 3.26 | % | |
WestJet Airlines Ltd. | | | 3.23 | % | |
First Hawaiian, Inc. | | | 3.19 | % | |
Masonite International Corp. | | | 3.17 | % | |
COMMON
STOCKS — 98.22% | | Shares
Held | | Value | |
CONSUMER DISCRETIONARY — 8.65%
Household Durables — 1.79% | |
TRI Pointe Group, Inc. (a) | | | 874,600 | | | $ | 14,308,456 | | |
Media — 1.44% | |
MDC Partners, Inc. (a) | | | 2,506,900 | | | | 11,531,740 | | |
Specialty Retail — 5.42% | |
Bed Bath & Beyond, Inc. | | | 169,100 | | | | 3,369,317 | | |
Group 1 Automotive, Inc. | | | 64,600 | | | | 4,069,800 | | |
Office Depot, Inc. | | | 6,470,800 | | | | 16,500,540 | | |
Sonic Automotive, Inc. | | | 942,200 | | | | 19,409,320 | | |
| | | | 43,348,977 | | |
TOTAL CONSUMER DISCRETIONARY | | | 69,189,173 | | |
ENERGY — 16.65%
Energy Equipment & Services — 6.87% | |
C&J Energy Services, Inc. (a) | | | 527,200 | | | | 12,441,920 | | |
Frank's International NV (a) | | | 3,404,500 | | | | 26,555,100 | | |
Key Energy Services, Inc. (a) | | | 250,300 | | | | 4,064,872 | | |
McDermott International, Inc. (a) | | | 153,000 | | | | 3,006,450 | | |
Nine Energy Service, Inc. (a) | | | 211,400 | | | | 7,001,568 | | |
Quintana Energy Services, Inc. (a) (l) | | | 223,800 | | | | 1,895,586 | | |
| | | | 54,965,496 | | |
Oil, Gas & Consumable Fuels — 9.78% | |
Cairn Energy PLC (a) (v) | | | 721,100 | | | | 2,367,774 | | |
Kosmos Energy Ltd. (a) | | | 1,766,500 | | | | 14,608,955 | | |
PBF Energy, Inc. | | | 145,300 | | | | 6,092,429 | | |
Rockhopper Exploration PLC (a) | | | 4,963,300 | | | | 2,685,627 | | |
Talos Energy, Inc. (a) | | | 19,800 | | | | 636,174 | | |
Whiting Petroleum Corp. (a) | | | 982,725 | | | | 51,809,262 | | |
| | | | 78,200,221 | | |
TOTAL ENERGY | | | 133,165,717 | | |
| | | Shares
Held | | Value | |
FINANCIALS — 27.33%
Banks — 14.14% | |
Associated Banc-Corp | | | 361,100 | | | $ | 9,858,030 | | |
The Bank of NT Butterfield & Son Ltd. | | | 397,300 | | | | 18,164,556 | | |
First BanCorp (a) | | | 1,027,200 | | | | 7,858,080 | | |
First Hawaiian, Inc. | | | 879,800 | | | | 25,531,796 | | |
First Horizon National Corp. | | | 926,431 | | | | 16,527,529 | | |
Investors Bancorp, Inc. | | | 253,300 | | | | 3,239,707 | | |
Popular, Inc. | | | 577,100 | | | | 26,090,691 | | |
TCF Financial Corp. | | | 238,500 | | | | 5,871,870 | | |
| | | | 113,142,259 | | |
Capital Markets — 1.40% | |
BrightSphere Investment Group PLC | | | 513,500 | | | | 7,322,510 | | |
Oppenheimer Holdings, Inc. | | | 139,000 | | | | 3,892,000 | | |
| | | | 11,214,510 | | |
Consumer Finance — 1.34% | |
SLM Corp. (a) | | | 937,100 | | | | 10,729,795 | | |
Insurance — 10.09% | |
CNO Financial Group, Inc. | | | 799,700 | | | | 15,226,288 | | |
Enstar Group Ltd. (a) | | | 171,079 | | | | 35,464,677 | | |
Global Indemnity Ltd. | | | 374,736 | | | | 14,607,209 | | |
Horace Mann Educators Corp. | | | 345,400 | | | | 15,404,840 | | |
| | | | 80,703,014 | | |
Thrifts & Mortgage Finance — 0.36% | |
Luther Burbank Corp. | | | 246,700 | | | | 2,838,284 | | |
TOTAL FINANCIALS | | | 218,627,862 | | |
HEALTH CARE — 3.92%
Health Care Equipment & Supplies — 0.63% | |
Invacare Corp. | | | 272,000 | | | | 5,059,200 | | |
The accompanying notes are an integral part of these financial statements.
22
Schedule of Investments — June 30, 2018
Hotchkis & Wiley Small Cap Value Fund
| | | Shares
Held | | Value | |
Health Care Providers & Services — 3.29% | |
Hanger, Inc. (a) | | | 1,373,800 | | | $ | 23,299,648 | | |
LifePoint Health, Inc. (a) | | | 61,800 | | | | 3,015,840 | | |
| | | | 26,315,488 | | |
TOTAL HEALTH CARE | | | 31,374,688 | | |
INDUSTRIALS — 22.06%
Aerospace & Defense — 2.37% | |
Embraer SA — ADR | | | 760,600 | | | | 18,938,940 | | |
Airlines — 3.23% | |
WestJet Airlines Ltd. | | | 1,871,700 | | | | 25,812,133 | | |
Building Products — 3.55% | |
Armstrong Flooring, Inc. (a) | | | 220,700 | | | | 3,098,628 | | |
Masonite International Corp. (a) | | | 352,800 | | | | 25,348,680 | | |
| | | | 28,447,308 | | |
Commercial Services & Supplies — 1.56% | |
LSC Communications, Inc. | | | 796,000 | | | | 12,465,360 | | |
Construction & Engineering — 3.96% | |
KBR, Inc. | | | 1,310,800 | | | | 23,489,536 | | |
Tutor Perini Corp. (a) | | | 446,200 | | | | 8,232,390 | | |
| | | | 31,721,926 | | |
Machinery — 2.18% | |
EnPro Industries, Inc. | | | 42,400 | | | | 2,965,880 | | |
Miller Industries, Inc. | | | 383,300 | | | | 9,793,315 | | |
Navistar International Corp. (a) | | | 114,200 | | | | 4,650,224 | | |
| | | | 17,409,419 | | |
Marine — 3.73% | |
Matson, Inc. | | | 777,600 | | | | 29,844,288 | | |
Professional Services — 0.44% | |
Hudson Global, Inc. (a) (o) | | | 2,187,600 | | | | 3,543,912 | | |
Trading Companies & Distributors — 1.04% | |
Rush Enterprises, Inc. (a) | | | 191,900 | | | | 8,324,622 | | |
TOTAL INDUSTRIALS | | | 176,507,908 | | |
INFORMATION TECHNOLOGY — 6.07%
Communications Equipment — 4.57% | |
ARRIS International PLC (a) | | | 1,495,700 | | | | 36,562,387 | | |
Semiconductors & Semiconductor Equipment — 1.50% | |
Diodes, Inc. (a) | | | 348,100 | | | | 11,999,007 | | |
TOTAL INFORMATION TECHNOLOGY | | | 48,561,394 | | |
MATERIALS — 0.11%
Metals & Mining — 0.11% | |
Elah Holdings, Inc. (a) (i) | | | 11,539 | | | | 865,425 | | |
Noranda Aluminum Holding Corp. (a) (o) | | | 800,300 | | | | 24,569 | | |
TOTAL MATERIALS | | | 889,994 | | |
| | | Shares
Held | | Value | |
REAL ESTATE — 9.81%
Equity Real Estate Investment Trusts — 9.81% | |
The GEO Group, Inc. | | | 840,244 | | | $ | 23,140,320 | | |
Granite Real Estate Investment Trust (l) | | | 335,600 | | | | 13,682,412 | | |
New York REIT, Inc. (a) (l) | | | 50,240 | | | | 916,377 | | |
Seritage Growth Properties (l) | | | 959,700 | | | | 40,720,071 | | |
TOTAL REAL ESTATE | | | 78,459,180 | | |
UTILITIES — 3.62%
Electric Utilities — 3.62% | |
Evergy, Inc. | | | 279,492 | | | | 15,693,476 | | |
Portland General Electric Company | | | 310,500 | | | | 13,276,980 | | |
TOTAL UTILITIES | | | 28,970,456 | | |
Total common stocks
(Cost $682,868,982) | | | | | 785,746,372 | | |
Total long-term investments
(Cost $682,868,982) | | | | | 785,746,372 | | |
COLLATERAL FOR SECURITIES ON LOAN — 4.05% | |
Money Market Funds — 4.05% | |
Invesco Government & Agency Portfolio —
Institutional Class, 1.81%^ | | | 32,363,992 | | | | 32,363,992 | | |
Total collateral for securities on loan
(Cost $32,363,992) | | | 32,363,992 | | |
SHORT-TERM
INVESTMENTS — 2.08% | | Principal
Amount | | | |
Time Deposits — 2.08% | |
Brown Brothers Harriman & Co.,
0.51%, 07/03/2018* | | CAD | 185,986 | | | | 141,472 | | |
Citigroup, Inc.,
1.27%, 07/02/2018* | | $ | 16,472,612 | | | | 16,472,612 | �� | |
Total short-term investments
(Cost $16,614,084) | | | 16,614,084 | | |
Total investments — 104.35%
(Cost $731,847,058) | | | | | 834,724,448 | | |
Liabilities in excess of other assets — (4.35)% | | | | | (34,778,396 | ) | |
Net assets — 100.00% | | $ | 799,946,052 | | |
(a) — Non-income producing security.
(i) — Illiquid security.
(l) — All or a portion of this security is on loan. The total market value of securities on loan was $31,681,036. The remaining contractual maturity of all of the securities lending transactions is overnight and continuous.
(o) — Affiliated issuer. See Note 6 in Notes to the Financial Statements.
(v) — Security was fair valued as a result of market movements following the close of local trading using a third-party vendor's proprietary fair value pricing model. The total market value of these securities was $2,367,774, which represented 0.30% of net assets. See Security Valuation in Note 1 in Notes to the Financial Statements.
ADR — American Depositary Receipt
CAD — Canadian Dollar
^ — Rate shown is the 7-day yield as of June 30, 2018.
* — Invested through a cash management account administered by Brown Brothers Harriman & Co.
The accompanying notes are an integral part of these financial statements.
23
Schedule of Investments — June 30, 2018
Hotchkis & Wiley Small Cap Diversified Value Fund
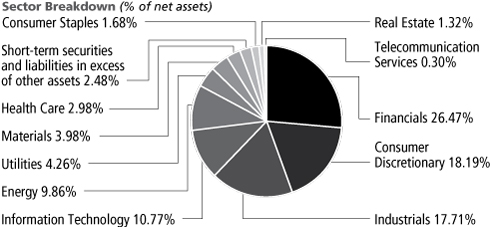
Largest Equity Holdings | | Percent of
net assets | |
The Greenbrier Companies, Inc. | | | 0.45 | % | |
Ultra Petroleum Corp. | | | 0.45 | % | |
Gulfport Energy Corp. | | | 0.43 | % | |
Frank's International NV | | | 0.43 | % | |
Kosmos Energy Ltd. | | | 0.43 | % | |
Smart Sand, Inc. | | | 0.43 | % | |
MSG Networks, Inc. | | | 0.42 | % | |
Bed Bath & Beyond, Inc. | | | 0.42 | % | |
Luxoft Holding, Inc. | | | 0.42 | % | |
Oceaneering International, Inc. | | | 0.42 | % | |
COMMON
STOCKS — 97.52% | | Shares
Held | | Value | |
CONSUMER DISCRETIONARY — 18.19%
Auto Components — 3.18% | |
Cooper Tire & Rubber Company | | | 6,339 | | | $ | 166,716 | | |
Cooper-Standard Holdings, Inc. (a) | | | 965 | | | | 126,097 | | |
Dana, Inc. | | | 4,276 | | | | 86,332 | | |
Gentherm, Inc. (a) | | | 2,212 | | | | 86,932 | | |
Horizon Global Corp. (a) | | | 30,103 | | | | 179,413 | | |
Modine Manufacturing Company (a) | | | 2,262 | | | | 41,282 | | |
Motorcar Parts of America, Inc. (a) | | | 6,791 | | | | 127,060 | | |
Standard Motor Products, Inc. | | | 844 | | | | 40,799 | | |
Stoneridge, Inc. (a) | | | 1,234 | | | | 43,363 | | |
Superior Industries International, Inc. | | | 7,087 | | | | 126,857 | | |
Tenneco, Inc. | | | 3,918 | | | | 172,234 | | |
Tower International, Inc. | | | 5,312 | | | | 168,922 | | |
| | | | 1,366,007 | | |
Diversified Consumer Services — 0.59% | |
Capella Education Company | | | 1,726 | | | | 170,356 | | |
Graham Holdings Company | | | 71 | | | | 41,613 | | |
Strayer Education, Inc. | | | 376 | | | | 42,492 | | |
| | | | 254,461 | | |
Hotels, Restaurants & Leisure — 2.00% | |
Bluegreen Vacations Corp. | | | 5,584 | | | | 132,899 | | |
Bojangles', Inc. (a) | | | 8,552 | | | | 123,149 | | |
Brinker International, Inc. | | | 837 | | | | 39,841 | | |
Carrols Restaurant Group, Inc. (a) | | | 6,090 | | | | 90,437 | | |
The Cheesecake Factory, Inc. | | | 1,554 | | | | 85,563 | | |
El Pollo Loco Holdings, Inc. (a) | | | 15,136 | | | | 172,550 | | |
Eldorado Resorts, Inc. (a) | | | 1,087 | | | | 42,502 | | |
Hilton Grand Vacations, Inc. (a) | | | 2,521 | | | | 87,479 | | |
International Speedway Corp. | | | 961 | | | | 42,957 | | |
Ruth's Hospitality Group, Inc. | | | 1,484 | | | | 41,626 | | |
| | | | 859,003 | | |
| | | Shares
Held | | Value | |
Household Durables — 4.55% | |
Century Communities, Inc. (a) | | | 5,595 | | | $ | 176,522 | | |
CSS Industries, Inc. | | | 5,003 | | | | 84,551 | | |
Ethan Allen Interiors, Inc. | | | 3,482 | | | | 85,309 | | |
Flexsteel Industries, Inc. | | | 2,157 | | | | 86,064 | | |
Green Brick Partners, Inc. (a) | | | 4,655 | | | | 45,619 | | |
Hooker Furniture Corp. | | | 2,727 | | | | 127,896 | | |
iRobot Corp. (a) | | | 568 | | | | 43,037 | | |
La-Z-Boy, Inc. | | | 2,827 | | | | 86,506 | | |
LGI Homes, Inc. (a) | | | 1,509 | | | | 87,115 | | |
M/I Homes, Inc. (a) | | | 4,932 | | | | 130,599 | | |
Meritage Homes Corp. (a) | | | 4,048 | | | | 177,910 | | |
Taylor Morrison Home Corp. (a) | | | 8,630 | | | | 179,330 | | |
Tempur Sealy International, Inc. (a) | | | 847 | | | | 40,698 | | |
TRI Pointe Group, Inc. (a) | | | 10,677 | | | | 174,676 | | |
Tupperware Brands Corp. | | | 4,186 | | | | 172,631 | | |
William Lyon Homes (a) | | | 7,558 | | | | 175,346 | | |
ZAGG, Inc. (a) | | | 4,772 | | | | 82,556 | | |
| | | | 1,956,365 | | |
Internet & Catalog Retail — 0.22% | |
Duluth Holdings, Inc. (a) | | | 3,892 | | | | 92,591 | | |
Leisure Products — 0.68% | |
Nautilus, Inc. (a) | | | 10,735 | | | | 168,540 | | |
Sturm, Ruger & Company, Inc. | | | 2,197 | | | | 123,032 | | |
| | | | 291,572 | | |
Media — 2.59% | |
Entercom Communications Corp. | | | 11,206 | | | | 84,605 | | |
Entravision Communications Corp. | | | 34,497 | | | | 172,485 | | |
Gray Television, Inc. (a) | | | 2,951 | | | | 46,626 | | |
The Marcus Corp. | | | 2,566 | | | | 83,395 | | |
MDC Partners, Inc. (a) | | | 35,444 | | | | 163,042 | | |
Meredith Corp. | | | 3,334 | | | | 170,034 | | |
The accompanying notes are an integral part of these financial statements.
24
Schedule of Investments — June 30, 2018
Hotchkis & Wiley Small Cap Diversified Value Fund
| | | Shares
Held | | Value | |
MSG Networks, Inc. (a) | | | 7,611 | | | $ | 182,284 | | |
Nexstar Media Group, Inc. | | | 1,121 | | | | 82,281 | | |
Scholastic Corp. | | | 1,954 | | | | 86,582 | | |
TEGNA, Inc. | | | 3,760 | | | | 40,796 | | |
| | | | 1,112,130 | | |
Multiline Retail — 0.39% | |
Big Lots, Inc. | | | 4,067 | | | | 169,919 | | |
Specialty Retail — 3.79% | |
Asbury Automotive Group, Inc. (a) | | | 1,842 | | | | 126,269 | | |
Bed Bath & Beyond, Inc. | | | 9,117 | | | | 181,656 | | |
Francesca's Holdings Corp. (a) | | | 22,547 | | | | 170,230 | | |
GameStop Corp. | | | 8,632 | | | | 125,768 | | |
Group 1 Automotive, Inc. | | | 2,646 | | | | 166,698 | | |
Haverty Furniture Companies, Inc. | | | 1,914 | | | | 41,342 | | |
Hibbett Sports, Inc. (a) | | | 3,607 | | | | 82,600 | | |
Lithia Motors, Inc. | | | 1,766 | | | | 167,011 | | |
Murphy USA, Inc. (a) | | | 1,733 | | | | 128,745 | | |
Office Depot, Inc. | | | 64,545 | | | | 164,590 | | |
Sonic Automotive, Inc. | | | 7,810 | | | | 160,886 | | |
Sportsman's Warehouse Holdings, Inc. (a) | | | 22,122 | | | | 113,265 | | |
| | | | 1,629,060 | | |
Textiles, Apparel & Luxury Goods — 0.20% | |
Movado Group, Inc. | | | 1,755 | | | | 84,767 | | |
TOTAL CONSUMER DISCRETIONARY | | | 7,815,875 | | |
CONSUMER STAPLES — 1.68%
Food & Staples Retailing — 0.48% | |
United Natural Foods, Inc. (a) | | | 2,965 | | | | 126,487 | | |
Village Super Market, Inc. | | | 2,778 | | | | 81,840 | | |
| | | | 208,327 | | |
Food Products — 0.89% | |
B&G Foods, Inc. | | | 3,994 | | | | 119,421 | | |
Dean Foods Company | | | 8,216 | | | | 86,350 | | |
Fresh Del Monte Produce, Inc. | | | 948 | | | | 42,233 | | |
Sanderson Farms, Inc. | | | 1,254 | | | | 131,858 | | |
| | | | 379,862 | | |
Personal Products — 0.31% | |
Natural Health Trends Corp. | | | 5,369 | | | | 134,332 | | |
TOTAL CONSUMER STAPLES | | | 722,521 | | |
| | | Shares
Held | | Value | |
ENERGY — 9.86%
Energy Equipment & Services — 2.95% | |
C&J Energy Services, Inc. (a) | | | 7,415 | | | $ | 174,994 | | |
Diamond Offshore Drilling, Inc. (a) | | | 4,618 | | | | 96,331 | | |
Dril-Quip, Inc. (a) | | | 3,445 | | | | 177,073 | | |
Ensco PLC | | | 6,590 | | | | 47,843 | | |
Frank's International NV (a) | | | 23,839 | | | | 185,945 | | |
Matrix Service Company (a) | | | 6,832 | | | | 125,367 | | |
Oceaneering International, Inc. (a) | | | 7,088 | | | | 180,460 | | |
Rowan Companies PLC (a) | | | 5,892 | | | | 95,568 | | |
Smart Sand, Inc. (a) | | | 34,415 | | | | 182,744 | | |
| | | | 1,266,325 | | |
Oil, Gas & Consumable Fuels — 6.91% | |
California Resources Corp. (a) | | | 2,111 | | | | 95,924 | | |
Callon Petroleum Company (a) | | | 15,768 | | | | 169,348 | | |
CNX Midstream Partners LP | | | 4,466 | | | | 86,596 | | |
Contango Oil & Gas Company (a) | | | 15,602 | | | | 88,619 | | |
CVR Refining LP | | | 1,892 | | | | 42,286 | | |
Denbury Resources, Inc. (a) | | | 19,071 | | | | 91,732 | | |
Earthstone Energy, Inc. (a) | | | 15,169 | | | | 134,246 | | |
EP Energy Corp. (a) | | | 13,532 | | | | 40,596 | | |
Gulfport Energy Corp. (a) | | | 14,825 | | | | 186,350 | | |
Kosmos Energy Ltd. (a) | | | 22,474 | | | | 185,860 | | |
Nordic American Tankers Ltd. | | | 49,245 | | | | 131,977 | | |
PBF Logistics LP | | | 6,096 | | | | 128,016 | | |
QEP Resources, Inc. (a) | | | 14,601 | | | | 179,008 | | |
Range Resources Corp. | | | 10,357 | | | | 173,273 | | |
Renewable Energy Group, Inc. (a) | | | 9,653 | | | | 172,306 | | |
REX American Resources Corp. (a) | | | 2,136 | | | | 172,952 | | |
Rice Midstream Partners LP | | | 10,205 | | | | 173,689 | | |
SM Energy Company | | | 6,844 | | | | 175,822 | | |
Southwestern Energy Company (a) | | | 32,605 | | | | 172,807 | | |
Ultra Petroleum Corp. (a) | | | 83,274 | | | | 192,362 | | |
World Fuel Services Corp. | | | 8,548 | | | | 174,465 | | |
| | | | 2,968,234 | | |
TOTAL ENERGY | | | 4,234,559 | | |
The accompanying notes are an integral part of these financial statements.
25
Schedule of Investments — June 30, 2018
Hotchkis & Wiley Small Cap Diversified Value Fund
| | | Shares
Held | | Value | |
FINANCIALS — 26.47%
Banks — 10.71% | |
1st Source Corp. | | | 752 | | | $ | 40,179 | | |
Access National Corp. | | | 2,807 | | | | 80,280 | | |
American National Bankshares, Inc. | | | 1,034 | | | | 41,360 | | |
Arrow Financial Corp. | | | 1,128 | | | | 41,059 | | |
Bank of Marin Bancorp | | | 1,526 | | | | 123,377 | | |
The Bank of NT Butterfield & Son Ltd. | | | 3,622 | | | | 165,598 | | |
Bar Harbor Bankshares | | | 2,764 | | | | 83,722 | | |
Bridge Bancorp, Inc. | | | 1,140 | | | | 40,983 | | |
Brookline Bancorp, Inc. | | | 2,209 | | | | 41,087 | | |
Camden National Corp. | | | 911 | | | | 41,642 | | |
Carolina Financial Corp. | | | 972 | | | | 41,718 | | |
Cathay General Bancorp | | | 2,099 | | | | 84,989 | | |
City Holding Company | | | 543 | | | | 40,850 | | |
Community Trust Bancorp, Inc. | | | 2,548 | | | | 127,273 | | |
Customers Bancorp, Inc. (a) | | | 2,829 | | | | 80,287 | | |
Fidelity Southern Corp. | | | 6,632 | | | | 168,519 | | |
Financial Institutions, Inc. | | | 5,175 | | | | 170,258 | | |
First BanCorp (a) | | | 21,967 | | | | 168,048 | | |
First Business Financial Services, Inc. | | | 1,605 | | | | 41,730 | | |
First Financial Corp. | | | 929 | | | | 42,130 | | |
First Hawaiian, Inc. | | | 5,870 | | | | 170,347 | | |
First Internet Bancorp | | | 3,795 | | | | 129,410 | | |
First Mid-Illinois Bancshares, Inc. | | | 1,040 | | | | 40,872 | | |
Flushing Financial Corp. | | | 6,481 | | | | 169,154 | | |
Franklin Financial Network, Inc. (a) | | | 4,436 | | | | 166,794 | | |
Great Western Bancorp, Inc. | | | 962 | | | | 40,394 | | |
Hanmi Financial Corp. | | | 5,908 | | | | 167,492 | | |
Hilltop Holdings, Inc. | | | 7,622 | | | | 168,218 | | |
HomeTrust Bancshares, Inc. (a) | | | 1,449 | | | | 40,789 | | |
Hope Bancorp, Inc. | | | 9,577 | | | | 170,757 | | |
Howard Bancorp, Inc. (a) | | | 2,200 | | | | 39,600 | | |
International Bancshares Corp. | | | 2,976 | | | | 127,373 | | |
Investors Bancorp, Inc. | | | 13,107 | | | | 167,639 | | |
Live Oak Bancshares, Inc. | | | 2,781 | | | | 85,238 | | |
Midland States Bancorp, Inc. | | | 4,982 | | | | 170,683 | | |
MidSouth Bancorp, Inc. | | | 3,061 | | | | 40,558 | | |
MidWestOne Financial Group, Inc. | | | 1,250 | | | | 42,225 | | |
National Bankshares, Inc. | | | 872 | | | | 40,461 | | |
Northrim BanCorp, Inc. | | | 2,113 | | | | 83,569 | | |
OFG Bancorp | | | 2,934 | | | | 41,223 | | |
Old National Bancorp | | | 2,244 | | | | 41,738 | | |
Orrstown Financial Services, Inc. | | | 1,576 | | | | 40,976 | | |
Peapack Gladstone Financial Corp. | | | 2,472 | | | | 85,506 | | |
| | | Shares
Held | | Value | |
RBB Bancorp | | | 2,571 | | | $ | 82,581 | | |
Republic Bancorp, Inc. | | | 910 | | | | 41,223 | | |
Sandy Spring Bancorp, Inc. | | | 1,002 | | | | 41,092 | | |
Southern National Bancorp of Virginia, Inc. | | | 7,273 | | | | 129,750 | | |
State Bank Financial Corp. | | | 1,228 | | | | 41,015 | | |
TriCo Bancshares | | | 2,152 | | | | 80,592 | | |
Trustmark Corp. | | | 5,220 | | | | 170,329 | | |
West Bancorporation, Inc. | | | 1,615 | | | | 40,617 | | |
Westamerica Bancorporation | | | 704 | | | | 39,783 | | |
| | | | 4,603,087 | | |
Capital Markets — 4.18% | |
AllianceBernstein Holding LP | | | 6,002 | | | | 171,357 | | |
BrightSphere Investment Group PLC | | | 11,627 | | | | 165,801 | | |
Donnelley Financial Solutions, Inc. (a) | | | 9,832 | | | | 170,782 | | |
Ellington Financial LLC | | | 10,750 | | | | 167,808 | | |
Federated Investors, Inc. | | | 7,469 | | | | 174,176 | | |
GAMCO Investors, Inc. | | | 1,593 | | | | 42,629 | | |
Greenhill & Company, Inc. | | | 5,953 | | | | 169,065 | | |
Legg Mason, Inc. | | | 4,901 | | | | 170,212 | | |
Och-Ziff Capital Management Group LLC | | | 44,083 | | | | 85,080 | | |
Oppenheimer Holdings, Inc. | | | 6,098 | | | | 170,744 | | |
Victory Capital Holdings, Inc. (a) | | | 12,777 | | | | 135,181 | | |
Waddell & Reed Financial, Inc. | | | 9,487 | | | | 170,481 | | |
| | | | 1,793,316 | | |
Consumer Finance — 0.40% | |
Navient Corp. | | | 13,275 | | | | 172,973 | | |
Diversified Financial Services — 0.79% | |
Compass Diversified Holdings | | | 9,778 | | | | 169,159 | | |
FGL Holdings (a) | | | 20,035 | | | | 168,094 | | |
| | | | 337,253 | | |
Insurance — 4.77% | |
Ambac Financial Group, Inc. (a) | | | 4,237 | | | | 84,104 | | |
American Equity Investment Life Holding Company | | | 2,384 | | | | 85,824 | | |
Argo Group International Holdings Ltd. | | | 2,184 | | | | 127,000 | | |
Aspen Insurance Holdings Ltd. | | | 4,213 | | | | 171,469 | | |
CNO Financial Group, Inc. | | | 9,166 | | | | 174,520 | | |
EMC Insurance Group, Inc. | | | 1,498 | | | | 41,614 | | |
Employers Holdings, Inc. | | | 2,068 | | | | 83,134 | | |
Enstar Group Ltd. (a) | | | 830 | | | | 172,059 | | |
Global Indemnity Ltd. | | | 2,042 | | | | 79,597 | | |
Horace Mann Educators Corp. | | | 3,839 | | | | 171,219 | | |
MBIA, Inc. (a) | | | 14,788 | | | | 133,684 | | |
National Western Life Group, Inc. | | | 556 | | | | 170,837 | | |
The Navigators Group, Inc. | | | 1,465 | | | | 83,505 | | |
The accompanying notes are an integral part of these financial statements.
26
Schedule of Investments — June 30, 2018
Hotchkis & Wiley Small Cap Diversified Value Fund
| | | Shares
Held | | Value | |
ProAssurance Corp. | | | 3,647 | | | $ | 129,286 | | |
Stewart Information Services Corp. | | | 2,974 | | | | 128,090 | | |
Third Point Reinsurance Ltd. (a) | | | 10,181 | | | | 127,263 | | |
White Mountains Insurance Group Ltd. | | | 95 | | | | 86,128 | | |
| | | | 2,049,333 | | |
Mortgage Real Estate Investment Trusts — 1.70% | |
Ares Commercial Real Estate Corp. | | | 12,440 | | | | 171,796 | | |
Colony Credit Real Estate, Inc. | | | 8,642 | | | | 179,150 | | |
Exantas Capital Corp. | | | 12,438 | | | | 126,619 | | |
Great Ajax Corp. | | | 3,215 | | | | 42,052 | | |
Owens Realty Mortgage, Inc. | | | 2,452 | | | | 40,899 | | |
PennyMac Mortgage Investment Trust | | | 8,853 | | | | 168,118 | | |
| | | | 728,634 | | |
Thrifts & Mortgage Finance — 3.92% | |
Capitol Federal Financial, Inc. | | | 12,968 | | | | 170,659 | | |
Dime Community Bancshares, Inc. | | | 8,682 | | | | 169,299 | | |
HomeStreet, Inc. (a) | | | 6,063 | | | | 163,398 | | |
Luther Burbank Corp. | | | 3,439 | | | | 39,566 | | |
Merchants Bancorp | | | 6,206 | | | | 177,056 | | |
Northfield Bancorp, Inc. | | | 10,218 | | | | 169,823 | | |
Oritani Financial Corp. | | | 10,398 | | | | 168,448 | | |
PCSB Financial Corp. | | | 4,154 | | | | 82,540 | | |
Southern Missouri Bancorp, Inc. | | | 1,068 | | | | 41,673 | | |
Sterling Bancorp, Inc. | | | 6,196 | | | | 82,779 | | |
Territorial Bancorp, Inc. | | | 1,345 | | | | 41,695 | | |
TrustCo Bank Corp. | | | 14,293 | | | | 127,208 | | |
Washington Federal, Inc. | | | 5,103 | | | | 166,868 | | |
Waterstone Financial, Inc. | | | 4,958 | | | | 84,534 | | |
| | | | 1,685,546 | | |
TOTAL FINANCIALS | | | 11,370,142 | | |
HEALTH CARE — 2.98% | |
Biotechnology — 0.19% | |
Emergent BioSolutions, Inc. (a) | | | 1,642 | | | | 82,905 | | |
Health Care Equipment & Supplies — 1.10% | |
Anika Therapeutics, Inc. (a) | | | 2,821 | | | | 90,272 | | |
Invacare Corp. | | | 9,122 | | | | 169,669 | | |
Meridian Bioscience, Inc. | | | 8,018 | | | | 127,486 | | |
Varex Imaging Corp. (a) | | | 2,331 | | | | 86,457 | | |
| | | | 473,884 | | |
| | | Shares
Held | | Value | |
Health Care Providers & Services — 1.69% | |
AMN Healthcare Services, Inc. (a) | | | 711 | | | $ | 41,665 | | |
LifePoint Health, Inc. (a) | | | 3,512 | | | | 171,386 | | |
Magellan Health, Inc. (a) | | | 1,783 | | | | 171,079 | | |
National HealthCare Corp. | | | 2,441 | | | | 171,797 | | |
Owens & Minor, Inc. | | | 2,419 | | | | 40,421 | | |
Tivity Health, Inc. (a) | | | 3,651 | | | | 128,515 | | |
| | | | 724,863 | | |
TOTAL HEALTH CARE | | | 1,281,652 | | |
INDUSTRIALS — 17.71%
Aerospace & Defense — 1.10% | |
Astronics Corp. (a) | | | 2,375 | | | | 85,429 | | |
Esterline Technologies Corp. (a) | | | 1,164 | | | | 85,903 | | |
National Presto Industries, Inc. | | | 1,031 | | | | 127,844 | | |
Vectrus, Inc. (a) | | | 5,619 | | | | 173,178 | | |
| | | | 472,354 | | |
Air Freight & Logistics — 0.20% | |
Hub Group, Inc. (a) | | | 1,709 | | | | 85,108 | | |
Airlines — 1.11% | |
Allegiant Travel Company | | | 1,249 | | | | 173,549 | | |
Hawaiian Holdings, Inc. | | | 4,818 | | | | 173,207 | | |
Spirit Airlines, Inc. (a) | | | 3,586 | | | | 130,351 | | |
| | | | 477,107 | | |
Building Products — 2.22% | |
Apogee Enterprises, Inc. | | | 2,962 | | | | 142,680 | | |
Armstrong Flooring, Inc. (a) | | | 12,054 | | | | 169,238 | | |
Builders FirstSource, Inc. (a) | | | 2,274 | | | | 41,591 | | |
Caesarstone Ltd. | | | 11,557 | | | | 174,511 | | |
Gibraltar Industries, Inc. (a) | | | 1,086 | | | | 40,725 | | |
Insteel Industries, Inc. | | | 2,582 | | | | 86,239 | | |
Masonite International Corp. (a) | | | 2,380 | | | | 171,003 | | |
NCI Building Systems, Inc. (a) | | | 2,013 | | | | 42,273 | | |
Universal Forest Products, Inc. | | | 2,302 | | | | 84,299 | | |
| | | | 952,559 | | |
Commercial Services & Supplies — 2.70% | |
ACCO Brands Corp. | | | 6,375 | | | | 88,294 | | |
Deluxe Corp. | | | 1,305 | | | | 86,404 | | |
Ennis, Inc. | | | 6,598 | | | | 134,269 | | |
Herman Miller, Inc. | | | 5,046 | | | | 171,059 | | |
InnerWorkings, Inc. (a) | | | 9,875 | | | | 85,814 | | |
Knoll, Inc. | | | 8,299 | | | | 172,702 | | |
LSC Communications, Inc. | | | 10,867 | | | | 170,177 | | |
Quad/Graphics, Inc. | | | 1,993 | | | | 41,514 | | |
Steelcase, Inc. | | | 12,527 | | | | 169,115 | | |
UniFirst Corp. | | | 234 | | | | 41,395 | | |
| | | | 1,160,743 | | |
The accompanying notes are an integral part of these financial statements.
27
Schedule of Investments — June 30, 2018
Hotchkis & Wiley Small Cap Diversified Value Fund
| | | Shares
Held | | Value | |
Construction & Engineering — 1.58% | |
Dycom Industries, Inc. (a) | | | 1,344 | | | $ | 127,021 | | |
KBR, Inc. | | | 9,536 | | | | 170,885 | | |
MYR Group, Inc. (a) | | | 3,621 | | | | 128,401 | | |
Primoris Services Corp. | | | 1,510 | | | | 41,117 | | |
Tutor Perini Corp. (a) | | | 9,226 | | | | 170,220 | | |
Valmont Industries, Inc. | | | 280 | | | | 42,210 | | |
| | | | 679,854 | | |
Electrical Equipment — 0.69% | |
Encore Wire Corp. | | | 2,678 | | | | 127,071 | | |
Generac Holdings, Inc. (a) | | | 842 | | | | 43,557 | | |
Preformed Line Products Company | | | 941 | | | | 83,542 | | |
Thermon Group Holdings, Inc. (a) | | | 1,805 | | | | 41,280 | | |
| | | | 295,450 | | |
Machinery — 5.02% | |
Alamo Group, Inc. | | | 463 | | | | 41,837 | | |
Blue Bird Corp. (a) | | | 5,746 | | | | 128,423 | | |
Briggs & Stratton Corp. | | | 2,323 | | | | 40,908 | | |
Commercial Vehicle Group, Inc. (a) | | | 23,625 | | | | 173,407 | | |
EnPro Industries, Inc. | | | 2,449 | | | | 171,307 | | |
Global Brass & Copper Holdings, Inc. | | | 5,220 | | | | 163,646 | | |
Graham Corp. | | | 3,228 | | | | 83,315 | | |
The Greenbrier Companies, Inc. | | | 3,698 | | | | 195,069 | | |
Hurco Companies, Inc. | | | 2,825 | | | | 126,419 | | |
Hyster-Yale Materials Handling, Inc. | | | 1,955 | | | | 125,609 | | |
Luxfer Holdings PLC | | | 2,495 | | | | 43,613 | | |
Lydall, Inc. (a) | | | 1,999 | | | | 87,256 | | |
Meritor, Inc. (a) | | | 8,438 | | | | 173,569 | | |
Mueller Industries, Inc. | | | 2,801 | | | | 82,658 | | |
Navistar International Corp. (a) | | | 3,216 | | | | 130,956 | | |
Park-Ohio Holdings Corp. | | | 2,297 | | | | 85,678 | | |
REV Group, Inc. | | | 7,974 | | | | 135,638 | | |
The Timken Company | | | 944 | | | | 41,111 | | |
Wabash National Corp. | | | 6,860 | | | | 128,008 | | |
| | | | 2,158,427 | | |
Marine — 0.41% | |
Matson, Inc. | | | 4,547 | | | | 174,514 | | |
| | | Shares
Held | | Value | |
Professional Services — 1.89% | |
Barrett Business Services, Inc. | | | 480 | | | $ | 46,354 | | |
CBIZ, Inc. (a) | | | 1,770 | | | | 40,710 | | |
FTI Consulting, Inc. (a) | | | 1,365 | | | | 82,555 | | |
GP Strategies Corp. (a) | | | 4,764 | | | | 83,846 | | |
Kelly Services, Inc. | | | 5,810 | | | | 130,435 | | |
Kforce, Inc. | | | 2,445 | | | | 83,864 | | |
Korn/Ferry International | | | 2,879 | | | | 178,296 | | |
Navigant Consulting, Inc. (a) | | | 3,849 | | | | 85,217 | | |
Resources Connection, Inc. | | | 4,840 | | | | 81,796 | | |
| | | | 813,073 | | |
Trading Companies & Distributors — 0.79% | |
Beacon Roofing Supply, Inc. (a) | | | 972 | | | | 41,427 | | |
Rush Enterprises, Inc. (a) | | | 3,874 | | | | 168,054 | | |
WESCO International, Inc. (a) | | | 2,299 | | | | 131,273 | | |
| | | | 340,754 | | |
TOTAL INDUSTRIALS | | | 7,609,943 | | |
INFORMATION TECHNOLOGY — 10.77%
Communications Equipment — 1.01% | |
Comtech Telecommunications Corp. | | | 1,340 | | | | 42,719 | | |
Digi International, Inc. (a) | | | 6,252 | | | | 82,526 | | |
NETGEAR, Inc. (a) | | | 1,373 | | | | 85,813 | | |
Quantenna Communications, Inc. (a) | | | 8,274 | | | | 128,578 | | |
Ribbon Communications, Inc. (a) | | | 12,989 | | | | 92,482 | | |
| | | | 432,118 | | |
Electronic Equipment, Instruments & Components — 4.45% | |
Anixter International, Inc. (a) | | | 2,688 | | | | 170,150 | | |
AVX Corp. | | | 10,936 | | | | 171,367 | | |
Benchmark Electronics, Inc. | | | 4,408 | | | | 128,493 | | |
Daktronics, Inc. | | | 14,929 | | | | 127,046 | | |
ePlus, Inc. (a) | | | 890 | | | | 83,749 | | |
Insight Enterprises, Inc. (a) | | | 2,650 | | | | 129,665 | | |
Methode Electronics, Inc. | | | 3,174 | | | | 127,912 | | |
PC Connection, Inc. | | | 3,893 | | | | 129,248 | | |
Plexus Corp. (a) | | | 2,128 | | | | 126,701 | | |
Sanmina Corp. (a) | | | 5,640 | | | | 165,252 | | |
ScanSource, Inc. (a) | | | 3,153 | | | | 127,066 | | |
Tech Data Corp. (a) | | | 2,057 | | | | 168,921 | | |
TTM Technologies, Inc. (a) | | | 7,322 | | | | 129,087 | | |
Vishay Intertechnology, Inc. | | | 5,512 | | | | 127,878 | | |
| | | | 1,912,535 | | |
The accompanying notes are an integral part of these financial statements.
28
Schedule of Investments — June 30, 2018
Hotchkis & Wiley Small Cap Diversified Value Fund
| | | Shares
Held | | Value | |
Internet Software & Services — 0.50% | |
Cars.com, Inc. (a) | | | 3,042 | | | $ | 86,362 | | |
NIC, Inc. | | | 8,223 | | | | 127,868 | | |
| | | | 214,230 | | |
IT Services — 1.41% | |
CSG Systems International, Inc. | | | 3,105 | | | | 126,901 | | |
Luxoft Holding, Inc. (a) | | | 4,929 | | | | 181,633 | | |
Sykes Enterprises, Inc. (a) | | | 4,388 | | | | 126,287 | | |
Syntel, Inc. (a) | | | 5,351 | | | | 171,714 | | |
| | | | 606,535 | | |
Semiconductors & Semiconductor Equipment — 2.61% | |
Advanced Energy Industries, Inc. (a) | | | 1,415 | | | | 82,197 | | |
Amkor Technology, Inc. (a) | | | 9,844 | | | | 84,560 | | |
Aquantia Corp. (a) | | | 7,297 | | | | 84,499 | | |
Cirrus Logic, Inc. (a) | | | 4,505 | | | | 172,677 | | |
Diodes, Inc. (a) | | | 4,955 | | | | 170,799 | | |
Ichor Holdings Ltd. (a) | | | 4,255 | | | | 90,291 | | |
Photronics, Inc. (a) | | | 22,286 | | | | 177,731 | | |
SMART Global Holdings, Inc. (a) | | | 2,664 | | | | 84,902 | | |
Synaptics, Inc. (a) | | | 3,455 | | | | 174,028 | | |
| | | | 1,121,684 | | |
Software — 0.40% | |
MicroStrategy, Inc. (a) | | | 1,034 | | | | 132,094 | | |
Monotype Imaging Holdings, Inc. | | | 1,980 | | | | 40,194 | | |
| | | | 172,288 | | |
Technology Hardware, Storage & Peripherals — 0.39% | |
Super Micro Computer, Inc. (a) | | | 7,082 | | | | 167,489 | | |
TOTAL INFORMATION TECHNOLOGY | | | 4,626,879 | | |
MATERIALS — 3.98%
Chemicals — 2.09% | |
American Vanguard Corp. | | | 3,718 | | | | 85,328 | | |
Core Molding Technologies, Inc. | | | 2,947 | | | | 42,083 | | |
FutureFuel Corp. | | | 8,904 | | | | 124,745 | | |
GCP Applied Technologies, Inc. (a) | | | 1,467 | | | | 42,470 | | |
Hawkins, Inc. | | | 3,695 | | | | 130,618 | | |
Innospec, Inc. | | | 1,664 | | | | 127,379 | | |
Koppers Holdings, Inc. (a) | | | 1,089 | | | | 41,763 | | |
Minerals Technologies, Inc. | | | 1,118 | | | | 84,241 | | |
Rayonier Advanced Materials, Inc. | | | 5,218 | | | | 89,176 | | |
Stepan Company | | | 1,655 | | | | 129,107 | | |
| | | | 896,910 | | |
| | | Shares
Held | | Value | |
Containers & Packaging — 0.40% | |
Owens-Illinois, Inc. (a) | | | 2,508 | | | $ | 42,159 | | |
Silgan Holdings, Inc. | | | 4,798 | | | | 128,731 | | |
| | | | 170,890 | | |
Metals & Mining — 0.79% | |
Cleveland-Cliffs, Inc. (a) | | | 5,029 | | | | 42,394 | | |
Compass Minerals International, Inc. | | | 1,986 | | | | 130,580 | | |
Kaiser Aluminum Corp. | | | 385 | | | | 40,082 | | |
SunCoke Energy Partners LP | | | 8,563 | | | | 128,445 | | |
| | | | 341,501 | | |
Paper & Forest Products — 0.70% | |
Clearwater Paper Corp. (a) | | | 7,535 | | | | 174,058 | | |
PH Glatfelter Company | | | 4,332 | | | | 84,864 | | |
Schweitzer-Mauduit International, Inc. | | | 980 | | | | 42,846 | | |
| | | | 301,768 | | |
TOTAL MATERIALS | | | 1,711,069 | | |
REAL ESTATE — 1.32%
Equity Real Estate Investment Trusts — 1.12% | |
Colony Capital, Inc. | | | 28,295 | | | | 176,561 | | |
The GEO Group, Inc. | | | 6,449 | | | | 177,606 | | |
Seritage Growth Properties | | | 3,042 | | | | 129,072 | | |
| | | | 483,239 | | |
Real Estate Management & Development — 0.20% | |
HFF, Inc. | | | 1,253 | | | | 43,040 | | |
Marcus & Millichap, Inc. (a) | | | 1,084 | | | | 42,287 | | |
| | | | 85,327 | | |
TOTAL REAL ESTATE | | | 568,566 | | |
TELECOMMUNICATION SERVICES — 0.30%
Diversified Telecommunication Services — 0.30% | |
IDT Corp. (a) | | | 22,506 | | | | 126,484 | | |
TOTAL TELECOMMUNICATION SERVICES | | | 126,484 | | |
UTILITIES — 4.26%
Electric Utilities — 1.58% | |
ALLETE, Inc. | | | 1,111 | | | | 86,003 | | |
El Paso Electric Company | | | 1,447 | | | | 85,518 | | |
PNM Resources, Inc. | | | 4,390 | | | | 170,771 | | |
Portland General Electric Company | | | 3,999 | | | | 170,996 | | |
Spark Energy, Inc. | | | 17,032 | | | | 166,062 | | |
| | | | 679,350 | | |
The accompanying notes are an integral part of these financial statements.
29
Schedule of Investments — June 30, 2018
Hotchkis & Wiley Small Cap Diversified Value Fund
| | | Shares
Held | | Value | |
Gas Utilities — 1.29% | |
Northwest Natural Gas Company | | | 2,023 | | | $ | 129,067 | | |
South Jersey Industries, Inc. | | | 3,809 | | | | 127,487 | | |
Spire, Inc. | | | 2,390 | | | | 168,855 | | |
Star Group LP | | | 4,345 | | | | 42,581 | | |
Suburban Propane Partners LP | | | 3,609 | | | | 84,775 | | |
| | | | 552,765 | | |
Multi-Utilities — 1.39% | |
Avista Corp. | | | 3,221 | | | | 169,618 | | |
Black Hills Corporation | | | 2,773 | | | | 169,735 | | |
NorthWestern Corp. | | | 2,999 | | | | 171,693 | | |
Unitil Corp. | | | 1,652 | | | | 84,318 | | |
| | | | 595,364 | | |
TOTAL UTILITIES | | | 1,827,479 | | |
Total common stocks
(Cost $40,383,653) | | | | | 41,895,169 | | |
Total long-term investments
(Cost $40,383,653) | | | | | 41,895,169 | | |
SHORT-TERM
INVESTMENTS — 4.15% | | Principal
Amount | | Value | |
Time Deposits — 4.15% | |
Banco Santander SA,
1.27%, 07/02/2018* | | $ | 1,784,361 | | | $ | 1,784,361 | | |
Total short-term investments
(Cost $1,784,361) | | | 1,784,361 | | |
Total investments — 101.67%
(Cost $42,168,014) | | | | | 43,679,530 | | |
Liabilities in excess of other assets — (1.67)% | | | | | (716,821 | ) | |
Net assets — 100.00% | | $ | 42,962,709 | | |
(a) — Non-income producing security.
* — Invested through a cash management account administered by Brown Brothers Harriman & Co.
The accompanying notes are an integral part of these financial statements.
30
Schedule of Investments — June 30, 2018
Hotchkis & Wiley Global Value Fund

* Based on country of risk.
Largest Equity Holdings | | Percent of
net assets | |
American International Group, Inc. | | | 4.87 | % | |
WestJet Airlines Ltd. | | | 3.34 | % | |
Wells Fargo & Company | | | 3.09 | % | |
Societe Generale SA | | | 3.05 | % | |
Hewlett Packard Enterprise Company | | | 2.85 | % | |
Barclays PLC | | | 2.76 | % | |
Telefonaktiebolaget LM Ericsson | | | 2.73 | % | |
ARRIS International PLC | | | 2.68 | % | |
Discovery, Inc. - Class C | | | 2.66 | % | |
Oracle Corp. | | | 2.62 | % | |
COMMON
STOCKS — 99.70% | | Shares
Held | | Value | |
CONSUMER DISCRETIONARY — 9.33%
Auto Components — 2.34% | |
Adient PLC | | | 1,513 | | | $ | 74,424 | | |
Magna International, Inc. | | | 2,630 | | | | 152,882 | | |
| | | | 227,306 | | |
Automobiles — 3.09% | |
Bayerische Motoren Werke AG (v) | | | 1,807 | | | | 143,743 | | |
General Motors Company | | | 3,969 | | | | 156,379 | | |
| | | | 300,122 | | |
Media — 2.66% | |
Discovery, Inc. — Class C (a) | | | 10,152 | | | | 258,876 | | |
Specialty Retail — 1.24% | |
Kingfisher PLC (v) | | | 18,398 | | | | 71,947 | | |
Office Depot, Inc. | | | 18,859 | | | | 48,091 | | |
| | | | 120,038 | | |
TOTAL CONSUMER DISCRETIONARY | | | 906,342 | | |
CONSUMER STAPLES — 4.11%
Beverages — 2.07% | |
Heineken Holding NV (v) | | | 987 | | | | 94,393 | | |
PepsiCo, Inc. | | | 981 | | | | 106,801 | | |
| | | | 201,194 | | |
Food & Staples Retailing — 1.04% | |
Tesco PLC (v) | | | 29,814 | | | | 100,878 | | |
Personal Products — 1.00% | |
Unilever PLC (v) | | | 1,766 | | | | 97,555 | | |
TOTAL CONSUMER STAPLES | | | 399,627 | | |
| | Shares
Held | | Value | |
ENERGY — 12.88%
Energy Equipment & Services — 3.76% | |
Borr Drilling Ltd. (a) (v) | | | 10,006 | | | $ | 47,725 | | |
C&J Energy Services, Inc. (a) | | | 1,874 | | | | 44,227 | | |
Frank's International NV (a) | | | 16,055 | | | | 125,229 | | |
National Oilwell Varco, Inc. | | | 2,346 | | | | 101,816 | | |
Nine Energy Service, Inc. (a) | | | 1,390 | | | | 46,037 | | |
| | | | 365,034 | | |
Oil, Gas & Consumable Fuels — 9.12% | |
Apache Corp. | | | 1,971 | | | | 92,144 | | |
Cairn Energy PLC (a) (v) | | | 36,190 | | | | 118,832 | | |
Kosmos Energy Ltd. (a) | | | 21,418 | | | | 177,127 | | |
Marathon Oil Corp. | | | 3,750 | | | | 78,225 | | |
Ophir Energy PLC (a) | | | 147,966 | | | | 98,615 | | |
Rockhopper Exploration PLC (a) | | | 134,915 | | | | 73,002 | | |
Whiting Petroleum Corp. (a) | | | 4,713 | | | | 248,470 | | |
| | | | 886,415 | | |
TOTAL ENERGY | | | 1,251,449 | | |
FINANCIALS — 28.11%
Banks — 16.90% | |
Barclays PLC (v) | | | 108,677 | | | | 268,620 | | |
Citigroup, Inc. | | | 2,975 | | | | 199,087 | | |
Credito Valtellinese SpA (a) (v) | | | 1,737,702 | | | | 195,518 | | |
ING Groep NV (v) | | | 10,136 | | | | 145,498 | | |
Popular, Inc. | | | 5,220 | | | | 235,996 | | |
Societe Generale SA (v) | | | 7,053 | | | | 296,437 | | |
Wells Fargo & Company | | | 5,424 | | | | 300,707 | | |
| | | | 1,641,863 | | |
Capital Markets — 1.45% | |
Credit Suisse Group AG (a) (v) | | | 9,427 | | | | 140,963 | | |
Consumer Finance — 0.73% | |
Capital One Financial Corp. | | | 773 | | | | 71,039 | | |
The accompanying notes are an integral part of these financial statements.
31
Schedule of Investments — June 30, 2018
Hotchkis & Wiley Global Value Fund
| | | Shares
Held | | Value | |
Insurance — 9.03% | |
American International Group, Inc. | | | 8,932 | | | $ | 473,574 | | |
Tokio Marine Holdings, Inc. (v) | | | 4,000 | | | | 187,133 | | |
Zurich Insurance Group AG (v) | | | 734 | | | | 217,066 | | |
| | | | 877,773 | | |
TOTAL FINANCIALS | | | 2,731,638 | | |
HEALTH CARE — 3.70%
Health Care Providers & Services — 1.24% | |
Anthem, Inc. | | | 504 | | | | 119,967 | | |
Pharmaceuticals — 2.46% | |
GlaxoSmithKline PLC — ADR | | | 3,158 | | | | 127,299 | | |
Sanofi (v) | | | 1,397 | | | | 112,123 | | |
| | | | 239,422 | | |
TOTAL HEALTH CARE | | | 359,389 | | |
INDUSTRIALS — 22.43%
Aerospace & Defense — 4.01% | |
BAE Systems PLC (v) | | | 24,546 | | | | 208,820 | | |
Embraer SA — ADR | | | 7,253 | | | | 180,600 | | |
| | | | 389,420 | | |
Air Freight & Logistics — 2.27% | |
Royal Mail PLC (v) | | | 33,126 | | | | 220,385 | | |
Airlines — 3.34% | |
WestJet Airlines Ltd. | | | 23,559 | | | | 324,896 | | |
Building Products — 3.12% | |
Johnson Controls International PLC | | | 2,885 | | | | 96,503 | | |
Masonite International Corp. (a) | | | 2,872 | | | | 206,353 | | |
| | | | 302,856 | | |
Construction & Engineering — 0.51% | |
KBR, Inc. | | | 2,783 | | | | 49,871 | | |
Machinery — 7.12% | |
| CNH Industrial NV | | | 16,428 | | | | 172,987 | | |
Cummins, Inc. | | | 1,255 | | | | 166,915 | | |
Danieli & C Officine Meccaniche SpA (v) | | | 14,206 | | | | 249,701 | | |
Navistar International Corp. (a) | | | 2,521 | | | | 102,655 | | |
| | | | 692,258 | | |
Marine — 1.01% | |
Matson, Inc. | | | 2,556 | | | | 98,099 | | |
Road & Rail — 1.05% | |
AMERCO | | | 287 | | | | 102,215 | | |
TOTAL INDUSTRIALS | | | 2,180,000 | | |
INFORMATION TECHNOLOGY — 13.79%
Communications Equipment — 5.41% | |
ARRIS International PLC (a) | | | 10,675 | | | | 260,951 | | |
Telefonaktiebolaget LM Ericsson — ADR | | | 34,602 | | | | 265,397 | | |
| | | | 526,348 | | |
| | | Shares
Held | | Value | |
Electronic Equipment, Instruments & Components — 0.99% | |
Corning, Inc. | | | 3,501 | | | $ | 96,312 | | |
Software — 4.54% | |
Microsoft Corp. | | | 1,886 | | | | 185,979 | | |
Oracle Corp. | | | 5,789 | | | | 255,063 | | |
| | | | 441,042 | | |
Technology Hardware, Storage & Peripherals — 2.85% | |
Hewlett Packard Enterprise Company | | | 18,953 | | | | 276,903 | | |
TOTAL INFORMATION TECHNOLOGY | | | 1,340,605 | | |
REAL ESTATE — 2.52%
Equity Real Estate Investment Trusts — 2.52% | |
Seritage Growth Properties | | | 5,770 | | | | 244,821 | | |
TOTAL REAL ESTATE | | | 244,821 | | |
TELECOMMUNICATION SERVICES — 2.83%
Wireless Telecommunication Services — 2.83% | |
Orange Belgium SA (v) | | | 2,448 | | | | 41,257 | | |
Vodafone Group PLC — ADR | | | 9,632 | | | | 234,154 | | |
TOTAL TELECOMMUNICATION SERVICES | | | 275,411 | | |
Total common stocks
(Cost $8,857,576) | | | | | 9,689,282 | | |
Total long-term investments
(Cost $8,857,576) | | | | | 9,689,282 | | |
SHORT-TERM
INVESTMENTS — 0.86% | | Principal
Amount | | | |
Time Deposits — 0.86% | |
Brown Brothers Harriman & Co.,
0.51%, 07/03/2018* | | CAD | 2,176 | | | | 1,655 | | |
Brown Brothers Harriman & Co.,
0.23%, 07/02/2018* | | GBP | 1 | | | | 1 | | |
Citigroup, Inc., 1.27%, 07/02/2018* | | $ | 81,772 | | | | 81,772 | | |
Total short-term investments
(Cost $83,428) | | | 83,428 | | |
Total investments — 100.56%
(Cost $8,941,004) | | | | | 9,772,710 | | |
Liabilities in excess of other assets — (0.56)% | | | | | (54,233 | ) | |
Net assets — 100.00% | | $ | 9,718,477 | | |
(a) — Non-income producing security.
(v) — Security was fair valued as a result of market movements following the close of local trading using a third-party vendor's proprietary fair value pricing model. The total market value of these securities was $2,958,594, which represented 30.44% of net assets. See Security Valuation in Note 1 in Notes to the Financial Statements.
ADR — American Depositary Receipt
CAD — Canadian Dollar
GBP — British Pound
* — Invested through a cash management account administered by Brown Brothers Harriman & Co.
The accompanying notes are an integral part of these financial statements.
32
Schedule of Investments — June 30, 2018
Hotchkis & Wiley International Value Fund

Largest Equity Holdings | | Percent of
net assets | |
BAE Systems PLC | | | 4.18 | % | |
WestJet Airlines Ltd. | | | 3.92 | % | |
Societe Generale SA | | | 3.59 | % | |
ARRIS International PLC | | | 3.54 | % | |
Tokio Marine Holdings, Inc. | | | 3.31 | % | |
Barclays PLC | | | 3.26 | % | |
Enstar Group Ltd. | | | 3.17 | % | |
Masonite International Corp. | | | 3.11 | % | |
Danieli & C Officine Meccaniche SpA | | | 3.07 | % | |
Zurich Insurance Group AG | | | 2.97 | % | |
* Based on country of risk
+ Sum of sectors shown is greater than 100% due to liabilities in excess of other assets of (0.48)%.
COMMON
STOCKS — 100.48% | | Shares
Held | | Value | |
CONSUMER DISCRETIONARY — 7.87%
Auto Components — 3.16% | |
Adient PLC | | | 692 | | | $ | 34,039 | | |
Magna International, Inc. | | | 798 | | | | 46,388 | | |
| | | | 80,427 | | |
Automobiles — 2.18% | |
Bayerische Motoren Werke AG (v) | | | 476 | | | | 37,865 | | |
Honda Motor Company Ltd. (v) | | | 600 | | | | 17,593 | | |
| | | | 55,458 | | |
Media — 0.58% | |
RTL Group SA (v) | | | 216 | | | | 14,692 | | |
Specialty Retail — 1.95% | |
Kingfisher PLC (v) | | | 9,735 | | | | 38,070 | | |
Pendragon PLC | | | 35,662 | | | | 11,507 | | |
| | | | 49,577 | | |
TOTAL CONSUMER DISCRETIONARY | | | 200,154 | | |
CONSUMER STAPLES — 8.08%
Beverages — 2.06% | |
Heineken Holding NV (v) | | | 547 | | | | 52,313 | | |
Food & Staples Retailing — 1.91% | |
Tesco PLC (v) | | | 14,396 | | | | 48,710 | | |
Food Products — 1.51% | |
Ezaki Glico Company Ltd. (v) | | | 800 | | | | 38,429 | | |
Personal Products — 2.15% | |
Unilever PLC (v) | | | 988 | | | | 54,578 | | |
Tobacco — 0.45% | |
Scandinavian Tobacco Group (r) (v) | | | 757 | | | | 11,422 | | |
TOTAL CONSUMER STAPLES | | | 205,452 | | |
| | Shares
Held | | Value | |
ENERGY — 10.12%
Energy Equipment & Services — 4.57% | |
Borr Drilling Ltd. (a) (v) | | | 5,296 | | | $ | 25,260 | | |
Frank's International NV (a) | | | 9,057 | | | | 70,645 | | |
WorleyParsons Ltd. (v) | | | 1,560 | | | | 20,150 | | |
| | | | 116,055 | | |
Oil, Gas & Consumable Fuels — 5.55% | |
Cairn Energy PLC (a) (v) | | | 9,036 | | | | 29,671 | | |
Kosmos Energy Ltd. (a) | | | 5,306 | | | | 43,881 | | |
Ophir Energy PLC (a) | | | 37,546 | | | | 25,023 | | |
Rockhopper Exploration PLC (a) | | | 42,625 | | | | 23,064 | | |
Royal Dutch Shell PLC (v) | | | 561 | | | | 19,469 | | |
| | | | 141,108 | | |
TOTAL ENERGY | | | 257,163 | | |
FINANCIALS — 28.27%
Banks — 13.18% | |
Barclays PLC (v) | | | 33,547 | | | | 82,919 | | |
BNP Paribas SA (v) | | | 363 | | | | 22,454 | | |
Credito Valtellinese SpA (a) (v) | | | 580,187 | | | | 65,280 | | |
ING Groep NV (v) | | | 3,565 | | | | 51,174 | | |
Societe Generale SA (v) | | | 2,171 | | | | 91,246 | | |
Standard Chartered PLC (v) | | | 2,435 | | | | 22,118 | | |
| | | | 335,191 | | |
Capital Markets — 1.97% | |
Credit Suisse Group AG (a) (v) | | | 3,348 | | | | 50,063 | | |
The accompanying notes are an integral part of these financial statements.
33
Schedule of Investments — June 30, 2018
Hotchkis & Wiley International Value Fund
| | | Shares
Held | | Value | |
Insurance — 13.12% | |
Enstar Group Ltd. (a) | | | 389 | | | $ | 80,640 | | |
Global Indemnity Ltd. | | | 1,668 | | | | 65,019 | | |
RSA Insurance Group PLC (v) | | | 3,155 | | | | 28,216 | | |
Tokio Marine Holdings, Inc. (v) | | | 1,800 | | | | 84,209 | | |
Zurich Insurance Group AG (v) | | | 255 | | | | 75,411 | | |
| | | | 333,495 | | |
TOTAL FINANCIALS | | | 718,749 | | |
HEALTH CARE — 7.06%
Health Care Equipment & Supplies — 3.95% | |
Draegerwerk AG & Company KGaA | | | 80 | | | | 32,694 | | |
Koninklijke Philips NV (v) | | | 937 | | | | 39,699 | | |
Medtronic PLC | | | 328 | | | | 28,080 | | |
| | | | 100,473 | | |
Pharmaceuticals — 3.11% | |
GlaxoSmithKline PLC (v) | | | 2,509 | | | | 50,584 | | |
Sanofi (v) | | | 353 | | | | 28,332 | | |
| | | | 78,916 | | |
TOTAL HEALTH CARE | | | 179,389 | | |
INDUSTRIALS — 24.59%
Aerospace & Defense — 6.80% | |
BAE Systems PLC (v) | | | 12,504 | | | | 106,375 | | |
Embraer SA — ADR | | | 2,669 | | | | 66,458 | | |
| | | | 172,833 | | |
Air Freight & Logistics — 2.21% | |
Royal Mail PLC (v) | | | 8,471 | | | | 56,357 | | |
Airlines — 3.92% | |
WestJet Airlines Ltd. | | | 7,231 | | | | 99,721 | | |
Building Products — 5.26% | |
Johnson Controls International PLC | | | 1,634 | | | | 54,657 | | |
Masonite International Corp. (a) | | | 1,101 | | | | 79,106 | | |
| | | | 133,763 | | |
Construction & Engineering — 0.44% | |
Bouygues SA (v) | | | 261 | | | | 11,215 | | |
Machinery — 5.64% | |
| CNH Industrial NV | | | 4,853 | | | | 51,102 | | |
Danieli & C Officine Meccaniche SpA (v) | | | 4,447 | | | | 78,165 | | |
KSB SE & Company KGaA (v) | | | 34 | | | | 14,055 | | |
| | | | 143,322 | | |
Professional Services — 0.32% | |
Hudson Global, Inc. (a) | | | 4,990 | | | | 8,084 | | |
TOTAL INDUSTRIALS | | | 625,295 | | |
| | | Shares
Held | | Value | |
INFORMATION TECHNOLOGY — 9.19%
Communications Equipment — 6.39% | |
ARRIS International PLC (a) | | | 3,687 | | | $ | 90,129 | | |
Telefonaktiebolaget LM Ericsson (v) | | | 9,406 | | | | 72,466 | | |
| | | | 162,595 | | |
Electronic Equipment, Instruments & Components — 2.80% | |
Hitachi Ltd. (v) | | | 4,000 | | | | 28,180 | | |
Nippon Electric Glass Company Ltd. (v) | | | 300 | | | | 8,316 | | |
TE Connectivity Ltd. | | | 385 | | | | 34,673 | | |
| | | | 71,169 | | |
TOTAL INFORMATION TECHNOLOGY | | | 233,764 | | |
MATERIALS — 0.91%
Chemicals — 0.91% | |
Tikkurila Oyj | | | 1,341 | | | | 23,021 | | |
TOTAL MATERIALS | | | 23,021 | | |
REAL ESTATE — 1.02%
Equity Real Estate Investment Trusts — 1.02% | |
Granite Real Estate Investment Trust | | | 636 | | | | 25,940 | | |
TOTAL REAL ESTATE | | | 25,940 | | |
TELECOMMUNICATION SERVICES — 3.37%
Wireless Telecommunication Services — 3.37% | |
Orange Belgium SA (v) | | | 1,081 | | | | 18,218 | | |
Vodafone Group PLC (v) | | | 27,882 | | | | 67,538 | | |
TOTAL TELECOMMUNICATION SERVICES | | | 85,756 | | |
Total common stocks
(Cost $2,372,622) | | | | | 2,554,683 | | |
Total long-term investments
(Cost $2,372,622) | | | | | 2,554,683 | | |
Total investments — 100.48%
(Cost $2,372,622) | | | | | 2,554,683 | | |
Liabilities in excess of other assets — (0.48)% | | | | | (12,132 | ) | |
Net assets — 100.00% | | $ | 2,542,551 | | |
(a) — Non-income producing security.
(r) — Rule 144A security of the Securities Act of 1933. Purchased in a private placement transaction; resale to the public may require registration or be limited to qualified institutional buyers. The total market value of these securities was $11,422, which represented 0.45% of net assets.
(v) — Security was fair valued as a result of market movements following the close of local trading using a third-party vendor's proprietary fair value pricing model. The total market value of these securities was $1,560,812, which represented 61.39% of net assets. See Security Valuation in Note 1 in Notes to the Financial Statements.
ADR — American Depositary Receipt
The accompanying notes are an integral part of these financial statements.
34
Schedule of Investments — June 30, 2018
Hotchkis & Wiley Value Opportunities Fund

Largest Holdings* | | Percent of
net assets | |
Wells Fargo & Company | | | 5.33 | % | |
Seritage Growth Properties | | | 5.08 | % | |
American International Group, Inc. | | | 4.59 | % | |
Oracle Corp. | | | 3.89 | % | |
ARRIS International PLC | | | 3.59 | % | |
Whiting Petroleum Corp. | | | 3.49 | % | |
WestJet Airlines Ltd. | | | 3.44 | % | |
Discovery, Inc. - Class C | | | 3.21 | % | |
Microsoft Corp. | | | 3.14 | % | |
Apache Corp. | | | 2.82 | % | |
* Excluding short-term securities.
COMMON
STOCKS — 95.96% | | Shares
Held | | Value | |
CONSUMER DISCRETIONARY — 8.85%
Automobiles — 2.15% | |
General Motors Company | | | 348,300 | | | $ | 13,723,020 | | |
Media — 4.71% | |
Comcast Corp. | | | 291,700 | | | | 9,570,677 | | |
Discovery, Inc. — Class C (a) | | | 805,600 | | | | 20,542,800 | | |
| | | | 30,113,477 | | |
Specialty Retail — 1.63% | |
Bed Bath & Beyond, Inc. | | | 158,200 | | | | 3,152,135 | | |
Office Depot, Inc. (c) | | | 2,857,300 | | | | 7,286,115 | | |
| | | | 10,438,250 | | |
Textiles, Apparel & Luxury Goods — 0.36% | |
JG Boswell Company | | | 3,401 | | | | 2,285,472 | | |
TOTAL CONSUMER DISCRETIONARY | | | 56,560,219 | | |
CONSUMER STAPLES — 3.13%
Beverages — 1.49% | |
PepsiCo, Inc. | | | 87,800 | | | | 9,558,786 | | |
Food Products — 1.64% | |
Mondelez International, Inc. | | | 255,000 | | | | 10,455,000 | | |
TOTAL CONSUMER STAPLES | | | 20,013,786 | | |
ENERGY — 16.06%
Energy Equipment & Services — 5.50% | |
C&J Energy Services, Inc. (a) | | | 181,000 | | | | 4,271,600 | | |
Frank's International NV (a) (l) | | | 1,878,300 | | | | 14,650,740 | | |
National Oilwell Varco, Inc. | | | 374,700 | | | | 16,261,980 | | |
| | | | 35,184,320 | | |
| | | Shares
Held | | Value | |
Oil, Gas & Consumable Fuels — 10.56% | |
Apache Corp. | | | 385,700 | | | $ | 18,031,475 | | |
Cairn Energy PLC (a) (v) | | | 1,598,400 | | | | 5,248,440 | | |
Hess Corp. | | | 54,300 | | | | 3,632,127 | | |
Marathon Oil Corp. | | | 611,500 | | | | 12,755,890 | | |
Ophir Energy PLC (a) | | | 4,122,000 | | | | 2,747,202 | | |
Rockhopper Exploration PLC (a) | | | 5,048,100 | | | | 2,731,512 | | |
Whiting Petroleum Corp. (a) | | | 423,300 | | | | 22,316,376 | | |
| | | | 67,463,022 | | |
TOTAL ENERGY | | | 102,647,342 | | |
FINANCIALS — 26.23%
Banks — 14.85% | |
Bank of America Corp. (c) | | | 608,200 | | | | 17,145,158 | | |
Barclays PLC — ADR | | | 737,500 | | | | 7,397,125 | | |
Citigroup, Inc. (c) | | | 165,300 | | | | 11,061,876 | | |
Credito Valtellinese SpA (a) (v) | | | 54,457,200 | | | | 6,127,270 | | |
JPMorgan Chase & Company (c) | | | 29,300 | | | | 3,053,060 | | |
Popular, Inc. | | | 174,400 | | | | 7,884,624 | | |
Societe Generale SA (v) | | | 194,900 | | | | 8,191,641 | | |
Wells Fargo & Company | | | 614,800 | | | | 34,084,512 | | |
| | | | 94,945,266 | | |
Capital Markets — 4.38% | |
The Goldman Sachs Group, Inc. | | | 53,900 | | | | 11,888,724 | | |
Motors Liquidation Company GUC Trust (a) (o) | | | 1,623,100 | | | | 16,078,834 | | |
| | | | 27,967,558 | | |
Consumer Finance — 1.17% | |
Capital One Financial Corp. | | | 81,400 | | | | 7,480,660 | | |
Insurance — 5.73% | |
American International Group, Inc. (c) | | | 553,400 | | | | 29,341,268 | | |
Enstar Group Ltd. (a) | | | 15,400 | | | | 3,192,420 | | |
Global Indemnity Ltd. | | | 104,400 | | | | 4,069,512 | | |
| | | | 36,603,200 | | |
The accompanying notes are an integral part of these financial statements.
35
Schedule of Investments — June 30, 2018
Hotchkis & Wiley Value Opportunities Fund
| | | Shares
Held | | Value | |
Real Estate Management & Development — 0.10% | |
Maui Land & Pineapple Company, Inc. (a) | | | 60,400 | | | $ | 676,480 | | |
TOTAL FINANCIALS | | | 167,673,164 | | |
HEALTH CARE — 1.55%
Health Care Providers & Services — 1.55% | |
Hanger, Inc. (a) | | | 584,700 | | | | 9,916,512 | | |
TOTAL HEALTH CARE | | | 9,916,512 | | |
INDUSTRIALS — 13.22%
Air Freight & Logistics — 1.44% | |
Royal Mail PLC (c) (v) | | | 1,380,200 | | | | 9,182,356 | | |
Airlines — 3.44% | |
WestJet Airlines Ltd. | | | 1,594,700 | | | | 21,992,097 | | |
Building Products — 3.70% | |
Johnson Controls International PLC | | | 462,600 | | | | 15,473,970 | | |
Masonite International Corp. (a) | | | 113,500 | | | | 8,154,975 | | |
| | | | 23,628,945 | | |
Construction & Engineering — 0.68% | |
KBR, Inc. | | | 241,500 | | | | 4,327,680 | | |
Machinery — 1.77% | |
Danieli & C Officine Meccaniche SpA (c) (v) | | | 644,300 | | | | 11,324,938 | | |
Marine — 0.49% | |
Matson, Inc. | | | 82,300 | | | | 3,158,674 | | |
Professional Services — 0.12% | |
Hudson Global, Inc. (a) | | | 481,700 | | | | 780,354 | | |
Road & Rail — 1.58% | |
AMERCO | | | 28,400 | | | | 10,114,660 | | |
TOTAL INDUSTRIALS | | | 84,509,704 | | |
INFORMATION TECHNOLOGY — 16.16%
Communications Equipment — 5.31% | |
ARRIS International PLC (a) | | | 939,300 | | | | 22,961,188 | | |
Telefonaktiebolaget LM Ericsson — ADR | | | 1,430,500 | | | | 10,971,935 | | |
| | | | 33,933,123 | | |
Electronic Equipment, Instruments & Components — 1.04% | |
Corning, Inc. | | | 241,100 | | | | 6,632,661 | | |
Software — 7.03% | |
Microsoft Corp. (c) | | | 203,400 | | | | 20,057,274 | | |
Oracle Corp. (c) | | | 564,200 | | | | 24,858,652 | | |
| | | | 44,915,926 | | |
Technology Hardware, Storage & Peripherals — 2.78% | |
Hewlett Packard Enterprise Company | | | 1,217,600 | | | | 17,789,136 | | |
TOTAL INFORMATION TECHNOLOGY | | | 103,270,846 | | |
| | | Shares
Held | | Value | |
MATERIALS — 1.71%
Chemicals — 1.08% | |
Iracore Investments Holdings, Inc. — Class A
(Acquired 04/13/2017,
Cost $6,892,250) (a) (f) (i) (m) (o) (u) | | | 32,422 | | | $ | 6,892,269 | | |
Metals & Mining — 0.63% | |
American Zinc Recycling LLC
(Acquired 07/24/2014,
Cost $7,500,000) (a) (f) (i) (m) (u) | | | 4,688 | | | | 1,859,401 | | |
CB Noranda Aluminum Acquisition Corp. —
Escrow (Acquired 11/29/2017,
Cost $0) (a) (f) (i) (m) (u) | | | 41,000 | | | | 0 | | |
Elah Holdings, Inc. (a) (i) | | | 1,949 | | | | 146,175 | | |
GHW Holdco LLC
(Acquired 10/28/2016 — 10/23/2017,
Cost $812,999) (a) (f) (i) (m) (o) (u) | | | 40 | | | | 2,009,120 | | |
| | | | 4,014,696 | | |
TOTAL MATERIALS | | | 10,906,965 | | |
REAL ESTATE — 6.87%
Equity Real Estate Investment Trusts — 6.87% | |
The GEO Group, Inc. | | | 415,600 | | | | 11,445,624 | | |
Seritage Growth Properties (l) | | | 764,500 | | | | 32,437,735 | | |
TOTAL REAL ESTATE | | | 43,883,359 | | |
TELECOMMUNICATION SERVICES — 2.18%
Wireless Telecommunication Services — 2.18% | |
Vodafone Group PLC — ADR | | | 573,500 | | | | 13,941,785 | | |
TOTAL TELECOMMUNICATION SERVICES | | | 13,941,785 | | |
Total common stocks
(Cost $571,130,151) | | | | | 613,323,682 | | |
| PREFERRED STOCKS — 0.50% | |
FINANCIALS — 0.50%
Thrifts & Mortgage Finance — 0.50% | |
Federal Home Loan Mortgage Corp. — Series K (a) | | | 33,900 | | | | 317,813 | | |
Federal Home Loan Mortgage Corp. — Series N (a) | | | 118,600 | | | | 1,145,676 | | |
Federal Home Loan Mortgage Corp. — Series S (a) | | | 18,700 | | | | 177,463 | | |
Federal Home Loan Mortgage Corp. — Series Z (a) | | | 248,000 | | | | 1,550,000 | | |
TOTAL FINANCIALS | | | 3,190,952 | | |
Total preferred stocks
(Cost $1,935,637) | | | | | 3,190,952 | | |
CONVERTIBLE
BONDS — 0.01% | | Principal
Amount | | | |
ENERGY — 0.01%
Oil, Gas & Consumable Fuels — 0.01% | |
Cobalt International Energy, Inc.
2.625%, 12/01/2019 (d) | | $ | 10,000,000 | | | | 38,000 | | |
TOTAL ENERGY | | | 38,000 | | |
Total convertible bonds
(Cost $1,067,500) | | | | | 38,000 | | |
The accompanying notes are an integral part of these financial statements.
36
Schedule of Investments — June 30, 2018
Hotchkis & Wiley Value Opportunities Fund
CORPORATE
BONDS — 1.02% | | | | Principal
Amount | | Value | |
ENERGY — 0.39%
Oil, Gas & Consumable Fuels — 0.39% | |
Rockpoint Gas Storage Canada Ltd.
7.000%, 03/31/2023 (r) | | | | $ | 2,500,000 | | | $ | 2,512,500 | | |
TOTAL ENERGY | | | 2,512,500 | | |
MATERIALS — 0.63%
Metals & Mining — 0.63% | |
New Day Aluminum LLC
4.000% Cash and 6.000% PIK, 10/28/2020
(Acquired 10/28/2016 — 06/30/2018,
Cost $357,904) (f) (i) (m) (p) (u) | | | | | 1,108,293 | | | | 1,108,293 | | |
4.000% Cash and 6.000% PIK, 10/28/2020
(Acquired 10/28/2016 — 06/30/2018,
Cost $903,978) (f) (i) (m) (p) (u) | | | | | 2,981,777 | | | | 2,881,738 | | |
TOTAL MATERIALS | | | 3,990,031 | | |
Total corporate bonds
(Cost $3,700,421) | | | | | | | 6,502,531 | | |
TERM LOANS — 0.59% | |
MATERIALS — 0.59%
Chemicals — 0.59% | |
Iracore International Holdings, Inc.
11.125% (1 Month LIBOR USD + 9.000%),
04/13/2021 (Acquired 04/13/2017,
Cost $3,802,486) (b) (f) (i) (m) (u) | | | | | 3,802,486 | | | | 3,802,486 | | |
TOTAL MATERIALS | | | 3,802,486 | | |
Total term loans
(Cost $3,802,486) | | | | | | | 3,802,486 | | |
PURCHASED
PUT OPTIONS —
0.39% | | Contracts
(100 shares
per contract) | | Notional
Amount | | | |
CONSUMER DISCRETIONARY — 0.39%
Automobiles — 0.39% | |
Tesla, Inc. (a)
Expiration: January 2020,
Exercise Price: $300.00 | | | 380 | | | $ | 13,032,100 | | | | 2,479,500 | | |
TOTAL CONSUMER DISCRETIONARY | | | 2,479,500 | | |
Total purchased put options
(Cost $2,957,234) | | | | | | | 2,479,500 | | |
WARRANTS — 0.43% | | | | Shares
Held | | | |
CONSUMER DISCRETIONARY — 0.12%
Automobiles — 0.12% | |
General Motors Company (a)
Expiration: July 2019,
Exercise Price: $18.33 | | | | | 33,866 | | | | 763,678 | | |
TOTAL CONSUMER DISCRETIONARY | | | 763,678 | | |
| | | Shares
Held | | Value | |
ENERGY — 0.04%
Oil, Gas & Consumable Fuels — 0.04% | |
Lonestar Resources America, Inc.
(Acquired 09/30/2016,
Cost $339,200) (a) (f) (i) (m)
Expiration: December 2021,
Exercise Price: $5.00 | | | 80,000 | | | $ | 275,200 | | |
TOTAL ENERGY | | | 275,200 | | |
FINANCIALS — 0.27%
Insurance — 0.27% | |
American International Group, Inc. (a)
Expiration: January 2021,
Exercise Price: $43.69 | | | 117,400 | | | | 1,702,300 | | |
TOTAL FINANCIALS | | | 1,702,300 | | |
Total warrants
(Cost $1,745,022) | | | | | 2,741,178 | | |
Total long-term investments
(Cost $586,338,451) | | | | | 632,078,329 | | |
COLLATERAL FOR SECURITIES ON LOAN — 3.94% | |
Money Market Funds — 3.94% | |
Invesco Government & Agency Portfolio —
Institutional Class, 1.81%^ | | | 25,188,204 | | | | 25,188,204 | | |
Total collateral for securities on loan
(Cost $25,188,204) | | | 25,188,204 | | |
SHORT-TERM
INVESTMENTS — 1.20% | | Principal
Amount | | | |
Time Deposits — 1.20% | |
Banco Santander, 1.27%, 07/02/2018* | | $ | 7,554,684 | | | | 7,554,684 | | |
Brown Brothers Harriman & Co., 1.13%,
07/02/2018* | | AUD | 41 | | | | 30 | | |
Brown Brothers Harriman & Co., 0.51%,
07/03/2018* | | CAD | 149,544 | | | | 113,752 | | |
Brown Brothers Harriman & Co., 0.23%,
07/02/2018* | | GBP | 33 | | | | 43 | | |
Total short-term investments
(Cost $7,668,513) | | | 7,668,509 | | |
Total investments — 104.04%
(Cost $619,195,168) | | | | | 664,935,042 | | |
Liabilities in excess of other assets — (4.04)% | | | | | (25,802,991 | ) | |
Net assets — 100.00% | | $ | 639,132,051 | | |
(a) — Non-income producing security.
(b) — The coupon rate shown on variable rate securities represents the rate at June 30, 2018.
(c) — All or a portion of this security is segregated as collateral for futures contracts.
(d) — Issuer is currently in default on its regularly scheduled interest payments.
The accompanying notes are an integral part of these financial statements.
37
Schedule of Investments — June 30, 2018
Hotchkis & Wiley Value Opportunities Fund
(f) — Security was fair valued under guidelines established by and under the general supervision and responsibility of the Trust's Board of Trustees. The total market value of these securities was $18,828,507 which represented 2.95% of net assets. See Security Valuation in Note 1 in Notes to the Financial Statements.
(i) — Illiquid security.
(l) — All or a portion of this security is on loan. The total market value of securities on loan was $24,653,760. The remaining contractual maturity of all of the securities lending transactions is overnight and continuous.
(m) — Restricted security. Purchased in a private placement transaction; resale to the public may require registration. The total market value of these securities was $18,828,507, which represented 2.95% of net assets.
(o) — Affiliated issuer. See Note 6 in Notes to the Financial Statements.
(p) — Payment in-kind (PIK) security.
(r) — Rule 144A security of the Securities Act of 1933. Purchased in a private placement transaction; resale to the public may require registration or be limited to qualified institutional buyers. The total market value of these securities was $2,512,500, which represented 0.39% of net assets.
(u) — Value determined using significant unobservable inputs.
(v) — Security was fair valued as a result of market movements following the close of local trading using a third-party vendor's proprietary fair value pricing model. The total market value of these securities was $40,074,645, which represented 6.27% of net assets. See Security Valuation in Note 1 in Notes to the Financial Statements.
ADR — American Depositary Receipt
AUD — Australian Dollar
CAD — Canadian Dollar
GBP — British Pound
LIBOR — London Interbank Offered Rate
USD — United States Dollar
^ — Rate shown is the 7-day yield as of June 30, 2018.
* — Invested through a cash management account administered by Brown Brothers Harriman & Co.
Schedule of Futures Contracts — June 30, 2018
Hotchkis & Wiley Value Opportunities Fund
Description | | Number of
Contracts
Purchased (Sold) | | Expiration | | Notional
Amount | | Value/Unrealized
Appreciation
(Depreciation) | |
British Pound Currency Futures | | | (64 | ) | | September 2018 | | $ | (5,294,400 | ) | | $ | 68,936 | | |
Euro Fx Currency Futures | | | (56 | ) | | September 2018 | | | (8,215,550 | ) | | | 90,095 | | |
| | | | | | | $ | (13,509,950 | ) | | $ | 159,031 | | |
The accompanying notes are an integral part of these financial statements.
38
Schedule of Investments — June 30, 2018
Hotchkis & Wiley Capital Income Fund

Largest Issuers | | Percent of
net assets | |
Whiting Petroleum Corp. | | | 3.10 | % | |
American International Group, Inc. | | | 2.77 | % | |
WestJet Airlines Ltd. | | | 2.30 | % | |
Popular, Inc. | | | 2.26 | % | |
Wells Fargo & Company | | | 1.98 | % | |
ARRIS International PLC | | | 1.83 | % | |
Seritage Growth Properties | | | 1.76 | % | |
Discovery, Inc. | | | 1.65 | % | |
The GEO Group, Inc. | | | 1.58 | % | |
Hewlett Packard Enterprise Company | | | 1.56 | % | |
COMMON
STOCKS — 58.14% | | Shares
Held | | Value | |
CONSUMER DISCRETIONARY — 6.00%
Auto Components — 0.94% | |
Adient PLC | | | 4,219 | | | $ | 207,532 | | |
Magna International, Inc. | | | 2,368 | | | | 137,652 | | |
| | | | 345,184 | | |
Automobiles — 1.13% | |
General Motors Company | | | 10,569 | | | | 416,419 | | |
General Motors Company — Escrow
(Acquired 12/31/2010,
Cost $0) (a) (f) (i) (m) (u) | | | 4,600 | | | | 0 | | |
| | | | 416,419 | | |
Media — 1.65% | |
Discovery, Inc. — Class C (a) | | | 23,860 | | | | 608,430 | | |
Specialty Retail — 1.64% | |
Bed Bath & Beyond, Inc. | | | 9,457 | | | | 188,431 | | |
Kingfisher PLC — ADR | | | 12,772 | | | | 100,771 | | |
Office Depot, Inc. | | | 122,654 | | | | 312,768 | | |
| | | | 601,970 | | |
Textiles, Apparel & Luxury Goods — 0.64% | |
Quiksilver, Inc.
(Acquired 07/11/2013 — 05/12/2016,
Cost $351,163) (a) (f) (i) (m) (u) | | | 6,960 | | | | 236,640 | | |
TOTAL CONSUMER DISCRETIONARY | | | 2,208,643 | | |
CONSUMER STAPLES — 0.28%
Food & Staples Retailing — 0.28% | |
Tesco PLC — ADR | | | 10,151 | | | | 102,830 | | |
TOTAL CONSUMER STAPLES | | | 102,830 | | |
| | | Shares
Held | | Value | |
ENERGY — 9.10%
Energy Equipment & Services — 2.05% | |
Borr Drilling Ltd. (a) (v) | | | 21,187 | | | $ | 101,055 | | |
C&J Energy Services, Inc. (a) | | | 8,090 | | | | 190,924 | | |
Fieldwood Energy, Inc.
(Acquired 05/03/2018,
Cost $34,085) (a) (i) (m) | | | 395 | | | | 20,738 | | |
Fieldwood Energy, Inc.
(Acquired 05/03/2018,
Cost $22,408) (a) (i) (m) | | | 1,461 | | | | 76,703 | | |
Frank's International NV (a) | | | 13,468 | | | | 105,050 | | |
Nine Energy Service, Inc. (a) | | | 2,428 | | | | 80,415 | | |
Quintana Energy Services, Inc. (a) | | | 21,243 | | | | 179,928 | | |
| | | | 754,813 | | |
Oil, Gas & Consumable Fuels — 7.05% | |
Apache Corp. | | | 2,470 | | | | 115,473 | | |
Cairn Energy PLC — ADR (a) | | | 35,024 | | | | 235,011 | | |
Kosmos Energy Ltd. (a) | | | 45,966 | | | | 380,139 | | |
Murphy Oil Corp. | | | 4,712 | | | | 159,124 | | |
Ophir Energy PLC — ADR (a) | | | 252,097 | | | | 336,171 | | |
Rockhopper Exploration PLC (a) | | | 110,384 | | | | 59,728 | | |
Sanchez Energy Corp. (a) | | | 64,647 | | | | 292,204 | | |
Warren Resources, Inc.
(Acquired 11/23/2016,
Cost $2,157) (a) (f) (i) (m) (u) | | | 1,559 | | | | 2,156 | | |
Whiting Petroleum Corp. (a) | | | 19,282 | | | | 1,016,548 | | |
| | | | 2,596,554 | | |
TOTAL ENERGY | | | 3,351,367 | | |
The accompanying notes are an integral part of these financial statements.
39
Schedule of Investments — June 30, 2018
Hotchkis & Wiley Capital Income Fund
| | | Shares
Held | | Value | |
FINANCIALS — 15.85% | |
Banks — 8.73% | |
Bank of America Corp. | | | 6,937 | | | $ | 195,554 | | |
Barclays PLC — ADR | | | 37,721 | | | | 378,342 | | |
Citigroup, Inc. | | | 7,040 | | | | 471,117 | | |
Credito Valtellinese SpA (a) (v) | | | 2,981,952 | | | | 335,515 | | |
Popular, Inc. | | | 16,434 | | | | 742,980 | | |
Societe Generale SA — ADR | | | 43,168 | | | | 360,669 | | |
Wells Fargo & Company | | | 13,151 | | | | 729,091 | | |
| | | | 3,213,268 | | |
Capital Markets — 1.95% | |
Credit Suisse Group AG — ADR (a) | | | 5,896 | | | | 87,732 | | |
Fifth Street Asset Management, Inc. (a) | | | 176,631 | | | | 230,503 | | |
Motors Liquidation Company GUC Trust (a) | | | 40,476 | | | | 400,966 | | |
| | | | 719,201 | | |
Consumer Finance — 0.82% | |
Capital One Financial Corp. | | | 2,131 | | | | 195,839 | | |
Santander Consumer USA Holdings, Inc. | | | 5,472 | | | | 104,460 | | |
| | | | 300,299 | | |
Insurance — 4.35% | |
American International Group, Inc. (c) | | | 19,239 | | | | 1,020,052 | | |
Global Indemnity Ltd. | | | 2,612 | | | | 101,816 | | |
Tokio Marine Holdings, Inc. — ADR | | | 6,131 | | | | 289,261 | | |
Zurich Insurance Group AG — ADR | | | 6,494 | | | | 191,670 | | |
| | | | 1,602,799 | | |
TOTAL FINANCIALS | | | 5,835,567 | | |
HEALTH CARE — 2.11% | |
Health Care Providers & Services — 0.55% | |
Anthem, Inc. | | | 846 | | | | 201,373 | | |
Pharmaceuticals — 1.56% | |
GlaxoSmithKline PLC — ADR | | | 8,721 | | | | 351,544 | | |
Sanofi — ADR | | | 5,613 | | | | 224,576 | | |
| | | | 576,120 | | |
TOTAL HEALTH CARE | | | 777,493 | | |
INDUSTRIALS — 11.30%
Aerospace & Defense — 1.79% | |
BAE Systems PLC — ADR | | | 14,897 | | | | 515,734 | | |
Embraer SA — ADR | | | 5,800 | | | | 144,420 | | |
| | | | 660,154 | | |
Air Freight & Logistics — 1.13% | |
Royal Mail PLC — ADR | | | 30,889 | | | | 415,148 | | |
Airlines — 2.30% | |
WestJet Airlines Ltd. | | | 61,518 | | | | 848,379 | | |
| | | Shares
Held | | Value | |
Building Products — 1.05% | |
Johnson Controls International PLC | | | 2,842 | | | $ | 95,065 | | |
Masonite International Corp. (a) | | | 4,073 | | | | 292,645 | | |
| | | | 387,710 | | |
Commercial Services & Supplies — 0.41% | |
LSC Communications, Inc. | | | 9,655 | | | | 151,197 | | |
Construction & Engineering — 0.28% | |
KBR, Inc. | | | 5,783 | | | | 103,631 | | |
Machinery — 2.37% | |
| CNH Industrial NV | | | 9,219 | | | | 97,076 | | |
Cummins, Inc. | | | 2,189 | | | | 291,137 | | |
Danieli & C Officine Meccaniche SpA — ADR | | | 27,675 | | | | 484,727 | | |
| | | | 872,940 | | |
Marine — 0.98% | |
Matson, Inc. | | | 9,394 | | | | 360,542 | | |
Professional Services — 0.23% | |
Hudson Global, Inc. (a) | | | 51,558 | | | | 83,524 | | |
Road & Rail — 0.42% | |
AMERCO | | | 431 | | | | 153,501 | | |
Trading Companies & Distributors — 0.34% | |
RA Parent, Inc.
(Acquired 12/23/2014 — 01/18/2018,
Cost $192,714) (a) (f) (i) (m) (u) | | | 3 | | | | 124,848 | | |
TOTAL INDUSTRIALS | | | 4,161,574 | | |
INFORMATION TECHNOLOGY — 7.84%
Communications Equipment — 3.06% | |
ARRIS International PLC (a) | | | 27,548 | | | | 673,412 | | |
Telefonaktiebolaget LM Ericsson — ADR | | | 59,393 | | | | 455,544 | | |
| | | | 1,128,956 | | |
Electronic Equipment, Instruments & Components — 0.80% | |
Corning, Inc. (c) | | | 10,743 | | | | 295,540 | | |
Software — 2.42% | |
Microsoft Corp. (c) | | | 3,575 | | | | 352,531 | | |
Oracle Corp. | | | 12,194 | | | | 537,267 | | |
| | | | 889,798 | | |
Technology Hardware, Storage & Peripherals — 1.56% | |
Hewlett Packard Enterprise Company | | | 39,215 | | | | 572,931 | | |
TOTAL INFORMATION TECHNOLOGY | | | 2,887,225 | | |
MATERIALS — 1.08%
Chemicals — 0.15% | |
Iracore Investments Holdings, Inc. —
Class A (Acquired 04/13/2017,
Cost $57,250) (a) (f) (i) (m) (u) | | | 269 | | | | 57,184 | | |
The accompanying notes are an integral part of these financial statements.
40
Schedule of Investments — June 30, 2018
Hotchkis & Wiley Capital Income Fund
| | | Shares
Held | | Value | |
Metals & Mining — 0.93% | |
American Zinc Recycling LLC
(Acquired 07/19/2012 — 09/30/2016,
Cost $404,157) (a) (f) (i) (m) (u) | | | 860 | | | $ | 341,102 | | |
CB Noranda Aluminum Acquisition
Corp. — Escrow
(Acquired 03/01/2013 — 11/29/2017,
Cost $0) (a) (f) (i) (m) (u) | | | 222,000 | | | | 0 | | |
| | | | 341,102 | | |
TOTAL MATERIALS | | | 398,286 | | |
REAL ESTATE — 3.41%
Equity Real Estate Investment Trusts — 3.41% | |
The GEO Group, Inc. (c) | | | 16,274 | | | | 448,186 | | |
Granite Real Estate Investment Trust | | | 3,834 | | | | 156,312 | | |
Seritage Growth Properties | | | 15,304 | | | | 649,349 | | |
TOTAL REAL ESTATE | | | 1,253,847 | | |
TELECOMMUNICATION SERVICES — 1.17%
Wireless Telecommunication Services — 1.17% | |
Vodafone Group PLC — ADR (c) | | | 17,662 | | | | 429,363 | | |
TOTAL TELECOMMUNICATION SERVICES | | | 429,363 | | |
Total common stocks
(Cost $19,396,273) | | | | | 21,406,195 | | |
INVESTMENT COMPANIES — 0.62% | |
Business Development Companies — 0.62% | |
Oaktree Specialty Lending Corp. | | | 25,818 | | | | 123,410 | | |
Oaktree Strategic Income Corp. | | | 12,280 | | | | 104,380 | | |
Total investment companies
(Cost $197,835) | | | | | 227,790 | | |
PREFERRED STOCKS — 0.62% | |
CONSUMER STAPLES — 0.19%
Food Products — 0.19% | |
Pinnacle Agriculture Enterprises LLC
(Acquired 03/10/2017,
Cost $69,351) (a) (f) (i) (m) (u) | | | 94,387 | | | | 69,846 | | |
TOTAL CONSUMER STAPLES | | | 69,846 | | |
FINANCIALS — 0.43%
Banks — 0.28% | |
Royal Bank of Scotland Group PLC —
Series S, 6.600% | | | 4,122 | | | | 105,853 | | |
Thrifts & Mortgage Finance — 0.15% | |
Federal Home Loan Mortgage Corp. — Series V (a) | | | 10,323 | | | | 54,609 | | |
TOTAL FINANCIALS | | | 160,462 | | |
Total preferred stocks
(Cost $229,989) | | | | | 230,308 | | |
CORPORATE
BONDS — 37.39% | | Principal
Amount | | Value | |
CONSUMER DISCRETIONARY — 8.07%
Auto Components — 0.83% | |
Adient Global Holdings Ltd.
4.875%, 08/15/2026 (r) | | $ | 138,000 | | | $ | 124,890 | | |
Delphi Technologies PLC
5.000%, 10/01/2025 (r) | | | 90,000 | | | | 86,063 | | |
The Goodyear Tire & Rubber Company
4.875%, 03/15/2027 | | | 105,000 | | | | 96,207 | | |
| | | | 307,160 | | |
Hotels, Restaurants & Leisure — 1.72% | |
Boyd Gaming Corp.
6.000%, 08/15/2026 (r) | | | 80,000 | | | | 79,300 | | |
Interval Acquisition Corp.
5.625%, 04/15/2023 | | | 70,000 | | | | 70,918 | | |
Jacobs Entertainment, Inc.
7.875%, 02/01/2024 (r) | | | 90,000 | | | | 94,275 | | |
National CineMedia LLC
5.750%, 08/15/2026 | | | 170,000 | | | | 155,975 | | |
Penn National Gaming, Inc.
5.625%, 01/15/2027 (r) | | | 105,000 | | | | 99,225 | | |
Rivers Pittsburgh Borrower LP / Rivers
Pittsburgh Finance Corp.
6.125%, 08/15/2021 (r) | | | 75,000 | | | | 74,438 | | |
Wyndham Hotels & Resorts, Inc.
5.375%, 04/15/2026 (r) | | | 60,000 | | | | 59,850 | | |
| | | | 633,981 | | |
Household Durables — 0.87% | |
TopBuild Corp.
5.625%, 05/01/2026 (r) | | | 104,000 | | | | 100,100 | | |
Weekley Homes LLC / Weekley Finance Corp.
6.000%, 02/01/2023 | | | 225,000 | | | | 220,219 | | |
| | | | 320,319 | | |
Leisure Products — 0.53% | |
Silversea Cruise Finance Ltd.
7.250%, 02/01/2025 (r) | | | 95,000 | | | | 103,084 | | |
Vista Outdoor, Inc.
5.875%, 10/01/2023 | | | 95,000 | | | | 90,963 | | |
| | | | 194,047 | | |
The accompanying notes are an integral part of these financial statements.
41
Schedule of Investments — June 30, 2018
Hotchkis & Wiley Capital Income Fund
| | | Principal
Amount | | Value | |
Media — 2.97% | |
Altice France SA
6.000%, 05/15/2022 (r) | | $ | 63,000 | | | $ | 63,473 | | |
Altice Luxembourg SA
7.625%, 02/15/2025 (r) | | | 119,000 | | | | 109,926 | | |
CCO Holdings LLC / CCO Holdings Capital Corp.
5.750%, 02/15/2026 (r) | | | 100,000 | | | | 98,500 | | |
Harland Clarke Holdings Corp.
9.250%, 03/01/2021 (r) | | | 129,000 | | | | 124,485 | | |
8.375%, 08/15/2022 (r) | | | 40,000 | | | | 39,400 | | |
MDC Partners, Inc.
6.500%, 05/01/2024 (r) | | | 132,000 | | | | 115,170 | | |
Multi-Color Corp.
4.875%, 11/01/2025 (r) | | | 114,000 | | | | 106,448 | | |
Salem Media Group, Inc.
6.750%, 06/01/2024 (r) | | | 125,000 | | | | 114,063 | | |
Townsquare Media, Inc.
6.500%, 04/01/2023 (r) | | | 134,000 | | | | 121,103 | | |
Virgin Media Secured Finance PLC
5.250%, 01/15/2026 (r) | | | 55,000 | | | | 51,081 | | |
VTR Finance BV
6.875%, 01/15/2024 (r) | | | 149,000 | | | | 150,258 | | |
| | | | 1,093,907 | | |
Multiline Retail — 0.48% | |
JC Penney Corp., Inc.
5.875%, 07/01/2023 (r) | | | 129,000 | | | | 121,421 | | |
8.625%, 03/15/2025 (r) | | | 65,000 | | | | 55,250 | | |
| | | | 176,671 | | |
Specialty Retail — 0.67% | |
PetSmart, Inc.
7.125%, 03/15/2023 (r) | | | 36,000 | | | | 24,347 | | |
5.875%, 06/01/2025 (r) | | | 175,000 | | | | 135,187 | | |
Staples, Inc.
8.500%, 09/15/2025 (r) | | | 92,000 | | | | 86,020 | | |
| | | | 245,554 | | |
TOTAL CONSUMER DISCRETIONARY | | | 2,971,639 | | |
CONSUMER STAPLES — 0.89%
Food Products — 0.67% | |
Pinnacle Operating Corp.
9.000%, 05/15/2023 (i) (r) | | | 135,499 | | | | 128,724 | | |
TreeHouse Foods, Inc.
6.000%, 02/15/2024 (r) | | | 115,000 | | | | 118,048 | | |
| | | | 246,772 | | |
Personal Products — 0.22% | |
Energizer Gamma Acquisition, Inc.
6.375%, 07/15/2026 (e) (r) | | | 80,000 | | | | 81,500 | | |
TOTAL CONSUMER STAPLES | | | 328,272 | | |
| | | Principal
Amount | | Value | |
ENERGY — 9.97%
Energy Equipment & Services — 4.72% | |
Apergy Corp.
6.375%, 05/01/2026 (r) | | $ | 100,000 | | | $ | 101,750 | | |
Bellatrix Exploration Ltd.
8.500%, 05/15/2020 (i) (r) | | | 175,000 | | | | 117,250 | | |
Exterran Energy Solutions LP / EES Finance Corp.
8.125%, 05/01/2025 | | | 100,000 | | | | 105,750 | | |
Jonah Energy LLC / Jonah Energy Finance Corp.
7.250%, 10/15/2025 (r) | | | 120,000 | | | | 97,500 | | |
KCA Deutag UK Finance PLC
9.875%, 04/01/2022 (r) | | | 100,000 | | | | 103,849 | | |
9.625%, 04/01/2023 (r) | | | 15,000 | | | | 15,244 | | |
McDermott Technology Americas, Inc. /
McDermott Technology US, Inc.
10.625%, 05/01/2024 (r) | | | 125,000 | | | | 130,625 | | |
Moss Creek Resources Holdings, Inc.
7.500%, 01/15/2026 (r) | | | 115,000 | | | | 112,805 | | |
PHI, Inc.
5.250%, 03/15/2019 | | | 194,000 | | | | 190,604 | | |
SESI LLC
7.750%, 09/15/2024 | | | 125,000 | | | | 128,906 | | |
Shelf Drilling Holdings Ltd.
8.250%, 02/15/2025 (r) | | | 139,000 | | | | 140,564 | | |
Transocean, Inc.
9.000%, 07/15/2023 (r) | | | 244,000 | | | | 263,519 | | |
Ultra Resources, Inc.
7.125%, 04/15/2025 (r) | | | 165,000 | | | | 116,738 | | |
Unit Corp.
6.625%, 05/15/2021 | | | 110,000 | | | | 110,275 | | |
| | | | 1,735,379 | | |
Oil, Gas & Consumable Fuels — 5.25% | |
American Midstream Partners LP /
American Midstream Finance Corp.
8.500%, 12/15/2021 (r) | | | 105,000 | | | | 103,425 | | |
Callon Petroleum Company
6.375%, 07/01/2026 (r) | | | 100,000 | | | | 100,625 | | |
Calumet Specialty Products Partners LP /
Calumet Finance Corp.
6.500%, 04/15/2021 | | | 153,000 | | | | 153,000 | | |
Cheniere Corpus Christi Holdings LLC
5.875%, 03/31/2025 | | | 75,000 | | | | 78,281 | | |
Comstock Resources, Inc.
10.000% Cash or 12.250% PIK, 03/15/2020 (p) | | | 82,000 | | | | 86,100 | | |
GasLog Ltd.
8.875%, 03/22/2022 (i) | | | 137,000 | | | | 142,823 | | |
HighPoint Operating Corp.
8.750%, 06/15/2025 (i) | | | 94,000 | | | | 101,050 | | |
Holly Energy Partners LP /
Holly Energy Finance Corp.
6.000%, 08/01/2024 (r) | | | 83,000 | | | | 84,245 | | |
The accompanying notes are an integral part of these financial statements.
42
Schedule of Investments — June 30, 2018
Hotchkis & Wiley Capital Income Fund
| | | Principal
Amount | | Value | |
Kosmos Energy Ltd.
7.875%, 08/01/2021 (r) | | $ | 140,000 | | | $ | 142,975 | | |
Lonestar Resources America, Inc.
11.250%, 01/01/2023 (r) | | | 105,000 | | | | 112,088 | | |
PBF Holding Company LLC / PBF Finance Corp.
7.250%, 06/15/2025 | | | 80,000 | | | | 84,300 | | |
PBF Logistics LP / PBF Logistics Finance Corp.
6.875%, 05/15/2023 | | | 115,000 | | | | 116,581 | | |
PetroQuest Energy, Inc.
1.000% Cash and 9.000% PIK, 02/15/2021 (i) (p) | | | 144,271 | | | | 67,086 | | |
Rockpoint Gas Storage Canada Ltd.
7.000%, 03/31/2023 (r) | | | 310,000 | | | | 311,549 | | |
Sanchez Energy Corp.
6.125%, 01/15/2023 | | | 184,000 | | | | 125,580 | | |
Whiting Petroleum Corp.
6.625%, 01/15/2026 (r) | | | 120,000 | | | | 123,900 | | |
| | | | 1,933,608 | | |
TOTAL ENERGY | | | 3,668,987 | | |
FINANCIALS — 1.28%
Banks — 1.28% | |
DAE Funding LLC
5.000%, 08/01/2024 (r) | | | 110,000 | | | | 105,930 | | |
Park Aerospace Holdings Ltd.
5.500%, 02/15/2024 (r) | | | 128,000 | | | | 126,693 | | |
Popular, Inc.
7.000%, 07/01/2019 | | | 87,000 | | | | 88,740 | | |
Societe Generale SA
7.375% (Fixed until 09/12/2021, then 5 Year
Swap Rate USD + 6.238%), Perpetual (r) | | | 145,000 | | | | 147,900 | | |
| | | | 469,263 | | |
TOTAL FINANCIALS | | | 469,263 | | |
HEALTH CARE — 5.22%
Health Care Equipment & Supplies — 0.21% | |
Halyard Health, Inc.
6.250%, 10/15/2022 (c) | | | 74,000 | | | | 76,220 | | |
Health Care Providers & Services — 3.15% | |
Centene Escrow I Corp.
5.375%, 06/01/2026 (r) | | | 80,000 | | | | 81,250 | | |
CHS / Community Health Systems, Inc.
6.875%, 02/01/2022 | | | 197,000 | | | | 101,455 | | |
6.250%, 03/31/2023 | | | 150,000 | | | | 138,000 | | |
8.625%, 01/15/2024 (e) (r) | | | 20,000 | | | | 20,102 | | |
DaVita, Inc.
5.000%, 05/01/2025 | | | 105,000 | | | | 99,094 | | |
DJO Finance LLC / DJO Finance Corp.
8.125%, 06/15/2021 (r) | | | 149,000 | | | | 151,563 | | |
HCA, Inc.
6.500%, 02/15/2020 | | | 210,000 | | | | 219,188 | | |
5.250%, 06/15/2026 | | | 14,000 | | | | 13,940 | | |
| | | Principal
Amount | | Value | |
LifePoint Health, Inc.
5.875%, 12/01/2023 | | $ | 110,000 | | | $ | 109,863 | | |
Tenet Healthcare Corp.
6.750%, 06/15/2023 | | | 228,000 | | | | 227,714 | | |
| | | | 1,162,169 | | |
Pharmaceuticals — 1.86% | |
AMAG Pharmaceuticals, Inc.
7.875%, 09/01/2023 (r) | | | 134,000 | | | | 142,208 | | |
Endo Dac / Endo Finance LLC / Endo Finco, Inc.
6.000%, 07/15/2023 (r) | | | 137,000 | | | | 113,368 | | |
Mallinckrodt International Finance SA /
Mallinckrodt CB LLC
5.625%, 10/15/2023 (r) | | | 189,000 | | | | 158,476 | | |
Valeant Pharmaceuticals International, Inc.
7.000%, 03/15/2024 (r) | | | 65,000 | | | | 68,230 | | |
6.125%, 04/15/2025 (r) | | | 218,000 | | | | 201,649 | | |
| | | | 683,931 | | |
TOTAL HEALTH CARE | | | 1,922,320 | | |
INDUSTRIALS — 5.24%
Building Products — 1.29% | |
Ashton Woods USA LLC / Ashton Woods
Finance Company
6.750%, 08/01/2025 (r) | | | 135,000 | | | | 128,924 | | |
Builders FirstSource, Inc.
5.625%, 09/01/2024 (r) | | | 125,000 | | | | 122,344 | | |
FBM Finance, Inc.
8.250%, 08/15/2021 (r) | | | 100,000 | | | | 104,625 | | |
Standard Industries, Inc.
6.000%, 10/15/2025 (r) | | | 119,000 | | | | 119,893 | | |
| | | | 475,786 | | |
Commercial Services & Supplies — 1.90% | |
Aptim Corp.
7.750%, 06/15/2025 (r) | | | 145,000 | | | | 118,175 | | |
Herc Rentals, Inc.
7.750%, 06/01/2024 (r) | | | 123,000 | | | | 131,918 | | |
LSC Communications, Inc.
8.750%, 10/15/2023 (r) | | | 205,000 | | | | 201,668 | | |
Matthews International Corp.
5.250%, 12/01/2025 (r) | | | 110,000 | | | | 105,600 | | |
Zachry Holdings, Inc.
7.500%, 02/01/2020 (r) | | | 141,000 | | | | 140,119 | | |
| | | | 697,480 | | |
Construction & Engineering — 0.49% | |
AECOM
5.875%, 10/15/2024 (c) | | | 78,000 | | | | 80,828 | | |
Tutor Perini Corp.
6.875%, 05/01/2025 (r) | | | 100,000 | | | | 100,375 | | |
| | | | 181,203 | | |
The accompanying notes are an integral part of these financial statements.
43
Schedule of Investments — June 30, 2018
Hotchkis & Wiley Capital Income Fund
| | | Principal
Amount | | Value | |
Machinery — 0.93% | |
Cleaver-Brooks, Inc.
7.875%, 03/01/2023 (r) | | $ | 85,000 | | | $ | 87,763 | | |
Meritor, Inc.
6.250%, 02/15/2024 | | | 124,000 | | | | 125,550 | | |
Navistar International Corp.
6.625%, 11/01/2025 (r) | | | 125,000 | | | | 129,062 | | |
| | | | 342,375 | | |
Professional Services — 0.38% | |
Enviva Partners LP / Enviva Partners Finance Corp.
8.500%, 11/01/2021 | | | 135,000 | | | | 140,906 | | |
Trading Companies & Distributors — 0.25% | |
Beacon Roofing Supply, Inc.
4.875%, 11/01/2025 (r) | | | 100,000 | | | | 93,000 | | |
TOTAL INDUSTRIALS | | | 1,930,750 | | |
INFORMATION TECHNOLOGY — 0.55%
Communications Equipment — 0.32% | |
CommScope Technologies LLC
6.000%, 06/15/2025 (r) | | | 117,000 | | | | 120,072 | | |
Software — 0.23% | |
Nuance Communications, Inc.
5.625%, 12/15/2026 | | | 85,000 | | | | 83,513 | | |
TOTAL INFORMATION TECHNOLOGY | | | 203,585 | | |
MATERIALS — 4.04%
Chemicals — 2.14% | |
Alpha 3 BV / Alpha US Bidco, Inc.
6.250%, 02/01/2025 (r) | | | 125,000 | | | | 123,438 | | |
The Chemours Company
7.000%, 05/15/2025 | | | 46,000 | | | | 49,565 | | |
Hexion, Inc.
6.625%, 04/15/2020 | | | 143,000 | | | | 134,263 | | |
Momentive Performance Materials, Inc.
3.880%, 10/24/2021 | | | 150,000 | | | | 157,875 | | |
Platform Specialty Products Corp.
6.500%, 02/01/2022 (r) | | | 64,000 | | | | 65,280 | | |
5.875%, 12/01/2025 (r) | | | 70,000 | | | | 68,513 | | |
Rayonier AM Products, Inc.
5.500%, 06/01/2024 (r) | | | 199,000 | | | | 188,054 | | |
| | | | 786,988 | | |
Containers & Packaging — 0.26% | |
Plastipak Holdings, Inc.
6.250%, 10/15/2025 (r) | | | 105,000 | | | | 97,125 | | |
| | | Principal
Amount | | Value | |
Metals & Mining — 1.37% | |
Century Aluminum Company
7.500%, 06/01/2021 (r) | | $ | 125,000 | | | $ | 126,563 | | |
Grinding Media, Inc. / Moly-Cop AltaSteel Ltd.
7.375%, 12/15/2023 (r) | | | 140,000 | | | | 146,299 | | |
New Day Aluminum LLC
4.000% Cash and 6.000% PIK, 10/28/2020
(Acquired 10/28/2016 — 06/30/2018,
Cost $19,775) (f) (i) (m) (p) (u) | | | 65,229 | | | | 63,041 | | |
4.000% Cash and 6.000% PIK, 10/28/2020
(Acquired 10/28/2016 — 06/30/2018,
Cost $7,830) (f) (i) (m) (p) (u) | | | 24,245 | | | | 24,245 | | |
Rain CII Carbon LLC / CII Carbon Corp.
7.250%, 04/01/2025 (r) | | | 140,000 | | | | 142,800 | | |
| | | | 502,948 | | |
Paper & Forest Products — 0.27% | |
Neenah, Inc.
5.250%, 05/15/2021 (i) (r) | | | 100,000 | | | | 100,125 | | |
TOTAL MATERIALS | | | 1,487,186 | | |
REAL ESTATE — 0.36%
Equity Real Estate Investment Trusts — 0.36% | |
The GEO Group, Inc.
5.875%, 10/15/2024 | | | 134,000 | | | | 132,660 | | |
TOTAL REAL ESTATE | | | 132,660 | | |
TELECOMMUNICATION SERVICES — 1.05%
Diversified Telecommunication Services — 0.57% | |
Sable International Finance Ltd.
6.875%, 08/01/2022 (r) | | | 84,000 | | | | 86,705 | | |
Uniti Group LP / Uniti Group Finance, Inc. /
CSL Capital LLC
8.250%, 10/15/2023 | | | 126,000 | | | | 120,985 | | |
| | | | 207,690 | | |
Wireless Telecommunication Services — 0.48% | |
Telesat Canada / Telesat LLC
8.875%, 11/15/2024 (r) | | | 165,000 | | | | 176,963 | | |
TOTAL TELECOMMUNICATION SERVICES | | | 384,653 | | |
UTILITIES — 0.72%
Electric Utilities — 0.26% | |
Itron, Inc.
5.000%, 01/15/2026 (r) | | | 100,000 | | | | 95,220 | | |
Independent Power and Renewable Electricity
Producers — 0.46% | |
NRG Energy, Inc.
7.250%, 05/15/2026 | | | 87,000 | | | | 93,090 | | |
Vistra Energy Corp.
7.625%, 11/01/2024 (c) | | | 72,000 | | | | 77,130 | | |
| | | | 170,220 | | |
TOTAL UTILITIES | | | 265,440 | | |
Total corporate bonds
(Cost $13,979,590) | | | | | 13,764,755 | | |
The accompanying notes are an integral part of these financial statements.
44
Schedule of Investments — June 30, 2018
Hotchkis & Wiley Capital Income Fund
TERM LOANS — 2.14% | | Principal
Amount | | Value | |
CONSUMER DISCRETIONARY — 0.70%
Specialty Retail — 0.48% | |
Office Depot, Inc.
9.125% (1 Month LIBOR USD + 7.000%),
11/08/2022 (Acquired 11/03/2017 —
12/20/2017, Cost $64,768) (b) (m) | | $ | 66,500 | | | $ | 68,287 | | |
Staples, Inc.
5.787% (2 Month LIBOR USD + 4.000%),
09/12/2024 (Acquired 08/15/2017,
Cost $109,176) (b) (m) | | | 109,450 | | | | 108,168 | | |
| | | | 176,455 | | |
Textiles, Apparel & Luxury Goods — 0.22% | |
Boardriders, Inc.
8.480% (1 Month LIBOR USD + 6.500%),
04/23/2024 (Acquired 03/21/2018,
Cost $78,415) (b) (m) | | | 80,000 | | | | 80,000 | | |
TOTAL CONSUMER DISCRETIONARY | | | 256,455 | | |
ENERGY — 0.78%
Energy Equipment & Services — 0.50% | |
Fieldwood Energy LLC
7.230% (1 Month LIBOR USD + 5.250%),
04/11/2022 (Acquired 04/11/2018,
Cost $79,998) (b) (m) | | | 80,218 | | | | 80,508 | | |
9.230% (1 Month LIBOR USD + 7.250%),
04/11/2023 (Acquired 04/11/2018,
Cost $104,501) (b) (m)) | | | 108,296 | | | | 105,408 | | |
| | | | 185,916 | | |
Oil, Gas & Consumable Fuels — 0.28% | |
International Seaways Operating Corp.
7.990% (1 Month LIBOR USD + 6.000%),
06/22/2022 (Acquired 06/20/2017 — 08/07/2017,
Cost $101,572) (b) (m) | | | 103,031 | | | | 103,224 | | |
TOTAL ENERGY | | | 289,140 | | |
HEALTH CARE — 0.31%
Health Care Providers & Services — 0.31% | |
Wink Holdco, Inc.
8.740% (1 Month LIBOR USD + 6.750%),
12/01/2025 (b) | | | 115,000 | | | | 114,665 | | |
TOTAL HEALTH CARE | | | 114,665 | | |
INDUSTRIALS — 0.26%
Trading Companies & Distributors — 0.26% | |
Foundation Building Materials
TBD, 05/11/2025
(Acquired 05/11/2018 — 06/19/2018,
Cost $95,081) (e) (m) | | | 95,000 | | | | 94,911 | | |
TOTAL INDUSTRIALS | | | 94,911 | | |
| | | Principal
Amount | | Value | |
MATERIALS — 0.09%
Chemicals — 0.09% | |
Iracore International Holdings, Inc.
11.125% (1 Month LIBOR USD + 9.000%),
04/13/2021 (Acquired 04/13/2017,
Cost $31,585) (b) (f) (i) (m) (u) | | $ | 31,585 | | | $ | 31,585 | | |
TOTAL MATERIALS | | | 31,585 | | |
Total term loans
(Cost $779,640) | | | | | 786,756 | | |
Total long-term investments
(Cost $34,583,327) | | | | | 36,415,804 | | |
SHORT-TERM INVESTMENTS — 1.01% | |
Time Deposits — 1.01% | |
Banco Santander SA, 1.27%, 07/02/2018* | | | 366,569 | | | | 366,569 | | |
Brown Brothers Harriman & Co.,
0.51%, 07/03/2018* | | CAD | 4,796 | | | | 3,648 | | |
Brown Brothers Harriman & Co.,
0.15%, 07/02/2018* | | NOK | 4 | | | | 1 | | |
Total short-term investments
(Cost $370,218) | | | 370,218 | | |
Total investments — 99.92%
(Cost $34,953,545) | | | | | 36,786,022 | | |
Other assets in excess of liabilities — 0.08% | | | | | 29,182 | | |
Net assets — 100.00% | | $ | 36,815,204 | | |
(a) — Non-income producing security.
(b) — The coupon rate shown on variable rate securities represents the rate at June 30, 2018.
(c) — All or a portion of this security is segregated as collateral for bridge loan commitments and/or delayed delivery securities.
(e) — Delayed delivery security.
(f) — Security was fair valued under guidelines established by and under the general supervision and responsibility of the Trust's Board of Trustees. The total market value of these securities was $950,647, which represented 2.58% of net assets. See Security Valuation in Note 1 in Notes to the Financial Statements.
(i) — Illiquid security.
(m) — Restricted security. Purchased in a private placement transaction; resale to the public may require registration. The total market value of these securities was $1,688,594, which represented 4.59% of net assets.
(p) — Payment in-kind (PIK) security.
(r) — Rule 144A security of the Securities Act of 1933. Purchased in a private placement transaction; resale to the public may require registration or be limited to qualified institutional buyers. The total market value of these securities was $9,282,272, which represented 25.21% of net assets.
The accompanying notes are an integral part of these financial statements.
45
Schedule of Investments — June 30, 2018
Hotchkis & Wiley Capital Income Fund
(u) — Value determined using significant unobservable inputs.
(v) — Security was fair valued as a result of market movements following the close of local trading using a third-party vendor's proprietary fair value pricing model. The total market value of these securities was $436,570, which represented 1.19% of net assets. See Security Valuation in Note 1 in Notes to the Financial Statements.
ADR — American Depositary Receipt
CAD — Canadian Dollar
LIBOR — London Interbank Offered Rate
NOK — Norwegian Krone
USD — United States Dollar
* — Invested through a cash management account administered by Brown Brothers Harriman & Co.
The accompanying notes are an integral part of these financial statements.
46
Schedule of Investments — June 30, 2018
Hotchkis & Wiley High Yield Fund

Largest Issuers | | Percent of
net assets | |
CCO Holdings LLC / CCO Holdings
Capital Corp. | | | 1.30 | % | |
Pinnacle Agriculture Holdings LLC
(includes Pinnacle Agriculture
Enterprises LLC and Pinnacle
Operating Corp.) | | | 1.18 | % | |
Altice Europe NV (includes Altice
France SA and Altice Luxembourg SA) | | | 1.17 | % | |
Boardriders, Inc. (includes
Boardriders, Inc. and Quiksilver, Inc.) | | | 1.16 | % | |
Valeant Pharmaceuticals International, Inc. | | | 1.13 | % | |
American Zinc Recycling LLC | | | 1.12 | % | |
Staples, Inc. | | | 1.11 | % | |
JC Penney Corp., Inc. | | | 1.05 | % | |
CHS / Community Health Systems, Inc. | | | 1.05 | % | |
HCA, Inc. | | | 1.04 | % | |
CORPORATE
BONDS — 87.68% | | Principal
Amount | | Value | |
Advertising — 0.72% | |
MDC Partners, Inc.
6.500%, 05/01/2024 (r) | | $ | 22,461,000 | | | $ | 19,597,222 | | |
Auto Parts & Equipment — 2.58% | |
Adient Global Holdings Ltd.
4.875%, 08/15/2026 (r) | | | 22,802,000 | | | | 20,635,810 | | |
Delphi Technologies PLC
5.000%, 10/01/2025 (r) | | | 15,891,000 | | | | 15,195,769 | | |
The Goodyear Tire & Rubber Company
4.875%, 03/15/2027 | | | 17,601,000 | | | | 16,127,092 | | |
Meritor, Inc.
6.250%, 02/15/2024 | | | 17,954,000 | | | | 18,178,425 | | |
| | | | 70,137,096 | | |
Automakers — 0.74% | |
Navistar International Corp.
6.625%, 11/01/2025 (r) | | | 19,426,000 | | | | 20,057,345 | | |
Banking — 1.35% | |
Popular, Inc.
7.000%, 07/01/2019 | | | 21,336,000 | | | | 21,762,720 | | |
Societe Generale SA
7.375% (Fixed until 09/12/2021,
then 5 Year Swap Rate USD + 6.238%),
Perpetual (r) | | | 14,524,000 | | | | 14,814,480 | | |
| | | | 36,577,200 | | |
Building & Construction — 3.90% | |
Ashton Woods USA LLC / Ashton Woods
Finance Company
6.750%, 08/01/2025 (r) | | | 23,779,000 | | | | 22,708,945 | | |
TopBuild Corp.
5.625%, 05/01/2026 (r) | | | 16,827,000 | | | | 16,195,988 | | |
Tutor Perini Corp.
6.875%, 05/01/2025 (r) | | | 17,519,000 | | | | 17,584,696 | | |
Weekley Homes LLC / Weekley Finance Corp.
6.000%, 02/01/2023 | | | 26,230,000 | | | | 25,672,613 | | |
Zachry Holdings, Inc.
7.500%, 02/01/2020 (r) | | | 24,012,000 | | | | 23,861,925 | | |
| | | | 106,024,167 | | |
| | | Principal
Amount | | Value | |
Building Materials — 3.13% | |
Beacon Roofing Supply, Inc.
4.875%, 11/01/2025 (r) | | $ | 16,835,000 | | | $ | 15,656,550 | | |
Builders FirstSource, Inc.
5.625%, 09/01/2024 (r) | | | 20,523,000 | | | | 20,086,886 | | |
FBM Finance, Inc.
8.250%, 08/15/2021 (r) | | | 8,369,000 | | | | 8,756,066 | | |
Standard Industries, Inc.
6.000%, 10/15/2025 (r) | | | 19,797,000 | | | | 19,945,478 | | |
WESCO Distribution, Inc.
5.375%, 06/15/2024 | | | 20,873,000 | | | | 20,585,996 | | |
| | | | 85,030,976 | | |
Cable & Satellite TV — 4.58% | |
Altice France SA
6.000%, 05/15/2022 (r) | | | 12,975,000 | | | | 13,072,312 | | |
Altice Luxembourg SA
7.625%, 02/15/2025 (r) | | | 20,301,000 | | | | 18,753,049 | | |
Cable One, Inc.
5.750%, 06/15/2022 (r) | | | 14,845,000 | | | | 15,179,012 | | |
CCO Holdings LLC / CCO Holdings Capital Corp.
5.375%, 05/01/2025 (r) | | | 11,234,000 | | | | 10,896,980 | | |
5.750%, 02/15/2026 (r) | | | 24,792,000 | | | | 24,420,120 | | |
Virgin Media Finance PLC
6.375%, 04/15/2023 (r) | | | 10,973,000 | | | | 11,027,865 | | |
Virgin Media Secured Finance PLC
5.250%, 01/15/2026 (r) | | | 12,411,000 | | | | 11,526,716 | | |
VTR Finance BV
6.875%, 01/15/2024 (r) | | | 19,410,000 | | | | 19,574,015 | | |
| | | | 124,450,069 | | |
Chemicals — 3.90% | |
Alpha 3 BV / Alpha US Bidco, Inc.
6.250%, 02/01/2025 (r) | | | 20,675,000 | | | | 20,416,562 | | |
The Chemours Company
7.000%, 05/15/2025 (c) | | | 12,986,000 | | | | 13,992,415 | | |
Hexion, Inc.
6.625%, 04/15/2020 (c) | | | 23,045,000 | | | | 21,636,950 | | |
The accompanying notes are an integral part of these financial statements.
47
Schedule of Investments — June 30, 2018
Hotchkis & Wiley High Yield Fund
| | | Principal
Amount | | Value | |
Momentive Performance Materials, Inc.
3.880%, 10/24/2021 (c) | | $ | 24,294,000 | | | $ | 25,569,435 | | |
Momentive Performance Materials,
Inc. — Escrow
8.875%, 10/15/2020
(Acquired 10/29/2014 — 11/24/2015,
Cost $13) (a) (f) (i) (m) (u) | | | 24,222,000 | | | | 0 | | |
Platform Specialty Products Corp.
6.500%, 02/01/2022 (r) | | | 13,101,000 | | | | 13,363,020 | | |
5.875%, 12/01/2025 (r) | | | 11,290,000 | | | | 11,050,088 | | |
| | | | 106,028,470 | | |
Consumer/Commercial/Lease Financing — 2.39% | |
Credit Acceptance Corp.
6.125%, 02/15/2021 | | | 17,536,000 | | | | 17,689,440 | | |
7.375%, 03/15/2023 | | | 3,886,000 | | | | 4,031,725 | | |
DAE Funding LLC
5.000%, 08/01/2024 (r) | | | 21,942,000 | | | | 21,130,146 | | |
Park Aerospace Holdings Ltd.
5.500%, 02/15/2024 (r) | | | 22,260,000 | | | | 22,032,725 | | |
| | | | 64,884,036 | | |
Department Stores — 1.05% | |
JC Penney Corp., Inc.
5.875%, 07/01/2023 (r) | | | 21,250,000 | | | | 20,001,562 | | |
8.625%, 03/15/2025 (r) | | | 10,078,000 | | | | 8,566,300 | | |
| | | | 28,567,862 | | |
Diversified Capital Goods — 0.98% | |
EnPro Industries, Inc.
5.875%, 09/15/2022 | | | 7,967,000 | | | | 8,166,175 | | |
Matthews International Corp.
5.250%, 12/01/2025 (r) | | | 19,230,000 | | | | 18,460,800 | | |
| | | | 26,626,975 | | |
Electric — Generation — 1.04% | |
NRG Energy, Inc.
7.250%, 05/15/2026 | | | 13,883,000 | | | | 14,854,810 | | |
Vistra Energy Corp.
7.625%, 11/01/2024 (c) | | | 12,399,000 | | | | 13,282,429 | | |
| | | | 28,137,239 | | |
Electronics — 0.51% | |
Sensata Technologies BV
5.625%, 11/01/2024 (r) | | | 13,262,000 | | | | 13,809,058 | | |
Energy — Exploration & Production — 8.07% | |
Bellatrix Exploration Ltd.
8.500%, 05/15/2020 (i) (r) | | | 21,501,000 | | | | 14,405,670 | | |
Callon Petroleum Company
6.375%, 07/01/2026 (r) | | | 16,710,000 | | | | 16,814,437 | | |
Comstock Resources, Inc.
10.000% Cash or 12.250% PIK,
03/15/2020 (p) | | | 12,701,000 | | | | 13,336,050 | | |
HighPoint Operating Corp.
8.750%, 06/15/2025 (i) | | | 14,135,000 | | | | 15,195,125 | | |
Jonah Energy LLC / Jonah Energy Finance Corp.
7.250%, 10/15/2025 (r) | | | 20,563,000 | | | | 16,707,437 | | |
| | | Principal
Amount | | Value | |
Kosmos Energy Ltd.
7.875%, 08/01/2021 (r) | | $ | 22,225,000 | | | $ | 22,697,281 | | |
Lonestar Resources America, Inc.
11.250%, 01/01/2023 (r) | | | 17,583,000 | | | | 18,769,852 | | |
Moss Creek Resources Holdings, Inc.
7.500%, 01/15/2026 (r) | | | 20,175,000 | | | | 19,789,859 | | |
PetroQuest Energy, Inc.
1.000% Cash and 9.000% PIK,
02/15/2021 (i) (p) | | | 23,285,081 | | | | 10,827,563 | | |
Sanchez Energy Corp.
6.125%, 01/15/2023 (c) | | | 28,371,000 | | | | 19,363,208 | | |
Ultra Resources, Inc.
7.125%, 04/15/2025 (r) | | | 19,687,000 | | | | 13,928,553 | | |
Unit Corp.
6.625%, 05/15/2021 | | | 17,649,000 | | | | 17,693,123 | | |
Whiting Petroleum Corp.
6.625%, 01/15/2026 (r) | | | 19,245,000 | | | | 19,870,463 | | |
| | | | 219,398,621 | | |
Food — Wholesale — 1.46% | |
Pinnacle Operating Corp.
9.000%, 05/15/2023 (i) (r) | | | 21,872,134 | | | | 20,778,527 | | |
TreeHouse Foods, Inc.
6.000%, 02/15/2024 (r) | | | 18,379,000 | | | | 18,866,044 | | |
| | | | 39,644,571 | | |
Forestry/Paper — 2.87% | |
Boise Cascade Company
5.625%, 09/01/2024 (r) | | | 15,308,000 | | | | 15,422,810 | | |
Enviva Partners LP / Enviva Partners
Finance Corp.
8.500%, 11/01/2021 | | | 20,095,000 | | | | 20,974,156 | | |
Neenah, Inc.
5.250%, 05/15/2021 (i) (r) | | | 16,618,000 | | | | 16,638,773 | | |
Rayonier AM Products, Inc.
5.500%, 06/01/2024 (r) | | | 26,326,000 | | | | 24,878,070 | | |
| | | | 77,913,809 | | |
Gaming — 2.19% | |
Boyd Gaming Corp.
6.000%, 08/15/2026 (r) | | | 13,655,000 | | | | 13,535,519 | | |
Jacobs Entertainment, Inc.
7.875%, 02/01/2024 (r) | | | 15,772,000 | | | | 16,521,170 | | |
Penn National Gaming, Inc.
5.625%, 01/15/2027 (r) | | | 18,679,000 | | | | 17,651,655 | | |
Rivers Pittsburgh Borrower LP / Rivers
Pittsburgh Finance Corp.
6.125%, 08/15/2021 (r) | | | 12,030,000 | | | | 11,939,775 | | |
| | | | 59,648,119 | | |
Gas Distribution — 3.45% | |
American Midstream Partners LP / American
Midstream Finance Corp.
8.500%, 12/15/2021 (r) | | | 18,193,000 | | | | 17,920,105 | | |
Cheniere Corpus Christi Holdings LLC
5.875%, 03/31/2025 | | | 17,064,000 | | | | 17,810,550 | | |
The accompanying notes are an integral part of these financial statements.
48
Schedule of Investments — June 30, 2018
Hotchkis & Wiley High Yield Fund
| | | Principal
Amount | | Value | |
Holly Energy Partners LP / Holly Energy
Finance Corp.
6.000%, 08/01/2024 (r) | | $ | 20,743,000 | | | $ | 21,054,145 | | |
PBF Logistics LP / PBF Logistics Finance Corp.
6.875%, 05/15/2023 | | | 18,391,000 | | | | 18,643,876 | | |
Rockpoint Gas Storage Canada Ltd.
7.000%, 03/31/2023 (r) | | | 18,130,000 | | | | 18,220,650 | | |
| | | | 93,649,326 | | |
Health Facilities — 3.59% | |
CHS / Community Health Systems, Inc.
6.875%, 02/01/2022 | | | 17,518,000 | | | | 9,021,770 | | |
6.250%, 03/31/2023 | | | 17,470,000 | | | | 16,072,400 | | |
8.625%, 01/15/2024 (e) (r) | | | 3,380,000 | | | | 3,397,238 | | |
HCA, Inc.
5.375%, 02/01/2025 (c) | | | 20,541,000 | | | | 20,278,075 | | |
5.250%, 06/15/2026 | | | 8,129,000 | | | | 8,094,045 | | |
LifePoint Health, Inc.
5.875%, 12/01/2023 | | | 19,601,000 | | | | 19,576,499 | | |
Tenet Healthcare Corp.
6.750%, 06/15/2023 (c) | | | 21,016,000 | | | | 20,989,730 | | |
| | | | 97,429,757 | | |
Health Services — 0.61% | |
DaVita, Inc.
5.000%, 05/01/2025 | | | 17,601,000 | | | | 16,610,944 | | |
Hotels — 0.58% | |
Wyndham Hotels & Resorts, Inc.
5.375%, 04/15/2026 (r) | | | 15,860,000 | | | | 15,820,350 | | |
Machinery — 1.58% | |
Cleaver-Brooks, Inc.
7.875%, 03/01/2023 (r) | | | 13,608,000 | | | | 14,050,260 | | |
Itron, Inc.
5.000%, 01/15/2026 (r) | | | 16,880,000 | | | | 16,073,136 | | |
Welbilt, Inc.
9.500%, 02/15/2024 | | | 11,655,000 | | | | 12,893,344 | | |
| | | | 43,016,740 | | |
Managed Care — 0.53% | |
Centene Escrow I Corp.
5.375%, 06/01/2026 (r) | | | 14,202,000 | | | | 14,423,977 | | |
Media — Diversified — 0.77% | |
National CineMedia LLC
5.750%, 08/15/2026 | | | 22,840,000 | | | | 20,955,700 | | |
Media Content — 1.43% | |
Salem Media Group, Inc.
6.750%, 06/01/2024 (r) | | | 20,684,000 | | | | 18,874,150 | | |
Townsquare Media, Inc.
6.500%, 04/01/2023 (r) | | | 22,246,000 | | | | 20,104,822 | | |
| | | | 38,978,972 | | |
| | | Principal
Amount | | Value | |
Medical Products — 1.86% | |
DJO Finance LLC / DJO Finance Corp.
8.125%, 06/15/2021 (r) | | $ | 16,390,000 | | | $ | 16,671,908 | | |
Halyard Health, Inc.
6.250%, 10/15/2022 | | | 17,030,000 | | | | 17,540,900 | | |
Hill-Rom Holdings, Inc.
5.750%, 09/01/2023 (r) | | | 15,976,000 | | | | 16,335,460 | | |
| | | | 50,548,268 | | |
Metals/Mining Excluding Steel — 2.90% | |
Century Aluminum Company
7.500%, 06/01/2021 (r) | | | 23,408,000 | | | | 23,700,600 | | |
Grinding Media, Inc. / Moly-Cop AltaSteel Ltd.
7.375%, 12/15/2023 (r) | | | 16,132,000 | | | | 16,857,940 | | |
Kaiser Aluminum Corp.
5.875%, 05/15/2024 | | | 12,437,000 | | | | 12,716,833 | | |
New Day Aluminum LLC
4.000% Cash and 6.000% PIK, 10/28/2020
(Acquired 10/28/2016 — 06/30/2018,
Cost $122,947) (f) (i) (m) (p) (u) | | | 374,835 | | | | 374,835 | | |
4.000% Cash and 6.000% PIK, 10/28/2020
(Acquired 10/28/2016 — 06/30/2018,
Cost $305,882) (f) (i) (m) (p) (u) | | | 1,008,464 | | | | 974,630 | | |
Rain CII Carbon LLC / CII Carbon Corp.
7.250%, 04/01/2025 (r) | | | 23,739,000 | | | | 24,213,780 | | |
| | | | 78,838,618 | | |
Oil Field Equipment & Services — 5.50% | |
Exterran Energy Solutions LP / EES Finance Corp.
8.125%, 05/01/2025 | | | 14,037,000 | | | | 14,844,127 | | |
KCA Deutag UK Finance PLC
9.875%, 04/01/2022 (r) | | | 19,789,000 | | | | 20,550,679 | | |
9.625%, 04/01/2023 (r) | | | 3,352,000 | | | | 3,406,470 | | |
McDermott Technology Americas, Inc. /
McDermott Technology US, Inc.
10.625%, 05/01/2024 (r) | | | 20,386,000 | | | | 21,303,370 | | |
PHI, Inc.
5.250%, 03/15/2019 | | | 23,221,000 | | | | 22,814,632 | | |
SESI LLC
7.750%, 09/15/2024 | | | 20,753,000 | | | | 21,401,531 | | |
Shelf Drilling Holdings Ltd.
8.250%, 02/15/2025 (r) | | | 23,862,000 | | | | 24,130,448 | | |
Transocean, Inc.
9.000%, 07/15/2023 (r) | | | 19,428,000 | | | | 20,982,240 | | |
| | | | 149,433,497 | | |
Oil Refining & Marketing — 1.15% | |
Calumet Specialty Products Partners LP /
Calumet Finance Corp.
6.500%, 04/15/2021 | | | 17,746,000 | | | | 17,746,000 | | |
PBF Holding Company LLC /
PBF Finance Corp.
7.250%, 06/15/2025 | | | 12,795,000 | | | | 13,482,731 | | |
| | | | 31,228,731 | | |
The accompanying notes are an integral part of these financial statements.
49
Schedule of Investments — June 30, 2018
Hotchkis & Wiley High Yield Fund
| | | Principal
Amount | | Value | |
Packaging — 1.01% | |
Plastipak Holdings, Inc.
6.250%, 10/15/2025 (r) | | $ | 17,634,000 | | | $ | 16,311,450 | | |
Reynolds Group Issuer, Inc. / Reynolds
Group Issuer LLC
5.125%, 07/15/2023 (r) | | | 11,159,000 | | | | 11,033,461 | | |
| | | | 27,344,911 | | |
Personal & Household Products — 1.45% | |
Central Garden & Pet Company
6.125%, 11/15/2023 | | | 10,321,000 | | | | 10,720,939 | | |
Energizer Gamma Acquisition, Inc.
6.375%, 07/15/2026 (e) (r) | | | 13,545,000 | | | | 13,798,969 | | |
Vista Outdoor, Inc.
5.875%, 10/01/2023 | | | 15,507,000 | | | | 14,847,952 | | |
| | | | 39,367,860 | | |
Pharmaceuticals — 3.43% | |
AMAG Pharmaceuticals, Inc.
7.875%, 09/01/2023 (r) | | | 21,374,000 | | | | 22,683,157 | | |
Endo Dac / Endo Finance LLC / Endo Finco, Inc.
6.000%, 07/15/2023 (r) | | | 21,865,000 | | | | 18,093,288 | | |
Mallinckrodt International Finance SA /
Mallinckrodt CB LLC
5.625%, 10/15/2023 (r) | | | 25,857,000 | | | | 21,681,095 | | |
Valeant Pharmaceuticals International, Inc.
7.000%, 03/15/2024 (r) | | | 10,189,000 | | | | 10,695,291 | | |
6.125%, 04/15/2025 (r) | | | 21,611,000 | | | | 19,990,175 | | |
| | | | 93,143,006 | | |
Printing & Publishing — 2.34% | |
Harland Clarke Holdings Corp.
9.250%, 03/01/2021 (r) | | | 20,284,000 | | | | 19,574,060 | | |
8.375%, 08/15/2022 (r) | | | 6,619,000 | | | | 6,519,715 | | |
LSC Communications, Inc.
8.750%, 10/15/2023 (r) | | | 19,875,000 | | | | 19,552,031 | | |
Multi-Color Corp.
4.875%, 11/01/2025 (r) | | | 19,289,000 | | | | 18,011,104 | | |
| | | | 63,656,910 | | |
Recreation & Travel — 1.16% | |
Interval Acquisition Corp.
5.625%, 04/15/2023 | | | 10,634,000 | | | | 10,773,518 | | |
Silversea Cruise Finance Ltd.
7.250%, 02/01/2025 (r) | | | 19,185,000 | | | | 20,817,644 | | |
| | | | 31,591,162 | | |
| | | Principal
Amount | | Value | |
Software/Services — 2.58% | |
First Data Corp.
7.000%, 12/01/2023 (r) | | $ | 12,481,000 | | | $ | 13,031,162 | | |
j2 Cloud Services LLC / j2 Global Co-Obligor, Inc.
6.000%, 07/15/2025 (r) | | | 13,729,000 | | | | 13,969,258 | | |
Nuance Communications, Inc.
5.625%, 12/15/2026 | | | 16,610,000 | | | | 16,319,491 | | |
PTC, Inc.
6.000%, 05/15/2024 | | | 11,334,000 | | | | 11,815,695 | | |
VeriSign, Inc.
5.250%, 04/01/2025 | | | 14,614,000 | | | | 14,865,361 | | |
| | | | 70,000,967 | | |
Specialty Retail — 1.46% | |
Murphy Oil USA, Inc.
5.625%, 05/01/2027 | | | 17,075,000 | | | | 16,754,844 | | |
PetSmart, Inc.
7.125%, 03/15/2023 (r) | | | 5,933,000 | | | | 4,012,488 | | |
5.875%, 06/01/2025 (r) | | | 24,455,000 | | | | 18,891,487 | | |
| | | | 39,658,819 | | |
Support — Services — 3.90% | |
AECOM
5.875%, 10/15/2024 (c) | | | 17,354,000 | | | | 17,983,082 | | |
Aptim Corp.
7.750%, 06/15/2025 (r) | | | 21,348,000 | | | | 17,398,620 | | |
The GEO Group, Inc.
5.875%, 10/15/2024 | | | 22,289,000 | | | | 22,066,110 | | |
Herc Rentals, Inc.
7.750%, 06/01/2024 (r) | | | 20,139,000 | | | | 21,599,078 | | |
Sotheby's
4.875%, 12/15/2025 (r) | | | 13,882,000 | | | | 13,361,425 | | |
Staples, Inc.
8.500%, 09/15/2025 (r) | | | 14,590,000 | | | | 13,641,650 | | |
| | | | 106,049,965 | | |
Technology Hardware & Equipment — 1.72% | |
CDW LLC / CDW Finance Corp.
5.500%, 12/01/2024 | | | 12,384,000 | | | | 12,693,600 | | |
CommScope Technologies LLC
6.000%, 06/15/2025 (r) | | | 19,820,000 | | | | 20,340,275 | | |
Ingram Micro, Inc.
5.450%, 12/15/2024 | | | 13,827,000 | | | | 13,700,833 | | |
| | | | 46,734,708 | | |
Telecom — Wireless — 0.80% | |
Telesat Canada / Telesat LLC
8.875%, 11/15/2024 (r) | | | 20,359,000 | | | | 21,835,028 | | |
Telecom — Wireline Integrated & Services — 1.23% | |
Sable International Finance Ltd.
6.875%, 08/01/2022 (r) | | | 13,420,000 | | | | 13,852,124 | | |
Uniti Group LP / Uniti Group Finance, Inc. /
CSL Capital LLC
8.250%, 10/15/2023 | | | 20,279,000 | | | | 19,471,896 | | |
| | | | 33,324,020 | | |
The accompanying notes are an integral part of these financial statements.
50
Schedule of Investments — June 30, 2018
Hotchkis & Wiley High Yield Fund
| | | Principal
Amount | | Value | |
Transport Infrastructure/Services — 1.19% | |
GasLog Ltd.
8.875%, 03/22/2022 (i) | | $ | 18,985,000 | | | $ | 19,791,863 | | |
XPO Logistics, Inc.
6.500%, 06/15/2022 (r) | | | 12,279,000 | | | | 12,632,021 | | |
| | | | 32,423,884 | | |
Total corporate bonds
(Cost $2,425,636,967) | | | | | 2,382,598,955 | | |
TERM LOANS — 3.60% | |
Building Materials — 0.61% | |
Foundation Building Materials
TBD, 05/11/2025
(Acquired 05/11/2018 — 06/19/2018,
Cost $16,519,863) (e) (m) | | | 16,500,000 | | | | 16,484,572 | | |
Energy — Exploration & Production — 0.62% | |
Fieldwood Energy LLC
7.230% (1 Month LIBOR USD + 5.250%),
04/11/2022 (Acquired 04/11/2018,
Cost $7,228,724) (b) (m) | | | 7,248,658 | | | | 7,274,898 | | |
9.230% (1 Month LIBOR USD + 7.250%),
04/11/2023 (Acquired 04/11/2018,
Cost $9,442,877) (b) (m) | | | 9,785,808 | | | | 9,524,821 | | |
| | | | 16,799,719 | | |
Managed Care — 0.30% | |
Wink Holdco, Inc.
4.980% (1 Month LIBOR USD + 3.000%),
12/02/2024 (Acquired 11/02/2017 — 12/20/2017,
Cost $8,225,987) (b) (m) | | | 8,208,750 | | | | 8,168,978 | | |
Oil Field Equipment & Services — 0.09% | |
Iracore International Holdings, Inc.
11.125% (1 Month LIBOR USD + 9.000%),
04/13/2021 (Acquired 04/13/2017,
Cost $2,590,943) (b) (f) (i) (m) (u) | | | 2,590,943 | | | | 2,590,943 | | |
Specialty Retail — 1.49% | |
Boardriders, Inc.
8.480% (1 Month LIBOR USD + 6.500%),
04/23/2024 (Acquired 03/21/2018,
Cost $11,487,831) (b) (m) | | | 11,720,000 | | | | 11,720,000 | | |
Office Depot, Inc.
9.125% (1 Month LIBOR USD + 7.000%),
11/08/2022 (Acquired 11/03/2017 — 12/20/2017,
Cost $11,549,343) (b) (m) | | | 11,808,500 | | | | 12,125,854 | | |
Staples, Inc.
5.787% (2 Month LIBOR USD + 4.000%),
09/12/2024 (Acquired 08/15/2017 — 01/26/2018,
Cost $16,723,836) (b) (m) | | | 16,765,750 | | | | 16,569,339 | | |
| | | | 40,415,193 | | |
Transportation Excluding Air/Rail — 0.49% | |
International Seaways Operating Corp.
7.990% (1 Month LIBOR USD + 6.000%),
06/22/2022 (Acquired 06/20/2017 — 08/07/2017,
Cost $13,203,089) (b) (m) | | | 13,417,000 | | | | 13,442,157 | | |
Total term loans
(Cost $96,972,493) | | | | | 97,901,562 | | |
PREFERRED STOCKS — 1.07% | | Shares
Held | | Value | |
Banking — 0.66% | |
Royal Bank of Scotland Group PLC —
Series S, 6.600% | | | 695,347 | | | $ | 17,856,511 | | |
Food — Wholesale — 0.41% | |
Pinnacle Agriculture Enterprises LLC
(Acquired 03/10/2017,
Cost $11,192,395) (a) (f) (i) (m) (u) | | | 15,232,907 | | | | 11,272,351 | | |
Total preferred stocks
(Cost $26,560,744) | | | | | 29,128,862 | | |
COMMON STOCKS — 2.78% | |
Automakers — 0.00% | |
General Motors Company — Escrow
(Acquired 11/17/2009 — 04/06/2011,
Cost $0) (a) (f) (i) (m) (u) | | | 352,400 | | | | 0 | | |
Energy — Exploration & Production — 0.28% | |
Fieldwood Energy, Inc. (Acquired 05/03/2018,
Cost $1,705,030) (a) (i) (m) | | | 30,033 | | | | 1,576,733 | | |
Fieldwood Energy, Inc. (Acquired 05/03/2018,
Cost $2,595,253) (a) (i) (m) | | | 111,241 | | | | 5,840,152 | | |
Warren Resources, Inc. (Acquired 11/23/2016,
Cost $160,767) (a) (f) (i) (m) (u) | | | 116,226 | | | | 160,741 | | |
| | | | 7,577,626 | | |
Metals/Mining Excluding Steel — 1.60% | |
American Zinc Recycling LLC
(Acquired 07/19/2012 — 09/30/2016,
Cost $35,758,540) (a) (f) (i) (o) (m) (u) | | | 76,444 | | | | 30,319,984 | | |
CB Noranda Aluminum Acquisition Corp. — Escrow
(Acquired 03/01/2013 – 11/29/2017,
Cost $0) (a) (f) (i) (m) (u) | | | 18,476,000 | | | | 0 | | |
GHW Holdco LLC
(Acquired 10/28/2016 — 10/23/2017,
Cost $541,999) (a) (f) (i) (m) (o) (u) | | | 27 | | | | 1,339,581 | | |
RA Parent, Inc.
(Acquired 12/23/2014 — 01/18/2018,
Cost $17,853,515) (a) (f) (i) (m) (o) (u) | | | 288 | | | | 11,731,221 | | |
| | | | 43,390,786 | | |
Oil Field Equipment & Services — 0.17% | |
Iracore Investments Holdings, Inc. — Class A
(Acquired 04/13/2017,
Cost $4,696,250) (a) (f) (i) (m) (o) (u) | | | 22,092 | | | | 4,696,318 | | |
Specialty Retail — 0.73% | |
Quiksilver, Inc.
(Acquired 07/11/2013 — 05/12/2016,
Cost $28,586,327) (a) (f) (i) (m) (u) | | | 582,983 | | | | 19,821,422 | | |
Total common stocks
(Cost $91,897,681) | | | | | 75,486,152 | | |
The accompanying notes are an integral part of these financial statements.
51
Schedule of Investments — June 30, 2018
Hotchkis & Wiley High Yield Fund
WARRANTS — 0.03% | | Shares
Held | | Value | |
Energy — Exploration & Production — 0.03% | |
Lonestar Resources America, Inc.
(Acquired 08/19/2016 — 09/30/2016,
Cost $763,200) (a) (f) (i) (m)
Expiration: December 2021, Exercise
Price $5.00 | | | 180,000 | | | $ | 619,200 | | |
Total warrants
(Cost $763,200) | | | | | 619,200 | | |
Total long-term investments
(Cost $2,641,831,085) | | | | | 2,585,734,731 | | |
SHORT-TERM INVESTMENTS — 4.66% | |
Money Market Funds — 2.21% | |
JPMorgan U.S. Government Money Market
Fund — Class IM, 1.84%, 07/02/2018^ | | | 60,116,628 | | | | 60,116,628 | | |
| | | Principal
Amount | | | |
Time Deposits — 2.45% | |
Standard Chartered Bank, 1.27%,
07/02/2018* | | $ | 66,622,057 | | | | 66,622,057 | | |
Total short-term investments
(Cost $126,738,685) | | | 126,738,685 | | |
Total investments — 99.82%
(Cost $2,768,569,770) | | | | | 2,712,473,416 | | |
Other assets in excess of liabilities — 0.18% | | | | | 4,955,379 | | |
Net assets — 100.00% | | $ | 2,717,428,795 | | |
(a) — Non-income producing security.
(b) — The coupon rate shown on variable rate securities represents the rate at June 30, 2018.
(c) — All or a portion of this security is segregated as collateral for bridge loan commitments and/or delayed delivery securities.
(e) — Delayed delivery security.
(f) — Security was fair valued under guidelines established by and under the general supervision and responsibility of the Trust's Board of Trustees. The total market value of these securities was $83,901,226, which represented 3.09% of net assets. See Security Valuation in Note 1 in Notes to the Financial Statements.
(i) — Illiquid security.
(m) — Restricted security. Purchased in a private placement transaction; resale to the public may require registration. The total market value of these securities was $186,628,730, which represented 6.87% of net assets.
(o) — Affiliated issuer. See Note 6 in Notes to the Financial Statements.
(p) — Payment in-kind (PIK) security.
(r) — Rule 144A security of the Securities Act of 1933. Purchased in a private placement transaction; resale to the public may require registration or be limited to qualified institutional buyers. The total market value of these securities was $1,559,011,169, which represented 57.37% of net assets.
(u) — Value determined using significant unobservable inputs.
LIBOR — London Interbank Offered Rate
USD — United States Dollar
^ — Rate shown is the 7-day yield as of June 30, 2018.
* — Invested through a cash management account administered by Brown Brothers Harriman & Co.
The accompanying notes are an integral part of these financial statements.
52
Statements of Assets & Liabilities
JUNE 30, 2018
| | | Diversified Value
Fund | | Large Cap Value
Fund | | Mid-Cap Value
Fund | | Small Cap Value
Fund | | Small Cap
Diversified Value
Fund | |
Assets: | |
Long-term investments, at value* | |
Unaffiliated issuers | | $ | 107,287,759 | | | $ | 421,559,506 | | | $ | 1,821,478,181 | | | $ | 782,177,891 | | | $ | 41,895,169 | | |
Affiliated issuers | | | — | | | | — | | | | 37,708,315 | | | | 3,568,481 | | | | — | | |
Collateral for securities on loan* | | | 416,970 | | | | 1,663,360 | | | | 29,260,359 | | | | 32,363,992 | | | | — | | |
Short-term investments* | | | — | | | | 7,045,829 | | | | 36,697,938 | | | | 16,614,084 | | | | 1,784,361 | | |
Dividends and interest receivable | | | 253,151 | | | | 1,078,281 | | | | 2,106,920 | | | | 936,708 | | | | 30,808 | | |
Receivable for investments sold | | | 572,552 | | | | — | | | | 3,004,353 | | | | — | | | | — | | |
Receivable for Fund shares sold | | | 13,943 | | | | 578,765 | | | | 1,456,302 | | | | 1,549,888 | | | | 50,378 | | |
Other assets | | | 10,014 | | | | 36,639 | | | | 48,203 | | | | 31,667 | | | | 7,654 | | |
Total assets | | $ | 108,554,389 | | | $ | 431,962,380 | | | $ | 1,931,760,571 | | | $ | 837,242,711 | | | $ | 43,768,370 | | |
Liabilities: | |
Collateral upon return of securities on loan | | $ | 416,970 | | | $ | 1,663,360 | | | $ | 29,260,359 | | | $ | 32,363,992 | | | $ | — | | |
Payable for investments purchased | | | — | | | | — | | | | 12,267,084 | | | | 1,955,505 | | | | 739,599 | | |
Payable for Fund shares repurchased | | | 49,642 | | | | 397,912 | | | | 2,950,011 | | | | 2,046,618 | | | | 505 | | |
Payable to Advisor | | | 71,999 | | | | 266,880 | | | | 1,180,805 | | | | 500,544 | | | | 13,789 | | |
Payable to Trustees | | | 32 | | | | 110 | | | | 533 | | | | 217 | | | | 8 | | |
Accrued distribution and service fees | | | 52,052 | | | | 216,137 | | | | 317,887 | | | | 109,534 | | | | 1,749 | | |
Cash overdraft | | | 182,370 | | | | — | | | | — | | | | — | | | | — | | |
Accrued expenses and other liabilities | | | 64,767 | | | | 163,719 | | | | 638,130 | | | | 320,249 | | | | 50,011 | | |
Total liabilities | | | 837,832 | | | | 2,708,118 | | | | 46,614,809 | | | | 37,296,659 | | | | 805,661 | | |
Commitments and contingencies (Note 8) | | | | | | | | | | | |
Net assets | | $ | 107,716,557 | | | $ | 429,254,262 | | | $ | 1,885,145,762 | | | $ | 799,946,052 | | | $ | 42,962,709 | | |
Net Assets consist of: | |
Paid-in capital | | $ | 147,715,245 | | | $ | 452,361,146 | | | $ | 1,759,355,457 | | | $ | 664,809,574 | | | $ | 38,795,662 | | |
Undistributed net investment income (loss) | | | 1,280,233 | | | | 4,631,157 | | | | (322,010 | ) | | | 2,099,354 | | | | 127,246 | | |
Undistributed net realized gain (loss) | | | (28,840,212 | ) | | | (269,090 | ) | | | (26,718,695 | ) | | | 30,159,633 | | | | 2,528,285 | | |
Net unrealized appreciation (depreciation) of: | |
Unaffiliated issuers and foreign currency transactions | | | (12,438,709 | ) | | | (27,468,951 | ) | | | 242,344,959 | | | | 126,711,503 | | | | 1,511,516 | | |
Affiliated issuers | | | — | | | | — | | | | (89,513,949 | ) | | | (23,834,012 | ) | | | — | | |
Net assets | | $ | 107,716,557 | | | $ | 429,254,262 | | | $ | 1,885,145,762 | | | $ | 799,946,052 | | | $ | 42,962,709 | | |
Calculation of Net Asset Value Per Share and
Public Offering Price Per Share — Class I | |
Net assets | | $ | 65,503,031 | | | $ | 276,930,318 | | | $ | 1,609,001,585 | | | $ | 715,194,012 | | | $ | 40,127,883 | | |
Shares outstanding (unlimited shares $0.001 par value authorized) | | | 3,483,380 | | | | 8,249,637 | | | | 40,553,074 | | | | 11,193,396 | | | | 3,287,683 | | |
Net asset value per share | | $ | 18.80 | | | $ | 33.57 | | | $ | 39.68 | | | $ | 63.89 | | | $ | 12.21 | | |
Calculation of Net Asset Value Per Share — Class A | |
Net assets | | $ | 39,615,883 | | | $ | 131,275,535 | | | $ | 230,105,320 | | | $ | 70,927,995 | | | $ | 2,834,826 | | |
Shares outstanding (unlimited shares $0.001 par value authorized) | | | 2,101,378 | | | | 3,935,467 | | | | 5,896,006 | | | | 1,117,105 | | | | 233,475 | | |
Net asset value per share | | $ | 18.85 | | | $ | 33.36 | | | $ | 39.03 | | | $ | 63.49 | | | $ | 12.14 | | |
Public Offering Price Per Share — Class A | |
(Net asset value per share divided by 0.9475) | | $ | 19.89 | | | $ | 35.21 | | | $ | 41.19 | | | $ | 67.01 | | | $ | 12.81 | | |
Calculation of Net Asset Value Per Share and
Public Offering Price Per Share — Class C | |
Net assets | | $ | 2,597,643 | | | $ | 14,160,747 | | | $ | 39,383,132 | | | $ | 13,824,045 | | | | | | |
Shares outstanding (unlimited shares $0.001 par value authorized) | | | 139,385 | | | | 433,355 | | | | 1,160,837 | | | | 262,544 | | | | | | |
Net asset value per share | | $ | 18.64 | | | $ | 32.68 | | | $ | 33.93 | | | $ | 52.65 | | | | | | |
Calculation of Net Asset Value Per Share and
Public Offering Price Per Share — Class R | |
Net assets | | | | $ | 6,887,662 | | | $ | 6,655,725 | | | | | | | | | | |
Shares outstanding (unlimited shares $0.001 par value authorized) | | | | | 205,245 | | | | 170,572 | | | | | | | | | | |
Net asset value per share | | | | $ | 33.56 | | | $ | 39.02 | | | | | | | | | | |
*Cost of long-term investments | |
Unaffiliated issuers | | $ | 119,726,468 | | | $ | 449,028,457 | | | $ | 1,579,133,222 | | | $ | 655,466,489 | | | $ | 40,383,653 | | |
Affiliated issuers | | | — | | | | — | | | | 127,222,264 | | | | 27,402,493 | | | | — | | |
*Cost of collateral for securities on loan | | | 416,970 | | | | 1,663,360 | | | | 29,260,359 | | | | 32,363,992 | | | | — | | |
*Cost of short-term investments | | | — | | | | 7,045,829 | | | | 36,697,938 | | | | 16,614,084 | | | | 1,784,361 | | |
The accompanying notes are an integral part of these financial statements.
53
Statements of Assets & Liabilities
JUNE 30, 2018
| | | Global Value
Fund | | International Value
Fund | | Value Opportunities
Fund | | Capital Income
Fund | | High Yield
Fund | |
Assets: | |
Long-term investments, at value* | |
Unaffiliated issuers | | $ | 9,689,282 | | | $ | 2,554,683 | | | $ | 607,098,106 | | | $ | 36,415,804 | | | $ | 2,537,647,627 | | |
Affiliated issuers | | | — | | | | — | | | | 24,980,223 | | | | — | | | | 48,087,104 | | |
Collateral for securities on loan* | | | — | | | | — | | | | 25,188,204 | | | | — | | | | — | | |
Short-term investments* | | | 83,428 | | | | — | | | | 7,668,509 | | | | 370,218 | | | | 126,738,685 | | |
Cash denominated in foreign currencies# | | | — | | | | 550 | | | | — | | | | — | | | | — | | |
Cash collateral for futures | | | — | | | | — | | | | 312,430 | | | | — | | | | — | | |
Cash collateral for options | | | — | | | | — | | | | 2,686 | | | | — | | | | — | | |
Dividends and interest receivable | | | 27,681 | | | | 10,152 | | | | 1,731,973 | | | | 310,353 | | | | 42,278,279 | | |
Receivable for investments sold | | | — | | | | 15,566 | | | | 1,183,483 | | | | 55,354 | | | | 4,593,462 | | |
Receivable for Fund shares sold | | | — | | | | — | | | | 753,735 | | | | 78,007 | | | | 3,524,850 | | |
Receivable from Advisor | | | 7,162 | | | | 9,291 | | | | — | | | | — | | | | — | | |
Other assets | | | 7,083 | | | | 3,428 | | | | 15,528 | | | | 14,426 | | | | 82,006 | | |
Total assets | | $ | 9,814,636 | | | $ | 2,593,670 | | | $ | 668,934,877 | | | $ | 37,244,162 | | | $ | 2,762,952,013 | | |
Liabilities: | |
Collateral upon return of securities on loan | | $ | — | | | $ | — | | | $ | 25,188,204 | | | $ | — | | | $ | — | | |
Payable for investments purchased | | | 51,337 | | | | 4,729 | | | | 3,326,696 | | | | 278,979 | | | | 38,000,561 | | |
Payable for variation margin | | | — | | | | — | | | | 128,300 | | | | — | | | | — | | |
Payable for Fund shares repurchased | | | — | | | | — | | | | 357,805 | | | | 57,578 | | | | 2,292,870 | | |
Payable to Advisor | | | — | | | | — | | | | 396,268 | | | | 8,400 | | | | 1,073,462 | | |
Payable to Trustees | | | 3 | | | | 1 | | | | 173 | | | | 11 | | | | 788 | | |
Accrued distribution and service fees | | | 1,188 | | | | — | | | | 196,045 | | | | 8,529 | | | | 266,920 | | |
Distributions payable to shareholders | | | — | | | | — | | | | — | | | | 21,381 | | | | 3,138,730 | | |
Cash overdraft | | | — | | | | 6,816 | | | | — | | | | — | | | | — | | |
Accrued expenses and other liabilities | | | 43,631 | | | | 39,573 | | | | 209,335 | | | | 54,080 | | | | 749,887 | | |
Total liabilities | | | 96,159 | | | | 51,119 | | | | 29,802,826 | | | | 428,958 | | | | 45,523,218 | | |
Commitments and contingencies (Note 8) | | | | | | | | | | | |
Net assets | | $ | 9,718,477 | | | $ | 2,542,551 | | | $ | 639,132,051 | | | $ | 36,815,204 | | | $ | 2,717,428,795 | | |
Net Assets consist of: | |
Paid-in capital | | $ | 8,482,401 | | | $ | 2,244,680 | | | $ | 550,713,961 | | | $ | 36,104,174 | | | $ | 2,887,420,004 | | |
Undistributed net investment income (loss) | | | 50,116 | | | | 16,649 | | | | 1,949,167 | | | | (4,358 | ) | | | 92,301 | | |
Undistributed net realized gain (loss) | | | 354,228 | | | | 99,188 | | | | 40,567,754 | | | | (1,117,043 | ) | | | (113,987,156 | ) | |
Net unrealized appreciation (depreciation) of: | |
Unaffiliated issuers and foreign currency transactions | | | 831,732 | | | | 182,034 | | | | 42,904,638 | | | | 1,832,431 | | | | (45,333,153 | ) | |
Affiliated issuers | | | — | | | | — | | | | 2,837,500 | | | | — | | | | (10,763,201 | ) | |
Futures contracts | | | — | | | | — | | | | 159,031 | | | | — | | | | — | | |
Net assets | | $ | 9,718,477 | | | $ | 2,542,551 | | | $ | 639,132,051 | | | $ | 36,815,204 | | | $ | 2,717,428,795 | | |
Calculation of Net Asset Value Per Share and
Public Offering Price Per Share — Class I | |
Net assets | | $ | 8,986,604 | | | $ | 2,542,551 | | | $ | 453,183,650 | | | $ | 20,004,707 | | | $ | 1,918,320,012 | | |
Shares outstanding (unlimited shares $0.001 par value authorized) | | | 675,508 | | | | 219,778 | | | | 14,915,663 | | | | 1,558,586 | | | | 161,245,052 | | |
Net asset value per share | | $ | 13.30 | | | $ | 11.57 | | | $ | 30.38 | | | $ | 12.84 | | | $ | 11.90 | | |
Calculation of Net Asset Value Per Share — Class A | |
Net assets | | $ | 731,873 | | | | | | | $ | 136,324,506 | | | $ | 16,810,497 | | | $ | 466,959,749 | | |
Shares outstanding (unlimited shares $0.001 par value authorized) | | | 55,112 | | | | | | | | 4,483,805 | | | | 1,258,178 | | | | 39,488,112 | | |
Net asset value per share | | $ | 13.28 | | | | | | | $ | 30.40 | | | $ | 13.36 | | | $ | 11.83 | | |
Public Offering Price Per Share — Class A | |
(Net asset value per share divided by 0.9475) | | $ | 14.02 | | | | | | | $ | 32.08 | | | | | | | | | | |
(Net asset value per share divided by 0.9525) | | | | | | | | $ | 14.03 | | | | | | |
(Net asset value per share divided by 0.9625) | | | | | | | | | | $ | 12.29 | | |
Calculation of Net Asset Value Per Share and
Public Offering Price Per Share — Class C | |
Net assets | | | | | | $ | 49,623,895 | | | | | | | $ | 3,379,673 | | |
Shares outstanding (unlimited shares $0.001 par value authorized) | | | | | | | 1,758,256 | | | | | | | | 284,139 | | |
Net asset value per share | | | | | | $ | 28.22 | | | | | | | $ | 11.89 | | |
Calculation of Net Asset Value Per Share and
Public Offering Price Per Share — Class Z | |
Net assets | | | | | | | | | | $ | 328,769,361 | | |
Shares outstanding (unlimited shares $0.001 par value authorized) | | | | | | | | | | | 27,619,814 | | |
Net asset value per share | | | | | | | | | | $ | 11.90 | | |
*Cost of long-term investments | |
Unaffiliated issuers | | $ | 8,857,576 | | | $ | 2,372,622 | | | $ | 564,195,728 | | | $ | 34,583,327 | | | $ | 2,582,980,780 | | |
Affiliated issuers | | | — | | | | — | | | | 22,142,723 | | | | — | | | | 58,850,305 | | |
*Cost of collateral for securities on loan | | | — | | | | — | | | | 25,188,204 | | | | — | | | | — | | |
*Cost of short-term investments | | | 83,428 | | | | — | | | | 7,668,513 | | | | 370,218 | | | | 126,738,685 | | |
#Cost of cash denominated in foreign currencies | | $ | — | | | $ | 545 | | | $ | — | | | $ | — | | | $ | — | | |
The accompanying notes are an integral part of these financial statements.
54
Statements of Operations
FOR THE YEAR ENDED JUNE 30, 2018
| | | Diversified Value
Fund | | Large Cap Value
Fund | | Mid-Cap Value
Fund | | Small Cap Value
Fund | | Small Cap
Diversified Value
Fund | |
Investment income: | |
Dividends* | |
Unaffiliated issuers | | $ | 2,463,123 | | | $ | 9,136,049 | | | $ | 23,032,788 | | | $ | 10,934,271 | | | $ | 428,484 | | |
Interest | | | 5,712 | | | | 35,946 | | | | 299,368 | | | | 75,808 | | | | 5,437 | | |
Securities on loan, net | | | 11,780 | | | | 44,506 | | | | 1,118,550 | | | | 623,450 | | | | — | | |
Total income | | | 2,480,615 | | | | 9,216,501 | | | | 24,450,706 | | | | 11,633,529 | | | | 433,921 | | |
Expenses: | |
Advisory fees | | | 845,257 | | | | 3,042,093 | | | | 14,308,556 | | | | 5,854,964 | | | | 165,558 | | |
Professional fees and expenses | | | 32,116 | | | | 42,242 | | | | 94,252 | | | | 55,483 | | | | 26,940 | | |
Custodian fees and expenses | | | 11,774 | | | | 18,450 | | | | 73,142 | | | | 28,884 | | | | 14,660 | | |
Transfer agent fees and expenses | | | 134,790 | | | | 595,223 | | | | 3,104,163 | | | | 1,441,943 | | | | 26,603 | | |
Accounting fees and expenses | | | 20,144 | | | | 52,163 | | | | 220,157 | | | | 94,758 | | | | 55,839 | | |
Administration fees and expenses | | | 36,008 | | | | 126,499 | | | | 591,752 | | | | 242,790 | | | | 35,163 | | |
Trustees' fees and expenses | | | 9,183 | | | | 33,358 | | | | 156,683 | | | | 62,988 | | | | 1,895 | | |
Reports to shareholders | | | 1,413 | | | | 30,206 | | | | 174,017 | | | | 69,463 | | | | 4,445 | | |
Registration fees | | | 48,620 | | | | 71,139 | | | | 75,759 | | | | 57,353 | | | | 33,964 | | |
Distribution and service fees — Class A | | | 102,739 | | | | 338,013 | | | | 619,931 | | | | 196,740 | | | | 3,015 | | |
Distribution and service fees — Class C | | | 27,399 | | | | 160,236 | | | | 446,789 | | | | 151,136 | | | | — | | |
Distribution and service fees — Class R | | | — | | | | 48,623 | | | | 50,513 | | | | — | | | | — | | |
Other expenses | | | 10,233 | | | | 28,525 | | | | 114,894 | | | | 47,464 | | | | 4,732 | | |
Total expenses | | | 1,279,676 | | | | 4,586,770 | | | | 20,030,608 | | | | 8,303,966 | | | | 372,814 | | |
Fee waiver/expense reimbursement by Advisor (Note 2) | | | (78,879 | ) | | | — | | | | — | | | | — | | | | (140,566 | ) | |
Net expenses | | | 1,200,797 | | | | 4,586,770 | | | | 20,030,608 | | | | 8,303,966 | | | | 232,248 | | |
Net investment income | | | 1,279,818 | | | | 4,629,731 | | | | 4,420,098 | | | | 3,329,563 | | | | 201,673 | | |
Realized and Unrealized Gains (Losses): | |
Net realized gains (losses) from: | |
Sales of unaffiliated issuers | | | (1,069,491 | ) | | | 29,838,656 | | | | (2,951,849 | ) | | | 61,976,684 | | | | 4,735,623 | | |
Sales of affiliated issuers | | | — | | | | — | | | | (1,248,950 | ) | | | — | | | | — | | |
Foreign currency transactions | | | 415 | | | | 1,427 | | | | 8,605 | | | | (13,207 | ) | | | 23 | | |
Net realized gains (losses) | | | (1,069,076 | ) | | | 29,840,083 | | | | (4,192,194 | ) | | | 61,963,477 | | | | 4,735,646 | | |
Net change in unrealized appreciation (depreciation) of:
Securities of unaffiliated issuers and foreign currency transactions | | | 10,500,294 | | | | 2,301,915 | | | | 275,783,254 | | | | 24,797,166 | | | | (1,021,186 | ) | |
Securities of affiliated issuers | | | — | | | | — | | | | (23,803,312 | ) | | | 7,926,107 | | | | — | | |
Net change in unrealized appreciation (depreciation) | | | 10,500,294 | | | | 2,301,915 | | | | 251,979,942 | | | | 32,723,273 | | | | (1,021,186 | ) | |
Net gains | | | 9,431,218 | | | | 32,141,998 | | | | 247,787,748 | | | | 94,686,750 | | | | 3,714,460 | | |
Net Increase in Net Assets Resulting from
Operations | | $ | 10,711,036 | | | $ | 36,771,729 | | | $ | 252,207,846 | | | $ | 98,016,313 | | | $ | 3,916,133 | | |
*Net of Foreign Taxes Withheld | | $ | 38,552 | | | $ | 153,189 | | | $ | 543,911 | | | $ | 403,841 | | | $ | 1,259 | | |
The accompanying notes are an integral part of these financial statements.
55
Statements of Operations
FOR THE YEAR ENDED JUNE 30, 2018
| | | Global Value
Fund | | International Value
Fund | | Value
Opportunities
Fund | | Capital Income
Fund | | High Yield
Fund | |
Investment income: | |
Dividends* | |
Unaffiliated issuers | | $ | 169,244 | | | $ | 52,410 | | | $ | 9,289,181 | | | $ | 431,855 | | | $ | 1,784,491 | | |
Interest | | | 1,069 | | | | 389 | | | | 3,879,556 | | | | 1,263,982 | | | | 179,695,470 | | |
Securities on loan, net | | | — | | | | — | | | | 484,324 | | | | — | | | | — | | |
Total income | | | 170,313 | | | | 52,799 | | | | 13,653,061 | | | | 1,695,837 | | | | 181,479,961 | | |
Expenses: | |
Advisory fees | | | 70,657 | | | | 21,910 | | | | 4,427,030 | | | | 254,073 | | | | 15,034,909 | | |
Professional fees and expenses | | | 25,724 | | | | 23,184 | | | | 43,852 | | | | 26,611 | | | | 181,864 | | |
Custodian fees and expenses | | | 7,406 | | | | 6,336 | | | | 44,520 | | | | 18,742 | | | | 74,541 | | |
Transfer agent fees and expenses | | | 32,466 | | | | 15,243 | | | | 753,112 | | | | 47,665 | | | | 3,132,207 | | |
Accounting fees and expenses | | | 41,922 | | | | 45,240 | | | | 75,773 | | | | 65,339 | | | | 343,029 | | |
Administration fees and expenses | | | 31,441 | | | | 31,838 | | | | 184,255 | | | | 30,002 | | | | 853,399 | | |
Trustees' fees and expenses | | | 698 | | | | 206 | | | | 46,451 | | | | 3,238 | | | | 222,924 | | |
Reports to shareholders | | | 3,600 | | | | 3,380 | | | | 36,447 | | | | 6,606 | | | | 172,192 | | |
Registration fees | | | 34,764 | | | | 4,419 | | | | 70,903 | | | | 35,540 | | | | 143,305 | | |
Distribution and service fees — Class A | | | 1,196 | | | | — | | | | 335,745 | | | | 47,119 | | | | 1,274,357 | | |
Distribution and service fees — Class C | | | — | | | | — | | | | 534,748 | | | | — | | | | 34,043 | | |
Other expenses | | | 3,952 | | | | 3,105 | | | | 32,272 | | | | 5,585 | | | | 151,319 | | |
Total expenses | | | 253,826 | | | | 154,861 | | | | 6,585,108 | | | | 540,520 | | | | 21,618,089 | | |
Fee waiver/expense reimbursement by Advisor (Note 2) | | | (155,477 | ) | | | (125,219 | ) | | | — | | | | (180,696 | ) | | | (1,206,111 | ) | |
Net expenses | | | 98,349 | | | | 29,642 | | | | 6,585,108 | | | | 359,824 | | | | 20,411,978 | | |
Net investment income | | | 71,964 | | | | 23,157 | | | | 7,067,953 | | | | 1,336,013 | | | | 161,067,983 | | |
Realized and Unrealized Gains (Losses): | |
Net realized gains (losses) from: | |
Sales of unaffiliated issuers | | | 647,005 | | | | 155,083 | | | | 60,006,478 | | | | 2,055,413 | | | | (11,071,526 | ) | |
Foreign currency transactions | | | (2,576 | ) | | | (956 | ) | | | (88,556 | ) | | | (2,365 | ) | | | (830 | ) | |
Credit default swap contracts | | | — | | | | — | | | | — | | | | (8,259 | ) | | | (1,479,429 | ) | |
Futures contracts | | | — | | | | — | | | | 1,005,743 | | | | — | | | | — | | |
Net realized gains (losses) | | | 644,429 | | | | 154,127 | | | | 60,923,665 | | | | 2,044,789 | | | | (12,551,785 | ) | |
Net change in unrealized appreciation (depreciation) of:
Securities of unaffiliated issuers and foreign currency transactions | | | 61,872 | | | | (93,077 | ) | | | (3,330,745 | ) | | | (961,552 | ) | | | (79,373,854 | ) | |
Securities of affiliated issuers | | | — | | | | — | | | | 2,837,481 | | | | — | | | | 5,507,303 | | |
Credit default swap contracts | | | — | | | | — | | | | — | | | | (1,510 | ) | | | (271,744 | ) | |
Futures contracts | | | — | | | | — | | | | 219,556 | | | | — | | | | — | | |
Net change in unrealized appreciation (depreciation) | | | 61,872 | | | | (93,077 | ) | | | (273,708 | ) | | | (963,062 | ) | | | (74,138,295 | ) | |
Net gains (losses) | | | 706,301 | | | | 61,050 | | | | 60,649,957 | | | | 1,081,727 | | | | (86,690,080 | ) | |
Net Increase in Net Assets Resulting from
Operations | | $ | 778,265 | | | $ | 84,207 | | | $ | 67,717,910 | | | $ | 2,417,740 | | | $ | 74,377,903 | | |
*Net of Foreign Taxes Withheld | | $ | 9,173 | | | $ | 4,666 | | | $ | 263,805 | | | $ | 17,957 | | | $ | — | | |
The accompanying notes are an integral part of these financial statements.
56
Statements of Changes in Net Assets
| | | Diversified Value Fund | | Large Cap Value Fund | |
| | | Year ended
June 30, 2018 | | Year ended
June 30, 2017 | | Year ended
June 30, 2018 | | Year ended
June 30, 2017 | |
Operations: | |
Net investment income | | $ | 1,279,818 | | | $ | 1,972,254 | | | $ | 4,629,731 | | | $ | 5,848,670 | | |
Net realized gains (losses) | | | (1,069,076 | ) | | | (26,805,493 | ) | | | 29,840,083 | | | | 15,479,924 | | |
Net change in unrealized appreciation | | | 10,500,294 | | | | 68,420,848 | | | | 2,301,915 | | | | 87,865,394 | | |
Net increase in net assets resulting from operations | | | 10,711,036 | | | | 43,587,609 | | | | 36,771,729 | | | | 109,193,988 | | |
Dividends and Distributions to Shareholders: | |
Net investment income: | |
Class I | | | (1,291,066 | ) | | | (4,250,963 | ) | | | (3,696,306 | ) | | | (6,008,031 | ) | |
Class A | | | (657,010 | ) | | | (2,029,291 | ) | | | (1,968,759 | ) | | | (2,463,997 | ) | |
Class C | | | (23,932 | ) | | | (130,512 | ) | | | (84,374 | ) | | | (130,596 | ) | |
Class R | | | — | | | | — | | | | (98,106 | ) | | | (223,583 | ) | |
Net realized gains: | |
Class I | | | — | | | | — | | | | — | | | | — | | |
Class A | | | — | | | | — | | | | — | | | | — | | |
Class C | | | — | | | | — | | | | — | | | | — | | |
Class R | | | — | | | | — | | | | — | | | | — | | |
Net decrease in net assets resulting from dividends and
distributions to shareholders | | | (1,972,008 | ) | | | (6,410,766 | ) | | | (5,847,545 | ) | | | (8,826,207 | ) | |
Capital Share Transactions: | |
Net decrease in net assets resulting from capital share transactions | | | (13,183,311 | ) | | | (308,922,204 | ) | | | (37,501,866 | ) | | | (146,809,432 | ) | |
Net Assets: | |
Total decrease in net assets | | | (4,444,283 | ) | | | (271,745,361 | ) | | | (6,577,682 | ) | | | (46,441,651 | ) | |
Beginning of year | | | 112,160,840 | | | | 383,906,201 | | | | 435,831,944 | | | | 482,273,595 | | |
End of year | | $ | 107,716,557 | | | $ | 112,160,840 | | | $ | 429,254,262 | | | $ | 435,831,944 | | |
| Undistributed net investment income | | $ | 1,280,233 | | | $ | 1,972,008 | | | $ | 4,631,157 | | | $ | 5,847,544 | | |
The accompanying notes are an integral part of these financial statements.
57
Statements of Changes in Net Assets
| | | Mid-Cap Value Fund | | Small Cap Value Fund | |
| | | Year ended
June 30, 2018 | | Year ended
June 30, 2017 | | Year ended
June 30, 2018 | | Year ended
June 30, 2017 | |
Operations: | |
Net investment income | | $ | 4,420,098 | | | $ | 4,425,405 | | | $ | 3,329,563 | | | $ | 2,376,090 | | |
Net realized gains (losses) | | | (4,192,194 | ) | | | 126,462,466 | | | | 61,963,477 | | | | 80,480,851 | | |
Net change in unrealized appreciation | | | 251,979,942 | | | | 305,154,552 | | | | 32,723,273 | | | | 117,552,434 | | |
Net increase in net assets resulting from operations | | | 252,207,846 | | | | 436,042,423 | | | | 98,016,313 | | | | 200,409,375 | | |
Dividends and Distributions to Shareholders: | |
Net investment income: | |
Class I | | | (6,191,906 | ) | | | (5,491,081 | ) | | | (3,110,570 | ) | | | (2,949,850 | ) | |
Class A | | | (410,149 | ) | | | (590,653 | ) | | | (130,714 | ) | | | — | | |
Class C | | | — | | | | — | | | | — | | | | — | | |
Class R | | | (3,532 | ) | | | (13,844 | ) | | | — | | | | — | | |
Net realized gains: | |
Class I | | | (96,701,330 | ) | | | (21,970,175 | ) | | | (30,747,351 | ) | | | — | | |
Class A | | | (15,750,884 | ) | | | (3,941,402 | ) | | | (3,543,365 | ) | | | — | | |
Class C | | | (3,159,514 | ) | | | (865,957 | ) | | | (811,924 | ) | | | — | | |
Class R | | | (647,348 | ) | | | (181,505 | ) | | | — | | | | — | | |
Net decrease in net assets resulting from dividends and
distributions to shareholders | | | (122,864,663 | ) | | | (33,054,617 | ) | | | (38,343,924 | ) | | | (2,949,850 | ) | |
Capital Share Transactions: | |
Net decrease in net assets resulting from capital share transactions | | | (256,537,398 | ) | | | (448,189,011 | ) | | | (36,415,088 | ) | | | (253,832,782 | ) | |
Net Assets: | |
Total increase (decrease) in net assets | | | (127,194,215 | ) | | | (45,201,205 | ) | | | 23,257,301 | | | | (56,373,257 | ) | |
Beginning of year | | | 2,012,339,977 | | | | 2,057,541,182 | | | | 776,688,751 | | | | 833,062,008 | | |
End of year | | $ | 1,885,145,762 | | | $ | 2,012,339,977 | | | $ | 799,946,052 | | | $ | 776,688,751 | | |
| Undistributed net investment income (loss) | | $ | (322,010 | ) | | $ | 1,055,587 | | | $ | 2,099,354 | | | $ | 1,758,707 | | |
The accompanying notes are an integral part of these financial statements.
58
Statements of Changes in Net Assets
| | | Small Cap Diversified Value Fund | | Global Value Fund | |
| | | Year ended
June 30, 2018 | | Year ended
June 30, 2017 | | Year ended
June 30, 2018 | | Year ended
June 30, 2017 | |
Operations: | |
Net investment income | | $ | 201,673 | | | $ | 153,337 | | | $ | 71,964 | | | $ | 68,924 | | |
Net realized gains | | | 4,735,646 | | | | 1,898,110 | | | | 644,429 | | | | 346,770 | | |
Net change in unrealized appreciation (depreciation) | | | (1,021,186 | ) | | | 2,842,162 | | | | 61,872 | | | | 1,187,259 | | |
Net increase in net assets resulting from operations | | | 3,916,133 | | | | 4,893,609 | | | | 778,265 | | | | 1,602,953 | | |
Dividends and Distributions to Shareholders: | |
Net investment income: | |
Class I | | | (97,468 | ) | | | (145,133 | ) | | | (80,053 | ) | | | (54,261 | ) | |
Class A | | | (3,154 | ) | | | (1,679 | ) | | | (3,738 | ) | | | (1,332 | ) | |
Net realized gains: | |
Class I | | | (3,306,631 | ) | | | — | | | | (352,626 | ) | | | — | | |
Class A | | | (178,445 | ) | | | — | | | | (21,332 | ) | | | — | | |
Net decrease in net assets resulting from dividends and
distributions to shareholders | | | (3,585,698 | ) | | | (146,812 | ) | | | (457,749 | ) | | | (55,593 | ) | |
Capital Share Transactions: | |
Net increase in net assets resulting from capital share transactions | | | 22,646,240 | | | | 561,118 | | | | 1,268,577 | | | | 1,283,358 | | |
Net Assets: | |
Total increase in net assets | | | 22,976,675 | | | | 5,307,915 | | | | 1,589,093 | | | | 2,830,718 | | |
Beginning of year | | | 19,986,034 | | | | 14,678,119 | | | | 8,129,384 | | | | 5,298,666 | | |
End of year | | $ | 42,962,709 | | | $ | 19,986,034 | | | $ | 9,718,477 | | | $ | 8,129,384 | | |
| Undistributed net investment income | | $ | 127,246 | | | $ | 21,347 | | | $ | 50,116 | | | $ | 58,469 | | |
The accompanying notes are an integral part of these financial statements.
59
Statements of Changes in Net Assets
| | | International Value Fund | | Value Opportunities Fund | |
| | | Year ended
June 30, 2018 | | Year ended
June 30, 2017 | | Year ended
June 30, 2018 | | Year ended
June 30, 2017 | |
Operations: | |
Net investment income | | $ | 23,157 | | | $ | 23,306 | | | $ | 7,067,953 | | | $ | 6,228,872 | | |
Net realized gains | | | 154,127 | | | | 89,646 | | | | 60,923,665 | | | | 6,184,052 | | |
Net change in unrealized appreciation (depreciation) | | | (93,077 | ) | | | 366,528 | | | | (273,708 | ) | | | 106,966,426 | | |
Net increase in net assets resulting from operations | | | 84,207 | | | | 479,480 | | | | 67,717,910 | | | | 119,379,350 | | |
Dividends and Distributions to Shareholders: | |
Net investment income: | |
Class I | | | (26,262 | ) | | | (32,331 | ) | | | (7,243,094 | ) | | | (6,518,819 | ) | |
Class A | | | — | | | | — | | | | (1,982,727 | ) | | | (2,482,498 | ) | |
Class C | | | — | | | | — | | | | (451,278 | ) | | | (798,800 | ) | |
Net realized gains: | |
Class I | | | (118,306 | ) | | | (44,837 | ) | | | (5,657,545 | ) | | | — | | |
Class A | | | — | | | | — | | | | (1,813,918 | ) | | | — | | |
Class C | | | — | | | | — | | | | (802,290 | ) | | | — | | |
Net decrease in net assets resulting from dividends and
distributions to shareholders | | | (144,568 | ) | | | (77,168 | ) | | | (17,950,852 | ) | | | (9,800,117 | ) | |
Capital Share Transactions: | |
Net increase (decrease) in net assets resulting from capital share transactions | | | 180,942 | | | | 213,738 | | | | 46,962,687 | | | | (23,105,293 | ) | |
Net Assets: | |
Total increase in net assets | | | 120,581 | | | | 616,050 | | | | 96,729,745 | | | | 86,473,940 | | |
Beginning of year | | | 2,421,970 | | | | 1,805,920 | | | | 542,402,306 | | | | 455,928,366 | | |
End of year | | $ | 2,542,551 | | | $ | 2,421,970 | | | $ | 639,132,051 | | | $ | 542,402,306 | | |
| Undistributed net investment income | | $ | 16,649 | | | $ | 20,262 | | | $ | 1,949,167 | | | $ | 3,893,537 | | |
The accompanying notes are an integral part of these financial statements.
60
Statements of Changes in Net Assets
| | | Capital Income Fund | | High Yield Fund | |
| | | Year ended
June 30, 2018 | | Year ended
June 30, 2017 | | Year ended
June 30, 2018 | | Year ended
June 30, 2017 | |
Operations: | |
Net investment income | | $ | 1,336,013 | | | $ | 1,381,206 | | | $ | 161,067,983 | | | $ | 161,234,213 | | |
Net realized gains (losses) | | | 2,044,789 | | | | 470,954 | | | | (12,551,785 | ) | | | (44,432,801 | ) | |
Net change in unrealized appreciation (depreciation) | | | (963,062 | ) | | | 5,720,311 | | | | (74,138,295 | ) | | | 215,605,410 | | |
Net increase in net assets resulting from operations | | | 2,417,740 | | | | 7,572,471 | | | | 74,377,903 | | | | 332,406,822 | | |
Dividends and Distributions to Shareholders: | |
Net investment income: | |
Class I | | | (790,343 | ) | | | (720,589 | ) | | | (127,191,770 | ) | | | (127,660,818 | ) | |
Class A | | | (660,571 | ) | | | (763,722 | ) | | | (28,374,568 | ) | | | (33,791,394 | ) | |
Class C | | | — | | | | — | | | | (163,724 | ) | | | (160,983 | ) | |
Class Z | | | — | | | | — | | | | (1,893,234 | ) | | | — | | |
Net realized gains: | |
Class I | | | — | | | | — | | | | — | | | | — | | |
Class A | | | — | | | | — | | | | — | | | | — | | |
Class C | | | — | | | | — | | | | — | | | | — | | |
Class Z | | | — | | | | — | | | | — | | | | — | | |
Net decrease in net assets resulting from dividends and
distributions to shareholders | | | (1,450,914 | ) | | | (1,484,311 | ) | | | (157,623,296 | ) | | | (161,613,195 | ) | |
Capital Share Transactions: | |
Net increase (decrease) in net assets resulting from capital share transactions | | | (5,903,933 | ) | | | (2,517,949 | ) | | | 139,753,443 | | | | (303,868 | ) | |
Net Assets: | |
Total increase (decrease) in net assets | | | (4,937,107 | ) | | | 3,570,211 | | | | 56,508,050 | | | | 170,489,759 | | |
Beginning of year | | | 41,752,311 | | | | 38,182,100 | | | | 2,660,920,745 | | | | 2,490,430,986 | | |
End of year | | $ | 36,815,204 | | | $ | 41,752,311 | | | $ | 2,717,428,795 | | | $ | 2,660,920,745 | | |
| Undistributed net investment income (loss) | | $ | (4,358 | ) | | $ | 21,081 | | | $ | 92,301 | | | $ | (1,507,342 | ) | |
The accompanying notes are an integral part of these financial statements.
61
Financial Highlights
The following per share data and ratios have been derived from information provided in the financial statements.
| | | | | Income (loss) from investment operations | | Dividends and distributions | |
Diversified Value Fund | | Net asset
value,
beginning
of year | | Net
investment
income1 | | Net gains
(losses) on
securities
(both
realized and
unrealized) | | Total from
investment
operations | | Dividends
(from net
investment
income) | | Distributions
(from
capital
gains) | | Total
distributions | |
Class I | |
Year ended 6/30/2018 | | $ | 17.43 | | | $ | 0.23 | | | $ | 1.48 | | | $ | 1.71 | | | $ | (0.34 | ) | | $ | — | | | $ | (0.34 | ) | |
Year ended 6/30/2017 | | | 14.31 | | | | 0.19 | | | | 3.77 | | | | 3.96 | | | | (0.84 | ) | | | — | | | | (0.84 | ) | |
Year ended 6/30/2016 | | | 15.89 | | | | 0.22 | | | | (1.59 | ) | | | (1.37 | ) | | | (0.21 | ) | | | — | | | | (0.21 | ) | |
Year ended 6/30/2015 | | | 15.47 | | | | 0.19 | | | | 0.61 | | | | 0.80 | | | | (0.38 | ) | | | — | | | | (0.38 | ) | |
Year ended 6/30/2014 | | | 12.53 | | | | 0.38 | | | | 2.73 | | | | 3.11 | | | | (0.17 | ) | | | — | | | | (0.17 | ) | |
Class A | |
Year ended 6/30/2018 | | | 17.47 | | | | 0.19 | | | | 1.49 | | | | 1.68 | | | | (0.30 | ) | | | — | | | | (0.30 | ) | |
Year ended 6/30/2017 | | | 14.36 | | | | 0.16 | | | | 3.77 | | | | 3.93 | | | | (0.82 | ) | | | — | | | | (0.82 | ) | |
Year ended 6/30/2016 | | | 15.92 | | | | 0.18 | | | | (1.59 | ) | | | (1.41 | ) | | | (0.15 | ) | | | — | | | | (0.15 | ) | |
Year ended 6/30/2015 | | | 15.50 | | | | 0.14 | | | | 0.63 | | | | 0.77 | | | | (0.35 | ) | | | — | | | | (0.35 | ) | |
Year ended 6/30/2014 | | | 12.57 | | | | 0.38 | | | | 2.70 | | | | 3.08 | | | | (0.15 | ) | | | — | | | | (0.15 | ) | |
Class C | |
Year ended 6/30/2018 | | | 17.27 | | | | 0.04 | | | | 1.48 | | | | 1.52 | | | | (0.15 | ) | | | — | | | | (0.15 | ) | |
Year ended 6/30/2017 | | | 14.23 | | | | 0.04 | | | | 3.73 | | | | 3.77 | | | | (0.73 | ) | | | — | | | | (0.73 | ) | |
Year ended 6/30/2016 | | | 15.76 | | | | 0.07 | | | | (1.57 | ) | | | (1.50 | ) | | | (0.03 | ) | | | — | | | | (0.03 | ) | |
Year ended 6/30/2015 | | | 15.20 | | | | 0.03 | | | | 0.62 | | | | 0.65 | | | | (0.09 | ) | | | — | | | | (0.09 | ) | |
Year ended 6/30/2014 | | | 12.35 | | | | 0.17 | | | | 2.75 | | | | 2.92 | | | | (0.07 | ) | | | — | | | | (0.07 | ) | |
| | | | | Ratios to Average Net Assets | |
Diversified Value Fund | | Net asset
value, end
of year | | Total
return2 | | Net assets,
end of
year (in
thousands) | | Expenses,
net of
reimbursement/
waiver | | Expenses,
before
reimbursement/
waiver | | Net
investment
income | |
Class I | |
Year ended 6/30/2018 | | $ | 18.80 | | | | 9.81 | % | | $ | 65,503 | | | | 0.95 | % | | | 1.02 | % | | | 1.25 | % | |
Year ended 6/30/2017 | | | 17.43 | | | | 28.05 | | | | 68,260 | | | | 0.95 | | | | 1.09 | | | | 1.21 | | |
Year ended 6/30/2016 | | | 14.31 | | | | –8.59 | | | | 342,046 | | | | 0.95 | | | | 1.03 | | | | 1.52 | | |
Year ended 6/30/2015 | | | 15.89 | | | | 5.30 | | | | 481,815 | | | | 0.95 | | | | 0.99 | | | | 1.18 | | |
Year ended 6/30/2014 | | | 15.47 | | | | 24.98 | | | | 485,541 | | | | 0.95 | | | | 1.01 | | | | 2.72 | | |
Class A | |
Year ended 6/30/2018 | | | 18.85 | | | | 9.57 | | | | 39,616 | | | | 1.20 | | | | 1.27 | | | | 1.00 | | |
Year ended 6/30/2017 | | | 17.47 | | | | 27.71 | | | | 41,084 | | | | 1.20 | | | | 1.34 | | | | 1.00 | | |
Year ended 6/30/2016 | | | 14.36 | | | | –8.83 | | | | 38,527 | | | | 1.20 | | | | 1.28 | | | | 1.25 | | |
Year ended 6/30/2015 | | | 15.92 | | | | 5.07 | | | | 52,752 | | | | 1.20 | | | | 1.24 | | | | 0.92 | | |
Year ended 6/30/2014 | | | 15.50 | | | | 24.68 | | | | 59,173 | | | | 1.20 | | | | 1.26 | | | | 2.71 | | |
Class C | |
Year ended 6/30/2018 | | | 18.64 | | | | 8.77 | | | | 2,598 | | | | 1.95 | | | | 2.02 | | | | 0.25 | | |
Year ended 6/30/2017 | | | 17.27 | | | | 26.78 | | | | 2,817 | | | | 1.95 | | | | 2.09 | | | | 0.23 | | |
Year ended 6/30/2016 | | | 14.23 | | | | –9.51 | | | | 3,334 | | | | 1.95 | | | | 2.03 | | | | 0.51 | | |
Year ended 6/30/2015 | | | 15.76 | | | | 4.27 | | | | 4,419 | | | | 1.95 | | | | 1.99 | | | | 0.17 | | |
Year ended 6/30/2014 | | | 15.20 | | | | 23.70 | | | | 4,429 | | | | 1.95 | | | | 2.01 | | | | 1.28 | | |
| | | Year Ended June 30, | |
| | | 2018 | | 2017 | | 2016 | | 2015 | | 2014 | |
Portfolio turnover rate | | | 28 | % | | | 25 | % | | | 35 | % | | | 38 | % | | | 33 | % | |
| | | | | Income (loss) from investment operations | | Dividends and distributions | |
Large Cap Value Fund | | Net asset
value,
beginning
of year | | Net
investment
income1 | | Net gains
(losses) on
securities
(both
realized and
unrealized) | | Total from
investment
operations | | Dividends
(from net
investment
income) | | Distributions
(from
capital
gains) | | Total
distributions | |
Class I | |
Year ended 6/30/2018 | | $ | 31.04 | | | $ | 0.42 | | | $ | 2.67 | | | $ | 3.09 | | | $ | (0.56 | ) | | $ | — | | | $ | (0.56 | ) | |
Year ended 6/30/2017 | | | 25.06 | | | | 0.39 | | | | 6.15 | | | | 6.54 | | | | (0.56 | ) | | | — | | | | (0.56 | ) | |
Year ended 6/30/2016 | | | 27.21 | | | | 0.39 | | | | (2.15 | ) | | | (1.76 | ) | | | (0.39 | ) | | | — | | | | (0.39 | ) | |
Year ended 6/30/2015 | | | 26.65 | | | | 0.35 | | | | 0.99 | | | | 1.34 | | | | (0.78 | ) | | | — | | | | (0.78 | ) | |
Year ended 6/30/2014 | | | 21.35 | | | | 0.73 | | | | 4.88 | | | | 5.61 | | | | (0.31 | ) | | | — | | | | (0.31 | ) | |
Class A | |
Year ended 6/30/2018 | | | 30.85 | | | | 0.34 | | | | 2.65 | | | | 2.99 | | | | (0.48 | ) | | | — | | | | (0.48 | ) | |
Year ended 6/30/2017 | | | 24.91 | | | | 0.32 | | | | 6.10 | | | | 6.42 | | | | (0.48 | ) | | | — | | | | (0.48 | ) | |
Year ended 6/30/2016 | | | 27.02 | | | | 0.33 | | | | (2.13 | ) | | | (1.80 | ) | | | (0.31 | ) | | | — | | | | (0.31 | ) | |
Year ended 6/30/2015 | | | 26.46 | | | | 0.27 | | | | 0.99 | | | | 1.26 | | | | (0.70 | ) | | | — | | | | (0.70 | ) | |
Year ended 6/30/2014 | | | 21.21 | | | | 0.73 | | | | 4.79 | | | | 5.52 | | | | (0.27 | ) | | | — | | | | (0.27 | ) | |
Class C | |
Year ended 6/30/2018 | | | 30.16 | | | | 0.08 | | | | 2.61 | | | | 2.69 | | | | (0.17 | ) | | | — | | | | (0.17 | ) | |
Year ended 6/30/2017 | | | 24.29 | | | | 0.10 | | | | 5.94 | | | | 6.04 | | | | (0.17 | ) | | | — | | | | (0.17 | ) | |
Year ended 6/30/2016 | | | 26.30 | | | | 0.13 | | | | (2.06 | ) | | | (1.93 | ) | | | (0.08 | ) | | | — | | | | (0.08 | ) | |
Year ended 6/30/2015 | | | 25.96 | | | | 0.09 | | | | 0.94 | | | | 1.03 | | | | (0.69 | ) | | | — | | | | (0.69 | ) | |
Year ended 6/30/2014 | | | 20.72 | | | | 0.72 | | | | 4.52 | | | | 5.24 | | | | — | | | | — | | | | — | | |
Class R | |
Year ended 6/30/2018 | | | 30.96 | | | | 0.22 | | | | 2.70 | | | | 2.92 | | | | (0.32 | ) | | | — | | | | (0.32 | ) | |
Year ended 6/30/2017 | | | 25.02 | | | | 0.25 | | | | 6.13 | | | | 6.38 | | | | (0.44 | ) | | | — | | | | (0.44 | ) | |
Year ended 6/30/2016 | | | 27.16 | | | | 0.28 | | | | (2.16 | ) | | | (1.88 | ) | | | (0.26 | ) | | | — | | | | (0.26 | ) | |
Year ended 6/30/2015 | | | 26.62 | | | | 0.22 | | | | 0.98 | | | | 1.20 | | | | (0.66 | ) | | | — | | | | (0.66 | ) | |
Year ended 6/30/2014 | | | 21.33 | | | | 0.60 | | | | 4.89 | | | | 5.49 | | | | (0.20 | ) | | | — | | | | (0.20 | ) | |
| | | | | Ratios to Average Net Assets | |
Large Cap Value Fund | | Net asset
value, end
of year | | Total
return2 | | Net assets,
end of
year (in
thousands) | | Expenses,
net of
reimbursement/
waiver | | Expenses,
before
reimbursement/
waiver | | Net
investment
income | |
Class I | |
Year ended 6/30/2018 | | $ | 33.57 | | | | 10.01 | % | | $ | 276,930 | | | | 1.00 | % | | | 1.00 | % | | | 1.28 | % | |
Year ended 6/30/2017 | | | 31.04 | | | | 26.22 | | | | 269,714 | | | | 0.99 | | | | 0.99 | | | | 1.38 | | |
Year ended 6/30/2016 | | | 25.06 | | | | –6.42 | | | | 305,282 | | | | 1.01 | | | | 1.01 | | | | 1.55 | | |
Year ended 6/30/2015 | | | 27.21 | | | | 5.17 | | | | 479,488 | | | | 0.99 | | | | 0.99 | | | | 1.30 | | |
Year ended 6/30/2014 | | | 26.65 | | | | 26.52 | | | | 500,102 | | | | 1.01 | | | | 1.01 | | | | 3.04 | | |
Class A | |
Year ended 6/30/2018 | | | 33.36 | | | | 9.72 | | | | 131,276 | | | | 1.25 | | | | 1.25 | | | | 1.03 | | |
Year ended 6/30/2017 | | | 30.85 | | | | 25.88 | | | | 135,349 | | | | 1.24 | | | | 1.24 | | | | 1.13 | | |
Year ended 6/30/2016 | | | 24.91 | | | | –6.62 | | | | 142,768 | | | | 1.26 | | | | 1.26 | | | | 1.33 | | |
Year ended 6/30/2015 | | | 27.02 | | | | 4.89 | | | | 191,665 | | | | 1.24 | | | | 1.24 | | | | 1.03 | | |
Year ended 6/30/2014 | | | 26.46 | | | | 26.22 | | | | 223,219 | | | | 1.26 | | | | 1.26 | | | | 3.02 | | |
Class C | |
Year ended 6/30/2018 | | | 32.68 | | | | 8.92 | | | | 14,161 | | | | 2.00 | | | | 2.00 | | | | 0.26 | | |
Year ended 6/30/2017 | | | 30.16 | | | | 24.92 | | | | 17,250 | | | | 1.99 | | | | 1.99 | | | | 0.38 | | |
Year ended 6/30/2016 | | | 24.29 | | | | –7.34 | | | | 21,038 | | | | 2.01 | | | | 2.01 | | | | 0.53 | | |
Year ended 6/30/2015 | | | 26.30 | | | | 4.10 | | | | 40,862 | | | | 1.99 | | | | 1.99 | | | | 0.34 | | |
Year ended 6/30/2014 | | | 25.96 | | | | 25.29 | | | | 25,765 | | | | 2.01 | | | | 2.01 | | | | 3.02 | | |
Class R | |
Year ended 6/30/2018 | | | 33.56 | | | | 9.47 | | | | 6,888 | | | | 1.50 | | | | 1.50 | | | | 0.66 | | |
Year ended 6/30/2017 | | | 30.96 | | | | 25.58 | | | | 13,519 | | | | 1.49 | | | | 1.49 | | | | 0.88 | | |
Year ended 6/30/2016 | | | 25.02 | | | | –6.88 | | | | 13,186 | | | | 1.51 | | | | 1.51 | | | | 1.12 | | |
Year ended 6/30/2015 | | | 27.16 | | | | 4.64 | | | | 12,867 | | | | 1.49 | | | | 1.49 | | | | 0.81 | | |
Year ended 6/30/2014 | | | 26.62 | | | | 25.91 | | | | 11,924 | | | | 1.51 | | | | 1.51 | | | | 2.51 | | |
| | | Year Ended June 30, | |
| | | 2018 | | 2017 | | 2016 | | 2015 | | 2014 | |
Portfolio turnover rate | | | 41 | % | | | 27 | % | | | 39 | % | | | 39 | % | | | 57 | % | |
1 Net investment income per share has been calculated based on average shares outstanding during the year.
2 Total returns exclude the effects of sales charges. The Fund's investment advisor may have waived a portion of its advisory fee and/or reimbursed a portion of the Fund's expenses. Without such waiver and/or reimbursement, the Fund's performance would have been lower.
The accompanying notes are an integral part of these financial statements.
62
Financial Highlights
The following per share data and ratios have been derived from information provided in the financial statements.
| | | | | Income (loss) from investment operations | | Dividends and distributions | |
Mid-Cap Value Fund | | Net asset
value,
beginning
of year | | Net
investment
income
(loss)1 | | Net gains
(losses) on
securities
(both
realized and
unrealized) | | Total from
investment
operations | | Dividends
(from net
investment
income) | | Distributions
(from
capital
gains) | | Total
distributions | |
Class I | |
Year ended 6/30/2018 | | $ | 37.13 | | | $ | 0.11 | | | $ | 4.96 | | | $ | 5.07 | | | $ | (0.15 | ) | | $ | (2.37 | ) | | $ | (2.52 | ) | |
Year ended 6/30/2017 | | | 30.55 | | | | 0.10 | | | | 7.05 | | | | 7.15 | | | | (0.11 | ) | | | (0.46 | ) | | | (0.57 | ) | |
Year ended 6/30/2016 | | | 40.43 | | | | 0.25 | | | | (5.54 | ) | | | (5.29 | ) | | | (0.16 | ) | | | (4.43 | ) | | | (4.59 | ) | |
Year ended 6/30/2015 | | | 45.15 | | | | 0.15 | | | | (0.63 | ) | | | (0.48 | ) | | | (0.27 | ) | | | (3.97 | ) | | | (4.24 | ) | |
Year ended 6/30/2014 | | | 35.36 | | | | 0.21 | | | | 9.71 | | | | 9.92 | | | | (0.13 | ) | | | — | | | | (0.13 | ) | |
Class A | |
Year ended 6/30/2018 | | | 36.57 | | | | 0.01 | | | | 4.88 | | | | 4.89 | | | | (0.06 | ) | | | (2.37 | ) | | | (2.43 | ) | |
Year ended 6/30/2017 | | | 30.13 | | | | 0.01 | | | | 6.96 | | | | 6.97 | | | | (0.07 | ) | | | (0.46 | ) | | | (0.53 | ) | |
Year ended 6/30/2016 | | | 39.91 | | | | 0.16 | | | | (5.47 | ) | | | (5.31 | ) | | | (0.04 | ) | | | (4.43 | ) | | | (4.47 | ) | |
Year ended 6/30/2015 | | | 44.60 | | | | 0.04 | | | | (0.61 | ) | | | (0.57 | ) | | | (0.15 | ) | | | (3.97 | ) | | | (4.12 | ) | |
Year ended 6/30/2014 | | | 34.98 | | | | 0.12 | | | | 9.58 | | | | 9.70 | | | | (0.08 | ) | | | — | | | | (0.08 | ) | |
Class C | |
Year ended 6/30/2018 | | | 32.26 | | | | (0.24 | ) | | | 4.28 | | | | 4.04 | | | | — | | | | (2.37 | ) | | | (2.37 | ) | |
Year ended 6/30/2017 | | | 26.78 | | | | (0.23 | ) | | | 6.17 | | | | 5.94 | | | | — | | | | (0.46 | ) | | | (0.46 | ) | |
Year ended 6/30/2016 | | | 36.24 | | | | (0.08 | ) | | | (4.95 | ) | | | (5.03 | ) | | | — | | | | (4.43 | ) | | | (4.43 | ) | |
Year ended 6/30/2015 | | | 41.04 | | | | (0.25 | ) | | | (0.58 | ) | | | (0.83 | ) | | | — | | | | (3.97 | ) | | | (3.97 | ) | |
Year ended 6/30/2014 | | | 32.39 | | | | (0.16 | ) | | | 8.85 | | | | 8.69 | | | | (0.04 | ) | | | — | | | | (0.04 | ) | |
Class R | |
Year ended 6/30/2018 | | | 36.60 | | | | (0.08 | ) | | | 4.88 | | | | 4.80 | | | | (0.01 | ) | | | (2.37 | ) | | | (2.38 | ) | |
Year ended 6/30/2017 | | | 30.21 | | | | (0.08 | ) | | | 6.96 | | | | 6.88 | | | | (0.03 | ) | | | (0.46 | ) | | | (0.49 | ) | |
Year ended 6/30/2016 | | | 40.04 | | | | 0.09 | | | | (5.49 | ) | | | (5.40 | ) | | | — | | | | (4.43 | ) | | | (4.43 | ) | |
Year ended 6/30/2015 | | | 44.77 | | | | (0.07 | ) | | | (0.62 | ) | | | (0.69 | ) | | | (0.07 | ) | | | (3.97 | ) | | | (4.04 | ) | |
Year ended 6/30/2014 | | | 35.17 | | | | 0.02 | | | | 9.63 | | | | 9.65 | | | | (0.05 | ) | | | — | | | | (0.05 | ) | |
| | | | | Ratios to Average Net Assets | |
Mid-Cap Value Fund | | Net asset
value, end
of year | | Total
return2 | | Net assets,
end of
year (in
thousands) | | Expenses,
net of
reimbursement/
waiver | | Expenses,
before
reimbursement/
waiver | | Net
investment
income
(loss) | |
Class I | |
Year ended 6/30/2018 | | $ | 39.68 | | | | 14.32 | % | | $ | 1,609,002 | | | | 0.99 | % | | | 0.99 | % | | | 0.28 | % | |
Year ended 6/30/2017 | | | 37.13 | | | | 23.37 | | | | 1,675,920 | | | | 1.03 | | | | 1.03 | | | | 0.28 | | |
Year ended 6/30/2016 | | | 30.55 | | | | –13.23 | | | | 1,659,480 | | | | 1.02 | | | | 1.02 | | | | 0.75 | | |
Year ended 6/30/2015 | | | 40.43 | | | | –0.70 | | | | 2,492,532 | | | | 1.00 | | | | 1.00 | | | | 0.35 | | |
Year ended 6/30/2014 | | | 45.15 | | | | 28.10 | | | | 2,542,569 | | | | 1.01 | | | | 1.01 | | | | 0.52 | | |
Class A | |
Year ended 6/30/2018 | | | 39.03 | | | | 14.05 | | | | 230,105 | | | | 1.24 | | | | 1.24 | | | | 0.03 | | |
Year ended 6/30/2017 | | | 36.57 | | | | 23.05 | | | | 274,787 | | | | 1.28 | | | | 1.28 | | | | 0.02 | | |
Year ended 6/30/2016 | | | 30.13 | | | | –13.45 | | | | 322,023 | | | | 1.27 | | | | 1.27 | | | | 0.48 | | |
Year ended 6/30/2015 | | | 39.91 | | | | –0.93 | | | | 626,544 | | | | 1.25 | | | | 1.25 | | | | 0.10 | | |
Year ended 6/30/2014 | | | 44.60 | | | | 27.78 | | | | 862,559 | | | | 1.26 | | | | 1.26 | | | | 0.29 | | |
Class C | |
Year ended 6/30/2018 | | | 33.93 | | | | 13.20 | | | | 39,383 | | | | 1.99 | | | | 1.99 | | | | (0.72 | ) | |
Year ended 6/30/2017 | | | 32.26 | | | | 22.13 | | | | 50,612 | | | | 2.03 | | | | 2.03 | | | | (0.74 | ) | |
Year ended 6/30/2016 | | | 26.78 | | | | –14.09 | | | | 64,568 | | | | 2.02 | | | | 2.02 | | | | (0.27 | ) | |
Year ended 6/30/2015 | | | 36.24 | | | | –1.69 | | | | 128,647 | | | | 2.00 | | | | 2.00 | | | | (0.65 | ) | |
Year ended 6/30/2014 | | | 41.04 | | | | 26.84 | | | | 154,222 | | | | 2.01 | | | | 2.01 | | | | (0.45 | ) | |
Class R | |
Year ended 6/30/2018 | | | 39.02 | | | | 13.74 | | | | 6,656 | | | | 1.49 | | | | 1.49 | | | | (0.22 | ) | |
Year ended 6/30/2017 | | | 36.60 | | | | 22.74 | | | | 11,020 | | | | 1.53 | | | | 1.53 | | | | (0.23 | ) | |
Year ended 6/30/2016 | | | 30.21 | | | | –13.64 | | | | 11,471 | | | | 1.52 | | | | 1.52 | | | | 0.26 | | |
Year ended 6/30/2015 | | | 40.04 | | | | –1.21 | | | | 18,683 | | | | 1.50 | | | | 1.50 | | | | (0.16 | ) | |
Year ended 6/30/2014 | | | 44.77 | | | | 27.47 | | | | 24,693 | | | | 1.51 | | | | 1.51 | | | | 0.05 | | |
| | | Year Ended June 30, | |
| | | 2018 | | 2017 | | 2016 | | 2015 | | 2014 | |
Portfolio turnover rate | | | 32 | % | | | 37 | % | | | 42 | % | | | 54 | % | | | 55 | % | |
| | | | | Income (loss) from investment operations | | Dividends and distributions | |
Small Cap Value Fund | | Net asset
value,
beginning
of year | | Net
investment
income
(loss)1 | | Net gains
(losses) on
securities
(both
realized and
unrealized) | | Total from
investment
operations | | Dividends
(from net
investment
income) | | Distributions
(from
capital
gains) | | Total
distributions | |
Class I | |
Year ended 6/30/2018 | | $ | 59.31 | | | $ | 0.29 | | | $ | 7.35 | | | $ | 7.64 | | | $ | (0.28 | ) | | $ | (2.78 | ) | | $ | (3.06 | ) | |
Year ended 6/30/2017 | | | 46.46 | | | | 0.19 | | | | 12.90 | | | | 13.09 | | | | (0.24 | ) | | | — | | | | (0.24 | ) | |
Year ended 6/30/2016 | | | 61.67 | | | | 0.17 | | | | (9.57 | ) | | | (9.40 | ) | | | (0.16 | ) | | | (5.65 | ) | | | (5.81 | ) | |
Year ended 6/30/2015 | | | 66.62 | | | | 0.27 | | | | 2.30 | | | | 2.57 | | | | (0.13 | ) | | | (7.39 | ) | | | (7.52 | ) | |
Year ended 6/30/2014 | | | 54.84 | | | | 0.13 | | | | 16.83 | | | | 16.96 | | | | (0.20 | ) | | | (4.98 | ) | | | (5.18 | ) | |
Class A | |
Year ended 6/30/2018 | | | 58.93 | | | | 0.12 | | | | 7.32 | | | | 7.44 | | | | (0.10 | ) | | | (2.78 | ) | | | (2.88 | ) | |
Year ended 6/30/2017 | | | 46.09 | | | | 0.05 | | | | 12.79 | | | | 12.84 | | | | — | | | | — | | | | — | | |
Year ended 6/30/2016 | | | 61.27 | | | | 0.04 | | | | (9.51 | ) | | | (9.47 | ) | | | (0.06 | ) | | | (5.65 | ) | | | (5.71 | ) | |
Year ended 6/30/2015 | | | 66.26 | | | | 0.12 | | | | 2.28 | | | | 2.40 | | | | — | | | | (7.39 | ) | | | (7.39 | ) | |
Year ended 6/30/2014 | | | 54.67 | | | | (0.02 | ) | | | 16.75 | | | | 16.73 | | | | (0.16 | ) | | | (4.98 | ) | | | (5.14 | ) | |
Class C | |
Year ended 6/30/2018 | | | 49.60 | | | | (0.28 | ) | | | 6.11 | | | | 5.83 | | | | — | | | | (2.78 | ) | | | (2.78 | ) | |
Year ended 6/30/2017 | | | 39.09 | | | | (0.30 | ) | | | 10.81 | | | | 10.51 | | | | — | | | | — | | | | — | | |
Year ended 6/30/2016 | | | 53.25 | | | | (0.30 | ) | | | (8.21 | ) | | | (8.51 | ) | | | — | | | | (5.65 | ) | | | (5.65 | ) | |
Year ended 6/30/2015 | | | 58.99 | | | | (0.32 | ) | | | 1.97 | | | | 1.65 | | | | — | | | | (7.39 | ) | | | (7.39 | ) | |
Year ended 6/30/2014 | | | 49.40 | | | | (0.43 | ) | | | 15.04 | | | | 14.61 | | | | (0.04 | ) | | | (4.98 | ) | | | (5.02 | ) | |
| | | | | Ratios to Average Net Assets | |
Small Cap Value Fund | | Net asset
value, end
of year | | Total
return2 | | Net assets,
end of
year (in
thousands) | | Expenses,
net of
reimbursement/
waiver | | Expenses,
before
reimbursement/
waiver | | Net
investment
income
(loss) | |
Class I | |
Year ended 6/30/2018 | | $ | 63.89 | | | | 13.33 | % | | $ | 715,194 | | | | 1.02 | % | | | 1.02 | % | | | 0.47 | % | |
Year ended 6/30/2017 | | | 59.31 | | | | 28.15 | | | | 669,810 | | | | 1.04 | | | | 1.04 | | | | 0.35 | | |
Year ended 6/30/2016 | | | 46.46 | | | | –15.63 | | | | 699,420 | | | | 1.04 | | | | 1.04 | | | | 0.33 | | |
Year ended 6/30/2015 | | | 61.67 | | | | 4.64 | | | | 951,911 | | | | 1.06 | | | | 1.06 | | | | 0.43 | | |
Year ended 6/30/2014 | | | 66.62 | | | | 32.40 | | | | 785,915 | | | | 0.99 | | | | 0.99 | | | | 0.21 | | |
Class A | |
Year ended 6/30/2018 | | | 63.49 | | | | 13.05 | | | | 70,928 | | | | 1.27 | | | | 1.27 | | | | 0.20 | | |
Year ended 6/30/2017 | | | 58.93 | | | | 27.83 | | | | 89,795 | | | | 1.29 | | | | 1.29 | | | | 0.09 | | |
Year ended 6/30/2016 | | | 46.09 | | | | –15.83 | | | | 113,335 | | | | 1.29 | | | | 1.29 | | | | 0.07 | | |
Year ended 6/30/2015 | | | 61.27 | | | | 4.37 | | | | 194,587 | | | | 1.31 | | | | 1.31 | | | | 0.19 | | |
Year ended 6/30/2014 | | | 66.26 | | | | 32.06 | | | | 204,205 | | | | 1.24 | | | | 1.24 | | | | (0.04 | ) | |
Class C | |
Year ended 6/30/2018 | | | 52.65 | | | | 12.21 | | | | 13,824 | | | | 2.02 | | | | 2.02 | | | | (0.55 | ) | |
Year ended 6/30/2017 | | | 49.60 | | | | 26.85 | | | | 17,084 | | | | 2.04 | | | | 2.04 | | | | (0.66 | ) | |
Year ended 6/30/2016 | | | 39.09 | | | | –16.46 | | | | 20,308 | | | | 2.04 | | | | 2.04 | | | | (0.68 | ) | |
Year ended 6/30/2015 | | | 53.25 | | | | 3.60 | | | | 35,172 | | | | 2.06 | | | | 2.06 | | | | (0.58 | ) | |
Year ended 6/30/2014 | | | 58.99 | | | | 31.09 | | | | 43,161 | | | | 1.99 | | | | 1.99 | | | | (0.79 | ) | |
| | | Year Ended June 30, | |
| | | 2018 | | 2017 | | 2016 | | 2015 | | 2014 | |
Portfolio turnover rate | | | 29 | % | | | 29 | % | | | 45 | % | | | 43 | % | | | 43 | % | |
1 Net investment income (loss) per share has been calculated based on average shares outstanding during the year.
2 Total returns exclude the effects of sales charges. The Fund's investment advisor may have waived a portion of its advisory fee and/or reimbursed a portion of the Fund's expenses. Without such waiver and/or reimbursement, the Fund's performance would have been lower.
The accompanying notes are an integral part of these financial statements.
63
Financial Highlights
The following per share data and ratios have been derived from information provided in the financial statements.
| | | | Income (loss) from investment operations | | Dividends and distributions | |
Small Cap Diversified
Value Fund | | Net asset
value,
beginning
of year | | Net
investment
income1 | | Net gains
(losses) on
securities
(both
realized and
unrealized) | | Total from
investment
operations | | Dividends
(from net
investment
income) | | Distributions
(from
capital
gains) | | Total
distributions | |
Class I | |
Year ended 6/30/2018 | | $ | 12.06 | | | $ | 0.10 | | | $ | 1.85 | | | $ | 1.95 | | | $ | (0.05 | ) | | $ | (1.75 | ) | | $ | (1.80 | ) | |
Year ended 6/30/2017 | | | 9.12 | | | | 0.09 | | | | 2.94 | | | | 3.03 | | | | (0.09 | ) | | | — | | | | (0.09 | ) | |
Year ended 6/30/2016 | | | 10.01 | | | | 0.06 | | | | (0.66 | ) | | | (0.60 | ) | | | (0.04 | ) | | | (0.25 | ) | | | (0.29 | ) | |
Year from
6/30/20143 to
6/30/2015 | | | 10.00 | | | | 0.05 | | | | 0.22 | | | | 0.27 | | | | (0.04 | ) | | | (0.22 | ) | | | (0.26 | ) | |
Class A | |
Year ended 6/30/2018 | | | 12.01 | | | | 0.07 | | | | 1.84 | | | | 1.91 | | | | (0.03 | ) | | | (1.75 | ) | | | (1.78 | ) | |
Year ended 6/30/2017 | | | 9.09 | | | | 0.06 | | | | 2.93 | | | | 2.99 | | | | (0.07 | ) | | | — | | | | (0.07 | ) | |
Year ended 6/30/2016 | | | 10.00 | | | | 0.05 | | | | (0.68 | ) | | | (0.63 | ) | | | (0.03 | ) | | | (0.25 | ) | | | (0.28 | ) | |
Year from
6/30/20143 to
6/30/2015 | | | 10.00 | | | | 0.03 | | | | 0.22 | | | | 0.25 | | | | (0.03 | ) | | | (0.22 | ) | | | (0.25 | ) | |
| | | | | Ratios to Average Net Assets | |
Small Cap Diversified
Value Fund | | Net asset
value, end
of year | | Total
return2 | | Net assets,
end of
year (in
thousands) | | Expenses,
net of
reimbursement/
waiver | | Expenses,
before
reimbursement/
waiver | | Net
investment
income | |
Class I | |
Year ended 6/30/2018 | | $ | 12.21 | | | | 17.48 | % | | $ | 40,128 | | | | 0.90 | % | | | 1.45 | % | | | 0.80 | % | |
Year ended 6/30/2017 | | | 12.06 | | | | 33.26 | | | | 19,265 | | | | 0.90 | | | | 1.70 | | | | 0.86 | | |
Year ended 6/30/2016 | | | 9.12 | | | | –5.80 | | | | 14,446 | | | | 1.25 | | | | 2.13 | | | | 0.72 | | |
Year from
6/30/20143 to
6/30/2015 | | | 10.01 | | | | 2.93 | | | | 15,337 | | | | 1.25 | | | | 3.75 | | | | 0.48 | | |
Class A | |
Year ended 6/30/2018 | | | 12.14 | | | | 17.18 | | | | 2,835 | | | | 1.15 | | | | 1.70 | | | | 0.58 | | |
Year ended 6/30/2017 | | | 12.01 | | | | 32.86 | | | | 721 | | | | 1.15 | | | | 1.89 | | | | 0.55 | | |
Year ended 6/30/2016 | | | 9.09 | | | | –6.14 | | | | 232 | | | | 1.50 | | | | 2.38 | | | | 0.53 | | |
Year from
6/30/20143 to
6/30/2015 | | | 10.00 | | | | 2.71 | | | | 130 | | | | 1.50 | | | | 4.25 | | | | 0.29 | | |
| | | Year Ended June 30, | |
| | | 2018 | | 2017 | | 2016 | | 2015 | |
Portfolio turnover rate | | | 95 | % | | | 58 | % | | | 89 | % | | | 40 | % | |
| | | | | Income (loss) from investment operations | | Dividends and distributions | |
Global Value Fund | | Net asset
value,
beginning
of period | | Net
investment
income1 | | Net gains
(losses) on
securities
(both
realized and
unrealized) | | Total from
investment
operations | | Dividends
(from net
investment
income) | | Distributions
(from
capital
gains) | | Total
distributions | |
Class I | |
Year ended 6/30/2018 | | $ | 12.82 | | | $ | 0.11 | | | $ | 1.09 | | | $ | 1.20 | | | $ | (0.13 | ) | | $ | (0.59 | ) | | $ | (0.72 | ) | |
Year ended 6/30/2017 | | | 10.10 | | | | 0.12 | | | | 2.70 | | | | 2.82 | | | | (0.10 | ) | | | — | | | | (0.10 | ) | |
Year ended 6/30/2016 | | | 11.93 | | | | 0.13 | | | | (1.23 | ) | | | (1.10 | ) | | | (0.12 | ) | | | (0.61 | ) | | | (0.73 | ) | |
Year ended 6/30/2015 | | | 13.31 | | | | 0.14 | | | | (0.46 | ) | | | (0.32 | ) | | | (0.30 | ) | | | (0.76 | ) | | | (1.06 | ) | |
Year ended 6/30/2014 | | | 11.49 | | | | 0.41 | | | | 2.45 | | | | 2.86 | | | | (0.17 | ) | | | (0.87 | ) | | | (1.04 | ) | |
Class A | |
Year ended 6/30/2018 | | | 12.80 | | | | 0.07 | | | | 1.10 | | | | 1.17 | | | | (0.10 | ) | | | (0.59 | ) | | | (0.69 | ) | |
Year ended 6/30/2017 | | | 10.09 | | | | 0.14 | | | | 2.65 | | | | 2.79 | | | | (0.08 | ) | | | — | | | | (0.08 | ) | |
Year ended 6/30/2016 | | | 11.91 | | | | 0.10 | | | | (1.23 | ) | | | (1.13 | ) | | | (0.08 | ) | | | (0.61 | ) | | | (0.69 | ) | |
Year ended 6/30/2015 | | | 13.29 | | | | 0.10 | | | | (0.45 | ) | | | (0.35 | ) | | | (0.27 | ) | | | (0.76 | ) | | | (1.03 | ) | |
Period from
8/30/20133 to
6/30/2014 | | | 11.85 | | | | 0.34 | | | | 2.13 | | | | 2.47 | | | | (0.16 | ) | | | (0.87 | ) | | | (1.03 | ) | |
| | | | | Ratios to Average Net Assets | |
Global Value Fund | | Net asset
value, end
of period | | Total
return2 | | Net assets,
end of
period (in
thousands) | | Expenses,
net of
reimbursement/
waiver | | Expenses,
before
reimbursement/
waiver | | Net
investment
income | |
Class I | |
Year ended 6/30/2018 | | $ | 13.30 | | | | 9.59 | % | | $ | 8,987 | | | | 1.10 | % | | | 2.87 | % | | | 0.83 | % | |
Year ended 6/30/2017 | | | 12.82 | | | | 27.93 | | | | 7,694 | | | | 1.10 | | | | 3.37 | | | | 1.00 | | |
Year ended 6/30/2016 | | | 10.10 | | | | –9.25 | | | | 5,199 | | | | 1.10 | | | | 4.14 | | | | 1.25 | | |
Year ended 6/30/2015 | | | 11.93 | | | | –1.98 | | | | 6,144 | | | | 1.10 | | | | 4.34 | | | | 1.11 | | |
Year ended 6/30/2014 | | | 13.31 | | | | 25.98 | | | | 3,867 | | | | 1.10 | | | | 6.26 | | | | 3.29 | | |
Class A | |
Year ended 6/30/2018 | | | 13.28 | | | | 9.36 | | | | 732 | | | | 1.35 | | | | 3.12 | | | | 0.55 | | |
Year ended 6/30/2017 | | | 12.80 | | | | 27.69 | | | | 436 | | | | 1.35 | | | | 3.37 | | | | 1.19 | | |
Year ended 6/30/2016 | | | 10.09 | | | | –9.47 | | | | 100 | | | | 1.35 | | | | 4.39 | | | | 0.96 | | |
Year ended 6/30/2015 | | | 11.91 | | | | –2.22 | | | | 110 | | | | 1.35 | | | | 4.77 | | | | 0.79 | | |
Period from
8/30/20133 to
6/30/2014 | | | 13.29 | | | | 21.88 | | | | 137 | | | | 1.354 | | | | 6.584 | | | | 3.214 | | |
| | | Year Ended June 30, | |
| | | 2018 | | 2017 | | 2016 | | 2015 | | 2014 | |
Portfolio turnover rate | | | 43 | % | | | 38 | % | | | 52 | % | | | 42 | % | | | 52 | % | |
1 Net investment income per share has been calculated based on average shares outstanding during the period.
2 Total returns exclude the effects of sales charges. The Fund's investment advisor may have waived a portion of its advisory fee and/or reimbursed a portion of the Fund's expenses. Without such waiver and/or reimbursement, the Fund's performance would have been lower. Returns for periods less than one year are not annualized.
3 Commencement of operations.
4 Annualized.
The accompanying notes are an integral part of these financial statements.
64
Financial Highlights
The following per share data and ratios have been derived from information provided in the financial statements.
| | | | | Income (loss) from investment operations | | Dividends and distributions | |
International
Value Fund | | Net asset
value,
beginning
of period | | Net
investment
income1 | | Net gains
(losses) on
securities
(both
realized and
unrealized) | | Total from
investment
operations | | Dividends
(from net
investment
income) | | Distributions
(from
capital
gains) | | Total
distributions | |
Class I | |
Year ended 6/30/2018 | | $ | 11.85 | | | $ | 0.11 | | | $ | 0.31 | | | $ | 0.42 | | | $ | (0.13 | ) | | $ | (0.57 | ) | | $ | (0.70 | ) | |
Year ended 6/30/2017 | | | 9.76 | | | | 0.12 | | | | 2.38 | | | | 2.50 | | | | (0.17 | ) | | | (0.24 | ) | | | (0.41 | ) | |
Period from
12/31/20153 to
6/30/2016 | | | 10.00 | | | | 0.16 | | | | (0.40 | ) | | | (0.24 | ) | | | — | | | | — | | | | — | | |
| | | | | Ratios to Average Net Assets | |
International
Value Fund | | Net asset
value, end
of period | | Total
return2 | | Net assets,
end of
period (in
thousands) | | Expenses,
net of
reimbursement/
waiver | | Expenses,
before
reimbursement/
waiver | | Net
investment
income | |
Class I | |
Year ended 6/30/2018 | | $ | 11.57 | | | | 3.50 | % | | $ | 2,543 | | | | 1.15 | % | | | 6.01 | % | | | 0.90 | % | |
Year ended 6/30/2017 | | | 11.85 | | | | 26.14 | | | | 2,422 | | | | 1.15 | | | | 7.36 | | | | 1.12 | | |
Period from
12/31/20153 to
6/30/2016 | | | 9.76 | | | | –2.40 | | | | 1,806 | | | | 1.154 | | | | 12.674 | | | | 3.174 | | |
| | | Year Ended June 30, | | Period December 31, 20153 | |
| | | 2018 | | 2017 | | through June 30, 2016 | |
Portfolio turnover rate | | | 33 | % | | | 34 | % | | | 17 | % | |
| | | | | Income (loss) from investment operations | | Dividends and distributions | |
Value Opportunities
Fund | | Net asset
value,
beginning
of year | | Net
investment
income1 | | Net gains
(losses) on
securities
(both
realized and
unrealized) | | Total from
investment
operations | | Dividends
(from net
investment
income) | | Distributions
(from
capital
gains) | | Total
distributions | |
Class I | |
Year ended 6/30/2018 | | $ | 27.99 | | | $ | 0.40 | | | $ | 2.93 | | | $ | 3.33 | | | $ | (0.53 | ) | | $ | (0.41 | ) | | $ | (0.94 | ) | |
Year ended 6/30/2017 | | | 22.21 | | | | 0.38 | | | | 5.99 | | | | 6.37 | | | | (0.59 | ) | | | — | | | | (0.59 | ) | |
Year ended 6/30/2016 | | | 29.13 | | | | 0.69 | | | | (3.68 | ) | | | (2.99 | ) | | | (0.49 | ) | | | (3.44 | ) | | | (3.93 | ) | |
Year ended 6/30/2015 | | | 29.88 | | | | 0.41 | | | | 1.35 | | | | 1.76 | | | | (0.42 | ) | | | (2.09 | ) | | | (2.51 | ) | |
Year ended 6/30/2014 | | | 25.46 | | | | 0.35 | | | | 5.91 | | | | 6.26 | | | | (0.23 | ) | | | (1.61 | ) | | | (1.84 | ) | |
Class A | |
Year ended 6/30/2018 | | | 28.00 | | | | 0.31 | | | | 2.95 | | | | 3.26 | | | | (0.45 | ) | | | (0.41 | ) | | | (0.86 | ) | |
Year ended 6/30/2017 | | | 22.21 | | | | 0.31 | | | | 5.99 | | | | 6.30 | | | | (0.51 | ) | | | — | | | | (0.51 | ) | |
Year ended 6/30/2016 | | | 29.13 | | | | 0.63 | | | | (3.69 | ) | | | (3.06 | ) | | | (0.42 | ) | | | (3.44 | ) | | | (3.86 | ) | |
Year ended 6/30/2015 | | | 29.88 | | | | 0.34 | | | | 1.36 | | | | 1.70 | | | | (0.36 | ) | | | (2.09 | ) | | | (2.45 | ) | |
Year ended 6/30/2014 | | | 25.48 | | | | 0.25 | | | | 5.94 | | | | 6.19 | | | | (0.18 | ) | | | (1.61 | ) | | | (1.79 | ) | |
Class C | |
Year ended 6/30/2018 | | | 26.04 | | | | 0.08 | | | | 2.74 | | | | 2.82 | | | | (0.23 | ) | | | (0.41 | ) | | | (0.64 | ) | |
Year ended 6/30/2017 | | | 20.68 | | | | 0.11 | | | | 5.57 | | | | 5.68 | | | | (0.32 | ) | | | — | | | | (0.32 | ) | |
Year ended 6/30/2016 | | | 27.41 | | | | 0.42 | | | | (3.47 | ) | | | (3.05 | ) | | | (0.24 | ) | | | (3.44 | ) | | | (3.68 | ) | |
Year ended 6/30/2015 | | | 28.31 | | | | 0.12 | | | | 1.27 | | | | 1.39 | | | | (0.20 | ) | | | (2.09 | ) | | | (2.29 | ) | |
Year ended 6/30/2014 | | | 24.28 | | | | 0.04 | | | | 5.65 | | | | 5.69 | | | | (0.05 | ) | | | (1.61 | ) | | | (1.66 | ) | |
| | | | | Ratios to Average Net Assets | |
Value Opportunities
Fund | | Net asset
value, end
of year | | Total
return2 | | Net assets,
end of
year (in
thousands) | | Expenses,
net of
reimbursement/
waiver | | Expenses,
before
reimbursement/
waiver | | Net
investment
income | |
Class I | |
Year ended 6/30/2018 | | $ | 30.38 | | | | 12.11 | % | | $ | 453,184 | | | | 0.97 | % | | | 0.97 | % | | | 1.36 | % | |
Year ended 6/30/2017 | | | 27.99 | | | | 28.79 | | | | 347,924 | | | | 0.99 | | | | 0.99 | | | | 1.46 | | |
Year ended 6/30/2016 | | | 22.21 | | | | –10.48 | | | | 259,421 | | | | 1.00 | | | | 1.00 | | | | 2.80 | | |
Year ended 6/30/2015 | | | 29.13 | | | | 6.75 | | | | 363,363 | | | | 0.96 | | | | 0.96 | | | | 1.42 | | |
Year ended 6/30/2014 | | | 29.88 | | | | 25.67 | | | | 265,138 | | | | 0.99 | | | | 0.99 | | | | 1.25 | | |
Class A | |
Year ended 6/30/2018 | | | 30.40 | | | | 11.84 | | | | 136,325 | | | | 1.22 | | | | 1.22 | | | | 1.07 | | |
Year ended 6/30/2017 | | | 28.00 | | | | 28.47 | | | | 136,525 | | | | 1.24 | | | | 1.24 | | | | 1.21 | | |
Year ended 6/30/2016 | | | 22.21 | | | | –10.71 | | | | 132,870 | | | | 1.25 | | | | 1.25 | | | | 2.55 | | |
Year ended 6/30/2015 | | | 29.13 | | | | 6.47 | | | | 201,477 | | | | 1.21 | | | | 1.21 | | | | 1.19 | | |
Year ended 6/30/2014 | | | 29.88 | | | | 25.34 | | | | 165,608 | | | | 1.24 | | | | 1.24 | | | | 0.91 | | |
Class C | |
Year ended 6/30/2018 | | | 28.22 | | | | 10.99 | | | | 49,624 | | | | 1.97 | | | | 1.97 | | | | 0.30 | | |
Year ended 6/30/2017 | | | 26.04 | | | | 27.53 | | | | 57,953 | | | | 1.99 | | | | 1.99 | | | | 0.46 | | |
Year ended 6/30/2016 | | | 20.68 | | | | –11.37 | | | | 63,637 | | | | 2.00 | | | | 2.00 | | | | 1.84 | | |
Year ended 6/30/2015 | | | 27.41 | | | | 5.65 | | | | 76,647 | | | | 1.96 | | | | 1.96 | | | | 0.43 | | |
Year ended 6/30/2014 | | | 28.31 | | | | 24.44 | | | | 52,042 | | | | 1.99 | | | | 1.99 | | | | 0.17 | | |
| | | Year Ended June 30, | |
| | | 2018 | | 2017 | | 2016 | | 2015 | | 2014 | |
Portfolio turnover rate | | | 55 | % | | | 83 | % | | | 62 | % | | | 101 | % | | | 45 | % | |
1 Net investment income per share has been calculated based on average shares outstanding during the period.
2 Total returns exclude the effects of sales charges. The Fund's investment advisor may have waived a portion of its advisory fee and/or reimbursed a portion of the Fund's expenses. Without such waiver and/or reimbursement, the Fund's performance would have been lower. Returns for periods less than one year are not annualized.
3 Commencement of operations.
4 Annualized.
The accompanying notes are an integral part of these financial statements.
65
Financial Highlights
The following per share data and ratios have been derived from information provided in the financial statements.
| | | | | Income (loss) from investment operations | | Dividends and distributions | |
Capital Income Fund | | Net asset
value,
beginning
of year | | Net
investment
income1 | | Net gains
(losses) on
securities
(both
realized and
unrealized) | | Total from
investment
operations | | Dividends
(from net
investment
income) | | Distributions
(from
capital
gains) | | Total
distributions | |
Class I | |
Year ended 6/30/2018 | | $ | 12.51 | | | $ | 0.45 | | | $ | 0.37 | | | $ | 0.82 | | | $ | (0.49 | ) | | $ | — | | | $ | (0.49 | ) | |
Year ended 6/30/2017 | | | 10.56 | | | | 0.45 | | | | 2.00 | | | | 2.45 | | | | (0.50 | ) | | | — | | | | (0.50 | ) | |
Year ended 6/30/2016 | | | 12.22 | | | | 0.51 | | | | (1.13 | ) | | | (0.62 | ) | | | (0.54 | ) | | | (0.50 | ) | | | (1.04 | ) | |
Year ended 6/30/2015 | | | 12.85 | | | | 0.47 | | | | (0.38 | ) | | | 0.09 | | | | (0.52 | ) | | | (0.20 | ) | | | (0.72 | ) | |
Year ended 6/30/2014 | | | 11.83 | | | | 0.57 | | | | 1.64 | | | | 2.21 | | | | (0.51 | ) | | | (0.68 | ) | | | (1.19 | ) | |
Class A | |
Year ended 6/30/2018 | | | 13.01 | | | | 0.43 | | | | 0.38 | | | | 0.81 | | | | (0.46 | ) | | | — | | | | (0.46 | ) | |
Year ended 6/30/2017 | | | 10.97 | | | | 0.44 | | | | 2.07 | | | | 2.51 | | | | (0.47 | ) | | | — | | | | (0.47 | ) | |
Year ended 6/30/2016 | | | 12.65 | | | | 0.50 | | | | (1.17 | ) | | | (0.67 | ) | | | (0.51 | ) | | | (0.50 | ) | | | (1.01 | ) | |
Year ended 6/30/2015 | | | 13.24 | | | | 0.44 | | | | (0.35 | ) | | | 0.09 | | | | (0.48 | ) | | | (0.20 | ) | | | (0.68 | ) | |
Year ended 6/30/2014 | | | 12.18 | | | | 0.61 | | | | 1.61 | | | | 2.22 | | | | (0.48 | ) | | | (0.68 | ) | | | (1.16 | ) | |
| | | | | Ratios to Average Net Assets | |
Capital Income Fund | | Net asset
value, end
of year | | Total
return2 | | Net assets,
end of
year (in
thousands) | | Expenses,
net of
reimbursement/
waiver | | Expenses,
before
reimbursement/
waiver | | Net
investment
income | |
Class I | |
Year ended 6/30/2018 | | $ | 12.84 | | | | 6.71 | % | | $ | 20,005 | | | | 0.80 | % | | | 1.26 | % | | | 3.55 | % | |
Year ended 6/30/2017 | | | 12.51 | | | | 23.54 | | | | 20,582 | | | | 0.80 | | | | 1.27 | | | | 3.83 | | |
Year ended 6/30/2016 | | | 10.56 | | | | –4.77 | | | | 20,873 | | | | 0.80 | | | | 1.18 | | | | 4.63 | | |
Year ended 6/30/2015 | | | 12.22 | | | | 0.69 | | | | 33,958 | | | | 0.80 | | | | 1.05 | | | | 3.75 | | |
Year ended 6/30/2014 | | | 12.85 | | | | 19.71 | | | | 21,399 | | | | 0.80 | | | | 1.34 | | | | 4.61 | | |
Class A | |
Year ended 6/30/2018 | | | 13.36 | | | | 6.34 | | | | 16,810 | | | | 1.05 | | | | 1.51 | | | | 3.28 | | |
Year ended 6/30/2017 | | | 13.01 | | | | 23.17 | | | | 21,171 | | | | 1.05 | | | | 1.52 | | | | 3.56 | | |
Year ended 6/30/2016 | | | 10.97 | | | | –4.99 | | | | 17,309 | | | | 1.05 | | | | 1.43 | | | | 4.36 | | |
Year ended 6/30/2015 | | | 12.65 | | | | 0.73 | | | | 42,398 | | | | 1.05 | | | | 1.30 | | | | 3.39 | | |
Year ended 6/30/2014 | | | 13.24 | | | | 19.17 | | | | 47,872 | | | | 1.05 | | | | 1.51 | | | | 4.76 | | |
| | | Year Ended June 30, | |
| | | 2018 | | 2017 | | 2016 | | 2015 | | 2014 | |
Portfolio turnover rate | | | 46 | % | | | 71 | % | | | 93 | % | | | 62 | % | | | 53 | % | |
| | | | | Income (loss) from investment operations | | Dividends and distributions | |
High Yield Fund | | Net asset
value,
beginning
of period | | Net
investment
income1 | | Net gains
(losses) on
securities
(both
realized and
unrealized) | | Total from
investment
operations | | Dividends
(from net
investment
income) | | Distributions
(from
capital
gains) | | Total
distributions | |
Class I | |
Year ended 6/30/2018 | | $ | 12.26 | | | $ | 0.72 | | | $ | (0.37 | )3 | | $ | 0.35 | | | $ | (0.71 | ) | | $ | — | | | $ | (0.71 | ) | |
Year ended 6/30/2017 | | | 11.47 | | | | 0.75 | | | | 0.793 | | | | 1.54 | | | | (0.75 | ) | | | — | | | | (0.75 | ) | |
Year ended 6/30/2016 | | | 12.51 | | | | 0.76 | | | | (0.94 | )3 | | | (0.18 | ) | | | (0.77 | ) | | | (0.09 | ) | | | (0.86 | ) | |
Year ended 6/30/2015 | | | 13.37 | | | | 0.70 | | | | (0.75 | )3 | | | (0.05 | ) | | | (0.71 | ) | | | (0.10 | ) | | | (0.81 | ) | |
Year ended 6/30/2014 | | | 12.83 | | | | 0.76 | | | | 0.67 | | | | 1.43 | | | | (0.76 | ) | | | (0.13 | ) | | | (0.89 | ) | |
Class A | |
Year ended 6/30/2018 | | | 12.18 | | | | 0.69 | | | | (0.37 | )4 | | | 0.32 | | | | (0.67 | ) | | | — | | | | (0.67 | ) | |
Year ended 6/30/2017 | | | 11.40 | | | | 0.72 | | | | 0.783 | | | | 1.50 | | | | (0.72 | ) | | | — | | | | (0.72 | ) | |
Year ended 6/30/2016 | | | 12.43 | | | | 0.73 | | | | (0.94 | )3 | | | (0.21 | ) | | | (0.73 | ) | | | (0.09 | ) | | | (0.82 | ) | |
Year ended 6/30/2015 | | | 13.29 | | | | 0.67 | | | | (0.75 | )4 | | | (0.08 | ) | | | (0.68 | ) | | | (0.10 | ) | | | (0.78 | ) | |
Year ended 6/30/2014 | | | 12.75 | | | | 0.73 | | | | 0.66 | | | | 1.39 | | | | (0.72 | ) | | | (0.13 | ) | | | (0.85 | ) | |
Class C | |
Year ended 6/30/2018 | | | 12.26 | | | | 0.60 | | | | (0.38 | )3 | | | 0.22 | | | | (0.59 | ) | | | — | | | | (0.59 | ) | |
Year ended 6/30/2017 | | | 11.47 | | | | 0.63 | | | | 0.793 | | | | 1.42 | | | | (0.63 | ) | | | — | | | | (0.63 | ) | |
Year ended 6/30/2016 | | | 12.50 | | | | 0.65 | | | | (0.94 | )5 | | | (0.29 | ) | | | (0.65 | ) | | | (0.09 | ) | | | (0.74 | ) | |
Year ended 6/30/2015 | | | 13.36 | | | | 0.58 | | | | (0.76 | )3 | | | (0.18 | ) | | | (0.58 | ) | | | (0.10 | ) | | | (0.68 | ) | |
Year ended 6/30/2014 | | | 12.82 | | | | 0.62 | | | | 0.68 | | | | 1.30 | | | | (0.63 | ) | | | (0.13 | ) | | | (0.76 | ) | |
Class Z | |
Period from
3/29/20186 to
6/30/2018 | | | 12.00 | | | | 0.18 | | | | (0.11 | ) | | | 0.07 | | | | (0.17 | ) | | | — | | | | (0.17 | ) | |
| | | | | Ratios to Average Net Assets | |
High Yield Fund | | Net asset
value, end
of period | | Total
return2 | | Net assets,
end of
period (in
thousands) | | Expenses,
net of
reimbursement/
waiver | | Expenses,
before
reimbursement/
waiver | | Net
investment
income | |
Class I | |
Year ended 6/30/2018 | | $ | 11.90 | | | | 2.87 | % | | $ | 1,918,320 | | | | 0.70 | % | | | 0.74 | % | | | 5.93 | % | |
Year ended 6/30/2017 | | | 12.26 | | | | 13.75 | | | | 2,091,104 | | | | 0.70 | | | | 0.74 | | | | 6.22 | | |
Year ended 6/30/2016 | | | 11.47 | | | | –1.12 | | | | 1,884,613 | | | | 0.70 | | | | 0.74 | | | | 6.59 | | |
Year ended 6/30/2015 | | | 12.51 | | | | –0.26 | | | | 2,060,504 | | | | 0.70 | | | | 0.73 | | | | 5.56 | | |
Year ended 6/30/2014 | | | 13.37 | | | | 11.51 | | | | 1,127,080 | | | | 0.70 | | | | 0.75 | | | | 5.82 | | |
Class A | |
Year ended 6/30/2018 | | | 11.83 | | | | 2.68 | | | | 466,960 | | | | 0.95 | | | | 0.99 | | | | 5.69 | | |
Year ended 6/30/2017 | | | 12.18 | | | | 13.42 | | | | 566,806 | | | | 0.95 | | | | 0.99 | | | | 5.99 | | |
Year ended 6/30/2016 | | | 11.40 | | | | –1.34 | | | | 603,081 | | | | 0.95 | | | | 0.99 | | | | 6.35 | | |
Year ended 6/30/2015 | | | 12.43 | | | | –0.54 | | | | 682,129 | | | | 0.95 | | | | 0.98 | | | | 5.31 | | |
Year ended 6/30/2014 | | | 13.29 | | | | 11.28 | | | | 607,104 | | | | 0.95 | | | | 1.00 | | | | 5.59 | | |
Class C | |
Year ended 6/30/2018 | | | 11.89 | | | | 1.76 | | | | 3,380 | | | | 1.70 | | | | 1.74 | | | | 4.93 | | |
Year ended 6/30/2017 | | | 12.26 | | | | 12.62 | | | | 3,010 | | | | 1.70 | | | | 1.74 | | | | 5.22 | | |
Year ended 6/30/2016 | | | 11.47 | | | | –2.02 | | | | 2,737 | | | | 1.70 | | | | 1.74 | | | | 5.61 | | |
Year ended 6/30/2015 | | | 12.50 | | | | –1.25 | | | | 3,581 | | | | 1.70 | | | | 1.73 | | | | 4.53 | | |
Year ended 6/30/2014 | | | 13.36 | | | | 10.40 | | | | 3,623 | | | | 1.70 | | | | 1.75 | | | | 4.72 | | |
Class Z | |
Period from
3/29/20186 to
6/30/2018 | | | 11.90 | | | | 0.59 | | | | 328,769 | | | | 0.607 | | | | 0.707 | | | | 6.547 | | |
| | | Year Ended June 30, | |
| | | 2018 | | 2017 | | 2016 | | 2015 | | 2014 | |
Portfolio turnover rate | | | 38 | % | | | 46 | % | | | 45 | % | | | 44 | % | | | 51 | % | |
1 Net investment income per share has been calculated based on average shares outstanding during the period.
2 Total returns exclude the effects of sales charges. The Fund's investment advisor may have waived a portion of its advisory fee and/or reimbursed a portion of the Fund's expenses. Without such waiver and/or reimbursement, the Fund's performance would have been lower. Returns for periods less than one year are not annualized.
3 Redemption fees per share were less than $0.005.
4 Includes redemption fees per share of $0.01.
5 Includes redemption fees per share of $0.02.
6 Commencement of operations.
7 Annualized.
The accompanying notes are an integral part of these financial statements.
66
Notes to the Financial Statements
JUNE 30, 2018
NOTE 1.
Organization. Hotchkis & Wiley Funds (the "Trust") is registered under the Investment Company Act of 1940, as amended (the "1940 Act"), as an open-end, management investment company. The Trust was organized as a Delaware statutory trust on July 23, 2001 and consists of ten series. The Hotchkis & Wiley Diversified Value Fund, the Hotchkis & Wiley Large Cap Value Fund, the Hotchkis & Wiley Mid-Cap Value Fund, the Hotchkis & Wiley Small Cap Value Fund, the Hotchkis & Wiley Small Cap Diversified Value Fund, the Hotchkis & Wiley Global Value Fund, the Hotchkis & Wiley International Value Fund, the Hotchkis & Wiley Capital Income Fund and the Hotchkis & Wiley High Yield Fund (collectively, the "H&W Funds") are each a diversified series and the Hotchkis & Wiley Value Opportunities Fund (together with the H&W Funds, hereafter referred to as the "Funds") is a non-diversified series of the Trust. The Trust was organized to acquire the assets and liabilities of the Mercury HW Large Cap Value Fund, the Mercury HW Mid-Cap Value Fund and the Mercury HW Small Cap Value Fund (the "Mercury HW Funds"). On February 4, 2002, the Mercury HW Funds were reorganized into the Trust through a non-taxable exchange. On August 28, 2009, the Hotchkis & Wiley Core Value Fund was renamed the Hotchkis & Wiley Diversified Value Fund and the Hotchkis & Wiley All Cap Value Fund was renamed the Hotchkis & Wiley Value Opportunities Fund.
The Large Cap Value Fund and Mid-Cap Value Fund have five classes of shares: Class I, Class A, Class C, Class R and Class T. The Diversified Value Fund, Small Cap Value Fund, Small Cap Diversified Value Fund, Global Value Fund, International Value Fund, Value Opportunities Fund and Capital Income Fund have four classes of shares: Class I, Class A, Class C and Class T. The High Yield Fund has five classes of shares: Class I, Class A, Class C, Class T and Class Z. Class A and Class T shares are sold with a front-end sales charge. Class C shares may be subject to a contingent deferred sales charge. Class C shares are automatically converted to Class A shares approximately eight years after purchase and will then be subject to lower distribution and service fees. All classes of shares have identical voting, dividend, liquidation and other rights and the same terms and conditions, except that Class A, Class C, Class R and Class T shares bear certain expenses related to the distribution and servicing expenditures. Currently, the Small Cap Diversified Value Fund, Global Value Fund and Capital Income Fund are not offering Class C shares to investors, the International Value Fund is not offering Class A or Class C shares to investors and the Funds are not offering Class T shares to investors.
Significant Accounting Policies. The Funds' financial statements have been prepared in conformity with accounting principles generally accepted in the United States of America ("U.S. GAAP"), which may require the use of management accruals and estimates. Actual results could differ from those estimates and those differences could be significant. Each Fund is an investment company and accordingly follows the investment company accounting and reporting guidance of the Financial Accounting Standards Board ("FASB") Accounting Standard Codification Topic 946 "Financial Services — Investment Companies". The following is a summary of significant accounting policies followed by the Funds.
Security Valuation. Portfolio securities that are listed on a securities exchange (whether domestic or foreign) or The Nasdaq Stock Market ("NSM") (including the Nasdaq National Market and the Nasdaq Small Cap Market) are valued at the last reported sale price (or official closing price) on that day as of the close of the New York Stock Exchange (which is generally 4:00 p.m. Eastern time), or, in the absence of recorded sales, at the average between the last bid and asked quotation on such exchange or NSM. Unlisted equity securities that are not included in NSM are valued at the last sale price, or if the last sale price is unavailable, at the average of the quoted bid and asked prices in the over-the-counter market. Fixed-income securities are generally valued on the basis of quotes obtained from an approved independent pricing service but may also be valued based on reported transactions on FINRA's Trade Reporting and Compliance Engine (TRACE) or quotations provided by a broker-dealer. The pricing services may provide a price determined by a matrix pricing method or other analytical pricing models. Investments quoted in foreign currency are valued daily in U.S. dollars on the basis of the foreign currency exchange rate prevailing at the time of valuation. Securities and other assets for which market quotations are not readily available are valued at their fair value as determined by Hotchkis & Wiley Capital Management, LLC (the "Advisor") under guidelines established by and under the general supervision and responsibility of the Trust's Board of Trustees (the "Board"). The Board has approved the use of a third-party vendor's proprietary fair value pricing model to assist in determining current valuation for foreign securities traded in markets that close prior to the New York Stock Exchange. When fair value pricing is employed, the value of the portfolio securities used to calculate the Funds' net asset values may differ from quoted or official closing prices.
The Trust has performed an analysis of all existing investments to determine the significance and character of all inputs to their fair value determination. Various inputs are used in determining the value of each Fund's investments. These inputs are summarized in the following three broad categories:
• Level 1 — Quoted unadjusted prices for identical instruments in active markets to which the Trust has access at the date of measurement.
• Level 2 — Other significant observable inputs (including quoted prices for similar instruments, interest rates, current yields, credit quality, prepayment speeds for mortgage related securities, collateral for asset-backed securities, foreign security indices, foreign exchange rates, fair value estimates for foreign securities, and changes in benchmark securities indices). Level 2 inputs are those in markets for which there are few transactions, the prices are not current, little public information exists or instances where prices vary substantially over time or among brokered market makers.
• Level 3 — Significant unobservable inputs including model derived valuations in which one or more significant inputs or significant value drivers are unobservable. Unobservable inputs are those inputs that reflect the Trust's own assumptions that market participants would use to price the asset or liability based on the best available information.
67
The following table presents the valuation levels of each Fund's assets as of June 30, 2018:
| | | Diversified
Value | | Large Cap
Value | | Mid-Cap
Value | | Small Cap
Value | | Small Cap
Diversified
Value | |
Level 1 — Quoted prices in an active market: | |
Common Stocks | | $ | 107,287,759 | | | $ | 421,559,506 | | | $ | 1,768,872,139 | | | $ | 782,513,173 | | | $ | 41,895,169 | | |
Money Market Funds | | | 416,970 | | | | 1,663,360 | | | | 29,260,359 | | | | 32,363,992 | | | | — | | |
Level 2 — Other significant observable market inputs: | |
Common Stocks: | |
Energy | | | — | | | | — | | | | 63,549,008 | | | | 2,367,774 | | | | — | | |
Industrials | | | — | | | | — | | | | 26,765,349 | | | | — | | | | — | | |
Materials | | | — | | | | — | | | | — | | | | 865,425 | | | | — | | |
Time Deposits | | | — | | | | 7,045,829 | | | | 36,697,938 | | | | 16,614,084 | | | | 1,784,361 | | |
Level 3 — Significant unobservable inputs | | | — | | | | — | | | | — | | | | — | | | | — | | |
Total Investments | | $ | 107,704,729 | | | $ | 430,268,695 | | | $ | 1,925,144,793 | | | $ | 834,724,448 | | | $ | 43,679,530 | | |
| | Global
Value | | International
Value | | Value
Opportunities | | Capital
Income | | High Yield | |
Level 1 — Quoted prices in an active market: | |
Common Stocks | | $ | 6,730,688 | | | $ | 993,871 | | | $ | 562,342,072 | | | $ | 19,058,853 | | | $ | — | | |
Investment Companies | | | — | | | | — | | | | — | | | | 227,790 | | | | — | | |
Preferred Stocks | | | — | | | | — | | | | 1,550,000 | | | | 160,462 | | | | 17,856,511 | | |
Purchased Put Options | | | — | | | | — | | | | 2,479,500 | | | | — | | | | — | | |
Warrants | | | — | | | | — | | | | 2,465,978 | | | | — | | | | — | | |
Money Market Funds | | | — | | | | — | | | | 25,188,204 | | | | — | | | | 60,116,628 | | |
Level 2 — Other significant observable market inputs: | |
Common Stocks: | |
Consumer Discretionary | | | 215,690 | | | | 108,220 | | | | — | | | | — | | | | — | | |
Consumer Staples | | | 292,826 | | | | 205,452 | | | | — | | | | — | | | | — | | |
Energy | | | 166,557 | | | | 94,550 | | | | 5,248,440 | | | | 534,667 | | | | — | | |
Energy — Exploration & Production | | | — | | | | — | | | | — | | | | — | | | | 7,416,885 | | |
Financials | | | 1,451,235 | | | | 573,090 | | | | 14,318,911 | | | | 566,018 | | | | — | | |
Health Care | | | 112,123 | | | | 118,615 | | | | — | | | | — | | | | — | | |
Industrials | | | 678,906 | | | | 266,167 | | | | 20,507,294 | | | | 484,727 | | | | — | | |
Information Technology | | | — | | | | 108,962 | | | | — | | | | — | | | | — | | |
Materials | | | — | | | | — | | | | 146,175 | | | | — | | | | — | | |
Telecommunication Services | | | 41,257 | | | | 85,756 | | | | — | | | | — | | | | — | | |
Preferred Stocks: | |
Financials | | | — | | | | — | | | | 1,640,952 | | | | — | | | | — | | |
Convertible Bonds | | | — | | | | — | | | | 38,000 | | | | — | | | | — | | |
Corporate Bonds | | | — | | | | — | | | | 2,512,500 | | | | 13,677,469 | | | | 2,381,249,490 | | |
Term Loans | | | — | | | | — | | | | — | | | | 755,171 | | | | 95,310,619 | | |
Warrants | | | — | | | | — | | | | 275,200 | | | | — | | | | 619,200 | | |
Time Deposits | | | 83,428 | | | | — | | | | 7,668,509 | | | | 370,218 | | | | 66,622,057 | | |
Level 3 — Significant unobservable inputs: | |
Common Stocks: | |
Automakers | | | — | | | | — | | | | — | | | | — | | | | 0 | | |
Consumer Discretionary | | | — | | | | — | | | | — | | | | 236,640 | | | | — | | |
Energy | | | — | | | | — | | | | — | | | | 2,156 | | | | — | | |
Energy — Exploration & Production | | | — | | | | — | | | | — | | | | — | | | | 160,741 | | |
Industrials | | | — | | | | — | | | | — | | | | 124,848 | | | | — | | |
Materials | | | — | | | | — | | | | 10,760,790 | | | | 398,286 | | | | — | | |
Metals/Mining Excluding Steel | | | — | | | | — | | | | — | | | | — | | | | 43,390,786 | | |
Oil Field Equipment & Services | | | — | | | | — | | | | — | | | | — | | | | 4,696,318 | | |
Specialty Retail | | | — | | | | — | | | | — | | | | — | | | | 19,821,422 | | |
Preferred Stocks: | |
Consumer Staples | | | — | | | | — | | | | — | | | | 69,846 | | | | — | | |
Food — Wholesale | | | — | | | | — | | | | — | | | | — | | | | 11,272,351 | | |
Corporate Bonds | | | — | | | | — | | | | 3,990,031 | | | | 87,286 | | | | 1,349,465 | | |
Term Loans | | | — | | | | — | | | | 3,802,486 | | | | 31,585 | | | | 2,590,943 | | |
Total Investments | | $ | 9,772,710 | | | $ | 2,554,683 | | | $ | 664,935,042 | | | $ | 36,786,022 | | | $ | 2,712,473,416 | | |
Other Financial Instruments | |
Level 1 — Quoted prices in an active market: | |
Futures Contracts * | | | | | | $ | 159,031 | | | | | | | | | | |
Level 2 — Other significant observable market inputs | | | | | | | — | | | | | | |
Level 3 — Significant unobservable inputs | | | | | | | — | | | | | | |
Total Other Financial Instruments | | | | | | $ | 159,031 | | | | | | | | | | |
* Futures contracts are derivative instruments not reflected on the Schedule of Investments and are reflected at the unrealized appreciation (depreciation) on the instrument.
68
Please refer to the Schedule of Investments for additional information regarding the composition of the amounts listed above.
The following table provides information about the Level 3 values, as well as their inputs, as of June 30, 2018:
| | Fair Value at
June 30,
2018 | | Valuation
Techniques | | Unobservable
Inputs | | Input
Values | | Impact to
Valuation from an
Increase to Input | |
Value Opportunities | |
Common Stocks: | | $ | 0 | | | Estimated recovery value | | Probability of asset recovery | | $0 | | Increase | |
| | | | 3,868,521 | | | Market comparable
companies* | |
EBITDA multiple | | 6.3x - 8.6x | |
Increase | |
| | | 6,892,269 | | | Market quote (stale) | | N/A | | $212.58 | | Increase | |
Total Common Stocks | | | 10,760,790 | | | | | | | | | | |
Corporate Bonds | | | 3,990,031 | | | Market quote (stale) | | N/A | | $96.65 - $100.00 | | Increase | |
Term Loans | | | 3,802,486 | | | Market quote (stale) | | N/A | | $100.00 | | Increase | |
| | $ | 18,553,307 | | | | | | | | | | |
Capital Income | |
| Common Stocks: | | $ | 236,640
| | | Calculation of enterprise
value using:
Discounted cash flows
Market comparable
companies*
Transaction analysis | |
Yield (Discount rate of cash flows)
EBITDA multiple
Guideline transactions | | 9.75%-11.75%
6x - 8x
$499 Million - $602 Million | |
Decrease
Increase
Increase | |
| | | 0 | | | Estimated recovery value | | Probability of asset recovery | | $0 | | Increase | |
| | | 2,156 | | | Last traded price (stale) | | N/A | | $1.38 | | Increase | |
| | | 465,950 | | | Market comparable
companies* | |
EBITDA multiple | | 5.0x - 7.3x | |
Increase | |
| | | | 57,184 | | | Market quote (stale) | | N/A | | $212.58 | | Increase | |
Total Common Stocks | | | 761,930 | | | | | | | | | | |
Preferred Stocks | | | 69,846 | | | Last traded price (stale) | | N/A | | $0.74 | | Increase | |
Corporate Bonds | | | 87,286 | | | Market quote (stale) | | N/A | | $96.65 - $100.00 | | Increase | |
Term Loans | | | 31,585 | | | Market quote (stale) | | N/A | | $100.00 | | Increase | |
| | $ | 950,647 | | | | | | | | | | |
High Yield | |
| Common Stocks: | | $ | 19,821,422
| | | Calculation of enterprise
value using:
Discounted cash flows
Market comparable
companies*
Transaction analysis | |
Yield (Discount rate of cash flows)
EBITDA multiple
Guideline transactions | | 9.75% - 11.75%
6x - 8x
$499 Million - $602 Million | |
Decrease
Increase
Increase | |
| | | 0 | | | Estimated recovery value | | Probability of asset recovery | | $0 | | Increase | |
| | | 160,741 | | | Last traded price (stale) | | N/A | | $1.38 | | Increase | |
| | | 43,390,786 | | | Market comparable
companies* | |
EBITDA multiple | | 5.0x - 8.6x | |
Increase | |
| | | 4,696,318 | | | Market quote (stale) | | N/A | | $212.58 | | Increase | |
Total Common Stocks | | | 68,069,267 | | | | | | | | | | |
Preferred Stocks | | | 11,272,351 | | | Last traded price (stale) | | N/A | | $0.74 | | Increase | |
Corporate Bonds: | | | 0 | | | Estimated recovery value | | Probability of asset recovery | | $0 | | Increase | |
| | | 1,349,465 | | | Market quote (stale) | | N/A | | $96.65 - $100.00 | | Increase | |
Total Corporate Bonds | | | 1,349,465 | | | | | | | | | | |
Term Loans | | | 2,590,943 | | | Market quote (stale) | | N/A | | $100.00 | | Increase | |
| | $ | 83,282,026 | | | | | | | | | | |
* The valuation technique was changed from last traded price (stale) to market comparable companies for American Zinc Recycling LLC (formerly Horsehead Holding LLC) and GHW Holdco LLC. The change in valuation technique is primarily due to the market comparable companies model more closely reflecting current market participant assumptions.
69
The following is a reconciliation of Level 3 assets for which significant unobservable inputs were used to determine fair value:
| | Value Opportunities | |
| | Common
Stocks | | Corporate
Bonds | | Term
Loans | | Rights | | Total | |
Balance at June 30, 2017 | | $ | 2,338,352 | | | $ | 3,570,315 | | | $ | — | | | $ | 0 | | | $ | 5,908,667 | | |
Purchases | | | 767,999 | | | | 239,000 | | | | — | | | | — | | | | 1,006,999 | | |
Sales | | | (752,349 | ) | | | (1,196 | ) | | | — | | | | (0 | ) | | | (753,545 | ) | |
Accrued discounts (premiums) | | | — | | | | 265,485 | | | | — | | | | — | | | | 265,485 | | |
Realized gains (losses) | | | 752,349 | | | | (13,726 | ) | | | — | | | | — | | | | 738,623 | | |
Change in unrealized appreciation
(depreciation) | | | 762,170 | | | | (69,847 | ) | | | — | | | | — | | | | 692,323 | | |
Transfers into Level 3 | | | 6,892,269 | * | | | — | | | | 3,802,486 | * | | | — | | | | 10,694,755 | | |
Balance at June 30, 2018 | | $ | 10,760,790 | | | $ | 3,990,031 | | | $ | 3,802,486 | | | $ | — | | | $ | 18,553,307 | | |
Change in unrealized appreciation
(depreciation) for Level 3 assets
held at June 30, 2018 | | $ | 1,860,404 | | | $ | (84,769 | ) | | $ | — | | | $ | — | | | $ | 1,775,635 | | |
| | Capital Income | |
| | Common
Stocks | | Preferred
Stocks | | Corporate
Bonds | | Term
Loans | | Total | |
Balance at June 30, 2017 | | $ | 370,678 | | | $ | 69,846 | | | $ | 78,104 | | | $ | — | | | $ | 518,628 | | |
Purchases | | | 194,967 | | | | — | | | | 5,229 | | | | — | | | | 200,196 | | |
Sales | | | (147 | ) | | | — | | | | (3,173 | ) | | | — | | | | (3,320 | ) | |
Accrued discounts (premiums) | | | — | | | | — | | | | 5,808 | | | | — | | | | 5,808 | | |
Realized gains (losses) | | | (2,106 | ) | | | — | | | | (210,129 | ) | | | — | | | | (212,235 | ) | |
Change in unrealized appreciation
(depreciation) | | | 141,354 | | | | — | | | | 211,447 | | | | — | | | | 352,801 | | |
Transfers into Level 3 | | | 57,184 | * | | | — | | | | — | | | | 31,585 | * | | | 88,769 | | |
Balance at June 30, 2018 | | $ | 761,930 | | | $ | 69,846 | | | $ | 87,286 | | | $ | 31,585 | | | $ | 950,647 | | |
Change in unrealized appreciation
(depreciation) for Level 3 assets
held at June 30, 2018 | | $ | 151,644 | | | $ | — | | | $ | (1,855 | ) | | $ | — | | | $ | 149,789 | | |
| | High Yield | |
| | Common
Stocks | | Preferred
Stocks | | Corporate
Bonds | | Term
Loans | | Total | |
Balance at June 30, 2017 | | $ | 31,479,973 | | | $ | 11,272,351 | | | $ | 1,207,514 | | | $ | — | | | $ | 43,959,838 | | |
Purchases | | | 18,516,806 | | | | — | | | | 80,832 | | | | — | | | | 18,597,638 | | |
Sales | | | (11,212 | ) | | | — | | | | (247,449 | ) | | | — | | | | (258,661 | ) | |
Accrued discounts (premiums) | | | — | | | | — | | | | 90,220 | | | | — | | | | 90,220 | | |
Realized gains (losses) | | | (140,080 | ) | | | — | | | | (16,652,703 | ) | | | — | | | | (16,792,783 | ) | |
Change in unrealized appreciation
(depreciation) | | | 13,527,462 | | | | — | | | | 16,871,051 | | | | — | | | | 30,398,513 | | |
Transfers into Level 3 | | | 4,696,318 | * | | | — | | | | — | | | | 2,590,943 | * | | | 7,287,261 | | |
Balance at June 30, 2018 | | $ | 68,069,267 | | | $ | 11,272,351 | | | $ | 1,349,465 | | | $ | 2,590,943 | | | $ | 83,282,026 | | |
Change in unrealized appreciation
(depreciation) for Level 3 assets
held at June 30, 2018 | | $ | 13,686,555 | | | $ | — | | | $ | (29,101 | ) | | $ | — | | | $ | 13,657,454 | | |
* The transfers were due to lack of observable inputs on June 30, 2018.
70
There were transfers from Level 1 to Level 2 of $1,463,489 in the Value Opportunities Fund and $230,503 in the Capital Income Fund using market values as of June 30, 2018. The transfers were due to lack of trading volume on June 30, 2018. There were transfers from Level 1 to Level 2 of $11,422 in the International Value Fund using market values as of June 30, 2018. The transfers were due to securities being fair valued as a result of market movements following the close of local trading on June 30, 2018. There were transfers from Level 2 to Level 1 of $235,011 in the Capital Income Fund using market values as of June 30, 2018. The transfers were due to increased trading volume on June 30, 2018. There were transfers from Level 2 to Level 1 of $37,708,315 in the Mid-Cap Value Fund, $98,615 in the Global Value Fund, $48,044 in the International Value Fund and $2,747,202 in the Value Opportunities Fund using market values as of June 30, 2018. The transfers were due to securities being fair valued as a result of market movements following the close of local trading at the beginning of the reporting period. There were no transfers into or out of Level 1 or Level 2 during the year ended June 30, 2018 for the Diversified Value Fund, Large Cap Value Fund, Small Cap Value Fund and Small Cap Diversified Value Fund. Transfers between Levels are recognized at the end of the reporting period.
Income and Expense Allocation. Common expenses incurred by the Trust which are not allocable to a specific Fund are allocated among the Funds based upon relative net assets or evenly, depending on the nature of the expenditure. For all Funds, except the Capital Income Fund and High Yield Fund, net investment income, other than class-specific expenses, and realized and unrealized gains and losses are allocated daily to each class of shares based upon the relative net asset value of outstanding shares of each class at the beginning of the day (after adjusting for the current day's capital share activity of the respective class). For the Capital Income Fund and High Yield Fund, net investment income, other than class-specific expenses, and realized and unrealized gains and losses are allocated daily to each class of shares based upon the relative net asset value of settled shares of each class at the beginning of the day (after adjusting for the current day's capital share activity of the respective class).
Dividends and Distributions to Shareholders. Dividends and distributions to shareholders are recorded on the ex-dividend date. Dividends from net investment income are declared daily and paid monthly for the Capital Income Fund and High Yield Fund and declared and paid annually for the Diversified Value Fund, Large Cap Value Fund, Mid-Cap Value Fund, Small Cap Value Fund, Small Cap Diversified Value Fund, Global Value Fund, International Value Fund and Value Opportunities Fund. Distributions of net realized capital gains, if any, will be declared and paid at least annually.
Security Transactions and Investment Income. Security and shareholder transactions are recorded on trade date. Realized gains and losses on sales of investments are calculated on the specifically identified cost basis of the securities. Dividend income, less foreign taxes withheld, if any, is recorded on the ex-dividend date. Interest income is recognized on the accrual basis. Market discounts, premiums and original issue discounts on fixed-income securities are amortized daily over the expected life of the security using the effective yield method. Return of capital distributions received from real estate investment trust ("REIT") securities are recorded as an adjustment to the cost of the security and thus may impact unrealized gains or losses on the security.
Securities purchased or sold on a when-issued, delayed delivery or forward commitment basis may have extended settlement periods. The value of the security purchased is subject to market fluctuations during this period. The Funds will segregate or "earmark" liquid assets until the settlement date or otherwise cover their position in an amount sufficient to meet the Funds' obligations.
Foreign Currency Transactions. Securities and other assets and liabilities denominated in foreign currencies are translated into U.S. dollar amounts at the date of valuation. Purchases and sales of securities and income and expense items denominated in foreign currencies are translated into U.S. dollar amounts on the respective dates of such transactions. The Funds isolate the portion of realized gains or losses and do not isolate the portion of unrealized appreciation or depreciation resulting from changes in foreign exchange rates on securities from the fluctuations arising from changes in market prices of securities held. Reported net realized foreign exchange gains or losses arise from sales of securities, currency gains or losses realized between the trade and settlement dates on securities transactions and the difference between the amounts of dividends, interest and foreign withholding taxes recorded on the Funds' books and the U.S. dollar equivalent of the amounts actually received or paid.
Payment In-Kind Securities. Certain Funds may invest in payment in-kind securities. Payment in-kind securities give the issuer the option at each interest payment date of making interest payments in either cash or additional debt securities. Those additional debt securities usually have the same terms, including maturity dates and interest rates, and associated risks as the original bonds. The daily market quotations of the original bonds may include the accrued interest (referred to as a dirty price) and may require a pro-rata adjustment to interest receivable from the unrealized appreciation or depreciation of securities on the Statements of Assets & Liabilities.
Restricted and Illiquid Securities. The Funds may invest in securities that are subject to legal or contractual restrictions on resale or are illiquid. Restricted securities generally may be resold in transactions exempt from registration. An illiquid security is a security which cannot be disposed of promptly (within seven days) and in the usual course of business at approximately its fair value and includes repurchase agreements maturing in excess of seven days, time deposits with a withdrawal penalty, non-negotiable instruments and instruments for which no market exists. Disposal of these securities may involve time-consuming negotiations and expense, and prompt sale at the current valuation may be difficult.
Options. The Funds are subject to equity price risk in the normal course of pursuing their investment objectives. The Funds may purchase put options on securities to protect holdings in an underlying or related security against a substantial decline in market value. The Funds may purchase call options on securities and security indexes. A Fund may write a call or put option only if the option is "covered" by the Fund holding a position in the underlying securities or by other means which would permit immediate satisfaction of the Fund's obligation as writer of the option. Prior to exercise or expiration, an option may be closed by an offsetting purchase or sale of an option of the same series. The purchase and writing of options involves certain risks. If a put or call option purchased by a Fund is not sold when it has remaining value, and if the market price of the underlying security, in the case of a put, remains equal to or greater than the exercise price or, in the case of a call, remains less than or equal to the exercise price, the Fund will lose its entire investment in the option. There can be no assurance that a liquid market will exist when a Fund seeks to close out an option position. Furthermore, if trading restrictions or suspensions are imposed on the options markets, the Fund may be unable to close out a position. With options, there is minimal counterparty risk to the Funds since options are exchange traded and the exchange's clearinghouse, as counterparty to all exchange traded options, guarantees the options against default.
When a Fund purchases a put or call option, an amount equal to the premium paid is included on the Statements of Assets & Liabilities as an investment, and is subsequently adjusted to reflect the fair market value of the option. If an option expires on the stipulated expiration date or if the Fund enters into a closing sale transaction, a gain or loss is realized. If the Fund exercises a put option, a gain or loss is realized from the sale of the
71
underlying security, and the proceeds from such sale are decreased by the premium originally paid. If the Fund exercises a call option, the cost of the security acquired is increased by the premium paid for the call.
Futures Contracts. The Value Opportunities Fund is subject to foreign currency exchange rate risk in the normal course of pursuing its investment objective. The Fund may use futures contracts to gain exposure to, or hedge against, changes in the value of foreign currencies. A futures contract provides for the future sale by one party and purchase by another party of an asset at a specified price on a specified date. Upon entering into such contracts, the Fund is required to deposit with the broker, either in cash or securities, an initial margin deposit in an amount equal to a certain percentage of the contract amount. Subsequent payments (variation margin) are made or received by the Fund each day, depending on the daily fluctuations in the value of the contract, and are recorded for financial statement purposes as unrealized gains or losses by the Fund. Upon entering into such contracts, the Fund bears the risk of exchange rates moving unexpectedly, in which case the Fund may not achieve the anticipated benefits of the futures contracts and may realize a loss. When a contract is closed, the Fund records a realized gain or loss equal to the difference between the proceeds from (or cost of) the closing transaction and the Fund's basis in the contract. With futures, there is minimal counterparty risk to the Fund since futures are exchange traded and the exchange's clearinghouse, as counterparty to all exchange traded futures, guarantees the futures against default. The use of futures contracts involves the risk of imperfect correlation in movements in the price of the futures contracts, exchange rates and the underlying hedged assets.
Credit Default Swap Contracts. The Value Opportunities Fund, Capital Income Fund and High Yield Fund may enter into credit default swap agreements for purposes of attempting to obtain a particular desired return at a lower cost to the Fund than if the Fund had invested directly in an instrument that yielded the desired return. The buyer in a credit default swap is obligated to pay the seller a periodic stream of payments over the term of the contract provided no event of default on an underlying reference obligation has occurred. In the event of default, the seller must pay the buyer a net settlement amount in the form of cash or securities equal to the notional amount of the swap less the recovery value of the referenced entity or underlying securities comprising the referenced index. Credit default swaps involve greater risks than if the Fund invested in the reference obligation directly. In addition to general market risks, credit default swaps are subject to illiquidity risk, counterparty risk and credit risk. The Fund's maximum risk of loss from counterparty risk, either as the protection seller or as the protection buyer, is the fair value of the contract. This risk is mitigated by having a master netting arrangement between the Fund and the counterparty and by the posting of collateral by the counterparty to the Fund to cover the Fund's exposure to the counterparty.
The Value Opportunities Fund, Capital Income Fund and High Yield Fund are party to an International Swap Dealers Association, Inc. Master Agreement ("ISDA Master Agreement") with each of Goldman Sachs International and JPMorgan Chase Bank, N.A. that governs transactions, such as over-the-counter swap contracts, entered into by the Funds and the counterparty. The ISDA Master Agreement contains provisions for general obligations, representations, agreements, collateral and events of default or termination. Events of termination include conditions that may entitle the counterparty to elect to terminate early and cause settlement of all outstanding transactions under the ISDA Master Agreement.
Upon entering into swap agreements, the Value Opportunities Fund, Capital Income Fund and High Yield Fund will either receive or pay an upfront payment based upon the difference between the current principal amount and the notional amount of the swap and whether the Fund is buying or selling protection. Upfront payments that are received are recorded as liabilities while upfront payments paid are recorded as assets. These payments remain on the books until the swap contract is closed. When entering into credit default swaps, the Fund will either deliver collateral to the counterparty or the counterparty will deliver collateral to the Fund. The amount of this collateral is calculated based upon the notional value and the current price of the swap. In the event of default, the Fund has recourse against any collateral posted to it by the counterparty. When entering into swap agreements as a seller, the notional amounts would be partially offset by any recovery values of the respective reference obligations, upfront payments received upon entering into the agreement, or net amounts received from the settlement of buy protection credit default swap agreements entered into by the Fund for the same reference entity. Unrealized appreciation or depreciation is recorded daily as the difference between the prior day and current day closing price.
Derivative Instruments. The Funds have adopted authoritative standards regarding disclosures about derivatives and how they affect the Funds' Statements of Assets & Liabilities and Statements of Operations.
The following is a summary of the Funds' derivative instrument holdings categorized by primary risk exposure as of June 30, 2018:
Liability Derivatives
| | Location on Statements of
Assets & Liabilities | | Value
Opportunities | | Capital
Income | | High
Yield | |
Equity Contracts: | |
Purchased Put Options | | Long-term investments | | $ | 2,479,500 | | | $ | — | | | $ | — | | |
Foreign Exchange Contracts: | |
| Futures Contracts | | Net unrealized depreciation of
futures contracts* | | |
159,031 | | | |
— | | | |
— | | |
*Includes cumulative depreciation of futures contracts as reported in the "Net Assets consist of:" section on the Statements of Assets & Liabilities.
72
The following is a summary of the Funds' realized gains (losses) and change in unrealized appreciation (depreciation) on derivative instruments recognized in the Statements of Operations categorized by primary risk exposure for the year ended June 30, 2018:
Realized Gains (Losses) on Derivatives
| | Value Opportunities | | Capital Income | | High Yield | |
Credit Contracts: | |
Credit Default Swap Contracts | | $ | — | | | $ | (8,259 | ) | | $ | (1,479,429 | ) | |
Equity Contracts: | |
Purchased Put Options | | | — | | | | — | | | | — | | |
Foreign Exchange Contracts: | |
Futures Contracts | | | 1,005,743 | | | | — | | | | — | | |
Change in Unrealized Appreciation (Depreciation) on Derivatives
| | Value Opportunities | | Capital Income | | High Yield | |
Credit Contracts: | |
Credit Default Swap Contracts | | $ | — | | | $ | (1,510 | ) | | $ | (271,744 | ) | |
Equity Contracts: | |
Purchased Put Options | | | (477,734 | )* | | | — | | | | — | | |
Foreign Exchange Contracts: | |
Futures Contracts | | | 219,556 | | | | — | | | | — | | |
* Included with net change in unrealized appreciation (depreciation) of securities of unaffiliated issuers and foreign currency transactions.
The following is a summary of the Funds' average quarterly balance of outstanding derivative instruments categorized by primary risk exposure for the year ended June 30, 2018:
Average Quarterly Balance of Outstanding Derivatives
| | Value Opportunities | | Capital Income | | High Yield | |
Credit Contracts: | |
Average Number of Contracts — Credit Default Swap Contracts | | | — | | | | 1 | | | | 1 | | |
Average Notional Amount — Credit Default Swap Contracts | | $ | — | | | $ | 216,000 | | | $ | 38,880,000 | | |
Equity Contracts: | |
Average Number of Contracts — Purchased Put Options | | | 76 | | | | — | | | | — | | |
Average Notional Amount — Purchased Put Options | | $ | 2,606,420 | | | $ | — | | | $ | — | | |
Foreign Exchange Contracts: | |
Average Number of Contracts — Futures Contracts | | | 198 | | | | — | | | | — | | |
Average Notional Amount — Futures Contracts | | $ | 19,093,523 | | | $ | — | | | $ | — | | |
Offsetting Assets and Liabilities. The Funds are subject to various master netting arrangements, which govern the terms of certain transactions with counterparties. The arrangements allow the Funds to close out and net their total exposure to a counterparty in the event of a default with respect to all the transactions governed under a single agreement with a counterparty. For financial reporting purposes, the Funds do not offset financial assets and liabilities that are subject to master netting arrangements in the Statements of Assets & Liabilities.
73
The following is a summary of the arrangements subject to offsetting as of June 30, 2018:
| | | | | | | | Gross Amounts Not Offset in the
Statements of Assets & Liabilities | |
| | Gross Amounts | | Gross Amounts
Offset in the
Statements of
Assets &
Liabilities | | Net Amounts
Presented in the
Statements of
Assets &
Liabilities | | Financial
Instruments | | Collateral
Pledged
(Received) | | Net Amount | |
Liabilities: | |
Futures Contracts: | |
Value Opportunities | | $ | 128,300 | | | $ | — | | | $ | 128,300 | | | $ | — | | | $ | 128,300 | | | $ | — | | |
Securities Lending: | |
Diversified Value | | | 416,970 | | | | — | | | | 416,970 | | | | 416,970 | | | | — | | | | — | | |
Large Cap Value | | | 1,663,360 | | | | — | | | | 1,663,360 | | | | 1,663,360 | | | | — | | | | — | | |
Mid-Cap Value | | | 29,260,359 | | | | — | | | | 29,260,359 | | | | 29,260,359 | | | | — | | | | — | | |
Small Cap Value | | | 32,363,992 | | | | — | | | | 32,363,992 | | | | 32,363,992 | | | | — | | | | — | | |
Value Opportunities | | | 25,188,204 | | | | — | | | | 25,188,204 | | | | 25,188,204 | | | | — | | | | — | | |
NOTE 2.
Fees and Transactions with Affiliates. The Trust has entered into Investment Advisory Agreements for each of the Funds with the Advisor, with which the officers and a Trustee of the Trust are affiliated. The Advisor is a limited liability company, the primary members of which are HWCap Holdings, a limited liability company with members who are current and former employees of the Advisor, and Stephens - H&W, LLC, a limited liability company whose primary member is SF Holding Corp., which is a diversified holding company. The Advisor is responsible for the management of the Funds' investments and provides the personnel, facilities, equipment and certain other services necessary to the operations of each Fund. The Advisor receives a fee, computed daily and payable monthly, at the annual rates presented below as applied to each Fund's daily net assets. The Advisor has contractually agreed to waive fees or reimburse regular operating expenses in excess of the annual rates presented below as applied to such Fund's daily net assets through August 31, 2019.
| | | Diversified
Value | | Large Cap
Value | | Mid-Cap
Value | | Small Cap
Value | | Small Cap
Diversified
Value | | Global
Value | | International
Value | | Value
Opportunities | | Capital
Income | | High
Yield | |
Annual Advisory
Fee Rate | | | 0.75 | %1 | | | 0.75 | %1 | | | 0.75 | %1 | | | 0.75 | % | | | 0.65 | % | | | 0.80 | % | | | 0.85 | % | | | 0.75 | % | | | 0.65 | % | | | 0.55 | % | |
Annual cap on
expenses — Class I | | | 0.95 | % | | | 1.05 | % | | | 1.15 | % | | | 1.25 | % | | | 0.90 | % | | | 1.10 | % | | | 1.15 | % | | | 1.25 | % | | | 0.80 | % | | | 0.70 | % | |
Annual cap on
expenses — Class A | | | 1.20 | % | | | 1.30 | % | | | 1.40 | % | | | 1.50 | % | | | 1.15 | % | | | 1.35 | % | | | 1.40 | % | | | 1.50 | % | | | 1.05 | % | | | 0.95 | % | |
Annual cap on
expenses — Class C | | | 1.95 | % | | | 2.05 | % | | | 2.15 | % | | | 2.25 | % | | | 1.90 | % | | | 2.10 | % | | | 2.15 | % | | | 2.25 | % | | | 1.80 | % | | | 1.70 | % | |
Annual cap on
expenses — Class R | | | N/A | | | | 1.55 | % | | | 1.65 | % | | | N/A | | | | N/A | | | | N/A | | | | N/A | | | | N/A | | | | N/A | | | | N/A | | |
Annual cap on
expenses — Class T | | | 1.20 | % | | | 1.30 | % | | | 1.40 | % | | | 1.50 | % | | | 1.15 | % | | | 1.35 | % | | | 1.40 | % | | | 1.50 | % | | | 1.05 | % | | | 0.95 | % | |
Annual cap on
expenses — Class Z | | | N/A | | | | N/A | | | | N/A | | | | N/A | | | | N/A | | | | N/A | | | | N/A | | | | N/A | | | | N/A | | | | 0.60 | % | |
1 The Annual Advisory Fee Rate is 0.75% for the first $5 billion in assets, 0.65% for the next $5 billion in assets and 0.60% for assets over $10 billion.
Quasar Distributors, LLC is the principal underwriter and distributor for the shares of the Funds ("Quasar" or the "Distributor"). The Distributor is affiliated with the Funds' transfer agent, fund accountant and administrator, U.S. Bancorp Fund Services, LLC. Pursuant to the Distribution Plan adopted by the Trust in accordance with Rule 12b-1 under the 1940 Act, the Funds pay the Distributor ongoing distribution and service fees. The fees are accrued daily at the annual rates based upon the average daily net assets of the shares as follows:
| | | Distribution and Service
Fee | |
Class A | | | 0.25 | % | |
Class C | | | 1.00 | % | |
Class R | | | 0.50 | % | |
Class T | | | 0.25 | % | |
Pursuant to separate agreements with the Distributor, selected dealers and other financial intermediaries also provide distribution services to the Funds. The ongoing distribution and service fee compensates the Distributor and selected dealers for providing distribution-related and shareholder services to Class A, Class C, Class R and Class T shareholders.
74
Certain selected dealers and other financial intermediaries charge a fee for shareholder accounting services and administrative services that they provide to the Funds on behalf of certain shareholders; the portion of this fee paid by the Funds is included within "Transfer agent fees and expenses" in the Statements of Operations. Class Z shares are not subject to these fees.
The Funds are permitted to purchase securities from or sell securities to another Fund or affiliated person under procedures adopted by the Board. During the year ended June 30, 2018, the Funds' purchases and sales were as follows:
| | Diversified
Value | | Large Cap
Value | | Mid-Cap
Value | | Small Cap
Value | | Small Cap
Diversified
Value | | Global
Value | | International
Value | | Value
Opportunities | | Capital
Income | | High Yield | |
Purchases | | $ | — | | | $ | — | | | $ | — | | | $ | — | | | $ | — | | | $ | — | | | $ | — | | | $ | — | | | $ | — | | | $ | 43,342,698 | | |
Sales | | | — | | | | — | | | | — | | | | — | | | | — | | | | — | | | | — | | | | — | | | | 779,363 | * | | | — | | |
* Resulted in a realized gain of $29,076 for the Capital Income Fund.
NOTE 3.
Investments. Purchases and sales of investment securities, excluding short-term investments, for the year ended June 30, 2018 were as follows:
| | | Diversified
Value | | Large Cap
Value | | Mid-Cap
Value | | Small Cap
Value | | Small Cap
Diversified
Value | | Global
Value | | International
Value | | Value
Opportunities | | Capital
Income | | High Yield | |
Purchases | | $ | 31,357,447 | | | $ | 165,589,186 | | | $ | 591,867,731 | | | $ | 224,295,303 | | | $ | 42,753,847 | | | $ | 4,644,802 | | | $ | 950,496 | | | $ | 369,199,526 | | | $ | 17,706,334 | | | $ | 1,106,742,742 | | |
Sales | | | 45,736,131 | | | | 211,143,385 | | | | 975,219,935 | | | | 292,917,958 | | | | 24,078,439 | | | | 3,757,995 | | | | 849,285 | | | | 320,500,035 | | | | 23,508,839 | | | | 993,601,666 | | |
The Funds did not have any purchases or sales of U.S. Government securities for the year ended June 30, 2018.
NOTE 4.
Federal Income Taxes. It is each Fund's policy to comply with the requirements of the Internal Revenue Code applicable to regulated investment companies and each Fund intends to distribute substantially all of its investment company net taxable income and net capital gains to shareholders. Therefore, no federal income tax provision is required. Under the applicable foreign tax law, a withholding tax may be imposed on interest, dividends and capital gains at various rates.
Distributions paid to shareholders are based on net investment income and net realized gains determined on a tax basis, which may differ from net investment income and net realized gains for financial reporting purposes. The fiscal year in which amounts are distributed may differ from the year in which the net investment income and net realized gains are recorded by the Funds for financial reporting purposes. The Funds may utilize earnings and profits distributed to shareholders on redemptions of shares as part of the dividends paid deduction. Generally accepted accounting principles require that permanent financial reporting and tax differences be reclassified within the capital accounts.
The following information is presented on an income tax basis as of June 30, 2018:
| | Diversified
Value | | Large Cap
Value | | Mid-Cap
Value | | Small Cap
Value | | Small Cap
Diversified
Value | | Global
Value | | International
Value | | Value
Opportunities | | Capital
Income | | High Yield | |
Tax cost of
investments | | $ | 120,187,024 | | | $ | 449,297,547 | | | $ | 1,734,980,538 | | | $ | 687,088,718 | | | $ | 40,430,632 | | | $ | 8,941,972 | | | $ | 2,388,195 | | | $ | 588,113,834 | | | $ | 35,073,446 | | | $ | 2,644,512,596 | | |
Gross unrealized
appreciation | | | 9,693,989 | | | | 35,761,609 | | | | 388,459,854 | | | | 180,568,917 | | | | 3,285,777 | | | | 1,423,708 | | | | 314,670 | | | | 95,365,094 | | | | 4,003,247 | | | | 74,618,390 | | |
Gross unrealized
depreciation | | | (22,593,254 | ) | | | (63,499,650 | ) | | | (264,253,896 | ) | | | (81,911,162 | ) | | | (1,821,240 | ) | | | (676,372 | ) | | | (148,209 | ) | | | (51,398,339 | ) | | | (2,660,935 | ) | | | (133,396,255 | ) | |
Net unrealized
appreciation
(depreciation) | | | (12,899,265 | ) | | | (27,738,041 | ) | | | 124,205,958 | | | | 98,657,755 | | | | 1,464,537 | | | | 747,336 | | | | 166,461 | | | | 43,966,755 | | | | 1,342,312 | | | | (58,777,865 | ) | |
Distributable
ordinary income
(as of 6/30/18)* | | | 1,280,233 | | | | 4,631,157 | | | | 22,954,884 | | | | 12,816,478 | | | | 1,505,254 | | | | 97,340 | | | | 35,525 | | | | 17,161,085 | | | | 103,595 | | | | 3,227,839 | | |
Distributable
long-term gains
(as of 6/30/18) | | | — | | | | — | | | | — | | | | 23,662,245 | | | | 1,201,356 | | | | 391,400 | | | | 95,885 | | | | 27,290,250 | | | | — | | | | — | | |
Total distributable
earnings | | | 1,280,233 | | | | 4,631,157 | | | | 22,954,884 | | | | 36,478,723 | | | | 2,706,610 | | | | 488,740 | | | | 131,410 | | | | 44,451,335 | | | | 103,595 | | | | 3,227,839 | | |
Other accumulated
losses | | | (28,379,656 | ) | | | — | | | | (21,370,537 | ) | | | — | | | | (4,100 | ) | | | — | | | | — | | | | — | | | | (734,877 | ) | | | (114,441,183 | ) | |
Total accumulated
gains (losses) | | $ | (39,998,688 | ) | | $ | (23,106,884 | ) | | $ | 125,790,305 | | | $ | 135,136,478 | | | $ | 4,167,047 | | | $ | 1,236,076 | | | $ | 297,871 | | | $ | 88,418,090 | | | $ | 711,030 | | | $ | (169,991,209 | ) | |
* Includes distributable short-term gains of $8,001,991 for the Mid-Cap Value Fund, $10,387,689 for the Small Cap Value Fund, $1,373,908 for the Small Cap Diversified Value Fund, $17,205 for the Global Value Fund, $5,236 for the International Value Fund and $13,818,882 for the Value Opportunities Fund.
75
As of the close of business on December 31, 2012, in exchange for shares the Advisor transferred assets valued at $1,132,946 to the Global Value Fund. As a result of the tax-deferred transfers, the Global Value Fund acquired $50,230 of unrealized appreciation for tax purposes. As of June 30, 2018, the Global Value Fund held securities with $17,429 of net unrealized appreciation relating to the transfers.
As of the close of business on June 30, 2014, in exchange for shares Stephens Investment Holdings LLC transferred assets valued at $5,038,896 to the Small Cap Diversified Value Fund. As a result of the tax-deferred transfers, the Small Cap Diversified Value Fund acquired $592,438 of unrealized appreciation for tax purposes. As of June 30, 2018, the Small Cap Diversified Value Fund held securities with $68,496 of net unrealized appreciation relating to the transfers.
On the Statements of Assets & Liabilities, the following adjustments were made for permanent tax differences. These differences are due primarily to differing treatment for items such as foreign currency gain/loss transactions, PFICs, partnership adjustments, swap interest reclass and distribution reclass, expiring capital loss carryforwards, equalization and consent fee reclasses.
| | Paid-In
Capital | | Undistributed
Net Investment
Income (Loss) | | Undistributed
Net Realized
Gain (Loss) | |
Diversified Value | | $ | (241,537,261 | ) | | $ | 415 | | | $ | 241,536,846 | | |
Large Cap Value | | | (413,035,935 | ) | | | 1,427 | | | | 413,034,508 | | |
Mid-Cap Value | | | — | | | | 807,892 | | | | (807,892 | ) | |
Small Cap Value | | | 662,015 | | | | 252,368 | | | | (914,383 | ) | |
Small Cap Diversified Value | | | 97 | | | | 4,848 | | | | (4,945 | ) | |
Global Value | | | — | | | | 3,474 | | | | (3,474 | ) | |
International Value | | | — | | | | (508 | ) | | | 508 | | |
Value Opportunities | | | — | | | | 664,776 | | | | (664,776 | ) | |
Capital Income | | | — | | | | 89,462 | | | | (89,462 | ) | |
High Yield | | | — | | | | (1,845,044 | ) | | | 1,845,044 | | |
The tax components of distributions paid during the fiscal years ended June 30, 2018 and 2017, capital loss carryovers as of June 30, 2018, and any tax basis late year losses as of June 30, 2018, which are not recognized for tax purposes until the first day of the following fiscal year, are:
| | | June 30, 2018 | | June 30, 2017 | |
| | | Ordinary
Income
Distributions | | Long-Term
Capital Gains
Distributions | | Net Capital
Loss
Carryovers | | Capital Loss
Carryovers
Utilized | | Late
Year
Losses | | Ordinary
Income
Distributions | | Long-Term
Capital Gains
Distributions | |
| Diversified Value | | $ | 1,972,008 | | | $ | — | | | $ | 28,379,6561 | | | $ | — | | | $ | — | | | $ | 6,410,766 | | | $ | — | | |
| Large Cap Value | | | 5,847,545 | | | | — | | | | — | | | | 29,560,503 | | | | — | | | | 8,826,207 | | | | — | | |
| Mid-Cap Value | | | 7,015,174 | | | | 115,849,489 | | | | — | | | | — | | | | 21,370,5374 | | | | 15,737,440 | | | | 17,317,177 | | |
| Small Cap Value | | | 7,785,649 | | | | 30,558,275 | | | | — | | | | — | | | | — | | | | 2,949,850 | | | | — | | |
| Small Cap Diversified Value | | | 1,255,591 | | | | 2,330,107 | | | | — | | | | — | | | | — | | | | 146,812 | | | | — | | |
| Global Value | | | 141,786 | | | | 315,963 | | | | — | | | | — | | | | — | | | | 55,593 | | | | — | | |
| International Value | | | 31,134 | | | | 113,434 | | | | — | | | | — | | | | — | | | | 77,168 | | | | — | | |
| Value Opportunities | | | 10,183,262 | | | | 7,767,590 | | | | — | | | | — | | | | — | | | | 9,800,117 | | | | — | | |
| Capital Income | | | 1,450,914 | | | | — | | | | 713,4962 | | | | — | | | | — | | | | 1,484,311 | | | | — | | |
| High Yield | | | 157,623,296 | | | | — | | | | 111,302,4533 | | | | — | | | | — | | | | 161,613,195 | | | | — | | |
1 Long-term with no expiration.
2 Short-term with no expiration.
3 $2,651,171 is short-term with no expiration and $108,651,282 is long-term with no expiration.
4 Long-term post-October loss.
As of and during the year ended June 30, 2018, the Funds did not have a liability for any unrecognized tax benefits. The Funds recognize interest and penalties, if any, related to unrecognized tax benefits as income tax expense in the Statements of Operations. During the year ended June 30, 2018, the Funds did not incur any interest or penalties. The tax years ended June 30, 2015 through June 30, 2018 remain open and subject to examination by tax jurisdictions.
76
NOTE 5.
Capital Share Transactions. Transactions in capital shares for each class were as follows:
| | Sales | | Reinvestment of
dividends
and distributions | | Redemptions | | Net increase (decrease) | |
| | Shares | | Amount | | Shares | | Amount | | Shares | | Amount | | Shares | | Amount | |
Year Ended June 30, 2018 | |
Diversified Value Fund | |
Class I | | | 158,259 | | | $ | 2,894,320 | | | | 65,134 | | | $ | 1,195,866 | | | | (657,010 | ) | | $ | (12,209,082 | ) | | | (433,617 | ) | | $ | (8,118,896 | ) | |
Class A | | | 48,074 | | | | 876,199 | | | | 15,357 | | | | 283,178 | | | | (313,602 | ) | | | (5,776,170 | ) | | | (250,171 | ) | | | (4,616,793 | ) | |
Class C | | | 21,522 | | | | 394,838 | | | | 923 | | | | 16,885 | | | | (46,209 | ) | | | (859,345 | ) | | | (23,764 | ) | | | (447,622 | ) | |
Total net increase
(decrease) | | | 227,855 | | | | 4,165,357 | | | | 81,414 | | | | 1,495,929 | | | | (1,016,821 | ) | | | (18,844,597 | ) | | | (707,552 | ) | | | (13,183,311 | ) | |
Large Cap Value Fund | |
Class I | | | 2,979,791 | | | | 100,588,501 | | | | 99,918 | | | | 3,269,329 | | | | (3,519,093 | ) | | | (114,686,179 | ) | | | (439,384 | ) | | | (10,828,349 | ) | |
Class A | | | 452,316 | | | | 14,768,834 | | | | 47,404 | | | | 1,543,005 | | | | (952,247 | ) | | | (31,125,175 | ) | | | (452,527 | ) | | | (14,813,336 | ) | |
Class C | | | 44,840 | | | | 1,422,878 | | | | 1,739 | | | | 55,671 | | | | (185,128 | ) | | | (5,888,577 | ) | | | (138,549 | ) | | | (4,410,028 | ) | |
Class R | | | 40,901 | | | | 1,335,321 | | | | 1,733 | | | | 56,845 | | | | (274,012 | ) | | | (8,842,319 | ) | | | (231,378 | ) | | | (7,450,153 | ) | |
Total net increase
(decrease) | | | 3,517,848 | | | | 118,115,534 | | | | 150,794 | | | | 4,924,850 | | | | (4,930,480 | ) | | | (160,542,250 | ) | | | (1,261,838 | ) | | | (37,501,866 | ) | |
Mid-Cap Value Fund | |
Class I | | | 5,359,663 | | | | 204,455,967 | | | | 2,597,067 | | | | 93,987,859 | | | | (12,538,664 | ) | | | (475,379,489 | ) | | | (4,581,934 | ) | | | (176,935,663 | ) | |
Class A | | | 826,747 | | | | 30,841,562 | | | | 285,594 | | | | 10,181,425 | | | | (2,731,375 | ) | | | (102,165,358 | ) | | | (1,619,034 | ) | | | (61,142,371 | ) | |
Class C | | | 58,509 | | | | 1,886,168 | | | | 79,737 | | | | 2,481,427 | | | | (546,107 | ) | | | (17,827,337 | ) | | | (407,861 | ) | | | (13,459,742 | ) | |
Class R | | | 49,700 | | | | 1,838,661 | | | | 9,440 | | | | 336,912 | | | | (189,676 | ) | | | (7,175,195 | ) | | | (130,536 | ) | | | (4,999,622 | ) | |
Total net increase
(decrease) | | | 6,294,619 | | | | 239,022,358 | | | | 2,971,838 | | | | 106,987,623 | | | | (16,005,822 | ) | | | (602,547,379 | ) | | | (6,739,365 | ) | | | (256,537,398 | ) | |
Small Cap Value Fund | |
Class I | | | 1,908,065 | | | | 115,867,183 | | | | 352,439 | | | | 20,726,931 | | | | (2,359,930 | ) | | | (143,981,605 | ) | | | (99,426 | ) | | | (7,387,491 | ) | |
Class A | | | 189,657 | | | | 11,366,706 | | | | 33,531 | | | | 1,962,240 | | | | (629,826 | ) | | | (38,203,675 | ) | | | (406,638 | ) | | | (24,874,729 | ) | |
Class C | | | 8,406 | | | | 420,678 | | | | 12,314 | | | | 600,049 | | | | (102,576 | ) | | | (5,173,595 | ) | | | (81,856 | ) | | | (4,152,868 | ) | |
Total net increase
(decrease) | | | 2,106,128 | | | | 127,654,567 | | | | 398,284 | | | | 23,289,220 | | | | (3,092,332 | ) | | | (187,358,875 | ) | | | (587,920 | ) | | | (36,415,088 | ) | |
Small Cap Diversified Value Fund | |
Class I | | | 1,442,922 | | | | 17,769,109 | | | | 302,587 | | | | 3,404,099 | | | | (55,350 | ) | | | (652,882 | ) | | | 1,690,159 | | | | 20,520,326 | | |
Class A | | | 227,730 | | | | 2,778,889 | | | | 15,788 | | | | 176,823 | | | | (70,064 | ) | | | (829,798 | ) | | | 173,454 | | | | 2,125,914 | | |
Total net increase
(decrease) | | | 1,670,652 | | | | 20,547,998 | | | | 318,375 | | | | 3,580,922 | | | | (125,414 | ) | | | (1,482,680 | ) | | | 1,863,613 | | | | 22,646,240 | | |
Global Value Fund | |
Class I | | | 49,087 | | | | 660,967 | | | | 33,882 | | | | 432,679 | | | | (7,720 | ) | | | (103,218 | ) | | | 75,249 | | | | 990,428 | | |
Class A | | | 43,606 | | | | 579,945 | | | | 1,965 | | | | 25,070 | | | | (24,499 | ) | | | (326,866 | ) | | | 21,072 | | | | 278,149 | | |
Total net increase
(decrease) | | | 92,693 | | | | 1,240,912 | | | | 35,847 | | | | 457,749 | | | | (32,219 | ) | | | (430,084 | ) | | | 96,321 | | | | 1,268,577 | | |
International Value Fund | |
Class I | | | 3,000 | | | | 36,374 | | | | 12,356 | | | | 144,568 | | | | — | | | | — | | | | 15,356 | | | | 180,942 | | |
Total net increase | | | 3,000 | | | | 36,374 | | | | 12,356 | | | | 144,568 | | | | — | | | | — | | | | 15,356 | | | | 180,942 | | |
Value Opportunities Fund | |
Class I | | | 4,807,140 | | | | 140,856,785 | | | | 330,329 | | | | 9,424,295 | | | | (2,652,597 | ) | | | (79,269,451 | ) | | | 2,484,872 | | | | 71,011,629 | | |
Class A | | | 997,225 | | | | 29,301,165 | | | | 103,459 | | | | 2,957,879 | | | | (1,492,259 | ) | | | (43,639,405 | ) | | | (391,575 | ) | | | (11,380,361 | ) | |
Class C | | | 126,468 | | | | 3,448,265 | | | | 35,417 | | | | 943,875 | | | | (629,312 | ) | | | (17,060,721 | ) | | | (467,427 | ) | | | (12,668,581 | ) | |
Total net increase
(decrease) | | | 5,930,833 | | | | 173,606,215 | | | | 469,205 | | | | 13,326,049 | | | | (4,774,168 | ) | | | (139,969,577 | ) | | | 1,625,870 | | | | 46,962,687 | | |
Capital Income Fund | |
Class I | | | 534,542 | | | | 6,800,460 | | | | 47,650 | | | | 603,069 | | | | (668,387 | ) | | | (8,492,631 | ) | | | (86,195 | ) | | | (1,089,102 | ) | |
Class A | | | 255,525 | | | | 3,353,937 | | | | 39,003 | | | | 513,024 | | | | (663,362 | ) | | | (8,681,792 | ) | | | (368,834 | ) | | | (4,814,831 | ) | |
Total net increase
(decrease) | | | 790,067 | | | | 10,154,397 | | | | 86,653 | | | | 1,116,093 | | | | (1,331,749 | ) | | | (17,174,423 | ) | | | (455,029 | ) | | | (5,903,933 | ) | |
77
| | Sales | | Reinvestment of
dividends
and distributions | | Redemptions | | Net increase (decrease) | |
| | Shares | | Amount | | Shares | | Amount | | Shares | | Amount | | Shares | | Amount | |
Year Ended June 30, 2018 | |
High Yield Fund | |
Class I | | | 54,281,965 | | | $ | 662,131,795 | | | | 7,909,848 | | | $ | 96,192,964 | | | | (71,502,544 | ) | | $ | (863,414,446 | )1 | | | (9,310,731 | ) | | $ | (105,089,687 | ) | |
Class A | | | 4,403,302 | | | | 53,523,767 | | | | 2,291,302 | | | | 27,709,530 | | | | (13,728,851 | ) | | | (166,831,745 | )1 | | | (7,034,247 | ) | | | (85,598,448 | ) | |
Class C | | | 118,822 | | | | 1,458,091 | | | | 8,896 | | | | 107,978 | | | | (89,106 | ) | | | (1,088,904 | )1 | | | 38,612 | | | | 477,165 | | |
Class Z | | | 27,668,304 | | | | 330,543,054 | | | | 38,445 | | | | 458,459 | | | | (86,935 | ) | | | (1,037,100 | ) | | | 27,619,814 | | | | 329,964,413 | | |
Total net increase
(decrease) | | | 86,472,393 | | | | 1,047,656,707 | | | | 10,248,491 | | | | 124,468,931 | | | | (85,407,436 | ) | | | (1,032,372,195 | ) | | | 11,313,448 | | | | 139,753,443 | | |
Year Ended June 30, 2017 | |
Diversified Value Fund | |
Class I | | | 548,819 | | | | 8,699,241 | | | | 244,219 | | | | 4,041,821 | | | | (20,783,724 | ) | | | (315,301,576 | ) | | | (19,990,686 | ) | | | (302,560,514 | ) | |
Class A | | | 77,654 | | | | 1,273,228 | | | | 54,517 | | | | 905,529 | | | | (463,825 | ) | | | (7,452,010 | ) | | | (331,654 | ) | | | (5,273,253 | ) | |
Class C | | | 17,706 | | | | 289,256 | | | | 4,952 | | | | 81,656 | | | | (93,794 | ) | | | (1,459,349 | ) | | | (71,136 | ) | | | (1,088,437 | ) | |
Total net increase
(decrease) | | | 644,179 | | | | 10,261,725 | | | | 303,688 | | | | 5,029,006 | | | | (21,341,343 | ) | | | (324,212,935 | ) | | | (20,393,476 | ) | | | (308,922,204 | ) | |
Large Cap Value Fund | |
Class I | | | 1,858,606 | | | | 53,542,851 | | | | 194,155 | | | | 5,706,224 | | | | (5,543,590 | ) | | | (157,700,893 | ) | | | (3,490,829 | ) | | | (98,451,818 | ) | |
Class A | | | 450,429 | | | | 12,916,244 | | | | 65,925 | | | | 1,927,647 | | | | (1,860,523 | ) | | | (52,410,738 | ) | | | (1,344,169 | ) | | | (37,566,847 | ) | |
Class C | | | 31,274 | | | | 865,836 | | | | 2,686 | | | | 77,122 | | | | (328,212 | ) | | | (9,064,006 | ) | | | (294,252 | ) | | | (8,121,048 | ) | |
Class R | | | 154,260 | | | | 4,469,774 | | | | 4,446 | | | | 130,667 | | | | (248,990 | ) | | | (7,270,160 | ) | | | (90,284 | ) | | | (2,669,719 | ) | |
Total net increase
(decrease) | | | 2,494,569 | | | | 71,794,705 | | | | 267,212 | | | | 7,841,660 | | | | (7,981,315 | ) | | | (226,445,797 | ) | | | (5,219,534 | ) | | | (146,809,432 | ) | |
Mid-Cap Value Fund | |
Class I | | | 7,318,551 | | | | 259,240,441 | | | | 667,636 | | | | 25,370,176 | | | | (17,166,116 | ) | | | (597,208,871 | ) | | | (9,179,929 | ) | | | (312,598,254 | ) | |
Class A | | | 1,178,583 | | | | 42,047,606 | | | | 79,503 | | | | 2,978,963 | | | | (4,430,108 | ) | | | (152,247,703 | ) | | | (3,172,022 | ) | | | (107,221,134 | ) | |
Class C | | | 104,742 | | | | 3,370,715 | | | | 19,068 | | | | 633,072 | | | | (966,056 | ) | | | (29,294,341 | ) | | | (842,246 | ) | | | (25,290,554 | ) | |
Class R | | | 169,885 | | | | 5,744,063 | | | | 2,932 | | | | 110,120 | | | | (251,451 | ) | | | (8,933,252 | ) | | | (78,634 | ) | | | (3,079,069 | ) | |
Total net increase
(decrease) | | | 8,771,761 | | | | 310,402,825 | | | | 769,139 | | | | 29,092,331 | | | | (22,813,731 | ) | | | (787,684,167 | ) | | | (13,272,831 | ) | | | (448,189,011 | ) | |
Small Cap Value Fund | |
Class I | | | 2,000,823 | | | | 112,438,205 | | | | 31,464 | | | | 1,872,419 | | | | (5,793,793 | ) | | | (311,018,844 | ) | | | (3,761,506 | ) | | | (196,708,220 | ) | |
Class A | | | 321,829 | | | | 18,159,679 | | | | — | | | | — | | | | (1,257,117 | ) | | | (67,256,146 | ) | | | (935,288 | ) | | | (49,096,467 | ) | |
Class C | | | 10,061 | | | | 468,356 | | | | — | | | | — | | | | (185,197 | ) | | | (8,496,451 | ) | | | (175,136 | ) | | | (8,028,095 | ) | |
Total net increase
(decrease) | | | 2,332,713 | | | | 131,066,240 | | | | 31,464 | | | | 1,872,419 | | | | (7,236,107 | ) | | | (386,771,441 | ) | | | (4,871,930 | ) | | | (253,832,782 | ) | |
Small Cap Diversified Value Fund | |
Class I | | | 1,024 | | | | 10,305 | | | | 12,237 | | | | 145,133 | | | | (4 | ) | | | (47 | ) | | | 13,257 | | | | 155,391 | | |
Class A | | | 67,516 | | | | 789,171 | | | | 142 | | | | 1,679 | | | | (33,214 | ) | | | (385,123 | ) | | | 34,444 | | | | 405,727 | | |
Total net increase
(decrease) | | | 68,540 | | | | 799,476 | | | | 12,379 | | | | 146,812 | | | | (33,218 | ) | | | (385,170 | ) | | | 47,701 | | | | 561,118 | | |
Global Value Fund | |
Class I | | | 99,925 | | | | 1,172,355 | | | | 4,453 | | | | 53,569 | | | | (19,120 | ) | | | (225,520 | ) | | | 85,258 | | | | 1,000,404 | | |
Class A | | | 33,240 | | | | 393,270 | | | | 76 | | | | 911 | | | | (9,154 | ) | | | (111,227 | ) | | | 24,162 | | | | 282,954 | | |
Total net increase
(decrease) | | | 133,165 | | | | 1,565,625 | | | | 4,529 | | | | 54,480 | | | | (28,274 | ) | | | (336,747 | ) | | | 109,420 | | | | 1,283,358 | | |
International Value Fund | |
Class I | | | 12,217 | | | | 136,570 | | | | 7,205 | | | | 77,168 | | | | — | | | | — | | | | 19,422 | | | | 213,738 | | |
Total net increase | | | 12,217 | | | | 136,570 | | | | 7,205 | | | | 77,168 | | | | — | | | | — | | | | 19,422 | | | | 213,738 | | |
78
| | | Sales | | Reinvestment of
dividends
and distributions | | Redemptions | | Net increase (decrease) | |
| | | Shares | | Amount | | Shares | | Amount | | Shares | | Amount | | Shares | | Amount | |
Year Ended June 30, 2017 | |
Value Opportunities Fund | |
Class I | | | 3,844,831 | | | $ | 102,190,967 | | | | 152,247 | | | $ | 4,107,620 | | | | (3,248,754 | ) | | $ | (83,216,995 | ) | | | 748,324 | | | $ | 23,081,592 | | |
Class A | | | 1,355,149 | | | | 35,883,634 | | | | 69,948 | | | | 1,890,685 | | | | (2,532,267 | ) | | | (64,233,864 | ) | | | (1,107,170 | ) | | | (26,459,545 | ) | |
Class C | | | 246,352 | | | | 6,006,220 | | | | 22,269 | | | | 562,082 | | | | (1,120,338 | ) | | | (26,295,642 | ) | | | (851,717 | ) | | | (19,727,340 | ) | |
Total net increase
(decrease) | | | 5,446,332 | | | | 144,080,821 | | | | 244,464 | | | | 6,560,387 | | | | (6,901,359 | ) | | | (173,746,501 | ) | | | (1,210,563 | ) | | | (23,105,293 | ) | |
Capital Income Fund | |
Class I | | | 772,062 | | | | 9,475,354 | | | | 41,991 | | | | 498,700 | | | | (1,145,429 | ) | | | (13,096,384 | ) | | | (331,376 | ) | | | (3,122,330 | ) | |
Class A | | | 743,231 | | | | 9,248,362 | | | | 49,871 | | | | 615,907 | | | | (744,141 | ) | | | (9,259,888 | ) | | | 48,961 | | | | 604,381 | | |
Total net increase
(decrease) | | | 1,515,293 | | | | 18,723,716 | | | | 91,862 | | | | 1,114,607 | | | | (1,889,570 | ) | | | (22,356,272 | ) | | | (282,415 | ) | | | (2,517,949 | ) | |
High Yield Fund | |
Class I | | | 62,906,295 | | | | 758,702,120 | | | | 7,817,097 | | | | 94,376,939 | | | | (64,412,501 | ) | | | (778,952,418 | )2 | | | 6,310,891 | | | | 74,126,641 | | |
Class A | | | 9,124,346 | | | | 109,486,200 | | | | 2,750,338 | | | | 32,958,043 | | | | (18,251,434 | ) | | | (216,953,366 | )2 | | | (6,376,750 | ) | | | (74,509,123 | ) | |
Class C | | | 97,898 | | | | 1,174,029 | | | | 6,510 | | | | 78,569 | | | | (97,443 | ) | | | (1,173,984 | )2 | | | 6,965 | | | | 78,614 | | |
Total net increase
(decrease) | | | 72,128,539 | | | | 869,362,349 | | | | 10,573,945 | | | | 127,413,551 | | | | (82,761,378 | ) | | | (997,079,768 | ) | | | (58,894 | ) | | | (303,868 | ) | |
1 Net of redemption fees of $119,313 for Class I, $241,463 for Class A and $49 for Class C.
2 Net of redemption fees of $106,483 for Class I, $20,505 for Class A and $596 for Class C.
NOTE 6.
Investments in Affiliated Issuers. An issuer in which a Fund's holdings represent 5% or more of the outstanding voting securities of the issuer is an "affiliated" issuer as defined in the 1940 Act. A schedule of each Fund's investments in securities of affiliated issuers held during the year ended June 30, 2018, is set forth below:
Mid-Cap Value Fund
| Issuer Name | | Shares
Held at
July 1, 2017 | | Additions | | Reductions | | Shares
Held at
June 30, 2018 | | Dividends | | Net Realized
Gains (Losses) | | Net Change in
Unrealized
Appreciation
(Depreciation) | | Value at
June 30, 2018 | |
Ophir Energy PLC | | | 56,973,900 | | | | — | | | | (395,000 | ) | | | 56,578,900 | | | $ | — | | | $ | (1,248,950 | ) | | $ | (23,803,312 | ) | | $ | 37,708,315 | | |
| | | | | | | | | | $ | — | | | $ | (1,248,950 | ) | | $ | (23,803,312 | ) | | | |
Small Cap Value Fund
| Issuer Name | | Shares
Held at
July 1, 2017 | | Additions | | Reductions | | Shares
Held at
June 30, 2018 | | Dividends | | Net Realized
Gains (Losses) | | Net Change in
Unrealized
Appreciation
(Depreciation) | | Value at
June 30, 2018 | |
Hudson Global, Inc. | | | 2,187,600 | | | | — | | | | — | | | | 2,187,600 | | | $ | — | | | $ | — | | | $ | 612,528 | | | $ | 3,543,912 | | |
Noranda Aluminum
Holding Corp. | | | 800,300 | | | | — | | | | — | | | | 800,300 | | | | — | | | | — | | | | 6,963 | | | | 24,569 | | |
Real Industry, Inc. + | | | 2,307,708 | | | | — | | | | (2,307,708 | )* | | | — | | | | — | | | | — | | | | 7,306,616 | | | | — | | |
| | | | | | | | | | $ | — | | | $ | — | | | $ | 7,926,107 | | | | |
+ Issuer was not an affiliate as of June 30, 2018.
* Reductions due to corporate action.
79
Value Opportunities Fund
| Issuer Name | | Shares
Held at
July 1, 2017 | | Additions | | Reductions | | Shares
Held at
June 30, 2018 | | Dividends | | Net Realized
Gains (Losses) | | Net Change in
Unrealized
Appreciation
(Depreciation) | | Value at
June 30, 2018 | |
GHW Holdco LLC | | | 2 | | | | 38 | | | | — | | | | 40 | | | $ | — | | | $ | — | | | $ | 1,196,121 | | | $ | 2,009,120 | | |
Iracore Investments
Holdings, Inc. | | | 32,422 | | | | — | | | | — | | | | 32,422 | | | | — | | | | — | | | | — | | | | 6,892,269 | | |
Motors Liquidation
Company GUC
Trust | | | 1,048,100 | | | | 575,000 | | | | | | | | 1,623,100 | | | | — | | | | — | | | | 1,641,360 | | | | 16,078,834 | | |
| | | | | | | | | | $ | — | | | $ | — | | | $ | 2,837,481 | | | | |
High Yield Fund
| Issuer Name | | Shares
Held at
July 1, 2017 | | Additions | | Reductions | | Shares
Held at
June 30, 2018 | | Dividends | | Net Realized
Gains (Losses) | | Net Change in
Unrealized
Appreciation
(Depreciation) | | Value at
June 30, 2018 | |
American Zinc
Recycling LLC
(formerly Horsehead
Holding LLC) | | | 76,444 | | | | — | | | | — | | | | 76,444 | | | $ | — | | | $ | — | | | $ | 10,832,016 | | | $ | 30,319,984 | | |
GHW Holdco LLC | | | 1 | | | | 26 | | | | — | | | | 27 | | | | — | | | | — | | | | 797,582 | | | | 1,339,581 | | |
Iracore Investments
Holdings, Inc. | | | 22,092 | | | | — | | | | — | | | | 22,092 | | | | — | | | | — | | | | — | | | | 4,696,318 | | |
RA Parent, Inc. | | | — | | | | 288 | * | | | — | | | | 288 | | | | — | | | | — | | | | (6,122,295 | ) | | | 11,731,221 | | |
| | | | | | | | | | $ | — | | | $ | — | | | $ | 5,507,303 | | | | |
* Additions due to corporate action.
NOTE 7.
Securities Lending. Effective December 2007, the Funds entered into a securities lending arrangement with Brown Brothers Harriman & Co. (the "Custodian"). Under the securities lending agreement, the Custodian is authorized to loan securities on behalf of the Funds to approved brokers. In exchange, the Funds receive cash collateral in the amount of at least 102% of the value of the securities loaned plus accrued interest. The total market value of securities on loan for each Fund is disclosed on the Schedule of Investments. The cash collateral is invested in short-term instruments as noted on the Schedule of Investments. Income earned from these investments is included in "Securities on loan, net" on the Statements of Operations and is allocated to each Fund based on each Fund's proportion of the total cash collateral received. Securities lending involves counterparty risks, including the risk that the loaned securities may not be returned in a timely manner or at all. Subject to certain conditions, the Custodian has agreed to indemnify the Funds from losses resulting from a borrower's failure to return a loaned security. In addition, the Funds bear the risk of loss associated with the investment of cash collateral received.
A portion of the income generated by the investment of the collateral, net of any rebates paid by the Custodian to borrowers, is remitted to the Custodian as lending agent, and the remainder is paid to the applicable Fund.
NOTE 8.
Commitments and Contingencies. Under the Trust's organizational documents and indemnification agreements between each independent Trustee and the Trust, its officers and Trustees are indemnified against certain liability arising out of the performance of their duties to the Trust. In addition, in the normal course of business the Trust enters into contracts that contain a variety of representations and warranties, which provide general indemnifications. The Funds' maximum exposure under these arrangements is unknown, as this would involve future claims that may be made against the Funds. However, based on experience, the Funds expect the risk of loss to be remote.
Bridge loan commitments may obligate a Fund to furnish temporary financing to a borrower until permanent financing can be arranged. At June 30, 2018, the Capital Income Fund and High Yield Fund had outstanding bridge loan commitments of $50,000 and $9,760,000, respectively.
Unfunded loan commitments are contractual obligations for funding to a borrower. At June 30, 2018, the Funds did not have any outstanding unfunded loan commitments.
NOTE 9.
Risk Factors. Investing in a Fund may involve certain risks including, but not limited to, those described below.
Lower rated debt securities generally have higher rates of interest and involve greater risk of default or price changes due to changes in the issuer's creditworthiness than higher rated debt securities. The market prices of these securities may fluctuate more than higher quality securities and may decline significantly in periods of general economic difficulty. There may be little trading in the secondary market for particular debt securities, which may make them more difficult to value or sell.
80
The prices of, and the income generated by, most debt securities held by a Fund may be affected by changing interest rates and by changes in the effective maturities and credit ratings of these securities. For example, the prices of debt securities in a Fund's portfolio generally will decline when interest rates rise and increase when interest rates fall. In addition, falling interest rates may cause an issuer to redeem, "call" or refinance a security before its stated maturity, which may result in the Fund having to reinvest the proceeds in lower yielding securities. Debt securities are also subject to credit risk, which is the possibility that the credit strength of an issuer will weaken and/or an issuer of a debt security will fail to make timely payments of principal or interest and the security will go into default. Longer maturity debt securities generally have higher rates of interest and may be subject to greater price fluctuations than shorter maturity debt securities.
Certain Funds may invest in foreign (non-U.S.) securities and may experience more rapid and extreme changes in value than a fund that invests exclusively in securities of U.S. companies. The securities markets of many foreign countries are relatively small, with a limited number of companies representing a small number of industries. Additionally, reporting, accounting and auditing standards of foreign countries differ, in some cases significantly, from U.S. standards. Also, nationalization, expropriation or confiscatory taxation, currency blockage, political changes or diplomatic developments could adversely affect a Fund's investments in a foreign country.
The Funds are subject to management risk because each Fund is an actively managed investment portfolio. Consequently, the Funds are subject to the risks that the methods and analysis employed by the Advisor may not produce the desired results and result in losses to the Funds.
The prices of, and the income generated by, the common stocks and other equity securities held by a Fund may decline in response to certain events taking place around the world, including those directly involving the issuers whose securities are owned by the Fund; conditions affecting the general economy; overall market changes; local, regional or global political, social or economic instability; governmental or governmental agency responses to economic conditions; and currency, interest rate and commodity price fluctuations.
Certain funds, accounts, individuals or affiliates may from time to time own (beneficially or of record) or control a significant percentage of a Fund's shares. Redemptions by these entities of their holdings in the Fund may impact the Fund's liquidity and net asset value ("NAV"). These redemptions may also force the Fund to sell securities.
NOTE 10.
New Accounting Pronouncements. In March 2017, the FASB issued Accounting Standards Update ("ASU") No. 2017-08, Receivables — Nonrefundable Fees and Other Costs (Subtopic 310-20): Premium Amortization on Purchased Callable Debt Securities. The amendments in the ASU shorten the amortization period for certain callable debt securities, held at a premium, to be amortized to the earliest call date. The ASU does not require an accounting change for securities held at a discount; which continues to be amortized to maturity. The ASU is effective for fiscal years and interim periods within those fiscal years beginning after December 15, 2018. Management is currently evaluating the impact, if any, of applying this provision.
NOTE 11.
Subsequent Events. The Board approved a reduction in the annual advisory fee rate and annual cap on expenses for certain Funds to be effective August 29, 2018.
| | Diversified
Value | | Large Cap
Value | | Global
Value | | International
Value | |
Annual Advisory Fee Rate | | | 0.70 | %1 | | | 0.70 | %2 | | | 0.75 | % | | | 0.80 | % | |
Annual cap on expenses — Class I | | | 0.80 | % | | | 0.95 | % | | | 0.95 | % | | | 0.95 | % | |
Annual cap on expenses — Class A | | | 1.05 | % | | | 1.20 | % | | | 1.20 | % | | | 1.20 | % | |
Annual cap on expenses — Class C | | | 1.80 | % | | | 1.95 | % | | | 1.95 | % | | | 1.95 | % | |
Annual cap on expenses — Class R | | | N/A | | | | 1.45 | % | | | N/A | | | | N/A | | |
Annual cap on expenses — Class T | | | 1.05 | % | | | 1.20 | % | | | 1.20 | % | | | 1.20 | % | |
1 The Annual Advisory Fee Rate is 0.70% for the first $250 million in assets, 0.60% for the next $250 million in assets and 0.50% thereafter.
2 The Annual Advisory Fee Rate is 0.70% for the first $500 million in assets, 0.60% for the next $500 million in assets and 0.55% thereafter.
Management has evaluated subsequent events in the preparation of the Funds' financial statements and has determined that there are no additional events that require recognition or disclosure in the financial statements.
NOTE 12.(UNAUDITED)
Federal Tax Disclosure. The Funds designated as long-term capital gain dividends, pursuant to Internal Revenue Code Section 852(b)(3), the amount necessary to reduce the earnings and profits of the Funds related to net capital gains to zero for the tax year ended June 30, 2018.
For the year ended June 30, 2018, the following percentages of ordinary distributions paid qualify for the dividend received deduction available to corporate shareholders: Diversified Value Fund — 100.00%, Large Cap Value Fund — 100.00%, Mid-Cap Value Fund — 65.47%, Small Cap Value Fund — 59.61%, Small Cap Diversified Value Fund — 27.50%, Global Value Fund — 49.19%, International Value Fund — 0.00%, Value Opportunities Fund — 50.12%, Capital Income Fund — 13.90%, High Yield Fund — 1.13%.
For the year ended June 30, 2018, the following percentages of ordinary distributions paid are designated as qualified dividend income under the Jobs and Growth Tax Relief Reconciliation Act of 2003: Diversified Value Fund — 100.00%, Large Cap Value Fund — 100.00%, Mid-Cap Value Fund — 75.78%, Small Cap Value Fund — 59.61%, Small Cap Diversified Value Fund — 28.44%, Global Value Fund — 94.84%, International Value Fund — 100.00%, Value Opportunities Fund — 64.78%, Capital Income Fund — 27.99%, High Yield Fund — 1.13%. Shareholders should consult their tax advisors.
81
For the year ended June 30, 2018, the Global Value Fund and International Value Fund earned foreign source income of $117,043 and $57,146, respectively, and paid foreign taxes of $9,173 and $4,666, respectively, which each Fund intends to pass through to shareholders pursuant to Section 853 of the Internal Revenue Code.
Additional Information Applicable to Foreign Shareholders Only. For the year ended June 30, 2018, the Funds designate the following percentages of ordinary distributions paid as interest-related dividends under Internal Revenue Code Section 871(k)(1)(c): Diversified Value Fund — 0.09%, Large Cap Value Fund — 0.12%, Mid-Cap Value Fund — 0.51%, Small Cap Value Fund — 0.24%, Small Cap Diversified Value Fund — 0.22%, Global Value Fund — 0.31%, International Value Fund — 0.29%, Value Opportunities Fund — 18.93%, Capital Income Fund — 63.54%, High Yield Fund — 95.13%.
For the year ended June 30, 2018, the following percentages of ordinary income distributions paid are designated as short-term capital gain distributions under Internal Revenue Code Section 871(k)(2)(c): Diversified Value Fund — 0.00%, Large Cap Value Fund — 0.00%, Mid-Cap Value Fund — 5.84%, Small Cap Value Fund — 58.37%, Small Cap Diversified Value Fund — 91.99%, Global Value Fund — 40.90%, International Value Fund — 15.65%, Value Opportunities Fund — 4.97%, Capital Income Fund — 0.00%, High Yield Fund — 0.00%.
82
Report of Independent Registered Public Accounting Firm
To the Shareholders and Board of Trustees
of Hotchkis & Wiley Funds
Opinion on the Financial Statements and Financial Highlights
We have audited the accompanying statements of assets & liabilities of Hotchkis & Wiley Funds (the "Funds") comprising the Diversified Value Fund, Large Cap Value Fund, Mid-Cap Value Fund, Small Cap Value Fund, Small Cap Diversified Value Fund, Global Value Fund, International Value Fund, Value Opportunities Fund, Capital Income Fund, and High Yield Fund, including the schedules of investments, as of June 30, 2018, the related statements of operations for the year then ended, the statements of changes in net assets for each of the two years in the period then ended, the financial highlights for each of the five years in the period then ended for the Funds, except, Small Cap Diversified Value Fund which is for each of the three years in the period then ended and for the period from June 30, 2014 (commencement of operations) to June 30, 2015, and International Value Fund, which is for each of the two years in the period then ended and for the period from December 31, 2015 (commencement of operations) to June 30, 2016, and the related notes. In our opinion, the financial statements and financial highlights present fairly, in all material respects, the financial position of the Funds as of June 30, 2018, and the results of its operations for the year then ended, the changes in its net assets for each of the two years in the period then ended, and the financial highlights for each of the five years in the period then ended for the Funds, except, Small Cap Diversified Value Fund which is for each of the three years in the period then ended and for the period from June 30, 2014 (commencement of operations) to June 30, 2015, and International Value Fund, which is for each of the two years in the period then ended and for the period from December 31, 2015 (commencement of operations) to June 30, 2016, in conformity with accounting principles generally accepted in the United States of America.
Basis for Opinion
These financial statements and financial highlights are the responsibility of the Funds' management. Our responsibility is to express an opinion on the Funds' financial statements and financial highlights based on our audits. We are a public accounting firm registered with the Public Company Accounting Oversight Board (United States) (PCAOB) and are required to be independent with respect to the Funds in accordance with the U.S. federal securities laws and the applicable rules and regulations of the Securities and Exchange Commission and the PCAOB.
We conducted our audits in accordance with the standards of the PCAOB. Those standards require that we plan and perform the audit to obtain reasonable assurance about whether the financial statements and financial highlights are free of material misstatement, whether due to error or fraud. The Funds are not required to have, nor were we engaged to perform, an audit of its internal control over financial reporting. As part of our audits we are required to obtain an understanding of internal control over financial reporting but not for the purpose of expressing an opinion on the effectiveness of the Funds' internal control over financial reporting. Accordingly, we express no such opinion.
Our audits included performing procedures to assess the risks of material misstatement of the financial statements and financial highlights, whether due to error or fraud, and performing procedures that respond to those risks. Such procedures included examining, on a test basis, evidence regarding the amounts and disclosures in the financial statements and financial highlights. Our audits also included evaluating the accounting principles used and significant estimates made by management, as well as evaluating the overall presentation of the financial statements and financial highlights. Our procedures included confirmation of securities owned as of June 30, 2018, by correspondence with the custodian and brokers; when replies were not received from brokers, we performed other auditing procedures. We believe that our audits provide a reasonable basis for our opinion.
Deloitte & Touche LLP
Los Angeles, California
August 21, 2018
We have served as the auditor of one or more Hotchkis & Wiley Funds investment companies since 2012.
83
Fund Expense Examples (Unaudited)
As a mutual fund shareholder, you incur two types of costs: (1) transaction costs such as initial sales charges (loads) on purchase payments and contingent deferred sales charges and redemption fees on redemptions and (2) ongoing costs, including management fees, distribution and service (12b-1) fees and other fund expenses. The following examples are intended to help you understand your ongoing costs (in dollars) of investing in the Funds and to compare these costs with the ongoing costs of investing in other mutual funds. The examples are based on an investment of $1,000 invested at the beginning of the most recent six-month period and held for the entire period (January 1, 2018 – June 30, 2018).
The table below illustrates the Funds' costs in two ways:
Based on actual fund returns. This section provides information about actual account values and actual expenses. You may use the information in this section, together with the amount you invested, to estimate the expenses that you paid over the period. Simply divide your account value by $1,000 (for example, an $8,600 account value divided by $1,000 = 8.6), then multiply the result by the number in the section under the heading entitled "Expenses Paid During Period" to estimate the expenses you paid on your account during this period.
Based on hypothetical 5% yearly returns. This section provides information about hypothetical account values and hypothetical expenses based on the Funds' actual expense ratios and an assumed rate of return of 5% per year before expenses, which is not the Funds' actual return. The hypothetical account values and expenses may not be used to estimate the actual ending account balance or expenses you paid for the period. You may use this information to compare the ongoing costs of investing in the Funds and other funds. To do so, compare this 5% hypothetical example with the 5% hypothetical examples that appear in the shareholder reports of the other funds.
Please note that the expenses shown in the table are meant to highlight your ongoing costs only and do not reflect any transactional costs, such as sales charges (loads). Therefore, the second section is useful in comparing ongoing costs only, and will not help you determine the relative total costs of owning different funds. In addition, if these transactional costs were included, your costs would have been higher.
The calculations assume no shares were bought or sold during the period. Your actual costs may have been higher or lower, depending on the amount of your investment and the timing of any purchases or redemptions.
| | Based on Actual Fund Returns | | Based on Hypothetical 5% Yearly Returns | | | |
| | Beginning
Account Value
1/1/18 | | Ending
Account Value
6/30/18 | | Expenses Paid
During Period*
1/1/18 - 6/30/18 | | Beginning
Account Value
1/1/18 | | Ending
Account Value
6/30/18 | | Expenses Paid
During Period*
1/1/18 - 6/30/18 | |
Annualized
Expense Ratio | |
Diversified Value Fund | |
Class I | | $ | 1,000.00 | | | $ | 997.90 | | | $ | 4.71 | | | $ | 1,000.00 | | | $ | 1,020.08 | | | $ | 4.76 | | | | 0.95 | % | |
Class A | | | 1,000.00 | | | | 996.80 | | | | 5.94 | | | | 1,000.00 | | | | 1,018.84 | | | | 6.01 | | | | 1.20 | | |
Class C | | | 1,000.00 | | | | 993.10 | | | | 9.64 | | | | 1,000.00 | | | | 1,015.12 | | | | 9.74 | | | | 1.95 | | |
Large Cap Value Fund | |
Class I | | | 1,000.00 | | | | 998.80 | | | | 4.81 | | | | 1,000.00 | | | | 1,019.98 | | | | 4.86 | | | | 0.97 | | |
Class A | | | 1,000.00 | | | | 997.60 | | | | 6.04 | | | | 1,000.00 | | | | 1,018.74 | | | | 6.11 | | | | 1.22 | | |
Class C | | | 1,000.00 | | | | 993.90 | | | | 9.74 | | | | 1,000.00 | | | | 1,015.03 | | | | 9.84 | | | | 1.97 | | |
Class R | | | 1,000.00 | | | | 996.10 | | | | 7.28 | | | | 1,000.00 | | | | 1,017.50 | | | | 7.35 | | | | 1.47 | | |
Mid-Cap Value Fund | |
Class I | | | 1,000.00 | | | | 1,055.90 | | | | 4.79 | | | | 1,000.00 | | | | 1,020.13 | | | | 4.71 | | | | 0.94 | | |
Class A | | | 1,000.00 | | | | 1,054.30 | | | | 6.06 | | | | 1,000.00 | | | | 1,018.89 | | | | 5.96 | | | | 1.19 | | |
Class C | | | 1,000.00 | | | | 1,050.50 | | | | 9.86 | | | | 1,000.00 | | | | 1,015.17 | | | | 9.69 | | | | 1.94 | | |
Class R | | | 1,000.00 | | | | 1,053.20 | | | | 7.33 | | | | 1,000.00 | | | | 1,017.65 | | | | 7.20 | | | | 1.44 | | |
Small Cap Value Fund | |
Class I | | | 1,000.00 | | | | 1,058.00 | | | | 5.10 | | | | 1,000.00 | | | | 1,019.84 | | | | 5.01 | | | | 1.00 | | |
Class A | | | 1,000.00 | | | | 1,056.80 | | | | 6.37 | | | | 1,000.00 | | | | 1,018.60 | | | | 6.26 | | | | 1.25 | | |
Class C | | | 1,000.00 | | | | 1,052.80 | | | | 10.18 | | | | 1,000.00 | | | | 1,014.88 | | | | 9.99 | | | | 2.00 | | |
Small Cap Diversified Value Fund | |
Class I | | | 1,000.00 | | | | 1,065.40 | | | | 4.61 | | | | 1,000.00 | | | | 1,020.33 | | | | 4.51 | | | | 0.90 | | |
Class A | | | 1,000.00 | | | | 1,063.00 | | | | 5.88 | | | | 1,000.00 | | | | 1,019.09 | | | | 5.76 | | | | 1.15 | | |
Global Value Fund | |
Class I | | | 1,000.00 | | | | 1,015.30 | | | | 5.50 | | | | 1,000.00 | | | | 1,019.34 | | | | 5.51 | | | | 1.10 | | |
Class A | | | 1,000.00 | | | | 1,013.70 | | | | 6.74 | | | | 1,000.00 | | | | 1,018.10 | | | | 6.76 | | | | 1.35 | | |
International Value Fund | |
Class I | | | 1,000.00 | | | | 969.80 | | | | 5.62 | | | | 1,000.00 | | | | 1,019.09 | | | | 5.76 | | | | 1.15 | | |
84
Fund Expense Examples (Unaudited)
| | Based on Actual Fund Returns | | Based on Hypothetical 5% Yearly Returns | | | |
| | Beginning
Account Value
1/1/18 | | Ending
Account Value
6/30/18 | | Expenses Paid
During Period*
1/1/18 - 6/30/18 | | Beginning
Account Value
1/1/18 | | Ending
Account Value
6/30/18 | | Expenses Paid
During Period*
1/1/18 - 6/30/18 | |
Annualized
Expense Ratio | |
Value Opportunities Fund | |
Class I | | $ | 1,000.00 | | | $ | 1,032.60 | | | $ | 4.89 | | | $ | 1,000.00 | | | $ | 1,019.98 | | | $ | 4.86 | | | | 0.97 | % | |
Class A | | | 1,000.00 | | | | 1,031.20 | | | | 6.14 | | | | 1,000.00 | | | | 1,018.74 | | | | 6.11 | | | | 1.22 | | |
Class C | | | 1,000.00 | | | | 1,027.30 | | | | 9.90 | | | | 1,000.00 | | | | 1,015.03 | | | | 9.84 | | | | 1.97 | | |
Capital Income Fund | |
Class I | | | 1,000.00 | | | | 1,028.70 | | | | 4.02 | | | | 1,000.00 | | | | 1,020.83 | | | | 4.01 | | | | 0.80 | | |
Class A | | | 1,000.00 | | | | 1,027.10 | | | | 5.28 | | | | 1,000.00 | | | | 1,019.59 | | | | 5.26 | | | | 1.05 | | |
High Yield Fund | |
Class I | | | 1,000.00 | | | | 999.60 | | | | 3.47 | | | | 1,000.00 | | | | 1,021.32 | | | | 3.51 | | | | 0.70 | | |
Class A | | | 1,000.00 | | | | 999.00 | | | | 4.71 | | | | 1,000.00 | | | | 1,020.08 | | | | 4.76 | | | | 0.95 | | |
Class C | | | 1,000.00 | | | | 993.80 | | | | 8.40 | | | | 1,000.00 | | | | 1,016.36 | | | | 8.50 | | | | 1.70 | | |
Class Z | | | 1,000.00 | | | | 1,005.90 | | | | 1.50 | ** | | | 1,000.00 | | | | 1,021.82 | | | | 3.01 | | | | 0.60 | | |
* Expenses are equal to the Funds' annualized expense ratio by class multiplied by the average account value over the period, multiplied by the number of days in the most recent fiscal half-year (181), then divided by the number of days in the most recent fiscal year (365).
** Actual expenses are equal to the Fund's annualized expense ratio for Class Z multiplied by the average account value over the period, multiplied by 91/365 (to reflect the commencement of operations to June 30, 2018).
85
Board Considerations In Approving Continuation of Investment Advisory Agreements
Background and Approval Process. Hotchkis and Wiley Capital Management, LLC (the "Advisor") serves as investment adviser to the Hotchkis and Wiley Diversified Value Fund, the Hotchkis and Wiley Large Cap Value Fund, the Hotchkis and Wiley Mid-Cap Value Fund, the Hotchkis and Wiley Small Cap Value Fund, the Hotchkis and Wiley Small Cap Diversified Value Fund, the Hotchkis and Wiley Global Value Fund, the Hotchkis and Wiley International Value Fund, the Hotchkis and Wiley Value Opportunities Fund, the Hotchkis and Wiley Capital Income Fund and the Hotchkis and Wiley High Yield Fund (each a "Fund" and collectively, the "Funds") pursuant to separate investment advisory agreements (the "Advisory Agreements") with the Hotchkis and Wiley Funds (the "Trust"). The Advisory Agreements were initially approved by the Board of Trustees at the inception of each Fund for two-year terms. The Advisory Agreements continue thereafter if approved annually by the Board of Trustees of the Trust, including a majority of the Trustees who are not "interested persons" (as defined in the Investment Company Act of 1940, as amended (the "1940 Act")) (the "Independent Trustees"), by a vote cast in person at a meeting called for the purpose of voting on the Advisory Agreements. The Advisory Agreements for each Fund were renewed by the Board at a meeting held in May 2018 and for four funds amended in August, 2018.
As part of the annual contract review process, the Independent Trustees, through their independent legal counsel, requested and received extensive materials, including information relating to: (i) the nature, extent and quality of services provided by the Advisor, along with compliance with legal requirements, (ii) short-term and longer-term total return of each Fund relative to their respective peer groups and market indices, (iii) the costs of the services provided and the Advisor's estimated profitability with respect to the management of each Fund, (iv) the extent to which the Advisor has in the past or is likely in the future to experience economies of scale in connection with the investment advisory services it provides to each Fund, (v) the expense ratios of each Fund as compared with the expense ratios of funds in its respective peer group, and (vi) benefits to the Advisor and its affiliates from its relationship with the Funds. The Independent Trustees also requested and received information specifically related to the Advisor's risk controls and risk assessment process. The Independent Trustees noted that the information provided by the Advisor was thorough and responsive to their requests. The information provided in response to their request was in addition to information received by the Board throughout the year, both in writing and during meetings, regarding the Funds, including Fund performance, expense ratios, portfolio composition and regulatory compliance. The Independent Trustees also held a conference call with their independent legal counsel in April 2018 to review the materials provided by the Advisor and were advised regarding the duties of directors/trustees under the 1940 Act and relevant state law in reviewing and approving investment advisory contracts. The Independent Trustees, through their legal counsel, then provided follow-up questions to the Advisor to which they received responses in advance of the Funds' May Board meeting.
At the May Board meeting, representatives of the Advisor discussed certain responses with the Board and responded to their further questions. The Board considered the factors set out in case law and identified by the Securities and Exchange Commission as most relevant in considering the renewal of investment advisory agreements. The Board determined that, given the totality of the information provided with respect to the Advisory Agreements, the Board had received sufficient information to renew each Advisory Agreement.
The Board considered these and other factors, as summarized in more detail below, and concluded that the terms of each Advisory Agreement are fair and reasonable and the continuance of each Advisory Agreement is in the best interests of the applicable Fund. In deciding to approve the renewal of each Advisory Agreement, the Board did not identify any single factor or group of factors as all important or controlling and considered all factors together. The Board did not allot a particular weight to any one factor or group of factors.
Nature, Extent and Quality of Services. As part of the Board's decision-making process, the Board noted that the Advisor and its predecessors have managed the Funds and their predecessors since their inception, and the Board believes that a long-term relationship with a capable, conscientious investment adviser is in the best interests of the Funds. The Board also considered that shareholders invest in a Fund specifically seeking the Advisor's investment expertise and style. The Board also noted that when shareholders invest in a Fund, they know the advisory fee that is paid by the Fund. In this connection, the Board considered, in particular, that each Fund is managed in accordance with its investment objective and policies as disclosed to shareholders.
The Board reviewed information regarding various services provided by the Advisor to the Funds, including an organizational chart and background information on personnel performing such services. The Board also reviewed each Fund's performance and information regarding the Advisor's investment program, which is driven by team-oriented, in-depth, fundamental research. The Board considered the depth and quality of the Advisor's investment process, the low turnover rates of the Advisor's key personnel, the overall stability of the Advisor's organization, and the experience, capability and integrity of its senior management. The Board considered the portfolio managers' significant investments in the Funds. The Board reviewed the Trust's compliance program and the resultant compliance by the Funds and the Advisor with legal requirements.
The Board also considered other non-advisory services provided to the Funds, such as the services of Advisor employees as Trust officers and other personnel provided that are necessary for Fund operations. The Board particularly noted that the services of the Trust's Chief Compliance Officer are provided to the Funds at no cost to the Funds. The Board noted that the Advisor organizes Board meetings and the preparation of Board meeting materials, and those Advisor employees serving as Trust officers oversee and manage the other Fund service providers.
Based on their review, the Board concluded that the nature, extent and quality of services provided (and expected to be provided) to each Fund under its Advisory Agreement were satisfactory.
Investment Performance of the Funds and the Advisor. The Board noted that they review data on the short-term and longer-term total return of the Funds in connection with each quarterly Board meeting. For the contract review meeting, the Board reviewed a report prepared by the Trust's administrator (the "Report") using information provided by Morningstar, Inc., an independent provider of mutual fund data, that compared the total return of Class I shares of each Fund to that of a small group of funds that are similar primarily in terms of investment style (each, a "Peer Group"), for periods ended December 31, 2017. The Peer Groups were selected by the Advisor based on its criteria to determine an appropriate group of competitor funds. In addition, data regarding performance of the Peer Group funds is provided at each quarterly Board meeting. The Board also considered total return information for various periods through March 2018 that was provided by the Advisor.
86
The Board considered the total return information for each Fund for applicable periods up to 10 years. The Board noted that all Funds with at least 5 years of performance (i.e., all but the Small Cap Diversified Value Fund and International Value Fund) outperformed the median total return of their respective Peer Group for the 5-year period ended December 31, 2017, except the Mid-Cap Value Fund which underperformed the median total return of its Peer Group. The Board noted that for the 3-year period ended December 31, 2017, the Large Cap Value, Small Cap Diversified Value Fund, Global Value, Value Opportunities, Capital Income and High Yield Funds equaled or outperformed the median total return of their respective Peer Group. The Board also noted that for the 3-year period ended December 31, 2017, the Diversified Value, Small Cap Value and Mid-Cap Value Funds underperformed the median total return of their respective Peer Group. The Board considered that for the 1-year period ended December 31, 2017, the Diversified Value, Large Cap Value, Small Cap Diversified Value and High Yield Funds outperformed the median total return of their respective Peer Group, but the Mid-Cap Value, Small Cap Value, Global Value, International Value, Value Opportunities and Capital Income Funds underperformed the median total return of their respective Peer Group. The Board also considered the Advisor's supplemental report for periods through March 31, 2018, but focused more on longer-term than short-term performance of the Funds versus their respective Peer Groups.
In addition, the Board reviewed each Fund's total return to that of its respective benchmark index(es). The Independent Trustees reviewed the variability of the performance of the Funds over time in light of the Advisor's investment strategy for each Fund.
Fees, Expenses and Profitability. The Board reviewed expense data using information provided by Morningstar, Inc., contained in the Report, including information regarding any expense caps for the Funds. The Board reviewed data in the Report showing how the Funds' advisory fees and expense ratios compared to those in their respective Peer Groups. The Board also reviewed information provided by the Advisor on advisory fees charged by the Advisor for sub-advisory services it provides to other mutual funds and advisory fees it charges to its separate account clients with investment objectives and policies similar to those of the Funds. The Board considered a list of the many additional functions performed for the Funds that the Advisor does not perform for its separate account and sub-advisory clients and noted it is generally acknowledged that managing mutual funds subjects an investment adviser to more legal and regulatory risk than is the case with separate accounts.
With respect to the advisory fee for each Fund, the Board noted that the Report showed that the Diversified Value, Large Cap Value, Mid-Cap Value, International Value, Value Opportunities and Capital Income Funds' advisory fees were higher than the median of their respective Peer Groups, that the Small Cap Value Fund's advisory fee was lower than the median of its Peer Group, and that the Small Cap Diversified Value, Global Value and High Yield Funds' advisory fees were the same as the median of their respective Peer Group. The Board further considered that at the request of the Independent Trustees, that the Advisor reviewed the advisory fees for certain funds and at the August meeting proposed reductions in the advisory fee for the Diversified Value Fund, Large Cap Value Fund, Global Value Fund and International Value Fund; which the Board approved. The Board noted that the Advisor uses a research-intensive process. With respect to the expense ratios for the Funds, the Board noted that the Report showed that each Funds' net expense ratios were higher than the median of their respective Peer Group, except that the Value Opportunities and High Yield Funds' net expense ratios were equal to the median of their respective Peer Group. The Board considered the expense caps put in place by the Advisor (as further described below). The Board noted the quality of the Advisor's investment process and concluded that the advisory fee and expense ratios were fair and reasonable for each Fund.
The Board reviewed information concerning the estimated profitability to the Advisor of the Advisory Agreements, including information regarding the methodology for allocating expenses. The Board reviewed data regarding the Advisor's variable expenses and fixed expenses. The Board considered that in 2017, as in recent prior years, the Advisor had absorbed costs above expense caps for certain of the Funds for which it would not be reimbursed. The Board also noted that the annualized expense ratio was above the expense cap for the Diversified Value, Small Cap Diversified Value, Global Value, International Value, Capital Income and High Yield Funds in 2017. The Board noted that the Advisor has agreed to continue the expense caps and at the August 2018 meeting, lower the expense limitation for the Diversified Value Fund, Large Cap Value Fund, Global Value Fund and International Value Fund. The Board also recognized that individual fund or product line profitability of other advisers is generally not publicly available, and that profitability may be affected by numerous factors, so that the comparability of profitability among advisory firms is limited. The Board noted the importance of the Advisor's profitability — which is derived solely from investment management fees — in maintaining its entrepreneurial environment in a private, primarily employee-owned structure. They noted that the Advisor's compensation/profit structure facilitates retention of its management and investment professionals. They also noted that from time to time the Advisor had voluntarily limited growth of assets by closing certain Funds to new investors, and that currently the Small Cap Value Fund has limited availability for purchase. The Board noted that closing Funds is financially disadvantageous to the Advisor, and illustrated a commitment to act in the best interests of Fund shareholders. The Board concluded that the level of estimated profitability to the Advisor under the Advisory Agreements appeared to be not unreasonable.
Economies of Scale and Whether Fee Levels Reflect These Economies of Scale. The Board considered information regarding the investment, compliance and client service personnel who have been hired by the Advisor, the Advisor's investment in technology resources and the back office services outsourced by the Advisor. The Board concluded that the Funds' shareholders share in the additional services, investment in talented employees and technology improvements provided by the Advisor without an increase in advisory fees. The Board also noted that the addition of breakpoints to the Diversified Value, Large Cap Value and Mid-Cap Value Funds has in the past enabled, and may in the future enable, shareholders to share in economies of scale.
Indirect Benefits to the Advisor from its Relationship to the Funds. The Board considered information regarding any indirect benefits to the Advisor that could be identified from its relationship to the Funds. In particular, the Board considered that the Advisor has the ability to use commission sharing arrangements that allow the Advisor to pay for third-party research with the equity Funds' soft dollars. The Board considered that the bundled research services and the use of commission sharing arrangements provides valuable information or service to the investment research process, which benefits the Funds (as well as the Advisor who use (or can use) the research for the benefit of the Advisor's other clients). The Board noted that the ability to use the Funds' soft dollars to obtain third-party research is a fallout benefit to the Advisor.
* * * *
Based on their review, including their consideration of each of the factors referred to above, the Board, including all of the Independent Trustees, concluded that the terms of each Advisory Agreement are fair and reasonable and that the renewal of each Advisory Agreement is in the best interests of each Fund.
87
INDEPENDENT TRUSTEES
Name and Year of Birth | | Position
Held with
the Trust | | Term of
Office* and
Length of
Time Served | | Principal Occupation(s) During
Past Five Years | | Number of
Portfolios in
Fund Complex
Overseen by
Trustee | | Other
Directorships
Held by Trustee
During Past
Five Years | |
Randall H. Breitenbach
(born 1960) | | Trustee
Chairman | | Since 2001
Since 2018 | | Non-Executive Director and Vice Chairman, BreitBurn Energy Partners, L.P. (2012 — present); Co-Founder, Director and CEO, Pacific Coast Energy Company, LP and President, BreitBurn Energy Partners, L.P. (1988 — present); Chairman Emeritus, Finance Committee, Stanford University PIC Endowment (1999 — present); Founder, Chairman and CEO, Bridge Energy LLC (2017 — present). | | Ten | | BreitBurn Energy Partners, L.P.; Pacific Coast Energy Company, LP | |
Alejandra C. Edwards, Ph.D.
(born 1954) | | Trustee(a) | | Since 2007 | | California State University — Long Beach: Professor of Economics (1994 — 2015). | | Ten | | None | |
Marcy Elkind, Ph.D.
(born 1947) | | Trustee
Vice Chair | | Since 2005
Since 2018 | | President, Elkind Economics, Inc. (1980 — present). | | Ten | | None | |
Robert Fitzgerald
(born 1952) | | Trustee(b) | | Since 2005 | | Retired. Chief Financial Officer of National Retirement Partners, Inc. (2005 — 2007); Executive Vice President and Chief Financial Officer of PIMCO Advisors L.P. (1995 — 2001). | | Ten | | Independent Trustee, Brandes Investment Trust (10 portfolios) | |
H. Thomas Hicks
(born 1950) | | Trustee(c) | | Since 2017 | | Retired. Chief Financial Officer, URS Corporation (2005 — 2015). | | Ten | | None | |
Donald Morrison, Ph.D.
(born 1939) | | Trustee | | Since 2007 | | The William E. Leonhard Professor in the Anderson Graduate School of Management at the University of California, Los Angeles (1988 — present). | | Ten | | None | |
* Each Independent Trustee serves until his or her successor is elected and qualified or until his or her death or resignation or removal as provided in the Trust's Agreement and Declaration of Trust.
(a) Chair of the Nominating and Governance Committee.
(b) Chair of the Audit Committee.
(c) Vice Chair of the Audit Committee.
INTERESTED TRUSTEE
Name and Year of Birth | | Position
Held with
the Trust | | Term of
Office** and
Length of
Time Served | | Principal Occupation(s) During
Past Five Years | | Number of
Portfolios in
Fund Complex
Overseen by
Trustee | | Other
Directorships
Held by Trustee
During Past
Five Years | |
George H. Davis, Jr.*
(born 1961) | | Trustee | | Since 2007 | | Chief Executive Officer and Portfolio Manager of Hotchkis & Wiley Capital Management, LLC (the "Advisor") (2001 — present). | | Ten | | None | |
* Mr. Davis is an "interested person," as defined in the 1940 Act, of the Trust based on his position as Chief Executive Officer and Portfolio Manager of the Advisor.
** As Trustee, Mr. Davis serves until his successor is elected and qualified or until his death or resignation or removal as provided in the Trust's Agreement and Declaration of Trust.
OFFICERS
Name and Year of Birth | | Position
Held with
the Trust | | Term of
Office* and
Length of
Time Served | | Principal Occupation(s) During Past Five Years | |
Anna Marie Lopez
(born 1967) | | President | | Since 2007 | | Chief Operating Officer of the Advisor (2007 — present). | |
Mark McMahon
(born 1968) | | Vice President and Secretary | | Since 2006 | | Managing Director, Mutual Fund Operations of the Advisor (2006 — present). | |
James Menvielle
(born 1972) | | Vice President and Treasurer | | Since 2007 | | Chief Financial Officer of the Advisor (2006 — present). | |
Tina Kodama
(born 1968) | | Vice President and Chief Compliance Officer | | Since 2007 | | Chief Compliance Officer of the Advisor (2007 — present). | |
* Each officer is appointed by and serves at the pleasure of the Board of Trustees of the Trust.
The Statement of Additional Information includes additional information about the Trust's Trustees and officers, and is available without charge upon request by calling the transfer agent at 1-866-HW-FUNDS (1-866-493-8637). The address for all Trustees and officers of the Trust is c/o Hotchkis & Wiley Capital Management, LLC, 725 South Figueroa Street, 39th Floor, Los Angeles, CA 90017, attention: Trust Secretary.
88
(This page intentionally left blank)
Information about the Funds
ADVISOR
Hotchkis & Wiley Capital Management, LLC
725 South Figueroa Street, 39th Floor
Los Angeles, California 90017
LEGAL COUNSEL
Vedder Price P.C.
222 North LaSalle Street
Chicago, Illinois 60601
INDEPENDENT REGISTERED PUBLIC ACCOUNTING FIRM
Deloitte & Touche LLP
555 West 5th Street
Los Angeles, California 90013
DISTRIBUTOR
Quasar Distributors, LLC
615 East Michigan Street
Milwaukee, Wisconsin 53202
ADMINISTRATOR AND TRANSFER AGENT
U.S. Bancorp Fund Services, LLC
615 East Michigan Street
Milwaukee, Wisconsin 53202
CUSTODIAN
Brown Brothers Harriman & Co.
50 Post Office Square
Boston, Massachusetts 02110
This report is for the information of shareholders of the Hotchkis & Wiley Funds, but may also be used as sales literature when preceded or accompanied by a current prospectus, which gives details about charges, expenses, investment objectives and operating policies of the Funds.
A description of the policies and procedures that the Funds use to determine how to vote proxies relating to portfolio securities is included in the Statement of Additional Information, which is available without charge, upon request, by calling 1-866-HW-FUNDS (1-866-493-8637) and on the Securities and Exchange Commission's ("SEC") website at http://www.sec.gov.
Information regarding how the Funds voted proxies relating to portfolio securities during the most recent 12-month period ended June 30 is available without charge on the Funds' website at www.hwcm.com and on the SEC's website at http://www.sec.gov.
Hotchkis & Wiley Funds files a complete schedule of portfolio holdings with the SEC for the first and third quarters of each fiscal year on Form N-Q. The Funds' Forms N-Q are available free of charge on the SEC's website at http://www.sec.gov. You may also review or, for a fee, copy the forms at the SEC's Public Reference Room in Washington, D.C. (1-800-SEC-0330). The Forms N-Q are also available on the Funds' website at www.hwcm.com.
725 SOUTH FIGUEROA STREET, 39th Floor
LOS ANGELES, CALIFORNIA 90017-5439
www.hwcm.com
1.866.HW.FUNDS (1.866.493.8637)
Item 2. Code of Ethics.
The registrant has adopted a code of ethics that applies to the registrant’s principal executive officer and principal financial officer. The registrant has not made any substantive amendments to its code of ethics during the period covered by this report. The registrant has not granted any waivers from any provisions of the code of ethics during the period covered by this report. A copy of the code of ethics is available without charge, upon request, by calling toll-free at 1-800-796-5606.
Item 3. Audit Committee Financial Expert.
The registrant’s Board of Trustees (the “Board”) has determined that Robert Fitzgerald, a member of the registrant’s Audit Committee, is an “audit committee financial expert” and “independent,” as such terms are defined in this Item. This designation will not increase the designee’s duties, obligations or liability as compared to his duties, obligations and liability as a member of the Audit Committee and of the Board; nor will it reduce the responsibility of the other Audit Committee members. The Board believes each member of the Audit Committee contributes significantly to the effective oversight of the registrant’s financial statements and condition.
Item 4. Principal Accountant Fees and Services.
The registrant has engaged its principal accountant to perform audit services, audit-related services, tax services and other services during the past two fiscal years. “Audit services” refer to performing an audit of the registrant’s annual financial statements or services that are normally provided by the accountant in connection with statutory and regulatory filings or engagements for those fiscal years. “Audit-related services” refer to the assurance and related services by the principal accountant that are reasonably related to the performance of the audit. “Tax services” refer to professional services rendered by the principal accountant for tax compliance, tax advice, and tax planning. The principal accountant did not provide any other services. The following table details the aggregate fees billed or expected to be billed for each of the last two fiscal years for audit fees, audit-related fees, tax fees and other fees by the principal accountant.
| | FYE 6/30/2018 | | FYE 6/30/2017 | |
Audit Fees | | $ | 245,758 | | $ | 246,428 | |
Audit-Related Fees | | $ | 0 | | $ | 0 | |
Tax Fees | | $ | 75,750 | | $ | 74,265 | |
All Other Fees | | $ | 0 | | $ | 0 | |
The registrant’s Audit Committee (the “Committee”) has adopted policies and procedures with regard to the pre-approval of services. The Committee shall pre-approve any engagements of the independent auditors to provide any non-prohibited services to the registrant, including the fees and other compensation to be paid to the independent auditors. The Chairman of the Committee may grant the pre-approval of services to the registrant for non-prohibited services for engagements of less than $5,000. The Committee shall also pre-approve any engagement of the independent auditors, including the fees and other compensation to be paid to the independent auditors, to provide any non-audit services to the registrant’s investment adviser, Hotchkis & Wiley Capital Management, LLC (the “Advisor”) (or any
“control affiliate” of the Advisor providing ongoing services to the registrant), if the engagement relates directly to the operations and financial reporting of the registrant. The Chairman of the Committee may grant the pre-approval for non-prohibited services to the Advisor for engagements of less than $5,000. All such delegated pre-approvals shall be presented to the Committee no later than the next Committee meeting.
The percentage of fees billed by Deloitte & Touche LLP (“D&T”) applicable to non-audit services pursuant to waiver of pre-approval requirement were as follows:
| | FYE 6/30/2018 | | FYE 6/30/2017 | |
Audit-Related Fees | | 0 | % | 0 | % |
Tax Fees | | 0 | % | 0 | % |
All Other Fees | | 0 | % | 0 | % |
All of the principal accountant’s hours spent on auditing the registrant’s financial statements were attributed to work performed by full-time permanent employees of the principal accountant.
During the last two fiscal years, D&T has served as the auditor to the Advisor and/or affiliates of the Advisor, and has rendered non-audit services to the Advisor and/or affiliates of the Advisor. The non-audit services that D&T provided to the Advisor and/or affiliates of the Advisor in 2018 and 2017 consisted of preparing state and federal tax returns. D&T charged $124,900 and $121,250 for such non-audit services to the Advisor and/or affiliates of the Advisor for 2018 and 2017, respectively. None of the non-audit services provided by D&T to the Advisor and/or affiliates of the Advisor directly related to the operations or financial reporting of the registrant. The Committee has considered whether the provision of audit and non-audit services that were rendered to the Advisor and any entity controlling, controlled by or under common control with the Advisor is compatible with maintaining the principal accountant’s independence and has concluded that the provision of such non-audit services by the accountant has not compromised the accountant’s independence.
Item 5. Audit Committee of Listed Registrants.
Not applicable to registrants who are not listed issuers (as defined in Rule 10A-3 under the Securities Exchange Act of 1934).
Item 6. Investments.
Schedule of Investments is included as part of the report to shareholders filed under Item 1 of this Form.
Item 7. Disclosure of Proxy Voting Policies and Procedures for Closed-End Management Investment Companies.
Not applicable to open-end investment companies.
Item 8. Portfolio Managers of Closed-End Management Investment Companies.
Not applicable to open-end investment companies.
Item 9. Purchases of Equity Securities by Closed-End Management Investment Company and Affiliated Purchasers.
Not applicable to open-end investment companies.
Item 10. Submission of Matters to a Vote of Security Holders.
The identification and recommendation of individuals for Board membership is the responsibility of the Nominating and Governance Committee. Shareholders may submit suggestions for candidates by forwarding their correspondence by U.S. mail or other courier service to the registrant’s Secretary for the attention of the Chairman of the Nominating and Governance Committee, 725 South Figueroa Street, 39th Floor, Los Angeles, CA 90017-5439.
Item 11. Controls and Procedures.
(a) The registrant’s President / Principal Executive Officer and Treasurer / Principal Financial Officer have reviewed the registrant’s disclosure controls and procedures (as defined in Rule 30a-3(c) under the Investment Company Act of 1940 (the “Act”)) as of a date within 90 days of the filing of this report, as required by Rule 30a-3(b) under the Act and Rules 13a-15(b) or 15d-15(b) under the Securities Exchange Act of 1934. Based on their review, such officers have concluded that the disclosure controls and procedures are effective in ensuring that information required to be disclosed in this report is appropriately recorded, processed, summarized and reported and made known to them by others within the registrant and by the registrant’s service provider.
(b) There were no changes in the registrant’s internal control over financial reporting (as defined in Rule 30a-3(d) under the Act) that occurred during the second fiscal quarter of the period covered by this report that has materially affected, or is reasonably likely to materially affect, the registrant’s internal control over financial reporting.
Item 12. Disclosure of Securities Lending Activities for Closed-End Management Investment Companies.
Not applicable to open-end investment companies.
Item 13. Exhibits.
(a) (1) Any code of ethics or amendment thereto, that is the subject of the disclosure required by Item 2, to the extent that the registrant intends to satisfy Item 2 requirements through filing an exhibit. Available without charge, upon request, by calling toll-free at 1-800-796-5606.
(2) A separate certification for each principal executive officer and principal financial officer pursuant to Section 302 of the Sarbanes-Oxley Act of 2002. Filed herewith.
(3) Any written solicitation to purchase securities under Rule 23c-1 under the Act sent or given during the period covered by the report by or on behalf of the registrant to 10 or more persons. Not applicable to open-end investment companies.
(4) Change in the registrant’s independent public accountant. There was no change in the registrant’s independent public accountant for the period covered by this report.
(b) Certifications pursuant to Section 906 of the Sarbanes-Oxley Act of 2002. Furnished herewith.
SIGNATURES
Pursuant to the requirements of the Securities Exchange Act of 1934 and the Investment Company Act of 1940, the registrant has duly caused this report to be signed on its behalf by the undersigned, thereunto duly authorized.
| (Registrant) | Hotchkis & Wiley Funds | | |
| | | |
| By (Signature and Title) | /s/ Anna Marie Lopez | | |
| Anna Marie Lopez, President / Principal Executive Officer | | |
| | | |
| Date | August 28, 2018 | | |
| | | | | | |
Pursuant to the requirements of the Securities Exchange Act of 1934 and the Investment Company Act of 1940, this report has been signed below by the following persons on behalf of the registrant and in the capacities and on the dates indicated.
| By (Signature and Title) | /s/ Anna Marie Lopez | | |
| Anna Marie Lopez, President / Principal Executive Officer | | |
| | | |
| Date | August 28, 2018 | | |
| | | |
| By (Signature and Title) | /s/ James Menvielle | | |
| James Menvielle, Treasurer / Principal Financial Officer | | |
| | | |
| Date | August 28, 2018 | | |
| | | | | | |