UNITED STATES
SECURITIES AND EXCHANGE COMMISSION
Washington, D.C. 20549
FORM N-CSR
CERTIFIED SHAREHOLDER REPORT OF REGISTERED
MANAGEMENT INVESTMENT COMPANIES
Investment Company Act file number | 811-10487 |
|
Hotchkis & Wiley Funds |
(Exact name of registrant as specified in charter) |
|
725 South Figueroa Street, 39th Floor Los Angeles, California | | 90017-5439 |
(Address of principal executive offices) | | (Zip code) |
|
Anna Marie Lopez Hotchkis & Wiley Capital Management, LLC 725 South Figueroa Street, 39th Floor Los Angeles, California 90017-5439 |
(Name and address of agent for service) |
Copies to: Karin Jagel Flynn, Esq. Vedder Price P.C. 222 North LaSalle Street Chicago, IL 60601 |
(Counsel for the registrant) |
|
Registrant’s telephone number, including area code: | (213) 430-1000 | |
|
Date of fiscal year end: | June 30, 2015 | |
|
Date of reporting period: | July 1, 2014 – June 30, 2015 | |
| | | | | | | | | |
Item 1. Reports to Stockholders.

Hotchkis & Wiley Funds
Annual Report
JUNE 30, 2015
DIVERSIFIED VALUE FUND
LARGE CAP VALUE FUND
MID-CAP VALUE FUND
SMALL CAP VALUE FUND
SMALL CAP DIVERSIFIED VALUE FUND
GLOBAL VALUE FUND
VALUE OPPORTUNITIES FUND
CAPITAL INCOME FUND
HIGH YIELD FUND

SHAREHOLDER LETTER | | | 3 | | |
| FUND PERFORMANCE DATA | | | 6 | | |
SCHEDULE OF INVESTMENTS: | |
| DIVERSIFIED VALUE FUND | | | 16 | | |
| LARGE CAP VALUE FUND | | | 19 | | |
| MID-CAP VALUE FUND | | | 21 | | |
| SMALL CAP VALUE FUND | | | 24 | | |
| SMALL CAP DIVERSIFIED VALUE FUND | | | 27 | | |
| GLOBAL VALUE FUND | | | 34 | | |
| VALUE OPPORTUNITIES FUND | | | 37 | | |
| CAPITAL INCOME FUND | | | 41 | | |
| HIGH YIELD FUND | | | 50 | | |
| STATEMENTS OF ASSETS & LIABILITIES | | | 58 | | |
| STATEMENTS OF OPERATIONS | | | 60 | | |
| STATEMENTS OF CHANGES IN NET ASSETS | | | 62 | | |
| FINANCIAL HIGHLIGHTS | | | 67 | | |
| NOTES TO THE FINANCIAL STATEMENTS | | | 72 | | |
| REPORT OF INDEPENDENT REGISTERED PUBLIC ACCOUNTING FIRM | | | 84 | | |
| FUND EXPENSE EXAMPLES | | | 85 | | |
BOARD CONSIDERATIONS IN APPROVING CONTINUATION OF
INVESTMENT ADVISORY AGREEMENTS | | | 87 | | |
| MANAGEMENT | | | 91 | | |
PRIVACY POLICY | | | 92 | | |
INFORMATION ABOUT THE FUNDS | | | BACK COVER | | |
DEAR SHAREHOLDER:
The following investment review and annual report relates to the activities of the Hotchkis & Wiley Funds for the twelve-month period ended June 30, 2015.
OVERVIEW
Economic improvement and corporate earnings growth have supported the rise in both equity and high yield markets, although economic perils in Europe have re-emerged as an important concern that is giving investors pause. While it appears as though Greece will remain in the Eurozone for now, the primary risk for investors is the possibility that a larger European economy (e.g., Italy, Spain) may find itself in a similar situation in the future, which could trigger global economic turmoil. Thus far, the market appears to perceive the Greece situation as largely contained — government bond spreads for other European periphery countries have remained relatively tight versus the German Bund. Nonetheless, we are monitoring the situation closely and are confident that we are not bearing unnecessary risk across our Funds.
In equity markets, value stocks have lagged considerably over the past twelve months. Typically, such environments present a headwind for our value-focused investment philosophy but we have managed to navigate the past twelve months satisfactorily considering the circumstances. Naturally, however, we would welcome a value tailwind. Our experience has taught us that this will emerge in due course. In recent years, strengthened corporate balance sheets, robust earnings growth, and an improved economic backdrop have supported the strong rise in U.S. stock prices. In our view, the broad equity market's valuation appears about average — neither exceptionally attractive nor dramatically overextended. Fortunately, we have been able to identify pockets of attractive valuation across market caps and geographies.
Interest rates fell over the final six months of 2014 before rising over the first six months of 2015. Rates rose a fair amount in the most recent quarter, particularly on the long end, steepening the yield curve in a notable fashion for the first time since late 2013. We have long contended that the high yield market is more sensitive to changes in the credit environment than changes in the interest rate environment; high yield's flat return in the most recent quarter is much more tolerable considering the 10-Year Treasury note sold off by –3% and the 30-Year Treasury bond sold off by –10%. Default activity remains subdued as the par-weighted default rate ended the period at 1.9%, half the historical median of 3.8% (1986-current). The yield-to-worst on the high yield market, represented by the BofA Merrill Lynch US High Yield Index, closed at 6.5% and spreads closed at 490 basis points — we believe both are reasonable levels given current market conditions and much more compelling than other fixed income alternatives.
From a historical context, the broad equity and high yield markets appear reasonably valued. In both markets, however, we have been able to identify selective opportunities and are optimistic as we look forward. We have learned from experience that an acute focus on risk controls is particularly important in such environments, and the positioning of our Funds exemplifies this mentality.
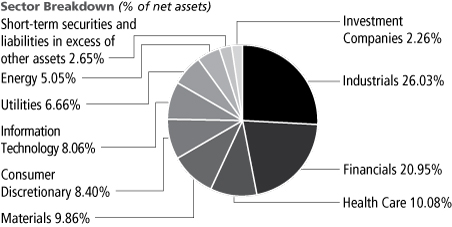
HOTCHKIS & WILEY DIVERSIFIED VALUE FUND
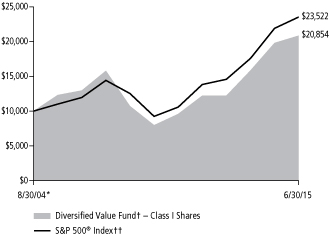
The Fund's Class I shares had a total return of 5.30% for the twelve-month period ended June 30, 2015, compared to the Russell 1000® Value Index return of 4.13%.
Positive stock selection in financials was the largest driver of outperformance over the past year. An underweight position in energy and an overweight position in consumer discretionary also helped relative performance. Target, Anthem, and AIG were the largest individual performance contributors over the twelve-month period. Stock selection in energy was the largest detractor from performance, followed by stock selection in utilities and consumer staples. Cobalt International Energy, Royal Dutch Shell, and Murphy Oil were the largest individual performance detractors over the twelve-month period.
HOTCHKIS & WILEY LARGE CAP VALUE FUND
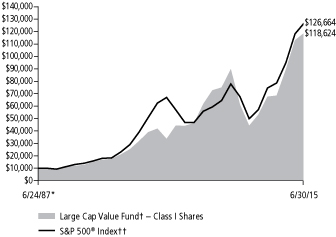
The Fund's Class I shares had a total return of 5.17% for the twelve-month period ended June 30, 2015, compared to the Russell 1000® Value Index return of 4.13%.
The primary contributor to the Fund's outperformance over the twelve-month period was positive stock selection in financials. The Fund's positions in banks and insurance both outperformed. The underweight position in energy, which was the index's worst-performing sector by a large margin, also helped relative performance. The largest individual contributors were Target, Anthem, and UnitedHealth Group. On the negative side, stock selection in energy detracted from performance over the twelve-month period while stock selection in utilities and consumer staples were more modest performance detractors. The largest individual performance detractors were Murphy Oil, Royal Dutch Shell, and Marathon Oil.
HOTCHKIS & WILEY MID-CAP VALUE FUND
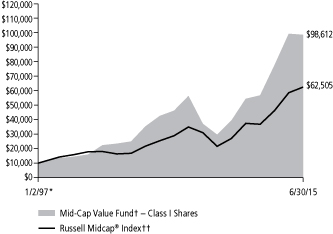
The Fund's Class I shares had a total return of –0.70% for the twelve-month period ended June 30, 2015, compared to the Russell Midcap® Value Index return of 3.67%.
All of the Fund's underperformance can be attributed to unfavorable sector allocation as the overweight in energy and the underweight in health care hurt performance. Energy was the worst-performing sector by a considerable margin and health care was the best-performing sector by a considerable margin. Stock selection in industrials was a more modest performance detractor over the period. On the positive side, favorable stock selection in financials, consumer staples, and consumer discretionary helped relative performance. The overweight in consumer discretionary was also beneficial. Comstock Resources, Cobalt International Energy, and Ophir Energy were the largest individual detractors over the period while Kohl's, Staples, and ON Semiconductor were the largest individual contributors over the period.
HOTCHKIS & WILEY SMALL CAP VALUE FUND
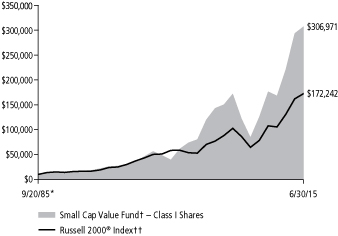
The Fund's Class I shares had a total return of 4.64% for the twelve-month period ended June 30, 2015, compared to the Russell 2000® Value Index return of 0.78%.
Positive stock selection drove more than 90% of the outperformance over the twelve-month period. Positive stock selection in financials, industrials, and energy were particularly strong. The top individual contributors were Matson, Masonite International, and First Horizon
3
National. Stock selection in utilities and information technology, along with an underweight position in financials, detracted from relative performance over the period. The top individual detractors were Con-way, Noranda Aluminum, and NRG Energy.
HOTCHKIS & WILEY SMALL CAP DIVERSIFIED VALUE FUND
The Fund's Class I shares had a total return of 2.93% for the twelve-month period ended June 30, 2015, compared to the Russell 2000® Value Index return of 0.78%.
All of the Fund's outperformance over the twelve-month period was due to positive stock selection. Stock selection was positive or neutral in 9 of the 10 global industry classification standards (GICS)® sectors, and was particularly strong in financials, energy, and industrials. The Fund's energy positions declined over the period but held up better than the index's energy positions. The Fund's process gravitates toward companies with less financial leverage, which led to the avoidance of some of the worst-performing energy stocks. An underweight allocation to financials and health care hurt performance as these were among the best-performing sectors in the small cap market. Stock selection in health care was also a modest detractor.
HOTCHKIS & WILEY GLOBAL VALUE FUND
The Fund's Class I shares had a total return of –1.98% for the twelve-month period ended June 30, 2015, compared to the Russell Developed Index return of 2.02%.
Stock selection in information technology, consumer staples, and energy were the largest performance detractors over the twelve-month period. The largest individual detractors were Danieli, Ophir Energy, and Rockhopper Exploration. The Fund was overweight Western Europe, particularly the United Kingdom, which also hurt relative returns over the period — both the Pound Sterling and the Euro weakened considerably relative to the U.S. Dollar. Positive stock selection in financials and consumer discretionary, along with an underweight allocation to materials helped relative performance. The largest individual contributors were UnitedHealth Group, Direct Line Insurance, and Target.
HOTCHKIS & WILEY VALUE OPPORTUNITIES FUND
The Fund's Class I shares had a total return of 6.75% for the twelve-month period ended June 30, 2015, compared to the S&P 500® Index return of 7.42%.
Security selection in industrials, health care, and information technology detracted from relative performance over the twelve-month period. An underweight allocation to health care, which was the best-performing sector over the period, also detracted from relative performance. The Fund's exposure to non-U.S. securities hurt as the U.S. Dollar appreciated relative to other major currencies over the year, but roughly 75% of the currency exposure was hedged muting the effect considerably. On the positive side, favorable security selection in consumer staples, consumer discretionary, and materials helped relative performance. The largest individual contributors were Thorntons PLC, Masonite International, and McDermott International bonds; the largest individual detractors were Danieli, KSB, and Cobalt International Energy.
HOTCHKIS & WILEY CAPITAL INCOME FUND
The Fund's Class I shares had a total return of 0.69% for the twelve-month period ended June 30, 2015, compared to the 50/50 blended benchmark of the S&P 500® Index and the BofA Merrill Lynch U.S. Corporate, Government and Mortgage Index return of 4.82%.
The Fund's average equity weight over the twelve-month period was 57% versus a long-term target of 50%, which helped relative performance as equities outperformed high yield bonds. High yield bonds underperformed investment grade bonds over the period, however, which hurt performance relative to the 50/50 blended benchmark.
The equity portion of the Fund underperformed the S&P 500® Index return of 7.42% over the twelve-month period, as high dividend yielding companies generally lagged the overall market. Stock selections in health care, energy, and consumer staples were the notable performance detractors over the period. The largest individual detractors were Royal Dutch Shell, Total, and GlaxoSmithKline. Positive security selections in financials, industrials, and telecommunication services were the largest contributors to relative performance over the period. The largest individual contributors were Target, Eli Lilly, and JPMorgan Chase.
The fixed income portion of the Fund underperformed the BofA Merrill Lynch U.S. Corporate, Government and Mortgage Index return of 2.03% over the twelve-month period as high yield bonds lagged investment grade bonds. The Fund lagged by a small margin to the BofA Merrill Lynch BB-B US High Yield Constrained Index due to credit selection in energy and consumer goods. On the positive side, credit selection in basic industry and banking helped relative performance.
HOTCHKIS & WILEY HIGH YIELD FUND
The Fund's Class I shares had a total return of –0.26% for the twelve-month period ended June 30, 2015, compared to the BofA Merrill Lynch BB-B US High Yield Constrained Index return of 0.70%.
Credit selection in energy and consumer goods along with an overweight allocation to basic industry credits were the primary causes of underperformance over the twelve-month period. The Fund is also underweight BB-rated credits and overweight B-rated credits relative to the benchmark, which also hurt performance over the period. Positive credit selection in basic industry, banking, and telecommunications helped relative performance over the period. A small overweight in automotive and technology credits also benefited relative performance marginally.
CONCLUSION
We appreciate your continued support of the Hotchkis & Wiley Funds, and we look forward to serving your investment needs in the future.
4
CONCLUSION
We appreciate your continued support of the Hotchkis & Wiley Funds, and we look forward to serving your investment needs in the future.
Sincerely,

| | 
| | 
| |
Anna Marie Lopez
President | | George Davis
Fund Manager | | Sheldon Lieberman
Fund Manager | |

| | 
| | 
| |
Patty McKenna
Fund Manager | | James Miles
Fund Manager | | Stan Majcher
Fund Manager | |

| | 
| | 
| |
David Green
Fund Manager | | Scott McBride
Fund Manager | | Judd Peters
Fund Manager | |

| | 
| | 
| |
Ray Kennedy
Fund Manager | | Mark Hudoff
Fund Manager | | Patrick Meegan
Fund Manager | |

| | 
| | 
| |
Scott Rosenthal
Fund Manager | | Richard Mak
Fund Manager | | Ryan Thomes
Fund Manager | |
Past performance does not guarantee future results.
The above reflects opinions of Fund managers as of June 30, 2015. They are subject to change and any forecasts made cannot be guaranteed. The Funds might not continue to hold any securities mentioned and have no obligation to disclose purchases or sales in these securities. Fund holdings are not recommendations to buy or sell any security. Please refer to the Schedule of Investments in this report for a complete list of Fund holdings as of June 30, 2015. Indexes do not incur expenses or sales loads and are not available for investment.
The Global Industry Classification Standard (GICS®) was developed by MSCI, an independent provider of global indices and benchmark-related products and services, and Standard & Poor's (S&P), an independent international financial data and investment services company. The GICS methodology has been widely accepted as an industry analysis framework for investment research, portfolio management and asset allocation. The GICS structure consists of 10 sectors, 24 industry groups, 67 industries and 156 sub-industries. Each stock that is classified will have a coding at all four of these levels.
Credit Quality weights by rating were derived from the highest bond rating as determined by S&P, Moody's or Fitch. Bond ratings are grades given to bonds that indicate their credit quality as determined by private independent rating services such as Standard & Poor's, Moody's and Fitch. These firms evaluate a bond issuer's financial strength, or its ability to pay a bond's principal and interest in a timely fashion. Ratings are expressed as letters ranging from 'AAA', which is the highest grade, to 'D', which is the lowest grade. In limited situations when none of the three rating agencies have issued a formal rating, the Advisor will classify the security as nonrated.
Investing in value stocks presents the risk that value stocks may fall out of favor with investors and underperform other asset types during a given period. Equities, bonds, and other asset classes have different risk profiles, which should be considered when investing. All investments contain risk and may lose value.
Earnings growth is not representative of any Fund's future performance.
A basis point is one hundredth of one percent (0.01%).
Spread is the percentage point difference between yields of various classes of bonds compared to Treasury bonds.
5
ABOUT FUND PERFORMANCE
The Large Cap Value Fund and Mid-Cap Value Fund have four classes of shares. The Diversified Value Fund, Small Cap Value Fund, Small Cap Diversified Value Fund, Global Value Fund, Value Opportunities Fund, Capital Income Fund and High Yield Fund have three classes of shares. Each share class has its own sales charge and expense structure, allowing you to invest in the way that best suits your needs. Currently, the Small Cap Diversified Value Fund, Global Value Fund and Capital Income Fund are not offering Class C shares to investors.
Class I shares have no initial sales charge and bear no ongoing distribution and service fees under a 12b-1 plan. Class I shares are available only to eligible investors.
Class A shares incur a maximum initial sales charge of 5.25% for the Diversified Value Fund, Large Cap Value Fund, Mid-Cap Value Fund, Small Cap Value Fund, Small Cap Diversified Value Fund, Global Value Fund and Value Opportunities Fund, 4.75% for the Capital Income Fund and 3.75% for the High Yield Fund and an annual distribution and service fee of 0.25%.
Class C shares are subject to an annual distribution and service fee of 1.00%. In addition, Class C shares are subject to a 1.00% contingent deferred sales charge (CDSC) if redeemed within one year after purchase. Class C shares automatically convert to Class A shares approximately eight years after purchase and will then be subject to lower distribution and service fees.
Class R shares have no initial sales charge or CDSC and are subject to an annual distribution and service fee of 0.50%. Class R shares are offered only by the Large Cap Value Fund and Mid-Cap Value Fund and are available only to certain retirement plans.
FUND RISKS
Mutual fund investing involves risk; loss of principal is possible. The Mid-Cap Value Fund, Small Cap Value Fund, Small Cap Diversified Value Fund, Global Value Fund and Value Opportunities Fund invest in small- and medium-capitalization companies which tend to have limited liquidity and greater price volatility than large-capitalization companies. The Value Opportunities Fund is a non-diversified fund which involves greater risk than investing in diversified funds, such as business risk, significant stock price fluctuations and sector concentration. Growth stocks typically are more volatile than value stocks; however, value stocks have a lower expected growth rate in earnings and sales. The Value Opportunities Fund, Capital Income Fund and High Yield Fund invest in debt securities that decrease in value when interest rates rise. This risk is usually greater for longer-term debt securities. Investment by the Value Opportunities Fund, Capital Income Fund and High Yield Fund in lower-rated and non-rated securities presents a greater risk of loss to principal and interest than higher-rated securities. The Value Opportunities Fund, Capital Income Fund and High Yield Fund may utilize derivative instruments, which derive their performance from the performance of an underlying asset, index, interest rate or currency exchange rate. Derivatives can be volatile and involve various types and degrees of risks. Depending upon the characteristics of particular derivatives, they can suddenly become illiquid. Investments by the Capital Income Fund and High Yield Fund in asset-backed and mortgage-backed securities include additional risks that investors should be aware of such as credit risk, prepayment risk, possible illiquidity and default, as well as increased susceptibility to adverse economic
developments. The Funds may invest in foreign securities, including developed and emerging markets, which involve greater volatility and political, economic, and currency risks.
MARKET INDEXES
The following are definitions for indexes used in the shareholder letter and the performance summary tables on the following pages. These indexes are unmanaged and include the reinvestment of dividends, but do not reflect the payment of transaction costs and advisory and other fees associated with an investment in the Funds. The securities that comprise these indexes may differ substantially from the securities in the Funds' portfolios. The Funds' value disciplines may prevent or restrict investments in the benchmark indexes. It is not possible to invest directly in an index. Each index named is not the only index which may be used to characterize performance of a specific Fund and other indexes may portray different comparative performance.
S&P 500® Index, a capital weighted, unmanaged index, represents the aggregate market value of the common equity of 500 stocks primarily traded on the New York Stock Exchange.
Russell 1000® Index, an unmanaged index, measures the performance of the 1,000 largest companies in the Russell 3000® Index.
Russell 1000® Value Index measures the performance of those Russell 1000® companies with lower price-to-book ratios and lower forecasted growth values.
Russell Midcap® Index, an unmanaged index, measures the performance of the 800 smallest companies in the Russell 1000® Index.
Russell Midcap® Value Index measures the performance of those Russell Midcap® companies with lower price-to-book ratios and lower forecasted growth values.
Russell 2000® Index, an unmanaged index, measures the performance of the 2,000 smallest companies in the Russell 3000® Index.
Russell 2000® Value Index measures the performance of those Russell 2000® companies with lower price-to-book ratios and lower forecasted growth values.
Russell Developed Index measures the performance of the investable securities in developed countries globally across all market capitalization ranges.
BofA Merrill Lynch U.S. Corporate, Government and Mortgage Index is a broad-based measure of the total rate of return performance of the U.S. investment grade bond markets. The Index is a capitalization weighted aggregation of outstanding U.S. Treasury, agency and supranational, mortgage pass-through, and investment grade corporate bonds meeting specified selection criteria.
BofA Merrill Lynch BB-B US High Yield Constrained Index contains all securities in the BofA Merrill Lynch U.S. High Yield Index rated BB+ through B- by S&P (or equivalent as rated by Moody's or Fitch), but caps issuer exposure at 2%. Index constituents are capitalization-weighted, based on their current amount outstanding, provided the total allocation to an individual issuer does not exceed 2%.
BofA Merrill Lynch US High Yield Index tracks the performance of below investment grade, but not in default, U.S. dollar-denominated corporate bonds publicly issued in the U.S. domestic market, and includes issues with a credit rating of BBB or below, as rated by Moody's and S&P.
6
DIVERSIFIED VALUE FUND
Total Return Based on a $10,000 Investment
Comparative Results†††
For Periods ended June 30, 2015 | | 1 Year | | 5 Years | | 10 Years | | Since
8/30/04* | |
Class I | |
Average annual total return | | | 5.30 | % | | | 16.80 | % | | | 5.41 | % | | | 7.02 | % | |
Class A | |
Average annual total return (with sales charge) | | | –0.46 | % | | | 15.29 | % | | | 4.58 | % | | | 6.23 | % | |
Average annual total return (without sales charge) | | | 5.07 | % | | | 16.53 | % | | | 5.14 | % | | | 6.75 | % | |
Class C | |
Average annual total return (with CDSC) | | | 3.27 | % | | | 15.63 | % | | | 4.39 | % | | | 5.98 | % | |
Average annual total return (without CDSC) | | | 4.27 | % | | | 15.63 | % | | | 4.39 | % | | | 5.98 | % | |
S&P 500® Index†† | |
Average annual total return | | | 7.42 | % | | | 17.34 | % | | | 7.89 | % | | | 8.21 | % | |
Russell 1000® Index†† | |
Average annual total return | | | 7.37 | % | | | 17.58 | % | | | 8.13 | % | | | 8.60 | % | |
Russell 1000® Value Index†† | |
Average annual total return | | | 4.13 | % | | | 16.50 | % | | | 7.05 | % | | | 7.85 | % | |
Average annual total returns with sales charge and CDSC shown for Class A and Class C shares, respectively, have been adjusted to reflect the applicable sales charges of each specific class. Returns for Class A reflect the maximum initial sales charge of 5.25%. Class C shares have no adjustment for sales charges, but redemptions within one year of purchase may be subject to a CDSC of 1%. Average annual total returns without sales charge or CDSC do not reflect the sales charges. Had the sales charge or CDSC been included, the Fund's returns would have been lower.
† The Fund invests primarily in equity securities of companies with market capitalizations similar to the Russell 1000® Index.
†† See index descriptions on page 6.
††† Fund returns during certain periods shown reflect a fee waiver and/or expense reimbursement. Without waiver/reimbursement, returns would have been lower. Returns shown include the reinvestment of all dividends.
* Commencement of Class I, Class A and Class C.
Past performance is not indicative of future results and the graph and table do not reflect the deduction of taxes that a shareholder would pay on Fund distributions or the redemption of Fund shares.
7
LARGE CAP VALUE FUND
Total Return Based on a $10,000 Investment
Comparative Results†††
For Periods ended June 30, 2015 | | 1 Year | | 5 Years | | 10 Years | | Since
6/24/87* | |
Class I | |
Average annual total return | | | 5.17 | % | | | 17.53 | % | | | 5.04 | % | | | 9.23 | % | |
Class A | |
Average annual total return (with sales charge) | | | –0.63 | % | | | 15.98 | % | | | 4.19 | % | | | 8.77 | % | |
Average annual total return (without sales charge) | | | 4.89 | % | | | 17.23 | % | | | 4.76 | % | | | 8.98 | % | |
Class C | |
Average annual total return (with CDSC) | | | 3.10 | % | | | 16.36 | % | | | 4.03 | % | | | 8.16 | % | |
Average annual total return (without CDSC) | | | 4.10 | % | | | 16.36 | % | | | 4.03 | % | | | 8.16 | % | |
Class R | |
Average annual total return | | | 4.64 | % | | | 16.94 | % | | | 4.50 | % | | | 8.70 | % | |
S&P 500® Index†† | |
Average annual total return | | | 7.42 | % | | | 17.34 | % | | | 7.89 | % | | | 9.48 | % | |
Russell 1000® Index†† | |
Average annual total return | | | 7.37 | % | | | 17.58 | % | | | 8.13 | % | | | 9.64 | % | |
Russell 1000® Value Index†† | |
Average annual total return | | | 4.13 | % | | | 16.50 | % | | | 7.05 | % | | | n/a | | |
Returns shown for Class A, Class C, and Class R shares for the periods prior to their inception are derived from the historical performance of Class I shares of the Fund during such periods and have been adjusted to reflect the higher total annual operating expenses of each specific class. (Inception dates: Class A — 10/26/01; Class C — 2/4/02; Class R — 8/28/03.)
Average annual total returns with sales charge and CDSC shown for Class A and Class C shares, respectively, have been adjusted to reflect the applicable sales charges of each specific class. Returns for Class A reflect the maximum initial sales charge of 5.25%. Class C shares have no adjustment for sales charges, but redemptions within one year of purchase may be subject to a CDSC of 1%. Average annual total returns without sales charge or CDSC do not reflect the sales charges. Had the sales charge or CDSC been included, the Fund's returns would have been lower.
† The Fund invests primarily in equity securities of companies with market capitalizations similar to the Russell 1000® Index.
†† See index descriptions on page 6.
††† Fund returns during certain periods shown reflect a fee waiver and/or expense reimbursement. Without waiver/reimbursement, returns would have been lower. Returns shown include the reinvestment of all dividends.
* Commencement of Class I.
Past performance is not indicative of future results and the graph and table do not reflect the deduction of taxes that a shareholder would pay on Fund distributions or the redemption of Fund shares.
8
MID-CAP VALUE FUND
Total Return Based on a $10,000 Investment
Comparative Results†††
For Periods ended June 30, 2015 | | 1 Year | | 5 Years | | 10 Years | | Since
1/2/97* | |
Class I | |
Average annual total return | | | –0.70 | % | | | 20.12 | % | | | 8.76 | % | | | 13.18 | % | |
Class A | |
Average annual total return (with sales charge) | | | –6.13 | % | | | 18.53 | % | | | 7.90 | % | | | 12.57 | % | |
Average annual total return (without sales charge) | | | –0.93 | % | | | 19.82 | % | | | 8.49 | % | | | 12.90 | % | |
Class C | |
Average annual total return (with CDSC) | | | –2.69 | % | | | 18.92 | % | | | 7.76 | % | | | 12.09 | % | |
Average annual total return (without CDSC) | | | –1.69 | % | | | 18.92 | % | | | 7.76 | % | | | 12.09 | % | |
Class R | |
Average annual total return | | | –1.21 | % | | | 19.53 | % | | | 8.22 | % | | | 12.70 | % | |
Russell Midcap® Index†† | |
Average annual total return | | | 6.63 | % | | | 18.23 | % | | | 9.40 | % | | | 10.42 | % | |
Russell Midcap® Value Index†† | |
Average annual total return | | | 3.67 | % | | | 17.73 | % | | | 8.89 | % | | | 10.77 | % | |
Returns shown for Class A, Class C, and Class R shares for the periods prior to their inception are derived from the historical performance of Class I shares of the Fund during such periods and have been adjusted to reflect the higher total annual operating expenses of each specific class. (Inception dates: Class A, Class C — 1/2/01; Class R — 8/28/03.)
Average annual total returns with sales charge and CDSC shown for Class A and Class C shares, respectively, have been adjusted to reflect the applicable sales charges of each specific class. Returns for Class A reflect the maximum initial sales charge of 5.25%. Class C shares have no adjustment for sales charges, but redemptions within one year of purchase may be subject to a CDSC of 1%. Average annual total returns without sales charge or CDSC do not reflect the sales charges. Had the sales charge or CDSC been included, the Fund's returns would have been lower.
† The Fund invests primarily in equity securities of companies with market capitalizations similar to the Russell Midcap® Index.
†† See index descriptions on page 6.
††† Fund returns during certain periods shown reflect a fee waiver and/or expense reimbursement. Without waiver/reimbursement, returns would have been lower. Returns shown include the reinvestment of all dividends.
* Commencement of Class I.
Past performance is not indicative of future results and the graph and table do not reflect the deduction of taxes that a shareholder would pay on Fund distributions or the redemption of Fund shares.
9
SMALL CAP VALUE FUND
Total Return Based on a $10,000 Investment
Comparative Results†††
For Periods ended June 30, 2015 | | 1 Year | | 5 Years | | 10 Years | | Since
9/20/85* | |
Class I | |
Average annual total return | | | 4.64 | % | | | 19.55 | % | | | 7.94 | % | | | 12.19 | % | |
Class A | |
Average annual total return (with sales charge) | | | –1.11 | % | | | 17.97 | % | | | 7.09 | % | | | 11.73 | % | |
Average annual total return (without sales charge) | | | 4.37 | % | | | 19.25 | % | | | 7.67 | % | | | 11.94 | % | |
Class C | |
Average annual total return (with CDSC) | | | 2.60 | % | | | 18.37 | % | | | 6.97 | % | | | 11.13 | % | |
Average annual total return (without CDSC) | | | 3.60 | % | | | 18.37 | % | | | 6.97 | % | | | 11.13 | % | |
Russell 2000® Index†† | |
Average annual total return | | | 6.49 | % | | | 17.08 | % | | | 8.40 | % | | | 10.02 | % | |
Russell 2000® Value Index†† | |
Average annual total return | | | 0.78 | % | | | 14.81 | % | | | 6.87 | % | | | n/a | | |
Returns shown for Class A and Class C shares for the periods prior to their inception are derived from the historical performance of Class I shares of the Fund during such periods and have been adjusted to reflect the higher total annual operating expenses of each specific class. (Inception dates: Class A — 10/6/00; Class C — 2/4/02.)
Average annual total returns with sales charge and CDSC shown for Class A and Class C shares, respectively, have been adjusted to reflect the applicable sales charges of each specific class. Returns for Class A reflect the maximum initial sales charge of 5.25%. Class C shares have no adjustment for sales charges, but redemptions within one year of purchase may be subject to a CDSC of 1%. Average annual total returns without sales charge or CDSC do not reflect the sales charges. Had the sales charge or CDSC been included, the Fund's returns would have been lower.
† The Fund invests primarily in equity securities of companies with market capitalizations similar to the Russell 2000® Index.
†† See index descriptions on page 6.
††† Fund returns during certain periods shown reflect a fee waiver and/or expense reimbursement. Without waiver/reimbursement, returns would have been lower. Returns shown include the reinvestment of all dividends.
* Commencement of Class I.
Past performance is not indicative of future results and the graph and table do not reflect the deduction of taxes that a shareholder would pay on Fund distributions or the redemption of Fund shares.
10
SMALL CAP DIVERSIFIED VALUE FUND
Total Return Based on a $10,000 Investment
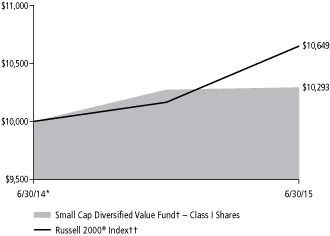
Comparative Results†††
For Period ended June 30, 2015 | | Since
6/30/14* | |
Class I | |
Average annual total return | | | 2.93 | % | |
Class A | |
Average annual total return (with sales charge) | | | –2.64 | % | |
Average annual total return (without sales charge) | | | 2.71 | % | |
Russell 2000® Index†† | |
Average annual total return | | | 6.49 | % | |
Russell 2000® Value Index†† | |
Average annual total return | | | 0.78 | % | |
Average annual total returns with sales charge shown for Class A shares have been adjusted to reflect the applicable sales charge of the class. Returns for Class A reflect the maximum initial sales charge of 5.25%. Average annual total returns without sales charge do not reflect the sales charge. Had the sales charge been included, the Fund's returns would have been lower.
† The Fund invests primarily in equity securities of companies with market capitalizations similar to the Russell 2000® Index.
†† See index descriptions on page 6.
††† Fund returns during certain periods shown reflect a fee waiver and/or expense reimbursement. Without waiver/reimbursement, returns would have been lower. Returns shown include the reinvestment of all dividends.
* Commencement of Class I and Class A.
Past performance is not indicative of future results and the graph and table do not reflect the deduction of taxes that a shareholder would pay on Fund distributions or the redemption of Fund shares.
11
GLOBAL VALUE FUND
Total Return Based on a $10,000 Investment

Comparative Results†††
For Periods ended June 30, 2015 | | 1 Year | | Since
12/31/12* | |
Class I | |
Average annual total return | | | –1.98 | % | | | 15.05 | % | |
Class A | |
Average annual total return (with sales charge) | | | –7.38 | % | | | 12.32 | % | |
Average annual total return (without sales charge) | | | –2.22 | % | | | 14.75 | % | |
Russell Developed Index†† | |
Average annual total return | | | 2.02 | % | | | 14.29 | % | |
Returns shown for Class A shares for the periods prior to its inception are derived from the historical performance of Class I shares of the Fund during such periods and have been adjusted to reflect the higher total annual operating expenses of the class. (Inception date: Class A — 8/30/13.)
Average annual total returns with sales charge shown for Class A shares have been adjusted to reflect the applicable sales charge of the class. Returns for Class A reflect the maximum initial sales charge of 5.25%. Average annual total returns without sales charge do not reflect the sales charge. Had the sales charge been included, the Fund's returns would have been lower.
† The Fund invests primarily in U.S. and non-U.S. companies.
†† See index description on page 6.
††† Fund returns during certain periods shown reflect a fee waiver and/or expense reimbursement. Without waiver/reimbursement, returns would have been lower. Returns shown include the reinvestment of all dividends.
* Commencement of Class I.
Past performance is not indicative of future results and the graph and table do not reflect the deduction of taxes that a shareholder would pay on Fund distributions or the redemption of Fund shares.
12
VALUE OPPORTUNITIES FUND
Total Return Based on a $10,000 Investment

Comparative Results†††
For Periods ended June 30, 2015 | | 1 Year | | 5 Years | | 10 Years | | Since
12/31/02* | |
Class I | |
Average annual total return | | | 6.75 | % | | | 20.39 | % | | | 9.37 | % | | | 13.78 | % | |
Class A | |
Average annual total return (with sales charge) | | | 0.86 | % | | | 18.79 | % | | | 8.51 | % | | | 13.07 | % | |
Average annual total return (without sales charge) | | | 6.47 | % | | | 20.08 | % | | | 9.10 | % | | | 13.56 | % | |
Class C | |
Average annual total return (with CDSC) | | | 4.65 | % | | | 19.18 | % | | | 8.34 | % | | | 12.69 | % | |
Average annual total return (without CDSC) | | | 5.65 | % | | | 19.18 | % | | | 8.34 | % | | | 12.69 | % | |
S&P 500® Index†† | |
Average annual total return | | | 7.42 | % | | | 17.34 | % | | | 7.89 | % | | | 9.26 | % | |
Returns shown for Class C shares for the periods prior to its inception are derived from the historical performance of Class I shares of the Fund during such periods and have been adjusted to reflect the higher total annual operating expenses of the class. (Inception date: Class C — 8/28/03.)
Average annual total returns with sales charge and CDSC shown for Class A and Class C shares, respectively, have been adjusted to reflect the applicable sales charges of each specific class. Returns for Class A reflect the maximum initial sales charge of 5.25%. Class C shares have no adjustment for sales charges, but redemptions within one year of purchase may be subject to a CDSC of 1%. Average annual total returns without sales charge or CDSC do not reflect the sales charges. Had the sales charge or CDSC been included, the Fund's returns would have been lower.
† The Fund invests primarily in securities of companies with strong capital appreciation potential.
†† See index description on page 6.
††† Fund returns during certain periods shown reflect a fee waiver and/or expense reimbursement. Without waiver/reimbursement, returns would have been lower. Returns shown include the reinvestment of all dividends.
* Commencement of Class I and Class A.
Past performance is not indicative of future results and the graph and table do not reflect the deduction of taxes that a shareholder would pay on Fund distributions or the redemption of Fund shares.
13
CAPITAL INCOME FUND
Total Return Based on a $10,000 Investment
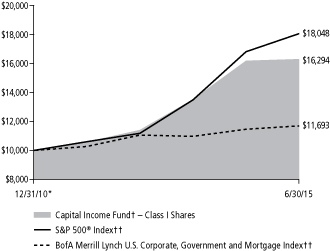
Comparative Results†††
For Periods ended June 30, 2015 | | 1 Year | | Since
12/31/10* | |
Class I | |
Average annual total return | | | 0.69 | % | | | 11.47 | % | |
Class A | |
Average annual total return (with sales charge) | | | –4.05 | % | | | 10.69 | % | |
Average annual total return (without sales charge) | | | 0.73 | % | | | 11.90 | % | |
S&P 500® Index†† | |
Average annual total return | | | 7.42 | % | | | 14.02 | % | |
BofA Merrill Lynch U.S. Corporate, Government and Mortgage Index†† | |
Average annual total return | | | 2.03 | % | | | 3.54 | % | |
Returns shown for Class A shares for the periods prior to its inception are derived from the historical performance of Class I shares of the Fund during such periods and have been adjusted to reflect the higher total annual operating expenses of the class. (Inception date: Class A — 2/28/11.)
Average annual total returns with sales charge shown for Class A shares have been adjusted to reflect the applicable sales charge of the class. Returns for Class A reflect the maximum initial sales charge of 4.75%. Average annual total returns without sales charge do not reflect the sales charge. Had the sales charge been included, the Fund's returns would have been lower.
† The Fund invests primarily in dividend-paying equities and high yield fixed income securities.
†† See index descriptions on page 6.
††† Fund returns during certain periods shown reflect a fee waiver and/or expense reimbursement. Without waiver/reimbursement, returns would have been lower. Returns shown include the reinvestment of all dividends.
* Commencement of Class I.
Past performance is not indicative of future results and the graph and table do not reflect the deduction of taxes that a shareholder would pay on Fund distributions or the redemption of Fund shares.
14
HIGH YIELD FUND
Total Return Based on a $10,000 Investment

Comparative Results†††
For Periods ended June 30, 2015 | | 1 Year | | 5 Years | | Since
3/31/09* | |
Class I | |
Average annual total return | | | –0.26 | % | | | 9.31 | % | | | 13.29 | % | |
Class A | |
Average annual total return (with sales charge) | | | –4.28 | % | | | 8.16 | % | | | 12.19 | % | |
Average annual total return (without sales charge) | | | –0.54 | % | | | 8.99 | % | | | 12.88 | % | |
Class C | |
Average annual total return (with CDSC) | | | –2.25 | % | | | 8.19 | % | | | 12.14 | % | |
Average annual total return (without CDSC) | | | –1.25 | % | | | 8.19 | % | | | 12.14 | % | |
BofA Merrill Lynch BB-B US High Yield Constrained Index†† | |
Average annual total return | | | 0.70 | % | | | 8.32 | % | | | 12.95 | % | |
Returns shown for Class A and Class C shares for the periods prior to their inception are derived from the historical performance of Class I shares of the Fund during such periods and have been adjusted to reflect the higher total annual operating expenses of the class. (Inception dates: Class A — 5/29/09; Class C — 12/31/12.)
Average annual total returns with sales charge and CDSC shown for Class A and Class C shares, respectively, have been adjusted to reflect the applicable sales charges of each specific class. Returns for Class A reflect the maximum initial sales charge of 3.75%. Class C shares have no adjustment for sales charges, but redemptions within one year of purchase may be subject to a CDSC of 1%. Average annual total returns without sales charge or CDSC do not reflect the sales charges. Had the sales charge or CDSC been included, the Fund's returns would have been lower. Effective August 29, 2014, the Fund may impose a 2.00% redemption fee on shares that are redeemed or exchanged if they have been held for 90 days or less. Returns shown do not reflect the imposition of the redemption fee. Had the redemption fee been included, the Fund's returns would have been lower.
† The Fund invests primarily in high yield securities.
†† See index description on page 6.
††† Fund returns during certain periods shown reflect a fee waiver and/or expense reimbursement. Without waiver/reimbursement, returns would have been lower. Returns shown include the reinvestment of all dividends.
* Commencement of Class I.
Past performance is not indicative of future results and the graph and table do not reflect the deduction of taxes that a shareholder would pay on Fund distributions or the redemption of Fund shares.
15
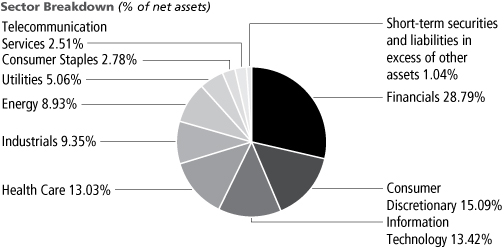
Schedule of Investments — June 30, 2015
Hotchkis & Wiley Diversified Value Fund
Largest Equity Holdings | | Percent of
net assets | |
American International Group, Inc. | | | 4.58 | % | |
Citigroup, Inc. | | | 4.26 | % | |
Bank of America Corp. | | | 4.04 | % | |
JPMorgan Chase & Company | | | 3.57 | % | |
Microsoft Corp. | | | 2.96 | % | |
Oracle Corp. | | | 2.94 | % | |
Marathon Oil Corp. | | | 2.76 | % | |
Corning, Inc. | | | 2.64 | % | |
Sanofi | | | 2.53 | % | |
Vodafone Group PLC | | | 2.51 | % | |
COMMON
STOCKS — 98.96% | | Shares
Held | | Value | |
CONSUMER DISCRETIONARY — 15.09%
Auto Components — 2.21% | |
Johnson Controls, Inc. | | | 240,300 | | | $ | 11,902,059 | | |
Automobiles — 4.14% | |
General Motors Company | | | 331,900 | | | | 11,062,227 | | |
Harley-Davidson, Inc. | | | 50,700 | | | | 2,856,945 | | |
Honda Motor Company Ltd. — ADR | | | 258,900 | | | | 8,388,360 | | |
| | | | 22,307,532 | | |
Hotels, Restaurants & Leisure — 0.53% | |
Carnival Corp. | | | 58,300 | | | | 2,879,437 | | |
Media — 4.49% | |
Comcast Corp. | | | 188,800 | | | | 11,316,672 | | |
Discovery Communications, Inc. (a) | | | 169,900 | | | | 5,650,874 | | |
The Interpublic Group of Companies, Inc. | | | 244,900 | | | | 4,719,223 | | |
Omnicom Group, Inc. | | | 35,800 | | | | 2,487,742 | | |
| | | | 24,174,511 | | |
Multiline Retail — 1.75% | |
Nordstrom, Inc. | | | 55,000 | | | | 4,097,500 | | |
Target Corp. | | | 65,300 | | | | 5,330,439 | | |
| | | | 9,427,939 | | |
Specialty Retail — 1.97% | |
Bed Bath & Beyond, Inc. (a) | | | 115,900 | | | | 7,994,782 | | |
Lowe's Companies, Inc. | | | 39,200 | | | | 2,625,224 | | |
| | | | 10,620,006 | | |
TOTAL CONSUMER DISCRETIONARY | | | 81,311,484 | | |
CONSUMER STAPLES — 2.78%
Food & Staples Retailing — 1.10% | |
Wal-Mart Stores, Inc. | | | 83,300 | | | | 5,908,469 | | |
Food Products — 1.22% | |
Bunge Ltd. | | | 33,800 | | | | 2,967,640 | | |
Kellogg Company | | | 58,000 | | | | 3,636,600 | | |
| | | | 6,604,240 | | |
| | Shares
Held | | Value | |
Tobacco — 0.46% | |
Philip Morris International, Inc. | | | 31,200 | | | $ | 2,501,304 | | |
TOTAL CONSUMER STAPLES | | | 15,014,013 | | |
ENERGY — 8.93%
Oil, Gas & Consumable Fuels — 8.93% | |
Cobalt International Energy, Inc. (a) | | | 1,242,200 | | | | 12,061,762 | | |
Kosmos Energy Ltd. (a) | | | 324,600 | | | | 2,736,378 | | |
Marathon Oil Corp. | | | 561,500 | | | | 14,902,210 | | |
Murphy Oil Corp. | | | 193,100 | | | | 8,027,167 | | |
Royal Dutch Shell PLC — ADR | | | 182,120 | | | | 10,382,661 | | |
TOTAL ENERGY | | | 48,110,178 | | |
FINANCIALS — 28.79%
Banks — 15.72% | |
Bank of America Corp. | | | 1,280,622 | | | | 21,796,187 | | |
Citigroup, Inc. | | | 415,474 | | | | 22,950,784 | | |
Citizens Financial Group, Inc. | | | 292,500 | | | | 7,988,175 | | |
JPMorgan Chase & Company | | | 284,000 | | | | 19,243,840 | | |
SunTrust Banks, Inc. | | | 163,700 | | | | 7,042,374 | | |
Wells Fargo & Company | | | 101,134 | | | | 5,687,776 | | |
| | | | 84,709,136 | | |
Capital Markets — 2.80% | |
The Bank of New York Mellon Corp. | | | 65,100 | | | | 2,732,247 | | |
The Goldman Sachs Group, Inc. | | | 26,100 | | | | 5,449,419 | | |
Morgan Stanley | | | 75,500 | | | | 2,928,645 | | |
State Street Corp. | | | 52,100 | | | | 4,011,700 | | |
| | | | 15,122,011 | | |
Consumer Finance — 1.89% | |
Capital One Financial Corp. | | | 116,000 | | | | 10,204,520 | | |
The accompanying notes are an integral part of these financial statements.
16
Schedule of Investments — June 30, 2015
Hotchkis & Wiley Diversified Value Fund
| | Shares
Held | | Value | |
Insurance — 8.38% | |
The Allstate Corp. | | | 58,400 | | | $ | 3,788,408 | | |
American International Group, Inc. | | | 399,100 | | | | 24,672,362 | | |
The Chubb Corp. | | | 84,700 | | | | 8,058,358 | | |
Unum Group | | | 241,500 | | | | 8,633,625 | | |
| | | | 45,152,753 | | |
TOTAL FINANCIALS | | | 155,188,420 | | |
HEALTH CARE — 13.03%
Health Care Equipment & Supplies — 2.46% | |
Medtronic PLC | | | 145,282 | | | | 10,765,396 | | |
Zimmer Biomet Holdings, Inc. | | | 22,800 | | | | 2,490,444 | | |
| | | | 13,255,840 | | |
Health Care Providers & Services — 4.30% | |
Anthem, Inc. | | | 33,700 | | | | 5,531,518 | | |
Express Scripts Holding Company (a) | | | 81,500 | | | | 7,248,610 | | |
Humana, Inc. | | | 25,600 | | | | 4,896,768 | | |
UnitedHealth Group, Inc. | | | 44,800 | | | | 5,465,600 | | |
| | | | 23,142,496 | | |
Pharmaceuticals — 6.27% | |
Eli Lilly & Company | | | 98,200 | | | | 8,198,718 | | |
GlaxoSmithKline PLC — ADR | | | 287,500 | | | | 11,974,375 | | |
Sanofi — ADR | | | 275,300 | | | | 13,635,609 | | |
| | | | 33,808,702 | | |
TOTAL HEALTH CARE | | | 70,207,038 | | |
INDUSTRIALS — 9.35%
Aerospace & Defense — 2.63% | |
The Boeing Company | | | 44,400 | | | | 6,159,168 | | |
Embraer SA — ADR | | | 85,200 | | | | 2,580,708 | | |
Rockwell Collins, Inc. | | | 58,800 | | | | 5,430,180 | | |
| | | | 14,170,056 | | |
Industrial Conglomerates — 0.45% | |
Koninklijke Philips NV | | | 95,100 | | | | 2,421,246 | | |
Machinery — 6.27% | |
| CNH Industrial NV (c) | | | 845,000 | | | | 7,841,600 | | |
Cummins, Inc. | | | 81,900 | | | | 10,744,461 | | |
PACCAR, Inc. | | | 72,700 | | | | 4,638,987 | | |
Parker-Hannifin Corp. | | | 55,900 | | | | 6,502,847 | | |
Stanley Black & Decker, Inc. | | | 39,000 | | | | 4,104,360 | | |
| | | | 33,832,255 | | |
TOTAL INDUSTRIALS | | | 50,423,557 | | |
INFORMATION TECHNOLOGY — 13.42%
Communications Equipment — 1.42% | |
Telefonaktiebolaget LM Ericsson — ADR | | | 734,100 | | | | 7,664,004 | | |
| | Shares
Held | | Value | |
Electronic Equipment, Instruments & Components — 2.64% | |
Corning, Inc. | | | 721,400 | | | $ | 14,233,222 | | |
IT Services — 1.60% | |
International Business Machines Corp. | | | 37,000 | | | | 6,018,420 | | |
Teradata Corp. (a) | | | 70,600 | | | | 2,612,200 | | |
| | | | 8,630,620 | | |
Semiconductors & Semiconductor Equipment — 0.45% | |
Texas Instruments, Inc. | | | 46,600 | | | | 2,400,366 | | |
Software — 5.90% | |
Microsoft Corp. | | | 362,000 | | | | 15,982,300 | | |
Oracle Corp. | | | 393,000 | | | | 15,837,900 | | |
| | | | 31,820,200 | | |
Technology Hardware, Storage & Peripherals — 1.41% | |
Hewlett-Packard Company | | | 252,300 | | | | 7,571,523 | | |
TOTAL INFORMATION TECHNOLOGY | | | 72,319,935 | | |
TELECOMMUNICATION SERVICES — 2.51%
Wireless Telecommunication Services — 2.51% | |
Vodafone Group PLC — ADR | | | 371,963 | | | | 13,558,051 | | |
TOTAL TELECOMMUNICATION SERVICES | | | 13,558,051 | | |
UTILITIES — 5.06%
Electric Utilities — 1.51% | |
PPL Corp. | | | 92,100 | | | | 2,714,187 | | |
The Southern Company | | | 128,800 | | | | 5,396,720 | | |
| | | | 8,110,907 | | |
Independent Power and Renewable Electricity
Producers — 2.63% | |
Calpine Corp. (a) | | | 496,900 | | | | 8,939,231 | | |
NRG Energy, Inc. | | | 228,700 | | | | 5,232,656 | | |
| | | | 14,171,887 | | |
Multi-Utilities — 0.92% | |
Public Service Enterprise Group, Inc. | | | 126,900 | | | | 4,984,632 | | |
TOTAL UTILITIES | | | 27,267,426 | | |
Total common stocks
(Cost $527,030,724) | | | 533,400,102 | | |
Total long-term investments
(Cost $527,030,724) | | | | | 533,400,102 | | |
COLLATERAL FOR SECURITIES ON LOAN — 1.11% | |
Money Market Funds — 1.11% | |
Invesco Government & Agency Portfolio, 0.04%^ | | | 5,985,033 | | | | 5,985,033 | | |
Total collateral for securities on loan
(Cost $5,985,033) | | | 5,985,033 | | |
The accompanying notes are an integral part of these financial statements.
17
Schedule of Investments — June 30, 2015
Hotchkis & Wiley Diversified Value Fund
SHORT-TERM
INVESTMENTS — 0.64% | | Principal
Amount | | Value | |
Time Deposits — 0.64% | |
Australia and New Zealand Banking
Group Ltd., 0.03%, 07/01/2015* | | $ | 3,441,985 | | | $ | 3,441,985 | | |
Total short-term investments
(Cost $3,441,985) | | | 3,441,985 | | |
Total investments — 100.71%
(Cost $536,457,742) | | | 542,827,120 | | |
Liabilities in excess of other assets — (0.71)% | | | | | (3,840,840 | ) | |
Net assets — 100.00% | | $ | 538,986,280 | | |
(a) — Non-income producing security.
(c) — All or a portion of this security is on loan. The total market value of securities on loan was $5,804,463.
ADR — American Depositary Receipt
^ — Rate shown is the 7-day yield as of June 30, 2015.
* — Invested through a cash management account administered by Brown Brothers Harriman & Co.
The Global Industry Classification Standard (GICS®) was developed by MSCI, an independent provider of global indices and benchmark-related products and services, and Standard & Poor's (S&P), an independent international financial data and investment services company. The GICS methodology has been widely accepted as an industry analysis framework for investment research, portfolio management and asset allocation. The GICS structure consists of 10 sectors, 24 industry groups, 67 industries and 156 sub-industries. Each stock that is classified will have a coding at all four of these levels.
The accompanying notes are an integral part of these financial statements.
18
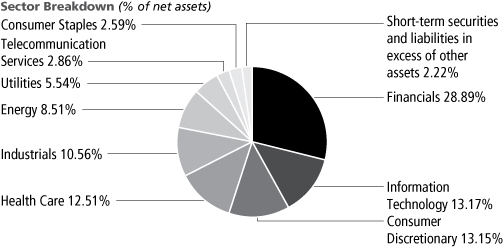
Schedule of Investments — June 30, 2015
Hotchkis & Wiley Large Cap Value Fund
Largest Equity Holdings | | Percent of
net assets | |
American International Group, Inc. | | | 5.02 | % | |
Citigroup, Inc. | | | 4.44 | % | |
Bank of America Corp. | | | 4.27 | % | |
JPMorgan Chase & Company | | | 4.04 | % | |
Marathon Oil Corp. | | | 3.25 | % | |
Microsoft Corp. | | | 2.95 | % | |
Oracle Corp. | | | 2.92 | % | |
Vodafone Group PLC | | | 2.86 | % | |
Corning, Inc. | | | 2.86 | % | |
Murphy Oil Corp. | | | 2.77 | % | |
COMMON
STOCKS — 97.78% | | Shares
Held | | Value | |
CONSUMER DISCRETIONARY — 13.15%
Auto Components — 2.24% | |
Johnson Controls, Inc. | | | 327,200 | | | $ | 16,206,216 | | |
Automobiles — 4.18% | |
General Motors Company | | | 440,000 | | | | 14,665,200 | | |
Harley-Davidson, Inc. | | | 67,800 | | | | 3,820,530 | | |
Honda Motor Company Ltd. — ADR | | | 364,200 | | | | 11,800,080 | | |
| | | | 30,285,810 | | |
Hotels, Restaurants & Leisure — 0.49% | |
McDonald's Corp. | | | 37,700 | | | | 3,584,139 | | |
Media — 3.03% | |
Comcast Corp. | | | 253,000 | | | | 15,164,820 | | |
The Interpublic Group of Companies, Inc. | | | 354,000 | | | | 6,821,580 | | |
| | | | 21,986,400 | | |
Multiline Retail — 1.48% | |
Target Corp. | | | 131,000 | | | | 10,693,530 | | |
Specialty Retail — 1.73% | |
Bed Bath & Beyond, Inc. (a) | | | 181,800 | | | | 12,540,564 | | |
TOTAL CONSUMER DISCRETIONARY | | | 95,296,659 | | |
CONSUMER STAPLES — 2.59%
Food & Staples Retailing — 1.42% | |
Wal-Mart Stores, Inc. | | | 145,000 | | | | 10,284,850 | | |
Food Products — 0.70% | |
Kellogg Company | | | 81,500 | | | | 5,110,050 | | |
Tobacco — 0.47% | |
Philip Morris International, Inc. | | | 42,500 | | | | 3,407,225 | | |
TOTAL CONSUMER STAPLES | | | 18,802,125 | | |
ENERGY — 8.51%
Oil, Gas & Consumable Fuels — 8.51% | |
Marathon Oil Corp. | | | 888,000 | | | | 23,567,520 | | |
Murphy Oil Corp. | | | 483,600 | | | | 20,103,252 | | |
Royal Dutch Shell PLC — ADR | | | 315,644 | | | | 17,994,865 | | |
TOTAL ENERGY | | | 61,665,637 | | |
| | Shares
Held | | Value | |
FINANCIALS — 28.89%
Banks — 15.53% | |
Bank of America Corp. | | | 1,820,689 | | | $ | 30,988,127 | | |
Citigroup, Inc. | | | 582,968 | | | | 32,203,152 | | |
Citizens Financial Group, Inc. | | | 391,400 | | | | 10,689,134 | | |
JPMorgan Chase & Company | | | 432,500 | | | | 29,306,200 | | |
Wells Fargo & Company | | | 166,291 | | | | 9,352,206 | | |
| | | | 112,538,819 | | |
Capital Markets — 2.49% | |
The Bank of New York Mellon Corp. | | | 85,800 | | | | 3,601,026 | | |
The Goldman Sachs Group, Inc. | | | 34,900 | | | | 7,286,771 | | |
State Street Corp. | | | 92,900 | | | | 7,153,300 | | |
| | | | 18,041,097 | | |
Consumer Finance — 2.03% | |
Capital One Financial Corp. | | | 167,500 | | | | 14,734,975 | | |
Insurance — 8.84% | |
American International Group, Inc. | | | 588,700 | | | | 36,393,434 | | |
The Chubb Corp. | | | 150,700 | | | | 14,337,598 | | |
Unum Group | | | 373,400 | | | | 13,349,050 | | |
| | | | 64,080,082 | | |
TOTAL FINANCIALS | | | 209,394,973 | | |
HEALTH CARE — 12.51%
Health Care Equipment & Supplies — 2.93% | |
Medtronic PLC | | | 190,500 | | | | 14,116,050 | | |
Zimmer Biomet Holdings, Inc. | | | 65,700 | | | | 7,176,411 | | |
| | | | 21,292,461 | | |
Health Care Providers & Services — 3.19% | |
Anthem, Inc. | | | 56,500 | | | | 9,273,910 | | |
Humana, Inc. | | | 34,200 | | | | 6,541,776 | | |
UnitedHealth Group, Inc. | | | 59,900 | | | | 7,307,800 | | |
| | | | 23,123,486 | | |
The accompanying notes are an integral part of these financial statements.
19
Schedule of Investments — June 30, 2015
Hotchkis & Wiley Large Cap Value Fund
| | Shares
Held | | Value | |
Pharmaceuticals — 6.39% | |
Eli Lilly & Company | | | 131,800 | | | $ | 11,003,982 | | |
GlaxoSmithKline PLC — ADR | | | 410,800 | | | | 17,109,820 | | |
Sanofi — ADR | | | 367,400 | | | | 18,197,322 | | |
| | | | 46,311,124 | | |
TOTAL HEALTH CARE | | | 90,727,071 | | |
INDUSTRIALS — 10.56%
Aerospace & Defense — 1.76% | |
The Boeing Company | | | 71,900 | | | | 9,973,968 | | |
Embraer SA — ADR | | | 91,900 | | | | 2,783,651 | | |
| | | | 12,757,619 | | |
Building Products — 0.80% | |
Owens Corning | | | 140,300 | | | | 5,787,375 | | |
Industrial Conglomerates — 0.47% | |
Koninklijke Philips NV | | | 134,100 | | | | 3,414,186 | | |
Machinery — 7.10% | |
| CNH Industrial NV (c) | | | 1,117,100 | | | | 10,366,688 | | |
Cummins, Inc. | | | 136,600 | | | | 17,920,554 | | |
PACCAR, Inc. | | | 113,800 | | | | 7,261,578 | | |
Parker-Hannifin Corp. | | | 89,800 | | | | 10,446,434 | | |
Stanley Black & Decker, Inc. | | | 52,300 | | | | 5,504,052 | | |
| | | | 51,499,306 | | |
Professional Services — 0.43% | |
ManpowerGroup, Inc. | | | 34,600 | | | | 3,092,548 | | |
TOTAL INDUSTRIALS | | | 76,551,034 | | |
INFORMATION TECHNOLOGY — 13.17%
Communications Equipment — 1.45% | |
Telefonaktiebolaget LM Ericsson — ADR | | | 1,006,800 | | | | 10,510,992 | | |
Electronic Equipment, Instruments & Components — 2.86% | |
Corning, Inc. | | | 1,050,600 | | | | 20,728,338 | | |
IT Services — 1.36% | |
International Business Machines Corp. | | | 60,600 | | | | 9,857,196 | | |
Software — 5.87% | |
Microsoft Corp. | | | 483,600 | | | | 21,350,940 | | |
Oracle Corp. | | | 525,700 | | | | 21,185,710 | | |
| | | | 42,536,650 | | |
Technology Hardware, Storage & Peripherals — 1.63% | |
Hewlett-Packard Company | | | 393,700 | | | | 11,814,937 | | |
TOTAL INFORMATION TECHNOLOGY | | | 95,448,113 | | |
TELECOMMUNICATION SERVICES — 2.86%
Wireless Telecommunication Services — 2.86% | |
Vodafone Group PLC — ADR | | | 569,154 | | | | 20,745,663 | | |
TOTAL TELECOMMUNICATION SERVICES | | | 20,745,663 | | |
| | Shares
Held | | Value | |
UTILITIES — 5.54%
Electric Utilities — 2.00% | |
PPL Corp. | | | 246,000 | | | $ | 7,249,620 | | |
The Southern Company | | | 172,400 | | | | 7,223,560 | | |
| | | | 14,473,180 | | |
Independent Power and Renewable Electricity
Producers — 2.62% | |
Calpine Corp. (a) | | | 666,300 | | | | 11,986,737 | | |
NRG Energy, Inc. | | | 305,300 | | | | 6,985,264 | | |
| | | | 18,972,001 | | |
Multi-Utilities — 0.92% | |
Public Service Enterprise Group, Inc. | | | 170,600 | | | | 6,701,168 | | |
TOTAL UTILITIES | | | 40,146,349 | | |
Total common stocks
(Cost $723,263,306) | | | 708,777,624 | | |
Total long-term investments
(Cost $723,263,306) | | | | | 708,777,624 | | |
COLLATERAL FOR SECURITIES ON LOAN — 1.09% | |
Money Market Funds — 1.09% | |
Invesco Government & Agency Portfolio, 0.04%^ | | | 7,895,512 | | | | 7,895,512 | | |
Total collateral for securities on loan
(Cost $7,895,512) | | | 7,895,512 | | |
SHORT-TERM
INVESTMENTS — 1.87% | | Principal
Amount | | | |
Time Deposits — 1.87% | |
Australia and New Zealand Banking
Group Ltd., 0.03%, 07/01/2015* | | $ | 13,581,314 | | | | 13,581,314 | | |
Total short-term investments
(Cost $13,581,314) | | | 13,581,314 | | |
Total investments — 100.74%
(Cost $744,740,132) | | | 730,254,450 | | |
Liabilities in excess of other assets — (0.74)% | | | | | (5,372,542 | ) | |
Net assets — 100.00% | | $ | 724,881,908 | | |
(a) — Non-income producing security.
(c) — All or a portion of this security is on loan. The total market value of securities on loan was $7,674,477.
ADR — American Depositary Receipt
^ — Rate shown is the 7-day yield as of June 30, 2015.
* — Invested through a cash management account administered by Brown Brothers Harriman & Co.
The Global Industry Classification Standard (GICS®) was developed by MSCI, an independent provider of global indices and benchmark-related products and services, and Standard & Poor's (S&P), an independent international financial data and investment services company. The GICS methodology has been widely accepted as an industry analysis framework for investment research, portfolio management and asset allocation. The GICS structure consists of 10 sectors, 24 industry groups, 67 industries and 156 sub-industries. Each stock that is classified will have a coding at all four of these levels.
The accompanying notes are an integral part of these financial statements.
20
Schedule of Investments — June 30, 2015
Hotchkis & Wiley Mid-Cap Value Fund

* Sum of sectors shown is greater than 100% due to short-term securities and liabilities in excess of other assets of (0.64)%.
Largest Equity Holdings | | Percent of
net assets | |
Great Plains Energy, Inc. | | | 3.56 | % | |
ARRIS Group, Inc. | | | 3.53 | % | |
White Mountains Insurance Group Ltd. | | | 3.41 | % | |
Cobalt International Energy, Inc. | | | 3.40 | % | |
Willis Group Holdings PLC | | | 3.37 | % | |
Con-way, Inc. | | | 3.30 | % | |
SunTrust Banks, Inc. | | | 3.28 | % | |
Citizens Financial Group, Inc. | | | 3.13 | % | |
The Goodyear Tire & Rubber Company | | | 3.12 | % | |
Regions Financial Corp. | | | 3.03 | % | |
COMMON
STOCKS — 100.64% | | Shares
Held | | Value | |
CONSUMER DISCRETIONARY — 15.72%
Auto Components — 3.12% | |
The Goodyear Tire & Rubber Company | | | 3,381,300 | | | $ | 101,946,195 | | |
Diversified Consumer Services — 0.63% | |
H&R Block, Inc. | | | 696,700 | | | | 20,657,155 | | |
Household Durables — 2.25% | |
TRI Pointe Homes, Inc. (a) | | | 4,807,700 | | | | 73,557,810 | | |
Media — 3.49% | |
The Interpublic Group of Companies, Inc. | | | 1,563,400 | | | | 30,126,718 | | |
News Corp. (a) | | | 3,149,900 | | | | 45,957,041 | | |
Omnicom Group, Inc. | | | 545,200 | | | | 37,885,948 | | |
| | | | 113,969,707 | | |
Multiline Retail — 1.02% | |
Kohl's Corp. | | | 530,800 | | | | 33,233,388 | | |
Specialty Retail — 5.21% | |
Bed Bath & Beyond, Inc. (a) | | | 856,500 | | | | 59,081,370 | | |
Best Buy Company, Inc. | | | 741,100 | | | | 24,167,271 | | |
Office Depot, Inc. (a) | | | 2,904,600 | | | | 25,153,836 | | |
Rent-A-Center, Inc. | | | 930,400 | | | | 26,376,840 | | |
Staples, Inc. | | | 2,310,500 | | | | 35,373,755 | | |
| | | | 170,153,072 | | |
TOTAL CONSUMER DISCRETIONARY | | | 513,517,327 | | |
CONSUMER STAPLES — 2.74%
Food Products — 2.74% | |
Bunge Ltd. | | | 785,100 | | | | 68,931,780 | | |
Fresh Del Monte Produce, Inc. | | | 534,100 | | | | 20,648,306 | | |
TOTAL CONSUMER STAPLES | | | 89,580,086 | | |
ENERGY — 15.02%
Energy Equipment & Services — 3.37% | |
Dresser-Rand Group, Inc. (a) | | | 961,100 | | | | 81,866,498 | | |
McDermott International, Inc. (a) | | | 3,697,800 | | | | 19,746,252 | | |
Rowan Companies PLC | | | 399,500 | | | | 8,433,445 | | |
| | | | 110,046,195 | | |
| | Shares
Held | | Value | |
Oil, Gas & Consumable Fuels — 11.65% | |
Cairn Energy PLC (a) (b) (f) | | | 30,408,600 | | | $ | 80,989,964 | | |
Cobalt International Energy, Inc. (a) | | | 11,423,800 | | | | 110,925,098 | | |
Comstock Resources, Inc. (b) | | | 5,728,300 | | | | 19,075,239 | | |
Kosmos Energy Ltd. (a) | | | 9,771,600 | | | | 82,374,588 | | |
Ophir Energy PLC (a) (b) (f) | | | 49,018,000 | | | | 87,289,379 | | |
| | | | 380,654,268 | | |
TOTAL ENERGY | | | 490,700,463 | | |
FINANCIALS — 32.06%
Banks — 15.42% | |
CIT Group, Inc. | | | 1,153,500 | | | | 53,626,215 | | |
Citizens Financial Group, Inc. | | | 3,748,100 | | | | 102,360,611 | | |
Fifth Third Bancorp | | | 1,271,500 | | | | 26,472,630 | | |
Popular, Inc. (a) | | | 3,160,200 | | | | 91,203,372 | | |
Regions Financial Corp. | | | 9,566,900 | | | | 99,113,084 | | |
SunTrust Banks, Inc. | | | 2,489,800 | | | | 107,111,196 | | |
Zions Bancorporation | | | 748,700 | | | | 23,759,995 | | |
| | | | 503,647,103 | | |
Consumer Finance — 0.82% | |
Santander Consumer USA Holdings, Inc. (a) | | | 1,045,300 | | | | 26,728,321 | | |
Diversified Financial Services — 1.68% | |
PHH Corp. (a) (c) | | | 2,110,900 | | | | 54,946,727 | | |
Insurance — 12.90% | |
Alleghany Corp. (a) | | | 77,000 | | | | 36,094,520 | | |
Brown & Brown, Inc. | | | 1,272,700 | | | | 41,820,922 | | |
Enstar Group Ltd. (a) | | | 77,140 | | | | 11,952,843 | | |
Old Republic International Corp. | | | 2,216,200 | | | | 34,639,206 | | |
Unum Group | | | 2,109,500 | | | | 75,414,625 | | |
White Mountains Insurance Group Ltd. | | | 170,300 | | | | 111,536,282 | | |
Willis Group Holdings PLC | | | 2,345,700 | | | | 110,013,330 | | |
| | | | 421,471,728 | | |
The accompanying notes are an integral part of these financial statements.
21
Schedule of Investments — June 30, 2015
Hotchkis & Wiley Mid-Cap Value Fund
| | Shares
Held | | Value | |
Real Estate Investment Trusts — 1.24% | |
Corrections Corp. of America | | | 498,500 | | | $ | 16,490,380 | | |
The GEO Group, Inc. | | | 702,400 | | | | 23,993,984 | | |
| | | | 40,484,364 | | |
TOTAL FINANCIALS | | | 1,047,278,243 | | |
HEALTH CARE — 0.73%
Health Care Providers & Services — 0.73% | |
WellCare Health Plans, Inc. (a) | | | 278,800 | | | | 23,650,604 | | |
TOTAL HEALTH CARE | | | 23,650,604 | | |
INDUSTRIALS — 10.64%
Aerospace & Defense — 0.94% | |
Embraer SA — ADR | | | 1,019,500 | | | | 30,880,655 | | |
Air Freight & Logistics — 2.74% | |
Royal Mail PLC (f) | | | 11,054,000 | | | | 89,365,660 | | |
Building Products — 0.59% | |
Owens Corning | | | 466,200 | | | | 19,230,750 | | |
Machinery — 3.07% | |
Allison Transmission Holdings, Inc. | | | 539,500 | | | | 15,785,770 | | |
Navistar International Corp. (a) (c) | | | 3,732,600 | | | | 84,468,738 | | |
| | | | 100,254,508 | | |
Road & Rail — 3.30% | |
Con-way, Inc. | | | 2,811,800 | | | | 107,888,766 | | |
TOTAL INDUSTRIALS | | | 347,620,339 | | |
INFORMATION TECHNOLOGY — 14.67%
Communications Equipment — 3.53% | |
ARRIS Group, Inc. (a) | | | 3,765,200 | | | | 115,215,120 | | |
Electronic Equipment, Instruments & Components — 5.43% | |
Avnet, Inc. | | | 2,243,300 | | | | 92,222,063 | | |
CDW Corp. | | | 1,837,600 | | | | 62,992,928 | | |
Ingram Micro, Inc. (a) | | | 891,900 | | | | 22,324,257 | | |
| | | | 177,539,248 | | |
IT Services — 1.00% | |
Teradata Corp. (a) | | | 884,700 | | | | 32,733,900 | | |
Semiconductors & Semiconductor Equipment — 2.62% | |
Marvell Technology Group Ltd. | | | 3,080,500 | | | | 40,616,393 | | |
ON Semiconductor Corp. (a) | | | 3,837,200 | | | | 44,856,868 | | |
| | | | 85,473,261 | | |
Software — 2.09% | |
CA, Inc. | | | 1,158,600 | | | | 33,935,394 | | |
Comverse, Inc. (a) | | | 152,680 | | | | 3,065,814 | | |
Symantec Corp. | | | 1,340,000 | | | | 31,155,000 | | |
| | | | 68,156,208 | | |
TOTAL INFORMATION TECHNOLOGY | | | 479,117,737 | | |
| | Shares
Held | | Value | |
UTILITIES — 9.06%
Electric Utilities — 3.56% | |
Great Plains Energy, Inc. | | | 4,818,500 | | | $ | 116,414,960 | | |
Independent Power and Renewable Electricity
Producers — 3.97% | |
Calpine Corp. (a) | | | 4,606,400 | | | | 82,869,136 | | |
NRG Energy, Inc. | | | 2,042,800 | | | | 46,739,264 | | |
| | | | 129,608,400 | | |
Multi-Utilities — 1.53% | |
Public Service Enterprise Group, Inc. | | | 1,269,600 | | | | 49,869,888 | | |
TOTAL UTILITIES | | | 295,893,248 | | |
Total common stocks
(Cost $3,172,939,172) | | | 3,287,358,047 | | |
Total long-term investments
(Cost $3,172,939,172) | | | | | 3,287,358,047 | | |
COLLATERAL FOR SECURITIES ON LOAN — 1.22% | |
Money Market Funds — 1.22% | |
Invesco Government & Agency Portfolio, 0.04%^ | | | 39,991,213 | | | | 39,991,213 | | |
Total collateral for securities on loan
(Cost $39,991,213) | | | 39,991,213 | | |
SHORT-TERM
INVESTMENTS — 0.09% | | Principal
Amount | | | |
Time Deposits — 0.09% | |
Bank of Montreal, 0.03%, 07/01/2015* | | $ | 2,751,182 | | | | 2,751,182 | | |
Brown Brothers Harriman & Co.,
0.08%, 07/01/2015* | | GBP | 11 | | | | 17 | | |
Total short-term investments
(Cost $2,751,198) | | | 2,751,199 | | |
Total investments — 101.95%
(Cost $3,215,681,583) | | | 3,330,100,459 | | |
Liabilities in excess of other assets — (1.95)% | | | | | (63,694,955 | ) | |
Net assets — 100.00% | | $ | 3,266,405,504 | | |
(a) — Non-income producing security.
(b) — Affiliated issuer. See Note 6 in Notes to the Financial Statements.
(c) — All or a portion of this security is on loan. The total market value of securities on loan was $39,119,673.
(f) — Security was fair valued as a result of market movements following the close of local trading using a third-party vendor's proprietary fair value pricing model. The total market value of these securities was $257,645,003, which represented 7.89% of net assets. See Security Valuation in Note 1 in Notes to the Financial Statements.
ADR — American Depositary Receipt
GBP — British Pounds
^ — Rate shown is the 7-day yield as of June 30, 2015.
* — Invested through a cash management account administered by Brown Brothers Harriman & Co.
The accompanying notes are an integral part of these financial statements.
22
Schedule of Investments — June 30, 2015
Hotchkis & Wiley Mid-Cap Value Fund
The Global Industry Classification Standard (GICS®) was developed by MSCI, an independent provider of global indices and benchmark-related products and services, and Standard & Poor's (S&P), an independent international financial data and investment services company. The GICS methodology has been widely accepted as an industry analysis framework for investment research, portfolio management and asset allocation. The GICS structure consists of 10 sectors, 24 industry groups, 67 industries and 156 sub-industries. Each stock that is classified will have a coding at all four of these levels.
The accompanying notes are an integral part of these financial statements.
23
Schedule of Investments — June 30, 2015
Hotchkis & Wiley Small Cap Value Fund
Largest Equity Holdings | | Percent of
net assets | |
Con-way, Inc. | | | 4.76 | % | |
Horace Mann Educators Corp. | | | 4.31 | % | |
Great Plains Energy, Inc. | | | 4.28 | % | |
Rush Enterprises, Inc. | | | 3.51 | % | |
Masonite International Corp. | | | 3.40 | % | |
Hanger, Inc. | | | 3.24 | % | |
Sonic Automotive, Inc. | | | 2.90 | % | |
WellCare Health Plans, Inc. | | | 2.71 | % | |
ARRIS Group, Inc. | | | 2.65 | % | |
Kaiser Aluminum Corp. | | | 2.60 | % | |
COMMON
STOCKS — 95.09% | | Shares
Held | | Value | |
CONSUMER DISCRETIONARY — 8.40%
Hotels, Restaurants & Leisure — 0.77% | |
Lakes Entertainment, Inc. (a) | | | 98,500 | | | $ | 894,380 | | |
Ruby Tuesday, Inc. (a) | | | 1,313,700 | | | | 8,236,899 | | |
| | | | 9,131,279 | | |
Household Durables — 4.73% | |
M/I Homes, Inc. (a) | | | 717,500 | | | | 17,700,725 | | |
TRI Pointe Homes, Inc. (a) | | | 1,202,000 | | | | 18,390,600 | | |
William Lyon Homes (a) | | | 768,600 | | | | 19,729,962 | | |
| | | | 55,821,287 | | |
Specialty Retail — 2.90% | |
Sonic Automotive, Inc. | | | 1,438,400 | | | | 34,277,072 | | |
TOTAL CONSUMER DISCRETIONARY | | | 99,229,638 | | |
ENERGY — 5.05%
Energy Equipment & Services — 1.97% | |
McDermott International, Inc. (a) | | | 1,378,300 | | | | 7,360,122 | | |
Rowan Companies PLC | | | 755,000 | | | | 15,938,050 | | |
| | | | 23,298,172 | | |
Oil, Gas & Consumable Fuels — 3.08% | |
Cairn Energy PLC (a) (f) | | | 3,342,600 | | | | 8,902,648 | | |
Cobalt International Energy, Inc. (a) | | | 1,199,300 | | | | 11,645,203 | | |
Kosmos Energy Ltd. (a) | | | 1,236,300 | | | | 10,422,009 | | |
Rockhopper Exploration PLC (a) (f) | | | 5,203,200 | | | | 5,449,682 | | |
| | | | 36,419,542 | | |
TOTAL ENERGY | | | 59,717,714 | | |
| | Shares
Held | | Value | |
FINANCIALS — 20.95%
Banks — 8.12% | |
Associated Banc-Corp | | | 482,500 | | | $ | 9,780,275 | | |
First BanCorp (a) | | | 1,851,100 | | | | 8,922,302 | | |
First Horizon National Corp. | | | 1,524,331 | | | | 23,886,267 | | |
First Niagara Financial Group, Inc. | | | 2,088,700 | | | | 19,717,328 | | |
Investors Bancorp, Inc. | | | 276,500 | | | | 3,400,950 | | |
Popular, Inc. (a) | | | 826,700 | | | | 23,858,562 | | |
Synovus Financial Corp. | | | 205,571 | | | | 6,335,698 | | |
| | | | 95,901,382 | | |
Capital Markets — 0.60% | |
Oppenheimer Holdings, Inc. | | | 270,900 | | | | 7,119,252 | | |
Diversified Financial Services — 1.51% | |
PHH Corp. (a) | | | 686,200 | | | | 17,861,786 | | |
Insurance — 7.15% | |
Aspen Insurance Holdings Ltd. | | | 123,300 | | | | 5,906,070 | | |
Employers Holdings, Inc. | | | 45,600 | | | | 1,038,768 | | |
Endurance Specialty Holdings Ltd. | | | 81,800 | | | | 5,374,260 | | |
Enstar Group Ltd. (a) | | | 26,850 | | | | 4,160,408 | | |
Global Indemnity PLC (a) | | | 380,036 | | | | 10,671,411 | | |
Horace Mann Educators Corp. | | | 1,400,000 | | | | 50,932,000 | | |
National Western Life Insurance Company | | | 5,800 | | | | 1,389,042 | | |
Symetra Financial Corp. | | | 209,000 | | | | 5,051,530 | | |
| | | | 84,523,489 | | |
Real Estate Investment Trusts — 3.57% | |
The GEO Group, Inc. | | | 886,796 | | | | 30,292,951 | | |
Granite Real Estate Investment Trust | | | 347,400 | | | | 11,860,236 | | |
| | | | 42,153,187 | | |
TOTAL FINANCIALS | | | 247,559,096 | | |
The accompanying notes are an integral part of these financial statements.
24
Schedule of Investments — June 30, 2015
Hotchkis & Wiley Small Cap Value Fund
| | Shares
Held | | Value | |
HEALTH CARE — 10.08%
Health Care Equipment & Supplies — 0.93% | |
Invacare Corp. | | | 510,300 | | | $ | 11,037,789 | | |
Health Care Providers & Services — 8.18% | |
Hanger, Inc. (a) | | | 1,631,900 | | | | 38,251,736 | | |
LifePoint Health, Inc. (a) | | | 304,300 | | | | 26,458,885 | | |
WellCare Health Plans, Inc. (a) | | | 377,200 | | | | 31,997,876 | | |
| | | | 96,708,497 | | |
Pharmaceuticals — 0.97% | |
Taro Pharmaceutical Industries Ltd. (a) | | | 79,400 | | | | 11,408,986 | | |
TOTAL HEALTH CARE | | | 119,155,272 | | |
INDUSTRIALS — 26.03%
Building Products — 3.40% | |
Masonite International Corp. (a) | | | 572,800 | | | | 40,159,008 | | |
Commercial Services & Supplies — 0.48% | |
The Brink's Company | | | 193,600 | | | | 5,697,648 | | |
Construction & Engineering — 3.24% | |
KBR, Inc. | | | 1,369,900 | | | | 26,685,652 | | |
Tutor Perini Corp. (a) | | | 541,100 | | | | 11,676,938 | | |
| | | | 38,362,590 | | |
Machinery — 7.94% | |
CIRCOR International, Inc. | | | 165,800 | | | | 9,041,074 | | |
EnPro Industries, Inc. | | | 498,500 | | | | 28,524,170 | | |
Harsco Corp. | | | 353,300 | | | | 5,829,450 | | |
Meritor, Inc. (a) | | | 1,692,900 | | | | 22,210,848 | | |
Miller Industries, Inc. (b) | | | 848,800 | | | | 16,933,560 | | |
Navistar International Corp. (a) (c) | | | 500,100 | | | | 11,317,263 | | |
| | | | 93,856,365 | | |
Marine — 1.99% | |
Matson, Inc. | | | 559,400 | | | | 23,517,176 | | |
Professional Services — 0.71% | |
Heidrick & Struggles International, Inc. | | | 121,400 | | | | 3,166,112 | | |
Hudson Global, Inc. (a) (b) | | | 2,266,700 | | | | 5,190,743 | | |
| | | | 8,356,855 | | |
Road & Rail — 4.76% | |
Con-way, Inc. (d) | | | 1,464,900 | | | | 56,208,213 | | |
Trading Companies & Distributors — 3.51% | |
Rush Enterprises, Inc. (a) (b) | | | 1,581,100 | | | | 41,440,631 | | |
TOTAL INDUSTRIALS | | | 307,598,486 | | |
INFORMATION TECHNOLOGY — 8.06%
Communications Equipment — 3.38% | |
ARRIS Group, Inc. (a) | | | 1,025,200 | | | | 31,371,120 | | |
Extreme Networks, Inc. (a) | | | 3,168,700 | | | | 8,523,803 | | |
| | | | 39,894,923 | | |
| | Shares
Held | | Value | |
Semiconductors & Semiconductor Equipment — 2.12% | |
Diodes, Inc. (a) | | | 591,300 | | | $ | 14,256,243 | | |
ON Semiconductor Corp. (a) | | | 922,400 | | | | 10,782,856 | | |
| | | | 25,039,099 | | |
Software — 1.14% | |
Comverse, Inc. (a) | | | 673,110 | | | | 13,516,049 | | |
Technology Hardware, Storage & Peripherals — 1.42% | |
QLogic Corp. (a) | | | 1,186,300 | | | | 16,833,597 | | |
TOTAL INFORMATION TECHNOLOGY | | | 95,283,668 | | |
MATERIALS — 9.86%
Chemicals — 0.59% | |
American Vanguard Corp. | | | 502,300 | | | | 6,931,740 | | |
Metals & Mining — 7.70% | |
Horsehead Holding Corp. (a) (c) | | | 2,295,100 | | | | 26,898,572 | | |
Kaiser Aluminum Corp. | | | 369,700 | | | | 30,714,676 | | |
Noranda Aluminum Holding Corp. (b) | | | 5,601,500 | | | | 4,761,275 | | |
Real Industry, Inc. (a) (b) | | | 2,518,508 | | | | 28,585,066 | | |
| | | | 90,959,589 | | |
Paper & Forest Products — 1.57% | |
Louisiana-Pacific Corp. (a) | | | 1,092,700 | | | | 18,608,681 | | |
TOTAL MATERIALS | | | 116,500,010 | | |
UTILITIES — 6.66%
Electric Utilities — 5.42% | |
Great Plains Energy, Inc. | | | 2,092,700 | | | | 50,559,632 | | |
Portland General Electric Company | | | 352,400 | | | | 11,685,584 | | |
Westar Energy, Inc. | | | 52,300 | | | | 1,789,706 | | |
| | | | 64,034,922 | | |
Independent Power and Renewable Electricity
Producers — 1.24% | |
NRG Energy, Inc. | | | 638,599 | | | | 14,611,145 | | |
TOTAL UTILITIES | | | 78,646,067 | | |
Total common stocks
(Cost $1,017,879,007) | | | | | 1,123,689,951 | | |
INVESTMENT COMPANIES — 2.26% | |
Exchange Traded Funds — 2.26% | |
iShares Russell 2000 Value Index Fund (c) | | | 262,200 | | | | 26,733,912 | | |
Total investment companies
(Cost $22,697,417) | | | 26,733,912 | | |
Total long-term investments
(Cost $1,040,576,424) | | | | | 1,150,423,863 | | |
The accompanying notes are an integral part of these financial statements.
25
Schedule of Investments — June 30, 2015
Hotchkis & Wiley Small Cap Value Fund
| | Shares
Held | | Value | |
COLLATERAL FOR SECURITIES ON LOAN — 3.89% | |
Money Market Funds — 3.89% | |
Invesco Government & Agency Portfolio, 0.04%^ | | | 45,944,634 | | | $ | 45,944,634 | | |
Total collateral for securities on loan
(Cost $45,944,634) | | | 45,944,634 | | |
SHORT-TERM
INVESTMENTS — 2.87% | | Principal
Amount | | | |
Time Deposits — 2.87% | |
Bank of Montreal, 0.03%, 07/01/2015* | | $ | 33,922,760 | | | | 33,922,760 | | |
Total short-term investments
(Cost $33,922,760) | | | 33,922,760 | | |
Total investments — 104.11%
(Cost $1,120,443,818) | | | 1,230,291,257 | | |
Liabilities in excess of other assets — (4.11)% | | | | | (48,620,669 | ) | |
Net assets — 100.00% | | $ | 1,181,670,588 | | |
(a) — Non-income producing security.
(b) — Affiliated issuer. See Note 6 in Notes to the Financial Statements.
(c) — All or a portion of this security is on loan. The total market value of securities on loan was $44,973,840.
(d) — All or a portion of this security is segregated as collateral.
(f) — Security was fair valued as a result of market movements following the close of local trading using a third-party vendor's proprietary fair value pricing model. The total market value of these securities was $14,352,330, which represented 1.21% of net assets. See Security Valuation in Note 1 in Notes to the Financial Statements.
^ — Rate shown is the 7-day yield as of June 30, 2015.
* — Invested through a cash management account administered by Brown Brothers Harriman & Co.
The Global Industry Classification Standard (GICS®) was developed by MSCI, an independent provider of global indices and benchmark-related products and services, and Standard & Poor's (S&P), an independent international financial data and investment services company. The GICS methodology has been widely accepted as an industry analysis framework for investment research, portfolio management and asset allocation. The GICS structure consists of 10 sectors, 24 industry groups, 67 industries and 156 sub-industries. Each stock that is classified will have a coding at all four of these levels.
The accompanying notes are an integral part of these financial statements.
26
Schedule of Investments — June 30, 2015
Hotchkis & Wiley Small Cap Diversified Value Fund
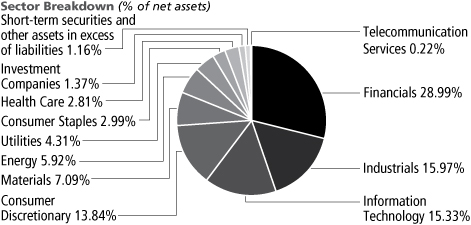
Largest Equity Holdings | | Percent of
net assets | |
Sears Hometown and Outlet Stores, Inc. | | | 0.55 | % | |
National Presto Industries, Inc. | | | 0.52 | % | |
RPX Corp. | | | 0.47 | % | |
Higher One Holdings, Inc. | | | 0.47 | % | |
Oppenheimer Holdings, Inc. | | | 0.45 | % | |
Primoris Services Corp. | | | 0.45 | % | |
Columbus McKinnon Corp. | | | 0.45 | % | |
Suffolk Bancorp | | | 0.45 | % | |
HomeStreet, Inc. | | | 0.45 | % | |
Associated Banc-Corp | | | 0.45 | % | |
COMMON
STOCKS — 97.47% | | Shares
Held | | Value | |
CONSUMER DISCRETIONARY — 13.84%
Auto Components — 2.32% | |
American Axle & Manufacturing Holdings, Inc. (a) | | | 1,857 | | | $ | 38,830 | | |
Cooper-Standard Holding, Inc. (a) | | | 564 | | | | 34,669 | | |
Federal-Mogul Holdings Corp. (a) | | | 1,215 | | | | 13,790 | | |
Modine Manufacturing Company (a) | | | 4,187 | | | | 44,927 | | |
Remy International, Inc. | | | 2,719 | | | | 60,117 | | |
Shiloh Industries, Inc. (a) | | | 4,750 | | | | 61,512 | | |
Standard Motor Products, Inc. | | | 775 | | | | 27,218 | | |
Strattec Security Corp. | | | 446 | | | | 30,640 | | |
Tower International, Inc. (a) | | | 1,839 | | | | 47,906 | | |
| | | | 359,609 | | |
Diversified Consumer Services — 0.70% | |
American Public Education, Inc. (a) | | | 2,019 | | | | 51,929 | | |
Bridgepoint Education, Inc. (a) | | | 3,219 | | | | 30,774 | | |
Capella Education Company | | | 239 | | | | 12,827 | | |
DeVry Education Group, Inc. | | | 441 | | | | 13,221 | | |
| | | | 108,751 | | |
Hotels, Restaurants & Leisure — 0.97% | |
Century Casinos, Inc. (a) | | | 5,761 | | | | 36,294 | | |
Lakes Entertainment, Inc. (a) | | | 7,281 | | | | 66,112 | | |
Speedway Motorsports, Inc. | | | 1,399 | | | | 31,687 | | |
Tropicana Entertainment, Inc. (a) | | | 975 | | | | 15,649 | | |
| | | | 149,742 | | |
| | Shares
Held | | Value | |
Household Durables — 2.86% | |
Blyth, Inc. (a) | | | 2,122 | | | $ | 13,475 | | |
CSS Industries, Inc. | | | 1,071 | | | | 32,398 | | |
Ethan Allen Interiors, Inc. | | | 569 | | | | 14,987 | | |
Hooker Furniture Corp. | | | 1,787 | | | | 44,872 | | |
LGI Homes, Inc. (a) | | | 2,483 | | | | 49,114 | | |
Libbey, Inc. | | | 391 | | | | 16,160 | | |
Lifetime Brands, Inc. | | | 3,261 | | | | 48,165 | | |
M/I Homes, Inc. (a) | | | 2,047 | | | | 50,499 | | |
Skullcandy, Inc. (a) | | | 4,075 | | | | 31,255 | | |
Taylor Morrison Home Corp. (a) | | | 2,365 | | | | 48,151 | | |
William Lyon Homes (a) | | | 2,018 | | | | 51,803 | | |
ZAGG, Inc. (a) | | | 5,334 | | | | 42,245 | | |
| | | | 443,124 | | |
Internet & Catalog Retail — 0.44% | |
PetMed Express, Inc. | | | 3,982 | | | | 68,769 | | |
Leisure Products — 0.93% | |
Arctic Cat, Inc. | | | 1,674 | | | | 55,593 | | |
Johnson Outdoors, Inc. | | | 1,936 | | | | 45,593 | | |
Malibu Boats, Inc. (a) | | | 2,100 | | | | 42,189 | | |
| | | | 143,375 | | |
Media — 1.08% | |
Entercom Communications Corp. (a) | | | 2,661 | | | | 30,389 | | |
Meredith Corp. | | | 281 | | | | 14,654 | | |
The New York Times Company | | | 2,311 | | | | 31,545 | | |
Saga Communications, Inc. | | | 1,113 | | | | 42,127 | | |
Time, Inc. | | | 2,068 | | | | 47,585 | | |
| | | | 166,300 | | |
The accompanying notes are an integral part of these financial statements.
27
Schedule of Investments — June 30, 2015
Hotchkis & Wiley Small Cap Diversified Value Fund
| | Shares
Held | | Value | |
Specialty Retail — 2.91% | |
Aaron's, Inc. | | | 1,854 | | | $ | 67,133 | | |
America's Car-Mart, Inc. (a) | | | 280 | | | | 13,810 | | |
Big 5 Sporting Goods Corp. | | | 1,160 | | | | 16,484 | | |
The Buckle, Inc. | | | 307 | | | | 14,051 | | |
Express, Inc. (a) | | | 940 | | | | 17,023 | | |
The Finish Line, Inc. | | | 1,303 | | | | 36,249 | | |
Francesca's Holdings Corp. (a) | | | 2,946 | | | | 39,683 | | |
Office Depot, Inc. (a) | | | 5,054 | | | | 43,768 | | |
Outerwall, Inc. | | | 703 | | | | 53,505 | | |
Rent-A-Center, Inc. | | | 560 | | | | 15,876 | | |
Sears Hometown and Outlet Stores, Inc. (a) | | | 8,893 | | | | 84,484 | | |
Select Comfort Corp. (a) | | | 921 | | | | 27,694 | | |
Tilly's, Inc. (a) | | | 943 | | | | 9,119 | | |
Zumiez, Inc. (a) | | | 393 | | | | 10,466 | | |
| | | | 449,345 | | |
Textiles, Apparel & Luxury Goods — 1.63% | |
Culp, Inc. | | | 1,185 | | | | 36,735 | | |
Iconix Brand Group, Inc. (a) | | | 1,204 | | | | 30,064 | | |
Movado Group, Inc. | | | 1,586 | | | | 43,076 | | |
Rocky Brands, Inc. | | | 2,964 | | | | 55,426 | | |
Steven Madden Ltd. (a) | | | 1,244 | | | | 53,218 | | |
Vera Bradley, Inc. (a) | | | 2,950 | | | | 33,247 | | |
| | | | 251,766 | | |
TOTAL CONSUMER DISCRETIONARY | | | 2,140,781 | | |
CONSUMER STAPLES — 2.99%
Food & Staples Retailing — 0.17% | |
Weis Markets, Inc. | | | 616 | | | | 25,964 | | |
Food Products — 0.65% | |
John B. Sanfilippo & Son, Inc. | | | 417 | | | | 21,642 | | |
Omega Protein Corp. (a) | | | 4,692 | | | | 64,516 | | |
Sanderson Farms, Inc. | | | 189 | | | | 14,205 | | |
| | | | 100,363 | | |
Personal Products — 1.73% | |
Lifevantage Corp. (a) | | | 92,811 | | | | 49,190 | | |
Nature's Sunshine Products, Inc. | | | 3,613 | | | | 49,679 | | |
Nu Skin Enterprises, Inc. | | | 1,237 | | | | 58,300 | | |
Nutraceutical International Corp. (a) | | | 2,458 | | | | 60,810 | | |
USANA Health Sciences, Inc. (a) | | | 366 | | | | 50,018 | | |
| | | | 267,997 | | |
Tobacco — 0.44% | |
Universal Corp. | | | 1,200 | | | | 68,784 | | |
TOTAL CONSUMER STAPLES | | | 463,108 | | |
| | Shares
Held | | Value | |
ENERGY — 5.92%
Energy Equipment & Services — 2.20% | |
Atwood Oceanics, Inc. | | | 1,084 | | | $ | 28,661 | | |
CARBO Ceramics, Inc. | | | 1,104 | | | | 45,960 | | |
Dawson Geophysical Company (a) | | | 3,489 | | | | 16,398 | | |
Geospace Technologies Corp. (a) | | | 2,181 | | | | 50,272 | | |
Gulf Island Fabrication, Inc. | | | 1,031 | | | | 11,516 | | |
Hornbeck Offshore Services, Inc. (a) | | | 816 | | | | 16,752 | | |
Matrix Service Company (a) | | | 2,738 | | | | 50,051 | | |
Oil States International, Inc. (a) | | | 1,204 | | | | 44,825 | | |
Tesco Corp. | | | 4,108 | | | | 44,777 | | |
Unit Corp. (a) | | | 1,148 | | | | 31,134 | | |
| | | | 340,346 | | |
Oil, Gas & Consumable Fuels — 3.72% | |
Alliance Resource Partners LP | | | 1,405 | | | | 35,069 | | |
Alon USA Energy, Inc. | | | 2,083 | | | | 39,369 | | |
Alon USA Partners LP | | | 1,618 | | | | 34,010 | | |
Cloud Peak Energy, Inc. (a) | | | 10,221 | | | | 47,630 | | |
Contango Oil & Gas Company (a) | | | 3,304 | | | | 40,540 | | |
Delek US Holdings, Inc. | | | 1,253 | | | | 46,135 | | |
Global Partners LP | | | 836 | | | | 27,120 | | |
Natural Resource Partners LP | | | 6,056 | | | | 22,952 | | |
Northern Tier Energy LP | | | 1,228 | | | | 29,190 | | |
Oasis Petroleum, Inc. (a) | | | 2,739 | | | | 43,413 | | |
PrimeEnergy Corp. (a) | | | 915 | | | | 52,064 | | |
Stone Energy Corp. (a) | | | 3,346 | | | | 42,126 | | |
VAALCO Energy, Inc. (a) | | | 27,976 | | | | 59,869 | | |
Western Refining, Inc. | | | 1,273 | | | | 55,528 | | |
| | | | 575,015 | | |
TOTAL ENERGY | | | 915,361 | | |
The accompanying notes are an integral part of these financial statements.
28
Schedule of Investments — June 30, 2015
Hotchkis & Wiley Small Cap Diversified Value Fund
| | Shares
Held | | Value | |
FINANCIALS — 28.99%
Banks — 15.03% | |
1st Source Corp. | | | 492 | | | $ | 16,787 | | |
Access National Corp. | | | 851 | | | | 16,543 | | |
American National Bankshares, Inc. | | | 2,071 | | | | 49,311 | | |
Ames National Corp. | | | 635 | | | | 15,939 | | |
Associated Banc-Corp | | | 3,410 | | | | 69,121 | | |
The Bancorp, Inc. (a) | | | 6,776 | | | | 62,881 | | |
Bank of Hawaii Corp. | | | 522 | | | | 34,807 | | |
Bank of Marin Bancorp | | | 618 | | | | 31,438 | | |
Bank of the Ozarks, Inc. | | | 847 | | | | 38,750 | | |
Bar Harbor Bankshares | | | 484 | | | | 17,148 | | |
BBCN Bancorp, Inc. | | | 3,342 | | | | 49,428 | | |
Bridge Bancorp, Inc. | | | 630 | | | | 16,815 | | |
C&F Financial Corp. | | | 1,852 | | | | 68,617 | | |
Camden National Corp. | | | 1,637 | | | | 63,352 | | |
Cathay General Bancorp | | | 1,148 | | | | 37,253 | | |
Central Valley Community Bancorp | | | 4,056 | | | | 47,982 | | |
Chemical Financial Corp. | | | 1,021 | | | | 33,754 | | |
City Holding Company | | | 333 | | | | 16,400 | | |
First Bancorp | | | 2,737 | | | | 45,653 | | |
First BanCorp (a) | | | 10,093 | | | | 48,648 | | |
First Bancorp, Inc. | | | 1,887 | | | | 36,683 | | |
First Citizens BancShares, Inc. | | | 182 | | | | 47,873 | | |
First Community Bancshares, Inc. | | | 902 | | | | 16,434 | | |
First Financial Bancorp | | | 899 | | | | 16,128 | | |
First Financial Corp. | | | 1,338 | | | | 47,847 | | |
First Horizon National Corp. | | | 4,409 | | | | 69,089 | | |
First Niagara Financial Group, Inc. | | | 7,153 | | | | 67,524 | | |
Flushing Financial Corp. | | | 1,545 | | | | 32,460 | | |
Fulton Financial Corp. | | | 2,558 | | | | 33,407 | | |
Great Southern Bancorp, Inc. | | | 403 | | | | 16,982 | | |
Hanmi Financial Corp. | | | 1,522 | | | | 37,806 | | |
Heartland Financial USA, Inc. | | | 473 | | | | 17,605 | | |
Heritage Financial Corp. | | | 968 | | | | 17,298 | | |
HomeTrust Bancshares, Inc. (a) | | | 1,972 | | | | 33,051 | | |
International Bancshares Corp. | | | 2,498 | | | | 67,121 | | |
LCNB Corp. | | | 2,096 | | | | 33,966 | | |
Merchants Bancshares, Inc. | | | 1,122 | | | | 37,105 | | |
Northrim BanCorp, Inc. | | | 2,673 | | | | 68,509 | | |
Old Second Bancorp, Inc. (a) | | | 2,892 | | | | 19,087 | | |
Orrstown Financial Services, Inc. | | | 3,688 | | | | 59,672 | | |
Pacific Continental Corp. | | | 2,403 | | | | 32,513 | | |
Peapack Gladstone Financial Corp. | | | 2,943 | | | | 65,393 | | |
Peoples Bancorp, Inc. | | | 685 | | | | 15,988 | | |
| | Shares
Held | | Value | |
Popular, Inc. (a) | | | 1,860 | | | $ | 53,680 | | |
Premier Financial Bancorp, Inc. | | | 3,144 | | | | 48,575 | | |
QCR Holdings, Inc. | | | 894 | | | | 19,453 | | |
Republic Bancorp, Inc. | | | 2,601 | | | | 66,846 | | |
Sandy Spring Bancorp, Inc. | | | 1,197 | | | | 33,492 | | |
Shore Bancshares, Inc. (a) | | | 6,783 | | | | 63,964 | | |
Sierra Bancorp | | | 2,892 | | | | 50,061 | | |
Suffolk Bancorp | | | 2,701 | | | | 69,308 | | |
TowneBank | | | 2,913 | | | | 47,453 | | |
TriCo Bancshares | | | 1,969 | | | | 47,354 | | |
Trustmark Corp. | | | 1,962 | | | | 49,011 | | |
Valley National Bancorp | | | 3,335 | | | | 34,384 | | |
Webster Financial Corp. | | | 1,305 | | | | 51,613 | | |
Wilshire Bancorp, Inc. | | | 1,575 | | | | 19,892 | | |
| | | | 2,325,254 | | |
Capital Markets — 0.53% | |
Arlington Asset Investment Corp. | | | 624 | | | | 12,205 | | |
Oppenheimer Holdings, Inc. | | | 2,651 | | | | 69,669 | | |
| | | | 81,874 | | |
Consumer Finance — 0.27% | |
The JG Wentworth Company (a) | | | 4,514 | | | | 41,529 | | |
Diversified Financial Services — 0.33% | |
PHH Corp. (a) | | | 1,960 | | | | 51,019 | | |
Insurance — 4.93% | |
Ambac Financial Group, Inc. (a) | | | 1,819 | | | | 30,268 | | |
CNO Financial Group, Inc. | | | 3,660 | | | | 67,160 | | |
Crawford & Company | | | 4,172 | | | | 31,749 | | |
Employers Holdings, Inc. | | | 2,747 | | | | 62,577 | | |
Hallmark Financial Services, Inc. (a) | | | 3,070 | | | | 34,937 | | |
The Hanover Insurance Group, Inc. | | | 656 | | | | 48,564 | | |
Horace Mann Educators Corp. | | | 1,868 | | | | 67,957 | | |
Kansas City Life Insurance Company | | | 346 | | | | 15,816 | | |
Kemper Corp. | | | 1,199 | | | | 46,221 | | |
MBIA, Inc. (a) | | | 1,690 | | | | 10,157 | | |
Meadowbrook Insurance Group, Inc. | | | 7,443 | | | | 64,009 | | |
National Western Life Insurance Company | | | 252 | | | | 60,351 | | |
The Navigators Group, Inc. (a) | | | 202 | | | | 15,667 | | |
The Phoenix Companies, Inc. (a) | | | 944 | | | | 17,219 | | |
Selective Insurance Group, Inc. | | | 1,059 | | | | 29,705 | | |
StanCorp Financial Group, Inc. | | | 232 | | | | 17,542 | | |
State Auto Financial Corp. | | | 2,005 | | | | 48,020 | | |
Stewart Information Services Corp. | | | 1,146 | | | | 45,611 | | |
Symetra Financial Corp. | | | 2,046 | | | | 49,452 | | |
| | | | 762,982 | | |
The accompanying notes are an integral part of these financial statements.
29
Schedule of Investments — June 30, 2015
Hotchkis & Wiley Small Cap Diversified Value Fund
| | Shares
Held | | Value | |
Real Estate Investment Trusts — 1.96% | |
Arbor Realty Trust, Inc. | | | 4,532 | | | $ | 30,636 | | |
Ares Commercial Real Estate Corp. | | | 2,749 | | | | 31,311 | | |
| BRT Realty Trust (a) | | | 4,440 | | | | 31,213 | | |
Cherry Hill Mortgage Investment Corp. | | | 1,725 | | | | 27,980 | | |
Five Oaks Investment Corp. | | | 4,458 | | | | 37,224 | | |
The GEO Group, Inc. | | | 1,623 | | | | 55,442 | | |
Parkway Properties, Inc. | | | 3,527 | | | | 61,512 | | |
Resource Capital Corp. | | | 3,335 | | | | 12,906 | | |
ZAIS Financial Corp. | | | 872 | | | | 14,100 | | |
| | | | 302,324 | | |
Thrifts & Mortgage Finance — 5.94% | |
Astoria Financial Corp. | | | 3,694 | | | | 50,940 | | |
Brookline Bancorp, Inc. | | | 3,190 | | | | 36,015 | | |
Cape Bancorp, Inc. | | | 3,289 | | | | 31,114 | | |
Charter Financial Corp. | | | 1,314 | | | | 16,307 | | |
Clifton Bancorp, Inc. | | | 1,139 | | | | 15,935 | | |
Dime Community Bancshares, Inc. | | | 2,952 | | | | 50,007 | | |
ESSA Bancorp, Inc. | | | 3,711 | | | | 47,723 | | |
Flagstar Bancorp, Inc. (a) | | | 2,475 | | | | 45,738 | | |
Hingham Institution for Savings | | | 409 | | | | 47,080 | | |
Home Bancorp, Inc. | | | 2,231 | | | | 56,310 | | |
HomeStreet, Inc. (a) | | | 3,032 | | | | 69,190 | | |
Lake Sunapee Bank Group | | | 1,047 | | | | 15,108 | | |
Meta Financial Group, Inc. | | | 815 | | | | 34,980 | | |
OceanFirst Financial Corp. | | | 2,762 | | | | 51,511 | | |
Oritani Financial Corp. | | | 2,195 | | | | 35,230 | | |
Provident Financial Holdings, Inc. | | | 3,953 | | | | 66,173 | | |
Prudential Bancorp, Inc. | | | 1,264 | | | | 18,328 | | |
Territorial Bancorp, Inc. | | | 2,780 | | | | 67,443 | | |
TrustCo Bank Corp. | | | 4,624 | | | | 32,507 | | |
Washington Federal, Inc. | | | 2,898 | | | | 67,668 | | |
Waterstone Financial, Inc. | | | 1,222 | | | | 16,130 | | |
Westfield Financial, Inc. | | | 6,554 | | | | 47,910 | | |
| | | | 919,347 | | |
TOTAL FINANCIALS | | | 4,484,329 | | |
HEALTH CARE — 2.81%
Biotechnology — 0.09% | |
Myriad Genetics, Inc. (a) | | | 432 | | | | 14,684 | | |
Health Care Equipment & Supplies — 0.43% | |
Halyard Health, Inc. (a) | | | 332 | | | | 13,446 | | |
Meridian Bioscience, Inc. | | | 1,627 | | | | 30,327 | | |
PhotoMedex, Inc. (a) | | | 17,067 | | | | 23,211 | | |
| | | | 66,984 | | |
| | Shares
Held | | Value | |
Health Care Providers & Services — 2.29% | |
Almost Family, Inc. (a) | | | 816 | | | $ | 32,567 | | |
The Ensign Group, Inc. | | | 338 | | | | 17,258 | | |
Hanger, Inc. (a) | | | 1,195 | | | | 28,011 | | |
IPC Healthcare, Inc. (a) | | | 682 | | | | 37,776 | | |
LHC Group, Inc. (a) | | | 976 | | | | 37,332 | | |
LifePoint Health, Inc. (a) | | | 412 | | | | 35,823 | | |
Molina Healthcare, Inc. (a) | | | 483 | | | | 33,955 | | |
National HealthCare Corp. | | | 485 | | | | 31,520 | | |
Select Medical Holdings Corp. | | | 2,078 | | | | 33,664 | | |
WellCare Health Plans, Inc. (a) | | | 773 | | | | 65,573 | | |
| | | | 353,479 | | |
TOTAL HEALTH CARE | | | 435,147 | | |
INDUSTRIALS — 15.97%
Aerospace & Defense — 0.94% | |
Engility Holdings, Inc. | | | 922 | | | | 23,198 | | |
Erickson, Inc. (a) | | | 3,739 | | | | 16,227 | | |
LMI Aerospace, Inc. (a) | | | 2,577 | | | | 25,796 | | |
National Presto Industries, Inc. | | | 1,002 | | | | 80,480 | | |
| | | | 145,701 | | |
Air Freight & Logistics — 0.39% | |
Forward Air Corp. | | | 279 | | | | 14,581 | | |
Hub Group, Inc. (a) | | | 776 | | | | 31,303 | | |
Park-Ohio Holdings Corp. | | | 302 | | | | 14,635 | | |
| | | | 60,519 | | |
Building Products — 0.21% | |
American Woodmark Corp. (a) | | | 303 | | | | 16,620 | | |
Universal Forest Products, Inc. | | | 300 | | | | 15,609 | | |
| | | | 32,229 | | |
Commercial Services & Supplies — 2.73% | |
The Brink's Company | | | 1,137 | | | | 33,462 | | |
Deluxe Corp. | | | 467 | | | | 28,954 | | |
Ennis, Inc. | | | 2,775 | | | | 51,587 | | |
Essendant, Inc. | | | 784 | | | | 30,772 | | |
Knoll, Inc. | | | 1,405 | | | | 35,167 | | |
Matthews International Corp. | | | 616 | | | | 32,734 | | |
NL Industries, Inc. (a) | | | 8,432 | | | | 62,481 | | |
Performant Financial Corp. (a) | | | 20,462 | | | | 66,297 | | |
RR Donnelley & Sons Company | | | 2,051 | | | | 35,749 | | |
Steelcase, Inc. | | | 790 | | | | 14,939 | | |
Team, Inc. (a) | | | 404 | | | | 16,261 | | |
West Corp. | | | 479 | | | | 14,418 | | |
| | | | 422,821 | | |
The accompanying notes are an integral part of these financial statements.
30
Schedule of Investments — June 30, 2015
Hotchkis & Wiley Small Cap Diversified Value Fund
| | Shares
Held | | Value | |
Construction & Engineering — 1.67% | |
Aegion Corp. (a) | | | 2,598 | | | $ | 49,206 | | |
Argan, Inc. | | | 1,401 | | | | 56,502 | | |
Comfort Systems USA, Inc. | | | 797 | | | | 18,291 | | |
KBR, Inc. | | | 3,286 | | | | 64,011 | | |
Primoris Services Corp. | | | 3,512 | | | | 69,538 | | |
| | | | 257,548 | | |
Electrical Equipment — 0.34% | |
Preformed Line Products Company | | | 1,391 | | | | 52,469 | | |
Machinery — 6.01% | |
Alamo Group, Inc. | | | 777 | | | | 42,455 | | |
Altra Industrial Motion Corp. | | | 586 | | | | 15,927 | | |
Columbus McKinnon Corp. | | | 2,780 | | | | 69,500 | | |
Commercial Vehicle Group, Inc. (a) | | | 7,213 | | | | 52,006 | | |
The Eastern Company | | | 3,206 | | | | 59,375 | | |
Global Brass & Copper Holdings, Inc. | | | 2,995 | | | | 50,945 | | |
Hardinge, Inc. | | | 5,609 | | | | 55,249 | | |
Hillenbrand, Inc. | | | 518 | | | | 15,903 | | |
Hurco Companies, Inc. | | | 1,938 | | | | 67,094 | | |
Hyster-Yale Materials Handling, Inc. | | | 652 | | | | 45,171 | | |
Kadant, Inc. | | | 624 | | | | 29,453 | | |
LB Foster Company | | | 683 | | | | 23,639 | | |
Manitex International, Inc. (a) | | | 8,013 | | | | 61,219 | | |
Meritor, Inc. (a) | | | 4,335 | | | | 56,875 | | |
Miller Industries, Inc. | | | 3,051 | | | | 60,867 | | |
Mueller Industries, Inc. | | | 887 | | | | 30,797 | | |
Supreme Industries, Inc. | | | 3,963 | | | | 33,963 | | |
Titan International, Inc. | | | 3,439 | | | | 36,935 | | |
TriMas Corp. (a) | | | 1,073 | | | | 31,761 | | |
Twin Disc, Inc. | | | 1,732 | | | | 32,284 | | |
Wabash National Corp. (a) | | | 4,575 | | | | 57,371 | | |
| | | | 928,789 | | |
Marine — 0.21% | |
Matson, Inc. | | | 759 | | | | 31,908 | | |
Professional Services — 2.83% | |
Barrett Business Services, Inc. | | | 1,720 | | | | 62,470 | | |
CDI Corp. | | | 1,138 | | | | 14,794 | | |
FTI Consulting, Inc. (a) | | | 422 | | | | 17,403 | | |
Heidrick & Struggles International, Inc. | | | 2,581 | | | | 67,313 | | |
Insperity, Inc. | | | 926 | | | | 47,133 | | |
Kelly Services, Inc. | | | 1,795 | | | | 27,553 | | |
Korn/Ferry International | | | 977 | | | | 33,970 | | |
Navigant Consulting, Inc. (a) | | | 3,470 | | | | 51,599 | | |
Resources Connection, Inc. | | | 2,708 | | | | 43,572 | | |
RPX Corp. (a) | | | 4,278 | | | | 72,299 | | |
| | | | 438,106 | | |
| | Shares
Held | | Value | |
Road & Rail — 0.34% | |
Con-way, Inc. | | | 1,390 | | | $ | 53,334 | | |
Transportation Infrastructure — 0.30% | |
Wesco Aircraft Holdings, Inc. (a) | | | 3,035 | | | | 45,980 | | |
TOTAL INDUSTRIALS | | | 2,469,404 | | |
INFORMATION TECHNOLOGY — 15.33%
Communications Equipment — 1.66% | |
Black Box Corp. | | | 2,937 | | | | 58,740 | | |
Comtech Telecommunications Corp. | | | 1,089 | | | | 31,635 | | |
Digi International, Inc. (a) | | | 6,116 | | | | 58,408 | | |
NETGEAR, Inc. (a) | | | 1,945 | | | | 58,389 | | |
Plantronics, Inc. | | | 577 | | | | 32,491 | | |
Ubiquiti Networks, Inc. | | | 511 | | | | 16,309 | | |
| | | | 255,972 | | |
Electronic Equipment, Instruments & Components — 4.07% | |
Anixter International, Inc. (a) | | | 409 | | | | 26,646 | | |
AVX Corp. | | | 2,134 | | | | 28,724 | | |
Benchmark Electronics, Inc. (a) | | | 2,550 | | | | 55,539 | | |
Electro Rent Corp. | | | 6,170 | | | | 67,007 | | |
II-VI, Inc. (a) | | | 2,599 | | | | 49,329 | | |
Insight Enterprises, Inc. (a) | | | 2,228 | | | | 66,639 | | |
MTS Systems Corp. | | | 207 | | | | 14,273 | | |
PC Connection, Inc. | | | 1,215 | | | | 30,059 | | |
Plexus Corp. (a) | | | 748 | | | | 32,822 | | |
Rofin-Sinar Technologies, Inc. (a) | | | 1,301 | | | | 35,908 | | |
ScanSource, Inc. (a) | | | 1,186 | | | | 45,139 | | |
SYNNEX Corp. | | | 200 | | | | 14,638 | | |
Tech Data Corp. (a) | | | 806 | | | | 46,393 | | |
TTM Technologies, Inc. (a) | | | 1,669 | | | | 16,673 | | |
Vishay Intertechnology, Inc. | | | 4,584 | | | | 53,541 | | |
Vishay Precision Group, Inc. (a) | | | 3,098 | | | | 46,656 | | |
| | | | 629,986 | | |
Internet Software & Services — 1.47% | |
Blucora, Inc. (a) | | | 3,915 | | | | 63,227 | | |
DHI Group, Inc. (a) | | | 5,267 | | | | 46,824 | | |
j2 Global, Inc. | | | 227 | | | | 15,422 | | |
Liquidity Services, Inc. (a) | | | 6,393 | | | | 61,565 | | |
RetailMeNot, Inc. (a) | | | 869 | | | | 15,494 | | |
Travelzoo, Inc. (a) | | | 2,265 | | | | 25,549 | | |
| | | | 228,081 | | |
The accompanying notes are an integral part of these financial statements.
31
Schedule of Investments — June 30, 2015
Hotchkis & Wiley Small Cap Diversified Value Fund
| | Shares
Held | | Value | |
IT Services — 3.18% | |
Booz Allen Hamilton Holding Corp. | | | 557 | | | $ | 14,059 | | |
CACI International, Inc. (a) | | | 356 | | | | 28,797 | | |
Computer Task Group, Inc. | | | 8,432 | | | | 65,095 | | |
CSG Systems International, Inc. | | | 2,077 | | | | 65,758 | | |
Datalink Corp. (a) | | | 5,077 | | | | 45,388 | | |
Global Cash Access Holdings, Inc. (a) | | | 8,331 | | | | 64,482 | | |
Higher One Holdings, Inc. (a) | | | 24,096 | | | | 72,047 | | |
ManTech International Corp. | | | 459 | | | | 13,311 | | |
MoneyGram International, Inc. (a) | | | 7,110 | | | | 65,341 | | |
Science Applications International Corp. | | | 286 | | | | 15,115 | | |
Sykes Enterprises, Inc. (a) | | | 649 | | | | 15,738 | | |
Unisys Corp. (a) | | | 1,310 | | | | 26,187 | | |
| | | | 491,318 | | |
Semiconductors & Semiconductor Equipment — 2.12% | |
Audience, Inc. (a) | | | 8,378 | | | | 40,968 | | |
Cirrus Logic, Inc. (a) | | | 1,646 | | | | 56,013 | | |
OmniVision Technologies, Inc. (a) | | | 1,801 | | | | 47,177 | | |
Photronics, Inc. (a) | | | 6,115 | | | | 58,154 | | |
Synaptics, Inc. (a) | | | 621 | | | | 53,862 | | |
Ultra Clean Holdings, Inc. (a) | | | 2,029 | | | | 12,641 | | |
Xcerra Corp. (a) | | | 7,896 | | | | 59,773 | | |
| | | | 328,588 | | |
Software — 1.61% | |
Comverse, Inc. (a) | | | 2,605 | | | | 52,308 | | |
Ebix, Inc. | | | 1,746 | | | | 56,938 | | |
ePlus, Inc. (a) | | | 713 | | | | 54,651 | | |
Mentor Graphics Corp. | | | 652 | | | | 17,232 | | |
Take-Two Interactive Software, Inc. (a) | | | 2,441 | | | | 67,299 | | |
| | | | 248,428 | | |
Technology Hardware, Storage & Peripherals — 1.22% | |
Cray, Inc. (a) | | | 1,036 | | | | 30,572 | | |
Lexmark International, Inc. | | | 1,143 | | | | 50,521 | | |
QLogic Corp. (a) | | | 4,239 | | | | 60,152 | | |
Super Micro Computer, Inc. (a) | | | 1,592 | | | | 47,091 | | |
| | | | 188,336 | | |
TOTAL INFORMATION TECHNOLOGY | | | 2,370,709 | | |
| | Shares
Held | | Value | |
MATERIALS — 7.09%
Chemicals — 4.75% | |
American Vanguard Corp. | | | 4,551 | | | $ | 62,804 | | |
Axiall Corp. | | | 1,657 | | | | 59,735 | | |
Chase Corp. | | | 1,485 | | | | 59,029 | | |
Core Molding Technologies, Inc. (a) | | | 1,819 | | | | 41,546 | | |
CVR Partners LP | | | 4,781 | | | | 60,384 | | |
FutureFuel Corp. | | | 5,023 | | | | 64,645 | | |
Hawkins, Inc. | | | 409 | | | | 16,520 | | |
Innospec, Inc. | | | 1,413 | | | | 63,642 | | |
Koppers Holdings, Inc. | | | 1,191 | | | | 29,442 | | |
LSB Industries, Inc. (a) | | | 1,508 | | | | 61,587 | | |
OCI Partners LP | | | 2,743 | | | | 46,220 | | |
Olin Corp. | | | 1,688 | | | | 45,492 | | |
OMNOVA Solutions, Inc. (a) | | | 3,735 | | | | 27,975 | | |
Rentech Nitrogen Partners LP | | | 2,082 | | | | 29,752 | | |
Stepan Company | | | 1,228 | | | | 66,446 | | |
| | | | 735,219 | | |
Containers & Packaging — 0.39% | |
UFP Technologies, Inc. (a) | | | 2,885 | | | | 60,354 | | |
Metals & Mining — 1.17% | |
Ampco-Pittsburgh Corp. | | | 3,729 | | | | 56,382 | | |
Handy & Harman Ltd. (a) | | | 381 | | | | 13,202 | | |
Kaiser Aluminum Corp. | | | 831 | | | | 69,039 | | |
Noranda Aluminum Holding Corp. | | | 34,412 | | | | 29,250 | | |
SunCoke Energy Partners LP | | | 725 | | | | 12,398 | | |
| | | | 180,271 | | |
Paper & Forest Products — 0.78% | |
KapStone Paper and Packaging Corp. | | | 481 | | | | 11,121 | | |
Neenah Paper, Inc. | | | 253 | | | | 14,917 | | |
PH Glatfelter Company | | | 1,806 | | | | 39,714 | | |
Schweitzer-Mauduit International, Inc. | | | 1,384 | | | | 55,193 | | |
| | | | 120,945 | | |
TOTAL MATERIALS | | | 1,096,789 | | |
TELECOMMUNICATION SERVICES — 0.22%
Diversified Telecommunication Services — 0.22% | |
IDT Corp. | | | 921 | | | | 16,652 | | |
Inteliquent, Inc. | | | 965 | | | | 17,756 | | |
TOTAL TELECOMMUNICATION SERVICES | | | 34,408 | | |
The accompanying notes are an integral part of these financial statements.
32
Schedule of Investments — June 30, 2015
Hotchkis & Wiley Small Cap Diversified Value Fund
| | Shares
Held | | Value | |
UTILITIES — 4.31%
Electric Utilities — 2.00% | |
ALLETE, Inc. | | | 892 | | | $ | 41,380 | | |
El Paso Electric Company | | | 1,250 | | | | 43,325 | | |
The Empire District Electric Company | | | 1,876 | | | | 40,897 | | |
IDACORP, Inc. | | | 507 | | | | 28,463 | | |
Otter Tail Corp. | | | 490 | | | | 13,034 | | |
PNM Resources, Inc. | | | 2,216 | | | | 54,514 | | |
Portland General Electric Company | | | 1,288 | | | | 42,710 | | |
UIL Holdings Corp. | | | 637 | | | | 29,187 | | |
Unitil Corp. | | | 456 | | | | 15,057 | | |
| | | | 308,567 | | |
Gas Utilities — 1.94% | |
Gas Natural, Inc. | | | 6,478 | | | | 66,723 | | |
The Laclede Group, Inc. | | | 924 | | | | 48,103 | | |
Northwest Natural Gas Company | | | 665 | | | | 28,050 | | |
ONE Gas, Inc. | | | 1,491 | | | | 63,457 | | |
Southwest Gas Corp. | | | 275 | | | | 14,633 | | |
Star Gas Partners LP | | | 7,279 | | | | 64,274 | | |
WGL Holdings, Inc. | | | 286 | | | | 15,527 | | |
| | | | 300,767 | | |
Multi-Utilities — 0.37% | |
Avista Corp. | | | 1,398 | | | | 42,848 | | |
NorthWestern Corp. | | | 290 | | | | 14,138 | | |
| | | | 56,986 | | |
TOTAL UTILITIES | | | 666,320 | | |
Total common stocks
(Cost $15,213,833) | | | | | 15,076,356 | | |
INVESTMENT COMPANIES — 1.37%
Business Development Companies — 1.37% | |
BlackRock Capital Investment Corp. | | | 1,724 | | | | 15,757 | | |
Fifth Street Finance Corp. | | | 2,204 | | | | 14,436 | | |
Gladstone Investment Corp. | | | 4,290 | | | | 34,106 | | |
MVC Capital, Inc. | | | 6,634 | | | | 67,667 | | |
OFS Capital Corp. | | | 2,632 | | | | 31,584 | | |
WhiteHorse Finance, Inc. | | | 3,755 | | | | 47,538 | | |
Total investment companies
(Cost $208,933) | | | | | 211,088 | | |
Total long-term investments
(Cost $15,422,766) | | | | | 15,287,444 | | |
SHORT-TERM
INVESTMENTS — 1.10% | | Principal
Amount | | Value | |
Time Deposits — 1.10% | |
Nordea Bank AB, 0.03%, 07/01/2015* | | $ | 170,550 | | | $ | 170,550 | | |
Total short-term investments
(Cost $170,550) | | | 170,550 | | |
Total investments — 99.94%
(Cost $15,593,316) | | | 15,457,994 | | |
Other assets in excess of liabilities — 0.06% | | | | | 9,080 | | |
Net assets — 100.00% | | $ | 15,467,074 | | |
(a) — Non-income producing security.
* — Invested through a cash management account administered by Brown Brothers Harriman & Co.
The Global Industry Classification Standard (GICS®) was developed by MSCI, an independent provider of global indices and benchmark-related products and services, and Standard & Poor's (S&P), an independent international financial data and investment services company. The GICS methodology has been widely accepted as an industry analysis framework for investment research, portfolio management and asset allocation. The GICS structure consists of 10 sectors, 24 industry groups, 67 industries and 156 sub-industries. Each stock that is classified will have a coding at all four of these levels.
The accompanying notes are an integral part of these financial statements.
33
Schedule of Investments — June 30, 2015
Hotchkis & Wiley Global Value Fund
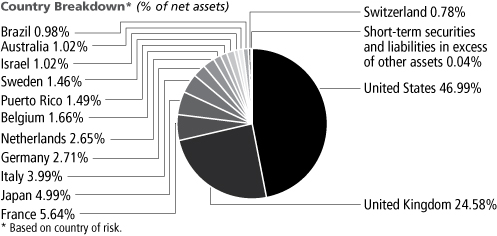
Largest Equity Holdings | | Percent of
net assets | |
American International Group, Inc. | | | 4.88 | % | |
Danieli & C Officine Meccaniche SpA | | | 3.99 | % | |
Bank of America Corp. | | | 3.81 | % | |
Royal Mail PLC | | | 3.43 | % | |
BAE Systems PLC | | | 3.12 | % | |
Citigroup, Inc. | | | 3.12 | % | |
GlaxoSmithKline PLC | | | 2.79 | % | |
Corning, Inc. | | | 2.64 | % | |
Con-way, Inc. | | | 2.55 | % | |
JPMorgan Chase & Company | | | 2.55 | % | |
COMMON
STOCKS — 99.96% | | Shares
Held | | Value | |
CONSUMER DISCRETIONARY — 8.05%
Auto Components — 0.52% | |
Cie Generale des Etablissements Michelin (f) | | | 306 | | | $ | 32,198 | | |
Automobiles — 4.97% | |
Bayerische Motoren Werke AG (f) | | | 1,193 | | | | 101,015 | | |
General Motors Company | | | 2,219 | | | | 73,959 | | |
Honda Motor Company Ltd. (f) | | | 4,200 | | | | 135,744 | | |
| | | | 310,718 | | |
Distributors — 1.06% | |
D'ieteren SA | | | 1,858 | | | | 66,492 | | |
Specialty Retail — 1.50% | |
Bed Bath & Beyond, Inc. (a) | | | 467 | | | | 32,214 | | |
Kingfisher PLC (f) | | | 11,280 | | | | 61,526 | | |
| | | | 93,740 | | |
TOTAL CONSUMER DISCRETIONARY | | | 503,148 | | |
CONSUMER STAPLES — 3.63%
Beverages — 0.50% | |
Stock Spirits Group PLC (f) | | | 10,383 | | | | 31,406 | | |
Food & Staples Retailing — 3.13% | |
Tesco PLC (f) | | | 39,919 | | | | 133,000 | | |
Wal-Mart Stores, Inc. | | | 884 | | | | 62,702 | | |
| | | | 195,702 | | |
TOTAL CONSUMER STAPLES | | | 227,108 | | |
ENERGY — 7.97%
Energy Equipment & Services — 1.02% | |
WorleyParsons Ltd. (f) | | | 7,924 | | | | 63,620 | | |
| | Shares
Held | | Value | |
Oil, Gas & Consumable Fuels — 6.95% | |
Cairn Energy PLC (a) (f) | | | 25,672 | | | $ | 68,375 | | |
Cobalt International Energy, Inc. (a) | | | 5,923 | | | | 57,512 | | |
Kosmos Energy Ltd. (a) | | | 3,642 | | | | 30,702 | | |
| MPI (f) | | | 10,147 | | | | 31,570 | | |
Ophir Energy PLC (a) (f) | | | 78,008 | | | | 138,914 | | |
Rockhopper Exploration PLC (a) (f) | | | 102,885 | | | | 107,759 | | |
| | | | 434,832 | | |
TOTAL ENERGY | | | 498,452 | | |
FINANCIALS — 28.71%
Banks — 16.35% | |
Bank of America Corp. | | | 14,001 | | | | 238,297 | | |
Barclays PLC (f) | | | 24,287 | | | | 99,543 | | |
Citigroup, Inc. | | | 3,535 | | | | 195,273 | | |
Citizens Financial Group, Inc. | | | 5,193 | | | | 141,821 | | |
JPMorgan Chase & Company | | | 2,350 | | | | 159,236 | | |
Popular, Inc. (a) | | | 3,230 | | | | 93,218 | | |
Societe Generale SA (f) | | | 2,027 | | | | 95,115 | | |
| | | | 1,022,503 | | |
Capital Markets — 0.78% | |
Credit Suisse Group AG (f) | | | 1,770 | | | | 48,830 | | |
Insurance — 11.58% | |
American International Group, Inc. | | | 4,933 | | | | 304,958 | | |
The Chubb Corp. | | | 659 | | | | 62,697 | | |
RSA Insurance Group PLC (f) | | | 24,655 | | | | 153,743 | | |
White Mountains Insurance Group Ltd. | | | 68 | | | | 44,536 | | |
Willis Group Holdings PLC | | | 3,366 | | | | 157,865 | | |
| | | | 723,799 | | |
TOTAL FINANCIALS | | | 1,795,132 | | |
The accompanying notes are an integral part of these financial statements.
34
Schedule of Investments — June 30, 2015
Hotchkis & Wiley Global Value Fund
| | Shares
Held | | Value | |
HEALTH CARE — 9.87%
Health Care Equipment & Supplies — 1.75% | |
Medtronic PLC | | | 1,473 | | | $ | 109,150 | | |
Health Care Providers & Services — 1.19% | |
Anthem, Inc. | | | 202 | | | | 33,156 | | |
Humana, Inc. | | | 217 | | | | 41,508 | | |
| | | | 74,664 | | |
Pharmaceuticals — 6.93% | |
GlaxoSmithKline PLC — ADR | | | 4,185 | | | | 174,305 | | |
KYORIN Holdings, Inc. (f) | | | 3,200 | | | | 65,243 | | |
Sanofi (f) | | | 1,316 | | | | 130,192 | | |
Taro Pharmaceutical Industries Ltd. (a) | | | 444 | | | | 63,798 | | |
| | | | 433,538 | | |
TOTAL HEALTH CARE | | | 617,352 | | |
INDUSTRIALS — 23.13%
Aerospace & Defense — 4.10% | |
BAE Systems PLC (f) | | | 27,570 | | | | 195,344 | | |
Embraer SA — ADR | | | 2,020 | | | | 61,186 | | |
| | | | 256,530 | | |
Air Freight & Logistics — 3.43% | |
Royal Mail PLC (f) | | | 26,500 | | | | 214,238 | | |
Building Products — 1.57% | |
Masonite International Corp. (a) | | | 1,405 | | | | 98,505 | | |
Construction & Engineering — 1.02% | |
Bouygues SA | | | 1,701 | | | | 63,594 | | |
Industrial Conglomerates — 0.99% | |
Koninklijke Philips NV (f) | | | 2,438 | | | | 62,224 | | |
Machinery — 9.47% | |
| CNH Industrial NV | | | 11,159 | | | | 103,555 | | |
Cummins, Inc. | | | 827 | | | | 108,494 | | |
Danieli & C Officine Meccaniche SpA | | | 16,470 | | | | 249,718 | | |
KSB AG (f) | | | 147 | | | | 68,525 | | |
Navistar International Corp. (a) | | | 2,739 | | | | 61,984 | | |
| | | | 592,276 | | |
Road & Rail — 2.55% | |
Con-way, Inc. | | | 4,152 | | | | 159,312 | | |
TOTAL INDUSTRIALS | | | 1,446,679 | | |
INFORMATION TECHNOLOGY — 11.72%
Communications Equipment — 1.46% | |
Telefonaktiebolaget LM Ericsson — ADR | | | 8,744 | | | | 91,288 | | |
Electronic Equipment, Instruments & Components — 4.42% | |
Corning, Inc. | | | 8,380 | | | | 165,337 | | |
Nippon Electric Glass Company Ltd. (f) | | | 22,000 | | | | 111,254 | | |
| | | | 276,591 | | |
| | Shares
Held | | Value | |
Software — 4.40% | |
Microsoft Corp. | | | 3,114 | | | $ | 137,483 | | |
Oracle Corp. | | | 3,410 | | | | 137,423 | | |
| | | | 274,906 | | |
Technology Hardware, Storage & Peripherals — 1.44% | |
Hewlett-Packard Company | | | 3,011 | | | | 90,360 | | |
TOTAL INFORMATION TECHNOLOGY | | | 733,145 | | |
TELECOMMUNICATION SERVICES — 3.13%
Wireless Telecommunication Services — 3.13% | |
Mobistar SA (a) | | | 1,952 | | | | 36,952 | | |
Vodafone Group PLC — ADR | | | 4,363 | | | | 159,031 | | |
TOTAL TELECOMMUNICATION SERVICES | | | 195,983 | | |
UTILITIES — 3.75%
Independent Power and Renewable Electricity
Producers — 2.76% | |
Calpine Corp. (a) | | | 6,779 | | | | 121,954 | | |
NRG Energy, Inc. | | | 2,205 | | | | 50,450 | | |
| | | | 172,404 | | |
Multi-Utilities — 0.99% | |
Public Service Enterprise Group, Inc. | | | 1,578 | | | | 61,984 | | |
TOTAL UTILITIES | | | 234,388 | | |
Total common stocks
(Cost $6,187,057) | | | 6,251,387 | | |
Total long-term investments
(Cost $6,187,057) | | | | | 6,251,387 | | |
SHORT-TERM
INVESTMENTS — 0.45% | | Principal
Amount | | | |
Time Deposits — 0.45% | |
BNP Paribas, 0.03%, 07/01/2015* | | $ | 28,446 | | | | 28,446 | | |
Total short-term investments
(Cost $28,446) | | | 28,446 | | |
Total investments — 100.41%
(Cost $6,215,503) | | | | | 6,279,833 | | |
Liabilities in excess of other assets — (0.41)% | | | | | (25,911 | ) | |
Net assets — 100.00% | | $ | 6,253,922 | | |
(a) — Non-income producing security.
(f) — Security was fair valued as a result of market movements following the close of local trading using a third-party vendor's proprietary fair value pricing model. The total market value of these securities was $2,149,378, which represented 34.37% of net assets. See Security Valuation in Note 1 in Notes to the Financial Statements.
ADR — American Depositary Receipt
* — Invested through a cash management account administered by Brown Brothers Harriman & Co.
The accompanying notes are an integral part of these financial statements.
35
Schedule of Investments — June 30, 2015
Hotchkis & Wiley Global Value Fund
The Global Industry Classification Standard (GICS®) was developed by MSCI, an independent provider of global indices and benchmark-related products and services, and Standard & Poor's (S&P), an independent international financial data and investment services company. The GICS methodology has been widely accepted as an industry analysis framework for investment research, portfolio management and asset allocation. The GICS structure consists of 10 sectors, 24 industry groups, 67 industries and 156 sub-industries. Each stock that is classified will have a coding at all four of these levels.
The accompanying notes are an integral part of these financial statements.
36
Schedule of Investments — June 30, 2015
Hotchkis & Wiley Value Opportunities Fund
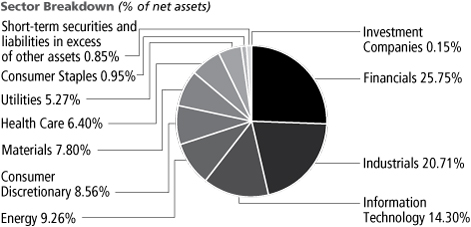
Largest Equity Holdings | | Percent of
net assets | |
American International Group, Inc. | | | 5.47 | % | |
Bank of America Corp. | | | 5.28 | % | |
JPMorgan Chase & Company | | | 5.20 | % | |
Citigroup, Inc. | | | 4.93 | % | |
Danieli & C Officine Meccaniche SpA | | | 4.23 | % | |
Con-way, Inc. | | | 4.17 | % | |
Royal Mail PLC | | | 3.80 | % | |
Oracle Corp. | | | 3.57 | % | |
Microsoft Corp. | | | 3.57 | % | |
Corning, Inc. | | | 3.53 | % | |
COMMON
STOCKS — 89.77% | | Shares
Held | | Value | |
CONSUMER DISCRETIONARY — 8.35%
Automobiles — 2.38% | |
Motors Liquidation Company GUC Trust | | | 793,100 | | | $ | 15,267,175 | | |
Hotels, Restaurants & Leisure — 1.79% | |
Intrawest Resorts Holdings, Inc. (a) | | | 952,000 | | | | 11,062,240 | | |
Lakes Entertainment, Inc. (a) | | | 49,900 | | | | 453,092 | | |
| | | | 11,515,332 | | |
Household Durables — 2.75% | |
TRI Pointe Homes, Inc. (a) | | | 1,153,500 | | | | 17,648,550 | | |
Media — 1.43% | |
Comcast Corp. | | | 152,100 | | | | 9,147,294 | | |
TOTAL CONSUMER DISCRETIONARY | | | 53,578,351 | | |
CONSUMER STAPLES — 0.95%
Food & Staples Retailing — 0.95% | |
Wal-Mart Stores, Inc. | | | 86,000 | | | | 6,099,980 | | |
TOTAL CONSUMER STAPLES | | | 6,099,980 | | |
ENERGY — 8.57%
Energy Equipment & Services — 5.23% | |
Dresser-Rand Group, Inc. (a) (d) | | | 263,500 | | | | 22,444,930 | | |
WorleyParsons Ltd. (f) | | | 1,380,600 | | | | 11,084,553 | | |
| | | | 33,529,483 | | |
Oil, Gas & Consumable Fuels — 3.34% | |
Cairn Energy PLC (a) (d) (f) | | | 1,251,600 | | | | 3,333,499 | | |
Cobalt International Energy, Inc. (a) | | | 963,300 | | | | 9,353,643 | | |
Ophir Energy PLC (a) (d) (f) | | | 3,788,500 | | | | 6,746,416 | | |
Rockhopper Exploration PLC (a) (d) (f) | | | 1,919,100 | | | | 2,010,010 | | |
| | | | 21,443,568 | | |
TOTAL ENERGY | | | 54,973,051 | | |
| | Shares
Held | | Value | |
FINANCIALS — 24.04%
Banks — 15.41% | |
Bank of America Corp. (d) | | | 1,989,300 | | | $ | 33,857,886 | | |
Citigroup, Inc. (d) | | | 572,900 | | | | 31,646,996 | | |
JPMorgan Chase & Company (d) | | | 492,200 | | | | 33,351,472 | | |
| | | | 98,856,354 | | |
Insurance — 8.63% | |
American International Group, Inc. (d) | | | 567,900 | | | | 35,107,578 | | |
Global Indemnity PLC (a) | | | 104,800 | | | | 2,942,784 | | |
RSA Insurance Group PLC (d) (f) | | | 2,772,900 | | | | 17,291,130 | | |
| | | | 55,341,492 | | |
TOTAL FINANCIALS | | | 154,197,846 | | |
HEALTH CARE — 6.40%
Health Care Equipment & Supplies — 0.71% | |
Medtronic PLC | | | 61,574 | | | | 4,562,633 | | |
Health Care Providers & Services — 2.93% | |
Express Scripts Holding Company (a) | | | 36,800 | | | | 3,272,992 | | |
Hanger, Inc. (a) | | | 663,600 | | | | 15,554,784 | | |
| | | | 18,827,776 | | |
Pharmaceuticals — 2.76% | |
GlaxoSmithKline PLC — ADR | | | 181,700 | | | | 7,567,805 | | |
Sanofi — ADR | | | 204,400 | | | | 10,123,932 | | |
| | | | 17,691,737 | | |
TOTAL HEALTH CARE | | | 41,082,146 | | |
INDUSTRIALS — 18.47%
Air Freight & Logistics — 3.80% | |
Royal Mail PLC (d) (f) | | | 3,014,800 | | | | 24,373,041 | | |
Construction & Engineering — 0.75% | |
Bouygues SA | | | 128,100 | | | | 4,789,219 | | |
The accompanying notes are an integral part of these financial statements.
37
Schedule of Investments — June 30, 2015
Hotchkis & Wiley Value Opportunities Fund
| | Shares
Held | | Value | |
Machinery — 6.89% | |
Danieli & C Officine Meccaniche SpA (d) | | | 1,791,700 | | | $ | 27,165,734 | | |
KSB AG (d) (f) | | | 23,446 | | | | 10,929,457 | | |
Navistar International Corp. (a) (c) | | | 268,300 | | | | 6,071,629 | | |
| | | | 44,166,820 | | |
Professional Services — 0.17% | |
Hudson Global, Inc. (a) | | | 481,700 | | | | 1,103,093 | | |
Road & Rail — 4.17% | |
Con-way, Inc. (d) | | | 697,600 | | | | 26,766,912 | | |
Trading Companies & Distributors — 2.69% | |
Rush Enterprises, Inc. (a) | | | 658,900 | | | | 17,269,769 | | |
TOTAL INDUSTRIALS | | | 118,468,854 | | |
INFORMATION TECHNOLOGY — 14.30%
Electronic Equipment, Instruments & Components — 5.63% | |
Corning, Inc. | | | 1,147,600 | | | | 22,642,148 | | |
Nippon Electric Glass Company Ltd. (d) (f) | | | 2,659,300 | | | | 13,448,049 | | |
| | | | 36,090,197 | | |
IT Services — 0.93% | |
International Business Machines Corp. | | | 36,800 | | | | 5,985,888 | | |
Software — 7.14% | |
Microsoft Corp. | | | 519,000 | | | | 22,913,850 | | |
Oracle Corp. (d) | | | 568,600 | | | | 22,914,580 | | |
| | | | 45,828,430 | | |
Technology Hardware, Storage & Peripherals — 0.60% | |
Hewlett-Packard Company | | | 128,100 | | | | 3,844,281 | | |
TOTAL INFORMATION TECHNOLOGY | | | 91,748,796 | | |
MATERIALS — 3.42%
Metals & Mining — 2.15% | |
Horsehead Holding Corp. (a) (c) | | | 618,200 | | | | 7,245,304 | | |
Noranda Aluminum Holding Corp. | | | 2,500,400 | | | | 2,125,340 | | |
Real Industry, Inc. (a) | | | 389,782 | | | | 4,424,026 | | |
| | | | 13,794,670 | | |
Paper & Forest Products — 1.27% | |
Louisiana-Pacific Corp. (a) | | | 476,900 | | | | 8,121,607 | | |
TOTAL MATERIALS | | | 21,916,277 | | |
UTILITIES — 5.27%
Electric Utilities — 3.03% | |
Great Plains Energy, Inc. | | | 804,300 | | | | 19,431,888 | | |
Independent Power and Renewable Electricity
Producers — 2.24% | |
Calpine Corp. (a) | | | 797,500 | | | | 14,347,025 | | |
TOTAL UTILITIES | | | 33,778,913 | | |
Total common stocks
(Cost $576,024,834) | | | | | 575,844,214 | | |
INVESTMENT
COMPANIES — 0.15% | | Shares
Held | | Value | |
Closed-End Funds — 0.15% | |
Boulder Growth & Income Fund, Inc. | | | 118,292 | | | $ | 998,384 | | |
Total investment companies
(Cost $649,324) | | | | | 998,384 | | |
PREFERRED STOCKS — 0.17% | |
FINANCIALS — 0.17%
Real Estate — 0.02% | |
W2007 Grace Acquisition I, Inc. (a) | | | 6,366 | | | | 154,710 | | |
Thrifts & Mortgage Finance — 0.15% | |
Federal Home Loan Mortgage Corp. — Series K (a) | | | 33,900 | | | | 197,637 | | |
Federal Home Loan Mortgage Corp. — Series N (a) | | | 118,600 | | | | 630,952 | | |
Federal Home Loan Mortgage Corp. — Series S (a) | | | 18,700 | | | | 104,720 | | |
| | | | 933,309 | | |
TOTAL FINANCIALS | | | 1,088,019 | | |
Total preferred stocks
(Cost $337,338) | | | | | 1,088,019 | | |
CONVERTIBLE
BONDS — 0.69% | | Principal
Amount | | | |
ENERGY — 0.69%
Oil, Gas & Consumable Fuels — 0.69% | |
Cobalt International Energy, Inc.
2.625%, 12/01/2019 | | $ | 6,000,000 | | | | 4,436,250 | | |
TOTAL ENERGY | | | 4,436,250 | | |
Total convertible bonds
(Cost $4,141,816) | | | | | 4,436,250 | | |
CORPORATE BONDS — 7.65% | |
FINANCIALS — 1.03%
Diversified Financial Services — 1.03% | |
Harland Clarke Holdings Corp.
9.250%, 03/01/2021
(Acquired 06/16/2015 — 06/26/2015,
Cost $6,609,304) (r) | | | 7,413,000 | | | | 6,625,369 | | |
TOTAL FINANCIALS | | | 6,625,369 | | |
INDUSTRIALS — 2.24%
Building Products — 0.65% | |
Associated Materials LLC/AMH New Finance, Inc.
9.125%, 11/01/2017 | | | 5,000,000 | | | | 4,175,000 | | |
Trading Companies & Distributors — 1.59% | |
Real Alloy Holding, Inc.
10.000%, 01/15/2019
(Acquired 12/23/2014,
Cost $9,173,172) (r) | | | 10,000,000 | | | | 10,200,000 | | |
TOTAL INDUSTRIALS | | | 14,375,000 | | |
The accompanying notes are an integral part of these financial statements.
38
Schedule of Investments — June 30, 2015
Hotchkis & Wiley Value Opportunities Fund
| | Principal
Amount | | Value | |
MATERIALS — 4.38%
Chemicals — 3.20% | |
Iracore International Holdings, Inc.
9.500%, 06/01/2018
(Acquired 11/12/2014 — 06/19/2015,
Cost $19,316,865) (i) (r) | | $ | 27,207,000 | | | $ | 20,541,285 | | |
Metals & Mining — 1.18% | |
Horsehead Holding Corp.
9.000%, 06/01/2017
(Acquired 07/24/2014,
Cost $7,500,000) (i) (r) | | | 7,500,000 | | | | 7,537,500 | | |
TOTAL MATERIALS | | | 28,078,785 | | |
Total corporate bonds
(Cost $46,857,447) | | | | | 49,079,154 | | |
WARRANTS — 0.72% | | Shares
Held | | | |
CONSUMER DISCRETIONARY — 0.21%
Automobiles — 0.21% | |
General Motors Company (a)
Expiration: July 2016,
Exercise Price: $10.00 | | | 33,866 | | | | 804,995 | | |
Expiration: July 2019,
Exercise Price: $18.33 | | | 33,866 | | | | 543,549 | | |
TOTAL CONSUMER DISCRETIONARY | | | 1,348,544 | | |
FINANCIALS — 0.51%
Insurance — 0.51% | |
American International Group, Inc. (a)
Expiration: January 2021,
Exercise Price: $45.00 | | | 117,400 | | | | 3,253,154 | | |
TOTAL FINANCIALS | | | 3,253,154 | | |
Total warrants
(Cost $2,192,459) | | | | | 4,601,698 | | |
Total long-term investments
(Cost $630,203,218) | | | | | 636,047,719 | | |
COLLATERAL FOR SECURITIES ON LOAN — 0.94% | |
Money Market Funds — 0.94% | |
Invesco Government & Agency Portfolio, 0.04%^ | | | 6,060,485 | | | | 6,060,485 | | |
Total collateral for securities on loan
(Cost $6,060,485) | | | 6,060,485 | | |
SHORT-TERM
INVESTMENTS — 0.76% | | Principal
Amount | | | |
Time Deposits — 0.76% | |
Brown Brothers Harriman & Co.,
0.08%, 07/01/2015* | | GBP | 14 | | | | 22 | | |
DNB Group, 0.03%, 07/01/2015* | | $ | 4,856,516 | | | | 4,856,516 | | |
Total short-term investments
(Cost $4,856,537) | | | 4,856,538 | | |
Total investments — 100.85%
(Cost $641,120,240) | | | | | 646,964,742 | | |
Liabilities in excess of other assets — (0.85)% | | | | | (5,477,495 | ) | |
Net assets — 100.00% | | $ | 641,487,247 | | |
(a) — Non-income producing security.
(c) — All or a portion of this security is on loan. The total market value of securities on loan was $5,935,774.
(d) — All or a portion of this security is segregated as collateral for futures contracts.
(f) — Security was fair valued as a result of market movements following the close of local trading using a third-party vendor's proprietary fair value pricing model. The total market value of these securities was $89,216,155, which represented 13.91% of net assets. See Security Valuation in Note 1 in Notes to the Financial Statements.
(i) — Illiquid security.
(r) — Restricted security under Rule 144A of the Securities Act of 1933. Purchased in a private placement transaction; resale to the public may require registration or be limited to qualified institutional buyers. The total market value of these securities was $44,904,154, which represented 7.00% of net assets.
ADR — American Depositary Receipt
GBP — British Pounds
^ — Rate shown is the 7-day yield as of June 30, 2015.
* — Invested through a cash management account administered by Brown Brothers Harriman & Co.
The Global Industry Classification Standard (GICS®) was developed by MSCI, an independent provider of global indices and benchmark-related products and services, and Standard & Poor's (S&P), an independent international financial data and investment services company. The GICS methodology has been widely accepted as an industry analysis framework for investment research, portfolio management and asset allocation. The GICS structure consists of 10 sectors, 24 industry groups, 67 industries and 156 sub-industries. Each stock that is classified will have a coding at all four of these levels.
The accompanying notes are an integral part of these financial statements.
39
Schedule of Futures Contracts — June 30, 2015
Hotchkis & Wiley Value Opportunities Fund
Description | | Number of
Contracts
Purchased (Sold) | | Expiration | | Notional
Amount
at Value | | Unrealized
Appreciation
(Depreciation) | |
British Pound Currency Futures | | | (540 | ) | | September 2015 | | $ | (53,071,875 | ) | | $ | (715,863 | ) | |
Euro Fx Currency Futures | | | (150 | ) | | September 2015 | | | (20,917,500 | ) | | | 227,083 | | |
Japanese Yen Currency Futures | | | (120 | ) | | September 2015 | | | (12,273,750 | ) | | | (105,463 | ) | |
| | | | | | | $ | (86,263,125 | ) | | $ | (594,243 | ) | |
The accompanying notes are an integral part of these financial statements.
40
Schedule of Investments — June 30, 2015
Hotchkis & Wiley Capital Income Fund

Largest Issuers | | Percent of
net assets | |
JPMorgan Chase & Company | | | 2.88 | % | |
Wells Fargo & Company | | | 2.86 | % | |
Microsoft Corp. | | | 2.51 | % | |
The GEO Group, Inc. | | | 2.06 | % | |
GlaxoSmithKline PLC | | | 1.94 | % | |
Vodafone Group PLC | | | 1.76 | % | |
Marathon Oil Corp. | | | 1.73 | % | |
Royal Dutch Shell PLC | | | 1.73 | % | |
Sanofi | | | 1.72 | % | |
Willis Group Holdings PLC | | | 1.71 | % | |
COMMON
STOCKS — 55.80% | | Shares
Held | | Value | |
CONSUMER DISCRETIONARY — 6.19%
Auto Components — 1.37% | |
Johnson Controls, Inc. | | | 21,152 | | | $ | 1,047,659 | | |
Automobiles — 1.61% | |
Ford Motor Company | | | 72,171 | | | | 1,083,287 | | |
General Motors Company | | | 2,145 | | | | 71,493 | | |
General Motors Company — Escrow (a) (f) (i) | | | 4,600 | | | | 0 | | |
Motors Liquidation Company GUC Trust | | | 3,717 | | | | 71,552 | | |
| | | | 1,226,332 | | |
Hotels, Restaurants & Leisure — 1.75% | |
Carnival Corp. | | | 9,318 | | | | 460,216 | | |
McDonald's Corp. | | | 9,260 | | | | 880,347 | | |
| | | | 1,340,563 | | |
Multiline Retail — 1.46% | |
Kohl's Corp. | | | 3,420 | | | | 214,126 | | |
Target Corp. | | | 11,034 | | | | 900,706 | | |
| | | | 1,114,832 | | |
TOTAL CONSUMER DISCRETIONARY | | | 4,729,386 | | |
CONSUMER STAPLES — 4.27%
Food & Staples Retailing — 1.40% | |
Wal-Mart Stores, Inc. (d) | | | 15,035 | | | | 1,066,433 | | |
Food Products — 1.45% | |
Kellogg Company | | | 17,748 | | | | 1,112,799 | | |
Tobacco — 1.42% | |
Philip Morris International, Inc. (d) | | | 13,500 | | | | 1,082,295 | | |
TOTAL CONSUMER STAPLES | | | 3,261,527 | | |
ENERGY — 5.11%
Energy Equipment & Services — 0.00% | |
Lone Pine Resources Canada Ltd. (a) (f) (i) | | | 3,118 | | | | 0 | | |
Lone Pine Resources, Inc. (a) (f) (i) | | | 3,118 | | | | 0 | | |
Lone Pine Resources, Inc. — Escrow (a) (f) (i) | | | 25,000 | | | | 0 | | |
| | | | 0 | | |
| | Shares
Held | | Value | |
Oil, Gas & Consumable Fuels — 5.11% | |
Marathon Oil Corp. | | | 49,692 | | | $ | 1,318,826 | | |
Murphy Oil Corp. | | | 30,451 | | | | 1,265,848 | | |
Royal Dutch Shell PLC — ADR (d) | | | 23,121 | | | | 1,318,128 | | |
| | | | 3,902,802 | | |
TOTAL ENERGY | | | 3,902,802 | | |
FINANCIALS — 14.00%
Banks — 6.30% | |
Bank of America Corp. | | | 25,382 | | | | 432,002 | | |
JPMorgan Chase & Company (d) | | | 32,445 | | | | 2,198,473 | | |
Wells Fargo & Company (d) | | | 38,787 | | | | 2,181,381 | | |
| | | | 4,811,856 | | |
Capital Markets — 1.17% | |
Fifth Street Asset Management, Inc. | | | 86,713 | | | | 891,410 | | |
Insurance — 3.74% | |
American International Group, Inc. | | | 7,157 | | | | 442,446 | | |
The Chubb Corp. | | | 6,853 | | | | 651,994 | | |
Horace Mann Educators Corp. | | | 12,613 | | | | 458,861 | | |
Willis Group Holdings PLC | | | 27,790 | | | | 1,303,351 | | |
| | | | 2,856,652 | | |
Real Estate Investment Trusts — 2.79% | |
Corrections Corp. of America | | | 25,520 | | | | 844,202 | | |
The GEO Group, Inc. (d) | | | 37,558 | | | | 1,282,981 | | |
| | | | 2,127,183 | | |
TOTAL FINANCIALS | | | 10,687,101 | | |
HEALTH CARE — 5.51%
Health Care Equipment & Supplies — 0.56% | |
Medtronic PLC | | | 5,833 | | | | 432,225 | | |
The accompanying notes are an integral part of these financial statements.
41
Schedule of Investments — June 30, 2015
Hotchkis & Wiley Capital Income Fund
| | Shares
Held | | Value | |
Pharmaceuticals — 4.95% | |
Eli Lilly & Company (d) | | | 11,805 | | | $ | 985,599 | | |
GlaxoSmithKline PLC — ADR (d) | | | 35,498 | | | | 1,478,492 | | |
Sanofi — ADR | | | 26,541 | | | | 1,314,576 | | |
| | | | 3,778,667 | | |
TOTAL HEALTH CARE | | | 4,210,892 | | |
INDUSTRIALS — 5.33%
Aerospace & Defense — 2.19% | |
BAE Systems PLC — ADR | | | 28,515 | | | | 808,971 | | |
The Boeing Company (d) | | | 6,241 | | | | 865,751 | | |
| | | | 1,674,722 | | |
Machinery — 3.14% | |
| CNH Industrial NV | | | 49,775 | | | | 461,912 | | |
Cummins, Inc. | | | 6,442 | | | | 845,127 | | |
PACCAR, Inc. | | | 10,183 | | | | 649,777 | | |
Stanley Black & Decker, Inc. | | | 4,152 | | | | 436,956 | | |
| | | | 2,393,772 | | |
TOTAL INDUSTRIALS | | | 4,068,494 | | |
INFORMATION TECHNOLOGY — 8.80%
Communications Equipment — 1.33% | |
Telefonaktiebolaget LM Ericsson — ADR | | | 97,465 | | | | 1,017,535 | | |
Electronic Equipment, Instruments & Components — 1.11% | |
Corning, Inc. | | | 42,809 | | | | 844,622 | | |
IT Services — 1.13% | |
International Business Machines Corp. | | | 5,285 | | | | 859,658 | | |
Semiconductors & Semiconductor Equipment — 1.09% | |
Texas Instruments, Inc. | | | 16,240 | | | | 836,522 | | |
Software — 3.62% | |
CA, Inc. | | | 14,620 | | | | 428,220 | | |
Microsoft Corp. (d) | | | 43,445 | | | | 1,918,097 | | |
Oracle Corp. | | | 10,391 | | | | 418,757 | | |
| | | | 2,765,074 | | |
Technology Hardware, Storage & Peripherals — 0.52% | |
Hewlett-Packard Company | | | 13,228 | | | | 396,972 | | |
TOTAL INFORMATION TECHNOLOGY | | | 6,720,383 | | |
TELECOMMUNICATION SERVICES — 1.76%
Wireless Telecommunication Services — 1.76% | |
Vodafone Group PLC — ADR (d) | | | 36,808 | | | | 1,341,652 | | |
TOTAL TELECOMMUNICATION SERVICES | | | 1,341,652 | | |
UTILITIES — 4.83%
Electric Utilities — 3.19% | |
Great Plains Energy, Inc. | | | 27,105 | | | | 654,857 | | |
PPL Corp. | | | 37,917 | | | | 1,117,413 | | |
The Southern Company | | | 15,815 | | | | 662,649 | | |
| | | | 2,434,919 | | |
| | Shares
Held | | Value | |
Multi-Utilities — 1.64% | |
Public Service Enterprise Group, Inc. (d) | | | 31,854 | | | $ | 1,251,225 | | |
TOTAL UTILITIES | | | 3,686,144 | | |
Total common stocks
(Cost $40,200,813) | | | | | 42,608,381 | | |
INVESTMENT COMPANIES — 0.27% | |
Business Development Companies — 0.27% | |
Fifth Street Senior Floating Rate Corp. | | | 22,047 | | | | 203,273 | | |
Total investment companies
(Cost $222,342) | | | | | 203,273 | | |
PREFERRED STOCKS — 1.51% | |
ENERGY — 0.02%
Energy Equipment & Services — 0.02% | |
Lone Pine Resources Canada Ltd. (a) (f) (i) | | | 12,005 | | | | 11,645 | | |
Lone Pine Resources, Inc. Multiple
Voting Shares (a) (f) (i) | | | 12,005 | | | | 0 | | |
| | | | 11,645 | | |
TOTAL ENERGY | | | 11,645 | | |
FINANCIALS — 1.49%
Banks — 1.49% | |
Citigroup, Inc., 7.125% (b) | | | 9,739 | | | | 266,555 | | |
Countrywide Capital V, 7.000% | | | 8,870 | | | | 228,403 | | |
Morgan Stanley Capital Trust III, 6.250% | | | 7,932 | | | | 202,504 | | |
Morgan Stanley Capital Trust VIII, 6.450% | | | 2,159 | | | | 54,731 | | |
Royal Bank of Scotland Group PLC, 6.400% | | | 4,455 | | | | 110,974 | | |
Royal Bank of Scotland Group PLC, 6.600% | | | 10,107 | | | | 252,069 | | |
Synovus Financial Corp., 7.875% (b) | | | 836 | | | | 23,237 | | |
| | | | 1,138,473 | | |
TOTAL FINANCIALS | | | 1,138,473 | | |
Total preferred stocks
(Cost $1,105,111) | | | | | 1,150,118 | | |
CONVERTIBLE PREFERRED STOCKS — 0.16% | |
ENERGY — 0.16%
Energy Equipment & Services — 0.10% | |
McDermott International, Inc., 6.250% | | | 3,768 | | | | 73,212 | | |
Oil, Gas & Consumable Fuels — 0.06% | |
PetroQuest Energy, Inc., 6.875% (i) | | | 1,853 | | | | 48,178 | | |
TOTAL ENERGY | | | 121,390 | | |
Total convertible preferred stocks
(Cost $169,359) | | | | | 121,390 | | |
CONVERTIBLE
BONDS — 0.53% | | Principal
Amount | | | |
ENERGY — 0.23%
Oil, Gas & Consumable Fuels — 0.23% | |
Cobalt International Energy, Inc.
3.125%, 05/15/2024 | | $ | 240,000 | | | | 175,050 | | |
TOTAL ENERGY | | | 175,050 | | |
The accompanying notes are an integral part of these financial statements.
42
Schedule of Investments — June 30, 2015
Hotchkis & Wiley Capital Income Fund
| | Principal
Amount | | Value | |
INDUSTRIALS — 0.30%
Machinery — 0.30% | |
Meritor, Inc.
7.875%, 03/01/2026 | | $ | 74,000 | | | $ | 117,290 | | |
Navistar International Corp.
4.750%, 04/15/2019 | | | 135,000 | | | | 116,184 | | |
| | | | 233,474 | | |
TOTAL INDUSTRIALS | | | 233,474 | | |
Total convertible bonds
(Cost $458,270) | | | | | 408,524 | | |
CORPORATE BONDS — 37.15% | |
CONSUMER DISCRETIONARY — 9.71%
Auto Components — 0.67% | |
Schaeffler Holding Finance BV
6.750%, 11/15/2022
(Acquired 10/21/2014 — 03/17/2015,
Cost $246,367) (p) (r) | | | 235,000 | | | | 254,681 | | |
ZF North America Capital, Inc.
4.750%, 04/29/2025
(Acquired 04/24/2015 — 05/11/2015,
Cost $259,365) (r) | | | 260,000 | | | | 253,175 | | |
| | | | 507,856 | | |
Hotels, Restaurants & Leisure — 2.04% | |
1011778 BC ULC/New Red Finance, Inc.
6.000%, 04/01/2022
(Acquired 09/24/2014 — 05/04/2015,
Cost $205,126) (r) | | | 204,000 | | | | 210,120 | | |
Boyd Gaming Corp.
6.875%, 05/15/2023 | | | 105,000 | | | | 108,150 | | |
Interval Acquisition Corp.
5.625%, 04/15/2023
(Acquired 04/02/2015 — 04/10/2015,
Cost $255,923) (r) | | | 255,000 | | | | 259,463 | | |
MGM Resorts International
7.750%, 03/15/2022 | | | 299,000 | | | | 330,394 | | |
Ruby Tuesday, Inc.
7.625%, 05/15/2020 (i) | | | 220,000 | | | | 227,150 | | |
Shearer's Foods LLC/Chip Finance Corp.
9.000%, 11/01/2019
(Acquired 10/24/2012 — 02/19/2015,
Cost $182,902) (r) | | | 172,000 | | | | 185,760 | | |
Wynn Macau Ltd.
5.250%, 10/15/2021
(Acquired 03/13/2014 — 03/17/2015,
Cost $248,198) (r) | | | 250,000 | | | | 237,500 | | |
| | | | 1,558,537 | | |
| | Principal
Amount | | Value | |
Household Durables — 1.05% | |
Century Communities, Inc.
6.875%, 05/15/2022 (i) | | $ | 78,000 | | | $ | 77,025 | | |
WCI Communities, Inc.
6.875%, 08/15/2021 | | | 225,000 | | | | 233,438 | | |
Weekley Homes LLC/Weekley Finance Corp.
6.000%, 02/01/2023 | | | 308,000 | | | | 292,600 | | |
William Lyon Homes, Inc.
8.500%, 11/15/2020 | | | 181,000 | | | | 196,385 | | |
| | | | 799,448 | | |
Leisure Products — 0.97% | |
Apex Tool Group LLC
7.000%, 02/01/2021
(Acquired 01/25/2013 — 04/01/2015,
Cost $277,851) (r) | | | 285,000 | | | | 255,788 | | |
Gibson Brands, Inc.
8.875%, 08/01/2018
(Acquired 07/24/2013 — 11/14/2014,
Cost $236,665) (r) | | | 230,000 | | | | 233,450 | | |
MCE Finance Ltd.
5.000%, 02/15/2021
(Acquired 02/06/2013 — 12/30/2014,
Cost $259,596) (r) | | | 264,000 | | | | 252,120 | | |
| | | | 741,358 | | |
Media — 2.93% | |
Altice SA
7.625%, 02/15/2025
(Acquired 01/30/2015 — 05/21/2015,
Cost $277,338) (r) | | | 275,000 | | | | 259,188 | | |
Cable One, Inc.
5.750%, 06/15/2022
(Acquired 06/03/2015 — 06/08/2015,
Cost $207,498) (r) | | | 205,000 | | | | 208,075 | | |
CCO Holdings LLC/CCO Holdings Capital Corp.
7.375%, 06/01/2020 | | | 116,000 | | | | 122,815 | | |
Entercom Radio LLC
10.500%, 12/01/2019 | | | 205,000 | | | | 220,888 | | |
MDC Partners, Inc.
6.750%, 04/01/2020
(Acquired 03/15/2013 — 04/28/2015,
Cost $276,602) (r) | | | 270,000 | | | | 270,000 | | |
Numericable — SFR SAS
6.000%, 05/15/2022
(Acquired 04/23/2014 — 12/29/2014,
Cost $309,435) (r) | | | 305,000 | | | | 301,377 | | |
Townsquare Media, Inc.
6.500%, 04/01/2023
(Acquired 03/24/2015 — 05/18/2015,
Cost $260,875) (r) | | | 260,000 | | | | 258,375 | | |
Virgin Media Finance PLC
6.375%, 04/15/2023
(Acquired 02/07/2013 — 12/29/2014,
Cost $276,226) (r) | | | 265,000 | | | | 274,938 | | |
VTR Finance BV
6.875%, 01/15/2024
(Acquired 01/27/2014 — 03/09/2015,
Cost $326,898) (r) | | | 318,000 | | | | 325,742 | | |
| | | | 2,241,398 | | |
The accompanying notes are an integral part of these financial statements.
43
Schedule of Investments — June 30, 2015
Hotchkis & Wiley Capital Income Fund
| | Principal
Amount | | Value | |
Multiline Retail — 0.29% | |
Family Tree Escrow LLC
5.750%, 03/01/2023
(Acquired 02/06/2015 — 02/09/2015,
Cost $215,278) (r) | | $ | 210,000 | | | $ | 220,500 | | |
Specialty Retail — 1.48% | |
Argos Merger Sub, Inc.
7.125%, 03/15/2023
(Acquired 02/18/2015 — 05/04/2015,
Cost $260,392) (r) | | | 255,000 | | | | 267,750 | | |
Chinos Intermediate Holdings A, Inc.
7.750%, 05/01/2019
(Acquired 01/28/2015 — 06/08/2015,
Cost $113,164) (p) (r) | | | 130,000 | | | | 105,300 | | |
CST Brands, Inc.
5.000%, 05/01/2023 | | | 278,000 | | | | 278,000 | | |
The Men's Wearhouse, Inc.
7.000%, 07/01/2022 | | | 256,000 | | | | 275,200 | | |
Outerwall, Inc.
5.875%, 06/15/2021 | | | 220,000 | | | | 206,800 | | |
| | | | 1,133,050 | | |
Textiles, Apparel & Luxury Goods — 0.28% | |
Quiksilver, Inc./QS Wholesale, Inc.
7.875%, 08/01/2018
(Acquired 07/11/2013 — 05/05/2015,
Cost $219,959) (r) | | | 218,000 | | | | 187,480 | | |
10.000%, 08/01/2020 | | | 70,000 | | | | 26,600 | | |
| | | | 214,080 | | |
TOTAL CONSUMER DISCRETIONARY | | | 7,416,227 | | |
CONSUMER STAPLES — 1.63%
Food Products — 0.79% | |
Pinnacle Operating Corp.
9.000%, 11/15/2020
(Acquired 09/13/2013 — 02/26/2015,
Cost $296,104) (r) | | | 282,000 | | | | 280,590 | | |
Wells Enterprises, Inc.
6.750%, 02/01/2020
(Acquired 01/15/2013 — 04/22/2015,
Cost $324,121) (r) | | | 314,000 | | | | 321,850 | | |
| | | | 602,440 | | |
Household Products — 0.84% | |
American Greetings Corp.
7.375%, 12/01/2021 | | | 293,000 | | | | 308,748 | | |
Central Garden & Pet Company
8.250%, 03/01/2018 | | | 153,000 | | | | 157,055 | | |
FGI Operating Company LLC/FGI Finance, Inc.
7.875%, 05/01/2020 | | | 225,000 | | | | 173,250 | | |
| | | | 639,053 | | |
TOTAL CONSUMER STAPLES | | | 1,241,493 | | |
| | Principal
Amount | | Value | |
ENERGY — 6.19%
Energy Equipment & Services — 2.88% | |
Atwood Oceanics, Inc.
6.500%, 02/01/2020 | | $ | 220,000 | | | $ | 213,400 | | |
Bellatrix Exploration Ltd.
8.500%, 05/15/2020
(Acquired 05/15/2015 — 05/20/2015,
Cost $166,906) (r) | | | 170,000 | | | | 160,225 | | |
Energy XXI Gulf Coast, Inc.
11.000%, 03/15/2020
(Acquired 04/14/2015 — 05/06/2015,
Cost $116,191) (r) | | | 120,000 | | | | 105,900 | | |
Globe Luxembourg SCA
9.625%, 05/01/2018
(Acquired 05/02/2013 — 05/26/2015,
Cost $207,370) (r) | | | 200,000 | | | | 193,000 | | |
McDermott International, Inc.
8.000%, 05/01/2021
(Acquired 04/10/2014 — 03/03/2015,
Cost $290,037) (r) | | | 330,000 | | | | 298,650 | | |
Paragon Offshore PLC
6.750%, 07/15/2022
(Acquired 07/11/2014 — 04/21/2015,
Cost $288,869) (r) | | | 330,000 | | | | 110,550 | | |
Parsley Energy LLC/Parsley Finance Corp.
7.500%, 02/15/2022
(Acquired 01/31/2014 — 02/12/2015,
Cost $249,333) (r) | | | 241,000 | | | | 245,745 | | |
PHI, Inc.
5.250%, 03/15/2019 | | | 323,000 | | | | 300,390 | | |
Shale-Inland Holdings LLC/
Shale-Inland Finance Corp.
8.750%, 11/15/2019
(Acquired 10/26/2012 — 04/20/2015,
Cost $159,498) (r) | | | 160,000 | | | | 120,800 | | |
Shelf Drilling Holdings Ltd.
8.625%, 11/01/2018
(Acquired 10/10/2012 — 03/13/2015,
Cost $188,319) (r) | | | 195,000 | | | | 174,525 | | |
Unit Corp.
6.625%, 05/15/2021 | | | 284,000 | | | | 276,900 | | |
| | | | 2,200,085 | | |
The accompanying notes are an integral part of these financial statements.
44
Schedule of Investments — June 30, 2015
Hotchkis & Wiley Capital Income Fund
| | Principal
Amount | | Value | |
Oil, Gas & Consumable Fuels — 3.31% | |
Calumet Specialty Products Partners LP/
Calumet Finance Corp.
6.500%, 04/15/2021 | | $ | 241,000 | | | $ | 238,590 | | |
Comstock Resources, Inc.
10.000%, 03/15/2020
(Acquired 03/04/2015 — 03/09/2015,
Cost $210,000) (r) | | | 210,000 | | | | 191,100 | | |
9.500%, 06/15/2020 | | | 235,000 | | | | 100,463 | | |
Gastar Exploration, Inc.
8.625%, 05/15/2018 (i) | | | 253,000 | | | | 238,453 | | |
Gulfport Energy Corp.
7.750%, 11/01/2020 | | | 285,000 | | | | 299,962 | | |
Holly Energy Partners LP/
Holly Energy Finance Corp.
6.500%, 03/01/2020 | | | 241,000 | | | | 241,603 | | |
Kosmos Energy Ltd.
7.875%, 08/01/2021
(Acquired 07/25/2014 — 04/28/2015,
Cost $313,148) (r) | | | 323,000 | | | | 313,309 | | |
Niska Gas Storage Canada ULC/
Niska Gas Storage Canada Finance Corp.
6.500%, 04/01/2019 | | | 133,000 | | | | 125,685 | | |
PBF Holding Company LLC/PBF Finance Corp.
8.250%, 02/15/2020 | | | 237,000 | | | | 251,576 | | |
PBF Logistics LP/PBF Logistics Finance Corp.
6.875%, 05/15/2023
(Acquired 05/07/2015 — 05/29/2015,
Cost $225,737) (r) | | | 223,000 | | | | 225,230 | | |
PetroQuest Energy, Inc.
10.000%, 09/01/2017 | | | 205,000 | | | | 193,725 | | |
Warren Resources, Inc.
9.000%, 08/01/2022
(Acquired 08/06/2014 — 12/04/2014,
Cost $215,752) (r) | | | 223,000 | | | | 107,040 | | |
| | | | 2,526,736 | | |
TOTAL ENERGY | | | 4,726,821 | | |
FINANCIALS — 2.13%
Banks — 0.86% | |
AerCap Ireland Capital Ltd./
AerCap Global Aviation Trust
4.625%, 07/01/2022 | | | 120,000 | | | | 120,300 | | |
First Tennessee Capital II
6.300%, 04/15/2034 (i) | | | 260,000 | | | | 247,650 | | |
Popular, Inc.
7.000%, 07/01/2019 | | | 292,000 | | | | 293,095 | | |
| | | | 661,045 | | |
| | Principal
Amount | | Value | |
Consumer Finance — 0.49% | |
Credit Acceptance Corp.
6.125%, 02/15/2021 | | $ | 265,000 | | | $ | 266,656 | | |
7.375%, 03/15/2023
(Acquired 03/25/2015 — 04/16/2015,
Cost $104,326) (r) | | | 105,000 | | | | 108,675 | | |
| | | | 375,331 | | |
Diversified Financial Services — 0.40% | |
Harland Clarke Holdings Corp.
9.250%, 03/01/2021
(Acquired 01/27/2014 — 01/26/2015,
Cost $340,389) (r) | | | 340,000 | | | | 303,875 | | |
Real Estate Investment Trusts — 0.38% | |
The GEO Group, Inc.
5.875%, 10/15/2024 | | | 280,000 | | | | 289,800 | | |
TOTAL FINANCIALS | | | 1,630,051 | | |
HEALTH CARE — 2.98%
Health Care Equipment & Supplies — 0.31% | |
Halyard Health, Inc.
6.250%, 10/15/2022
(Acquired 10/02/2014 — 03/18/2015,
Cost $228,410) (r) | | | 223,000 | | | | 234,568 | | |
Health Care Providers & Services — 1.39% | |
CHS/Community Health Systems, Inc.
6.875%, 02/01/2022 | | | 205,000 | | | | 217,044 | | |
DJO Finco, Inc./DJO Finance LLC/
DJO Finance Corp.
8.125%, 06/15/2021
(Acquired 04/23/2015 — 06/16/2015,
Cost $129,383) (r) | | | 129,000 | | | | 133,193 | | |
HCA, Inc.
6.500%, 02/15/2020 | | | 235,000 | | | | 263,200 | | |
5.375%, 02/01/2025 | | | 240,000 | | | | 243,000 | | |
Tenet Healthcare Corp.
6.750%, 06/15/2023
(Acquired 06/02/2015 — 06/08/2015,
Cost $105,632) (r) | | | 105,000 | | | | 107,297 | | |
Universal Hospital Services, Inc.
7.625%, 08/15/2020 | | | 105,000 | | | | 97,125 | | |
| | | | 1,060,859 | | |
Health Care Technology — 0.48% | |
Hologic, Inc.
5.250%, 07/15/2022
(Acquired 06/18/2015,
Cost $87,385) (e) (r) | | | 87,000 | | | | 89,066 | | |
Mallinckrodt International Finance SA/
Mallinckrodt CB LLC
5.750%, 08/01/2022
(Acquired 07/30/2014 — 02/03/2015,
Cost $270,362) (r) | | | 268,000 | | | | 274,365 | | |
| | | | 363,431 | | |
The accompanying notes are an integral part of these financial statements.
45
Schedule of Investments — June 30, 2015
Hotchkis & Wiley Capital Income Fund
| | Principal
Amount | | Value | |
Pharmaceuticals — 0.80% | |
Endo Finance LLC/Endo Ltd./Endo Finco, Inc.
6.000%, 07/15/2023
(Acquired 06/24/2015,
Cost $51,000) (e) (r) | | $ | 51,000 | | | $ | 52,275 | | |
Grifols Worldwide Operations Ltd.
5.250%, 04/01/2022 | | | 260,000 | | | | 261,300 | | |
Valeant Pharmaceuticals International, Inc.
6.125%, 04/15/2025
(Acquired 03/13/2015 — 06/15/2015,
Cost $295,242) (r) | | | 290,000 | | | | 299,425 | | |
| | | | 613,000 | | |
TOTAL HEALTH CARE | | | 2,271,858 | | |
INDUSTRIALS — 5.65%
Aerospace & Defense — 0.26% | |
CBC Ammo LLC/CBC FinCo, Inc.
7.250%, 11/15/2021
(Acquired 04/09/2015 — 05/11/2015,
Cost $184,573) (i) (r) | | | 210,000 | | | | 197,925 | | |
Building Products — 1.46% | |
Allegion U.S. Holding Company, Inc.
5.750%, 10/01/2021 | | | 160,000 | | | | 166,000 | | |
Associated Materials LLC/AMH New Finance, Inc.
9.125%, 11/01/2017 | | | 189,000 | | | | 157,815 | | |
Masonite International Corp.
5.625%, 03/15/2023
(Acquired 03/09/2015,
Cost $245,000) (r) | | | 245,000 | | | | 250,206 | | |
Roofing Supply Group LLC/
Roofing Supply Finance, Inc.
10.000%, 06/01/2020
(Acquired 05/24/2012 — 01/09/2015,
Cost $262,456) (r) | | | 250,000 | | | | 256,875 | | |
WESCO Distribution, Inc.
5.375%, 12/15/2021 | | | 278,000 | | | | 282,169 | | |
| | | | 1,113,065 | | |
Commercial Services & Supplies — 1.26% | |
Aguila 3 SA
7.875%, 01/31/2018
(Acquired 03/24/2014 — 09/17/2014,
Cost $201,090) (r) | | | 195,000 | | | | 193,781 | | |
Ashtead Capital, Inc.
5.625%, 10/01/2024
(Acquired 09/10/2014 — 03/03/2015,
Cost $260,409) (r) | | | 255,000 | | | | 256,913 | | |
Audatex North America, Inc.
6.125%, 11/01/2023
(Acquired 11/12/2014 — 01/28/2015,
Cost $242,157) (r) | | | 234,000 | | | | 241,313 | | |
Zachry Holdings, Inc.
7.500%, 02/01/2020
(Acquired 01/18/2013 — 04/02/2015,
Cost $285,766) (r) | | | 272,000 | | | | 271,999 | | |
| | | | 964,006 | | |
| | Principal
Amount | | Value | |
Construction & Engineering — 1.17% | |
AECOM
5.875%, 10/15/2024
(Acquired 09/17/2014 — 03/05/2015,
Cost $347,734) (r) | | $ | 340,000 | | | $ | 345,525 | | |
Rice Energy, Inc.
6.250%, 05/01/2022 | | | 275,000 | | | | 274,313 | | |
RSI Home Products, Inc.
6.500%, 03/15/2023
(Acquired 03/05/2015,
Cost $270,000) (r) | | | 270,000 | | | | 273,375 | | |
| | | | 893,213 | | |
Electrical Equipment — 0.31% | |
General Cable Corp.
5.750%, 10/01/2022 | | | 251,000 | | | | 236,568 | | |
Machinery — 0.83% | |
Cleaver-Brooks, Inc.
8.750%, 12/15/2019
(Acquired 05/01/2015 — 05/19/2015,
Cost $187,581) (r) | | | 185,000 | | | | 183,150 | | |
Meritor, Inc.
6.250%, 02/15/2024 | | | 195,000 | | | | 193,538 | | |
Navistar International Corp.
8.250%, 11/01/2021 | | | 270,000 | | | | 257,850 | | |
| | | | 634,538 | | |
Trading Companies & Distributors — 0.36% | |
Real Alloy Holding, Inc.
10.000%, 01/15/2019
(Acquired 12/23/2014 — 03/02/2015,
Cost $257,269) (r) | | | 271,000 | | | | 276,420 | | |
TOTAL INDUSTRIALS | | | 4,315,735 | | |
INFORMATION TECHNOLOGY — 2.61%
Communications Equipment — 0.22% | |
CommScope Technologies Finance LLC
6.000%, 06/15/2025
(Acquired 05/28/2015 — 05/29/2015,
Cost $170,584) (r) | | | 170,000 | | | | 169,788 | | |
The accompanying notes are an integral part of these financial statements.
46
Schedule of Investments — June 30, 2015
Hotchkis & Wiley Capital Income Fund
| | Principal
Amount | | Value | |
Electronic Equipment, Instruments & Components — 1.24% | |
CommScope Holding Company, Inc.
6.625%, 06/01/2020
(Acquired 11/19/2014 — 01/05/2015,
Cost $165,792) (p) (r) | | $ | 160,000 | | | $ | 166,600 | | |
Freescale Semiconductor, Inc.
6.000%, 01/15/2022
(Acquired 10/28/2013 — 09/18/2014,
Cost $167,883) (r) | | | 163,000 | | | | 173,188 | | |
NXP BV/NXP Funding LLC
4.625%, 06/15/2022
(Acquired 06/02/2015 — 06/09/2015,
Cost $90,005) (r) | | | 90,000 | | | | 89,438 | | |
5.750%, 03/15/2023
(Acquired 06/11/2013 — 09/17/2014,
Cost $188,563) (r) | | | 183,000 | | | | 190,777 | | |
Sensata Technologies BV
5.625%, 11/01/2024
(Acquired 10/07/2014 — 03/19/2015,
Cost $177,882) (r) | | | 175,000 | | | | 180,905 | | |
Zebra Technologies Corp.
7.250%, 10/15/2022
(Acquired 09/30/2014 — 06/05/2015,
Cost $141,699) (r) | | | 135,000 | | | | 146,475 | | |
| | | | 947,383 | | |
Software — 0.79% | |
ACI Worldwide, Inc.
6.375%, 08/15/2020
(Acquired 08/15/2013 — 04/21/2014,
Cost $172,989) (r) | | | 168,000 | | | | 177,450 | | |
First Data Corp.
8.750%, 01/15/2022
(Acquired 11/19/2012 — 07/31/2014,
Cost $237,003) (r) | | | 225,884 | | | | 240,708 | | |
VeriSign, Inc.
5.250%, 04/01/2025
(Acquired 03/24/2015 — 05/04/2015,
Cost $183,353) (r) | | | 181,000 | | | | 181,000 | | |
| | | | 599,158 | | |
Technology Hardware, Storage & Peripherals — 0.36% | |
CDW LLC/CDW Finance Corp.
5.500%, 12/01/2024 | | | 276,000 | | | | 273,930 | | |
TOTAL INFORMATION TECHNOLOGY | | | 1,990,259 | | |
| | Principal
Amount | | Value | |
MATERIALS — 4.87%
Chemicals — 2.33% | |
The Chemours Company
7.000%, 05/15/2025
(Acquired 05/05/2015 — 05/19/2015,
Cost $191,045) (r) | | $ | 190,000 | | | $ | 184,775 | | |
Hexion, Inc.
6.625%, 04/15/2020 | | | 246,000 | | | | 226,935 | | |
9.000%, 11/15/2020 | | | 165,000 | | | | 120,450 | | |
Iracore International Holdings, Inc.
9.500%, 06/01/2018
(Acquired 05/08/2013 — 04/14/2015,
Cost $244,761) (i) (r) | | | 248,000 | | | | 187,240 | | |
Momentive Performance Materials, Inc.
3.880%, 10/24/2021 | | | 282,000 | | | | 254,505 | | |
Momentive Performance Materials, Inc. — Escrow
8.875%, 10/15/2020 (a) (f) (i) | | | 282,000 | | | | 0 | | |
OMNOVA Solutions, Inc.
7.875%, 11/01/2018 | | | 282,000 | | | | 283,057 | | |
Platform Specialty Products Corp.
6.500%, 02/01/2022
(Acquired 01/23/2015 — 02/03/2015,
Cost $258,377) (r) | | | 255,000 | | | | 264,562 | | |
Rayonier AM Products, Inc.
5.500%, 06/01/2024
(Acquired 05/08/2014 — 02/04/2015,
Cost $273,666) (r) | | | 285,000 | | | | 255,788 | | |
| | | | 1,777,312 | | |
Containers & Packaging — 0.43% | |
Ball Corp.
5.250%, 07/01/2025 | | | 205,000 | | | | 203,719 | | |
Silgan Holdings, Inc.
5.500%, 02/01/2022 | | | 122,000 | | | | 126,270 | | |
| | | | 329,989 | | |
Metals & Mining — 1.53% | |
Century Aluminum Company
7.500%, 06/01/2021
(Acquired 05/23/2013 — 02/23/2015,
Cost $246,406) (r) | | | 240,000 | | | | 244,500 | | |
Horsehead Holding Corp.
9.000%, 06/01/2017
(Acquired 07/24/2014 — 11/04/2014,
Cost $110,583) (i) (r) | | | 110,000 | | | | 110,550 | | |
10.500%, 06/01/2017
(Acquired 07/19/2012 — 01/29/2015,
Cost $190,094) (i) (r) | | | 180,000 | | | | 191,475 | | |
Kaiser Aluminum Corp.
8.250%, 06/01/2020 | | | 103,000 | | | | 111,755 | | |
Noranda Aluminum Acquisition Corp.
11.000%, 06/01/2019 | | | 220,000 | | | | 157,300 | | |
Rain CII Carbon LLC/CII Carbon Corp.
8.000%, 12/01/2018
(Acquired 12/31/2010 — 04/06/2015,
Cost $165,036) (r) | | | 165,000 | | | | 162,113 | | |
8.250%, 01/15/2021
(Acquired 12/14/2012 — 03/02/2015,
Cost $206,133) (r) | | | 200,000 | | | | 195,500 | | |
| | | | 1,173,193 | | |
The accompanying notes are an integral part of these financial statements.
47
Schedule of Investments — June 30, 2015
Hotchkis & Wiley Capital Income Fund
| | Principal
Amount | | Value | |
Paper & Forest Products — 0.58% | |
Appvion, Inc.
9.000%, 06/01/2020
(Acquired 11/13/2013 — 03/11/2015,
Cost $249,847) (i) (r) | | $ | 256,000 | | | $ | 162,560 | | |
Neenah Paper, Inc.
5.250%, 05/15/2021
(Acquired 05/16/2013 — 02/18/2015,
Cost $278,080) (i) (r) | | | 276,000 | | | | 278,070 | | |
| | | | 440,630 | | |
TOTAL MATERIALS | | | | | 3,721,124 | | |
TELECOMMUNICATION SERVICES — 0.59%
Diversified Telecommunication Services — 0.32% | |
Communications Sales & Leasing, Inc.
8.250%, 10/15/2023
(Acquired 04/16/2015 — 05/19/2015,
Cost $249,667) (r) | | | 250,000 | | | | 246,563 | | |
Wireless Telecommunication Services — 0.27% | |
Wind Acquisition Finance SA
7.375%, 04/23/2021
(Acquired 04/08/2014 — 01/27/2015,
Cost $201,741) (r) | | | 203,000 | | | | 205,791 | | |
TOTAL TELECOMMUNICATION SERVICES | | | 452,354 | | |
UTILITIES — 0.79%
Independent Power and Renewable Electricity
Producers — 0.79% | |
Calpine Corp.
5.750%, 01/15/2025 | | | 260,000 | | | | 253,825 | | |
Dynegy, Inc.
7.625%, 11/01/2024
(Acquired 10/10/2014 — 06/23/2015,
Cost $336,644) (r) | | | 325,000 | | | | 346,125 | | |
| | | | 599,950 | | |
TOTAL UTILITIES | | | 599,950 | | |
Total corporate bonds
(Cost $29,377,300) | | | | | 28,365,872 | | |
ASSET-BACKED SECURITIES — 0.58% | |
INDUSTRIALS — 0.58%
Airlines — 0.58% | |
U.S. Airways Pass Through Trust — Class B —
Series 2012-1
8.000%, 10/01/2019 | | | 153,075 | | | | 173,548 | | |
U.S. Airways Pass Through Trust — Class B —
Series 2012-2
6.750%, 06/03/2021 | | | 246,861 | | | | 267,845 | | |
| | | | 441,393 | | |
TOTAL INDUSTRIALS | | | 441,393 | | |
Total asset-backed securities
(Cost $431,639) | | | | | 441,393 | | |
TERM
LOANS — 1.30% | | Principal
Amount | | Value | |
CONSUMER DISCRETIONARY — 0.39%
Multiline Retail — 0.39% | |
J.C. Penney Corp., Inc.
6.000%, 05/22/2018 (b) | | $ | 296,356 | | | $ | 296,144 | | |
TOTAL CONSUMER DISCRETIONARY | | | 296,144 | | |
ENERGY — 0.58%
Energy Equipment & Services — 0.58% | |
Fieldwood Energy LLC
8.375%, 09/30/2020 (b) | | | 310,000 | | | | 238,846 | | |
Jonah Energy LLC
7.500%, 05/12/2021 (b) | | | 215,000 | | | | 205,056 | | |
| | | | 443,902 | | |
TOTAL ENERGY | | | | | 443,902 | | |
MATERIALS — 0.33%
Containers & Packaging — 0.33% | |
Rexam Healthcare
8.000%, 05/02/2022 (b) | | | 255,000 | | | | 255,956 | | |
TOTAL MATERIALS | | | 255,956 | | |
Total term loans
(Cost $1,031,766) | | | | | 996,002 | | |
| WARRANTS — 0.06% | | Shares
Held | | | |
Automobiles — 0.06% | |
General Motors Company (a)
Expiration: July 2016,
Exercise Price: $10.00 | | | 886 | | | | 21,060 | | |
Expiration: July 2019,
Exercise Price: $18.33 | | | 1,491 | | | | 23,931 | | |
Total warrants (Cost $42,461) | | | | | 44,991 | | |
Total long-term investments
(Cost $73,039,061) | | | | | 74,339,944 | | |
SHORT-TERM
INVESTMENTS — 2.18% | | Principal
Amount | | | |
Time Deposits — 2.18% | |
Banco Santander SA,
0.03%, 07/01/2015* | | $ | 1,665,180 | | | | 1,665,180 | | |
Total short-term investments
(Cost $1,665,180) | | | 1,665,180 | | |
Total investments — 99.54%
(Cost $74,704,241) | | | | | 76,005,124 | | |
Other assets in excess of liabilities — 0.46% | | | | | 350,979 | | |
Net assets — 100.00% | | $ | 76,356,103 | | |
(a) — Non-income producing security.
(b) — The coupon rate shown on variable rate securities represents the rate at June 30, 2015.
(d) — All or a portion of this security is segregated as collateral for bridge loan commitments and delayed delivery securities.
(e) — Delayed delivery security.
The accompanying notes are an integral part of these financial statements.
48
Schedule of Investments — June 30, 2015
Hotchkis & Wiley Capital Income Fund
(f) — Security was fair valued under guidelines established by and under the general supervision and responsibility of the Trust's Board of Trustees. The total market value of these securities was $11,645, which represented 0.02% of net assets. See Security Valuation in Note 1 in Notes to the Financial Statements.
(i) — Illiquid security.
(p) — Payment in-kind security.
(r) — Restricted security under Rule 144A of the Securities Act of 1933. Purchased in a private placement transaction; resale to the public may require registration or be limited to qualified institutional buyers. The total market value of these securities was $16,771,458, which represented 21.96% of net assets.
ADR — American Depositary Receipt
* — Invested through a cash management account administered by Brown Brothers Harriman & Co.
The Global Industry Classification Standard (GICS®) was developed by MSCI, an independent provider of global indices and benchmark-related products and services, and Standard & Poor's (S&P), an independent international financial data and investment services company. The GICS methodology has been widely accepted as an industry analysis framework for investment research, portfolio management and asset allocation. The GICS structure consists of 10 sectors, 24 industry groups, 67 industries and 156 sub-industries. Each stock that is classified will have a coding at all four of these levels.
The accompanying notes are an integral part of these financial statements.
49
Schedule of Investments — June 30, 2015
Hotchkis & Wiley High Yield Fund

Largest Issuers | | Percent of
net assets | |
HCA, Inc. | | | 1.44 | % | |
American Airlines Group, Inc.
(includes U.S. Airways) | | | 1.24 | % | |
Royal Bank of Scotland Group PLC | | | 1.12 | % | |
Navistar International Corp. | | | 1.07 | % | |
Credit Acceptance Corp. | | | 1.03 | % | |
Dynegy, Inc. | | | 1.00 | % | |
AECOM | | | 0.99 | % | |
Hexion, Inc. | | | 0.98 | % | |
CommScope Holding Company, Inc.
(includes CommScope Technologies
Finance LLC) | | | 0.96 | % | |
Rain CII Carbon LLC/CII Carbon Corp. | | | 0.95 | % | |
CORPORATE
BONDS — 83.43% | | Principal
Amount | | Value | |
Advertising — 0.79% | |
MDC Partners, Inc.
6.750%, 04/01/2020
(Acquired 03/15/2013 — 06/25/2015,
Cost $22,398,853) (r) | | $ | 21,810,000 | | | $ | 21,810,000 | | |
Aerospace/Defense — 0.60% | |
CBC Ammo LLC/CBC FinCo, Inc.
7.250%, 11/15/2021
(Acquired 04/09/2015 — 06/16/2015,
Cost $15,464,258) (i) (r) | | | 17,445,000 | | | | 16,441,912 | | |
Auto Parts & Equipment — 2.38% | |
Lear Corp.
5.375%, 03/15/2024 | | | 7,000,000 | | | | 7,140,000 | | |
Meritor, Inc.
6.250%, 02/15/2024 | | | 15,800,000 | | | | 15,681,500 | | |
Schaeffler Holding Finance BV
6.750%, 11/15/2022
(Acquired 10/21/2014 — 03/17/2015,
Cost $21,340,681) (p) (r) | | | 20,270,000 | | | | 21,967,612 | | |
ZF North America Capital, Inc.
4.750%, 04/29/2025
(Acquired 04/24/2015 — 05/11/2015,
Cost $21,029,826) (r) | | | 21,070,000 | | | | 20,516,913 | | |
| | | | 65,306,025 | | |
Automakers — 0.72% | |
Navistar International Corp. (d)
8.250%, 11/01/2021 | | | 20,647,000 | | | | 19,717,885 | | |
Banking — 0.95% | |
First Tennessee Capital II
6.300%, 04/15/2034 (i) | | | 1,165,000 | | | | 1,109,663 | | |
Popular, Inc.
7.000%, 07/01/2019 | | | 24,792,000 | | | | 24,884,970 | | |
| | | | 25,994,633 | | |
| | Principal
Amount | | Value | |
Building & Construction — 3.00% | |
Century Communities, Inc.
6.875%, 05/15/2022 (i) | | $ | 4,512,000 | | | $ | 4,455,600 | | |
WCI Communities, Inc.
6.875%, 08/15/2021 | | | 18,477,000 | | | | 19,169,887 | | |
Weekley Homes LLC/Weekley Finance Corp.
6.000%, 02/01/2023 | | | 25,068,000 | | | | 23,814,600 | | |
William Lyon Homes, Inc.
8.500%, 11/15/2020 (d) | | | 12,589,000 | | | | 13,659,065 | | |
Zachry Holdings, Inc.
7.500%, 02/01/2020
(Acquired 01/18/2013 — 05/21/2015,
Cost $21,467,115) (r) | | | 21,151,000 | | | | 21,151,000 | | |
| | | | 82,250,152 | | |
Building Materials — 4.01% | |
Allegion U.S. Holding Company, Inc.
5.750%, 10/01/2021 (d) | | | 12,025,000 | | | | 12,475,937 | | |
Associated Materials LLC/AMH New
Finance, Inc.
9.125%, 11/01/2017 (d) | | | 18,655,000 | | | | 15,576,925 | | |
Masonite International Corp.
5.625%, 03/15/2023
(Acquired 03/09/2015 — 06/22/2015,
Cost $17,880,325) (r) | | | 17,864,000 | | | | 18,243,610 | | |
Roofing Supply Group LLC/
Roofing Supply Finance, Inc.
10.000%, 06/01/2020
(Acquired 05/24/2012 — 05/08/2015,
Cost $20,954,222) (r) | | | 20,179,000 | | | | 20,733,923 | | |
RSI Home Products, Inc.
6.500%, 03/15/2023
(Acquired 03/05/2015 — 06/02/2015,
Cost $21,297,398) (r) | | | 21,215,000 | | | | 21,480,187 | | |
WESCO Distribution, Inc.
5.375%, 12/15/2021 (d) | | | 21,407,000 | | | | 21,728,105 | | |
| | | | 110,238,687 | | |
The accompanying notes are an integral part of these financial statements.
50
Schedule of Investments — June 30, 2015
Hotchkis & Wiley High Yield Fund
| | Principal
Amount | | Value | |
Cable & Satellite TV — 3.61% | |
Altice SA
7.625%, 02/15/2025
(Acquired 01/30/2015 — 05/21/2015,
Cost $21,395,592) (r) | | $ | 21,220,000 | | | $ | 19,999,850 | | |
CCO Holdings LLC/CCO Holdings Capital Corp.
7.375%, 06/01/2020 (d) | | | 9,192,000 | | | | 9,732,030 | | |
Numericable — SFR SAS
6.000%, 05/15/2022
(Acquired 04/23/2014 — 06/03/2015,
Cost $24,535,536) (r) | | | 24,235,000 | | | | 23,947,209 | | |
Virgin Media Finance PLC
6.375%, 04/15/2023
(Acquired 02/07/2013 — 05/11/2015,
Cost $21,158,086) (r) | | | 20,415,000 | | | | 21,180,563 | | |
VTR Finance BV
6.875%, 01/15/2024
(Acquired 01/27/2014 — 06/16/2015,
Cost $24,371,611) (r) | | | 23,823,000 | | | | 24,403,090 | | |
| | | | 99,262,742 | | |
Chemicals — 5.19% | |
Axalta Coating Systems U.S. Holdings,
Inc./Axalta Coating Systems Dutch Holding
7.375%, 05/01/2021
(Acquired 01/16/2013 — 06/22/2015,
Cost $16,315,051) (r) | | | 15,666,000 | | | | 16,821,368 | | |
The Chemours Company
7.000%, 05/15/2025
(Acquired 05/05/2015 — 05/19/2015,
Cost $14,795,776) (r) | | | 14,715,000 | | | | 14,310,337 | | |
Hexion, Inc.
6.625%, 04/15/2020 (d) | | | 18,569,000 | | | | 17,129,902 | | |
9.000%, 11/15/2020 | | | 13,485,000 | | | | 9,844,050 | | |
Momentive Performance Materials, Inc.
3.880%, 10/24/2021 (d) | | | 22,013,000 | | | | 19,866,733 | | |
Momentive Performance Materials,
Inc. — Escrow
8.875%, 10/15/2020 (a) (f) (i) | | | 22,013,000 | | | | 0 | | |
OMNOVA Solutions, Inc.
7.875%, 11/01/2018 (d) | | | 21,327,000 | | | | 21,406,976 | | |
Perstorp Holding AB
8.750%, 05/15/2017
(Acquired 11/09/2012 — 04/16/2015,
Cost $22,605,622) (r) | | | 22,192,000 | | | | 23,190,640 | | |
Platform Specialty Products Corp.
6.500%, 02/01/2022
(Acquired 01/23/2015 — 03/17/2015,
Cost $19,450,779) (r) | | | 19,180,000 | | | | 19,899,250 | | |
| | | | 142,469,256 | | |
| | Principal
Amount | | Value | |
Consumer/Commercial/Lease Financing — 1.40% | |
AerCap Ireland Capital Ltd./AerCap
Global Aviation Trust
4.625%, 07/01/2022 | | $ | 9,880,000 | | | $ | 9,904,700 | | |
Credit Acceptance Corp.
6.125%, 02/15/2021 | | | 19,925,000 | | | | 20,049,531 | | |
7.375%, 03/15/2023
(Acquired 03/25/2015 — 04/16/2015,
Cost $8,020,035) (r) | | | 8,070,000 | | | | 8,352,450 | | |
| | | | 38,306,681 | | |
Discount Stores — 0.61% | |
Family Tree Escrow LLC
5.750%, 03/01/2023
(Acquired 02/06/2015 — 05/04/2015,
Cost $16,331,748) (r) | | | 15,895,000 | | | | 16,689,750 | | |
Diversified Capital Goods — 1.37% | |
Apex Tool Group LLC
7.000%, 02/01/2021
(Acquired 01/25/2013 — 04/28/2015,
Cost $21,456,681) (r) | | | 21,945,000 | | | | 19,695,637 | | |
General Cable Corp.
5.750%, 10/01/2022 | | | 19,026,000 | | | | 17,932,005 | | |
| | | | 37,627,642 | | |
Electric — Generation — 1.80% | |
Calpine Corp.
5.750%, 01/15/2025 | | | 22,437,000 | | | | 21,904,121 | | |
Dynegy, Inc.
7.625%, 11/01/2024
(Acquired 10/10/2014 — 06/23/2015,
Cost $26,770,236) (r) | | | 25,760,000 | | | | 27,434,400 | | |
| | | | 49,338,521 | | |
Electronics — 2.30% | |
Freescale Semiconductor, Inc.
6.000%, 01/15/2022
(Acquired 10/28/2013 — 10/28/2014,
Cost $12,548,737) (r) | | | 12,416,000 | | | | 13,192,000 | | |
NXP BV/NXP Funding LLC
4.625%, 06/15/2022
(Acquired 06/02/2015 — 06/09/2015,
Cost $8,500,516) (r) | | | 8,500,000 | | | | 8,446,875 | | |
5.750%, 03/15/2023
(Acquired 06/11/2013 — 09/17/2014,
Cost $13,907,126) (r) | | | 13,655,000 | | | | 14,235,337 | | |
Sensata Technologies BV
5.625%, 11/01/2024
(Acquired 10/07/2014 — 06/23/2015,
Cost $13,757,122) (r) | | | 13,418,000 | | | | 13,870,858 | | |
Zebra Technologies Corp.
7.250%, 10/15/2022
(Acquired 09/30/2014 — 06/17/2015,
Cost $13,104,959) (r) | | | 12,343,000 | | | | 13,392,155 | | |
| | | | 63,137,225 | | |
The accompanying notes are an integral part of these financial statements.
51
Schedule of Investments — June 30, 2015
Hotchkis & Wiley High Yield Fund
| | Principal
Amount | | Value | |
Energy — Exploration & Production — 6.44% | |
Bellatrix Exploration Ltd.
8.500%, 05/15/2020
(Acquired 05/15/2015 — 05/20/2015,
Cost $13,398,773) (r) | | $ | 13,645,000 | | | $ | 12,860,412 | | |
Comstock Resources, Inc.
10.000%, 03/15/2020
(Acquired 03/04/2015 — 04/09/2015,
Cost $14,829,935) (r) | | | 14,840,000 | | | | 13,504,400 | | |
9.500%, 06/15/2020 (d) | | | 17,701,000 | | | | 7,567,177 | | |
Energy XXI Gulf Coast, Inc.
11.000%, 03/15/2020
(Acquired 04/14/2015 — 05/06/2015,
Cost $9,260,162) (r) | | | 9,565,000 | | | | 8,441,113 | | |
Gastar Exploration, Inc.
8.625%, 05/15/2018 (i) | | | 18,674,000 | | | | 17,600,245 | | |
Gulfport Energy Corp.
7.750%, 11/01/2020 | | | 22,919,000 | | | | 24,122,248 | | |
Kosmos Energy Ltd.
7.875%, 08/01/2021
(Acquired 07/25/2014 — 04/28/2015,
Cost $25,999,553) (r) | | | 26,877,000 | | | | 26,070,690 | | |
Parsley Energy LLC/Parsley Finance Corp.
7.500%, 02/15/2022
(Acquired 01/31/2014 — 03/03/2015,
Cost $20,054,859) (r) | | | 19,661,000 | | | | 20,048,125 | | |
PetroQuest Energy, Inc.
10.000%, 09/01/2017 | | | 18,921,000 | | | | 17,880,345 | | |
Rice Energy, Inc.
6.250%, 05/01/2022 (d) | | | 21,465,000 | | | | 21,411,338 | | |
Warren Resources, Inc.
9.000%, 08/01/2022
(Acquired 08/06/2014 — 12/04/2014,
Cost $14,518,224) (r) | | | 15,131,000 | | | | 7,262,880 | | |
| | | | 176,768,973 | | |
Food — Wholesale — 2.35% | |
Pinnacle Operating Corp.
9.000%, 11/15/2020
(Acquired 09/13/2013 — 06/22/2015,
Cost $24,171,444) (r) | | | 23,318,000 | | | | 23,201,410 | | |
Shearer's Foods LLC/Chip Finance Corp.
9.000%, 11/01/2019
(Acquired 10/24/2012 — 06/22/2015,
Cost $16,772,943) (r) | | | 15,815,000 | | | | 17,080,200 | | |
Wells Enterprises, Inc.
6.750%, 02/01/2020
(Acquired 01/15/2013 — 04/23/2015,
Cost $24,472,100) (r) | | | 23,791,000 | | | | 24,385,775 | | |
| | | | 64,667,385 | | |
| | Principal
Amount | | Value | |
Forestry/Paper — 1.92% | |
Appvion, Inc.
9.000%, 06/01/2020
(Acquired 11/13/2013 — 06/12/2015,
Cost $17,513,514) (i) (r) | | $ | 19,350,000 | | | $ | 12,287,250 | | |
Neenah Paper, Inc.
5.250%, 05/15/2021
(Acquired 05/16/2013 — 06/02/2015,
Cost $20,440,160) (i) (r) | | | 20,348,000 | | | | 20,500,610 | | |
Rayonier AM Products, Inc.
5.500%, 06/01/2024
(Acquired 05/08/2014 — 04/23/2015,
Cost $21,013,149) (r) | | | 22,085,000 | | | | 19,821,287 | | |
| | | | 52,609,147 | | |
Gaming — 2.65% | |
Boyd Gaming Corp.
6.875%, 05/15/2023 | | | 9,005,000 | | | | 9,275,150 | | |
MCE Finance Ltd.
5.000%, 02/15/2021
(Acquired 01/29/2013 — 03/23/2015,
Cost $19,404,690) (r) | | | 19,632,000 | | | | 18,748,560 | | |
MGM Resorts International
7.750%, 03/15/2022 (d) | | | 23,267,000 | | | | 25,710,035 | | |
Wynn Macau Ltd.
5.250%, 10/15/2021
(Acquired 03/13/2014 — 03/11/2015,
Cost $19,938,056) (r) | | | 20,077,000 | | | | 19,073,150 | | |
| | | | 72,806,895 | | |
Gas Distribution — 1.70% | |
Holly Energy Partners LP/Holly Energy
Finance Corp.
6.500%, 03/01/2020 | | | 20,183,000 | | | | 20,233,458 | | |
Niska Gas Storage Canada ULC/Niska Gas
Storage Canada Finance Corp.
6.500%, 04/01/2019 | | | 9,114,000 | | | | 8,612,730 | | |
PBF Logistics LP/PBF Logistics Finance Corp.
6.875%, 05/15/2023
(Acquired 05/07/2015 — 05/29/2015,
Cost $17,823,683) (r) | | | 17,610,000 | | | | 17,786,100 | | |
| | | | 46,632,288 | | |
Health Facilities — 2.43% | |
CHS/Community Health Systems, Inc.
6.875%, 02/01/2022 (d) | | | 16,470,000 | | | | 17,437,613 | | |
HCA, Inc.
6.500%, 02/15/2020 (d) | | | 17,283,000 | | | | 19,356,960 | | |
5.375%, 02/01/2025 | | | 19,890,000 | | | | 20,138,625 | | |
Tenet Healthcare Corp.
6.750%, 06/15/2023
(Acquired 06/02/2015 — 06/16/2015,
Cost $9,603,263) (r) | | | 9,550,000 | | | | 9,758,906 | | |
| | | | 66,692,104 | | |
The accompanying notes are an integral part of these financial statements.
52
Schedule of Investments — June 30, 2015
Hotchkis & Wiley High Yield Fund
| | Principal
Amount | | Value | |
Health Services — 0.30% | |
Universal Hospital Services, Inc.
7.625%, 08/15/2020 | | $ | 8,875,000 | | | $ | 8,209,375 | | |
Machinery — 0.56% | |
Cleaver-Brooks, Inc.
8.750%, 12/15/2019
(Acquired 05/01/2015 — 06/11/2015,
Cost $15,781,462) (r) | | | 15,580,000 | | | | 15,424,200 | | |
Media — Cable — 0.62% | |
Cable One, Inc.
5.750%, 06/15/2022
(Acquired 06/03/2015 — 06/30/2015,
Cost $17,086,510) (r) | | | 16,880,000 | | | | 17,133,200 | | |
Media Content — 1.44% | |
Entercom Radio LLC
10.500%, 12/01/2019 | | | 17,741,000 | | | | 19,115,928 | | |
Townsquare Media, Inc.
6.500%, 04/01/2023
(Acquired 03/24/2015 — 06/17/2015,
Cost $20,589,896) (r) | | | 20,515,000 | | | | 20,386,781 | | |
| | | | 39,502,709 | | |
Medical Products — 2.86% | |
DJO Finco, Inc./DJO Finance LLC/DJO
Finance Corp.
8.125%, 06/15/2021
(Acquired 04/23/2015 — 06/16/2015,
Cost $10,682,414) (r) | | | 10,620,000 | | | | 10,965,150 | | |
Grifols Worldwide Operations Ltd.
5.250%, 04/01/2022 | | | 19,731,000 | | | | 19,829,655 | | |
Halyard Health, Inc.
6.250%, 10/15/2022
(Acquired 10/02/2014 — 04/24/2015,
Cost $18,744,821) (r) | | | 18,204,000 | | | | 19,148,332 | | |
Hologic, Inc.
5.250%, 07/15/2022
(Acquired 06/18/2015,
Cost $7,373,118) (e) (r) | | | 7,341,000 | | | | 7,515,349 | | |
Mallinckrodt International
Finance SA/Mallinckrodt CB LLC
5.750%, 08/01/2022
(Acquired 07/30/2014 — 05/08/2015,
Cost $21,030,850) (r) | | | 20,677,000 | | | | 21,168,079 | | |
| | | | 78,626,565 | | |
| | Principal
Amount | | Value | |
Metals/Mining Excluding Steel — 4.51% | |
Century Aluminum Company
7.500%, 06/01/2021
(Acquired 05/23/2013 — 06/30/2015,
Cost $19,417,454) (r) | | $ | 19,280,000 | | | $ | 19,641,500 | | |
Horsehead Holding Corp.
9.000%, 06/01/2017
(Acquired 07/24/2014 — 01/08/2015,
Cost $8,903,721) (i) (r) | | | 8,845,000 | | | | 8,889,225 | | |
10.500%, 06/01/2017
(Acquired 07/19/2012 — 04/22/2015,
Cost $14,613,574) (i) (r) | | | 14,000,000 | | | | 14,892,500 | | |
Kaiser Aluminum Corp.
8.250%, 06/01/2020 | | | 11,339,000 | | | | 12,302,815 | | |
Noranda Aluminum Acquisition Corp.
11.000%, 06/01/2019 | | | 16,386,000 | | | | 11,715,990 | | |
Rain CII Carbon LLC/CII Carbon Corp.
8.000%, 12/01/2018
(Acquired 11/23/2010 — 04/06/2015,
Cost $12,009,950) (r) | | | 12,110,000 | | | | 11,898,075 | | |
8.250%, 01/15/2021
(Acquired 12/14/2012 — 04/10/2015,
Cost $14,912,478) (r) | | | 14,645,000 | | | | 14,315,487 | | |
Real Alloy Holding, Inc.
10.000%, 01/15/2019
(Acquired 12/23/2014 — 05/05/2015,
Cost $19,682,975) (r) | | | 20,582,000 | | | | 20,993,640 | | |
Shale-Inland Holdings LLC/Shale-Inland
Finance Corp.
8.750%, 11/15/2019
(Acquired 10/26/2012 — 04/20/2015,
Cost $12,104,101) (r) | | | 12,365,000 | | | | 9,335,575 | | |
| | | | 123,984,807 | | |
The accompanying notes are an integral part of these financial statements.
53
Schedule of Investments — June 30, 2015
Hotchkis & Wiley High Yield Fund
| | Principal
Amount | | Value | |
Oil Field Equipment & Services — 4.85% | |
Atwood Oceanics, Inc.
6.500%, 02/01/2020 (d) | | $ | 17,935,000 | | | $ | 17,396,950 | | |
Globe Luxembourg SCA
9.625%, 05/01/2018
(Acquired 05/02/2013 — 03/31/2015,
Cost $13,674,028) (r) | | | 13,756,000 | | | | 13,274,540 | | |
Iracore International Holdings, Inc.
9.500%, 06/01/2018
(Acquired 05/08/2013 — 04/14/2015,
Cost $16,551,294) (i) (r) | | | 18,538,000 | | | | 13,996,190 | | |
McDermott International, Inc.
8.000%, 05/01/2021
(Acquired 04/10/2014 — 03/02/2015,
Cost $20,087,644) (r) | | | 23,296,000 | | | | 21,082,880 | | |
Paragon Offshore PLC
6.750%, 07/15/2022
(Acquired 07/11/2014 — 04/21/2015,
Cost $19,954,337) (r) | | | 24,417,000 | | | | 8,179,695 | | |
PHI, Inc.
5.250%, 03/15/2019 | | | 26,257,000 | | | | 24,419,010 | | |
Shelf Drilling Holdings Ltd.
8.625%, 11/01/2018
(Acquired 10/10/2012 — 03/13/2015,
Cost $15,623,188) (r) | | | 16,487,000 | | | | 14,755,865 | | |
Unit Corp.
6.625%, 05/15/2021 | | | 20,705,000 | | | | 20,187,375 | | |
| | | | 133,292,505 | | |
Oil Refining & Marketing — 1.43% | |
Calumet Specialty Products Partners
LP/Calumet Finance Corp.
6.500%, 04/15/2021 | | | 19,544,000 | | | | 19,348,560 | | |
PBF Holding Company LLC/PBF Finance Corp.
8.250%, 02/15/2020 | | | 18,678,000 | | | | 19,826,697 | | |
| | | | 39,175,257 | | |
Packaging — 1.14% | |
Ball Corp.
5.250%, 07/01/2025 | | | 17,420,000 | | | | 17,311,125 | | |
Silgan Holdings, Inc.
5.500%, 02/01/2022 (d) | | | 13,436,000 | | | | 13,906,260 | | |
| | | | 31,217,385 | | |
Personal & Household Products — 2.56% | |
American Greetings Corp.
7.375%, 12/01/2021 (d) | | | 24,585,000 | | | | 25,906,444 | | |
Central Garden & Pet Company
8.250%, 03/01/2018 | | | 13,993,000 | | | | 14,363,814 | | |
FGI Operating Company LLC/FGI Finance, Inc.
7.875%, 05/01/2020 | | | 17,206,000 | | | | 13,248,620 | | |
Gibson Brands, Inc.
8.875%, 08/01/2018
(Acquired 07/24/2013 — 03/30/2015,
Cost $17,039,742) (r) | | | 16,632,000 | | | | 16,881,480 | | |
| | | | 70,400,358 | | |
| | Principal
Amount | | Value | |
Pharmaceuticals — 1.02% | |
Endo Finance LLC/Endo Ltd./Endo Finco, Inc.
6.000%, 07/15/2023
(Acquired 06/24/2015,
Cost $4,282,000) (e) (r) | | $ | 4,282,000 | | | $ | 4,389,050 | | |
Valeant Pharmaceuticals International, Inc.
6.125%, 04/15/2025
(Acquired 03/13/2015 — 06/15/2015,
Cost $23,271,590) (r) | | | 22,824,000 | | | | 23,565,780 | | |
| | | | 27,954,830 | | |
Printing & Publishing — 0.88% | |
Harland Clarke Holdings Corp.
9.250%, 03/01/2021
(Acquired 01/27/2014 — 06/26/2015,
Cost $26,712,266) (r) | | | 27,070,000 | | | | 24,193,813 | | |
Recreation & Travel — 0.73% | |
Interval Acquisition Corp.
5.625%, 04/15/2023
(Acquired 04/02/2015 — 04/22/2015,
Cost $19,738,778) (r) | | | 19,669,000 | | | | 20,013,208 | | |
Restaurants — 1.24% | |
1011778 BC ULC/New Red Finance, Inc.
6.000%, 04/01/2022
(Acquired 09/24/2014 — 05/08/2015,
Cost $16,767,263) (r) | | | 16,579,000 | | | | 17,076,370 | | |
Ruby Tuesday, Inc.
7.625%, 05/15/2020 (i) | | | 16,392,000 | | | | 16,924,740 | | |
| | | | 34,001,110 | | |
Software/Services — 2.02% | |
ACI Worldwide, Inc.
6.375%, 08/15/2020
(Acquired 08/15/2013 — 05/07/2015,
Cost $12,871,951) (r) | | | 12,539,000 | | | | 13,244,319 | | |
First Data Corp.
8.875%, 08/15/2020
(Acquired 08/11/2010 — 01/28/2015,
Cost $10,537,183) (r) | | | 10,157,000 | | | | 10,702,939 | | |
8.750%, 01/15/2022
(Acquired 11/19/2012 — 12/30/2014,
Cost $13,989,580) (r) | | | 13,477,000 | | | | 14,361,428 | | |
VeriSign, Inc.
5.250%, 04/01/2025
(Acquired 03/24/2015 — 06/29/2015,
Cost $17,391,000) (r) | | | 17,185,000 | | | | 17,185,000 | | |
| | | | 55,493,686 | | |
The accompanying notes are an integral part of these financial statements.
54
Schedule of Investments — June 30, 2015
Hotchkis & Wiley High Yield Fund
| | Principal
Amount | | Value | |
Specialty Retail — 3.91% | |
Argos Merger Sub, Inc.
7.125%, 03/15/2023
(Acquired 02/18/2015 — 06/15/2015,
Cost $20,996,635) (r) | | $ | 20,475,000 | | | $ | 21,498,750 | | |
Chinos Intermediate Holdings A, Inc.
7.750%, 05/01/2019
(Acquired 01/28/2015 — 06/08/2015,
Cost $9,701,255) (p) (r) | | | 11,267,000 | | | | 9,126,270 | | |
CST Brands, Inc.
5.000%, 05/01/2023 | | | 21,826,000 | | | | 21,826,000 | | |
The Men's Wearhouse, Inc.
7.000%, 07/01/2022 | | | 20,306,000 | | | | 21,828,950 | | |
Outerwall, Inc.
5.875%, 06/15/2021 | | | 17,900,000 | | | | 16,826,000 | | |
Quiksilver, Inc./QS Wholesale, Inc.
7.875%, 08/01/2018
(Acquired 07/11/2013 — 05/20/2015,
Cost $16,467,267) (r) | | | 16,744,000 | | | | 14,399,840 | | |
10.000%, 08/01/2020 | | | 4,886,000 | | | | 1,856,680 | | |
| | | | 107,362,490 | | |
Support — Services — 3.89% | |
AECOM
5.875%, 10/15/2024
(Acquired 09/17/2014 — 06/18/2015,
Cost $27,556,947) (r) | | | 26,810,000 | | | | 27,245,662 | | |
Aguila 3 SA
7.875%, 01/31/2018
(Acquired 07/30/2013 — 03/04/2015,
Cost $15,993,826) (r) | | | 15,598,000 | | | | 15,500,512 | | |
Ashtead Capital, Inc.
5.625%, 10/01/2024
(Acquired 09/10/2014 — 06/24/2015,
Cost $23,209,601) (r) | | | 22,655,000 | | | | 22,824,913 | | |
Audatex North America, Inc.
6.125%, 11/01/2023
(Acquired 11/12/2014 — 05/27/2015,
Cost $18,871,225) (r) | | | 18,083,000 | | | | 18,648,094 | | |
The GEO Group, Inc.
5.875%, 10/15/2024 | | | 21,915,000 | | | | 22,682,025 | | |
| | | | 106,901,206 | | |
Technology Hardware & Equipment — 1.18% | |
CDW LLC/CDW Finance Corp.
5.500%, 12/01/2024 | | | 19,823,000 | | | | 19,674,328 | | |
CommScope Holding Company, Inc.
6.625%, 06/01/2020
(Acquired 05/23/2013 — 01/05/2015,
Cost $12,470,080) (p) (r) | | | 12,325,000 | | | | 12,833,406 | | |
| | | | 32,507,734 | | |
| | Principal
Amount | | Value | |
Telecom — Wireless — 1.31% | |
Communications Sales & Leasing, Inc.
8.250%, 10/15/2023
(Acquired 04/16/2015 — 06/18/2015,
Cost $20,585,756) (r) | | $ | 20,610,000 | | | $ | 20,326,613 | | |
Wind Acquisition Finance SA
7.375%, 04/23/2021
(Acquired 04/08/2014 — 04/24/2015,
Cost $15,380,335) (r) | | | 15,487,000 | | | | 15,699,946 | | |
| | | | 36,026,559 | | |
Telecom — Wireline Integrated & Services — 0.26% | |
Sable International Finance Ltd.
8.750%, 02/01/2020
(Acquired 01/20/2012 — 02/03/2015,
Cost $7,058,896) (r) | | | 6,739,000 | | | | 7,244,425 | | |
Telecommunications Equipment — 0.50% | |
CommScope Technologies Finance LLC
6.000%, 06/15/2025
(Acquired 05/28/2015 — 05/29/2015,
Cost $13,694,869) (r) | | | 13,645,000 | | | | 13,627,944 | | |
Total corporate bonds
(Cost $2,349,714,532) | | | | | 2,291,061,269 | | |
ASSET-BACKED SECURITIES — 1.24% | |
Airlines — 1.24% | |
U.S. Airways Pass Through Trust — Class B —
Series 2012-1
8.000%, 10/01/2019 | | | 10,826,790 | | | | 12,274,873 | | |
U.S. Airways Pass Through Trust — Class B —
Series 2012-2
6.750%, 06/03/2021 | | | 20,110,679 | | | | 21,820,087 | | |
| | | | 34,094,960 | | |
Total asset-backed securities
(Cost $33,017,911) | | | | | 34,094,960 | | |
CONVERTIBLE BONDS — 1.13% | |
Auto Parts & Equipment — 0.35% | |
Meritor, Inc.
7.875%, 03/01/2026 | | | 6,089,000 | | | | 9,651,065 | | |
Automakers — 0.35% | |
Navistar International Corp.
4.750%, 04/15/2019 | | | 11,225,000 | | | | 9,660,516 | | |
Energy — Exploration & Production — 0.43% | |
Cobalt International Energy, Inc.
3.125%, 05/15/2024 (d) | | | 16,235,000 | | | | 11,841,403 | | |
Total convertible bonds
(Cost $33,378,913) | | | | | 31,152,984 | | |
The accompanying notes are an integral part of these financial statements.
55
Schedule of Investments — June 30, 2015
Hotchkis & Wiley High Yield Fund
TERM LOANS — 3.50% | | Principal
Amount | | Value | |
Department Stores — 0.92% | |
J.C. Penney Corp., Inc.
6.000%, 05/22/2018 (b) | | $ | 25,224,428 | | | $ | 25,206,393 | | |
Energy — Exploration & Production — 1.27% | |
Fieldwood Energy LLC
8.375%, 09/30/2020 (b) | | | 22,775,000 | | | | 17,547,454 | | |
Jonah Energy LLC
7.500%, 05/12/2021 (b) | | | 18,295,000 | | | | 17,448,856 | | |
| | | | 34,996,310 | | |
Packaging — 0.74% | |
Rexam Healthcare
8.000%, 05/02/2022 (b) | | | 20,227,000 | | | | 20,302,851 | | |
Specialty Retail — 0.33% | |
J.Crew Group, Inc.
4.000%, 03/05/2021 (b) (e) | | | 10,467,318 | | | | 9,051,299 | | |
Telecom — Wireless — 0.24% | |
Cable & Wireless Communications
6.500%, 12/30/2016 (b) (i) | | | 4,500,000 | | | | 4,522,500 | | |
5.500%, 04/28/2017 (b) (i) | | | 2,119,565 | | | | 2,122,215 | | |
| | | | 6,644,715 | | |
Total term loans
(Cost $99,587,516) | | | | | 96,201,568 | | |
CONVERTIBLE
PREFERRED STOCKS — 0.13% | | Shares
Held | | | |
Oil Field Equipment & Services — 0.13% | |
McDermott International, Inc., 6.250% | | | 178,219 | | | | 3,462,795 | | |
Total convertible preferred stocks
(Cost $4,532,955) | | | | | 3,462,795 | | |
PREFERRED STOCKS — 3.40% | |
Banking — 3.34% | |
Citigroup, Inc., 7.125% (b) | | | 734,412 | | | | 20,100,856 | | |
Countrywide Capital V, 7.000% | | | 682,895 | | | | 17,584,546 | | |
Morgan Stanley Capital Trust III, 6.250% | | | 670,695 | | | | 17,122,843 | | |
Morgan Stanley Capital Trust VIII, 6.450% | | | 180,057 | | | | 4,564,445 | | |
Royal Bank of Scotland Group PLC, 6.400% | | | 338,495 | | | | 8,431,911 | | |
Royal Bank of Scotland Group PLC, 6.600% | | | 895,037 | | | | 22,322,223 | | |
Synovus Financial Corp., 7.875% (b) | | | 55,372 | | | | 1,539,065 | | |
| | | | 91,665,889 | | |
Energy — Exploration & Production — 0.06% | |
Lone Pine Resources Canada Ltd. (a) (f) (i) | | | 1,596,813 | | | | 1,548,908 | | |
Lone Pine Resources, Inc. Multiple Voting
Shares (a) (f) (i) | | | 1,596,813 | | | | 0 | | |
| | | | 1,548,908 | | |
Total preferred stocks
(Cost $89,270,151) | | | | | 93,214,797 | | |
COMMON STOCKS — 0.37% | | Shares
Held | | Value | |
Automakers — 0.37% | |
General Motors Company | | | 161,023 | | | $ | 5,366,897 | | |
General Motors Company — Escrow (a) (f) (i) | | | 352,400 | | | | 0 | | |
Motors Liquidation Company GUC Trust (a) | | | 246,813 | | | | 4,751,150 | | |
| | | | 10,118,047 | | |
Energy — Exploration & Production — 0.00% | |
Lone Pine Resources Canada Ltd. (a) (f) (i) | | | 414,738 | | | | 0 | | |
Lone Pine Resources, Inc. (a) (f) (i) | | | 414,738 | | | | 0 | | |
Lone Pine Resources, Inc. — Escrow (a) (f) (i) | | | 3,325,000 | | | | 0 | | |
| | | | 0 | | |
Total common stocks
(Cost $10,771,554) | | | | | 10,118,047 | | |
WARRANTS — 0.12% | |
Automakers — 0.12% | |
General Motors Company (a)
Expiration: July 2016,
Exercise Price: $10.00 | | | 46,747 | | | | 1,111,176 | | |
Expiration: July 2019,
Exercise Price: $18.33 | | | 133,142 | | | | 2,136,929 | | |
Total warrants
(Cost $2,942,685) | | | | | 3,248,105 | | |
Total long-term investments
(Cost $2,623,216,217) | | | | | 2,562,554,525 | | |
SHORT-TERM
INVESTMENTS — 6.14% | | Principal
Amount | | | |
Time Deposits — 6.14% | |
Bank of Montreal, 0.03%, 07/01/2015* | | $ | 168,731,242 | | | | 168,731,242 | | |
Total short-term investments
(Cost $168,731,242) | | | 168,731,242 | | |
Total investments — 99.46%
(Cost $2,791,947,459) | | | | | 2,731,285,767 | | |
Other assets in excess of liabilities — 0.54% | | | | | 14,927,917 | | |
Net assets — 100.00% | | $ | 2,746,213,684 | | |
(a) — Non-income producing security.
(b) — The coupon rate shown on variable rate securities represents the rate at June 30, 2015.
(d) — All or a portion of this security is segregated as collateral for bridge loan commitments, credit default swap contracts and delayed delivery securities.
(e) — Delayed delivery security.
(f) — Security was fair valued under guidelines established by and under the general supervision and responsibility of the Trust's Board of Trustees. The total market value of these securities was $1,548,908, which represented 0.06% of net assets. See Security Valuation in Note 1 in Notes to the Financial Statements.
(i) — Illiquid security.
(p) — Payment in-kind security.
The accompanying notes are an integral part of these financial statements.
56
Schedule of Investments — June 30, 2015
Hotchkis & Wiley High Yield Fund
(r) — Restricted security under Rule 144A of the Securities Act of 1933. Purchased in a private placement transaction; resale to the public may require registration or be limited to qualified institutional buyers. The total market value of these securities was $1,375,823,819, which represented 50.10% of net assets.
* — Invested through a cash management account administered by Brown Brothers Harriman & Co.
Schedule of Credit Default Swap Contracts — June 30, 2015
Hotchkis & Wiley High Yield Fund
CREDIT DEFAULT SWAP CONTRACTS — SELL PROTECTION(1) | |
Reference Entity | | Counterparty | | Receive
Fixed Rate | | Expiration
Date | | Notional
Amount(2) | | Premiums Paid
(Received) | | Value(3) | | Unrealized
Appreciation
(Depreciation) | |
Markit CDX.NA.HY.24 | | Goldman Sachs International(4) | | | 5.00 | % | | 6/20/20 | | $ | (9,900,000 | ) | | $ | 573,354 | | | $ | 636,144 | | | $ | 62,790 | | |
(1) The buyer of protection is obligated to pay the seller a periodic stream of payments over the term of the contract provided no event of default occurs. If a credit event occurs, as defined under the terms of that particular swap agreement, the seller will either (i) pay to the buyer of protection an amount equal to the notional amount of the swap and take delivery of the referenced entity or underlying securities comprising the referenced index or (ii) pay a net settlement amount in the form of cash or securities equal to the notional amount of the swap less the recovery value of the referenced entity or underlying securities comprising the referenced index.
(2) The maximum potential payment the Fund could receive as a buyer or pay as a seller of credit protection if a credit event occurs as defined under the terms of the swap agreement.
(3) The prices and resulting values for credit default swap agreements on credit indices serve as an indicator of the current status of the payment/performance risk and represent the likelihood of an expected liability (or profit) for the credit derivative should the notional amount of the swap agreement be closed/sold as of the period end. Increasing market values, in absolute terms when compared to the notional amount of the swap, represent a deterioration of the referenced entity's credit soundness and a greater likelihood or risk of default or other credit event occurring as defined under the terms of the agreement.
(4) Moody's rating of Goldman Sachs International, the counterparty, as of June 30, 2015 was A3.
The accompanying notes are an integral part of these financial statements.
57
Statements of Assets & Liabilities
JUNE 30, 2015
| | | Diversified Value
Fund | | Large Cap Value
Fund | | Mid-Cap Value
Fund | | Small Cap Value
Fund | | Small Cap
Diversified Value
Fund | |
Assets: | |
Long-term investments, at value* | |
Unaffiliated issuers | | $ | 533,400,102 | | | $ | 708,777,624 | | | $ | 3,100,003,465 | | | $ | 1,053,512,588 | | | $ | 15,287,444 | | |
Affiliated issuers | | | — | | | | — | | | | 187,354,582 | | | | 96,911,275 | | | | — | | |
Collateral for securities on loan* | | | 5,985,033 | | | | 7,895,512 | | | | 39,991,213 | | | | 45,944,634 | | | | — | | |
Short-term investments* | | | 3,441,985 | | | | 13,581,314 | | | | 2,751,199 | | | | 33,922,760 | | | | 170,550 | | |
Dividends and interest receivable | | | 1,245,069 | | | | 1,888,607 | | | | 3,112,943 | | | | 486,944 | | | | 14,752 | | |
Receivable for investments sold | | | 2,974,847 | | | | 2,518,830 | | | | 15,476,695 | | | | 6,365,765 | | | | — | | |
Receivable for Fund shares sold | | | 761,712 | | | | 1,218,702 | | | | 5,900,401 | | | | 3,493,174 | | | | — | | |
Receivable from Advisor | | | — | | | | — | | | | — | | | | — | | | | 17,236 | | |
Other assets | | | 21,175 | | | | 42,606 | | | | 108,718 | | | | 49,974 | | | | 14,410 | | |
Total assets | | $ | 547,829,923 | | | $ | 735,923,195 | | | $ | 3,354,699,216 | | | $ | 1,240,687,114 | | | $ | 15,504,392 | | |
Liabilities: | |
Collateral upon return of securities on loan | | $ | 5,985,033 | | | $ | 7,895,512 | | | $ | 39,991,213 | | | $ | 45,944,634 | | | $ | — | | |
Payable for investments purchased | | | 2,125,532 | | | | 1,103,333 | | | | 35,406,644 | | | | 11,120,611 | | | | — | | |
Payable for Fund shares repurchased | | | 222,826 | | | | 928,039 | | | | 8,939,970 | | | | 703,926 | | | | — | | |
Payable to Advisor | | | 291,482 | | | | 457,056 | | | | 2,096,834 | | | | 743,960 | | | | — | | |
Payable to Trustees | | | 112 | | | | 150 | | | | 730 | | | | 250 | | | | 6 | | |
Accrued distribution and service fees | | | 66,249 | | | | 387,976 | | | | 759,570 | | | | 211,744 | | | | 257 | | |
Accrued expenses and other liabilities | | | 152,409 | | | | 269,221 | | | | 1,098,751 | | | | 291,401 | | | | 37,055 | | |
Total liabilities | | | 8,843,643 | | | | 11,041,287 | | | | 88,293,712 | | | | 59,016,526 | | | | 37,318 | | |
Commitments and contingencies (Note 8) | | | | | | | | | | | |
Net assets | | $ | 538,986,280 | | | $ | 724,881,908 | | | $ | 3,266,405,504 | | | $ | 1,181,670,588 | | | $ | 15,467,074 | | |
Net Assets consist of: | |
Paid-in capital | | $ | 1,160,054,346 | | | $ | 1,788,454,251 | | | $ | 2,950,101,373 | | | $ | 1,005,766,914 | | | $ | 14,996,869 | | |
Undistributed net investment income | | | 6,224,082 | | | | 9,065,264 | | | | 3,642,385 | | | | 3,005,664 | | | | 17,795 | | |
Undistributed net realized gain (loss) | | | (633,661,526 | ) | | | (1,058,151,925 | ) | | | 198,242,870 | | | | 63,051,183 | | | | 587,732 | | |
Net unrealized appreciation (depreciation) of securities and
foreign currency transactions | | | 6,369,378 | | | | (14,485,682 | ) | | | 114,418,876 | | | | 109,846,827 | | | | (135,322 | ) | |
Net assets | | $ | 538,986,280 | | | $ | 724,881,908 | | | $ | 3,266,405,504 | | | $ | 1,181,670,588 | | | $ | 15,467,074 | | |
Calculation of Net Asset Value Per Share and
Public Offering Price Per Share — Class I | |
Net assets | | $ | 481,814,688 | | | $ | 479,488,190 | | | $ | 2,492,532,018 | | | $ | 951,911,442 | | | $ | 15,337,148 | | |
Shares outstanding (unlimited shares $0.001 par value authorized) | | | 30,322,276 | | | | 17,621,061 | | | | 61,644,318 | | | | 15,435,785 | | | | 1,531,824 | | |
Net asset value per share | | $ | 15.89 | | | $ | 27.21 | | | $ | 40.43 | | | $ | 61.67 | | | $ | 10.01 | | |
Calculation of Net Asset Value Per Share — Class A | |
Net assets | | $ | 52,752,204 | | | $ | 191,665,040 | | | $ | 626,544,274 | | | $ | 194,587,080 | | | $ | 129,926 | | |
Shares outstanding (unlimited shares $0.001 par value authorized) | | | 3,313,723 | | | | 7,092,691 | | | | 15,698,945 | | | | 3,176,094 | | | | 12,991 | | |
Net asset value per share | | $ | 15.92 | | | $ | 27.02 | | | $ | 39.91 | | | $ | 61.27 | | | $ | 10.00 | | |
Public Offering Price Per Share — Class A | |
(Net asset value per share divided by 0.9475) | | $ | 16.80 | | | $ | 28.52 | | | $ | 42.12 | | | $ | 64.66 | | | $ | 10.55 | | |
Calculation of Net Asset Value Per Share and
Public Offering Price Per Share — Class C | |
Net assets | | $ | 4,419,388 | | | $ | 40,861,852 | | | $ | 128,646,700 | | | $ | 35,172,066 | | | | | | |
Shares outstanding (unlimited shares $0.001 par value authorized) | | | 280,382 | | | | 1,553,690 | | | | 3,549,397 | | | | 660,495 | | | | | | |
Net asset value per share | | $ | 15.76 | | | $ | 26.30 | | | $ | 36.24 | | | $ | 53.25 | | | | | | |
Calculation of Net Asset Value Per Share and
Public Offering Price Per Share — Class R | |
Net assets | | | | | | $ | 12,866,826 | | | $ | 18,682,512 | | | | | | | | | | |
Shares outstanding (unlimited shares $0.001 par value authorized) | | | | | | | 473,689 | | | | 466,543 | | | | | | | | | | |
Net asset value per share | | | | | | $ | 27.16 | | | $ | 40.04 | | | | | | | | | | |
*Cost of long-term investments | |
Unaffiliated issuers | | $ | 527,030,724 | | | $ | 723,263,306 | | | $ | 2,893,123,892 | | | $ | 920,497,224 | | | $ | 15,422,766 | | |
Affiliated issuers | | | — | | | | — | | | | 279,815,280 | | | | 120,079,200 | | | | — | | |
*Cost of collateral for securities on loan | | | 5,985,033 | | | | 7,895,512 | | | | 39,991,213 | | | | 45,944,634 | | | | — | | |
*Cost of short-term investments | | | 3,441,985 | | | | 13,581,314 | | | | 2,751,198 | | | | 33,922,760 | | | | 170,550 | | |
The accompanying notes are an integral part of these financial statements.
58
Statements of Assets & Liabilities
JUNE 30, 2015
| | | Global Value
Fund | | Value Opportunities
Fund | | Capital Income
Fund | | High Yield
Fund | |
Assets: | |
Long-term investments, at value* | | $ | 6,251,387 | | | $ | 636,047,719 | | | $ | 74,339,944 | | | $ | 2,562,554,525 | | |
Collateral for securities on loan* | | | — | | | | 6,060,485 | | | | — | | | | — | | |
Short-term investments* | | | 28,446 | | | | 4,856,538 | | | | 1,665,180 | | | | 168,731,242 | | |
Premiums paid for credit default swap contracts | | | — | | | | — | | | | — | | | | 573,354 | | |
Unrealized appreciation on credit default swap contracts | | | — | | | | — | | | | — | | | | 62,790 | | |
Cash collateral for futures | | | — | | | | 2,325,067 | | | | — | | | | — | | |
Dividends and interest receivable | | | 12,296 | | | | 1,459,307 | | | | 657,308 | | | | 41,180,912 | | |
Receivable for investments sold | | | 92,241 | | | | 1,702,346 | | | | 68,272 | | | | 441,527 | | |
Receivable from broker for credit default swap contracts | | | — | | | | — | | | | — | | | | 35,330 | | |
Receivable for variation margin | | | — | | | | 199,361 | | | | — | | | | — | | |
Receivable for Fund shares sold | | | 566 | | | | 1,952,284 | | | | 193,680 | | | | 5,853,728 | | |
Receivable from Advisor | | | 10,146 | | | | — | | | | — | | | | — | | |
Other assets | | | 8,960 | | | | 22,460 | | | | 21,275 | | | | 80,484 | | |
Total assets | | $ | 6,404,042 | | | $ | 654,625,567 | | | $ | 76,945,659 | | | $ | 2,779,513,892 | | |
Liabilities: | |
Collateral upon return of securities on loan | | $ | — | | | $ | 6,060,485 | | | $ | — | | | $ | — | | |
Payable for investments purchased | | | 117,167 | | | | 5,112,971 | | | | 204,282 | | | | 23,543,899 | | |
Payable for variation margin | | | — | | | | 11,250 | | | | — | | | | — | | |
Payable for Fund shares repurchased | | | — | | | | 1,061,287 | | | | 209,268 | | | | 4,488,039 | | |
Payable to Advisor | | | — | | | | 398,944 | | | | 23,278 | | | | 1,229,600 | | |
Payable to Trustees | | | 1 | | | | 140 | | | | 15 | | | | 579 | | |
Accrued distribution and service fees | | | 382 | | | | 333,861 | | | | 22,561 | | | | 362,722 | | |
Distributions payable to shareholders | | | — | | | | — | | | | 70,557 | | | | 3,062,197 | | |
Accrued expenses and other liabilities | | | 32,570 | | | | 159,382 | | | | 59,595 | | | | 613,172 | | |
Total liabilities | | | 150,120 | | | | 13,138,320 | | | | 589,556 | | | | 33,300,208 | | |
Commitments and contingencies (Note 8) | | | | | | | | | |
Net assets | | $ | 6,253,922 | | | $ | 641,487,247 | | | $ | 76,356,103 | | | $ | 2,746,213,684 | | |
Net Assets consist of: | |
Paid-in capital | | $ | 5,955,382 | | | $ | 564,506,468 | | | $ | 74,285,605 | | | $ | 2,786,648,413 | | |
| Undistributed net investment income | | | 35,787 | | | | 2,032,018 | | | | 131,324 | | | | 77,357 | | |
| Undistributed net realized gain | | | 198,412 | | | | 69,699,202 | | | | 638,291 | | | | 20,086,816 | | |
Net unrealized appreciation (depreciation) of: | |
Securities and foreign currency transactions | | | 64,341 | | | | 5,843,802 | | | | 1,300,883 | | | | (60,661,692 | ) | |
Credit default swap contracts | | | — | | | | — | | | | — | | | | 62,790 | | |
Futures contracts | | | — | | | | (594,243 | ) | | | — | | | | — | | |
Net assets | | $ | 6,253,922 | | | $ | 641,487,247 | | | $ | 76,356,103 | | | $ | 2,746,213,684 | | |
Calculation of Net Asset Value Per Share and
Public Offering Price Per Share — Class I | |
Net assets | | $ | 6,144,200 | | | $ | 363,362,624 | | | $ | 33,958,237 | | | $ | 2,060,504,042 | | |
Shares outstanding (unlimited shares $0.001 par value authorized) | | | 515,094 | | | | 12,474,174 | | | | 2,777,779 | | | | 164,766,439 | | |
Net asset value per share | | $ | 11.93 | | | $ | 29.13 | | | $ | 12.22 | | | $ | 12.51 | | |
Calculation of Net Asset Value Per Share — Class A | |
Net assets | | $ | 109,722 | | | $ | 201,477,370 | | | $ | 42,397,866 | | | $ | 682,128,884 | | |
Shares outstanding (unlimited shares $0.001 par value authorized) | | | 9,213 | | | | 6,917,560 | | | | 3,350,465 | | | | 54,872,404 | | |
Net asset value per share | | $ | 11.91 | | | $ | 29.13 | | | $ | 12.65 | | | $ | 12.43 | | |
Public Offering Price Per Share — Class A | |
(Net asset value per share divided by 0.9475) | | $ | 12.57 | | | $ | 30.74 | | | | | | | | | | |
(Net asset value per share divided by 0.9525) | | | | | | | | | | $ | 13.28 | | | | | | |
(Net asset value per share divided by 0.9625) | | | | | | | | | | | | | | $ | 12.91 | | |
Calculation of Net Asset Value Per Share and
Public Offering Price Per Share — Class C | |
Net assets | | | | | | $ | 76,647,253 | | | | | | | $ | 3,580,758 | | |
Shares outstanding (unlimited shares $0.001 par value authorized) | | | | | | | 2,796,833 | | | | | | | | 286,561 | | |
Net asset value per share | | | | | | $ | 27.41 | | | | | | | $ | 12.50 | | |
*Cost of long-term investments | | $ | 6,187,057 | | | $ | 630,203,218 | | | $ | 73,039,061 | | | $ | 2,623,216,217 | | |
*Cost of collateral for securities on loan | | | — | | | | 6,060,485 | | | | — | | | | — | | |
*Cost of short-term investments | | | 28,446 | | | | 4,856,537 | | | | 1,665,180 | | | | 168,731,242 | | |
The accompanying notes are an integral part of these financial statements.
59
Statements of Operations
FOR THE YEAR ENDED JUNE 30, 2015
| | | Diversified Value
Fund | | Large Cap Value
Fund | | Mid-Cap Value
Fund | | Small Cap Value
Fund | | Small Cap
Diversified Value
Fund | |
Investment income: | |
Dividends* | |
Unaffiliated issuers | | $ | 11,538,009 | | | $ | 17,621,893 | | | $ | 44,396,428 | | | $ | 15,496,666 | | | $ | 140,354 | | |
Affiliated issuers | | | — | | | | — | | | | 799,175 | | | | 685,197 | | | | — | | |
Interest | | | 2,402 | | | | 4,357 | | | | 32,024 | | | | 7,889 | | | | 42 | | |
Securities on loan | | | 26,373 | | | | 42,113 | | | | 280,105 | | | | 102,083 | | | | — | | |
Total income | | | 11,566,784 | | | | 17,668,363 | | | | 45,507,732 | | | | 16,291,835 | | | | 140,396 | | |
Expenses: | |
Advisory fees | | | 4,071,122 | | | | 5,779,564 | | | | 25,412,337 | | | | 8,148,774 | | | | 60,866 | | |
Professional fees and expenses | | | 36,808 | | | | 42,175 | | | | 99,540 | | | | 47,223 | | | | 25,884 | | |
Custodian fees and expenses | | | 68,424 | | | | 97,890 | | | | 107,908 | | | | 32,760 | | | | 26,253 | | |
Transfer agent fees and expenses | | | 764,286 | | | | 1,165,948 | | | | 5,923,390 | | | | 2,557,516 | | | | 26,359 | | |
Accounting fees and expenses | | | 65,344 | | | | 88,492 | | | | 365,923 | | | | 122,690 | | | | 55,434 | | |
Administration fees and expenses | | | 151,085 | | | | 213,909 | | | | 940,198 | | | | 301,248 | | | | 30,737 | | |
Trustees' fees and expenses | | | 32,975 | | | | 47,199 | | | | 208,080 | | | | 63,262 | | | | 283 | | |
Reports to shareholders | | | 61,337 | | | | 96,023 | | | | 340,553 | | | | 160,007 | | | | 5,674 | | |
Registration fees | | | 68,890 | | | | 92,059 | | | | 175,818 | | | | 93,441 | | | | 37,731 | | |
Distribution and service fees — Class A | | | 139,510 | | | | 507,013 | | | | 1,860,797 | | | | 484,066 | | | | 268 | | |
Distribution and service fees — Class C | | | 45,981 | | | | 364,944 | | | | 1,422,537 | | | | 379,251 | | | | — | | |
Distribution and service fees — Class R | | | — | | | | 64,182 | | | | 110,321 | | | | — | | | | — | | |
Offering costs | | | — | | | | — | | | | — | | | | — | | | | 33,242 | | |
Other expenses | | | 29,275 | | | | 42,300 | | | | 160,562 | | | | 50,847 | | | | 1,989 | | |
Total expenses | | | 5,535,037 | | | | 8,601,698 | | | | 37,127,964 | | | | 12,441,085 | | | | 304,720 | | |
Fee waiver/expense reimbursement by Advisor (Note 2) | | | (192,791 | ) | | | — | | | | — | | | | — | | | | (165,509 | ) | |
Fee waiver by Administrator (Note 2) | | | — | | | | — | | | | — | | | | — | | | | (37,500 | ) | |
Net expenses | | | 5,342,246 | | | | 8,601,698 | | | | 37,127,964 | | | | 12,441,085 | | | | 101,711 | | |
Net investment income | | | 6,224,538 | | | | 9,066,665 | | | | 8,379,768 | | | | 3,850,750 | | | | 38,685 | | |
Realized and Unrealized Gains (Losses): | |
Net realized gains (losses) from: | |
Sales of unaffiliated issuers | | | 66,912,026 | | | | 81,576,332 | | | | 300,121,319 | | | | 96,919,372 | | | | 119,874 | | |
Sales of affiliated issuers | | | — | | | | — | | | | (7,440,242 | ) | | | 4,104,522 | | | | — | | |
Foreign currency transactions | | | (456 | ) | | | (661 | ) | | | (56,925 | ) | | | (17,864 | ) | | | — | | |
Net realized gains | | | 66,911,570 | | | | 81,575,671 | | | | 292,624,152 | | | | 101,006,030 | | | | 119,874 | | |
Net change in unrealized depreciation of securities and
foreign currency transactions | | | (45,156,726 | ) | | | (50,911,252 | ) | | | (341,212,577 | ) | | | (54,701,875 | ) | | | (135,322 | ) | |
Net gains (losses) | | | 21,754,844 | | | | 30,664,419 | | | | (48,588,425 | ) | | | 46,304,155 | | | | (15,448 | ) | |
Net Increase (Decrease) in Net Assets Resulting
from Operations | | $ | 27,979,382 | | | $ | 39,731,084 | | | $ | (40,208,657 | ) | | $ | 50,154,905 | | | $ | 23,237 | | |
*Net of Foreign Taxes Withheld | | $ | 253,392 | | | $ | 379,457 | | | $ | 54,485 | | | $ | 111,424 | | | $ | 43 | | |
The accompanying notes are an integral part of these financial statements.
60
Statements of Operations
FOR THE YEAR ENDED JUNE 30, 2015
| | | Global Value
Fund | | Value Opportunities
Fund | | Capital Income
Fund | | High Yield
Fund | |
Investment income: | |
Dividends* | | $ | 115,413 | | | $ | 8,272,845 | | | $ | 1,554,447 | | | $ | 6,237,815 | | |
Interest | | | 80 | | | | 5,194,466 | | | | 1,844,446 | | | | 131,403,560 | | |
Securities on loan | | | — | | | | 7,082 | | | | — | | | | — | | |
Total income | | | 115,493 | | | | 13,474,393 | | | | 3,398,893 | | | | 137,641,375 | | |
Expenses: | |
Advisory fees | | | 41,779 | | | | 4,223,845 | | | | 493,044 | | | | 12,094,609 | | |
Professional fees and expenses | | | 23,627 | | | | 35,031 | | | | 24,988 | | | | 80,962 | | |
Custodian fees and expenses | | | 16,260 | | | | 61,427 | | | | 35,143 | | | | 66,731 | | |
Transfer agent fees and expenses | | | 25,672 | | | | 711,084 | | | | 98,982 | | | | 2,354,574 | | |
Accounting fees and expenses | | | 43,910 | | | | 70,430 | | | | 65,275 | | | | 267,559 | | |
Administration fees and expenses | | | 31,317 | | | | 156,661 | | | | 28,217 | | | | 608,059 | | |
Trustees' fees and expenses | | | 294 | | | | 32,484 | | | | 4,417 | | | | 124,063 | | |
Reports to shareholders | | | 2,748 | | | | 39,075 | | | | 8,283 | | | | 120,620 | | |
Registration fees | | | 37,697 | | | | 69,804 | | | | 41,841 | | | | 129,518 | | |
Distribution and service fees — Class A | | | 306 | | | | 446,167 | | | | 118,581 | | | | 1,555,208 | | |
Distribution and service fees — Class C | | | — | | | | 645,074 | | | | — | | | | 38,854 | | |
Other expenses | | | 3,506 | | | | 24,822 | | | | 5,637 | | | | 87,879 | | |
Total expenses | | | 227,116 | | | | 6,515,904 | | | | 924,408 | | | | 17,528,636 | | |
Fee waiver/expense reimbursement by Advisor (Note 2) | | | (169,364 | ) | | | — | | | | (199,004 | ) | | | (541,435 | ) | |
Net expenses | | | 57,752 | | | | 6,515,904 | | | | 725,404 | | | | 16,987,201 | | |
Net investment income | | | 57,741 | | | | 6,958,489 | | | | 2,673,489 | | | | 120,654,174 | | |
Realized and Unrealized Gains (Losses): | |
Net realized gains (losses) from: | |
Sales of unaffiliated issuers | | | 299,482 | | | | 79,106,845 | | | | 947,662 | | | | 20,453,176 | | |
Sales of affiliated issuers | | | — | | | | 5,310,866 | | | | — | | | | — | | |
Foreign currency transactions | | | (2,183 | ) | | | (243,617 | ) | | | (30 | ) | | | — | | |
Credit default swap contracts | | | — | | | | — | | | | 36,200 | | | | 1,771,451 | | |
Futures contracts | | | — | | | | 8,844,916 | | | | — | | | | — | | |
Net realized gains | | | 297,299 | | | | 93,019,010 | | | | 983,832 | | | | 22,224,627 | | |
Net change in unrealized appreciation (depreciation) of: | |
Securities and foreign currency transactions | | | (411,497 | ) | | | (63,415,838 | ) | | | (2,986,899 | ) | | | (132,844,795 | ) | |
Credit default swap contracts | | | — | | | | — | | | | — | | | | 62,790 | | |
Futures contracts | | | — | | | | (594,243 | ) | | | — | | | | — | | |
Net change in unrealized depreciation | | | (411,497 | ) | | | (64,010,081 | ) | | | (2,986,899 | ) | | | (132,782,005 | ) | |
Net gains (losses) | | | (114,198 | ) | | | 29,008,929 | | | | (2,003,067 | ) | | | (110,557,378 | ) | |
Net Increase (Decrease) in Net Assets Resulting from Operations | | $ | (56,457 | ) | | $ | 35,967,418 | | | $ | 670,422 | | | $ | 10,096,796 | | |
*Net of Foreign Taxes Withheld | | $ | 8,235 | | | $ | 485,944 | | | $ | 31,999 | | | $ | 27,725 | | |
The accompanying notes are an integral part of these financial statements.
61
Statements of Changes in Net Assets
| | | Diversified Value Fund | | Large Cap Value Fund | |
| | | Year ended
June 30, 2015 | | Year ended
June 30, 2014 | | Year ended
June 30, 2015 | | Year ended
June 30, 2014 | |
Operations: | |
Net investment income | | $ | 6,224,538 | | | $ | 12,803,817 | | | $ | 9,066,665 | | | $ | 21,716,658 | | |
Net realized gains | | | 66,911,570 | | | | 33,419,573 | | | | 81,575,671 | | | | 85,951,132 | | |
Net change in unrealized appreciation (depreciation) | | | (45,156,726 | ) | | | 58,448,071 | | | | (50,911,252 | ) | | | 58,457,075 | | |
Net increase in net assets resulting from operations | | | 27,979,382 | | | | 104,671,461 | | | | 39,731,084 | | | | 166,124,865 | | |
Dividends and Distributions to Shareholders: | |
Net investment income: | |
Class I | | | (11,538,580 | ) | | | (4,908,742 | ) | | | (14,945,124 | ) | | | (5,604,965 | ) | |
Class A | | | (1,240,124 | ) | | | (481,382 | ) | | | (5,638,158 | ) | | | (2,288,711 | ) | |
Class C | | | (25,227 | ) | | | (44,726 | ) | | | (827,500 | ) | | | — | | |
Class R | | | — | | | | — | | | | (306,615 | ) | | | (90,380 | ) | |
Net realized gains: | |
Class I | | | — | | | | — | | | | — | | | | — | | |
Class A | | | — | | | | — | | | | — | | | | — | | |
Class C | | | — | | | | — | | | | — | | | | — | | |
Class R | | | — | | | | — | | | | — | | | | — | | |
Net decrease in net assets resulting from dividends and
distributions to shareholders | | | (12,803,931 | ) | | | (5,434,850 | ) | | | (21,717,397 | ) | | | (7,984,056 | ) | |
Capital Share Transactions: | |
Net increase (decrease) in net assets resulting from capital share
transactions | | | (25,332,350 | ) | | | 34,878,129 | | | | (54,141,813 | ) | | | 39,371,206 | | |
Net Assets: | |
Total increase (decrease) in net assets | | | (10,156,899 | ) | | | 134,114,740 | | | | (36,128,126 | ) | | | 197,512,015 | | |
Beginning of year | | | 549,143,179 | | | | 415,028,439 | | | | 761,010,034 | | | | 563,498,019 | | |
End of year | | $ | 538,986,280 | | | $ | 549,143,179 | | | $ | 724,881,908 | | | $ | 761,010,034 | | |
Undistributed net investment income | | $ | 6,224,082 | | | $ | 12,803,931 | | | $ | 9,065,264 | | | $ | 21,716,657 | | |
The accompanying notes are an integral part of these financial statements.
62
Statements of Changes in Net Assets
| | | Mid-Cap Value Fund | | Small Cap Value Fund | |
| | | Year ended
June 30, 2015 | | Year ended
June 30, 2014 | | Year ended
June 30, 2015 | | Year ended
June 30, 2014 | |
Operations: | |
Net investment income | | $ | 8,379,768 | | | $ | 12,058,683 | | | $ | 3,850,750 | | | $ | 860,820 | | |
Net realized gains | | | 292,624,152 | | | | 406,312,115 | | | | 101,006,030 | | | | 121,667,369 | | |
Net change in unrealized appreciation (depreciation) | | | (341,212,577 | ) | | | 275,181,109 | | | | (54,701,875 | ) | | | 96,717,775 | | |
Net increase (decrease) in net assets resulting from operations | | | (40,208,657 | ) | | | 693,551,907 | | | | 50,154,905 | | | | 219,245,964 | | |
Dividends and Distributions to Shareholders: | |
Net investment income: | |
Class I | | | (14,081,522 | ) | | | (6,148,056 | ) | | | (1,581,401 | ) | | | (1,868,145 | ) | |
Class A | | | (2,526,377 | ) | | | (1,367,862 | ) | | | — | | | | (462,993 | ) | |
Class C | | | — | | | | (115,505 | ) | | | — | | | | (27,101 | ) | |
Class R | | | (35,928 | ) | | | (22,467 | ) | | | — | | | | — | | |
Net realized gains: | |
Class I | | | (209,828,890 | ) | | | — | | | | (92,773,672 | ) | | | (46,665,876 | ) | |
Class A | | | (68,572,878 | ) | | | — | | | | (21,621,104 | ) | | | (14,109,950 | ) | |
Class C | | | (14,212,255 | ) | | | — | | | | (4,750,207 | ) | | | (3,583,146 | ) | |
Class R | | | (2,041,591 | ) | | | — | | | | — | | | | — | | |
Net decrease in net assets resulting from dividends and
distributions to shareholders | | | (311,299,441 | ) | | | (7,653,890 | ) | | | (120,726,384 | ) | | | (66,717,211 | ) | |
Capital Share Transactions: | |
Net increase in net assets resulting from capital share transactions | | | 33,871,751 | | | | 791,433,219 | | | | 218,961,094 | | | | 295,975,809 | | |
Net Assets: | |
Total increase (decrease) in net assets | | | (317,636,347 | ) | | | 1,477,331,236 | | | | 148,389,615 | | | | 448,504,562 | | |
Beginning of year | | | 3,584,041,851 | | | | 2,106,710,615 | | | | 1,033,280,973 | | | | 584,776,411 | | |
End of year | | $ | 3,266,405,504 | | | $ | 3,584,041,851 | | | $ | 1,181,670,588 | | | $ | 1,033,280,973 | | |
Undistributed net investment income | | $ | 3,642,385 | | | $ | 11,963,369 | | | $ | 3,005,664 | | | $ | 811,351 | | |
The accompanying notes are an integral part of these financial statements.
63
Statements of Changes in Net Assets
| | | Small Cap
Diversified Value Fund | | Global Value Fund | |
| | | Year ended
June 30, 2015+ | | Year ended
June 30, 2015 | | Year ended
June 30, 2014 | |
Operations: | |
Net investment income | | $ | 38,685 | | | $ | 57,741 | | | $ | 104,154 | | |
Net realized gains | | | 119,874 | | | | 297,299 | | | | 254,749 | | |
Net change in unrealized appreciation (depreciation) | | | (135,322 | ) | | | (411,497 | ) | | | 316,395 | | |
Net increase (decrease) in net assets resulting from operations | | | 23,237 | | | | (56,457 | ) | | | 675,298 | | |
Dividends and Distributions to Shareholders: | |
Net investment income: | |
Class I | | | (23,732 | ) | | | (111,362 | ) | | | (35,894 | ) | |
Class A | | | (337 | ) | | | (3,011 | ) | | | (955 | ) | |
Net realized gains: | |
Class I | | | (119,160 | ) | | | (283,232 | ) | | | (181,345 | ) | |
Class A | | | (2,242 | ) | | | (8,484 | ) | | | (5,087 | ) | |
Net decrease in net assets resulting from dividends and
distributions to shareholders | | | (145,471 | ) | | | (406,089 | ) | | | (223,281 | ) | |
Capital Share Transactions: | |
Net increase in net assets resulting from capital share transactions | | | 15,589,308 | | | | 2,712,326 | | | | 1,528,088 | | |
Net Assets: | |
Total increase in net assets | | | 15,467,074 | | | | 2,249,780 | | | | 1,980,105 | | |
Beginning of year | | | — | | | | 4,004,142 | | | | 2,024,037 | | |
End of year | | $ | 15,467,074 | | | $ | 6,253,922 | | | $ | 4,004,142 | | |
Undistributed net investment income | | $ | 17,795 | | | $ | 35,787 | | | $ | 94,602 | | |
+ The Fund commenced operations on June 30, 2014.
The accompanying notes are an integral part of these financial statements.
64
Statements of Changes in Net Assets
| | | Value Opportunities Fund | | Capital Income Fund | |
| | | Year ended
June 30, 2015 | | Year ended
June 30, 2014 | | Year ended
June 30, 2015 | | Year ended
June 30, 2014 | |
Operations: | |
Net investment income | | $ | 6,958,489 | | | $ | 3,428,013 | | | $ | 2,673,489 | | | $ | 1,526,324 | | |
Net realized gains | | | 93,019,010 | | | | 27,444,439 | | | | 983,832 | | | | 1,558,561 | | |
Net change in unrealized appreciation (depreciation) | | | (64,010,081 | ) | | | 45,551,330 | | | | (2,986,899 | ) | | | 2,626,185 | | |
Net increase in net assets resulting from operations | | | 35,967,418 | | | | 76,423,782 | | | | 670,422 | | | | 5,711,070 | | |
Dividends and Distributions to Shareholders: | |
Net investment income: | |
Class I | | | (4,493,870 | ) | | | (1,119,363 | ) | | | (1,145,276 | ) | | | (545,563 | ) | |
Class A | | | (2,221,897 | ) | | | (859,974 | ) | | | (1,779,729 | ) | | | (693,473 | ) | |
Class C | | | (453,054 | ) | | | (72,346 | ) | | | — | | | | — | | |
Net realized gains: | |
Class I | | | (22,317,258 | ) | | | (7,936,180 | ) | | | (387,273 | ) | | | (635,662 | ) | |
Class A | | | (13,002,279 | ) | | | (7,803,482 | ) | | | (772,864 | ) | | | (707,583 | ) | |
Class C | | | (4,700,078 | ) | | | (2,221,386 | ) | | | — | | | | — | | |
Net decrease in net assets resulting from dividends and
distributions to shareholders | | | (47,188,436 | ) | | | (20,012,731 | ) | | | (4,085,142 | ) | | | (2,582,281 | ) | |
Capital Share Transactions: | |
Net increase in net assets resulting from capital share transactions | | | 169,920,311 | | | | 192,494,140 | | | | 10,499,937 | | | | 41,012,351 | | |
Net Assets: | |
Total increase in net assets | | | 158,699,293 | | | | 248,905,191 | | | | 7,085,217 | | | | 44,141,140 | | |
Beginning of year | | | 482,787,954 | | | | 233,882,763 | | | | 69,270,886 | | | | 25,129,746 | | |
End of year | | $ | 641,487,247 | | | $ | 482,787,954 | | | $ | 76,356,103 | | | $ | 69,270,886 | | |
Undistributed net investment income | | $ | 2,032,018 | | | $ | 2,485,967 | | | $ | 131,324 | | | $ | 353,809 | | |
The accompanying notes are an integral part of these financial statements.
65
Statements of Changes in Net Assets
| | | High Yield Fund | |
| | | Year ended
June 30, 2015 | | Year ended
June 30, 2014 | |
Operations: | |
Net investment income | | $ | 120,654,174 | | | $ | 81,769,565 | | |
Net realized gains | | | 22,224,627 | | | | 17,478,737 | | |
Net change in unrealized appreciation (depreciation) | | | (132,782,005 | ) | | | 53,239,557 | | |
Net increase in net assets resulting from operations | | | 10,096,796 | | | | 152,487,859 | | |
Dividends and Distributions to Shareholders: | |
Net investment income: | |
Class I | | | (88,000,479 | ) | | | (53,642,913 | ) | |
Class A | | | (33,219,800 | ) | | | (27,309,600 | ) | |
Class C | | | (177,610 | ) | | | (96,625 | ) | |
Net realized gains: | |
Class I | | | (12,049,524 | ) | | | (9,104,675 | ) | |
Class A | | | (4,803,498 | ) | | | (4,860,631 | ) | |
Class C | | | (31,717 | ) | | | (17,961 | ) | |
Net decrease in net assets resulting from dividends and distributions to shareholders | | | (138,282,628 | ) | | | (95,032,405 | ) | |
Capital Share Transactions: | |
Net increase in net assets resulting from capital share transactions | | | 1,136,592,881 | | | | 582,760,360 | | |
Net Assets: | |
Total increase in net assets | | | 1,008,407,049 | | | | 640,215,814 | | |
Beginning of year | | | 1,737,806,635 | | | | 1,097,590,821 | | |
End of year | | $ | 2,746,213,684 | | | $ | 1,737,806,635 | | |
Undistributed net investment income (loss) | | $ | 77,357 | | | $ | (1,177,852 | ) | |
The accompanying notes are an integral part of these financial statements.
66
Financial Highlights
The following per share data and ratios have been derived from information provided in the financial statements.
| | | | | Income (loss) from investment operations | | Dividends and distributions | | | | Ratios to Average Net Assets | |
Diversified Value Fund | | Net asset
value,
beginning
of year | | Net
investment
income1 | | Net gains
(losses) on
securities
(both
realized and
unrealized) | | Total from
investment
operations | | Dividends
(from net
investment
income) | | Distributions
(from
capital
gains) | | Total
distributions | | Net asset
value, end
of year | | Total
return2 | | Net assets,
end of
year (in
thousands) | | Expenses,
net of
reimbursement/
waiver | |
Expenses,
before
reimbursement/
waiver | | Net
investment
income | |
Class I | |
Year ended 6/30/2015 | | $ | 15.47 | | | $ | 0.19 | | | $ | 0.61 | | | $ | 0.80 | | | $ | (0.38 | ) | | $ | — | | | $ | (0.38 | ) | | $ | 15.89 | | | | 5.30 | % | | $ | 481,815 | | | | 0.95 | % | | | 0.99 | % | | | 1.18 | % | |
Year ended 6/30/2014 | | | 12.53 | | | | 0.38 | | | | 2.73 | | | | 3.11 | | | | (0.17 | ) | | | — | | | | (0.17 | ) | | | 15.47 | | | | 24.98 | | | | 485,541 | | | | 0.95 | | | | 1.01 | | | | 2.72 | | |
Year ended 6/30/2013 | | | 9.82 | | | | 0.16 | | | | 2.72 | | | | 2.88 | | | | (0.17 | ) | | | — | | | | (0.17 | ) | | | 12.53 | | | | 29.65 | | | | 367,963 | | | | 0.95 | | | | 1.06 | | | | 1.47 | | |
Year ended 6/30/2012 | | | 10.01 | | | | 0.16 | | | | (0.18 | ) | | | (0.02 | ) | | | (0.17 | ) | | | — | | | | (0.17 | ) | | | 9.82 | | | | –0.01 | | | | 320,916 | | | | 0.95 | | | | 1.06 | | | | 1.73 | | |
Year ended 6/30/2011 | | | 7.94 | | | | 0.15 | | | | 2.02 | | | | 2.17 | | | | (0.10 | ) | | | — | | | | (0.10 | ) | | | 10.01 | | | | 27.44 | | | | 328,273 | | | | 0.95 | | | | 1.12 | | | | 1.59 | | |
Class A | |
Year ended 6/30/2015 | | | 15.50 | | | | 0.14 | | | | 0.63 | | | | 0.77 | | | | (0.35 | ) | | | — | | | | (0.35 | ) | | | 15.92 | | | | 5.07 | | | | 52,752 | | | | 1.20 | | | | 1.24 | | | | 0.92 | | |
Year ended 6/30/2014 | | | 12.57 | | | | 0.38 | | | | 2.70 | | | | 3.08 | | | | (0.15 | ) | | | — | | | | (0.15 | ) | | | 15.50 | | | | 24.68 | | | | 59,173 | | | | 1.20 | | | | 1.26 | | | | 2.71 | | |
Year ended 6/30/2013 | | | 9.86 | | | | 0.13 | | | | 2.72 | | | | 2.85 | | | | (0.14 | ) | | | — | | | | (0.14 | ) | | | 12.57 | | | | 29.25 | | | | 35,251 | | | | 1.20 | | | | 1.31 | | | | 1.21 | | |
Year ended 6/30/2012 | | | 10.03 | | | | 0.14 | | | | (0.18 | ) | | | (0.04 | ) | | | (0.13 | ) | | | — | | | | (0.13 | ) | | | 9.86 | | | | –0.18 | | | | 34,731 | | | | 1.20 | | | | 1.31 | | | | 1.46 | | |
Year ended 6/30/2011 | | | 7.96 | | | | 0.14 | | | | 2.02 | | | | 2.16 | | | | (0.09 | ) | | | — | | | | (0.09 | ) | | | 10.03 | | | | 27.16 | | | | 45,383 | | | | 1.20 | | | | 1.37 | | | | 1.42 | | |
Class C | |
Year ended 6/30/2015 | | | 15.20 | | | | 0.03 | | | | 0.62 | | | | 0.65 | | | | (0.09 | ) | | | — | | | | (0.09 | ) | | | 15.76 | | | | 4.27 | | | | 4,419 | | | | 1.95 | | | | 1.99 | | | | 0.17 | | |
Year ended 6/30/2014 | | | 12.35 | | | | 0.17 | | | | 2.75 | | | | 2.92 | | | | (0.07 | ) | | | — | | | | (0.07 | ) | | | 15.20 | | | | 23.70 | | | | 4,429 | | | | 1.95 | | | | 2.01 | | | | 1.28 | | |
Year ended 6/30/2013 | | | 9.72 | | | | 0.05 | | | | 2.68 | | | | 2.73 | | | | (0.10 | ) | | | — | | | | (0.10 | ) | | | 12.35 | | | | 28.28 | | | | 11,815 | | | | 1.95 | | | | 2.06 | | | | 0.45 | | |
Year ended 6/30/2012 | | | 9.92 | | | | 0.07 | | | | (0.17 | ) | | | (0.10 | ) | | | (0.10 | ) | | | — | | | | (0.10 | ) | | | 9.72 | | | | -0.92 | | | | 12,062 | | | | 1.95 | | | | 2.06 | | | | 0.73 | | |
Year ended 6/30/2011 | | | 7.90 | | | | 0.06 | | | | 2.00 | | | | 2.06 | | | | (0.04 | ) | | | — | | | | (0.04 | ) | | | 9.92 | | | | 26.11 | | | | 14,036 | | | | 1.95 | | | | 2.12 | | | | 0.61 | | |
| | | Year Ended June 30, | |
| | | 2015 | | 2014 | | 2013 | | 2012 | | 2011 | |
Portfolio turnover rate | | | 38 | % | | | 33 | % | | | 44 | % | | | 42 | % | | | 63 | % | |
| | | | | Income (loss) from investment operations | | Dividends and distributions | | | | Ratios to Average Net Assets | |
Large Cap Value Fund | | Net asset
value,
beginning
of year | | Net
investment
income1 | | Net gains
(losses) on
securities
(both
realized and
unrealized) | | Total from
investment
operations | | Dividends
(from net
investment
income) | | Distributions
(from
capital
gains) | | Total
distributions | | Net asset
value, end
of year | | Total
return2 | | Net assets,
end of
year (in
thousands) | | Expenses,
net of
reimbursement/
waiver | | Expenses,
before
reimbursement/
waiver | | Net
investment
income | |
Class I | |
Year ended 6/30/2015 | | $ | 26.65 | | | $ | 0.35 | | | $ | 0.99 | | | $ | 1.34 | | | $ | (0.78 | ) | | $ | — | | | $ | (0.78 | ) | | $ | 27.21 | | | | 5.17 | % | | $ | 479,488 | | | | 0.99 | % | | | 0.99 | % | | | 1.30 | % | |
Year ended 6/30/2014 | | | 21.35 | | | | 0.73 | | | | 4.88 | | | | 5.61 | | | | (0.31 | ) | | | — | | | | (0.31 | ) | | | 26.65 | | | | 26.52 | | | | 500,102 | | | | 1.01 | | | | 1.01 | | | | 3.04 | | |
Year ended 6/30/2013 | | | 16.80 | | | | 0.31 | | | | 4.69 | | | | 5.00 | | | | (0.45 | ) | | | — | | | | (0.45 | ) | | | 21.35 | | | | 30.48 | | | | 389,300 | | | | 1.05 | | | | 1.05 | | | | 1.68 | | |
Year ended 6/30/2012 | | | 16.96 | | | | 0.31 | | | | (0.13 | ) | | | 0.18 | | | | (0.34 | ) | | | — | | | | (0.34 | ) | | | 16.80 | | | | 1.22 | | | | 316,081 | | | | 1.05 | | | | 1.05 | | | | 1.96 | | |
Year ended 6/30/2011 | | | 13.32 | | | | 0.26 | | | | 3.42 | | | | 3.68 | | | | (0.04 | ) | | | — | | | | (0.04 | ) | | | 16.96 | | | | 27.61 | | | | 588,823 | | | | 1.05 | | | | 1.07 | | | | 1.60 | | |
Class A | |
Year ended 6/30/2015 | | | 26.46 | | | | 0.27 | | | | 0.99 | | | | 1.26 | | | | (0.70 | ) | | | — | | | | (0.70 | ) | | | 27.02 | | | | 4.89 | | | | 191,665 | | | | 1.24 | | | | 1.24 | | | | 1.03 | | |
Year ended 6/30/2014 | | | 21.21 | | | | 0.73 | | | | 4.79 | | | | 5.52 | | | | (0.27 | ) | | | — | | | | (0.27 | ) | | | 26.46 | | | | 26.22 | | | | 223,219 | | | | 1.26 | | | | 1.26 | | | | 3.02 | | |
Year ended 6/30/2013 | | | 16.68 | | | | 0.26 | | | | 4.67 | | | | 4.93 | | | | (0.40 | ) | | | — | | | | (0.40 | ) | | | 21.21 | | | | 30.16 | | | | 156,303 | | | | 1.30 | | | | 1.30 | | | | 1.42 | | |
Year ended 6/30/2012 | | | 16.84 | | | | 0.26 | | | | (0.12 | ) | | | 0.14 | | | | (0.30 | ) | | | — | | | | (0.30 | ) | | | 16.68 | | | | 0.99 | | | | 155,767 | | | | 1.30 | | | | 1.30 | | | | 1.66 | | |
Year ended 6/30/2011 | | | 13.25 | | | | 0.21 | | | | 3.39 | | | | 3.60 | | | | (0.01 | ) | | | — | | | | (0.01 | ) | | | 16.84 | | | | 27.21 | | | | 319,863 | | | | 1.30 | | | | 1.31 | | | | 1.33 | | |
Class C | |
Year ended 6/30/2015 | | | 25.96 | | | | 0.09 | | | | 0.94 | | | | 1.03 | | | | (0.69 | ) | | | — | | | | (0.69 | ) | | | 26.30 | | | | 4.10 | | | | 40,862 | | | | 1.99 | | | | 1.99 | | | | 0.34 | | |
Year ended 6/30/2014 | | | 20.72 | | | | 0.72 | | | | 4.52 | | | | 5.24 | | | | — | | | | — | | | | — | | | | 25.96 | | | | 25.29 | | | | 25,765 | | | | 2.01 | | | | 2.01 | | | | 3.02 | | |
Year ended 6/30/2013 | | | 16.26 | | | | 0.10 | | | | 4.58 | | | | 4.68 | | | | (0.22 | ) | | | — | | | | (0.22 | ) | | | 20.72 | | | | 29.12 | | | | 8,324 | | | | 2.05 | | | | 2.05 | | | | 0.59 | | |
Year ended 6/30/2012 | | | 16.48 | | | | 0.14 | | | | (0.12 | ) | | | 0.02 | | | | (0.24 | ) | | | — | | | | (0.24 | ) | | | 16.26 | | | | 0.29 | | | | 23,891 | | | | 2.05 | | | | 2.05 | | | | 0.92 | | |
Year ended 6/30/2011 | | | 13.05 | | | | 0.09 | | | | 3.34 | | | | 3.43 | | | | — | | | | — | | | | — | | | | 16.48 | | | | 26.28 | | | | 36,612 | | | | 2.05 | | | | 2.07 | | | | 0.59 | | |
Class R | |
Year ended 6/30/2015 | | | 26.62 | | | | 0.22 | | | | 0.98 | | | | 1.20 | | | | (0.66 | ) | | | — | | | | (0.66 | ) | | | 27.16 | | | | 4.64 | | | | 12,867 | | | | 1.49 | | | | 1.49 | | | | 0.81 | | |
Year ended 6/30/2014 | | | 21.33 | | | | 0.60 | | | | 4.89 | | | | 5.49 | | | | (0.20 | ) | | | — | | | | (0.20 | ) | | | 26.62 | | | | 25.91 | | | | 11,924 | | | | 1.51 | | | | 1.51 | | | | 2.51 | | |
Year ended 6/30/2013 | | | 16.77 | | | | 0.21 | | | | 4.69 | | | | 4.90 | | | | (0.34 | ) | | | — | | | | (0.34 | ) | | | 21.33 | | | | 29.79 | | | | 9,571 | | | | 1.55 | | | | 1.55 | | | | 1.15 | | |
Year ended 6/30/2012 | | | 16.95 | | | | 0.23 | | | | (0.12 | ) | | | 0.11 | | | | (0.29 | ) | | | — | | | | (0.29 | ) | | | 16.77 | | | | 0.80 | | | | 10,812 | | | | 1.55 | | | | 1.55 | | | | 1.42 | | |
Year ended 6/30/2011 | | | 13.36 | | | | 0.17 | | | | 3.42 | | | | 3.59 | | | | — | | | | — | | | | — | | | | 16.95 | | | | 26.87 | | | | 14,034 | | | | 1.55 | | | | 1.56 | | | | 1.08 | | |
| | | Year Ended June 30, | |
| | | 2015 | | 2014 | | 2013 | | 2012 | | 2011 | |
Portfolio turnover rate | | | 39 | % | | | 57 | % | | | 41 | % | | | 59 | % | | | 43 | % | |
1 Net investment income per share has been calculated based on average shares outstanding during the year.
2 Total returns exclude the effects of sales charges. The Fund's investment advisor may have waived a portion of its advisory fee and/or reimbursed a portion of the Fund's expenses. Without such waiver and/or reimbursement, the Fund's performance would have been lower.
The accompanying notes are an integral part of these financial statements.
67
Financial Highlights
The following per share data and ratios have been derived from information provided in the financial statements.
| | | | | Income (loss) from investment operations | | Dividends and distributions | | | | Ratios to Average Net Assets | |
Mid-Cap Value Fund | | Net asset
value,
beginning
of year | | Net
investment
income
(loss)1 | | Net gains
(losses) on
securities
(both
realized and
unrealized) | | Total from
investment
operations | | Dividends
(from net
investment
income) | | Distributions
(from
capital
gains) | | Total
distributions | | Net asset
value, end
of year | | Total
return2 | | Net assets,
end of
year (in
thousands) | | Expenses,
net of
reimbursement/
waiver | | Expenses,
before
reimbursement/
waiver | | Net
investment
income
(loss) | |
Class I | |
Year ended 6/30/2015 | | $ | 45.15 | | | $ | 0.15 | | | $ | (0.63 | ) | | $ | (0.48 | ) | | $ | (0.27 | ) | | $ | (3.97 | ) | | $ | (4.24 | ) | | $ | 40.43 | | | | –0.70 | % | | $ | 2,492,532 | | | | 1.00 | % | | | 1.00 | % | | | 0.35 | % | |
Year ended 6/30/2014 | | | 35.36 | | | | 0.21 | | | | 9.71 | | | | 9.92 | | | | (0.13 | ) | | | — | | | | (0.13 | ) | | | 45.15 | | | | 28.10 | | | | 2,542,569 | | | | 1.01 | | | | 1.01 | | | | 0.52 | | |
Year ended 6/30/2013 | | | 26.02 | | | | 0.16 | | | | 9.31 | | | | 9.47 | | | | (0.13 | ) | | | — | | | | (0.13 | ) | | | 35.36 | | | | 36.51 | | | | 1,627,378 | | | | 1.07 | | | | 1.07 | | | | 0.55 | | |
Year ended 6/30/2012 | | | 24.96 | | | | 0.13 | | | | 0.95 | | | | 1.08 | | | | (0.02 | ) | | | — | | | | (0.02 | ) | | | 26.02 | | | | 4.33 | | | | 1,058,806 | | | | 1.10 | | | | 1.10 | | | | 0.54 | | |
Year ended 6/30/2011 | | | 18.14 | | | | 0.05 | | | | 6.85 | | | | 6.90 | | | | (0.08 | ) | | | — | | | | (0.08 | ) | | | 24.96 | | | | 38.05 | | | | 1,077,149 | | | | 1.08 | | | | 1.08 | | | | 0.20 | | |
Class A | |
Year ended 6/30/2015 | | | 44.60 | | | | 0.04 | | | | (0.61 | ) | | | (0.57 | ) | | | (0.15 | ) | | | (3.97 | ) | | | (4.12 | ) | | | 39.91 | | | | –0.93 | | | | 626,544 | | | | 1.25 | | | | 1.25 | | | | 0.10 | | |
Year ended 6/30/2014 | | | 34.98 | | | | 0.12 | | | | 9.58 | | | | 9.70 | | | | (0.08 | ) | | | — | | | | (0.08 | ) | | | 44.60 | | | | 27.78 | | | | 862,559 | | | | 1.26 | | | | 1.26 | | | | 0.29 | | |
Year ended 6/30/2013 | | �� | 25.75 | | | | 0.09 | | | | 9.21 | | | | 9.30 | | | | (0.07 | ) | | | — | | | | (0.07 | ) | | | 34.98 | | | | 36.16 | | | | 406,949 | | | | 1.32 | | | | 1.32 | | | | 0.32 | | |
Year ended 6/30/2012 | | | 24.74 | | | | 0.07 | | | | 0.94 | | | | 1.01 | | | | — | | | | — | | | | — | | | | 25.75 | | | | 4.08 | | | | 217,069 | | | | 1.35 | | | | 1.35 | | | | 0.28 | | |
Year ended 6/30/2011 | | | 18.01 | | | | (0.01 | ) | | | 6.78 | | | | 6.77 | | | | (0.04 | ) | | | — | | | | (0.04 | ) | | | 24.74 | | | | 37.63 | | | | 235,301 | | | | 1.33 | | | | 1.33 | | | | (0.06 | ) | |
Class C | |
Year ended 6/30/2015 | | | 41.04 | | | | (0.25 | ) | | | (0.58 | ) | | | (0.83 | ) | | | — | | | | (3.97 | ) | | | (3.97 | ) | | | 36.24 | | | | –1.69 | | | | 128,647 | | | | 2.00 | | | | 2.00 | | | | (0.65 | ) | |
Year ended 6/30/2014 | | | 32.39 | | | | (0.16 | ) | | | 8.85 | | | | 8.69 | | | | (0.04 | ) | | | — | | | | (0.04 | ) | | | 41.04 | | | | 26.84 | | | | 154,222 | | | | 2.01 | | | | 2.01 | | | | (0.45 | ) | |
Year ended 6/30/2013 | | | 23.97 | | | | (0.11 | ) | | | 8.53 | | | | 8.42 | | | | — | | | | — | | | | — | | | | 32.39 | | | | 35.13 | | | | 62,638 | | | | 2.07 | | | | 2.07 | | | | (0.39 | ) | |
Year ended 6/30/2012 | | | 23.20 | | | | (0.11 | ) | | | 0.88 | | | | 0.77 | | | | — | | | | — | | | | — | | | | 23.97 | | | | 3.32 | | | | 15,072 | | | | 2.10 | | | | 2.10 | | | | (0.53 | ) | |
Year ended 6/30/2011 | | | 16.98 | | | | (0.17 | ) | | | 6.39 | | | | 6.22 | | | | — | | | | — | | | | — | | | | 23.20 | | | | 36.63 | | | | 35,320 | | | | 2.08 | | | | 2.08 | | | | (0.81 | ) | |
Class R | |
Year ended 6/30/2015 | | | 44.77 | | | | (0.07 | ) | | | (0.62 | ) | | | (0.69 | ) | | | (0.07 | ) | | | (3.97 | ) | | | (4.04 | ) | | | 40.04 | | | | –1.21 | | | | 18,683 | | | | 1.50 | | | | 1.50 | | | | (0.16 | ) | |
Year ended 6/30/2014 | | | 35.17 | | | | 0.02 | | | | 9.63 | | | | 9.65 | | | | (0.05 | ) | | | — | | | | (0.05 | ) | | | 44.77 | | | | 27.47 | | | | 24,693 | | | | 1.51 | | | | 1.51 | | | | 0.05 | | |
Year ended 6/30/2013 | | | 25.92 | | | | 0.03 | | | | 9.25 | | | | 9.28 | | | | (0.03 | ) | | | — | | | | (0.03 | ) | | | 35.17 | | | | 35.82 | | | | 9,746 | | | | 1.57 | | | | 1.57 | | | | 0.09 | | |
Year ended 6/30/2012 | | | 24.95 | | | | 0.003 | | | | 0.97 | | | | 0.97 | | | | — | | | | — | | | | — | | | | 25.92 | | | | 3.89 | | | | 4,762 | | | | 1.60 | | | | 1.60 | | | | 0.02 | | |
Year ended 6/30/2011 | | | 18.18 | | | | (0.07 | ) | | | 6.85 | | | | 6.78 | | | | (0.01 | ) | | | — | | | | (0.01 | ) | | | 24.95 | | | | 37.32 | | | | 6,215 | | | | 1.58 | | | | 1.58 | | | | (0.30 | ) | |
| | | Year Ended June 30, | |
| | | 2015 | | 2014 | | 2013 | | 2012 | | 2011 | |
Portfolio turnover rate | | | 54 | % | | | 55 | % | | | 66 | % | | | 72 | % | | | 62 | % | |
| | | | | Income (loss) from investment operations | | Dividends and distributions | | | | Ratios to Average Net Assets | |
Small Cap Value Fund | | Net asset
value,
beginning
of year | | Net
investment
income
(loss)1 | | Net gains
(losses) on
securities
(both
realized and
unrealized) | | Total from
investment
operations | | Dividends
(from net
investment
income) | | Distributions
(from
capital
gains) | | Total
distributions | | Net asset
value, end
of year | | Total
return2 | | Net assets,
end of
year (in
thousands) | | Expenses,
net of
reimbursement/
waiver | | Expenses,
before
reimbursement/
waiver | | Net
investment
income
(loss) | |
Class I | |
Year ended 6/30/2015 | | $ | 66.62 | | | $ | 0.27 | | | $ | 2.30 | | | $ | 2.57 | | | $ | (0.13 | ) | | $ | (7.39 | ) | | $ | (7.52 | ) | | $ | 61.67 | | | | 4.64 | % | | $ | 951,911 | | | | 1.06 | % | | | 1.06 | % | | | 0.43 | % | |
Year ended 6/30/2014 | | | 54.84 | | | | 0.13 | | | | 16.83 | | | | 16.96 | | | | (0.20 | ) | | | (4.98 | ) | | | (5.18 | ) | | | 66.62 | | | | 32.40 | | | | 785,915 | | | | 0.99 | | | | 0.99 | | | | 0.21 | | |
Year ended 6/30/2013 | | | 41.83 | | | | 0.32 | | | | 12.96 | | | | 13.28 | | | | (0.27 | ) | | | — | | | | (0.27 | ) | | | 54.84 | | | | 31.88 | | | | 452,702 | | | | 1.03 | | | | 1.03 | | | | 0.67 | | |
Year ended 6/30/2012 | | | 43.90 | | | | 0.29 | | | | (2.36 | ) | | | (2.07 | ) | | | — | | | | — | | | | — | | | | 41.83 | | | | –4.72 | | | | 296,436 | | | | 1.09 | | | | 1.09 | | | | 0.73 | | |
Year ended 6/30/2011 | | | 31.33 | | | | (0.05 | ) | | | 12.68 | | | | 12.63 | | | | (0.06 | ) | | | — | | | | (0.06 | ) | | | 43.90 | | | | 40.29 | | | | 254,187 | | | | 1.08 | | | | 1.08 | | | | (0.13 | ) | |
Class A | |
Year ended 6/30/2015 | | | 66.26 | | | | 0.12 | | | | 2.28 | | | | 2.40 | | | | — | | | | (7.39 | ) | | | (7.39 | ) | | | 61.27 | | | | 4.37 | | | | 194,587 | | | | 1.31 | | | | 1.31 | | | | 0.19 | | |
Year ended 6/30/2014 | | | 54.67 | | | | (0.02 | ) | | | 16.75 | | | | 16.73 | | | | (0.16 | ) | | | (4.98 | ) | | | (5.14 | ) | | | 66.26 | | | | 32.06 | | | | 204,205 | | | | 1.24 | | | | 1.24 | | | | (0.04 | ) | |
Year ended 6/30/2013 | | | 41.67 | | | | 0.21 | | | | 12.91 | | | | 13.12 | | | | (0.12 | ) | | | — | | | | (0.12 | ) | | | 54.67 | | | | 31.55 | | | | 103,329 | | | | 1.28 | | | | 1.28 | | | | 0.43 | | |
Year ended 6/30/2012 | | | 43.84 | | | | 0.15 | | | | (2.32 | ) | | | (2.17 | ) | | | — | | | | — | | | | — | | | | 41.67 | | | | –4.95 | | | | 39,803 | | | | 1.34 | | | | 1.34 | | | | 0.39 | | |
Year ended 6/30/2011 | | | 31.34 | | | | (0.15 | ) | | | 12.68 | | | | 12.53 | | | | (0.03 | ) | | | — | | | | (0.03 | ) | | | 43.84 | | | | 39.94 | | | | 64,100 | | | | 1.33 | | | | 1.33 | | | | (0.39 | ) | |
Class C | |
Year ended 6/30/2015 | | | 58.99 | | | | (0.32 | ) | | | 1.97 | | | | 1.65 | | | | — | | | | (7.39 | ) | | | (7.39 | ) | | | 53.25 | | | | 3.60 | | | | 35,172 | | | | 2.06 | | | | 2.06 | | | | (0.58 | ) | |
Year ended 6/30/2014 | | | 49.40 | | | | (0.43 | ) | | | 15.04 | | | | 14.61 | | | | (0.04 | ) | | | (4.98 | ) | | | (5.02 | ) | | | 58.99 | | | | 31.09 | | | | 43,161 | | | | 1.99 | | | | 1.99 | | | | (0.79 | ) | |
Year ended 6/30/2013 | | | 37.84 | | | | (0.14 | ) | | | 11.70 | | | | 11.56 | | | | — | | | | — | | | | — | | | | 49.40 | | | | 30.55 | | | | 28,745 | | | | 2.03 | | | | 2.03 | | | | (0.31 | ) | |
Year ended 6/30/2012 | | | 40.11 | | | | (0.10 | ) | | | (2.17 | ) | | | (2.27 | ) | | | — | | | | — | | | | — | | | | 37.84 | | | | –5.66 | | | | 10,970 | | | | 2.09 | | | | 2.09 | | | | (0.29 | ) | |
Year ended 6/30/2011 | | | 28.87 | | | | (0.42 | ) | | | 11.66 | | | | 11.24 | | | | — | | | | — | | | | — | | | | 40.11 | | | | 38.93 | | | | 11,727 | | | | 2.08 | | | | 2.08 | | | | (1.14 | ) | |
| | | Year Ended June 30, | |
| | | 2015 | | 2014 | | 2013 | | 2012 | | 2011 | |
Portfolio turnover rate | | | 43 | % | | | 43 | % | | | 35 | % | | | 37 | % | | | 54 | % | |
1 Net investment income (loss) per share has been calculated based on average shares outstanding during the year.
2 Total returns exclude the effects of sales charges. The Fund's investment advisor may have waived a portion of its advisory fee and/or reimbursed a portion of the Fund's expenses. Without such waiver and/or reimbursement, the Fund's performance would have been lower.
3 Amount is less than $0.005.
The accompanying notes are an integral part of these financial statements.
68
Financial Highlights
The following per share data and ratios have been derived from information provided in the financial statements.
| | | | | Income from investment operations | | Dividends and distributions | | | | Ratios to Average Net Assets | |
Small Cap Diversified
Value Fund | | Net asset
value,
beginning
of year | | Net
investment
income1 | | Net gains
on
securities
(both
realized and
unrealized) | | Total from
investment
operations | | Dividends
(from net
investment
income) | | Distributions
(from
capital
gains) | | Total
distributions | | Net asset
value, end
of year | | Total
return2 | | Net assets,
end of
year (in
thousands) | | Expenses,
net of
reimbursement/
waiver | | Expenses,
before
reimbursement/
waiver | | Net
investment
income | |
Class I | |
Year from
6/30/20143 to
6/30/2015 | | $ | 10.00 | | | $ | 0.05 | | | $ | 0.22 | | | $ | 0.27 | | | $ | (0.04 | ) | | $ | (0.22 | ) | | $ | (0.26 | ) | | $ | 10.01 | | | | 2.93 | % | | $ | 15,337 | | | | 1.25 | % | | | 3.75 | % | | | 0.48 | % | |
Class A | |
Year from
6/30/20143 to
6/30/2015 | | | 10.00 | | | | 0.03 | | | | 0.22 | | | | 0.25 | | | | (0.03 | ) | | | (0.22 | ) | | | (0.25 | ) | | | 10.00 | | | | 2.71 | | | | 130 | | | | 1.50 | | | | 4.25 | | | | 0.29 | | |
| | | Year Ended June 30, 2015 | |
Portfolio turnover rate | | | 40 | % | |
| | | | | Income (loss) from investment operations | | Dividends and distributions | | | | Ratios to Average Net Assets | |
Global Value Fund | | Net asset
value,
beginning
of period | | Net
investment
income1 | | Net gains
(losses) on
securities
(both
realized and
unrealized) | | Total from
investment
operations | | Dividends
(from net
investment
income) | | Distributions
(from
capital
gains) | | Total
distributions | | Net asset
value, end
of period | | Total
return2 | | Net assets,
end of
period (in
thousands) | | Expenses,
net of
reimbursement/
waiver | | Expenses,
before
reimbursement/
waiver | | Net
investment
income | |
Class I | |
Year ended
6/30/2015 | | $ | 13.31 | | | $ | 0.14 | | | $ | (0.46 | ) | | $ | (0.32 | ) | | $ | (0.30 | ) | | $ | (0.76 | ) | | $ | (1.06 | ) | | $ | 11.93 | | | | –1.98 | % | | $ | 6,144 | | | | 1.10 | % | | | 4.34 | % | | | 1.11 | % | |
Year ended 6/30/2014 | | | 11.49 | | | | 0.41 | | | | 2.45 | | | | 2.86 | | | | (0.17 | ) | | | (0.87 | ) | | | (1.04 | ) | | | 13.31 | | | | 25.98 | | | | 3,867 | | | | 1.10 | | | | 6.26 | | | | 3.29 | | |
Period from
12/31/20123 to
6/30/2013 | | | 10.00 | | | | 0.12 | | | | 1.37 | | | | 1.49 | | | | — | | | | — | | | | — | | | | 11.49 | | | | 14.90 | | | | 2,024 | | | | 1.104 | | | | 11.754 | | | | 2.224 | | |
Class A | |
Year ended 6/30/2015 | | | 13.29 | | | | 0.10 | | | | (0.45 | ) | | | (0.35 | ) | | | (0.27 | ) | | | (0.76 | ) | | | (1.03 | ) | | | 11.91 | | | | –2.22 | | | | 110 | | | | 1.35 | | | | 4.77 | | | | 0.79 | | |
Period from
8/30/20133 to
6/30/2014 | | | 11.85 | | | | 0.34 | | | | 2.13 | | | | 2.47 | | | | (0.16 | ) | | | (0.87 | ) | | | (1.03 | ) | | | 13.29 | | | | 21.88 | | | | 137 | | | | 1.354 | | | | 6.584 | | | | 3.214 | | |
| | | Year Ended June 30, | | Period December 31, 20123 | |
| | | 2015 | | 2014 | | through June 30, 2013 | |
Portfolio turnover rate | | | 42 | % | | | 52 | % | | | 38 | % | |
1 Net investment income per share has been calculated based on average shares outstanding during the period.
2 Total returns exclude the effects of sales charges. The Fund's investment advisor and administrator may have waived a portion of their fees and/or reimbursed a portion of the Fund's expenses. Without such waiver and/or reimbursement, the Fund's performance would have been lower. Returns for periods less than one year are not annualized.
3 Commencement of operations.
4 Annualized.
The accompanying notes are an integral part of these financial statements.
69
Financial Highlights
The following per share data and ratios have been derived from information provided in the financial statements.
| | | | | Income (loss) from investment operations | | Dividends and distributions | | | | Ratios to Average Net Assets | |
Value Opportunities Fund | | Net asset
value,
beginning
of year | | Net
investment
income
(loss)1 | | Net gains
(losses) on
securities
(both
realized and
unrealized) | | Total from
investment
operations | | Dividends
(from net
investment
income) | | Distributions
(from
capital
gains) | | Total
distributions | | Net asset
value, end
of year | | Total
return2 | | Net assets,
end of
year (in
thousands) | | Expenses,
net of
reimbursement/
waiver | | Expenses,
before
reimbursement/
waiver | | Net
investment
income
(loss) | |
Class I | |
Year ended 6/30/2015 | | $ | 29.88 | | | $ | 0.41 | | | $ | 1.35 | | | $ | 1.76 | | | $ | (0.42 | ) | | $ | (2.09 | ) | | $ | (2.51 | ) | | $ | 29.13 | | | | 6.75 | % | | $ | 363,363 | | | | 0.96 | % | | | 0.96 | % | | | 1.42 | % | |
Year ended 6/30/2014 | | | 25.46 | | | | 0.35 | | | | 5.91 | | | | 6.26 | | | | (0.23 | ) | | | (1.61 | ) | | | (1.84 | ) | | | 29.88 | | | | 25.67 | | | | 265,138 | | | | 0.99 | | | | 0.99 | | | | 1.25 | | |
Year ended 6/30/2013 | | | 20.44 | | | | 0.34 | | | | 6.00 | | | | 6.34 | | | | (0.38 | ) | | | (0.94 | ) | | | (1.32 | ) | | | 25.46 | | | | 32.28 | | | | 105,332 | | | | 1.03 | | | | 1.03 | | | | 1.45 | | |
Year ended 6/30/2012 | | | 21.12 | | | | 0.33 | | | | (0.48 | ) | | | (0.15 | ) | | | (0.14 | ) | | | (0.39 | ) | | | (0.53 | ) | | | 20.44 | | | | –0.20 | | | | 41,079 | | | | 1.10 | | | | 1.10 | | | | 1.73 | | |
Year ended 6/30/2011 | | | 14.96 | | | | 0.14 | | | | 6.24 | | | | 6.38 | | | | (0.22 | ) | | | — | | | | (0.22 | ) | | | 21.12 | | | | 42.81 | | | | 39,014 | | | | 1.11 | | | | 1.11 | | | | 0.74 | | |
Class A | |
Year ended 6/30/2015 | | | 29.88 | | | | 0.34 | | | | 1.36 | | | | 1.70 | | | | (0.36 | ) | | | (2.09 | ) | | | (2.45 | ) | | | 29.13 | | | | 6.47 | | | | 201,477 | | | | 1.21 | | | | 1.21 | | | | 1.19 | | |
Year ended 6/30/2014 | | | 25.48 | | | | 0.25 | | | | 5.94 | | | | 6.19 | | | | (0.18 | ) | | | (1.61 | ) | | | (1.79 | ) | | | 29.88 | | | | 25.34 | | | | 165,608 | | | | 1.24 | | | | 1.24 | | | | 0.91 | | |
Year ended 6/30/2013 | | | 20.46 | | | | 0.28 | | | | 6.01 | | | | 6.29 | | | | (0.33 | ) | | | (0.94 | ) | | | (1.27 | ) | | | 25.48 | | | | 31.98 | | | | 103,822 | | | | 1.28 | | | | 1.28 | | | | 1.22 | | |
Year ended 6/30/2012 | | | 21.12 | | | | 0.28 | | | | (0.47 | ) | | | (0.19 | ) | | | (0.08 | ) | | | (0.39 | ) | | | (0.47 | ) | | | 20.46 | | | | -0.45 | | | | 32,022 | | | | 1.35 | | | | 1.35 | | | | 1.45 | | |
Year ended 6/30/2011 | | | 14.98 | | | | 0.11 | | | | 6.22 | | | | 6.33 | | | | (0.19 | ) | | | — | | | | (0.19 | ) | | | 21.12 | | | | 42.40 | | | | 34,908 | | | | 1.36 | | | | 1.36 | | | | 0.58 | | |
Class C | |
Year ended 6/30/2015 | | | 28.31 | | | | 0.12 | | | | 1.27 | | | | 1.39 | | | | (0.20 | ) | | | (2.09 | ) | | | (2.29 | ) | | | 27.41 | | | | 5.65 | | | | 76,647 | | | | 1.96 | | | | 1.96 | | | | 0.43 | | |
Year ended 6/30/2014 | | | 24.28 | | | | 0.04 | | | | 5.65 | | | | 5.69 | | | | (0.05 | ) | | | (1.61 | ) | | | (1.66 | ) | | | 28.31 | | | | 24.44 | | | | 52,042 | | | | 1.99 | | | | 1.99 | | | | 0.17 | | |
Year ended 6/30/2013 | | | 19.50 | | | | 0.10 | | | | 5.73 | | | | 5.83 | | | | (0.11 | ) | | | (0.94 | ) | | | (1.05 | ) | | | 24.28 | | | | 30.97 | | | | 24,728 | | | | 2.03 | | | | 2.03 | | | | 0.44 | | |
Year ended 6/30/2012 | | | 20.21 | | | | 0.13 | | | | (0.45 | ) | | | (0.32 | ) | | | — | | | | (0.39 | ) | | | (0.39 | ) | | | 19.50 | | | | –1.22 | | | | 11,308 | | | | 2.10 | | | | 2.10 | | | | 0.69 | | |
Year ended 6/30/2011 | | | 14.40 | | | | (0.05 | ) | | | 5.99 | | | | 5.94 | | | | (0.13 | ) | | | — | | | | (0.13 | ) | | | 20.21 | | | | 41.35 | | | | 12,160 | | | | 2.11 | | | | 2.11 | | | | (0.26 | ) | |
| | | Year Ended June 30, | |
| | | 2015 | | 2014 | | 2013 | | 2012 | | 2011 | |
Portfolio turnover rate | | | 101 | % | | | 45 | % | | | 98 | % | | | 123 | % | | | 137 | % | |
| | | | | Income (loss) from investment operations | | Dividends and distributions | | | | Ratios to Average Net Assets | |
Capital Income Fund | | Net asset
value,
beginning
of period | | Net
investment
income1 | | Net gains
(losses) on
securities
(both
realized and
unrealized) | | Total from
investment
operations | | Dividends
(from net
investment
income) | | Distributions
(from
capital
gains) | | Total
distributions | | Net asset
value, end
of period | | Total
return2 | | Net assets,
end of
period (in
thousands) | | Expenses,
net of
reimbursement/
waiver | | Expenses,
before
reimbursement/
waiver | | Net
investment
income | |
Class I | |
Year ended 6/30/2015 | | $ | 12.85 | | | $ | 0.47 | | | $ | (0.38 | ) | | $ | 0.09 | | | $ | (0.52 | ) | | $ | (0.20 | ) | | $ | (0.72 | ) | | $ | 12.22 | | | | 0.69 | % | | $ | 33,958 | | | | 0.80 | % | | | 1.05 | % | | | 3.75 | % | |
Year ended 6/30/2014 | | | 11.83 | | | | 0.57 | | | | 1.64 | | | | 2.21 | | | | (0.51 | ) | | | (0.68 | ) | | | (1.19 | ) | | | 12.85 | | | | 19.71 | | | | 21,399 | | | | 0.80 | | | | 1.34 | | | | 4.61 | | |
Year ended 6/30/2013 | | | 10.57 | | | | 0.51 | | | | 1.38 | | | | 1.89 | | | | (0.50 | ) | | | (0.13 | ) | | | (0.63 | ) | | | 11.83 | | | | 18.45 | | | | 11,348 | | | | 0.80 | | | | 1.85 | | | | 4.51 | | |
Year ended 6/30/2012 | | | 10.37 | | | | 0.51 | | | | 0.25 | | | | 0.76 | | | | (0.48 | ) | | | (0.08 | ) | | | (0.56 | ) | | | 10.57 | | | | 7.76 | | | | 8,588 | | | | 0.80 | | | | 2.81 | | | | 5.06 | | |
Period from
12/31/20103 to
6/30/2011 | | | 10.00 | | | | 0.24 | | | | 0.35 | | | | 0.59 | | | | (0.22 | ) | | | — | | | | (0.22 | ) | | | 10.37 | | | | 5.90 | | | | 7,765 | | | | 0.804 | | | | 3.754 | | | | 4.604 | | |
Class A | |
Year ended 6/30/2015 | | | 13.24 | | | | 0.44 | | | | (0.35 | ) | | | 0.09 | | | | (0.48 | ) | | | (0.20 | ) | | | (0.68 | ) | | | 12.65 | | | | 0.73 | | | | 42,398 | | | | 1.05 | | | | 1.30 | | | | 3.39 | | |
Year ended 6/30/2014 | | | 12.18 | | | | 0.61 | | | | 1.61 | | | | 2.22 | | | | (0.48 | ) | | | (0.68 | ) | | | (1.16 | ) | | | 13.24 | | | | 19.17 | | | | 47,872 | | | | 1.05 | | | | 1.51 | | | | 4.76 | | |
Year ended 6/30/2013 | | | 10.67 | | | | 0.50 | | | | 1.61 | | | | 2.11 | | | | (0.47 | ) | | | (0.13 | ) | | | (0.60 | ) | | | 12.18 | | | | 20.34 | | | | 13,782 | | | | 1.05 | | | | 1.99 | | | | 4.31 | | |
Year ended 6/30/2012 | | | 10.38 | | | | 0.51 | | | | 0.32 | | | | 0.83 | | | | (0.46 | ) | | | (0.08 | ) | | | (0.54 | ) | | | 10.67 | | | | 8.37 | | | | 333 | | | | 1.05 | | | | 3.06 | | | | 4.93 | | |
Period from
2/28/20118 to
6/30/2011 | | | 10.34 | | | | 0.15 | | | | 0.03 | | | | 0.18 | | | | (0.14 | ) | | | — | | | | (0.14 | ) | | | 10.38 | | | | 1.74 | | | | 82 | | | | 1.054 | | | | 4.124 | | | | 4.314 | | |
| | | Year Ended June 30, | | Period December 31, 20103 | |
| | | 2015 | | 2014 | | 2013 | | 2012 | | through June 30, 2011 | |
Portfolio turnover rate | | | 62 | % | | | 53 | % | | | 65 | % | | | 38 | % | | | 39 | % | |
1 Net investment income (loss) per share has been calculated based on average shares outstanding during the period.
2 Total returns exclude the effects of sales charges. The Fund's investment advisor may have waived a portion of its advisory fee and/or reimbursed a portion of the Fund's expenses. Without such waiver and/or reimbursement, the Fund's performance would have been lower. Returns for periods less than one year are not annualized.
3 Commencement of operations.
4 Annualized.
The accompanying notes are an integral part of these financial statements.
70
Financial Highlights
The following per share data and ratios have been derived from information provided in the financial statements.
| | | | | Income (loss) from investment operations | | Dividends and distributions | | | | Ratios to Average Net Assets | |
High Yield Fund | | Net asset
value,
beginning
of period | | Net
investment
income1 | | Net gains
(losses) on
securities
(both
realized and
unrealized) | | Total from
investment
operations | | Dividends
(from net
investment
income) | | Distributions
(from
capital
gains) | | Total
distributions | | Net asset
value, end
of period | | Total
return2 | | Net assets,
end of
period (in
thousands) | | Expenses,
net of
reimbursement/
waiver | | Expenses,
before
reimbursement/
waiver | | Net
investment
income | |
Class I | |
Year ended 6/30/2015 | | $ | 13.37 | | | $ | 0.70 | | | $ | (0.75 | )3 | | $ | (0.05 | ) | | $ | (0.71 | ) | | $ | (0.10 | ) | | $ | (0.81 | ) | | $ | 12.51 | | | | –0.26 | % | | $ | 2,060,504 | | | | 0.70 | % | | | 0.73 | % | | | 5.56 | % | |
Year ended 6/30/2014 | | | 12.83 | | | | 0.76 | | | | 0.67 | | | | 1.43 | | | | (0.76 | ) | | | (0.13 | ) | | | (0.89 | ) | | | 13.37 | | | | 11.51 | | | | 1,127,080 | | | | 0.70 | | | | 0.75 | | | | 5.82 | | |
Year ended 6/30/2013 | | | 12.28 | | | | 0.80 | | | | 0.61 | | | | 1.41 | | | | (0.81 | ) | | | (0.05 | ) | | | (0.86 | ) | | | 12.83 | | | | 11.70 | | | | 686,718 | | | | 0.70 | | | | 0.75 | | | | 6.23 | | |
Year ended 6/30/2012 | | | 12.79 | | | | 0.94 | | | | (0.25 | ) | | | 0.69 | | | | (0.95 | ) | | | (0.25 | ) | | | (1.20 | ) | | | 12.28 | | | | 6.02 | | | | 426,041 | | | | 0.70 | | | | 0.76 | | | | 7.76 | | |
Year ended 6/30/2011 | | | 12.01 | | | | 0.92 | | | | 1.23 | | | | 2.15 | | | | (0.93 | ) | | | (0.44 | ) | | | (1.37 | ) | | | 12.79 | | | | 18.45 | | | | 187,319 | | | | 0.70 | | | | 0.75 | | | | 7.15 | | |
Class A | |
Year ended 6/30/2015 | | | 13.29 | | | | 0.67 | | | | (0.75 | )4 | | | (0.08 | ) | | | (0.68 | ) | | | (0.10 | ) | | | (0.78 | ) | | | 12.43 | | | | –0.54 | | | | 682,129 | | | | 0.95 | | | | 0.98 | | | | 5.31 | | |
Year ended 6/30/2014 | | | 12.75 | | | | 0.73 | | | | 0.66 | | | | 1.39 | | | | (0.72 | ) | | | (0.13 | ) | | | (0.85 | ) | | | 13.29 | | | | 11.28 | | | | 607,104 | | | | 0.95 | | | | 1.00 | | | | 5.59 | | |
Year ended 6/30/2013 | | | 12.21 | | | | 0.76 | | | | 0.60 | | | | 1.36 | | | | (0.77 | ) | | | (0.05 | ) | | | (0.82 | ) | | | 12.75 | | | | 11.37 | | | | 410,060 | | | | 0.95 | | | | 1.00 | | | | 5.91 | | |
Year ended 6/30/2012 | | | 12.73 | | | | 0.90 | | | | (0.26 | ) | | | 0.64 | | | | (0.91 | ) | | | (0.25 | ) | | | (1.17 | ) | | | 12.21 | | | | 5.66 | | | | 105,472 | | | | 0.95 | | | | 1.01 | | | | 7.47 | | |
Year ended 6/30/2011 | | | 11.97 | | | | 0.88 | | | | 1.21 | | | | 2.09 | | | | (0.89 | ) | | | (0.44 | ) | | | (1.33 | ) | | | 12.73 | | | | 18.11 | | | | 53,832 | | | | 0.95 | | | | 1.01 | | | | 6.88 | | |
Class C | |
Year ended 6/30/2015 | | | 13.36 | | | | 0.58 | | | | (0.76 | )3 | | | (0.18 | ) | | | (0.58 | ) | | | (0.10 | ) | | | (0.68 | ) | | | 12.50 | | | | –1.25 | | | | 3,581 | | | | 1.70 | | | | 1.73 | | | | 4.53 | | |
Year ended 6/30/2014 | | | 12.82 | | | | 0.62 | | | | 0.68 | | | | 1.30 | | | | (0.63 | ) | | | (0.13 | ) | | | (0.76 | ) | | | 13.36 | | | | 10.40 | | | | 3,623 | | | | 1.70 | | | | 1.75 | | | | 4.72 | | |
Period from
12/31/20125 to
6/30/2013 | | | 12.88 | | | | 0.30 | | | | (0.05 | ) | | | 0.25 | | | | (0.31 | ) | | | — | | | | (0.31 | ) | | | 12.82 | | | | 1.91 | | | | 812 | | | | 1.706 | | | | 1.746 | | | | 4.736 | | |
| | | Year Ended June 30, | |
| | | 2015 | | 2014 | | 2013 | | 2012 | | 2011 | |
Portfolio turnover rate | | | 44 | % | | | 51 | % | | | 66 | % | | | 57 | % | | | 139 | % | |
1 Net investment income per share has been calculated based on average shares outstanding during the period.
2 Total returns exclude the effects of sales charges. The Fund's investment advisor may have waived a portion of its advisory fee and/or reimbursed a portion of the Fund's expenses. Without such waiver and/or reimbursement, the Fund's performance would have been lower. Returns for periods less than one year are not annualized.
3 Redemption fees per share were less than $0.005.
4 Includes redemption fees per share of $0.01.
5 Commencement of operations.
6 Annualized.
The accompanying notes are an integral part of these financial statements.
71
Notes to the Financial Statements
JUNE 30, 2015
NOTE 1.
Organization. Hotchkis & Wiley Funds (the "Trust") is registered under the Investment Company Act of 1940, as amended (the "1940 Act"), as an open-end, management investment company. The Trust was organized as a Delaware statutory trust on July 23, 2001 and consists of nine series. The Hotchkis & Wiley Diversified Value Fund, the Hotchkis & Wiley Large Cap Value Fund, the Hotchkis & Wiley Mid-Cap Value Fund, the Hotchkis & Wiley Small Cap Value Fund, the Hotchkis & Wiley Small Cap Diversified Value Fund, the Hotchkis & Wiley Global Value Fund, the Hotchkis & Wiley Capital Income Fund and the Hotchkis & Wiley High Yield Fund (collectively, the "H&W Funds") are each a diversified series and the Hotchkis & Wiley Value Opportunities Fund (together with the H&W Funds, hereafter referred to as the "Funds") is a non-diversified series of the Trust. The Trust was organized to acquire the assets and liabilities of the Mercury HW Large Cap Value Fund, the Mercury HW Mid-Cap Value Fund and the Mercury HW Small Cap Value Fund (the "Mercury HW Funds"). On February 4, 2002, the Mercury HW Funds were reorganized into the Trust through a non-taxable exchange. On August 28, 2009, the Hotchkis & Wiley Core Value Fund was renamed the Hotchkis & Wiley Diversified Value Fund and the Hotchkis & Wiley All Cap Value Fund was renamed the Hotchkis & Wiley Value Opportunities Fund.
The Large Cap Value Fund and Mid-Cap Value Fund have four classes of shares: Class I, Class A, Class C and Class R. The Diversified Value Fund, Small Cap Value Fund, Small Cap Diversified Value Fund, Global Value Fund, Value Opportunities Fund, Capital Income Fund and High Yield Fund have three classes of shares: Class I, Class A and Class C. Class A shares are sold with a front-end sales charge. Class C shares may be subject to a contingent deferred sales charge. Class C shares are automatically converted to Class A shares approximately eight years after purchase and will then be subject to lower distribution and service fees. All classes of shares have identical voting, dividend, liquidation and other rights and the same terms and conditions, except that Class A, Class C and Class R shares bear certain expenses related to the distribution and servicing expenditures. Currently, the Small Cap Diversified Value Fund, Global Value Fund and Capital Income Fund are not offering Class C shares to investors.
Significant Accounting Policies. The Funds' financial statements have been prepared in conformity with accounting principles generally accepted in the United States of America ("U.S. GAAP"), which may require the use of management accruals and estimates. Actual results could differ from those estimates and those differences could be significant. Each Fund is an investment company and accordingly follows the investment company accounting and reporting guidance of the Financial Accounting Standards Board ("FASB") Accounting Standard Codification Topic 946 "Financial Services — Investment Companies". The following is a summary of significant accounting policies followed by the Funds.
Security Valuation. Portfolio securities that are listed on a securities exchange (whether domestic or foreign) or The Nasdaq Stock Market ("NSM") (including the Nasdaq National Market and the Nasdaq Small Cap Market) are valued at the last reported sale price (or official closing price) on that day as of the close of the New York Stock Exchange (which is generally 4:00 p.m. Eastern time), or, in the absence of recorded sales, at the average between the last bid and asked quotation on such exchange or NSM. Unlisted equity securities that are not included in NSM are valued at the last sale price, or if the last sale price is unavailable, at the average of the quoted bid and asked prices in the over-the-counter market. Fixed-income securities are generally valued on the basis of quotes obtained from an approved independent pricing service but may also be valued based on reported transactions on FINRA's Trade Reporting and Compliance Engine (TRACE) or quotations provided by a broker-dealer. The pricing services may provide a price determined by a matrix pricing method or other analytical pricing models. Short-term investments which mature in 60 days or less are valued at amortized cost, which approximates fair value. Investments quoted in foreign currency are valued daily in U.S. dollars on the basis of the foreign currency exchange rate prevailing at the time of valuation. Securities and other assets for which market quotations are not readily available are valued at their fair value as determined by Hotchkis & Wiley Capital Management, LLC (the "Advisor") under guidelines established by and under the general supervision and responsibility of the Trust's Board of Trustees (the "Board"). The Board has approved the use of a third-party vendor's proprietary fair value pricing model to assist in determining current valuation for foreign securities traded in markets that close prior to the New York Stock Exchange. When fair value pricing is employed, the value of the portfolio securities used to calculate the Funds' net asset values may differ from quoted or official closing prices.
The Trust has performed an analysis of all existing investments to determine the significance and character of all inputs to their fair value determination. Various inputs are used in determining the value of each Fund's investments. These inputs are summarized in the following three broad categories:
• Level 1 — Quoted unadjusted prices for identical instruments in active markets to which the Trust has access at the date of measurement.
• Level 2 — Other significant observable inputs (including quoted prices for similar instruments, interest rates, current yields, credit quality, prepayment speeds for mortgage related securities, collateral for asset-backed securities, foreign security indices, foreign exchange rates, fair value estimates for foreign securities, and changes in benchmark securities indices). Level 2 inputs are those in markets for which there are few transactions, the prices are not current, little public information exists or instances where prices vary substantially over time or among brokered market makers.
• Level 3 — Significant unobservable inputs including model derived valuations in which one or more significant inputs or significant value drivers are unobservable. Unobservable inputs are those inputs that reflect the Trust's own assumptions that market participants would use to price the asset or liability based on the best available information.
72
The following table presents the valuation levels of each Fund's assets as of June 30, 2015:
| | Diversified
Value | | Large Cap
Value | | Mid-Cap
Value | | Small Cap
Value | | Small Cap
Diversified
Value | |
Level 1 — Quoted prices in an active market: | |
Common Stocks | | $ | 533,400,102 | | | $ | 708,777,624 | | | $ | 3,029,713,044 | | | $ | 1,109,337,621 | | | $ | 15,076,356 | | |
Investment Companies | | | — | | | | — | | | | — | | | | 26,733,912 | | | | 211,088 | | |
Money Market Funds | | | 5,985,033 | | | | 7,895,512 | | | | 39,991,213 | | | | 45,944,634 | | | | — | | |
Level 2 — Other significant observable market inputs: | |
Common Stocks: | |
Energy | | | — | | | | — | | | | 168,279,343 | | | | 14,352,330 | | | | — | | |
Industrials | | | — | | | | — | | | | 89,365,660 | | | | — | | | | — | | |
Time Deposits | | | 3,441,985 | | | | 13,581,314 | | | | 2,751,199 | | | | 33,922,760 | | | | 170,550 | | |
Level 3 — Significant unobservable inputs | | | — | | | | — | | | | — | | | | — | | | | — | | |
Total Investments | | $ | 542,827,120 | | | $ | 730,254,450 | | | $ | 3,330,100,459 | | | $ | 1,230,291,257 | | | $ | 15,457,994 | | |
| | Global
Value | | Value
Opportunities | | Capital
Income | | High Yield | |
Level 1 — Quoted prices in an active market: | |
Common Stocks | | $ | 4,102,009 | | | $ | 486,628,059 | | | $ | 42,608,381 | | | $ | 10,118,047 | | |
Investment Companies | | | — | | | | 998,384 | | | | 203,273 | | | | — | | |
Preferred Stocks | | | — | | | | 933,309 | | | | 1,115,236 | | | | 90,126,824 | | |
Convertible Preferred Stocks | | | — | | | | — | | | | 48,178 | | | | — | | |
Warrants | | | — | | | | 4,601,698 | | | | 44,991 | | | | 3,248,105 | | |
Money Market Funds | | | — | | | | 6,060,485 | | | | — | | | | — | | |
Level 2 — Other significant observable market inputs: | |
Common Stocks: | |
Consumer Discretionary | | | 330,483 | | | | — | | | | — | | | | — | | |
Consumer Staples | | | 164,406 | | | | — | | | | — | | | | — | | |
Energy | | | 410,238 | | | | 23,174,478 | | | | — | | | | — | | |
Financials | | | 397,231 | | | | 17,291,130 | | | | — | | | | — | | |
Health Care | | | 195,435 | | | | — | | | | — | | | | — | | |
Industrials | | | 540,331 | | | | 35,302,498 | | | | — | | | | — | | |
Information Technology | | | 111,254 | | | | 13,448,049 | | | | — | | | | — | | |
Preferred Stocks: | |
Financials/Banking | | | — | | | | 154,710 | | | | 23,237 | | | | 1,539,065 | | |
Convertible Preferred Stocks: | |
Energy/Oil Field Equipment & Services | | | — | | | | — | | | | 73,212 | | | | 3,462,795 | | |
Convertible Bonds | | | — | | | | 4,436,250 | | | | 408,524 | | | | 31,152,984 | | |
Corporate Bonds | | | — | | | | 49,079,154 | | | | 28,365,872 | | | | 2,291,061,269 | | |
Asset-Backed Securities | | | — | | | | — | | | | 441,393 | | | | 34,094,960 | | |
Term Loans | | | — | | | | — | | | | 996,002 | | | | 96,201,568 | | |
Time Deposits | | | 28,446 | | | | 4,856,538 | | | | 1,665,180 | | | | 168,731,242 | | |
Level 3 — Significant unobservable inputs: | |
Common Stocks: | |
Consumer Discretionary/Automakers | | | — | | | | — | | | | 0 | | | | 0 | | |
Energy/Energy — Exploration & Production | | | — | | | | — | | | | 0 | | | | 0 | | |
Preferred Stocks: | |
Energy/Energy — Exploration & Production | | | — | | | | — | | | | 11,645 | | | | 1,548,908 | | |
Corporate Bonds | | | — | | | | — | | | | 0 | | | | 0 | | |
Total Investments | | $ | 6,279,833 | | | $ | 646,964,742 | | | $ | 76,005,124 | | | $ | 2,731,285,767 | | |
Other Financial Instruments | |
Level 1 — Quoted prices in an active market | | | | | | $ | — | | | | | | | $ | — | | |
Level 2 — Other significant observable market inputs: | |
Futures Contracts* | | | | | | | (594,243 | ) | | | | | | | — | | |
Credit Default Swap Contracts* | | | | | | | — | | | | | | | | 62,790 | | |
Level 3 — Significant unobservable inputs | | | | | | | — | | | | | | | | — | | |
Total Other Financial Instruments | | | | | | $ | (594,243 | ) | | | | | | $ | 62,790 | | |
* Futures contracts and credit default swap contracts are derivative instruments not reflected on the Schedule of Investments and are reflected at the unrealized appreciation (depreciation) on the instrument.
73
Please refer to the Schedule of Investments for additional information regarding the composition of the amounts listed above.
There were transfers from Level 1 to Level 2 of $5,449,682 for the Small Cap Value Fund, $107,759 for the Global Value Fund and $2,010,010 for the Value Opportunities Fund using market values as of June 30, 2015. The transfers were due to securities being fair valued as a result of market movements following the close of local trading on June 30, 2015. There were transfers from Level 2 to Level 1 of $167,038 for the Global Value Fund and $4,789,219 for the Value Opportunities Fund using market values as of June 30, 2015. The transfers were due to securities being fair valued as a result of market movements following the close of local trading at the beginning of the reporting period. There were transfers from Level 1 to Level 2 of $23,327 for the Capital Income Fund and $1,539,065 for the High Yield Fund using market values as of June 30, 2015. The transfers were due to lack of trading volume on June 30, 2015. There were transfers from Level 2 to Level 1 of $197,637 for the Value Opportunities Fund using market values as of June 30, 2015. The transfers were due to increased trading volume on June 30, 2015. There were no transfers into or out of Level 1 or Level 2 during the year ended June 30, 2015 for the Diversified Value Fund, Large Cap Value Fund, Mid-Cap Value Fund and Small Cap Diversified Value Fund. Transfers between Levels are recognized at the end of the reporting period.
Income and Expense Allocation. Common expenses incurred by the Trust which are not allocable to a specific Fund are allocated among the Funds based upon relative net assets or evenly, depending on the nature of the expenditure. For all Funds, except the Capital Income Fund and High Yield Fund, net investment income, other than class-specific expenses, and realized and unrealized gains and losses are allocated daily to each class of shares based upon the relative net asset value of outstanding shares of each class at the beginning of the day (after adjusting for the current day's capital share activity of the respective class). For the Capital Income Fund and High Yield Fund, net investment income, other than class-specific expenses, and realized and unrealized gains and losses are allocated daily to each class of shares based upon the relative net asset value of settled shares of each class at the beginning of the day (after adjusting for the current day's capital share activity of the respective class).
Dividends and Distributions to Shareholders. Dividends and distributions to shareholders are recorded on the ex-dividend date. Dividends from net investment income are declared daily and paid monthly for the Capital Income Fund and High Yield Fund and declared and paid annually for the Diversified Value Fund, Large Cap Value Fund, Mid-Cap Value Fund, Small Cap Value Fund, Small Cap Diversified Value Fund, Global Value Fund and Value Opportunities Fund. Distributions of net realized capital gains, if any, will be declared and paid at least annually.
Security Transactions and Investment Income. Security and shareholder transactions are recorded on trade date. Realized gains and losses on sales of investments are calculated on the specifically identified cost basis of the securities. Dividend income, less foreign taxes withheld, if any, is recorded on the ex-dividend date. Interest income is recognized on the accrual basis. Market discounts, premiums and original issue discounts on fixed-income securities are amortized daily over the expected life of the security using the effective yield method. Return of capital distributions received from real estate investment trust ("REIT") securities are recorded as an adjustment to the cost of the security and thus may impact unrealized gains or losses on the security.
Securities purchased or sold on a when-issued, delayed delivery or forward commitment basis may have extended settlement periods. The value of the security purchased is subject to market fluctuations during this period. The Funds will segregate or "earmark" liquid assets until the settlement date or otherwise cover their position in an amount sufficient to meet the Funds' obligations.
Foreign Currency Transactions. Securities and other assets and liabilities denominated in foreign currencies are translated into U.S. dollar amounts at the date of valuation. Purchases and sales of securities and income and expense items denominated in foreign currencies are translated into U.S. dollar amounts on the respective dates of such transactions. The Funds isolate the portion of realized gains or losses resulting from changes in foreign exchange rates on securities from the fluctuations arising from changes in market prices of securities held. Reported net realized foreign exchange gains or losses arise from sales of securities, currency gains or losses realized between the trade and settlement dates on securities transactions and the difference between the amounts of dividends, interest and foreign withholding taxes recorded on the Funds' books and the U.S. dollar equivalent of the amounts actually received or paid.
Payment In-Kind Securities. Certain Funds may invest in payment in-kind securities. Payment in-kind securities give the issuer the option at each interest payment date of making interest payments in either cash or additional debt securities. Those additional debt securities usually have the same terms, including maturity dates and interest rates, and associated risks as the original bonds. The daily market quotations of the original bonds may include the accrued interest (referred to as a dirty price) and may require a pro-rata adjustment to interest receivable from the unrealized appreciation or depreciation of securities on the Statements of Assets & Liabilities.
Restricted and Illiquid Securities. The Funds may invest in securities that are subject to legal or contractual restrictions on resale or are illiquid. Restricted securities generally may be resold in transactions exempt from registration. An illiquid security is a security which cannot be disposed of promptly (within seven days) and in the usual course of business at approximately its fair value and includes repurchase agreements maturing in excess of seven days, time deposits with a withdrawal penalty, non-negotiable instruments and instruments for which no market exists. Disposal of these securities may involve time-consuming negotiations and expense, and prompt sale at the current valuation may be difficult.
Options. The Funds are subject to equity price risk in the normal course of pursuing their investment objectives. The Funds may purchase put options on securities to protect holdings in an underlying or related security against a substantial decline in market value. The Funds may purchase call options on securities and security indexes. A Fund may write a call or put option only if the option is "covered" by the Fund holding a position in the underlying securities or by other means which would permit immediate satisfaction of the Fund's obligation as writer of the option. Prior to exercise or expiration, an option may be closed by an offsetting purchase or sale of an option of the same series. The purchase and writing of options involves certain risks. If a put or call option purchased by a Fund is not sold when it has remaining value, and if the market price of the underlying security, in the case of a put, remains equal to or greater than the exercise price or, in the case of a call, remains less than or equal to the exercise price, the Fund will lose its entire investment in the option. There can be no assurance that a liquid market will exist when a Fund seeks to close out an option position. Furthermore, if trading restrictions or suspensions are imposed on the options markets, the Fund may be unable to close out a position. With options, there is minimal counterparty risk to the Funds since options are exchange traded and the exchange's clearinghouse, as counterparty to all exchange traded options, guarantees the options against default.
74
When a Fund purchases a put or call option, an amount equal to the premium paid is included on the Statements of Assets & Liabilities as an investment, and is subsequently adjusted to reflect the fair market value of the option. If an option expires on the stipulated expiration date or if the Fund enters into a closing sale transaction, a gain or loss is realized. If the Fund exercises a put option, a gain or loss is realized from the sale of the underlying security, and the proceeds from such sale are decreased by the premium originally paid. If the Fund exercises a call option, the cost of the security acquired is increased by the premium paid for the call.
Futures Contracts. The Value Opportunities Fund is subject to foreign currency exchange rate risk in the normal course of pursuing its investment objective. The Fund may use futures contracts to gain exposure to, or hedge against, changes in the value of foreign currencies. A futures contract provides for the future sale by one party and purchase by another party of an asset at a specified price on a specified date. Upon entering into such contracts, the Fund is required to deposit with the broker, either in cash or securities, an initial margin deposit in an amount equal to a certain percentage of the contract amount. Subsequent payments (variation margin) are made or received by the Fund each day, depending on the daily fluctuations in the value of the contract, and are recorded for financial statement purposes as unrealized gains or losses by the Fund. Upon entering into such contracts, the Fund bears the risk of exchange rates moving unexpectedly, in which case the Fund may not achieve the anticipated benefits of the futures contracts and may realize a loss. When a contract is closed, the Fund records a realized gain or loss equal to the difference between the proceeds from (or cost of) the closing transaction and the Fund's basis in the contract. With futures, there is minimal counterparty risk to the Fund since futures are exchange traded and the exchange's clearinghouse, as counterparty to all exchange traded futures, guarantees the futures against default. The use of futures contracts involves the risk of imperfect correlation in movements in the price of the futures contracts, exchange rates and the underlying hedged assets.
Credit Default Swap Contracts. The Value Opportunities Fund, Capital Income Fund and High Yield Fund may enter into credit default swap agreements for purposes of attempting to obtain a particular desired return at a lower cost to the Fund than if the Fund had invested directly in an instrument that yielded the desired return. The buyer in a credit default swap is obligated to pay the seller a periodic stream of payments over the term of the contract provided no event of default on an underlying reference obligation has occurred. In the event of default, the seller must pay the buyer the full notional amount ("par value") of the underlying reference obligation in exchange for the underlying reference obligation. Credit default swaps involve greater risks than if the Fund invested in the reference obligation directly. In addition to general market risks, credit default swaps are subject to illiquidity risk, counterparty risk and credit risk. The Fund's maximum risk of loss from counterparty risk, either as the protection seller or as the protection buyer, is the fair value of the contract. This risk is mitigated by having a master netting arrangement between the Fund and the counterparty and by the posting of collateral by the counterparty to the Fund to cover the Fund's exposure to the counterparty.
The Value Opportunities Fund, Capital Income Fund and High Yield Fund are party to an International Swap Dealers Association, Inc. Master Agreement ("ISDA Master Agreement") with each of Goldman Sachs International and JPMorgan Chase Bank, N.A. that governs transactions, such as over-the-counter swap contracts, entered into by the Funds and the counterparty. The ISDA Master Agreement contains provisions for general obligations, representations, agreements, collateral and events of default or termination. Events of termination include conditions that may entitle the counterparty to elect to terminate early and cause settlement of all outstanding transactions under the ISDA Master Agreement.
Upon entering into swap agreements, the Value Opportunities Fund, Capital Income Fund and High Yield Fund will either receive or pay an upfront payment based upon the difference between the current principal amount and the notional amount of the swap and whether the Fund is buying or selling protection. Upfront payments that are received are recorded as liabilities while upfront payments paid are recorded as assets. These payments remain on the books until the swap contract is closed. When entering into credit default swaps, the Fund will either deliver collateral to the counterparty or the counterparty will deliver collateral to the Fund. The amount of this collateral is calculated based upon the notional value and the current price of the swap. In the event of default, the Fund has recourse against any collateral posted to it by the counterparty. When entering into swap agreements as a seller, the notional amounts would be partially offset by any recovery values of the respective reference obligations, upfront payments received upon entering into the agreement, or net amounts received from the settlement of buy protection credit default swap agreements entered into by the Fund for the same reference entity. Unrealized appreciation or depreciation is recorded daily as the difference between the prior day and current day closing price.
Derivative Instruments. The Funds have adopted authoritative standards regarding disclosures about derivatives and how they affect the Funds' Statements of Assets & Liabilities and Statements of Operations.
The following is a summary of the Funds' derivative instrument holdings categorized by primary risk exposure as of June 30, 2015:
Asset Derivatives
| | Location on Statements of
Assets & Liabilities | | Value
Opportunities | | High
Yield | |
Credit Contracts: | |
Credit Default Swap Contracts | | Premiums paid for credit default swap contracts | | $ | — | | | $ | 573,354 | | |
| | | Unrealized appreciation on credit default swap
contracts | | | — | | | | 62,790 | | |
Liability Derivatives
| | Location on Statements of
Assets & Liabilities | | Value
Opportunities | | High
Yield | |
Foreign Exchange Contracts: | |
Futures Contracts | | Net unrealized depreciation of futures contracts* | | $ | (594,243 | ) | | $ | — | | |
* Includes cumulative depreciation of futures contracts as reported in the "Net Assets consist of:" section on the Statements of Assets & Liabilities.
75
The following is a summary of the Funds' realized gains (losses) and change in unrealized appreciation (depreciation) on derivative instruments recognized in the Statements of Operations categorized by primary risk exposure for the year ended June 30, 2015:
Realized Gains (Losses) on Derivatives
| | Value Opportunities | | Capital Income | | High Yield | |
Credit Contracts: | |
Credit Default Swap Contracts | | $ | — | | | $ | 36,200 | | | $ | 1,771,451 | | |
Foreign Exchange Contracts: | |
Futures Contracts | | | 8,844,916 | | | | — | | | | — | | |
Equity Contracts: | |
Purchased Put Options | | | (1,016,113 | )* | | | — | | | | — | | |
* Included with net realized gains (losses) from sales of unaffiliated issuers.
Change in Unrealized Appreciation (Depreciation) on Derivatives
| | Value Opportunities | | High Yield | |
Credit Contracts: | |
Credit Default Swap Contracts | | $ | — | | | $ | 62,790 | | |
Foreign Exchange Contracts: | |
Futures Contracts | | | (594,243 | ) | | | — | | |
Equity Contracts: | |
Purchased Put Options | | | 824,071 | * | | | — | | |
* Included with net change in unrealized appreciation (depreciation) of securities and foreign currency transactions.
The following is a summary of the Funds' average quarterly balance of outstanding derivative instruments categorized by primary risk exposure for the year ended June 30, 2015:
Average Quarterly Balance of Outstanding Derivatives
| | Value Opportunities | | Capital Income | | High Yield | |
Credit Contracts: | |
Average Number of Contracts — Credit Default Swap Contracts | | | — | | | | 1 | | | | 1 | | |
Average Notional Amount — Credit Default Swap Contracts | | $ | — | | | $ | (330,000 | ) | | $ | (33,980,000 | ) | |
Foreign Exchange Contracts: | |
Average Number of Contracts — Futures Contracts | | | (534 | ) | | | — | | | | — | | |
Average Notional Amount — Futures Contracts | | $ | (60,157,538 | ) | | $ | — | | | $ | — | | |
Equity Contracts: | |
Average Number of Contracts — Purchased Put Options | | | 800 | | | | — | | | | — | | |
Average Market Value — Purchased Put Options | | $ | 66,400 | | | $ | — | | | $ | — | | |
Offsetting Assets and Liabilities. The Funds are subject to various master netting arrangements, which govern the terms of certain transactions with counterparties. The arrangements allow the Funds to close out and net their total exposure to a counterparty in the event of a default with respect to all the transactions governed under a single agreement with a counterparty. For financial reporting purposes, the Funds do not offset financial assets and liabilities that are subject to master netting arrangements in the Statements of Assets & Liabilities.
The following is a summary of the arrangements subject to offsetting as of June 30, 2015:
| | | | | | | | Gross Amounts Not Offset in the
Statements of Assets & Liabilities | |
| | Gross Amounts | | Gross Amounts
Offset in the
Statements of
Assets &
Liabilities | | Net Amounts
Presented in the
Statements of
Assets &
Liabilities | | Financial
Instruments | | Collateral
Pledged
(Received) | | Net Amount | |
Assets: | |
Credit Default Swap Contracts: | |
High Yield | | $ | 62,790 | | | $ | — | | | $ | 62,790 | | | $ | — | | | $ | — | | | $ | 62,790 | | |
Futures Contracts: | |
Value Opportunities | | | 199,361 | | | | — | | | | 199,361 | | | | (11,250 | ) | | | 188,375 | | | | — | | |
76
| | | | | | | | Gross Amounts Not Offset in the
Statements of Assets & Liabilities | |
| | Gross Amounts | | Gross Amounts
Offset in the
Statements of
Assets &
Liabilities | | Net Amounts
Presented in the
Statements of
Assets &
Liabilities | | Financial
Instruments | | Collateral
Pledged
(Received) | | Net Amount | |
Liabilities: | |
Securities Lending: | |
Diversified Value | | $ | 5,985,033 | | | $ | — | | | $ | 5,985,033 | | | $ | 5,985,033 | | | $ | — | | | $ | — | | |
Large Cap Value | | | 7,895,512 | | | | — | | | | 7,895,512 | | | | 7,895,512 | | | | — | | | | — | | |
Mid-Cap Value | | | 39,991,213 | | | | — | | | | 39,991,213 | | | | 39,991,213 | | | | — | | | | — | | |
Small Cap Value | | | 45,944,634 | | | | — | | | | 45,944,634 | | | | 45,944,634 | | | | — | | | | — | | |
Value Opportunities | | | 6,060,485 | | | | — | | | | 6,060,485 | | | | 6,060,485 | | | | — | | | | — | | |
Futures Contracts: | |
Value Opportunities | | | 11,250 | | | | — | | | | 11,250 | | | | (11,250 | ) | | | — | | | | — | | |
NOTE 2.
Fees and Transactions with Affiliates. The Trust has entered into Investment Advisory Agreements for each of the Funds with the Advisor, with which the officers and a Trustee of the Trust are affiliated. The Advisor is a limited liability company, the primary members of which are HWCap Holdings, a limited liability company with members who are current and former employees of the Advisor, and Stephens - H&W, LLC, a limited liability company whose primary member is SF Holding Corp., which is a diversified holding company. The Advisor is responsible for the management of the Funds' investments and provides the personnel, facilities, equipment and certain other services necessary to the operations of each Fund. The Advisor receives a fee, computed daily and payable monthly, at the annual rates presented below as applied to each Fund's daily net assets. The Advisor has contractually agreed to waive fees or reimburse regular operating expenses in excess of the annual rates presented below as applied to such Fund's daily net assets through October 31, 2016.
| | | Diversified
Value | | Large Cap
Value | | Mid-Cap
Value | | Small Cap
Value | | Small Cap
Diversified
Value | | Global
Value | | Value
Opportunities | | Capital
Income | | High
Yield | |
Annual Advisory Fee Rate | | | 0.75 | %1 | | | 0.75 | %1 | | | 0.75 | %1 | | | 0.75 | % | | | 0.75 | % | | | 0.80 | % | | | 0.75 | % | | | 0.65 | % | | | 0.55 | % | |
Annual cap on expenses —
Class I | | | 0.95 | % | | | 1.05 | % | | | 1.15 | % | | | 1.25 | % | | | 1.25 | % | | | 1.10 | % | | | 1.25 | % | | | 0.80 | % | | | 0.70 | % | |
Annual cap on expenses —
Class A | | | 1.20 | % | | | 1.30 | % | | | 1.40 | % | | | 1.50 | % | | | 1.50 | % | | | 1.35 | % | | | 1.50 | % | | | 1.05 | % | | | 0.95 | % | |
Annual cap on expenses —
Class C | | | 1.95 | % | | | 2.05 | % | | | 2.15 | % | | | 2.25 | % | | | 2.25 | % | | | 2.10 | % | | | 2.25 | % | | | 1.80 | % | | | 1.70 | % | |
Annual cap on expenses —
Class R | | | N/A | | | | 1.55 | % | | | 1.65 | % | | | N/A | | | | N/A | | | | N/A | | | | N/A | | | | N/A | | | | N/A | | |
1 The Annual Advisory Fee Rate is 0.75% for the first $5 billion in assets, 0.65% for the next $5 billion in assets and 0.60% for assets over $10 billion.
Quasar Distributors, LLC is the principal underwriter and distributor for the shares of the Funds ("Quasar" or the "Distributor"). The Distributor is affiliated with the Funds' transfer agent, fund accountant and administrator, U.S. Bancorp Fund Services, LLC. Pursuant to the Distribution Plan adopted by the Trust in accordance with Rule 12b-1 under the 1940 Act, the Funds pay the Distributor ongoing distribution and service fees. The fees are accrued daily at the annual rates based upon the average daily net assets of the shares as follows:
| | | Distribution and Service
Fee | |
Class A | | | 0.25 | % | |
Class C | | | 1.00 | % | |
Class R | | | 0.50 | % | |
Pursuant to separate agreements with the Distributor, selected dealers and other financial intermediaries also provide distribution services to the Funds. The ongoing distribution and service fee compensates the Distributor and selected dealers for providing distribution-related and shareholder services to Class A, Class C and Class R shareholders.
Certain selected dealers and other financial intermediaries charge a fee for shareholder accounting services and administrative services that they provide to the Funds on behalf of certain shareholders; the portion of this fee paid by the Funds is included within "Transfer agent fees and expenses" in the Statements of Operations.
Stephens Inc. is an affiliated broker-dealer of the Funds. For the year ended June 30, 2015, Stephens Inc. received the following amounts of front-end sales charges for Class A shares:
Diversified
Value | | Large Cap
Value | | Mid-Cap
Value | | Small Cap
Value | | Small Cap
Diversified
Value | | Global
Value | | Value
Opportunities | | Capital
Income | | High Yield | |
$ | — | | | $ | 6 | | | $ | — | | | $ | — | | | $ | — | | | $ | — | | | $ | 22 | | | $ | — | | | $ | — | | |
77
U.S. Bancorp Fund Services, LLC, the Funds' administrator, agreed to waive a portion of its administration and accounting fees during the Small Cap Diversified Value Fund's first twelve months of operations.
NOTE 3.
Investments. Purchases and sales of investment securities, excluding short-term investments, for the year ended June 30, 2015 were as follows:
| | Diversified
Value | | Large Cap
Value | | Mid-Cap
Value | | Small Cap
Value | | Small Cap
Diversified
Value | | Global
Value | | Value
Opportunities | | Capital
Income | | High Yield | |
Purchases | | $ | 203,692,586 | | | $ | 296,265,562 | | | $ | 1,760,371,274 | | | $ | 545,384,548 | | | $ | 18,505,061 | | | $ | 4,537,537 | | | $ | 697,463,029 | | | $ | 56,610,796 | | | $ | 1,911,863,338 | | |
Sales | | | 224,519,230 | | | | 366,694,591 | | | | 1,857,612,684 | | | | 458,095,780 | | | | 3,178,303 | | | | 2,146,565 | | | | 556,614,357 | | | | 45,008,092 | | | | 908,363,045 | | |
The Funds did not have any purchases or sales of U.S. Government securities for the year ended June 30, 2015.
NOTE 4.
Federal Income Taxes. It is each Fund's policy to comply with the requirements of the Internal Revenue Code applicable to regulated investment companies and each Fund intends to distribute substantially all of its investment company net taxable income and net capital gains to shareholders. Therefore, no federal income tax provision is required. Under the applicable foreign tax law, a withholding tax may be imposed on interest, dividends and capital gains at various rates.
Distributions paid to shareholders are based on net investment income and net realized gains determined on a tax basis, which may differ from net investment income and net realized gains for financial reporting purposes. The fiscal year in which amounts are distributed may differ from the year in which the net investment income and net realized gains are recorded by the Funds for financial reporting purposes. The Funds may utilize earnings and profits distributed to shareholders on redemptions of shares as part of the dividends paid deduction. Generally accepted accounting principles require that permanent financial reporting and tax differences be reclassified within the capital accounts.
The following information is presented on an income tax basis as of June 30, 2015:
| | | Diversified
Value | | Large Cap
Value | | Mid-Cap
Value | | Small Cap
Value | | Small Cap
Diversified
Value | | Global
Value | | Value
Opportunities | | Capital
Income | | High Yield | |
Tax cost of
investments | | $ | 527,118,278 | | | $ | 724,396,689 | | | $ | 3,181,967,638 | | | $ | 1,042,323,882 | | | $ | 15,077,555 | | | $ | 6,173,605 | | | $ | 630,903,794 | | | $ | 73,794,369 | | | $ | 2,622,101,979 | | |
Gross unrealized
appreciation | | | 74,344,113 | | | | 77,686,943 | | | | 395,427,478 | | | | 200,505,353 | | | | 1,357,745 | | | | 553,911 | | | | 48,513,867 | | | | 4,631,124 | | | | 47,049,065 | | |
Gross unrealized
depreciation | | | (68,062,289 | ) | | | (93,306,008 | ) | | | (290,037,069 | ) | | | (92,405,372 | ) | | | (1,147,856 | ) | | | (476,129 | ) | | | (43,369,942 | ) | | | (4,085,549 | ) | | | (106,596,519 | ) | |
Net unrealized
appreciation
(depreciation) | | | 6,281,824 | | | | (15,619,065 | ) | | | 105,390,409 | | | | 108,099,981 | | | | 209,889 | | | | 77,782 | | | | 5,143,925 | | | | 545,575 | | | | (59,547,454 | ) | |
Distributable
ordinary income
(as of 6/30/15) | | | 6,224,082 | | | | 9,065,264 | | | | 38,834,103 | | | | 12,487,668 | | | | 39,482 | | | | 66,482 | | | | 29,563,580 | | | | 763,094 | | | | 8,843,036 | | |
Distributable
long-term gains
(as of 6/30/15) | | | — | | | | — | | | | 172,079,618 | | | | 55,316,637 | | | | 223,457 | | | | 154,265 | | | | 42,273,973 | | | | 832,386 | | | | 13,331,886 | | |
Total distributable
earnings | | | 6,224,082 | | | | 9,065,264 | | | | 210,913,721 | | | | 67,804,305 | | | | 262,939 | | | | 220,747 | | | | 71,837,553 | | | | 1,595,480 | | | | 22,174,922 | | |
Other accumulated
gains (losses) | | | (633,573,972 | ) | | | (1,057,018,542 | ) | | | 1 | | | | (612 | ) | | | (2,623 | ) | | | 11 | | | | (699 | ) | | | (70,557 | ) | | | (3,062,197 | ) | |
Total accumulated
gains (losses) | | $ | (621,068,066 | ) | | $ | (1,063,572,343 | ) | | $ | 316,304,131 | | | $ | 175,903,674 | | | $ | 470,205 | | | $ | 298,540 | | | $ | 76,980,779 | | | $ | 2,070,498 | | | $ | (40,434,729 | ) | |
As of the close of business on December 31, 2010, in exchange for shares the Advisor transferred assets valued at $3,298,650 to the Capital Income Fund. As a result of the tax-deferred transfers, the Capital Income Fund acquired $30,179 of unrealized appreciation for tax purposes. As of June 30, 2015, the Capital Income Fund held securities with $10,818 of net unrealized appreciation relating to the transfers.
As of the close of business on December 31, 2012, in exchange for shares the Advisor transferred assets valued at $1,132,946 to the Global Value Fund. As a result of the tax-deferred transfers, the Global Value Fund acquired $50,230 of unrealized appreciation for tax purposes. As of June 30, 2015, the Global Value Fund held securities with $35,935 of net unrealized appreciation relating to the transfers.
As of the close of business on June 30, 2014, in exchange for shares Stephens Investment Holdings LLC transferred assets valued at $5,038,896 to the Small Cap Diversified Value Fund. As a result of the tax-deferred transfers, the Small Cap Diversified Value Fund acquired $592,438 of unrealized appreciation for tax purposes. As of June 30, 2015, the Small Cap Diversified Value Fund held securities with $368,476 of net unrealized appreciation relating to the transfers.
78
On the Statements of Assets & Liabilities, the following adjustments were made for permanent tax differences. These differences are due primarily to differing treatment for items such as foreign currency gain/loss transactions, PFICs, partnership adjustments, swap interest reclass and transfers in-kind.
| | Paid-In
Capital | | Undistributed
Net Investment
Income | | Undistributed
Net Realized
Gain (Loss) | |
Diversified Value | | $ | — | | | $ | (456 | ) | | $ | 456 | | |
Large Cap Value | | | — | | | | (661 | ) | | | 661 | | |
Mid-Cap Value | | | — | | | | (56,925 | ) | | | 56,925 | | |
Small Cap Value | | | — | | | | (75,036 | ) | | | 75,036 | | |
Small Cap Diversified Value | | | (592,439 | ) | | | 3,179 | | | | 589,260 | | |
Global Value | | | — | | | | (2,183 | ) | | | 2,183 | | |
Value Opportunities | | | — | | | | (243,617 | ) | | | 243,617 | | |
Capital Income | | | — | | | | 29,031 | | | | (29,031 | ) | |
High Yield | | | — | | | | 1,998,924 | | | | (1,998,924 | ) | |
The tax components of distributions paid during the fiscal years ended June 30, 2015 and 2014, capital loss carryovers as of June 30, 2015, and any tax basis late year losses as of June 30, 2015, which are not recognized for tax purposes until the first day of the following fiscal year, are:
| | | June 30, 2015 | | June 30, 2014 | |
| | | Ordinary
Income
Distributions | | Long-Term
Capital Gains
Distributions | | Net Capital
Loss
Carryovers | | Capital Loss
Carryovers
Utilized | | Late
Year
Losses | | Ordinary
Income
Distributions | | Long-Term
Capital Gains
Distributions | |
Diversified Value | | $ | 12,803,931 | | | $ | — | | | $ | (633,573,972 | )1 | | $ | 66,905,320 | | | $ | — | | | $ | 5,434,850 | | | $ | — | | |
Large Cap Value | | | 21,717,397 | | | | — | | | | (1,057,018,542 | )2 | | | 80,515,360 | | | | — | | | | 7,984,056 | | | | — | | |
Mid-Cap Value | | | 44,412,431 | | | | 266,887,010 | | | | — | | | | — | | | | — | | | | 7,653,890 | | | | — | | |
Small Cap Value | | | 20,071,822 | | | | 100,654,562 | | | | — | | | | — | | | | — | | | | 21,241,525 | | | | 45,475,686 | | |
Small Cap Diversified Value* | | | 102,942 | | | | 42,529 | | | | — | | | | — | | | | — | | | | — | | | | — | | |
Global Value | | | 190,514 | | | | 215,575 | | | | — | | | | — | | | | — | | | | 163,376 | | | | 59,905 | | |
Value Opportunities | | | 16,452,433 | | | | 30,736,003 | | | | — | | | | — | | | | — | | | | 11,464,397 | | | | 8,548,334 | | |
Capital Income | | | 3,371,754 | | | | 713,388 | | | | — | | | | — | | | | — | | | | 1,996,888 | | | | 585,393 | | |
High Yield | | | 124,042,629 | | | | 14,239,999 | | | | — | | | | — | | | | — | | | | 86,349,686 | | | | 8,682,719 | | |
* The Fund commenced operations on June 30, 2014.
1 $392,036,711 expires on 6/30/2017 and $241,537,261 expires on 6/30/2018.
2 $614,422,104 expires on 6/30/2017 and $442,596,438 expires on 6/30/2018.
As of and during the year ended June 30, 2015, the Funds did not have a liability for any unrecognized tax benefits. The Funds recognize interest and penalties, if any, related to unrecognized tax benefits as income tax expense in the Statements of Operations. During the year ended June 30, 2015, the Funds did not incur any interest or penalties. The tax years ended June 30, 2012 through June 30, 2015 remain open and subject to examination by tax jurisdictions.
NOTE 5.
Capital Share Transactions. Transactions in capital shares for each class were as follows:
| | Sales | | Reinvestment of
dividends
and distributions | | Redemptions | | Net increase (decrease) | |
| | Shares | | Amount | | Shares | | Amount | | Shares | | Amount | | Shares | | Amount | |
Year Ended June 30, 2015 | |
Diversified Value Fund | |
Class I | | | 5,801,870 | | | $ | 90,776,761 | | | | 754,476 | | | $ | 11,339,777 | | | | (7,624,636 | ) | | $ | (119,399,654 | ) | | | (1,068,290 | ) | | $ | (17,283,116 | ) | |
Class A | | | 468,469 | | | | 7,275,362 | | | | 43,270 | | | | 652,506 | | | | (1,015,064 | ) | | | (15,812,307 | ) | | | (503,325 | ) | | | (7,884,439 | ) | |
Class C | | | 78,136 | | | | 1,213,550 | | | | 1,125 | | | | 16,860 | | | | (90,182 | ) | | | (1,395,205 | ) | | | (10,921 | ) | | | (164,795 | ) | |
Total net increase
(decrease) | | | 6,348,475 | | | | 99,265,673 | | | | 798,871 | | | | 12,009,143 | | | | (8,729,882 | ) | | | (136,607,166 | ) | | | (1,582,536 | ) | | | (25,332,350 | ) | |
Large Cap Value Fund | |
Class I | | | 4,280,905 | | | | 113,995,916 | | | | 540,634 | | | | 14,075,352 | | | | (5,964,207 | ) | | | (161,943,181 | ) | | | (1,142,668 | ) | | | (33,871,913 | ) | |
Class A | | | 1,366,332 | | | | 36,079,025 | | | | 172,790 | | | | 4,473,387 | | | | (2,882,728 | ) | | | (75,877,206 | ) | | | (1,343,606 | ) | | | (35,324,794 | ) | |
Class C | | | 750,023 | | | | 19,349,234 | | | | 18,432 | | | | 466,792 | | | | (207,366 | ) | | | (5,433,992 | ) | | | 561,089 | | | | 14,382,034 | | |
Class R | | | 153,859 | | | | 4,123,248 | | | | 7,592 | | | | 197,836 | | | | (135,675 | ) | | | (3,648,224 | ) | | | 25,776 | | | | 672,860 | | |
Total net increase
(decrease) | | | 6,551,119 | | | | 173,547,423 | | | | 739,448 | | | | 19,213,367 | | | | (9,189,976 | ) | | | (246,902,603 | ) | | | (1,899,409 | ) | | | (54,141,813 | ) | |
79
| | | Sales | | Reinvestment of
dividends
and distributions | | Redemptions | | Net increase (decrease) | |
| | | Shares | | Amount | | Shares | | Amount | | Shares | | Amount | | Shares | | Amount | |
Year Ended June 30, 2015 | |
Mid-Cap Value Fund | |
Class I | | | 18,607,037 | | | $ | 782,048,516 | | | | 5,233,267 | | | $ | 203,574,095 | | | | (18,508,793 | ) | | $ | (785,001,812 | ) | | | 5,331,511 | | | $ | 200,620,799 | | |
Class A | | | 3,393,489 | | | | 142,663,703 | | | | 1,401,404 | | | | 53,883,999 | | | | (8,434,347 | ) | | | (350,666,927 | ) | | | (3,639,454 | ) | | | (154,119,225 | ) | |
Class C | | | 351,372 | | | | 13,129,293 | | | | 233,747 | | | | 8,195,168 | | | | (793,633 | ) | | | (30,265,856 | ) | | | (208,514 | ) | | | (8,941,395 | ) | |
Class R | | | 164,928 | | | | 6,833,925 | | | | 29,401 | | | | 1,135,778 | | | | (279,381 | ) | | | (11,658,131 | ) | | | (85,052 | ) | | | (3,688,428 | ) | |
Total net increase
(decrease) | | | 22,516,826 | | | | 944,675,437 | | | | 6,897,819 | | | | 266,789,040 | | | | (28,016,154 | ) | | | (1,177,592,726 | ) | | | 1,398,491 | | | | 33,871,751 | | |
Small Cap Value Fund | |
Class I | | | 5,457,516 | | | | 337,618,299 | | | | 1,064,758 | | | | 61,457,813 | | | | (2,883,746 | ) | | | (179,382,881 | ) | | | 3,638,528 | | | | 219,693,231 | | |
Class A | | | 1,136,077 | | | | 69,792,007 | | | | 260,267 | | | | 14,947,145 | | | | (1,302,186 | ) | | | (81,149,357 | ) | | | 94,158 | | | | 3,589,795 | | |
Class C | | | 67,964 | | | | 3,583,474 | | | | 54,600 | | | | 2,736,546 | | | | (193,735 | ) | | | (10,641,952 | ) | | | (71,171 | ) | | | (4,321,932 | ) | |
Total net increase
(decrease) | | | 6,661,557 | | | | 410,993,780 | | | | 1,379,625 | | | | 79,141,504 | | | | (4,379,667 | ) | | | (271,174,190 | ) | | | 3,661,515 | | | | 218,961,094 | | |
Small Cap Diversified Value Funda | |
Class I* | | | 1,523,152 | | | | 15,379,897 | | | | 15,041 | | | | 142,892 | | | | (6,369 | ) | | | (63,518 | ) | | | 1,531,824 | | | | 15,459,271 | | |
Class A* | | | 13,213 | | | | 132,500 | | | | 271 | | | | 2,578 | | | | (493 | ) | | | (5,041 | ) | | | 12,991 | | | | 130,037 | | |
Total net increase
(decrease) | | | 1,536,365 | | | | 15,512,397 | | | | 15,312 | | | | 145,470 | | | | (6,862 | ) | | | (68,559 | ) | | | 1,544,815 | | | | 15,589,308 | | |
Global Value Fundb | |
Class I | | | 197,769 | | | | 2,424,855 | | | | 34,177 | | | | 386,888 | | | | (7,394 | ) | | | (87,949 | ) | | | 224,552 | | | | 2,723,794 | | |
Class A | | | 2,101 | | | | 26,271 | | | | 947 | | | | 10,720 | | | | (4,123 | ) | | | (48,459 | ) | | | (1,075 | ) | | | (11,468 | ) | |
Total net increase
(decrease) | | | 199,870 | | | | 2,451,126 | | | | 35,124 | | | | 397,608 | | | | (11,517 | ) | | | (136,408 | ) | | | 223,477 | | | | 2,712,326 | | |
Value Opportunities Fund | |
Class I | | | 5,866,864 | | | | 169,563,337 | | | | 601,633 | | | | 15,937,260 | | | | (2,868,306 | ) | | | (81,441,127 | ) | | | 3,600,191 | | | | 104,059,470 | | |
Class A | | | 4,207,087 | | | | 121,331,659 | | | | 482,759 | | | | 12,802,765 | | | | (3,314,597 | ) | | | (94,175,936 | ) | | | 1,375,249 | | | | 39,958,488 | | |
Class C | | | 1,146,520 | | | | 31,325,419 | | | | 142,433 | | | | 3,567,942 | | | | (330,689 | ) | | | (8,991,008 | ) | | | 958,264 | | | | 25,902,353 | | |
Total net increase
(decrease) | | | 11,220,471 | | | | 322,220,415 | | | | 1,226,825 | | | | 32,307,967 | | | | (6,513,592 | ) | | | (184,608,071 | ) | | | 5,933,704 | | | | 169,920,311 | | |
Capital Income Fund | |
Class I | | | 2,254,647 | | | | 27,957,139 | | | | 83,551 | | | | 1,031,748 | | | | (1,225,539 | ) | | | (15,194,349 | ) | | | 1,112,659 | | | | 13,794,538 | | |
Class A | | | 2,552,457 | | | | 33,029,293 | | | | 176,278 | | | | 2,245,471 | | | | (2,995,280 | ) | | | (38,569,365 | ) | | | (266,545 | ) | | | (3,294,601 | ) | |
Total net increase
(decrease) | | | 4,807,104 | | | | 60,986,432 | | | | 259,829 | | | | 3,277,219 | | | | (4,220,819 | ) | | | (53,763,714 | ) | | | 846,114 | | | | 10,499,937 | | |
High Yield Fund | |
Class I | | | 118,586,577 | | | | 1,503,675,337 | | | | 5,591,916 | | | | 70,620,729 | | | | (43,696,611 | ) | | | (554,448,480 | )1 | | | 80,481,882 | | | | 1,019,847,586 | | |
Class A | | | 19,316,095 | | | | 244,902,231 | | | | 2,955,264 | | | | 37,169,600 | | | | (13,081,404 | ) | | | (165,555,411 | )1 | | | 9,189,955 | | | | 116,516,420 | | |
Class C | | | 116,003 | | | | 1,494,869 | | | | 6,735 | | | | 84,989 | | | | (107,303 | ) | | | (1,350,983 | )1 | | | 15,435 | | | | 228,875 | | |
Total net increase
(decrease) | | | 138,018,675 | | | | 1,750,072,437 | | | | 8,553,915 | | | | 107,875,318 | | | | (56,885,318 | ) | | | (721,354,874 | ) | | | 89,687,272 | | | | 1,136,592,881 | | |
Year Ended June 30, 2014 | |
Diversified Value Fund | |
Class I | | | 7,744,855 | | | | 109,380,942 | | | | 355,404 | | | | 4,858,367 | | | | (6,078,279 | ) | | | (84,688,097 | ) | | | 2,021,980 | | | | 29,551,212 | | |
Class A | | | 1,428,704 | | | | 20,377,139 | | | | 16,116 | | | | 221,112 | | | | (431,099 | ) | | | (6,148,279 | ) | | | 1,013,721 | | | | 14,449,972 | | |
Class C | | | 159,950 | | | | 2,292,863 | | | | 2,404 | | | | 32,478 | | | | (827,659 | ) | | | (11,448,396 | ) | | | (665,305 | ) | | | (9,123,055 | ) | |
Total net increase
(decrease) | | | 9,333,509 | | | | 132,050,944 | | | | 373,924 | | | | 5,111,957 | | | | (7,337,037 | ) | | | (102,284,772 | ) | | | 2,370,396 | | | | 34,878,129 | | |
80
| | | Sales | | Reinvestment of
dividends
and distributions | | Redemptions | | Net increase (decrease) | |
| | | Shares | | Amount | | Shares | | Amount | | Shares | | Amount | | Shares | | Amount | |
Year Ended June 30, 2014 | |
Large Cap Value Fund | |
Class I# | | | 5,749,044 | | | $ | 139,610,226 | | | | 240,030 | | | $ | 5,467,702 | | | | (5,457,112 | ) | | $ | (132,675,487 | ) | | | 531,962 | | | $ | 12,402,441 | | |
Class A | | | 9,882,786 | | | | 236,147,761 | | | | 79,926 | | | | 1,820,889 | | | | (8,894,700 | ) | | | (226,227,261 | ) | | | 1,068,012 | | | | 11,741,389 | | |
Class C | | | 825,187 | | | | 20,438,064 | | | | — | | | | — | | | | (234,290 | ) | | | (5,206,458 | ) | | | 590,897 | | | | 15,231,606 | | |
Class R | | | 131,904 | | | | 3,230,512 | | | | 2,719 | | | | 61,986 | | | | (135,322 | ) | | | (3,296,728 | ) | | | (699 | ) | | | (4,230 | ) | |
Total net increase
(decrease) | | | 16,588,921 | | | | 399,426,563 | | | | 322,675 | | | | 7,350,577 | | | | (14,721,424 | ) | | | (367,405,934 | ) | | | 2,190,172 | | | | 39,371,206 | | |
Mid-Cap Value Fund | |
Class I+ | | | 21,696,406 | | | | 871,718,154 | | | | 146,545 | | | | 5,713,799 | | | | (11,553,595 | ) | | | (458,599,113 | ) | | | 10,289,356 | | | | 418,832,840 | | |
Class A | | | 13,471,669 | | | | 527,734,790 | | | | 26,702 | | | | 1,029,893 | | | | (5,792,950 | ) | | | (231,877,240 | ) | | | 7,705,421 | | | | 296,887,443 | | |
Class C | | | 2,236,257 | | | | 80,275,539 | | | | 1,722 | | | | 61,387 | | | | (413,830 | ) | | | (15,332,771 | ) | | | 1,824,149 | | | | 65,004,155 | | |
Class R | | | 407,203 | | | | 16,150,512 | | | | 328 | | | | 12,716 | | | | (133,076 | ) | | | (5,454,447 | ) | | | 274,455 | | | | 10,708,781 | | |
Total net increase
(decrease) | | | 37,811,535 | | | | 1,495,878,995 | | | | 175,297 | | | | 6,817,795 | | | | (17,893,451 | ) | | | (711,263,571 | ) | | | 20,093,381 | | | | 791,433,219 | | |
Small Cap Value Fund | |
Class I | | | 5,098,049 | | | | 314,352,463 | | | | 470,827 | | | | 27,129,048 | | | | (2,026,594 | ) | | | (122,912,360 | ) | | | 3,542,282 | | | | 218,569,151 | | |
Class A | | | 1,904,596 | | | | 113,780,688 | | | | 172,679 | | | | 9,910,020 | | | | (885,511 | ) | | | (53,985,558 | ) | | | 1,191,764 | | | | 69,705,150 | | |
Class C | | | 255,485 | | | | 13,599,999 | | | | 38,776 | | | | 1,989,199 | | | | (144,442 | ) | | | (7,887,690 | ) | | | 149,819 | | | | 7,701,508 | | |
Total net increase
(decrease) | | | 7,258,130 | | | | 441,733,150 | | | | 682,282 | | | | 39,028,267 | | | | (3,056,547 | ) | | | (184,785,608 | ) | | | 4,883,865 | | | | 295,975,809 | | |
Global Value Fundb | |
Class I | | | 96,113 | | | | 1,186,409 | | | | 18,286 | | | | 217,239 | | | | (5 | ) | | | (57 | ) | | | 114,394 | | | | 1,403,591 | | |
Class A** | | | 14,418 | | | | 177,759 | | | | 509 | | | | 6,042 | | | | (4,639 | ) | | | (59,304 | ) | | | 10,288 | | | | 124,497 | | |
Total net increase
(decrease) | | | 110,531 | | | | 1,364,168 | | | | 18,795 | | | | 223,281 | | | | (4,644 | ) | | | (59,361 | ) | | | 124,682 | | | | 1,528,088 | | |
Value Opportunities Fund | |
Class I | | | 6,194,679 | | | | 171,363,951 | | | | 257,248 | | | | 6,693,591 | | | | (1,714,640 | ) | | | (46,620,103 | ) | | | 4,737,287 | | | | 131,437,439 | | |
Class A | | | 3,040,252 | | | | 83,179,115 | | | | 271,861 | | | | 7,081,981 | | | | (1,844,426 | ) | | | (50,639,664 | ) | | | 1,467,687 | | | | 39,621,432 | | |
Class C | | | 948,954 | | | | 24,833,474 | | | | 63,510 | | | | 1,573,783 | | | | (192,233 | ) | | | (4,971,988 | ) | | | 820,231 | | | | 21,435,269 | | |
Total net increase
(decrease) | | | 10,183,885 | | | | 279,376,540 | | | | 592,619 | | | | 15,349,355 | | | | (3,751,299 | ) | | | (102,231,755 | ) | | | 7,025,205 | | | | 192,494,140 | | |
Capital Income Fund | |
Class I | | | 695,228 | | | | 8,753,519 | | | | 88,601 | | | | 1,069,520 | | | | (77,827 | ) | | | (972,432 | ) | | | 706,002 | | | | 8,850,607 | | |
Class A | | | 3,016,388 | | | | 38,848,961 | | | | 105,366 | | | | 1,315,164 | | | | (636,055 | ) | | | (8,002,381 | ) | | | 2,485,699 | | | | 32,161,744 | | |
Total net increase
(decrease) | | | 3,711,616 | | | | 47,602,480 | | | | 193,967 | | | | 2,384,684 | | | | (713,882 | ) | | | (8,974,813 | ) | | | 3,191,701 | | | | 41,012,351 | | |
High Yield Fund | |
Class I | | | 61,610,168 | | | | 808,808,659 | | | | 2,841,519 | | | | 37,371,762 | | | | (33,689,737 | ) | | | (442,645,361 | ) | | | 30,761,950 | | | | 403,535,060 | | |
Class A | | | 23,547,659 | | | | 307,102,686 | | | | 2,407,130 | | | | 31,417,283 | | | | (12,433,132 | ) | | | (162,023,620 | ) | | | 13,521,657 | | | | 176,496,349 | | |
Class C | | | 228,350 | | | | 3,000,722 | | | | 3,904 | | | | 51,262 | | | | (24,458 | ) | | | (323,033 | ) | | | 207,796 | | | | 2,728,951 | | |
Total net increase
(decrease) | | | 85,386,177 | | | | 1,118,912,067 | | | | 5,252,553 | | | | 68,840,307 | | | | (46,147,327 | ) | | | (604,992,014 | ) | | | 44,491,403 | | | | 582,760,360 | | |
a The Small Cap Diversified Value Fund had a single shareholder, Stephens Investment Holdings LLC, which individually held 97.3% of the total shares outstanding as of June 30, 2015.
b The Global Value Fund had a single shareholder, Davis Family Trust, which individually held 25.7% of the total shares outstanding as of June 30, 2015, and HW Atlas LLC, which individually held 41.0% of the total shares outstanding as of June 30, 2014.
* Commenced operations on June 30, 2014.
** For the period August 30, 2013 (commencement of operations) to June 30, 2014.
1 Net of redemption fees of $179,374 for Class I, $296,390 for Class A and $1,000 for Class C.
# Includes an in-kind redemption which resulted in a realized gain of $6,824,859.
+ Includes an in-kind redemption which resulted in a realized gain of $23,556,811.
81
NOTE 6.
Investments in Affiliated Issuers. An issuer in which a Fund's holdings represent 5% or more of the outstanding voting securities of the issuer is an "affiliated" issuer as defined in the 1940 Act. A schedule of each Fund's investments in securities of affiliated issuers held during the year ended June 30, 2015, is set forth below:
Mid-Cap Value Fund
| Issuer Name | | Share Balance
At July 1, 2014 | | Additions | | Reductions | | Share Balance
At June 30, 2015 | | Dividend
Income | | Value
At June 30, 2015 | |
Cairn Energy PLC | | | 11,084,600 | | | | 19,324,000 | | | | — | | | | 30,408,600 | | | $ | — | | | $ | 80,989,964 | | |
Comstock Resources, Inc. | | | 1,031,600 | | | | 4,911,900 | | | | 215,200 | | | | 5,728,300 | | | | 799,175 | | | | 19,075,239 | | |
Ophir Energy PLC | | | — | | | | 49,018,000 | | | | — | | | | 49,018,000 | | | | — | | | | 87,289,379 | | |
PHH Corp.+ | | | 3,128,000 | | | | — | | | | 1,017,100 | | | | 2,110,900 | | | | — | | | | 54,946,727 | | |
| | | | | | | | | | $ | 799,175 | | | | |
+ Issuer was not an affiliate as of June 30, 2015.
Small Cap Value Fund
| Issuer Name | | Share Balance
At July 1, 2014 | | Additions | | Reductions | | Share Balance
At June 30, 2015 | | Dividend
Income | | Value
At June 30, 2015 | |
Hudson Global, Inc. | | | 2,266,700 | | | | — | | | | — | | | | 2,266,700 | | | $ | — | | | $ | 5,190,743 | | |
Miller Industries, Inc. | | | 805,800 | | | | 128,700 | | | | 85,700 | | | | 848,800 | | | | 551,023 | | | | 16,933,560 | | |
Noranda Aluminum Holding Corp. | | | 2,739,100 | | | | 2,862,400 | | | | — | | | | 5,601,500 | | | | 134,174 | | | | 4,761,275 | | |
Real Industry, Inc. | | | — | | | | 2,518,508 | | | | — | | | | 2,518,508 | | | | — | | | | 28,585,066 | | |
Rush Enterprises, Inc. | | | 715,600 | | | | 1,172,700 | | | | 307,200 | | | | 1,581,100 | | | | — | | | | 41,440,631 | | |
| | | | | | | | | | $ | 685,197 | | | | |
Value Opportunities Fund
| Issuer Name | | Share Balance
At July 1, 2014 | | Additions | | Reductions | | Share Balance
At June 30, 2015 | | Dividend
Income | | Value
At June 30, 2015 | |
Thorntons PLC+ | | | — | | | | 5,729,300 | | | | 5,729,300 | | | | — | | | $ | — | | | $ | — | | |
| | | | | | | | | | $ | — | | | | |
+ Issuer was not an affiliate as of June 30, 2015.
NOTE 7.
Securities Lending. Effective December 2007, the Funds entered into a securities lending arrangement with Brown Brothers Harriman & Co. (the "Custodian"). Under the securities lending agreement, the Custodian is authorized to loan securities on behalf of the Funds to approved brokers. In exchange, the Funds receive cash collateral in the amount of at least 102% of the value of the securities loaned plus accrued interest. The total market value of securities on loan for each Fund is disclosed on the Schedule of Investments. The cash collateral is invested in short-term instruments as noted on the Schedule of Investments. Income earned from these investments is included in "Securities on loan" on the Statements of Operations and is allocated to each Fund based on each Fund's proportion of the total cash collateral received. Securities lending involves counterparty risks, including the risk that the loaned securities may not be returned in a timely manner or at all. Subject to certain conditions, the Custodian has agreed to indemnify the Funds from losses resulting from a borrower's failure to return a loaned security. In addition, the Funds bear the risk of loss associated with the investment of cash collateral received.
A portion of the income generated by the investment of the collateral, net of any rebates paid by the Custodian to borrowers, is remitted to the Custodian as lending agent, and the remainder is paid to the applicable Fund.
NOTE 8.
Commitments and Contingencies. Under the Trust's organizational documents and indemnification agreements between each independent Trustee and the Trust, its officers and Trustees are indemnified against certain liability arising out of the performance of their duties to the Trust. In addition, in the normal course of business the Trust enters into contracts that contain a variety of representations and warranties, which provide general indemnifications. The Funds' maximum exposure under these arrangements is unknown, as this would involve future claims that may be made against the Funds. However, based on experience, the Funds expect the risk of loss to be remote.
Bridge loan commitments may obligate a Fund to furnish temporary financing to a borrower until permanent financing can be arranged. At June 30, 2015, the Capital Income Fund and High Yield Fund had outstanding bridge loan commitments of $510,000 and $42,790,000, respectively.
NOTE 9.
Risk Factors. Investing in a Fund may involve certain risks including, but not limited to, those described below.
Lower rated debt securities generally have higher rates of interest and involve greater risk of default or price changes due to changes in the issuer's creditworthiness than higher rated debt securities. The market prices of these securities may fluctuate more than higher quality securities and may
82
decline significantly in periods of general economic difficulty. There may be little trading in the secondary market for particular debt securities, which may make them more difficult to value or sell.
The prices of, and the income generated by, most debt securities held by a Fund may be affected by changing interest rates and by changes in the effective maturities and credit ratings of these securities. For example, the prices of debt securities in a Fund's portfolio generally will decline when interest rates rise and increase when interest rates fall. In addition, falling interest rates may cause an issuer to redeem, "call" or refinance a security before its stated maturity, which may result in the Fund having to reinvest the proceeds in lower yielding securities. Debt securities are also subject to credit risk, which is the possibility that the credit strength of an issuer will weaken and/or an issuer of a debt security will fail to make timely payments of principal or interest and the security will go into default. Longer maturity debt securities generally have higher rates of interest and may be subject to greater price fluctuations than shorter maturity debt securities.
The prices of, and the income generated by, the common stocks and other equity securities held by a Fund may decline in response to certain events taking place around the world, including those directly involving the issuers whose securities are owned by the Fund; conditions affecting the general economy; overall market changes; local, regional or global political, social or economic instability; governmental or governmental agency responses to economic conditions; and currency, interest rate and commodity price fluctuations.
Certain funds, accounts, individuals or affiliates may from time to time own (beneficially or of record) or control a significant percentage of a Fund's shares. Redemptions by these entities of their holdings in the Fund may impact the Fund's liquidity and net asset value ("NAV"). These redemptions may also force the Fund to sell securities.
NOTE 10.
New Accounting Pronouncement. In May 2015, the FASB issued Accounting Standards Update ("ASU") No. 2015-07, which removes the requirement to categorize within the fair value hierarchy all investments for which fair value is measured using the net asset value per share practical expedient. The guidance is effective for fiscal years beginning after December 15, 2015 and for interim periods within those years and early adoption is permitted. The Funds did not early adopt this guidance as of year-end and are evaluating the impact of the ASU on future reporting periods.
NOTE 11.
Subsequent Events. Management has evaluated subsequent events in the preparation of the Funds' financial statements and has determined that there are no events that require recognition or disclosure in the financial statements.
NOTE 12.
Federal Tax Disclosure. The Funds designated as long-term capital gain dividends, pursuant to Internal Revenue Code Section 852(b)(3), the amount necessary to reduce the earnings and profits of the Funds related to net capital gains to zero for the tax year ended June 30, 2015.
For the year ended June 30, 2015, the following percentages of ordinary distributions paid qualify for the dividend received deduction available to corporate shareholders: Diversified Value Fund — 58.82%, Large Cap Value Fund — 56.68%, Mid-Cap Value Fund — 71.21%, Small Cap Value Fund — 45.22%, Small Cap Diversified Value Fund — 87.18%, Global Value Fund — 15.65%, Value Opportunities Fund — 17.31%, Capital Income Fund — 28.58%, High Yield Fund — 4.54%.
For the year ended June 30, 2015, the following percentages of ordinary distributions paid are designated as qualified dividend income under the Jobs and Growth Tax Relief Reconciliation Act of 2003: Diversified Value Fund — 100.00%, Large Cap Value Fund — 100.00%, Mid-Cap Value Fund — 76.77%, Small Cap Value Fund — 56.87%, Small Cap Diversified Value Fund — 88.28%, Global Value Fund — 75.00%, Value Opportunities Fund — 36.40%, Capital Income Fund — 43.35%, High Yield Fund — 4.54%. Shareholders should consult their tax advisors.
For the year ended June 30, 2015, the Global Value Fund earned foreign source income of $90,296 and paid foreign taxes of $5,404, which it intends to pass through to shareholders pursuant to Section 853 of the Internal Revenue Code.
Additional Information Applicable to Foreign Shareholders Only. For the year ended June 30, 2015, the Funds designate the following percentages of ordinary distributions paid as interest-related dividends under Internal Revenue Code Section 871(k)(1)(c): Diversified Value Fund — 0.02%, Large Cap Value Fund — 0.02%, Mid-Cap Value Fund — 0.05%, Small Cap Value Fund — 0.02%, Small Cap Diversified Value Fund — 0.02%, Global Value Fund — 0.01%, Value Opportunities Fund — 8.15%, Capital Income Fund — 41.64%, High Yield Fund — 85.03%. For the year ended June 30, 2015, the following percentages of ordinary income distributions paid are designated as short-term capital gain distributions under Internal Revenue Code Section 871(k)(2)(c): Diversified Value Fund — 0.00%, Large Cap Value Fund — 0.00%, Mid-Cap Value Fund — 62.52%, Small Cap Value Fund — 92.12%, Small Cap Diversified Value Fund — 76.62%, Global Value Fund — 39.97%, Value Opportunities Fund — 56.43%, Capital Income Fund — 13.25%, High Yield Fund — 2.13%.
83
Report of Independent Registered Public Accounting Firm
To the Shareholders and Board of Trustees
of Hotchkis & Wiley Funds
We have audited the accompanying statements of assets & liabilities, including the schedules of investments of Hotchkis & Wiley Funds (the "Funds") comprising the Diversified Value Fund, Large Cap Value Fund, Mid-Cap Value Fund, Small Cap Value Fund, Small Cap Diversified Value Fund, Global Value Fund, Value Opportunities Fund, Capital Income Fund, and High Yield Fund, as of June 30, 2015, and the related statements of operations for the year then ended, the statements of changes in net assets for each of the two years in the period then ended, and the financial highlights for each of the three years in the period then ended (as to the Small Cap Diversified Value Fund, which is for the year from June 30, 2014 (commencement of operations) through June 30, 2015). These financial statements and financial highlights are the responsibility of the Funds' management. Our responsibility is to express an opinion on these financial statements and financial highlights based on our audits. The financial highlights for each of the two years in the period ended June 30, 2012 were audited by other auditors whose report, dated August 22, 2012, expressed an unqualified opinion on those statements.
We conducted our audits in accordance with the standards of the Public Company Accounting Oversight Board (United States). Those standards require that we plan and perform the audits to obtain reasonable assurance about whether the financial statements and financial highlights are free of material misstatement. The Funds are not required to have, nor were we engaged to perform, an audit of their internal control over financial reporting. Our audits included consideration of internal control over financial reporting as a basis for designing audit procedures that are appropriate in the circumstances, but not for the purpose of expressing an opinion on the effectiveness of the Funds' internal control over financial reporting. Accordingly, we express no such opinion. An audit also includes examining, on a test basis, evidence supporting the amounts and disclosures in the financial statements, assessing the accounting principles used and significant estimates made by management, as well as evaluating the overall financial statement presentation. Our procedures included confirmation of securities owned as of June 30, 2015, by correspondence with the custodian and brokers; where replies were not received from brokers, we performed other auditing procedures. We believe that our audits provide a reasonable basis for our opinion.
In our opinion, the 2015 financial statements and financial highlights referred to above present fairly, in all material respects, the financial position of the Funds as of June 30, 2015, the results of their operations for the year then ended, and the changes in their net assets for each of the two years in the period then ended and the financial highlights for each of the three years in the period then ended (as to the Small Cap Diversified Value Fund, which is for the year from June 30, 2014 (commencement of operations) through June 30, 2015), in conformity with accounting principles generally accepted in the United States of America.

Costa Mesa, California
August 20, 2015
84
Fund Expense Examples (Unaudited)
As a mutual fund shareholder, you incur two types of costs: (1) transaction costs such as initial sales charges (loads) on purchase payments and contingent deferred sales charges and redemption fees on redemptions and (2) ongoing costs, including management fees, distribution and service (12b-1) fees and other fund expenses. The following examples are intended to help you understand your ongoing costs (in dollars) of investing in the Funds and to compare these costs with the ongoing costs of investing in other mutual funds. The examples are based on an investment of $1,000 invested at the beginning of the most recent six-month period and held for the entire period (January 1, 2015 – June 30, 2015).
The table below illustrates the Funds' costs in two ways:
Based on actual fund returns. This section provides information about actual account values and actual expenses. You may use the information in this section, together with the amount you invested, to estimate the expenses that you paid over the period. Simply divide your account value by $1,000 (for example, an $8,600 account value divided by $1,000 = 8.6), then multiply the result by the number in the section under the heading entitled "Expenses Paid During Period" to estimate the expenses you paid on your account during this period.
Based on hypothetical 5% yearly returns. This section provides information about hypothetical account values and hypothetical expenses based on the Funds' actual expense ratios and an assumed rate of return of 5% per year before expenses, which is not the Funds' actual return. The hypothetical account values and expenses may not be used to estimate the actual ending account balance or expenses you paid for the period. You may use this information to compare the ongoing costs of investing in the Funds and other funds. To do so, compare this 5% hypothetical example with the 5% hypothetical examples that appear in the shareholder reports of the other funds.
Please note that the expenses shown in the table are meant to highlight your ongoing costs only and do not reflect any transactional costs, such as sales charges (loads). Therefore, the second section is useful in comparing ongoing costs only, and will not help you determine the relative total costs of owning different funds. In addition, if these transactional costs were included, your costs would have been higher.
The calculations assume no shares were bought or sold during the period. Your actual costs may have been higher or lower, depending on the amount of your investment and the timing of any purchases or redemptions.
| | Based on Actual Fund Returns | | Based on Hypothetical 5% Yearly Returns | | | |
| | | Beginning
Account Value
1/1/15 | | Ending
Account Value
6/30/15 | | Expenses Paid
During Period*
1/1/15 - 6/30/15 | | Beginning
Account Value
1/1/15 | | Ending
Account Value
6/30/15 | | Expenses Paid
During Period*
1/1/15 - 6/30/15 | | Annualized
Expense Ratio | |
Diversified Value Fund | |
Class I | | $ | 1,000.00 | | | $ | 1,015.30 | | | $ | 4.75 | | | $ | 1,000.00 | | | $ | 1,020.08 | | | $ | 4.76 | | | | 0.95 | % | |
Class A | | | 1,000.00 | | | | 1,014.70 | | | | 5.99 | | | | 1,000.00 | | | | 1,018.84 | | | | 6.01 | | | | 1.20 | | |
Class C | | | 1,000.00 | | | | 1,010.30 | | | | 9.72 | | | | 1,000.00 | | | | 1,015.12 | | | | 9.74 | | | | 1.95 | | |
Large Cap Value Fund | |
Class I | | | 1,000.00 | | | | 1,008.90 | | | | 4.93 | | | | 1,000.00 | | | | 1,019.89 | | | | 4.96 | | | | 0.99 | | |
Class A | | | 1,000.00 | | | | 1,007.80 | | | | 6.17 | | | | 1,000.00 | | | | 1,018.65 | | | | 6.21 | | | | 1.24 | | |
Class C | | | 1,000.00 | | | | 1,004.20 | | | | 9.89 | | | | 1,000.00 | | | | 1,014.93 | | | | 9.94 | | | | 1.99 | | |
Class R | | | 1,000.00 | | | | 1,006.30 | | | | 7.41 | | | | 1,000.00 | | | | 1,017.41 | | | | 7.45 | | | | 1.49 | | |
Mid-Cap Value Fund | |
Class I | | | 1,000.00 | | | | 984.20 | | | | 4.87 | | | | 1,000.00 | | | | 1,019.89 | | | | 4.96 | | | | 0.99 | | |
Class A | | | 1,000.00 | | | | 983.00 | | | | 6.10 | | | | 1,000.00 | | | | 1,018.65 | | | | 6.21 | | | | 1.24 | | |
Class C | | | 1,000.00 | | | | 979.20 | | | | 9.77 | | | | 1,000.00 | | | | 1,014.93 | | | | 9.94 | | | | 1.99 | | |
Class R | | | 1,000.00 | | | | 981.60 | | | | 7.32 | | | | 1,000.00 | | | | 1,017.41 | | | | 7.45 | | | | 1.49 | | |
Small Cap Value Fund | |
Class I | | | 1,000.00 | | | | 1,017.80 | | | | 5.70 | | | | 1,000.00 | | | | 1,019.14 | | | | 5.71 | | | | 1.14 | | |
Class A | | | 1,000.00 | | | | 1,016.40 | | | | 6.95 | | | | 1,000.00 | | | | 1,017.90 | | | | 6.95 | | | | 1.39 | | |
Class C | | | 1,000.00 | | | | 1,012.70 | | | | 10.68 | | | | 1,000.00 | | | | 1,014.18 | | | | 10.69 | | | | 2.14 | | |
Small Cap Diversified Value Fund | |
Class I | | | 1,000.00 | | | | 1,002.00 | | | | 6.20 | | | | 1,000.00 | | | | 1,018.60 | | | | 6.26 | | | | 1.25 | | |
Class A | | | 1,000.00 | | | | 1,002.00 | | | | 7.45 | | | | 1,000.00 | | | | 1,017.36 | | | | 7.50 | | | | 1.50 | | |
Global Value Fund | |
Class I | | | 1,000.00 | | | | 1,017.10 | | | | 5.50 | | | | 1,000.00 | | | | 1,019.34 | | | | 5.51 | | | | 1.10 | | |
Class A | | | 1,000.00 | | | | 1,016.20 | | | | 6.75 | | | | 1,000.00 | | | | 1,018.10 | | | | 6.76 | | | | 1.35 | | |
Value Opportunities Fund | |
Class I | | | 1,000.00 | | | | 1,050.10 | | | | 4.98 | | | | 1,000.00 | | | | 1,019.93 | | | | 4.91 | | | | 0.98 | | |
Class A | | | 1,000.00 | | | | 1,048.60 | | | | 6.25 | | | | 1,000.00 | | | | 1,018.70 | | | | 6.16 | | | | 1.23 | | |
Class C | | | 1,000.00 | | | | 1,045.00 | | | | 10.04 | | | | 1,000.00 | | | | 1,014.98 | | | | 9.89 | | | | 1.98 | | |
85
Fund Expense Examples (Unaudited)
| | Based on Actual Fund Returns | | Based on Hypothetical 5% Yearly Returns | | | |
| | Beginning
Account Value
1/1/15 | | Ending
Account Value
6/30/15 | | Expenses Paid
During Period*
1/1/15 - 6/30/15 | | Beginning
Account Value
1/1/15 | | Ending
Account Value
6/30/15 | | Expenses Paid
During Period*
1/1/15 - 6/30/15 | | Annualized
Expense Ratio | |
Capital Income Fund | |
Class I | | $ | 1,000.00 | | | $ | 1,007.20 | | | $ | 3.98 | | | $ | 1,000.00 | | | $ | 1,020.83 | | | $ | 4.01 | | | | 0.80 | % | |
Class A | | | 1,000.00 | | | | 1,008.10 | | | | 5.23 | | | | 1,000.00 | | | | 1,019.59 | | | | 5.26 | | | | 1.05 | | |
High Yield Fund | |
Class I | | | 1,000.00 | | | | 1,038.30 | | | | 3.54 | | | | 1,000.00 | | | | 1,021.32 | | | | 3.51 | | | | 0.70 | | |
Class A | | | 1,000.00 | | | | 1,036.20 | | | | 4.80 | | | | 1,000.00 | | | | 1,020.08 | | | | 4.76 | | | | 0.95 | | |
Class C | | | 1,000.00 | | | | 1,033.20 | | | | 8.57 | | | | 1,000.00 | | | | 1,016.36 | | | | 8.50 | | | | 1.70 | | |
* Expenses are equal to the Funds' annualized expense ratio by class multiplied by the average account value over the period, multiplied by the number of days in the most recent fiscal half-year (181), then divided by the number of days in the most recent fiscal year (365).
86
Board Considerations in Approving Continuation of Investment Advisory Agreements (Unaudited)
Background and Approval Process. Hotchkis and Wiley Capital Management, LLC (the "Advisor") serves as investment adviser to the Hotchkis and Wiley Diversified Value Fund, the Hotchkis and Wiley Large Cap Value Fund, the Hotchkis and Wiley Mid-Cap Value Fund, the Hotchkis and Wiley Small Cap Value Fund, the Hotchkis and Wiley Global Value Fund, the Hotchkis and Wiley Value Opportunities Fund, the Hotchkis and Wiley Capital Income Fund and the Hotchkis and Wiley High Yield Fund (each a "Fund" and collectively, the "Funds") pursuant to separate investment advisory agreements (the "Advisory Agreements") with the Hotchkis and Wiley Funds (the "Trust"). The Advisory Agreements were initially approved by the Board of Trustees at the inception of each Fund for two-year terms. The Advisory Agreements continue thereafter if approved annually by the Trustees, including a majority of the Trustees who are not "interested persons" (as defined in the Investment Company Act of 1940, as amended (the "1940 Act")) of the Trust (the "Independent Trustees"), by a vote cast in person at a meeting called for the purpose of voting on the Advisory Agreements. The Advisory Agreements for each Fund were most recently considered by the Board at a meeting held in May 2015.
As part of the annual contract review process, the Independent Trustees, through their independent legal counsel, requested and received extensive materials, including information relating to (i) the nature, extent and quality of services provided by the Advisor, including compliance with legal requirements, (ii) short-term and longer-term performance of each Fund relative to peer groups and market indices, (iii) the costs of the services provided and the Advisor's profitability with respect to the management of each Fund, (iv) the extent to which the Advisor has in the past or is likely in the future to experience economies of scale in connection with the investment advisory services it provides to each Fund, (v) the expense ratios of each Fund as compared with the expense ratios of funds in its peer group and (vi) any benefits to the Advisor and its affiliates from its relationship with the Funds. The Independent Trustees also requested and received information specifically related to the Advisor's risk controls and risk evaluation process, including information on how the Advisor addresses portfolio volatility. The Independent Trustees noted that the information provided by the Advisor was thorough and responsive to their request. The information provided in response to their request supplemented information received by the Board throughout the year, both in writing and in meetings, regarding the Funds, including Fund performance, expense ratios, portfolio composition and regulatory compliance. The Independent Trustees also held a conference call with their independent legal counsel in April 2015 to review the materials provided by the Advisor and reviewed and discussed a legal memorandum regarding, among other things, the duties of directors/trustees under the 1940 Act and relevant state law in reviewing and approving investment advisory contracts. The Independent Trustees, through their independent legal counsel, then provided follow-up questions to the Advisor to which they received responses in advance of the May Board meeting.
At the May Board meeting, representatives of the Advisor discussed certain responses with the Trustees and responded to their further questions. The Trustees considered the factors set out in case law and identified by the Securities and Exchange Commission as most relevant in considering the renewal of investment advisory agreements. The Trustees considered these and other factors, as summarized in more detail below, and concluded that the terms of each Advisory Agreement are fair and reasonable and the continuance of each Agreement is in the best interests of the applicable Fund.
Nature, Extent and Quality of Services. As part of the Board's decision-making process, the Trustees noted that the Advisor and its predecessors have managed the Funds and their predecessors since their inception, and the Trustees believe that a long-term relationship with a capable, conscientious investment adviser is in the best interests of the Funds. The Board also considered that shareholders invest in a Fund specifically seeking the Advisor's investment expertise and style. The Board also noted that when shareholders invest in a Fund, they know the advisory fee that is paid by the Fund. In this connection, the Trustees considered, in particular, whether each Fund is managed in accordance with its investment objective and policies as disclosed to shareholders. The Trustees concluded that each Fund is managed consistent with its investment objective and policies.
The Trustees reviewed information regarding various services provided by the Advisor to the Funds, including an organizational chart and background information on personnel performing such services. The Trustees also reviewed each Fund's performance and information regarding the Advisor's investment program, which is driven by team-oriented, in-depth, fundamental research. The Trustees considered the depth and quality of the Advisor's investment process, the low turnover rates of the Advisor's key personnel, the overall stability of the Advisor's organization, and the experience, capability and integrity of its senior management. The Trustees considered the portfolio managers' significant investments in the Funds. The Trustees reviewed the Trust's compliance program and the Advisor's commitment to a rigorous compliance effort and the resultant compliance by the Funds and the Advisor with legal requirements.
The Trustees also considered other non-advisory services provided to the Funds, such as the services of Advisor employees as Trust officers and other personnel provided that are necessary for Fund operations. The Trustees particularly noted that the services of the Trust's Chief Compliance Officer are provided to the Funds at no cost to the Funds. The Trustees noted that the Advisor organizes Board meetings and the preparation of Board meeting materials, and those Advisor employees serving as Trust officers oversee and manage the other Fund service providers.
Based on their review, the Trustees concluded that the nature, extent and quality of services provided (and expected to be provided) to each Fund under its Advisory Agreement were of a high level and were very satisfactory.
Investment Performance of the Funds and the Advisor. The Trustees noted that they review data on the short-term and longer-term performance of the Funds in connection with each quarterly Board meeting. For the contract review meeting, the Trustees reviewed a report prepared by the Trust's administrator (the "Report") using information compiled from Morningstar, Inc., an independent provider of data to mutual fund boards, that compared the performance of Class I shares of each Fund to that of a small group of funds that are similar primarily in terms of investment style (each, a "Peer Group"), for periods ended December 31, 2014. The Peer Groups were selected by the Advisor based on its criteria to determine an appropriate group of competitor funds, and data regarding performance of the Peer Group funds also is provided at each quarterly Board meeting. The Trustees also considered performance information through March 2015 that was provided by the Advisor.
The Board considered the performance information for each Fund for applicable periods up to 10 years. The Board noted that all Funds outperformed their Peer Group median for the 1- and 3-year periods ended December 31, 2014, except for the Global Value Fund (with an inception date of December 31, 2012), which significantly outperformed its Peer Group median for the 1-year period, and the High Yield Fund, which underperformed its Peer Group median for the 1-year period and outperformed its Peer Group median for the 3-year period. The Board noted that every Fund with 5 years
87
of performance also outperformed the median of its Peer Group — often significantly — for that period, and for those Funds with at least 10 years of performance, that the Mid Cap Value Fund, Small Cap Value Fund and Value Opportunities Fund each outperformed its Peer Group median for the 10-year period, while the Diversified Value Fund and the Large Cap Value Fund each underperformed its Peer Group median for the 10-year period. The Board also considered the Advisor's supplemental report for periods through March 31, 2015, but focused more on longer-term than short-term performance of the Funds versus their Peer Groups. In addition, the Board considered data from the Report and the Advisor's supplemental report comparing each Fund's performance to that of its benchmark index(es). The Trustees noted that all Funds underperformed their benchmark index(es) for the 1-year period ended March 31, 2015 covered in the Advisor's supplemental report on performance, including the Capital Income Fund, which underperformed its blended benchmark comprised of the BofA Merrill Lynch U.S. Corporate, Government and Mortgage Index and the Standard & Poor's 500® Index, but that each Fund with 3 years of performance as of March 31, 2015 (i.e., all but the Global Value Fund) outperformed its benchmark index(es) for the 3-year period, including the Capital Income Fund, based on its blended benchmark, and that the Global Value Fund outperformed its benchmark index for the since-inception period ended March 31, 2015. The Independent Trustees reviewed with the Advisor the reasons for the historical variability in performance, congratulated the Advisor for the Funds' continued strong performance, and encouraged the Advisor to continue to adapt its risk assessment approach in an effort to appropriately consider the impact of volatility in Fund performance going forward.
Fees, Expenses and Profitability. The Trustees reviewed expense data compiled from Lipper Inc., another independent provider of mutual fund data, contained in the Report and information provided by the Advisor in the supplemental report regarding the Funds' advisory fees and expense ratios, including information regarding any expense caps for the Funds. The Trustees reviewed data in the Report showing how the Funds' advisory fees and expense ratios compared to those of their respective Peer Groups. Since some Peer Group funds' advisory contracts include administration services, the Report included administration fees with advisory fees for comparability. The Trustees also reviewed information provided by the Advisor on advisory fees charged by the Advisor for subadvisory services it provides to other mutual funds and advisory fees it charges to its separate account clients with investment objectives and policies similar to those of the Funds. The Trustees considered a list of the many additional functions performed for the Funds that the Advisor does not perform for its separate account and subadvisory clients. The Trustees noted that even though the Funds require more services and have higher costs, and even though it is generally acknowledged that managing mutual funds subjects an investment adviser to more legal and regulatory risk than is the case with separate accounts, the fees charged to three of the Funds (the Small Cap Value Fund, the Global Value Fund and the Value Opportunities Fund) are the same as or lower than the Advisor's current standard fee schedules for its separate account clients.
With respect to the advisory fee for each Fund, the Trustees noted that the Report showed that the Diversified Value, Large Cap Value and Mid-Cap Value Funds' net advisory fees (including administration fees) were higher than their Peer Group median, and that the Small Cap Value, Value Opportunities, Capital Income and High Yield Funds' net advisory fees (including administration fees) were lower than their Peer Group medians, and noted that administration fees are not paid to the Advisor but to an unaffiliated entity. The Board noted that the Global Value Fund's net advisory fees (including administration fees) were negative due to fee waivers. The Trustees noted that the Advisor had agreed to add breakpoints to the fee schedule for the Diversified Value, Large Cap Value and Mid-Cap Value Funds effective January 1, 2007, but that lower asset levels in recent years, including 2014, meant that the breakpoints did not have an impact on the advisory fees. They noted that the Advisor uses a research-intensive process where other firms, including those advising Peer Funds, might use investment processes that are less research-intensive. With respect to the expense ratios for the Funds, the Trustees noted that the Report showed that the Diversified Value, Large Cap Value, Mid-Cap Value and Global Value Funds' net expense ratios were higher than the median of their Peer Groups, that the Small Cap Value, Value Opportunities and High Yield Funds' net expense ratios were lower than the median of their Peer Groups, and that the Capital Income Fund's net expense ratio was the same as the median for its Peer Group. The Trustees noted the quality of the Advisor's investment process and concluded that the advisory fee and expense ratios were fair and reasonable for each Fund.
The Trustees reviewed information concerning the estimated profitability to the Advisor of the Advisory Agreements, including information regarding the methodology for allocating expenses. The Trustees reviewed data regarding the Advisor's variable expenses and fixed expenses. The Trustees considered that in 2014, as in recent prior years, the Advisor had absorbed costs above expense caps for certain of the Funds for which it would not be reimbursed. The Board noted that the Advisor has agreed to continue the expense caps through at least October 31, 2016, and that annualized expense ratios continue to be above the expense caps for the Diversified Value, Global Value, Capital Income and High Yield Funds. The Trustees also recognized that individual fund or product line profitability of other advisers is generally not publicly available, and that profitability may be affected by numerous factors, so that the comparability of profitability among advisory firms is limited. The Trustees noted the importance of the Advisor's profitability — which is derived solely from investment management fees — in maintaining its entrepreneurial environment in a private, primarily employee-owned structure. They noted that the Advisor's compensation/profit structure facilitates retention of its management and investment professionals. They also noted that from time to time the Advisor had voluntarily limited growth of assets by closing certain Funds to new investors, and that currently the Mid-Cap Value and Small Cap Value Funds have limited availability for purchase. The Trustees noted that closing Funds was financially disadvantageous to the Advisor, and illustrated a commitment to act in the best interests of Fund shareholders. The Trustees concluded that the level of estimated profitability to the Advisor under the Advisory Agreements appeared to be not unreasonable.
Economies of Scale and Whether Fee Levels Reflect These Economies of Scale. The Trustees considered information regarding the investment, compliance and client service personnel who have been hired by the Advisor over the past few years, and the increase in technology spending. The Trustees concluded that the Funds' shareholders share in the additional services, investment in talented employees and capital improvements provided by the Advisor without an increase in advisory fees. The Trustees also noted that the addition of breakpoints to the Diversified Value, Large Cap Value and Mid-Cap Value Funds has in the past enabled, and may in the future enable, shareholders to share in economies of scale.
Indirect Benefits to the Advisor from its Relationship to the Funds. The Trustees considered information regarding any indirect benefits to the Advisor that could be identified from its relationship to the Funds. In particular, the Trustees considered any benefits from soft dollar arrangements. The Trustees noted that, while the Advisor had not historically used the Funds' commissions to pay for research, other than for proprietary research from brokers that was "bundled" with the commission cost, beginning in May 2011, the Board granted to the Advisor the ability to use commission sharing arrangements that would permit the Advisor to pay for third-party research with the equity Funds' soft dollars. The Trustees considered that the bundled research services and the use of commission sharing arrangements provides valuable information or service to the investment research process,
88
which benefits the Funds (as well as the Advisor's other clients). The Trustees noted that the ability to use the Funds' soft dollars to obtain third-party research is a fallout benefit to the Advisor. The Trustees also noted that the commissions paid by the Funds are generally quite low and that the Advisor believes that the use of commission sharing arrangements to obtain research for the Funds does not affect best execution, and that the Funds bear no additional costs as a result of these arrangements.
* * * *
Based on their review, including their consideration of each of the factors referred to above, the Trustees, including all of the Independent Trustees, concluded that the terms of each Advisory Agreement are fair and reasonable and that the renewal of each Agreement is in the best interests of each Fund. No single factor was determinative in the Board's analysis.
89
(This page intentionally left blank)
INDEPENDENT TRUSTEES
Name and Year of Birth | | Position
Held with
the Trust | | Term of
Office* and
Length of
Time Served | | Principal Occupation(s) During
Past Five Years | | Number of
Portfolios in
Fund Complex
Overseen by
Trustee | | Other
Directorships
Held by Trustee
During Past
Five Years | |
Randall H. Breitenbach
(born 1960) | | Trustee(a) | | Since 2001 | | Non-Executive Director and Vice Chairman, BreitBurn Energy Partners, L.P. (2012 — present); Co-Founder, Director and CEO, Pacific Coast Energy Company, LP and President, BreitBurn Energy Partners, L.P. (1988 — 2012); Chairman Emeritus, Finance Committee, Stanford University PIC Endowment (1999 — present). | | Nine | | BreitBurn Energy Partners, L.P.; Pacific Coast Energy Company, LP | |
Robert L. Burch III
(born 1934) | | Trustee | | Since 2001 | | Senior Partner, A.W. Jones Co. (investments) (1984 — present); Chairman, Jonathan Mfg. Corp. (slide manufacturing) (1977 — 2004). | | Nine | | None | |
Alejandra C. Edwards, Ph.D.
(born 1954) | | Trustee | | Since 2007 | | California State University — Long Beach: Professor of Economics (1994 — present); Associate Chair Economics (2001 — 2012); Graduate Advisor Economics (2000 — 2012). | | Nine | | None | |
Marcy Elkind, Ph.D.
(born 1947) | | Trustee | | Since 2005 | | President, Elkind Economics, Inc. (1980 — present). | | Nine | | None | |
Robert Fitzgerald
(born 1952) | | Trustee(b) | | Since 2005 | | Chief Financial Officer of National Retirement Partners, Inc. (2005 — 2007); Executive Vice President and Chief Financial Officer of PIMCO Advisors L.P. (1995 — 2001). | | Nine | | Independent Trustee, Brandes Investment Trust (9 portfolios); Director, College Savings Bank. | |
John A.G. Gavin
(born 1931) | | Trustee
Chairman | | Since 2001
Since 2007 | | Chairman, Gamma Holdings (international capital and consulting) (1968 — present); Senior Counselor, Hicks Holdings (private equity investment firm) (2001 — 2013); U.S. Ambassador to Mexico (1981 — 1986). | | Nine | | Independent Trustee: TCW Strategic Income Fund, Inc. (1 portfolio); TCW Funds, Inc. (27 portfolios); Causeway Capital Management Trust (5 portfolios) (2001 — 2013). | |
Donald Morrison, Ph.D.
(born 1939) | | Trustee | | Since 2007 | | The William E. Leonhard Professor in the Anderson Graduate School of Management at the University of California, Los Angeles (1988 — present). | | Nine | | None | |
* Each Independent Trustee serves until his or her successor is elected and qualified or until his or her death or resignation or removal as provided in the Trust's Agreement and Declaration of Trust.
(a) Chairman of the Nominating and Governance Committee.
(b) Chairman of the Audit Committee.
INTERESTED TRUSTEE
Name and Year of Birth | | Position
Held with
the Trust | | Term of
Office** and
Length of
Time Served | | Principal Occupation(s) During
Past Five Years | | Number of
Portfolios in
Fund Complex
Overseen by
Trustee | | Other
Directorships
Held by Trustee
During Past
Five Years | |
George H. Davis, Jr.*
(born 1961) | | Trustee | | Since 2007 | | Chief Executive Officer and Portfolio Manager of Hotchkis & Wiley Capital Management, LLC (the "Advisor") (2001 — present). | | Nine | | None | |
* Mr. Davis is an "interested person," as defined in the 1940 Act, of the Trust based on his position as Chief Executive Officer and Portfolio Manager of the Advisor.
** As Trustee, Mr. Davis serves until his successor is elected and qualified or until his death or resignation or removal as provided in the Trust's Agreement and Declaration of Trust.
OFFICERS
Name and Year of Birth | | Position
Held with
the Trust | | Term of
Office* and
Length of
Time Served | | Principal Occupation(s) During Past Five Years | |
Anna Marie Lopez
(born 1967) | | President | | Since 2007 | | Chief Operating Officer of the Advisor (2007 — present). | |
Mark McMahon
(born 1968) | | Vice President and Secretary | | Since 2006 | | Managing Director, Mutual Fund Operations of the Advisor (2006 — present). | |
James Menvielle
(born 1972) | | Vice President and Treasurer | | Since 2007 | | Chief Financial Officer of the Advisor (2006 — present). | |
Tina Kodama
(born 1968) | | Vice President and Chief Compliance Officer | | Since 2007 | | Chief Compliance Officer of the Advisor (2007 — present). | |
* Each officer is appointed by and serves at the pleasure of the Board of Trustees of the Trust.
The Statement of Additional Information includes additional information about the Trust's Trustees and officers, and is available without charge upon request by calling the transfer agent at 1-866-HW-FUNDS (1-866-493-8637). The address for all Trustees and officers of the Trust is c/o Hotchkis & Wiley Capital Management, LLC, 725 South Figueroa Street, 39th Floor, Los Angeles, CA 90017, attention: Trust Secretary.
91
The Hotchkis & Wiley Funds and Hotchkis & Wiley Capital Management, LLC value our relationship with our clients as our most important asset. We are committed to safeguarding our clients' confidential non-public personal information. Our privacy policy outlines the steps we take to protect our clients' personal information.
We collect non-public personal information about you from the following sources in the normal course of business to serve you better:
• Information we receive about you on applications, questionnaires or other forms;
• Information you give us orally or on written or electronic correspondence;
• Information about your transactions with us, financial intermediaries, or others;
• Information received from your custodian, consultant, attorneys, or others; and
• Information provided and captured on our website, including any information captured on our website through the use of "cookies".
We do not sell your personal information to anyone, nor do we disclose your personal information to unaffiliated third parties without the client's authorization, except to your authorized representatives (including your consultant, attorney or accountant). We may disclose your personal information to financial intermediaries (such as broker-dealers and custodians) only as permitted by law and only as necessary for us to provide agreed services and products. We may also disclose your personal information to other service providers with whom we have business arrangements to help administrate our business. These service providers are bound by law or by contract to use your information only for the services for which we hired them, and are not permitted to use or share this information for any other purpose. In limited circumstances, we may disclose your personal information as required by law or in response to inquires from governmental authorities.
We limit access to your personal information, as much as possible, to those employees who need to know that information to provide products and services to you. We also maintain physical, electronic and procedural safeguards to guard the privacy of your nonpublic personal information.
We apply this policy to current and former clients.
This page is not part of the annual report.
92
(This page intentionally left blank)
(This page intentionally left blank)
(This page intentionally left blank)
Information about the Funds
ADVISOR
Hotchkis & Wiley Capital Management, LLC
725 South Figueroa Street, 39th Floor
Los Angeles, California 90017
LEGAL COUNSEL
Vedder Price P.C.
222 North LaSalle Street
Chicago, Illinois 60601
INDEPENDENT REGISTERED PUBLIC ACCOUNTING FIRM
Deloitte & Touche LLP
695 Town Center Drive, Suite 1200
Costa Mesa, CA 92626
DISTRIBUTOR
Quasar Distributors, LLC
615 East Michigan Street
Milwaukee, Wisconsin 53202
ADMINISTRATOR AND TRANSFER AGENT
U.S. Bancorp Fund Services, LLC
615 East Michigan Street
Milwaukee, Wisconsin 53202
CUSTODIAN
Brown Brothers Harriman & Co.
50 Post Office Square
Boston, Massachusetts 02110
This report is for the information of shareholders of the Hotchkis & Wiley Funds, but may also be used as sales literature when preceded or accompanied by a current prospectus, which gives details about charges, expenses, investment objectives and operating policies of the Funds.
A description of the policies and procedures that the Funds use to determine how to vote proxies relating to portfolio securities is included in the Statement of Additional Information, which is available without charge, upon request, by calling 1-866-HW-FUNDS (1-866-493-8637) and on the Securities and Exchange Commission's ("SEC") website at http://www.sec.gov.
Information regarding how the Funds voted proxies relating to portfolio securities during the most recent 12-month period ended June 30 is available without charge on the Funds' website at www.hwcm.com and on the SEC's website at http://www.sec.gov.
Hotchkis & Wiley Funds files a complete schedule of portfolio holdings with the SEC for the first and third quarters of each fiscal year on Form N-Q. The Funds' Forms N-Q are available free of charge on the SEC's website at http://www.sec.gov. You may also review or, for a fee, copy the forms at the SEC's Public Reference Room in Washington, D.C. (1-800-SEC-0330). The Forms N-Q are also available on the Funds' website at www.hwcm.com.
725 SOUTH FIGUEROA STREET, 39th Floor
LOS ANGELES, CALIFORNIA 90017-5439
www.hwcm.com
1.866.HW.FUNDS (1.866.493.8637)
Item 2. Code of Ethics.
The registrant has adopted a code of ethics that applies to the registrant’s principal executive officer and principal financial officer. The registrant has not made any substantive amendments to its code of ethics during the period covered by this report. The registrant has not granted any waivers from any provisions of the code of ethics during the period covered by this report. A copy of the code of ethics is available without charge, upon request, by calling toll-free at 1-800-796-5606.
Item 3. Audit Committee Financial Expert.
The registrant’s Board of Trustees (the “Board”) has determined that Robert Fitzgerald, a member of the registrant’s Audit Committee, is an “audit committee financial expert” and “independent,” as such terms are defined in this Item. This designation will not increase the designee’s duties, obligations or liability as compared to his duties, obligations and liability as a member of the Audit Committee and of the Board; nor will it reduce the responsibility of the other Audit Committee members. The Board believes each member of the Audit Committee contributes significantly to the effective oversight of the registrant’s financial statements and condition.
Item 4. Principal Accountant Fees and Services.
The registrant has engaged its principal accountant to perform audit services, audit-related services, tax services and other services during the past two fiscal years. “Audit services” refer to performing an audit of the registrant’s annual financial statements or services that are normally provided by the accountant in connection with statutory and regulatory filings or engagements for those fiscal years. “Audit-related services” refer to the assurance and related services by the principal accountant that are reasonably related to the performance of the audit. “Tax services” refer to professional services rendered by the principal accountant for tax compliance, tax advice, and tax planning. The principal accountant did not provide any other services. The following table details the aggregate fees billed or expected to be billed for each of the last two fiscal years for audit fees, audit-related fees, tax fees and other fees by the principal accountant.
| | FYE 6/30/2015 | | FYE 6/30/2014 | |
Audit Fees | | $ | 189,600 | | $ | 168,000 | |
Audit-Related Fees | | $ | 0 | | $ | 0 | |
Tax Fees | | $ | 64,370 | | $ | 52,800 | |
All Other Fees | | $ | 0 | | $ | 0 | |
The registrant’s Audit Committee (the “Committee”) has adopted policies and procedures with regard to the pre-approval of services. The Committee shall pre-approve any engagements of the independent auditors to provide any non-prohibited services to the registrant, including the fees and other compensation to be paid to the independent auditors. The Chairman of the Committee may grant the pre-approval of services to the registrant for non-prohibited services for engagements of less than $5,000. The Committee shall also pre-approve any engagement of the independent auditors, including the fees and other compensation to be paid to the independent auditors, to provide any non-audit services to the Advisor (or any “control affiliate” of the Advisor providing ongoing services to the registrant), if the engagement relates directly to the operations and financial reporting of the registrant. The Chairman of
the Committee may grant the pre-approval for non-prohibited services to the Advisor for engagements of less than $5,000. All such delegated pre-approvals shall be presented to the Committee no later than the next Committee meeting.
The percentage of fees billed by Deloitte & Touche LLP applicable to non-audit services pursuant to waiver of the pre-approval requirement were as follows:
| | FYE 6/30/2015 | | FYE 6/30/2014 | |
Audit-Related Fees | | 0 | % | 0 | % |
Tax Fees | | 0 | % | 0 | % |
All Other Fees | | 0 | % | 0 | % |
All of the principal accountant’s hours spent on auditing the registrant’s financial statements were attributed to work performed by full-time permanent employees of the principal accountant.
The following table indicates the non-audit fees billed or expected to be billed by the registrant’s accountant for services to the registrant and to the registrant’s investment adviser for the last two years. The registrant’s accountant did not provide any non-audit services to the registrant’s investment adviser and any entity controlling, controlled by or under common control with the investment adviser. Therefore, the Committee was not required to consider whether the provision of non-audit services by the accountant would compromise the principal accountant’s independence.
Non-Audit Related Fees | | FYE 6/30/2015 | | FYE 6/30/2014 | |
Registrant | | $ | 64,370 | | $ | 52,800 | |
Registrant’s Investment Adviser | | $ | 0 | | $ | 0 | |
Item 5. Audit Committee of Listed Registrants.
Not applicable to registrants who are not listed issuers (as defined in Rule 10A-3 under the Securities Exchange Act of 1934).
Item 6. Investments.
Schedule of Investments is included as part of the report to shareholders filed under Item 1 of this Form.
Item 7. Disclosure of Proxy Voting Policies and Procedures for Closed-End Management Investment Companies.
Not applicable to open-end investment companies.
Item 8. Portfolio Managers of Closed-End Management Investment Companies.
Not applicable to open-end investment companies.
Item 9. Purchases of Equity Securities by Closed-End Management Investment Company and Affiliated Purchasers.
Not applicable to open-end investment companies.
Item 10. Submission of Matters to a Vote of Security Holders.
The identification and recommendation of individuals for Board membership is the responsibility of the Nominating and Governance Committee. Shareholders may submit suggestions for candidates by forwarding their correspondence by U.S. mail or other courier service to the registrant’s Secretary for the attention of the Chairman of the Nominating and Governance Committee, 725 South Figueroa Street, 39th Floor, Los Angeles, CA 90017-5439.
Item 11. Controls and Procedures.
(a) The registrant’s President / Principal Executive Officer and Treasurer / Principal Financial Officer have reviewed the registrant’s disclosure controls and procedures (as defined in Rule 30a-3(c) under the Investment Company Act of 1940 (the “Act”)) as of a date within 90 days of the filing of this report, as required by Rule 30a-3(b) under the Act and Rules 13a-15(b) or 15d-15(b) under the Securities Exchange Act of 1934. Based on their review, such officers have concluded that the disclosure controls and procedures are effective in ensuring that information required to be disclosed in this report is appropriately recorded, processed, summarized and reported and made known to them by others within the registrant and by the registrant’s service provider.
(b) There were no changes in the registrant’s internal control over financial reporting (as defined in Rule 30a-3(d) under the Act) that occurred during the second fiscal quarter of the period covered by this report that has materially affected, or is reasonably likely to materially affect, the registrant’s internal control over financial reporting.
Item 12. Exhibits.
(a) (1) Any code of ethics or amendment thereto, that is the subject of the disclosure required by Item 2, to the extent that the registrant intends to satisfy Item 2 requirements through filing an exhibit. Available without charge, upon request, by calling toll-free at 1-800-796-5606.
(2) A separate certification for each principal executive officer and principal financial officer pursuant to Section 302 of the Sarbanes-Oxley Act of 2002. Filed herewith.
(3) Any written solicitation to purchase securities under Rule 23c-1 under the Act sent or given during the period covered by the report by or on behalf of the registrant to 10 or more persons. Not applicable to open-end investment companies.
(b) Certifications pursuant to Section 906 of the Sarbanes-Oxley Act of 2002. Furnished herewith.
SIGNATURES
Pursuant to the requirements of the Securities Exchange Act of 1934 and the Investment Company Act of 1940, the registrant has duly caused this report to be signed on its behalf by the undersigned, thereunto duly authorized.
(Registrant) | Hotchkis & Wiley Funds | |
| |
By (Signature and Title) | /s/ Anna Marie Lopez | |
Anna Marie Lopez, President / Principal Executive Officer | |
| |
Date | August 27, 2015 | |
| | | |
Pursuant to the requirements of the Securities Exchange Act of 1934 and the Investment Company Act of 1940, this report has been signed below by the following persons on behalf of the registrant and in the capacities and on the dates indicated.
By (Signature and Title) | /s/ Anna Marie Lopez | |
Anna Marie Lopez, President / Principal Executive Officer | |
| |
Date | August 27, 2015 | |
| |
By (Signature and Title) | /s/ James Menvielle | |
James Menvielle, Treasurer / Principal Financial Officer | |
| |
Date | August 27, 2015 | |
| | | |