As filed with the Securities and Exchange Commission on August 29, 2014
UNITED STATES
SECURITIES AND EXCHANGE COMMISSION
Washington, D.C. 20549
FORM N-CSR
CERTIFIED SHAREHOLDER REPORT OF REGISTERED
MANAGEMENT INVESTMENT COMPANIES
Investment Company Act file number | 811-10487 |
|
Hotchkis & Wiley Funds |
(Exact name of registrant as specified in charter) |
|
725 South Figueroa Street, 39th Floor Los Angeles, California | | 90017-5439 |
(Address of principal executive offices) | | (Zip code) |
|
Anna Marie Lopez Hotchkis & Wiley Capital Management, LLC 725 South Figueroa Street, 39th Floor Los Angeles, California 90017-5439 |
(Name and address of agent for service) |
|
Copies to: Karin Jagel Flynn, Esq. Vedder Price P.C. 222 North LaSalle Street Chicago, IL 60601 |
(Counsel for the Registrant) |
|
Registrant’s telephone number, including area code: | (213) 430-1000 | |
|
Date of fiscal year end: | June 30, 2014 | |
|
Date of reporting period: | July 1, 2013 – June 30, 2014 | |
| | | | | | | | | |
Item 1. Reports to Stockholders.

Hotchkis & Wiley Funds
Annual Report
JUNE 30, 2014
DIVERSIFIED VALUE FUND
LARGE CAP VALUE FUND
MID-CAP VALUE FUND
SMALL CAP VALUE FUND
GLOBAL VALUE FUND
VALUE OPPORTUNITIES FUND
CAPITAL INCOME FUND
HIGH YIELD FUND

SHAREHOLDER LETTER | | | 3 | | |
FUND PERFORMANCE DATA | | | 6 | | |
SCHEDULE OF INVESTMENTS: | |
DIVERSIFIED VALUE FUND | | | 15 | | |
LARGE CAP VALUE FUND | | | 18 | | |
MID-CAP VALUE FUND | | | 20 | | |
SMALL CAP VALUE FUND | | | 23 | | |
GLOBAL VALUE FUND | | | 26 | | |
VALUE OPPORTUNITIES FUND | | | 28 | | |
CAPITAL INCOME FUND | | | 31 | | |
| HIGH YIELD FUND | | | 41 | | |
| STATEMENTS OF ASSETS & LIABILITIES | | | 48 | | |
| STATEMENTS OF OPERATIONS | | | 50 | | |
| STATEMENTS OF CHANGES IN NET ASSETS | | | 52 | | |
| FINANCIAL HIGHLIGHTS | | | 56 | | |
| NOTES TO THE FINANCIAL STATEMENTS | | | 60 | | |
REPORT OF INDEPENDENT REGISTERED PUBLIC ACCOUNTING FIRM | | | 71 | | |
| FUND EXPENSE EXAMPLES | | | 72 | | |
BOARD CONSIDERATIONS IN APPROVING CONTINUATION OF
INVESTMENT ADVISORY AGREEMENTS | | | 74 | | |
MANAGEMENT | | | 77 | | |
PRIVACY POLICY | | | 78 | | |
INFORMATION ABOUT THE FUNDS | | | BACK COVER | | |
DEAR SHAREHOLDER:
The following investment review and annual report relates to the activities of the Hotchkis & Wiley Funds for the twelve-month period ended June 30, 2014.
OVERVIEW
Despite several incidences of geopolitical unrest, the equity market, as represented by the S&P 500® Index, gained +24.61% and the high yield market, as represented by the BofA Merrill Lynch US High Yield Index, gained +11.8% over the twelve months ended June 30, 2014. Investors appeared to largely dismiss the Russia/Ukraine and various other global conflicts as economically inconsequential. Economic activity has been predominantly positive and seems to have reignited investor confidence in risky assets. The unemployment rate fell to a post-financial crisis low, and now stands at 6.1% compared to 10.0% at the end of 2009. The housing market demonstrated signs of improvement, with new home sales reaching six-year highs and pending sales of existing homes reaching four-year highs. Corporate performance continued to be relatively robust with most companies exceeding rising consensus earnings estimates. In response to these developments, the Federal Open Market Committee's most recent statement struck an increasingly optimistic tone, which helped boost equity and high yield fixed income markets.
While the yield curve has flattened over the past couple of quarters, the curve remained normal, which has been a constructive signal for economic growth historically. An inverted yield curve has preceded nearly every recession over the past century, but it would take a dramatic move from the current interest rate environment for this to occur. The yield-to-worst on the high yield market declined, finishing the period at 4.9%. The market's spread over similar duration Treasuries tightened, finishing the period at 350 basis points. Spreads are narrower than average, which should not be surprising given the sturdy economic and corporate foundation, low default rate environment, and extended debt maturities.
In the equity market, all sectors posted positive returns over the twelve-month period, but dispersion between the best and worst performers was notable. Materials, information technology, and health care led the way while telecommunication services, consumer staples, and financials lagged. In addition, growth stocks outperformed value stocks but by a slight margin. In aggregate, large cap stocks and small cap stocks performed similarly, and international developed markets performed in line with U.S. markets after adjusting for modest currency movements.
Given the rise in both equity and high yield prices, our expectations have been somewhat tempered as valuations have risen. We continued to find interesting opportunities selectively, and believe our focus on risk is particularly important in today's environment.
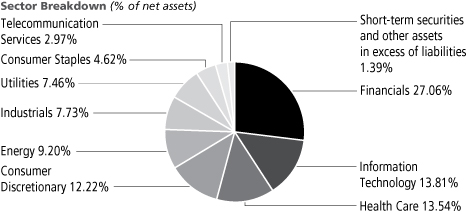
HOTCHKIS & WILEY DIVERSIFIED VALUE FUND
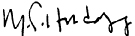
The Fund's Class I shares had a total return of 24.98% for the twelve-month period ended June 30, 2014 compared to the Russell 1000® Value Index return of 23.81%.
More than 95% of the outperformance was due to positive stock selection. Stock selection was particularly favorable in financials, industrials, utilities, and telecommunication services. The largest individual performance contributors were Corning, Total, and Lockheed Martin. Stock selection in energy and a lack of exposure to materials, the Index's top-performing sector, detracted from performance over the period. The largest individual detractors were Cobalt International Energy, Target, and Citigroup.
HOTCHKIS & WILEY LARGE CAP VALUE FUND
The Fund's Class I shares had a total return of 26.52% for the twelve-month period ended June 30, 2014, compared to the Russell 1000® Value Index return of 23.81%.
All of the Fund's outperformance over the period was due to positive stock selection. Stock selection was strongest in energy, industrials, financials, and health care. The overweight position in information technology was also a modest performance contributor over the period. The largest individual contributors to performance over the period were Total, Corning, and Hewlett-Packard. Stock selection in consumer staples, and no exposure to materials — the top-performing sector in the Russell 1000® Value Index — detracted from performance. The largest individual detractors to relative performance over the period were Target, Citigroup, and Wal-Mart.
HOTCHKIS & WILEY MID-CAP VALUE FUND
The Fund's Class I shares had a total return of 28.10% for the twelve-month period ended June 30, 2014, compared to the Russell Midcap® Value Index return of 27.76%.
More than 2/3 of the outperformance was due to positive stock selection, which was particularly strong in industrials, utilities, and information technology. The underweight in Real Estate Investment Trusts (REITs), which is a substantial portion of the Index, also helped performance, as REITs lagged the broad market by a substantial margin. ARRIS Group, Goodyear Tire, and Valassis Communications were the largest individual performance contributors. Stock selection in energy and information technology, along with an underweight position in health care, detracted from performance over the period. Cobalt International Energy, Rent-A-Center, and Willis Group Holdings were the largest individual performance detractors.
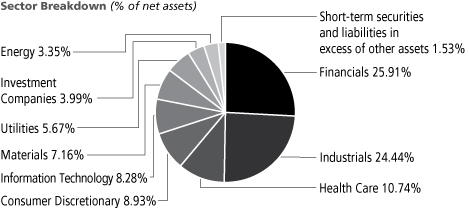
HOTCHKIS & WILEY SMALL CAP VALUE FUND
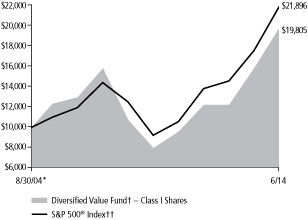
The Fund's Class I shares had a total return of 32.40% for the twelve-month period ended June 30, 2014, compared to the Russell 2000® Value Index return of 22.54%, outperforming the Index by nearly 1,000 basis points.
Positive stock selection drove the majority of the outperformance over the period, with industrials, information technology, and financials particularly compelling. The overweight in industrials and underweight in REITs were secondary performance contributors. Over the twelve months, ARRIS Group, Taro Pharmaceutical, and Huntington Ingalls were the three largest individual performance contributors. An underweight and stock selection in energy detracted from performance. Rent-A-Center, First Horizon National, and Quiksilver were the three largest individual performance detractors.
3
HOTCHKIS & WILEY GLOBAL VALUE FUND
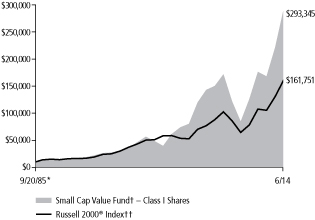
The Fund's Class I shares had a total return of 25.98% for the twelve-month period ended June 30, 2014, compared to the Russell Developed Index return of 25.43%.
All of the Fund's outperformance is attributable to positive stock selection, which was positive across all major geographic regions. Stock selection was especially strong in consumer discretionary, industrials, and information technology. An underweight position in Japan was also beneficial, as it lagged the global developed equity market by about 10 percentage points (in U.S. dollar terms). The largest individual contributors to performance over the period were Taro Pharmaceutical, Direct Line Insurance, and Corning. Stock selection in energy and telecommunication services detracted from performance over the period. The largest individual detractors from performance over the period were Cobalt International Energy, Citigroup, and Mobistar.
HOTCHKIS & WILEY VALUE OPPORTUNITIES FUND
The Fund's Class I shares had a total return of 25.67% for the twelve-month period ended June 30, 2014, compared to the S&P 500® Index return of 24.61%.
More than 80% of the Fund's outperformance over the twelve-month period was due to positive security selection. Positive selection in health care, financials, industrials, and information technology were each important performance contributors. An underweight in the consumer sectors was modestly beneficial also. The largest individual performance contributors were Direct Line Insurance, Taro Pharmaceutical, and Valassis Communications. Security selection in energy and an overweight position in financials were the primary performance detractors over the period. The largest individual performance detractors were Cobalt International Energy, Rent-A-Center, and Citigroup.
HOTCHKIS & WILEY CAPITAL INCOME FUND
The Fund's Class I shares had a total return of 19.71% for the twelve-month period ended June 30, 2014, compared to the 50/50 blended benchmark of the S&P 500® Index and the BofA Merrill Lynch U.S. Corporate, Government and Mortgage Index return of 14.26%. The equity portion of the Fund and the high yield portion of the Fund both outperformed their respective benchmarks over the period. Also, the Fund was overweight equities relative to the long-term target (56% average weight versus a long term target of 50%) which also helped performance as equities outperformed fixed income.
The equity portion of the Fund outperformed the S&P 500® Index, all of which can be attributed to positive stock selection. Being overweight telecommunication services and utilities while being underweight materials and information technology hurt relative performance, but positive selection more than compensated for this allocation. Stock selection was strongest in energy, industrials, and consumer discretionary. The largest individual contributors to performance were Total, Royal Dutch Shell, and Molson Coors, while the largest individual detractors from performance were Target, Wal-Mart, and Exelon.
The fixed income portion of the Fund outperformed the BofA Merrill Lynch U.S. Corporate, Government and Mortgage Index for the twelve-month period. It also outperformed the broad high yield (BofA
Merrill Lynch US High Yield Index) market due to positive credit selection, which drove all of the excess return. Credit selection was strongest in automotive, media, financial services, and services. The modest cash position was a slight performance drag along with credit selection in the banking sector.
HOTCHKIS & WILEY HIGH YIELD FUND
The Fund's Class I shares had a total return of 11.51% for the twelve-month period ended June 30, 2014, compared to the BofA Merrill Lynch BB-B US High Yield Constrained Index return of 11.33%.
Credit selection was positive or neutral in 13 of the 16 BofA Merrill Lynch sectors. Automotive, financial services, media, and services were particularly strong. Credit selection in banking and consumer cyclicals along with an underweight position in telecommunications detracted from performance but by a small degree. Positive credit selection has been the predominant driver of excess returns since the Fund's inception, which now dates back more than five years.
CONCLUSION
We appreciate your continued support of the Hotchkis & Wiley Funds, and we look forward to serving your investment needs in the future.
Sincerely,

| | 
| | 
| |
Anna Marie Lopez
President | | George Davis
Fund Manager | | Sheldon Lieberman
Fund Manager | |

| | 
| | 
| |
Patty McKenna
Fund Manager | | James Miles
Fund Manager | | Stan Majcher
Fund Manager | |

| | 
| | 
| |
David Green
Fund Manager | | Scott McBride
Fund Manager | | Judd Peters
Fund Manager | |

| | 
| | 
| |
Ray Kennedy
Fund Manager | | Mark Hudoff
Fund Manager | | Patrick Meegan
Fund Manager | |

| | 
| | | |
Scott Rosenthal
Fund Manager | | Richard Mak
Fund Manager | | | |
4
Past performance does not guarantee future results
The above reflects opinions of Fund managers as of June 30, 2014. They are subject to change and any forecasts made cannot be guaranteed. The Funds might not continue to hold any securities mentioned and have no obligation to disclose purchases or sales in these securities. Please refer to the Schedule of Investments in this report for a complete list of Fund holdings for June 30, 2014. Indexes do not incur expenses or sales loads and are not available for investment.
Performance attribution is an analysis of the portfolio's return relative to a selected benchmark and is calculated using daily holding information (and does not reflect payment of transaction costs, fees and expenses of the Funds). Specific securities identified are the largest contributors (or detractors) on a relative basis to a designated index. Securities' absolute performance may reflect different results.
The Global Industry Classification Standard (GICS®) was developed by MSCI, an independent provider of global indices and benchmark-related products and services, and Standard & Poor's (S&P), an independent international financial data and investment services company. The GICS methodology has been widely accepted as an industry analysis framework for investment research, portfolio management and asset allocation. The GICS structure consists of 10 sectors, 24 industry groups, 67 industries and 156 sub-industries. Each stock that is classified will have a coding at all four of these levels.
A basis point is one hundredth of one percent (0.01%).
Duration is a commonly used measure of the potential volatility of the price of a debt security, or the aggregate market value of a portfolio of debt securities, prior to maturity. Securities with a longer duration generally have more volatile prices than securities of comparable quality with a shorter duration.
Spread is the percentage point difference between yields of various classes of bonds compared to Treasury bonds.
Yield-to-Worst is the lowest possible yield from owning a bond considering all potential call dates prior to maturity.
The 50/50 blended benchmark is an average, equal weighted blend of the S&P 500® Index and the BofA Merrill Lynch U.S. Corporate, Government and Mortgage Index.
5
ABOUT FUND PERFORMANCE
The Large Cap Value Fund and Mid-Cap Value Fund have four classes of shares. The Diversified Value Fund, Small Cap Value Fund, Global Value Fund, Value Opportunities Fund, Capital Income Fund and High Yield Fund have three classes of shares. Each share class has its own sales charge and expense structure, allowing you to invest in the way that best suits your needs. Currently, the Global Value Fund and Capital Income Fund are not offering Class C shares to investors.
Class I shares have no initial sales charge and bear no ongoing distribution and service fees under a 12b-1 plan. Class I shares are available only to eligible investors.
Class A shares incur a maximum initial sales charge of 5.25% for the Diversified Value Fund, Large Cap Value Fund, Mid-Cap Value Fund, Small Cap Value Fund, Global Value Fund and Value Opportunities Fund, 4.75% for the Capital Income Fund and 3.75% for the High Yield Fund and an annual distribution and service fee of 0.25%.
Class C shares are subject to an annual distribution and service fee of 1.00%. In addition, Class C shares are subject to a 1.00% contingent deferred sales charge (CDSC) if redeemed within one year after purchase. Class C shares automatically convert to Class A shares approximately eight years after purchase and will then be subject to lower distribution and service fees.
Class R shares have no initial sales charge or CDSC and are subject to an annual distribution and service fee of 0.50%. Class R shares are offered only by the Large Cap Value Fund and Mid-Cap Value Fund and are available only to certain retirement plans.
FUND RISKS
Mutual fund investing involves risk; loss of principal is possible. The Small Cap Value Fund, Mid-Cap Value Fund, Global Value Fund and Value Opportunities Fund invest in small- and medium-capitalization companies which tend to have limited liquidity and greater price volatility than large-capitalization companies. The Value Opportunities Fund is a non-diversified fund which involves greater risk than investing in diversified funds, such as business risk, significant stock price fluctuations and sector concentration. Growth stocks typically are more volatile than value stocks; however, value stocks have a lower expected growth rate in earnings and sales. The Value Opportunities Fund, Capital Income Fund and High Yield Fund invest in debt securities that decrease in value when interest rates rise. This risk is usually greater for longer-term debt securities. Investment by the Value Opportunities Fund, Capital Income Fund and High Yield Fund in lower-rated and non-rated securities presents a greater risk of loss to principal and interest than higher-rated securities. The Value Opportunities Fund, Capital Income Fund and High Yield Fund may utilize derivative instruments, which derive their performance from the performance of an underlying asset, index, interest rate or currency exchange rate. Derivatives can be volatile and involve various types and degrees of risks. Depending upon the characteristics of particular derivatives, they can suddenly become illiquid. Investments by the Capital Income Fund and High Yield Fund in asset-backed and mortgage-backed securities include additional risks that investors should be aware of such as credit risk, prepayment risk, possible illiquidity and default, as well as increased susceptibility to adverse economic developments. The Funds may invest in foreign securities, including developed and emerging markets, which involve greater volatility and political, economic, and currency risks.
MARKET INDEXES
The following are definitions for indexes used in the shareholder letter and the performance summary tables on the following pages. These indexes are unmanaged and include the reinvestment of dividends, but do not reflect the payment of transaction costs and advisory and other fees associated with an investment in the Funds. The securities that comprise these indexes may differ substantially from the securities in the Funds' portfolios. The Funds' value disciplines may prevent or restrict investments in the benchmark indexes. It is not possible to invest directly in an index. Each index named is not the only index which may be used to characterize performance of a specific Fund and other indexes may portray different comparative performance.
S&P 500® Index, a capital weighted, unmanaged index, represents the aggregate market value of the common equity of 500 stocks primarily traded on the New York Stock Exchange.
Russell 1000® Index, an unmanaged index, measures the performance of the 1,000 largest companies in the Russell 3000® Index.
Russell 1000® Value Index measures the performance of those Russell 1000® companies with lower price-to-book ratios and lower forecasted growth values.
Russell Midcap® Index, an unmanaged index, measures the performance of the 800 smallest companies in the Russell 1000® Index.
Russell Midcap® Value Index measures the performance of those Russell Midcap® companies with lower price-to-book ratios and lower forecasted growth values.
Russell 2000® Index, an unmanaged index, measures the performance of the 2,000 smallest companies in the Russell 3000® Index.
Russell 2000® Value Index measures the performance of those Russell 2000® companies with lower price-to-book ratios and lower forecasted growth values.
Russell Developed Index measures the performance of the investable securities in developed countries globally across all market capitalization ranges.
BofA Merrill Lynch U.S. Corporate, Government and Mortgage Index is a broad-based measure of the total rate of return performance of the U.S. investment grade bond markets. The Index is a capitalization weighted aggregation of outstanding U.S. Treasury, agency and supranational, mortgage pass-through, and investment grade corporate bonds meeting specified selection criteria.
BofA Merrill Lynch BB-B US High Yield Constrained Index contains all securities in the BofA Merrill Lynch U.S. High Yield Index rated BB+ through B- by S&P (or equivalent as rated by Moody's or Fitch), but caps issuer exposure at 2%. Index constituents are capitalization-weighted, based on their current amount outstanding, provided the total allocation to an individual issuer does not exceed 2%.
BofA Merrill Lynch US High Yield Index tracks the performance of below investment grade, but not in default, U.S. dollar-denominated corporate bonds publicly issued in the U.S. domestic market, and includes issues with a credit rating of BBB or below, as rated by Moody's and S&P.
6
DIVERSIFIED VALUE FUND
Total Return Based on a $10,000 Investment
Comparative Results†††
For Periods ended June 30, 2014 | | 1 Year | | 5 Years | | Since
8/30/04* | |
Class I | |
Average annual total return | | | 24.98 | % | | | 19.94 | % | | | 7.20 | % | |
Class A | |
Average annual total return (with sales charge) | | | 18.11 | % | | | 18.35 | % | | | 6.35 | % | |
Average annual total return (without sales charge) | | | 24.68 | % | | | 19.64 | % | | | 6.93 | % | |
Class C | |
Average annual total return (with CDSC) | | | 22.70 | % | | | 18.76 | % | | | 6.16 | % | |
Average annual total return (without CDSC) | | | 23.70 | % | | | 18.76 | % | | | 6.16 | % | |
S&P 500® Index†† | |
Average annual total return | | | 24.61 | % | | | 18.83 | % | | | 8.29 | % | |
Russell 1000® Index†† | |
Average annual total return | | | 25.35 | % | | | 19.25 | % | | | 8.73 | % | |
Russell 1000® Value Index†† | |
Average annual total return | | | 23.81 | % | | | 19.23 | % | | | 8.24 | % | |
Average annual total returns with sales charge and CDSC shown for Class A and Class C shares, respectively, have been adjusted to reflect the applicable sales charges of each specific class. Returns for Class A reflect the maximum initial sales charge of 5.25%. Class C shares have no adjustment for sales charges, but redemptions within one year of purchase may be subject to a CDSC of 1%. Average annual total returns without sales charge or CDSC do not reflect the sales charges. Had the sales charge or CDSC been included, the Fund's returns would have been lower.
† The Fund invests primarily in equity securities of companies with market capitalizations similar to the Russell 1000® Index.
†† See index descriptions on page 6.
††† Fund returns during certain periods shown reflect a fee waiver and/or expense reimbursement. Without waiver/reimbursement, returns would have been lower. Returns shown include the reinvestment of all dividends.
* Commencement of Class I, Class A and Class C.
Past performance is not indicative of future results and the graph and table do not reflect the deduction of taxes that a shareholder would pay on Fund distributions or the redemption of Fund shares.
7
LARGE CAP VALUE FUND
Total Return Based on a $10,000 Investment

Comparative Results†††
For Periods ended June 30, 2014 | | 1 Year | | 5 Years | | 10 Years | | Since
6/24/87* | |
Class I | |
Average annual total return | | | 26.52 | % | | | 20.69 | % | | | 6.25 | % | | | 9.38 | % | |
Class A | |
Average annual total return (with sales charge) | | | 19.57 | % | | | 19.11 | % | | | 5.40 | % | | | 8.92 | % | |
Average annual total return (without sales charge) | | | 26.22 | % | | | 20.39 | % | | | 5.97 | % | | | 9.14 | % | |
Class C | |
Average annual total return (with CDSC) | | | 24.29 | % | | | 19.49 | % | | | 5.24 | % | | | 8.31 | % | |
Average annual total return (without CDSC) | | | 25.29 | % | | | 19.49 | % | | | 5.24 | % | | | 8.31 | % | |
Class R | |
Average annual total return | | | 25.91 | % | | | 20.10 | % | | | 5.71 | % | | | 8.85 | % | |
S&P 500® Index†† | |
Average annual total return | | | 24.61 | % | | | 18.83 | % | | | 7.78 | % | | | 9.56 | % | |
Russell 1000® Index†† | |
Average annual total return | | | 25.35 | % | | | 19.25 | % | | | 8.19 | % | | | 9.72 | % | |
Russell 1000® Value Index†† | |
Average annual total return | | | 23.81 | % | | | 19.23 | % | | | 8.03 | % | | | n/a | | |
Returns shown for Class A, Class C, and Class R shares for the periods prior to their inception are derived from the historical performance of Class I shares of the Fund during such periods and have been adjusted to reflect the higher total annual operating expenses of each specific class. (Inception dates: Class A — 10/26/01; Class C — 2/4/02; Class R — 8/28/03.)
Average annual total returns with sales charge and CDSC shown for Class A and Class C shares, respectively, have been adjusted to reflect the applicable sales charges of each specific class. Returns for Class A reflect the maximum initial sales charge of 5.25%. Class C shares have no adjustment for sales charges, but redemptions within one year of purchase may be subject to a CDSC of 1%. Average annual total returns without sales charge or CDSC do not reflect the sales charges. Had the sales charge or CDSC been included, the Fund's returns would have been lower.
† The Fund invests primarily in equity securities of companies with market capitalizations similar to the Russell 1000® Index.
†† See index descriptions on page 6.
††† Fund returns during certain periods shown reflect a fee waiver and/or expense reimbursement. Without waiver/reimbursement, returns would have been lower. Returns shown include the reinvestment of all dividends.
* Commencement of Class I.
Past performance is not indicative of future results and the graph and table do not reflect the deduction of taxes that a shareholder would pay on Fund distributions or the redemption of Fund shares.
8
MID-CAP VALUE FUND
Total Return Based on a $10,000 Investment

Comparative Results†††
For Periods ended June 30, 2014 | | 1 Year | | 5 Years | | 10 Years | | Since
1/2/97* | |
Class I | |
Average annual total return | | | 28.10 | % | | | 27.35 | % | | | 10.87 | % | | | 14.03 | % | |
Class A | |
Average annual total return (with sales charge) | | | 21.07 | % | | | 25.66 | % | | | 10.00 | % | | | 13.40 | % | |
Average annual total return (without sales charge) | | | 27.78 | % | | | 27.02 | % | | | 10.60 | % | | | 13.75 | % | |
Class C | |
Average annual total return (with CDSC) | | | 25.84 | % | | | 26.08 | % | | | 9.86 | % | | | 12.94 | % | |
Average annual total return (without CDSC) | | | 26.84 | % | | | 26.08 | % | | | 9.86 | % | | | 12.94 | % | |
Class R | |
Average annual total return | | | 27.47 | % | | | 26.73 | % | | | 10.33 | % | | | 13.55 | % | |
Russell Midcap® Index†† | |
Average annual total return | | | 26.85 | % | | | 22.07 | % | | | 10.43 | % | | | 10.64 | % | |
Russell Midcap® Value Index†† | |
Average annual total return | | | 27.76 | % | | | 22.97 | % | | | 10.66 | % | | | 11.19 | % | |
Returns shown for Class A, Class C, and Class R shares for the periods prior to their inception are derived from the historical performance of Class I shares of the Fund during such periods and have been adjusted to reflect the higher total annual operating expenses of each specific class. (Inception dates: Class A, Class C — 1/2/01; Class R — 8/28/03.)
Average annual total returns with sales charge and CDSC shown for Class A and Class C shares, respectively, have been adjusted to reflect the applicable sales charges of each specific class. Returns for Class A reflect the maximum initial sales charge of 5.25%. Class C shares have no adjustment for sales charges, but redemptions within one year of purchase may be subject to a CDSC of 1%. Average annual total returns without sales charge or CDSC do not reflect the sales charges. Had the sales charge or CDSC been included, the Fund's returns would have been lower.
† The Fund invests primarily in equity securities of companies with market capitalizations similar to the Russell Midcap® Index.
†† See index descriptions on page 6.
††† Fund returns during certain periods shown reflect a fee waiver and/or expense reimbursement. Without waiver/reimbursement, returns would have been lower. Returns shown include the reinvestment of all dividends.
* Commencement of Class I.
Past performance is not indicative of future results and the graph and table do not reflect the deduction of taxes that a shareholder would pay on Fund distributions or the redemption of Fund shares.
9
SMALL CAP VALUE FUND
Total Return Based on a $10,000 Investment
Comparative Results†††
For Periods ended June 30, 2014 | | 1 Year | | 5 Years | | 10 Years | | Since
9/20/85* | |
Class I | |
Average annual total return | | | 32.40 | % | | | 28.31 | % | | | 9.38 | % | | | 12.46 | % | |
Class A | |
Average annual total return (with sales charge) | | | 25.13 | % | | | 26.63 | % | | | 8.52 | % | | | 12.00 | % | |
Average annual total return (without sales charge) | | | 32.06 | % | | | 28.00 | % | | | 9.11 | % | | | 12.21 | % | |
Class C | |
Average annual total return (with CDSC) | | | 30.09 | % | | | 27.05 | % | | | 8.40 | % | | | 11.40 | % | |
Average annual total return (without CDSC) | | | 31.09 | % | | | 27.05 | % | | | 8.40 | % | | | 11.40 | % | |
Russell 2000® Index†† | |
Average annual total return | | | 23.64 | % | | | 20.21 | % | | | 8.70 | % | | | 10.15 | % | |
Russell 2000® Value Index†† | |
Average annual total return | | | 22.54 | % | | | 19.88 | % | | | 8.24 | % | | | n/a | | |
Returns shown for Class A and Class C shares for the periods prior to their inception are derived from the historical performance of Class I shares of the Fund during such periods and have been adjusted to reflect the higher total annual operating expenses of each specific class. (Inception dates: Class A — 10/6/00; Class C — 2/4/02.)
Average annual total returns with sales charge and CDSC shown for Class A and Class C shares, respectively, have been adjusted to reflect the applicable sales charges of each specific class. Returns for Class A reflect the maximum initial sales charge of 5.25%. Class C shares have no adjustment for sales charges, but redemptions within one year of purchase may be subject to a CDSC of 1%. Average annual total returns without sales charge or CDSC do not reflect the sales charges. Had the sales charge or CDSC been included, the Fund's returns would have been lower.
† The Fund invests primarily in equity securities of companies with market capitalizations similar to the Russell 2000® Index.
†† See index descriptions on page 6.
††† Fund returns during certain periods shown reflect a fee waiver and/or expense reimbursement. Without waiver/reimbursement, returns would have been lower. Returns shown include the reinvestment of all dividends.
* Commencement of Class I.
Past performance is not indicative of future results and the graph and table do not reflect the deduction of taxes that a shareholder would pay on Fund distributions or the redemption of Fund shares.
10
GLOBAL VALUE FUND
Total Return Based on a $10,000 Investment
Comparative Results†††
For Periods ended June 30, 2014 | | 1 Year | | Since
12/31/12* | |
Class I | |
Average annual total return | | | 25.98 | % | | | 28.05 | % | |
Class A | |
Average annual total return (with sales charge) | | | 19.02 | % | | | 23.23 | % | |
Average annual total return (without sales charge) | | | 25.65 | % | | | 27.72 | % | |
Russell Developed Index†† | |
Average annual total return | | | 25.43 | % | | | 23.28 | % | |
Returns shown for Class A shares for the periods prior to its inception are derived from the historical performance of Class I shares of the Fund during such periods and have been adjusted to reflect the higher total annual operating expenses of the class. (Inception date: Class A — 8/30/13.)
Average annual total returns with sales charge shown for Class A shares have been adjusted to reflect the applicable sales charge of the class. Returns for Class A reflect the maximum initial sales charge of 5.25%. Average annual total returns without sales charge do not reflect the sales charges. Had the sales charge been included, the Fund's returns would have been lower.
† The Fund invests primarily in U.S. and non-U.S. companies.
†† See index descriptions on page 6.
††† Fund returns during certain periods shown reflect a fee waiver and/or expense reimbursement. Without waiver/reimbursement, returns would have been lower. Returns shown include the reinvestment of all dividends.
* Commencement of Class I.
Past performance is not indicative of future results and the graph and table do not reflect the deduction of taxes that a shareholder would pay on Fund distributions or the redemption of Fund shares.
11
VALUE OPPORTUNITIES FUND
Total Return Based on a $10,000 Investment
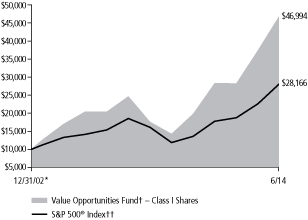
Comparative Results†††
For Periods ended June 30, 2014 | | 1 Year | | 5 Years | | 10 Years | | Since
12/31/02* | |
Class I | |
Average annual total return | | | 25.67 | % | | | 26.87 | % | | | 10.67 | % | | | 14.41 | % | |
Class A | |
Average annual total return (with sales charge) | | | 18.76 | % | | | 25.20 | % | | | 9.80 | % | | | 13.67 | % | |
Average annual total return (without sales charge) | | | 25.34 | % | | | 26.56 | % | | | 10.40 | % | | | 14.20 | % | |
Class C | |
Average annual total return (with CDSC) | | | 23.44 | % | | | 25.61 | % | | | 9.64 | % | | | 13.32 | % | |
Average annual total return (without CDSC) | | | 24.44 | % | | | 25.61 | % | | | 9.64 | % | | | 13.32 | % | |
S&P 500® Index†† | |
Average annual total return | | | 24.61 | % | | | 18.83 | % | | | 7.78 | % | | | 9.42 | % | |
Returns shown for Class C shares for the periods prior to their inception are derived from the historical performance of Class I shares of the Fund during such periods and have been adjusted to reflect the higher total annual operating expenses of the class. (Inception date: Class C — 8/28/03.)
Average annual total returns with sales charge and CDSC shown for Class A and Class C shares, respectively, have been adjusted to reflect the applicable sales charges of each specific class. Returns for Class A reflect the maximum initial sales charge of 5.25%. Class C shares have no adjustment for sales charges, but redemptions within one year of purchase may be subject to a CDSC of 1%. Average annual total returns without sales charge or CDSC do not reflect the sales charges. Had the sales charge or CDSC been included, the Fund's returns would have been lower.
† The Fund invests primarily in securities of companies with strong capital appreciation potential.
†† See index descriptions on page 6.
††† Fund returns during certain periods shown reflect a fee waiver and/or expense reimbursement. Without waiver/reimbursement, returns would have been lower. Returns shown include the reinvestment of all dividends.
* Commencement of Class I and Class A.
Past performance is not indicative of future results and the graph and table do not reflect the deduction of taxes that a shareholder would pay on Fund distributions or the redemption of Fund shares.
12
CAPITAL INCOME FUND
Total Return Based on a $10,000 Investment
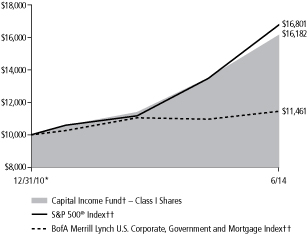
Comparative Results†††
For Periods ended June 30, 2014 | | 1 Year | | Since
12/31/10* | |
Class I | |
Average annual total return | | | 19.71 | % | | | 14.76 | % | |
Class A | |
Average annual total return (with sales charge) | | | 13.49 | % | | | 13.71 | % | |
Average annual total return (without sales charge) | | | 19.17 | % | | | 15.31 | % | |
S&P 500® Index†† | |
Average annual total return | | | 24.61 | % | | | 15.98 | % | |
BofA Merrill Lynch U.S. Corporate, Government and Mortgage Index†† | |
Average annual total return | | | 4.46 | % | | | 3.97 | % | |
Returns shown for Class A shares for the periods prior to its inception are derived from the historical performance of Class I shares of the Fund during such periods and have been adjusted to reflect the higher total annual operating expenses of the class. (Inception date: Class A — 2/28/11.)
Average annual total returns with sales charge shown for Class A shares have been adjusted to reflect the applicable sales charge of the class. Returns for Class A reflect the maximum initial sales charge of 4.75%. Average annual total returns without sales charge do not reflect the sales charges. Had the sales charge been included, the Fund's returns would have been lower.
† The Fund invests primarily in dividend-paying equities and high yield fixed income securities.
†† See index descriptions on page 6.
††† Fund returns during certain periods shown reflect a fee waiver and/or expense reimbursement. Without waiver/reimbursement, returns would have been lower. Returns shown include the reinvestment of all dividends.
* Commencement of Class I.
Past performance is not indicative of future results and the graph and table do not reflect the deduction of taxes that a shareholder would pay on Fund distributions or the redemption of Fund shares.
13
HIGH YIELD FUND
Total Return Based on a $10,000 Investment
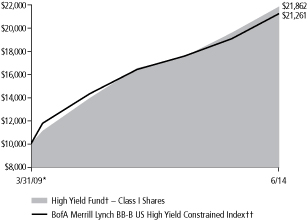
Comparative Results†††
For Periods ended June 30, 2014 | | 1 Year | | 5 Years | | Since
3/31/09* | |
Class I | |
Average annual total return | | | 11.51 | % | | | 14.43 | % | | | 16.07 | % | |
Class A | |
Average annual total return (with sales charge) | | | 7.10 | % | | | 13.18 | % | | | 14.80 | % | |
Average annual total return (without sales charge) | | | 11.28 | % | | | 14.05 | % | | | 15.63 | % | |
Class C | |
Average annual total return (with CDSC) | | | 9.40 | % | | | 13.27 | % | | | 14.89 | % | |
Average annual total return (without CDSC) | | | 10.40 | % | | | 13.27 | % | | | 14.89 | % | |
BofA Merrill Lynch BB-B US High Yield Constrained Index†† | |
Average annual total return | | | 11.33 | % | | | 12.49 | % | | | 15.45 | % | |
Returns shown for Class A and Class C shares for the periods prior to their inception are derived from the historical performance of Class I shares of the Fund during such periods and have been adjusted to reflect the higher total annual operating expenses of the class. (Inception dates: Class A — 5/29/09; Class C — 12/31/12.)
Average annual total returns with sales charge and CDSC shown for Class A and Class C shares, respectively, have been adjusted to reflect the applicable sales charges of each specific class. Returns for Class A reflect the maximum initial sales charge of 3.75%. Class C shares have no adjustment for sales charges, but redemptions within one year of purchase may be subject to a CDSC of 1%. Average annual total returns without sales charge or CDSC do not reflect the sales charges. Had the sales charge or CDSC been included, the Fund's returns would have been lower.
† The Fund invests primarily in high yield securities.
†† See index description on page 6.
††† Fund returns during certain periods shown reflect a fee waiver and/or expense reimbursement. Without waiver/reimbursement, returns would have been lower. Returns shown include the reinvestment of all dividends.
* Commencement of Class I.
Past performance is not indicative of future results and the graph and table do not reflect the deduction of taxes that a shareholder would pay on Fund distributions or the redemption of Fund shares.
14
Schedule of Investments — June 30, 2014
Hotchkis & Wiley Diversified Value Fund
Largest Equity Holdings | | Percent of
net assets | |
JPMorgan Chase & Co. | | | 3.95 | % | |
Citigroup Inc. | | | 3.93 | % | |
American International Group, Inc. | | | 3.86 | % | |
Royal Dutch Shell PLC | | | 3.67 | % | |
Bank of America Corporation | | | 3.05 | % | |
Corning Incorporated | | | 2.97 | % | |
Microsoft Corporation | | | 2.85 | % | |
Oracle Corporation | | | 2.74 | % | |
Hewlett-Packard Company | | | 2.52 | % | |
Vodafone Group Public Limited
Company | | | 2.48 | % | |
COMMON
STOCKS — 97.33% | | Shares
Held | | Value | |
CONSUMER DISCRETIONARY — 14.02%
Auto Components — 2.12% | |
Johnson Controls, Inc. | | | 232,700 | | | $ | 11,618,711 | | |
Automobiles — 2.50% | |
General Motors Company | | | 229,300 | | | | 8,323,590 | | |
Honda Motor Co., Ltd. — ADR | | | 154,900 | | | | 5,419,951 | | |
| | | | 13,743,541 | | |
Hotels, Restaurants & Leisure — 1.19% | |
Carnival Corporation | | | 68,100 | | | | 2,563,965 | | |
McDonald's Corporation | | | 39,300 | | | | 3,959,082 | | |
| | | | 6,523,047 | | |
Media — 5.04% | |
Comcast Corporation | | | 137,300 | | | | 7,322,209 | | |
The Interpublic Group of Companies, Inc. | | | 371,000 | | | | 7,238,210 | | |
Omnicom Group Inc. | | | 38,700 | | | | 2,756,214 | | |
Time Warner Cable Inc. | | | 51,400 | | | | 7,571,220 | | |
Time Warner Inc. | | | 39,800 | | | | 2,795,950 | | |
| | | | 27,683,803 | | |
Multiline Retail — 2.50% | |
Nordstrom, Inc. | | | 40,100 | | | | 2,723,993 | | |
Target Corporation | | | 189,700 | | | | 10,993,115 | | |
| | | | 13,717,108 | | |
Specialty Retail — 0.67% | |
Lowe's Companies, Inc. | | | 77,100 | | | | 3,700,029 | | |
TOTAL CONSUMER DISCRETIONARY | | | 76,986,239 | | |
CONSUMER STAPLES — 5.44%
Beverages — 1.01% | |
Molson Coors Brewing Company | | | 37,300 | | | | 2,766,168 | | |
PepsiCo, Inc. | | | 30,900 | | | | 2,760,606 | | |
| | | | 5,526,774 | | |
Food & Staples Retailing — 2.21% | |
Wal-Mart Stores, Inc. | | | 162,000 | | | | 12,161,340 | | |
| | Shares
Held | | Value | |
Food Products — 1.74% | |
Kellogg Company | | | 61,400 | | | $ | 4,033,980 | | |
Mondelez International, Inc. | | | 146,100 | | | | 5,494,821 | | |
| | | | 9,528,801 | | |
Tobacco — 0.48% | |
Philip Morris International Inc. | | | 31,200 | | | | 2,630,472 | | |
TOTAL CONSUMER STAPLES | | | 29,847,387 | | |
ENERGY — 9.03%
Oil, Gas & Consumable Fuels — 9.03% | |
Cobalt International Energy, Inc. (a) | | | 696,400 | | | | 12,778,940 | | |
Kosmos Energy Ltd. (a) | | | 140,600 | | | | 1,578,938 | | |
Marathon Oil Corporation | | | 243,100 | | | | 9,704,552 | | |
Murphy Oil Corporation | | | 81,200 | | | | 5,398,176 | | |
Royal Dutch Shell PLC — ADR (c) | | | 244,519 | | | | 20,141,030 | | |
TOTAL ENERGY | | | 49,601,636 | | |
FINANCIALS — 25.68%
Banks — 14.32% | |
Bank of America Corporation | | | 1,089,522 | | | | 16,745,953 | | |
Citigroup Inc. | | | 458,174 | | | | 21,579,996 | | |
JPMorgan Chase & Co. | | | 376,200 | | | | 21,676,644 | | |
SunTrust Banks, Inc. | | | 191,700 | | | | 7,679,502 | | |
Wells Fargo & Company | | | 208,234 | | | | 10,944,779 | | |
| | | | 78,626,874 | | |
Capital Markets — 2.28% | |
The Bank of New York Mellon Corporation | | | 155,100 | | | | 5,813,148 | | |
The Goldman Sachs Group, Inc. | | | 16,400 | | | | 2,746,016 | | |
Morgan Stanley | | | 122,400 | | | | 3,957,192 | | |
| | | | 12,516,356 | | |
Consumer Finance — 1.84% | |
Capital One Financial Corporation | | | 122,100 | | | | 10,085,460 | | |
The accompanying notes are an integral part of these financial statements.
15
Schedule of Investments — June 30, 2014
Hotchkis & Wiley Diversified Value Fund
| | Shares
Held | | Value | |
Insurance — 7.24% | |
The Allstate Corporation | | | 181,700 | | | $ | 10,669,424 | | |
American International Group, Inc. | | | 388,500 | | | | 21,204,330 | | |
Unum Group | | | 227,600 | | | | 7,911,376 | | |
| | | | 39,785,130 | | |
TOTAL FINANCIALS | | | 141,013,820 | | |
HEALTH CARE — 15.24%
Health Care Equipment & Supplies — 2.05% | |
Covidien Public Limited Company | | | 35,100 | | | | 3,165,318 | | |
Medtronic, Inc. | | | 83,000 | | | | 5,292,080 | | |
Zimmer Holdings, Inc. | | | 26,700 | | | | 2,773,062 | | |
| | | | 11,230,460 | | |
Health Care Providers & Services — 7.40% | |
Aetna Inc. | | | 37,800 | | | | 3,064,824 | | |
Express Scripts Holding Company (a) | | | 77,100 | | | | 5,345,343 | | |
Humana Inc. | | | 58,400 | | | | 7,458,848 | | |
Quest Diagnostics Inc. | | | 43,800 | | | | 2,570,622 | | |
UnitedHealth Group Incorporated | | | 159,700 | | | | 13,055,475 | | |
WellPoint, Inc. | | | 84,900 | | | | 9,136,089 | | |
| | | | 40,631,201 | | |
Pharmaceuticals — 5.79% | |
Eli Lilly and Company | | | 110,500 | | | | 6,869,785 | | |
GlaxoSmithKline plc — ADR | | | 118,700 | | | | 6,348,076 | | |
Johnson & Johnson | | | 26,200 | | | | 2,741,044 | | |
Novartis AG — ADR | | | 29,500 | | | | 2,670,635 | | |
Sanofi SA — ADR | | | 247,700 | | | | 13,170,209 | | |
| | | | 31,799,749 | | |
TOTAL HEALTH CARE | | | 83,661,410 | | |
INDUSTRIALS — 6.83%
Aerospace & Defense — 2.58% | |
The Boeing Company | | | 51,400 | | | | 6,539,622 | | |
Embraer S.A. — ADR | | | 71,700 | | | | 2,612,031 | | |
Lockheed Martin Corporation | | | 15,800 | | | | 2,539,534 | | |
Northrop Grumman Corporation | | | 20,800 | | | | 2,488,304 | | |
| | | | 14,179,491 | | |
Air Freight & Logistics — 0.52% | |
FedEx Corporation | | | 18,900 | | | | 2,861,082 | | |
Machinery — 3.73% | |
CNH Industrial N.V. (c) | | | 112,800 | | | | 1,152,816 | | |
Cummins Inc. | | | 58,400 | | | | 9,010,536 | | |
PACCAR Inc. | | | 76,700 | | | | 4,819,061 | | |
Stanley Black & Decker, Inc. | | | 62,600 | | | | 5,497,532 | | |
| | | | 20,479,945 | | |
TOTAL INDUSTRIALS | | | 37,520,518 | | |
| | Shares
Held | | Value | |
INFORMATION TECHNOLOGY — 14.04%
Communications Equipment — 0.79% | |
Telefonaktiebolaget LM Ericsson — ADR | | | 359,800 | | | $ | 4,346,384 | | |
Electronic Equipment, Instruments & Components — 3.44% | |
Corning Incorporated | | | 742,800 | | | | 16,304,460 | | |
TE Connectivity Ltd. | | | 41,500 | | | | 2,566,360 | | |
| | | | 18,870,820 | | |
IT Services — 1.22% | |
International Business Machines Corporation | | | 37,000 | | | | 6,706,990 | | |
Semiconductors & Semiconductor Equipment — 0.48% | |
Texas Instruments Incorporated | | | 54,900 | | | | 2,623,671 | | |
Software — 5.59% | |
Microsoft Corporation | | | 375,800 | | | | 15,670,860 | | |
Oracle Corporation | | | 371,100 | | | | 15,040,683 | | |
| | | | 30,711,543 | | |
Technology Hardware, Storage & Peripherals — 2.52% | |
Hewlett-Packard Company | | | 411,600 | | | | 13,862,688 | | |
TOTAL INFORMATION TECHNOLOGY | | | 77,122,096 | | |
TELECOMMUNICATION SERVICES — 2.48%
Wireless Telecommunication Services — 2.48% | |
Vodafone Group Public Limited Company — ADR | | | 407,163 | | | | 13,595,172 | | |
TOTAL TELECOMMUNICATION SERVICES | | | 13,595,172 | | |
UTILITIES — 4.57%
Electric Utilities — 0.98% | |
Edison International | | | 46,700 | | | | 2,713,737 | | |
Exelon Corporation | | | 74,300 | | | | 2,710,464 | | |
| | | | 5,424,201 | | |
Independent Power & Renewable Electricity
Producers — 1.43% | |
NRG Energy, Inc. | | | 210,900 | | | | 7,845,480 | | |
Multi-Utilities — 2.16% | |
Public Service Enterprise Group Incorporated | | | 290,500 | | | | 11,849,495 | | |
TOTAL UTILITIES | | | 25,119,176 | | |
Total common stocks
(Cost $482,941,350) | | | 534,467,454 | | |
Total long-term investments
(Cost $482,941,350) | | | | | 534,467,454 | | |
COLLATERAL FOR SECURITIES ON LOAN — 0.19% | |
Money Market Funds — 0.19% | |
Invesco Government Agency Portfolio, 0.01%^ | | | 1,065,210 | | | | 1,065,210 | | |
Total collateral for securities on loan
(Cost $1,065,210) | | | 1,065,210 | | |
The accompanying notes are an integral part of these financial statements.
16
Schedule of Investments — June 30, 2014
Hotchkis & Wiley Diversified Value Fund
SHORT-TERM
INVESTMENTS — 2.72% | | Principal
Amount | | Value | |
Time Deposits — 2.72% | |
Citibank, 0.03%, 07/01/2014* | | $ | 10,879,749 | | | $ | 10,879,749 | | |
Deutsche Bank, 0.03%, 07/01/2014* | | | 4,072,900 | | | | 4,072,900 | | |
Total short-term investments
(Cost $14,952,649) | | | 14,952,649 | | |
Total investments — 100.24%
(Cost $498,959,209) | | | 550,485,313 | | |
Liabilities in excess of other assets — (0.24)% | | | | | (1,342,134 | ) | |
Net assets — 100.00% | | $ | 549,143,179 | | |
(a) — Non-income producing security.
(c) — All or a portion of this security is on loan. The total market value of securities on loan was $1,042,147.
ADR — American Depositary Receipt
^ — Rate shown is the 7-day yield as of June 30, 2014.
* — Invested through a cash management account administered by Brown Brothers Harriman & Co.
The Global Industry Classification Standard (GICS®) was developed by MSCI, an independent provider of global indices and benchmark-related products and services, and Standard & Poor's (S&P), an independent international financial data and investment services company. The GICS methodology has been widely accepted as an industry analysis framework for investment research, portfolio management and asset allocation. The GICS structure consists of 10 sectors, 24 industry groups, 67 industries and 156 sub-industries. Each stock that is classified will have a coding at all four of these levels.
The accompanying notes are an integral part of these financial statements.
17
Schedule of Investments — June 30, 2014
Hotchkis & Wiley Large Cap Value Fund
Largest Equity Holdings | | Percent of
net assets | |
American International Group, Inc. | | | 4.72 | % | |
JPMorgan Chase & Co. | | | 4.19 | % | |
Citigroup Inc. | | | 4.15 | % | |
Royal Dutch Shell PLC | | | 4.04 | % | |
Bank of America Corporation | | | 3.30 | % | |
Corning Incorporated | | | 3.04 | % | |
Vodafone Group Public Limited
Company | | | 2.97 | % | |
Wal-Mart Stores, Inc. | | | 2.95 | % | |
Microsoft Corporation | | | 2.95 | % | |
Hewlett-Packard Company | | | 2.84 | % | |
COMMON
STOCKS — 98.61% | | Shares
Held | | Value | |
CONSUMER DISCRETIONARY — 12.22%
Auto Components — 3.24% | |
Johnson Controls, Inc. | | | 341,000 | | | $ | 17,026,130 | | |
Lear Corporation | | | 41,900 | | | | 3,742,508 | | |
Magna International Inc. | | | 36,000 | | | | 3,879,000 | | |
| | | | 24,647,638 | | |
Automobiles — 2.01% | |
General Motors Company | | | 214,700 | | | | 7,793,610 | | |
Honda Motor Co., Ltd. — ADR | | | 213,900 | | | | 7,484,361 | | |
| | | | 15,277,971 | | |
Hotels, Restaurants & Leisure — 0.73% | |
McDonald's Corporation | | | 55,300 | | | | 5,570,922 | | |
Media — 3.58% | |
Comcast Corporation | | | 222,000 | | | | 11,839,260 | | |
The Interpublic Group of Companies, Inc. | | | 389,600 | | | | 7,601,096 | | |
Time Warner Cable Inc. | | | 52,900 | | | | 7,792,170 | | |
| | | | 27,232,526 | | |
Multiline Retail — 2.66% | |
Target Corporation | | | 349,800 | | | | 20,270,910 | | |
TOTAL CONSUMER DISCRETIONARY | | | 92,999,967 | | |
CONSUMER STAPLES — 4.62%
Food & Staples Retailing — 2.95% | |
Wal-Mart Stores, Inc. | | | 299,200 | | | | 22,460,944 | | |
Food Products — 1.20% | |
Kellogg Company | | | 81,500 | | | | 5,354,550 | | |
Mondelez International, Inc. | | | 99,000 | | | | 3,723,390 | | |
| | | | 9,077,940 | | |
Tobacco — 0.47% | |
Philip Morris International Inc. | | | 42,500 | | | | 3,583,175 | | |
TOTAL CONSUMER STAPLES | | | 35,122,059 | | |
| | Shares
Held | | Value | |
ENERGY — 9.20%
Oil, Gas & Consumable Fuels — 9.20% | |
Marathon Oil Corporation | | | 384,800 | | | $ | 15,361,216 | | |
Murphy Oil Corporation | | | 243,300 | | | | 16,174,584 | | |
Royal Dutch Shell PLC — ADR (c) | | | 373,143 | | | | 30,735,789 | | |
Total S.A. — ADR | | | 107,200 | | | | 7,739,840 | | |
TOTAL ENERGY | | | 70,011,429 | | |
FINANCIALS — 27.06%
Banks — 14.63% | |
Bank of America Corporation | | | 1,631,689 | | | | 25,079,060 | | |
BB&T Corporation | | | 98,600 | | | | 3,887,798 | | |
Citigroup Inc. | | | 670,768 | | | | 31,593,173 | | |
JPMorgan Chase & Co. | | | 553,700 | | | | 31,904,194 | | |
Wells Fargo & Company | | | 358,691 | | | | 18,852,799 | | |
| | | | 111,317,024 | | |
Capital Markets — 1.58% | |
The Bank of New York Mellon Corporation | | | 217,300 | | | | 8,144,404 | | |
The Goldman Sachs Group, Inc. | | | 23,300 | | | | 3,901,352 | | |
| | | | 12,045,756 | | |
Consumer Finance — 1.97% | |
Capital One Financial Corporation | | | 181,500 | | | | 14,991,900 | | |
Insurance — 8.88% | |
The Allstate Corporation | | | 321,000 | | | | 18,849,120 | | |
American International Group, Inc. | | | 658,600 | | | | 35,946,388 | | |
Unum Group | | | 367,800 | | | | 12,784,728 | | |
| | | | 67,580,236 | | |
TOTAL FINANCIALS | | | 205,934,916 | | |
HEALTH CARE — 13.54%
Health Care Equipment & Supplies — 0.97% | |
Zimmer Holdings, Inc. | | | 71,300 | | | | 7,405,218 | | |
The accompanying notes are an integral part of these financial statements.
18
Schedule of Investments — June 30, 2014
Hotchkis & Wiley Large Cap Value Fund
| | Shares
Held | | Value | |
Health Care Providers & Services — 6.10% | |
Humana Inc. | | | 81,200 | | | $ | 10,370,864 | | |
UnitedHealth Group Incorporated | | | 262,600 | | | | 21,467,550 | | |
WellPoint, Inc. | | | 135,300 | | | | 14,559,633 | | |
| | | | 46,398,047 | | |
Pharmaceuticals — 6.47% | |
Eli Lilly and Company | | | 189,200 | | | | 11,762,564 | | |
GlaxoSmithKline plc — ADR | | | 207,700 | | | | 11,107,796 | | |
Johnson & Johnson | | | 73,300 | | | | 7,668,646 | | |
Sanofi SA — ADR | | | 352,400 | | | | 18,737,108 | | |
| | | | 49,276,114 | | |
TOTAL HEALTH CARE | | | 103,079,379 | | |
INDUSTRIALS — 7.73%
Aerospace & Defense — 2.74% | |
The Boeing Company | | | 82,500 | | | | 10,496,475 | | |
Embraer S.A. — ADR | | | 81,900 | | | | 2,983,617 | | |
Lockheed Martin Corporation | | | 23,000 | | | | 3,696,790 | | |
Northrop Grumman Corporation | | | 31,000 | | | | 3,708,530 | | |
| | | | 20,885,412 | | |
Machinery — 4.48% | |
Cummins Inc. | | | 115,800 | | | | 17,866,782 | | |
PACCAR Inc. | | | 137,000 | | | | 8,607,710 | | |
Stanley Black & Decker, Inc. | | | 86,300 | | | | 7,578,866 | | |
| | | | 34,053,358 | | |
Professional Services — 0.51% | |
Manpowergroup Inc. | | | 46,100 | | | | 3,911,585 | | |
TOTAL INDUSTRIALS | | | 58,850,355 | | |
INFORMATION TECHNOLOGY — 13.81%
Communications Equipment — 0.79% | |
Telefonaktiebolaget LM Ericsson — ADR | | | 498,300 | | | | 6,019,464 | | |
Electronic Equipment, Instruments & Components — 3.04% | |
Corning Incorporated | | | 1,053,500 | | | | 23,124,325 | | |
IT Services — 1.47% | |
International Business Machines Corporation | | | 61,600 | | | | 11,166,232 | | |
Software — 5.67% | |
Microsoft Corporation | | | 538,400 | | | | 22,451,280 | | |
Oracle Corporation | | | 510,000 | | | | 20,670,300 | | |
| | | | 43,121,580 | | |
Technology Hardware, Storage & Peripherals — 2.84% | |
Hewlett-Packard Company | | | 642,200 | | | | 21,629,296 | | |
TOTAL INFORMATION TECHNOLOGY | | | 105,060,897 | | |
TELECOMMUNICATION SERVICES — 2.97%
Wireless Telecommunication Services — 2.97% | |
Vodafone Group Public Limited Company — ADR | | | 676,754 | | | | 22,596,816 | | |
TOTAL TELECOMMUNICATION SERVICES | | | 22,596,816 | | |
| | Shares
Held | | Value | |
UTILITIES — 7.46%
Electric Utilities — 3.03% | |
Edison International | | | 66,800 | | | $ | 3,881,748 | | |
Exelon Corporation | | | 102,900 | | | | 3,753,792 | | |
PPL Corporation | | | 215,000 | | | | 7,638,950 | | |
The Southern Company | | | 171,400 | | | | 7,778,132 | | |
| | | | 23,052,622 | | |
Independent Power & Renewable Electricity
Producers — 1.66% | |
NRG Energy, Inc. | | | 339,700 | | | | 12,636,840 | | |
Multi-Utilities — 2.77% | |
Public Service Enterprise Group Incorporated | | | 517,200 | | | | 21,096,588 | | |
TOTAL UTILITIES | | | 56,786,050 | | |
Total common stocks
(Cost $714,016,298) | | | 750,441,868 | | |
Total long-term investments
(Cost $714,016,298) | | | | | 750,441,868 | | |
COLLATERAL FOR SECURITIES ON LOAN — 0.04% | |
Money Market Funds — 0.04% | |
Invesco Government Agency Portfolio, 0.01%^ | | | 311,269 | | | | 311,269 | | |
Total collateral for securities on loan
(Cost $311,269) | | | 311,269 | | |
SHORT-TERM
INVESTMENTS — 1.20% | | Principal
Amount | | | |
Time Deposits — 1.20% | |
SEB, 0.03%, 07/01/2014* | | $ | 9,078,974 | | | | 9,078,974 | | |
Total short-term investments
(Cost $9,078,974) | | | 9,078,974 | | |
Total investments — 99.85%
(Cost $723,406,541) | | | 759,832,111 | | |
Other assets in excess of liabilities — 0.15% | | | | | 1,177,923 | | |
Net assets — 100.00% | | $ | 761,010,034 | | |
(c) — All or a portion of this security is on loan. The total market value of securities on loan was $305,073.
ADR — American Depositary Receipt
^ — Rate shown is the 7-day yield as of June 30, 2014.
* — Invested through a cash management account administered by Brown Brothers Harriman & Co.
The Global Industry Classification Standard (GICS®) was developed by MSCI, an independent provider of global indices and benchmark-related products and services, and Standard & Poor's (S&P), an independent international financial data and investment services company. The GICS methodology has been widely accepted as an industry analysis framework for investment research, portfolio management and asset allocation. The GICS structure consists of 10 sectors, 24 industry groups, 67 industries and 156 sub-industries. Each stock that is classified will have a coding at all four of these levels.
The accompanying notes are an integral part of these financial statements.
19
Schedule of Investments — June 30, 2014
Hotchkis & Wiley Mid-Cap Value Fund

Largest Equity Holdings | | Percent of
net assets | |
SunTrust Banks, Inc. | | | 3.82 | % | |
ARRIS Group, Inc. | | | 3.36 | % | |
Great Plains Energy Incorporated | | | 3.30 | % | |
The Goodyear Tire & Rubber Company | | | 3.25 | % | |
Public Service Enterprise Group
Incorporated | | | 3.23 | % | |
Cobalt International Energy, Inc. | | | 3.19 | % | |
Willis Group Holdings Public Limited
Company | | | 3.18 | % | |
Avnet, Inc. | | | 3.10 | % | |
Kosmos Energy Ltd. | | | 3.09 | % | |
Kohl's Corporation | | | 3.01 | % | |
COMMON
STOCKS — 95.81% | | Shares
Held | | Value | |
CONSUMER DISCRETIONARY — 16.03%
Auto Components — 4.76% | |
The Goodyear Tire & Rubber Company | | | 4,186,900 | | | $ | 116,312,082 | | |
Lear Corporation | | | 606,500 | | | | 54,172,580 | | |
| | | | 170,484,662 | | |
Diversified Consumer Services — 0.76% | |
H & R Block, Inc. | | | 808,800 | | | | 27,110,976 | | |
Media — 2.32% | |
The Interpublic Group of Companies, Inc. | | | 3,301,500 | | | | 64,412,265 | | |
News Corporation (a) | | | 1,055,300 | | | | 18,932,082 | | |
| | | | 83,344,347 | | |
Multiline Retail — 3.01% | |
Kohl's Corporation | | | 2,049,700 | | | | 107,978,196 | | |
Specialty Retail — 5.18% | |
Bed Bath & Beyond Inc. (a) | | | 506,400 | | | | 29,057,232 | | |
Best Buy Co., Inc. | | | 699,800 | | | | 21,700,798 | | |
Office Depot, Inc. (a) | | | 3,255,500 | | | | 18,523,795 | | |
Rent-A-Center, Inc. | | | 2,185,600 | | | | 62,683,008 | | |
Staples, Inc. | | | 4,939,100 | | | | 53,539,844 | | |
| | | | 185,504,677 | | |
TOTAL CONSUMER DISCRETIONARY | | | 574,422,858 | | |
CONSUMER STAPLES — 2.80%
Food Products — 2.80% | |
Bunge Limited | | | 971,900 | | | | 73,514,516 | | |
Fresh Del Monte Produce Inc. | | | 873,400 | | | | 26,769,710 | | |
TOTAL CONSUMER STAPLES | | | 100,284,226 | | |
ENERGY — 8.70%
Energy Equipment & Services — 0.54% | |
McDermott International, Inc. (a) (c) | | | 2,371,300 | | | | 19,183,817 | | |
| | Shares
Held | | Value | |
Oil, Gas & Consumable Fuels — 8.16% | |
Cairn Energy PLC (a) (f) | | | 11,084,600 | | | $ | 37,927,137 | | |
Cobalt International Energy, Inc. (a) | | | 6,224,000 | | | | 114,210,400 | | |
Comstock Resources, Inc. | | | 1,031,600 | | | | 29,751,344 | | |
Kosmos Energy Ltd. (a) | | | 9,853,500 | | | | 110,654,805 | | |
| | | | 292,543,686 | | |
TOTAL ENERGY | | | 311,727,503 | | |
FINANCIALS — 27.20%
Banks — 13.14% | |
CIT Group Inc. | | | 837,000 | | | | 38,301,120 | | |
Comerica Incorporated | | | 326,300 | | | | 16,367,208 | | |
First Horizon National Corporation | | | 5,311,258 | | | | 62,991,515 | | |
KeyCorp | | | 3,181,120 | | | | 45,585,450 | | |
Regions Financial Corporation | | | 10,048,200 | | | | 106,711,884 | | |
SunTrust Banks, Inc. | | | 3,417,500 | | | | 136,905,050 | | |
Zions Bancorporation | | | 2,170,300 | | | | 63,958,741 | | |
| | | | 470,820,968 | | |
Capital Markets — 0.79% | |
Northern Trust Corporation | | | 440,900 | | | | 28,310,189 | | |
Diversified Financial Services — 2.00% | |
PHH Corporation (a) (b) | | | 3,128,000 | | | | 71,881,440 | | |
Insurance — 10.71% | |
Alleghany Corporation (a) | | | 81,800 | | | | 35,838,216 | | |
Aspen Insurance Holdings Limited | | | 622,700 | | | | 28,283,034 | | |
Unum Group | | | 2,308,400 | | | | 80,239,984 | | |
White Mountains Insurance Group, Ltd. | | | 176,300 | | | | 107,267,972 | | |
Willis Group Holdings Public Limited Company | | | 2,633,500 | | | | 114,030,550 | | |
XL Group Public Limited Company | | | 552,500 | | | | 18,083,325 | | |
| | | | 383,743,081 | | |
The accompanying notes are an integral part of these financial statements.
20
Schedule of Investments — June 30, 2014
Hotchkis & Wiley Mid-Cap Value Fund
| | Shares
Held | | Value | |
Real Estate Investment Trusts — 0.56% | |
The GEO Group, Inc. | | | 565,800 | | | $ | 20,216,034 | | |
TOTAL FINANCIALS | | | 974,971,712 | | |
HEALTH CARE — 6.23%
Health Care Providers & Services — 6.23% | |
Humana Inc. | | | 764,300 | | | | 97,616,396 | | |
LifePoint Hospitals, Inc. (a) | | | 578,600 | | | | 35,931,060 | | |
Quest Diagnostics Inc. | | | 1,036,300 | | | | 60,820,447 | | |
WellCare Health Plans, Inc. (a) | | | 388,500 | | | | 29,005,410 | | |
TOTAL HEALTH CARE | �� | | 223,373,313 | | |
INDUSTRIALS — 6.84%
Aerospace & Defense — 0.99% | |
Embraer S.A. — ADR | | | 968,900 | | | | 35,297,027 | | |
Airlines — 1.03% | |
JetBlue Airways Corporation (a) | | | 3,393,300 | | | | 36,817,305 | | |
Machinery — 1.93% | |
Navistar International Corporation (a) | | | 490,600 | | | | 18,387,688 | | |
Stanley Black & Decker, Inc. | | | 579,500 | | | | 50,891,690 | | |
| | | | 69,279,378 | | |
Road & Rail — 2.89% | |
Con-way Inc. | | | 2,057,500 | | | | 103,718,575 | | |
TOTAL INDUSTRIALS | | | 245,112,285 | | |
INFORMATION TECHNOLOGY — 15.36%
Communications Equipment — 3.36% | |
ARRIS Group, Inc. (a) | | | 3,703,300 | | | | 120,468,349 | | |
Electronic Equipment, Instruments & Components — 5.92% | |
Avnet, Inc. | | | 2,503,700 | | | | 110,938,947 | | |
CDW Corporation | | | 2,297,300 | | | | 73,237,924 | | |
Ingram Micro Inc. (a) | | | 954,400 | | | | 27,878,024 | | |
| | | | 212,054,895 | | |
IT Services — 1.16% | |
The Western Union Company | | | 2,390,200 | | | | 41,446,068 | | |
Semiconductors & Semiconductor Equipment — 2.74% | |
Marvell Technology Group Ltd. | | | 1,100,200 | | | | 15,765,866 | | |
ON Semiconductor Corporation (a) | | | 9,041,900 | | | | 82,642,966 | | |
| | | | 98,408,832 | | |
Software — 2.18% | |
CA, Inc. | | | 1,274,700 | | | | 36,634,878 | | |
Comverse, Inc. (a) | | | 152,680 | | | | 4,073,503 | | |
Symantec Corporation | | | 1,636,300 | | | | 37,471,270 | | |
| | | | 78,179,651 | | |
TOTAL INFORMATION TECHNOLOGY | | | 550,557,795 | | |
| | Shares
Held | | Value | |
UTILITIES — 12.65%
Electric Utilities — 7.17% | |
Great Plains Energy Incorporated | | | 4,401,900 | | | $ | 118,279,053 | | |
Pepco Holdings, Inc. | | | 1,492,700 | | | | 41,019,396 | | |
PPL Corporation | | | 2,743,600 | | | | 97,480,108 | | |
| | | | 256,778,557 | | |
Independent Power & Renewable Electricity
Producers — 2.25% | |
NRG Energy, Inc. | | | 2,170,500 | | | | 80,742,600 | | |
Multi-Utilities — 3.23% | |
Public Service Enterprise Group Incorporated | | | 2,838,700 | | | | 115,790,573 | | |
TOTAL UTILITIES | | | 453,311,730 | | |
Total common stocks
(Cost $2,978,129,969) | | | 3,433,761,422 | | |
Total long-term investments
(Cost $2,978,129,969) | | | 3,433,761,422 | | |
COLLATERAL FOR SECURITIES ON LOAN — 0.40% | |
Money Market Funds — 0.40% | |
Invesco Government Agency Portfolio, 0.01%^ | | | 14,602,452 | | | | 14,602,452 | | |
Total collateral for securities on loan
(Cost $14,602,452) | | | 14,602,452 | | |
SHORT-TERM
INVESTMENTS — 5.04% | | Principal
Amount | | | |
Time Deposits — 5.04% | |
Australia and New Zealand Banking Group Limited,
0.03%, 07/01/2014* | | $ | 62,649,036 | | | | 62,649,036 | | |
The Bank of Tokyo — Mitsubishi UFJ, Ltd.
0.03%, 07/01/2014* | | | 117,984,976 | | | | 117,984,976 | | |
Total short-term investments
(Cost $180,634,012) | | | 180,634,012 | | |
Total investments — 101.25%
(Cost $3,173,366,433) | | | 3,628,997,886 | | |
Liabilities in excess of other assets — (1.25)% | | | | | (44,956,035 | ) | |
Net assets — 100.00% | | $ | 3,584,041,851 | | |
(a) — Non-income producing security.
(b) — Affiliated issuer. See Note 6 in Notes to the Financial Statements.
(c) — All or a portion of this security is on loan. The total market value of securities on loan was $14,227,800.
(f) — Security was fair valued as a result of market movements following the close of local trading using a third-party vendor's proprietary fair value pricing model. The total market value of this security was $37,927,137, which represented 1.06% of net assets. See Security Valuation in Note 1 in Notes to the Financial Statements.
ADR — American Depositary Receipt
^ — Rate shown is the 7-day yield as of June 30, 2014.
* — Invested through a cash management account administered by Brown Brothers Harriman & Co.
The accompanying notes are an integral part of these financial statements.
21
Schedule of Investments — June 30, 2014
Hotchkis & Wiley Mid-Cap Value Fund
The Global Industry Classification Standard (GICS®) was developed by MSCI, an independent provider of global indices and benchmark-related products and services, and Standard & Poor's (S&P), an independent international financial data and investment services company. The GICS methodology has been widely accepted as an industry analysis framework for investment research, portfolio management and asset allocation. The GICS structure consists of 10 sectors, 24 industry groups, 67 industries and 156 sub-industries. Each stock that is classified will have a coding at all four of these levels.
The accompanying notes are an integral part of these financial statements.
22
Schedule of Investments — June 30, 2014
Hotchkis & Wiley Small Cap Value Fund
Largest Equity Holdings | | Percent of
net assets | |
Masonite International Corporation | | | 5.18 | % | |
Con-way Inc. | | | 5.15 | % | |
Kaiser Aluminum Corporation | | | 4.01 | % | |
First Horizon National Corporation | | | 3.80 | % | |
Horace Mann Educators Corporation | | | 3.61 | % | |
WellCare Health Plans, Inc. | | | 3.39 | % | |
The GEO Group, Inc. | | | 3.23 | % | |
Matson, Inc. | | | 3.06 | % | |
Sonic Automotive, Inc. | | | 3.03 | % | |
Great Plains Energy Incorporated | | | 2.98 | % | |
COMMON
STOCKS — 94.48% | | Shares
Held | | Value | |
CONSUMER DISCRETIONARY — 8.93%
Hotels, Restaurants & Leisure — 0.59% | |
Lakes Entertainment, Inc. (a) | | | 197,000 | | | $ | 927,870 | | |
Ruby Tuesday, Inc. (a) | | | 677,800 | | | | 5,144,502 | | |
| | | | 6,072,372 | | |
Household Durables — 1.69% | |
M/I Homes, Inc. (a) | | | 433,600 | | | | 10,523,472 | | |
William Lyon Homes (a) | | | 228,700 | | | | 6,961,628 | | |
| | | | 17,485,100 | | |
Multiline Retail — 0.49% | |
Big Lots, Inc. (a) | | | 109,500 | | | | 5,004,150 | | |
Specialty Retail — 5.78% | |
Rent-A-Center, Inc. | | | 991,000 | | | | 28,421,880 | | |
Sonic Automotive, Inc. | | | 1,174,000 | | | | 31,322,320 | | |
| | | | 59,744,200 | | |
Textiles, Apparel & Luxury Goods — 0.38% | |
Quiksilver, Inc. (a) | | | 1,096,700 | | | | 3,926,186 | | |
TOTAL CONSUMER DISCRETIONARY | | | 92,232,008 | | |
ENERGY — 3.35%
Energy Equipment & Services — 0.84% | |
McDermott International, Inc. (a) (c) | | | 1,077,700 | | | | 8,718,593 | | |
Oil, Gas & Consumable Fuels — 2.51% | |
Cairn Energy PLC (a) (f) | | | 3,342,600 | | | | 11,437,061 | | |
Cobalt International Energy, Inc. (a) | | | 397,200 | | | | 7,288,620 | | |
Rockhopper Exploration PLC (a) | | | 4,768,500 | | | | 7,181,476 | | |
| | | | 25,907,157 | | |
TOTAL ENERGY | | | 34,625,750 | | |
| | Shares
Held | | Value | |
FINANCIALS — 25.91%
Banks — 7.84% | |
Associated Banc-Corp | | | 482,500 | | | $ | 8,723,600 | | |
Cascade Bancorp (a) | | | 413,765 | | | | 2,155,715 | | |
First Horizon National Corporation | | | 3,308,231 | | | | 39,235,623 | | |
First Niagara Financial Group, Inc. | | | 1,256,200 | | | | 10,979,188 | | |
Investors Bancorp, Inc. | | | 276,500 | | | | 3,055,325 | | |
Synovus Financial Corp. | | | 364,671 | | | | 8,890,679 | | |
Webster Financial Corporation | | | 254,300 | | | | 8,020,622 | | |
| | | | 81,060,752 | | |
Capital Markets — 0.22% | |
Oppenheimer Holdings Inc. | | | 96,800 | | | | 2,322,232 | | |
Diversified Financial Services — 2.34% | |
PHH Corporation (a) | | | 1,050,700 | | | | 24,145,086 | | |
Insurance — 10.97% | |
Aspen Insurance Holdings Limited | | | 351,000 | | | | 15,942,420 | | |
Employers Holdings, Inc. | | | 118,000 | | | | 2,499,240 | | |
Endurance Specialty Holdings Ltd. | | | 81,800 | | | | 4,220,062 | | |
Global Indemnity Public Limited Company (a) | | | 375,536 | | | | 9,760,181 | | |
The Hanover Insurance Group, Inc. | | | 97,200 | | | | 6,138,180 | | |
Horace Mann Educators Corporation | | | 1,192,200 | | | | 37,280,094 | | |
National Western Life Insurance Company | | | 5,800 | | | | 1,446,578 | | |
Platinum Underwriters Holdings, Ltd. | | | 314,400 | | | | 20,388,840 | | |
Symetra Financial Corporation | | | 691,100 | | | | 15,715,614 | | |
| | | | 113,391,209 | | |
Real Estate Investment Trusts — 4.54% | |
The GEO Group, Inc. | | | 934,996 | | | | 33,407,407 | | |
Granite Real Estate Investment Trust | | | 361,600 | | | | 13,455,136 | | |
| | | | 46,862,543 | | |
TOTAL FINANCIALS | | | 267,781,822 | | |
The accompanying notes are an integral part of these financial statements.
23
Schedule of Investments — June 30, 2014
Hotchkis & Wiley Small Cap Value Fund
| | Shares
Held | | Value | |
HEALTH CARE — 10.74%
Health Care Equipment & Supplies — 1.00% | |
Invacare Corporation | | | 562,600 | | | $ | 10,334,962 | | |
Health Care Providers & Services — 7.01% | |
Hanger, Inc. (a) | | | 313,300 | | | | 9,853,285 | | |
LifePoint Hospitals, Inc. (a) | | | 442,900 | | | | 27,504,090 | | |
WellCare Health Plans, Inc. (a) | | | 469,100 | | | | 35,023,006 | | |
| | | | 72,380,381 | | |
Pharmaceuticals — 2.73% | |
Taro Pharmaceutical Industries Ltd. (a) | | | 201,200 | | | | 28,216,288 | | |
TOTAL HEALTH CARE | | | 110,931,631 | | |
INDUSTRIALS — 24.44%
Aerospace & Defense — 0.85% | |
Embraer S.A. — ADR | | | 113,600 | | | | 4,138,448 | | |
Huntington Ingalls industries, Inc. | | | 48,800 | | | | 4,615,992 | | |
| | | | 8,754,440 | | |
Airlines — 1.34% | |
JetBlue Airways Corporation (a) | | | 1,278,000 | | | | 13,866,300 | | |
Building Products — 5.18% | |
Masonite International Corporation (a) | | | 950,400 | | | | 53,469,504 | | |
Commercial Services & Supplies — 1.06% | |
The Brink's Company | | | 389,800 | | | | 11,000,156 | | |
Machinery — 4.32% | |
Meritor, Inc. (a) | | | 2,149,500 | | | | 28,029,480 | | |
Miller Industries, Inc. (b) | | | 805,800 | | | | 16,583,364 | | |
| | | | 44,612,844 | | |
Marine — 3.06% | |
Matson, Inc. | | | 1,177,700 | | | | 31,609,468 | | |
Professional Services — 1.08% | |
Heidrick & Struggles International, Inc. | | | 121,400 | | | | 2,245,900 | | |
Hudson Global, Inc. (a) (b) | | | 2,266,700 | | | | 8,908,131 | | |
| | | | 11,154,031 | | |
Road & Rail — 5.15% | |
Con-way Inc. | | | 1,055,900 | | | | 53,227,919 | | |
Trading Companies & Distributors — 2.40% | |
Rush Enterprises, Inc. (a) | | | 715,600 | | | | 24,809,852 | | |
TOTAL INDUSTRIALS | | | 252,504,514 | | |
INFORMATION TECHNOLOGY — 8.28%
Communications Equipment — 2.85% | |
ARRIS Group, Inc. (a) | | | 906,700 | | | | 29,494,951 | | |
Semiconductors & Semiconductor Equipment — 3.30% | |
Diodes Incorporated (a) | | | 357,500 | | | | 10,353,200 | | |
ON Semiconductor Corporation (a) | | | 2,592,700 | | | | 23,697,278 | | |
| | | | 34,050,478 | | |
| | Shares
Held | | Value | |
Software — 1.19% | |
Comverse, Inc. (a) | | | 462,510 | | | $ | 12,339,767 | | |
Technology Hardware, Storage & Peripherals — 0.94% | |
QLogic Corporation (a) | | | 960,500 | | | | 9,691,445 | | |
TOTAL INFORMATION TECHNOLOGY | | | 85,576,641 | | |
MATERIALS — 7.16%
Metals & Mining — 7.16% | |
Horsehead Holding Corp. (a) | | | 1,249,100 | | | | 22,808,566 | | |
Kaiser Aluminum Corporation | | | 569,300 | | | | 41,484,891 | | |
Noranda Aluminum Holding Corporation | | | 2,739,100 | | | | 9,669,023 | | |
TOTAL MATERIALS | | | 73,962,480 | | |
UTILITIES — 5.67%
Electric Utilities — 3.17% | |
Great Plains Energy Incorporated | | | 1,147,200 | | | | 30,825,264 | | |
Westar Energy, Inc. | | | 52,300 | | | | 1,997,337 | | |
| | | | 32,822,601 | | |
Independent Power & Renewable Electricity Producers — 2.50% | |
NRG Energy, Inc. | | | 693,999 | | | | 25,816,763 | | |
TOTAL UTILITIES | | | 58,639,364 | | |
Total common stocks
(Cost $819,307,524) | | | | | 976,254,210 | | |
INVESTMENT COMPANIES — 3.99% | |
Exchange Traded Funds — 3.99% | |
iShares Russell 2000 Index Fund (c) | | | 173,300 | | | | 20,589,773 | | |
iShares Russell 2000 Value Index Fund (c) | | | 199,200 | | | | 20,569,392 | | |
Total investment companies
(Cost $33,556,853) | | | | | 41,159,165 | | |
Total long-term investments
(Cost $852,864,377) | | | | | 1,017,413,375 | | |
COLLATERAL FOR SECURITIES ON LOAN — 2.90% | |
Money Market Funds — 2.90% | |
Invesco Government Agency Portfolio, 0.01%^ | | | 29,977,495 | | | | 29,977,495 | | |
Total collateral for securities on loan
(Cost $29,977,495) | | | 29,977,495 | | |
SHORT-TERM
INVESTMENTS — 9.81% | | Principal
Amount | | | |
Time Deposits — 9.81% | |
Banco Santander S.A., 0.03%, 07/01/2014* | | $ | 101,365,378 | | | | 101,365,378 | | |
Total short-term investments
(Cost $101,365,378) | | | 101,365,378 | | |
Total investments — 111.18%
(Cost $984,207,250) | | | 1,148,756,248 | | |
Liabilities in excess of other assets — (11.18)% | | | | | (115,475,275 | ) | |
Net assets — 100.00% | | $ | 1,033,280,973 | | |
The accompanying notes are an integral part of these financial statements.
24
Schedule of Investments — June 30, 2014
Hotchkis & Wiley Small Cap Value Fund
(a) — Non-income producing security.
(b) — Affiliated issuer. See Note 6 in Notes to the Financial Statements.
(c) — All or a portion of these securities are on loan. The total market value of securities on loan was $29,332,167.
(f) — Security was fair valued as a result of market movements following the close of local trading using a third-party vendor's proprietary fair value pricing model. The total market value of this security was $11,437,061, which represented 1.11% of net assets. See Security Valuation in Note 1 in Notes to the Financial Statements.
ADR — American Depositary Receipt
^ — Rate shown is the 7-day yield as of June 30, 2014.
* — Invested through a cash management account administered by Brown Brothers Harriman & Co.
The Global Industry Classification Standard (GICS®) was developed by MSCI, an independent provider of global indices and benchmark-related products and services, and Standard & Poor's (S&P), an independent international financial data and investment services company. The GICS methodology has been widely accepted as an industry analysis framework for investment research, portfolio management and asset allocation. The GICS structure consists of 10 sectors, 24 industry groups, 67 industries and 156 sub-industries. Each stock that is classified will have a coding at all four of these levels.
The accompanying notes are an integral part of these financial statements.
25
Schedule of Investments — June 30, 2014
Hotchkis & Wiley Global Value Fund

Largest Equity Holdings | | Percent of
net assets | |
Direct Line Insurance Group plc | | | 4.89 | % | |
American International Group, Inc. | | | 4.66 | % | |
Citigroup Inc. | | | 3.68 | % | |
JPMorgan Chase & Co. | | | 3.29 | % | |
BAE Systems PLC | | | 3.08 | % | |
Sanofi SA | | | 2.96 | % | |
Bank of America Corporation | | | 2.84 | % | |
Corning Incorporated | | | 2.74 | % | |
Willis Group Holdings Public Limited
Company | | | 2.56 | % | |
Royal Dutch Shell PLC | | | 2.52 | % | |
COMMON
STOCKS — 99.21% | | Shares
Held | | Value | |
CONSUMER DISCRETIONARY — 7.44%
Auto Components — 0.46% | |
Compagnie Generale des Etablissements Michelin (f) | | | 154 | | | $ | 18,388 | | |
Automobiles — 4.62% | |
Bayerische Motoren Werke AG (f) | | | 688 | | | | 65,871 | | |
Honda Motor Co., Ltd. (f) | | | 2,300 | | | | 80,258 | | |
Renault SA (f) | | | 430 | | | | 38,869 | | |
| | | | 184,998 | | |
Distributors — 0.94% | |
SA D'Ieteren NV (f) | | | 899 | | | | 37,659 | | |
Multiline Retail — 1.42% | |
Target Corporation | | | 982 | | | | 56,907 | | |
TOTAL CONSUMER DISCRETIONARY | | | 297,952 | | |
CONSUMER STAPLES — 5.56%
Beverages — 1.47% | |
Heineken Holding N.V. (f) | | | 598 | | | | 39,297 | | |
Stock Spirits Group PLC (a) (f) | | | 3,889 | | | | 19,818 | | |
| | | | 59,115 | | |
Food & Staples Retailing — 3.32% | |
Tesco plc (f) | | | 15,649 | | | | 76,057 | | |
Wal-Mart Stores, Inc. | | | 757 | | | | 56,828 | | |
| | | | 132,885 | | |
Food Products — 0.77% | |
Toyo Suisan Kaisha, Ltd. (f) | | | 1,000 | | | | 30,825 | | |
TOTAL CONSUMER STAPLES | | | 222,825 | | |
ENERGY — 8.35%
Oil, Gas & Consumable Fuels — 8.35% | |
Cairn Energy PLC (a) (f) | | | 14,747 | | | | 50,458 | | |
Cobalt International Energy, Inc. (a) | | | 4,428 | | | | 81,254 | | |
Kosmos Energy Ltd. (a) | | | 3,675 | | | | 41,270 | | |
Rockhopper Exploration PLC (a) | | | 40,126 | | | | 60,431 | | |
Royal Dutch Shell PLC — ADR | | | 1,226 | | | | 100,986 | | |
TOTAL ENERGY | | | 334,399 | | |
| | Shares
Held | | Value | |
FINANCIALS — 29.04%
Banks — 12.59% | |
Bank of America Corporation | | | 7,407 | | | $ | 113,846 | | |
Barclays PLC (f) | | | 12,747 | | | | 46,434 | | |
Citigroup Inc. | | | 3,129 | | | | 147,376 | | |
JPMorgan Chase & Co. | | | 2,289 | | | | 131,892 | | |
Societe Generale (f) | | | 467 | | | | 24,491 | | |
Wells Fargo & Company | | | 759 | | | | 39,893 | | |
| | | | 503,932 | | |
Capital Markets — 0.91% | |
The Bank of New York Mellon Corporation | | | 522 | | | | 19,565 | | |
Credit Suisse Group AG (f) | | | 595 | | | | 16,921 | | |
| | | | 36,486 | | |
Diversified Financial Services — 1.42% | |
ING Groep N.V. (a) (f) | | | 4,052 | | | | 56,859 | | |
Insurance — 14.12% | |
The Allstate Corporation | | | 707 | | | | 41,515 | | |
American International Group, Inc. | | | 3,416 | | | | 186,445 | | |
Direct Line Insurance Group plc (f) | | | 42,450 | | | | 195,900 | | |
White Mountains Insurance Group, Ltd. | | | 64 | | | | 38,940 | | |
Willis Group Holdings Public Limited Company | | | 2,368 | | | | 102,535 | | |
| | | | 565,335 | | |
TOTAL FINANCIALS | | | 1,162,612 | | |
HEALTH CARE — 11.81%
Health Care Providers & Services — 4.19% | |
Humana Inc. | | | 419 | | | | 53,515 | | |
UnitedHealth Group Incorporated | | | 1,119 | | | | 91,478 | | |
WellPoint, Inc. | | | 210 | | | | 22,598 | | |
| | | | 167,591 | | |
The accompanying notes are an integral part of these financial statements.
26
Schedule of Investments — June 30, 2014
Hotchkis & Wiley Global Value Fund
| | Shares
Held | | Value | |
Pharmaceuticals — 7.62% | |
GlaxoSmithKline plc — ADR | | | 1,411 | | | $ | 75,460 | | |
Novartis AG — ADR | | | 219 | | | | 19,826 | | |
Sanofi SA (f) | | | 1,114 | | | | 118,407 | | |
Taro Pharmaceutical Industries Ltd. (a) | | | 652 | | | | 91,436 | | |
| | | | 305,129 | | |
TOTAL HEALTH CARE | | | 472,720 | | |
INDUSTRIALS — 16.62%
Aerospace & Defense — 4.61% | |
BAE Systems plc (f) | | | 16,627 | | | | 123,151 | | |
Embraer S.A. — ADR | | | 1,689 | | | | 61,530 | | |
| | | | 184,681 | | |
Air Freight & Logistics — 2.08% | |
Royal Mail PLC (f) | | | 9,763 | | | | 83,316 | | |
Building Products — 2.44% | |
Masonite International Corporation (a) | | | 1,734 | | | | 97,555 | | |
Construction & Engineering — 0.70% | |
Bouygues SA (f) | | | 673 | | | | 28,004 | | |
Machinery — 5.64% | |
Cummins Inc. | | | 456 | | | | 70,356 | | |
Danieli & C. Officine Meccaniche S.p.A. | | | 4,046 | | | | 90,693 | | |
KSB AG (f) | | | 90 | | | | 64,892 | | |
| | | | 225,941 | | |
Road & Rail — 1.15% | |
Con-way Inc. | | | 912 | | | | 45,974 | | |
TOTAL INDUSTRIALS | | | 665,471 | | |
INFORMATION TECHNOLOGY — 12.55%
Communications Equipment — 1.20% | |
Telefonaktiebolaget LM Ericsson — ADR | | | 3,980 | | | | 48,078 | | |
Electronic Equipment, Instruments & Components — 4.92% | |
Corning Incorporated | | | 4,998 | | | | 109,706 | | |
Nippon Electric Glass Co., Ltd. (f) | | | 15,000 | | | | 87,418 | | |
| | | | 197,124 | | |
Software — 4.09% | |
Microsoft Corporation | | | 2,007 | | | | 83,692 | | |
Oracle Corporation | | | 1,970 | | | | 79,844 | | |
| | | | 163,536 | | |
Technology Hardware, Storage & Peripherals — 2.34% | |
Hewlett-Packard Company | | | 2,786 | | | | 93,833 | | |
TOTAL INFORMATION TECHNOLOGY | | | 502,571 | | |
TELECOMMUNICATION SERVICES — 3.44%
Wireless Telecommunication Services — 3.44% | |
Mobistar SA (a) (f) | | | 1,963 | | | | 37,471 | | |
Vodafone Group Public Limited Company — ADR | | | 3,003 | | | | 100,270 | | |
TOTAL TELECOMMUNICATION SERVICES | | | 137,741 | | |
| | Shares
Held | | Value | |
UTILITIES — 4.40%
Electric Utilities — 1.09% | |
SSE PLC (f) | | | 1,625 | | | $ | 43,532 | | |
Independent Power & Renewable Electricity Producers — 1.48% | |
NRG Energy, Inc. | | | 1,595 | | | | 59,334 | | |
Multi-Utilities — 1.83% | |
Public Service Enterprise Group Incorporated | | | 1,795 | | | | 73,218 | | |
TOTAL UTILITIES | | | 176,084 | | |
Total common stocks
(Cost $3,496,587) | | | 3,972,375 | | |
Total long-term investments
(Cost $3,496,587) | | | | | 3,972,375 | | |
SHORT-TERM
INVESTMENTS — 0.73% | | Principal
Amount | | | |
Time Deposits — 0.73% | �� |
Banco Santander S.A., 0.03%, 07/01/2014* | | $ | 28,736 | | | | 28,736 | | |
Brown Brothers Harriman & Co.,
0.005%, 07/01/2014* | | JPY | 74,523 | | | | 735 | | |
Total short-term investments
(Cost $29,468) | | | 29,471 | | |
Total investments — 99.94%
(Cost $3,526,055) | | | 4,001,846 | | |
Other assets in excess of liabilities — 0.06% | | | | | 2,296 | | |
Net assets — 100.00% | | $ | 4,004,142 | | |
(a) — Non-income producing security.
(f) — Securities were fair valued as a result of market movements following the close of local trading using a third-party vendor's proprietary fair value pricing model. The total market value of these securities was $1,384,296, which represented 34.57% of net assets. See Security Valuation in Note 1 in Notes to the Financial Statements.
ADR — American Depositary Receipt
JPY — Japanese Yen
* — Invested through a cash management account administered by Brown Brothers Harriman & Co.
The Global Industry Classification Standard (GICS®) was developed by MSCI, an independent provider of global indices and benchmark-related products and services, and Standard & Poor's (S&P), an independent international financial data and investment services company. The GICS methodology has been widely accepted as an industry analysis framework for investment research, portfolio management and asset allocation. The GICS structure consists of 10 sectors, 24 industry groups, 67 industries and 156 sub-industries. Each stock that is classified will have a coding at all four of these levels.
The accompanying notes are an integral part of these financial statements.
27
Schedule of Investments — June 30, 2014
Hotchkis & Wiley Value Opportunities Fund
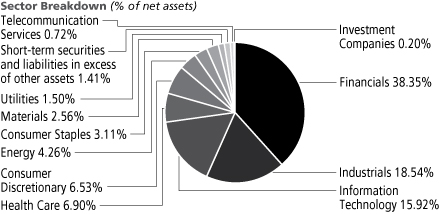
Largest Equity Holdings | | Percent of
net assets | |
Direct Line Insurance Group plc | | | 8.88 | % | |
American International Group, Inc. | | | 8.54 | % | |
Masonite International Corporation | | | 5.61 | % | |
Citigroup Inc. | | | 4.93 | % | |
Bank of America Corporation | | | 4.92 | % | |
JPMorgan Chase & Co. | | | 4.58 | % | |
Oracle Corporation | | | 3.50 | % | |
Nippon Electric Glass Co., Ltd. | | | 3.47 | % | |
Corning Incorporated | | | 3.46 | % | |
Danieli & C. Officine Meccaniche S.p.A. | | | 2.99 | % | |
COMMON
STOCKS — 95.52% | | Shares
Held | | Value | |
CONSUMER DISCRETIONARY — 6.30%
Automobiles — 3.14% | |
Bayerische Motoren Werke AG (f) | | | 90,500 | | | $ | 8,664,683 | | |
General Motors Company | | | 32,300 | | | | 1,172,490 | | |
Motors Liquidation Company GUC Trust (a) | | | 208,100 | | | | 5,327,360 | | |
| | | | 15,164,533 | | |
Hotels, Restaurants & Leisure — 0.55% | |
Lakes Entertainment, Inc. (a) | | | 99,800 | | | | 470,058 | | |
McDonald's Corporation | | | 21,500 | | | | 2,165,910 | | |
| | | | 2,635,968 | | |
Multiline Retail — 0.92% | |
Target Corporation | | | 76,100 | | | | 4,409,995 | | |
Specialty Retail — 1.69% | |
Rent-A-Center, Inc. (b) | | | 147,200 | | | | 4,221,696 | | |
Sonic Automotive, Inc. | | | 63,000 | | | | 1,680,840 | | |
Staples, Inc. | | | 209,300 | | | | 2,268,812 | | |
| | | | 8,171,348 | | |
TOTAL CONSUMER DISCRETIONARY | | | 30,381,844 | | |
CONSUMER STAPLES — 3.11%
Food & Staples Retailing — 1.82% | |
Wal-Mart Stores, Inc. | | | 117,300 | | | | 8,805,711 | | |
Tobacco — 1.29% | |
Philip Morris International Inc. | | | 73,800 | | | | 6,222,078 | | |
TOTAL CONSUMER STAPLES | | | 15,027,789 | | |
ENERGY — 4.26%
Oil, Gas & Consumable Fuels — 4.26% | |
Cairn Energy PLC (a) (f) | | | 489,500 | | | | 1,674,876 | | |
Cobalt International Energy, Inc. (a) | | | 331,300 | | | | 6,079,355 | | |
Kosmos Energy Ltd. (a) | | | 549,700 | | | | 6,173,131 | | |
Rockhopper Exploration PLC (a) | | | 913,600 | | | | 1,375,904 | | |
Royal Dutch Shell PLC — ADR (c) | | | 63,940 | | | | 5,266,738 | | |
TOTAL ENERGY | | | 20,570,004 | | |
| | Shares
Held | | Value | |
FINANCIALS — 37.07%
Banks — 16.93% | |
Bank of America Corporation | | | 1,546,100 | | | $ | 23,763,557 | | |
Citigroup Inc. | | | 504,900 | | | | 23,780,790 | | |
JPMorgan Chase & Co. (b) | | | 384,100 | | | | 22,131,842 | | |
Wells Fargo & Company | | | 229,200 | | | | 12,046,752 | | |
| | | | 81,722,941 | | |
Consumer Finance — 1.19% | |
Capital One Financial Corporation | | | 69,600 | | | | 5,748,960 | | |
Insurance — 18.22% | |
American International Group, Inc. (b) | | | 755,300 | | | | 41,224,274 | | |
Direct Line Insurance Group plc (f) | | | 9,293,700 | | | | 42,888,933 | | |
Global Indemnity Public Limited Company (a) | | | 148,300 | | | | 3,854,317 | | |
| | | | 87,967,524 | | |
Real Estate Investment Trusts — 0.73% | |
The GEO Group, Inc. | | | 99,100 | | | | 3,540,843 | | |
TOTAL FINANCIALS | | | 178,980,268 | | |
HEALTH CARE — 6.90%
Health Care Providers & Services — 3.30% | |
Express Scripts Holding Company (a) | | | 112,800 | | | | 7,820,424 | | |
UnitedHealth Group Incorporated | | | 99,000 | | | | 8,093,250 | | |
| | | | 15,913,674 | | |
Pharmaceuticals — 3.60% | |
Sanofi SA — ADR | | | 123,800 | | | | 6,582,446 | | |
Taro Pharmaceutical Industries Ltd. (a) | | | 77,100 | | | | 10,812,504 | | |
| | | | 17,394,950 | | |
TOTAL HEALTH CARE | | | 33,308,624 | | |
INDUSTRIALS — 18.54%
Air Freight & Logistics — 2.15% | |
Air T, Inc. (a) | | | 42,900 | | | | 560,274 | | |
Royal Mail PLC (f) | | | 1,152,500 | | | | 9,835,311 | | |
| | | | 10,395,585 | | |
The accompanying notes are an integral part of these financial statements.
28
Schedule of Investments — June 30, 2014
Hotchkis & Wiley Value Opportunities Fund
| | Shares
Held | | Value | |
Building Products — 5.61% | |
Masonite International Corporation (a) | | | 481,700 | | | $ | 27,100,442 | | |
Machinery — 7.55% | |
Danieli & C. Officine Meccaniche S.p.A. | | | 643,400 | | | | 14,422,098 | | |
KSB AG (f) | | | 19,973 | | | | 14,401,011 | | |
Meritor, Inc. (a) | | | 330,400 | | | | 4,308,416 | | |
Miller Industries, Inc. (b) | | | 159,798 | | | | 3,288,643 | | |
| | | | 36,420,168 | | |
Professional Services — 0.39% | |
Hudson Global, Inc. (a) | | | 481,700 | | | | 1,893,081 | | |
Road & Rail — 2.84% | |
Con-way Inc. | | | 271,600 | | | | 13,691,356 | | |
TOTAL INDUSTRIALS | | | 89,500,632 | | |
INFORMATION TECHNOLOGY — 15.92%
Electronic Equipment, Instruments & Components — 6.92% | |
Corning Incorporated | | | 760,100 | | | | 16,684,195 | | |
Nippon Electric Glass Co., Ltd. (f) | | | 2,873,000 | | | | 16,743,482 | | |
| | | | 33,427,677 | | |
IT Services — 1.38% | |
International Business Machines Corporation | | | 36,800 | | | | 6,670,736 | | |
Software — 6.40% | |
Microsoft Corporation | | | 335,900 | | | | 14,007,030 | | |
Oracle Corporation | | | 416,800 | | | | 16,892,904 | | |
| | | | 30,899,934 | | |
Technology Hardware, Storage & Peripherals — 1.22% | |
Hewlett-Packard Company (b) | | | 174,300 | | | | 5,870,424 | | |
TOTAL INFORMATION TECHNOLOGY | | | 76,868,771 | | |
MATERIALS — 1.25%
Metals & Mining — 1.25% | |
Kaiser Aluminum Corporation | | | 32,900 | | | | 2,397,423 | | |
Noranda Aluminum Holding Corporation | | | 1,031,100 | | | | 3,639,783 | | |
TOTAL MATERIALS | | | 6,037,206 | | |
TELECOMMUNICATION SERVICES — 0.67%
Wireless Telecommunication Services — 0.67% | |
Mobistar SA (a) (f) | | | 169,900 | | | | 3,243,127 | | |
TOTAL TELECOMMUNICATION SERVICES | | | 3,243,127 | | |
UTILITIES — 1.50%
Electric Utilities — 0.75% | |
Great Plains Energy Incorporated | | | 134,500 | | | | 3,614,015 | | |
Independent Power & Renewable Electricity Producers — 0.75% | |
NRG Energy, Inc. | | | 97,300 | | | | 3,619,560 | | |
TOTAL UTILITIES | | | 7,233,575 | | |
Total common stocks
(Cost $397,296,670) | | | | | 461,151,840 | | |
INVESTMENT
COMPANIES — 0.20% | | Shares
Held | | Value | |
Closed-End Funds — 0.20% | |
Boulder Total Return Fund, Inc. | | | 37,900 | | | $ | 972,135 | | |
Total investment companies
(Cost $649,328) | | | | | 972,135 | | |
PREFERRED STOCKS — 0.63% | |
FINANCIALS — 0.63%
Real Estate — 0.03% | |
W2007 Grace Acquisition I, Inc. (a) | | | 6,366 | | | | 131,856 | | |
Thrifts & Mortgage Finance — 0.60% | |
Federal Home Loan Mortgage
Corporation — Series K (a) | | | 33,900 | | | | 620,031 | | |
Federal Home Loan Mortgage
Corporation — Series N (a) | | | 118,600 | | | | 1,960,458 | | |
Federal Home Loan Mortgage
Corporation — Series S (a) | | | 18,700 | | | | 329,120 | | |
| | | | 2,909,609 | | |
TOTAL FINANCIALS | | | 3,041,465 | | |
Total preferred stocks
(Cost $337,338) | | | | | 3,041,465 | | |
CORPORATE
BONDS — 1.54% | | Principal
Amount | | | |
CONSUMER DISCRETIONARY — 0.23%
Household Durables — 0.23% | |
William Lyon Homes, Inc.
8.500%, 11/15/2020 | | $ | 1,000,000 | | | | 1,123,750 | | |
TOTAL CONSUMER DISCRETIONARY | | | 1,123,750 | | |
MATERIALS — 1.31%
Metals & Mining — 1.31% | |
Horsehead Holding Corp.
10.500%, 06/01/2017
(Acquired 07/19/2012 — 10/23/2012,
Cost $5,496,658) (r) | | | 5,500,000 | | | | 6,338,750 | | |
TOTAL MATERIALS | | | 6,338,750 | | |
Total corporate bonds
(Cost $6,496,658) | | | | | 7,462,500 | | |
PURCHASED
PUT OPTIONS — 0.05% | | Contracts
(100 shares
per contract) | | | |
TELECOMMUNICATION SERVICES — 0.05%
Diversified Telecommunication Services — 0.05% | |
Verizon Communications Inc. (a)
Expiration: January 2015,
Exercise Price: $45.00 | | | 2,000 | | | | 242,000 | | |
TOTAL TELECOMMUNICATION SERVICES | | | 242,000 | | |
Total purchased put options
(Cost $1,066,071) | | | | | 242,000 | | |
The accompanying notes are an integral part of these financial statements.
29
Schedule of Investments — June 30, 2014
Hotchkis & Wiley Value Opportunities Fund
WARRANTS — 0.65% | | Shares
Held | | Value | |
FINANCIALS — 0.65%
Insurance — 0.65% | |
American International Group, Inc. (a)
Expiration: January 2021,
Exercise Price: $45.00 | | | 117,400 | | | $ | 3,122,840 | | |
TOTAL FINANCIALS | | | 3,122,840 | | |
Total warrants
(Cost $887,359) | | | | | 3,122,840 | | |
Total long-term investments
(Cost $406,733,424) | | | | | 475,992,780 | | |
COLLATERAL FOR SECURITIES ON LOAN — 0.01% | |
Money Market Funds — 0.01% | |
Invesco Government Agency Portfolio, 0.01%^ | | | 47,320 | | | | 47,320 | | |
Total collateral for securities on loan
(Cost $47,320) | | | 47,320 | | |
SHORT-TERM
INVESTMENTS — 1.48% | | Principal
Amount | | | |
Time Deposits — 1.48% | |
Australia and New Zealand Banking Group
Limited,
0.03%, 07/01/2014* | | $ | 7,025,792 | | | | 7,025,792 | | |
The Bank of Tokyo — Mitsubishi UFJ, Ltd.
0.005%, 07/01/2014* | | JPY | 9,748,938 | | | | 96,234 | | |
Total short-term investments
(Cost $7,121,638) | | | 7,122,026 | | |
Total investments — 100.08%
(Cost $413,902,382) | | | | | 483,162,126 | | |
Liabilities in excess of other assets — (0.08)% | | | | | (374,172 | ) | |
Net assets — 100.00% | | $ | 482,787,954 | | |
(a) — Non-income producing security.
(b) — All or a portion of this security is segregated as collateral.
(c) — All or a portion of this security is on loan. The total market value of securities on loan was $46,378.
(f) — Securities were fair valued as a result of market movements following the close of local trading using a third-party vendor's proprietary fair value pricing model. The total market value of these securities was $97,451,423, which represented 20.19% of net assets. See Security Valuation in Note 1 in Notes to the Financial Statements.
(r) — Restricted security under Rule 144A of the Securities Act of 1933. Purchased in a private placement transaction; resale to the public may require registration or be limited to qualified institutional buyers. The total market value of this security was $6,338,750, which represented 1.31% of net assets.
ADR — American Depositary Receipt
JPY — Japanese Yen
^ — Rate shown is the 7-day yield as of June 30, 2014.
* — Invested through a cash management account administered by Brown Brothers Harriman & Co.
The Global Industry Classification Standard (GICS®) was developed by MSCI, an independent provider of global indices and benchmark-related products and services, and Standard & Poor's (S&P), an independent international financial data and investment services company. The GICS methodology has been widely accepted as an industry analysis framework for investment research, portfolio management and asset allocation. The GICS structure consists of 10 sectors, 24 industry groups, 67 industries and 156 sub-industries. Each stock that is classified will have a coding at all four of these levels.
The accompanying notes are an integral part of these financial statements.
30
Schedule of Investments — June 30, 2014
Hotchkis & Wiley Capital Income Fund
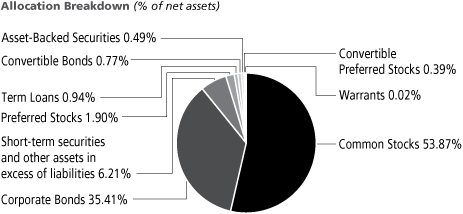
Largest Issuers | | Percent of
net assets | |
Public Service Enterprise Group
Incorporated | | | 2.75 | % | |
Royal Dutch Shell PLC | | | 2.69 | % | |
JPMorgan Chase & Co. | | | 2.68 | % | |
Microsoft Corporation | | | 2.65 | % | |
Wells Fargo & Company | | | 2.40 | % | |
Total S.A. | | | 2.14 | % | |
Vodafone Group Public Limited
Company | | | 1.64 | % | |
PPL Corporation | | | 1.63 | % | |
Eli Lilly and Company | | | 1.62 | % | |
Willis Group Holdings Public Limited
Company | | | 1.60 | % | |
COMMON
STOCKS — 53.87% | | Shares
Held | | Value | |
CONSUMER DISCRETIONARY — 6.03%
Auto Components — 1.59% | |
The Goodyear Tire & Rubber Company | | | 6,624 | | | $ | 184,015 | | |
Johnson Controls, Inc. | | | 18,364 | | | | 916,914 | | |
| | | | 1,100,929 | | |
Automobiles — 1.25% | |
Ford Motor Company | | | 42,963 | | | | 740,682 | | |
General Motors Company | | | 1,170 | | | | 42,471 | | |
General Motors Company — Escrow (a) (f) (i) | | | 4,600 | | | | 0 | | |
Motors Liquidation Company GUC Trust (a) | | | 3,200 | | | | 81,920 | | |
| | | | 865,073 | | |
Hotels, Restaurants & Leisure — 1.60% | |
Carnival Corporation | | | 9,669 | | | | 364,038 | | |
McDonald's Corporation | | | 7,358 | | | | 741,245 | | |
| | | | 1,105,283 | | |
Multiline Retail — 1.59% | |
Target Corporation | | | 19,101 | | | | 1,106,903 | | |
TOTAL CONSUMER DISCRETIONARY | | | 4,178,188 | | |
CONSUMER STAPLES — 6.93%
Beverages — 1.87% | |
Molson Coors Brewing Company | | | 12,472 | | | | 924,923 | | |
PepsiCo, Inc. | | | 4,137 | | | | 369,600 | | |
| | | | 1,294,523 | | |
Food & Staples Retailing — 1.60% | |
Wal-Mart Stores, Inc. (c) | | | 14,762 | | | | 1,108,183 | | |
Food Products — 1.87% | |
Kellogg Company | | | 14,103 | | | | 926,568 | | |
Mondelez International, Inc. | | | 9,857 | | | | 370,722 | | |
| | | | 1,297,290 | | |
Tobacco — 1.59% | |
Philip Morris International Inc. (c) | | | 13,075 | | | | 1,102,353 | | |
TOTAL CONSUMER STAPLES | | | 4,802,349 | | |
| | Shares
Held | | Value | |
ENERGY — 5.36%
Energy Equipment & Services — 0.00% | |
Lone Pine Resources Canada Ltd. (a) (f) (i) | | | 3,118 | | | $ | 3,302 | | |
Lone Pine Resources Inc. (a) (f) (i) | | | 3,118 | | | | 0 | | |
Lone Pine Resources Inc. — Escrow (a) (f) (i) | | | 25,000 | | | | 0 | | |
| | | | 3,302 | | |
Oil, Gas & Consumable Fuels — 5.36% | |
Marathon Oil Corporation | | | 9,270 | | | | 370,058 | | |
Royal Dutch Shell PLC — ADR | | | 22,592 | | | | 1,860,903 | | |
Total S.A. — ADR | | | 20,493 | | | | 1,479,595 | | |
| | | | 3,710,556 | | |
TOTAL ENERGY | | | 3,713,858 | | |
FINANCIALS — 10.92%
Banks — 5.30% | |
Citigroup Inc. | | | 3,172 | | | | 149,401 | | |
JPMorgan Chase & Co. (c) | | | 32,276 | | | | 1,859,743 | | |
Wells Fargo & Company (c) | | | 31,672 | | | | 1,664,680 | | |
| | | | 3,673,824 | | |
Capital Markets — 0.55% | |
The Bank of New York Mellon Corporation | | | 10,113 | | | | 379,035 | | |
Insurance — 2.66% | |
The Allstate Corporation | | | 12,435 | | | | 730,183 | | |
Willis Group Holdings Public Limited Company | | | 25,649 | | | | 1,110,602 | | |
| | | | 1,840,785 | | |
Real Estate Investment Trusts — 2.41% | |
Corrections Corporation of America | | | 22,493 | | | | 738,895 | | |
The GEO Group, Inc. | | | 26,075 | | | | 931,660 | | |
| | | | 1,670,555 | | |
TOTAL FINANCIALS | | | 7,564,199 | | |
The accompanying notes are an integral part of these financial statements.
31
Schedule of Investments — June 30, 2014
Hotchkis & Wiley Capital Income Fund
| | Shares
Held | | Value | |
HEALTH CARE — 6.38%
Health Care Providers & Services — 0.52% | |
WellPoint, Inc. | | | 3,382 | | | $ | 363,937 | | |
Pharmaceuticals — 5.86% | |
Eli Lilly and Company | | | 18,021 | | | | 1,120,366 | | |
GlaxoSmithKline plc — ADR | | | 20,540 | | | | 1,098,479 | | |
Johnson & Johnson | | | 6,972 | | | | 729,411 | | |
Sanofi SA — ADR | | | 20,883 | | | | 1,110,349 | | |
| | | | 4,058,605 | | |
TOTAL HEALTH CARE | | | 4,422,542 | | |
INDUSTRIALS — 3.74%
Aerospace & Defense — 1.88% | |
BAE Systems PLC — ADR | | | 25,365 | | | | 757,399 | | |
The Boeing Company (c) | | | 4,294 | | | | 546,326 | | |
| | | | 1,303,725 | | |
Machinery — 1.86% | |
Cummins Inc. | | | 3,610 | | | | 556,986 | | |
PACCAR Inc. | | | 5,755 | | | | 361,587 | | |
Stanley Black & Decker, Inc. | | | 4,180 | | | | 367,088 | | |
| | | | 1,285,661 | | |
TOTAL INDUSTRIALS | | | 2,589,386 | | |
INFORMATION TECHNOLOGY — 7.41%
Electronic Equipment, Instruments & Components — 0.80% | |
Corning Incorporated | | | 25,246 | | | | 554,150 | | |
IT Services — 1.06% | |
International Business Machines Corporation | | | 4,047 | | | | 733,600 | | |
Software — 4.23% | |
CA, Inc. | | | 25,480 | | | | 732,294 | | |
Microsoft Corporation (c) | | | 43,961 | | | | 1,833,173 | | |
Oracle Corporation | | | 9,003 | | | | 364,892 | | |
| | | | 2,930,359 | | |
Technology Hardware, Storage & Peripherals — 1.32% | |
Hewlett-Packard Company | | | 27,076 | | | | 911,920 | | |
TOTAL INFORMATION TECHNOLOGY | | | 5,130,029 | | |
TELECOMMUNICATION SERVICES — 1.64%
Wireless Telecommunication Services — 1.64% | |
Vodafone Group Public Limited Company — ADR | | | 33,973 | | | | 1,134,358 | | |
TOTAL TELECOMMUNICATION SERVICES | | | 1,134,358 | | |
UTILITIES — 5.46%
Electric Utilities — 2.71% | |
PPL Corporation | | | 31,803 | | | | 1,129,961 | | |
The Southern Company | | | 16,459 | | | | 746,909 | | |
| | | | 1,876,870 | | |
| | Shares
Held | | Value | |
Multi-Utilities — 2.75% | |
Public Service Enterprise Group Incorporated | | | 46,683 | | | $ | 1,904,200 | | |
TOTAL UTILITIES | | | 3,781,070 | | |
Total common stocks
(Cost $33,659,968) | | | | | 37,315,979 | | |
PREFERRED STOCKS — 1.90% | |
ENERGY — 0.02%
Energy Equipment & Services — 0.02% | |
Lone Pine Resources Canada Ltd. (a) (f) (i) | | | 12,005 | | | | 15,366 | | |
Lone Pine Resources Inc. Multiple Voting
Shares (a) (f) (i) | | | 12,005 | | | | 0 | | |
| | | | 15,366 | | |
TOTAL ENERGY | | | 15,366 | | |
FINANCIALS — 1.88%
Banks — 1.88% | |
Citigroup Inc., 7.125% (b) | | | 9,857 | | | | 272,537 | | |
Countrywide Capital V, 7.000% | | | 9,308 | | | | 242,008 | | |
Morgan Stanley Capital Trust III, 6.250% | | | 9,118 | | | | 230,138 | | |
Morgan Stanley Capital Trust VIII, 6.450% | | | 4,005 | | | | 101,006 | | |
The Royal Bank of Scotland Group Public Limited
Company, 6.400% | | | 2,643 | | | | 63,643 | | |
The Royal Bank of Scotland Group Public Limited
Company, 6.600% | | | 9,550 | | | | 234,453 | | |
Synovus Financial Corp., 7.875% (b) | | | 5,700 | | | | 159,600 | | |
| | | | 1,303,385 | | |
TOTAL FINANCIALS | | | 1,303,385 | | |
Total preferred stocks
(Cost $1,267,804) | | | | | 1,318,751 | | |
CONVERTIBLE PREFERRED STOCKS — 0.39% | |
ENERGY — 0.26%
Energy Equipment & Services — 0.14% | |
McDermott International, Inc., 6.250% | | | 3,551 | | | | 97,653 | | |
Oil, Gas & Consumable Fuels — 0.12% | |
PetroQuest Energy, Inc., 6.875% | | | 1,853 | | | | 84,589 | | |
TOTAL ENERGY | | | 182,242 | | |
UTILITIES — 0.13%
Electric Utilities — 0.13% | |
Exelon Corporation, 6.500% | | | 1,650 | | | | 89,012 | | |
TOTAL UTILITIES | | | 89,012 | | |
Total convertible preferred stocks
(Cost $246,163) | | | | | 271,254 | | |
The accompanying notes are an integral part of these financial statements.
32
Schedule of Investments — June 30, 2014
Hotchkis & Wiley Capital Income Fund
CONVERTIBLE
BONDS — 0.77% | | Principal
Amount | | Value | |
CONSUMER DISCRETIONARY — 0.07%
Leisure Products — 0.07% | |
JAKKS Pacific, Inc.
4.500%, 11/01/2014 (i) | | $ | 50,000 | | | $ | 50,500 | | |
TOTAL CONSUMER DISCRETIONARY | | | 50,500 | | |
ENERGY — 0.23%
Oil, Gas & Consumable Fuels — 0.23% | |
Cobalt International Energy, Inc.
3.125%, 05/15/2024 | | | 145,000 | | | | 156,509 | | |
TOTAL ENERGY | | | 156,509 | | |
INDUSTRIALS — 0.47%
Machinery — 0.47% | |
Meritor, Inc.
7.875%, 03/01/2026 | | | 85,000 | | | | 137,222 | | |
4.000%, 02/15/2027 (b) | | | 108,000 | | | | 115,290 | | |
Navistar International Corporation
4.750%, 04/15/2019
(Acquired 03/19/2014 — 03/24/2014,
Cost $64,750) (r) | | | 65,000 | | | | 69,672 | | |
| | | | 322,184 | | |
TOTAL INDUSTRIALS | | | 322,184 | | |
Total convertible bonds
(Cost $487,724) | | | | | 529,193 | | |
CORPORATE BONDS — 35.41% | |
CONSUMER DISCRETIONARY — 9.29%
Auto Components — 0.81% | |
Allison Transmission, Inc.
7.125%, 05/15/2019
(Acquired 05/09/2011 — 04/28/2014,
Cost $75,043) (r) | | | 72,000 | | | | 77,400 | | |
American Axle & Manufacturing, Inc.
7.750%, 11/15/2019 | | | 226,000 | | | | 261,595 | | |
Lear Corporation
5.375%, 03/15/2024 | | | 213,000 | | | | 219,923 | | |
| | | | 558,918 | | |
Automobiles — 0.31% | |
Chrysler Group LLC/CG Co-Issuer Inc.
8.250%, 06/15/2021 | | | 190,000 | | | | 215,650 | | |
Diversified Consumer Services — 0.34% | |
Regal Entertainment Group
5.750%, 03/15/2022 | | | 225,000 | | | | 234,000 | | |
Hotels, Restaurants & Leisure — 0.96% | |
MGM Resorts International
7.750%, 03/15/2022 | | | 257,000 | | | | 301,974 | | |
Ruby Tuesday, Inc.
7.625%, 05/15/2020 | | | 205,000 | | | | 206,025 | | |
Shearer's Foods LLC/Chip Finance Corp.
9.000%, 11/01/2019
(Acquired 10/24/2012 — 06/18/2014,
Cost $154,470) (r) | | | 143,000 | | | | 157,300 | | |
| | | | 665,299 | | |
| | Principal
Amount | | Value | |
Household Durables — 0.70% | |
M/I Homes, Inc.
8.625%, 11/15/2018 | | $ | 55,000 | | | $ | 58,850 | | |
Weekley Homes LLC/Weekley Finance Corp.
6.000%, 02/01/2023 | | | 278,000 | | | | 279,390 | | |
William Lyon Homes, Inc.
8.500%, 11/15/2020 | | | 134,000 | | | | 150,583 | | |
| | | | 488,823 | | |
Leisure Products — 1.76% | |
BC Mountain LLC/BC Mountain Finance Inc.
7.000%, 02/01/2021
(Acquired 01/25/2013 — 06/18/2014,
Cost $202,184) (r) | | | 205,000 | | | | 199,363 | | |
Gibson Brands, Inc.
8.875%, 08/01/2018
(Acquired 07/24/2013 — 06/18/2014,
Cost $193,342) (r) | | | 185,000 | | | | 191,244 | | |
Golden Nugget Escrow Inc.
8.500%, 12/01/2021
(Acquired 11/05/2013 — 06/18/2014,
Cost $158,412) (r) | | | 155,000 | | | | 163,331 | | |
MCE Finance Ltd.
5.000%, 02/15/2021
(Acquired 02/06/2013 — 05/22/2014,
Cost $261,751) (r) | | | 262,000 | | | | 265,929 | | |
Seven Seas Cruises S. De R.L., LLC
9.125%, 05/15/2019 | | | 172,000 | | | | 188,555 | | |
Wynn Macau, Limited
5.250%, 10/15/2021
(Acquired 03/13/2014 — 03/27/2014,
Cost $206,613) (r) | | | 205,000 | | | | 211,150 | | |
| | | | 1,219,572 | | |
The accompanying notes are an integral part of these financial statements.
33
Schedule of Investments — June 30, 2014
Hotchkis & Wiley Capital Income Fund
| | Principal
Amount | | Value | |
Media — 3.03% | |
CCO Holdings, LLC/CCO Holdings Capital Corp.
7.375%, 06/01/2020 | | $ | 141,000 | | | $ | 154,043 | | |
Entercom Radio, LLC
10.500%, 12/01/2019 | | | 150,000 | | | | 172,500 | | |
Harland Clarke Holdings Corp.
9.250%, 03/01/2021
(Acquired 01/27/2014 — 06/10/2014,
Cost $218,604) (r) | | | 215,000 | | | | 226,019 | | |
MDC Partners Inc.
6.750%, 04/01/2020
(Acquired 03/15/2013 — 06/18/2014,
Cost $209,256) (r) | | | 200,000 | | | | 212,000 | | |
Nara Cable Funding Limited
8.875%, 12/01/2018
(Acquired 02/28/2013 — 04/15/2014,
Cost $173,212) (r) | | | 163,000 | | | | 174,818 | | |
Numericable Group SA
6.000%, 05/15/2022
(Acquired 04/23/2014 — 06/09/2014,
Cost $261,360) (r) | | | 255,000 | | | | 265,519 | | |
Townsquare Radio LLC/Townsquare Radio Inc.
9.000%, 04/01/2019
(Acquired 03/30/2012 — 06/24/2014,
Cost $261,008) (r) | | | 240,000 | | | | 266,999 | | |
Virgin Media Finance PLC
6.375%, 04/15/2023
(Acquired 02/07/2013 — 05/27/2014,
Cost $282,974) (r) | | | 270,000 | | | | 294,299 | | |
VTR Finance B.V.
6.875%, 01/15/2024
(Acquired 01/27/2014 — 06/09/2014,
Cost $319,394) (r) | | | 308,000 | | | | 331,355 | | |
| | | | 2,097,552 | | |
Multiline Retail — 0.16% | |
99 Cents Only Stores
11.000%, 12/15/2019 | | | 99,000 | | | | 110,138 | | |
Specialty Retail — 0.94% | |
CST Brands, Inc.
5.000%, 05/01/2023 | | | 268,000 | | | | 269,340 | | |
The Men's Wearhouse, Inc.
7.000%, 07/01/2022
(Acquired 06/11/2014 — 06/25/2014,
Cost $202,418) (r) | | | 196,000 | | | | 203,840 | | |
Outerwall Inc.
5.875%, 06/15/2021
(Acquired 06/04/2014 — 06/06/2014,
Cost $175,438) (r) | | | 175,000 | | | | 177,188 | | |
| | | | 650,368 | | |
| | Principal
Amount | | Value | |
Textiles, Apparel & Luxury Goods — 0.28% | |
Quiksilver Inc./QS Wholesale Inc.
7.875%, 08/01/2018
(Acquired 07/11/2013 — 06/03/2014,
Cost $126,119) (r) | | $ | 120,000 | | | $ | 122,400 | | |
10.000%, 08/01/2020 | | | 70,000 | | | | 70,700 | | |
| | | | 193,100 | | |
TOTAL CONSUMER DISCRETIONARY | | | 6,433,420 | | |
CONSUMER STAPLES — 1.51%
Food Products — 0.61% | |
Pinnacle Operating Corporation
9.000%, 11/15/2020
(Acquired 09/13/2013 — 06/09/2014,
Cost $177,200) (r) | | | 167,000 | | | | 181,613 | | |
Wells Enterprises, Inc.
6.750%, 02/01/2020
(Acquired 01/15/2013 — 06/27/2014,
Cost $239,083) (r) | | | 230,000 | | | | 242,362 | | |
| | | | 423,975 | | |
Household Products — 0.90% | |
American Greetings Corporation
7.375%, 12/01/2021 | | | 246,000 | | | | 262,605 | | |
Central Garden & Pet Company
8.250%, 03/01/2018 | | | 143,000 | | | | 149,078 | | |
FGI Operating Company LLC/FGI Finance Inc.
7.875%, 05/01/2020 | | | 200,000 | | | | 214,000 | | |
| | | | 625,683 | | |
TOTAL CONSUMER STAPLES | | | 1,049,658 | | |
The accompanying notes are an integral part of these financial statements.
34
Schedule of Investments — June 30, 2014
Hotchkis & Wiley Capital Income Fund
| | Principal
Amount | | Value | |
ENERGY — 5.41%
Energy Equipment & Services — 3.48% | |
Atwood Oceanics, Inc.
6.500%, 02/01/2020 | | $ | 250,000 | | | $ | 268,125 | | |
Bonanza Creek Energy, Inc.
6.750%, 04/15/2021 | | | 245,000 | | | | 263,375 | | |
Gastar Exploration, Inc.
8.625%, 05/15/2018 (i) | | | 238,000 | | | | 249,900 | | |
Globe Luxembourg SCA
9.625%, 05/01/2018
(Acquired 05/02/2013 — 06/10/2014,
Cost $254,479) (r) | | | 238,000 | | | | 265,394 | | |
McDermott International, Inc.
8.000%, 05/01/2021
(Acquired 04/10/2014 — 06/18/2014,
Cost $183,613) (r) | | | 180,000 | | | | 185,850 | | |
Parsley Energy LLC/
Parsley Finance Corporation
7.500%, 02/15/2022
(Acquired 01/31/2014 — 06/27/2014,
Cost $253,054) (r) | | | 241,000 | | | | 258,473 | | |
PHI, Inc.
5.250%, 03/15/2019
(Acquired 03/06/2014 — 06/03/2014,
Cost $235,213) (r) | | | 233,000 | | | | 238,243 | | |
Shale-Inland Holdings LLC/
Shale-Inland Finance Corp.
8.750%, 11/15/2019
(Acquired 10/26/2012 — 06/18/2014,
Cost $129,183) (r) | | | 125,000 | | | | 131,875 | | |
Shelf Drilling Holdings Ltd.
8.625%, 11/01/2018
(Acquired 10/10/2012 — 06/24/2014,
Cost $259,282) (r) | | | 245,000 | | | | 263,375 | | |
Unit Corporation
6.625%, 05/15/2021 | | | 264,000 | | | | 283,139 | | |
| | | | 2,407,749 | | |
| | Principal
Amount | | Value | |
Oil, Gas & Consumable Fuels — 1.93% | |
Calumet Specialty Products Partners LP/
Calumet Finance Corp.
6.500%, 04/15/2021
(Acquired 06/23/2014 — 06/24/2014,
Cost $70,890) (r) | | $ | 69,000 | | | $ | 70,725 | | |
Comstock Resources, Inc.
9.500%, 06/15/2020 | | | 166,000 | | | | 190,070 | | |
Gulfport Energy Corporation
7.750%, 11/01/2020 | | | 250,000 | | | | 271,875 | | |
Holly Energy Partners LP/
Holly Energy Finance Corp.
6.500%, 03/01/2020 | | | 184,000 | | | | 199,180 | | |
PBF Holding Company LLC/
PBF Finance Corp.
8.250%, 02/15/2020 | | | 232,000 | | | | 254,040 | | |
PetroQuest Energy, Inc.
10.000%, 09/01/2017 | | | 90,000 | | | | 95,409 | | |
Stone Energy Corporation
7.500%, 11/15/2022 | | | 234,000 | | | | 259,155 | | |
| | | | 1,340,454 | | |
TOTAL ENERGY | | | 3,748,203 | | |
FINANCIALS — 1.28%
Banks — 0.63% | |
First Tennessee Capital II
6.300%, 04/15/2034 | | | 255,000 | | | | 251,175 | | |
Popular, Inc.
7.000%, 07/01/2019 | | | 182,000 | | | | 185,640 | | |
| | | | 436,815 | | |
Consumer Finance — 0.65% | |
Credit Acceptance Corporation
6.125%, 02/15/2021
(Acquired 01/16/2014 — 05/30/2014,
Cost $258,482) (r) | | | 250,000 | | | | 262,500 | | |
Navient Corporation
8.000%, 03/25/2020 | | | 163,000 | | | | 188,876 | | |
| | | | 451,376 | | |
TOTAL FINANCIALS | | | 888,191 | | |
The accompanying notes are an integral part of these financial statements.
35
Schedule of Investments — June 30, 2014
Hotchkis & Wiley Capital Income Fund
| | Principal
Amount | | Value | |
HEALTH CARE — 3.18%
Health Care Providers & Services — 1.96% | |
Air Medical Group Holdings, Inc.
9.250%, 11/01/2018 | | $ | 185,000 | | | $ | 197,950 | | |
CHS/Community Health Systems, Inc.
8.000%, 11/15/2019 | | | 43,000 | | | | 47,193 | | |
6.875%, 02/01/2022
(Acquired 01/15/2014 — 06/09/2014,
Cost $263,822) (r) | | | 255,000 | | | | 271,574 | | |
HCA Inc.
6.500%, 02/15/2020 | | | 230,000 | | | | 259,325 | | |
LifePoint Hospitals, Inc.
5.500%, 12/01/2021
(Acquired 11/21/2013 — 05/01/2014,
Cost $235,499) (r) | | | 230,000 | | | | 241,500 | | |
Universal Hospital Services, Inc.
7.625%, 08/15/2020 | | | 190,000 | | | | 199,975 | | |
WellCare Health Plans, Inc.
5.750%, 11/15/2020 | | | 128,000 | | | | 136,960 | | |
| | | | 1,354,477 | | |
Health Care Technology — 0.30% | |
DJO Finance LLC
9.750%, 10/15/2017 | | | 98,000 | | | | 103,145 | | |
8.750%, 03/15/2018 | | | 100,000 | | | | 108,000 | | |
| | | | 211,145 | | |
Pharmaceuticals — 0.92% | |
ConvaTec Healthcare E S.A.
10.500%, 12/15/2018
(Acquired 12/31/2010 — 05/06/2014,
Cost $160,358) (r) | | | 150,000 | | | | 162,563 | | |
Grifols Worldwide Operations Limited
5.250%, 04/01/2022
(Acquired 03/05/2014 — 05/27/2014,
Cost $199,444) (r) | | | 195,000 | | | | 202,800 | | |
Salix Pharmaceuticals, Ltd.
6.000%, 01/15/2021
(Acquired 12/12/2013 — 05/01/2014,
Cost $263,658) (r) | | | 250,000 | | | | 268,750 | | |
| | | | 634,113 | | |
TOTAL HEALTH CARE | | | 2,199,735 | | |
INDUSTRIALS — 5.59%
Aerospace & Defense — 0.28% | |
Huntington Ingalls Industries, Inc.
7.125%, 03/15/2021 | | | 179,000 | | | | 196,453 | | |
| | Principal
Amount | | Value | |
Building Products — 1.49% | |
Allegion US Holding Company Inc.
5.750%, 10/01/2021
(Acquired 09/27/2013 — 06/27/2014,
Cost $298,070) (r) | | $ | 285,000 | | | $ | 301,387 | | |
Building Materials Corporation of America
6.750%, 05/01/2021
(Acquired 11/21/2011 — 06/10/2014,
Cost $240,550) (r) | | | 225,000 | | | | 243,000 | | |
Masonite International Corporation
8.250%, 04/15/2021
(Acquired 03/06/2012 — 06/18/2014,
Cost $232,855) (r) | | | 215,000 | | | | 235,425 | | |
Roofing Supply Group LLC/
Roofing Supply Finance Inc.
10.000%, 06/01/2020
(Acquired 05/24/2012 — 06/11/2014,
Cost $254,911) (r) | | | 235,000 | | | | 252,625 | | |
| | | | 1,032,437 | | |
Commercial Services & Supplies — 1.45% | |
Aguila 3 S.A.
7.875%, 01/31/2018
(Acquired 03/24/2014 — 06/09/2014,
Cost $211,405) (r) | | | 200,000 | | | | 211,125 | | |
Audatex North America, Inc.
6.000%, 06/15/2021
(Acquired 10/17/2013 — 05/28/2014,
Cost $246,036) (r) | | | 232,000 | | | | 248,820 | | |
International Lease Finance Corporation
8.250%, 12/15/2020 | | | 210,000 | | | | 259,875 | | |
Zachry Holdings, Inc.
7.500%, 02/01/2020
(Acquired 01/18/2013 — 05/15/2014,
Cost $279,448) (r) | | | 262,000 | | | | 282,304 | | |
| | | | 1,002,124 | | |
The accompanying notes are an integral part of these financial statements.
36
Schedule of Investments — June 30, 2014
Hotchkis & Wiley Capital Income Fund
| | Principal
Amount | | Value | |
Construction & Engineering — 1.36% | |
Century Communities, Inc.
6.875%, 05/15/2022
(Acquired 04/30/2014 — 06/18/2014,
Cost $147,337) (r) | | $ | 145,000 | | | $ | 148,988 | | |
Rice Energy Inc.
6.250%, 05/01/2022
(Acquired 04/16/2014 — 06/18/2014,
Cost $146,361) (r) | | | 145,000 | | | | 148,806 | | |
RSI Home Products, Inc.
6.875%, 03/01/2018
(Acquired 02/15/2013 — 05/30/2014,
Cost $233,773) (r) | | | 222,000 | | | | 237,539 | | |
Tutor Perini Corporation
7.625%, 11/01/2018 | | | 129,000 | | | | 136,256 | | |
WCI Communities, Inc.
6.875%, 08/15/2021 | | | 190,000 | | | | 196,175 | | |
6.875%, 08/15/2021
(Acquired 06/23/2014,
Cost $76,875) (r) | | | 75,000 | | | | 77,438 | | |
| | | | 945,202 | | |
Electrical Equipment — 0.24% | |
General Cable Corporation
6.500%, 10/01/2022
(Acquired 02/06/2013 — 06/18/2014,
Cost $165,510) (r) | | | 163,000 | | | | 166,668 | | |
Industrial Conglomerates — 0.36% | |
Actuant Corporation
5.625%, 06/15/2022 | | | 234,000 | | | | 246,870 | | |
Machinery — 0.41% | |
Mcron Finance Sub LLC/Mcron Finance Corp.
8.375%, 05/15/2019
(Acquired 04/20/2012 — 05/21/2014,
Cost $134,607) (r) | | | 127,000 | | | | 139,700 | | |
Navistar International Corporation
8.250%, 11/01/2021 | | | 135,000 | | | | 141,413 | | |
| | | | 281,113 | | |
TOTAL INDUSTRIALS | | | 3,870,867 | | |
INFORMATION TECHNOLOGY — 2.33%
Communications Equipment — 0.15% | |
CommScope, Inc.
5.000%, 06/15/2021
(Acquired 05/15/2014 — 05/16/2014,
Cost $100,459) (r) | | | 100,000 | | | | 102,500 | | |
| | Principal
Amount | | Value | |
Electronic Equipment, Instruments & Components — 1.49% | |
CommScope Holding Company, Inc.
6.625%, 06/01/2020
(Acquired 05/22/2013 — 06/09/2014,
Cost $191,889) (p) (r) | | $ | 185,000 | | | $ | 198,413 | | |
Freescale Semiconductor, Inc.
8.050%, 02/01/2020 | | | 103,000 | | | | 111,498 | | |
6.000%, 01/15/2022
(Acquired 10/28/2013 — 06/09/2014,
Cost $213,526) (r) | | | 205,000 | | | | 218,838 | | |
NXP B.V. and NXP Funding LLC
5.750%, 03/15/2023
(Acquired 05/06/2013 — 05/02/2014,
Cost $242,832) (r) | | | 233,000 | | | | 245,523 | | |
WESCO Distribution, Inc.
5.375%, 12/15/2021
(Acquired 11/21/2013 — 06/11/2014,
Cost $253,008) (r) | | | 248,000 | | | | 254,199 | | |
| | | | 1,028,471 | | |
Software — 0.69% | |
ACI Worldwide, Inc.
6.375%, 08/15/2020
(Acquired 08/15/2013 — 04/21/2014,
Cost $221,553) (r) | | | 213,000 | | | | 224,715 | | |
First Data Corporation
8.875%, 08/15/2020
(Acquired 12/31/2010 — 08/23/2012,
Cost $41,255) (r) | | | 40,000 | | | | 44,350 | | |
8.750%, 01/15/2022
(Acquired 11/19/2012 — 05/01/2014,
Cost $203,558) (p) (r) | | | 190,884 | | | | 211,643 | | |
| | | | 480,708 | | |
TOTAL INFORMATION TECHNOLOGY | | | 1,611,679 | | |
The accompanying notes are an integral part of these financial statements.
37
Schedule of Investments — June 30, 2014
Hotchkis & Wiley Capital Income Fund
| | Principal
Amount | | Value | |
MATERIALS — 5.45%
Chemicals — 2.72% | |
Axalta Coating Systems US Holdings Inc./
Axalta Coating Systems Dutch Holding B BV
7.375%, 05/01/2021
(Acquired 01/16/2013 — 05/30/2014,
Cost $257,075) (r) | | $ | 239,000 | | | $ | 261,705 | | |
Hexion U.S. Finance Corp.
6.625%, 04/15/2020 | | | 136,000 | | | | 144,840 | | |
Hexion U.S. Finance Corp./Hexion Nova
Scotia Finance ULC
8.875%, 02/01/2018 | | | 110,000 | | | | 114,675 | | |
Iracore International Holdings, Inc.
9.500%, 06/01/2018
(Acquired 05/08/2013 — 05/29/2014,
Cost $148,365) (i) (r) | | | 141,000 | | | | 148,050 | | |
Momentive Performance Materials Inc.
8.875%, 10/15/2020 (d) | | | 122,000 | | | | 130,845 | | |
10.000%, 10/15/2020 (d) | | | 95,000 | | | | 101,531 | | |
OMNOVA Solutions Inc.
7.875%, 11/01/2018 | | | 115,000 | | | | 121,181 | | |
Perstorp Holding AB
8.750%, 05/15/2017
(Acquired 11/09/2012 — 04/15/2014,
Cost $146,070) (r) | | | 140,000 | | | | 150,850 | | |
Rayonier A.M. Products Inc.
5.500%, 06/01/2024
(Acquired 05/08/2014 — 06/11/2014,
Cost $223,850) (r) | | | 220,000 | | | | 224,400 | | |
Taminco Global Chemical Corporation
9.750%, 03/31/2020
(Acquired 01/20/2012 — 05/13/2014,
Cost $224,784) (r) | | | 204,000 | | | | 228,990 | | |
Trinseo Materials Operating SCA/
Trinseo Materials Finance Inc.
8.750%, 02/01/2019 | | | 240,000 | | | | 259,200 | | |
| | | | 1,886,267 | | |
Containers & Packaging — 0.35% | |
Silgan Holdings Inc.
5.500%, 02/01/2022
(Acquired 10/25/2013 — 05/27/2014,
Cost $236,396) (r) | | | 232,000 | | | | 241,280 | | |
| | Principal
Amount | | Value | |
Metals & Mining — 1.41% | |
Century Aluminum Company
7.500%, 06/01/2021
(Acquired 05/23/2013 — 06/20/2014,
Cost $194,982) (r) | | $ | 190,000 | | | $ | 201,400 | | |
Horsehead Holding Corp.
10.500%, 06/01/2017
(Acquired 07/19/2012 — 06/18/2014,
Cost $163,347) (i) (r) | | | 150,000 | | | | 172,875 | | |
Kaiser Aluminum Corporation
8.250%, 06/01/2020 | | | 203,000 | | | | 229,390 | | |
Noranda Aluminum Acquisition Corporation
11.000%, 06/01/2019 | | | 185,000 | | | | 184,538 | | |
Rain CII Carbon LLC
8.000%, 12/01/2018
(Acquired 12/31/2010 — 09/06/2012,
Cost $51,219) (r) | | | 50,000 | | | | 52,875 | | |
8.250%, 01/15/2021
(Acquired 12/14/2012 — 06/10/2014,
Cost $135,393) (r) | | | 130,000 | | | | 137,150 | | |
| | | | 978,228 | | |
Paper & Forest Products — 0.97% | |
Appvion, Inc.
9.000%, 06/01/2020
(Acquired 11/13/2013 — 05/02/2014,
Cost $228,097) (r) | | | 226,000 | | | | 225,718 | | |
Neenah Paper, Inc.
5.250%, 05/15/2021
(Acquired 05/16/2013 — 05/02/2014,
Cost $224,888) (r) | | | 223,000 | | | | 227,459 | | |
Sappi Papier Holding GmbH
7.750%, 07/15/2017
(Acquired 09/17/2012 — 06/18/2014,
Cost $213,556) (r) | | | 195,000 | | | | 217,913 | | |
| | | | 671,090 | | |
TOTAL MATERIALS | | | 3,776,865 | | |
TELECOMMUNICATION SERVICES — 0.61%
Diversified Telecommunication Services — 0.38% | |
Sable International Finance Limited
8.750%, 02/01/2020
(Acquired 01/20/2012 — 04/08/2014,
Cost $152,495) (r) | | | 139,000 | | | | 157,070 | | |
Telecom Italia S.p.A.
5.303%, 05/30/2024
(Acquired 06/24/2014 — 06/25/2014,
Cost $104,106) (r) | | | 104,000 | | | | 104,650 | | |
| | | | 261,720 | | |
Wireless Telecommunication Services — 0.23% | |
Wind Acquisition Finance S.A.
7.375%, 04/23/2021
(Acquired 04/08/2014 — 05/15/2014,
Cost $153,702) (r) | | | 153,000 | | | | 163,710 | | |
TOTAL TELECOMMUNICATION SERVICES | | | 425,430 | | |
The accompanying notes are an integral part of these financial statements.
38
Schedule of Investments — June 30, 2014
Hotchkis & Wiley Capital Income Fund
| | Principal
Amount | | Value | |
UTILITIES — 0.76%
Electric Utilities — 0.76% | |
Calpine Corporation
6.000%, 01/15/2022
(Acquired 10/17/2013 — 05/20/2014,
Cost $234,445) (r) | | $ | 225,000 | | | $ | 243,563 | | |
Dynegy Inc.
5.875%, 06/01/2023 | | | 270,000 | | | | 273,375 | | |
Energy Future Intermediate Holding
Company LLC Escrow
10.000%, 12/01/2020 (d) | | | 108,000 | | | | 10,530 | | |
| | | | 527,468 | | |
TOTAL UTILITIES | | | 527,468 | | |
Total corporate bonds
(Cost $24,035,070) | | | | | 24,531,516 | | |
ASSET-BACKED SECURITIES — 0.49% | |
INDUSTRIALS — 0.49%
Airlines — 0.49% | |
US Airways Pass Through Trust — Class B —
Series 2012-1
8.000%, 10/01/2019 | | | 117,681 | | | | 135,039 | | |
US Airways Pass Through Trust — Class B —
Series 2012-2
6.750%, 06/03/2021 | | | 188,042 | | | | 206,376 | | |
| | | | 341,415 | | |
TOTAL INDUSTRIALS | | | 341,415 | | |
Total asset-backed securities
(Cost $331,396) | | | | | 341,415 | | |
TERM LOANS — 0.94% | |
CONSUMER DISCRETIONARY — 0.14%
Multiline Retail — 0.14% | |
J.C. Penney Corporation, Inc.
6.000%, 05/22/2018 (b) | | | 99,000 | | | | 100,285 | | |
TOTAL CONSUMER DISCRETIONARY | | | 100,285 | | |
ENERGY — 0.44%
Energy Equipment & Services — 0.44% | |
Fieldwood Energy LLC
8.375%, 09/30/2020 (b) | | | 170,000 | | | | 175,630 | | |
Jonah Energy LLC
7.500%, 05/12/2021 (b) | | | 125,000 | | | | 126,303 | | |
| | | | 301,933 | | |
TOTAL ENERGY | | | 301,933 | | |
INFORMATION TECHNOLOGY — 0.29%
Software — 0.29% | |
Flexera Software, LLC
4.500%, 04/02/2020 (b) | | | 100,000 | | | | 100,167 | | |
8.000%, 04/02/2021 (b) | | | 100,000 | | | | 100,375 | | |
| | | | 200,542 | | |
TOTAL INFORMATION TECHNOLOGY | | | 200,542 | | |
| | Principal
Amount | | Value | |
MATERIALS — 0.07%
Containers & Packaging — 0.07% | |
Rexam Healthcare
8.000%, 04/11/2022 (b) | | $ | 50,000 | | | $ | 50,313 | | |
TOTAL MATERIALS | | | 50,313 | | |
Total term loans
(Cost $647,008) | | | | | 653,073 | | |
WARRANTS — 0.02% | | Shares
Held | | | |
CONSUMER DISCRETIONARY — 0.02%
Automobiles — 0.02% | |
General Motors Company (a)
Expiration: July 2019,
Exercise Price: $18.33 | | | 605 | | | | 11,229 | | |
TOTAL CONSUMER DISCRETIONARY | | | 11,229 | | |
Total warrants
(Cost $9,495) | | | | | 11,229 | | |
Total long-term investments
(Cost $60,684,628) | | | | | 64,972,410 | | |
SHORT-TERM
INVESTMENTS — 1.93% | | Principal
Amount | | | |
Time Deposits — 1.93% | |
JPMorgan Chase & Co., 0.03%, 07/01/2014* | | $ | 1,337,059 | | | | 1,337,059 | | |
Total short-term investments
(Cost $1,337,059) | | | 1,337,059 | | |
Total investments — 95.72%
(Cost $62,021,687) | | | | | 66,309,469 | | |
Other assets in excess of liabilities — 4.28% | | | | | 2,961,417 | | |
Net assets — 100.00% | | $ | 69,270,886 | | |
(a) — Non-income producing security.
(b) — The coupon rate shown on variable rate securities represents the rate at June 30, 2014.
(c) — All or a portion of this security is segregated as collateral for bridge loan commitments.
(d) — Issuer is currently in default on its regularly scheduled interest payments.
(f) — Fair valued security. The total market value of these securities was $18,668, which represented 0.03% of net assets.
(i) — Illiquid security.
(p) — Payment in-kind security.
(r) — Restricted security under Rule 144A under the Securities Act of 1933. Purchased in a private placement transaction; resale to the public may require registration or be limited to qualified institutional buyers. The total market value of these securities was $14,211,087, which represented 20.52% of net assets.
ADR — American Depositary Receipt
* — Invested through a cash management account administered by Brown Brothers Harriman & Co.
The accompanying notes are an integral part of these financial statements.
39
Schedule of Investments — June 30, 2014
Hotchkis & Wiley Capital Income Fund
The Global Industry Classification Standard (GICS®) was developed by MSCI, an independent provider of global indices and benchmark-related products and services, and Standard & Poor's (S&P), an independent international financial data and investment services company. The GICS methodology has been widely accepted as an industry analysis framework for investment research, portfolio management and asset allocation. The GICS structure consists of 10 sectors, 24 industry groups, 67 industries and 156 sub-industries. Each stock that is classified will have a coding at all four of these levels.
The accompanying notes are an integral part of these financial statements.
40
Schedule of Investments — June 30, 2014
Hotchkis & Wiley High Yield Fund
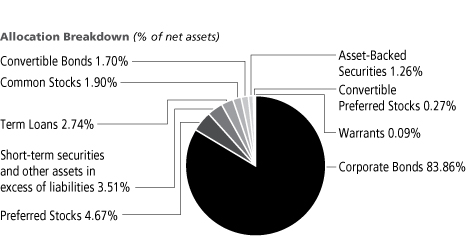
Largest Issuers | | Percent of
net assets | |
Citigroup Inc. | | | 1.43 | % | |
American Airlines Group, Inc.
(includes US Airways) | | | 1.26 | % | |
The Royal Bank of Scotland Group
Public Limited Company | | | 1.15 | % | |
Virgin Media Finance PLC | | | 1.13 | % | |
Momentive Performance Materials Inc. | | | 1.06 | % | |
First Data Corporation | | | 1.05 | % | |
Navistar International Corporation | | | 1.05 | % | |
Freescale Semiconductor, Inc. | | | 1.01 | % | |
Bonanza Creek Energy, Inc. | | | 1.01 | % | |
Momentive Specialty Chemical
(includes Hexion U.S. Finance Corp.) | | | 0.99 | % | |
CORPORATE
BONDS — 83.86% | | Principal
Amount | | Value | |
Aerospace/Defense — 0.80% | |
Huntington Ingalls Industries, Inc.
7.125%, 03/15/2021 | | $ | 12,617,000 | | | $ | 13,847,158 | | |
Apparel/Textiles — 0.75% | |
Quiksilver Inc./QS Wholesale Inc.
7.875%, 08/01/2018
(Acquired 07/11/2013 — 06/03/2014,
Cost $8,091,033) (r) | | | 7,892,000 | | | | 8,049,840 | | |
10.000%, 08/01/2020 | | | 4,886,000 | | | | 4,934,860 | | |
| | | | 12,984,700 | | |
Auto Loans — 0.87% | |
Credit Acceptance Corporation
6.125%, 02/15/2021
(Acquired 01/16/2014 — 06/18/2014,
Cost $14,628,535) (r) | | | 14,395,000 | | | | 15,114,750 | | |
Auto Parts & Equipment — 1.92% | |
Allison Transmission, Inc.
7.125%, 05/15/2019
(Acquired 04/27/2011 — 07/31/2013,
Cost $7,426,262) (r) | | | 7,218,000 | | | | 7,759,350 | | |
American Axle & Manufacturing, Inc.
7.750%, 11/15/2019 | | | 11,845,000 | | | | 13,710,587 | | |
Lear Corporation
5.375%, 03/15/2024 | | | 11,457,000 | | | | 11,829,353 | | |
| | | | 33,299,290 | | |
Automakers — 1.48% | |
Chrysler Group LLC/CG Co-Issuer Inc.
8.250%, 06/15/2021 | | | 11,535,000 | | | | 13,092,225 | | |
Navistar International Corporation
8.250%, 11/01/2021 | | | 12,045,000 | | | | 12,617,138 | | |
| | | | 25,709,363 | | |
Banking — 0.62% | |
Popular, Inc.
7.000%, 07/01/2019 | | | 10,535,000 | | | | 10,745,700 | | |
| | Principal
Amount | | Value | |
Building & Construction — 4.47% | |
Century Communities, Inc.
6.875%, 05/15/2022
(Acquired 04/30/2014 — 06/18/2014,
Cost $8,801,392) (r) | | $ | 8,670,000 | | | $ | 8,908,425 | | |
M/I Homes, Inc.
8.625%, 11/15/2018 | | | 7,960,000 | | | | 8,517,200 | | |
Tutor Perini Corporation
7.625%, 11/01/2018 | | | 7,516,000 | | | | 7,938,775 | | |
WCI Communities, Inc.
6.875%, 08/15/2021 | | | 12,530,000 | | | | 12,937,225 | | |
6.875%, 08/15/2021
(Acquired 06/23/2014,
Cost $527,875) (r) | | | 515,000 | | | | 531,738 | | |
Weekley Homes LLC/Weekley Finance Corp.
6.000%, 02/01/2023 | | | 15,490,000 | | | | 15,567,450 | | |
William Lyon Homes, Inc.
8.500%, 11/15/2020 | | | 8,404,000 | | | | 9,443,995 | | |
Zachry Holdings, Inc.
7.500%, 02/01/2020
(Acquired 01/18/2013 — 06/18/2014,
Cost $13,242,527) (r) | | | 12,791,000 | | | | 13,782,302 | | |
| | | | 77,627,110 | | |
The accompanying notes are an integral part of these financial statements.
41
Schedule of Investments — June 30, 2014
Hotchkis & Wiley High Yield Fund
| | Principal
Amount | | Value | |
Building Materials — 4.58% | |
Allegion US Holding Company Inc.
5.750%, 10/01/2021
(Acquired 09/27/2013 — 06/24/2014,
Cost $11,898,354) (r) | | $ | 11,655,000 | | | $ | 12,325,162 | | |
Building Materials Corporation of America
6.750%, 05/01/2021
(Acquired 08/26/2011 — 06/10/2014,
Cost $13,705,727) (r) | | | 13,198,000 | | | | 14,253,840 | | |
Masonite International Corporation
8.250%, 04/15/2021
(Acquired 09/06/2011 — 06/18/2014,
Cost $14,623,236) (r) | | | 13,813,000 | | | | 15,125,235 | | |
Roofing Supply Group LLC/Roofing
Supply Finance Inc.
10.000%, 06/01/2020
(Acquired 05/24/2012 — 06/18/2014,
Cost $12,055,082) (r) | | | 11,239,000 | | | | 12,081,925 | | |
RSI Home Products, Inc.
6.875%, 03/01/2018
(Acquired 02/15/2013 — 06/18/2014,
Cost $12,436,147) (r) | | | 12,083,000 | | | | 12,928,810 | | |
WESCO Distribution, Inc.
5.375%, 12/15/2021
(Acquired 11/21/2013 — 06/18/2014,
Cost $12,692,519) (r) | | | 12,607,000 | | | | 12,922,175 | | |
| | | | 79,637,147 | | |
Chemicals — 5.59% | |
Axalta Coating Systems US Holdings Inc./
Axalta Coating Systems Dutch Holding B BV
7.375%, 05/01/2021
(Acquired 01/16/2013 — 06/18/2014,
Cost $13,181,918) (r) | | | 12,634,000 | | | | 13,834,230 | | |
Hexion U.S. Finance Corp.
6.625%, 04/15/2020 | | | 8,995,000 | | | | 9,579,675 | | |
Hexion U.S. Finance Corp./Hexion Nova
Scotia Finance ULC
8.875%, 02/01/2018 (c) | | | 7,365,000 | | | | 7,678,012 | | |
Momentive Performance Materials Inc.
8.875%, 10/15/2020 (d) | | | 10,258,000 | | | | 11,001,705 | | |
10.000%, 10/15/2020 (d) | | | 6,880,000 | | | | 7,353,000 | | |
OMNOVA Solutions Inc.
7.875%, 11/01/2018 | | | 8,040,000 | | | | 8,472,150 | | |
Perstorp Holding AB
8.750%, 05/15/2017
(Acquired 11/09/2012 — 06/18/2014,
Cost $10,627,340) (r) | | | 10,385,000 | | | | 11,189,838 | | |
Taminco Global Chemical Corporation
9.750%, 03/31/2020
(Acquired 01/20/2012 — 06/18/2014,
Cost $10,321,747) (r) | | | 9,668,000 | | | | 10,852,330 | | |
Trinseo Materials Operating SCA/Trinseo
Materials Finance Inc.
8.750%, 02/01/2019 | | | 15,895,000 | | | | 17,166,600 | | |
| | | | 97,127,540 | | |
| | Principal
Amount | | Value | |
Consumer — Products — 2.05% | |
American Greetings Corporation
7.375%, 12/01/2021 | | $ | 12,057,000 | | | $ | 12,870,847 | | |
Central Garden & Pet Company
8.250%, 03/01/2018 | | | 8,599,000 | | | | 8,964,458 | | |
FGI Operating Company LLC/FGI Finance Inc.
7.875%, 05/01/2020 | | | 12,941,000 | | | | 13,846,870 | | |
| | | | 35,682,175 | | |
Consumer/Commercial/Lease Financing — 1.65% | |
International Lease Finance Corporation
8.250%, 12/15/2020 (c) | | | 12,731,000 | | | | 15,754,613 | | |
Navient Corporation
8.000%, 03/25/2020 (c) | | | 11,195,000 | | | | 12,972,206 | | |
| | | | 28,726,819 | | |
Discount Stores — 0.44% | |
99 Cents Only Stores
11.000%, 12/15/2019 | | | 6,869,000 | | | | 7,641,763 | | |
Diversified Capital Goods — 2.05% | |
Actuant Corporation
5.625%, 06/15/2022 (c) | | | 9,853,000 | | | | 10,394,915 | | |
BC Mountain LLC/BC Mountain Finance Inc.
7.000%, 02/01/2021
(Acquired 01/25/2013 — 06/18/2014,
Cost $13,489,383) (r) | | | 13,435,000 | | | | 13,065,537 | | |
General Cable Corporation
6.500%, 10/01/2022
(Acquired 02/06/2013 — 06/18/2014,
Cost $12,131,849) (r) | | | 11,896,000 | | | | 12,163,660 | | |
| | | | 35,624,112 | | |
Electric — Generation — 1.82% | |
Calpine Corporation
6.000%, 01/15/2022
(Acquired 10/17/2013 — 06/18/2014,
Cost $13,783,705) (r) | | | 13,531,000 | | | | 14,647,307 | | |
Dynegy Inc.
5.875%, 06/01/2023 | | | 15,395,000 | | | | 15,587,438 | | |
Energy Future Intermediate Holding Company
LLC Escrow
10.000%, 12/01/2020 | | | 14,922,000 | | | | 1,454,895 | | |
| | | | 31,689,640 | | |
Electronics — 1.93% | |
Freescale Semiconductor, Inc.
8.050%, 02/01/2020 | | | 3,658,000 | | | | 3,959,785 | | |
6.000%, 01/15/2022
(Acquired 10/28/2013 — 06/18/2014,
Cost $13,074,270) (r) | | | 12,800,000 | | | | 13,664,000 | | |
NXP B.V. and NXP Funding LLC
5.750%, 03/15/2023
(Acquired 05/06/2013 — 03/28/2014,
Cost $15,470,084) (r) | | | 15,080,000 | | | | 15,890,550 | | |
| | | | 33,514,335 | | |
The accompanying notes are an integral part of these financial statements.
42
Schedule of Investments — June 30, 2014
Hotchkis & Wiley High Yield Fund
| | Principal
Amount | | Value | |
Energy — Exploration & Production — 6.63% | |
Bonanza Creek Energy, Inc.
6.750%, 04/15/2021 | | $ | 16,371,000 | | | $ | 17,598,825 | | |
Comstock Resources, Inc.
9.500%, 06/15/2020 | | | 10,141,000 | | | | 11,611,445 | | |
Gastar Exploration, Inc.
8.625%, 05/15/2018 (i) | | | 14,789,000 | | | | 15,528,450 | | |
Gulfport Energy Corporation
7.750%, 11/01/2020 | | | 15,909,000 | | | | 17,301,037 | | |
Parsley Energy LLC/Parsley Finance Corporation
7.500%, 02/15/2022
(Acquired 01/31/2014 — 06/18/2014,
Cost $13,765,119) (r) | | | 13,385,000 | | | | 14,355,412 | | |
PetroQuest Energy, Inc.
10.000%, 09/01/2017 | | | 11,915,000 | | | | 12,631,092 | | |
Rice Energy Inc.
6.250%, 05/01/2022
(Acquired 04/16/2014 — 06/18/2014,
Cost $8,581,960) (r) | | | 8,510,000 | | | | 8,733,388 | | |
Stone Energy Corporation
7.500%, 11/15/2022 | | | 15,758,000 | | | | 17,451,985 | | |
| | | | 115,211,634 | | |
Food — Wholesale — 1.89% | |
Pinnacle Operating Corporation
9.000%, 11/15/2020
(Acquired 09/13/2013 — 06/18/2014,
Cost $9,192,104) (r) | | | 8,928,000 | | | | 9,709,200 | | |
Shearer's Foods LLC/Chip Finance Corp.
9.000%, 11/01/2019
(Acquired 10/24/2012 — 06/18/2014,
Cost $9,737,111) (r) | | | 9,224,000 | | | | 10,146,400 | | |
Wells Enterprises, Inc.
6.750%, 02/01/2020
(Acquired 01/15/2013 — 06/19/2014,
Cost $12,737,700) (r) | | | 12,341,000 | | | | 13,004,329 | | |
| | | | 32,859,929 | | |
Forestry/Paper — 2.99% | |
Appvion, Inc.
9.000%, 06/01/2020
(Acquired 11/13/2013 — 06/18/2014,
Cost $12,734,723) (r) | | | 12,855,000 | | | | 12,838,931 | | |
Neenah Paper, Inc.
5.250%, 05/15/2021
(Acquired 05/16/2013 — 06/18/2014,
Cost $13,755,472) (r) | | | 13,724,000 | | | | 13,998,480 | | |
Rayonier A.M. Products Inc.
5.500%, 06/01/2024
(Acquired 05/08/2014 — 06/18/2014,
Cost $13,171,386) (r) | | | 12,970,000 | | | | 13,229,400 | | |
Sappi Papier Holding GmbH
7.750%, 07/15/2017
(Acquired 06/20/2012 — 06/18/2014,
Cost $11,086,087) (r) | | | 10,605,000 | | | | 11,851,088 | | |
| | | | 51,917,899 | | |
| | Principal
Amount | | Value | |
Gaming — 3.01% | |
Golden Nugget Escrow Inc.
8.500%, 12/01/2021
(Acquired 11/05/2013 — 06/18/2014,
Cost $10,389,866) (r) | | $ | 10,280,000 | | | $ | 10,832,550 | | |
MCE Finance Ltd.
5.000%, 02/15/2021
(Acquired 01/29/2013 — 06/18/2014,
Cost $16,199,693) (r) | | | 16,232,000 | | | | 16,475,480 | | |
MGM Resorts International
7.750%, 03/15/2022 | | | 13,359,000 | | | | 15,696,825 | | |
Wynn Macau, Limited
5.250%, 10/15/2021
(Acquired 03/13/2014 — 03/28/2014,
Cost $9,209,410) (r) | | | 9,107,000 | | | | 9,380,210 | | |
| | | | 52,385,065 | | |
Gas Distribution — 0.75% | |
Holly Energy Partners LP/Holly Energy
Finance Corp.
6.500%, 03/01/2020 | | | 12,080,000 | | | | 13,076,600 | | |
Health Facilities — 2.90% | |
CHS/Community Health Systems, Inc.
8.000%, 11/15/2019 | | | 3,150,000 | | | | 3,457,125 | | |
6.875%, 02/01/2022
(Acquired 01/15/2014 — 06/18/2014,
Cost $12,796,427) (r) | | | 12,580,000 | | | | 13,397,700 | | |
HCA Inc.
6.500%, 02/15/2020 (c) | | | 15,213,000 | | | | 17,152,657 | | |
LifePoint Hospitals, Inc.
5.500%, 12/01/2021
(Acquired 11/21/2013 — 06/18/2014,
Cost $15,729,432) (r) | | | 15,565,000 | | | | 16,343,250 | | |
| | | | 50,350,732 | | |
Health Services — 1.05% | |
Air Medical Group Holdings, Inc.
9.250%, 11/01/2018 | | | 5,014,000 | | | | 5,364,980 | | |
Universal Hospital Services, Inc.
7.625%, 08/15/2020 | | | 12,195,000 | | | | 12,835,237 | | |
| | | | 18,200,217 | | |
Household & Leisure Products — 0.71% | |
Gibson Brands, Inc.
8.875%, 08/01/2018
(Acquired 07/24/2013 — 06/18/2014,
Cost $12,486,896) (r) | | | 11,975,000 | | | | 12,379,156 | | |
Leisure — 0.76% | |
Seven Seas Cruises S. De R.L., LLC
9.125%, 05/15/2019 | | | 12,009,000 | | | | 13,164,866 | | |
Machinery — 0.61% | |
Mcron Finance Sub LLC/Mcron Finance Corp.
8.375%, 05/15/2019
(Acquired 04/20/2012 — 06/18/2014,
Cost $10,021,993) (r) | | | 9,588,000 | | | | 10,546,800 | | |
The accompanying notes are an integral part of these financial statements.
43
Schedule of Investments — June 30, 2014
Hotchkis & Wiley High Yield Fund
| | Principal
Amount | | Value | |
Managed Care — 0.82% | |
WellCare Health Plans, Inc.
5.750%, 11/15/2020 | | $ | 13,370,000 | | | $ | 14,305,900 | | |
Media — Broadcast — 1.18% | |
Entercom Radio, LLC
10.500%, 12/01/2019 | | | 6,728,000 | | | | 7,737,200 | | |
Townsquare Radio LLC/Townsquare Radio Inc.
9.000%, 04/01/2019
(Acquired 03/30/2012 — 06/24/2014,
Cost $12,237,325) (r) | | | 11,542,000 | | | | 12,840,475 | | |
| | | | 20,577,675 | | |
Media — Cable — 4.14% | |
CCO Holdings, LLC/CCO Holdings Capital Corp.
7.375%, 06/01/2020 | | | 9,684,000 | | | | 10,579,770 | | |
Nara Cable Funding Limited
8.875%, 12/01/2018
(Acquired 02/28/2013 — 04/15/2014,
Cost $12,388,655) (r) | | | 11,838,000 | | | | 12,696,255 | | |
Numericable Group SA
6.000%, 05/15/2022
(Acquired 04/23/2014 — 06/18/2014,
Cost $13,102,876) (r) | | | 12,912,000 | | | | 13,444,620 | | |
Virgin Media Finance PLC
6.375%, 04/15/2023
(Acquired 02/07/2013 — 06/18/2014,
Cost $18,716,140) (r) | | | 17,990,000 | | | | 19,609,100 | | |
VTR Finance B.V.
6.875%, 01/15/2024
(Acquired 01/27/2014 — 06/18/2014,
Cost $14,751,048) (r) | | | 14,498,000 | | | | 15,597,383 | | |
| | | | 71,927,128 | | |
Media — Services — 0.85% | |
MDC Partners Inc.
6.750%, 04/01/2020
(Acquired 03/15/2013 — 06/18/2014,
Cost $14,462,675) (r) | | | 13,997,000 | | | | 14,836,820 | | |
Medical Products — 1.56% | |
DJO Finance LLC
9.750%, 10/15/2017 | | | 6,343,000 | | | | 6,676,008 | | |
8.750%, 03/15/2018 | | | 5,909,000 | | | | 6,381,720 | | |
Grifols Worldwide Operations Limited
5.250%, 04/01/2022
(Acquired 03/05/2014 — 05/27/2014,
Cost $13,803,219) (r) | | | 13,540,000 | | | | 14,081,600 | | |
| | | | 27,139,328 | | |
| | Principal
Amount | | Value | |
Metals/Mining Excluding Steel — 4.10% | |
Century Aluminum Company
7.500%, 06/01/2021
(Acquired 05/23/2013 — 06/20/2014,
Cost $11,443,914) (r) | | $ | 11,625,000 | | | $ | 12,322,500 | | |
Horsehead Holding Corp.
10.500%, 06/01/2017
(Acquired 07/19/2012 — 06/18/2014,
Cost $8,853,826) (i) (r) | | | 8,590,000 | | | | 9,899,975 | | |
Kaiser Aluminum Corporation
8.250%, 06/01/2020 | | | 11,574,000 | | | | 13,078,620 | | |
Noranda Aluminum Acquisition Corporation
11.000%, 06/01/2019 | | | 12,036,000 | | | | 12,005,910 | | |
Rain CII Carbon LLC
8.000%, 12/01/2018
(Acquired 11/23/2010 — 12/13/2013,
Cost $7,198,055) (r) | | | 7,050,000 | | | | 7,455,375 | | |
8.250%, 01/15/2021
(Acquired 12/14/2012 — 06/18/2014,
Cost $7,192,523) (r) | | | 7,000,000 | | | | 7,385,000 | | |
Shale-Inland Holdings LLC/Shale-Inland
Finance Corp.
8.750%, 11/15/2019
(Acquired 10/26/2012 — 06/18/2014,
Cost $8,874,289) (r) | | | 8,655,000 | | | | 9,131,025 | | |
| | | | 71,278,405 | | |
Oil Field Equipment & Services — 5.36% | |
Atwood Oceanics, Inc.
6.500%, 02/01/2020 (c) | | | 12,820,000 | | | | 13,749,450 | | |
Globe Luxembourg SCA
9.625%, 05/01/2018
(Acquired 05/02/2013 — 06/18/2014,
Cost $13,768,697) (r) | | | 13,236,000 | | | | 14,759,464 | | |
Iracore International Holdings, Inc.
9.500%, 06/01/2018
(Acquired 05/08/2013 — 06/18/2014,
Cost $10,292,282) (i) (r) | | | 9,895,000 | | | | 10,389,750 | | |
McDermott International, Inc.
8.000%, 05/01/2021
(Acquired 04/10/2014 — 06/18/2014,
Cost $11,271,250) (r) | | | 11,090,000 | | | | 11,450,425 | | |
PHI, Inc.
5.250%, 03/15/2019
(Acquired 03/06/2014 — 06/18/2014,
Cost $13,002,989) (r) | | | 12,972,000 | | | | 13,263,870 | | |
Shelf Drilling Holdings Ltd.
8.625%, 11/01/2018
(Acquired 10/10/2012 — 06/18/2014,
Cost $13,177,007) (r) | | | 12,692,000 | | | | 13,643,900 | | |
Unit Corporation
6.625%, 05/15/2021 | | | 14,855,000 | | | | 15,931,987 | | |
| | | | 93,188,846 | | |
The accompanying notes are an integral part of these financial statements.
44
Schedule of Investments — June 30, 2014
Hotchkis & Wiley High Yield Fund
| | Principal
Amount | | Value | |
Oil Refining & Marketing — 1.02% | |
Calumet Specialty Products Partners LP/
Calumet Finance Corp.
6.500%, 04/15/2021
(Acquired 06/23/2014 — 06/24/2014,
Cost $4,416,730) (r) | | $ | 4,299,000 | | | $ | 4,406,475 | | |
PBF Holding Company LLC/PBF Finance Corp.
8.250%, 02/15/2020 | | | 12,183,000 | | | | 13,340,385 | | |
| | | | 17,746,860 | | |
Packaging — 0.77% | |
Silgan Holdings Inc.
5.500%, 02/01/2022
(Acquired 10/25/2013 — 06/18/2014,
Cost $12,953,005) (r) | | | 12,936,000 | | | | 13,453,440 | | |
Pharmaceuticals — 1.40% | |
ConvaTec Healthcare E S.A.
10.500%, 12/15/2018
(Acquired 12/28/2010 — 06/18/2014,
Cost $8,694,635) (r) | | | 8,299,000 | | | | 8,994,041 | | |
Salix Pharmaceuticals, Ltd.
6.000%, 01/15/2021
(Acquired 12/12/2013 — 06/18/2014,
Cost $14,739,805) (r) | | | 14,215,000 | | | | 15,281,125 | | |
| | | | 24,275,166 | | |
Printing & Publishing — 0.81% | |
Harland Clarke Holdings Corp.
9.250%, 03/01/2021
(Acquired 01/27/2014 — 06/18/2014,
Cost $13,510,438) (r) | | | 13,360,000 | | | | 14,044,700 | | |
Restaurants — 0.68% | |
Ruby Tuesday, Inc.
7.625%, 05/15/2020 | | | 11,760,000 | | | | 11,818,800 | | |
Software/Services — 1.72% | |
ACI Worldwide, Inc.
6.375%, 08/15/2020
(Acquired 08/15/2013 — 06/18/2014,
Cost $11,369,733) (r) | | | 11,036,000 | | | | 11,642,980 | | |
First Data Corporation
8.875%, 08/15/2020
(Acquired 08/11/2010 — 06/18/2014,
Cost $5,322,602) (r) | | | 5,157,000 | | | | 5,717,824 | | |
8.750%, 01/15/2022
(Acquired 11/19/2012 — 06/18/2014,
Cost $11,809,333) (p) (r) | | | 11,327,000 | | | | 12,558,811 | | |
| | | | 29,919,615 | | |
| | Principal
Amount | | Value | |
Specialty Retail — 2.38% | |
CST Brands, Inc.
5.000%, 05/01/2023 | | $ | 16,496,000 | | | $ | 16,578,480 | | |
The Men's Wearhouse, Inc.
7.000%, 07/01/2022
(Acquired 06/11/2014 — 06/25/2014,
Cost $13,194,885) (r) | | | 12,776,000 | | | | 13,287,040 | | |
Outerwall Inc.
5.875%, 06/15/2021
(Acquired 06/04/2014 — 06/06/2014,
Cost $11,321,367) (r) | | | 11,295,000 | | | | 11,436,187 | | |
| | | | 41,301,707 | | |
Support — Services — 1.42% | |
Aguila 3 S.A.
7.875%, 01/31/2018
(Acquired 07/30/2013 — 06/18/2014,
Cost $10,670,281) (r) | | | 10,233,000 | | | | 10,802,211 | | |
Audatex North America, Inc.
6.000%, 06/15/2021
(Acquired 10/17/2013 — 06/18/2014,
Cost $13,523,516) (r) | | | 12,946,000 | | | | 13,884,585 | | |
| | | | 24,686,796 | | |
Telecom — Integrated/Services — 1.04% | |
Sable International Finance Limited
8.750%, 02/01/2020
(Acquired 01/20/2012 — 06/18/2014,
Cost $10,990,719) (r) | | | 10,153,000 | | | | 11,472,890 | | |
Telecom Italia S.p.A.
5.303%, 05/30/2024
(Acquired 06/24/2014 — 06/25/2014,
Cost $6,523,670) (r) | | | 6,517,000 | | | | 6,557,731 | | |
| | | | 18,030,621 | | |
Telecom — Wireless — 0.58% | |
Wind Acquisition Finance S.A.
7.375%, 04/23/2021
(Acquired 04/08/2014 — 06/18/2014,
Cost $9,496,629) (r) | | | 9,473,000 | | | | 10,136,110 | | |
Telecommunications Equipment — 0.86% | |
CommScope Holding Company, Inc.
6.625%, 06/01/2020
(Acquired 05/23/2013 — 06/18/2014,
Cost $7,999,765) (p) (r) | | | 8,035,000 | | | | 8,617,538 | | |
CommScope, Inc.
5.000%, 06/15/2021
(Acquired 05/15/2014 — 06/18/2014,
Cost $6,120,047) (r) | | | 6,095,000 | | | | 6,247,375 | | |
| | | | 14,864,913 | | |
Theaters & Entertainment — 0.85% | |
Regal Entertainment Group
5.750%, 03/15/2022 | | | 14,144,000 | | | | 14,709,760 | | |
Total corporate bonds
(Cost $1,403,313,963) | | | | | 1,457,307,090 | | |
The accompanying notes are an integral part of these financial statements.
45
Schedule of Investments — June 30, 2014
Hotchkis & Wiley High Yield Fund
ASSET-BACKED
SECURITIES — 1.26% | | Principal
Amount | | Value | |
Airlines — 1.26% | |
US Airways Pass Through Trust — Class B —
Series 2012-1
8.000%, 10/01/2019 | | $ | 6,991,390 | | | $ | 8,022,620 | | |
US Airways Pass Through Trust — Class B —
Series 2012-2
6.750%, 06/03/2021 | | | 12,683,235 | | | | 13,919,851 | | |
| | | | 21,942,471 | | |
Total asset-backed securities
(Cost $20,794,477) | | | | | 21,942,471 | | |
CONVERTIBLE BONDS — 1.70% | |
Auto Parts & Equipment — 0.83% | |
Meritor, Inc.
7.875%, 03/01/2026 | | | 4,550,000 | | | | 7,345,406 | | |
4.000%, 02/15/2027 (b) | | | 6,603,000 | | | | 7,048,703 | | |
| | | | 14,394,109 | | |
Automakers — 0.32% | |
Navistar International Corporation
4.750%, 04/15/2019
(Acquired 03/19/2014 — 06/18/2014,
Cost $5,254,257) (r) | | | 5,250,000 | | | | 5,627,344 | | |
Energy — Exploration & Production — 0.55% | |
Cobalt International Energy, Inc.
3.125%, 05/15/2024 | | | 8,830,000 | | | | 9,530,881 | | |
Total convertible bonds
(Cost $24,781,693) | | | | | 29,552,334 | | |
TERM LOANS — 2.74% | |
Department Stores — 0.72% | |
J.C. Penney Corporation, Inc.
6.000%, 05/22/2018 (b) | | | 12,374,823 | | | | 12,535,448 | | |
Energy — Exploration & Production — 1.18% | |
Fieldwood Energy LLC
8.375%, 09/30/2020 (b) | | | 11,765,000 | | | | 12,154,716 | | |
Jonah Energy LLC
7.500%, 05/12/2021 (b) | | | 8,175,000 | | | | 8,260,183 | | |
| | | | 20,414,899 | | |
Packaging — 0.25% | |
Rexam Healthcare
8.000%, 04/11/2022 (b) | | | 4,350,000 | | | | 4,377,188 | | |
Software/Services — 0.59% | |
Flexera Software, LLC
4.500%, 04/02/2020 (b) | | | 3,900,000 | | | | 3,906,493 | | |
8.000%, 04/02/2021 (b) | | | 6,400,000 | | | | 6,424,000 | | |
| | | | 10,330,493 | | |
Total term loans
(Cost $46,934,994) | | | | | 47,658,028 | | |
CONVERTIBLE
PREFERRED STOCKS — 0.27% | | Shares
Held | | Value | |
Oil Field Equipment & Services — 0.27% | |
McDermott International, Inc., 6.250% | | | 171,804 | | | $ | 4,724,610 | | |
Total convertible preferred stocks
(Cost $4,364,561) | | | | | 4,724,610 | | |
PREFERRED STOCKS — 4.67% | |
Banking — 4.55% | |
Citigroup Inc., 7.125% (b) | | | 611,494 | | | | 16,907,198 | | |
Countrywide Capital V, 7.000% | | | 573,156 | | | | 14,902,056 | | |
Morgan Stanley Capital Trust III, 6.250% | | | 484,666 | | | | 12,232,970 | | |
Morgan Stanley Capital Trust VIII, 6.450% | | | 110,082 | | | | 2,776,268 | | |
The Royal Bank of Scotland Group Public Limited
Company, 6.400% | | | 175,332 | | | | 4,221,994 | | |
The Royal Bank of Scotland Group Public Limited
Company, 6.600% | | | 644,255 | | | | 15,816,460 | | |
Synovus Financial Corp., 7.875% (b) | | | 437,611 | | | | 12,253,108 | | |
| | | | 79,110,054 | | |
Energy — Exploration & Production — 0.12% | |
Lone Pine Resources Canada Ltd. (a) (f) (i) | | | 1,596,813 | | | | 2,043,921 | | |
Lone Pine Resources Inc. Multiple Voting
Shares (a) (f) (i) | | | 1,596,813 | | | | 0 | | |
| | | | 2,043,921 | | |
Total preferred stocks
(Cost $76,157,868) | | | | | 81,153,975 | | |
COMMON STOCKS — 1.90% | |
Auto Parts & Equipment — 0.77% | |
The Goodyear Tire & Rubber Company | | | 483,736 | | | | 13,438,186 | | |
Automakers — 0.64% | |
General Motors Company | | | 109,601 | | | | 3,978,516 | | |
General Motors Company — Escrow (a) (f) (i) | | | 352,400 | | | | 0 | | |
Motors Liquidation Company GUC Trust (a) | | | 280,070 | | | | 7,169,792 | | |
| | | | 11,148,308 | | |
Banking — 0.46% | |
Citigroup Inc. | | | 169,826 | | | | 7,998,805 | | |
Energy — Exploration & Production — 0.03% | |
Lone Pine Resources Canada Ltd. (a) (f) (i) | | | 414,738 | | | | 439,205 | | |
Lone Pine Resources Inc. — Escrow (a) (f) (i) | | | 3,325,000 | | | | 0 | | |
Lone Pine Resources Inc. (a) (f) (i) | | | 414,738 | | | | 0 | | |
| | | | 439,205 | | |
Total common stocks
(Cost $27,061,833) | | | | | 33,024,504 | | |
The accompanying notes are an integral part of these financial statements.
46
Schedule of Investments — June 30, 2014
Hotchkis & Wiley High Yield Fund
WARRANTS — 0.09% | | Shares
Held | | Value | |
Automakers — 0.09% | |
General Motors Company (a)
Expiration: July 2019
Exercise Price: $18.33 | | | 86,395 | | | $ | 1,603,491 | | |
Total warrants
(Cost $1,374,011) | | | | | 1,603,491 | | |
Total long-term investments
(Cost $1,604,783,400) | | | | | 1,676,966,503 | | |
SHORT-TERM
INVESTMENTS — 1.60% | | Principal
Amount | | | |
Time Deposits — 1.60% | |
SEB, 0.03%, 07/01/2014* | | $ | 27,727,372 | | | | 27,727,372 | | |
Total short-term investments
(Cost $27,727,372) | | | 27,727,372 | | |
Total investments — 98.09%
(Cost $1,632,510,772) | | | | | 1,704,693,875 | | |
Other assets in excess of liabilities — 1.91% | | | | | 33,112,760 | | |
Net assets — 100.00% | | $ | 1,737,806,635 | | |
(a) — Non-income producing security.
(b) — The coupon rate shown on variable rate securities represents the rate at June 30, 2014.
(c) — All or a portion of this security is segregated as collateral for bridge loan commitments.
(d) — Issuer is currently in default on its regularly scheduled interest payments.
(f) — Fair valued security. The total market value of these securities was $2,483,126, which represented 0.14% of net assets.
(i) — Illiquid security.
(p) — Payment in-kind security.
(r) — Restricted security under Rule 144A under the Securities Act of 1933. Purchased in a private placement transaction; resale to the public may require registration or be limited to qualified institutional buyers. The total market value of these securities was $833,288,722, which represented 47.95% of net assets.
* — Invested through a cash management account administered by Brown Brothers Harriman & Co.
The accompanying notes are an integral part of these financial statements.
47
Statements of Assets & Liabilities
JUNE 30, 2014
| | | Diversified Value
Fund | | Large Cap Value
Fund | | Mid-Cap Value
Fund | | Small Cap Value
Fund | |
Assets: | |
Long-term investments, at value* | |
Unaffiliated issuers | | $ | 534,467,454 | | | $ | 750,441,868 | | | $ | 3,361,879,982 | | | $ | 991,921,880 | | |
Affiliated issuers | | | — | | | | — | | | | 71,881,440 | | | | 25,491,495 | | |
Collateral for securities on loan* | | | 1,065,210 | | | | 311,269 | | | | 14,602,452 | | | | 29,977,495 | | |
Short-term investments* | | | 14,952,649 | | | | 9,078,974 | | | | 180,634,012 | | | | 101,365,378 | | |
Dividends and interest receivable | | | 783,513 | | | | 1,411,926 | | | | 4,528,752 | | | | 518,615 | | |
Receivable for investments sold | | | 1,407,786 | | | | 2,059,540 | | | | — | | | | 476,428 | | |
Receivable for Fund shares sold | | | 513,636 | | | | 2,180,707 | | | | 6,354,565 | | | | 1,522,230 | | |
Other assets | | | 23,099 | | | | 38,871 | | | | 124,301 | | | | 54,878 | | |
Total assets | | $ | 553,213,347 | | | $ | 765,523,155 | | | $ | 3,640,005,504 | | | $ | 1,151,328,399 | | |
Liabilities: | |
Collateral upon return of securities on loan | | $ | 1,065,210 | | | $ | 311,269 | | | $ | 14,602,452 | | | $ | 29,977,495 | | |
Payable for investments purchased | | | 1,995,525 | | | | 2,542,091 | | | | 18,399,564 | | | | 85,919,946 | | |
Payable for Fund shares repurchased | | | 335,175 | | | | 469,079 | | | | 17,847,150 | | | | 921,920 | | |
Payable to Advisor | | | 326,843 | | | | 473,592 | | | | 2,177,530 | | | | 583,560 | | |
Payable to Trustees | | | 270 | | | | 455 | | | | 1,713 | | | | 478 | | |
Accrued distribution and service fees | | | 69,817 | | | | 348,224 | | | | 1,206,397 | | | | 290,108 | | |
Accrued expenses and other liabilities | | | 277,328 | | | | 368,411 | | | | 1,728,847 | | | | 353,919 | | |
Total liabilities | | | 4,070,168 | | | | 4,513,121 | | | | 55,963,653 | | | | 118,047,426 | | |
Commitments and contingencies (Note 1 and Note 8) | | | | | | | | | |
Net assets | | $ | 549,143,179 | | | $ | 761,010,034 | | | $ | 3,584,041,851 | | | $ | 1,033,280,973 | | |
Net Assets consist of: | |
Paid-in capital | | $ | 1,185,386,696 | | | $ | 1,842,596,064 | | | $ | 2,916,229,622 | | | $ | 786,805,820 | | |
Undistributed net investment income | | | 12,803,931 | | | | 21,716,657 | | | | 11,963,369 | | | | 811,351 | | |
Undistributed net realized gain (loss) | | | (700,573,552 | ) | | | (1,139,728,257 | ) | | | 200,217,407 | | | | 81,115,100 | | |
Net unrealized appreciation of securities and foreign currency transactions | | | 51,526,104 | | | | 36,425,570 | | | | 455,631,453 | | | | 164,548,702 | | |
Net assets | | $ | 549,143,179 | | | $ | 761,010,034 | | | $ | 3,584,041,851 | | | $ | 1,033,280,973 | | |
Calculation of Net Asset Value Per Share and
Public Offering Price Per Share — Class I | |
Net assets | | $ | 485,541,417 | | | $ | 500,101,961 | | | $ | 2,542,568,681 | | | $ | 785,914,903 | | |
Shares outstanding (unlimited shares $0.001 par value authorized) | | | 31,390,566 | | | | 18,763,729 | | | | 56,312,807 | | | | 11,797,257 | | |
Net asset value per share | | $ | 15.47 | | | $ | 26.65 | | | $ | 45.15 | | | $ | 66.62 | | |
Calculation of Net Asset Value Per Share — Class A | |
Net assets | | $ | 59,172,929 | | | $ | 223,219,153 | | | $ | 862,558,741 | | | $ | 204,205,381 | | |
Shares outstanding (unlimited shares $0.001 par value authorized) | | | 3,817,048 | | | | 8,436,297 | | | | 19,338,399 | | | | 3,081,936 | | |
Net asset value per share | | $ | 15.50 | | | $ | 26.46 | | | $ | 44.60 | | | $ | 66.26 | | |
Public Offering Price Per Share — Class A | |
(Net asset value per share divided by 0.9475) | | $ | 16.36 | | | $ | 27.93 | | | $ | 47.07 | | | $ | 69.93 | | |
Calculation of Net Asset Value Per Share and
Public Offering Price Per Share — Class C | |
Net assets | | $ | 4,428,833 | | | $ | 25,765,292 | | | $ | 154,221,869 | | | $ | 43,160,689 | | |
Shares outstanding (unlimited shares $0.001 par value authorized) | | | 291,303 | | | | 992,601 | | | | 3,757,911 | | | | 731,666 | | |
Net asset value per share | | $ | 15.20 | | | $ | 25.96 | | | $ | 41.04 | | | $ | 58.99 | | |
Calculation of Net Asset Value Per Share and
Public Offering Price Per Share — Class R | |
Net assets | | | | $ | 11,923,628 | | | $ | 24,692,560 | | | | | | |
Shares outstanding (unlimited shares $0.001 par value authorized) | | | | | 447,913 | | | | 551,595 | | | | | | |
Net asset value per share | | | | $ | 26.62 | | | $ | 44.77 | | | | | | |
*Cost of long-term investments | |
Unaffiliated issuers | | $ | 482,941,350 | | | $ | 714,016,298 | | | $ | 2,900,201,798 | | | $ | 808,557,502 | | |
Affiliated issuers | | | — | | | | — | | | | 77,928,171 | | | | 44,306,875 | | |
*Cost of collateral for securities on loan | | | 1,065,210 | | | | 311,269 | | | | 14,602,452 | | | | 29,977,495 | | |
*Cost of short-term investments | | | 14,952,649 | | | | 9,078,974 | | | | 180,634,012 | | | | 101,365,378 | | |
The accompanying notes are an integral part of these financial statements.
48
Statements of Assets & Liabilities
JUNE 30, 2014
| | | Global Value
Fund | | Value Opportunities
Fund | | Capital Income
Fund | | High Yield
Fund | |
Assets: | |
Long-term investments, at value* | | $ | 3,972,375 | | | $ | 475,992,780 | | | $ | 64,972,410 | | | $ | 1,676,966,503 | | |
Collateral for securities on loan* | | | — | | | | 47,320 | | | | — | | | | — | | |
Short-term investments* | | | 29,471 | | | | 7,122,026 | | | | 1,337,059 | | | | 27,727,372 | | |
Dividends and interest receivable | | | 9,330 | | | | 308,989 | | | | 502,658 | | | | 24,011,041 | | |
Receivable for investments sold | | | 23,880 | | | | 963,935 | | | | 214,080 | | | | 22,104,250 | | |
Receivable for Fund shares sold | | | 10,958 | | | | 4,826,070 | | | | 3,224,687 | | | | 4,062,350 | | |
Other assets | | | 13,063 | | | | 20,887 | | | | 24,738 | | | | 81,582 | | |
Total assets | | $ | 4,059,077 | | | $ | 489,282,007 | | | $ | 70,275,632 | | | $ | 1,754,953,098 | | |
Liabilities: | |
Collateral upon return of securities on loan | | $ | — | | | $ | 47,320 | | | $ | — | | | $ | — | | |
Payable for investments purchased | | | 18,624 | | | | 5,024,927 | | | | 614,193 | | | | 12,222,496 | | |
Payable for Fund shares repurchased | | | — | | | | 705,046 | | | | 282,710 | | | | 1,682,845 | | |
Payable to Advisor | | | 467 | | | | 288,605 | | | | 21,196 | | | | 622,861 | | |
Payable to Trustees | | | 2 | | | | 222 | | | | 17 | | | | 844 | | |
Accrued distribution and service fees | | | 183 | | | | 271,000 | | | | 21,693 | | | | 339,012 | | |
Distributions payable to shareholders | | | — | | | | — | | | | 11,990 | | | | 1,684,695 | | |
Accrued expenses and other liabilities | | | 35,659 | | | | 156,933 | | | | 52,947 | | | | 593,710 | | |
Total liabilities | | | 54,935 | | | | 6,494,053 | | | | 1,004,746 | | | | 17,146,463 | | |
Commitments and contingencies (Note 1 and Note 8) | | | | | | | | | |
Net assets | | $ | 4,004,142 | | | $ | 482,787,954 | | | $ | 69,270,886 | | | $ | 1,737,806,635 | | |
Net Assets consist of: | |
Paid-in capital | | $ | 3,243,056 | | | $ | 394,586,157 | | | $ | 63,785,668 | | | $ | 1,650,055,532 | | |
| Undistributed net investment income (loss) | | | 94,602 | | | | 2,485,967 | | | | 353,809 | | | | (1,177,852 | ) | |
Undistributed net realized gain | | | 190,646 | | | | 16,456,190 | | | | 843,627 | | | | 16,745,852 | | |
Net unrealized appreciation of securities and foreign currency transactions | | | 475,838 | | | | 69,259,640 | | | | 4,287,782 | | | | 72,183,103 | | |
Net assets | | $ | 4,004,142 | | | $ | 482,787,954 | | | $ | 69,270,886 | | | $ | 1,737,806,635 | | |
Calculation of Net Asset Value Per Share and
Public Offering Price Per Share — Class I | |
Net assets | | $ | 3,867,366 | | | $ | 265,138,175 | | | $ | 21,398,913 | | | $ | 1,127,080,057 | | |
Shares outstanding (unlimited shares $0.001 par value authorized) | | | 290,542 | | | | 8,873,983 | | | | 1,665,120 | | | | 84,284,557 | | |
Net asset value per share | | $ | 13.31 | | | $ | 29.88 | | | $ | 12.85 | | | $ | 13.37 | | |
Calculation of Net Asset Value Per Share — Class A | |
Net assets | | $ | 136,776 | | | $ | 165,608,031 | | | $ | 47,871,973 | | | $ | 607,103,884 | | |
Shares outstanding (unlimited shares $0.001 par value authorized) | | | 10,288 | | | | 5,542,311 | | | | 3,617,010 | | | | 45,682,449 | | |
Net asset value per share | | $ | 13.29 | | | $ | 29.88 | | | $ | 13.24 | | | $ | 13.29 | | |
Public Offering Price Per Share — Class A | |
(Net asset value per share divided by 0.9475) | | $ | 14.03 | | | $ | 31.54 | | | | | | | | | | |
(Net asset value per share divided by 0.9525) | | | | | | | | | | $ | 13.90 | | | | | | |
(Net asset value per share divided by 0.9625) | | | | | | | | $ | 13.81 | | |
Calculation of Net Asset Value Per Share and
Public Offering Price Per Share — Class C | |
Net assets | | | | | | $ | 52,041,748 | | | | | | | $ | 3,622,694 | | |
Shares outstanding (unlimited shares $0.001 par value authorized) | | | | | | | 1,838,569 | | | | | | | | 271,126 | | |
Net asset value per share | | | | | | $ | 28.31 | | | | | | | $ | 13.36 | | |
*Cost of long-term investments | | $ | 3,496,587 | | | $ | 406,733,424 | | | $ | 60,684,628 | | | $ | 1,604,783,400 | | |
*Cost of collateral for securities on loan | | | — | | | | 47,320 | | | | — | | | | — | | |
*Cost of short-term investments | | | 29,468 | | | | 7,121,638 | | | | 1,337,059 | | | | 27,727,372 | | |
The accompanying notes are an integral part of these financial statements.
49
Statements of Operations
FOR THE YEAR ENDED JUNE 30, 2014
| | | Diversified Value
Fund | | Large Cap Value
Fund | | Mid-Cap Value
Fund | | Small Cap Value
Fund | |
Investment income: | |
Dividends* | |
Unaffiliated issuers | | $ | 17,499,429 | | | $ | 29,685,056 | | | $ | 42,291,640 | | | $ | 9,124,991 | | |
Affiliated issuers | | | — | | | | — | | | | 1,560,292 | | | | 458,592 | | |
Interest | | | 3,629 | | | | 5,906 | | | | 42,519 | | | | 5,953 | | |
Securities on loan | | | 24,020 | | | | 51,452 | | | | 58,733 | | | | 77,387 | | |
Total income | | | 17,527,078 | | | | 29,742,414 | | | | 43,953,184 | | | | 9,666,923 | | |
Expenses: | |
Advisory fees | | | 3,570,779 | | | | 5,386,472 | | | | 21,403,155 | | | | 6,018,805 | | |
Professional fees and expenses | | | 43,441 | | | | 52,487 | | | | 134,111 | | | | 53,695 | | |
Custodian fees and expenses | | | 39,460 | | | | 61,734 | | | | 83,253 | | | | 26,252 | | |
Transfer agent fees and expenses | | | 737,583 | | | | 1,201,730 | | | | 5,374,708 | | | | 1,274,462 | | |
Accounting fees and expenses | | | 60,526 | | | | 86,802 | | | | 323,371 | | | | 97,540 | | |
Administration fees and expenses | | | 142,263 | | | | 214,080 | | | | 858,398 | | | | 241,331 | | |
Trustees' fees and expenses | | | 36,570 | | | | 53,204 | | | | 203,149 | | | | 57,628 | | |
Reports to shareholders | | | 39,039 | | | | 63,341 | | | | 237,320 | | | | 84,997 | | |
Registration fees | | | 80,834 | | | | 78,139 | | | | 168,177 | | | | 84,534 | | |
Distribution and service fees — Class A | | | 114,060 | | | | 622,662 | | | | 1,704,153 | | | | 428,842 | | |
Distribution and service fees — Class C | | | 86,555 | | | | 103,325 | | | | 1,166,515 | | | | 392,898 | | |
Distribution and service fees — Class R | | | — | | | | 53,834 | | | | 90,025 | | | | — | | |
Other expenses | | | 34,928 | | | | 47,946 | | | | 148,166 | | | | 45,119 | | |
Total expenses | | | 4,986,038 | | | | 8,025,756 | | | | 31,894,501 | | | | 8,806,103 | | |
Fee waiver/expense reimbursement by Advisor (Note 2) | | | (262,777 | ) | | | — | | | | — | | | | — | | |
Net expenses | | | 4,723,261 | | | | 8,025,756 | | | | 31,894,501 | | | | 8,806,103 | | |
Net investment income | | | 12,803,817 | | | | 21,716,658 | | | | 12,058,683 | | | | 860,820 | | |
Realized and Unrealized Gains (Losses): | |
Net realized gains (losses) from: | |
Sales of unaffiliated issuers | | | 33,419,459 | | | | 85,951,132 | | | | 390,762,220 | | | | 122,024,072 | | |
Sales of affiliated issuers | | | — | | | | — | | | | 15,645,208 | | | | (325,852 | ) | |
Foreign currency transactions | | | 114 | | | | — | | | | (95,313 | ) | | | (30,851 | ) | |
Net realized gains | | | 33,419,573 | | | | 85,951,132 | | | | 406,312,115 | | | | 121,667,369 | | |
Net change in unrealized appreciation of securities and foreign currency
transactions | | | 58,448,071 | | | | 58,457,075 | | | | 275,181,109 | | | | 96,717,775 | | |
Net gains | | | 91,867,644 | | | | 144,408,207 | | | | 681,493,224 | | | | 218,385,144 | | |
Net Increase in Net Assets Resulting from Operations | | $ | 104,671,461 | | | $ | 166,124,865 | | | $ | 693,551,907 | | | $ | 219,245,964 | | |
*Net of Foreign Taxes Withheld | | $ | 202,559 | | | $ | 366,832 | | | $ | 75,404 | | | $ | 80,516 | | |
The accompanying notes are an integral part of these financial statements.
50
Statements of Operations
FOR THE YEAR ENDED JUNE 30, 2014
| | | Global Value
Fund | | Value Opportunities
Fund | | Capital Income
Fund | | High Yield
Fund | |
Investment income: | |
Dividends* | | $ | 139,184 | | | $ | 6,894,634 | | | $ | 1,014,124 | | | $ | 4,321,903 | | |
Interest | | | 59 | | | | 666,922 | | | | 819,940 | | | | 88,679,420 | | |
Securities on loan | | | — | | | | 2,990 | | | | — | | | | — | | |
Total income | | | 139,243 | | | | 7,564,546 | | | | 1,834,064 | | | | 93,001,323 | | |
Expenses: | |
Advisory fees | | | 25,352 | | | | 2,580,961 | | | | 211,129 | | | | 7,839,679 | | |
Professional fees and expenses | | | 22,456 | | | | 35,228 | | | | 23,608 | | | | 90,144 | | |
Custodian fees and expenses | | | 15,428 | | | | 39,423 | | | | 11,225 | | | | 46,897 | | |
Transfer agent fees and expenses | | | 21,102 | | | | 454,580 | | | | 38,265 | | | | 1,692,796 | | |
Accounting fees and expenses | | | 43,418 | | | | 50,273 | | | | 58,312 | | | | 187,056 | | |
Administration fees and expenses | | | 30,542 | | | | 103,970 | | | | 27,724 | | | | 429,689 | | |
Trustees' fees and expenses | | | 217 | | | | 23,372 | | | | 2,050 | | | | 102,930 | | |
Reports to shareholders | | | 1,381 | | | | 30,961 | | | | 4,579 | | | | 90,848 | | |
Registration fees | | | 34,852 | | | | 81,798 | | | | 38,743 | | | | 132,106 | | |
Distribution and service fees — Class A | | | 224 | | | | 344,709 | | | | 47,914 | | | | 1,234,429 | | |
Distribution and service fees — Class C | | | — | | | | 374,086 | | | | — | | | | 20,630 | | |
Other expenses | | | 3,868 | | | | 17,172 | | | | 4,774 | | | | 78,177 | | |
Total expenses | | | 198,840 | | | | 4,136,533 | | | | 468,323 | | | | 11,945,381 | | |
Fee waiver/expense reimbursement by Advisor (Note 2) | | | (153,251 | ) | | | — | | | | (160,583 | ) | | | (713,623 | ) | |
Fee waiver by Administrator (Note 2) | | | (10,500 | ) | | | — | | | | — | | | | — | | |
Net expenses | | | 35,089 | | | | 4,136,533 | | | | 307,740 | | | | 11,231,758 | | |
Net investment income | | | 104,154 | | | | 3,428,013 | | | | 1,526,324 | | | | 81,769,565 | | |
Realized and Unrealized Gains (Losses): | |
Net realized gains (losses) from: | |
Sales of unaffiliated issuers | | | 255,114 | | | | 27,478,205 | | | | 1,558,561 | | | | 17,478,737 | | |
Foreign currency transactions | | | (365 | ) | | | (33,766 | ) | | | — | | | | — | | |
Net realized gains | | | 254,749 | | | | 27,444,439 | | | | 1,558,561 | | | | 17,478,737 | | |
Net change in unrealized appreciation of securities and foreign currency transactions | | | 316,395 | | | | 45,551,330 | | | | 2,626,185 | | | | 53,239,557 | | |
Net gains | | | 571,144 | | | | 72,995,769 | | | | 4,184,746 | | | | 70,718,294 | | |
Net Increase in Net Assets Resulting from Operations | | $ | 675,298 | | | $ | 76,423,782 | | | $ | 5,711,070 | | | $ | 152,487,859 | | |
*Net of Foreign Taxes Withheld | | $ | 5,584 | | | $ | 432,313 | | | $ | 14,072 | | | $ | 27,725 | | |
The accompanying notes are an integral part of these financial statements.
51
Statements of Changes in Net Assets
| | | Diversified Value Fund | | Large Cap Value Fund | |
| | | Year ended
June 30, 2014 | | Year ended
June 30, 2013 | | Year ended
June 30, 2014 | | Year ended
June 30, 2013 | |
Operations: | |
Net investment income | | $ | 12,803,817 | | | $ | 5,560,471 | | | $ | 21,716,658 | | | $ | 7,984,055 | | |
Net realized gains (losses) | | | 33,419,573 | | | | 20,370,321 | | | | 85,951,132 | | | | (1,689,511 | ) | |
Net change in unrealized appreciation | | | 58,448,071 | | | | 76,406,951 | | | | 58,457,075 | | | | 129,033,500 | | |
Net increase in net assets resulting from operations | | | 104,671,461 | | | | 102,337,743 | | | | 166,124,865 | | | | 135,328,044 | | |
Dividends and Distributions to Shareholders: | |
Net investment income: | |
Class I | | | (4,908,742 | ) | | | (5,093,871 | ) | | | (5,604,965 | ) | | | (8,213,389 | ) | |
Class A | | | (481,382 | ) | | | (430,420 | ) | | | (2,288,711 | ) | | | (3,335,419 | ) | |
Class C | | | (44,726 | ) | | | (110,553 | ) | | | — | | | | (272,549 | ) | |
Class R | | | — | | | | — | | | | (90,380 | ) | | | (194,957 | ) | |
Net realized gains: | |
Class I | | | — | | | | — | | | | — | | | | — | | |
Class A | | | — | | | | — | | | | — | | | | — | | |
Class C | | | — | | | | — | | | | — | | | | — | | |
Class R | | | — | | | | — | | | | — | | | | — | | |
Net decrease in net assets resulting from dividends and
distributions to shareholders | | | (5,434,850 | ) | | | (5,634,844 | ) | | | (7,984,056 | ) | | | (12,016,314 | ) | |
Capital Share Transactions: | |
Net increase (decrease) in net assets resulting from capital share
transactions | | | 34,878,129 | | | | (49,383,506 | ) | | | 39,371,206 | | | | (66,365,313 | ) | |
Net Assets: | |
Total increase in net assets | | | 134,114,740 | | | | 47,319,393 | | | | 197,512,015 | | | | 56,946,417 | | |
Beginning of year | | | 415,028,439 | | | | 367,709,046 | | | | 563,498,019 | | | | 506,551,602 | | |
End of year | | $ | 549,143,179 | | | $ | 415,028,439 | | | $ | 761,010,034 | | | $ | 563,498,019 | | |
Undistributed net investment income | | $ | 12,803,931 | | | $ | 5,434,850 | | | $ | 21,716,657 | | | $ | 7,984,055 | | |
The accompanying notes are an integral part of these financial statements.
52
Statements of Changes in Net Assets
| | | Mid-Cap Value Fund | | Small Cap Value Fund | |
| | | Year ended
June 30, 2014 | | Year ended
June 30, 2013 | | Year ended
June 30, 2014 | | Year ended
June 30, 2013 | |
Operations: | |
Net investment income | | $ | 12,058,683 | | | $ | 7,650,643 | | | $ | 860,820 | | | $ | 2,614,950 | | |
Net realized gains | | | 406,312,115 | | | | 126,224,598 | | | | 121,667,369 | | | | 29,567,495 | | |
Net change in unrealized appreciation | | | 275,181,109 | | | | 356,599,470 | | | | 96,717,775 | | | | 88,366,909 | | |
Net increase in net assets resulting from operations | | | 693,551,907 | | | | 490,474,711 | | | | 219,245,964 | | | | 120,549,354 | | |
Dividends and Distributions to Shareholders: | |
Net investment income: | |
Class I | | | (6,148,056 | ) | | | (5,139,766 | ) | | | (1,868,145 | ) | | | (1,928,838 | ) | |
Class A | | | (1,367,862 | ) | | | (512,141 | ) | | | (462,993 | ) | | | (123,490 | ) | |
Class C | | | (115,505 | ) | | | — | | | | (27,101 | ) | | | — | | |
Class R | | | (22,467 | ) | | | (6,267 | ) | | | — | | | | — | | |
Net realized gains: | |
Class I | | | — | | | | — | | | | (46,665,876 | ) | | | — | | |
Class A | | | — | | | | — | | | | (14,109,950 | ) | | | — | | |
Class C | | | — | | | | — | | | | (3,583,146 | ) | | | — | | |
Class R | | | — | | | | — | | | | — | | | | — | | |
Net decrease in net assets resulting from dividends and
distributions to shareholders | | | (7,653,890 | ) | | | (5,658,174 | ) | | | (66,717,211 | ) | | | (2,052,328 | ) | |
Capital Share Transactions: | |
Net increase in net assets resulting from capital share transactions | | | 791,433,219 | | | | 326,185,659 | | | | 295,975,809 | | | | 119,070,176 | | |
Net Assets: | |
Total increase in net assets | | | 1,477,331,236 | | | | 811,002,196 | | | | 448,504,562 | | | | 237,567,202 | | |
Beginning of year | | | 2,106,710,615 | | | | 1,295,708,419 | | | | 584,776,411 | | | | 347,209,209 | | |
End of year | | $ | 3,584,041,851 | | | $ | 2,106,710,615 | | | $ | 1,033,280,973 | | | $ | 584,776,411 | | |
Undistributed net investment income | | $ | 11,963,369 | | | $ | 7,653,889 | | | $ | 829,969 | | | $ | 2,358,239 | | |
The accompanying notes are an integral part of these financial statements.
53
Statements of Changes in Net Assets
| | | Global Value Fund | | Value Opportunities Fund | |
| | | Year ended
June 30, 2014 | | Period ended
June 30, 2013+ | | Year ended
June 30, 2014 | | Year ended
June 30, 2013 | |
Operations: | |
Net investment income | | $ | 104,154 | | | $ | 21,199 | | | $ | 3,428,013 | | | $ | 1,664,210 | | |
Net realized gains | | | 254,749 | | | | 78,197 | | | | 27,444,439 | | | | 10,645,866 | | |
Net change in unrealized appreciation | | | 316,395 | | | | 159,443 | | | | 45,551,330 | | | | 23,709,571 | | |
Net increase in net assets resulting from operations | | | 675,298 | | | | 258,839 | | | | 76,423,782 | | | | 36,019,647 | | |
Dividends and Distributions to Shareholders: | |
Net investment income: | |
Class I | | | (35,894 | ) | | | — | | | | (1,119,363 | ) | | | (865,417 | ) | |
Class A | | | (955 | ) | | | — | | | | (859,974 | ) | | | (673,818 | ) | |
Class C | | | — | | | | — | | | | (72,346 | ) | | | (67,096 | ) | |
Net realized gains: | |
Class I | | | (181,345 | ) | | | — | | | | (7,936,180 | ) | | | (2,140,938 | ) | |
Class A | | | (5,087 | ) | | | — | | | | (7,803,482 | ) | | | (1,943,224 | ) | |
Class C | | | — | | | | — | | | | (2,221,386 | ) | | | (568,658 | ) | |
Net decrease in net assets resulting from dividends and
distributions to shareholders | | | (223,281 | ) | | | — | | | | (20,012,731 | ) | | | (6,259,151 | ) | |
Capital Share Transactions: | |
Net increase in net assets resulting from capital share transactions | | | 1,528,088 | | | | 1,765,198 | | | | 192,494,140 | | | | 119,712,666 | | |
Net Assets: | |
Total increase in net assets | | | 1,980,105 | | | | 2,024,037 | | | | 248,905,191 | | | | 149,473,162 | | |
Beginning of year | | | 2,024,037 | | | | — | | | | 233,882,763 | | | | 84,409,601 | | |
End of year | | $ | 4,004,142 | | | $ | 2,024,037 | | | $ | 482,787,954 | | | $ | 233,882,763 | | |
Undistributed net investment income | | $ | 94,602 | | | $ | 21,807 | | | $ | 2,485,967 | | | $ | 1,143,403 | | |
+ The Fund commenced operations on December 31, 2012.
The accompanying notes are an integral part of these financial statements.
54
Statements of Changes in Net Assets
| | | Capital Income Fund | | High Yield Fund | |
| | | Year ended
June 30, 2014 | | Year ended
June 30, 2013 | | Year ended
June 30, 2014 | | Year ended
June 30, 2013 | |
Operations: | |
Net investment income | | $ | 1,526,324 | | | $ | 768,099 | | | $ | 81,769,565 | | | $ | 50,703,701 | | |
Net realized gains | | | 1,558,561 | | | | 731,483 | | | | 17,478,737 | | | | 13,980,891 | | |
Net change in unrealized appreciation | | | 2,626,185 | | | | 1,332,813 | | | | 53,239,557 | | | | 9,892,758 | | |
Net increase in net assets resulting from operations | | | 5,711,070 | | | | 2,832,395 | | | | 152,487,859 | | | | 74,577,350 | | |
Dividends and Distributions to Shareholders: | |
Net investment income: | |
Class I | | | (545,563 | ) | | | (436,895 | ) | | | (53,642,913 | ) | | | (36,816,886 | ) | |
Class A | | | (693,473 | ) | | | (296,292 | ) | | | (27,309,600 | ) | | | (13,880,606 | ) | |
Class C | | | — | | | | — | | | | (96,625 | ) | | | (11,807 | ) | |
Net realized gains: | |
Class I | | | (635,662 | ) | | | (112,510 | ) | | | (9,104,675 | ) | | | (2,281,084 | ) | |
Class A | | | (707,583 | ) | | | (85,372 | ) | | | (4,860,631 | ) | | | (712,748 | ) | |
Class C | | | — | | | | — | | | | (17,961 | ) | | | — | | |
Net decrease in net assets resulting from dividends and
distributions to shareholders | | | (2,582,281 | ) | | | (931,069 | ) | | | (95,032,405 | ) | | | (53,703,131 | ) | |
Capital Share Transactions: | |
Net increase in net assets resulting from capital share transactions | | | 41,012,351 | | | | 14,307,824 | | | | 582,760,360 | | | | 545,203,830 | | |
Net Assets: | |
Total increase in net assets | | | 44,141,140 | | | | 16,209,150 | | | | 640,215,814 | | | | 566,078,049 | | |
Beginning of year | | | 25,129,746 | | | | 8,920,596 | | | | 1,097,590,821 | | | | 531,512,772 | | |
End of year | | $ | 69,270,886 | | | $ | 25,129,746 | | | $ | 1,737,806,635 | | | $ | 1,097,590,821 | | |
Undistributed net investment income (loss) | | $ | 353,809 | | | $ | 71,438 | | | $ | (1,177,852 | ) | | $ | (1,154,108 | ) | |
The accompanying notes are an integral part of these financial statements.
55
Financial Highlights
The following per share data and ratios have been derived from information provided in the financial statements.
| | | | | Income (loss) from investment operations | | Dividends and distributions | | | | Ratios to Average Net Assets | |
Diversified Value Fund | | Net asset
value,
beginning
of year | | Net
investment
income1 | | Net gains
(losses) on
securities
(both
realized and
unrealized) | | Total from
investment
operations | | Dividends
(from net
investment
income) | | Distributions
(from
capital
gains) | | Total
distributions | | Net asset
value, end
of year | | Total
return2 | | Net assets,
end of
year (in
thousands) | | Expenses,
net of
reimbursement/
waiver | | Expenses,
before
reimbursement/
waiver | | Net
investment
income | |
Class I | |
Year ended 6/30/2014 | | $ | 12.53 | | | $ | 0.38 | | | $ | 2.73 | | | $ | 3.11 | | | $ | (0.17 | ) | | $ | — | | | $ | (0.17 | ) | | $ | 15.47 | | | | 24.98 | % | | $ | 485,541 | | | | 0.95 | % | | | 1.01 | % | | | 2.72 | % | |
Year ended 6/30/2013 | | | 9.82 | | | | 0.16 | | | | 2.72 | | | | 2.88 | | | | (0.17 | ) | | | — | | | | (0.17 | ) | | | 12.53 | | | | 29.65 | | | | 367,963 | | | | 0.95 | | | | 1.06 | | | | 1.47 | | |
Year ended 6/30/2012 | | | 10.01 | | | | 0.16 | | | | (0.18 | ) | | | (0.02 | ) | | | (0.17 | ) | | | — | | | | (0.17 | ) | | | 9.82 | | | | –0.01 | | | | 320,916 | | | | 0.95 | | | | 1.06 | | | | 1.73 | | |
Year ended 6/30/2011 | | | 7.94 | | | | 0.15 | | | | 2.02 | | | | 2.17 | | | | (0.10 | ) | | | — | | | | (0.10 | ) | | | 10.01 | | | | 27.44 | | | | 328,273 | | | | 0.95 | | | | 1.12 | | | | 1.59 | | |
Year ended 6/30/2010 | | | 6.77 | | | | 0.12 | | | | 1.25 | | | | 1.37 | | | | (0.20 | ) | | | — | | | | (0.20 | ) | | | 7.94 | | | | 20.22 | | | | 330,586 | | | | 0.95 | | | | 1.11 | | | | 1.48 | | |
Class A | |
Year ended 6/30/2014 | | | 12.57 | | | | 0.38 | | | | 2.70 | | | | 3.08 | | | | (0.15 | ) | | | — | | | | (0.15 | ) | | | 15.50 | | | | 24.68 | | | | 59,173 | | | | 1.20 | | | | 1.26 | | | | 2.71 | | |
Year ended 6/30/2013 | | | 9.86 | | | | 0.13 | | | | 2.72 | | | | 2.85 | | | | (0.14 | ) | | | — | | | | (0.14 | ) | | | 12.57 | | | | 29.25 | | | | 35,251 | | | | 1.20 | | | | 1.31 | | | | 1.21 | | |
Year ended 6/30/2012 | | | 10.03 | | | | 0.14 | | | | (0.18 | ) | | | (0.04 | ) | | | (0.13 | ) | | | — | | | | (0.13 | ) | | | 9.86 | | | | –0.18 | | | | 34,731 | | | | 1.20 | | | | 1.31 | | | | 1.46 | | |
Year ended 6/30/2011 | | | 7.96 | | | | 0.14 | | | | 2.02 | | | | 2.16 | | | | (0.09 | ) | | | — | | | | (0.09 | ) | | | 10.03 | | | | 27.16 | | | | 45,383 | | | | 1.20 | | | | 1.37 | | | | 1.42 | | |
Year ended 6/30/2010 | | | 6.79 | | | | 0.10 | | | | 1.25 | | | | 1.35 | | | | (0.18 | ) | | | — | | | | (0.18 | ) | | | 7.96 | | | | 19.84 | | | | 45,427 | | | | 1.20 | | | | 1.36 | | | | 1.21 | | |
Class C | |
Year ended 6/30/2014 | | | 12.35 | | | | 0.17 | | | | 2.75 | | | | 2.92 | | | | (0.07 | ) | | | — | | | | (0.07 | ) | | | 15.20 | | | | 23.70 | | | | 4,429 | | | | 1.95 | | | | 2.01 | | | | 1.28 | | |
Year ended 6/30/2013 | | | 9.72 | | | | 0.05 | | | | 2.68 | | | | 2.73 | | | | (0.10 | ) | | | — | | | | (0.10 | ) | | | 12.35 | | | | 28.28 | | | | 11,815 | | | | 1.95 | | | | 2.06 | | | | 0.45 | | |
Year ended 6/30/2012 | | | 9.92 | | | | 0.07 | | | | (0.17 | ) | | | (0.10 | ) | | | (0.10 | ) | | | — | | | | (0.10 | ) | | | 9.72 | | | | –0.92 | | | | 12,062 | | | | 1.95 | | | | 2.06 | | | | 0.73 | | |
Year ended 6/30/2011 | | | 7.90 | | | | 0.06 | | | | 2.00 | | | | 2.06 | | | | (0.04 | ) | | | — | | | | (0.04 | ) | | | 9.92 | | | | 26.11 | | | | 14,036 | | | | 1.95 | | | | 2.12 | | | | 0.61 | | |
Year ended 6/30/2010 | | | 6.74 | | | | 0.04 | | | | 1.26 | | | | 1.30 | | | | (0.14 | ) | | | — | | | | (0.14 | ) | | | 7.90 | | | | 19.17 | | | | 15,254 | | | | 1.95 | | | | 2.11 | | | | 0.47 | | |
| | | Year Ended June 30, | |
| | | 2014 | | 2013 | | 2012 | | 2011 | | 2010 | |
Portfolio turnover rate | | | 33 | % | | | 44 | % | | | 42 | % | | | 63 | % | | | 43 | % | |
| | | | | Income (loss) from investment operations | | Dividends and distributions | | | | Ratios to Average Net Assets | |
Large Cap Value Fund | | Net asset
value,
beginning
of year | | Net
investment
income1 | | Net gains
(losses) on
securities
(both
realized and
unrealized) | | Total from
investment
operations | | Dividends
(from net
investment
income) | | Distributions
(from
capital
gains) | | Total
distributions | | Net asset
value, end
of year | | Total
return2 | | Net assets,
end of
year (in
thousands) | | Expenses,
net of
reimbursement/
waiver | | Expenses,
before
reimbursement/
waiver | | Net
investment
income | |
Class I | |
Year ended 6/30/2014 | | $ | 21.35 | | | $ | 0.73 | | | $ | 4.88 | | | $ | 5.61 | | | $ | (0.31 | ) | | $ | — | | | $ | (0.31 | ) | | $ | 26.65 | | | | 26.52 | % | | $ | 500,102 | | | | 1.01 | % | | | 1.01 | % | | | 3.04 | % | |
Year ended 6/30/2013 | | | 16.80 | | | | 0.31 | | | | 4.69 | | | | 5.00 | | | | (0.45 | ) | | | — | | | | (0.45 | ) | | | 21.35 | | | | 30.48 | | | | 389,300 | | | | 1.05 | | | | 1.05 | | | | 1.68 | | |
Year ended 6/30/2012 | | | 16.96 | | | | 0.31 | | | | (0.13 | ) | | | 0.18 | | | | (0.34 | ) | | | — | | | | (0.34 | ) | | | 16.80 | | | | 1.22 | | | | 316,081 | | | | 1.05 | | | | 1.05 | | | | 1.96 | | |
Year ended 6/30/2011 | | | 13.32 | | | | 0.26 | | | | 3.42 | | | | 3.68 | | | | (0.04 | ) | | | — | | | | (0.04 | ) | | | 16.96 | | | | 27.61 | | | | 588,823 | | | | 1.05 | | | | 1.07 | | | | 1.60 | | |
Year ended 6/30/2010 | | | 11.49 | | | | 0.21 | | | | 1.99 | | | | 2.20 | | | | (0.37 | ) | | | — | | | | (0.37 | ) | | | 13.32 | | | | 20.08 | | | | 478,653 | | | | 1.05 | | | | 1.09 | | | | 1.51 | | |
Class A | |
Year ended 6/30/2014 | | | 21.21 | | | | 0.73 | | | | 4.79 | | | | 5.52 | | | | (0.27 | ) | | | — | | | | (0.27 | ) | | | 26.46 | | | | 26.22 | | | | 223,219 | | | | 1.26 | | | | 1.26 | | | | 3.02 | | |
Year ended 6/30/2013 | | | 16.68 | | | | 0.26 | | | | 4.67 | | | | 4.93 | | | | (0.40 | ) | | | — | | | | (0.40 | ) | | | 21.21 | | | | 30.16 | | | | 156,303 | | | | 1.30 | | | | 1.30 | | | | 1.42 | | |
Year ended 6/30/2012 | | | 16.84 | | | | 0.26 | | | | (0.12 | ) | | | 0.14 | | | | (0.30 | ) | | | — | | | | (0.30 | ) | | | 16.68 | | | | 0.99 | | | | 155,767 | | | | 1.30 | | | | 1.30 | | | | 1.66 | | |
Year ended 6/30/2011 | | | 13.25 | | | | 0.21 | | | | 3.39 | | | | 3.60 | | | | (0.01 | ) | | | — | | | | (0.01 | ) | | | 16.84 | | | | 27.21 | | | | 319,863 | | | | 1.30 | | | | 1.31 | | | | 1.33 | | |
Year ended 6/30/2010 | | | 11.44 | | | | 0.16 | | | | 2.01 | | | | 2.17 | | | | (0.36 | ) | | | — | | | | (0.36 | ) | | | 13.25 | | | | 19.82 | | | | 512,120 | | | | 1.30 | | | | 1.34 | | | | 1.17 | | |
Class C | |
Year ended 6/30/2014 | | | 20.72 | | | | 0.72 | | | | 4.52 | | | | 5.24 | | | | — | | | | — | | | | — | | | | 25.96 | | | | 25.29 | | | | 25,765 | | | | 2.01 | | | | 2.01 | | | | 3.02 | | |
Year ended 6/30/2013 | | | 16.26 | | | | 0.10 | | | | 4.58 | | | | 4.68 | | | | (0.22 | ) | | | — | | | | (0.22 | ) | | | 20.72 | | | | 29.12 | | | | 8,324 | | | | 2.05 | | | | 2.05 | | | | 0.59 | | |
Year ended 6/30/2012 | | | 16.48 | | | | 0.14 | | | | (0.12 | ) | | | 0.02 | | | | (0.24 | ) | | | — | | | | (0.24 | ) | | | 16.26 | | | | 0.29 | | | | 23,891 | | | | 2.05 | | | | 2.05 | | | | 0.92 | | |
Year ended 6/30/2011 | | | 13.05 | | | | 0.09 | | | | 3.34 | | | | 3.43 | | | | — | | | | — | | | | — | | | | 16.48 | | | | 26.28 | | | | 36,612 | | | | 2.05 | | | | 2.07 | | | | 0.59 | | |
Year ended 6/30/2010 | | | 11.33 | | | | 0.06 | | | | 1.99 | | | | 2.05 | | | | (0.33 | ) | | | — | | | | (0.33 | ) | | | 13.05 | | | | 18.91 | | | | 38,064 | | | | 2.05 | | | | 2.09 | | | | 0.46 | | |
Class R | |
Year ended 6/30/2014 | | | 21.33 | | | | 0.60 | | | | 4.89 | | | | 5.49 | | | | (0.20 | ) | | | — | | | | (0.20 | ) | | | 26.62 | | | | 25.91 | | | | 11,924 | | | | 1.51 | | | | 1.51 | | | | 2.51 | | |
Year ended 6/30/2013 | | | 16.77 | | | | 0.21 | | | | 4.69 | | | | 4.90 | | | | (0.34 | ) | | | — | | | | (0.34 | ) | | | 21.33 | | | | 29.79 | | | | 9,571 | | | | 1.55 | | | | 1.55 | | | | 1.15 | | |
Year ended 6/30/2012 | | | 16.95 | | | | 0.23 | | | | (0.12 | ) | | | 0.11 | | | | (0.29 | ) | | | — | | | | (0.29 | ) | | | 16.77 | | | | 0.80 | | | | 10,812 | | | | 1.55 | | | | 1.55 | | | | 1.42 | | |
Year ended 6/30/2011 | | | 13.36 | | | | 0.17 | | | | 3.42 | | | | 3.59 | | | | — | | | | — | | | | — | | | | 16.95 | | | | 26.87 | | | | 14,034 | | | | 1.55 | | | | 1.56 | | | | 1.08 | | |
Year ended 6/30/2010 | | | 11.54 | | | | 0.13 | | | | 2.03 | | | | 2.16 | | | | (0.34 | ) | | | — | | | | (0.34 | ) | | | 13.36 | | | | 19.55 | | | | 14,922 | | | | 1.55 | | | | 1.59 | | | | 0.97 | | |
| | | Year Ended June 30, | |
| | | 2014 | | 2013 | | 2012 | | 2011 | | 2010 | |
Portfolio turnover rate | | | 57 | % | | | 41 | % | | | 59 | % | | | 43 | % | | | 47 | % | |
1 Net investment income per share has been calculated based on average shares outstanding during the period.
2 Total returns exclude the effects of sales charges. The Fund's investment advisor may have waived a portion of its advisory fee and/or reimbursed a portion of the Fund's expenses. Without such waiver and/or reimbursement, the Fund's performance would have been lower.
The accompanying notes are an integral part of these financial statements.
56
Financial Highlights
The following per share data and ratios have been derived from information provided in the financial statements.
| | | | | Income (loss) from investment operations | | Dividends and distributions | | | | Ratios to Average Net Assets | |
Mid-Cap Value Fund | | Net asset
value,
beginning
of year | | Net
investment
income
(loss)1 | | Net
gains on
securities
(both
realized and
unrealized) | | Total from
investment
operations | | Dividends
(from net
investment
income) | | Distributions
(from
capital
gains) | | Total
distributions | | Net asset
value, end
of year | | Total
return2 | | Net assets,
end of
year (in
thousands) | | Expenses,
net of
reimbursement/
waiver | | Expenses,
before
reimbursement/
waiver | | Net
investment
income
(loss) | |
Class I | |
Year ended 6/30/2014 | | $ | 35.36 | | | $ | 0.21 | | | $ | 9.71 | | | $ | 9.92 | | | $ | (0.13 | ) | | $ | — | | | $ | (0.13 | ) | | $ | 45.15 | | | | 28.10 | % | | $ | 2,542,569 | | | | 1.01 | % | | | 1.01 | % | | | 0.52 | % | |
Year ended 6/30/2013 | | | 26.02 | | | | 0.16 | | | | 9.31 | | | | 9.47 | | | | (0.13 | ) | | | — | | | | (0.13 | ) | | | 35.36 | | | | 36.51 | | | | 1,627,378 | | | | 1.07 | | | | 1.07 | | | | 0.55 | | |
Year ended 6/30/2012 | | | 24.96 | | | | 0.13 | | | | 0.95 | | | | 1.08 | | | | (0.02 | ) | | | — | | | | (0.02 | ) | | | 26.02 | | | | 4.33 | | | | 1,058,806 | | | | 1.10 | | | | 1.10 | | | | 0.54 | | |
Year ended 6/30/2011 | | | 18.14 | | | | 0.05 | | | | 6.85 | | | | 6.90 | | | | (0.08 | ) | | | — | | | | (0.08 | ) | | | 24.96 | | | | 38.05 | | | | 1,077,149 | | | | 1.08 | | | | 1.08 | | | | 0.20 | | |
Year ended 6/30/2010 | | | 13.76 | | | | 0.05 | | | | 4.49 | | | | 4.54 | | | | (0.16 | ) | | | — | | | | (0.16 | ) | | | 18.14 | | | | 33.00 | | | | 875,883 | | | | 1.10 | | | | 1.10 | | | | 0.29 | | |
Class A | |
Year ended 6/30/2014 | | | 34.98 | | | | 0.12 | | | | 9.58 | | | | 9.70 | | | | (0.08 | ) | | | — | | | | (0.08 | ) | | | 44.60 | | | | 27.78 | | | | 862,559 | | | | 1.26 | | | | 1.26 | | | | 0.29 | | |
Year ended 6/30/2013 | | | 25.75 | | | | 0.09 | | | | 9.21 | | | | 9.30 | | | | (0.07 | ) | | | — | | | | (0.07 | ) | | | 34.98 | | | | 36.16 | | | | 406,949 | | | | 1.32 | | | | 1.32 | | | | 0.32 | | |
Year ended 6/30/2012 | | | 24.74 | | | | 0.07 | | | | 0.94 | | | | 1.01 | | | | — | | | | — | | | | — | | | | 25.75 | | | | 4.08 | | | | 217,069 | | | | 1.35 | | | | 1.35 | | | | 0.28 | | |
Year ended 6/30/2011 | | | 18.01 | | | | (0.01 | ) | | | 6.78 | | | | 6.77 | | | | (0.04 | ) | | | — | | | | (0.04 | ) | | | 24.74 | | | | 37.63 | | | | 235,301 | | | | 1.33 | | | | 1.33 | | | | (0.06 | ) | |
Year ended 6/30/2010 | | | 13.68 | | | | 0.01 | | | | 4.46 | | | | 4.47 | | | | (0.14 | ) | | | — | | | | (0.14 | ) | | | 18.01 | | | | 32.67 | | | | 215,231 | | | | 1.35 | | | | 1.35 | | | | 0.03 | | |
Class C | |
Year ended 6/30/2014 | | | 32.39 | | | | (0.16 | ) | | | 8.85 | | | | 8.69 | | | | (0.04 | ) | | | — | | | | (0.04 | ) | | | 41.04 | | | | 26.84 | | | | 154,222 | | | | 2.01 | | | | 2.01 | | | | (0.45 | ) | |
Year ended 6/30/2013 | | | 23.97 | | | | (0.11 | ) | | | 8.53 | | | | 8.42 | | | | — | | | | — | | | | — | | | | 32.39 | | | | 35.13 | | | | 62,638 | | | | 2.07 | | | | 2.07 | | | | (0.39 | ) | |
Year ended 6/30/2012 | | | 23.20 | | | | (0.11 | ) | | | 0.88 | | | | 0.77 | | | | — | | | | — | | | | — | | | | 23.97 | | | | 3.32 | | | | 15,072 | | | | 2.10 | | | | 2.10 | | | | (0.53 | ) | |
Year ended 6/30/2011 | | | 16.98 | | | | (0.17 | ) | | | 6.39 | | | | 6.22 | | | | — | | | | — | | | | — | | | | 23.20 | | | | 36.63 | | | | 35,320 | | | | 2.08 | | | | 2.08 | | | | (0.81 | ) | |
Year ended 6/30/2010 | | | 12.99 | | | | (0.12 | ) | | | 4.23 | | | | 4.11 | | | | (0.12 | ) | | | — | | | | (0.12 | ) | | | 16.98 | | | | 31.67 | | | | 30,317 | | | | 2.10 | | | | 2.10 | | | | (0.71 | ) | |
Class R | |
Year ended 6/30/2014 | | | 35.17 | | | | 0.02 | | | | 9.63 | | | | 9.65 | | | | (0.05 | ) | | | — | | | | (0.05 | ) | | | 44.77 | | | | 27.47 | | | | 24,693 | | | | 1.51 | | | | 1.51 | | | | 0.05 | | |
Year ended 6/30/2013 | | | 25.92 | | | | 0.03 | | | | 9.25 | | | | 9.28 | | | | (0.03 | ) | | | — | | | | (0.03 | ) | | | 35.17 | | | | 35.82 | | | | 9,746 | | | | 1.57 | | | | 1.57 | | | | 0.09 | | |
Year ended 6/30/2012 | | | 24.95 | | | | 0.003 | | | | 0.97 | | | | 0.97 | | | | — | | | | — | | | | — | | | | 25.92 | | | | 3.89 | | | | 4,762 | | | | 1.60 | | | | 1.60 | | | | 0.02 | | |
Year ended 6/30/2011 | | | 18.18 | | | | (0.07 | ) | | | 6.85 | | | | 6.78 | | | | (0.01 | ) | | | — | | | | (0.01 | ) | | | 24.95 | | | | 37.32 | | | | 6,215 | | | | 1.58 | | | | 1.58 | | | | (0.30 | ) | |
Year ended 6/30/2010 | | | 13.82 | | | | (0.04 | ) | | | 4.51 | | | | 4.47 | | | | (0.11 | ) | | | — | | | | (0.11 | ) | | | 18.18 | | | | 32.36 | | | | 5,519 | | | | 1.60 | | | | 1.60 | | | | (0.23 | ) | |
| | | Year Ended June 30, | |
| | | 2014 | | 2013 | | 2012 | | 2011 | | 2010 | |
Portfolio turnover rate | | | 55 | % | | | 66 | % | | | 72 | % | | | 62 | % | | | 67 | % | |
| | | | | Income (loss) from investment operations | | Dividends and distributions | | | | Ratios to Average Net Assets | |
Small Cap Value Fund | | Net asset
value,
beginning
of year | | Net
investment
income
(loss)1 | | Net gains
(losses) on
securities
(both
realized and
unrealized) | | Total from
investment
operations | | Dividends
(from net
investment
income) | | Distributions
(from
capital
gains) | | Total
distributions | | Net asset
value, end
of year | | Total
return2 | | Net assets,
end of
year (in
thousands) | | Expenses,
net of
reimbursement/
waiver | | Expenses,
before
reimbursement/
waiver | | Net
investment
income
(loss) | |
Class I | |
Year ended 6/30/2014 | | $ | 54.84 | | | $ | 0.13 | | | $ | 16.83 | | | $ | 16.96 | | | $ | (0.20 | ) | | $ | (4.98 | ) | | $ | (5.18 | ) | | $ | 66.62 | | | | 32.40 | % | | $ | 785,915 | | | | 0.99 | % | | | 0.99 | % | | | 0.21 | % | |
Year ended 6/30/2013 | | | 41.83 | | | | 0.32 | | | | 12.96 | | | | 13.28 | | | | (0.27 | ) | | | — | | | | (0.27 | ) | | | 54.84 | | | | 31.88 | | | | 452,702 | | | | 1.03 | | | | 1.03 | | | | 0.67 | | |
Year ended 6/30/2012 | | | 43.90 | | | | 0.29 | | | | (2.36 | ) | | | (2.07 | ) | | | — | | | | — | | | | — | | | | 41.83 | | | | –4.72 | | | | 296,436 | | | | 1.09 | | | | 1.09 | | | | 0.73 | | |
Year ended 6/30/2011 | | | 31.33 | | | | (0.05 | ) | | | 12.68 | | | | 12.63 | | | | (0.06 | ) | | | — | | | | (0.06 | ) | | | 43.90 | | | | 40.29 | | | | 254,187 | | | | 1.08 | | | | 1.08 | | | | (0.13 | ) | |
Year ended 6/30/2010 | | | 21.15 | | | | 0.07 | | | | 10.28 | | | | 10.35 | | | | (0.17 | ) | | | — | | | | (0.17 | ) | | | 31.33 | | | | 49.02 | | | | 165,348 | | | | 1.14 | | | | 1.14 | | | | 0.23 | | |
Class A | |
Year ended 6/30/2014 | | | 54.67 | | | | (0.02 | ) | | | 16.75 | | | | 16.73 | | | | (0.16 | ) | | | (4.98 | ) | | | (5.14 | ) | | | 66.26 | | | | 32.06 | | | | 204,205 | | | | 1.24 | | | | 1.24 | | | | (0.04 | ) | |
Year ended 6/30/2013 | | | 41.67 | | | | 0.21 | | | | 12.91 | | | | 13.12 | | | | (0.12 | ) | | | — | | | | (0.12 | ) | | | 54.67 | | | | 31.55 | | | | 103,329 | | | | 1.28 | | | | 1.28 | | | | 0.43 | | |
Year ended 6/30/2012 | | | 43.84 | | | | 0.15 | | | | (2.32 | ) | | | (2.17 | ) | | | — | | | | — | | | | — | | | | 41.67 | | | | –4.95 | | | | 39,803 | | | | 1.34 | | | | 1.34 | | | | 0.39 | | |
Year ended 6/30/2011 | | | 31.34 | | | | (0.15 | ) | | | 12.68 | | | | 12.53 | | | | (0.03 | ) | | | — | | | | (0.03 | ) | | | 43.84 | | | | 39.94 | | | | 64,100 | | | | 1.33 | | | | 1.33 | | | | (0.39 | ) | |
Year ended 6/30/2010 | | | 21.18 | | | | 0.003 | | | | 10.30 | | | | 10.30 | | | | (0.14 | ) | | | — | | | | (0.14 | ) | | | 31.34 | | | | 48.70 | | | | 47,007 | | | | 1.39 | | | | 1.39 | | | | (0.01 | ) | |
Class C | |
Year ended 6/30/2014 | | | 49.40 | | | | (0.43 | ) | | | 15.04 | | | | 14.61 | | | | (0.04 | ) | | | (4.98 | ) | | | (5.02 | ) | | | 58.99 | | | | 31.09 | | | | 43,161 | | | | 1.99 | | | | 1.99 | | | | (0.79 | ) | |
Year ended 6/30/2013 | | | 37.84 | | | | (0.14 | ) | | | 11.70 | | | | 11.56 | | | | — | | | | — | | | | — | | | | 49.40 | | | | 30.55 | | | | 28,745 | | | | 2.03 | | | | 2.03 | | | | (0.31 | ) | |
Year ended 6/30/2012 | | | 40.11 | | | | (0.10 | ) | | | (2.17 | ) | | | (2.27 | ) | | | — | | | | — | | | | — | | | | 37.84 | | | | –5.66 | | | | 10,970 | | | | 2.09 | | | | 2.09 | | | | (0.29 | ) | |
Year ended 6/30/2011 | | | 28.87 | | | | (0.42 | ) | | | 11.66 | | | | 11.24 | | | | — | | | | — | | | | — | | | | 40.11 | | | | 38.93 | | | | 11,727 | | | | 2.08 | | | | 2.08 | | | | (1.14 | ) | |
Year ended 6/30/2010 | | | 19.65 | | | | (0.22 | ) | | | 9.56 | | | | 9.34 | | | | (0.12 | ) | | | — | | | | (0.12 | ) | | | 28.87 | | | | 47.56 | | | | 4,278 | | | | 2.14 | | | | 2.14 | | | | (0.77 | ) | |
| | | Year Ended June 30, | |
| | | 2014 | | 2013 | | 2012 | | 2011 | | 2010 | |
Portfolio turnover rate | | | 43 | % | | | 35 | % | | | 37 | % | | | 54 | % | | | 93 | % | |
1 Net investment income (loss) per share has been calculated based on average shares outstanding during the period.
2 Total returns exclude the effects of sales charges. The Fund's investment advisor may have waived a portion of its advisory fee and/or reimbursed a portion of the Fund's expenses. Without such waiver and/or reimbursement, the Fund's performance would have been lower.
3 Amount is less than $0.005.
The accompanying notes are an integral part of these financial statements.
57
Financial Highlights
The following per share data and ratios have been derived from information provided in the financial statements.
| | | | | Income from investment operations | | Dividends and distributions | | | | Ratios to Average Net Assets | |
Global Value Fund | | Net asset
value,
beginning
of period | | Net
investment
income1 | | Net
gains on
securities
(both
realized and
unrealized) | | Total from
investment
operations | | Dividends
(from net
investment
income) | | Distributions
(from
capital
gains) | | Total
distributions | | Net asset
value, end
of period | | Total
return2 | | Net assets,
end of
period (in
thousands) | | Expenses,
net of
reimbursement/
waiver | | Expenses,
before
reimbursement/
waiver | | Net
investment
income | |
Class I | |
Year ended 6/30/2014 | | $ | 11.49 | | | $ | 0.41 | | | $ | 2.45 | | | $ | 2.86 | | | $ | (0.17 | ) | | $ | (0.87 | ) | | $ | (1.04 | ) | | $ | 13.31 | | | | 25.98 | % | | $ | 3,867 | | | | 1.10 | % | | | 6.26 | % | | | 3.29 | % | |
Period from
12/31/20123 to
6/30/2013 | | | 10.00 | | | | 0.12 | | | | 1.37 | | | | 1.49 | | | | — | | | | — | | | | — | | | | 11.49 | | | | 14.90 | | | | 2,024 | | | | 1.104 | | | | 11.754 | | | | 2.224 | | |
Class A | |
Period from
8/30/20133 to
6/30/2014 | | | 11.85 | | | | 0.34 | | | | 2.13 | | | | 2.47 | | | | (0.16 | ) | | | (0.87 | ) | | | (1.03 | ) | | | 13.29 | | | | 21.88 | | | | 137 | | | | 1.354 | | | | 6.584 | | | | 3.214 | | |
| | | Year Ended June 30, 2014 | | Period December 31, 20123
through June 30, 2013 | |
Portfolio turnover rate | | | 52 | % | | | 38 | % | |
| | | | | Income (loss) from investment operations | | Dividends and distributions | | | | Ratios to Average Net Assets | |
Value Opportunities Fund | | Net asset
value,
beginning
of year | | Net
investment
income
(loss)1 | | Net gains
(losses) on
securities
(both
realized and
unrealized) | | Total from
investment
operations | | Dividends
(from net
investment
income) | | Distributions
(from
capital
gains) | | Total
distributions | | Net asset
value, end
of year | | Total
return2 | | Net assets,
end of
year (in
thousands) | | Expenses,
net of
reimbursement/
waiver | | Expenses,
before
reimbursement/
waiver | | Net
investment
income
(loss) | |
Class I | |
Year ended 6/30/2014 | | $ | 25.46 | | | $ | 0.35 | | | $ | 5.91 | | | $ | 6.26 | | | $ | (0.23 | ) | | $ | (1.61 | ) | | $ | (1.84 | ) | | $ | 29.88 | | | | 25.67 | % | | $ | 265,138 | | | | 0.99 | % | | | 0.99 | % | | | 1.25 | % | |
Year ended 6/30/2013 | | | 20.44 | | | | 0.34 | | | | 6.00 | | | | 6.34 | | | | (0.38 | ) | | | (0.94 | ) | | | (1.32 | ) | | | 25.46 | | | | 32.28 | | | | 105,332 | | | | 1.03 | | | | 1.03 | | | | 1.45 | | |
Year ended 6/30/2012 | | | 21.12 | | | | 0.33 | | | | (0.48 | ) | | | (0.15 | ) | | | (0.14 | ) | | | (0.39 | ) | | | (0.53 | ) | | | 20.44 | | | | –0.20 | | | | 41,079 | | | | 1.10 | | | | 1.10 | | | | 1.73 | | |
Year ended 6/30/2011 | | | 14.96 | | | | 0.14 | | | | 6.24 | | | | 6.38 | | | | (0.22 | ) | | | — | | | | (0.22 | ) | | | 21.12 | | | | 42.81 | | | | 39,014 | | | | 1.11 | | | | 1.11 | | | | 0.74 | | |
Year ended 6/30/2010 | | | 10.99 | | | | 0.17 | | | | 4.08 | | | | 4.25 | | | | (0.28 | ) | | | — | | | | (0.28 | ) | | | 14.96 | | | | 38.72 | | | | 24,073 | | | | 1.15 | | | | 1.15 | | | | 1.12 | | |
Class A | |
Year ended 6/30/2014 | | | 25.48 | | | | 0.25 | | | | 5.94 | | | | 6.19 | | | | (0.18 | ) | | | (1.61 | ) | | | (1.79 | ) | | | 29.88 | | | | 25.34 | | | | 165,608 | | | | 1.24 | | | | 1.24 | | | | 0.91 | | |
Year ended 6/30/2013 | | | 20.46 | | | | 0.28 | | | | 6.01 | | | | 6.29 | | | | (0.33 | ) | | | (0.94 | ) | | | (1.27 | ) | | | 25.48 | | | | 31.98 | | | | 103,822 | | | | 1.28 | | | | 1.28 | | | | 1.22 | | |
Year ended 6/30/2012 | | | 21.12 | | | | 0.28 | | | | (0.47 | ) | | | (0.19 | ) | | | (0.08 | ) | | | (0.39 | ) | | | (0.47 | ) | | | 20.46 | | | | –0.45 | | | | 32,022 | | | | 1.35 | | | | 1.35 | | | | 1.45 | | |
Year ended 6/30/2011 | | | 14.98 | | | | 0.11 | | | | 6.22 | | | | 6.33 | | | | (0.19 | ) | | | — | | | | (0.19 | ) | | | 21.12 | | | | 42.40 | | | | 34,908 | | | | 1.36 | | | | 1.36 | | | | 0.58 | | |
Year ended 6/30/2010 | | | 11.01 | | | | 0.13 | | | | 4.09 | | | | 4.22 | | | | (0.25 | ) | | | — | | | | (0.25 | ) | | | 14.98 | | | | 38.43 | | | | 21,794 | | | | 1.40 | | | | 1.40 | | | | 0.87 | | |
Class C | |
Year ended 6/30/2014 | | | 24.28 | | | | 0.04 | | | | 5.65 | | | | 5.69 | | | | (0.05 | ) | | | (1.61 | ) | | | (1.66 | ) | | | 28.31 | | | | 24.44 | | | | 52,042 | | | | 1.99 | | | | 1.99 | | | | 0.17 | | |
Year ended 6/30/2013 | | | 19.50 | | | | 0.10 | | | | 5.73 | | | | 5.83 | | | | (0.11 | ) | | | (0.94 | ) | | | (1.05 | ) | | | 24.28 | | | | 30.97 | | | | 24,728 | | | | 2.03 | | | | 2.03 | | | | 0.44 | | |
Year ended 6/30/2012 | | | 20.21 | | | | 0.13 | | | | (0.45 | ) | | | (0.32 | ) | | | — | | | | (0.39 | ) | | | (0.39 | ) | | | 19.50 | | | | –1.22 | | | | 11,308 | | | | 2.10 | | | | 2.10 | | | | 0.69 | | |
Year ended 6/30/2011 | | | 14.40 | | | | (0.05 | ) | | | 5.99 | | | | 5.94 | | | | (0.13 | ) | | | — | | | | (0.13 | ) | | | 20.21 | | | | 41.35 | | | | 12,160 | | | | 2.11 | | | | 2.11 | | | | (0.26 | ) | |
Year ended 6/30/2010 | | | 10.61 | | | | 0.01 | | | | 3.95 | | | | 3.96 | | | | (0.17 | ) | | | — | | | | (0.17 | ) | | | 14.40 | | | | 37.38 | | | | 7,288 | | | | 2.15 | | | | 2.15 | | | | 0.10 | | |
| | | Year Ended June 30, | |
| | | 2014 | | 2013 | | 2012 | | 2011 | | 2010 | |
Portfolio turnover rate | | | 45 | % | | | 98 | % | | | 123 | % | | | 137 | % | | | 166 | % | |
1 Net investment income (loss) per share has been calculated based on average shares outstanding during the period.
2 Total returns exclude the effects of sales charges. The Fund's investment advisor may have waived a portion of its advisory fee and/or reimbursed a portion of the Fund's expenses. Without such waiver and/or reimbursement, the Fund's performance would have been lower. Returns for periods less than one year are not annualized.
3 Commencement of operations.
4 Annualized.
The accompanying notes are an integral part of these financial statements.
58
Financial Highlights
The following per share data and ratios have been derived from information provided in the financial statements.
| | | | | Income from investment operations | | Dividends and distributions | | | | Ratios to Average Net Assets | |
Capital Income Fund | | Net asset
value,
beginning
of period | | Net
investment
income1 | | Net
gains on
securities
(both
realized and
unrealized) | | Total from
investment
operations | | Dividends
(from net
investment
income) | | Distributions
(from
capital
gains) | | Total
distributions | | Net asset
value, end
of period | | Total
return2 | | Net assets,
end of
period (in
thousands) | | Expenses,
net of
reimbursement/
waiver | | Expenses,
before
reimbursement/
waiver | | Net
investment
income | |
Class I | |
Year ended 6/30/2014 | | $ | 11.83 | | | $ | 0.57 | | | $ | 1.64 | | | $ | 2.21 | | | $ | (0.51 | ) | | $ | (0.68 | ) | | $ | (1.19 | ) | | $ | 12.85 | | | | 19.71 | % | | $ | 21,399 | | | | 0.80 | % | | | 1.34 | % | | | 4.61 | % | |
Year ended 6/30/2013 | | | 10.57 | | | | 0.51 | | | | 1.38 | | | | 1.89 | | | | (0.50 | ) | | | (0.13 | ) | | | (0.63 | ) | | | 11.83 | | | | 18.45 | | | | 11,348 | | | | 0.80 | | | | 1.85 | | | | 4.51 | | |
Year ended 6/30/2012 | | | 10.37 | | | | 0.51 | | | | 0.25 | | | | 0.76 | | | | (0.48 | ) | | | (0.08 | ) | | | (0.56 | ) | | | 10.57 | | | | 7.76 | | | | 8,588 | | | | 0.80 | | | | 2.81 | | | | 5.06 | | |
Period from
12/31/20103 to
6/30/2011 | | | 10.00 | | | | 0.24 | | | | 0.35 | | | | 0.59 | | | | (0.22 | ) | | | — | | | | (0.22 | ) | | | 10.37 | | | | 5.90 | | | | 7,765 | | | | 0.804 | | | | 3.754 | | | | 4.604 | | |
Class A | |
Year ended 6/30/2014 | | | 12.18 | | | | 0.61 | | | | 1.61 | | | | 2.22 | | | | (0.48 | ) | | | (0.68 | ) | | | (1.16 | ) | | | 13.24 | | | | 19.17 | | | | 47,872 | | | | 1.05 | | | | 1.51 | | | | 4.76 | | |
Year ended 6/30/2013 | | | 10.67 | | | | 0.50 | | | | 1.61 | | | | 2.11 | | | | (0.47 | ) | | | (0.13 | ) | | | (0.60 | ) | | | 12.18 | | | | 20.34 | | | | 13,782 | | | | 1.05 | | | | 1.99 | | | | 4.31 | | |
Year ended 6/30/2012 | | | 10.38 | | | | 0.51 | | | | 0.32 | | | | 0.83 | | | | (0.46 | ) | | | (0.08 | ) | | | (0.54 | ) | | | 10.67 | | | | 8.37 | | | | 333 | | | | 1.05 | | | | 3.06 | | | | 4.93 | | |
Period from
2/28/20113 to
6/30/2011 | | | 10.34 | | | | 0.15 | | | | 0.03 | | | | 0.18 | | | | (0.14 | ) | | | — | | | | (0.14 | ) | | | 10.38 | | | | 1.74 | | | | 82 | | | | 1.054 | | | | 4.124 | | | | 4.314 | | |
| | | Year Ended June 30, | | Period December 31, 20103 | |
| | | 2014 | | 2013 | | 2012 | | through June 30, 2011 | |
Portfolio turnover rate | | | 53 | % | | | 65 | % | | | 38 | % | | | 39 | % | |
| | | | | Income (loss) from investment operations | | Dividends and distributions | | | | Ratios to Average Net Assets | |
High Yield Fund | | Net asset
value,
beginning
of period | | Net
investment
income1 | | Net gains
(losses) on
securities
(both
realized and
unrealized) | | Total from
investment
operations | | Dividends
(from net
investment
income) | | Distributions
(from
capital
gains) | | Total
distributions | | Net asset
value, end
of period | | Total
return2 | | Net assets,
end of
period (in
thousands) | | Expenses,
net of
reimbursement/
waiver | | Expenses,
before
reimbursement/
waiver | | Net
investment
income | |
Class I | |
Year ended 6/30/2014 | | $ | 12.83 | | | $ | 0.76 | | | $ | 0.67 | | | $ | 1.43 | | | $ | (0.76 | ) | | $ | (0.13 | ) | | $ | (0.89 | ) | | $ | 13.37 | | | | 11.51 | % | | $ | 1,127,080 | | | | 0.70 | % | | | 0.75 | % | | | 5.82 | % | |
Year ended 6/30/2013 | | | 12.28 | | | | 0.80 | | | | 0.61 | | | | 1.41 | | | | (0.81 | ) | | | (0.05 | ) | | | (0.86 | ) | | | 12.83 | | | | 11.70 | | | | 686,718 | | | | 0.70 | | | | 0.75 | | | | 6.23 | | |
Year ended 6/30/2012 | | | 12.79 | | | | 0.94 | | | | (0.25 | ) | | | 0.69 | | | | (0.95 | ) | | | (0.25 | ) | | | (1.20 | ) | | | 12.28 | | | | 6.02 | | | | 426,041 | | | | 0.70 | | | | 0.76 | | | | 7.76 | | |
Year ended 6/30/2011 | | | 12.01 | | | | 0.92 | | | | 1.23 | | | | 2.15 | | | | (0.93 | ) | | | (0.44 | ) | | | (1.37 | ) | | | 12.79 | | | | 18.45 | | | | 187,319 | | | | 0.70 | | | | 0.75 | | | | 7.15 | | |
Year ended 6/30/2010 | | | 10.90 | | | | 1.02 | | | | 1.65 | | | | 2.67 | | | | (1.03 | ) | | | (0.53 | ) | | | (1.56 | ) | | | 12.01 | | | | 25.45 | | | | 93,139 | | | | 0.70 | | | | 0.89 | | | | 8.51 | | |
Class A | |
Year ended 6/30/2014 | | | 12.75 | | | | 0.73 | | | | 0.66 | | | | 1.39 | | | | (0.72 | ) | | | (0.13 | ) | | | (0.85 | ) | | | 13.29 | | | | 11.28 | | | | 607,104 | | | | 0.95 | | | | 1.00 | | | | 5.59 | | |
Year ended 6/30/2013 | | | 12.21 | | | | 0.76 | | | | 0.60 | | | | 1.36 | | | | (0.77 | ) | | | (0.05 | ) | | | (0.82 | ) | | | 12.75 | | | | 11.37 | | | | 410,060 | | | | 0.95 | | | | 1.00 | | | | 5.91 | | |
Year ended 6/30/2012 | | | 12.73 | | | | 0.90 | | | | (0.26 | ) | | | 0.64 | | | | (0.91 | ) | | | (0.25 | ) | | | (1.17 | ) | | | 12.21 | | | | 5.66 | | | | 105,472 | | | | 0.95 | | | | 1.01 | | | | 7.47 | | |
Year ended 6/30/2011 | | | 11.97 | | | | 0.88 | | | | 1.21 | | | | 2.09 | | | | (0.89 | ) | | | (0.44 | ) | | | (1.33 | ) | | | 12.73 | | | | 18.11 | | | | 53,832 | | | | 0.95 | | | | 1.01 | | | | 6.88 | | |
Year ended 6/30/2010 | | | 10.89 | | | | 0.97 | | | | 1.64 | | | | 2.61 | | | | (1.00 | ) | | | (0.53 | ) | | | (1.53 | ) | | | 11.97 | | | | 24.76 | | | | 22,090 | | | | 0.95 | | | | 1.12 | | | | 8.10 | | |
Class C | |
Year ended 6/30/2014 | | | 12.82 | | | | 0.62 | | | | 0.68 | | | | 1.30 | | | | (0.63 | ) | | | (0.13 | ) | | | (0.76 | ) | | | 13.36 | | | | 10.40 | | | | 3,623 | | | | 1.70 | | | | 1.75 | | | | 4.72 | | |
Period from
12/31/20123 to
6/30/2013 | | | 12.88 | | | | 0.30 | | | | (0.05 | ) | | | 0.25 | | | | (0.31 | ) | | | — | | | | (0.31 | ) | | | 12.82 | | | | 1.91 | | | | 812 | | | | 1.704 | | | | 1.744 | | | | 4.734 | | |
| | | Year Ended June 30, | |
| | | 2014 | | 2013 | | 2012 | | 2011 | | 2010 | |
Portfolio turnover rate | | | 51 | % | | | 66 | % | | | 57 | % | | | 139 | % | | | 175 | % | |
1 Net investment income per share has been calculated based on average shares outstanding during the period.
2 Total returns exclude the effects of sales charges. The Fund's investment advisor may have waived a portion of its advisory fee and/or reimbursed a portion of the Fund's expenses. Without such waiver and/or reimbursement, the Fund's performance would have been lower. Returns for periods less than one year are not annualized.
3 Commencement of operations.
4 Annualized.
The accompanying notes are an integral part of these financial statements.
59
Notes to the Financial Statements
JUNE 30, 2014
NOTE 1.
Organization. Hotchkis & Wiley Funds (the "Trust") is registered under the Investment Company Act of 1940, as amended (the "1940 Act"), as an open-end, management investment company. The Trust was organized as a Delaware statutory trust on July 23, 2001 and consists of nine series, one of which had not commenced operations as of June 30, 2014. The Hotchkis & Wiley Diversified Value Fund, the Hotchkis & Wiley Large Cap Value Fund, the Hotchkis & Wiley Mid-Cap Value Fund, the Hotchkis & Wiley Small Cap Value Fund, the Hotchkis & Wiley Global Value Fund, the Hotchkis & Wiley Capital Income Fund and the Hotchkis & Wiley High Yield Fund (collectively, the "H&W Funds") are each a diversified series and the Hotchkis & Wiley Value Opportunities Fund (together with the H&W Funds, hereafter referred to as the "Funds") is a non-diversified series of the Trust. The Trust was organized to acquire the assets and liabilities of the Mercury HW Large Cap Value Fund, the Mercury HW Mid-Cap Value Fund and the Mercury HW Small Cap Value Fund (the "Mercury HW Funds"). On February 4, 2002, the Mercury HW Funds were reorganized into the Trust through a non-taxable exchange. On August 28, 2009, the Hotchkis & Wiley Core Value Fund was renamed the Hotchkis & Wiley Diversified Value Fund and the Hotchkis & Wiley All Cap Value Fund was renamed the Hotchkis & Wiley Value Opportunities Fund.
The Large Cap Value Fund and Mid-Cap Value Fund have four classes of shares: Class I, Class A, Class C and Class R. The Diversified Value Fund, Small Cap Value Fund, Global Value Fund, Value Opportunities Fund, Capital Income Fund and High Yield Fund have three classes of shares: Class I, Class A and Class C. Class A shares are sold with a front-end sales charge. Class C shares may be subject to a contingent deferred sales charge. Class C shares are automatically converted to Class A shares approximately eight years after purchase and will then be subject to lower distribution and service fees. All classes of shares have identical voting, dividend, liquidation and other rights and the same terms and conditions, except that Class A, Class C and Class R shares bear certain expenses related to the distribution and servicing expenditures. Currently, the Global Value Fund and Capital Income Fund are not offering Class C shares to investors.
Significant Accounting Policies. The Funds' financial statements have been prepared in conformity with accounting principles generally accepted in the United States of America ("U.S. GAAP"), which may require the use of management accruals and estimates. Actual results could differ from those estimates and those differences could be significant. The following is a summary of significant accounting policies followed by the Funds.
Security Valuation. Portfolio securities that are listed on a securities exchange (whether domestic or foreign) or The Nasdaq Stock Market ("NSM") (including the Nasdaq National Market and the Nasdaq Small Cap Market) are valued at the last reported sale price (or official closing price) on that day as of the close of the New York Stock Exchange (which is generally 4:00 p.m. Eastern time), or, in the absence of recorded sales, at the average between the last bid and asked quotation on such exchange or NSM. Unlisted equity securities that are not included in NSM are valued at the last sale price, or if the last sale price is unavailable, at the average of the quoted bid and asked prices in the over-the-counter market. Fixed-income securities are generally valued on the basis of quotes obtained from an approved independent pricing service but may also be valued based on reported transactions on FINRA's Trade Reporting and Compliance Engine (TRACE) or quotations provided by a broker-dealer. The pricing services may provide a price determined by a matrix pricing method or other analytical pricing models. Short-term investments which mature in 60 days or less are valued at amortized cost, which approximates fair value. Investments quoted in foreign currency are valued daily in U.S. dollars on the basis of the foreign currency exchange rate prevailing at the time of valuation. Securities and other assets for which market quotations are not readily available are valued at their fair value as determined by Hotchkis & Wiley Capital Management, LLC (the "Advisor") under guidelines established by and under the general supervision and responsibility of the Trust's Board of Trustees (the "Board"). The Board has approved the use of a third-party vendor's proprietary fair value pricing model to assist in determining current valuation for foreign securities traded in markets that close prior to the New York Stock Exchange. When fair value pricing is employed, the value of the portfolio securities used to calculate the Funds' net asset values may differ from quoted or official closing prices.
The Trust has performed an analysis of all existing investments to determine the significance and character of all inputs to their fair value determination. Various inputs are used in determining the value of each Fund's investments. These inputs are summarized in the following three broad categories:
• Level 1 — Quoted unadjusted prices for identical instruments in active markets to which the Trust has access at the date of measurement.
• Level 2 — Other significant observable inputs (including quoted prices for similar instruments, interest rates, current yields, credit quality, prepayment speeds for mortgage related securities, collateral for asset-backed securities, foreign security indices, foreign exchange rates, fair value estimates for foreign securities, and changes in benchmark securities indices). Level 2 inputs are those in markets for which there are few transactions, the prices are not current, little public information exists or instances where prices vary substantially over time or among brokered market makers.
• Level 3 — Significant unobservable inputs including model derived valuations in which one or more significant inputs or significant value drivers are unobservable. Unobservable inputs are those inputs that reflect the Trust's own assumptions that market participants would use to price the asset or liability based on the best available information.
60
The following table presents the valuation levels of each Fund's assets as of June 30, 2014:
| | Diversified
Value | | Large Cap
Value | | Mid-Cap
Value | | Small Cap
Value | |
Level 1 — Quoted prices in an active market: | |
Common Stocks | | $ | 534,467,454 | | | $ | 750,441,868 | | | $ | 3,395,834,285 | | | $ | 964,817,149 | | |
Investment Companies | | | — | | | | — | | | | — | | | | 41,159,165 | | |
Money Market Funds | | | 1,065,210 | | | | 311,269 | | | | 14,602,452 | | | | 29,977,495 | | |
Level 2 — Other significant observable market inputs: | |
Common Stocks: | |
Energy | | | — | | | | — | | | | 37,927,137 | | | | 11,437,061 | | |
Time Deposits | | | 14,952,649 | | | | 9,078,974 | | | | 180,634,012 | | | | 101,365,378 | | |
Level 3 — Significant unobservable inputs | | | — | | | | — | | | | — | | | | — | | |
Total Investments | | $ | 550,485,313 | | | $ | 759,832,111 | | | $ | 3,628,997,886 | | | $ | 1,148,756,248 | | |
| | Global
Value | | Value
Opportunities | | Capital
Income | | High Yield | |
Level 1 — Quoted prices in an active market: | |
Common Stocks | | $ | 2,588,079 | | | $ | 363,700,417 | | | $ | 37,312,677 | | | $ | 32,585,299 | | |
Investment Companies | | | — | | | | 972,135 | | | | — | | | | — | | |
Preferred Stocks | | | — | | | | 2,289,578 | | | | 1,303,385 | | | | 79,110,054 | | |
Convertible Preferred Stocks | | | — | | | | — | | | | 173,601 | | | | — | | |
Purchased Put Options | | | — | | | | 242,000 | | | | — | | | | — | | |
Warrants | | | — | | | | 3,122,840 | | | | 11,229 | | | | 1,603,491 | | |
Money Market Funds | | | — | | | | 47,320 | | | | — | | | | — | | |
Level 2 — Other significant observable market inputs: | |
Common Stocks: | |
Consumer Discretionary | | | 241,045 | | | | 8,664,683 | | | | — | | | | — | | |
Consumer Staples | | | 165,997 | | | | — | | | | — | | | | — | | |
Energy | | | 50,458 | | | | 1,674,876 | | | | | | | | | | |
Financials | | | 340,605 | | | | 42,888,933 | | | | — | | | | — | | |
Health Care | | | 118,407 | | | | — | | | | — | | | | — | | |
Industrials | | | 299,363 | | | | 24,236,322 | | | | — | | | | — | | |
Information Technology | | | 87,418 | | | | 16,743,482 | | | | — | | | | — | | |
Telecommunication Services | | | 37,471 | | | | 3,243,127 | | | | — | | | | — | | |
Utilities | | | 43,532 | | | | — | | | | — | | | | — | | |
Preferred Stocks: | |
Financials | | | — | | | | 751,887 | | | | — | | | | — | | |
Convertible Preferred Stocks: | |
Energy/Oil Field Equipment & Services | | | — | | | | — | | | | 97,653 | | | | 4,724,610 | | |
Convertible Bonds | | | — | | | | — | | | | 529,193 | | | | 29,552,334 | | |
Corporate Bonds | | | — | | | | 7,462,500 | | | | 24,531,516 | | | | 1,457,307,090 | | |
Asset-Backed Securities | | | — | | | | — | | | | 341,415 | | | | 21,942,471 | | |
Term Loans | | | — | | | | — | | | | 653,073 | | | | 47,658,028 | | |
Time Deposits | | | 29,471 | | | | 7,122,026 | | | | 1,337,059 | | | | 27,727,372 | | |
Level 3 — Significant unobservable inputs: | |
Common Stocks: | |
Consumer Discretionary/Automakers | | | — | | | | — | | | | 0 | | | | 0 | | |
Energy/Energy — Exploration & Production | | | — | | | | — | | | | 3,302 | | | | 439,205 | | |
Preferred Stocks: | |
Energy/Energy — Exploration & Production | | | — | | | | — | | | | 15,366 | | | | 2,043,921 | | |
Total Investments | | $ | 4,001,846 | | | $ | 483,162,126 | | | $ | 66,309,469 | | | $ | 1,704,693,875 | | |
Please refer to the Schedule of Investments for additional information regarding the composition of the amounts listed above.
There were transfers from Level 1 to Level 2 of $37,659 for the Global Value Fund using market values as of June 30, 2014. The transfers were due to securities being fair valued as a result of market movements following the close of local trading on June 30, 2014. There were transfers from Level 2 to Level 1 of $90,693 for the Global Value Fund using market values as of June 30, 2014. The transfers were due to the securities being fair valued as a result of market movements following the close of local trading at the beginning of the reporting period. There were transfers from Level 1 to Level 2 of $620,031 for the Value Opportunities Fund using market values as of June 30, 2014. The transfers were due to lack of trading volume on June 30, 2014.
61
There were transfers from Level 2 to Level 1 of $16,382,556 for the Value Opportunities Fund using market values as of June 30, 2014. The transfers were due to increased trading volume on June 30, 2014 and securities being fair valued as a result of market movements following the close of local trading at the beginning of the reporting period. There were no transfers into or out of Level 1 or Level 2 during the year ended June 30, 2014 for the Diversified Value Fund, Large Cap Value Fund, Mid-Cap Value Fund, Small Cap Value Fund, Capital Income Fund and High Yield Fund. Transfers between Levels are recognized at the end of the reporting period.
Commitments. Bridge loan commitments may obligate a Fund to furnish temporary financing to a borrower until permanent financing can be arranged. At June 30, 2014, the Capital Income Fund and High Yield Fund had outstanding bridge loan commitments of $375,000 and $24,550,000, respectively.
Income and Expense Allocation. Common expenses incurred by the Trust which are not allocable to a specific Fund are allocated among the Funds based upon relative net assets or evenly, depending on the nature of the expenditure. For all Funds, except the Capital Income Fund and High Yield Fund, net investment income, other than class-specific expenses, and realized and unrealized gains and losses are allocated daily to each class of shares based upon the relative net asset value of outstanding shares of each class at the beginning of the day (after adjusting for the current day's capital share activity of the respective class). For the Capital Income Fund and High Yield Fund, net investment income, other than class-specific expenses, and realized and unrealized gains and losses are allocated daily to each class of shares based upon the relative net asset value of settled shares of each class at the beginning of the day (after adjusting for the current day's capital share activity of the respective class).
Dividends and Distributions to Shareholders. Dividends and distributions to shareholders are recorded on the ex-dividend date. Dividends from net investment income are declared daily and paid monthly for the Capital Income Fund and High Yield Fund, declared and paid semi-annually for the Large Cap Value Fund and declared and paid annually for the Diversified Value Fund, Mid-Cap Value Fund, Small Cap Value Fund, Global Value Fund and Value Opportunities Fund. Distributions of net realized capital gains, if any, will be declared and paid at least annually.
Security Transactions and Investment Income. Security and shareholder transactions are recorded on trade date. Realized gains and losses on sales of investments are calculated on the specifically identified cost basis of the securities. Dividend income, less foreign taxes withheld, if any, are recorded on the ex-dividend date. Interest income is recognized on the accrual basis. Market discounts, premiums and original issue discounts on fixed-income securities are amortized daily over the expected life of the security using the effective yield method. Return of capital distributions received from real estate investment trust ("REIT") securities are recorded as an adjustment to the cost of the security and thus may impact unrealized gains or losses on the security.
Securities purchased or sold on a when-issued, delayed delivery or forward commitment basis may have extended settlement periods. The value of the security purchased is subject to market fluctuations during this period. The Funds will segregate or "earmark" liquid assets until the settlement date or otherwise cover their position in an amount sufficient to meet the Funds' obligations.
Foreign Currency Transactions. Securities and other assets and liabilities denominated in foreign currencies are translated into U.S. dollar amounts at the date of valuation. Purchases and sales of securities and income and expense items denominated in foreign currencies are translated into U.S. dollar amounts on the respective dates of such transactions. The Funds isolate the portion of realized gains or losses resulting from changes in foreign exchange rates on securities from the fluctuations arising from changes in market prices of securities held. Reported net realized foreign exchange gains or losses arise from sales of securities, currency gains or losses realized between the trade and settlement dates on securities transactions and the difference between the amounts of dividends, interest and foreign withholding taxes recorded on the Funds' books and the U.S. dollar equivalent of the amounts actually received or paid.
Payment In-Kind Securities. Certain Funds may invest in payment in-kind securities. Payment in-kind securities give the issuer the option at each interest payment date of making interest payments in either cash or additional debt securities. Those additional debt securities usually have the same terms, including maturity dates and interest rates, and associated risks as the original bonds. The daily market quotations of the original bonds may include the accrued interest (referred to as a dirty price) and may require a pro-rata adjustment to interest receivable from the unrealized appreciation or depreciation of securities on the Statements of Assets & Liabilities.
Restricted and Illiquid Securities. The Funds may invest in securities that are subject to legal or contractual restrictions on resale or are illiquid. Restricted securities generally may be resold in transactions exempt from registration. An illiquid security is a security which cannot be disposed of promptly (within seven days) and in the usual course of business at approximately its fair value and includes repurchase agreements maturing in excess of seven days, time deposits with a withdrawal penalty, non-negotiable instruments and instruments for which no market exists. Disposal of these securities may involve time-consuming negotiations and expense, and prompt sale at the current valuation may be difficult.
Options. The Funds are subject to equity price risk in the normal course of pursuing their investment objectives. The Funds may purchase put options on securities to protect holdings in an underlying or related security against a substantial decline in market value. The Funds may purchase call options on securities and security indexes. A Fund may write a call or put option only if the option is "covered" by the Fund holding a position in the underlying securities or by other means which would permit immediate satisfaction of the Fund's obligation as writer of the option. Prior to exercise or expiration, an option may be closed by an offsetting purchase or sale of an option of the same series. The purchase and writing of options involves certain risks. If a put or call option purchased by a Fund is not sold when it has remaining value, and if the market price of the underlying security, in the case of a put, remains equal to or greater than the exercise price or, in the case of a call, remains less than or equal to the exercise price, the Fund will lose its entire investment in the option. There can be no assurance that a liquid market will exist when a Fund seeks to close out an option position. Furthermore, if trading restrictions or suspensions are imposed on the options markets, the Fund may be unable to close out a position. With options, there is minimal counterparty risk to the Funds since options are exchange traded and the exchange's clearinghouse, as counterparty to all exchange traded options, guarantees the options against default.
When a Fund purchases a put or call option, an amount equal to the premium paid is included on the Statements of Assets & Liabilities as an investment, and is subsequently adjusted to reflect the fair market value of the option. If an option expires on the stipulated expiration date or if the Fund enters into a closing sale transaction, a gain or loss is realized. If the Fund exercises a put option, a gain or loss is realized from the sale of the underlying security, and the proceeds from such sale are decreased by the premium originally paid. If the Fund exercises a call option, the cost of the security acquired is increased by the premium paid for the call.
62
Credit Default Swap Contracts. The High Yield Fund may enter into credit default swap agreements for purposes of attempting to obtain a particular desired return at a lower cost to the Fund than if the Fund had invested directly in an instrument that yielded the desired return. The buyer in a credit default swap is obligated to pay the seller a periodic stream of payments over the term of the contract provided no event of default on an underlying reference obligation has occurred. In the event of default, the seller must pay the buyer the full notional amount ("par value") of the underlying reference obligation in exchange for the underlying reference obligation. Credit default swaps involve greater risks than if the Fund invested in the reference obligation directly. In addition to general market risks, credit default swaps are subject to illiquidity risk, counterparty risk and credit risk. The Fund's maximum risk of loss from counterparty risk, either as the protection seller or as the protection buyer, is the fair value of the contract. This risk is mitigated by having a master netting arrangement between the Fund and the counterparty and by the posting of collateral by the counterparty to the Fund to cover the Fund's exposure to the counterparty.
The High Yield Fund is party to an International Swap Dealers Association, Inc. Master Agreement ("ISDA Master Agreement") with JPMorgan Chase Bank, N.A. that governs transactions, such as over-the-counter swap contracts, entered into by the Fund and the counterparty. The ISDA Master Agreement contains provisions for general obligations, representations, agreements, collateral and events of default or termination. Events of termination include conditions that may entitle the counterparty to elect to terminate early and cause settlement of all outstanding transactions under the ISDA Master Agreement.
Upon entering into swap agreements, the High Yield Fund will either receive or pay an upfront payment based upon the difference between the current principal amount and the notional amount of the swap and whether the Fund is buying or selling protection. Upfront payments that are received are recorded as liabilities while upfront payments paid are recorded as assets. These payments remain on the books until the swap contract is closed. When entering into credit default swaps, the Fund will either deliver collateral to the counterparty or the counterparty will deliver collateral to the Fund. The amount of this collateral is calculated based upon the notional value and the current price of the swap. In the event of default, the Fund has recourse against any collateral posted to it by the counterparty. When entering into swap agreements as a seller, the notional amounts would be partially offset by any recovery values of the respective reference obligations, upfront payments received upon entering into the agreement, or net amounts received from the settlement of buy protection credit default swap agreements entered into by the Fund for the same reference entity. Unrealized appreciation or depreciation is recorded daily as the difference between the prior day and current day closing price.
The High Yield Fund did not enter into any credit default swap contracts during the year ended June 30, 2014.
Derivative Instruments. The Funds have adopted authoritative standards regarding disclosures about derivatives and how they affect the Funds' Statements of Assets & Liabilities and Statements of Operations.
The following is a summary of the location of derivative instruments on the Funds' Statements of Assets & Liabilities as of June 30, 2014:
Derivative Type | | Asset Derivatives | |
Equity Contracts: | |
Purchased Put Options | | Long-term investments | |
The following is a summary of the Funds' derivative instrument holdings categorized by primary risk exposure as of June 30, 2014:
Asset Derivatives
| | | Value Opportunities | |
Equity Contracts: | |
| Purchased Put Options | | $ | 242,000 | | |
The following is a summary of the Funds' realized gains (losses) and change in unrealized appreciation (depreciation) on derivative instruments recognized in the Statements of Operations categorized by primary risk exposure for the year ended June 30, 2014:
Realized Gains (Losses) on Derivatives
| | | Value Opportunities | |
Equity Contracts: | |
| Purchased Put Options | | $ | (57,802 | )* | |
* Included with net realized gains from sales of unaffiliated issuers.
Change in Unrealized Appreciation (Depreciation) on Derivatives
| | | Value Opportunities | |
Equity Contracts: | |
| Purchased Put Options | | $ | (1,177,273 | )* | |
* Included with net change in unrealized appreciation of securities and foreign currency transactions.
63
The following is a summary of the Funds' average quarterly balance of outstanding derivative instruments categorized by primary risk exposure for the year ended June 30, 2014:
Average Quarterly Balance of Outstanding Derivatives
| | | Value Opportunities | |
Equity Contracts: | |
Average Number of Contracts —
Purchased Put Options | | | 2,050 | | |
Average Market Value —
Purchased Put Options | | $ | 1,166,070 | | |
Offsetting Assets and Liabilities. The Funds are subject to various master netting arrangements, which govern the terms of certain transactions with counterparties. The arrangements allow the Funds to close out and net their total exposure to a counterparty in the event of a default with respect to all the transactions governed under a single agreement with a counterparty.
The following is a summary of the arrangements subject to offsetting as of June 30, 2014:
| | | | | | | | Gross Amounts Not Offset in the
Statements of Assets & Liabilities | |
| Liabilities | | Gross Amounts | | Gross Amounts
Offset in the
Statements of
Assets &
Liabilities | | Net Amounts
Presented in the
Statements of
Assets &
Liabilities | | Financial
Instruments | | Collateral
Pledged | | Net Amount | |
Securities Lending: | |
Diversified Value | | $ | 1,065,210 | | | $ | — | | | $ | 1,065,210 | | | $ | 1,065,210 | | | $ | — | | | $ | — | | |
Large Cap Value | | | 311,269 | | | | — | | | | 311,269 | | | | 311,269 | | | | — | | | | — | | |
Mid-Cap Value | | | 14,602,452 | | | | — | | | | 14,602,452 | | | | 14,602,452 | | | | — | | | | — | | |
Small Cap Value | | | 29,977,495 | | | | — | | | | 29,977,495 | | | | 29,977,495 | | | | — | | | | — | | |
Value Opportunities | | | 47,320 | | | | — | | | | 47,320 | | | | 47,320 | | | | — | | | | — | | |
NOTE 2.
Fees and Transactions with Affiliates. The Trust has entered into Investment Advisory Agreements for each of the Funds with the Advisor, with which the officers and a Trustee of the Trust are affiliated. The Advisor is a limited liability company, the primary members of which are HWCap Holdings, a limited liability company with members who are current and former employees of the Advisor, and Stephens - H&W, LLC, a limited liability company whose primary member is SF Holding Corp., which is a diversified holding company. The Advisor is responsible for the management of the Funds' investments and provides the personnel, facilities, equipment and certain other services necessary to the operations of each Fund. The Advisor receives a fee, computed daily and payable monthly, at the annual rates presented below as applied to each Fund's daily net assets. The Advisor has contractually agreed to waive fees or reimburse regular operating expenses in excess of the annual rates presented below as applied to such Fund's daily net assets through October 31, 2015.
| | | Diversified
Value | | Large Cap
Value | | Mid-Cap
Value | | Small Cap
Value | | Global
Value | | Value
Opportunities | | Capital
Income | | High
Yield | |
Annual Advisory Fee Rate | | | 0.75 | %1 | | | 0.75 | %1 | | | 0.75 | %1 | | | 0.75 | % | | | 0.80 | % | | | 0.75 | % | | | 0.65 | % | | | 0.55 | % | |
Annual cap on expenses —
Class I | | | 0.95 | % | | | 1.05 | % | | | 1.15 | % | | | 1.25 | % | | | 1.10 | % | | | 1.25 | % | | | 0.80 | % | | | 0.70 | % | |
Annual cap on expenses —
Class A | | | 1.20 | % | | | 1.30 | % | | | 1.40 | % | | | 1.50 | % | | | 1.35 | % | | | 1.50 | % | | | 1.05 | % | | | 0.95 | % | |
Annual cap on expenses —
Class C | | | 1.95 | % | | | 2.05 | % | | | 2.15 | % | | | 2.25 | % | | | 2.10 | % | | | 2.25 | % | | | 1.80 | % | | | 1.70 | % | |
Annual cap on expenses —
Class R | | | N/A | | | | 1.55 | % | | | 1.65 | % | | | N/A | | | | N/A | | | | N/A | | | | N/A | | | | N/A | | |
1 The Annual Advisory Fee Rate is 0.75% for the first $5 billion in assets, 0.65% for the next $5 billion in assets and 0.60% for assets over $10 billion.
Quasar Distributors, LLC is the principal underwriter and distributor for the shares of the Funds ("Quasar" or the "Distributor"). The Distributor is affiliated with the Funds' transfer agent, fund accountant and administrator, U.S. Bancorp Fund Services, LLC. Pursuant to the Distribution Plan adopted by the Trust in accordance with Rule 12b-1 under the 1940 Act, the Funds pay the Distributor ongoing distribution and service fees. The fees are accrued daily at the annual rates based upon the average daily net assets of the shares as follows:
| | | Distribution and Service
Fee | |
Class A | | | 0.25 | % | |
Class C | | | 1.00 | % | |
Class R | | | 0.50 | % | |
64
Pursuant to separate agreements with the Distributor, selected dealers and other financial intermediaries also provide distribution services to the Funds. The ongoing distribution and service fee compensates the Distributor and selected dealers for providing distribution-related and shareholder services to Class A, Class C and Class R shareholders.
Certain selected dealers and other financial intermediaries charge a fee for shareholder accounting services and administrative services that they provide to the Funds on behalf of certain shareholders; the portion of this fee paid by the Funds is included within "Transfer agent fees and expenses" in the Statements of Operations.
Stephens Inc. is an affiliated broker-dealer of the Funds. For the year ended June 30, 2014, Stephens Inc. received the following amounts of front-end sales charges for Class A shares:
Diversified
Value | | Large Cap
Value | | Mid-Cap
Value | | Small Cap
Value | | Global
Value | | Value
Opportunities | | Capital
Income | | High Yield | |
$ | — | | | $ | 214 | | | $ | 6,261 | | | $ | 1,900 | | | $ | — | | | $ | 10,646 | | | $ | — | | | $ | 375 | | |
U.S. Bancorp Fund Services, LLC, the Funds' administrator, agreed to waive a portion of its administration and accounting fees during the Global Value Fund's first twelve months of operations.
NOTE 3.
Investments. Purchases and sales of investment securities, excluding short-term investments, for the year ended June 30, 2014 were as follows:
| | Diversified
Value | | Large Cap
Value | | Mid-Cap
Value | | Small Cap
Value | | Global
Value | | Value
Opportunities | | Capital
Income | | High Yield | |
Purchases | | $ | 184,003,647 | | | $ | 449,161,058 | | | $ | 2,250,190,358 | | | $ | 567,831,206 | | | $ | 3,024,139 | | | $ | 326,044,131 | | | $ | 53,708,617 | | | $ | 1,255,053,058 | | |
Sales | | | 150,922,392 | | | | 395,256,115 | | | | 1,512,391,659 | | | | 343,681,528 | | | | 1,626,043 | | | | 153,521,175 | | | | 17,406,147 | | | | 699,405,350 | | |
The Funds did not have any purchases or sales of U.S. Government securities for the year ended June 30, 2014.
NOTE 4.
Federal Income Taxes. It is each Fund's policy to comply with the requirements of the Internal Revenue Code applicable to regulated investment companies and each Fund intends to distribute substantially all of its investment company net taxable income and net capital gains to shareholders. Therefore, no federal income tax provision is required. Under the applicable foreign tax law, a withholding tax may be imposed on interest, dividends and capital gains at various rates.
Distributions paid to shareholders are based on net investment income and net realized gains determined on a tax basis, which may differ from net investment income and net realized gains for financial reporting purposes. The fiscal year in which amounts are distributed may differ from the year in which the net investment income and net realized gains are recorded by the Funds for financial reporting purposes. The Funds may utilize earnings and profits distributed to shareholders on redemptions of shares as part of the dividends paid deduction. Generally accepted accounting principles require that permanent financial reporting and tax differences be reclassified within the capital accounts.
The following information is presented on an income tax basis as of June 30, 2014:
| | | Diversified
Value | | Large Cap
Value | | Mid-Cap
Value | | Small Cap
Value | | Global
Value | | Value
Opportunities | | Capital
Income | | High Yield | |
Tax cost of
investments | | $ | 483,035,610 | | | $ | 716,210,653 | | | $ | 2,984,900,978 | | | $ | 855,117,422 | | | $ | 3,473,454 | | | $ | 406,940,038 | | | $ | 60,750,062 | | | $ | 1,604,921,235 | | |
Gross unrealized
appreciation | | | 107,401,829 | | | | 118,710,426 | | | | 548,511,593 | | | | 200,228,178 | | | | 618,453 | | | | 80,631,079 | | | | 4,863,359 | | | | 78,007,722 | | |
Gross unrealized
depreciation | | | (55,969,985 | ) | | | (84,479,211 | ) | | | (99,651,149 | ) | | | (37,932,225 | ) | | | (119,532 | ) | | | (11,578,337 | ) | | | (641,011 | ) | | | (5,962,454 | ) | |
Net unrealized
appreciation | | | 51,431,844 | | | | 34,231,215 | | | | 448,860,444 | | | | 162,295,953 | | | | 498,921 | | | | 69,052,742 | | | | 4,222,348 | | | | 72,045,268 | | |
Distributable ordinary
income
(as of 6/30/14) | | | 12,803,931 | | | | 21,716,657 | | | | 15,507,469 | | | | 16,870,733 | | | | 151,966 | | | | 3,710,228 | | | | 693,278 | | | | 3,150,873 | | |
Distributable long-term
gains (as of 6/30/14) | | | — | | | | — | | | | 203,444,316 | | | | 67,308,763 | | | | 110,149 | | | | 15,438,543 | | | | 581,582 | | | | 14,239,657 | | |
Total distributable
earnings | | | 12,803,931 | | | | 21,716,657 | | | | 218,951,785 | | | | 84,179,496 | | | | 262,115 | | | | 19,148,771 | | | | 1,274,860 | | | | 17,390,530 | | |
Other accumulated
gains (losses) | | | (700,479,292 | ) | | | (1,137,533,902 | ) | | | — | | | | (296 | ) | | | 50 | | | | 284 | | | | (11,990 | ) | | | (1,684,695 | ) | |
Total accumulated
gains (losses) | | $ | (636,243,517 | ) | | $ | (1,081,586,030 | ) | | $ | 667,812,229 | | | $ | 246,475,153 | | | $ | 761,086 | | | $ | 88,201,797 | | | $ | 5,485,218 | | | $ | 87,751,103 | | |
65
As of the close of business on December 31, 2010, in exchange for shares the Advisor transferred assets valued at $3,298,650 to the Capital Income Fund. As a result of the tax-deferred transfers, the Capital Income Fund acquired $30,179 of unrealized appreciation for tax purposes. As of June 30, 2014, the Capital Income Fund held securities with $11,912 of net unrealized appreciation relating to the transfers.
As of the close of business on December 31, 2012, in exchange for shares the Advisor transferred assets valued at $1,132,946 to the Global Value Fund. As a result of the tax-deferred transfers, the Global Value Fund acquired $50,230 of unrealized appreciation for tax purposes. As of June 30, 2014, the Global Value Fund held securities with $36,042 of net unrealized appreciation relating to the transfers.
On the Statements of Assets & Liabilities, the following adjustments were made for permanent tax differences. These differences are due primarily to differing treatment for items such as paydowns, consent income, foreign currency gain/loss transactions, PFICs, redemptions in-kind and transfers in-kind.
| | Paid-In
Capital | | Undistributed
Net Investment
Income (Loss) | | Undistributed
Net Realized
Gain (Loss) | |
Diversified Value | | $ | — | | | $ | 114 | | | $ | (114 | ) | |
Large Cap Value | | | 6,760,806 | | | | — | | | | (6,760,806 | ) | |
Mid-Cap Value | | | 23,297,476 | | | | (95,313 | ) | | | (23,202,163 | ) | |
Small Cap Value | | | — | | | | (49,469 | ) | | | 49,469 | | |
Global Value | | | — | | | | 5,490 | | | | (5,490 | ) | |
Value Opportunities | | | — | | | | (33,766 | ) | | | 33,766 | | |
Capital Income | | | — | | | | (4,917 | ) | | | 4,917 | | |
High Yield | | | — | | | | (744,171 | ) | | | 744,171 | | |
The tax components of distributions paid during the fiscal years ended June 30, 2014 and 2013, capital loss carryovers as of June 30, 2014, and tax basis late year losses as of June 30, 2014, which are not recognized for tax purposes until the first day of the following fiscal year, are:
| | | June 30, 2014 | | June 30, 2013 | |
| | | Ordinary
Income
Distributions | | Long-Term
Capital Gains
Distributions | | Net Capital
Loss
Carryovers | | Capital Loss
Carryovers
Utilized | | Late
Year
Losses | | Ordinary
Income
Distributions | | Long-Term
Capital Gains
Distributions | |
| Diversified Value | | $ | 5,434,850 | | | $ | — | | | $ | (700,479,292 | )1 | | $ | 33,359,494 | | | $ | — | | | $ | 5,634,844 | | | $ | — | | |
| Large Cap Value | | | 7,984,056 | | | | — | | | | (1,137,533,902 | )2 | | | 78,068,795 | | | | — | | | | 12,016,314 | | | | — | | |
| Mid-Cap Value | | | 7,653,890 | | | | — | | | | — | | | | 182,050,303 | | | | — | | | | 5,658,174 | | | | — | | |
| Small Cap Value | | | 21,241,525 | | | | 45,475,686 | | | | — | | | | — | | | | — | | | | 2,052,328 | | | | — | | |
| Global Value* | | | 163,376 | | | | 59,905 | | | | — | | | | — | | | | — | | | | — | | | | — | | |
| Value Opportunities | | | 11,464,397 | | | | 8,548,334 | | | | — | | | | — | | | | — | | | | 3,829,055 | | | | 2,430,096 | | |
| Capital Income | | | 1,996,888 | | | | 585,393 | | | | — | | | | — | | | | — | | | | 803,220 | | | | 127,849 | | |
| High Yield | | | 86,349,686 | | | | 8,682,719 | | | | — | | | | — | | | | — | | | | 53,317,108 | | | | 386,023 | | |
* The Fund commenced operations on December 31, 2012.
1 $458,942,031 expires on 6/30/2017 and $241,537,261 expires on 6/30/2018.
2 $674,684,050 expires on 6/30/2017, $442,596,438 expires on 6/30/2018 and $20,253,414 is long-term with no expiration.
As of and during the year ended June 30, 2014, the Funds did not have a liability for any unrecognized tax benefits. The Funds recognize interest and penalties, if any, related to unrecognized tax benefits as income tax expense in the Statements of Operations. During the year ended June 30, 2014, the Funds did not incur any interest or penalties. The tax years ended June 30, 2011 through June 30, 2014 remain open and subject to examination by tax jurisdictions.
NOTE 5.
Capital Share Transactions. Transactions in capital shares for each class were as follows:
| | | Sales | | Reinvestment of
dividends
and distributions | | Redemptions | | Net increase (decrease) | |
| | Shares | | Amount | | Shares | | Amount | | Shares | | Amount | | Shares | | Amount | |
Year Ended June 30, 2014 | |
Diversified Value Fund | |
Class I | | | 7,744,855 | | | $ | 109,380,942 | | | | 355,404 | | | $ | 4,858,367 | | | | (6,078,279 | ) | | $ | (84,688,097 | ) | | | 2,021,980 | | | $ | 29,551,212 | | |
Class A | | | 1,428,704 | | | | 20,377,139 | | | | 16,116 | | | | 221,112 | | | | (431,099 | ) | | | (6,148,279 | ) | | | 1,013,721 | | | | 14,449,972 | | |
Class C | | | 159,950 | | | | 2,292,863 | | | | 2,404 | | | | 32,478 | | | | (827,659 | ) | | | (11,448,396 | ) | | | (665,305 | ) | | | (9,123,055 | ) | |
Total net increase
(decrease) | | | 9,333,509 | | | | 132,050,944 | | | | 373,924 | | | | 5,111,957 | | | | (7,337,037 | ) | | | (102,284,772 | ) | | | 2,370,396 | | | | 34,878,129 | | |
66
| | | Sales | | Reinvestment of
dividends
and distributions | | Redemptions | | Net increase (decrease) | |
| | | Shares | | Amount | | Shares | | Amount | | Shares | | Amount | | Shares | | Amount | |
Year Ended June 30, 2014 | |
Large Cap Value Fund | |
Class I# | | | 5,749,044 | | | $ | 139,610,226 | | | | 240,030 | | | $ | 5,467,702 | | | | (5,457,112 | ) | | $ | (132,675,487 | ) | | | 531,962 | | | $ | 12,402,441 | | |
Class A | | | 9,882,786 | | | | 236,147,761 | | | | 79,926 | | | | 1,820,889 | | | | (8,894,700 | ) | | | (226,227,261 | ) | | | 1,068,012 | | | | 11,741,389 | | |
Class C | | | 825,187 | | | | 20,438,064 | | | | — | | | | — | | | | (234,290 | ) | | | (5,206,458 | ) | | | 590,897 | | | | 15,231,606 | | |
Class R | | | 131,904 | | | | 3,230,512 | | | | 2,719 | | | | 61,986 | | | | (135,322 | ) | | | (3,296,728 | ) | | | (699 | ) | | | (4,230 | ) | |
Total net increase
(decrease) | | | 16,588,921 | | | | 399,426,563 | | | | 322,675 | | | | 7,350,577 | | | | (14,721,424 | ) | | | (367,405,934 | ) | | | 2,190,172 | | | | 39,371,206 | | |
Mid-Cap Value Fund | |
Class I+ | | | 21,696,406 | | | | 871,718,154 | | | | 146,545 | | | | 5,713,799 | | | | (11,553,595 | ) | | | (458,599,113 | ) | | | 10,289,356 | | | | 418,832,840 | | |
Class A | | | 13,471,669 | | | | 527,734,790 | | | | 26,702 | | | | 1,029,893 | | | | (5,792,950 | ) | | | (231,877,240 | ) | | | 7,705,421 | | | | 296,887,443 | | |
Class C | | | 2,236,257 | | | | 80,275,539 | | | | 1,722 | | | | 61,387 | | | | (413,830 | ) | | | (15,332,771 | ) | | | 1,824,149 | | | | 65,004,155 | | |
Class R | | | 407,203 | | | | 16,150,512 | | | | 328 | | | | 12,716 | | | | (133,076 | ) | | | (5,454,447 | ) | | | 274,455 | | | | 10,708,781 | | |
Total net increase
(decrease) | | | 37,811,535 | | | | 1,495,878,995 | | | | 175,297 | | | | 6,817,795 | | | | (17,893,451 | ) | | | (711,263,571 | ) | | | 20,093,381 | | | | 791,433,219 | | |
Small Cap Value Fund | |
Class I | | | 5,098,049 | | | | 314,352,463 | | | | 470,827 | | | | 27,129,048 | | | | (2,026,594 | ) | | | (122,912,360 | ) | | | 3,542,282 | | | | 218,569,151 | | |
Class A | | | 1,904,596 | | | | 113,780,688 | | | | 172,679 | | | | 9,910,020 | | | | (885,511 | ) | | | (53,985,558 | ) | | | 1,191,764 | | | | 69,705,150 | | |
Class C | | | 255,485 | | | | 13,599,999 | | | | 38,776 | | | | 1,989,199 | | | | (144,442 | ) | | | (7,887,690 | ) | | | 149,819 | | | | 7,701,508 | | |
Total net increase
(decrease) | | | 7,258,130 | | | | 441,733,150 | | | | 682,282 | | | | 39,028,267 | | | | (3,056,547 | ) | | | (184,785,608 | ) | | | 4,883,865 | | | | 295,975,809 | | |
Global Value Fund^ | |
Class I | | | 96,113 | | | | 1,186,409 | | | | 18,286 | | | | 217,239 | | | | (5 | ) | | | (57 | ) | | | 114,394 | | | | 1,403,591 | | |
Class A* | | | 14,418 | | | | 177,759 | | | | 509 | | | | 6,042 | | | | (4,639 | ) | | | (59,304 | ) | | | 10,288 | | | | 124,497 | | |
Total net increase
(decrease) | | | 110,531 | | | | 1,364,168 | | | | 18,795 | | | | 223,281 | | | | (4,644 | ) | | | (59,361 | ) | | | 124,682 | | | | 1,528,088 | | |
Value Opportunities Fund | |
Class I | | | 6,194,679 | | | | 171,363,951 | | | | 257,248 | | | | 6,693,591 | | | | (1,714,640 | ) | | | (46,620,103 | ) | | | 4,737,287 | | | | 131,437,439 | | |
Class A | | | 3,040,252 | | | | 83,179,115 | | | | 271,861 | | | | 7,081,981 | | | | (1,844,426 | ) | | | (50,639,664 | ) | | | 1,467,687 | | | | 39,621,432 | | |
Class C | | | 948,954 | | | | 24,833,474 | | | | 63,510 | | | | 1,573,783 | | | | (192,233 | ) | | | (4,971,988 | ) | | | 820,231 | | | | 21,435,269 | | |
Total net increase
(decrease) | | | 10,183,885 | | | | 279,376,540 | | | | 592,619 | | | | 15,349,355 | | | | (3,751,299 | ) | | | (102,231,755 | ) | | | 7,025,205 | | | | 192,494,140 | | |
Capital Income Fund | |
Class I | | | 695,228 | | | | 8,753,519 | | | | 88,601 | | | | 1,069,520 | | | | (77,827 | ) | | | (972,432 | ) | | | 706,002 | | | | 8,850,607 | | |
Class A | | | 3,016,388 | | | | 38,848,961 | | | | 105,366 | | | | 1,315,164 | | | | (636,055 | ) | | | (8,002,381 | ) | | | 2,485,699 | | | | 32,161,744 | | |
Total net increase
(decrease) | | | 3,711,616 | | | | 47,602,480 | | | | 193,967 | | | | 2,384,684 | | | | (713,882 | ) | | | (8,974,813 | ) | | | 3,191,701 | | | | 41,012,351 | | |
High Yield Fund | |
Class I | | | 61,610,168 | | | | 808,808,659 | | | | 2,841,519 | | | | 37,371,762 | | | | (33,689,737 | ) | | | (442,645,361 | ) | | | 30,761,950 | | | | 403,535,060 | | |
Class A | | | 23,547,659 | | | | 307,102,686 | | | | 2,407,130 | | | | 31,417,283 | | | | (12,433,132 | ) | | | (162,023,620 | ) | | | 13,521,657 | | | | 176,496,349 | | |
Class C | | | 228,350 | | | | 3,000,722 | | | | 3,904 | | | | 51,262 | | | | (24,458 | ) | | | (323,033 | ) | | | 207,796 | | | | 2,728,951 | | |
Total net increase
(decrease) | | | 85,386,177 | | | | 1,118,912,067 | | | | 5,252,553 | | | | 68,840,307 | | | | (46,147,327 | ) | | | (604,992,014 | ) | | | 44,491,403 | | | | 582,760,360 | | |
Year Ended June 30, 2013 | |
Diversified Value Fund | |
Class I | | | 6,471,116 | | | | 72,259,012 | | | | 488,180 | | | | 5,057,545 | | | | (10,261,980 | ) | | | (116,009,525 | ) | | | (3,302,684 | ) | | | (38,692,968 | ) | |
Class A | | | 185,071 | | | | 2,068,771 | | | | 18,221 | | | | 189,858 | | | | (922,077 | ) | | | (9,819,624 | ) | | | (718,785 | ) | | | (7,560,995 | ) | |
Class C | | | 16,745 | | | | 188,155 | | | | 6,701 | | | | 68,816 | | | | (308,056 | ) | | | (3,386,514 | ) | | | (284,610 | ) | | | (3,129,543 | ) | |
Total net increase
(decrease) | | | 6,672,932 | | | | 74,515,938 | | | | 513,102 | | | | 5,316,219 | | | | (11,492,113 | ) | | | (129,215,663 | ) | | | (4,306,079 | ) | | | (49,383,506 | ) | |
67
| | | Sales | | Reinvestment of
dividends
and distributions | | Redemptions | | Net increase (decrease) | |
| | | Shares | | Amount | | Shares | | Amount | | Shares | | Amount | | Shares | | Amount | |
Year Ended June 30, 2013 | |
Large Cap Value Fund | |
Class I | | | 3,144,779 | | | $ | 59,110,547 | | | | 475,977 | | | $ | 8,056,466 | | | | (4,203,790 | ) | | $ | (76,654,368 | ) | | | (583,034 | ) | | $ | (9,487,355 | ) | |
Class A | | | 1,720,129 | | | | 32,846,375 | | | | 157,478 | | | | 2,644,346 | | | | (3,847,739 | ) | | | (69,308,071 | ) | | | (1,970,132 | ) | | | (33,817,350 | ) | |
Class C | | | 59,382 | | | | 1,125,919 | | | | 8,054 | | | | 132,128 | | | | (1,135,423 | ) | | | (20,864,500 | ) | | | (1,067,987 | ) | | | (19,606,453 | ) | |
Class R | | | 104,162 | | | | 2,007,621 | | | | 8,024 | | | | 135,124 | | | | (308,479 | ) | | | (5,596,900 | ) | | | (196,293 | ) | | | (3,454,155 | ) | |
Total net increase
(decrease) | | | 5,028,452 | | | | 95,090,462 | | | | 649,533 | | | | 10,968,064 | | | | (9,495,431 | ) | | | (172,423,839 | ) | | | (3,817,446 | ) | | | (66,365,313 | ) | |
Mid-Cap Value Fund | |
Class I | | | 14,314,188 | | | | 446,529,217 | | | | 178,009 | | | | 5,005,616 | | | | (9,161,030 | ) | | | (274,963,950 | ) | | | 5,331,167 | | | | 176,570,883 | | |
Class A | | | 6,370,401 | | | | 199,939,977 | | | | 11,618 | | | | 323,681 | | | | (3,178,760 | ) | | | (92,657,220 | ) | | | 3,203,259 | | | | 107,606,438 | | |
Class C | | | 1,506,613 | | | | 44,515,181 | | | | — | | | | — | | | | (201,735 | ) | | | (5,462,343 | ) | | | 1,304,878 | | | | 39,052,838 | | |
Class R | | | 188,039 | | | | 5,803,409 | | | | 116 | | | | 3,239 | | | | (94,760 | ) | | | (2,851,148 | ) | | | 93,395 | | | | 2,955,500 | | |
Total net increase
(decrease) | | | 22,379,241 | | | | 696,787,784 | | | | 189,743 | | | | 5,332,536 | | | | (12,636,285 | ) | | | (375,934,661 | ) | | | 9,932,699 | | | | 326,185,659 | | |
Small Cap Value Fund | |
Class I | | | 2,806,490 | | | | 137,041,351 | | | | 23,403 | | | | 1,042,119 | | | | (1,661,079 | ) | | | (79,873,758 | ) | | | 1,168,814 | | | | 58,209,712 | | |
Class A | | | 1,320,718 | | | | 66,218,822 | | | | 1,804 | | | | 80,202 | | | | (387,537 | ) | | | (18,635,975 | ) | | | 934,985 | | | | 47,663,049 | | |
Class C | | | 353,686 | | | | 15,899,756 | | | | — | | | | — | | | | (61,767 | ) | | | (2,702,341 | ) | | | 291,919 | | | | 13,197,415 | | |
Total net increase
(decrease) | | | 4,480,894 | | | | 219,159,929 | | | | 25,207 | | | | 1,122,321 | | | | (2,110,383 | ) | | | (101,212,074 | ) | | | 2,395,718 | | | | 119,070,176 | | |
Global Value Fund^ | |
Class I** | | | 176,148 | | | | 1,765,198 | | | | — | | | | — | | | | — | | | | — | | | | 176,148 | | | | 1,765,198 | | |
Total net increase | | | 176,148 | | | | 1,765,198 | | | | — | | | | — | | | | — | | | | — | | | | 176,148 | | | | 1,765,198 | | |
Value Opportunities Fund | |
Class I | | | 2,367,559 | | | | 56,521,333 | | | | 119,702 | | | | 2,524,516 | | | | (359,895 | ) | | | (8,382,773 | ) | | | 2,127,366 | | | | 50,663,076 | | |
Class A | | | 3,072,499 | | | | 72,103,090 | | | | 97,497 | | | | 2,060,109 | | | | (660,704 | ) | | | (15,107,189 | ) | | | 2,509,292 | | | | 59,056,010 | | |
Class C | | | 664,228 | | | | 14,982,804 | | | | 20,205 | | | | 408,539 | | | | (246,114 | ) | | | (5,397,763 | ) | | | 438,319 | | | | 9,993,580 | | |
Total net increase
(decrease) | | | 6,104,286 | | | | 143,607,227 | | | | 237,404 | | | | 4,993,164 | | | | (1,266,713 | ) | | | (28,887,725 | ) | | | 5,074,977 | | | | 119,712,666 | | |
Capital Income Fund | |
Class I | | | 181,207 | | | | 2,090,478 | | | | 44,816 | | | | 498,973 | | | | (79,623 | ) | | | (926,634 | ) | | | 146,400 | | | | 1,662,817 | | |
Class A | | | 1,569,636 | | | | 18,047,082 | | | | 32,580 | | | | 377,198 | | | | (502,104 | ) | | | (5,779,273 | ) | | | 1,100,112 | | | | 12,645,007 | | |
Total net increase
(decrease) | | | 1,750,843 | | | | 20,137,560 | | | | 77,396 | | | | 876,171 | | | | (581,727 | ) | | | (6,705,907 | ) | | | 1,246,512 | | | | 14,307,824 | | |
High Yield Fund | |
Class I | | | 40,995,362 | | | | 526,715,718 | | | | 1,698,071 | | | | 21,866,166 | | | | (23,852,918 | ) | | | (307,769,702 | ) | | | 18,840,515 | | | | 240,812,182 | | |
Class A | | | 27,968,727 | | | | 360,792,431 | | | | 1,091,186 | | | | 14,032,120 | | | | (5,537,001 | ) | | | (71,257,276 | ) | | | 23,522,912 | | | | 303,567,275 | | |
Class C** | | | 74,728 | | | | 972,593 | | | | 680 | | | | 8,878 | | | | (12,078 | ) | | | (157,098 | ) | | | 63,330 | | | | 824,373 | | |
Total net increase
(decrease) | | | 69,038,817 | | | | 888,480,742 | | | | 2,789,937 | | | | 35,907,164 | | | | (29,401,997 | ) | | | (379,184,076 | ) | | | 42,426,757 | | | | 545,203,830 | | |
# Includes an in-kind redemption which resulted in a realized gain of $6,824,859.
+ Includes an in-kind redemption which resulted in a realized gain of $23,556,811.
* For the period August 30, 2013 (commencement of operations) to June 30, 2014.
** For the period December 31, 2012 (commencement of operations) to June 30, 2013.
^ The Global Value Fund had a single shareholder, HW Atlas LLC, which individually held 41.0% of the total shares outstanding as of June 30, 2014 and 64.4% of the total shares outstanding as of June 30, 2013.
68
NOTE 6.
Investments in Affiliated Issuers. An issuer in which a Fund's holdings represent 5% or more of the outstanding voting securities of the issuer is an "affiliated" issuer as defined in the 1940 Act. A schedule of each Fund's investments in securities of affiliated issuers held during the year ended June 30, 2014, is set forth below:
Mid-Cap Value Fund
| Issuer Name | | Share Balance
At July 1, 2013 | | Additions | | Reductions | | Share Balance
At June 30, 2014 | | Dividend
Income | | Value
At June 30, 2014 | |
PHH Corporation | | | 2,341,300 | | | | 964,200 | | | | 177,500 | | | | 3,128,000 | | | $ | — | | | $ | 71,881,440 | | |
Valassis Communications, Inc.+ | | | 2,722,200 | | | | 150,200 | | | | 2,872,400 | | | | — | | | | 1,560,292 | | | | — | | |
| | | | | | | | | | $ | 1,560,292 | | | | |
+ Issuer was not an affiliate as of June 30, 2014.
Small Cap Value Fund
| Issuer Name | | Share Balance
At July 1, 2013 | | Additions | | Reductions | | Share Balance
At June 30, 2014 | | Dividend
Income | | Value
At June 30, 2014 | |
Hudson Global, Inc. | | | 2,171,800 | | | | 94,900 | | | | — | | | | 2,266,700 | | | $ | — | | | $ | 8,908,131 | | |
Miller Industries, Inc. | | | 768,300 | | | | 37,500 | | | | — | | | | 805,800 | | | | 458,592 | | | | 16,583,364 | | |
Overhill Farms, Inc. + | | | 982,900 | | | | — | | | | 982,900 | | | | — | | | | — | | | | — | | |
| | | | | | | | | | $ | 458,592 | | | | |
+ Issuer was not an affiliate as of June 30, 2014.
NOTE 7.
Securities Lending. Effective December 2007, the Funds entered into a securities lending arrangement with Brown Brothers Harriman & Co. (the "Custodian"). Under the securities lending agreement, the Custodian is authorized to loan securities on behalf of the Funds to approved brokers. In exchange, the Funds receive cash collateral in the amount of at least 102% of the value of the securities loaned plus accrued interest. The total market value of securities on loan for each Fund is disclosed on the Schedule of Investments. The cash collateral is invested in short-term instruments as noted on the Schedule of Investments. Income earned from these investments is included in "Securities on loan" on the Statements of Operations and is allocated to each Fund based on each Fund's proportion of the total cash collateral received. Securities lending involves counterparty risks, including the risk that the loaned securities may not be returned in a timely manner or at all. Subject to certain conditions, the Custodian has agreed to indemnify the Funds from losses resulting from a borrower's failure to return a loaned security. In addition, the Funds bear the risk of loss associated with the investment of cash collateral received.
A portion of the income generated by the investment of the collateral, net of any rebates paid by the Custodian to borrowers, is remitted to the Custodian as lending agent, and the remainder is paid to the applicable Fund.
NOTE 8.
Indemnifications. Under the Trust's organizational documents and indemnification agreements between each independent Trustee and the Trust, its officers and Trustees are indemnified against certain liability arising out of the performance of their duties to the Funds. In addition, in the normal course of business the Trust enters into contracts that contain a variety of representations and warranties, which provide general indemnifications. The Funds' maximum exposure under these arrangements is unknown, as this would involve future claims that may be made against the Funds. However, based on experience, the Funds expect the risk of loss to be remote.
NOTE 9.
Risk Factors. Investing in a Fund may involve certain risks including, but not limited to, those described below.
Lower rated debt securities generally have higher rates of interest and involve greater risk of default or price changes due to changes in the issuer's creditworthiness than higher rated debt securities. The market prices of these securities may fluctuate more than higher quality securities and may decline significantly in periods of general economic difficulty. There may be little trading in the secondary market for particular debt securities, which may make them more difficult to value or sell.
The prices of, and the income generated by, most debt securities held by a Fund may be affected by changing interest rates and by changes in the effective maturities and credit ratings of these securities. For example, the prices of debt securities in a Fund's portfolio generally will decline when interest rates rise and increase when interest rates fall. In addition, falling interest rates may cause an issuer to redeem, "call" or refinance a security before its stated maturity, which may result in the Fund having to reinvest the proceeds in lower yielding securities. Debt securities are also subject to credit risk, which is the possibility that the credit strength of an issuer will weaken and/or an issuer of a debt security will fail to make timely payments of principal or interest and the security will go into default. Longer maturity debt securities generally have higher rates of interest and may be subject to greater price fluctuations than shorter maturity debt securities.
The prices of, and the income generated by, the common stocks and other equity securities held by a Fund may decline in response to certain events taking place around the world, including those directly involving the issuers whose securities are owned by the Fund; conditions affecting the general economy; overall market changes; local, regional or global political, social or economic instability; governmental or governmental agency responses to economic conditions; and currency, interest rate and commodity price fluctuations.
69
Certain funds, accounts, individuals or affiliates may from time to time own (beneficially or of record) or control a significant percentage of a Fund's shares. Redemptions by these entities of their holdings in the Fund may impact the Fund's liquidity and net asset value ("NAV"). These redemptions may also force the Fund to sell securities.
NOTE 10.
New Accounting Pronouncement. In June 2014, the Financial Accounting Standards Board ("FASB") issued Accounting Standards Update ("ASU") No. 2014-11 "Repurchase-to-Maturity Transactions, Repurchase Financings, and Disclosures." ASU No. 2014-11 requires repurchase-to-maturity transactions and repurchase agreements executed as repurchase financings to be accounted for as secured borrowings. In addition, ASU No. 2014-11 eliminates sale accounting for repurchase-to-maturity transactions and supersedes the guidance under which a transfer of a financial asset and a contemporaneous repurchase financing could be accounted for on a combined basis as a forward agreement. The new disclosure requires disclosures for transactions economically similar to repurchase agreements when the transferor retains substantially all of the exposure to the economic return of the transferred financials assets throughout the term of the transactions. Lastly, the update expands disclosures about the nature of collateral pledged in repurchase agreements and similar transactions accounted for as secured borrowings. ASU No. 2014-11 requires disclosures to make financial statements that are prepared under U.S GAAP more comparable to those prepared under International Financial Reporting Standards ("IFRS"). New disclosures are required for annual reporting periods beginning on or after December 15, 2014, and interim periods within those annual periods.
Management is currently evaluating the impact ASU No. 2014-11 will have on the Funds' financial statements and disclosures.
NOTE 11.
Subsequent Events. The Large Cap Value Fund declared distributions from net investment income payable on July 11, 2014 to shareholders of record on July 10, 2014. The distributions from Class I shares were $7,919,412 or $0.42 per share, Class A shares were $3,308,759 or $0.39 per share, Class C shares were $395,167 or $0.39 per share and Class R shares were $161,290 or $0.36 per share.
The Board approved the imposition of a 2% redemption fee on shares of the High Yield Fund that are redeemed or exchanged if they have been held for 90 days or less. The redemption fee is effective on August 29, 2014 and will apply to shareholders who redeem their shares on or before the 90th day from the date of purchase. The redemption fee will not apply to High Yield Fund shares purchased before August 29, 2014.
NOTE 12.(UNAUDITED)
Federal Tax Disclosure. The Funds designated as long-term capital gain dividends, pursuant to Internal Revenue Code Section 852(b)(3), the amount necessary to reduce the earnings and profits of the Funds related to net capital gains to zero for the tax year ended June 30, 2014.
For the year ended June 30, 2014, the following percentages of ordinary distributions paid qualify for the dividend received deduction available to corporate shareholders: Diversified Value Fund — 100.00%, Large Cap Value Fund — 100.00%, Mid-Cap Value Fund — 100.00%, Small Cap Value Fund — 38.78%, Global Value Fund — 4.18%, Value Opportunities Fund — 30.51%, Capital Income Fund — 25.23%, High Yield Fund — 5.13%.
For the year ended June 30, 2014, the following percentages of ordinary distributions paid are designated as qualified dividend income under the Jobs and Growth Tax Relief Reconciliation Act of 2003: Diversified Value Fund — 100.00%, Large Cap Value Fund — 100.00%, Mid-Cap Value Fund — 100.00%, Small Cap Value Fund — 39.59%, Global Value Fund — 24.16%, Value Opportunities Fund — 48.97%, Capital Income Fund — 44.03%, High Yield Fund — 5.13%. Shareholders should consult their tax advisors.
For the year ended June 30, 2014, the Global Value Fund earned foreign source income of $119,482 and paid foreign taxes of $3,143, which it intends to pass through to shareholders pursuant to Section 853 of the Internal Revenue Code.
Additional Information Applicable to Foreign Shareholders Only. For the year ended June 30, 2014, the Funds designate the following percentages of ordinary distributions paid as interest-related dividends under Internal Revenue Code Section 871(k)(1)(c): Diversified Value Fund — 0.02%, Large Cap Value Fund — 0.02%, Mid-Cap Value Fund — 0.07%, Small Cap Value Fund — 0.01%, Global Value Fund — 0.00%, Value Opportunities Fund — 5.96%, Capital Income Fund — 31.76%, High Yield Fund — 86.54%. For the year ended June 30, 2014, the following percentages of ordinary income distributions paid are designated as short-term capital gain distributions under Internal Revenue Code Section 871(k)(2)(c): Diversified Value Fund — 0.00%, Large Cap Value Fund — 0.00%, Mid-Cap Value Fund — 0.00%, Small Cap Value Fund — 88.81%, Global Value Fund — 77.45%, Value Opportunities Fund — 82.10%, Capital Income Fund — 37.95%, High Yield Fund — 6.14%.
70
Report of Independent Registered Public Accounting Firm
To the Shareholders and Board of Trustees
of Hotchkis & Wiley Funds
We have audited the accompanying statements of assets & liabilities, including the schedules of investments of Hotchkis & Wiley Funds (the "Funds") comprising the Diversified Value Fund, Large Cap Value Fund, Mid-Cap Value Fund, Small Cap Value Fund, Global Value Fund, Value Opportunities Fund, Capital Income Fund and High Yield Fund, as of June 30, 2014, and the related statements of operations for the year then ended, the statements of changes in net assets, and the financial highlights for each of the two years then ended (as to the Global Value Fund, which is for the period from December 31, 2012 (commencement of operations) through June 30, 2013 and the year ended June 30, 2014). These financial statements and financial highlights are the responsibility of the Funds' management. Our responsibility is to express an opinion on these financial statements and financial highlights based on our audits. The financial highlights for each of the three years in the period ended June 30, 2012 were audited by other auditors whose report, dated August 22, 2012, expressed an unqualified opinion on those statements.
We conducted our audits in accordance with the standards of the Public Company Accounting Oversight Board (United States). Those standards require that we plan and perform the audits to obtain reasonable assurance about whether the financial statements and financial highlights are free of material misstatement. The Funds are not required to have, nor were we engaged to perform, an audit of their internal control over financial reporting. Our audits included consideration of internal control over financial reporting as a basis for designing audit procedures that are appropriate in the circumstances, but not for the purpose of expressing an opinion on the effectiveness of the Funds' internal control over financial reporting. Accordingly, we express no such opinion. An audit also includes examining, on a test basis, evidence supporting the amounts and disclosures in the financial statements, assessing the accounting principles used and significant estimates made by management, as well as evaluating the overall financial statement presentation. Our procedures included confirmation of securities owned as of June 30, 2014, by correspondence with the custodian and brokers; where replies were not received from brokers, we performed other auditing procedures. We believe that our audits provide a reasonable basis for our opinion.
In our opinion, the 2014 financial statements and financial highlights referred to above present fairly, in all material respects, the financial position of the Funds as of June 30, 2014, the results of their operations for the year then ended, and the changes in their net assets, and the financial highlights for each of the two years then ended (as to the Global Value Fund, which is for the period from December 31, 2012 (commencement of operations) through June 30, 2013 and the year ended June 30, 2014), in conformity with accounting principles generally accepted in the United States of America.
Deloitte & Touche LLP
Costa Mesa, California
August 20, 2014
71
Fund Expense Examples (Unaudited)
As a mutual fund shareholder, you incur two types of costs: (1) transaction costs such as initial sales charges (loads) on purchase payments and contingent deferred sales charges on redemptions and (2) ongoing costs, including management fees, distribution and service (12b-1) fees and other fund expenses. The following examples are intended to help you understand your ongoing costs (in dollars) of investing in the Funds and to compare these costs with the ongoing costs of investing in other mutual funds. The examples are based on an investment of $1,000 invested at the beginning of the most recent six-month period and held for the entire period (January 1, 2014 – June 30, 2014).
The table below illustrates the Funds' costs in two ways:
Based on actual fund returns. This section provides information about actual account values and actual expenses. You may use the information in this section, together with the amount you invested, to estimate the expenses that you paid over the period. Simply divide your account value by $1,000 (for example, an $8,600 account value divided by $1,000 = 8.6), then multiply the result by the number in the section under the heading entitled "Expenses Paid During Period" to estimate the expenses you paid on your account during this period.
Based on hypothetical 5% yearly returns. This section provides information about hypothetical account values and hypothetical expenses based on the Funds' actual expense ratios and an assumed rate of return of 5% per year before expenses, which is not the Funds' actual return. The hypothetical account values and expenses may not be used to estimate the actual ending account balance or expenses you paid for the period. You may use this information to compare the ongoing costs of investing in the Funds and other funds. To do so, compare this 5% hypothetical example with the 5% hypothetical examples that appear in the shareholder reports of the other funds.
Please note that the expenses shown in the table are meant to highlight your ongoing costs only and do not reflect any transactional costs, such as sales charges (loads). Therefore, the second section is useful in comparing ongoing costs only, and will not help you determine the relative total costs of owning different funds. In addition, if these transactional costs were included, your costs would have been higher.
The calculations assume no shares were bought or sold during the period. Your actual costs may have been higher or lower, depending on the amount of your investment and the timing of any purchases or redemptions.
| | Based on Actual Fund Returns | | Based on Hypothetical 5% Yearly Returns | | | |
| | Beginning
Account Value
1/1/14 | | Ending
Account Value
6/30/14 | | Expenses Paid
During Period*
1/1/14 - 6/30/14 | | Beginning
Account Value
1/1/14 | | Ending
Account Value
6/30/14 | | Expenses Paid
During Period*
1/1/14 - 6/30/14 | | Annualized
Expense Ratio | |
Diversified Value Fund | |
Class I | | $ | 1,000.00 | | | $ | 1,087.10 | | | $ | 4.92 | | | $ | 1,000.00 | | | $ | 1,020.08 | | | $ | 4.76 | | | | 0.95 | % | |
Class A | | | 1,000.00 | | | | 1,085.40 | | | | 6.20 | | | | 1,000.00 | | | | 1,018.84 | | | | 6.01 | | | | 1.20 | | |
Class C | | | 1,000.00 | | | | 1,081.10 | | | | 10.06 | | | | 1,000.00 | | | | 1,015.12 | | | | 9.74 | | | | 1.95 | | |
Large Cap Value Fund | |
Class I | | | 1,000.00 | | | | 1,088.60 | | | | 5.18 | | | | 1,000.00 | | | | 1,019.84 | | | | 5.01 | | | | 1.00 | | |
Class A | | | 1,000.00 | | | | 1,087.50 | | | | 6.47 | | | | 1,000.00 | | | | 1,018.60 | | | | 6.26 | | | | 1.25 | | |
Class C | | | 1,000.00 | | | | 1,083.50 | | | | 10.33 | | | | 1,000.00 | | | | 1,014.88 | | | | 9.99 | | | | 2.00 | | |
Class R | | | 1,000.00 | | | | 1,086.10 | | | | 7.76 | | | | 1,000.00 | | | | 1,017.36 | | | | 7.50 | | | | 1.50 | | |
Mid-Cap Value Fund | |
Class I | | | 1,000.00 | | | | 1,111.80 | | | | 5.24 | | | | 1,000.00 | | | | 1,019.84 | | | | 5.01 | | | | 1.00 | | |
Class A | | | 1,000.00 | | | | 1,110.30 | | | | 6.54 | | | | 1,000.00 | | | | 1,018.60 | | | | 6.26 | | | | 1.25 | | |
Class C | | | 1,000.00 | | | | 1,106.20 | | | | 10.44 | | | | 1,000.00 | | | | 1,014.88 | | | | 9.99 | | | | 2.00 | | |
Class R | | | 1,000.00 | | | | 1,109.00 | | | | 7.84 | | | | 1,000.00 | | | | 1,017.36 | | | | 7.50 | | | | 1.50 | | |
Small Cap Value Fund | |
Class I | | | 1,000.00 | | | | 1,083.80 | | | | 5.22 | | | | 1,000.00 | | | | 1,019.79 | | | | 5.06 | | | | 1.01 | | |
Class A | | | 1,000.00 | | | | 1,082.50 | | | | 6.51 | | | | 1,000.00 | | | | 1,018.55 | | | | 6.31 | | | | 1.26 | | |
Class C | | | 1,000.00 | | | | 1,078.40 | | | | 10.36 | | | | 1,000.00 | | | | 1,014.83 | | | | 10.04 | | | | 2.01 | | |
Global Value Fund | |
Class I | | | 1,000.00 | | | | 1,067.40 | | | | 5.64 | | | | 1,000.00 | | | | 1,019.34 | | | | 5.51 | | | | 1.10 | | |
Class A | | | 1,000.00 | | | | 1,065.80 | | | | 6.91 | | | | 1,000.00 | | | | 1,018.10 | | | | 6.76 | | | | 1.35 | | |
Value Opportunities Fund | |
Class I | | | 1,000.00 | | | | 1,083.00 | | | | 5.11 | | | | 1,000.00 | | | | 1,019.89 | | | | 4.96 | | | | 0.99 | | |
Class A | | | 1,000.00 | | | | 1,081.40 | | | | 6.40 | | | | 1,000.00 | | | | 1,018.65 | | | | 6.21 | | | | 1.24 | | |
Class C | | | 1,000.00 | | | | 1,077.70 | | | | 10.25 | | | | 1,000.00 | | | | 1,014.93 | | | | 9.94 | | | | 1.99 | | |
Capital Income Fund | |
Class I | | | 1,000.00 | | | | 1,081.30 | | | | 4.13 | | | | 1,000.00 | | | | 1,020.83 | | | | 4.01 | | | | 0.80 | | |
Class A | | | 1,000.00 | | | | 1,078.30 | | | | 5.41 | | | | 1,000.00 | | | | 1,019.59 | | | | 5.26 | | | | 1.05 | | |
72
Fund Expense Examples (Unaudited)
| | Based on Actual Fund Returns | | Based on Hypothetical 5% Yearly Returns | | | |
| | Beginning
Account Value
1/1/14 | | Ending
Account Value
6/30/14 | | Expenses Paid
During Period*
1/1/14 - 6/30/14 | | Beginning
Account Value
1/1/14 | | Ending
Account Value
6/30/14 | | Expenses Paid
During Period*
1/1/14 - 6/30/14 | | Annualized
Expense Ratio | |
High Yield Fund | |
Class I | | $ | 1,000.00 | | | $ | 1,052.40 | | | $ | 3.56 | | | $ | 1,000.00 | | | $ | 1,021.32 | | | $ | 3.51 | | | | 0.70 | % | |
Class A | | | 1,000.00 | | | | 1,051.20 | | | | 4.83 | | | | 1,000.00 | | | | 1,020.08 | | | | 4.76 | | | | 0.95 | | |
Class C | | | 1,000.00 | | | | 1,047.10 | | | | 8.63 | | | | 1,000.00 | | | | 1,016.36 | | | | 8.50 | | | | 1.70 | | |
* Expenses are equal to the Funds' annualized expense ratio by class multiplied by the average account value over the period, multiplied by the number of days in the most recent fiscal half-year (181), then divided by the number of days in the most recent fiscal year (365).
73
Board Considerations in Approving Continuation of Investment Advisory Agreements (Unaudited)
Background and Approval Process. Hotchkis and Wiley Capital Management, LLC (the "Advisor") serves as investment adviser to the Hotchkis and Wiley Diversified Value Fund, the Hotchkis and Wiley Large Cap Value Fund, the Hotchkis and Wiley Mid-Cap Value Fund, the Hotchkis and Wiley Small Cap Value Fund, the Hotchkis and Wiley Global Value Fund, the Hotchkis and Wiley Value Opportunities Fund, the Hotchkis and Wiley Capital Income Fund and the Hotchkis and Wiley High Yield Fund (each a "Fund") pursuant to separate investment advisory agreements (the "Advisory Agreements") with the Hotchkis and Wiley Funds (the "Trust"). The Advisory Agreements were initially approved by the Board of Trustees at the inception of each Fund for two-year terms. The Advisory Agreements continue thereafter if approved annually by the Trustees, including a majority of the Trustees who are not "interested persons" (as defined in the Investment Company Act of 1940, as amended (the "1940 Act")) of the Trust (the "Independent Trustees"), by a vote cast in person at a meeting called for the purpose of voting on the Advisory Agreements. The Advisory Agreements for each Fund were most recently considered by the Board at a meeting held in May 2014.
As part of the annual contract review process, the Independent Trustees, through their independent legal counsel, requested and received extensive materials, including information relating to (i) the nature, extent and quality of services provided by the Advisor, including compliance with legal requirements, (ii) short-term and longer-term performance of each Fund relative to peer groups and market indices, (iii) the costs of the services provided and the Advisor's profitability with respect to the management of each Fund, (iv) the extent to which the Advisor has in the past or is likely in the future to experience economies of scale in connection with the investment advisory services it provides to each Fund, (v) the expense ratios of each Fund as compared with the expense ratios of their peer group and (vi) any benefits to the Advisor and its affiliates from its relationship with the Funds. The Independent Trustees also requested and received information specifically related to the Advisor's risk controls and risk evaluation process, including information on how the Advisor addresses portfolio volatility. The Independent Trustees noted that the information provided by the Advisor was thorough and responsive to their request. The information provided in response to their request supplemented information received by the Board throughout the year, both in writing and in meetings, regarding the Funds, including Fund performance, expense ratios, portfolio composition and regulatory compliance. The Independent Trustees also held a conference call with their independent legal counsel in April 2014 to review the materials provided by the Advisor and reviewed and discussed a legal memorandum regarding, among other things, the duties of directors/trustees under the 1940 Act and relevant state law in reviewing and approving investment advisory contracts. The Independent Trustees, through their independent legal counsel, then provided follow-up questions to the Advisor to which they received responses in advance of the May Board meeting.
At the May Board meeting, representatives of the Advisor discussed certain responses with the Trustees and responded to their further questions. The Trustees considered the factors set out in case law and identified by the Securities and Exchange Commission as most relevant in considering the renewal of investment advisory agreements. The Trustees considered these and other factors, as summarized in more detail below, and concluded that the terms of each Advisory Agreement are fair and reasonable and the continuance of each Agreement is in the best interests of the applicable Fund.
Nature, Extent and Quality of Services. As part of the Board's decision-making process, the Trustees noted that the Advisor and its predecessors have managed the Funds and their predecessors since their inception, and the Trustees believe that a long-term relationship with a capable, conscientious investment adviser is in the best interests of the Funds. The Board also considered that shareholders invest in a Fund specifically seeking the Advisor's investment expertise and style. The Board also noted that when shareholders invest in a Fund, they know the advisory fee that is paid by the Fund. In this connection, the Trustees considered, in particular, whether each Fund is managed in accordance with its investment objective and policies as disclosed to shareholders. The Trustees concluded that each Fund is managed consistent with its investment objective and policies.
The Trustees reviewed information regarding various services provided by the Advisor to the Funds, including an organizational chart and background information on personnel performing such services. The Trustees also reviewed each Fund's performance and information regarding the Advisor's investment program, which is driven by team-oriented, in-depth, fundamental research. The Trustees considered the depth and quality of the Advisor's investment process, the low turnover rates of the Advisor's key personnel, the overall stability of the Advisor's organization, and the experience, capability and integrity of its senior management. The Trustees considered the portfolio managers' significant investments in the Funds. The Trustees reviewed the Trust's compliance program and the Advisor's commitment to a rigorous compliance effort and the resultant compliance by the Funds and the Advisor with legal requirements.
The Trustees also considered other non-advisory services provided to the Funds, such as the services of Advisor employees as Trust officers and other personnel provided that are necessary for Fund operations. The Trustees particularly noted that the services of the Trust's Chief Compliance Officer are provided to the Funds at no cost to the Funds. The Trustees noted that the Advisor organizes Board meetings and the preparation of Board meeting materials, and those Advisor employees serving as Trust officers oversee and manage the other Fund service providers.
Based on their review, the Trustees concluded that the nature, extent and quality of services provided (and expected to be provided) to each Fund under its Advisory Agreement were of a high level and were very satisfactory.
Investment Performance of the Funds and the Advisor. The Trustees noted that they review data on the short-term and longer-term performance of the Funds in connection with each quarterly Board meeting. For the contract review meeting, the Trustees reviewed a report prepared by the Trust's administrator (the "Report") using information compiled from Morningstar, Inc., an independent provider of data to mutual fund boards, that compared the performance of Class I shares of each Fund to that of a small group of funds that are similar primarily in terms of investment style (each, a "Peer Group"), for periods ended December 31, 2013. The Peer Groups were selected by the Advisor based on its criteria to determine an appropriate group of competitor funds, and data regarding performance of the Peer Group funds also is provided at each quarterly Board meeting. The Trustees also considered performance information through March 2014 that was provided by the Advisor as well.
The Board considered the performance information for each Fund for applicable periods up to 10 years. The Board noted that all Funds outperformed their Peer Group median for the 1-and 3-year periods ended December 31, 2013, except the Global Value Fund (with an inception date of December 31, 2012), which outperformed its Peer Group median for the 1-year period. The Board noted that every Fund with 5 and 10 years of
74
performance also outperformed the median of its Peer Group — often significantly — for those periods, with the exception of the Large Cap Value Fund, which underperformed its Peer Group median for the 10-year period. The Board also noted that the Advisor's supplemental report for periods through March 31, 2014, showed continued strong performance for the Funds versus their Peer Groups. In addition, the Board considered data from the Report and the Advisor's supplemental report comparing each Fund's performance to that of its benchmark index(es). The Trustees noted that all Funds outperformed their benchmark index(es) for the 1-year period ended March 31, 2014 covered in the Advisor's supplemental report on performance, including the Capital Income Fund, which outperformed its blended benchmark comprised of the BofA Merrill Lynch U.S. Corporate, Government and Mortgage Index and the Standard & Poor's 500® Index. Similarly, the Trustees noted that each Fund with 3 years of performance as of March 31, 2014 (i.e., all but the Global Value Fund) also outperformed its benchmark index(es) for the 3-year period, including the Capital Income Fund, based on its blended benchmark. The Independent Trustees reviewed with the Advisor the reasons for the historical variability in performance, congratulated the Advisor for the Funds' continued strong performance, and encouraged the Advisor to continue to adapt its risk assessment approach in an effort to appropriately consider the impact of volatility in Fund performance going forward.
Fees, Expenses and Profitability. The Trustees reviewed expense data compiled from Lipper Inc., another independent provider of mutual fund data, contained in the Report and information provided by the Advisor in the supplemental report regarding the Funds' advisory fees and expense ratios, including information regarding any expense caps for the Funds. The Trustees reviewed data in the Report showing how the Funds' advisory fees and expense ratios compared to those of their respective Peer Groups. Since some Peer Group funds' advisory contracts include administration services, the Report included administration fees with advisory fees for comparability. The Trustees also reviewed information provided by the Advisor on advisory fees charged by the Advisor for subadvisory services it provides to other mutual funds and advisory fees it charges to its separate account clients with investment objectives and policies similar to those of the Funds. The Trustees considered a list of the many additional functions performed for the Funds that the Advisor does not perform for its separate account and subadvisory clients. The Trustees noted that even though the Funds require more services and have higher costs, and even though it is generally acknowledged that managing mutual funds subjects an investment adviser to more legal and regulatory risk than is the case with separate accounts, the fees charged to three of the Funds (the Small Cap Value Fund, the Global Value Fund and the Value Opportunities Fund) are the same as or lower than the Advisor's current standard fee schedules for its separate account clients.
With respect to the advisory fee for each Fund, the Trustees noted that the Report showed that the Diversified Value, Large Cap Value, Mid-Cap Value and Small Cap Value Funds' net advisory fees (including administration fees) were higher than their Peer Group median, and that the Value Opportunities and High Yield Funds' net advisory fees (including administration fees) were lower than their Peer Group medians. The Board noted that the Global Value and Capital Income Funds' net advisory fees (including administration fees) were negative due to fee waivers. The Trustees noted that the Advisor had agreed to add breakpoints to the fee schedule for the Diversified Value, Large Cap Value and Mid-Cap Value Funds effective January 1, 2007, but that lower asset levels in recent years, including 2013, meant that the breakpoints did not have an impact on the advisory fees. They noted that the Advisor uses a research-intensive process where other firms, including those advising Peer Funds, might use investment processes that are less research-intensive. With respect to the expense ratios for the Funds, the Trustees noted that the Report showed that the Diversified Value, Large Cap Value, Mid-Cap Value and Global Value Funds' net expense ratios were higher than the median of their Peer Groups, that the Small Cap Value, Value Opportunities and High Yield Funds' net expense ratios were lower than the median of their Peer Groups, and that the Capital Income Fund's net expense ratio was the same as the median for its Peer Group. The Trustees noted the quality of the Advisor's investment process and concluded that the advisory fee and expense ratios were fair and reasonable for each Fund.
The Trustees reviewed information concerning the estimated profitability to the Advisor of the Advisory Agreements, including information regarding the methodology for allocating expenses. The Trustees reviewed data regarding the Advisor's variable expenses and fixed expenses. The Trustees considered that in 2013, as in recent prior years, the Advisor had absorbed costs above expense caps for certain of the Funds for which it would not be reimbursed. The Board noted that the Advisor has agreed to continue the expense caps through at least October 31, 2015, and that annualized expense ratios continue to be above the expense caps for the Diversified Value, Global Value, Capital Income and High Yield Funds. The Trustees also recognized that individual fund or product line profitability of other advisers is generally not publicly available, and that profitability may be affected by numerous factors, so that the comparability of profitability among advisory firms is limited. The Trustees noted the importance of the Advisor's profitability — which is derived solely from investment management fees — in maintaining its entrepreneurial environment in a private, primarily employee-owned structure. They noted that the Advisor's compensation/profit structure facilitates retention of its management and investment professionals. They also noted that from time to time the Advisor had voluntarily limited growth of assets by closing certain Funds to new investors, and that currently the Mid-Cap Value and Small Cap Value Funds have limited availability for purchase. The Trustees noted that closing Funds was financially disadvantageous to the Advisor, and illustrated a commitment to act in the best interests of Fund shareholders. The Trustees concluded that the level of estimated profitability to the Advisor under the Advisory Agreements appeared to be not unreasonable.
Economies of Scale and Whether Fee Levels Reflect These Economies of Scale. The Trustees considered information regarding the investment, compliance and client service personnel who have been hired by the Advisor over the past few years, and the increase in technology spending. The Trustees concluded that the Funds' shareholders share in the additional services, investment in talented employees and capital improvements provided by the Advisor without an increase in advisory fees. The Trustees also noted that the addition of breakpoints to the Diversified Value, Large Cap Value and Mid-Cap Value Funds has in the past enabled, and may in the future enable, shareholders to share in economies of scale.
Indirect Benefits to the Advisor from its Relationship to the Funds. The Trustees considered information regarding any indirect benefits to the Advisor that could be identified from its relationship to the Funds. In particular, the Trustees considered any benefits from soft dollar arrangements. The Trustees noted that, while the Advisor had not historically used the Funds' commissions to pay for research, other than for proprietary research from brokers that was "bundled" with the commission cost, beginning in May 2011, the Board granted to the Advisor the ability to use commission sharing arrangements that would permit the Advisor to pay for third-party research with the equity Funds' soft dollars. The Trustees considered that the bundled research services and the use of commission sharing arrangements provides valuable information or service to the investment research process, which benefits the Funds (as well as the Advisor's other clients). The Trustees noted that the ability to use the Funds' soft dollars to obtain third-party research is a fallout benefit to the Advisor. The Trustees also noted that the commissions paid by the Funds are generally quite low and that the Advisor believes
75
that the use of commission sharing arrangements to obtain research for the Funds does not affect best execution, and that the Funds bear no additional costs as a result of these arrangements.
* * * *
Based on their review, including their consideration of each of the factors referred to above, the Trustees, including all of the Independent Trustees, concluded that the terms of each Advisory Agreement are fair and reasonable and that the renewal of each Agreement is in the best interests of each Fund. No single factor was determinative in the Board's analysis.
76
INDEPENDENT TRUSTEES
Name and Year of Birth | | Position
Held with
the Trust | | Term of
Office* and
Length of
Time Served | | Principal Occupation(s) During
Past Five Years | | Number of
Portfolios in
Fund Complex
Overseen by
Trustee | | Other
Directorships
Held by Trustee
During Past
Five Years | |
Randall H. Breitenbach
(born 1960) | | Trustee(a) | | Since 2001 | | Non-Executive Director and Vice Chairman, BreitBurn Energy Partners, L.P. (2012 — present); Co-Founder, Director and CEO, Pacific Coast Energy Company, L.P. and President, BreitBurn Energy Partners, L.P. (1988 — 2012); Chairman Emeritus, Finance Committee, Stanford University PIC Endowment (1999 — present). | | Nine | | BreitBurn Energy Partners, L.P.; Pacific Coast Energy Company, L.P. | |
Robert L. Burch III
(born 1934) | | Trustee | | Since 2001 | | Senior Partner, A.W. Jones Co. (investments) (1984 — present); Chairman, Jonathan Mfg. Corp. (slide manufacturing) (1977 — 2004). | | Nine | | None | |
Alejandra C. Edwards, Ph.D.
(born 1954) | | Trustee | | Since 2007 | | California State University — Long Beach: Professor of Economics (1994 — present); Associate Chair Economics (2001 — 2012); Graduate Advisor Economics (2000 — 2012). | | Nine | | None | |
Marcy Elkind, Ph.D.
(born 1947) | | Trustee | | Since 2005 | | President, Elkind Economics, Inc. (1980 — present). | | Nine | | None | |
Robert Fitzgerald
(born 1952) | | Trustee(b) | | Since 2005 | | Chief Financial Officer of National Retirement Partners, Inc. (2005 — 2007); Executive Vice President and Chief Financial Officer of PIMCO Advisors L.P. (1995 — 2001). | | Nine | | Independent Trustee, Brandes Investment Trust (7 portfolios); Director, College Savings Bank. | |
John A.G. Gavin
(born 1931) | | Trustee
Chairman | | Since 2001
Since 2007 | | Chairman, Gamma Holdings (international capital and consulting) (1968 — present); Senior Counselor, Hicks Holdings (private equity investment firm) (2001 — 2013); U.S. Ambassador to Mexico (1981 — 1986). | | Nine | | Independent Trustee: TCW Strategic Income Fund, Inc. (1 portfolio); TCW Funds, Inc. (27 portfolios); Causeway Capital Management Trust (5 portfolios) (2001 — 2013). | |
Donald Morrison, Ph.D.
(born 1939) | | Trustee | | Since 2007 | | The William E. Leonhard Professor in the Anderson Graduate School of Management at the University of California, Los Angeles (1988 — present). | | Nine | | None | |
* Each Independent Trustee serves until his or her successor is elected and qualified or until his or her death or resignation or removal as provided in the Trust's Agreement and Declaration of Trust.
(a) Chairman of the Nominating and Governance Committee.
(b) Chairman of the Audit Committee.
INTERESTED TRUSTEE
Name and Year of Birth | | Position
Held with
the Trust | | Term of
Office** and
Length of
Time Served | | Principal Occupation(s) During
Past Five Years | | Number of
Portfolios in
Fund Complex
Overseen by
Trustee | | Other
Directorships
Held by Trustee
During Past
Five Years | |
George H. Davis, Jr.*
(born 1961) | | Trustee | | Since 2007 | | Chief Executive Officer and Portfolio Manager of Hotchkis & Wiley Capital Management, LLC (the "Advisor") (2001 — present). | | Nine | | None | |
* Mr. Davis is an "interested person," as defined in the 1940 Act, of the Trust based on his position as Chief Executive Officer and Portfolio Manager of the Advisor.
** As Trustee, Mr. Davis serves until his successor is elected and qualified or until his death or resignation or removal as provided in the Trust's Agreement and Declaration of Trust.
OFFICERS
Name and Year of Birth | | Position
Held with
the Trust | | Term of
Office* and
Length of
Time Served | | Principal Occupation(s) During Past Five Years | |
Anna Marie Lopez
(born 1967) | | President | | Since 2007 | | Chief Operating Officer of the Advisor (2007 — present). | |
Mark McMahon
(born 1968) | | Vice President and Secretary | | Since 2006 | | Managing Director, Mutual Fund Operations of the Advisor (2006 — present). | |
James Menvielle
(born 1972) | | Vice President and Treasurer | | Since 2007 | | Chief Financial Officer of the Advisor (2006 — present). | |
Tina Kodama
(born 1968) | | Vice President and Chief Compliance Officer | | Since 2007 | | Chief Compliance Officer of the Advisor (2007 — present). | |
* Each officer is appointed by and serves at the pleasure of the Board of Trustees of the Trust.
The Statement of Additional Information includes additional information about the Trust's Trustees and officers, and is available without charge upon request by calling the transfer agent at 1-866-HW-FUNDS (1-866-493-8637). The address for all Trustees and officers of the Trust is c/o Hotchkis & Wiley Capital Management, LLC, 725 South Figueroa Street, 39th Floor, Los Angeles, CA 90017, attention: Trust Secretary.
77
The Hotchkis & Wiley Funds and Hotchkis & Wiley Capital Management, LLC value our relationship with our clients as our most important asset. We are committed to safeguarding our clients' confidential non-public personal information. Our privacy policy outlines the steps we take to protect our clients' personal information.
We collect non-public personal information about you from the following sources in the normal course of business to serve you better:
• Information we receive about you on applications, questionnaires or other forms;
• Information you give us orally or on written or electronic correspondence;
• Information about your transactions with us, financial intermediaries, or others;
• Information received from your custodian, consultant, attorneys, or others; and
• Information provided and captured on our website, including any information captured on our website through the use of "cookies".
We do not sell your personal information to anyone, nor do we disclose your personal information to unaffiliated third parties without the client's authorization, except to your authorized representatives (including your consultant, attorney or accountant). We may disclose your personal information to financial intermediaries (such as broker-dealers and custodians) only as permitted by law and only as necessary for us to provide agreed services and products. We may also disclose your personal information to other service providers with whom we have business arrangements to help administrate our business. These service providers are bound by law or by contract to use your information only for the services for which we hired them, and are not permitted to use or share this information for any other purpose. In limited circumstances, we may disclose your personal information as required by law or in response to inquires from governmental authorities.
We limit access to your personal information, as much as possible, to those employees who need to know that information to provide products and services to you. We also maintain physical, electronic and procedural safeguards to guard the privacy of your nonpublic personal information.
We apply this policy to current and former clients.
This page is not part of the annual report.
78
(This page intentionally left blank)
Information about the Funds
ADVISOR
Hotchkis & Wiley Capital Management, LLC
725 South Figueroa Street, 39th Floor
Los Angeles, California 90017
LEGAL COUNSEL
Vedder Price P.C.
222 North LaSalle Street
Chicago, Illinois 60601
INDEPENDENT REGISTERED PUBLIC ACCOUNTING FIRM
Deloitte & Touche LLP
695 Town Center Drive, Suite 1200
Costa Mesa, CA 92626
DISTRIBUTOR
Quasar Distributors, LLC
615 East Michigan Street
Milwaukee, Wisconsin 53202
ADMINISTRATOR AND TRANSFER AGENT
U.S. Bancorp Fund Services, LLC
615 East Michigan Street
Milwaukee, Wisconsin 53202
CUSTODIAN
Brown Brothers Harriman & Co.
50 Post Office Square
Boston, Massachusetts 02110
This report is for the information of shareholders of the Hotchkis & Wiley Funds, but may also be used as sales literature when preceded or accompanied by a current prospectus, which gives details about charges, expenses, investment objectives and operating policies of the Funds.
A description of the policies and procedures that the Funds use to determine how to vote proxies relating to portfolio securities is included in the Statement of Additional Information, which is available without charge, upon request, by calling 1-866-HW-FUNDS (1-866-493-8637) and on the Securities and Exchange Commission's ("SEC") website at http://www.sec.gov.
Information regarding how the Funds voted proxies relating to portfolio securities during the most recent 12-month period ended June 30 is available without charge on the Funds' website at www.hwcm.com and on the SEC's website at http://www.sec.gov.
Hotchkis & Wiley Funds files a complete schedule of portfolio holdings with the SEC for the first and third quarters of each fiscal year on Form N-Q. The Funds' Forms N-Q are available free of charge on the SEC's website at http://www.sec.gov. You may also review or, for a fee, copy the forms at the SEC's Public Reference Room in Washington, D.C. (1-800-SEC-0330). The Forms N-Q are also available on the Funds' website at www.hwcm.com.
725 SOUTH FIGUEROA STREET, 39th Floor
LOS ANGELES, CALIFORNIA 90017-5439
www.hwcm.com
1.866.HW.FUNDS (1.866.493.8637)
Item 2. Code of Ethics.
The registrant has adopted a code of ethics that applies to the registrant’s principal executive officer and principal financial officer. The registrant has not made any amendments to its code of ethics during the period covered by this report. The registrant has not granted any waivers from any provisions of the code of ethics during the period covered by this report. A copy of the code of ethics is available without charge, upon request, by calling toll-free at 1-800-796-5606.
Item 3. Audit Committee Financial Expert.
The registrant’s Board has determined that Robert Fitzgerald, a member of the registrant’s Audit Committee, is an “audit committee financial expert” and “independent,” as such terms are defined in this Item. This designation will not increase the designee’s duties, obligations or liability as compared to his duties, obligations and liability as a member of the Audit Committee and of the Board; nor will it reduce the responsibility of the other Audit Committee members. The Board believes each member of the Audit Committee contributes significantly to the effective oversight of the registrant’s financial statements and condition.
Item 4. Principal Accountant Fees and Services.
The registrant has engaged its principal accountant to perform audit services, audit-related services, tax services and other services during the past two fiscal years. “Audit services” refer to performing an audit of the registrant’s annual financial statements or services that are normally provided by the accountant in connection with statutory and regulatory filings or engagements for those fiscal years. “Audit-related services” refer to the assurance and related services by the principal accountant that are reasonably related to the performance of the audit. “Tax services” refer to professional services rendered by the principal accountant for tax compliance, tax advice, and tax planning. The principal accountant did not provide any other services. The following table details the aggregate fees billed or expected to be billed for each of the last two fiscal years for audit fees, audit-related fees, tax fees and other fees by the principal accountant.
| | FYE 6/30/2014 | | FYE 6/30/2013 | |
Audit Fees | | $ | 168,000 | | $ | 160,000 | |
Audit-Related Fees | | $ | 0 | | $ | 0 | |
Tax Fees | | $ | 52,800 | | $ | 51,200 | |
All Other Fees | | $ | 0 | | $ | 0 | |
The registrant’s Audit Committee (the “Committee”) has adopted policies and procedures with regard to the pre-approval of services. The Committee shall pre-approve any engagement of the independent auditors to provide any non-prohibited services to the registrant, including the fees and other compensation to be paid to the independent auditors. The Chairman of the Audit Committee may grant the pre-approval of services to the registrant for non-prohibited services for engagements of less than $5,000. All such delegated pre-approvals shall be presented to the Audit Committee no later than the next Audit Committee meeting. The Committee shall also pre-approve any engagement of the independent auditors, including the fees and other compensation to be paid to the independent auditors, to provide any non-audit services to the Adviser (or any “control affiliate” of the Adviser providing ongoing services to
the registrant), if the engagement relates directly to the operations and financial reporting of the registrant. The Chairman of the Audit Committee may grant the pre-approval for non-prohibited services to the Adviser for engagements of less than $5,000. All such delegated pre-approvals shall be presented to the Audit Committee no later than the next Audit Committee meeting.
The percentage of fees billed by Deloitte & Touche LLP applicable to non-audit services pursuant to waiver of pre-approval requirement were as follows:
| | FYE 6/30/2014 | | FYE 6/30/2013 | |
Audit-Related Fees | | 0 | % | 0 | % |
Tax Fees | | 0 | % | 0 | % |
All Other Fees | | 0 | % | 0 | % |
All of the principal accountant’s hours spent on auditing the registrant’s financial statements were attributed to work performed by full-time permanent employees of the principal accountant.
The following table indicates the non-audit fees billed or expected to be billed by the registrant’s accountant for services to the registrant and to the registrant’s investment adviser for the last two years. The registrant’s Audit Committee has considered whether the provision of non-audit services that were rendered to the registrant’s investment adviser and any entity controlling, controlled by or under common control with the investment adviser is compatible with maintaining the principal accountant’s independence and has concluded that the provision of such non-audit services by the accountant has not compromised the accountant’s independence.
Non-Audit Related Fees | | FYE 6/30/2014 | | FYE 6/30/2013 | |
Registrant | | $ | 52,800 | | $ | 51,200 | |
Registrant’s Investment Adviser | | $ | 0 | | $ | 0 | |
Item 5. Audit Committee of Listed Registrants.
Not applicable to registrants who are not listed issuers (as defined in Rule 10A-3 under the Securities Exchange Act of 1934).
Item 6. Investments.
Schedule of Investments is included as part of the report to shareholders filed under Item 1 of this Form.
Item 7. Disclosure of Proxy Voting Policies and Procedures for Closed-End Management Investment Companies.
Not applicable to open-end investment companies.
Item 8. Portfolio Managers of Closed-End Management Investment Companies.
Not applicable to open-end investment companies.
Item 9. Purchases of Equity Securities by Closed-End Management Investment Company and Affiliated Purchasers.
Not applicable to open-end investment companies.
Item 10. Submission of Matters to a Vote of Security Holders.
The identification and recommendation of individuals for Board membership is the responsibility of the Nominating and Governance Committee. Shareholders may submit suggestions for candidates by forwarding their correspondence by U.S. mail or other courier service to the Funds’ Secretary for the attention of the Chairman of the Nominating and Governance Committee, 725 South Figueroa Street, 39th Floor, Los Angeles, CA 90017-5439.
Item 11. Controls and Procedures.
(a) The Registrant’s President / Principal Executive Officer and Treasurer / Principal Financial Officer have reviewed the Registrant’s disclosure controls and procedures (as defined in Rule 30a-3(c) under the Investment Company Act of 1940 (the “Act”)) as of a date within 90 days of the filing of this report, as required by Rule 30a-3(b) under the Act and Rules 13a-15(b) or 15d-15(b) under the Securities Exchange Act of 1934. Based on their review, such officers have concluded that the disclosure controls and procedures are effective in ensuring that information required to be disclosed in this report is appropriately recorded, processed, summarized and reported and made known to them by others within the Registrant and by the Registrant’s service provider.
(b) There were no changes in the Registrant’s internal control over financial reporting (as defined in Rule 30a-3(d) under the Act) that occurred during the second fiscal quarter of the period covered by this report that has materially affected, or is reasonably likely to materially affect, the Registrant’s internal control over financial reporting.
Item 12. Exhibits.
(a) (1) Any code of ethics or amendment thereto, that is the subject of the disclosure required by Item 2, to the extent that the registrant intends to satisfy Item 2 requirements through filing an exhibit. Available without charge, upon request, by calling toll-free at 1-800-796-5606.
(2) A separate certification for each principal executive and principal financial officer pursuant to Section 302 of the Sarbanes-Oxley Act of 2002. Filed herewith.
(3) Any written solicitation to purchase securities under Rule 23c-1 under the Act sent or given during the period covered by the report by or on behalf of the registrant to 10 or more persons. Not applicable to open-end investment companies.
(b) Certifications pursuant to Section 906 of the Sarbanes-Oxley Act of 2002. Attached hereto.
SIGNATURES
Pursuant to the requirements of the Securities Exchange Act of 1934 and the Investment Company Act of 1940, the registrant has duly caused this report to be signed on its behalf by the undersigned, thereunto duly authorized.
(Registrant) | Hotchkis & Wiley Funds | |
|
By (Signature and Title) | /s/ Anna Marie Lopez | |
| Anna Marie Lopez, President / Principal Executive Officer |
|
Date | August 22, 2014 | |
| | | | |
Pursuant to the requirements of the Securities Exchange Act of 1934 and the Investment Company Act of 1940, this report has been signed below by the following persons on behalf of the registrant and in the capacities and on the dates indicated.
By (Signature and Title) | /s/ Anna Marie Lopez | |
| Anna Marie Lopez, President / Principal Executive Officer |
| |
Date | August 22, 2014 | |
| |
By (Signature and Title) | /s/ James Menvielle | |
| James Menvielle, Treasurer / Principal Financial Officer |
| |
Date | August 22, 2014 | |
| | | |