UNITED STATES
SECURITIES AND EXCHANGE COMMISSION
Washington, D.C. 20549
FORM N-CSR
CERTIFIED SHAREHOLDER REPORT OF REGISTERED
MANAGEMENT INVESTMENT COMPANIES
Investment Company Act file number: 811-10487
Hotchkis & Wiley Funds
(Exact name of registrant as specified in charter)
601 South Figueroa Street, 39th Floor
Los Angeles, California 90017-5704
(Address of principal executive offices) (Zip code)
Anna Marie Lopez
Hotchkis & Wiley Capital Management, LLC
601 South Figueroa Street, 39th Floor
Los Angeles, California 90017-5704
(Name and address of agent for service)
Copies to:
Maureen A. Miller, Esq.
Joseph M. Mannon, Esq.
Vedder Price P.C.
222 North LaSalle Street, 26th Floor
Chicago, Illinois 60601
(Counsel for the registrant)
(213) 430-1000
Registrant's telephone number, including area code
Date of fiscal year end: June 30, 2022
Date of reporting period: June 30, 2022
Item 1. Reports to Stockholders.

Hotchkis & Wiley Funds
Annual Report
JUNE 30, 2022
DIVERSIFIED VALUE FUND
LARGE CAP VALUE FUND
MID-CAP VALUE FUND
SMALL CAP VALUE FUND
SMALL CAP DIVERSIFIED VALUE FUND
GLOBAL VALUE FUND
INTERNATIONAL VALUE FUND
INTERNATIONAL SMALL CAP DIVERSIFIED VALUE FUND
VALUE OPPORTUNITIES FUND
HIGH YIELD FUND

SHAREHOLDER LETTER | | | 1 | | |
FUND INFORMATION | | | 4 | | |
FUND PERFORMANCE DATA | | | 6 | | |
SCHEDULE OF INVESTMENTS: | |
DIVERSIFIED VALUE FUND | | | 16 | | |
LARGE CAP VALUE FUND | | | 18 | | |
MID-CAP VALUE FUND | | | 20 | | |
| SMALL CAP VALUE FUND | | | 23 | | |
| SMALL CAP DIVERSIFIED VALUE FUND | | | 26 | | |
| GLOBAL VALUE FUND | | | 33 | | |
| INTERNATIONAL VALUE FUND | | | 35 | | |
| INTERNATIONAL SMALL CAP DIVERSIFIED VALUE FUND | | | 37 | | |
| VALUE OPPORTUNITIES FUND | | | 43 | | |
| HIGH YIELD FUND | | | 46 | | |
STATEMENTS OF ASSETS & LIABILITIES | | | 53 | | |
STATEMENTS OF OPERATIONS | | | 55 | | |
STATEMENTS OF CHANGES IN NET ASSETS | | | 57 | | |
FINANCIAL HIGHLIGHTS | | | 62 | | |
NOTES TO THE FINANCIAL STATEMENTS | | | 67 | | |
REPORT OF INDEPENDENT REGISTERED PUBLIC ACCOUNTING FIRM | | | 81 | | |
| FUND EXPENSE EXAMPLES | | | 82 | | |
BOARD CONSIDERATIONS IN APPROVING CONTINUATION OF
INVESTMENT ADVISORY AGREEMENTS | | | 84 | | |
STATEMENT REGARDING LIQUIDITY RISK MANAGEMENT
PROGRAM | | | 86 | | |
| MANAGEMENT | | | 87 | | |
INFORMATION ABOUT THE FUNDS | | | BACK COVER | | |
DEAR SHAREHOLDER:
The following investment review and shareholder report relates to the activities of the Hotchkis & Wiley Funds for the 12 months ended June 30, 2022.
OVERVIEW
In the 12-month period ended June 30, 2022, the S&P 500® Index returned –11%, the MSCI World Index returned –14%, and the ICE BofA U.S. High Yield Index (high yield market) returned –13%. Several economic developments have sparked fears of a recession. The most recent real GDP growth was negative quarter-over-quarter, the war in Ukraine showed little signs of abating, inflation increased by the largest amount in more than 40 years, and an increasingly hawkish Federal Open Market Committee (FOMC) raised the Fed Funds rate by 150 basis points via three hikes over the past year (from 0.25% to 1.75%, upper bound). The Fed signaled further rate increases going forward to combat inflation. Other major central banks have raised rates also, and like the Fed, signaled further rate hikes going forward. Higher rates are generally bad for equities. It becomes more costly to borrow, increasing the cost of capital, which is the rate used to discount future cash flows. Higher rates impair long-duration equities disproportionately because most of the intrinsic value is derived from a terminal value estimate far into the future. In general, growth stocks are longer duration securities than value stocks. Unsurprisingly, value has outperformed growth in periods of elevated inflation and interest rates historically.
Value held up better than growth over the 12-month period. From a global sector perspective, energy was the best performer of the year by a large magnitude, returning +33%. The three least economically sensitive sectors — utilities, health care, and consumer staples — were next best, returning +4%, –2%, and –3%, respectively. All other sectors declined more than –10%. Communication services (–29%), consumer discretionary (–27%), and information technology (–19%) were the worst performers. These sectors comprise considerably larger portions of growth indexes. Combined, the three sectors averaged nearly two-thirds of the MSCI World Growth Index's total weight over the past year. This highlights growth indexes unusual concentration, the likes of which we have not observed since the tech bubble.
We are finding attractive equity opportunities in a variety of market segments. We are partial to select large cap software companies, which are not inexpensive on typical valuation metrics like price-to-earnings, enterprise value to earnings before interest and taxes, price-to-book, etc. They represent fantastic businesses, however trade at large discounts to our estimate of intrinsic value. Common traits among our positions are high returns on capital, captive customer bases, good balance sheets, and a substantial return of capital to shareholders. The stocks also trade at large discounts to other parts of the market generally viewed as high quality businesses, e.g., consumer staples, though with superior growth prospects. We also find many opportunities in energy and financials, across the market cap spectrum. Within energy, valuations remain uncommonly attractive despite the sector's significant outperformance recently, because valuations are coming off such a low base. Higher commodity prices have translated into strong free cash flow. Historically, elevated cash flows
in energy were routinely used to reinvest in new exploration projects. Recently, however, cash has been used to pay down considerable amounts of debt, de-risking the sector significantly. Dividends and share repurchases have also ramped up meaningfully. With balance sheets improved and cash flow still strong, we expect share repurchases to increase even further going forward — an accretive use of capital considering the still attractive valuations. Additionally, energy has been the best inflation hedge of all sectors dating back to the 1970s. In financials, we find banks unusually attractive. The Funds' banks trade at compelling valuations both relative to normal earnings power and tangible book values. The attractive valuations reflect the market's recession worries and the credit losses that typically coincide with economic slowdowns. Yet the capital position in the industry is such that even severe regulatory stress tests (most recently in June) are passed largely without comment. Banks also experience an earnings benefit should interest rates continue to climb — financials have been the best interest rate hedge of all sectors dating back to the 1970s.
Value continues to trade at a large discount to growth, despite its recent outperformance. The Funds' valuations represent larger-than-normal discounts to their respective benchmarks. We view a reversion toward a more normal valuation relationship as more likely than not, which would represent a conducive environment for our long-term fundamental value approach.
The high yield market's decline has resulted in yields and spreads increasing to levels we have not observed in some time. Spreads over treasuries widened to 587 basis points as of June 30, 2022, with more than a tenth of the market trading at spreads greater than 1,000 basis points. The high yield market's yield-to-worst closed the period at 8.9%, a function of both rising rates and spread widening. The number of attractive valuation opportunities has increased over the past year, though it took a negative market to get here. Nonetheless, we are more optimistic about our prospect to add value going forward than we were a year ago. We will continue to adhere to our competitive research advantage, particularly in small and mid cap credits, with a focus on strong asset coverage.
HOTCHKIS & WILEY DIVERSIFIED VALUE FUND
The Fund's Class I shares had a total return of –8.27% for the year ended June 30, 2022 compared to the Russell 1000® Value Index return of –6.82%.
Stock selection in consumer discretionary, industrials, and consumer staples detracted from performance in the period. The underweight exposure to non-cyclical sectors also hurt, as the Fund was underexposed to health care, consumer staples, and utilities. The overweight position and positive stock selection in energy was a significantly positive contributor. Positive stock selection in information technology and financials also helped. The largest detractors to relative performance in the 12-month period were General Electric, Citigroup, General Motors, Magna International, and Warner Bros. Discovery. The largest positive contributors were Marathon Oil, APA Corp., AIG, Elevance Health, and Shell.
1
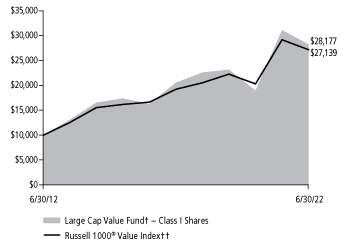
HOTCHKIS & WILEY LARGE CAP VALUE FUND
The Fund's Class I shares had a total return of –9.31% for the year ended June 30, 2022 compared to the Russell 1000® Value Index return of –6.82%.
Over the 12-month period ended June 30, 2022, stock selection in consumer discretionary, industrials, and communication services detracted from relative performance. The underweight positions in health care, consumer staples, and utilities also hurt, along with the overweight exposure to information technology. The overweight position in energy, along with positive stock selection in the same sector helped relative performance. The underweight exposure to communication services and stock selection in financials were also positive contributors. The largest individual detractors to performance in the period were General Electric, General Motors, Citigroup, Magna International, and Warner Bros. Discovery; the largest positive contributors were Marathon Oil, APA Corp., Elevance Health, AIG, and Shell.
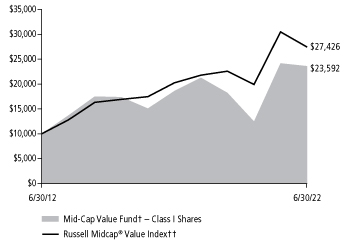
HOTCHKIS & WILEY MID-CAP VALUE FUND
The Fund's Class I shares had a total return of –2.34% for the year ended June 30, 2022 compared to the Russell Midcap® Value Index return of –10.00%.
Energy was the best-performing sector in the period by a wide margin. The Fund's overweight position and positive stock selection in the sector drove most of the outperformance. Positive stock selection in industrials was also a significant contributor. The underweight position and stock selection in consumer staples hurt relative performance. Stock selection in consumer discretionary and the underweight position in real estate detracted from performance. The largest positive contributors to relative performance in the 12-month period were Kosmos Energy, APA Corp., Fluor, Capricorn Energy, and Marathon Oil; the largest detractors were Royal Mail, CommScope, ODP Corp., Credit Suisse, and Adient.
HOTCHKIS & WILEY SMALL CAP VALUE FUND
The Fund's Class I shares had a total return of –3.42% for the year ended June 30, 2022 compared to the Russell 2000® Value Index return of –16.28%.
Positive stock selection drove most of the outperformance over the 12-month period. Stock selection was most positive in industrials, consumer discretionary, and communication services. The overweight position in energy and underweight position in health care also helped. Stock selection in real estate and the underweight positions in utilities and consumer staples detracted from performance. The largest positive contributors to relative performance were Range Resources, Fluor, Kosmos Energy, Meritor, and Points.com; the largest detractors were Seritage Growth Properties, Telos Corp., TrueBlue, Hanger, and Armstrong Flooring.
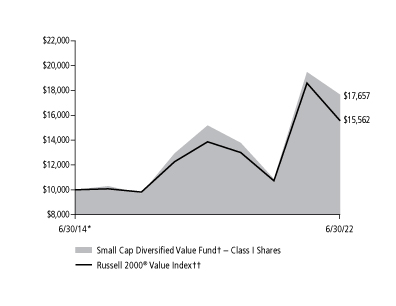
HOTCHKIS & WILEY SMALL CAP DIVERSIFIED VALUE FUND
The Fund's Class I shares had a total return of –9.34% for the year ended June 30, 2022 compared to the Russell 2000® Value Index return of –16.28%.
Stock selection was positive in 7 of the 11 GICS® sectors which helped relative performance. It was most positive in financials, industrials, and materials. The underweight positions in health care and communication services also helped, along with the overweight position in energy. Stock selection in energy, real estate, and consumer staples detracted from performance. The overweight position in consumer discretionary, along with the underweight positions in utilities, real estate, and consumer staples detracted from performance.
HOTCHKIS & WILEY GLOBAL VALUE FUND
The Fund's Class I shares had a total return of –11.86% for the year ended June 30, 2022 compared to the MSCI World Index return of –14.34%.
Both the overweight position in energy, and positive stock selection in the sector helped relative performance in the period. Positive stock selection in health care, financials, and information technology also helped. The underweight position in consumer discretionary and information technology, along with the overweight position in financials were positive contributors. Stock selection in consumer discretionary, consumer staples, and real estate detracted from performance. The underweight exposure to health care and no exposure to utilities hurt, as these were the best performing sectors for the benchmark after energy. The largest positive contributors to relative performance were Suncor Energy, Cenovus Energy, BAE Systems, Elevance Health, and AIG; the largest detractors were General Electric, Royal Mail, Credit Suisse, General Motors, and Warner Bros. Discovery.
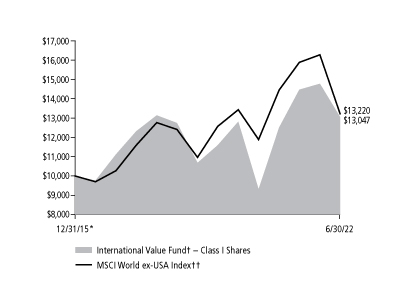
HOTCHKIS & WILEY INTERNATIONAL VALUE FUND
The Fund's Class I shares had a total return of –9.82% for the year ended June 30, 2022 compared to the MSCI World ex-USA Index return of –16.76%.
The index's only positive sector in the period was energy. The Fund's overweight position combined with positive stock selection in the sector were positive contributors to relative performance in the period. Positive stock selection in consumer discretionary and industrials also helped, along with the overweight exposure to financials. The underweight position and stock selection in health care detracted from performance. Stock selection in consumer staples also hurt. The largest positive contributors to relative performance were Cenovus Energy, BAE Systems, Kosmos Energy, Suncor Energy, and Points.com; the largest detractors were Royal Mail, Credit Suisse, Ericsson, Philips, and Magna International.
HOTCHKIS & WILEY INTERNATIONAL SMALL CAP DIVERSIFIED VALUE FUND
The Fund's Class I shares had a total return of –14.28% for the year ended June 30, 2022 compared to the MSCI World ex-USA Small Cap Index return of –23.02%.
Stock selection was positive in all 11 GICS® sectors, which drove most of the Fund's outperformance over the period. It was most positive in information technology, consumer discretionary, and financials. The overweight position in energy and financials also helped. The underweight exposure to real estate, utilities, and consumer staples detracted from performance.
2
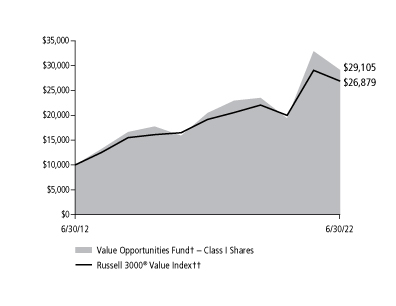
HOTCHKIS & WILEY VALUE OPPORTUNITIES FUND
The Fund's Class I shares had a total return of –11.50% for the year ended June 30, 2022 compared to the Russell 3000® Value return of –7.46%.
The overweight exposure to information technology was the Fund's largest detractor over the 12-month period, though this was more than offset by positive security selection in the sector. Security selection in real estate hurt performance, along with the underweight exposure to health care and utilities, and the overweight exposure to communication services. The overweight position in energy was a large positive contributor in the period. Positive security selection in health care also helped. The largest detractors to relative performance in the period were General Electric, Seritage Growth Properties, Credit Suisse, Royal Mail, and General Motors; the largest positive contributors were Range Resources, Triple-S Management, NOV, Inc., Kosmos Energy, and AIG.
HOTCHKIS & WILEY HIGH YIELD FUND
The Fund's Class I shares had a total return of –11.12% for the year ended June 30, 2022 compared to the ICE BofA BB-B U.S. High Yield Constrained Index return of –12.20%.
Positive credit selection in small cap credits contributed to relative performance in the period. Much of this was in energy, where positive credit selection was significantly positive. Positive credit selection in basic industry and services also helped, along with an underweight allocation to telecommunications. Credit selection in retail, leisure, and media detracted from performance in the period.
CONCLUSION
We appreciate your continued support of the Hotchkis & Wiley Funds, and we look forward to serving your investment needs in the future.
Sincerely,

| | 
| | 
| |
Anna Marie Lopez
President | | George Davis
Fund Manager | | Scott McBride
Fund Manager | |

| | 
| | 
| |
Patty McKenna
Fund Manager | | James Miles
Fund Manager | | Stan Majcher
Fund Manager | |

| | 
| | 
| |
David Green
Fund Manager | | Judd Peters
Fund Manager | | Ray Kennedy
Fund Manager | |

| | 
| | 
| |
Mark Hudoff
Fund Manager | | Patrick Meegan
Fund Manager | | Scott Rosenthal
Fund Manager | |

| | 
| | 
| |
Richard Mak
Fund Manager | | Ryan Thomes
Fund Manager | | Hunter Doble
Fund Manager | |
3
ABOUT FUND PERFORMANCE
The Diversified Value Fund, Large Cap Value Fund, Mid-Cap Value Fund, Small Cap Value Fund, Small Cap Diversified Value Fund, Global Value Fund, International Value Fund, Value Opportunities Fund and High Yield Fund have four authorized classes of shares (Class I, Class A, Class C and Class Z). The International Small Cap Diversified Value Fund has three authorized classes of shares (Class I, Class A and Class Z). Each share class has its own sales charge and expense structure, allowing you to invest in the way that best suits your needs. Currently, the International Value Fund and International Small Cap Diversified Value Fund are not offering Class A shares to investors; the Small Cap Diversified Value Fund, Global Value Fund and International Value Fund are not offering Class C shares to investors; and the Diversified Value Fund, Global Value Fund, International Value Fund and International Small Cap Diversified Value Fund are not offering Class Z shares to investors.
Class I shares have no initial sales charge and bear no ongoing distribution and service fees under a 12b-1 plan. Class I shares are available only to eligible investors.
Class A shares incur a maximum initial sales charge of 5.25% for the Diversified Value Fund, Large Cap Value Fund, Mid-Cap Value Fund, Small Cap Value Fund, Small Cap Diversified Value Fund, Global Value Fund, International Value Fund, International Small Cap Diversified Value Fund and Value Opportunities Fund and 3.75% for the High Yield Fund and an annual distribution and service fee of 0.25%.
Class C shares are subject to an annual distribution and service fee of 1.00%. In addition, Class C shares are subject to a 1.00% contingent deferred sales charge (CDSC) if redeemed within one year after purchase. Class C shares automatically convert to Class A shares approximately eight years after purchase and will then be subject to lower annual distribution and service fees.
Class Z shares have no initial sales charge and bear no ongoing distribution and service fees under a 12b-1 plan. Class Z shares are available only to eligible investors (provided that no compensation, administrative payments, sub-transfer agency payments and service payments are required).
FUND RISKS
Mutual fund investing involves risk; loss of principal is possible. The Mid-Cap Value Fund, Small Cap Value Fund, Small Cap Diversified Value Fund, Global Value Fund, International Value Fund, International Small Cap Diversified Value Fund and Value Opportunities Fund invest in small- and mid-capitalization companies which tend to have limited liquidity and greater price volatility than large-capitalization companies. The Value Opportunities Fund is a non-diversified fund which involves greater risk than investing in a diversified fund because a loss resulting from the decline in the value of one security may represent a greater portion of the total assets of a non-diversified fund. Growth stocks typically are more volatile than value stocks; however, value stocks have a lower expected growth rate in earnings and sales. The Value Opportunities Fund and High Yield Fund invest in debt securities that typically decrease in value when interest rates rise. This risk is usually greater for longer-term debt securities. Investment by the Value Opportunities Fund and High Yield Fund in lower-rated and non-rated securities presents a greater risk of loss to principal and interest than higher-rated securities. The Value Opportunities Fund
and High Yield Fund may utilize derivative instruments, which derive their performance from the performance of an underlying asset, index, interest rate or currency exchange rate. Derivatives can be volatile and involve various types and degrees of risks. Depending upon the characteristics of particular derivatives, they can suddenly become illiquid. Investments by the High Yield Fund in asset-backed and mortgage-backed securities include additional risks that investors should be aware of such as credit risk, extension risk, prepayment risk, and default risk, as well as increased susceptibility to adverse economic developments. The Funds may invest in foreign securities, including developed and emerging markets, which involve greater volatility and political, economic, and currency risks.
MARKET INDEXES
The following are definitions for indexes used in the shareholder letter and the fund performance data on the following pages. These indexes are unmanaged and include the reinvestment of dividends, but do not reflect the payment of transaction costs and advisory and other fees associated with an investment in the Funds. The securities that comprise these indexes may differ substantially from the securities in the Funds' portfolios. The Funds' value disciplines may prevent or restrict investments in securities included in the benchmark indexes. It is not possible to invest directly in an index. Each index named is not the only index which may be used to characterize performance of a specific Fund and other indexes may portray different comparative performance.
S&P 500® Index, a capital weighted, unmanaged index, represents the aggregate market value of the common equity of 500 stocks primarily traded on the New York Stock Exchange.
Russell 1000® Index, an unmanaged index, measures the performance of the 1,000 largest companies in the Russell 3000® Index.
Russell 1000® Value Index measures the performance of those Russell 1000® companies with lower price-to-book ratios and lower forecasted growth values.
Russell Midcap® Index, an unmanaged index, measures the performance of the 800 smallest companies in the Russell 1000® Index.
Russell Midcap® Value Index measures the performance of those Russell Midcap® companies with lower price-to-book ratios and lower forecasted growth values.
Russell 2000® Index, an unmanaged index, measures the performance of the 2,000 smallest companies in the Russell 3000® Index.
Russell 2000® Value Index measures the performance of those Russell 2000® companies with lower price-to-book ratios and lower forecasted growth values.
Russell 3000® Index, an unmanaged index, is comprised of the 3,000 largest U.S. companies based on total market capitalization, which represents approximately 98% of the investable U.S. equity market.
Russell 3000® Value Index measures the performance of those Russell 3000® companies with lower price-to-book ratios and lower forecasted growth values.
MSCI World Index is a free float-adjusted weighted index capturing large and mid cap representation across 23 Developed Markets (DM) countries.
4
MSCI World Growth Index is the growth investment style of the MSCI World Index. The growth investment style characteristics for index construction are defined using five variables: long-term forward EPS growth rate, short-term forward EPS growth rate, current internal growth rate and long-term historical EPS growth trend and long-term historical sales per share growth trend.
MSCI World ex-USA Index is a free float-adjusted weighted index capturing large and mid cap representation across 22 of 23 Developed Markets (DM) countries, excluding the United States.
MSCI World ex-USA Small Cap Index is a free float-adjusted weighted index capturing small cap representation across 22 of 23 Developed Markets (DM) countries, excluding the United States.
ICE BofA BB-B U.S. High Yield Constrained Index contains all securities in the ICE BofA U.S. High Yield Index rated BB+ through B- by S&P (or equivalent as rated by Moody's or Fitch), but caps issuer exposure at 2%. Index constituents are capitalization-weighted, based on their current amount outstanding, provided the total allocation to an individual issuer does not exceed 2%.
ICE BofA U.S. High Yield Index tracks the performance of below investment grade, but not in default, U.S. dollar-denominated corporate bonds publicly issued in the U.S. domestic market, and includes issues with a credit rating of BBB or below, as rated by Moody's and S&P.
DISCLOSURE
Past performance does not guarantee future results.
The shareholder letter reflects opinions of Fund managers as of June 30, 2022. They are subject to change and any forecasts made cannot be guaranteed. The Funds might not continue to hold any securities mentioned and have no obligation to disclose purchases or sales in these securities. Please refer to the Schedule of Investments in this report for a complete list of Fund holdings for June 30, 2022. Indexes do not incur expenses or sales loads and are not available for investment.
The Global Industry Classification Standard (GICS®) was developed by MSCI, an independent provider of global indices and benchmark-related products and services, and Standard & Poor's (S&P), an independent international financial data and investment services company.
The GICS methodology has been widely accepted as an industry analysis framework for investment research, portfolio management and asset allocation. The GICS structure consists of 11 sectors, 24 industry groups, 69 industries and 158 sub-industries. Each stock that is classified will have a coding at all four of these levels.
Investing in value stocks presents the risk that value stocks may fall out of favor with investors and underperform other asset types during a given period.
Each type of asset class or investment product has a different risk-return profile, which should be considered when investing. All investments contain risk and may lose value.
Basis point (bp) is a unit equal to 1/100th of 1% (0.01%) and is used to denote the change in a financial instrument.
Market capitalization of a company is calculated by multiplying the number of outstanding shares by the current market price of a share.
Yield-to-worst is the lowest possible yield from owning a bond considering all potential call dates prior to maturity.
Credit Quality weights by rating were derived from the highest bond rating as determined by S&P, Moody's or Fitch. Bond ratings are grades given to bonds that indicate their credit quality as determined by private independent rating services such as S&P, Moody's and Fitch. These firms evaluate a bond issuer's financial strength, or its ability to pay a bond's principal and interest in a timely fashion. Ratings are expressed as letters ranging from 'AAA', which is the highest grade, to 'D', which is the lowest grade. In limited situations when none of the three rating agencies have issued a formal rating, the Advisor will classify the security as nonrated.
During the year ended June 30, 2022, the Value Opportunities Fund held futures contracts, which resulted in realized gains and unrealized losses, and purchased put options, which resulted in realized losses and unrealized gains.
5
DIVERSIFIED VALUE FUND
Total Return Based on a $10,000 Investment

Comparative Results†††
For Periods ended June 30, 2022 | | 1 Year | | 5 Years | | 10 Years | | Since
8/30/04* | |
Class I | |
Average annual total return | | | –8.27 | % | | | 7.23 | % | | | 10.97 | % | | | 7.21 | % | |
Class A | |
Average annual total return (with sales charge) | | | –13.31 | % | | | 5.82 | % | | | 10.09 | % | | | 6.62 | % | |
Average annual total return (without sales charge) | | | –8.49 | % | | | 6.97 | % | | | 10.69 | % | | | 6.94 | % | |
Class C | |
Average annual total return (with CDSC) | | | –10.10 | % | | | 6.16 | % | | | 9.86 | % | | | 6.16 | % | |
Average annual total return (without CDSC) | | | –9.20 | % | | | 6.16 | % | | | 9.86 | % | | | 6.16 | % | |
Russell 1000® Value Index†† | |
Average annual total return | | | –6.82 | % | | | 7.17 | % | | | 10.50 | % | | | 7.79 | % | |
Russell 1000® Index†† | |
Average annual total return | | | –13.04 | % | | | 11.00 | % | | | 12.82 | % | | | 9.45 | % | |
Average annual total returns with sales charge and CDSC shown for Class A and Class C shares, respectively, have been adjusted to reflect the applicable sales charges of each specific class. Returns for Class A reflect the maximum initial sales charge of 5.25%. Class C shares have no adjustment for sales charges, but redemptions within one year of purchase may be subject to a CDSC of 1%. Average annual total returns without sales charge or CDSC do not reflect the sales charges. Had the sales charge or CDSC been included, the Fund's returns would have been lower.
† The Fund invests primarily in equity securities of companies with market capitalizations similar to the Russell 1000® Index.
†† See index descriptions in the Fund Information section.
††† Fund returns during certain periods shown reflect a fee waiver and/or expense reimbursement. Without waiver/reimbursement, returns would have been lower. Returns shown include the reinvestment of all dividends.
* Commencement of Class I, Class A and Class C.
Past performance is not indicative of future results and the graph and table do not reflect the deduction of taxes that a shareholder would pay on Fund distributions or the redemption of Fund shares.
The performance shown represents past performance. Past performance is no guarantee of future results and current performance may be higher or lower than the performance shown. Investment results and principal value will fluctuate so that shares, when redeemed, may be worth more or less than their original cost. To obtain performance data current to the most recent month-end, access our website at www.hwcm.com.
The gross expense ratio for the year ended June 30, 2022 is 1.01% for Class I shares, 1.22% for Class A shares and 1.98% for Class C shares, respectively.
6
LARGE CAP VALUE FUND
Total Return Based on a $10,000 Investment
Comparative Results†††
For Periods ended June 30, 2022 | | 1 Year | | 5 Years | | 10 Years | | Since
6/24/87* | |
Class I | |
Average annual total return | | | –9.31 | % | | | 6.56 | % | | | 10.91 | % | | | 8.81 | % | |
Class A | |
Average annual total return (with sales charge) | | | –14.28 | % | | | 5.15 | % | | | 10.04 | % | | | 8.39 | % | |
Average annual total return (without sales charge) | | | –9.53 | % | | | 6.29 | % | | | 10.64 | % | | | 8.56 | % | |
Class C | |
Average annual total return (with CDSC) | | | –11.07 | % | | | 5.53 | % | | | 9.82 | % | | | 7.75 | % | |
Average annual total return (without CDSC) | | | –10.17 | % | | | 5.53 | % | | | 9.82 | % | | | 7.75 | % | |
Class Z | |
Average annual total return | | | –9.22 | % | | | 6.63 | % | | | 10.95 | % | | | 8.82 | % | |
Russell 1000® Value Index†† | |
Average annual total return | | | –6.82 | % | | | 7.17 | % | | | 10.50 | % | | | 9.48 | % | |
Russell 1000® Index†† | |
Average annual total return | | | –13.04 | % | | | 11.00 | % | | | 12.82 | % | | | 9.88 | % | |
Returns shown for Class A, Class C, and Class Z shares for the periods prior to their inception are derived from the historical performance of Class I shares of the Fund during such periods and have been adjusted to reflect the higher total annual operating expenses of Class A and Class C shares. (Inception dates: Class A — 10/26/01; Class C — 2/4/02; Class Z — 9/30/19.)
Average annual total returns with sales charge and CDSC shown for Class A and Class C shares, respectively, have been adjusted to reflect the applicable sales charges of each specific class. Returns for Class A reflect the maximum initial sales charge of 5.25%. Class C shares have no adjustment for sales charges, but redemptions within one year of purchase may be subject to a CDSC of 1%. Average annual total returns without sales charge or CDSC do not reflect the sales charges. Had the sales charge or CDSC been included, the Fund's returns would have been lower.
† The Fund invests primarily in equity securities of companies with market capitalizations similar to the Russell 1000® Index.
†† See index descriptions in the Fund Information section.
††† Fund returns during certain periods shown reflect a fee waiver and/or expense reimbursement. Without waiver/reimbursement, returns would have been lower. Returns shown include the reinvestment of all dividends.
* Commencement of Class I is 6/24/87. Average annual total return for the Russell 1000® Value Index reflects a beginning date of 6/30/87.
Past performance is not indicative of future results and the graph and table do not reflect the deduction of taxes that a shareholder would pay on Fund distributions or the redemption of Fund shares.
The performance shown represents past performance. Past performance is no guarantee of future results and current performance may be higher or lower than the performance shown. Investment results and principal value will fluctuate so that shares, when redeemed, may be worth more or less than their original cost. To obtain performance data current to the most recent month-end, access our website at www.hwcm.com.
The gross expense ratio for the year ended June 30, 2022 is 0.97% for Class I shares, 1.18% for Class A shares, 1.91% for Class C shares and 0.86% for Class Z shares, respectively.
7
MID-CAP VALUE FUND
Total Return Based on a $10,000 Investment
Comparative Results†††
For Periods ended June 30, 2022 | | 1 Year | | 5 Years | | 10 Years | | Since
1/2/97* | |
Class I | |
Average annual total return | | | –2.34 | % | | | 4.88 | % | | | 8.96 | % | | | 10.72 | % | |
Class A | |
Average annual total return (with sales charge) | | | –7.65 | % | | | 3.53 | % | | | 8.12 | % | | | 10.22 | % | |
Average annual total return (without sales charge) | | | –2.54 | % | | | 4.66 | % | | | 8.71 | % | | | 10.45 | % | |
Class C | |
Average annual total return (with CDSC) | | | –4.26 | % | | | 3.86 | % | | | 7.89 | % | | | 9.65 | % | |
Average annual total return (without CDSC) | | | –3.29 | % | | | 3.86 | % | | | 7.89 | % | | | 9.65 | % | |
Class Z | |
Average annual total return | | | –2.23 | % | | | 4.96 | % | | | 9.00 | % | | | 10.73 | % | |
Russell Midcap® Value Index†† | |
Average annual total return | | | –10.00 | % | | | 6.27 | % | | | 10.62 | % | | | 9.77 | % | |
Russell Midcap® Index†† | |
Average annual total return | | | –17.30 | % | | | 7.96 | % | | | 11.29 | % | | | 9.76 | % | |
Returns shown for Class A, Class C, and Class Z shares for the periods prior to their inception are derived from the historical performance of Class I shares of the Fund during such periods and have been adjusted to reflect the higher total annual operating expenses of Class A and Class C shares. (Inception dates: Class A, Class C — 1/2/01; Class Z — 9/30/19.)
Average annual total returns with sales charge and CDSC shown for Class A and Class C shares, respectively, have been adjusted to reflect the applicable sales charges of each specific class. Returns for Class A reflect the maximum initial sales charge of 5.25%. Class C shares have no adjustment for sales charges, but redemptions within one year of purchase may be subject to a CDSC of 1%. Average annual total returns without sales charge or CDSC do not reflect the sales charges. Had the sales charge or CDSC been included, the Fund's returns would have been lower.
† The Fund invests primarily in equity securities of companies with market capitalizations similar to the Russell Midcap® Index.
†† See index descriptions in the Fund Information section.
††† Fund returns during certain periods shown reflect a fee waiver and/or expense reimbursement. Without waiver/reimbursement, returns would have been lower. Returns shown include the reinvestment of all dividends.
* Commencement of Class I.
Past performance is not indicative of future results and the graph and table do not reflect the deduction of taxes that a shareholder would pay on Fund distributions or the redemption of Fund shares.
The performance shown represents past performance. Past performance is no guarantee of future results and current performance may be higher or lower than the performance shown. Investment results and principal value will fluctuate so that shares, when redeemed, may be worth more or less than their original cost. To obtain performance data current to the most recent month-end, access our website at www.hwcm.com.
The gross expense ratio for the year ended June 30, 2022 is 1.01% for Class I shares, 1.21% for Class A shares, 1.97% for Class C shares and 0.87% for Class Z shares, respectively.
8
SMALL CAP VALUE FUND
Total Return Based on a $10,000 Investment

Comparative Results†††
For Periods ended June 30, 2022 | | 1 Year | | 5 Years | | 10 Years | | Since
9/20/85* | |
Class I | |
Average annual total return | | | –3.42 | % | | | 6.30 | % | | | 10.37 | % | | | 10.91 | % | |
Class A | |
Average annual total return (with sales charge) | | | –8.62 | % | | | 4.94 | % | | | 9.52 | % | | | 10.50 | % | |
Average annual total return (without sales charge) | | | –3.56 | % | | | 6.08 | % | | | 10.11 | % | | | 10.66 | % | |
Class C | |
Average annual total return (with CDSC) | | | –5.21 | % | | | 5.30 | % | | | 9.30 | % | | | 9.86 | % | |
Average annual total return (without CDSC) | | | –4.25 | % | | | 5.30 | % | | | 9.30 | % | | | 9.86 | % | |
Class Z | |
Average annual total return | | | –3.22 | % | | | 6.41 | % | | | 10.42 | % | | | 10.92 | % | |
Russell 2000® Value Index†† | |
Average annual total return | | | –16.28 | % | | | 4.89 | % | | | 9.05 | % | | | 10.27 | % | |
Russell 2000® Index†† | |
Average annual total return | | | –25.20 | % | | | 5.17 | % | | | 9.35 | % | | | 9.24 | % | |
Returns shown for Class A, Class C, and Class Z shares for the periods prior to their inception are derived from the historical performance of Class I shares of the Fund during such periods and have been adjusted to reflect the higher total annual operating expenses of Class A and Class C shares. (Inception dates: Class A — 10/6/00; Class C — 2/4/02: Class Z — 9/30/19.)
Average annual total returns with sales charge and CDSC shown for Class A and Class C shares, respectively, have been adjusted to reflect the applicable sales charges of each specific class. Returns for Class A reflect the maximum initial sales charge of 5.25%. Class C shares have no adjustment for sales charges, but redemptions within one year of purchase may be subject to a CDSC of 1%. Average annual total returns without sales charge or CDSC do not reflect the sales charges. Had the sales charge or CDSC been included, the Fund's returns would have been lower.
† The Fund invests primarily in equity securities of companies with market capitalizations similar to the Russell 2000® Index.
†† See index descriptions in the Fund Information section.
††† Fund returns during certain periods shown reflect a fee waiver and/or expense reimbursement. Without waiver/reimbursement, returns would have been lower. Returns shown include the reinvestment of all dividends.
* Commencement of Class I is 9/20/85. Average annual total return for the Russell 2000® Value Index reflects a beginning date of 9/30/85.
Past performance is not indicative of future results and the graph and table do not reflect the deduction of taxes that a shareholder would pay on Fund distributions or the redemption of Fund shares.
The performance shown represents past performance. Past performance is no guarantee of future results and current performance may be higher or lower than the performance shown. Investment results and principal value will fluctuate so that shares, when redeemed, may be worth more or less than their original cost. To obtain performance data current to the most recent month-end, access our website at www.hwcm.com.
The gross expense ratio for the year ended June 30, 2022 is 1.06% for Class I shares, 1.21% for Class A shares, 1.94% for Class C shares and 0.86% for Class Z shares, respectively.
9
SMALL CAP DIVERSIFIED VALUE FUND
Total Return Based on a $10,000 Investment
Comparative Results†††
For Periods ended June 30, 2022 | | 1 Year | | 5 Years | | Since
6/30/14* | |
Class I | |
Average annual total return | | | –9.34 | % | | | 6.44 | % | | | 7.37 | % | |
Class A | |
Average annual total return (with sales charge) | | | –14.31 | % | | | 5.05 | % | | | 6.38 | % | |
Average annual total return (without sales charge) | | | –9.57 | % | | | 6.19 | % | | | 7.09 | % | |
Class Z | |
Average annual total return | | | –9.38 | % | | | 6.44 | % | | | 7.36 | % | |
Russell 2000® Value Index†† | |
Average annual total return | | | –16.28 | % | | | 4.89 | % | | | 5.68 | % | |
Russell 2000® Index†† | |
Average annual total return | | | –25.20 | % | | | 5.17 | % | | | 5.98 | % | |
Returns shown for Class Z shares for the periods prior to its inception are derived from the historical performance of Class I shares of the Fund during such periods. (Inception date: Class Z — 9/30/19.)
Average annual total returns with sales charge shown for Class A shares have been adjusted to reflect the applicable sales charge of the class. Returns for Class A reflect the maximum initial sales charge of 5.25%. Average annual total returns without sales charge do not reflect the sales charge. Had the sales charge been included, the Fund's returns would have been lower.
† The Fund invests primarily in equity securities of companies with market capitalizations similar to the Russell 2000® Index.
†† See index descriptions in the Fund Information section.
††† Fund returns during certain periods shown reflect a fee waiver and/or expense reimbursement. Without waiver/reimbursement, returns would have been lower. Returns shown include the reinvestment of all dividends.
* Commencement of Class I and Class A.
Past performance is not indicative of future results and the graph and table do not reflect the deduction of taxes that a shareholder would pay on Fund distributions or the redemption of Fund shares.
The performance shown represents past performance. Past performance is no guarantee of future results and current performance may be higher or lower than the performance shown. Investment results and principal value will fluctuate so that shares, when redeemed, may be worth more or less than their original cost. To obtain performance data current to the most recent month-end, access our website at www.hwcm.com.
The gross expense ratio for the year ended June 30, 2022 is 0.87% for Class I shares, 1.15% for Class A shares and 0.76% for Class Z shares, respectively.
10
GLOBAL VALUE FUND
Total Return Based on a $10,000 Investment

Comparative Results†††
For Periods ended June 30, 2022 | | 1 Year | | 5 Years | | Since
12/31/12* | |
Class I | |
Average annual total return | | | –11.86 | % | | | 3.71 | % | | | 7.44 | % | |
Class A | |
Average annual total return (with sales charge) | | | –16.69 | % | | | 2.34 | % | | | 6.57 | % | |
Average annual total return (without sales charge) | | | –12.07 | % | | | 3.45 | % | | | 7.18 | % | |
MSCI World Index†† | |
Average annual total return | | | –14.34 | % | | | 7.67 | % | | | 9.01 | % | |
Returns shown for Class A shares for the periods prior to its inception are derived from the historical performance of Class I shares of the Fund during such periods and have been adjusted to reflect the higher total annual operating expenses of the class. (Inception date: Class A — 8/30/13.)
Average annual total returns with sales charge shown for Class A shares have been adjusted to reflect the applicable sales charge of the class. Returns for Class A reflect the maximum initial sales charge of 5.25%. Average annual total returns without sales charge do not reflect the sales charge. Had the sales charge been included, the Fund's returns would have been lower.
† The Fund invests primarily in U.S. and non-U.S. companies.
†† See index description in the Fund Information section.
††† Fund returns during certain periods shown reflect a fee waiver and/or expense reimbursement. Without waiver/reimbursement, returns would have been lower. Returns shown include the reinvestment of all dividends.
* Commencement of Class I.
Past performance is not indicative of future results and the graph and table do not reflect the deduction of taxes that a shareholder would pay on Fund distributions or the redemption of Fund shares.
The performance shown represents past performance. Past performance is no guarantee of future results and current performance may be higher or lower than the performance shown. Investment results and principal value will fluctuate so that shares, when redeemed, may be worth more or less than their original cost. To obtain performance data current to the most recent month-end, access our website at www.hwcm.com.
The gross expense ratio for the year ended June 30, 2022 is 1.22% for Class I shares and 1.46% for Class A shares, respectively.
11
INTERNATIONAL VALUE FUND
Total Return Based on a $10,000 Investment
Comparative Results†††
For Periods ended June 30, 2022 | | 1 Year | | 5 Years | | Since
12/31/15* | |
Class I | |
Average annual total return | | | –9.82 | % | | | 1.17 | % | | | 4.18 | % | |
MSCI World ex-USA Index†† | |
Average annual total return | | | –16.76 | % | | | 2.66 | % | | | 4.39 | % | |
† The Fund invests primarily in non-U.S. companies.
†† See index description in the Fund Information section.
††† Fund returns during certain periods shown reflect a fee waiver and/or expense reimbursement. Without waiver/reimbursement, returns would have been lower. Returns shown include the reinvestment of all dividends.
* Commencement of Class I.
Past performance is not indicative of future results and the graph and table do not reflect the deduction of taxes that a shareholder would pay on Fund distributions or the redemption of Fund shares.
The performance shown represents past performance. Past performance is no guarantee of future results and current performance may be higher or lower than the performance shown. Investment results and principal value will fluctuate so that shares, when redeemed, may be worth more or less than their original cost. To obtain performance data current to the most recent month-end, access our website at www.hwcm.com.
The gross expense ratio for the year ended June 30, 2022 is 4.87% for Class I shares.
12
INTERNATIONAL SMALL CAP DIVERSIFIED VALUE FUND
Total Return Based on a $10,000 Investment

Comparative Results†††
For Period ended June 30, 2022 | | 1 Year | | Since
6/30/20* | |
Class I | |
Average annual total return | | | ��14.28 | % | | | 13.99 | % | |
MSCI World ex-USA Small Cap Index†† | |
Average annual total return | | | –23.02 | % | | | 4.65 | % | |
† The Fund invests primarily in equity securities of non-U.S. companies with market capitalizations similar to the MSCI World ex-USA Small Cap Index.
†† See index description in the Fund Information section.
††† Fund returns during certain periods shown reflect a fee waiver and/or expense reimbursement. Without waiver/reimbursement, returns would have been lower. Returns shown include the reinvestment of all dividends.
* Commencement of Class I.
Past performance is not indicative of future results and the graph and table do not reflect the deduction of taxes that a shareholder would pay on Fund distributions or the redemption of Fund shares.
The performance shown represents past performance. Past performance is no guarantee of future results and current performance may be higher or lower than the performance shown. Investment results and principal value will fluctuate so that shares, when redeemed, may be worth more or less than their original cost. To obtain performance data current to the most recent month-end, access our website at www.hwcm.com.
The gross expense ratio for the year ended June 30, 2022 is 4.23% for Class I shares.
13
VALUE OPPORTUNITIES FUND
Total Return Based on a $10,000 Investment
Comparative Results†††
For Periods ended June 30, 2022 | | 1 Year | | 5 Years | | 10 Years | | Since
12/31/02* | |
Class I | |
Average annual total return | | | –11.50 | % | | | 7.31 | % | | | 11.27 | % | | | 11.42 | % | |
Class A | |
Average annual total return (with sales charge) | | | –16.34 | % | | | 5.89 | % | | | 10.40 | % | | | 10.88 | % | |
Average annual total return (without sales charge) | | | –11.72 | % | | | 7.03 | % | | | 11.00 | % | | | 11.18 | % | |
Class C | |
Average annual total return (with CDSC) | | | –13.11 | % | | | 6.26 | % | | | 10.18 | % | | | 10.34 | % | |
Average annual total return (without CDSC) | | | –12.34 | % | | | 6.26 | % | | | 10.18 | % | | | 10.34 | % | |
Class Z | |
Average annual total return | | | –11.40 | % | | | 7.36 | % | | | 11.30 | % | | | 11.43 | % | |
Russell 3000® Value Index†† | |
Average annual total return | | | –7.46 | % | | | 7.01 | % | | | 10.39 | % | | | 8.76 | % | |
Russell 3000® Index†† | |
Average annual total return | | | –13.87 | % | | | 10.60 | % | | | 12.57 | % | | | 10.02 | % | |
Returns shown for Class C and Class Z shares for the periods prior to their inception are derived from the historical performance of Class I shares of the Fund during such periods and have been adjusted to reflect the higher total annual operating expenses of Class C shares. (Inception dates: Class C — 8/28/03; Class Z — 9/30/19.)
Average annual total returns with sales charge and CDSC shown for Class A and Class C shares, respectively, have been adjusted to reflect the applicable sales charges of each specific class. Returns for Class A reflect the maximum initial sales charge of 5.25%. Class C shares have no adjustment for sales charges, but redemptions within one year of purchase may be subject to a CDSC of 1%. Average annual total returns without sales charge or CDSC do not reflect the sales charge. Had the sales charge or CDSC been included, the Fund's returns would have been lower.
† The Fund invests primarily in securities of companies with strong capital appreciation potential.
†† See index descriptions in the Fund Information section.
††† Fund returns during certain periods shown reflect a fee waiver and/or expense reimbursement. Without waiver/reimbursement, returns would have been lower. Returns shown include the reinvestment of all dividends.
* Commencement of Class I and Class A.
Past performance is not indicative of future results and the graph and table do not reflect the deduction of taxes that a shareholder would pay on Fund distributions or the redemption of Fund shares.
The performance shown represents past performance. Past performance is no guarantee of future results and current performance may be higher or lower than the performance shown. Investment results and principal value will fluctuate so that shares, when redeemed, may be worth more or less than their original cost. To obtain performance data current to the most recent month-end, access our website at www.hwcm.com.
The gross expense ratio for the year ended June 30, 2022 is 0.94% for Class I shares, 1.20% for Class A shares, 1.91% for Class C shares and 0.86% for Class Z shares, respectively.
14
HIGH YIELD FUND
Total Return Based on a $10,000 Investment

Comparative Results†††
For Periods ended June 30, 2022 | | 1 Year | | 5 Years | | 10 Years | | Since
3/31/09* | |
Class I | |
Average annual total return | | | –11.12 | % | | | 1.06 | % | | | 3.95 | % | | | 7.43 | % | |
Class A | |
Average annual total return (with sales charge) | | | –14.61 | % | | | 0.02 | % | | | 3.28 | % | | | 6.79 | % | |
Average annual total return (without sales charge) | | | –11.28 | % | | | 0.78 | % | | | 3.67 | % | | | 7.10 | % | |
Class C | |
Average annual total return (with CDSC) | | | –12.79 | % | | | 0.08 | % | | | 2.92 | % | | | 6.37 | % | |
Average annual total return (without CDSC) | | | –11.94 | % | | | 0.08 | % | | | 2.92 | % | | | 6.37 | % | |
Class Z | |
Average annual total return | | | –11.04 | % | | | 1.14 | % | | | 3.99 | % | | | 7.46 | % | |
ICE BofA BB-B U.S. High Yield Constrained Index†† | |
Average annual total return | | | –12.20 | % | | | 2.07 | % | | | 4.34 | % | | | 7.76 | % | |
Returns shown for Class A, Class C, and Class Z shares for the periods prior to their inception are derived from the historical performance of Class I shares of the Fund during such periods and have been adjusted to reflect the higher total annual operating expenses of Class A and Class C shares. (Inception dates: Class A — 5/29/09; Class C — 12/31/12; Class Z — 3/29/18.)
Average annual total returns with sales charge and CDSC shown for Class A and Class C shares, respectively, have been adjusted to reflect the applicable sales charges of each specific class. Returns for Class A reflect the maximum initial sales charge of 3.75%. Class C shares have no adjustment for sales charges, but redemptions within one year of purchase may be subject to a CDSC of 1%. Average annual total returns without sales charge or CDSC do not reflect the sales charges. Had the sales charge or CDSC been included, the Fund's returns would have been lower.
† The Fund invests primarily in high yield securities.
†† See index description in the Fund Information section.
††† Fund returns during certain periods shown reflect a fee waiver and/or expense reimbursement. Without waiver/reimbursement, returns would have been lower. Returns shown include the reinvestment of all dividends.
* Commencement of Class I.
Past performance is not indicative of future results and the graph and table do not reflect the deduction of taxes that a shareholder would pay on Fund distributions or the redemption of Fund shares.
The performance shown represents past performance. Past performance is no guarantee of future results and current performance may be higher or lower than the performance shown. Investment results and principal value will fluctuate so that shares, when redeemed, may be worth more or less than their original cost. To obtain performance data current to the most recent month-end, access our website at www.hwcm.com.
The gross expense ratio for the year ended June 30, 2022 is 0.77% for Class I shares, 0.98% for Class A shares, 1.77% for Class C shares and 0.65% for Class Z shares, respectively.
15
Schedule of Investments — June 30, 2022
Hotchkis & Wiley Diversified Value Fund

Largest Equity Holdings | | Percent of
net assets | |
Citigroup, Inc. | | | 4.85 | % | |
General Electric Company | | | 4.76 | % | |
Wells Fargo & Company | | | 3.91 | % | |
American International Group, Inc. | | | 3.76 | % | |
Microsoft Corp. | | | 2.94 | % | |
Alphabet, Inc. | | | 2.78 | % | |
Oracle Corp. | | | 2.77 | % | |
The Goldman Sachs Group, Inc. | | | 2.71 | % | |
Elevance Health, Inc. | | | 2.70 | % | |
PPL Corp. | | | 2.66 | % | |
COMMON
STOCKS — 99.20% | | Shares
Held | | Value | |
COMMUNICATION SERVICES — 9.77%
Entertainment — 1.74% | |
Warner Bros. Discovery, Inc. (a) | | | 108,900 | | | $ | 1,461,438 | | |
Interactive Media & Services — 2.78% | |
Alphabet, Inc. (a) | | | 1,070 | | | | 2,331,808 | | |
Media — 3.90% | |
Comcast Corp. | | | 39,100 | | | | 1,534,284 | | |
News Corp. | | | 57,000 | | | | 888,060 | | |
Omnicom Group, Inc. | | | 6,100 | | | | 388,021 | | |
Paramount Global | | | 18,700 | | | | 461,516 | | |
| | | | 3,271,881 | | |
Wireless Telecommunication Services — 1.35% | |
Vodafone Group PLC — ADR | | | 72,963 | | | | 1,136,764 | | |
TOTAL COMMUNICATION SERVICES | | | 8,201,891 | | |
CONSUMER DISCRETIONARY — 6.60%
Auto Components — 3.27% | |
Adient PLC (a) | | | 8,974 | | | | 265,899 | | |
Aptiv PLC (a) | | | 7,000 | | | | 623,490 | | |
The Goodyear Tire & Rubber Company (a) | | | 20,600 | | | | 220,626 | | |
Magna International, Inc. | | | 29,800 | | | | 1,636,020 | | |
| | | | 2,746,035 | | |
Automobiles — 2.64% | |
General Motors Company (a) | | | 69,900 | | | | 2,220,024 | | |
Hotels, Restaurants & Leisure — 0.69% | |
Booking Holdings, Inc. (a) | | | 330 | | | | 577,167 | | |
TOTAL CONSUMER DISCRETIONARY | | | 5,543,226 | | |
CONSUMER STAPLES — 1.72%
Personal Products — 1.72% | |
Unilever PLC — ADR | | | 31,600 | | | | 1,448,228 | | |
TOTAL CONSUMER STAPLES | | | 1,448,228 | | |
| | | Shares
Held | | Value | |
ENERGY — 11.99%
Energy Equipment & Services — 3.66% | |
Baker Hughes Company | | | 14,000 | | | $ | 404,180 | | |
Halliburton Company | | | 32,700 | | | | 1,025,472 | | |
NOV, Inc. | | | 75,600 | | | | 1,278,396 | | |
Schlumberger NV | | | 10,300 | | | | 368,328 | | |
| | | | 3,076,376 | | |
Oil, Gas & Consumable Fuels — 8.33% | |
APA Corp. | | | 46,700 | | | | 1,629,830 | | |
Cenovus Energy, Inc. | | | 28,800 | | | | 547,488 | | |
Hess Corp. | | | 8,900 | | | | 942,866 | | |
Marathon Oil Corp. | | | 77,900 | | | | 1,751,192 | | |
Murphy Oil Corp. | | | 20,200 | | | | 609,838 | | |
Shell PLC — ADR | | | 28,962 | | | | 1,514,423 | | |
| | | | 6,995,637 | | |
TOTAL ENERGY | | | 10,072,013 | | |
FINANCIALS — 25.03%
Banks — 11.02% | |
Citigroup, Inc. | | | 88,574 | | | | 4,073,518 | | |
Citizens Financial Group, Inc. | | | 23,900 | | | | 852,991 | | |
First Citizens BancShares, Inc. | | | 1,592 | | | | 1,040,818 | | |
Wells Fargo & Company | | | 83,834 | | | | 3,283,778 | | |
| | | | 9,251,105 | | |
Capital Markets — 7.34% | |
The Bank of New York Mellon Corp. | | | 44,000 | | | | 1,835,240 | | |
Credit Suisse Group AG — ADR | | | 102,400 | | | | 580,608 | | |
The Goldman Sachs Group, Inc. | | | 7,650 | | | | 2,272,203 | | |
State Street Corp. | | | 24,000 | | | | 1,479,600 | | |
| | | | 6,167,651 | | |
Diversified Financial Services — 0.47% | |
Equitable Holdings, Inc. | | | 15,100 | | | | 393,657 | | |
The accompanying notes are an integral part of these financial statements.
16
Schedule of Investments — June 30, 2022
Hotchkis & Wiley Diversified Value Fund
| | | Shares
Held | | Value | |
Insurance — 6.20% | |
American International Group, Inc. | | | 61,700 | | | $ | 3,154,721 | | |
The Hartford Financial Services Group, Inc. | | | 21,300 | | | | 1,393,659 | | |
The Travelers Companies, Inc. | | | 3,900 | | | | 659,607 | | |
| | | | 5,207,987 | | |
TOTAL FINANCIALS | | | 21,020,400 | | |
HEALTH CARE — 10.99%
Health Care Equipment & Supplies — 1.59% | |
Medtronic PLC | | | 8,882 | | | | 797,159 | | |
Zimmer Biomet Holdings, Inc. | | | 5,100 | | | | 535,806 | | |
| | | | 1,332,965 | | |
Health Care Providers & Services — 7.66% | |
Centene Corp. (a) | | | 14,600 | | | | 1,235,306 | | |
CVS Health Corp. | | | 13,200 | | | | 1,223,112 | | |
Elevance Health, Inc. | | | 4,700 | | | | 2,268,126 | | |
HCA Healthcare, Inc. | | | 4,600 | | | | 773,076 | | |
Humana, Inc. | | | 2,000 | | | | 936,140 | | |
| | | | 6,435,760 | | |
Pharmaceuticals — 1.74% | |
GSK PLC — ADR | | | 15,300 | | | | 666,009 | | |
Sanofi — ADR | | | 15,800 | | | | 790,474 | | |
| | | | 1,456,483 | | |
TOTAL HEALTH CARE | | | 9,225,208 | | |
INDUSTRIALS — 13.52%
Aerospace & Defense — 2.22% | |
The Boeing Company (a) | | | 7,000 | | | | 957,040 | | |
Raytheon Technologies Corp. | | | 9,400 | | | | 903,434 | | |
| | | | 1,860,474 | | |
Air Freight & Logistics — 2.51% | |
FedEx Corp. | | | 9,300 | | | | 2,108,403 | | |
Construction & Engineering — 0.35% | |
Fluor Corp. (a) | | | 12,200 | | | | 296,948 | | |
Industrial Conglomerates — 4.76% | |
General Electric Company | | | 62,737 | | | | 3,994,465 | | |
Machinery — 3.68% | |
| CNH Industrial NV | | | 90,500 | | | | 1,048,895 | | |
Cummins, Inc. | | | 5,700 | | | | 1,103,121 | | |
Iveco Group NV (a) (v) | | | 20,620 | | | | 109,173 | | |
PACCAR, Inc. | | | 10,100 | | | | 831,634 | | |
| | | | 3,092,823 | | |
TOTAL INDUSTRIALS | | | 11,353,113 | | |
INFORMATION TECHNOLOGY — 15.59%
Communications Equipment — 3.50% | |
F5, Inc. (a) | | | 13,000 | | | | 1,989,520 | | |
Telefonaktiebolaget LM Ericsson — ADR | | | 127,600 | | | | 944,240 | | |
| | | | 2,933,760 | | |
| | | Shares
Held | | Value | |
Electronic Equipment, Instruments & Components — 2.27% | |
Corning, Inc. | | | 33,300 | | | $ | 1,049,283 | | |
TE Connectivity Ltd. | | | 7,600 | | | | 859,940 | | |
| | | | 1,909,223 | | |
IT Services — 1.09% | |
Cognizant Technology Solutions Corp. | | | 7,000 | | | | 472,430 | | |
Fiserv, Inc. (a) | | | 5,000 | | | | 444,850 | | |
| | | | 917,280 | | |
Semiconductors & Semiconductor Equipment — 0.98% | |
Micron Technology, Inc. | | | 14,800 | | | | 818,144 | | |
Software — 7.75% | |
Microsoft Corp. | | | 9,600 | | | | 2,465,568 | | |
Oracle Corp. | | | 33,300 | | | | 2,326,671 | | |
Workday, Inc. (a) | | | 12,300 | | | | 1,716,834 | | |
| | | | 6,509,073 | | |
TOTAL INFORMATION TECHNOLOGY | | | 13,087,480 | | |
MATERIALS — 1.33%
Chemicals — 0.94% | |
Olin Corp. | | | 17,000 | | | | 786,760 | | |
Containers & Packaging — 0.39% | |
International Paper Company | | | 7,900 | | | | 330,457 | | |
TOTAL MATERIALS | | | 1,117,217 | | |
UTILITIES — 2.66%
Electric Utilities — 2.66% | |
PPL Corp. | | | 82,300 | | | | 2,232,799 | | |
TOTAL UTILITIES | | | 2,232,799 | | |
Total common stocks
(Cost $79,535,935) | | | | | 83,301,575 | | |
Total long-term investments
(Cost $79,535,935) | | | | | 83,301,575 | | |
SHORT-TERM
INVESTMENTS — 0.80% | | Principal
Amount | | | |
Time Deposits — 0.80% | |
Barclays PLC, 0.91%, 07/01/2022* | | $ | 670,660 | | | | 670,660 | | |
Total short-term investments
(Cost $670,660) | | | 670,660 | | |
Total investments — 100.00%
(Cost $80,206,595) | | | | | 83,972,235 | | |
Liabilities in excess of other assets — 0.00% | | | | | (3,984 | ) | |
Net assets — 100.00% | | $ | 83,968,251 | | |
(a) — Non-income producing security.
(v) — Security was fair valued as a result of market movements following the close of local trading using a third-party vendor's proprietary fair value pricing model. The total market value of these securities was $109,173, which represented 0.13% of net assets. See Security Valuation in Note 1 in Notes to the Financial Statements.
ADR — American Depositary Receipt
* — Invested through a cash management account administered by Brown Brothers Harriman & Co.
The accompanying notes are an integral part of these financial statements.
17
Schedule of Investments — June 30, 2022
Hotchkis & Wiley Large Cap Value Fund
Largest Equity Holdings | | Percent of
net assets | |
General Electric Company | | | 4.88 | % | |
Citigroup, Inc. | | | 4.86 | % | |
Wells Fargo & Company | | | 3.91 | % | |
American International Group, Inc. | | | 3.70 | % | |
General Motors Company | | | 3.37 | % | |
Elevance Health, Inc. | | | 3.17 | % | |
F5, Inc. | | | 3.13 | % | |
Oracle Corp. | | | 3.12 | % | |
The Goldman Sachs Group, Inc. | | | 2.97 | % | |
FedEx Corp. | | | 2.85 | % | |
COMMON
STOCKS — 98.04% | | Shares
Held | | Value | |
COMMUNICATION SERVICES — 6.70%
Entertainment — 2.03% | |
Warner Bros. Discovery, Inc. (a) | | | 611,400 | | | $ | 8,204,988 | | |
Interactive Media & Services — 0.97% | |
Alphabet, Inc. (a) | | | 1,800 | | | | 3,922,668 | | |
Media — 2.20% | |
Comcast Corp. | | | 227,000 | | | | 8,907,480 | | |
Wireless Telecommunication Services — 1.50% | |
Vodafone Group PLC — ADR | | | 390,944 | | | | 6,090,908 | | |
TOTAL COMMUNICATION SERVICES | | | 27,126,044 | | |
CONSUMER DISCRETIONARY — 6.91%
Auto Components — 2.76% | |
Adient PLC (a) | | | 44,891 | | | | 1,330,120 | | |
Magna International, Inc. | | | 179,300 | | | | 9,843,570 | | |
| | | | 11,173,690 | | |
Automobiles — 3.37% | |
General Motors Company (a) | | | 430,300 | | | | 13,666,328 | | |
Hotels, Restaurants & Leisure — 0.78% | |
Booking Holdings, Inc. (a) | | | 1,800 | | | | 3,148,182 | | |
TOTAL CONSUMER DISCRETIONARY | | | 27,988,200 | | |
CONSUMER STAPLES — 1.73%
Personal Products — 1.73% | |
Unilever PLC — ADR | | | 152,500 | | | | 6,989,075 | | |
TOTAL CONSUMER STAPLES | | | 6,989,075 | | |
ENERGY — 13.73%
Energy Equipment & Services — 4.17% | |
Baker Hughes Company | | | 70,100 | | | | 2,023,787 | | |
Halliburton Company | | | 109,500 | | | | 3,433,920 | | |
NOV, Inc. | | | 508,200 | | | | 8,593,662 | | |
Schlumberger NV | | | 79,300 | | | | 2,835,768 | | |
| | | | 16,887,137 | | |
| | | Shares
Held | | Value | |
Oil, Gas & Consumable Fuels — 9.56% | |
APA Corp. | | | 236,400 | | | $ | 8,250,360 | | |
Hess Corp. | | | 54,100 | | | | 5,731,354 | | |
Marathon Oil Corp. | | | 431,200 | | | | 9,693,376 | | |
Murphy Oil Corp. | | | 90,570 | | | | 2,734,308 | | |
Shell PLC — ADR | | | 160,872 | | | | 8,411,997 | | |
Suncor Energy, Inc. | | | 110,000 | | | | 3,857,700 | | |
| | | | 38,679,095 | | |
TOTAL ENERGY | | | 55,566,232 | | |
FINANCIALS — 25.51%
Banks — 10.27% | |
Citigroup, Inc. | | | 427,788 | | | | 19,673,970 | | |
Citizens Financial Group, Inc. | | | 169,700 | | | | 6,056,593 | | |
Wells Fargo & Company | | | 403,863 | | | | 15,819,314 | | |
| | | | 41,549,877 | | |
Capital Markets — 8.04% | |
The Bank of New York Mellon Corp. | | | 228,000 | | | | 9,509,880 | | |
Credit Suisse Group AG — ADR (l) | | | 535,500 | | | | 3,036,285 | | |
The Goldman Sachs Group, Inc. | | | 40,500 | | | | 12,029,310 | | |
State Street Corp. | | | 129,200 | | | | 7,965,180 | | |
| | | | 32,540,655 | | |
Diversified Financial Services — 0.50% | |
Equitable Holdings, Inc. | | | 77,600 | | | | 2,023,032 | | |
Insurance — 6.70% | |
American International Group, Inc. | | | 292,900 | | | | 14,975,977 | | |
The Hartford Financial Services Group, Inc. | | | 120,200 | | | | 7,864,686 | | |
The Travelers Companies, Inc. | | | 25,300 | | | | 4,278,989 | | |
| | | | 27,119,652 | | |
TOTAL FINANCIALS | | | 103,233,216 | | |
HEALTH CARE — 10.69%
Health Care Equipment & Supplies — 2.47% | |
Medtronic PLC | | | 73,400 | | | | 6,587,650 | | |
Zimmer Biomet Holdings, Inc. | | | 32,700 | | | | 3,435,462 | | |
| | | | 10,023,112 | | |
The accompanying notes are an integral part of these financial statements.
18
Schedule of Investments — June 30, 2022
Hotchkis & Wiley Large Cap Value Fund
| | | Shares
Held | | Value | |
Health Care Providers & Services — 5.91% | |
CVS Health Corp. | | | 67,000 | | | $ | 6,208,220 | | |
Elevance Health, Inc. | | | 26,600 | | | | 12,836,628 | | |
HCA Healthcare, Inc. | | | 29,000 | | | | 4,873,740 | | |
| | | | 23,918,588 | | |
Pharmaceuticals — 2.31% | |
GSK PLC — ADR | | | 121,300 | | | | 5,280,189 | | |
Sanofi — ADR | | | 81,200 | | | | 4,062,436 | | |
| | | | 9,342,625 | | |
TOTAL HEALTH CARE | | | 43,284,325 | | |
INDUSTRIALS — 13.19%
Aerospace & Defense — 0.64% | |
Huntington Ingalls Industries, Inc. | | | 11,800 | | | | 2,570,276 | | |
Air Freight & Logistics — 2.85% | |
FedEx Corp. | | | 50,900 | | | | 11,539,539 | | |
Industrial Conglomerates — 4.88% | |
General Electric Company | | | 310,387 | | | | 19,762,340 | | |
Machinery — 4.82% | |
| CNH Industrial NV | | | 486,700 | | | | 5,640,853 | | |
Cummins, Inc. | | | 33,800 | | | | 6,541,314 | | |
Iveco Group NV (a) (v) | | | 109,000 | | | | 577,104 | | |
PACCAR, Inc. | | | 56,300 | | | | 4,635,742 | | |
Stanley Black & Decker, Inc. | | | 20,200 | | | | 2,118,172 | | |
| | | | 19,513,185 | | |
TOTAL INDUSTRIALS | | | 53,385,340 | | |
INFORMATION TECHNOLOGY — 15.36%
Communications Equipment — 4.74% | |
F5, Inc. (a) | | | 82,900 | | | | 12,687,016 | | |
Telefonaktiebolaget LM Ericsson — ADR | | | 876,500 | | | | 6,486,100 | | |
| | | | 19,173,116 | | |
Electronic Equipment, Instruments & Components — 2.42% | |
Corning, Inc. | | | 160,800 | | | | 5,066,808 | | |
TE Connectivity Ltd. | | | 41,600 | | | | 4,707,040 | | |
| | | | 9,773,848 | | |
IT Services — 2.44% | |
Amdocs Ltd. | | | 25,600 | | | | 2,132,736 | | |
Euronet Worldwide, Inc. (a) | | | 54,100 | | | | 5,441,919 | | |
Fiserv, Inc. (a) | | | 25,900 | | | | 2,304,323 | | |
| | | | 9,878,978 | | |
Software — 5.76% | |
Microsoft Corp. | | | 41,600 | | | | 10,684,128 | | |
Oracle Corp. | | | 180,900 | | | | 12,639,483 | | |
| | | | 23,323,611 | | |
TOTAL INFORMATION TECHNOLOGY | | | 62,149,553 | | |
| | | Shares
Held | | Value | |
MATERIALS — 1.53%
Chemicals — 0.96% | |
Olin Corp. | | | 84,400 | | | $ | 3,906,032 | | |
Containers & Packaging — 0.57% | |
International Paper Company | | | 54,800 | | | | 2,292,284 | | |
TOTAL MATERIALS | | | 6,198,316 | | |
UTILITIES — 2.69%
Electric Utilities — 2.69% | |
PPL Corp. | | | 401,700 | | | | 10,898,121 | | |
TOTAL UTILITIES | | | 10,898,121 | | |
Total common stocks
(Cost $372,190,241) | | | | | 396,818,422 | | |
Total long-term investments
(Cost $372,190,241) | | | | | 396,818,422 | | |
COLLATERAL FOR SECURITIES ON LOAN — 0.16% | |
Money Market Funds — 0.16% | |
Invesco Short-Term Investments Trust
Government & Agency Portfolio —
Institutional Class, 1.38%^ | | | 638,435 | | | | 638,435 | | |
Total collateral for securities on loan
(Cost $638,435) | | | 638,435 | | |
SHORT-TERM
INVESTMENTS — 1.91% | | Principal
Amount | | | |
Time Deposits — 1.91% | |
Barclays PLC, 0.91%, 07/01/2022* | | $ | 7,730,917 | | | | 7,730,917 | | |
Citigroup, Inc., (0.78)%, 07/01/2022* | | EUR | 97 | | | | 102 | | |
Total short-term investments
(Cost $7,731,022) | | | 7,731,019 | | |
Total investments — 100.11%
(Cost $380,559,698) | | | | | 405,187,876 | | |
Liabilities in excess of other assets — (0.11)% | | | | | (464,055 | ) | |
Net assets — 100.00% | | $ | 404,723,821 | | |
(a) — Non-income producing security.
(l) — All or a portion of this security is on loan. The total market value of securities on loan was $621,267. The remaining contractual maturity of all of the securities lending transactions is overnight and continuous.
(v) — Security was fair valued as a result of market movements following the close of local trading using a third-party vendor's proprietary fair value pricing model. The total market value of these securities was $577,104, which represented 0.14% of net assets. See Security Valuation in Note 1 in Notes to the Financial Statements.
ADR — American Depositary Receipt
^ — Rate shown is the 7-day yield as of June 30, 2022.
* — Invested through a cash management account administered by Brown Brothers Harriman & Co.
The accompanying notes are an integral part of these financial statements.
19
Schedule of Investments — June 30, 2022
Hotchkis & Wiley Mid-Cap Value Fund
Largest Equity Holdings | | Percent of
net assets | |
Kosmos Energy Ltd. | | | 5.21 | % | |
Popular, Inc. | | | 4.82 | % | |
Fluor Corp. | | | 4.56 | % | |
First Citizens BancShares, Inc. | | | 4.28 | % | |
Citizens Financial Group, Inc. | | | 3.54 | % | |
APA Corp. | | | 3.29 | % | |
American International Group, Inc. | | | 3.18 | % | |
Adient PLC | | | 2.96 | % | |
Vistra Corp. | | | 2.57 | % | |
State Street Corp. | | | 2.44 | % | |
COMMON
STOCKS — 99.43% | | Shares
Held | | Value | |
COMMUNICATION SERVICES — 4.75%
Entertainment — 2.10% | |
Warner Bros. Discovery, Inc. (a) | | | 678,100 | | | $ | 9,100,102 | | |
Media — 2.65% | |
News Corp. | | | 225,500 | | | | 3,513,290 | | |
Omnicom Group, Inc. | | | 61,200 | | | | 3,892,932 | | |
Paramount Global | | | 166,800 | | | | 4,116,624 | | |
| | | | 11,522,846 | | |
TOTAL COMMUNICATION SERVICES | | | 20,622,948 | | |
CONSUMER DISCRETIONARY — 10.29%
Auto Components — 6.47% | |
Adient PLC (a) | | | 433,100 | | | | 12,832,753 | | |
The Goodyear Tire & Rubber Company (a) | | | 447,800 | | | | 4,795,938 | | |
Lear Corp. | | | 11,400 | | | | 1,435,146 | | |
Magna International, Inc. | | | 163,900 | | | | 8,998,110 | | |
| | | | 28,061,947 | | |
Automobiles — 0.32% | |
Harley-Davidson, Inc. | | | 43,900 | | | | 1,389,874 | | |
Household Durables — 1.72% | |
Tri Pointe Homes, Inc. (a) | | | 58,900 | | | | 993,643 | | |
Whirlpool Corp. | | | 41,800 | | | | 6,473,566 | | |
| | | | 7,467,209 | | |
Specialty Retail — 1.78% | |
The Gap, Inc. | | | 126,000 | | | | 1,038,240 | | |
The ODP Corp. (a) | | | 221,145 | | | | 6,687,425 | | |
| | | | 7,725,665 | | |
TOTAL CONSUMER DISCRETIONARY | | | 44,644,695 | | |
CONSUMER STAPLES — 1.10%
Personal Products — 1.10% | |
Herbalife Nutrition Ltd. (a) | | | 233,000 | | | | 4,764,850 | | |
TOTAL CONSUMER STAPLES | | | 4,764,850 | | |
| | | Shares
Held | | Value | |
ENERGY — 20.14%
Energy Equipment & Services — 2.38% | |
Expro Group Holdings NV (a) | | | 73,983 | | | $ | 852,284 | | |
Halliburton Company | | | 135,600 | | | | 4,252,416 | | |
NOV, Inc. | | | 310,000 | | | | 5,242,100 | | |
| | | | 10,346,800 | | |
Oil, Gas & Consumable Fuels — 17.76% | |
APA Corp. | | | 409,600 | | | | 14,295,040 | | |
Capricorn Energy PLC (a) (v) | | | 3,741,475 | | | | 9,946,269 | | |
Cenovus Energy, Inc. | | | 250,700 | | | | 4,765,807 | | |
Kosmos Energy Ltd. (a) | | | 3,655,220 | | | | 22,625,812 | | |
Murphy Oil Corp. | | | 220,900 | | | | 6,668,971 | | |
Oasis Petroleum, Inc. | | | 49,300 | | | | 5,997,345 | | |
PDC Energy, Inc. | | | 140,500 | | | | 8,656,205 | | |
Range Resources Corp. (a) | | | 165,800 | | | | 4,103,550 | | |
| | | | 77,058,999 | | |
TOTAL ENERGY | | | 87,405,799 | | |
FINANCIALS — 27.20%
Banks — 13.41% | |
Citizens Financial Group, Inc. | | | 430,900 | | | | 15,378,821 | | |
First Citizens BancShares, Inc. | | | 28,387 | | | | 18,558,853 | | |
First Horizon Corp. | | | 151,600 | | | | 3,313,976 | | |
Popular, Inc. | | | 272,200 | | | | 20,940,346 | | |
| | | | 58,191,996 | | |
Capital Markets — 4.88% | |
Credit Suisse Group AG — ADR (l) | | | 1,067,600 | | | | 6,053,292 | | |
Lazard Ltd. | | | 42,000 | | | | 1,361,220 | | |
Northern Trust Corp. | | | 33,000 | | | | 3,183,840 | | |
State Street Corp. | | | 172,100 | | | | 10,609,965 | | |
| | | | 21,208,317 | | |
Consumer Finance — 1.37% | |
SLM Corp. | | | 373,400 | | | | 5,951,996 | | |
The accompanying notes are an integral part of these financial statements.
20
Schedule of Investments — June 30, 2022
Hotchkis & Wiley Mid-Cap Value Fund
| | | Shares
Held | | Value | |
Insurance — 7.54% | |
American International Group, Inc. | | | 270,300 | | | $ | 13,820,439 | | |
CNO Financial Group, Inc. | | | 450,000 | | | | 8,140,500 | | |
Enstar Group Ltd. (a) | | | 23,300 | | | | 4,985,734 | | |
The Hartford Financial Services Group, Inc. | | | 88,100 | | | | 5,764,383 | | |
| | | | 32,711,056 | | |
TOTAL FINANCIALS | | | 118,063,365 | | |
HEALTH CARE — 3.57%
Health Care Providers & Services — 2.99% | |
Centene Corp. (a) | | | 51,300 | | | | 4,340,493 | | |
Universal Health Services, Inc. | | | 85,900 | | | | 8,650,989 | | |
| | | | 12,991,482 | | |
Pharmaceuticals — 0.58% | |
Jazz Pharmaceuticals PLC (a) | | | 16,000 | | | | 2,496,160 | | |
TOTAL HEALTH CARE | | | 15,487,642 | | |
INDUSTRIALS — 15.84%
Air Freight & Logistics — 1.87% | |
Royal Mail PLC (v) | | | 2,452,200 | | | | 8,100,749 | | |
Commercial Services & Supplies — 1.13% | |
The Brink's Company | | | 80,600 | | | | 4,893,226 | | |
Construction & Engineering — 4.56% | |
Fluor Corp. (a) | | | 813,800 | | | | 19,807,892 | | |
Machinery — 4.58% | |
Allison Transmission Holdings, Inc. | | | 127,300 | | | | 4,894,685 | | |
| CNH Industrial NV | | | 661,500 | | | | 7,666,785 | | |
Iveco Group NV (a) (v) | | | 154,080 | | | | 815,781 | | |
PACCAR, Inc. | | | 51,300 | | | | 4,224,042 | | |
Stanley Black & Decker, Inc. | | | 21,900 | | | | 2,296,434 | | |
| | | | 19,897,727 | | |
Professional Services — 1.98% | |
KBR, Inc. | | | 111,900 | | | | 5,414,841 | | |
ManpowerGroup, Inc. | | | 41,500 | | | | 3,171,015 | | |
| | | | 8,585,856 | | |
Road & Rail — 1.72% | |
AMERCO | | | 15,600 | | | | 7,460,388 | | |
TOTAL INDUSTRIALS | | | 68,745,838 | | |
INFORMATION TECHNOLOGY — 8.73%
Communications Equipment — 4.37% | |
CommScope Holding Company, Inc. (a) | | | 259,100 | | | | 1,585,692 | | |
F5, Inc. (a) | | | 52,700 | | | | 8,065,208 | | |
Telefonaktiebolaget LM Ericsson — ADR | | | 1,260,300 | | | | 9,326,220 | | |
| | | | 18,977,120 | | |
Electronic Equipment, Instruments & Components — 3.30% | |
Arrow Electronics, Inc. (a) | | | 38,800 | | | | 4,349,092 | | |
Avnet, Inc. | | | 105,300 | | | | 4,515,264 | | |
Corning, Inc. | | | 173,900 | | | | 5,479,589 | | |
| | | | 14,343,945 | | |
| | | Shares
Held | | Value | |
IT Services — 1.06% | |
Euronet Worldwide, Inc. (a) | | | 45,600 | | | $ | 4,586,904 | | |
TOTAL INFORMATION TECHNOLOGY | | | 37,907,969 | | |
MATERIALS — 3.34%
Chemicals — 3.34% | |
Huntsman Corp. | | | 166,700 | | | | 4,725,945 | | |
Olin Corp. | | | 211,400 | | | | 9,783,592 | | |
TOTAL MATERIALS | | | 14,509,537 | | |
REAL ESTATE — 0.48%
Equity Real Estate Investment Trusts — 0.48% | |
Pebblebrook Hotel Trust | | | 43,100 | | | | 714,167 | | |
Vornado Realty Trust | | | 47,300 | | | | 1,352,307 | | |
TOTAL REAL ESTATE | | | 2,066,474 | | |
UTILITIES — 3.99%
Electric Utilities — 1.42% | |
NRG Energy, Inc. | | | 161,100 | | | | 6,149,187 | | |
Independent Power and Renewable Electricity
Producers — 2.57% | |
Vistra Corp. | | | 487,900 | | | | 11,148,515 | | |
TOTAL UTILITIES | | | 17,297,702 | | |
Total common stocks
(Cost $401,547,353) | | | | | 431,516,819 | | |
Total long-term investments
(Cost $401,547,353) | | | | | 431,516,819 | | |
COLLATERAL FOR SECURITIES ON LOAN — 0.15% | |
Money Market Funds — 0.15% | |
Invesco Short-Term Investments
Trust Government & Agency Portfolio —
Institutional Class, 1.38%^ | | | 661,045 | | | | 661,045 | | |
Total collateral for securities on loan
(Cost $661,045) | | | 661,045 | | |
SHORT-TERM
INVESTMENTS — 0.20% | | Principal
Amount | | | |
Time Deposits — 0.20% | |
Citigroup, Inc., (0.78)%, 07/01/2022* | | EUR | 470 | | | | 493 | | |
Citigroup, Inc., 0.91%, 07/01/2022* | | $ | 880,646 | | | | 880,646 | | |
Total short-term investments (Cost $881,148) | | | 881,139 | | |
Total investments — 99.78% (Cost $403,089,546) | | | | | 433,059,003 | | |
Other assets in excess of liabilities — 0.22% | | | | | 949,224 | | |
Net assets — 100.00% | | $ | 434,008,227 | | |
(a) — Non-income producing security.
(l) — All or a portion of this security is on loan. The total market value of securities on loan was $643,269. The remaining contractual maturity of all of the securities lending transactions is overnight and continuous.
The accompanying notes are an integral part of these financial statements.
21
Schedule of Investments — June 30, 2022
Hotchkis & Wiley Mid-Cap Value Fund
(v) — Security was fair valued as a result of market movements following the close of local trading using a third-party vendor's proprietary fair value pricing model. The total market value of these securities was $18,862,799, which represented 4.35% of net assets. See Security Valuation in Note 1 in Notes to the Financial Statements.
ADR — American Depositary Receipt
EUR — Euro
^ — Rate shown is the 7-day yield as of June 30, 2022.
* — Invested through a cash management account administered by Brown Brothers Harriman & Co.
The accompanying notes are an integral part of these financial statements.
22
Schedule of Investments — June 30, 2022
Hotchkis & Wiley Small Cap Value Fund

Largest Equity Holdings | | Percent of
net assets | |
Evercore, Inc. | | | 4.05 | % | |
Stagwell, Inc. | | | 3.84 | % | |
Popular, Inc. | | | 3.81 | % | |
Range Resources Corp. | | | 3.51 | % | |
Kosmos Energy Ltd. | | | 3.46 | % | |
SLM Corp. | | | 3.05 | % | |
Fluor Corp. | | | 3.01 | % | |
Points.com, Inc. | | | 2.95 | % | |
The Bank of NT Butterfield & Son Ltd. | | | 2.81 | % | |
Euronet Worldwide, Inc. | | | 2.75 | % | |
COMMON
STOCKS — 95.28% | | Shares
Held | | Value | |
COMMUNICATION SERVICES — 3.84%
Media — 3.84% | |
Stagwell, Inc. (a) | | | 3,919,900 | | | $ | 21,285,057 | | |
TOTAL COMMUNICATION SERVICES | | | 21,285,057 | | |
CONSUMER DISCRETIONARY — 11.17%
Auto Components — 2.72% | |
Adient PLC (a) | | | 509,200 | | | | 15,087,596 | | |
Automobiles — 1.57% | |
Harley-Davidson, Inc. | | | 157,400 | | | | 4,983,284 | | |
Thor Industries, Inc. | | | 49,600 | | | | 3,706,608 | | |
| | | | 8,689,892 | | |
Diversified Consumer Services — 1.04% | |
Adtalem Global Education, Inc. (a) | | | 160,800 | | | | 5,783,976 | | |
Hotels, Restaurants & Leisure — 0.32% | |
International Game Technology PLC | | | 94,200 | | | | 1,748,352 | | |
Internet & Catalog Retail — 2.95% | |
Points.com, Inc. (a) | | | 654,525 | | | | 16,356,580 | | |
Specialty Retail — 2.57% | |
The ODP Corp. (a) | | | 236,180 | | | | 7,142,083 | | |
Sonic Automotive, Inc. | | | 194,200 | | | | 7,113,546 | | |
| | | | 14,255,629 | | |
TOTAL CONSUMER DISCRETIONARY | | | 61,922,025 | | |
CONSUMER STAPLES — 0.53%
Personal Products — 0.53% | |
Herbalife Nutrition Ltd. (a) | | | 142,900 | | | | 2,922,305 | | |
TOTAL CONSUMER STAPLES | | | 2,922,305 | | |
ENERGY — 14.99%
Energy Equipment & Services — 2.51% | |
Expro Group Holdings NV (a) | | | 856,882 | | | | 9,871,281 | | |
NOV, Inc. | | | 237,900 | | | | 4,022,889 | | |
| | | | 13,894,170 | | |
Oil, Gas & Consumable Fuels — 12.48% | |
APA Corp. | | | 159,100 | | | | 5,552,590 | | |
Berry Corp. | | | 1,155,100 | | | | 8,801,862 | | |
| | | Shares
Held | | Value | |
Equitrans Midstream Corp. | | | 942,400 | | | $ | 5,993,664 | | |
Kinetik Holdings, Inc. (l) | | | 31,390 | | | | 1,071,654 | | |
Kosmos Energy Ltd. (a) | | | 3,101,700 | | | | 19,199,523 | | |
Murphy Oil Corp. | | | 215,900 | | | | 6,518,021 | | |
Range Resources Corp. (a) | | | 786,400 | | | | 19,463,400 | | |
Ranger Oil Corp. (a) | | | 71,400 | | | | 2,346,918 | | |
Rockhopper Exploration PLC (a) | | | 3,066,400 | | | | 253,826 | | |
| | | | 69,201,458 | | |
TOTAL ENERGY | | | 83,095,628 | | |
FINANCIALS — 24.86%
Banks — 9.79% | |
Associated Banc-Corp | | | 66,800 | | | | 1,219,768 | | |
The Bank of NT Butterfield & Son Ltd. | | | 499,300 | | | | 15,573,167 | | |
First BanCorp | | | 418,700 | | | | 5,405,417 | | |
First Hawaiian, Inc. | | | 484,900 | | | | 11,012,079 | | |
Popular, Inc. | | | 274,200 | | | | 21,094,206 | | |
| | | | 54,304,637 | | |
Capital Markets — 6.21% | |
Evercore, Inc. | | | 240,100 | | | | 22,475,761 | | |
Perella Weinberg Partners (l) | | | 645,300 | | | | 3,762,099 | | |
Stifel Financial Corp. | | | 145,800 | | | | 8,167,716 | | |
| | | | 34,405,576 | | |
Consumer Finance — 3.05% | |
SLM Corp. | | | 1,059,900 | | | | 16,894,806 | | |
Insurance — 5.53% | |
CNO Financial Group, Inc. | | | 121,900 | | | | 2,205,171 | | |
Enstar Group Ltd. (a) | | | 54,979 | | | | 11,764,407 | | |
Global Indemnity Group LLC | | | 316,036 | | | | 8,175,851 | | |
Horace Mann Educators Corp. | | | 221,600 | | | | 8,505,008 | | |
| | | | 30,650,437 | | |
Thrifts & Mortgage Finance — 0.28% | |
Luther Burbank Corp. | | | 117,800 | | | | 1,537,290 | | |
TOTAL FINANCIALS | | | 137,792,746 | | |
The accompanying notes are an integral part of these financial statements.
23
Schedule of Investments — June 30, 2022
Hotchkis & Wiley Small Cap Value Fund
| | | Shares
Held | | Value | |
HEALTH CARE — 1.77%
Health Care Providers & Services — 1.77% | |
Hanger, Inc. (a) | | | 687,300 | | | $ | 9,842,136 | | |
TOTAL HEALTH CARE | | | 9,842,136 | | |
INDUSTRIALS — 21.81%
Building Products — 0.53% | |
Masonite International Corp. (a) | | | 38,400 | | | | 2,950,272 | | |
Commercial Services & Supplies — 3.27% | |
The Brink's Company | | | 249,500 | | | | 15,147,145 | | |
MillerKnoll, Inc. | | | 70,300 | | | | 1,846,781 | | |
Quad/Graphics, Inc. (a) | | | 419,100 | | | | 1,152,525 | | |
| | | | 18,146,451 | | |
Construction & Engineering — 3.01% | |
Fluor Corp. (a) | | | 685,700 | | | | 16,689,938 | | |
Machinery — 7.43% | |
Allison Transmission Holdings, Inc. | | | 192,600 | | | | 7,405,470 | | |
Crane Holdings Company | | | 82,300 | | | | 7,206,188 | | |
Enerpac Tool Group Corp. | | | 93,800 | | | | 1,784,076 | | |
Flowserve Corp. | | | 245,400 | | | | 7,025,802 | | |
The Greenbrier Companies, Inc. | | | 136,400 | | | | 4,909,036 | | |
Meritor, Inc. (a) | | | 275,700 | | | | 10,016,181 | | |
Miller Industries, Inc. | | | 125,300 | | | | 2,840,551 | | |
| | | | 41,187,304 | | |
Professional Services — 7.27% | |
Hudson Global, Inc. (a) (o) | | | 169,560 | | | | 5,324,184 | | |
KBR, Inc. | | | 141,000 | | | | 6,822,990 | | |
Korn Ferry | | | 197,100 | | | | 11,435,742 | | |
ManpowerGroup, Inc. | | | 34,500 | | | | 2,636,145 | | |
TrueBlue, Inc. (a) | | | 786,650 | | | | 14,081,035 | | |
| | | | 40,300,096 | | |
Trading Companies & Distributors — 0.30% | |
Rush Enterprises, Inc. | | | 34,350 | | | | 1,655,670 | | |
TOTAL INDUSTRIALS | | | 120,929,731 | | |
INFORMATION TECHNOLOGY — 11.18%
Communications Equipment — 1.28% | |
CommScope Holding Company, Inc. (a) | | | 201,300 | | | | 1,231,956 | | |
F5, Inc. (a) | | | 38,200 | | | | 5,846,128 | | |
| | | | 7,078,084 | | |
Electronic Equipment, Instruments & Components — 6.36% | |
Arrow Electronics, Inc. (a) | | | 128,700 | | | | 14,425,983 | | |
Belden, Inc. | | | 123,700 | | | | 6,589,499 | | |
Itron, Inc. (a) | | | 149,200 | | | | 7,374,956 | | |
Plexus Corp. (a) | | | 87,800 | | | | 6,892,300 | | |
| | | | 35,282,738 | | |
IT Services — 3.01% | |
Euronet Worldwide, Inc. (a) | | | 151,700 | | | | 15,259,503 | | |
Verra Mobility Corp. (a) | | | 89,000 | | | | 1,398,190 | | |
| | | | 16,657,693 | | |
| | | Shares
Held | | Value | |
Semiconductors & Semiconductor Equipment — 0.53% | |
Diodes, Inc. (a) | | | 45,900 | | | $ | 2,963,763 | | |
TOTAL INFORMATION TECHNOLOGY | | | 61,982,278 | | |
MATERIALS — 1.00%
Chemicals — 1.00% | |
Ecovyst, Inc. | | | 563,200 | | | | 5,547,520 | | |
Metals & Mining — 0.00% | |
Noranda Aluminum Holding Corp. (a) (f) (o) (u) | | | 800,300 | | | | 0 | | |
TOTAL MATERIALS | | | 5,547,520 | | |
REAL ESTATE — 2.22%
Real Estate Management & Development — 2.22% | |
The RMR Group, Inc. | | | 117,400 | | | | 3,328,290 | | |
Seritage Growth Properties (a) (l) | | | 1,722,400 | | | | 8,973,704 | | |
TOTAL REAL ESTATE | | | 12,301,994 | | |
UTILITIES — 1.91%
Electric Utilities — 0.22% | |
Portland General Electric Company | | | 25,200 | | | | 1,217,916 | | |
Multi-Utilities — 1.69% | |
Avista Corp. | | | 215,100 | | | | 9,359,001 | | |
TOTAL UTILITIES | | | 10,576,917 | | |
Total common stocks
(Cost $544,106,573) | | | | | 528,198,337 | | |
RIGHTS— 0.00% | |
ENERGY — 0.00%
Oil, Gas & Consumable Fuels — 0.00% | |
Rockhopper Exploration PLC (a) (i) | | | 383,300 | | | | 0 | | |
TOTAL ENERGY | | | 0 | | |
Total rights
(Cost $17,153) | | | | | 0 | | |
Total long-term investments
(Cost $544,123,726) | | | | | 528,198,337 | | |
COLLATERAL FOR SECURITIES ON LOAN — 0.50% | |
Money Market Funds — 0.50% | |
Invesco Short-Term Investments Trust
Government & Agency Portfolio —
Institutional Class, 1.38%^ | | | 2,787,980 | | | | 2,787,980 | | |
Total collateral for securities on loan
(Cost $2,787,980) | | | 2,787,980 | | |
SHORT-TERM
INVESTMENTS — 5.07% | | Principal
Amount | | | |
Time Deposits — 5.07% | |
Barclays PLC, 0.91%, 07/01/2022* | | $ | 28,096,262 | | | | 28,096,262 | | |
Total short-term investments
(Cost $28,096,262) | | | 28,096,262 | | |
Total investments — 100.85%
(Cost $575,007,968) | | | | | 559,082,579 | | |
Liabilities in excess of other assets — (0.85)% | | | | | (4,736,562 | ) | |
Net assets — 100.00% | | $ | 554,346,017 | | |
(a) — Non-income producing security.
The accompanying notes are an integral part of these financial statements.
24
Schedule of Investments — June 30, 2022
Hotchkis & Wiley Small Cap Value Fund
(f) — Security was fair valued under guidelines established by and under the general supervision and responsibility of the Trust's Board of Trustees. The total market value of these securities was $0, which represented 0.00% of net assets. See Security Valuation in Note 1 in Notes to the Financial Statements.
(i) — Illiquid security. The total market value of these securities was $0, which represented 0.00% of net assets.
(l) — All or a portion of this security is on loan. The total market value of securities on loan was $2,714,966. The remaining contractual maturity of all of the securities lending transactions is overnight and continuous.
(o) — Affiliated issuer. See Note 6 in Notes to the Financial Statements.
(u) — Value determined using significant unobservable inputs.
^ — Rate shown is the 7-day yield as of June 30, 2022.
* — Invested through a cash management account administered by Brown Brothers Harriman & Co.
The accompanying notes are an integral part of these financial statements.
25
Schedule of Investments — June 30, 2022
Hotchkis & Wiley Small Cap Diversified Value Fund

Largest Equity Holdings | | Percent of
net assets | |
Resources Connection, Inc. | | | 0.54 | % | |
Healthcare Services Group, Inc. | | | 0.50 | % | |
Otter Tail Corp. | | | 0.49 | % | |
OceanFirst Financial Corp. | | | 0.46 | % | |
Enerpac Tool Group Corp. | | | 0.46 | % | |
Meritor, Inc. | | | 0.46 | % | |
Allison Transmission Holdings, Inc. | | | 0.46 | % | |
Flushing Financial Corp. | | | 0.46 | % | |
Avista Corp. | | | 0.45 | % | |
South Jersey Industries, Inc. | | | 0.45 | % | |
COMMON
STOCKS — 98.28% | | Shares
Held | | Value | |
COMMUNICATION SERVICES — 0.65%
Media — 0.65% | |
Emerald Holding, Inc. (a) | | | 316,950 | | | $ | 1,289,987 | | |
Entravision Communications Corp. | | | 128,265 | | | | 584,888 | | |
Stagwell, Inc. (a) | | | 127,800 | | | | 693,954 | | |
TEGNA, Inc. | | | 23,067 | | | | 483,715 | | |
TOTAL COMMUNICATION SERVICES | | | 3,052,544 | | |
CONSUMER DISCRETIONARY — 13.71%
Auto Components — 0.39% | |
Adient PLC (a) | | | 62,605 | | | | 1,854,986 | | |
Diversified Consumer Services — 0.44% | |
H&R Block, Inc. | | | 59,200 | | | | 2,090,944 | | |
Hotels, Restaurants & Leisure — 1.48% | |
Brinker International, Inc. (a) | | | 54,470 | | | | 1,199,974 | | |
Dine Brands Global, Inc. | | | 6,200 | | | | 403,496 | | |
El Pollo Loco Holdings, Inc. (a) | | | 97,500 | | | | 959,400 | | |
International Game Technology PLC | | | 71,100 | | | | 1,319,616 | | |
Jack in the Box, Inc. | | | 23,200 | | | | 1,300,592 | | |
Potbelly Corp. (a) | | | 76,700 | | | | 433,355 | | |
Travel + Leisure Company | | | 34,780 | | | | 1,350,160 | | |
| | | | 6,966,593 | | |
Household Durables — 3.81% | |
Bassett Furniture Industries, Inc. | | | 26,300 | | | | 476,556 | | |
Century Communities, Inc. | | | 37,996 | | | | 1,708,680 | | |
Ethan Allen Interiors, Inc. | | | 91,005 | | | | 1,839,211 | | |
Green Brick Partners, Inc. (a) | | | 21,750 | | | | 425,648 | | |
Hooker Furnishings Corp. | | | 78,875 | | | | 1,226,506 | | |
KB Home | | | 17,800 | | | | 506,588 | | |
La-Z-Boy, Inc. | | | 82,500 | | | | 1,956,075 | | |
LGI Homes, Inc. (a) | | | 15,200 | | | | 1,320,880 | | |
M/I Homes, Inc. (a) | | | 49,923 | | | | 1,979,945 | | |
Meritage Homes Corp. (a) | | | 26,800 | | | | 1,943,000 | | |
| | | Shares
Held | | Value | |
Taylor Morrison Home Corp. (a) | | | 71,510 | | | $ | 1,670,474 | | |
Tri Pointe Homes, Inc. (a) | | | 109,487 | | | | 1,847,046 | | |
Tupperware Brands Corp. (a) | | | 160,600 | | | | 1,018,204 | | |
| | | | 17,918,813 | | |
Internet & Catalog Retail — 0.18% | |
PetMed Express, Inc. (l) | | | 41,600 | | | | 827,840 | | |
Leisure Products — 0.47% | |
Johnson Outdoors, Inc. | | | 30,600 | | | | 1,871,496 | | |
Vista Outdoor, Inc. (a) | | | 12,300 | | | | 343,170 | | |
| | | | 2,214,666 | | |
Multiline Retail — 0.14% | |
Franchise Group, Inc. | | | 18,300 | | | | 641,781 | | |
Specialty Retail — 5.83% | |
The Aaron's Company, Inc. | | | 136,500 | | | | 1,986,075 | | |
American Eagle Outfitters, Inc. | | | 75,600 | | | | 845,208 | | |
Asbury Automotive Group, Inc. (a) | | | 11,664 | | | | 1,975,182 | | |
Big 5 Sporting Goods Corp. (l) | | | 80,900 | | | | 906,889 | | |
The Cato Corp. | | | 109,400 | | | | 1,270,134 | | |
Designer Brands, Inc. | | | 33,900 | | | | 442,734 | | |
Foot Locker, Inc. | | | 50,500 | | | | 1,275,125 | | |
Genesco, Inc. (a) | | | 35,330 | | | | 1,763,320 | | |
Group 1 Automotive, Inc. | | | 11,728 | | | | 1,991,414 | | |
Haverty Furniture Companies, Inc. | | | 74,700 | | | | 1,731,546 | | |
Hibbett, Inc. | | | 32,673 | | | | 1,428,137 | | |
Kirkland's, Inc. (a) (l) | | | 234,700 | | | | 826,144 | | |
LL Flooring Holdings, Inc. (a) | | | 44,400 | | | | 416,028 | | |
MarineMax, Inc. (a) | | | 31,300 | | | | 1,130,556 | | |
The ODP Corp. (a) | | | 66,501 | | | | 2,010,990 | | |
OneWater Marine, Inc. (a) | | | 55,100 | | | | 1,821,055 | | |
Rent-A-Center, Inc. | | | 68,700 | | | | 1,336,215 | | |
Sleep Number Corp. (a) | | | 13,800 | | | | 427,110 | | |
The accompanying notes are an integral part of these financial statements.
26
Schedule of Investments — June 30, 2022
Hotchkis & Wiley Small Cap Diversified Value Fund
| | | Shares
Held | | Value | |
Sonic Automotive, Inc. | | | 50,050 | | | $ | 1,833,332 | | |
Tilly's, Inc. | | | 59,600 | | | | 418,392 | | |
Urban Outfitters, Inc. (a) | | | 50,010 | | | | 933,187 | | |
Zumiez, Inc. (a) | | | 23,800 | | | | 618,800 | | |
| | | | 27,387,573 | | |
Textiles, Apparel & Luxury Goods — 0.97% | |
Fossil Group, Inc. (a) | | | 72,700 | | | | 375,859 | | |
G-III Apparel Group Ltd. (a) | | | 64,940 | | | | 1,313,736 | | |
Lakeland Industries, Inc. (a) | | | 51,800 | | | | 795,648 | | |
Rocky Brands, Inc. | | | 12,100 | | | | 413,578 | | |
Vera Bradley, Inc. (a) | | | 383,400 | | | | 1,663,956 | | |
| | | | 4,562,777 | | |
TOTAL CONSUMER DISCRETIONARY | | | 64,465,973 | | |
CONSUMER STAPLES — 2.00%
Food & Staples Retailing — 0.19% | |
Natural Grocers by Vitamin Cottage, Inc. | | | 57,300 | | | | 913,935 | | |
Food Products — 0.28% | |
B&G Foods, Inc. (l) | | | 55,100 | | | | 1,310,278 | | |
Household Products — 0.80% | |
Central Garden & Pet Company (a) | | | 42,600 | | | | 1,807,092 | | |
Energizer Holdings, Inc. | | | 69,200 | | | | 1,961,820 | | |
| | | | 3,768,912 | | |
Personal Products — 0.73% | |
Medifast, Inc. | | | 5,400 | | | | 974,754 | | |
Nu Skin Enterprises, Inc. | | | 20,850 | | | | 902,805 | | |
USANA Health Sciences, Inc. (a) | | | 21,400 | | | | 1,548,504 | | |
| | | | 3,426,063 | | |
TOTAL CONSUMER STAPLES | | | 9,419,188 | | |
ENERGY — 9.93%
Energy Equipment & Services — 3.90% | |
Cactus, Inc. | | | 33,530 | | | | 1,350,253 | | |
ChampionX Corp. | | | 72,100 | | | | 1,431,185 | | |
Core Laboratories NV | | | 38,800 | | | | 768,628 | | |
Dril-Quip, Inc. (a) | | | 75,000 | | | | 1,935,000 | | |
Expro Group Holdings NV (a) | | | 149,203 | | | | 1,718,819 | | |
Helix Energy Solutions Group, Inc. (a) | | | 307,000 | | | | 951,700 | | |
Liberty Energy, Inc. (a) | | | 103,800 | | | | 1,324,488 | | |
National Energy Services Reunited Corp. (a) | | | 295,500 | | | | 2,003,490 | | |
Newpark Resources, Inc. (a) | | | 389,800 | | | | 1,204,482 | | |
NexTier Oilfield Solutions, Inc. (a) | | | 188,188 | | | | 1,789,668 | | |
Oil States International, Inc. (a) | | | 92,900 | | | | 503,518 | | |
ProPetro Holding Corp. (a) | | | 81,150 | | | | 811,500 | | |
Select Energy Services, Inc. (a) | | | 146,100 | | | | 996,402 | | |
| | | Shares
Held | | Value | |
Solaris Oilfield Infrastructure, Inc. | | | 95,300 | | | $ | 1,036,864 | | |
TechnipFMC PLC (a) | | | 73,500 | | | | 494,655 | | |
| | | | 18,320,652 | | |
Oil, Gas & Consumable Fuels — 6.03% | |
Amplify Energy Corp. (a) | | | 51,300 | | | | 335,502 | | |
Berry Corp. | | | 231,870 | | | | 1,766,849 | | |
California Resources Corp. | | | 36,700 | | | | 1,412,950 | | |
Centennial Resource Development, Inc. (a) | | | 178,300 | | | | 1,066,234 | | |
Civitas Resources, Inc. | | | 24,930 | | | | 1,303,590 | | |
CVR Energy, Inc. | | | 15,400 | | | | 515,900 | | |
Equitrans Midstream Corp. | | | 289,000 | | | | 1,838,040 | | |
HF Sinclair Corp. | | | 15,600 | | | | 704,496 | | |
Kosmos Energy Ltd. (a) | | | 265,913 | | | | 1,646,001 | | |
Laredo Petroleum, Inc. (a) | | | 14,000 | | | | 965,160 | | |
Murphy Oil Corp. | | | 61,110 | | | | 1,844,911 | | |
Northern Oil and Gas, Inc. | | | 61,300 | | | | 1,548,438 | | |
Oasis Petroleum, Inc. | | | 15,300 | | | | 1,861,245 | | |
Par Pacific Holdings, Inc. (a) | | | 93,700 | | | | 1,460,783 | | |
PDC Energy, Inc. | | | 27,698 | | | | 1,706,474 | | |
Range Resources Corp. (a) | | | 70,900 | | | | 1,754,775 | | |
Ranger Oil Corp. (a) | | | 53,200 | | | | 1,748,684 | | |
REX American Resources Corp. (a) | | | 12,478 | | | | 1,058,134 | | |
Talos Energy, Inc. (a) | | | 76,200 | | | | 1,178,814 | | |
Vertex Energy, Inc. (a) (l) | | | 32,500 | | | | 341,900 | | |
Whiting Petroleum Corp. | | | 24,200 | | | | 1,646,326 | | |
World Fuel Services Corp. | | | 32,424 | | | | 663,395 | | |
| | | | 28,368,601 | | |
TOTAL ENERGY | | | 46,689,253 | | |
FINANCIALS — 32.15%
Banks — 20.10% | |
1st Source Corp. | | | 32,506 | | | | 1,475,772 | | |
Amalgamated Financial Corp. | | | 47,800 | | | | 945,484 | | |
Associated Banc-Corp | | | 100,300 | | | | 1,831,478 | | |
Bank of Marin Bancorp | | | 20,400 | | | | 648,312 | | |
BankUnited, Inc. | | | 52,310 | | | | 1,860,667 | | |
Banner Corp. | | | 24,800 | | | | 1,394,008 | | |
BCB Bancorp, Inc. | | | 28,500 | | | | 485,355 | | |
Berkshire Hills Bancorp, Inc. | | | 76,500 | | | | 1,894,905 | | |
Brookline Bancorp, Inc. | | | 47,076 | | | | 626,582 | | |
Cadence Bank | | | 47,610 | | | | 1,117,883 | | |
Camden National Corp. | | | 21,116 | | | | 930,160 | | |
Carter Bankshares, Inc. (a) | | | 36,200 | | | | 477,840 | | |
Cathay General Bancorp | | | 37,732 | | | | 1,477,208 | | |
The accompanying notes are an integral part of these financial statements.
27
Schedule of Investments — June 30, 2022
Hotchkis & Wiley Small Cap Diversified Value Fund
| | | Shares
Held | | Value | |
Central Pacific Financial Corp. | | | 61,700 | | | $ | 1,323,465 | | |
Central Valley Community Bancorp | | | 38,700 | | | | 561,150 | | |
Civista Bancshares, Inc. | | | 18,900 | | | | 401,814 | | |
CNB Financial Corp. | | | 28,400 | | | | 686,996 | | |
Columbia Banking System, Inc. | | | 50,200 | | | | 1,438,230 | | |
The Community Financial Corp. | | | 11,600 | | | | 427,808 | | |
Community Trust Bancorp, Inc. | | | 22,610 | | | | 914,348 | | |
CrossFirst Bankshares, Inc. (a) | | | 31,200 | | | | 411,840 | | |
CVB Financial Corp. | | | 69,800 | | | | 1,731,738 | | |
Eagle Bancorp, Inc. | | | 39,930 | | | | 1,893,081 | | |
Enterprise Financial Services Corp. | | | 9,700 | | | | 402,550 | | |
FB Financial Corp. | | | 34,025 | | | | 1,334,461 | | |
Financial Institutions, Inc. | | | 26,861 | | | | 698,923 | | |
First BanCorp | | | 110,686 | | | | 1,428,956 | | |
First Busey Corp. | | | 86,400 | | | | 1,974,240 | | |
First Business Financial Services, Inc. | | | 13,765 | | | | 429,330 | | |
First Financial Bancorp | | | 41,250 | | | | 800,250 | | |
First Financial Corp. | | | 34,063 | | | | 1,515,804 | | |
First Hawaiian, Inc. | | | 62,440 | | | | 1,418,012 | | |
First Internet Bancorp | | | 26,189 | | | | 964,279 | | |
First Interstate BancSystem, Inc. | | | 35,429 | | | | 1,350,199 | | |
First Merchants Corp. | | | 9,102 | | | | 324,213 | | |
First Mid Bancshares, Inc. | | | 17,300 | | | | 617,091 | | |
The First of Long Island Corp. | | | 53,680 | | | | 941,010 | | |
Flushing Financial Corp. | | | 100,918 | | | | 2,145,517 | | |
FNB Corp. | | | 161,580 | | | | 1,754,759 | | |
Fulton Financial Corp. | | | 95,140 | | | | 1,374,773 | | |
Great Southern Bancorp, Inc. | | | 21,110 | | | | 1,236,202 | | |
Hancock Whitney Corp. | | | 29,300 | | | | 1,298,869 | | |
Hanmi Financial Corp. | | | 87,567 | | | | 1,965,003 | | |
Heartland Financial USA, Inc. | | | 34,700 | | | | 1,441,438 | | |
Heritage Financial Corp. | | | 40,700 | | | | 1,024,012 | | |
HomeStreet, Inc. | | | 37,278 | | | | 1,292,428 | | |
Hope Bancorp, Inc. | | | 138,633 | | | | 1,918,681 | | |
Horizon Bancorp, Inc. | | | 85,100 | | | | 1,482,442 | | |
Independent Bank Corp. | | | 6,591 | | | | 523,523 | | |
Independent Bank Corp. | | | 77,100 | | | | 1,486,488 | | |
International Bancshares Corp. | | | 36,136 | | | | 1,448,331 | | |
Investar Holding Corp. | | | 25,800 | | | | 565,020 | | |
Lakeland Bancorp, Inc. | | | 98,330 | | | | 1,437,585 | | |
Macatawa Bank Corp. | | | 57,000 | | | | 503,880 | | |
Mercantile Bank Corp. | | | 28,700 | | | | 916,965 | | |
Midland States Bancorp, Inc. | | | 50,513 | | | | 1,214,333 | | |
MidWestOne Financial Group, Inc. | | | 25,594 | | | | 760,654 | | |
National Bankshares, Inc. | | | 13,900 | | | | 436,460 | | |
| | | Shares
Held | | Value | |
Nicolet Bankshares, Inc. (a) | | | 24,100 | | | $ | 1,743,394 | | |
Northeast Bank | | | 13,200 | | | | 482,196 | | |
Northrim BanCorp, Inc. | | | 11,584 | | | | 466,372 | | |
OceanFirst Financial Corp. | | | 113,510 | | | | 2,171,446 | | |
Old National Bancorp | | | 58,739 | | | | 868,750 | | |
Orrstown Financial Services, Inc. | | | 22,379 | | | | 540,900 | | |
PacWest Bancorp | | | 43,300 | | | | 1,154,378 | | |
PCB Bancorp | | | 45,100 | | | | 842,468 | | |
Peapack-Gladstone Financial Corp. | | | 28,936 | | | | 859,399 | | |
Peoples Bancorp, Inc. | | | 19,530 | | | | 519,498 | | |
Preferred Bank | | | 19,200 | | | | 1,305,984 | | |
Premier Financial Corp. | | | 56,560 | | | | 1,433,796 | | |
Primis Financial Corp. | | | 56,456 | | | | 769,495 | | |
RBB Bancorp | | | 33,032 | | | | 682,771 | | |
Renasant Corp. | | | 48,300 | | | | 1,391,523 | | |
Republic Bancorp, Inc. | | | 22,770 | | | | 1,098,653 | | |
S&T Bancorp, Inc. | | | 50,700 | | | | 1,390,701 | | |
Sierra Bancorp | | | 16,900 | | | | 367,237 | | |
Simmons First National Corp. | | | 17,600 | | | | 374,176 | | |
Texas Capital Bancshares, Inc. (a) | | | 39,190 | | | | 2,062,962 | | |
Towne Bank | | | 31,100 | | | | 844,365 | | |
TriCo Bancshares | | | 11,994 | | | | 547,406 | | |
Trustmark Corp. | | | 65,801 | | | | 1,920,731 | | |
Univest Financial Corp. | | | 16,950 | | | | 431,208 | | |
Washington Federal, Inc. | | | 68,744 | | | | 2,063,695 | | |
Washington Trust Bancorp, Inc. | | | 8,430 | | | | 407,759 | | |
Webster Financial Corp. | | | 26,100 | | | | 1,100,115 | | |
Wintrust Financial Corp. | | | 16,350 | | | | 1,310,453 | | |
| | | | 94,534,636 | | |
Capital Markets — 2.00% | |
Artisan Partners Asset Management, Inc. | | | 27,200 | | | | 967,504 | | |
Cowen, Inc. | | | 81,500 | | | | 1,930,734 | | |
Diamond Hill Investment Group, Inc. | | | 5,000 | | | | 868,200 | | |
Evercore, Inc. | | | 3,610 | | | | 337,932 | | |
Federated Hermes, Inc. | | | 46,500 | | | | 1,478,235 | | |
Greenhill & Company, Inc. | | | 105,725 | | | | 974,785 | | |
Perella Weinberg Partners | | | 137,300 | | | | 800,459 | | |
Victory Capital Holdings, Inc. | | | 61,127 | | | | 1,473,161 | | |
Virtus Investment Partners, Inc. | | | 3,300 | | | | 564,366 | | |
| | | | 9,395,376 | | |
Consumer Finance — 0.42% | |
Navient Corp. | | | 140,320 | | | | 1,963,077 | | |
Insurance — 5.63% | |
Ambac Financial Group, Inc. (a) | | | 177,087 | | | | 2,009,937 | | |
American Equity Investment Life Holding Company | | | 55,526 | | | | 2,030,586 | | |
The accompanying notes are an integral part of these financial statements.
28
Schedule of Investments — June 30, 2022
Hotchkis & Wiley Small Cap Diversified Value Fund
| | | Shares
Held | | Value | |
Assured Guaranty Ltd. | | | 36,500 | | | $ | 2,036,335 | | |
Axis Capital Holdings Ltd. | | | 32,700 | | | | 1,866,843 | | |
Brighthouse Financial, Inc. (a) | | | 14,200 | | | | 582,484 | | |
CNO Financial Group, Inc. | | | 106,086 | | | | 1,919,096 | | |
Employers Holdings, Inc. | | | 45,735 | | | | 1,915,839 | | |
Enstar Group Ltd. (a) | | | 8,739 | | | | 1,869,971 | | |
The Hanover Insurance Group, Inc. | | | 5,500 | | | | 804,375 | | |
Horace Mann Educators Corp. | | | 31,814 | | | | 1,221,021 | | |
James River Group Holdings Ltd. | | | 50,900 | | | | 1,261,302 | | |
Kemper Corp. | | | 20,100 | | | | 962,790 | | |
National Western Life Group, Inc. | | | 6,655 | | | | 1,348,969 | | |
ProAssurance Corp. | | | 42,400 | | | | 1,001,912 | | |
Safety Insurance Group, Inc. | | | 15,400 | | | | 1,495,340 | | |
SiriusPoint Ltd. (a) | | | 335,478 | | | | 1,818,291 | | |
Trean Insurance Group, Inc. (a) | | | 73,800 | | | | 459,774 | | |
White Mountains Insurance Group Ltd. | | | 1,500 | | | | 1,869,195 | | |
| | | | 26,474,060 | | |
Mortgage Real Estate Investment Trusts — 0.75% | |
Arlington Asset Investment Corp. (a) | | | 146,400 | | | | 475,800 | | |
Granite Point Mortgage Trust, Inc. | | | 42,800 | | | | 409,596 | | |
Great Ajax Corp. | | | 67,234 | | | | 644,774 | | |
MFA Financial, Inc. | | | 45,500 | | | | 489,125 | | |
New York Mortgage Trust, Inc. | | | 396,500 | | | | 1,094,340 | | |
TPG RE Finance Trust, Inc. | | | 44,000 | | | | 396,440 | | |
| | | | 3,510,075 | | |
Thrifts & Mortgage Finance — 3.25% | |
Blue Foundry Bancorp (a) | | | 76,700 | | | | 919,633 | | |
Bridgewater Bancshares, Inc. (a) | | | 30,490 | | | | 492,109 | | |
Essent Group Ltd. | | | 50,300 | | | | 1,956,670 | | |
Federal Agricultural Mortgage Corp. | | | 14,520 | | | | 1,417,878 | | |
FS Bancorp, Inc. | | | 15,080 | | | | 432,947 | | |
Home Bancorp, Inc. | | | 12,800 | | | | 436,864 | | |
Luther Burbank Corp. | | | 54,445 | | | | 710,507 | | |
NMI Holdings, Inc. (a) | | | 115,400 | | | | 1,921,410 | | |
Northeast Community Bancorp, Inc. | | | 44,800 | | | | 527,296 | | |
Northfield Bancorp, Inc. | | | 51,107 | | | | 665,924 | | |
Provident Financial Services, Inc. | | | 41,300 | | | | 919,338 | | |
Radian Group, Inc. | | | 95,300 | | | | 1,872,645 | | |
Territorial Bancorp, Inc. | | | 20,752 | | | | 432,679 | | |
TrustCo Bank Corp. | | | 36,892 | | | | 1,137,749 | | |
Waterstone Financial, Inc. | | | 58,800 | | | | 1,002,540 | | |
William Penn Bancorp | | | 36,000 | | | | 421,200 | | |
| | | | 15,267,389 | | |
TOTAL FINANCIALS | | | 151,144,613 | | |
| | | Shares
Held | | Value | |
HEALTH CARE — 1.95%
Biotechnology — 0.86% | |
Emergent BioSolutions, Inc. (a) | | | 64,900 | | | $ | 2,014,496 | | |
Vanda Pharmaceuticals, Inc. (a) | | | 187,200 | | | | 2,040,480 | | |
| | | | 4,054,976 | | |
Health Care Providers & Services — 0.50% | |
Hanger, Inc. (a) | | | 129,000 | | | | 1,847,280 | | |
Patterson Companies, Inc. | | | 17,000 | | | | 515,100 | | |
| | | | 2,362,380 | | |
Pharmaceuticals — 0.59% | |
Prestige Consumer Healthcare, Inc. (a) | | | 17,400 | | | | 1,023,120 | | |
Taro Pharmaceutical Industries Ltd. (a) | | | 47,880 | | | | 1,731,341 | | |
| | | | 2,754,461 | | |
TOTAL HEALTH CARE | | | 9,171,817 | | |
INDUSTRIALS — 19.96%
Aerospace & Defense — 1.64% | |
AAR Corp. (a) | | | 46,640 | | | | 1,951,418 | | |
Moog, Inc. | | | 25,900 | | | | 2,056,201 | | |
National Presto Industries, Inc. | | | 28,614 | | | | 1,878,223 | | |
Vectrus, Inc. (a) | | | 55,155 | | | | 1,845,486 | | |
| | | | 7,731,328 | | |
Air Freight & Logistics — 0.25% | |
Forward Air Corp. | | | 12,700 | | | | 1,167,892 | | |
Airlines — 0.31% | |
Mesa Air Group, Inc. (a) | | | 177,800 | | | | 389,382 | | |
Spirit Airlines, Inc. (a) (l) | | | 45,500 | | | | 1,084,720 | | |
| | | | 1,474,102 | | |
Building Products — 1.37% | |
Griffon Corp. | | | 22,400 | | | | 627,872 | | |
JELD-WEN Holding, Inc. (a) | | | 120,200 | | | | 1,753,718 | | |
Masonite International Corp. (a) | | | 25,341 | | | | 1,946,949 | | |
Resideo Technologies, Inc. (a) | | | 89,700 | | | | 1,741,974 | | |
UFP Industries, Inc. | | | 5,500 | | | | 374,770 | | |
| | | | 6,445,283 | | |
Commercial Services & Supplies — 2.54% | |
ABM Industries, Inc. | | | 24,000 | | | | 1,042,080 | | |
ACCO Brands Corp. | | | 274,309 | | | | 1,791,238 | | |
The Brink's Company | | | 25,500 | | | | 1,548,105 | | |
Ennis, Inc. | | | 80,717 | | | | 1,632,905 | | |
Healthcare Services Group, Inc. | | | 133,700 | | | | 2,327,717 | | |
Interface, Inc. | | | 75,500 | | | | 946,770 | | |
Kimball International, Inc. | | | 170,900 | | | | 1,310,803 | | |
Steelcase, Inc. | | | 124,015 | | | | 1,330,681 | | |
| | | | 11,930,299 | | |
The accompanying notes are an integral part of these financial statements.
29
Schedule of Investments — June 30, 2022
Hotchkis & Wiley Small Cap Diversified Value Fund
| | | Shares
Held | | Value | |
Construction & Engineering — 2.08% | |
Comfort Systems USA, Inc. | | | 11,300 | | | $ | 939,595 | | |
Fluor Corp. (a) | | | 69,830 | | | | 1,699,662 | | |
Great Lakes Dredge & Dock Corp. (a) | | | 148,200 | | | | 1,942,903 | | |
Matrix Service Company (a) | | | 172,500 | | | | 872,850 | | |
MYR Group, Inc. (a) | | | 10,444 | | | | 920,430 | | |
Primoris Services Corp. | | | 63,553 | | | | 1,382,913 | | |
Sterling Infrastructure, Inc. (a) | | | 38,000 | | | | 832,960 | | |
Tutor Perini Corp. (a) | | | 133,121 | | | | 1,168,802 | | |
| | | | 9,760,115 | | |
Electrical Equipment — 2.26% | |
Atkore, Inc. (a) | | | 7,400 | | | | 614,274 | | |
AZZ, Inc. | | | 41,600 | | | | 1,698,112 | | |
Encore Wire Corp. | | | 13,296 | | | | 1,381,720 | | |
EnerSys | | | 29,010 | | | | 1,710,429 | | |
GrafTech International Ltd. | | | 238,780 | | | | 1,688,175 | | |
Powell Industries, Inc. | | | 46,600 | | | | 1,089,042 | | |
Preformed Line Products Company | | | 14,127 | | | | 868,811 | | |
Thermon Group Holdings, Inc. (a) | | | 113,683 | | | | 1,597,246 | | |
| | | | 10,647,809 | | |
Machinery — 4.80% | |
Allison Transmission Holdings, Inc. | | | 55,900 | | | | 2,149,355 | | |
Barnes Group, Inc. | | | 28,300 | | | | 881,262 | | |
Enerpac Tool Group Corp. | | | 114,000 | | | | 2,168,280 | | |
EnPro Industries, Inc. | | | 21,850 | | | | 1,790,171 | | |
Flowserve Corp. | | | 65,600 | | | | 1,878,128 | | |
Graham Corp. | | | 19,189 | | | | 132,788 | | |
The Greenbrier Companies, Inc. | | | 49,299 | | | | 1,774,271 | | |
Hillenbrand, Inc. | | | 51,420 | | | | 2,106,163 | | |
Hyster-Yale Materials Handling, Inc. | | | 43,527 | | | | 1,402,440 | | |
L B Foster Company (a) | | | 24,000 | | | | 308,880 | | |
Meritor, Inc. (a) | | | 59,213 | | | | 2,151,208 | | |
Miller Industries, Inc. | | | 25,320 | | | | 574,004 | | |
Mueller Industries, Inc. | | | 18,700 | | | | 996,523 | | |
Mueller Water Products, Inc. | | | 78,500 | | | | 920,805 | | |
Proto Labs, Inc. (a) | | | 30,700 | | | | 1,468,688 | | |
Wabash National Corp. | | | 135,182 | | | | 1,835,772 | | |
| | | | 22,538,738 | | |
Marine — 0.18% | |
Matson, Inc. | | | 11,613 | | | | 846,355 | | |
Professional Services — 2.95% | |
BGSF, Inc. | | | 37,460 | | | | 463,006 | | |
CBIZ, Inc. (a) | | | 19,800 | | | | 791,208 | | |
FTI Consulting, Inc. (a) | | | 8,200 | | | | 1,482,970 | | |
Heidrick & Struggles International, Inc. | | | 57,910 | | | | 1,873,968 | | |
| | | Shares
Held | | Value | |
Kelly Services, Inc. | | | 84,350 | | | $ | 1,672,661 | | |
Korn Ferry | | | 35,356 | | | | 2,051,355 | | |
ManTech International Corp. | | | 10,300 | | | | 983,135 | | |
Resources Connection, Inc. | | | 123,485 | | | | 2,515,388 | | |
TrueBlue, Inc. (a) | | | 114,400 | | | | 2,047,760 | | |
| | | | 13,881,451 | | |
Road & Rail — 0.40% | |
Heartland Express, Inc. | | | 102,500 | | | | 1,425,775 | | |
Schneider National, Inc. | | | 19,700 | | | | 440,886 | | |
| | | | 1,866,661 | | |
Trading Companies & Distributors — 1.18% | |
BlueLinx Holdings, Inc. (a) | | | 21,900 | | | | 1,463,139 | | |
Boise Cascade Company | | | 21,700 | | | | 1,290,933 | | |
DXP Enterprises, Inc. (a) | | | 26,980 | | | | 826,397 | | |
Rush Enterprises, Inc. | | | 40,547 | | | | 1,954,366 | | |
| | | | 5,534,835 | | |
TOTAL INDUSTRIALS | | | 93,824,868 | | |
INFORMATION TECHNOLOGY — 7.44%
Communications Equipment — 1.03% | |
Casa Systems, Inc. (a) (l) | | | 113,100 | | | | 444,483 | | |
CommScope Holding Company, Inc. (a) | | | 167,300 | | | | 1,023,876 | | |
Comtech Telecommunications Corp. | | | 213,400 | | | | 1,935,538 | | |
NETGEAR, Inc. (a) | | | 78,200 | | | | 1,448,264 | | |
| | | | 4,852,161 | | |
Electronic Equipment, Instruments & Components — 3.62% | |
Avnet, Inc. | | | 42,300 | | | | 1,813,824 | | |
Belden, Inc. | | | 35,970 | | | | 1,916,122 | | |
ePlus, Inc. (a) | | | 19,200 | | | | 1,019,904 | | |
Insight Enterprises, Inc. (a) | | | 21,368 | | | | 1,843,631 | | |
Kimball Electronics, Inc. (a) | | | 55,400 | | | | 1,113,540 | | |
Methode Electronics, Inc. | | | 45,659 | | | | 1,691,209 | | |
PC Connection, Inc. | | | 32,306 | | | | 1,423,079 | | |
Plexus Corp. (a) | | | 5,700 | | | | 447,450 | | |
Sanmina Corp. (a) | | | 50,095 | | | | 2,040,370 | | |
ScanSource, Inc. (a) | | | 57,933 | | | | 1,804,034 | | |
Vishay Intertechnology, Inc. | | | 107,926 | | | | 1,923,241 | | |
| | | | 17,036,404 | | |
IT Services — 0.88% | |
BM Technologies, Inc. (a) (l) | | | 27,624 | | | | 162,705 | | |
Cass Information Systems, Inc. | | | 56,500 | | | | 1,909,700 | | |
CSG Systems International, Inc. | | | 9,100 | | | | 543,088 | | |
MoneyGram International, Inc. (a) | | | 98,400 | | | | 984,000 | | |
Verra Mobility Corp. (a) | | | 33,300 | | | | 523,143 | | |
| | | | 4,122,636 | | |
The accompanying notes are an integral part of these financial statements.
30
Schedule of Investments — June 30, 2022
Hotchkis & Wiley Small Cap Diversified Value Fund
| | | Shares
Held | | Value | |
Semiconductors & Semiconductor Equipment — 0.63% | |
Diodes, Inc. (a) | | | 19,449 | | | $ | 1,255,822 | | |
Photronics, Inc. (a) | | | 87,100 | | | | 1,696,708 | | |
| | | | 2,952,530 | | |
Software — 0.62% | |
Ebix, Inc. (l) | | | 61,970 | | | | 1,047,293 | | |
Telos Corp. (a) | | | 122,500 | | | | 989,800 | | |
Xperi Holding Corp. | | | 59,600 | | | | 860,028 | | |
| | | | 2,897,121 | | |
Technology Hardware, Storage & Peripherals — 0.66% | |
Diebold Nixdorf, Inc. (a) | | | 591,000 | | | | 1,341,570 | | |
Super Micro Computer, Inc. (a) | | | 43,300 | | | | 1,747,155 | | |
| | | | 3,088,725 | | |
TOTAL INFORMATION TECHNOLOGY | | | 34,949,577 | | |
MATERIALS — 4.81%
Chemicals — 2.91% | |
AdvanSix, Inc. | | | 60,800 | | | | 2,033,152 | | |
American Vanguard Corp. | | | 42,429 | | | | 948,288 | | |
Cabot Corp. | | | 21,670 | | | | 1,382,329 | | |
Chase Corp. | | | 11,700 | | | | 910,377 | | |
Ecovyst, Inc. | | | 198,200 | | | | 1,952,270 | | |
FutureFuel Corp. | | | 65,130 | | | | 474,146 | | |
Hawkins, Inc. | | | 13,100 | | | | 471,993 | | |
HB Fuller Company | | | 15,500 | | | | 933,255 | | |
Innospec, Inc. | | | 11,100 | | | | 1,063,269 | | |
NewMarket Corp. | | | 3,200 | | | | 963,072 | | |
Tredegar Corp. | | | 87,030 | | | | 870,300 | | |
Trinseo PLC | | | 43,650 | | | | 1,678,779 | | |
| | | | 13,681,230 | | |
Containers & Packaging — 0.10% | |
TriMas Corp. | | | 16,300 | | | | 451,347 | | |
Metals & Mining — 1.39% | |
Commercial Metals Company | | | 27,800 | | | | 920,180 | | |
Compass Minerals International, Inc. | | | 40,100 | | | | 1,419,139 | | |
Kaiser Aluminum Corp. | | | 22,167 | | | | 1,753,188 | | |
Ryerson Holding Corp. | | | 27,100 | | | | 576,959 | | |
Warrior Met Coal, Inc. | | | 29,100 | | | | 890,751 | | |
Worthington Industries, Inc. | | | 22,550 | | | | 994,455 | | |
| | | | 6,554,672 | | |
Paper & Forest Products — 0.41% | |
Glatfelter Corp. | | | 151,300 | | | | 1,040,944 | | |
Mercer International, Inc. | | | 67,950 | | | | 893,543 | | |
| | | | 1,934,487 | | |
TOTAL MATERIALS | | | 22,621,736 | | |
| | | Shares
Held | | Value | |
REAL ESTATE — 1.87%
Equity Real Estate Investment Trusts — 0.85% | |
Alexander's, Inc. | | | 8,300 | | | $ | 1,843,928 | | |
Braemar Hotels & Resorts, Inc. | | | 102,500 | | | | 439,725 | | |
Pebblebrook Hotel Trust | | | 102,600 | | | | 1,700,082 | | |
| | | | 3,983,735 | | |
Real Estate Management & Development — 1.02% | |
RE/MAX Holdings, Inc. | | | 83,800 | | | | 2,054,776 | | |
The RMR Group, Inc. | | | 70,500 | | | | 1,998,675 | | |
Seritage Growth Properties (a) (l) | | | 147,148 | | | | 766,641 | | |
| | | | 4,820,092 | | |
TOTAL REAL ESTATE | | | 8,803,827 | | |
UTILITIES — 3.81%
Electric Utilities — 2.11% | |
ALLETE, Inc. | | | 32,476 | | | | 1,908,939 | | |
Hawaiian Electric Industries, Inc. | | | 51,000 | | | | 2,085,900 | | |
Otter Tail Corp. | | | 34,340 | | | | 2,305,244 | | |
PNM Resources, Inc. | | | 34,602 | | | | 1,653,284 | | |
Portland General Electric Company | | | 40,700 | | | | 1,967,031 | | |
| | | | 9,920,398 | | |
Gas Utilities — 1.25% | |
South Jersey Industries, Inc. | | | 61,744 | | | | 2,107,940 | | |
Southwest Gas Holdings, Inc. | | | 21,100 | | | | 1,837,388 | | |
Spire, Inc. | | | 25,873 | | | | 1,924,175 | | |
| | | | 5,869,503 | | |
Multi-Utilities — 0.45% | |
Avista Corp. | | | 48,761 | | | | 2,121,591 | | |
TOTAL UTILITIES | | | 17,911,492 | | |
Total common stocks
(Cost $458,395,841) | | | | | 462,054,888 | | |
Total long-term investments
(Cost $458,395,841) | | | | | 462,054,888 | | |
COLLATERAL FOR SECURITIES ON LOAN — 0.99% | |
Money Market Funds — 0.99% | |
Invesco Short-Term Investments Trust
Government & Agency Portfolio —
Institutional Class, 1.38%^ | | | 4,634,772 | | | | 4,634,772 | | |
Total collateral for securities on loan
(Cost $4,634,772) | | | 4,634,772 | | |
The accompanying notes are an integral part of these financial statements.
31
Schedule of Investments — June 30, 2022
Hotchkis & Wiley Small Cap Diversified Value Fund
SHORT-TERM
INVESTMENTS — 2.29% | | Principal
Amount | | Value | |
Time Deposits — 2.29% | |
Banco Bilbao Vizcaya Argentaria SA, 0.91%,
07/01/2022* | | $ | 10,786,292 | | | $ | 10,786,292 | | |
Total short-term investments
(Cost $10,786,292) | | | 10,786,292 | | |
Total investments — 101.56%
(Cost $473,816,905) | | | 477,475,952 | | |
Liabilities in excess of other assets — (1.56)% | | | | | (7,312,586 | ) | |
Net assets — 100.00% | | $ | 470,163,366 | | |
(a) — Non-income producing security.
(l) — All or a portion of this security is on loan. The total market value of securities on loan was $4,421,326. The remaining contractual maturity of all of the securities lending transactions is overnight and continuous.
^ — Rate shown is the 7-day yield as of June 30, 2022.
* — Invested through a cash management account administered by Brown Brothers Harriman & Co.
The accompanying notes are an integral part of these financial statements.
32
Schedule of Investments — June 30, 2022
Hotchkis & Wiley Global Value Fund

Largest Equity Holdings | | Percent of
net assets | |
General Electric Company | | | 4.80 | % | |
F5, Inc. | | | 3.88 | % | |
American International Group, Inc. | | | 3.61 | % | |
Citigroup, Inc. | | | 3.48 | % | |
Microsoft Corp. | | | 3.15 | % | |
Euronet Worldwide, Inc. | | | 2.98 | % | |
Alphabet, Inc. | | | 2.97 | % | |
Oracle Corp. | | | 2.85 | % | |
CVS Health Corp. | | | 2.55 | % | |
Tokio Marine Holdings, Inc. | | | 2.50 | % | |
* Based on country of risk.
COMMON
STOCKS — 98.93% | | Shares
Held | | Value | |
COMMUNICATION SERVICES — 7.65%
Entertainment — 1.97% | |
Warner Bros. Discovery, Inc. (a) | | | 48,650 | | | $ | 652,883 | | |
Interactive Media & Services — 2.97% | |
Alphabet, Inc. (a) | | | 450 | | | | 980,667 | | |
Media — 0.99% | |
News Corp. | | | 21,100 | | | | 328,738 | | |
Wireless Telecommunication Services — 1.72% | |
Vodafone Group PLC — ADR | | | 36,572 | | | | 569,792 | | |
TOTAL COMMUNICATION SERVICES | | | 2,532,080 | | |
CONSUMER DISCRETIONARY — 7.57%
Auto Components — 2.26% | |
Magna International, Inc. | | | 13,611 | | | | 747,244 | | |
Automobiles — 2.35% | |
General Motors Company (a) | | | 24,445 | | | | 776,373 | | |
Hotels, Restaurants & Leisure — 2.96% | |
Accor SA (a) (v) | | | 27,000 | | | | 736,605 | | |
Booking Holdings, Inc. (a) | | | 140 | | | | 244,859 | | |
| | | | 981,464 | | |
TOTAL CONSUMER DISCRETIONARY | | | 2,505,081 | | |
CONSUMER STAPLES — 2.33%
Food Products — 0.99% | |
Gruma SAB de CV | | | 29,600 | | | | 326,844 | | |
Household Products — 1.34% | |
Henkel AG & Company KGaA (v) | | | 7,200 | | | | 442,372 | | |
TOTAL CONSUMER STAPLES | | | 769,216 | | |
ENERGY — 9.72%
Energy Equipment & Services — 2.45% | |
NOV, Inc. | | | 48,069 | | | | 812,847 | | |
| | | Shares
Held | | Value | |
Oil, Gas & Consumable Fuels — 7.27% | |
Cenovus Energy, Inc. | | | 37,300 | | | $ | 709,662 | | |
Hess Corp. | | | 4,400 | | | | 466,136 | | |
Marathon Oil Corp. | | | 18,300 | | | | 411,384 | | |
Suncor Energy, Inc. | | | 23,300 | | | | 817,455 | | |
| | | | 2,404,637 | | |
TOTAL ENERGY | | | 3,217,484 | | |
FINANCIALS — 25.21%
Banks — 13.57% | |
ABN AMRO Bank NV (r) (v) | | | 24,400 | | | | 274,173 | | |
BNP Paribas SA (v) | | | 6,956 | | | | 332,721 | | |
Citigroup, Inc. | | | 25,004 | | | | 1,149,934 | | |
ING Groep NV (v) | | | 44,456 | | | | 437,965 | | |
Popular, Inc. | | | 8,700 | | | | 669,291 | | |
Societe Generale SA (v) | | | 10,493 | | | | 231,998 | | |
UniCredit SpA (v) | | | 59,700 | | | | 570,516 | | |
Wells Fargo & Company | | | 21,030 | | | | 823,745 | | |
| | | | 4,490,343 | | |
Capital Markets — 4.55% | |
The Bank of New York Mellon Corp. | | | 10,000 | | | | 417,100 | | |
Credit Suisse Group AG (v) | | | 67,286 | | | | 384,058 | | |
The Goldman Sachs Group, Inc. | | | 2,368 | | | | 703,343 | | |
| | | | 1,504,501 | | |
Diversified Financial Services — 0.98% | |
Berkshire Hathaway, Inc. (a) | | | 1,194 | | | | 325,986 | | |
The accompanying notes are an integral part of these financial statements.
33
Schedule of Investments — June 30, 2022
Hotchkis & Wiley Global Value Fund
| | | Shares
Held | | Value | |
Insurance — 6.11% | |
American International Group, Inc. | | | 23,369 | | | $ | 1,194,857 | | |
Tokio Marine Holdings, Inc. (v) | | | 14,200 | | | | 828,030 | | |
| | | | 2,022,887 | | |
TOTAL FINANCIALS | | | 8,343,717 | | |
HEALTH CARE — 6.85%
Health Care Equipment & Supplies — 1.92% | |
Koninklijke Philips NV (v) | | | 14,900 | | | | 319,585 | | |
Medtronic PLC | | | 3,500 | | | | 314,125 | | |
| | | | 633,710 | | |
Health Care Providers & Services — 4.93% | |
CVS Health Corp. | | | 9,100 | | | | 843,206 | | |
Elevance Health, Inc. | | | 1,635 | | | | 789,018 | | |
| | | | 1,632,224 | | |
TOTAL HEALTH CARE | | | 2,265,934 | | |
INDUSTRIALS — 20.26%
Aerospace & Defense — 5.66% | |
Airbus SE (v) | | | 4,800 | | | | 469,489 | | |
Babcock International Group PLC (a) (v) | | | 135,400 | | | | 511,141 | | |
BAE Systems PLC (v) | | | 72,459 | | | | 733,575 | | |
Safran SA (v) | | | 1,600 | | | | 159,306 | | |
| | | | 1,873,511 | | |
Air Freight & Logistics — 4.21% | |
FedEx Corp. | | | 3,550 | | | | 804,820 | | |
Royal Mail PLC (v) | | | 178,087 | | | | 588,304 | | |
| | | | 1,393,124 | | |
Airlines — 0.84% | |
Qantas Airways Ltd. (a) (v) | | | 90,200 | | | | 279,154 | | |
Industrial Conglomerates — 4.80% | |
General Electric Company | | | 24,934 | | | | 1,587,548 | | |
Machinery — 3.07% | |
| CNH Industrial NV | | | 30,282 | | | | 350,969 | | |
Cummins, Inc. | | | 3,429 | | | | 663,614 | | |
| | | | 1,014,583 | | |
Road & Rail — 1.68% | |
AMERCO | | | 1,162 | | | | 555,703 | | |
TOTAL INDUSTRIALS | | | 6,703,623 | | |
INFORMATION TECHNOLOGY — 19.34%
Communications Equipment — 6.17% | |
F5, Inc. (a) | | | 8,400 | | | | 1,285,536 | | |
Telefonaktiebolaget LM Ericsson — ADR | | | 102,372 | | | | 757,553 | | |
| | | | 2,043,089 | | |
| | | Shares
Held | | Value | |
Electronic Equipment, Instruments & Components — 0.81% | |
Corning, Inc. | | | 8,473 | | | $ | 266,984 | | |
IT Services — 2.98% | |
Euronet Worldwide, Inc. (a) | | | 9,800 | | | | 985,782 | | |
Semiconductors & Semiconductor Equipment — 0.97% | |
Micron Technology, Inc. | | | 5,800 | | | | 320,624 | | |
Software — 7.73% | |
Microsoft Corp. | | | 4,063 | | | | 1,043,501 | | |
Oracle Corp. | | | 13,475 | | | | 941,498 | | |
Workday, Inc. (a) | | | 4,100 | | | | 572,278 | | |
| | | | 2,557,277 | | |
Technology Hardware, Storage & Peripherals — 0.68% | |
Samsung Electronics Company Ltd. (v) | | | 5,100 | | | | 224,947 | | |
TOTAL INFORMATION TECHNOLOGY | | | 6,398,703 | | |
Total common stocks
(Cost $32,484,080) | | | | | 32,735,838 | | |
Total long-term investments
(Cost $32,484,080) | | | | | 32,735,838 | | |
SHORT-TERM
INVESTMENTS — 2.67% | | Principal
Amount | | | |
Time Deposits — 2.67% | |
Citigroup Inc., 0.91%, 07/01/2022* | | $ | 884,803 | | | | 884,803 | | |
Total short-term investments
(Cost $884,803) | | | 884,803 | | |
Total investments — 101.60%
(Cost $33,368,883) | | | 33,620,641 | | |
Liabilities in excess of other assets — (1.60)% | | | | | (530,759 | ) | |
Net assets — 100.00% | | $ | 33,089,882 | | |
(a) — Non-income producing security.
(r) — Rule 144A security under the Securities Act of 1933. Purchased in a private placement transaction; resale to the public may require registration or be limited to qualified institutional buyers. The total market value of these securities was $274,173, which represented 0.83% of net assets.
(v) — Security was fair valued as a result of market movements following the close of local trading using a third-party vendor's proprietary fair value pricing model. The total market value of these securities was $7,523,939, which represented 22.74% of net assets. See Security Valuation in Note 1 in Notes to the Financial Statements.
ADR — American Depositary Receipt
* — Invested through a cash management account administered by Brown Brothers Harriman & Co.
The accompanying notes are an integral part of these financial statements.
34
Schedule of Investments — June 30, 2022
Hotchkis & Wiley International Value Fund
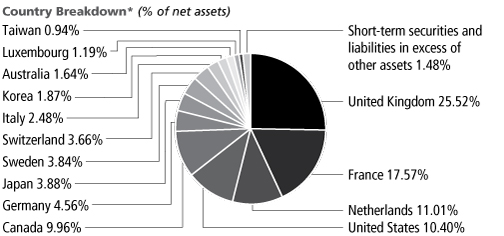
Largest Equity Holdings | | Percent of
net assets | |
Tokio Marine Holdings, Inc. | | | 3.88 | % | |
Telefonaktiebolaget LM Ericsson | | | 3.84 | % | |
BAE Systems PLC | | | 3.72 | % | |
BNP Paribas SA | | | 3.33 | % | |
ING Groep NV | | | 3.28 | % | |
Accor SA | | | 3.27 | % | |
Points.com, Inc. | | | 3.04 | % | |
Kosmos Energy Ltd. | | | 3.01 | % | |
Royal Mail PLC | | | 2.88 | % | |
Airbus SE | | | 2.87 | % | |
* Based on country of risk.
COMMON
STOCKS — 98.52% | | Shares
Held | | Value | |
COMMUNICATION SERVICES — 3.79%
Media — 1.19% | |
RTL Group SA (v) | | | 770 | | | $ | 32,253 | | |
Wireless Telecommunication Services — 2.60% | |
Vodafone Group PLC (v) | | | 45,246 | | | | 70,353 | | |
TOTAL COMMUNICATION SERVICES | | | 102,606 | | |
CONSUMER DISCRETIONARY — 11.60%
Auto Components — 2.17% | |
Magna International, Inc. | | | 1,072 | | | | 58,853 | | |
Automobiles — 1.02% | |
Bayerische Motoren Werke AG (v) | | | 386 | | | | 27,532 | | |
Hotels, Restaurants & Leisure — 5.37% | |
Accor SA (a) (v) | | | 3,250 | | | | 88,665 | | |
Compass Group PLC (v) | | | 2,760 | | | | 56,667 | | |
| | | | 145,332 | | |
Internet & Catalog Retail — 3.04% | |
Points.com, Inc. (a) | | | 3,300 | | | | 82,449 | | |
TOTAL CONSUMER DISCRETIONARY | | | 314,166 | | |
CONSUMER STAPLES — 8.99%
Beverages — 4.60% | |
Britvic PLC (v) | | | 2,800 | | | | 27,754 | | |
Coca-Cola Europacific Partners PLC | | | 570 | | | | 29,418 | | |
Heineken Holding NV (v) | | | 927 | | | | 67,342 | | |
| | | | 124,514 | | |
Food & Staples Retailing — 0.68% | |
Tesco PLC (v) | | | 5,938 | | | | 18,506 | | |
Household Products — 2.63% | |
Henkel AG & Company KGaA (v) | | | 1,160 | | | | 71,271 | | |
| | | Shares
Held | | Value | |
Personal Products — 1.08% | |
Unilever PLC (v) | | | 638 | | | $ | 29,080 | | |
TOTAL CONSUMER STAPLES | | | 243,371 | | |
ENERGY — 14.26%
Energy Equipment & Services — 3.58% | |
Expro Group Holdings NV (a) | | | 1,559 | | | | 17,960 | | |
Schlumberger NV | | | 1,140 | | | | 40,766 | | |
Subsea 7 SA (v) | | | 4,800 | | | | 38,338 | | |
| | | | 97,064 | | |
Oil, Gas & Consumable Fuels — 10.68% | |
Capricorn Energy PLC (a) (v) | | | 4,504 | | | | 11,973 | | |
Cenovus Energy, Inc. | | | 3,250 | | | | 61,834 | | |
Kosmos Energy Ltd. (a) | | | 13,168 | | | | 81,509 | | |
Shell PLC (v) | | | 1,527 | | | | 39,622 | | |
Suncor Energy, Inc. | | | 1,900 | | | | 66,659 | | |
TotalEnergies SE (v) | | | 525 | | | | 27,635 | | |
| | | | 289,232 | | |
TOTAL ENERGY | | | 386,296 | | |
FINANCIALS — 30.13%
Banks — 17.78% | |
ABN AMRO Bank NV (r) (v) | | | 4,200 | | | | 47,194 | | |
Barclays PLC (v) | | | 23,317 | | | | 43,602 | | |
BNP Paribas SA (v) | | | 1,884 | | | | 90,116 | | |
ING Groep NV (v) | | | 9,007 | | | | 88,734 | | |
Lloyds Banking Group PLC (v) | | | 105,600 | | | | 54,332 | | |
NatWest Group PLC (v) | | | 11,000 | | | | 29,279 | | |
Societe Generale SA (v) | | | 3,031 | | | | 67,015 | | |
UniCredit SpA (v) | | | 6,400 | | | | 61,161 | | |
| | | | 481,433 | | |
The accompanying notes are an integral part of these financial statements.
35
Schedule of Investments — June 30, 2022
Hotchkis & Wiley International Value Fund
| | | Shares
Held | | Value | |
Capital Markets — 5.13% | |
Credit Suisse Group AG (v) | | | 12,710 | | | $ | 72,547 | | |
Rothschild & Company (v) | | | 1,960 | | | | 66,467 | | |
| | | | 139,014 | | |
Insurance — 7.22% | |
Enstar Group Ltd. (a) | | | 299 | | | | 63,980 | | |
Tokio Marine Holdings, Inc. (v) | | | 1,800 | | | | 104,962 | | |
Zurich Insurance Group AG (v) | | | 61 | | | | 26,600 | | |
| | | | 195,542 | | |
TOTAL FINANCIALS | | | 815,989 | | |
HEALTH CARE — 4.94%
Health Care Equipment & Supplies — 3.40% | |
Koninklijke Philips NV (v) | | | 2,577 | | | | 55,273 | | |
Medtronic PLC | | | 410 | | | | 36,798 | | |
| | | | 92,071 | | |
Pharmaceuticals — 1.54% | |
Euroapi SA (a) | | | 5 | | | | 84 | | |
GSK PLC (v) | | | 1,309 | | | | 28,211 | | |
Sanofi (v) | | | 133 | | | | 13,413 | | |
| | | | 41,708 | | |
TOTAL HEALTH CARE | | | 133,779 | | |
INDUSTRIALS — 18.16%
Aerospace & Defense — 9.93% | |
Airbus SE (v) | | | 795 | | | | 77,759 | | |
Babcock International Group PLC (a) (v) | | | 12,100 | | | | 45,678 | | |
BAE Systems PLC (v) | | | 9,945 | | | | 100,682 | | |
Safran SA (v) | | | 450 | | | | 44,805 | | |
| | | | 268,924 | | |
Air Freight & Logistics — 2.88% | |
Royal Mail PLC (v) | | | 23,629 | | | | 78,058 | | |
Airlines — 1.64% | |
Qantas Airways Ltd. (a) (v) | | | 14,300 | | | | 44,256 | | |
Industrial Conglomerates — 0.91% | |
Siemens AG (v) | | | 240 | | | | 24,671 | | |
Machinery — 2.34% | |
| CNH Industrial NV | | | 4,953 | | | | 57,405 | | |
Iveco Group NV (a) (v) | | | 1,110 | | | | 5,877 | | |
| | | | 63,282 | | |
Professional Services — 0.46% | |
Hudson Global, Inc. (a) | | | 399 | | | | 12,529 | | |
TOTAL INDUSTRIALS | | | 491,720 | | |
INFORMATION TECHNOLOGY — 6.65%
Communications Equipment — 3.84% | |
Telefonaktiebolaget LM Ericsson (v) | | | 13,944 | | | | 104,148 | | |
| | | Shares
Held | | Value | |
Semiconductors & Semiconductor Equipment — 0.94% | |
Taiwan Semiconductor Manufacturing
Company Ltd. — ADR | | | 310 | | | $ | 25,342 | | |
Technology Hardware, Storage & Peripherals — 1.87% | |
Samsung Electronics Company Ltd. (v) | | | 1,150 | | | | 50,723 | | |
TOTAL INFORMATION TECHNOLOGY | | | 180,213 | | |
Total common stocks
(Cost $2,674,563) | | | 2,668,140 | | |
Total long-term investments
(Cost $2,674,563) | | | | | 2,668,140 | | |
SHORT-TERM
INVESTMENTS — 1.94% | | Principal
Amount | | | |
Time Deposits — 1.94% | |
Citigroup, Inc., 0.91%, 07/01/2022* | | $ | 52,447 | | | | 52,447 | | |
Total short-term investments
(Cost $52,447) | | | 52,447 | | |
Total investments — 100.46%
(Cost $2,727,010) | | | 2,720,587 | | |
Liabilities in excess of other assets — (0.46)% | | | | | (12,425 | ) | |
Net assets — 100.00% | | $ | 2,708,162 | | |
(a) — Non-income producing security.
(r) — Rule 144A security under the Securities Act of 1933. Purchased in a private placement transaction; resale to the public may require registration or be limited to qualified institutional buyers. The total market value of these securities was $47,194, which represented 1.74% of net assets.
(v) — Security was fair valued as a result of market movements following the close of local trading using a third-party vendor's proprietary fair value pricing model. The total market value of these securities was $2,032,554, which represented 75.05% of net assets. See Security Valuation in Note 1 in Notes to the Financial Statements.
ADR — American Depositary Receipt
* — Invested through a cash management account administered by Brown Brothers Harriman & Co.
The accompanying notes are an integral part of these financial statements.
36
Schedule of Investments — June 30, 2022
Hotchkis & Wiley International Small Cap Diversified Value Fund

Largest Equity Holdings | | Percent of
net assets | |
Burford Capital Ltd. | | | 0.69 | % | |
Tassal Group Ltd. | | | 0.67 | % | |
u-blox Holding AG | | | 0.66 | % | |
Silverlake Axis Ltd. | | | 0.64 | % | |
The First Bank of Toyama Ltd. | | | 0.63 | % | |
Beazley PLC | | | 0.59 | % | |
Centrica PLC | | | 0.58 | % | |
Plus500 Ltd. | | | 0.57 | % | |
Cardinal Energy Ltd. | | | 0.57 | % | |
Financial Products Group Company Ltd. | | | 0.56 | % | |
* Based on country of risk.
COMMON
STOCKS — 97.73% | | Shares
Held | | Value | |
COMMUNICATION SERVICES — 1.53%
Entertainment — 0.40% | |
Akatsuki, Inc. (v) | | | 600 | | | $ | 12,034 | | |
GungHo Online Entertainment, Inc. (v) | | | 600 | | | | 10,645 | | |
| | | | 22,679 | | |
Media — 1.13% | |
APG SGA SA (v) | | | 170 | | | | 31,387 | | |
Atresmedia Corp. de Medios de Comunicacion SA (v) | | | 3,200 | | | | 11,096 | | |
North Media A/S | | | 1,200 | | | | 11,226 | | |
ProSiebenSat.1 Media SE (v) | | | 1,200 | | | | 11,161 | | |
| | | | 64,870 | | |
TOTAL COMMUNICATION SERVICES | | | 87,549 | | |
CONSUMER DISCRETIONARY — 9.93%
Auto Components — 2.80% | |
AKWEL | | | 700 | | | | 11,752 | | |
Bulten AB (v) | | | 2,000 | | | | 12,562 | | |
Exco Technologies Ltd. | | | 1,800 | | | | 11,173 | | |
FCC Company Ltd. (v) | | | 1,700 | | | | 16,900 | | |
NHK Spring Company Ltd. (v) | | | 1,800 | | | | 11,814 | | |
Nichirin Company Ltd. (v) | | | 1,000 | | | | 11,288 | | |
Nokian Renkaat Oyj (v) | | | 1,400 | | | | 15,442 | | |
SAF-Holland SE (v) | | | 1,500 | | | | 9,969 | | |
Tokai Rika Company Ltd. (v) | | | 1,100 | | | | 11,999 | | |
Toyota Boshoku Corp. (v) | | | 1,200 | | | | 17,825 | | |
TS Tech Company Ltd. (v) | | | 2,800 | | | | 28,988 | | |
| | | | 159,712 | | |
Automobiles — 0.85% | |
Kabe Group AB (v) | | | 500 | | | | 9,828 | | |
Mazda Motor Corp. (v) | | | 1,600 | | | | 13,060 | | |
Mitsubishi Motors Corp. (a) (v) | | | 4,900 | | | | 16,528 | | |
Trigano SA (v) | | | 90 | | | | 8,856 | | |
| | | | 48,272 | | |
| | | Shares
Held | | Value | |
Distributors — 0.31% | |
Inchcape PLC (v) | | | 2,100 | | | $ | 17,846 | | |
Diversified Consumer Services — 0.30% | |
Anexo Group PLC (v) | | | 11,600 | | | | 17,278 | | |
Hotels, Restaurants & Leisure — 0.28% | |
Dalata Hotel Group PLC (a) (v) | | | 4,400 | | | | 16,049 | | |
Household Durables — 1.75% | |
Bonava AB (v) | | | 4,100 | | | | 11,933 | | |
Crest Nicholson Holdings PLC (v) | | | 4,100 | | | | 12,225 | | |
Fleetwood Ltd. (v) | | | 9,900 | | | | 8,863 | | |
Kaufman & Broad SA (v) | | | 600 | | | | 16,414 | | |
MJ Gleeson PLC | | | 1,700 | | | | 10,637 | | |
Nobia AB (v) | | | 3,700 | | | | 9,963 | | |
Redrow PLC (v) | | | 1,900 | | | | 11,344 | | |
Tamron Company Ltd. (v) | | | 1,000 | | | | 18,532 | | |
| | | | 99,911 | | |
Internet & Catalog Retail — 0.22% | |
Takkt AG (v) | | | 800 | | | | 12,607 | | |
Leisure Products — 1.07% | |
Fountaine Pajot SA (v) | | | 100 | | | | 10,689 | | |
Furyu Corp. (v) | | | 1,500 | | | | 12,475 | | |
Kawai Musical Instruments Manufacturing
Company Ltd. (v) | | | 1,300 | | | | 24,850 | | |
Photo-Me International PLC | | | 14,000 | | | | 13,088 | | |
| | | | 61,102 | | |
Specialty Retail — 1.80% | |
Beter Bed Holding NV (v) | | | 2,500 | | | | 10,747 | | |
Clas Ohlson AB (v) | | | 1,600 | | | | 16,589 | | |
Halfords Group PLC (v) | | | 10,800 | | | | 18,851 | | |
Leon's Furniture Ltd. | | | 900 | | | | 10,998 | | |
Michael Hill International Ltd. (v) | | | 15,800 | | | | 11,231 | | |
The accompanying notes are an integral part of these financial statements.
37
Schedule of Investments — June 30, 2022
Hotchkis & Wiley International Small Cap Diversified Value Fund
| | | Shares
Held | | Value | |
Shaver Shop Group Ltd. | | | 16,200 | | | $ | 10,903 | | |
Super Retail Group Ltd. (v) | | | 1,700 | | | | 9,986 | | |
Vertu Motors PLC (v) | | | 20,100 | | | | 13,281 | | |
| | | | 102,586 | | |
Textiles, Apparel & Luxury Goods — 0.55% | |
Hagihara Industries, Inc. (v) | | | 2,200 | | | | 17,626 | | |
Mavi Giyim Sanayi Ve Ticaret AS (r) | | | 4,400 | | | | 13,826 | | |
| | | | 31,452 | | |
TOTAL CONSUMER DISCRETIONARY | | | 566,815 | | |
CONSUMER STAPLES — 5.32%
Beverages — 1.05% | |
Britvic PLC (v) | | | 2,900 | | | | 28,746 | | |
Corby Spirit and Wine Ltd. | | | 1,300 | | | | 17,422 | | |
Olvi Oyj (v) | | | 400 | | | | 13,518 | | |
| | | | 59,686 | | |
Food Products — 3.33% | |
Austevoll Seafood ASA (v) | | | 2,000 | | | | 23,588 | | |
Ebara Foods Industry, Inc. (v) | | | 600 | | | | 13,453 | | |
Greencore Group PLC (a) | | | 7,700 | | | | 9,308 | | |
High Liner Foods, Inc. | | | 1,400 | | | | 13,084 | | |
Itoham Yonekyu Holdings, Inc. (v) | | | 2,200 | | | | 11,206 | | |
Lassonde Industries, Inc. (m) | | | 170 | | | | 15,724 | | |
Newlat Food SpA (a) (v) | | | 1,900 | | | | 11,275 | | |
Nitto Fuji Flour Milling Company Ltd. (v) | | | 400 | | | | 13,825 | | |
Savencia SA | | | 440 | | | | 27,666 | | |
Tassal Group Ltd. (v) | | | 11,600 | | | | 38,378 | | |
Wynnstay Group PLC | | | 1,700 | | | | 12,644 | | |
| | | | 190,151 | | |
Household Products — 0.20% | |
Suominen Oyj (v) | | | 3,700 | | | | 11,556 | | |
Personal Products — 0.46% | |
BWX Ltd. (v) | | | 30,400 | | | | 13,478 | | |
Shinnihonseiyaku Company Ltd. (v) | | | 1,100 | | | | 12,980 | | |
| | | | 26,458 | | |
Tobacco — 0.28% | |
Scandinavian Tobacco Group A/S (r) (v) | | | 800 | | | | 15,682 | | |
TOTAL CONSUMER STAPLES | | | 303,533 | | |
ENERGY — 6.30%
Energy Equipment & Services — 1.80% | |
Expro Group Holdings NV (a) | | | 2,433 | | | | 28,028 | | |
Subsea 7 SA (v) | | | 3,500 | | | | 27,955 | | |
Technip Energies NV (v) | | | 1,360 | | | | 17,041 | | |
TechnipFMC PLC (a) (i) | | | 2,600 | | | | 17,498 | | |
TerraVest Industries, Inc. | | | 700 | | | | 12,497 | | |
| | | | 103,019 | | |
| | | Shares
Held | | Value | |
Oil, Gas & Consumable Fuels — 4.50% | |
Birchcliff Energy Ltd. | | | 4,200 | | | $ | 28,550 | | |
Capricorn Energy PLC (a) (v) | | | 11,861 | | | | 31,531 | | |
Cardinal Energy Ltd. (m) | | | 5,800 | | | | 32,579 | | |
Crescent Point Energy Corp. | | | 4,500 | | | | 31,988 | | |
Koninklijke Vopak NV (v) | | | 450 | | | | 11,341 | | |
Kosmos Energy Ltd. (a) | | | 4,700 | | | | 29,093 | | |
Pantheon Resources PLC (a) (v) | | | 18,400 | | | | 20,100 | | |
Pilipinas Shell Petroleum Corp. (a) (v) | | | 34,700 | | | | 11,399 | | |
Tamarack Valley Energy Ltd. | | | 8,800 | | | | 29,602 | | |
Vermilion Energy, Inc. | | | 1,600 | | | | 30,454 | | |
| | | | 256,637 | | |
TOTAL ENERGY | | | 359,656 | | |
FINANCIALS — 26.13%
Banks — 9.44% | |
Aozora Bank Ltd. (v) | | | 1,500 | | | | 29,191 | | |
The Awa Bank Ltd. (v) | | | 1,800 | | | | 26,856 | | |
Banca Popolare di Sondrio SpA (v) | | | 4,700 | | | | 16,235 | | |
Bank Danamon Indonesia Tbk PT | | | 180,300 | | | | 28,441 | | |
The Bank of East Asia Ltd. (v) | | | 20,400 | | | | 28,708 | | |
Caisse Regionale de Credit Agricole
Mutuel Brie Picardie (v) | | | 1,400 | | | | 26,830 | | |
Caisse Regionale de Credit Agricole
Mutuel de Normandie-Seine (v) | | | 200 | | | | 16,997 | | |
Caisse Regionale de Credit Agricole
Mutuel de Paris et d'Ile-de-France | | | 230 | | | | 17,594 | | |
Caisse Regionale de Credit Agricole
Mutuel d'Ille-et-Vilaine | | | 180 | | | | 11,318 | | |
Caisse Regionale de Credit Agricole
Mutuel Nord de France | | | 600 | | | | 10,853 | | |
Caisse Regionale de Credit Agricole
Mutuel Toulouse 31 | | | 230 | | | | 16,513 | | |
Collector AB (a) (v) | | | 4,800 | | | | 14,542 | | |
Dah Sing Financial Holdings Ltd. (v) | | | 10,400 | | | | 29,725 | | |
The First Bank of Toyama Ltd. (v) | | | 11,800 | | | | 36,103 | | |
The Hachijuni Bank Ltd. (v) | | | 8,500 | | | | 31,388 | | |
The Iyo Bank Ltd. (v) | | | 6,100 | | | | 29,989 | | |
Komplett Bank ASA (a) (v) | | | 17,200 | | | | 10,571 | | |
Raiffeisen Bank International AG (v) | | | 2,500 | | | | 27,314 | | |
Seven Bank Ltd. (v) | | | 6,200 | | | | 11,840 | | |
Sparebank 1 Oestlandet (v) | | | 1,400 | | | | 16,788 | | |
Sparebanken More | | | 2,200 | | | | 16,598 | | |
Sparebanken Vest (v) | | | 3,000 | | | | 26,799 | | |
Sparekassen Sjaelland-Fyn A/S (v) | | | 500 | | | | 10,408 | | |
Suruga Bank Ltd. (v) | | | 9,300 | | | | 25,233 | | |
TOMONY Holdings, Inc. (v) | | | 4,900 | | | | 11,284 | | |
The Towa Bank Ltd. (v) | | | 2,900 | | | | 11,040 | | |
| | | | 539,158 | | |
The accompanying notes are an integral part of these financial statements.
38
Schedule of Investments — June 30, 2022
Hotchkis & Wiley International Small Cap Diversified Value Fund
| | | Shares
Held | | Value | |
Capital Markets — 5.50% | |
ABG Sundal Collier Holding ASA | | | 26,300 | | | $ | 15,727 | | |
AGF Management Ltd. | | | 5,900 | | | | 29,381 | | |
Ashmore Group PLC (v) | | | 6,700 | | | | 18,124 | | |
Azimut Holding SpA (v) | | | 900 | | | | 15,665 | | |
Bright Smart Securities & Commodities Group Ltd. (v) | | | 70,000 | | | | 12,592 | | |
CI Financial Corp. | | | 1,600 | | | | 16,992 | | |
Deutsche Beteiligungs AG (v) | | | 600 | | | | 15,947 | | |
GAM Holding AG (a) | | | 29,300 | | | | 24,247 | | |
HS Holdings Company Ltd. (v) | | | 3,200 | | | | 30,482 | | |
JAFCO Group Company Ltd. (v) | | | 1,500 | | | | 18,137 | | |
Jupiter Fund Management PLC (v) | | | 8,500 | | | | 15,288 | | |
Navigator Global Investments Ltd. (v) | | | 27,700 | | | | 23,848 | | |
Numis Corp. PLC (v) | | | 10,200 | | | | 31,190 | | |
Polar Capital Holdings PLC (v) | | | 2,800 | | | | 17,309 | | |
Rothschild & Company (v) | | | 860 | | | | 29,164 | | |
| | | | 314,093 | | |
Consumer Finance — 1.16% | |
Hoist Finance AB (a) (r) (v) | | | 9,800 | | | | 26,702 | | |
Orient Corp. (v) | | | 18,100 | | | | 17,118 | | |
Resurs Holding AB (r) (v) | | | 11,300 | | | | 22,478 | | |
| | | | 66,298 | | |
Diversified Financial Services — 2.57% | |
Banca IFIS SpA (v) | | | 1,700 | | | | 24,191 | | |
Burford Capital Ltd. (v) | | | 4,000 | | | | 39,219 | | |
Financial Products Group Company Ltd. (v) | | | 4,800 | | | | 32,128 | | |
Plus500 Ltd. (v) | | | 1,600 | | | | 32,608 | | |
Tokyo Century Corp. (v) | | | 550 | | | | 18,272 | | |
| | | | 146,418 | | |
Insurance — 5.89% | |
Beazley PLC (v) | | | 5,500 | | | | 33,536 | | |
Brookfield Asset Management Reinsurance
Partners Ltd. (a) | | | 600 | | | | 26,723 | | |
Clal Insurance Enterprises Holdings Ltd. (a) (v) | | | 900 | | | | 16,103 | | |
Coface SA (v) | | | 2,500 | | | | 26,260 | | |
Direct Line Insurance Group PLC (v) | | | 10,000 | | | | 30,694 | | |
FBD Holdings PLC | | | 1,100 | | | | 11,136 | | |
Grupo Catalana Occidente SA (v) | | | 1,000 | | | | 31,257 | | |
Hiscox Ltd. (v) | | | 1,500 | | | | 17,275 | | |
IDI Insurance Company Ltd. (v) | | | 400 | | | | 10,446 | | |
Just Group PLC (v) | | | 12,200 | | | | 10,621 | | |
Lancashire Holdings Ltd. (v) | | | 3,700 | | | | 18,184 | | |
The Phoenix Holdings Ltd. (v) | | | 1,100 | | | | 10,922 | | |
Protector Forsikring ASA | | | 1,200 | | | | 12,476 | | |
Societa Cattolica Di Assicurazione SpA (v) | | | 2,700 | | | | 19,122 | | |
| | | Shares
Held | | Value | |
Unipol Gruppo SpA (v) | | | 5,100 | | | $ | 23,231 | | |
Vienna Insurance Group AG Wiener
Versicherung Gruppe (v) | | | 1,200 | | | | 27,447 | | |
Wuestenrot & Wuerttembergische AG (v) | | | 600 | | | | 10,649 | | |
| | | | 336,082 | | |
Thrifts & Mortgage Finance — 1.57% | |
Aruhi Corp. (v) | | | 3,900 | | | | 29,165 | | |
Asax Company Ltd. (v) | | | 2,700 | | | | 12,011 | | |
EQB, Inc. | | | 400 | | | | 16,516 | | |
Home Capital Group, Inc. | | | 800 | | | | 15,140 | | |
MCAN Mortgage Corp. | | | 1,300 | | | | 16,917 | | |
| | | | 89,749 | | |
TOTAL FINANCIALS | | | 1,491,798 | | |
HEALTH CARE — 3.40%
Health Care Equipment & Supplies — 1.05% | |
Draegerwerk AG & Company KGaA | | | 660 | | | | 29,222 | | |
Guerbet (v) | | | 500 | | | | 11,639 | | |
Paramount Bed Holdings Company Ltd. (v) | | | 1,200 | | | | 19,501 | | |
| | | | 60,362 | | |
Health Care Providers & Services — 1.49% | |
Estia Health Ltd. (v) | | | 20,000 | | | | 26,372 | | |
FALCO HOLDINGS Company Ltd. (v) | | | 700 | | | | 10,552 | | |
Medical Facilities Corp. | | | 1,600 | | | | 10,864 | | |
Regis Healthcare Ltd. | | | 19,300 | | | | 24,645 | | |
Ship Healthcare Holdings, Inc. (v) | | | 700 | | | | 12,493 | | |
| | | | 84,926 | | |
Health Care Technology — 0.22% | |
GPI SpA | | | 900 | | | | 12,450 | | |
Pharmaceuticals — 0.64% | |
Eco Animal Health Group PLC | | | 7,700 | | | | 10,592 | | |
H Lundbeck A/S (a) | | | 600 | | | | 2,879 | | |
H Lundbeck A/S | | | 2,400 | | | | 11,656 | | |
Tsumura & Company (v) | | | 500 | | | | 11,246 | | |
| | | | 36,373 | | |
TOTAL HEALTH CARE | | | 194,111 | | |
INDUSTRIALS — 22.97%
Aerospace & Defense — 2.58% | |
Austal Ltd. (v) | | | 23,100 | | | | 28,700 | | |
Avio SpA (v) | | | 2,600 | | | | 29,969 | | |
Babcock International Group PLC (a) (v) | | | 8,100 | | | | 30,578 | | |
QinetiQ Group PLC (v) | | | 6,800 | | | | 30,413 | | |
Senior PLC (a) | | | 19,500 | | | | 27,488 | | |
| | | | 147,148 | | |
The accompanying notes are an integral part of these financial statements.
39
Schedule of Investments — June 30, 2022
Hotchkis & Wiley International Small Cap Diversified Value Fund
| | | Shares
Held | | Value | |
Air Freight & Logistics — 1.54% | |
bpost SA (v) | | | 2,700 | | | $ | 16,000 | | |
Oesterreichische Post AG (v) | | | 400 | | | | 11,443 | | |
PostNL NV (v) | | | 6,526 | | | | 19,770 | | |
Royal Mail PLC (v) | | | 7,400 | | | | 24,446 | | |
Wincanton PLC (v) | | | 3,900 | | | | 16,550 | | |
| | | | 88,209 | | |
Building Products — 1.13% | |
Deceuninck NV (v) | | | 4,600 | | | | 10,663 | | |
Nichiha Corp. (v) | | | 700 | | | | 13,599 | | |
Norcros PLC (v) | | | 6,500 | | | | 18,425 | | |
Okabe Company Ltd. (v) | | | 2,400 | | | | 10,777 | | |
Uponor Oyj (v) | | | 800 | | | | 11,102 | | |
| | | | 64,566 | | |
Commercial Services & Supplies — 1.93% | |
Cewe Stiftung & Company KGaA (v) | | | 140 | | | | 11,831 | | |
Downer EDI Ltd. (v) | | | 3,100 | | | | 10,816 | | |
ISS A/S (a) (v) | | | 700 | | | | 11,160 | | |
Loomis AB (v) | | | 1,300 | | | | 31,756 | | |
Mitie Group PLC (v) | | | 18,800 | | | | 12,914 | | |
Okamura Corp. (v) | | | 1,200 | | | | 10,702 | | |
Prosegur Cash SA (r) | | | 16,400 | | | | 10,690 | | |
SG Fleet Group Ltd. (v) | | | 6,900 | | | | 10,198 | | |
| | | | 110,067 | | |
Construction & Engineering — 3.34% | |
Aecon Group, Inc. | | | 1,100 | | | | 11,221 | | |
Bird Construction, Inc. | | | 1,900 | | | | 11,026 | | |
CTI Engineering Company Ltd. (v) | | | 700 | | | | 13,384 | | |
Dai-Dan Company Ltd. (v) | | | 700 | | | | 10,873 | | |
Fukuda Corp. (v) | | | 300 | | | | 10,306 | | |
Grupo Empresarial San Jose SA (v) | | | 2,800 | | | | 11,674 | | |
Hazama Ando Corp. (v) | | | 1,900 | | | | 11,793 | | |
Implenia AG (a) (v) | | | 500 | | | | 11,466 | | |
JDC Corp. (v) | | | 2,900 | | | | 11,172 | | |
Kumagai Gumi Company Ltd. (v) | | | 500 | | | | 10,125 | | |
Kyudenko Corp. (v) | | | 500 | | | | 10,124 | | |
NCC AB (v) | | | 1,000 | | | | 10,093 | | |
Nichireki Company Ltd. (v) | | | 1,300 | | | | 12,454 | | |
Per Aarsleff Holding A/S (v) | | | 300 | | | | 8,973 | | |
Strabag SE | | | 300 | | | | 12,748 | | |
Tobishima Corp. (v) | | | 1,400 | | | | 10,539 | | |
Yurtec Corp. (v) | | | 2,300 | | | | 12,495 | | |
| | | | 190,466 | | |
| | | Shares
Held | | Value | |
Electrical Equipment — 0.90% | |
Denyo Company Ltd. (v) | | | 1,000 | | | $ | 11,737 | | |
Nitto Kogyo Corp. (v) | | | 1,000 | | | | 17,300 | | |
Phoenix Mecano AG (v) | | | 30 | | | | 11,299 | | |
SEC Carbon Ltd. (v) | | | 300 | | | | 11,222 | | |
| | | | 51,558 | | |
Industrial Conglomerates — 0.44% | |
Chargeurs SA (v) | | | 1,000 | | | | 15,553 | | |
Indus Holding AG (v) | | | 400 | | | | 9,347 | | |
| | | | 24,900 | | |
Machinery — 8.37% | |
ANDRITZ AG (v) | | | 700 | | | | 28,257 | | |
Bucher Industries AG (v) | | | 50 | | | | 17,452 | | |
Cargotec Oyj (v) | | | 400 | | | | 10,590 | | |
Danieli & C Officine Meccaniche SpA (v) | | | 2,000 | | | | 28,187 | | |
Duerr AG (v) | | | 750 | | | | 17,391 | | |
Feintool International Holding AG (v) | | | 600 | | | | 11,806 | | |
Frencken Group Ltd. (v) | | | 19,300 | | | | 15,448 | | |
Fu Yu Corp. Ltd. | | | 65,600 | | | | 12,513 | | |
Glory Ltd. (v) | | | 1,100 | | | | 16,599 | | |
Haldex AB (a) (v) | | | 3,300 | | | | 21,188 | | |
Hirano Tecseed Company Ltd. (v) | | | 800 | | | | 9,924 | | |
Iveco Group NV (a) (v) | | | 5,400 | | | | 28,590 | | |
Manitou BF SA (v) | | | 600 | | | | 11,203 | | |
Morgan Advanced Materials PLC (v) | | | 3,400 | | | | 11,369 | | |
Morita Holdings Corp. (v) | | | 1,200 | | | | 11,692 | | |
Nitta Corp. (v) | | | 500 | | | | 10,168 | | |
Noritake Company Ltd. (v) | | | 400 | | | | 11,902 | | |
Norma Group SE (v) | | | 500 | | | | 11,206 | | |
Picanol | | | 170 | | | | 10,796 | | |
Ponsse Oyj | | | 400 | | | | 10,584 | | |
Rieter Holding AG (v) | | | 240 | | | | 27,777 | | |
Semperit AG Holding (v) | | | 800 | | | | 15,544 | | |
Shibuya Corp. (v) | | | 700 | | | | 12,097 | | |
Shinmaywa Industries Ltd. (v) | | | 1,700 | | | | 13,534 | | |
Shinwa Company Ltd. (v) | | | 800 | | | | 12,375 | | |
Sulzer AG (v) | | | 170 | | | | 10,596 | | |
Sumitomo Heavy Industries Ltd. (v) | | | 600 | | | | 13,282 | | |
Takeuchi Manufacturing Company Ltd. (v) | | | 900 | | | | 15,444 | | |
Talgo SA (r) (v) | | | 3,150 | | | | 10,603 | | |
Tsubakimoto Chain Company (v) | | | 700 | | | | 15,688 | | |
Tsukishima Kikai Company Ltd. (v) | | | 2,100 | | | | 13,493 | | |
Wacker Neuson SE (v) | | | 600 | | | | 10,412 | | |
| | | | 477,710 | | |
The accompanying notes are an integral part of these financial statements.
40
Schedule of Investments — June 30, 2022
Hotchkis & Wiley International Small Cap Diversified Value Fund
| | | Shares
Held | | Value | |
Professional Services — 1.64% | |
Bertrandt AG (v) | | | 400 | | | $ | 15,040 | | |
Groupe Crit (v) | | | 440 | | | | 27,167 | | |
Hito Communications Holdings, Inc. (v) | | | 1,600 | | | | 17,881 | | |
McMillan Shakespeare Ltd. (v) | | | 1,600 | | | | 10,760 | | |
PeopleIN Ltd. (v) | | | 5,100 | | | | 10,167 | | |
SThree PLC (v) | | | 2,900 | | | | 12,554 | | |
| | | | 93,569 | | |
Road & Rail — 0.73% | |
Nikkon Holdings Company Ltd. (v) | | | 1,200 | | | | 19,033 | | |
Redde Northgate PLC (v) | | | 2,700 | | | | 11,091 | | |
Sankyu, Inc. (v) | | | 400 | | | | 11,516 | | |
| | | | 41,640 | | |
Trading Companies & Distributors — 0.37% | |
Kanamoto Company Ltd. (v) | | | 700 | | | | 9,934 | | |
Sanyo Trading Company Ltd. (v) | | | 1,600 | | | | 11,536 | | |
| | | | 21,470 | | |
TOTAL INDUSTRIALS | | | 1,311,303 | | |
INFORMATION TECHNOLOGY — 6.53%
Communications Equipment — 0.73% | |
Evertz Technologies Ltd. | | | 2,800 | | | | 28,387 | | |
EVS Broadcast Equipment SA (v) | | | 600 | | | | 13,628 | | |
| | | | 42,015 | | |
Electronic Equipment, Instruments & Components — 2.80% | |
Alps Alpine Company Ltd. (v) | | | 1,800 | | | | 18,291 | | |
Celestica, Inc. (a) | | | 1,700 | | | | 16,535 | | |
Daitron Company Ltd. (v) | | | 1,900 | | | | 24,954 | | |
Elematec Corp. (v) | | | 2,000 | | | | 18,544 | | |
Esprinet SpA (v) | | | 2,100 | | | | 15,074 | | |
Horiba Ltd. (v) | | | 200 | | | | 8,532 | | |
Japan Aviation Electronics Industry Ltd. (v) | | | 1,200 | | | | 18,122 | | |
Kaga Electronics Company Ltd. (v) | | | 500 | | | | 11,181 | | |
Softwareone Holding AG (a) (v) | | | 1,000 | | | | 11,987 | | |
V Technology Company Ltd. (v) | | | 800 | | | | 16,496 | | |
| | | | 159,716 | | |
IT Services — 1.24% | |
CSE Global Ltd. (v) | | | 34,800 | | | | 11,647 | | |
DTS Corp. (v) | | | 600 | | | | 13,371 | | |
Global Dominion Access SA (r) (v) | | | 2,700 | | | | 11,751 | | |
KNOW IT AB (v) | | | 400 | | | | 11,193 | | |
Proact IT Group AB (v) | | | 1,700 | | | | 11,346 | | |
Sword Group (v) | | | 300 | | | | 11,350 | | |
| | | | 70,658 | | |
| | | Shares
Held | | Value | |
Semiconductors & Semiconductor Equipment — 0.88% | |
u-blox Holding AG (a) (v) | | | 370 | | | $ | 37,563 | | |
UMS Holdings Ltd. (v) | | | 15,625 | | | | 12,498 | | |
| | | | 50,061 | | |
Software — 0.88% | |
Silverlake Axis Ltd. (v) | | | 129,000 | | | | 36,728 | | |
System Research Company Ltd. (v) | | | 900 | | | | 13,592 | | |
| | | | 50,320 | | |
TOTAL INFORMATION TECHNOLOGY | | | 372,770 | | |
MATERIALS — 10.25%
Chemicals — 2.41% | |
ASAHI YUKIZAI CORP. (v) | | | 1,200 | | | | 17,689 | | |
Dai Nippon Toryo Company Ltd. (v) | | | 4,700 | | | | 24,543 | | |
Kanto Denka Kogyo Company Ltd. (v) | | | 2,400 | | | | 15,655 | | |
Nihon Parkerizing Company Ltd. (v) | | | 1,500 | | | | 9,876 | | |
Orion Engineered Carbons SA | | | 700 | | | | 10,871 | | |
Sumitomo Seika Chemicals Company Ltd. (v) | | | 800 | | | | 17,036 | | |
Toagosei Company Ltd. (v) | | | 2,000 | | | | 14,888 | | |
Tokuyama Corp. (v) | | | 1,300 | | | | 16,538 | | |
Yushiro Chemical Industry Company Ltd. (v) | | | 1,500 | | | | 10,257 | | |
| | | | 137,353 | | |
Construction Materials — 1.97% | |
Adbri Ltd. (v) | | | 5,900 | | | | 9,890 | | |
Buzzi Unicem SpA (v) | | | 1,000 | | | | 16,414 | | |
Cementir Holding NV (v) | | | 4,300 | | | | 27,939 | | |
CSR Ltd. (v) | | | 3,000 | | | | 8,434 | | |
Forterra PLC (r) (v) | | | 6,200 | | | | 20,190 | | |
H+H International A/S (a) (v) | | | 700 | | | | 13,095 | | |
Vicat SA (v) | | | 600 | | | | 16,606 | | |
| | | | 112,568 | | |
Containers & Packaging — 1.37% | |
Brodrene Hartmann A/S (a) | | | 400 | | | | 13,526 | | |
Fuji Seal International, Inc. (v) | | | 1,300 | | | | 14,162 | | |
Mayr Melnhof Karton AG (v) | | | 70 | | | | 11,965 | | |
Takemoto Yohki Company Ltd. (v) | | | 2,000 | | | | 11,630 | | |
Verallia SA (r) (v) | | | 400 | | | | 9,592 | | |
Winpak Ltd. | | | 500 | | | | 17,087 | | |
| | | | 77,962 | | |
Metals & Mining — 2.90% | |
Anglo Pacific Group PLC | | | 8,700 | | | | 15,335 | | |
Bekaert SA (v) | | | 300 | | | | 9,813 | | |
Grange Resources Ltd. (v) | | | 21,000 | | | | 18,381 | | |
MACA Ltd. (v) | | | 32,100 | | | | 14,652 | | |
Macmahon Holdings Ltd. (v) | | | 98,200 | | | | 9,165 | | |
Mount Gibson Iron Ltd. (v) | | | 40,700 | | | | 15,228 | | |
The accompanying notes are an integral part of these financial statements.
41
Schedule of Investments — June 30, 2022
Hotchkis & Wiley International Small Cap Diversified Value Fund
| | | Shares
Held | | Value | |
Pan African Resources PLC (v) | | | 47,400 | | | $ | 12,066 | | |
Rana Gruber ASA (v) | | | 2,000 | | | | 9,093 | | |
Regis Resources Ltd. (v) | | | 13,800 | | | | 12,290 | | |
Sandfire Resources Ltd. (v) | | | 5,000 | | | | 15,414 | | |
Silvercorp Metals, Inc. | | | 4,600 | | | | 11,400 | | |
Steel & Tube Holdings Ltd. (v) | | | 13,600 | | | | 10,786 | | |
Tokyo Steel Manufacturing Company Ltd. (v) | | | 1,100 | | | | 12,138 | | |
| | | | 165,761 | | |
Paper & Forest Products — 1.60% | |
Arctic Paper SA (v) | | | 4,000 | | | | 11,581 | | |
Canfor Corp. (a) | | | 600 | | | | 10,465 | | |
Iberpapel Gestion SA (v) | | | 700 | | | | 10,371 | | |
Miquel y Costas & Miquel SA (v) | | | 900 | | | | 12,330 | | |
Rottneros AB | | | 8,600 | | | | 10,055 | | |
Stella-Jones, Inc. (m) | | | 1,100 | | | | 27,773 | | |
Western Forest Products, Inc. | | | 7,900 | | | | 8,899 | | |
| | | | 91,474 | | |
TOTAL MATERIALS | | | 585,118 | | |
REAL ESTATE — 2.83%
Equity Real Estate Investment Trusts — 1.09% | |
First Real Estate Investment Trust (v) | | | 50,600 | | | | 10,020 | | |
Impact Healthcare Reit PLC (v) | | | 15,700 | | | | 22,301 | | |
SmartCentres Real Estate Investment Trust | | | 1,400 | | | | 29,899 | | |
| | | | 62,220 | | |
Real Estate Management & Development — 1.74% | |
Airport City Ltd. (a) (v) | | | 1,600 | | | | 27,473 | | |
Great Eagle Holdings Ltd. (v) | | | 12,000 | | | | 26,926 | | |
Nisshin Group Holdings Company Ltd. (v) | | | 5,200 | | | | 16,874 | | |
Shinoken Group Company Ltd. (v) | | | 3,900 | | | | 28,078 | | |
| | | | 99,351 | | |
TOTAL REAL ESTATE | | | 161,571 | | |
UTILITIES — 2.54%
Electric Utilities — 0.81% | |
Elmera Group ASA (r) (v) | | | 5,000 | | | | 10,170 | | |
EVN AG (v) | | | 700 | | | | 14,909 | | |
Hokkaido Electric Power Company, Inc. (v) | | | 2,800 | | | | 10,216 | | |
Hokuriku Electric Power Company (v) | | | 2,700 | | | | 10,595 | | |
| | | | 45,890 | | |
Gas Utilities — 0.77% | |
Hiroshima Gas Company Ltd. (v) | | | 7,200 | | | | 17,253 | | |
Italgas SpA (v) | | | 4,600 | | | | 26,843 | | |
| | | | 44,096 | | |
Independent Power and Renewable Electricity
Producers — 0.23% | |
Electric Power Development Company Ltd. (v) | | | 800 | | | | 13,227 | | |
| | | Shares
Held | | Value | |
Multi-Utilities — 0.73% | |
ACEA SpA (v) | | | 600 | | | $ | 8,895 | | |
Centrica PLC (a) (v) | | | 33,700 | | | | 32,909 | | |
| | | | 41,804 | | |
TOTAL UTILITIES | | | 145,017 | | |
Total common stocks
(Cost $5,922,125) | | | | | 5,579,241 | | |
RIGHTS — 0.00% | |
CONSUMER STAPLES — 0.00%
Personal Products — 0.00% | |
BWX Ltd. (a) | | | 3,040 | | | | 88 | | |
TOTAL CONSUMER STAPLES | | | 88 | | |
Total rights
(Cost $270) | | | | | 88 | | |
Total long-term investments
(Cost $5,922,395) | | | | | 5,579,329 | | |
SHORT-TERM
INVESTMENTS — 2.13% | | Principal
Amount | | | |
Time Deposits — 2.13% | |
Citigroup Inc., 0.91%, 07/01/2022* | | $ | 121,568 | | | | 121,568 | | |
Total short-term investments
(Cost $121,568) | | | 121,568 | | |
Total investments — 99.86%
(Cost $6,043,963) | | | 5,700,897 | | |
Other assets in excess of liabilities — 0.14% | | | | | 8,268 | | |
Net assets — 100.00% | | $ | 5,709,165 | | |
(a) — Non-income producing security.
(i) — Illiquid security. The total market value of these securities was $17,498, which represented 0.31% of net assets.
(m) — Restricted security. Purchased in a private placement transaction; resale to the public may require registration. The total market value of these securities was $76,076, which represented 1.33% of net assets.
(r) — Rule 144A security under the Securities Act of 1933. Purchased in a private placement transaction; resale to the public may require registration or be limited to qualified institutional buyers. The total market value of these securities was $151,684, which represented 2.66% of net assets.
(v) — Security was fair valued as a result of market movements following the close of local trading using a third-party vendor's proprietary fair value pricing model. The total market value of these securities was $4,453,323, which represented 78.00% of net assets. See Security Valuation in Note 1 in Notes to the Financial Statements.
* — Invested through a cash management account administered by Brown Brothers Harriman & Co.
The accompanying notes are an integral part of these financial statements.
42
Schedule of Investments — June 30, 2022
Hotchkis & Wiley Value Opportunities Fund

Largest Holdings* | | Percent of
net assets | |
Microsoft Corp. | | | 7.96 | % | |
F5, Inc. | | | 6.49 | % | |
General Electric Company | | | 6.47 | % | |
The Goldman Sachs Group, Inc. | | | 4.53 | % | |
AMERCO | | | 4.17 | % | |
General Motors Company | | | 4.12 | % | |
Range Resources Corp. | | | 4.01 | % | |
Stagwell, Inc. | | | 3.53 | % | |
Alphabet, Inc. | | | 3.22 | % | |
Rothschild & Company | | | 3.18 | % | |
* Excluding short-term securities
COMMON
STOCKS — 97.42% | | Shares
Held | | Value | |
COMMUNICATION SERVICES — 11.42%
Entertainment — 1.10% | |
Warner Bros. Discovery, Inc. (a) | | | 375,000 | | | $ | 5,032,500 | | |
Interactive Media & Services — 4.46% | |
Alphabet, Inc. (a) | | | 6,750 | | | | 14,710,005 | | |
Twitter, Inc. (a) | | | 152,100 | | | | 5,687,019 | | |
| | | | 20,397,024 | | |
Media — 5.07% | |
News Corp. | | | 286,600 | | | | 4,465,228 | | |
Paramount Global | | | 103,900 | | | | 2,564,252 | | |
Stagwell, Inc. (a) | | | 2,972,300 | | | | 16,139,589 | | |
| | | | 23,169,069 | | |
Wireless Telecommunication Services — 0.79% | |
Vodafone Group PLC — ADR | | | 231,300 | | | | 3,603,654 | | |
TOTAL COMMUNICATION SERVICES | | | 52,202,247 | | |
CONSUMER DISCRETIONARY — 6.14%
Automobiles — 4.12% | |
General Motors Company (a) | | | 592,500 | | | | 18,817,800 | | |
Internet & Catalog Retail — 1.51% | |
Points.com, Inc. (a) | | | 184,000 | | | | 4,598,160 | | |
Redbubble Ltd. (a) (v) | | | 3,750,700 | | | | 2,331,922 | | |
| | | | 6,930,082 | | |
Specialty Retail — 0.51% | |
The ODP Corp. (a) | | | 77,070 | | | | 2,330,597 | | |
TOTAL CONSUMER DISCRETIONARY | | | 28,078,479 | | |
ENERGY — 15.86%
Energy Equipment & Services — 1.20% | |
Expro Group Holdings NV (a) | | | 42,900 | | | | 494,208 | | |
Mcdermott International Ltd. (a) (f) | | | 2,266,028 | | | | 1,291,636 | | |
NOV, Inc. | | | 217,500 | | | | 3,677,925 | | |
| | | | 5,463,769 | | |
| | | Shares
Held | | Value | |
Oil, Gas & Consumable Fuels — 14.66% | |
Berry Corp. | | | 997,900 | | | $ | 7,603,998 | | |
Hess Corp. | | | 121,400 | | | | 12,861,116 | | |
Kosmos Energy Ltd. (a) | | | 1,792,600 | | | | 11,096,194 | | |
Murphy Oil Corp. | | | 192,900 | | | | 5,823,651 | | |
Range Resources Corp. (a) | | | 739,700 | | | | 18,307,575 | | |
Shell PLC — ADR | | | 216,500 | | | | 11,320,785 | | |
| | | | 67,013,319 | | |
TOTAL ENERGY | | | 72,477,088 | | |
FINANCIALS — 19.89%
Banks — 5.99% | |
Citigroup, Inc. | | | 248,400 | | | | 11,423,916 | | |
Popular, Inc. | | | 82,600 | | | | 6,354,418 | | |
Wells Fargo & Company | | | 245,300 | | | | 9,608,401 | | |
| | | | 27,386,735 | | |
Capital Markets — 10.68% | |
The Goldman Sachs Group, Inc. | | | 69,700 | | | | 20,702,294 | | |
Perella Weinberg Partners | | | 399,600 | | | | 2,329,668 | | |
Rothschild & Company (v) | | | 429,000 | | | | 14,548,178 | | |
State Street Corp. | | | 182,200 | | | | 11,232,630 | | |
| | | | 48,812,770 | | |
Consumer Finance — 2.64% | |
SLM Corp. | | | 756,900 | | | | 12,064,986 | | |
Insurance — 0.58% | |
Global Indemnity Group LLC | | | 102,500 | | | | 2,651,675 | | |
TOTAL FINANCIALS | | | 90,916,166 | | |
INDUSTRIALS — 16.31%
Aerospace & Defense — 1.51% | |
Babcock International Group PLC (a) (v) | | | 1,824,300 | | | | 6,886,820 | | |
Air Freight & Logistics — 1.70% | |
Royal Mail PLC (v) | | | 2,349,200 | | | | 7,760,493 | | |
The accompanying notes are an integral part of these financial statements.
43
Schedule of Investments — June 30, 2022
Hotchkis & Wiley Value Opportunities Fund
| | | Shares
Held | | Value | |
Construction & Engineering — 1.14% | |
Fluor Corp. (a) | | | 213,900 | | | $ | 5,206,326 | | |
Industrial Conglomerates — 6.47% | |
General Electric Company | | | 464,400 | | | | 29,568,348 | | |
Professional Services — 1.32% | |
Nielsen Holdings PLC | | | 259,500 | | | | 6,025,590 | | |
Road & Rail — 4.17% | |
AMERCO | | | 39,900 | | | | 19,081,377 | | |
TOTAL INDUSTRIALS | | | 74,528,954 | | |
INFORMATION TECHNOLOGY — 24.27%
Communications Equipment — 8.85% | |
F5, Inc. (a) | | | 193,800 | | | | 29,659,152 | | |
Telefonaktiebolaget LM Ericsson — ADR | | | 1,456,400 | | | | 10,777,360 | | |
| | | | 40,436,512 | | |
Electronic Equipment, Instruments & Components — 1.33% | |
Arrow Electronics, Inc. (a) | | | 54,100 | | | | 6,064,069 | | |
IT Services — 1.09% | |
Euronet Worldwide, Inc. (a) | | | 49,600 | | | | 4,989,264 | | |
Software — 13.00% | |
Microsoft Corp. | | | 141,700 | | | | 36,392,811 | | |
Oracle Corp. | | | 107,300 | | | | 7,497,051 | | |
Vonage Holdings Corp. (a) | | | 134,900 | | | | 2,541,516 | | |
Workday, Inc. (a) | | | 93,100 | | | | 12,994,898 | | |
| | | | 59,426,276 | | |
TOTAL INFORMATION TECHNOLOGY | | | 110,916,121 | | |
MATERIALS — 2.73%
Chemicals — 2.49% | |
Iracore Investments Holdings, Inc. — Class A
(Acquired 04/13/2017,
Cost $6,892,250) (a) (f) (i) (m) (o) (u) | | | 32,422 | | | | 9,603,396 | | |
UTEX Industries, Inc.
(Acquired 05/11/2021,
Cost $757,278) (a) (i) (m) | | | 24,058 | | | | 1,768,263 | | |
| | | | 11,371,659 | | |
Metals & Mining — 0.24% | |
Metals Recovery Holdings LLC
(Acquired 07/24/2014 — 12/10/2019,
Cost $7,295,703) (a) (f) (i) (m) (u) | | | 7,042 | | | | 1,122,401 | | |
TOTAL MATERIALS | | | 12,494,060 | | |
REAL ESTATE — 0.80%
Real Estate Management & Development — 0.80% | |
Seritage Growth Properties (a) (l) | | | 703,200 | | | | 3,663,672 | | |
TOTAL REAL ESTATE | | | 3,663,672 | | |
Total common stocks
(Cost $476,587,795) | | | | | 445,276,787 | | |
PREFERRED
STOCKS — 0.16% | | Shares
Held | | Value | |
FINANCIALS — 0.16%
Thrifts & Mortgage Finance — 0.16% | |
Federal Home Loan Mortgage Corp. —
Series K (a) | | | 33,300 | | | $ | 162,504 | | |
Federal Home Loan Mortgage Corp. —
Series N (a) (i) | | | 116,400 | | | | 494,118 | | |
Federal Home Loan Mortgage Corp. —
Series S (a) | | | 18,400 | | | | 82,800 | | |
TOTAL FINANCIALS | | | 739,422 | | |
Total preferred stocks
(Cost $268,508) | | | | | 739,422 | | |
TERM LOANS — 0.80% | | Principal
Amount | | | |
ENERGY — 0.22%
Energy Equipment & Services — 0.22% | |
Lealand Finance Company BV
4.666% (1 Month LIBOR USD + 3.000%),
06/28/2024 (Acquired 06/30/2020,
Cost $442,883) (b) (m) | | $ | 442,883 | | | | 287,873 | | |
2.666% Cash and 3.000% PIK
(1 Month LIBOR USD + 4.000%),
06/30/2025 (Acquired 06/30/2020 —
06/30/2022, Cost $1,474,869) (b) (m) (p) | | | 1,373,275 | | | | 704,380 | | |
TOTAL ENERGY | | | 992,253 | | |
MATERIALS — 0.58%
Chemicals — 0.58% | |
Iracore International Holdings, Inc.
10.000% (1 Month LIBOR USD + 9.000%),
04/12/2024 (Acquired 04/13/2017,
Cost $2,649,013) (b) (f) (m) (u) | | | 2,649,013 | | | | 2,649,013 | | |
TOTAL MATERIALS | | | 2,649,013 | | |
Total term loans
(Cost $4,566,765) | | | | | 3,641,266 | | |
PURCHASED
PUT OPTIONS —
0.90% | | Contracts
(100 shares
per contract) | | Notional
Amount | | | |
CONSUMER DISCRETIONARY — 0.90%
Automobiles — 0.90% | |
Tesla, Inc. (a)
Expiration: June 2024,
Exercise Price: $1,000.00 | | | 95 | | | $ | 6,397,490 | | | | 4,124,425 | | |
TOTAL CONSUMER DISCRETIONARY | | | 4,124,425 | | |
Total purchased put options
(Cost $4,183,448) | | | | | | | 4,124,425 | | |
Total long-term investments
(Cost $485,606,516) | | | | | | | 453,781,900 | | |
The accompanying notes are an integral part of these financial statements.
44
Schedule of Investments — June 30, 2022
Hotchkis & Wiley Value Opportunities Fund
COLLATERAL FOR SECURITIES
ON LOAN — 0.08% | | Shares
Held | | Value | |
Money Market Funds — 0.08% | |
Invesco Short-Term Investments Trust
Government & Agency Portfolio —
Institutional Class, 1.38%^ | | | 358,790 | | | $ | 358,790 | | |
Total collateral for securities on loan
(Cost $358,790) | | | 358,790 | | |
SHORT-TERM
INVESTMENTS — 4.99% | | Principal
Amount | | | |
Time Deposits — 4.99% | |
BNP Paribas, 0.52%, 07/01/2022* | | GBP | 1 | | | | 1 | | |
Citigroup, Inc., (0.78)%, 07/01/2022* | | EUR | 6,611 | | | | 6,928 | | |
Citigroup, Inc., 0.91%, 07/01/2022* | | $ | 22,786,216 | | | | 22,786,216 | | |
Total short-term investments
(Cost $22,793,207) | | | 22,793,145 | | |
Total investments — 104.35%
(Cost $508,758,513) | | | | | 476,933,835 | | |
Liabilities in excess of other assets — (4.35)% | | | | | (19,867,407 | ) | |
Net assets — 100.00% | | $ | 457,066,428 | | |
(a) — Non-income producing security.
(b) — The coupon rate shown on variable rate securities represents the rate at June 30, 2022.
(f) — Security was fair valued under guidelines established by and under the general supervision and responsibility of the Trust's Board of Trustees. The total market value of these securities was $14,666,446, which represented 3.21% of net assets. See Security Valuation in Note 1 in Notes to the Financial Statements.
(i) — Illiquid security. The total market value of these securities was $12,988,178, which represented 2.84% of net assets.
(l) — All or a portion of this security is on loan. The total market value of securities on loan was $344,925. The remaining contractual maturity of all of the securities lending transactions is overnight and continuous.
(m) — Restricted security. Purchased in a private placement transaction; resale to the public may require registration. The total market value of these securities was $16,135,326, which represented 3.53% of net assets.
(o) — Affiliated issuer. See Note 6 in Notes to the Financial Statements.
(p) — Payment in-kind (PIK) security.
(u) — Value determined using significant unobservable inputs.
(v) — Security was fair valued as a result of market movements following the close of local trading using a third-party vendor's proprietary fair value pricing model. The total market value of these securities was $31,527,413, which represented 6.90% of net assets. See Security Valuation in Note 1 in Notes to the Financial Statements.
ADR — American Depositary Receipt
EUR — Euro
GBP — British Pound
LIBOR — London Interbank Offered Rate
USD — United States Dollar
^ — Rate shown is the 7-day yield as of June 30, 2022.
* — Invested through a cash management account administered by Brown Brothers Harriman & Co.
The accompanying notes are an integral part of these financial statements.
45
Schedule of Investments — June 30, 2022
Hotchkis & Wiley High Yield Fund
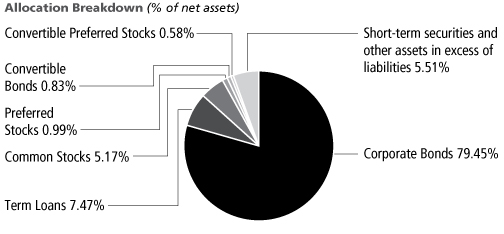
Largest Issuers* | | Percent of
net assets | |
Metals Recovery Holdings LLC | | | 2.30 | % | |
CCO Holdings LLC / CCO Holdings
Capital Corp. | | | 2.20 | % | |
Brookfield Asset Management,
Inc. (includes Brookfield Residential
Properties, Inc. / Brookfield
Residential US LLC, Central Parent,
Inc. and Scientific Games Holdings
LP / Scientific Games US FinCo, Inc.) | | | 1.56 | % | |
Boardriders, Inc. | | | 1.37 | % | |
General Electric Company | | | 1.26 | % | |
PBF Holding Company LLC / PBF
Finance Corp. | | | 1.22 | % | |
RA Parent, Inc. | | | 1.14 | % | |
G Holdings, Inc. (includes Standard
Industries, Inc. and WR Grace
Holdings LLC) | | | 1.13 | % | |
Schweitzer-Mauduit International, Inc. | | | 1.05 | % | |
Iracore Holdings Corp. (includes
Iracore International Holdings, Inc.
and Iracore Investments
Holdings, Inc.) | | | 1.05 | % | |
* Excluding investment companies and short-term securities
CORPORATE
BONDS — 79.45% | | Principal
Amount | | Value | |
Advertising — 0.12% | |
Stagwell Global LLC
5.625%, 08/15/2029 (r) | | $ | 1,160,000 | | | $ | 935,337 | | |
Aerospace/Defense — 0.98% | |
F-Brasile SpA / F-Brasile US LLC
7.375%, 08/15/2026 (r) | | | 5,667,000 | | | | 4,521,387 | | |
Spirit AeroSystems, Inc.
7.500%, 04/15/2025 (r) | | | 3,608,000 | | | | 3,361,159 | | |
| | | | 7,882,546 | | |
Airlines — 0.52% | |
United Airlines, Inc.
4.375%, 04/15/2026 (r) | | | 4,713,000 | | | | 4,169,685 | | |
Auto Loans — 0.64% | |
Ford Motor Credit Company LLC
5.113%, 05/03/2029 | | | 5,755,000 | | | | 5,171,466 | | |
Auto Parts & Equipment — 2.32% | |
Adient Global Holdings Ltd.
4.875%, 08/15/2026 (r) | | | 5,443,000 | | | | 4,785,023 | | |
American Axle & Manufacturing, Inc.
6.875%, 07/01/2028 | | | 4,842,000 | | | | 4,354,165 | | |
The Goodyear Tire & Rubber Company
4.875%, 03/15/2027 | | | 4,806,000 | | | | 4,302,571 | | |
| | | Principal
Amount | | Value | |
Meritor, Inc.
4.500%, 12/15/2028 (r) | | $ | 5,414,000 | | | $ | 5,220,346 | | |
| | | | 18,662,105 | | |
Banking — 0.33% | |
BNP Paribas SA
6.625% (Fixed until 03/24/2024, then
5 Year Swap Rate USD + 4.149%),
Perpetual (b) (r) | | | 2,781,000 | | | | 2,676,712 | | |
Building & Construction — 2.43% | |
Ashton Woods USA LLC / Ashton
Woods Finance Company
4.625%, 08/01/2029 (r) | | | 5,649,000 | | | | 4,244,517 | | |
Brookfield Residential Properties, Inc. /
Brookfield Residential US LLC
4.875%, 02/15/2030 (r) | | | 5,232,000 | | | | 3,807,588 | | |
Installed Building Products, Inc.
5.750%, 02/01/2028 (r) | | | 4,671,000 | | | | 4,156,364 | | |
Tri Pointe Homes, Inc.
5.250%, 06/01/2027 | | | 3,866,000 | | | | 3,385,622 | | |
Weekley Homes LLC /
Weekley Finance Corp.
4.875%, 09/15/2028 (r) | | | 5,023,000 | | | | 3,974,171 | | |
| | | | 19,568,262 | | |
The accompanying notes are an integral part of these financial statements.
46
Schedule of Investments — June 30, 2022
Hotchkis & Wiley High Yield Fund
| | | Principal
Amount | | Value | |
Building Materials — 2.72% | |
Arcosa, Inc.
4.375%, 04/15/2029 (r) | | $ | 5,069,000 | | | $ | 4,308,950 | | |
BlueLinx Holdings, Inc.
6.000%, 11/15/2029 (r) | | | 4,451,000 | | | | 3,477,856 | | |
Foundation Building Materials, Inc.
6.000%, 03/01/2029 (r) | | | 3,563,000 | | | | 2,615,420 | | |
PGT Innovations, Inc.
4.375%, 10/01/2029 (r) | | | 4,999,000 | | | | 3,948,485 | | |
Standard Industries, Inc.
4.375%, 07/15/2030 (r) | | | 6,150,000 | | | | 4,862,098 | | |
WESCO Distribution, Inc.
7.250%, 06/15/2028 (r) | | | 2,740,000 | | | | 2,716,491 | | |
| | | | 21,929,300 | | |
Cable & Satellite TV — 6.52% | |
Block Communications, Inc.
4.875%, 03/01/2028 (r) | | | 4,811,000 | | | | 4,093,367 | | |
CCO Holdings LLC / CCO Holdings Capital Corp.
5.375%, 06/01/2029 (r) | | | 12,337,000 | | | | 11,052,965 | | |
4.750%, 02/01/2032 (r) | | | 8,129,000 | | | | 6,676,348 | | |
CSC Holdings LLC
5.750%, 01/15/2030 (r) | | | 9,537,000 | | | | 6,964,203 | | |
DirecTV Financing LLC / DirecTV
Financing Co-Obligor, Inc.
5.875%, 08/15/2027 (r) | | | 3,880,000 | | | | 3,322,463 | | |
DISH DBS Corp.
5.750%, 12/01/2028 (r) | | | 4,424,000 | | | | 3,283,869 | | |
Telenet Finance Luxembourg
5.500%, 03/01/2028 (r) | | | 5,000,000 | | | | 4,417,750 | | |
Virgin Media Secured Finance PLC
5.500%, 05/15/2029 (r) | | | 9,131,000 | | | | 8,182,609 | | |
Ziggo BV
4.875%, 01/15/2030 (r) | | | 5,224,000 | | | | 4,443,675 | | |
| | | | 52,437,249 | | |
Chemicals — 3.88% | |
Axalta Coating Systems LLC / Axalta
Coating Systems Dutch Holding B BV
4.750%, 06/15/2027 (r) | | | 4,917,000 | | | | 4,424,931 | | |
Diamond BC BV
4.625%, 10/01/2029 (r) | | | 4,670,000 | | | | 3,741,067 | | |
Illuminate Buyer LLC / Illuminate
Holdings IV, Inc.
9.000%, 07/01/2028 (r) | | | 2,991,000 | | | | 2,366,793 | | |
LSF11 A5 HoldCo LLC
6.625%, 10/15/2029 (r) | | | 5,318,000 | | | | 4,487,807 | | |
SCIH Salt Holdings, Inc.
4.875%, 05/01/2028 (r) | | | 4,609,000 | | | | 3,840,150 | | |
SCIL IV LLC / SCIL USA Holdings LLC
5.375%, 11/01/2026 (r) | | | 4,977,000 | | | | 3,989,638 | | |
Trinseo Materials Operating SCA /
Trinseo Materials Finance, Inc.
5.125%, 04/01/2029 (r) | | | 5,776,000 | | | | 4,139,168 | | |
| | | Principal
Amount | | Value | |
WR Grace Holdings LLC
5.625%, 08/15/2029 (r) | | $ | 5,750,000 | | | $ | 4,247,813 | | |
| | | | 31,237,367 | | |
Consumer — Products — 0.44% | |
Winnebago Industries, Inc.
6.250%, 07/15/2028 (r) | | | 3,877,000 | | | | 3,557,147 | | |
Consumer/Commercial/Lease Financing — 0.29% | |
Rent-A-Center, Inc.
6.375%, 02/15/2029 (r) | | | 3,031,000 | | | | 2,368,090 | | |
Diversified Capital Goods — 2.77% | |
General Electric Company
5.159% (3 Month LIBOR USD + 3.330%),
Perpetual (b) (c) | | | 11,506,000 | | | | 10,124,705 | | |
Patrick Industries, Inc.
4.750%, 05/01/2029 (r) | | | 5,576,000 | | | | 4,157,967 | | |
Railworks Holdings LP / Railworks Rally, Inc.
8.250%, 11/15/2028 (r) | | | 3,227,000 | | | | 2,916,998 | | |
TK Elevator US Newco, Inc.
5.250%, 07/15/2027 (r) | | | 5,689,000 | | | | 5,081,984 | | |
| | | | 22,281,654 | | |
Electric — Generation — 0.60% | |
Calpine Corp.
3.750%, 03/01/2031 (r) | | | 5,893,000 | | | | 4,805,447 | | |
Electric — Integrated — 0.57% | |
PG&E Corp.
5.250%, 07/01/2030 | | | 5,515,000 | | | | 4,547,641 | | |
Electronics — 0.51% | |
II-VI, Inc.
5.000%, 12/15/2029 (r) | | | 4,725,000 | | | | 4,133,832 | | |
Energy — Exploration & Production — 3.83% | |
California Resources Corp.
7.125%, 02/01/2026 (r) | | | 3,349,000 | | | | 3,280,697 | | |
Callon Petroleum Company
6.375%, 07/01/2026 | | | 3,721,000 | | | | 3,437,627 | | |
Civitas Resources, Inc.
5.000%, 10/15/2026 (r) | | | 2,777,000 | | | | 2,496,301 | | |
Crescent Energy Finance LLC
7.250%, 05/01/2026 (r) | | | 3,111,000 | | | | 2,836,781 | | |
Earthstone Energy Holdings LLC
8.000%, 04/15/2027 (r) | | | 3,772,000 | | | | 3,574,555 | | |
Hilcorp Energy I LP / Hilcorp Finance Company
6.000%, 02/01/2031 (r) | | | 4,543,000 | | | | 3,924,016 | | |
Murphy Oil Corp.
6.375%, 07/15/2028 | | | 5,946,000 | | | | 5,556,180 | | |
Penn Virginia Holdings LLC
9.250%, 08/15/2026 (r) | | | 1,900,000 | | | | 1,825,881 | | |
Range Resources Corp.
4.750%, 02/15/2030 (r) | | | 1,755,000 | | | | 1,576,719 | | |
Southwestern Energy Company
4.750%, 02/01/2032 | | | 2,680,000 | | | | 2,296,599 | | |
| | | | 30,805,356 | | |
The accompanying notes are an integral part of these financial statements.
47
Schedule of Investments — June 30, 2022
Hotchkis & Wiley High Yield Fund
| | | Principal
Amount | | Value | |
Food — Wholesale — 1.02% | |
Central Garden & Pet Company
4.125%, 04/30/2031 (r) | | $ | 4,959,000 | | | $ | 3,988,699 | | |
Post Holdings, Inc.
4.500%, 09/15/2031 (r) | | | 5,127,000 | | | | 4,208,242 | | |
| | | | 8,196,941 | | |
Forestry/Paper — 2.29% | |
Ahlstrom-Munksjo Holding 3 Oy
4.875%, 02/04/2028 (r) | | | 6,004,000 | | | | 5,056,116 | | |
Mercer International, Inc.
5.125%, 02/01/2029 | | | 5,963,000 | | | | 5,103,106 | | |
Rayonier AM Products, Inc.
7.625%, 01/15/2026 (r) | | | 3,472,000 | | | | 3,034,215 | | |
Schweitzer-Mauduit International, Inc.
6.875%, 10/01/2026 (r) | | | 5,894,000 | | | | 5,253,470 | | |
| | | | 18,446,907 | | |
Gaming — 4.66% | |
Boyd Gaming Corp.
4.750%, 06/15/2031 (r) | | | 4,728,000 | | | | 4,004,616 | | |
Churchill Downs, Inc.
5.500%, 04/01/2027 (r) | | | 2,163,000 | | | | 2,057,922 | | |
Everi Holdings, Inc.
5.000%, 07/15/2029 (r) | | | 5,129,000 | | | | 4,340,878 | | |
International Game Technology PLC
6.250%, 01/15/2027 (r) | | | 3,267,000 | | | | 3,184,018 | | |
Jacobs Entertainment, Inc.
6.750%, 02/15/2029 (r) | | | 4,640,000 | | | | 3,930,349 | | |
MGM Resorts International
5.500%, 04/15/2027 | | | 4,530,000 | | | | 4,071,556 | | |
Peninsula Pacific Entertainment LLC /
Peninsula Pacific Entertainment Finance, Inc.
8.500%, 11/15/2027 (r) | | | 3,000,000 | | | | 3,153,285 | | |
Penn National Gaming, Inc.
5.625%, 01/15/2027 (r) | | | 5,350,000 | | | | 4,701,152 | | |
Scientific Games Holdings LP /
Scientific Games US FinCo, Inc.
6.625%, 03/01/2030 (r) | | | 5,195,000 | | | | 4,423,906 | | |
Wynn Macau Ltd.
5.500%, 10/01/2027 (r) | | | 5,636,000 | | | | 3,655,707 | | |
| | | | 37,523,389 | | |
Gas Distribution — 5.44% | |
Antero Midstream Partners LP /
Antero Midstream Finance Corp.
5.750%, 03/01/2027 (r) | | | 4,939,000 | | | | 4,601,567 | | |
Crestwood Midstream Partners LP /
Crestwood Midstream Finance Corp.
8.000%, 04/01/2029 (r) | | | 4,881,000 | | | | 4,542,405 | | |
DT Midstream, Inc.
4.375%, 06/15/2031 (r) | | | 4,678,000 | | | | 3,931,952 | | |
EQM Midstream Partners LP
7.500%, 06/01/2027 (r) | | | 1,702,000 | | | | 1,645,136 | | |
5.500%, 07/15/2028 | | | 4,568,000 | | | | 3,952,489 | | |
| | | Principal
Amount | | Value | |
Harvest Midstream I LP
7.500%, 09/01/2028 (r) | | $ | 4,814,000 | | | $ | 4,530,508 | | |
Holly Energy Partners LP /
Holly Energy Finance Corp.
5.000%, 02/01/2028 (r) | | | 4,581,000 | | | | 3,931,506 | | |
Kinetik Holdings LP
5.875%, 06/15/2030 (r) | | | 4,452,000 | | | | 4,248,900 | | |
Rockpoint Gas Storage Canada Ltd.
7.000%, 03/31/2023 (r) | | | 6,631,000 | | | | 6,522,484 | | |
Targa Resources Partners LP /
Targa Resources Partners Finance Corp.
5.500%, 03/01/2030 | | | 2,566,000 | | | | 2,453,109 | | |
Venture Global Calcasieu Pass LLC
4.125%, 08/15/2031 (r) | | | 3,986,000 | | | | 3,417,975 | | |
| | | | 43,778,031 | | |
Health Facilities — 1.85% | |
CHS / Community Health Systems, Inc.
6.875%, 04/01/2028 (r) | | | 2,573,000 | | | | 1,512,027 | | |
5.250%, 05/15/2030 (r) | | | 4,225,000 | | | | 3,218,267 | | |
Encompass Health Corp.
4.750%, 02/01/2030 | | | 4,878,000 | | | | 4,094,813 | | |
Tenet Healthcare Corp.
6.250%, 02/01/2027 (r) | | | 3,315,000 | | | | 3,058,088 | | |
6.125%, 06/15/2030 (r) | | | 3,247,000 | | | | 3,005,293 | | |
| | | | 14,888,488 | | |
Health Services — 0.94% | |
Charles River Laboratories International, Inc.
4.000%, 03/15/2031 (r) | | | 4,905,000 | | | | 4,190,822 | | |
DaVita, Inc.
4.625%, 06/01/2030 (r) | | | 680,000 | | | | 532,455 | | |
ModivCare Escrow Issuer, Inc.
5.000%, 10/01/2029 (r) | | | 3,465,000 | | | | 2,803,657 | | |
| | | | 7,526,934 | | |
Hotels — 1.56% | |
Hilton Grand Vacations Borrower Escrow LLC /
Hilton Grand Vacations Borrower Escrow
5.000%, 06/01/2029 (r) | | | 4,830,000 | | | | 3,919,956 | | |
Marriott Ownership Resorts, Inc.
4.500%, 06/15/2029 (r) | | | 5,121,000 | | | | 4,266,551 | | |
Park Intermediate Holdings LLC / PK Domestic
Property LLC / PK Finance Co-Issuer
4.875%, 05/15/2029 (r) | | | 5,090,000 | | | | 4,378,927 | | |
| | | | 12,565,434 | | |
Insurance Brokerage — 1.07% | |
AmWINS Group, Inc. | |
4.875%, 06/30/2029 (r) | | | 5,681,000 | | | | 4,659,458 | | |
Ryan Specialty Group LLC | |
4.375%, 02/01/2030 (r) | | | 4,552,000 | | | | 3,965,930 | | |
| | | | 8,625,388 | | |
The accompanying notes are an integral part of these financial statements.
48
Schedule of Investments — June 30, 2022
Hotchkis & Wiley High Yield Fund
| | | Principal
Amount | | Value | |
Investments & Miscellaneous Financial Services — 0.77% | |
SoftBank Group Corp.
6.000% (Fixed until 07/18/2023, then
5 Year Mid Swap Rate USD + 4.226%),
Perpetual (b) | | $ | 6,941,000 | | | $ | 6,222,607 | | |
Machinery — 1.03% | |
Cleaver-Brooks, Inc.
7.875%, 03/01/2023 (r) | | | 5,168,000 | | | | 4,813,604 | | |
NESCO Holdings II, Inc.
5.500%, 04/15/2029 (r) | | | 4,135,000 | | | | 3,475,178 | | |
| | | | 8,288,782 | | |
Media — Broadcast — 0.52% | |
Gray Escrow II, Inc.
5.375%, 11/15/2031 (r) | | | 5,165,000 | | | | 4,149,587 | | |
Media — Diversified — 0.56% | |
National CineMedia LLC
5.750%, 08/15/2026 | | | 6,365,000 | | | | 2,936,588 | | |
5.875%, 04/15/2028 (r) | | | 2,187,000 | | | | 1,547,456 | | |
| | | | 4,484,044 | | |
Media Content — 1.82% | |
News Corp.
3.875%, 05/15/2029 (r) | | | 3,083,000 | | | | 2,670,575 | | |
5.125%, 02/15/2032 (r) | | | 4,857,000 | | | | 4,310,102 | | |
Sirius XM Radio, Inc.
4.000%, 07/15/2028 (r) | | | 4,767,000 | | | | 4,140,354 | | |
Townsquare Media, Inc.
6.875%, 02/01/2026 (r) | | | 3,937,000 | | | | 3,512,397 | | |
| | | | 14,633,428 | | |
Medical Products — 1.84% | |
Grifols Escrow Issuer SA
4.750%, 10/15/2028 (r) | | | 4,926,000 | | | | 4,278,527 | | |
Medline Borrower LP
3.875%, 04/01/2029 (r) | | | 3,911,000 | | | | 3,344,374 | | |
5.250%, 10/01/2029 (r) | | | 3,731,000 | | | | 3,075,911 | | |
Varex Imaging Corp.
7.875%, 10/15/2027 (r) | | | 4,351,000 | | | | 4,143,261 | | |
| | | | 14,842,073 | | |
Metals/Mining Excluding Steel — 1.27% | |
Kaiser Aluminum Corp.
4.500%, 06/01/2031 (r) | | | 5,430,000 | | | | 4,119,412 | | |
Rain CII Carbon LLC / CII Carbon Corp.
7.250%, 04/01/2025 (r) | | | 6,576,000 | | | | 6,070,147 | | |
| | | | 10,189,559 | | |
Oil Field Equipment & Services — 3.15% | |
Bristow Group, Inc.
6.875%, 03/01/2028 (r) | | | 3,029,000 | | | | 2,657,780 | | |
Exterran Energy Solutions LP / EES Finance Corp.
8.125%, 05/01/2025 | | | 6,284,000 | | | | 5,962,699 | | |
Nabors Industries Ltd.
7.500%, 01/15/2028 (r) | | | 4,064,000 | | | | 3,500,262 | | |
| | | Principal
Amount | | Value | |
Shelf Drilling Holdings Ltd.
8.250%, 02/15/2025 (r) | | $ | 7,492,000 | | | $ | 5,855,223 | | |
Transocean Poseidon Ltd.
6.875%, 02/01/2027 (r) | | | 4,189,688 | | | | 3,692,393 | | |
Valaris Ltd.
8.250% Cash or 12.000% PIK or 5.125%
Cash & 5.125% PIK, 04/30/2028 (p) (r) | | | 3,814,000 | | | | 3,705,225 | | |
| | | | 25,373,582 | | |
Oil Refining & Marketing — 1.77% | |
Parkland Corp.
4.625%, 05/01/2030 (r) | | | 5,502,000 | | | | 4,473,057 | | |
PBF Holding Company LLC / PBF Finance Corp.
9.250%, 05/15/2025 (r) | | | 2,955,000 | | | | 3,093,516 | | |
6.000%, 02/15/2028 | | | 7,910,000 | | | | 6,715,709 | | |
| | | | 14,282,282 | | |
Personal & Household Products — 1.49% | |
Edgewell Personal Care Company
5.500%, 06/01/2028 (r) | | | 4,220,000 | | | | 3,847,880 | | |
Energizer Holdings, Inc.
4.375%, 03/31/2029 (r) | | | 5,276,000 | | | | 4,058,510 | | |
The Scotts Miracle-Gro Company
4.375%, 02/01/2032 | | | 5,405,000 | | | | 4,119,070 | | |
| | | | 12,025,460 | | |
Pharmaceuticals — 1.84% | |
Bausch Health Companies, Inc.
6.125%, 02/01/2027 (r) | | | 1,596,000 | | | | 1,359,465 | | |
7.250%, 05/30/2029 (r) | | | 3,434,000 | | | | 1,868,251 | | |
5.250%, 02/15/2031 (r) | | | 6,315,000 | | | | 3,250,330 | | |
Jazz Securities DAC
4.375%, 01/15/2029 (r) | | | 3,750,000 | | | | 3,342,943 | | |
Organon & Company / Organon
Foreign Debt Co-Issuer BV
5.125%, 04/30/2031 (r) | | | 5,734,000 | | | | 4,968,339 | | |
| | | | 14,789,328 | | |
Real Estate Development & Management — 0.53% | |
Realogy Group LLC / Realogy Co-Issuer Corp.
5.750%, 01/15/2029 (r) | | | 5,601,000 | | | | 4,256,760 | | |
Recreation & Travel — 2.18% | |
Boyne USA, Inc.
4.750%, 05/15/2029 (r) | | | 5,314,000 | | | | 4,609,948 | | |
Carnival Corp.
4.000%, 08/01/2028 (r) | | | 3,482,000 | | | | 2,867,566 | | |
6.000%, 05/01/2029 (r) | | | 3,200,000 | | | | 2,259,296 | | |
Royal Caribbean Cruises Ltd.
5.500%, 08/31/2026 (r) | | | 3,183,000 | | | | 2,372,608 | | |
VOC Escrow Ltd.
5.000%, 02/15/2028 (r) | | | 6,714,000 | | | | 5,403,965 | | |
| | | | 17,513,383 | | |
The accompanying notes are an integral part of these financial statements.
49
Schedule of Investments — June 30, 2022
Hotchkis & Wiley High Yield Fund
| | | Principal
Amount | | Value | |
Reinsurance — 0.73% | |
Highlands Holdings Bond Issuer Ltd. /
Highlands Holdings Bond
Co-Issuer, Inc. 7.625% Cash or 8.375%
PIK, 10/15/2025 (p) (r) | | $ | 6,054,983 | | | $ | 5,856,591 | | |
Restaurants — 1.36% | |
1011778 BC ULC / New Red Finance, Inc.
4.000%, 10/15/2030 (r) | | | 4,989,000 | | | | 4,019,812 | | |
Dave & Buster's, Inc.
7.625%, 11/01/2025 (r) | | | 2,721,000 | | | | 2,690,185 | | |
Papa John's International, Inc.
3.875%, 09/15/2029 (r) | | | 5,118,000 | | | | 4,229,259 | | |
| | | | 10,939,256 | | |
Software/Services — 1.74% | |
Consensus Cloud Solutions, Inc.
6.500%, 10/15/2028 (r) | | | 4,850,000 | | | | 4,009,155 | | |
The Dun & Bradstreet Corp.
5.000%, 12/15/2029 (r) | | | 2,695,000 | | | | 2,331,364 | | |
Twilio, Inc.
3.625%, 03/15/2029 | | | 4,305,000 | | | | 3,627,458 | | |
VM Consolidated, Inc.
5.500%, 04/15/2029 (r) | | | 5,081,000 | | | | 4,059,795 | | |
| | | | 14,027,772 | | |
Specialty Retail — 3.22% | |
Academy Ltd.
6.000%, 11/15/2027 (r) | | | 4,679,000 | | | | 4,283,367 | | |
Bed Bath & Beyond, Inc.
5.165%, 08/01/2044 | | | 8,512,000 | | | | 1,910,391 | | |
Eagle Intermediate Global Holding BV /
Ruyi US Finance LLC
7.500%, 05/01/2025 (r) | | | 4,917,000 | | | | 3,522,489 | | |
Kontoor Brands, Inc.
4.125%, 11/15/2029 (r) | | | 5,133,000 | | | | 4,084,893 | | |
Liberty Interactive LLC
8.250%, 02/01/2030 | | | 5,273,000 | | | | 3,508,944 | | |
Lithia Motors, Inc.
4.375%, 01/15/2031 (r) | | | 4,810,000 | | | | 4,108,702 | | |
PetSmart, Inc. / PetSmart Finance Corp.
4.750%, 02/15/2028 (r) | | | 5,191,000 | | | | 4,506,411 | | |
| | | | 25,925,197 | | |
Steel Producers/Products — 0.91% | |
Allegheny Technologies, Inc.
5.875%, 12/01/2027 | | | 3,639,000 | | | | 3,227,382 | | |
Carpenter Technology Corp.
7.625%, 03/15/2030 | | | 4,476,000 | | | | 4,117,454 | | |
| | | | 7,344,836 | | |
Support — Services — 1.01% | |
Summer BC Bidco B LLC
5.500%, 10/31/2026 (r) | | | 4,067,000 | | | | 3,648,597 | | |
ZipRecruiter, Inc.
5.000%, 01/15/2030 (r) | | | 5,296,000 | | | | 4,455,313 | | |
| | | | 8,103,910 | | |
| | | Principal
Amount | | Value | |
Technology Hardware & Equipment — 1.77% | |
CommScope Technologies LLC
6.000%, 06/15/2025 (r) | | $ | 3,596,000 | | | $ | 3,117,498 | | |
CommScope, Inc.
6.000%, 03/01/2026 (r) | | | 3,031,000 | | | | 2,797,659 | | |
NCR Corp.
6.125%, 09/01/2029 (r) | | | 4,712,000 | | | | 4,081,433 | | |
Xerox Holdings Corp.
5.500%, 08/15/2028 (r) | | | 5,084,000 | | | | 4,260,001 | | |
| | | | 14,256,591 | | |
Telecom — Satellite — 0.44% | |
Telesat Canada / Telesat LLC
5.625%, 12/06/2026 (r) | | | 5,575,000 | | | | 3,530,312 | | |
Telecom — Wireline Integrated & Services — 0.65% | |
Frontier Communications Holdings LLC
5.875%, 10/15/2027 (r) | | | 3,299,000 | | | | 2,974,717 | | |
Uniti Group LP / Uniti Group
Finance, Inc. / CSL Capital LLC
6.500%, 02/15/2029 (r) | | | 3,115,000 | | | | 2,290,896 | | |
| | | | 5,265,613 | | |
Tobacco — 0.55% | |
Turning Point Brands, Inc.
5.625%, 02/15/2026 (r) | | | 5,007,000 | | | | 4,456,956 | | |
Total corporate bonds
(Cost $757,169,767) | | | | | 639,478,617 | | |
CONVERTIBLE BONDS — 0.83% | |
Hotels — 0.54% | |
Pebblebrook Hotel Trust
1.750%, 12/15/2026 | | | 4,870,000 | | | | 4,361,085 | | |
Railroads — 0.29% | |
The Greenbrier Companies, Inc.
2.875%, 04/15/2028 | | | 2,433,000 | | | | 2,274,855 | | |
Total convertible bonds
(Cost $7,374,153) | | | | | 6,635,940 | | |
TERM LOANS — 7.47% | |
Advertising — 0.55% | |
AP Core Holdings II LLC
7.166% (1 Month LIBOR USD + 5.500%),
09/01/2027 (Acquired 07/21/2021,
Cost $4,653,752) (b) (m) | | | 4,706,378 | | | | 4,474,966 | | |
Airlines — 0.53% | |
AAdvantage Loyalty IP Ltd.
5.813% (1 Month LIBOR USD + 4.750%),
04/20/2028 (Acquired 06/24/2021,
Cost $4,636,836) (b) (m) | | | 4,472,000 | | | | 4,277,938 | | |
Cable & Satellite TV — 0.27% | |
DirecTV Financing LLC
6.666% (1 Month LIBOR USD + 5.000%),
08/02/2027 (Acquired 07/22/2021,
Cost $2,298,706) (b) (m) | | | 2,321,925 | | | | 2,144,402 | | |
The accompanying notes are an integral part of these financial statements.
50
Schedule of Investments — June 30, 2022
Hotchkis & Wiley High Yield Fund
| | | Principal
Amount | | Value | |
Forestry/Paper — 0.40% | |
Schweitzer-Mauduit International, Inc.
5.438% (1 Month LIBOR USD + 3.750%),
04/20/2028 (Acquired 02/23/2021,
Cost $3,332,340) (b) (m) | | $ | 3,366,000 | | | $ | 3,197,700 | | |
Health Services — 0.50% | |
FinThrive Software Intermediate Holdings, Inc.
5.666% (1 Month LIBOR USD + 4.000%),
12/18/2028 (Acquired 11/19/2021 —
11/22/2021, Cost $3,594,856) (b) (i) (m) | | | 3,599,978 | | | | 3,347,979 | | |
8.416% (1 Month LIBOR USD + 6.750%),
12/17/2029 (Acquired 11/19/2021,
Cost $740,720) (b) (i) (m) | | | 752,000 | | | | 673,040 | | |
| | | | 4,021,019 | | |
Machinery — 0.56% | |
Granite US Holdings Corp.
6.313% (1 Month LIBOR USD + 4.000%),
09/30/2026 (Acquired 09/25/2019,
Cost $4,639,681) (b) (m) | | | 4,736,809 | | | | 4,485,166 | | |
Oil Field Equipment & Services — 0.23% | |
Iracore International Holdings, Inc.
10.000% (1 Month LIBOR USD + 9.000%),
04/12/2024 (Acquired 04/13/2017,
Cost $1,826,992) (b) (f) (i) (m) (u) | | | 1,826,992 | | | | 1,826,992 | | |
Oil Refining & Marketing — 0.46% | |
Par Petroleum LLC
7.770% (3 Month LIBOR USD + 6.750%),
01/12/2026 (Acquired 02/13/2020 —
04/16/2021, Cost $3,817,391) (b) (m) | | | 3,883,604 | | | | 3,728,259 | | |
Personal & Household Products — 0.49% | |
Journey Personal Care Corp.
6.500% (1 Month LIBOR USD + 4.250%),
03/01/2028 (Acquired 02/19/2021,
Cost $4,991,707) (b) (m) | | | 5,016,791 | | | | 3,913,097 | | |
Pharmaceuticals — 1.28% | |
Covis Finco Sarl
8.704% (1 Month SOFR USD + 6.500%),
02/18/2027 (Acquired 02/14/2022,
Cost $4,056,152) (b) (m) | | | 4,485,225 | | | | 3,790,015 | | |
Mallinckrodt International Finance SA
7.503% (3 Month LIBOR USD + 5.500%),
02/24/2025 (Acquired 12/23/2019 —
01/22/2020, Cost $6,830,739) (b) (m) | | | 7,591,196 | | | | 6,525,051 | | |
| | | | 10,315,066 | | |
Software/Services — 1.06% | |
Central Parent, Inc.
TBD (1 Month SOFR USD + 4.500%),
06/08/2029 (Acquired 06/09/2022 —
6/10/2022, Cost $4,452,478) (b) (e) (m) | | | 4,581,000 | | | | 4,342,811 | | |
Syncapay, Inc.
8.750% (1 Month LIBOR USD + 6.500%),
12/10/2027 (Acquired 12/31/2020,
Cost $4,212,380) (b) (m) | | | 4,359,271 | | | | 4,203,427 | | |
| | | | 8,546,238 | | |
| | | Principal
Amount | | Value | |
Specialty Retail — 0.60% | |
Boardriders, Inc.
7.739% (3 Month LIBOR USD + 6.500%),
04/23/2024 (Acquired 03/21/2018,
Cost $5,961,106) (b) (i) (m) | | $ | 6,006,042 | | | $ | 3,408,279 | | |
9.371% PIK (1 Month LIBOR USD + 8.000%),
04/23/2024 (Acquired 10/07/2020 —
05/09/2022, Cost $1,590,127) (b) (i) (m) (p) | | | 1,590,127 | | | | 1,447,015 | | |
| | | | 4,855,294 | | |
Support — Services — 0.54% | |
Drive Chassis Holdco LLC
7.739% (1 Month LIBOR USD + 6.750%),
04/10/2026 (Acquired 04/12/2019,
Cost $4,280,741) (b) (m) | | | 4,430,000 | | | | 4,374,625 | | |
Total term loans
(Cost $65,916,704) | | | | | 60,160,762 | | |
CONVERTIBLE
PREFERRED STOCKS — 0.58% | | Shares
Held | | Value | |
Building & Construction — 0.58% | |
Fluor Corp., 6.500% | | | 3,961 | | | | 4,691,012 | | |
Total convertible preferred stocks
(Cost $3,961,000) | | | | | 4,691,012 | | |
| PREFERRED STOCKS — 0.99% | |
Hotels — 0.22% | |
Pebblebrook Hotel Trust — Series F, 6.300% | | | 85,621 | | | | 1,774,923 | | |
Specialty Retail — 0.77% | |
Boardriders, Inc. — Series B (Acquired
07/11/2013 — 08/09/2019,
Cost $28,937,490) (a) (f) (i) (m) (u) | | | 13,810,639 | | | | 6,214,788 | | |
Total preferred stocks
(Cost $30,848,797) | | | | | 7,989,711 | | |
COMMON STOCKS — 5.17% | |
Energy — Exploration & Production — 0.91% | |
Civitas Resources, Inc. | | | 37,684 | | | | 1,970,496 | | |
Jonah Energy Parent LLC (Acquired
12/31/2020, Cost $204,836) (f) (i) (m) (u) | | | 13,656 | | | | 687,716 | | |
PetroQuest Energy, Inc. (a) (f) (i) (o) (u) | | | 8,969,064 | | | | 1,255,669 | | |
Ranger Oil Corp. (a) | | | 98,195 | | | | 3,227,670 | | |
Warren Resources, Inc. (Acquired
11/23/2016, Cost $162,924) (a) (f) (i) (m) (u) | | | 117,785 | | | | 208,480 | | |
| | | | 7,350,031 | | |
Metals/Mining Excluding Steel — 3.44% | |
Metals Recovery Holdings LLC (Acquired
07/19/2012 — 12/10/2019,
Cost $32,793,156) (a) (f) (i) (m) (o) (u) | | | 116,127 | | | | 18,508,369 | | |
RA Parent, Inc. (Acquired
12/23/2014 — 08/09/2019,
Cost $8,348,746) (a) (f) (i) (m) (u) | | | 142 | | | | 9,159,000 | | |
| | | | 27,667,369 | | |
The accompanying notes are an integral part of these financial statements.
51
Schedule of Investments — June 30, 2022
Hotchkis & Wiley High Yield Fund
| | | Shares
Held | | Value | |
Oil Field Equipment & Services — 0.82% | |
Iracore Investments Holdings, Inc. — Class A
(Acquired 04/13/2017,
Cost $4,753,500) (a) (f) (i) (m) (o) (u) | | | 22,361 | | | $ | 6,623,328 | | |
Total common stocks
(Cost $76,029,864) | | | | | 41,640,728 | | |
Total long-term investments
(Cost $941,300,285) | | | | | 760,596,770 | | |
SHORT-TERM INVESTMENTS — 4.06% | |
Money Market Funds — 3.48% | |
JPMorgan U.S. Government Money
Market Fund — Class IM, 1.37%^ | | | 28,000,000 | | | | 28,000,000 | | |
| | | Principal
Amount | | | |
Time Deposits — 0.58% | |
Banco Bilbao Vizcaya Argentaria SA,
0.91%, 07/01/2022* | | $ | 4,684,523 | | | | 4,684,523 | | |
Royal Bank of Canada, 0.91%, 07/01/2022* | | | 5,502 | | | | 5,502 | | |
| | | | | | 4,690,025 | | |
Total short-term investments
(Cost $32,690,025) | | | 32,690,025 | | |
Total investments — 98.55%
(Cost $973,990,310) | | | | | 793,286,795 | | |
Other assets in excess of liabilities — 1.45% | | | | | 11,637,711 | | |
Net assets — 100.00% | | $ | 804,924,506 | | |
(a) — Non-income producing security.
(b) — The coupon rate shown on variable rate securities represents the rate at June 30, 2022.
(c) — All or a portion of this security is segregated for delayed delivery securities.
(e) — Delayed delivery security.
(f) — Security was fair valued under guidelines established by and under the general supervision and responsibility of the Trust's Board of Trustees. The total market value of these securities was $44,484,342, which represented 5.53% of net assets. See Security Valuation in Note 1 in Notes to the Financial Statements.
(i) — Illiquid security. The total market value of these securities was $53,360,655, which represented 6.63% of net assets.
(m) — Restricted security. Purchased in a private placement transaction; resale to the public may require registration. The total market value of these securities was $101,562,443, which represented 12.62% of net assets.
(o) — Affiliated issuer. See Note 6 in Notes to the Financial Statements.
(p) — Payment in-kind (PIK) security.
(r) — Rule 144A security under the Securities Act of 1933. Purchased in a private placement transaction; resale to the public may require registration or be limited to qualified institutional buyers. The total market value of these securities was $534,278,666, which represented 66.38% of net assets.
(u) — Value determined using significant unobservable inputs.
LIBOR — London Interbank Offered Rate
SOFR — Secured Overnight Financing Rate
TBD — To be determined.
USD — United States Dollar
^ — Rate shown is the 7-day yield as of June 30, 2022.
* — Invested through a cash management account administered by Brown Brothers Harriman & Co.
The accompanying notes are an integral part of these financial statements.
52
Statements of Assets & Liabilities
JUNE 30, 2022
| | | Diversified Value
Fund | | Large Cap Value
Fund | | Mid-Cap Value
Fund | | Small Cap Value
Fund | | Small Cap
Diversified Value
Fund | |
Assets: | |
Long-term investments, at value* | |
Unaffiliated issuers | | $ | 83,301,575 | | | $ | 396,818,422 | | | $ | 431,516,819 | | | $ | 522,874,153 | | | $ | 462,054,888 | | |
Affiliated issuers | | | — | | | | — | | | | — | | | | 5,324,184 | | | | — | | |
Collateral for securities on loan* | | | — | | | | 638,435 | | | | 661,045 | | | | 2,787,980 | | | | 4,634,772 | | |
Short-term investments* | | | 670,660 | | | | 7,731,019 | | | | 881,139 | | | | 28,096,262 | | | | 10,786,292 | | |
Cash | | | 252 | | | | 2,197 | | | | 3,248 | | | | 12,677 | | | | 4,905 | | |
Dividends and interest receivable | | | 130,959 | | | | 673,446 | | | | 451,945 | | | | 351,309 | | | | 519,634 | | |
Receivable for investments sold | | | — | | | | — | | | | 5,217,639 | | | | — | | | | — | | |
Receivable for Fund shares sold | | | — | | | | 579,868 | | | | 531,534 | | | | 2,442,531 | | | | 231,437 | | |
Other assets | | | 5,971 | | | | 30,217 | | | | 30,715 | | | | 34,386 | | | | 18,284 | | |
Total assets | | $ | 84,109,417 | | | $ | 406,473,604 | | | $ | 439,294,084 | | | $ | 561,923,482 | | | $ | 478,250,212 | | |
Liabilities: | |
Collateral upon return of securities on loan | | $ | — | | | $ | 638,435 | | | $ | 661,045 | | | $ | 2,787,980 | | | $ | 4,634,772 | | |
Payable for investments purchased | | | — | | | | — | | | | 3,397,152 | | | | 3,605,609 | | | | 2,816,669 | | |
Payable for Fund shares repurchased | | | 5 | | | | 386,188 | | | | 544,608 | | | | 479,678 | | | | 207,546 | | |
Payable to Advisor | | | 34,853 | | | | 235,814 | | | | 293,316 | | | | 363,496 | | | | 221,944 | | |
Accrued distribution and service fees | | | 45,798 | | | | 234,138 | | | | 180,130 | | | | 65,639 | | | | 4,636 | | |
Accrued expenses and other liabilities | | | 60,510 | | | | 255,208 | | | | 209,606 | | | | 275,063 | | | | 201,279 | | |
Total liabilities | | | 141,166 | | | | 1,749,783 | | | | 5,285,857 | | | | 7,577,465 | | | | 8,086,846 | | |
Commitments and contingencies (Note 8) | |
Net assets | | $ | 83,968,251 | | | $ | 404,723,821 | | | $ | 434,008,227 | | | $ | 554,346,017 | | | $ | 470,163,366 | | |
Net Assets consist of: | |
Paid-in capital | | $ | 108,683,325 | | | $ | 360,007,851 | | | $ | 703,235,352 | | | $ | 525,919,197 | | | $ | 434,260,545 | | |
Total accumulated distributable earnings (losses) | | $ | (24,715,074 | ) | | $ | 44,715,970 | | | $ | (269,227,125 | ) | | $ | 28,426,820 | | | $ | 35,902,821 | | |
Net assets | | $ | 83,968,251 | | | $ | 404,723,821 | | | $ | 434,008,227 | | | $ | 554,346,017 | | | $ | 470,163,366 | | |
Calculation of Net Asset Value Per Share and
Public Offering Price Per Share — Class I | |
Net assets | | $ | 50,757,206 | | | $ | 214,692,220 | | | $ | 286,886,974 | | | $ | 510,545,104 | | | $ | 461,865,709 | | |
Shares outstanding (unlimited shares $0.001 par value authorized) | | | 2,229,695 | | | | 5,516,390 | | | | 7,047,495 | | | | 7,735,232 | | | | 38,775,639 | | |
Net asset value per share | | $ | 22.76 | | | $ | 38.92 | | | $ | 40.71 | | | $ | 66.00 | | | $ | 11.91 | | |
Calculation of Net Asset Value Per Share — Class A | |
Net assets | | $ | 32,489,114 | | | $ | 150,259,722 | | | $ | 111,770,543 | | | $ | 33,249,826 | | | $ | 5,839,331 | | |
Shares outstanding (unlimited shares $0.001 par value authorized) | | | 1,422,531 | | | | 3,886,415 | | | | 2,794,638 | | | | 506,340 | | | | 493,564 | | |
Net asset value per share | | $ | 22.84 | | | $ | 38.66 | | | $ | 39.99 | | | $ | 65.67 | | | $ | 11.83 | | |
Public Offering Price Per Share — Class A | |
(Net asset value per share divided by 0.9475) | | $ | 24.11 | | | $ | 40.80 | | | $ | 42.21 | | | $ | 69.31 | | | $ | 12.49 | | |
Calculation of Net Asset Value Per Share and
Public Offering Price Per Share — Class C | |
Net assets | | $ | 721,931 | | | $ | 4,690,904 | | | $ | 4,480,345 | | | $ | 1,157,270 | | | | | | |
Shares outstanding (unlimited shares $0.001 par value authorized) | | | 31,755 | | | | 122,682 | | | | 129,441 | | | | 22,157 | | | | | | |
Net asset value per share | | $ | 22.73 | | | $ | 38.24 | | | $ | 34.61 | | | $ | 52.23 | | | | | | |
Calculation of Net Asset Value Per Share and
Public Offering Price Per Share — Class Z | |
Net assets | | | | $ | 35,080,975 | | | $ | 30,870,365 | | | $ | 9,393,817 | | | $ | 2,458,326 | | |
Shares outstanding (unlimited shares $0.001 par value authorized) | | | | | 901,331 | | | | 758,079 | | | | 142,238 | | | | 206,506 | | |
Net asset value per share | | | | $ | 38.92 | | | $ | 40.72 | | | $ | 66.04 | | | $ | 11.90 | | |
*Cost of long-term investments | |
Unaffiliated issuers | | $ | 79,535,935 | | | $ | 372,190,241 | | | $ | 401,547,353 | | | $ | 526,911,895 | | | $ | 458,395,841 | | |
Affiliated issuers | | | — | | | | — | | | | — | | | | 17,211,831 | | | | — | | |
*Cost of collateral for securities on loan | | | — | | | | 638,435 | | | | 661,045 | | | | 2,787,980 | | | | 4,634,772 | | |
*Cost of short-term investments | | | 670,660 | | | | 7,731,022 | | | | 881,148 | | | | 28,096,262 | | | | 10,786,292 | | |
The accompanying notes are an integral part of these financial statements.
53
Statements of Assets & Liabilities
JUNE 30, 2022
| | | Global Value
Fund | | International Value
Fund | | International
Small Cap
Diversified Value
Fund | | Value Opportunities
Fund | | High Yield
Fund | |
Assets: | |
Long-term investments, at value* | |
Unaffiliated issuers | | $ | 32,735,838 | | | $ | 2,668,140 | | | $ | 5,579,329 | | | $ | 444,178,504 | | | $ | 734,209,404 | | |
Affiliated issuers | | | — | | | | — | | | | — | | | | 9,603,396 | | | | 26,387,366 | | |
Collateral for securities on loan* | | | — | | | | — | | | | — | | | | 358,790 | | | | — | | |
Short-term investments* | | | 884,803 | | | | 52,447 | | | | 121,568 | | | | 22,793,145 | | | | 32,690,025 | | |
Cash | | | 402 | | | | 33 | | | | 53 | | | | 7,222 | | | | 2,603 | | |
Cash held at broker | | | — | | | | — | | | | — | | | | 9,000 | | | | — | | |
Dividends and interest receivable | | | 62,111 | | | | 9,830 | | | | 16,035 | | | | 438,525 | | | | 12,634,911 | | |
Receivable for investments sold | | | — | | | | — | | | | — | | | | 9,857,554 | | | | 5,356,953 | | |
Receivable for Fund shares sold | | | — | | | | — | | | | — | | | | 275,621 | | | | 1,458,732 | | |
Receivable from Advisor | | | — | | | | 8,275 | | | | 34,571 | | | | — | | | | — | | |
Other assets | | | 5,739 | | | | 1,951 | | | | 7,019 | | | | 25,065 | | | | 51,589 | | |
Total assets | | $ | 33,688,893 | | | $ | 2,740,676 | | | $ | 5,758,575 | | | $ | 487,546,822 | | | $ | 812,791,583 | | |
Liabilities: | |
Collateral upon return of securities on loan | | $ | — | | | $ | — | | | $ | — | | | $ | 358,790 | | | $ | — | | |
Payable for investments purchased | | | 275,187 | | | | — | | | | — | | | | 7,939,339 | | | | 4,452,478 | | |
Payable for Fund shares repurchased | | | 271,167 | | | | — | | | | — | | | | 21,588,427 | | | | 1,937,452 | | |
Payable to Advisor | | | 13,430 | | | | — | | | | — | | | | 317,854 | | | | 351,343 | | |
Accrued distribution and service fees | | | 2,031 | | | | — | | | | — | | | | 107,956 | | | | 3,462 | | |
Distributions payable to shareholders | | | — | | | | — | | | | — | | | | — | | | | 798,805 | | |
Accrued expenses and other liabilities | | | 37,196 | | | | 32,514 | | | | 49,410 | | | | 168,028 | | | | 323,537 | | |
Total liabilities | | | 599,011 | | | | 32,514 | | | | 49,410 | | | | 30,480,394 | | | | 7,867,077 | | |
Commitments and contingencies (Note 8) | |
Net assets | | $ | 33,089,882 | | | $ | 2,708,162 | | | $ | 5,709,165 | | | $ | 457,066,428 | | | $ | 804,924,506 | | |
Net Assets consist of: | |
Paid-in capital | | $ | 31,767,829 | | | $ | 2,629,247 | | | $ | 5,765,431 | | | $ | 484,222,181 | | | $ | 1,317,119,136 | | |
Total accumulated distributable earnings (losses) | | $ | 1,322,053 | | | $ | 78,915 | | | $ | (56,266 | ) | | $ | (27,155,753 | ) | | $ | (512,194,630 | ) | |
Net assets | | $ | 33,089,882 | | | $ | 2,708,162 | | | $ | 5,709,165 | | | $ | 457,066,428 | | | $ | 804,924,506 | | |
Calculation of Net Asset Value Per Share and
Public Offering Price Per Share — Class I | |
Net assets | | $ | 31,800,208 | | | $ | 2,708,162 | | | $ | 5,709,165 | | | $ | 326,559,334 | | | $ | 642,933,961 | | |
Shares outstanding (unlimited shares $0.001 par value authorized) | | | 2,515,860 | | | | 261,724 | | | | 554,980 | | | | 11,225,680 | | | | 65,372,704 | | |
Net asset value per share | | $ | 12.64 | | | $ | 10.35 | | | $ | 10.29 | | | $ | 29.09 | | | $ | 9.83 | | |
Calculation of Net Asset Value Per Share — Class A | |
Net assets | | $ | 1,289,674 | | | | | | | | | | | $ | 70,349,610 | | | $ | 29,066,153 | | |
Shares outstanding (unlimited shares $0.001 par value authorized) | | | 102,104 | | | | | | | | | | | | 2,418,336 | | | | 2,982,520 | | |
Net asset value per share | | $ | 12.63 | | | | | | | | | | | $ | 29.09 | | | $ | 9.75 | | |
Public Offering Price Per Share — Class A | |
(Net asset value per share divided by 0.9475) | | $ | 13.33 | | | | | | | | | | | $ | 30.70 | | | | | | |
(Net asset value per share divided by 0.9625) | | | | | | | | | | $ | 10.13 | | |
Calculation of Net Asset Value Per Share and
Public Offering Price Per Share — Class C | |
Net assets | | | | | | | | $ | 19,575,474 | | | $ | 1,077,629 | | |
Shares outstanding (unlimited shares $0.001 par value authorized) | | | | | | | | | 742,405 | | | | 109,666 | | |
Net asset value per share | | | | | | | | $ | 26.37 | | | $ | 9.83 | | |
Calculation of Net Asset Value Per Share and
Public Offering Price Per Share — Class Z | |
Net assets | | | | | | | | $ | 40,582,010 | | | $ | 131,846,763 | | |
Shares outstanding (unlimited shares $0.001 par value authorized) | | | | | | | | | 1,395,008 | | | | 13,406,206 | | |
Net asset value per share | | | | | | | | $ | 29.09 | | | $ | 9.83 | | |
*Cost of long-term investments | |
Unaffiliated issuers | | $ | 32,484,080 | | | $ | 2,674,563 | | | $ | 5,922,395 | | | $ | 478,714,266 | | | $ | 880,731,018 | | |
Affiliated issuers | | | — | | | | — | | | | — | | | | 6,892,250 | | | | 60,569,267 | | |
*Cost of collateral for securities on loan | | | — | | | | — | | | | — | | | | 358,790 | | | | — | | |
*Cost of short-term investments | | | 884,803 | | | | 52,447 | | | | 121,568 | | | | 22,793,207 | | | | 32,690,025 | | |
The accompanying notes are an integral part of these financial statements.
54
Statements of Operations
FOR THE YEAR ENDED JUNE 30, 2022
| | | Diversified Value
Fund | | Large Cap Value
Fund | | Mid-Cap Value
Fund | | Small Cap Value
Fund | | Small Cap
Diversified Value
Fund | |
Investment income: | |
Dividends* | |
Unaffiliated issuers | | $ | 1,772,424 | | | $ | 9,193,636 | | | $ | 6,912,406 | | | $ | 8,003,552 | | | $ | 9,896,862 | | |
Interest | | | 607 | | | | 5,217 | | | | 11,428 | | | | 26,586 | | | | 8,662 | | |
Securities on loan, net | | | 895 | | | | 5,786 | | | | 9,401 | | | | 31,060 | | | | 58,419 | | |
Total income | | | 1,773,926 | | | | 9,204,639 | | | | 6,933,235 | | | | 8,061,198 | | | | 9,963,943 | | |
Expenses: | |
Advisory fees | | | 699,720 | | | | 3,424,264 | | | | 3,434,346 | | | | 4,189,548 | | | | 3,145,442 | | |
Professional fees and expenses | | | 23,984 | | | | 55,130 | | | | 53,915 | | | | 62,358 | | | | 54,040 | | |
Custodian fees and expenses | | | 6,072 | | | | 14,771 | | | | 16,571 | | | | 19,888 | | | | 20,538 | | |
Transfer agent fees and expenses | | | 111,664 | | | | 701,725 | | | | 582,926 | | | | 1,122,529 | | | | 571,939 | | |
Accounting fees and expenses | | | 25,900 | | | | 58,695 | | | | 55,559 | | | | 66,100 | | | | 67,846 | | |
Administration fees and expenses | | | 47,286 | | | | 172,452 | | | | 161,404 | | | | 192,799 | | | | 173,807 | | |
Compliance fees | | | 1,587 | | | | 7,864 | | | | 7,310 | | | | 8,901 | | | | 7,814 | | |
Trustees' fees and expenses | | | 11,728 | | | | 55,820 | | | | 51,968 | | | | 63,592 | | | | 54,211 | | |
Reports to shareholders | | | 6,997 | | | | 27,643 | | | | 26,609 | | | | 30,772 | | | | 14,373 | | |
Registration fees | | | 48,644 | | | | 71,705 | | | | 66,726 | | | | 73,964 | | | | 61,126 | | |
Distribution and service fees — Class A | | | 96,290 | | | | 458,796 | | | | 306,454 | | | | 89,355 | | | | 17,770 | | |
Distribution and service fees — Class C | | | 10,614 | | | | 66,819 | | | | 57,322 | | | | 14,368 | | | | — | | |
Other expenses | | | 14,596 | | | | 47,842 | | | | 41,724 | | | | 52,520 | | | | 40,371 | | |
Total expenses | | | 1,105,082 | | | | 5,163,526 | | | | 4,862,834 | | | | 5,986,694 | | | | 4,229,277 | | |
Fee waiver/expense reimbursement by Advisor (Note 2) | | | (198,480 | ) | | | (49,931 | ) | | | — | | | | — | | | | (340,696 | ) | |
Net expenses | | | 906,602 | | | | 5,113,595 | | | | 4,862,834 | | | | 5,986,694 | | | | 3,888,581 | | |
Net investment income | | | 867,324 | | | | 4,091,044 | | | | 2,070,401 | | | | 2,074,504 | | | | 6,075,362 | | |
Realized and Unrealized Gains (Losses): | |
Net realized gains (losses) from: | |
Sales of unaffiliated issuers | | | 6,184,760 | | | | 31,502,459 | | | | 41,678,717 | | | | 89,717,698 | | | | 55,204,950 | | |
Sales of affiliated issuers | | | — | | | | — | | | | — | | | | (3,932,098 | ) | | | — | | |
Foreign currency transactions | | | 221 | | | | 1,117 | | | | (2,575 | ) | | | (643 | ) | | | — | | |
Net realized gains | | | 6,184,981 | | | | 31,503,576 | | | | 41,676,142 | | | | 85,784,957 | | | | 55,204,950 | | |
Net change in unrealized appreciation/depreciation of: | |
Securities of unaffiliated issuers and foreign currency translations | | | (14,713,941 | ) | | | (78,910,741 | ) | | | (59,787,599 | ) | | | (119,431,389 | ) | | | (109,788,819 | ) | |
Securities of affiliated issuers | | | — | | | | — | | | | — | | | | 6,523,176 | | | | — | | |
Net change in unrealized appreciation/depreciation | | | (14,713,941 | ) | | | (78,910,741 | ) | | | (59,787,599 | ) | | | (112,908,213 | ) | | | (109,788,819 | ) | |
Net losses | | | (8,528,960 | ) | | | (47,407,165 | ) | | | (18,111,457 | ) | | | (27,123,256 | ) | | | (54,583,869 | ) | |
Net Decrease in Net Assets Resulting
from Operations | | $ | (7,661,636 | ) | | $ | (43,316,121 | ) | | $ | (16,041,056 | ) | | $ | (25,048,752 | ) | | $ | (48,508,507 | ) | |
*Net of Foreign Taxes Withheld | | $ | 22,530 | | | $ | 150,308 | | | $ | 134,776 | | | $ | 96,937 | | | $ | 9,942 | | |
The accompanying notes are an integral part of these financial statements.
55
Statements of Operations
FOR THE YEAR ENDED JUNE 30, 2022
| | | Global Value
Fund | | International Value
Fund | | International
Small Cap
Diversified Value
Fund | | Value Opportunities
Fund | | High Yield
Fund | |
Investment income: | |
Dividends* | |
Unaffiliated issuers | | $ | 719,261 | | | $ | 86,309 | | | $ | 190,170 | | | $ | 7,279,665 | | | $ | 1,582,807 | | |
Interest | | | 2,489 | | | | 299 | | | | 112 | | | | 412,089 | | | | 52,115,074 | | |
Securities on loan, net | | | — | | | | — | | | | — | | | | 13,023 | | | | — | | |
Total income | | | 721,750 | | | | 86,608 | | | | 190,282 | | | | 7,704,777 | | | | 53,697,881 | | |
Expenses: | |
Advisory fees | | | 280,621 | | | | 20,975 | | | | 52,393 | | | | 4,176,969 | | | | 5,615,632 | | |
Professional fees and expenses | | | 17,581 | | | | 13,189 | | | | 13,459 | | | | 64,536 | | | | 108,556 | | |
Custodian fees and expenses | | | 8,079 | | | | 9,105 | | | | 51,654 | | | | 33,837 | | | | 44,854 | | |
Transfer agent fees and expenses | | | 29,467 | | | | 217 | | | | 398 | | | | 453,496 | | | | 1,031,126 | | |
Accounting fees and expenses | | | 28,650 | | | | 32,092 | | | | 80,928 | | | | 67,389 | | | | 152,007 | | |
Administration fees and expenses | | | 40,206 | | | | 40,199 | | | | 45,873 | | | | 193,812 | | | | 343,523 | | |
Compliance fees | | | 595 | | | | 41 | | | | 104 | | | | 8,914 | | | | 16,267 | | |
Trustees' fees and expenses | | | 4,292 | | | | 298 | | | | 761 | | | | 64,091 | | | | 122,239 | | |
Reports to shareholders | | | 3,511 | | | | 2,816 | | | | 3,138 | | | | 20,970 | | | | 23,079 | | |
Registration fees | | | 34,881 | | | | 4,130 | | | | 22,745 | | | | 69,541 | | | | 80,818 | | |
Distribution and service fees — Class A | | | 3,787 | | | | — | | | | — | | | | 221,366 | | | | 90,254 | | |
Distribution and service fees — Class C | | | — | | | | — | | | | — | | | | 249,315 | | | | 13,857 | | |
Other expenses | | | 8,359 | | | | 4,696 | | | | 5,712 | | | | 52,442 | | | | 115,536 | | |
Total expenses | | | 460,029 | | | | 127,758 | | | | 277,165 | | | | 5,676,678 | | | | 7,757,748 | | |
Fee waiver/expense reimbursement by Advisor (Note 2) | | | (100,698 | ) | | | (102,811 | ) | | | (212,329 | ) | | | — | | | | (659,998 | ) | |
Net expenses | | | 359,331 | | | | 24,947 | | | | 64,836 | | | | 5,676,678 | | | | 7,097,750 | | |
Net investment income | | | 362,419 | | | | 61,661 | | | | 125,446 | | | | 2,028,099 | | | | 46,600,131 | | |
Realized and Unrealized Gains (Losses): | |
Net realized gains (losses) from: | |
Sales of unaffiliated issuers | | | 2,893,814 | | | | 157,657 | | | | 345,329 | | | | 47,848,452 | | | | (10,771,511 | ) | |
Sales of affiliated issuers | | | — | | | | — | | | | — | | | | — | | | | (1,291,045 | ) | |
Foreign currency transactions | | | (5,671 | ) | | | (2,010 | ) | | | (6,407 | ) | | | (30,094 | ) | | | 5 | | |
Futures contracts | | | — | | | | — | | | | — | | | | 872,966 | | | | — | | |
Net realized gains (losses) | | | 2,888,143 | | | | 155,647 | | | | 338,922 | | | | 48,691,324 | | | | (12,062,551 | ) | |
Net change in unrealized appreciation/depreciation of: | |
Securities of unaffiliated issuers and foreign currency translations | | | (7,802,624 | ) | | | (496,722 | ) | | | (1,416,130 | ) | | | (111,379,153 | ) | | | (137,700,413 | ) | |
Securities of affiliated issuers | | | — | | | | — | | | | — | | | | (2,458,561 | ) | | | (2,616,426 | ) | |
Futures contracts | | | — | | | | — | | | | — | | | | (403,023 | ) | | | — | | |
Net change in unrealized appreciation/depreciation | | | (7,802,624 | ) | | | (496,722 | ) | | | (1,416,130 | ) | | | (114,240,737 | ) | | | (140,316,839 | ) | |
Net losses | | | (4,914,481 | ) | | | (341,075 | ) | | | (1,077,208 | ) | | | (65,549,413 | ) | | | (152,379,390 | ) | |
Net Decrease in Net Assets Resulting
from Operations | | $ | (4,552,062 | ) | | $ | (279,414 | ) | | $ | (951,762 | ) | | $ | (63,521,314 | ) | | $ | (105,779,259 | ) | |
*Net of Foreign Taxes Withheld | | $ | 53,346 | | | $ | 10,486 | | | $ | 32,429 | | | $ | 311,240 | | | $ | — | | |
The accompanying notes are an integral part of these financial statements.
56
Statements of Changes in Net Assets
| | | Diversified Value Fund | | Large Cap Value Fund | |
| | | Year ended
June 30, 2022 | | Year ended
June 30, 2021 | | Year ended
June 30, 2022 | | Year ended
June 30, 2021 | |
Operations: | |
Net investment income | | $ | 867,324 | | | $ | 993,767 | | | $ | 4,091,044 | | | $ | 4,667,389 | | |
Net realized gains | | | 6,184,981 | | | | 1,876,667 | | | | 31,503,576 | | | | 9,995,846 | | |
Net change in unrealized appreciation/depreciation | | | (14,713,941 | ) | | | 40,296,325 | | | | (78,910,741 | ) | | | 188,924,665 | | |
Net increase (decrease) in net assets resulting from operations | | | (7,661,636 | ) | | | 43,166,759 | | | | (43,316,121 | ) | | | 203,587,900 | | |
Dividends and Distributions to Shareholders: | |
Class I | | | (657,851 | ) | | | (992,196 | ) | | | (2,427,861 | ) | | | (4,266,621 | ) | |
Class A | | | (334,023 | ) | | | (525,542 | ) | | | (1,326,174 | ) | | | (2,063,556 | ) | |
Class C | | | (1,799 | ) | | | (8,023 | ) | | | — | | | | (18,447 | ) | |
Class Z | | | — | | | | — | | | | (121,577 | ) | | | (156,287 | ) | |
Net decrease in net assets resulting from dividends and distributions
to shareholders | | | (993,673 | ) | | | (1,525,761 | ) | | | (3,875,612 | ) | | | (6,504,911 | ) | |
Capital Share Transactions: | |
Net decrease in net assets resulting from capital share transactions | | | (16,142,449 | ) | | | (5,288,401 | ) | | | (10,878,399 | ) | | | (121,846,115 | ) | |
Net Assets: | |
Total increase (decrease) in net assets | | | (24,797,758 | ) | | | 36,352,597 | | | | (58,070,132 | ) | | | 75,236,874 | | |
Beginning of year | | | 108,766,009 | | | | 72,413,412 | | | | 462,793,953 | | | | 387,557,079 | | |
End of year | | $ | 83,968,251 | | | $ | 108,766,009 | | | $ | 404,723,821 | | | $ | 462,793,953 | | |
The accompanying notes are an integral part of these financial statements.
57
Statements of Changes in Net Assets
| | | Mid-Cap Value Fund | | Small Cap Value Fund | |
| | | Year ended
June 30, 2022 | | Year ended
June 30, 2021 | | Year ended
June 30, 2022 | | Year ended
June 30, 2021 | |
Operations: | |
Net investment income | | $ | 2,070,401 | | | $ | 5,360,742 | | | $ | 2,074,504 | | | $ | 1,979,403 | | |
Net realized gains | | | 41,676,142 | | | | 42,592,192 | | | | 85,784,957 | | | | 68,227,665 | | |
Net change in unrealized appreciation/depreciation | | | (59,787,599 | ) | | | 182,855,325 | | | | (112,908,213 | ) | | | 196,989,781 | | |
Net increase (decrease) in net assets resulting from operations | | | (16,041,056 | ) | | | 230,808,259 | | | | (25,048,752 | ) | | | 267,196,849 | | |
Dividends and Distributions to Shareholders: | |
Class I | | | (3,616,474 | ) | | | (5,186,501 | ) | | | (1,727,552 | ) | | | (3,423,111 | ) | |
Class A | | | (1,423,942 | ) | | | (2,090,006 | ) | | | (77,062 | ) | | | (203,554 | ) | |
Class C | | | (1,906 | ) | | | (162,167 | ) | | | — | | | | (5,353 | ) | |
Class Z | | | (434,467 | ) | | | (489,503 | ) | | | (51,094 | ) | | | (86,524 | ) | |
Net decrease in net assets resulting from dividends and distributions
to shareholders | | | (5,476,789 | ) | | | (7,928,177 | ) | | | (1,855,708 | ) | | | (3,718,542 | ) | |
Capital Share Transactions: | |
Net increase (decrease) in net assets resulting from capital share
transactions | | | 2,909,748 | | | | (69,449,403 | ) | | | 21,543,755 | | | | (74,946,971 | ) | |
Net Assets: | |
Total increase (decrease) in net assets | | | (18,608,097 | ) | | | 153,430,679 | | | | (5,360,705 | ) | | | 188,531,336 | | |
Beginning of year | | | 452,616,324 | | | | 299,185,645 | | | | 559,706,722 | | | | 371,175,386 | | |
End of year | | $ | 434,008,227 | | | $ | 452,616,324 | | | $ | 554,346,017 | | | $ | 559,706,722 | | |
The accompanying notes are an integral part of these financial statements.
58
Statements of Changes in Net Assets
| | | Small Cap Diversified Value Fund | | Global Value Fund | |
| | | Year ended
June 30, 2022 | | Year ended
June 30, 2021 | | Year ended
June 30, 2022 | | Year ended
June 30, 2021 | |
Operations: | |
Net investment income | | $ | 6,075,362 | | | $ | 3,311,779 | | | $ | 362,419 | | | $ | 257,456 | | |
Net realized gains | | | 55,204,950 | | | | 12,693,177 | | | | 2,888,143 | | | | 2,374,924 | | |
Net change in unrealized appreciation/depreciation | | | (109,788,819 | ) | | | 131,129,477 | | | | (7,802,624 | ) | | | 12,022,169 | | |
Net increase (decrease) in net assets resulting from operations | | | (48,508,507 | ) | | | 147,134,433 | | | | (4,552,062 | ) | | | 14,654,549 | | |
Dividends and Distributions to Shareholders: | |
Class I | | | (29,365,305 | ) | | | (2,363,036 | ) | | | (245,800 | ) | | | (444,350 | ) | |
Class A | | | (461,227 | ) | | | (18,884 | ) | | | (6,987 | ) | | | (2,722 | ) | |
Class Z | | | (75,948 | ) | | | (6,779 | ) | | | — | | | | — | | |
Net decrease in net assets resulting from dividends and distributions
to shareholders | | | (29,902,480 | ) | | | (2,388,699 | ) | | | (252,787 | ) | | | (447,072 | ) | |
Capital Share Transactions: | |
Net increase (decrease) in net assets resulting from capital share
transactions | | | 111,012,557 | | | | 147,825,977 | | | | 385,654 | | | | (2,014,373 | ) | |
Net Assets: | |
Total increase (decrease) in net assets | | | 32,601,570 | | | | 292,571,711 | | | | (4,419,195 | ) | | | 12,193,104 | | |
Beginning of year | | | 437,561,796 | | | | 144,990,085 | | | | 37,509,077 | | | | 25,315,973 | | |
End of year | | $ | 470,163,366 | | | $ | 437,561,796 | | | $ | 33,089,882 | | | $ | 37,509,077 | | |
The accompanying notes are an integral part of these financial statements.
59
Statements of Changes in Net Assets
| | | International Value Fund | | International Small Cap
Diversified Value Fund | |
| | | Year ended
June 30, 2022 | | Year ended
June 30, 2021 | | Year ended
June 30, 2022 | | Period ended
June 30, 2021+ | |
Operations: | |
Net investment income | | $ | 61,661 | | | $ | 38,235 | | | $ | 125,446 | | | $ | 107,363 | | |
Net realized gains | | | 155,647 | | | | 112,066 | | | | 338,922 | | | | 1,086,186 | | |
Net change in unrealized appreciation/depreciation | | | (496,722 | ) | | | 910,487 | | | | (1,416,130 | ) | | | 1,072,378 | | |
Net increase (decrease) in net assets resulting from operations | | | (279,414 | ) | | | 1,060,788 | | | | (951,762 | ) | | | 2,265,927 | | |
Dividends and Distributions to Shareholders: | |
Class I | | | (37,541 | ) | | | (30,073 | ) | | | (1,250,186 | ) | | | (120,245 | ) | |
Net decrease in net assets resulting from dividends and distributions
to shareholders | | | (37,541 | ) | | | (30,073 | ) | | | (1,250,186 | ) | | | (120,245 | ) | |
Capital Share Transactions: | |
Net increase (decrease) in net assets resulting from capital share
transactions | | | 471,104 | | | | (350,564 | ) | | | 1,250,186 | | | | 4,515,245 | | |
Net Assets: | |
Total increase (decrease) in net assets | | | 154,149 | | | | 680,151 | | | | (951,762 | ) | | | 6,660,927 | | |
Beginning of period | | | 2,554,013 | | | | 1,873,862 | | | | 6,660,927 | | | | — | | |
End of period | | $ | 2,708,162 | | | $ | 2,554,013 | | | $ | 5,709,165 | | | $ | 6,660,927 | | |
+ The Fund commenced operations on June 30, 2020.
The accompanying notes are an integral part of these financial statements.
60
Statements of Changes in Net Assets
| | | Value Opportunities Fund | | High Yield Fund | |
| | | Year ended
June 30, 2022 | | Year ended
June 30, 2021 | | Year ended
June 30, 2022 | | Year ended
June 30, 2021 | |
Operations: | |
Net investment income | | $ | 2,028,099 | | | $ | 7,799,559 | | | $ | 46,600,131 | | | $ | 66,989,826 | | |
Net realized gains (losses) | | | 48,691,324 | | | | 87,813,065 | | | | (12,062,551 | ) | | | (84,290,349 | ) | |
Net change in unrealized appreciation/depreciation | | | (114,240,737 | ) | | | 137,389,230 | | | | (140,316,839 | ) | | | 247,790,180 | | |
Net increase (decrease) in net assets resulting from operations | | | (63,521,314 | ) | | | 233,001,854 | | | | (105,779,259 | ) | | | 230,489,657 | | |
Dividends and Distributions to Shareholders: | |
Class I | | | (49,243,055 | ) | | | (7,100,606 | ) | | | (37,681,791 | ) | | | (45,766,603 | ) | |
Class A | | | (12,046,592 | ) | | | (1,983,365 | ) | | | (1,558,850 | ) | | | (1,971,546 | ) | |
Class C | | | (3,121,171 | ) | | | (577,064 | ) | | | (49,017 | ) | | | (95,373 | ) | |
Class Z | | | (5,855,755 | ) | | | (924,361 | ) | | | (7,150,392 | ) | | | (17,732,127 | ) | |
Net decrease in net assets resulting from dividends and distributions
to shareholders | | | (70,266,573 | ) | | | (10,585,396 | ) | | | (46,440,050 | ) | | | (65,565,649 | ) | |
Capital Share Transactions: | |
Net increase (decrease) in net assets resulting from capital share
transactions | | | 46,395,922 | | | | (194,829,898 | ) | | | (152,685,511 | ) | | | (603,574,274 | ) | |
Net Assets: | |
Total increase (decrease) in net assets | | | (87,391,965 | ) | | | 27,586,560 | | | | (304,904,820 | ) | | | (438,650,266 | ) | |
Beginning of year | | | 544,458,393 | | | | 516,871,833 | | | | 1,109,829,326 | | | | 1,548,479,592 | | |
End of year | | $ | 457,066,428 | | | $ | 544,458,393 | | | $ | 804,924,506 | | | $ | 1,109,829,326 | | |
The accompanying notes are an integral part of these financial statements.
61
Financial Highlights
The following per share data and ratios have been derived from information provided in the financial statements.
| | | | | Income (loss) from investment operations | | Dividends and distributions | | | | Ratios to Average Net Assets | |
Diversified Value Fund | | Net asset
value,
beginning
of year | | Net
investment
income
(loss)1 | | Net gains
(losses) on
securities
(both
realized and
unrealized) | | Total from
investment
operations | | Dividends
(from net
investment
income) | | Distributions
(from
capital
gains) | | Total
distributions | | Net asset
value, end
of year | | Total
return2 | | Net assets,
end of
year (in
thousands) | | Expenses,
net of
reimbursement/
waiver | | Expenses,
before
reimbursement/
waiver | | Net
investment
income
(loss) | |
Class I | |
Year ended 6/30/2022 | | $ | 25.09 | | | $ | 0.25 | | | $ | (2.30 | ) | | $ | (2.05 | ) | | $ | (0.28 | ) | | $ | — | | | $ | (0.28 | ) | | $ | 22.76 | | | | –8.27 | % | | $ | 50,757 | | | | 0.80 | % | | | 1.01 | % | | | 0.98 | % | |
Year ended 6/30/2021 | | | 15.31 | | | | 0.25 | | | | 9.92 | | | | 10.17 | | | | (0.39 | ) | | | — | | | | (0.39 | ) | | | 25.09 | | | | 67.14 | | | | 63,906 | | | | 0.80 | | | | 1.03 | | | | 1.24 | | |
Year ended 6/30/2020 | | | 18.90 | | | | 0.32 | | | | (3.54 | ) | | | (3.22 | ) | | | (0.37 | ) | | | — | | | | (0.37 | ) | | | 15.31 | | | | –17.51 | | | | 46,372 | | | | 0.80 | | | | 1.04 | | | | 1.83 | | |
Year ended 6/30/2019 | | | 18.80 | | | | 0.30 | | | | 0.06 | | | | 0.36 | | | | (0.26 | ) | | | — | | | | (0.26 | ) | | | 18.90 | | | | 2.08 | | | | 63,333 | | | | 0.83 | | | | 0.99 | | | | 1.65 | | |
Year ended 6/30/2018 | | | 17.43 | | | | 0.23 | | | | 1.48 | | | | 1.71 | | | | (0.34 | ) | | | — | | | | (0.34 | ) | | | 18.80 | | | | 9.81 | | | | 65,503 | | | | 0.95 | | | | 1.02 | | | | 1.25 | | |
Class A | |
Year ended 6/30/2022 | | | 25.18 | | | | 0.19 | | | | (2.30 | ) | | | (2.11 | ) | | | (0.23 | ) | | | — | | | | (0.23 | ) | | | 22.84 | | | | –8.49 | | | | 32,489 | | | | 1.05 | | | | 1.22 | | | | 0.72 | | |
Year ended 6/30/2021 | | | 15.36 | | | | 0.20 | | | | 9.96 | | | | 10.16 | | | | (0.34 | ) | | | — | | | | (0.34 | ) | | | 25.18 | | | | 66.74 | | | | 43,719 | | | | 1.05 | | | | 1.24 | | | | 1.00 | | |
Year ended 6/30/2020 | | | 18.95 | | | | 0.28 | | | | (3.56 | ) | | | (3.28 | ) | | | (0.31 | ) | | | — | | | | (0.31 | ) | | | 15.36 | | | | –17.68 | | | | 24,972 | | | | 1.05 | | | | 1.25 | | | | 1.57 | | |
Year ended 6/30/2019 | | | 18.85 | | | | 0.26 | | | | 0.05 | | | | 0.31 | | | | (0.21 | ) | | | — | | | | (0.21 | ) | | | 18.95 | | | | 1.78 | | | | 35,807 | | | | 1.08 | | | | 1.24 | | | | 1.39 | | |
Year ended 6/30/2018 | | | 17.47 | | | | 0.19 | | | | 1.49 | | | | 1.68 | | | | (0.30 | ) | | | — | | | | (0.30 | ) | | | 18.85 | | | | 9.57 | | | | 39,616 | | | | 1.20 | | | | 1.27 | | | | 1.00 | | |
Class C | |
Year ended 6/30/2022 | | | 25.07 | | | | (0.01 | ) | | | (2.29 | ) | | | (2.30 | ) | | | (0.04 | ) | | | — | | | | (0.04 | ) | | | 22.73 | | | | –9.20 | | | | 722 | | | | 1.80 | | | | 1.98 | | | | (0.04 | ) | |
Year ended 6/30/2021 | | | 15.24 | | | | 0.05 | | | | 9.91 | | | | 9.96 | | | | (0.13 | ) | | | — | | | | (0.13 | ) | | | 25.07 | | | | 65.57 | | | | 1,141 | | | | 1.80 | | | | 1.97 | | | | 0.25 | | |
Year ended 6/30/2020 | | | 18.77 | | | | 0.14 | | | | (3.55 | ) | | | (3.41 | ) | | | (0.12 | ) | | | — | | | | (0.12 | ) | | | 15.24 | | | | –18.33 | | | | 1,069 | | | | 1.80 | | | | 1.98 | | | | 0.80 | | |
Year ended 6/30/2019 | | | 18.64 | | | | 0.12 | | | | 0.06 | | | | 0.18 | | | | (0.05 | ) | | | — | | | | (0.05 | ) | | | 18.77 | | | | 0.98 | | | | 2,141 | | | | 1.83 | | | | 1.99 | | | | 0.64 | | |
Year ended 6/30/2018 | | | 17.27 | | | | 0.04 | | | | 1.48 | | | | 1.52 | | | | (0.15 | ) | | | — | | | | (0.15 | ) | | | 18.64 | | | | 8.77 | | | | 2,598 | | | | 1.95 | | | | 2.02 | | | | 0.25 | | |
| | | Year Ended June 30, | |
| | | 2022 | | 2021 | | 2020 | | 2019 | | 2018 | |
Portfolio turnover rate | | | 28 | % | | | 32 | % | | | 28 | % | | | 26 | % | | | 28 | % | |
| | | | | Income (loss) from investment operations | | Dividends and distributions | | | | Ratios to Average Net Assets | |
Large Cap Value Fund | | Net asset
value,
beginning
of period | | Net
investment
income
(loss)1 | | Net gains
(losses) on
securities
(both
realized and
unrealized) | | Total from
investment
operations | | Dividends
(from net
investment
income) | | Distributions
(from
capital
gains) | | Total
distributions | | Net asset
value, end
of period | | Total
return2 | | Net assets,
end of
period (in
thousands) | | Expenses,
net of
reimbursement/
waiver | | Expenses,
before
reimbursement/
waiver | | Net
investment
income
(loss) | |
Class I | |
Year ended 6/30/2022 | | $ | 43.29 | | | $ | 0.41 | | | $ | (4.40 | ) | | $ | (3.99 | ) | | $ | (0.38 | ) | | $ | — | | | $ | (0.38 | ) | | $ | 38.92 | | | | –9.31 | % | | $ | 214,692 | | | | 0.95 | % | | | 0.97 | % | | | 0.93 | % | |
Year ended 6/30/2021 | | | 26.81 | | | | 0.41 | | | | 16.64 | | | | 17.05 | | | | (0.57 | ) | | | — | | | | (0.57 | ) | | | 43.29 | | | | 64.20 | | | | 293,318 | | | | 0.95 | | | | 0.98 | | | | 1.19 | | |
Year ended 6/30/2020 | | | 33.29 | | | | 0.53 | | | | (6.44 | ) | | | (5.91 | ) | | | (0.57 | ) | | | — | | | | (0.57 | ) | | | 26.81 | | | | –18.18 | | | | 257,544 | | | | 0.95 | | | | 0.95 | | | | 1.72 | | |
Year ended 6/30/2019 | | | 33.57 | | | | 0.51 | | | | 0.19 | | | | 0.70 | | | | (0.64 | ) | | | (0.34 | ) | | | (0.98 | ) | | | 33.29 | | | | 2.51 | | | | 357,191 | | | | 0.95 | | | | 0.95 | | | | 1.56 | | |
Year ended 6/30/2018 | | | 31.04 | | | | 0.42 | | | | 2.67 | | | | 3.09 | | | | (0.56 | ) | | | — | | | | (0.56 | ) | | | 33.57 | | | | 10.01 | | | | 276,930 | | | | 1.00 | | | | 1.00 | | | | 1.28 | | |
Class A | |
Year ended 6/30/2022 | | | 43.04 | | | | 0.31 | | | | (4.38 | ) | | | (4.07 | ) | | | (0.31 | ) | | | — | | | | (0.31 | ) | | | 38.66 | | | | –9.53 | | | | 150,260 | | | | 1.18 | | | | 1.18 | | | | 0.71 | | |
Year ended 6/30/2021 | | | 26.67 | | | | 0.33 | | | | 16.56 | | | | 16.89 | | | | (0.52 | ) | | | — | | | | (0.52 | ) | | | 43.04 | | | | 63.82 | | | | 149,051 | | | | 1.18 | | | | 1.18 | | | | 0.96 | | |
Year ended 6/30/2020 | | | 33.14 | | | | 0.46 | | | | (6.45 | ) | | | (5.99 | ) | | | (0.48 | ) | | | — | | | | (0.48 | ) | | | 26.67 | | | | –18.42 | | | | 113,504 | | | | 1.20 | | | | 1.20 | | | | 1.49 | | |
Year ended 6/30/2019 | | | 33.36 | | | | 0.41 | | | | 0.22 | | | | 0.63 | | | | (0.51 | ) | | | (0.34 | ) | | | (0.85 | ) | | | 33.14 | | | | 2.24 | | | | 116,354 | | | | 1.20 | | | | 1.20 | | | | 1.26 | | |
Year ended 6/30/2018 | | | 30.85 | | | | 0.34 | | | | 2.65 | | | | 2.99 | | | | (0.48 | ) | | | — | | | | (0.48 | ) | | | 33.36 | | | | 9.72 | | | | 131,276 | | | | 1.25 | | | | 1.25 | | | | 1.03 | | |
Class C | |
Year ended 6/30/2022 | | | 42.57 | | | | (0.02 | ) | | | (4.31 | ) | | | (4.33 | ) | | | — | | | | — | | | | — | | | | 38.24 | | | | –10.17 | | | | 4,691 | | | | 1.91 | | | | 1.91 | | | | (0.05 | ) | |
Year ended 6/30/2021 | | | 26.26 | | | | 0.05 | | | | 16.36 | | | | 16.41 | | | | (0.10 | ) | | | — | | | | (0.10 | ) | | | 42.57 | | | | 62.60 | | | | 7,467 | | | | 1.92 | | | | 1.92 | | | | 0.16 | | |
Year ended 6/30/2020 | | | 32.59 | | | | 0.24 | | | | (6.36 | ) | | | (6.12 | ) | | | (0.21 | ) | | | — | | | | (0.21 | ) | | | 26.26 | | | | –18.93 | | | | 9,567 | | | | 1.88 | | | | 1.88 | | | | 0.78 | | |
Year ended 6/30/2019 | | | 32.68 | | | | 0.17 | | | | 0.25 | | | | 0.42 | | | | (0.17 | ) | | | (0.34 | ) | | | (0.51 | ) | | | 32.59 | | | | 1.49 | | | | 14,948 | | | | 1.95 | | | | 1.95 | | | | 0.55 | | |
Year ended 6/30/2018 | | | 30.16 | | | | 0.08 | | | | 2.61 | | | | 2.69 | | | | (0.17 | ) | | | — | | | | (0.17 | ) | | | 32.68 | | | | 8.92 | | | | 14,161 | | | | 2.00 | | | | 2.00 | | | | 0.26 | | |
Class Z | |
Year ended 6/30/2022 | | | 43.30 | | | | 0.46 | | | | (4.40 | ) | | | (3.94 | ) | | | (0.44 | ) | | | — | | | | (0.44 | ) | | | 38.92 | | | | –9.22 | | | | 35,081 | | | | 0.86 | | | | 0.86 | | | | 1.07 | | |
Year ended 6/30/2021 | | | 26.82 | | | | 0.47 | | | | 16.63 | | | | 17.10 | | | | (0.62 | ) | | | — | | | | (0.62 | ) | | | 43.30 | | | | 64.34 | | | | 12,958 | | | | 0.84 | | | | 0.84 | | | | 1.33 | | |
Period from
9/30/20193 to
6/30/2020 | | | 33.12 | | | | 0.49 | | | | (6.19 | ) | | | (5.70 | ) | | | (0.60 | ) | | | — | | | | (0.60 | ) | | | 26.82 | | | | –17.65 | | | | 6,943 | | | | 0.834 | | | | 0.834 | | | | 2.374 | | |
| | | Year Ended June 30, | |
| | | 2022 | | 2021 | | 2020 | | 2019 | | 2018 | |
Portfolio turnover rate | | | 35 | % | | | 25 | % | | | 29 | % | | | 23 | % | | | 41 | % | |
1 Net investment income (loss) per share has been calculated based on average shares outstanding during the period.
2 Total returns exclude the effects of sales charges. The Fund's investment advisor may have waived a portion of its advisory fee and/or reimbursed a portion of the Fund's expenses. Without such waiver and/or reimbursement, the Fund's performance would have been lower. Returns for periods less than one year are not annualized.
3 Commencement of operations.
4 Annualized.
The accompanying notes are an integral part of these financial statements.
62
Financial Highlights
The following per share data and ratios have been derived from information provided in the financial statements.
| | | | | Income (loss) from investment operations | | Dividends and distributions | | | | Ratios to Average Net Assets | |
Mid-Cap Value Fund | | Net asset
value,
beginning
of period | | Net
investment
income
(loss)1 | | Net gains
(losses) on
securities
(both
realized and
unrealized) | | Total from
investment
operations | | Dividends
(from net
investment
income) | | Distributions
(from
capital
gains) | | Total
distributions | | Net asset
value, end
of period | | Total
return2 | | Net assets,
end of
period (in
thousands) | | Expenses,
net of
reimbursement/
waiver | | Expenses,
before
reimbursement/
waiver | | Net
investment
income
(loss) | |
Class I | |
Year ended 6/30/2022 | | $ | 42.23 | | | $ | 0.22 | | | $ | (1.18 | ) | | $ | (0.96 | ) | | $ | (0.56 | ) | | $ | — | | | $ | (0.56 | ) | | $ | 40.71 | | | | –2.34 | % | | $ | 286,887 | | | | 1.01 | % | | | 1.01 | % | | | 0.51 | % | |
Year ended 6/30/2021 | | | 22.27 | | | | 0.48 | | | | 20.20 | | | | 20.68 | | | | (0.72 | ) | | | — | | | | (0.72 | ) | | | 42.23 | | | | 93.96 | | | | 302,584 | | | | 1.04 | | | | 1.04 | | | | 1.50 | | |
Year ended 6/30/2020 | | | 33.10 | | | | 0.51 | | | | (10.82 | ) | | | (10.31 | ) | | | (0.52 | ) | | | — | | | | (0.52 | ) | | | 22.27 | | | | –31.62 | | | | 202,902 | | | | 1.04 | | | | 1.04 | | | | 1.73 | | |
Year ended 6/30/2019 | | | 39.68 | | | | 0.24 | | | | (5.94 | ) | | | (5.70 | ) | | | (0.33 | ) | | | (0.55 | ) | | | (0.88 | ) | | | 33.10 | | | | –14.29 | | | | 1,044,280 | | | | 1.00 | | | | 1.00 | | | | 0.67 | | |
Year ended 6/30/2018 | | | 37.13 | | | | 0.11 | | | | 4.96 | | | | 5.07 | | | | (0.15 | ) | | | (2.37 | ) | | | (2.52 | ) | | | 39.68 | | | | 14.32 | | | | 1,609,002 | | | | 0.99 | | | | 0.99 | | | | 0.28 | | |
Class A | |
Year ended 6/30/2022 | | | 41.52 | | | | 0.13 | | | | (1.15 | ) | | | (1.02 | ) | | | (0.51 | ) | | | — | | | | (0.51 | ) | | | 39.99 | | | | –2.54 | | | | 111,771 | | | | 1.21 | | | | 1.21 | | | | 0.31 | | |
Year ended 6/30/2021 | | | 21.93 | | | | 0.43 | | | | 19.87 | | | | 20.30 | | | | (0.71 | ) | | | — | | | | (0.71 | ) | | | 41.52 | | | | 93.63 | | | | 118,947 | | | | 1.23 | | | | 1.23 | | | | 1.35 | | |
Year ended 6/30/2020 | | | 32.53 | | | | 0.43 | | | | (10.65 | ) | | | (10.22 | ) | | | (0.38 | ) | | | — | | | | (0.38 | ) | | | 21.93 | | | | –31.78 | | | | 71,919 | | | | 1.22 | | | | 1.22 | | | | 1.56 | | |
Year ended 6/30/2019 | | | 39.03 | | | | 0.15 | | | | (5.82 | ) | | | (5.67 | ) | | | (0.28 | ) | | | (0.55 | ) | | | (0.83 | ) | | | 32.53 | | | | –14.48 | | | | 159,676 | | | | 1.25 | | | | 1.25 | | | | 0.43 | | |
Year ended 6/30/2018 | | | 36.57 | | | | 0.01 | | | | 4.88 | | | | 4.89 | | | | (0.06 | ) | | | (2.37 | ) | | | (2.43 | ) | | | 39.03 | | | | 14.05 | | | | 230,105 | | | | 1.24 | | | | 1.24 | | | | 0.03 | | |
Class C | |
Year ended 6/30/2022 | | | 35.80 | | | | (0.17 | ) | | | (1.01 | ) | | | (1.18 | ) | | | (0.01 | ) | | | — | | | | (0.01 | ) | | | 34.61 | | | | –3.29 | | | | 4,480 | | | | 1.97 | | | | 1.97 | | | | (0.46 | ) | |
Year ended 6/30/2021 | | | 19.01 | | | | 0.15 | | | | 17.19 | | | | 17.34 | | | | (0.55 | ) | | | — | | | | (0.55 | ) | | | 35.80 | | | | 92.13 | | | | 8,206 | | | | 2.01 | | | | 2.01 | | | | 0.57 | | |
Year ended 6/30/2020 | | | 28.12 | | | | 0.20 | | | | (9.27 | ) | | | (9.07 | ) | | | (0.04 | ) | | | — | | | | (0.04 | ) | | | 19.01 | | | | –32.29 | | | | 8,389 | | | | 1.96 | | | | 1.96 | | | | 0.82 | | |
Year ended 6/30/2019 | | | 33.93 | | | | (0.10 | ) | | | (5.05 | ) | | | (5.15 | ) | | | (0.11 | ) | | | (0.55 | ) | | | (0.66 | ) | | | 28.12 | | | | –15.15 | | | | 24,447 | | | | 2.00 | | | | 2.00 | | | | (0.33 | ) | |
Year ended 6/30/2018 | | | 32.26 | | | | (0.24 | ) | | | 4.28 | | | | 4.04 | | | | — | | | | (2.37 | ) | | | (2.37 | ) | | | 33.93 | | | | 13.20 | | | | 39,383 | | | | 1.99 | | | | 1.99 | | | | (0.72 | ) | |
Class Z | |
Year ended 6/30/2022 | | | 42.25 | | | | 0.29 | | | | (1.19 | ) | | | (0.90 | ) | | | (0.63 | ) | | | — | | | | (0.63 | ) | | | 40.72 | | | | –2.23 | | | | 30,870 | | | | 0.87 | | | | 0.87 | | | | 0.65 | | |
Year ended 6/30/2021 | | | 22.26 | | | | 0.56 | | | | 20.19 | | | | 20.75 | | | | (0.76 | ) | | | — | | | | (0.76 | ) | | | 42.25 | | | | 94.35 | | | | 22,879 | | | | 0.88 | | | | 0.88 | | | | 1.75 | | |
Period from
9/30/20193 to
6/30/2020 | | | 30.67 | | | | 0.40 | | | | (8.25 | ) | | | (7.85 | ) | | | (0.56 | ) | | | — | | | | (0.56 | ) | | | 22.26 | | | | –26.16 | | | | 15,976 | | | | 0.894 | | | | 0.894 | | | | 2.124 | | |
| | | Year Ended June 30, | |
| | | 2022 | | 2021 | | 2020 | | 2019 | | 2018 | |
Portfolio turnover rate | | | 41 | % | | | 37 | % | | | 27 | % | | | 34 | % | | | 32 | % | |
| | | | | Income (loss) from investment operations | | Dividends and distributions | | | | Ratios to Average Net Assets | |
Small Cap Value Fund | | Net asset
value,
beginning
of period | | Net
investment
income
(loss)1 | | Net gains
(losses) on
securities
(both
realized and
unrealized) | | Total from
investment
operations | | Dividends
(from net
investment
income) | | Distributions
(from
capital
gains) | | Total
distributions | | Net asset
value, end
of period | | Total
return2 | | Net assets,
end of
period (in
thousands) | | Expenses,
net of
reimbursement/
waiver | | Expenses,
before
reimbursement/
waiver | | Net
investment
income
(loss) | |
Class I | |
Year ended 6/30/2022 | | $ | 68.58 | | | $ | 0.27 | | | $ | (2.59 | ) | | $ | (2.32 | ) | | $ | (0.26 | ) | | $ | — | | | $ | (0.26 | ) | | $ | 66.00 | | | | –3.42 | % | | $ | 510,545 | | | | 1.06 | % | | | 1.06 | % | | | 0.38 | % | |
Year ended 6/30/2021 | | | 38.22 | | | | 0.23 | | | | 30.56 | | | | 30.79 | | | | (0.43 | ) | | | — | | | | (0.43 | ) | | | 68.58 | | | | 80.88 | | | | 512,396 | | | | 1.07 | | | | 1.07 | | | | 0.44 | | |
Year ended 6/30/2020 | | | 53.27 | | | | 0.45 | | | | (12.86 | ) | | | (12.41 | ) | | | (0.48 | ) | | | (2.16 | ) | | | (2.64 | ) | | | 38.22 | | | | –24.70 | | | | 335,080 | | | | 1.05 | | | | 1.05 | | | | 0.94 | | |
Year ended 6/30/2019 | | | 63.89 | | | | 0.35 | | | | (6.34 | ) | | | (5.99 | ) | | | (0.33 | ) | | | (4.30 | ) | | | (4.63 | ) | | | 53.27 | | | | –8.97 | | | | 670,391 | | | | 1.03 | | | | 1.03 | | | | 0.61 | | |
Year ended 6/30/2018 | | | 59.31 | | | | 0.29 | | | | 7.35 | | | | 7.64 | | | | (0.28 | ) | | | (2.78 | ) | | | (3.06 | ) | | | 63.89 | | | | 13.33 | | | | 715,194 | | | | 1.02 | | | | 1.02 | | | | 0.47 | | |
Class A | |
Year ended 6/30/2022 | | | 68.24 | | | | 0.16 | | | | (2.58 | ) | | | (2.42 | ) | | | (0.15 | ) | | | — | | | | (0.15 | ) | | | 65.67 | | | | –3.56 | | | | 33,250 | | | | 1.21 | | | | 1.21 | | | | 0.23 | | |
Year ended 6/30/2021 | | | 38.03 | | | | 0.14 | | | | 30.41 | | | | 30.55 | | | | (0.34 | ) | | | — | | | | (0.34 | ) | | | 68.24 | | | | 80.58 | | | | 35,039 | | | | 1.25 | | | | 1.25 | | | | 0.27 | | |
Year ended 6/30/2020 | | | 52.98 | | | | 0.36 | | | | (12.83 | ) | | | (12.47 | ) | | | (0.32 | ) | | | (2.16 | ) | | | (2.48 | ) | | | 38.03 | | | | –24.86 | | | | 26,028 | | | | 1.25 | | | | 1.25 | | | | 0.76 | | |
Year ended 6/30/2019 | | | 63.49 | | | | 0.18 | | | | (6.26 | ) | | | (6.08 | ) | | | (0.13 | ) | | | (4.30 | ) | | | (4.43 | ) | | | 52.98 | | | | –9.20 | | | | 44,240 | | | | 1.28 | | | | 1.28 | | | | 0.32 | | |
Year ended 6/30/2018 | | | 58.93 | | | | 0.12 | | | | 7.32 | | | | 7.44 | | | | (0.10 | ) | | | (2.78 | ) | | | (2.88 | ) | | | 63.49 | | | | 13.05 | | | | 70,928 | | | | 1.27 | | | | 1.27 | | | | 0.20 | | |
Class C | |
Year ended 6/30/2022 | | | 54.55 | | | | (0.27 | ) | | | (2.05 | ) | | | (2.32 | ) | | | — | | | | — | | | | — | | | | 52.23 | | | | –4.25 | | | | 1,157 | | | | 1.94 | | | | 1.94 | | | | (0.48 | ) | |
Year ended 6/30/2021 | | | 30.49 | | | | (0.19 | ) | | | 24.33 | | | | 24.14 | | | | (0.08 | ) | | | — | | | | (0.08 | ) | | | 54.55 | | | | 79.25 | | | | 2,026 | | | | 1.99 | | | | 1.99 | | | | (0.46 | ) | |
Year ended 6/30/2020 | | | 42.94 | | | | 0.02 | | | | (10.31 | ) | | | (10.29 | ) | | | — | | | | (2.16 | ) | | | (2.16 | ) | | | 30.49 | | | | –25.40 | | | | 3,528 | | | | 1.95 | | | | 1.95 | | | | 0.05 | | |
Year ended 6/30/2019 | | | 52.65 | | | | (0.21 | ) | | | (5.20 | ) | | | (5.41 | ) | | | — | | | | (4.30 | ) | | | (4.30 | ) | | | 42.94 | | | | –9.86 | | | | 7,496 | | | | 2.03 | | | | 2.03 | | | | (0.44 | ) | |
Year ended 6/30/2018 | | | 49.60 | | | | (0.28 | ) | | | 6.11 | | | | 5.83 | | | | — | | | | (2.78 | ) | | | (2.78 | ) | | | 52.65 | | | | 12.21 | | | | 13,824 | | | | 2.02 | | | | 2.02 | | | | (0.55 | ) | |
Class Z | |
Year ended 6/30/2022 | | | 68.62 | | | | 0.42 | | | | (2.60 | ) | | | (2.18 | ) | | | (0.40 | ) | | | — | | | | (0.40 | ) | | | 66.04 | | | | –3.22 | | | | 9,394 | | | | 0.86 | | | | 0.86 | | | | 0.59 | | |
Year ended 6/30/2021 | | | 38.23 | | | | 0.35 | | | | 30.55 | | | | 30.90 | | | | (0.51 | ) | | | — | | | | (0.51 | ) | | | 68.62 | | | | 81.23 | | | | 10,246 | | | | 0.87 | | | | 0.87 | | | | 0.65 | | |
Period from
9/30/20193 to
6/30/2020 | | | 52.15 | | | | 0.56 | | | | (11.79 | ) | | | (11.23 | ) | | | (0.53 | ) | | | (2.16 | ) | | | (2.69 | ) | | | 38.23 | | | | –22.99 | | | | 6,540 | | | | 0.874 | | | | 0.874 | | | | 1.724 | | |
| | | Year Ended June 30, | |
| | | 2022 | | 2021 | | 2020 | | 2019 | | 2018 | |
Portfolio turnover rate | | | 49 | % | | | 36 | % | | | 34 | % | | | 40 | % | | | 29 | % | |
1 Net investment income (loss) per share has been calculated based on average shares outstanding during the period.
2 Total returns exclude the effects of sales charges. The Fund's investment advisor may have waived a portion of its advisory fee and/or reimbursed a portion of the Fund's expenses. Without such waiver and/or reimbursement, the Fund's performance would have been lower. Returns for periods less than one year are not annualized.
3 Commencement of operations.
4 Annualized.
The accompanying notes are an integral part of these financial statements.
63
Financial Highlights
The following per share data and ratios have been derived from information provided in the financial statements.
| | | | | Income (loss) from investment operations | | Dividends and distributions | | | | Ratios to Average Net Assets | |
Small Cap Diversified
Value Fund | | Net asset
value,
beginning
of period | | Net
investment
income1 | | Net gains
(losses) on
securities
(both
realized and
unrealized) | | Total from
investment
operations | | Dividends
(from net
investment
income) | | Distributions
(from
capital
gains) | | Total
distributions | | Net asset
value, end
of period | | Total
return2 | | Net assets,
end of
period (in
thousands) | | Expenses,
net of
reimbursement/
waiver | | Expenses,
before
reimbursement/
waiver | | Net
investment
income | |
Class I | |
Year ended 6/30/2022 | | $ | 13.99 | | | $ | 0.17 | | | $ | (1.38 | ) | | $ | (1.21 | ) | | $ | (0.14 | ) | | $ | (0.73 | ) | | $ | (0.87 | ) | | $ | 11.91 | | | | –9.34 | % | | $ | 461,866 | | | | 0.80 | % | | | 0.87 | % | | | 1.26 | % | |
Year ended 6/30/2021 | | | 7.88 | | | | 0.14 | | | | 6.07 | | | | 6.21 | | | | (0.10 | ) | | | — | | | | (0.10 | ) | | | 13.99 | | | | 79.26 | | | | 427,708 | | | | 0.80 | | | | 0.87 | | | | 1.21 | | |
Year ended 6/30/2020 | | | 10.08 | | | | 0.12 | | | | (2.23 | ) | | | (2.11 | ) | | | (0.09 | ) | | | — | | | | (0.09 | ) | | | 7.88 | | | | –21.14 | | | | 143,415 | | | | 0.82 | | | | 0.92 | | | | 1.37 | | |
Year ended 6/30/2019 | | | 12.21 | | | | 0.10 | | | | (1.30 | ) | | | (1.20 | ) | | | (0.08 | ) | | | (0.85 | ) | | | (0.93 | ) | | | 10.08 | | | | –9.23 | | | | 95,405 | | | | 0.90 | | | | 1.06 | | | | 0.91 | | |
Year ended 6/30/2018 | | | 12.06 | | | | 0.10 | | | | 1.85 | | | | 1.95 | | | | (0.05 | ) | | | (1.75 | ) | | | (1.80 | ) | | | 12.21 | | | | 17.48 | | | | 40,128 | | | | 0.90 | | | | 1.45 | | | | 0.80 | | |
Class A | |
Year ended 6/30/2022 | | | 13.91 | | | | 0.13 | | | | (1.36 | ) | | | (1.23 | ) | | | (0.12 | ) | | | (0.73 | ) | | | (0.85 | ) | | | 11.83 | | | | –9.57 | | | | 5,839 | | | | 1.05 | | | | 1.15 | | | | 0.98 | | |
Year ended 6/30/2021 | | | 7.83 | | | | 0.11 | | | | 6.06 | | | | 6.17 | | | | (0.09 | ) | | | — | | | | (0.09 | ) | | | 13.91 | | | | 79.09 | | | | 8,668 | | | | 1.05 | | | | 1.14 | | | | 0.96 | | |
Year ended 6/30/2020 | | | 10.03 | | | | 0.10 | | | | (2.24 | ) | | | (2.14 | ) | | | (0.06 | ) | | | — | | | | (0.06 | ) | | | 7.83 | | | | –21.48 | | | | 1,535 | | | | 1.07 | | | | 1.18 | | | | 1.06 | | |
Year ended 6/30/2019 | | | 12.14 | | | | 0.06 | | | | (1.26 | ) | | | (1.20 | ) | | | (0.06 | ) | | | (0.85 | ) | | | (0.91 | ) | | | 10.03 | | | | –9.35 | | | | 2,875 | | | | 1.15 | | | | 1.36 | | | | 0.55 | | |
Year ended 6/30/2018 | | | 12.01 | | | | 0.07 | | | | 1.84 | | | | 1.91 | | | | (0.03 | ) | | | (1.75 | ) | | | (1.78 | ) | | | 12.14 | | | | 17.18 | | | | 2,835 | | | | 1.15 | | | | 1.70 | | | | 0.58 | | |
Class Z | |
Year ended 6/30/2022 | | | 13.99 | | | | 0.18 | | | | (1.39 | ) | | | (1.21 | ) | | | (0.15 | ) | | | (0.73 | ) | | | (0.88 | ) | | | 11.90 | | | | –9.38 | | | | 2,458 | | | | 0.76 | | | | 0.76 | | | | 1.33 | | |
Year ended 6/30/2021 | | | 7.87 | | | | 0.15 | | | | 6.07 | | | | 6.22 | | | | (0.10 | ) | | | — | | | | (0.10 | ) | | | 13.99 | | | | 79.45 | | | | 1,186 | | | | 0.77 | | | | 0.77 | | | | 1.25 | | |
Period from
9/30/20193 to
6/30/2020 | | | 10.02 | | | | 0.09 | | | | (2.14 | ) | | | (2.05 | ) | | | (0.10 | ) | | | — | | | | (0.10 | ) | | | 7.87 | | | | –20.75 | | | | 40 | | | | 0.804 | | | | 0.844 | | | | 1.414 | | |
| | | Year Ended June 30, | |
| | | 2022 | | 2021 | | 2020 | | 2019 | | 2018 | |
Portfolio turnover rate | | | 38 | % | | | 42 | % | | | 53 | % | | | 84 | % | | | 95 | % | |
| | | | | Income (loss) from investment operations | | Dividends and distributions | | | | Ratios to Average Net Assets | |
Global Value Fund | | Net asset
value,
beginning
of year | | Net
investment
income1 | | Net gains
(losses) on
securities
(both
realized and
unrealized) | | Total from
investment
operations | | Dividends
(from net
investment
income) | | Distributions
(from
capital
gains) | | Total
distributions | | Net asset
value, end
of year | | Total
return2 | | Net assets,
end of
year (in
thousands) | | Expenses,
net of
reimbursement/
waiver | | Expenses,
before
reimbursement/
waiver | | Net
investment
income | |
Class I | |
Year ended 6/30/2022 | | $ | 14.44 | | | $ | 0.14 | | | $ | (1.84 | ) | | $ | (1.70 | ) | | $ | (0.10 | ) | | $ | — | | | $ | (0.10 | ) | | $ | 12.64 | | | | –11.86 | % | | $ | 31,800 | | | | 0.95 | % | | | 1.22 | % | | | 0.98 | % | |
Year ended 6/30/2021 | | | 8.96 | | | | 0.10 | | | | 5.56 | | | | 5.66 | | | | (0.18 | ) | | | — | | | | (0.18 | ) | | | 14.44 | | | | 63.58 | | | | 36,025 | | | | 0.95 | | | | 1.29 | | | | 0.83 | | |
Year ended 6/30/2020 | | | 11.55 | | | | 0.14 | | | | (2.42 | ) | | | (2.28 | ) | | | (0.13 | ) | | | (0.18 | ) | | | (0.31 | ) | | | 8.96 | | | | –20.42 | | | | 25,148 | | | | 0.95 | | | | 1.32 | | | | 1.31 | | |
Year ended 6/30/2019 | | | 13.30 | | | | 0.23 | | | | (0.94 | ) | | | (0.71 | ) | | | (0.14 | ) | | | (0.90 | ) | | | (1.04 | ) | | | 11.55 | | | | –4.57 | | | | 39,749 | | | | 0.96 | | | | 1.62 | | | | 2.02 | | |
Year ended 6/30/2018 | | | 12.82 | | | | 0.11 | | | | 1.09 | | | | 1.20 | | | | (0.13 | ) | | | (0.59 | ) | | | (0.72 | ) | | | 13.30 | | | | 9.59 | | | | 8,987 | | | | 1.10 | | | | 2.87 | | | | 0.83 | | |
Class A | |
Year ended 6/30/2022 | | | 14.43 | | | | 0.11 | | | | (1.84 | ) | | | (1.73 | ) | | | (0.07 | ) | | | — | | | | (0.07 | ) | | | 12.63 | | | | –12.07 | | | | 1,290 | | | | 1.20 | | | | 1.46 | | | | 0.73 | | |
Year ended 6/30/2021 | | | 8.96 | | | | 0.08 | | | | 5.54 | | | | 5.62 | | | | (0.15 | ) | | | — | | | | (0.15 | ) | | | 14.43 | | | | 63.05 | | | | 1,484 | | | | 1.20 | | | | 1.48 | | | | 0.58 | | |
Year ended 6/30/2020 | | | 11.55 | | | | 0.11 | | | | (2.41 | ) | | | (2.30 | ) | | | (0.11 | ) | | | (0.18 | ) | | | (0.29 | ) | | | 8.96 | | | | –20.57 | | | | 168 | | | | 1.20 | | | | 1.62 | | | | 1.05 | | |
Year ended 6/30/2019 | | | 13.28 | | | | 0.09 | | | | (0.83 | ) | | | (0.74 | ) | | | (0.09 | ) | | | (0.90 | ) | | | (0.99 | ) | | | 11.55 | | | | –4.85 | | | | 238 | | | | 1.24 | | | | 2.64 | | | | 0.72 | | |
Year ended 6/30/2018 | | | 12.80 | | | | 0.07 | | | | 1.10 | | | | 1.17 | | | | (0.10 | ) | | | (0.59 | ) | | | (0.69 | ) | | | 13.28 | | | | 9.36 | | | | 732 | | | | 1.35 | | | | 3.12 | | | | 0.55 | | |
| | | Year Ended June 30, | |
| | | 2022 | | 2021 | | 2020 | | 2019 | | 2018 | |
Portfolio turnover rate | | | 38 | % | | | 39 | % | | | 36 | % | | | 36 | % | | | 43 | % | |
1 Net investment income per share has been calculated based on average shares outstanding during the period.
2 Total returns exclude the effects of sales charges. The Fund's investment advisor may have waived a portion of its advisory fee and/or reimbursed a portion of the Fund's expenses. Without such waiver and/or reimbursement, the Fund's performance would have been lower. Returns for periods less than one year are not annualized.
3 Commencement of operations.
4 Annualized.
The accompanying notes are an integral part of these financial statements.
64
Financial Highlights
The following per share data and ratios have been derived from information provided in the financial statements.
| | | | | Income (loss) from investment operations | | Dividends and distributions | | | | Ratios to Average Net Assets | |
International
Value Fund | | Net asset
value,
beginning
of year | | Net
investment
income1 | | Net gains
(losses) on
securities
(both
realized and
unrealized) | | Total from
investment
operations | | Dividends
(from net
investment
income) | | Distributions
(from
capital
gains) | | Total
distributions | | Net asset
value, end
of year | | Total
return2 | | Net assets,
end of
year (in
thousands) | | Expenses,
net of
reimbursement/
waiver | | Expenses,
before
reimbursement/
waiver | | Net
investment
income | |
Class I | |
Year ended 6/30/2022 | | $ | 11.66 | | | $ | 0.27 | | | $ | (1.41 | ) | | $ | (1.14 | ) | | $ | (0.17 | ) | | $ | — | | | $ | (0.17 | ) | | $ | 10.35 | | | | –9.82 | % | | $ | 2,708 | | | | 0.95 | % | | | 4.87 | % | | | 2.35 | % | |
Year ended 6/30/2021 | | | 7.59 | | | | 0.15 | | | | 4.04 | | | | 4.19 | | | | (0.12 | ) | | | — | | | | (0.12 | ) | | | 11.66 | | | | 55.37 | | | | 2,554 | | | | 0.95 | | | | 5.13 | | | | 1.56 | | |
Year ended 6/30/2020 | | | 9.77 | | | | 0.13 | | | | (1.96 | ) | | | (1.83 | ) | | | (0.19 | ) | | | (0.16 | ) | | | (0.35 | ) | | | 7.59 | | | | –19.66 | | | | 1,874 | | | | 0.95 | | | | 6.10 | | | | 1.39 | | |
Year ended 6/30/2019 | | | 11.57 | | | | 0.19 | | | | (1.27 | ) | | | (1.08 | ) | | | (0.14 | ) | | | (0.58 | ) | | | (0.72 | ) | | | 9.77 | | | | –9.04 | | | | 2,334 | | | | 0.99 | | | | 5.94 | | | | 1.85 | | |
Year ended 6/30/2018 | | | 11.85 | | | | 0.11 | | | | 0.31 | | | | 0.42 | | | | (0.13 | ) | | | (0.57 | ) | | | (0.70 | ) | | | 11.57 | | | | 3.50 | | | | 2,543 | | | | 1.15 | | | | 6.01 | | | | 0.90 | | |
| | | Year Ended June 30, | |
| | | 2022 | | 2021 | | 2020 | | 2019 | | 2018 | |
Portfolio turnover rate | | | 20 | % | | | 29 | % | | | 30 | % | | | 42 | % | | | 33 | % | |
| | | | | Income (loss) from investment operations | | Dividends and distributions | | | | Ratios to Average Net Assets | |
International Small Cap
Diversified Value Fund | | Net asset
value,
beginning
of period | | Net
investment
income1 | | Net gains
(losses) on
securities
(both
realized and
unrealized) | | Total from
investment
operations | | Dividends
(from net
investment
income) | | Distributions
(from
capital
gains) | | Total
distributions | | Net asset
value, end
of period | | Total
return2 | | Net assets,
end of
period (in
thousands) | | Expenses,
net of
reimbursement/
waiver | | Expenses,
before
reimbursement/
waiver | | Net
investment
income | |
Class I | |
Year ended 6/30/2022 | | $ | 14.83 | | | $ | 0.25 | | | $ | (2.01 | ) | | $ | (1.76 | ) | | $ | (0.39 | ) | | $ | (2.39 | ) | | $ | (2.78 | ) | | $ | 10.29 | | | | –14.28 | % | | $ | 5,709 | | | | 0.99 | % | | | 4.23 | % | | | 1.92 | % | |
Period from
6/30/20203 to
6/30/2021 | | | 10.00 | | | | 0.24 | | | | 4.87 | | | | 5.11 | | | | (0.08 | ) | | | (0.20 | ) | | | (0.28 | ) | | | 14.83 | | | | 51.58 | | | | 6,661 | | | | 0.99 | | | | 4.27 | | | | 1.91 | | |
| | | Year Ended June 30, | |
| | | 2022 | | 2021 | |
Portfolio turnover rate | | | 45 | % | | | 63 | % | |
1 Net investment income per share has been calculated based on average shares outstanding during the period.
2 Total returns exclude the effects of sales charges. The Fund's investment advisor may have waived a portion of its advisory fee and/or reimbursed a portion of the Fund's expenses. Without such waiver and/or reimbursement, the Fund's performance would have been lower.
3 Commencement of operations.
The accompanying notes are an integral part of these financial statements.
65
Financial Highlights
The following per share data and ratios have been derived from information provided in the financial statements.
| | | | | Income (loss) from investment operations | | Dividends and distributions | | | | Ratios to Average Net Assets | |
Value Opportunities
Fund | | Net asset
value,
beginning
of period | | Net
investment
income
(loss)1 | | Net gains
(losses) on
securities
(both
realized and
unrealized) | | Total from
investment
operations | | Dividends
(from net
investment
income) | | Distributions
(from
capital
gains) | | Total
distributions | | Net asset
value, end
of period | | Total
return2 | | Net assets,
end of
period (in
thousands) | | Expenses,
net of
reimbursement/
waiver | | Expenses,
before
reimbursement/
waiver | | Net
investment
income
(loss) | |
Class I | |
Year ended 6/30/2022 | | $ | 37.42 | | | $ | 0.16 | | | $ | (3.67 | ) | | $ | (3.51 | ) | | $ | (0.45 | ) | | $ | (4.37 | ) | | $ | (4.82 | ) | | $ | 29.09 | | | | –11.50 | % | | $ | 326,559 | | | | 0.94 | % | | | 0.94 | % | | | 0.44 | % | |
Year ended 6/30/2021 | | | 22.61 | | | | 0.50 | | | | 15.06 | | | | 15.56 | | | | (0.75 | ) | | | — | | | | (0.75 | ) | | | 37.42 | | | | 69.77 | | | | 390,241 | | | | 0.94 | | | | 0.94 | | | | 1.69 | | |
Year ended 6/30/2020 | | | 28.08 | | | | 0.49 | | | | (5.28 | ) | | | (4.79 | ) | | | (0.32 | ) | | | (0.36 | ) | | | (0.68 | ) | | | 22.61 | | | | –17.56 | | | | 401,552 | | | | 0.97 | | | | 0.97 | | | | 1.88 | | |
Year ended 6/30/2019 | | | 30.38 | | | | 0.30 | | | | 0.09 | | | | 0.39 | | | | (0.31 | ) | | | (2.38 | ) | | | (2.69 | ) | | | 28.08 | | | | 2.45 | | | | 588,097 | | | | 0.96 | | | | 0.96 | | | | 1.05 | | |
Year ended 6/30/2018 | | | 27.99 | | | | 0.40 | | | | 2.93 | | | | 3.33 | | | | (0.53 | ) | | | (0.41 | ) | | | (0.94 | ) | | | 30.38 | | | | 12.11 | | | | 453,184 | | | | 0.97 | | | | 0.97 | | | | 1.36 | | |
Class A | |
Year ended 6/30/2022 | | | 37.43 | | | | 0.07 | | | | (3.68 | ) | | | (3.61 | ) | | | (0.36 | ) | | | (4.37 | ) | | | (4.73 | ) | | | 29.09 | | | | –11.72 | | | | 70,350 | | | | 1.20 | | | | 1.20 | | | | 0.19 | | |
Year ended 6/30/2021 | | | 22.66 | | | | 0.43 | | | | 15.06 | | | | 15.49 | | | | (0.72 | ) | | | — | | | | (0.72 | ) | | | 37.43 | | | | 69.24 | | | | 83,243 | | | | 1.24 | | | | 1.24 | | | | 1.43 | | |
Year ended 6/30/2020 | | | 28.12 | | | | 0.43 | | | | (5.29 | ) | | | (4.86 | ) | | | (0.24 | ) | | | (0.36 | ) | | | (0.60 | ) | | | 22.66 | | | | –17.73 | | | | 72,162 | | | | 1.20 | | | | 1.20 | | | | 1.64 | | |
Year ended 6/30/2019 | | | 30.40 | | | | 0.22 | | | | 0.10 | | | | 0.32 | | | | (0.22 | ) | | | (2.38 | ) | | | (2.60 | ) | | | 28.12 | | | | 2.18 | | | | 131,050 | | | | 1.21 | | | | 1.21 | | | | 0.77 | | |
Year ended 6/30/2018 | | | 28.00 | | | | 0.31 | | | | 2.95 | | | | 3.26 | | | | (0.45 | ) | | | (0.41 | ) | | | (0.86 | ) | | | 30.40 | | | | 11.84 | | | | 136,325 | | | | 1.22 | | | | 1.22 | | | | 1.07 | | |
Class C | |
Year ended 6/30/2022 | | | 34.31 | | | | (0.18 | ) | | | (3.31 | ) | | | (3.49 | ) | | | (0.08 | ) | | | (4.37 | ) | | | (4.45 | ) | | | 26.37 | | | | –12.34 | | | | 19,575 | | | | 1.91 | | | | 1.91 | | | | (0.55 | ) | |
Year ended 6/30/2021 | | | 20.87 | | | | 0.21 | | | | 13.83 | | | | 14.04 | | | | (0.60 | ) | | | — | | | | (0.60 | ) | | | 34.31 | | | | 68.05 | | | | 27,089 | | | | 1.93 | | | | 1.93 | | | | 0.76 | | |
Year ended 6/30/2020 | | | 25.94 | | | | 0.23 | | | | (4.90 | ) | | | (4.67 | ) | | | (0.04 | ) | | | (0.36 | ) | | | (0.40 | ) | | | 20.87 | | | | –18.32 | | | | 26,951 | | | | 1.91 | | | | 1.91 | | | | 0.94 | | |
Year ended 6/30/2019 | | | 28.22 | | | | 0.01 | | | | 0.10 | | | | 0.11 | | | | (0.01 | ) | | | (2.38 | ) | | | (2.39 | ) | | | 25.94 | | | | 1.44 | | | | 47,021 | | | | 1.96 | | | | 1.96 | | | | 0.02 | | |
Year ended 6/30/2018 | | | 26.04 | | | | 0.08 | | | | 2.74 | | | | 2.82 | | | | (0.23 | ) | | | (0.41 | ) | | | (0.64 | ) | | | 28.22 | | | | 10.99 | | | | 49,624 | | | | 1.97 | | | | 1.97 | | | | 0.30 | | |
Class Z | |
Year ended 6/30/2022 | | | 37.43 | | | | 0.19 | | | | (3.68 | ) | | | (3.49 | ) | | | (0.48 | ) | | | (4.37 | ) | | | (4.85 | ) | | | 29.09 | | | | –11.40 | | | | 40,582 | | | | 0.86 | | | | 0.86 | | | | 0.52 | | |
Year ended 6/30/2021 | | | 22.62 | | | | 0.55 | | | | 15.04 | | | | 15.59 | | | | (0.78 | ) | | | — | | | | (0.78 | ) | | | 37.43 | | | | 69.86 | | | | 43,886 | | | | 0.87 | | | | 0.87 | | | | 1.81 | | |
Period from
9/30/20193 to
6/30/2020 | | | 27.79 | | | | 0.37 | | | | (4.84 | ) | | | (4.47 | ) | | | (0.34 | ) | | | (0.36 | ) | | | (0.70 | ) | | | 22.62 | | | | –16.61 | | | | 16,207 | | | | 0.854 | | | | 0.854 | | | | 1.954 | | |
| | | Year Ended June 30, | |
| | | 2022 | | 2021 | | 2020 | | 2019 | | 2018 | |
Portfolio turnover rate | | | 75 | % | | | 76 | % | | | 47 | % | | | 60 | % | | | 55 | % | |
| | | | | Income (loss) from investment operations | | Dividends and distributions | | | | Ratios to Average Net Assets | |
High Yield Fund | | Net asset
value,
beginning
of period | | Net
investment
income1 | | Net gains
(losses) on
securities
(both
realized and
unrealized) | | Total from
investment
operations | | Dividends
(from net
investment
income) | | Distributions
(from
capital
gains) | | Total
distributions | | Net asset
value, end
of period | | Total
return2 | | Net assets,
end of
period (in
thousands) | | Expenses,
net of
reimbursement/
waiver | | Expenses,
before
reimbursement/
waiver | | Net
investment
income | |
Class I | |
Year ended 6/30/2022 | | $ | 11.58 | | | $ | 0.51 | | | $ | (1.75 | ) | | $ | (1.24 | ) | | $ | (0.51 | ) | | $ | — | | | $ | (0.51 | ) | | $ | 9.83 | | | | –11.12 | % | | $ | 642,934 | | | | 0.70 | % | | | 0.77 | % | | | 4.56 | % | |
Year ended 6/30/2021 | | | 10.22 | | | | 0.59 | | | | 1.34 | | | | 1.93 | | | | (0.57 | ) | | | — | | | | (0.57 | ) | | | 11.58 | | | | 19.32 | | | | 857,715 | | | | 0.70 | | | | 0.75 | | | | 5.34 | | |
Year ended 6/30/2020 | | | 11.69 | | | | 0.65 | | | | (1.48 | )5 | | | (0.83 | ) | | | (0.64 | ) | | | — | | | | (0.64 | ) | | | 10.22 | | | | –7.26 | | | | 978,398 | | | | 0.70 | | | | 0.75 | | | | 5.85 | | |
Year ended 6/30/2019 | | | 11.90 | | | | 0.69 | | | | (0.21 | )5 | | | 0.48 | | | | (0.69 | ) | | | — | | | | (0.69 | ) | | | 11.69 | | | | 4.19 | | | | 1,825,782 | | | | 0.70 | | | | 0.75 | | | | 5.87 | | |
Year ended 6/30/2018 | | | 12.26 | | | | 0.72 | | | | (0.37 | )5 | | | 0.35 | | | | (0.71 | ) | | | — | | | | (0.71 | ) | | | 11.90 | | | | 2.87 | | | | 1,918,320 | | | | 0.70 | | | | 0.74 | | | | 5.93 | | |
Class A | |
Year ended 6/30/2022 | | | 11.48 | | | | 0.48 | | | | (1.73 | ) | | | (1.25 | ) | | | (0.48 | ) | | | — | | | | (0.48 | ) | | | 9.75 | | | | –11.28 | | | | 29,066 | | | | 0.93 | | | | 0.98 | | | | 4.33 | | |
Year ended 6/30/2021 | | | 10.13 | | | | 0.56 | | | | 1.33 | | | | 1.89 | | | | (0.54 | ) | | | — | | | | (0.54 | ) | | | 11.48 | | | | 19.09 | | | | 39,312 | | | | 0.91 | | | | 0.97 | | | | 5.12 | | |
Year ended 6/30/2020 | | | 11.62 | | | | 0.63 | | | | (1.51 | )5 | | | (0.88 | ) | | | (0.61 | ) | | | — | | | | (0.61 | ) | | | 10.13 | | | | –7.77 | | | | 43,638 | | | | 0.95 | | | | 1.01 | | | | 5.54 | | |
Year ended 6/30/2019 | | | 11.83 | | | | 0.65 | | | | (0.20 | )5 | | | 0.45 | | | | (0.66 | ) | | | — | | | | (0.66 | ) | | | 11.62 | | | | 3.92 | | | | 303,367 | | | | 0.95 | | | | 1.00 | | | | 5.62 | | |
Year ended 6/30/2018 | | | 12.18 | | | | 0.69 | | | | (0.37 | )6 | | | 0.32 | | | | (0.67 | ) | | | — | | | | (0.67 | ) | | | 11.83 | | | | 2.68 | | | | 466,960 | | | | 0.95 | | | | 0.99 | | | | 5.69 | | |
Class C | |
Year ended 6/30/2022 | | | 11.57 | | | | 0.40 | | | | (1.74 | ) | | | (1.34 | ) | | | (0.40 | ) | | | — | | | | (0.40 | ) | | | 9.83 | | | | –11.94 | | | | 1,078 | | | | 1.70 | | | | 1.77 | | | | 3.55 | | |
Year ended 6/30/2021 | | | 10.21 | | | | 0.49 | | | | 1.34 | | | | 1.83 | | | | (0.47 | ) | | | — | | | | (0.47 | ) | | | 11.57 | | | | 18.20 | | | | 1,769 | | | | 1.66 | | | | 1.71 | | | | 4.41 | | |
Year ended 6/30/2020 | | | 11.68 | | | | 0.55 | | | | (1.48 | ) | | | (0.93 | ) | | | (0.54 | ) | | | — | | | | (0.54 | ) | | | 10.21 | | | | –8.13 | | | | 2,596 | | | | 1.64 | | | | 1.69 | | | | 4.95 | | |
Year ended 6/30/2019 | | | 11.89 | | | | 0.57 | | | | (0.21 | ) | | | 0.36 | | | | (0.57 | ) | | | — | | | | (0.57 | ) | | | 11.68 | | | | 3.15 | | | | 3,599 | | | | 1.70 | | | | 1.75 | | | | 4.88 | | |
Year ended 6/30/2018 | | | 12.26 | | | | 0.60 | | | | (0.38 | )5 | | | 0.22 | | | | (0.59 | ) | | | — | | | | (0.59 | ) | | | 11.89 | | | | 1.76 | | | | 3,380 | | | | 1.70 | | | | 1.74 | | | | 4.93 | | |
Class Z | |
Year ended 6/30/2022 | | | 11.58 | | | | 0.52 | | | | (1.75 | ) | | | (1.23 | ) | | | (0.52 | ) | | | — | | | | (0.52 | ) | | | 9.83 | | | | –11.04 | | | | 131,847 | | | | 0.60 | | | | 0.65 | | | | 4.66 | | |
Year ended 6/30/2021 | | | 10.22 | | | | 0.61 | | | | 1.33 | | | | 1.94 | | | | (0.58 | ) | | | — | | | | (0.58 | ) | | | 11.58 | | | | 19.44 | | | | 211,034 | | | | 0.60 | | | | 0.65 | | | | 5.56 | | |
Year ended 6/30/2020 | | | 11.70 | | | | 0.64 | | | | (1.46 | )5 | | | (0.82 | ) | | | (0.66 | ) | | | — | | | | (0.66 | ) | | | 10.22 | | | | –7.24 | | | | 523,848 | | | | 0.60 | | | | 0.65 | | | | 6.02 | | |
Year ended 6/30/2019 | | | 11.90 | | | | 0.70 | | | | (0.20 | ) | | | 0.50 | | | | (0.70 | ) | | | — | | | | (0.70 | ) | | | 11.70 | | | | 4.38 | | | | 401,268 | | | | 0.60 | | | | 0.65 | | | | 5.99 | | |
Period from
3/29/20183 to
6/30/2018 | | | 12.00 | | | | 0.19 | | | | (0.12 | ) | | | 0.07 | | | | (0.17 | ) | | | — | | | | (0.17 | ) | | | 11.90 | | | | 0.59 | | | | 328,769 | | | | 0.604 | | | | 0.704 | | | | 6.544 | | |
| | | Year Ended June 30, | |
| | | 2022 | | 2021 | | 2020 | | 2019 | | 2018 | |
Portfolio turnover rate | | | 40 | % | | | 82 | % | | | 67 | % | | | 41 | % | | | 38 | % | |
1 Net investment income (loss) per share has been calculated based on average shares outstanding during the period.
2 Total returns exclude the effects of sales charges. The Fund's investment advisor may have waived a portion of its advisory fee and/or reimbursed a portion of the Fund's expenses. Without such waiver and/or reimbursement, the Fund's performance would have been lower. Returns for periods less than one year are not annualized.
3 Commencement of operations.
4 Annualized.
5 Redemption fees per share were less than $0.005.
6 Includes redemption fees per share of $0.01.
The accompanying notes are an integral part of these financial statements.
66
Notes to the Financial Statements
JUNE 30, 2022
NOTE 1.
Organization. Hotchkis & Wiley Funds (the "Trust") is registered under the Investment Company Act of 1940, as amended (the "1940 Act"), as an open-end, management investment company. The Trust was organized as a Delaware statutory trust on July 23, 2001 and consists of ten series. The Hotchkis & Wiley Diversified Value Fund, the Hotchkis & Wiley Large Cap Value Fund, the Hotchkis & Wiley Mid-Cap Value Fund, the Hotchkis & Wiley Small Cap Value Fund, the Hotchkis & Wiley Small Cap Diversified Value Fund, the Hotchkis & Wiley Global Value Fund, the Hotchkis & Wiley International Value Fund, the Hotchkis & Wiley International Small Cap Diversified Value Fund and the Hotchkis & Wiley High Yield Fund (collectively, the "H&W Funds") are each a diversified series and the Hotchkis & Wiley Value Opportunities Fund (together with the H&W Funds, hereafter referred to as the "Funds") is a non-diversified series of the Trust. The Trust was organized to acquire the assets and liabilities of the Mercury HW Large Cap Value Fund, the Mercury HW Mid-Cap Value Fund and the Mercury HW Small Cap Value Fund (the "Mercury HW Funds"). On February 4, 2002, the Mercury HW Funds were reorganized into the Trust through a non-taxable exchange. On August 28, 2009, the Hotchkis & Wiley Core Value Fund was renamed the Hotchkis & Wiley Diversified Value Fund and the Hotchkis & Wiley All Cap Value Fund was renamed the Hotchkis & Wiley Value Opportunities Fund.
The Diversified Value Fund, Large Cap Value Fund, Mid-Cap Value Fund, Small Cap Value Fund, Small Cap Diversified Value Fund, Global Value Fund, International Value Fund, Value Opportunities Fund and High Yield Fund have four authorized classes of shares: Class I, Class A, Class C and Class Z. The International Small Cap Diversified Value Fund has three authorized classes of shares: Class I, Class A and Class Z. Class A shares are sold with a front-end sales charge. Class C shares may be subject to a contingent deferred sales charge. Class C shares are automatically converted to Class A shares approximately eight years after purchase and will then be subject to lower distribution and service fees. All classes have identical voting, dividend, liquidation and other rights and the same terms and conditions, except that Class A and Class C shares bear certain expenses related to the distribution and servicing expenditures. Currently, the International Value Fund and International Small Cap Diversified Value Fund are not offering Class A shares to investors; the Small Cap Diversified Value Fund, Global Value Fund and International Value Fund are not offering Class C shares to investors; and the Diversified Value Fund, Global Value Fund, International Value Fund and International Small Cap Diversified Value Fund are not offering Class Z shares to investors.
Significant Accounting Policies. The Funds' financial statements have been prepared in conformity with accounting principles generally accepted in the United States of America ("U.S. GAAP"), which may require the use of management accruals and estimates. Actual results could differ from those estimates and those differences could be significant. Each Fund is an investment company and accordingly follows the investment company accounting and reporting guidance of the Financial Accounting Standards Board ("FASB") Accounting Standard Codification Topic 946 "Financial Services — Investment Companies". The following is a summary of significant accounting policies followed by the Funds.
Security Valuation. Portfolio securities that are listed on a U.S. stock exchange or The Nasdaq Stock Market ("NSM") (including the Nasdaq National Market and the Nasdaq Small Cap Market) are valued at the last reported sale price (or official closing price) on that day as of the close of the New York Stock Exchange (which is generally 4:00 p.m. Eastern time), or, in the absence of recorded sales, at the average of the last bid and asked quotation on such exchange or NSM. Unlisted equity securities that are not included in NSM are valued at the last sale price, or if the last sale price is unavailable, at the average of the quoted bid and asked prices in the over-the-counter market. Foreign equity securities (which are principally traded in markets other than the U.S.) are valued based upon the last reported sale price on the primary exchange or market on which they trade as of the close of business of such exchange or market immediately preceding the time of determining the Fund's net asset value. Fixed-income securities are generally valued on the basis of prices obtained from an approved independent pricing service but may also be valued based on reported transactions on FINRA's Trade Reporting and Compliance Engine (TRACE) or quotations provided by a broker-dealer. The pricing services may provide a price determined by a matrix pricing method or other analytical pricing models. Investments quoted in foreign currency are valued daily in U.S. dollars on the basis of the foreign currency exchange rate prevailing at the time of valuation. Securities and other assets for which market quotations are not readily available are valued at their fair value as determined by Hotchkis & Wiley Capital Management, LLC (the "Advisor") under guidelines established by and under the general supervision and responsibility of the Trust's Board of Trustees (the "Board"). The Board has approved the use of a third-party vendor's proprietary fair value pricing model to assist in determining current valuation for foreign securities traded in markets that close prior to the New York Stock Exchange. When fair value pricing is employed, the value of the portfolio securities used to calculate the Funds' net asset values may differ from quoted or official closing prices.
The Trust has performed an analysis of all existing investments to determine the significance and character of all inputs to their fair value determination. Various inputs are used in determining the value of each Fund's investments. These inputs are summarized in the following three broad categories:
• Level 1 — Quoted unadjusted prices for identical instruments in active markets to which the Trust has access at the date of measurement.
• Level 2 — Other significant observable inputs (including quoted prices for similar instruments, interest rates, current yields, credit quality, prepayment speeds for mortgage related securities, collateral for asset-backed securities, foreign security indices, foreign exchange rates, fair value estimates for foreign securities, and changes in benchmark securities indices). Level 2 inputs are those in markets for which there are few transactions, the prices are not current, little public information exists or instances where prices vary substantially over time or among brokered market makers.
• Level 3 — Significant unobservable inputs including model derived valuations in which one or more significant inputs or significant value drivers are unobservable. Unobservable inputs are those inputs that reflect the Trust's own assumptions that market participants would use to price the asset or liability based on the best available information.
67
The following table presents the valuation levels of each Fund's assets as of June 30, 2022:
| | | Diversified
Value | | Large Cap
Value | | Mid-Cap
Value | | Small Cap
Value | | Small Cap
Diversified
Value | |
Level 1 — Quoted prices in an active market: | |
Common Stocks | | $ | 83,192,402 | | | $ | 396,241,318 | | | $ | 412,654,020 | | | $ | 528,198,337 | | | $ | 462,054,888 | | |
Money Market Funds | | | — | | | | 638,435 | | | | 661,045 | | | | 2,787,980 | | | | 4,634,772 | | |
Time Deposits | | | 670,660 | | | | 7,731,019 | | | | 881,139 | | | | 28,096,262 | | | | 10,786,292 | | |
Level 2 — Other significant observable market inputs: | |
Common Stocks: | |
Energy | | | — | | | | — | | | | 9,946,269 | | | | — | | | | — | | |
Industrials | | | 109,173 | | | | 577,104 | | | | 8,916,530 | | | | — | | | | — | | |
Rights | | | — | | | | — | | | | — | | | | 0 | | | | — | | |
Level 3 — Significant unobservable inputs: | |
Common Stocks: | |
Materials | | | — | | | | — | | | | — | | | | 0 | | | | — | | |
Total Investments | | $ | 83,972,235 | | | $ | 405,187,876 | | | $ | 433,059,003 | | | $ | 559,082,579 | | | $ | 477,475,952 | | |
| | Global
Value | | International
Value | | International
Small Cap
Diversified
Value | | Value
Opportunities | | High Yield | |
Level 1 — Quoted prices in an active market: | |
Common Stocks | | $ | 25,211,899 | | | $ | 635,586 | | | $ | 1,108,420 | | | $ | 399,963,678 | | | $ | 5,198,166 | | |
Preferred Stocks | | | — | | | | — | | | | — | | | | 82,800 | | | | 1,774,923 | | |
Purchased Put Options | | | — | | | | — | | | | — | | | | 4,124,425 | | | | — | | |
Money Market Funds | | | — | | | | — | | | | — | | | | 358,790 | | | | 28,000,000 | | |
Time Deposits | | | 884,803 | | | | 52,447 | | | | 121,568 | | | | 22,793,145 | | | | 4,690,025 | | |
Level 2 — Other significant observable market inputs: | |
Common Stocks: | |
Communication Services | | | — | | | | 102,606 | | | | 76,323 | | | | — | | | | — | | |
Consumer Discretionary | | | 736,605 | | | | 172,864 | | | | 484,438 | | | | 2,331,922 | | | | — | | |
Consumer Staples | | | 442,372 | | | | 213,953 | | | | 207,685 | | | | — | | | | — | | |
Energy | | | — | | | | 117,568 | | | | 136,865 | | | | 1,291,636 | | | | — | | |
Financials | | | 3,059,461 | | | | 752,009 | | | | 1,205,226 | | | | 14,548,178 | | | | — | | |
Health Care | | | 319,585 | | | | 96,897 | | | | 91,803 | | | | — | | | | — | | |
Industrials | | | 2,740,969 | | | | 421,786 | | | | 1,204,237 | | | | 14,647,313 | | | | — | | |
Information Technology | | | 224,947 | | | | 154,871 | | | | 327,848 | | | | — | | | | — | | |
Materials | | | — | | | | — | | | | 459,707 | | | | 1,768,263 | | | | — | | |
Real Estate | | | — | | | | — | | | | 131,672 | | | | — | | | | — | | |
Utilities | | | — | | | | — | | | | 145,017 | | | | — | | | | — | | |
Preferred Stocks: | |
Financials | | | — | | | | — | | | | — | | | | 656,622 | | | | — | | |
Convertible Preferred Stocks | | | — | | | | — | | | | — | | | | — | | | | 4,691,012 | | |
Convertible Bonds | | | — | | | | — | | | | — | | | | — | | | | 6,635,940 | | |
Corporate Bonds | | | — | | | | — | | | | — | | | | — | | | | 639,478,617 | | |
Term Loans | | | — | | | | — | | | | — | | | | 992,253 | | | | 58,333,770 | | |
Rights | | | — | | | | — | | | | 88 | | | | — | | | | — | | |
Level 3 — Significant unobservable inputs: | |
Common Stocks: | |
Energy — Exploration & Production | | | — | | | | — | | | | — | | | | — | | | | 2,151,865 | | |
Materials | | | — | | | | — | | | | — | | | | 10,725,797 | | | | — | | |
Metals/Mining Excluding Steel | | | — | | | | — | | | | — | | | | — | | | | 27,667,369 | | |
Oil Field Equipment & Services | | | — | | | | — | | | | — | | | | — | | | | 6,623,328 | | |
Preferred Stocks: | |
Specialty Retail | | | — | | | | — | | | | — | | | | — | | | | 6,214,788 | | |
Term Loans | | | — | | | | — | | | | — | | | | 2,649,013 | | | | 1,826,992 | | |
Total Investments | | $ | 33,620,641 | | | $ | 2,720,587 | | | $ | 5,700,897 | | | $ | 476,933,835 | | | $ | 793,286,795 | | |
68
Please refer to the Schedule of Investments for additional information regarding the composition of the amounts listed above.
The following table provides information about the Level 3 values, as well as their inputs, as of June 30, 2022:
| | Fair Value at
June 30, 2022 | | Valuation
Techniques | | Unobservable
Inputs | | Input
Values
(Weighted
Average)* | | Impact to
Valuation from an
Increase to Input | |
Small Cap Value | | | | | |
Common Stocks
| | $ | 0
| | | Estimated
recovery value | | Probability of
asset recovery | | $0.00
| | Increase
| |
| | | $ | 0 | | | | | | | | | | | | |
Value Opportunities | | | | | |
Common Stocks
| | $ | 9,603,396
| | | Market comparable
companies | | EBIT multiple
| | 7.6x - 13.4x
| | Increase
| |
| | | | 1,122,401 | | | Transaction price** | | N/A | | $159.38 | | Increase | |
Total Common Stocks | | | 10,725,797 | | | | | | | | | | | | |
Term Loans
| | | 2,649,013
| | | Market comparable
securities | | N/A
| | $100.00
| | Increase
| |
| | | $ | 13,374,810 | | | | | | | | | | | | |
High Yield | | | | | |
Common Stocks
| | $ | 6,623,328
| | | Market comparable
companies | | EBIT multiple
| | 7.6x - 13.4x
| | Increase
| |
| | | 2,151,865
| | | Market comparable
companies | | EBITDA multiple
| | 2.0x - 13.3x (7.7x)
| | Increase
| |
| | | 27,667,369 | | | Transaction price** | | N/A | | $159.38 - $64,500.00
($21,458.69) | | Increase
| |
Total Common Stocks | | | 36,442,562 | | | | | | | | | | | | |
Preferred Stocks
| | | 6,214,788
| | | Calculation of enterprise
value using: | | | | | | | |
| | | | | | | Discounted cash flows
| | Yield (Discount rate
of cash flows) | | 10%
| | Decrease
| |
| | | | | | | Market comparable
companies | | EBITDA multiple
| | 4.0x -10.3x
| | Increase
| |
Term Loans
| | | 1,826,992
| | | Market comparable
securities | | N/A
| | $100.00
| | Increase
| |
| | | $ | 44,484,342 | | | | | | | | | | | | |
* Unobservable inputs were weighted by the fair value of the investments.
** Fair value was determined based on recent acquisition or offer as the best measure of fair value with no material changes in operations of the related company since the transaction date.
The following is a reconciliation of Level 3 assets for which significant unobservable inputs were used to determine fair value:
| | Small Cap Value | |
| | Common Stocks | |
Balance at June 30, 2021 | | $ | — | | |
Purchases | | | — | | |
Sales | | | — | | |
Accrued discounts (premiums) | | | — | | |
Realized gains (losses) | | | — | | |
Change in unrealized appreciation/
depreciation | | | — | | |
Transfers into Level 3 | | | 0 | | |
Balance at June 30, 2022 | | $ | 0 | | |
Change in unrealized appreciation/
depreciation for Level 3 assets
held at June 30, 2022 | | $ | — | | |
69
| | Value Opportunities | |
| | Common
Stocks | | Term
Loans | | Total | |
Balance at June 30, 2021 | | $ | 14,070,772 | | | $ | 3,526,694 | | | $ | 17,597,466 | | |
Purchases | | | — | | | | 65,216 | | | | 65,216 | | |
Sales | | | (655,789 | ) | | | (942,897 | ) | | | (1,598,686 | ) | |
Accrued discounts (premiums) | | | — | | | | 1,017 | | | | 1,017 | | |
Realized gains (losses) | | | 56 | | | | 14,761 | | | | 14,817 | | |
Change in unrealized appreciation/
depreciation | | | (2,689,242 | ) | | | (15,778 | ) | | | (2,705,020 | ) | |
Transfers into Level 3 | | | — | | | | — | | | | — | | |
Balance at June 30, 2022 | | $ | 10,725,797 | | | $ | 2,649,013 | | | $ | 13,374,810 | | |
Change in unrealized appreciation/
depreciation for Level 3 assets
held at June 30, 2022 | | $ | (2,689,242 | ) | | $ | — | | | $ | (2,689,242 | ) | |
| | High Yield | |
| | Common
Stocks | | Preferred
Stocks | | Term
Loans | | Total | |
Balance at June 30, 2021 | | $ | 54,403,842 | | | $ | 8,976,915 | | | $ | 8,632,515 | | | $ | 72,013,272 | | |
Purchases | | | — | | | | — | | | | 505,686 | | | | 505,686 | | |
Sales | | $ | (19,220,333 | ) | | | — | | | | (7,311,210 | ) | | | (26,531,543 | ) | |
Accrued discounts (premiums) | | | — | | | | — | | | | 7,888 | | | | 7,888 | | |
Realized gains (losses) | | | (5,647,820 | ) | | | — | | | | 114,458 | | | | (5,533,362 | ) | |
Change in unrealized appreciation/
depreciation | | | 6,906,873 | | | | (2,762,127 | ) | | | (122,345 | ) | | | 4,022,401 | | |
Transfers into Level 3 | | | — | | | | — | | | | — | | | | — | | |
Balance at June 30, 2022 | | $ | 36,442,562 | | | $ | 6,214,788 | | | $ | 1,826,992 | | | $ | 44,484,342 | | |
Change in unrealized appreciation/
depreciation for Level 3 assets
held at June 30, 2022 | | $ | 2,550,098 | | | $ | (2,762,127 | ) | | $ | — | | | $ | (212,029 | ) | |
Income and Expense Allocation. Common expenses incurred by the Trust which are not allocable to a specific Fund are allocated among the Funds based upon relative net assets or evenly, depending on the nature of the expenditure. For all Funds, except the High Yield Fund, net investment income, other than class-specific expenses, and realized and unrealized gains and losses are allocated daily to each class of shares based upon the relative net asset value of outstanding shares of each class at the beginning of the day (after adjusting for the current day's capital share activity of the respective class). For the High Yield Fund, net investment income, other than class-specific expenses, and realized and unrealized gains and losses are allocated daily to each class of shares based upon the relative net asset value of settled shares of each class at the beginning of the day (after adjusting for the current day's capital share activity of the respective class).
Dividends and Distributions to Shareholders. Dividends and distributions to shareholders are recorded on the ex-dividend date. Dividends from net investment income are declared daily and paid monthly for the High Yield Fund and declared and paid annually for the Diversified Value Fund, Large Cap Value Fund, Mid-Cap Value Fund, Small Cap Value Fund, Small Cap Diversified Value Fund, Global Value Fund, International Value Fund, International Small Cap Diversified Value Fund and Value Opportunities Fund. Distributions of net realized capital gains, if any, will be declared and paid at least annually.
Security Transactions and Investment Income. Security and shareholder transactions are recorded on trade date. Realized gains and losses on sales of investments are calculated on the specifically identified cost basis of the securities. Dividend income, less foreign taxes withheld, if any, is recorded on the ex-dividend date. Interest income is recognized on the accrual basis. Market discounts and original issue discounts on fixed-income securities are amortized daily over the expected life of the security using the effective yield method. Market premiums on fixed-income securities are amortized daily on the yield to the next call method. Return of capital distributions received from real estate investment trust ("REIT") securities are recorded as an adjustment to the cost of the security and thus may impact unrealized gains or losses on the security.
Securities purchased or sold on a when-issued, delayed delivery or forward commitment basis may have extended settlement periods. The value of the security purchased is subject to market fluctuations during this period. The Funds segregate or "earmark" liquid assets until the settlement date or otherwise cover their position in an amount sufficient to meet the Funds' obligations.
70
Foreign Currency Transactions. Securities and other assets and liabilities denominated in foreign currencies are translated into U.S. dollar amounts at the date of valuation. Purchases and sales of securities and income and expense items denominated in foreign currencies are translated into U.S. dollar amounts on the respective dates of such transactions. The Funds isolate the portion of realized gains or losses and do not isolate the portion of unrealized appreciation or depreciation resulting from changes in foreign exchange rates on securities from the fluctuations arising from changes in market prices of securities held. Reported net realized foreign exchange gains or losses arise from sales of securities, currency gains or losses realized between the trade and settlement dates on securities transactions and the difference between the amounts of dividends, interest and foreign withholding taxes recorded on the Funds' books and the U.S. dollar equivalent of the amounts actually received or paid.
Payment In-Kind Securities. Certain Funds may invest in payment in-kind securities. Payment in-kind securities give the issuer the option at each interest payment date of making interest payments in either cash or additional debt securities. Those additional debt securities usually have the same terms, including maturity dates and interest rates, and associated risks as the original bonds. The daily market quotations of the original bonds may include the accrued interest (referred to as a dirty price) and may require a pro-rata adjustment to interest receivable from the unrealized appreciation or depreciation of securities on the Statements of Assets & Liabilities.
Restricted and Illiquid Securities. The Funds may invest in securities that are subject to legal or contractual restrictions on resale or are illiquid. Restricted securities generally may be resold in transactions exempt from registration. An illiquid security is an investment that a Fund reasonably expects cannot be sold or disposed of in current market conditions in seven calendar days or less without the sale or disposition significantly changing the market value of the investment. Disposal of these securities may involve time-consuming negotiations and expense, and prompt sale at the current valuation may be difficult.
Options. The Funds are subject to equity price risk in the normal course of pursuing their investment objectives. The Funds may purchase put options on securities to protect holdings in an underlying or related security against a substantial decline in market value. The Funds may purchase call options on securities and security indexes. A Fund may write a call or put option only if the option is "covered" by the Fund holding a position in the underlying securities or by other means which would permit immediate satisfaction of the Fund's obligation as writer of the option. Prior to exercise or expiration, an option may be closed by an offsetting purchase or sale of an option of the same series. The purchase and writing of options involves certain risks. If a put or call option purchased by a Fund is not sold when it has remaining value, and if the market price of the underlying security, in the case of a put, remains equal to or greater than the exercise price or, in the case of a call, remains less than or equal to the exercise price, the Fund will lose its entire investment in the option. There can be no assurance that a liquid market will exist when a Fund seeks to close out an option position. Furthermore, if trading restrictions or suspensions are imposed on the options markets, the Fund may be unable to close out a position. With options, there is minimal counterparty risk to the Funds since options are exchange traded and the exchange's clearinghouse, as counterparty to all exchange traded options, guarantees the options against default.
When a Fund purchases a put or call option, an amount equal to the premium paid is included on the Statements of Assets & Liabilities as an investment, and is subsequently adjusted to reflect the fair market value of the option. If an option expires on the stipulated expiration date or if the Fund enters into a closing sale transaction, a gain or loss is realized. If the Fund exercises a put option, a gain or loss is realized from the sale of the underlying security, and the proceeds from such sale are decreased by the premium originally paid. If the Fund exercises a call option, the cost of the security acquired is increased by the premium paid for the call.
Futures Contracts. The Global Value Fund, International Value Fund, International Small Cap Diversified Value Fund, Value Opportunities Fund and High Yield Fund are subject to foreign currency exchange rate risk in the normal course of pursuing their investment objectives. A Fund may use futures contracts to gain exposure to, or hedge against, changes in the value of foreign currencies. A futures contract provides for the future sale by one party and purchase by another party of an asset at a specified price on a specified date. Upon entering into such contracts, the Fund is required to deposit with the broker, either in cash or securities, an initial margin deposit in an amount equal to a certain percentage of the contract amount. Subsequent payments (variation margin) are made or received by the Fund each day, depending on the daily fluctuations in the value of the contract, and are recorded for financial statement purposes as unrealized gains or losses by the Fund. Upon entering into such contracts, the Fund bears the risk of exchange rates moving unexpectedly, in which case the Fund may not achieve the anticipated benefits of the futures contracts and may realize a loss. When a contract is closed, the Fund records a realized gain or loss equal to the difference between the proceeds from (or cost of) the closing transaction and the Fund's basis in the contract. With futures, there is minimal counterparty risk to the Fund since futures are exchange traded and the exchange's clearinghouse, as counterparty to all exchange traded futures, guarantees the futures against default. The use of futures contracts involves the risk of imperfect correlation in movements in the price of the futures contracts, exchange rates and the underlying hedged assets.
Credit Default Swap Contracts. The Value Opportunities Fund and High Yield Fund may enter into credit default swap agreements for purposes of attempting to obtain a particular desired return at a lower cost to the Fund than if the Fund had invested directly in an instrument that yielded the desired return. The buyer in a credit default swap is obligated to pay the seller a periodic stream of payments over the term of the contract provided no event of default on an underlying reference obligation has occurred. In the event of default, the seller must pay the buyer a net settlement amount in the form of cash or securities equal to the notional amount of the swap less the recovery value of the referenced entity or underlying securities comprising the referenced index. Credit default swaps involve greater risks than if the Fund invested in the reference obligation directly. In addition to general market risks, credit default swaps are subject to illiquidity risk, counterparty risk and credit risk. The Fund's maximum risk of loss from counterparty risk, either as the protection seller or as the protection buyer, is the fair value of the contract. This risk is mitigated by having a master netting arrangement between the Fund and the counterparty and by the posting of collateral by the counterparty to the Fund to cover the Fund's exposure to the counterparty.
The Advisor, on behalf of the Value Opportunities Fund and High Yield Fund, is party to an International Swap Dealers Association, Inc. Master Agreement ("ISDA Master Agreement") with each of Goldman Sachs International and JPMorgan Chase Bank, N.A. that governs transactions, such as over-the-counter swap contracts, entered into by the Funds and the counterparty. The ISDA Master Agreement contains provisions for general obligations, representations, agreements, collateral and events of default or termination. Events of termination include conditions that may entitle the counterparty to elect to terminate early and cause settlement of all outstanding transactions under the ISDA Master Agreement.
Upon entering into swap agreements, the Value Opportunities Fund and High Yield Fund will either receive or pay an upfront payment based upon the difference between the current principal amount and the notional amount of the swap and whether the Fund is buying or selling protection. Upfront payments that are received are recorded as liabilities while upfront payments paid are recorded as assets. These payments remain on the books until the
71
swap contract is closed. When entering into credit default swaps, the Fund will either deliver collateral to the counterparty or the counterparty will deliver collateral to the Fund. The amount of this collateral is calculated based upon the notional value and the current price of the swap. In the event of default, the Fund has recourse against any collateral posted to it by the counterparty. When entering into swap agreements as a seller, the notional amounts would be partially offset by any recovery values of the respective reference obligations, upfront payments received upon entering into the agreement, or net amounts received from the settlement of buy protection credit default swap agreements entered into by the Fund for the same reference entity. Unrealized appreciation or depreciation is recorded daily as the difference between the prior day and current day closing price. The Funds did not enter into any credit default swap contracts during the year ended June 30, 2022.
Derivative Instruments. The Funds have adopted authoritative standards regarding disclosures about derivatives and how they affect the Funds' Statements of Assets & Liabilities and Statements of Operations.
The following is a summary of the Funds' derivative instrument holdings categorized by primary risk exposure as of June 30, 2022:
Asset Derivatives
| | Location on Statements of
Assets & Liabilities | | Value
Opportunities | |
Equity Contracts: | |
Purchased Put Options | | Long-term investments | | $ | 4,124,425 | | |
The following is a summary of the Funds' realized gains (losses) and change in unrealized appreciation/depreciation on derivative instruments recognized in the Statements of Operations categorized by primary risk exposure for the year ended June 30, 2022:
Realized Gains (Losses) on Derivatives
| | Value Opportunities | |
Equity Contracts: | |
Purchased Put Options | | $ | (692,812 | )* | |
Foreign Exchange Contracts: | |
Futures Contracts | | | 872,966 | | |
* Included with net realized gains (losses) from sales of unaffiliated issuers.
Change in Unrealized Appreciation/Depreciation on Derivatives
| | Value Opportunities | |
Equity Contracts: | |
Purchased Put Options | | $ | 547,774 | * | |
Foreign Exchange Contracts: | |
Futures Contracts | | | (403,023 | ) | |
* Included with net change in unrealized appreciation/depreciation of securities of unaffiliated issuers and foreign currency translations.
The following is a summary of the Funds' average quarterly balance of outstanding derivative instruments categorized by primary risk exposure for the year ended June 30, 2022:
Average Quarterly Balance of Outstanding Derivatives
| | Value Opportunities | |
Equity Contracts: | |
Average Number of Contracts — Purchased Put Options | | | 111 | | |
Average Notional Amount — Purchased Put Options | | $ | 9,535,486 | | |
Foreign Exchange Contracts: | |
Average Number of Contracts — Futures Contracts | | | 62 | | |
Average Notional Amount — Futures Contracts | | $ | 5,279,381 | | |
Offsetting Assets and Liabilities. The Funds are subject to various master netting arrangements, which govern the terms of certain transactions with counterparties. The arrangements allow the Funds to close out and net their total exposure to a counterparty in the event of a default with respect to all the transactions governed under a single agreement with a counterparty. For financial reporting purposes, the Funds do not offset financial assets and liabilities that are subject to master netting arrangements in the Statements of Assets & Liabilities.
72
The following is a summary of the arrangements subject to offsetting as of June 30, 2022:
| | | | Gross Amounts Not Offset in the
Statements of Assets & Liabilities | |
| | Gross Amounts Presented in the
Statements of Assets & Liabilities | | Financial
Instruments | | Collateral
Received* | | Net Amount | |
Securities Lending: | |
Large Cap Value | | $ | 621,267 | | | $ | — | | | $ | (621,267 | ) | | $ | — | | |
Mid-Cap Value | | | 643,269 | | | | — | | | | (643,269 | ) | | | — | | |
Small Cap Value | | | 2,714,966 | | | | — | | | | (2,714,966 | ) | | | — | | |
Small Cap Diversified Value | | | 4,421,326 | | | | — | | | | (4,421,326 | ) | | | — | | |
Value Opportunities | | | 344,925 | | | | — | | | | (344,925 | ) | | | — | | |
* Actual collateral received is greater than the amount shown due to overcollateralization.
NOTE 2.
Fees and Transactions with Affiliates. The Trust has entered into Investment Advisory Agreements for each of the Funds with the Advisor, with which the officers and a Trustee of the Trust are affiliated. The Advisor is a limited liability company, the primary members of which are HWCap Holdings, a limited liability company with members who are current and former employees of the Advisor, and Stephens - H&W, LLC, a limited liability company whose primary member is SF Holding Corp., which is a diversified holding company. The Advisor is responsible for the management of the Funds' investments and provides the personnel, facilities, equipment and certain other services necessary to the operations of each Fund. The Advisor receives a fee, computed daily and payable monthly, at the annual rates presented below as applied to each Fund's daily net assets. The Advisor contractually agreed to waive fees or reimburse regular operating expenses in excess of the annual rates presented below as applied to such Fund's daily net assets during the year ended June 30, 2022.
| | | Diversified
Value | | Large Cap
Value | | Mid-Cap
Value | | Small Cap
Value | | Small Cap
Diversified
Value | | Global
Value | | International
Value | | International
Small Cap
Diversified
Value | | Value
Opportunities | | High
Yield | |
Annual Advisory
Fee Rate | | | 0.70 | %1 | | | 0.70 | %2 | | | 0.75 | %3 | | | 0.75 | % | | | 0.65 | % | | | 0.75 | % | | | 0.80 | % | | | 0.80 | % | | | 0.75 | % | | | 0.55 | % | |
Annual cap on
expenses —
Class I | | | 0.80 | % | | | 0.95 | % | | | 1.05 | % | | | 1.15 | % | | | 0.80 | % | | | 0.95 | % | | | 0.95 | % | | | 0.99 | % | | | 1.15 | % | | | 0.70 | % | |
Annual cap on
expenses —
Class A | | | 1.05 | % | | | 1.20 | % | | | 1.30 | % | | | 1.40 | % | | | 1.05 | % | | | 1.20 | % | | | 1.20 | % | | | 1.24 | % | | | 1.40 | % | | | 0.95 | % | |
Annual cap on
expenses —
Class C | | | 1.80 | % | | | 1.95 | % | | | 2.05 | % | | | 2.15 | % | | | 1.80 | % | | | 1.95 | % | | | 1.95 | % | | | n/a | | | | 2.15 | % | | | 1.70 | % | |
Annual cap on
expenses —
Class Z | | | 0.80 | % | | | 0.95 | % | | | 1.05 | % | | | 1.15 | % | | | 0.80 | % | | | 0.95 | % | | | 0.95 | % | | | 0.99 | % | | | 1.15 | % | | | 0.60 | % | |
1 The Annual Advisory Fee Rate is 0.70% for the first $250 million in assets, 0.60% for the next $250 million in assets and 0.50% thereafter.
2 The Annual Advisory Fee Rate is 0.70% for the first $500 million in assets, 0.60% for the next $500 million in assets and 0.55% thereafter.
3 The Annual Advisory Fee Rate is 0.75% for the first $5 billion in assets, 0.65% for the next $5 billion in assets and 0.60% thereafter.
The following rates were effective prior to August 27, 2021:
| | | Mid-Cap
Value | | Small Cap
Value | | Value
Opportunities | |
Annual cap on expenses — Class I | | | 1.15 | % | | | 1.25 | % | | | 1.25 | % | |
Annual cap on expenses — Class A | | | 1.40 | % | | | 1.50 | % | | | 1.50 | % | |
Annual cap on expenses — Class C | | | 2.15 | % | | | 2.25 | % | | | 2.25 | % | |
Annual cap on expenses — Class Z | | | 1.15 | % | | | 1.25 | % | | | 1.25 | % | |
Quasar Distributors, LLC is the principal underwriter and distributor for the shares of the Funds ("Quasar" or the "Distributor"). Pursuant to the Distribution Plan adopted by the Trust in accordance with Rule 12b-1 under the 1940 Act, the Funds pay the Distributor ongoing distribution and service fees. The fees are accrued daily at the annual rates based upon the average daily net assets of the shares as follows:
| | | Distribution and Service
Fee | |
Class A | | | 0.25 | % | |
Class C | | | 1.00 | % | |
73
Pursuant to separate agreements with the Distributor, selected dealers and other financial intermediaries also provide distribution services to the Funds. The ongoing distribution and service fee compensates the Distributor and selected dealers for providing distribution-related and shareholder services to Class A and Class C shareholders.
Certain selected dealers and other financial intermediaries charge a fee for shareholder accounting services and administrative services that they provide to the Funds on behalf of certain shareholders; the portion of this fee paid by the Funds is included within "Transfer agent fees and expenses" in the Statements of Operations. Class Z shares are not subject to these fees.
The Funds are permitted to purchase securities from or sell securities to another Fund or affiliated person under procedures adopted by the Board. During the year ended June 30, 2022, the Funds' did not have any of these purchases and sales.
NOTE 3.
Investments. Purchases and sales of investment securities, excluding short-term investments, for the year ended June 30, 2022 were as follows:
| | Diversified
Value | | Large Cap
Value | | Mid-Cap
Value | | Small Cap
Value | | Small Cap
Diversified
Value | | Global
Value | | International
Value | | International
Small Cap
Diversified
Value | | Value
Opportunities | | High
Yield | |
Purchases | | $ | 27,056,493 | | | $ | 167,620,876 | | | $ | 194,759,006 | | | $ | 274,967,126 | | | $ | 266,904,065 | | | $ | 14,671,332 | | | $ | 947,616 | | | $ | 2,891,956 | | | $ | 405,663,895 | | | $ | 396,959,850 | | |
Sales | | | 40,565,100 | | | | 185,220,697 | | | | 183,260,035 | | | | 265,807,836 | | | | 179,774,794 | | | | 13,665,225 | | | | 506,142 | | | | 2,853,502 | | | | 423,517,974 | | | | 566,369,729 | | |
The Funds did not have any purchases or sales of U.S. Government securities for the year ended June 30, 2022.
NOTE 4.
Federal Income Taxes. It is each Fund's policy to comply with the requirements of the Internal Revenue Code applicable to regulated investment companies and each Fund intends to distribute substantially all of its investment company net taxable income and net capital gains to shareholders. Therefore, no federal income tax provision is required. Under the applicable foreign tax law, a withholding tax may be imposed on interest, dividends and capital gains at various rates.
Distributions paid to shareholders are based on net investment income and net realized gains determined on a tax basis, which may differ from net investment income and net realized gains for financial reporting purposes. The fiscal year in which amounts are distributed may differ from the year in which the net investment income and net realized gains are recorded by the Funds for financial reporting purposes. The Funds may utilize earnings and profits distributed to shareholders on redemptions of shares as part of the dividends paid deduction. Generally accepted accounting principles require that permanent financial reporting and tax differences be reclassified within the capital accounts.
The following information is presented on an income tax basis as of June 30, 2022:
| | Diversified
Value | | Large Cap
Value | | Mid-Cap
Value | | Small Cap
Value | | Small Cap
Diversified
Value | | Global
Value | | International
Value | | International
Small Cap
Diversified
Value | | Value
Opportunities | | High Yield | |
Tax cost of
investments | | $ | 81,035,813 | | | $ | 379,258,733 | | | $ | 414,369,481 | | | $ | 549,183,623 | | | $ | 463,138,070 | | | $ | 32,722,267 | | | $ | 2,678,837 | | | $ | 5,946,551 | | | $ | 488,520,955 | | | $ | 942,266,661 | | |
Gross unrealized
appreciation | | | 15,340,834 | | | | 75,242,010 | | | | 81,504,039 | | | | 99,999,824 | | | | 69,239,591 | | | | 4,545,463 | | | | 362,127 | | | | 446,624 | | | | 53,160,665 | | | | 9,397,802 | | |
Gross unrealized
depreciation | | | (13,075,072 | ) | | | (57,682,321 | ) | | | (64,354,562 | ) | | | (120,985,110 | ) | | | (70,322,773 | ) | | | (4,533,916 | ) | | | (373,257 | ) | | | (814,532 | ) | | | (87,902,554 | ) | | | (191,067,712 | ) | |
Net unrealized
appreciation/
depreciation | | | 2,265,762 | | | | 17,559,689 | | | | 17,149,477 | | | | (20,985,286 | ) | | | (1,083,182 | ) | | | 11,547 | | | | (11,130 | ) | | | (367,908 | ) | | | (34,741,889 | ) | | | (181,669,910 | ) | |
Distributable
ordinary income
(as of 6/30/22)* | | | 867,545 | | | | 2,165,785 | | | | 2,143,120 | | | | 1,614,360 | | | | 10,544,461 | | | | 356,748 | | | | 59,717 | | | | 111,448 | | | | — | | | | 766,525 | | |
Distributable
long-term gains
(as of 6/30/22) | | | — | | | | 24,990,499 | | | | — | | | | 47,808,256 | | | | 26,441,542 | | | | 953,758 | | | | 30,328 | | | | 200,194 | | | | 8,269,848 | | | | — | | |
Total distributable
earnings | | | 867,545 | | | | 27,156,284 | | | | 2,143,120 | | | | 49,422,616 | | | | 36,986,003 | | | | 1,310,506 | | | | 90,045 | | | | 311,642 | | | | 8,269,848 | | | | 766,525 | | |
Other accumulated
losses | | | (27,848,381 | ) | | | (3 | ) | | | (288,519,722 | ) | | | (10,510 | ) | | | — | | | | — | | | | — | | | | — | | | | (683,712 | ) | | | (331,291,245 | ) | |
Total accumulated
gains (losses) | | $ | (24,715,074 | ) | | $ | 44,715,970 | | | $ | (269,227,125 | ) | | $ | 28,426,820 | | | $ | 35,902,821 | | | $ | 1,322,053 | | | $ | 78,915 | | | $ | (56,266 | ) | | $ | (27,155,753 | ) | | $ | (512,194,630 | ) | |
* Includes distributable short-term gains of $6,887,620 for the Small Cap Diversified Value Fund.
As of the close of business on December 31, 2012, in exchange for shares the Advisor transferred assets valued at $1,132,946 to the Global Value Fund. As a result of the tax-deferred transfers, the Global Value Fund acquired $50,230 of unrealized appreciation for tax purposes. As of June 30, 2022, the Global Value Fund held securities with $3,664 of net unrealized appreciation relating to the transfers.
74
As of the close of business on June 30, 2014, in exchange for shares Stephens Investment Holdings LLC transferred assets valued at $5,038,896 to the Small Cap Diversified Value Fund. As a result of the tax-deferred transfers, the Small Cap Diversified Value Fund acquired $592,438 of unrealized appreciation for tax purposes. As of June 30, 2022, the Small Cap Diversified Value Fund held securities with $20,591 of net unrealized appreciation relating to the transfers.
On the Statements of Assets & Liabilities, the following adjustments were made for permanent tax differences. These differences are due primarily to differing treatment for items such as partnership adjustments.
| | Paid-In
Capital | | Total
Accumulated
Distributable
Earnings (Losses) | |
Diversified Value | | $ | — | | | $ | — | | |
Large Cap Value | | | — | | | | — | | |
Mid-Cap Value | | | — | | | | — | | |
Small Cap Value | | | — | | | | — | | |
| Small Cap Diversified Value | | | (21,945 | ) | | | 21,945 | | |
Global Value | | | — | | | | — | | |
International Value | | | — | | | | — | | |
International Small Cap Diversified Value | | | — | | | | — | | |
Value Opportunities | | | — | | | | — | | |
High Yield | | | — | | | | — | | |
The tax components of distributions paid during the fiscal years ended June 30, 2022 and 2021, capital loss carryovers as of June 30, 2022, and any tax basis late year losses as of June 30, 2022, which are not recognized for tax purposes until the first day of the following fiscal year, are:
| | | June 30, 2022 | | June 30, 2021 | |
| | | Ordinary
Income
Distributions | | Long-Term
Capital Gains
Distributions | | Short-Term
Capital Loss
Carryovers1 | | Long-Term
Capital Loss
Carryovers2 | | Capital Loss
Carryovers
Utilized | | Late
Year
Losses | | Ordinary
Income
Distributions | | Long-Term
Capital Gains
Distributions | |
| Diversified Value | | $ | 993,673 | | | $ | — | | | $ | — | | | $ | 27,848,381 | | | $ | 6,163,593 | | | $ | — | | | $ | 1,525,761 | | | $ | — | | |
| Large Cap Value | | | 3,875,612 | | | | — | | | | — | | | | — | | | | 8,621,409 | | | | — | | | | 6,504,911 | | | | — | | |
| Mid-Cap Value | | | 5,476,789 | | | | — | | | | 86,598,129 | | | | 201,921,584 | | | | 36,469,426 | | | | — | | | | 7,928,177 | | | | — | | |
| Small Cap Value | | | 1,855,708 | | | | — | | | | — | | | | — | | | | 37,369,798 | | | | — | | | | 3,718,542 | | | | — | | |
Small Cap
Diversified Value | | | 16,228,065 | | | | 13,674,415 | | | | — | | | | — | | | | — | | | | — | | | | 2,388,699 | | | | — | | |
| Global Value | | | 252,787 | | | | — | | | | — | | | | — | | | | 1,914,073 | | | | — | | | | 447,072 | | | | — | | |
| International Value | | | 37,541 | | | | — | | | | — | | | | — | | | | 121,027 | | | | — | | | | 30,073 | | | | — | | |
International Small Cap
Diversified Value | | | 1,159,737 | | | | 90,449 | | | | — | | | | — | | | | — | | | | — | | | | 120,245 | | | | — | | |
| Value Opportunities | | | 10,786,641 | | | | 59,479,932 | | | | — | | | | — | | | | — | | | | 683,6503 | | | | 10,585,396 | | | | — | | |
| High Yield4 | | | 46,440,050 | | | | — | | | | 3,786,054 | | | | 326,706,386 | | | | — | | | | — | | | | 65,565,649 | | | | — | | |
1 Short-term with no expiration.
2 Long-term with no expiration.
3 Short-term post-October loss.
4 The Fund inherited a short-term capital loss carryover of $922,717 and a long-term capital loss carryover of $3,566,005 as a result of the reorganization with the Hotchkis & Wiley Capital Income Fund, which are included in the totals. These capital loss carryovers are further subject to an annual limitation of $171,228 pursuant to Section 382.
As of and during the year ended June 30, 2022, the Funds did not have a liability for any unrecognized tax benefits. The Funds recognize interest and penalties, if any, related to unrecognized tax benefits as income tax expense in the Statements of Operations. During the year ended June 30, 2022, the Funds did not incur any interest or penalties. The tax years ended June 30, 2019 through June 30, 2022 remain open and subject to examination by tax jurisdictions.
NOTE 5.
Capital Share Transactions. Transactions in capital shares for each class were as follows:
| | Sales | | Reinvestment of
dividends
and distributions | | Redemptions | | Net increase (decrease) | |
| | Shares | | Amount | | Shares | | Amount | | Shares | | Amount | | Shares | | Amount | |
Year Ended June 30, 2022 | |
Diversified Value Fund | |
Class I | | | 150,176 | | | $ | 3,932,509 | | | | 24,442 | | | $ | 623,755 | | | | (491,513 | ) | | $ | (12,544,875 | ) | | | (316,895 | ) | | $ | (7,988,611 | ) | |
Class A | | | 91,558 | | | | 2,417,634 | | | | 5,112 | | | | 131,077 | | | | (410,150 | ) | | | (10,344,146 | ) | | | (313,480 | ) | | | (7,795,435 | ) | |
Class C | | | 6,878 | | | | 181,923 | | | | 64 | | | | 1,638 | | | | (20,708 | ) | | | (541,964 | ) | | | (13,766 | ) | | | (358,403 | ) | |
Total net increase
(decrease) | | | 248,612 | | | | 6,532,066 | | | | 29,618 | | | | 756,470 | | | | (922,371 | ) | | | (23,430,985 | ) | | | (644,141 | ) | | | (16,142,449 | ) | |
75
| | Sales | | Reinvestment of
dividends
and distributions | | Redemptions | | Net increase (decrease) | |
| | Shares | | Amount | | Shares | | Amount | | Shares | | Amount | | Shares | | Amount | |
Year Ended June 30, 2022 | |
Large Cap Value Fund | |
Class I | | | 1,117,980 | | | $ | 49,387,294 | | | | 49,099 | | | $ | 2,147,118 | | | | (2,426,654 | ) | | $ | (107,300,059 | ) | | | (1,259,575 | ) | | $ | (55,765,647 | ) | |
Class A | | | 2,763,785 | | | | 118,706,521 | | | | 10,107 | | | | 439,639 | | | | (2,350,931 | ) | | | (98,857,159 | ) | | | 422,961 | | | | 20,289,001 | | |
Class C | | | 21,118 | | | | 929,544 | | | | — | | | | — | | | | (73,847 | ) | | | (3,172,367 | ) | | | (52,729 | ) | | | (2,242,823 | ) | |
Class Z | | | 728,713 | | | | 32,323,620 | | | | 2,767 | | | | 120,928 | | | | (129,426 | ) | | | (5,603,478 | ) | | | 602,054 | | | | 26,841,070 | | |
Total net increase
(decrease) | | | 4,631,596 | | | | 201,346,979 | | | | 61,973 | | | | 2,707,685 | | | | (4,980,858 | ) | | | (214,933,063 | ) | | | (287,289 | ) | | | (10,878,399 | ) | |
Mid-Cap Value Fund | |
Class I | | | 2,369,224 | | | | 108,356,664 | | | | 77,469 | | | | 3,353,653 | | | | (2,564,860 | ) | | | (111,411,685 | ) | | | (118,167 | ) | | | 298,632 | | |
Class A | | | 679,939 | | | | 29,991,266 | | | | 17,729 | | | | 754,899 | | | | (767,557 | ) | | | (33,377,683 | ) | | | (69,889 | ) | | | (2,631,518 | ) | |
Class C | | | 30,903 | | | | 1,184,642 | | | | 40 | | | | 1,464 | | | | (130,716 | ) | | | (4,786,330 | ) | | | (99,773 | ) | | | (3,600,224 | ) | |
Class Z | | | 327,016 | | | | 13,721,266 | | | | 9,380 | | | | 405,864 | | | | (119,879 | ) | | | (5,284,272 | ) | | | 216,517 | | | | 8,842,858 | | |
Total net increase
(decrease) | | | 3,407,082 | | | | 153,253,838 | | | | 104,618 | | | | 4,515,880 | | | | (3,583,012 | ) | | | (154,859,970 | ) | | | (71,312 | ) | | | 2,909,748 | | |
Small Cap Value Fund | |
Class I | | | 2,453,456 | | | | 178,270,897 | | | | 8,058 | | | | 575,021 | | | | (2,197,818 | ) | | | (155,530,588 | ) | | | 263,696 | | | | 23,315,330 | | |
Class A | | | 161,889 | | | | 11,856,176 | | | | 760 | | | | 54,041 | | | | (169,804 | ) | | | (12,316,357 | ) | | | (7,155 | ) | | | (406,140 | ) | |
Class C | | | 5,525 | | | | 305,126 | | | | — | | | | — | | | | (20,504 | ) | | | (1,159,407 | ) | | | (14,979 | ) | | | (854,281 | ) | |
Class Z | | | 38,578 | | | | 2,784,424 | | | | 707 | | | | 50,430 | | | | (46,352 | ) | | | (3,346,008 | ) | | | (7,067 | ) | | | (511,154 | ) | |
Total net increase
(decrease) | | | 2,659,448 | | | | 193,216,623 | | | | 9,525 | | | | 679,492 | | | | (2,434,478 | ) | | | (172,352,360 | ) | | | 234,495 | | | | 21,543,755 | | |
Small Cap Diversified Value Fund | |
Class I | | | 11,734,826 | | | | 158,715,920 | | | | 2,143,429 | | | | 29,000,600 | | | | (5,670,764 | ) | | | (76,741,063 | ) | | | 8,207,491 | | | | 110,975,457 | | |
Class A | | | 1,297,152 | | | | 18,065,756 | | | | 34,120 | | | | 458,912 | | | | (1,460,788 | ) | | | (20,130,433 | ) | | | (129,516 | ) | | | (1,605,765 | ) | |
Class Z | | | 122,913 | | | | 1,657,590 | | | | 5,617 | | | | 75,948 | | | | (6,830 | ) | | | (90,673 | ) | | | 121,700 | | | | 1,642,865 | | |
Total net increase
(decrease) | | | 13,154,891 | | | | 178,439,266 | | | | 2,183,166 | | | | 29,535,460 | | | | (7,138,382 | ) | | | (96,962,169 | ) | | | 8,199,675 | | | | 111,012,557 | | |
Global Value Fund | |
Class I | | | 262,675 | | | | 3,837,880 | | | | 16,806 | | | | 245,531 | | | | (258,703 | ) | | | (3,708,873 | ) | | | 20,778 | | | | 374,538 | | |
Class A | | | 25,379 | | | | 387,135 | | | | 474 | | | | 6,929 | | | | (26,622 | ) | | | (382,948 | ) | | | (769 | ) | | | 11,116 | | |
Total net increase
(decrease) | | | 288,054 | | | | 4,225,015 | | | | 17,280 | | | | 252,460 | | | | (285,325 | ) | | | (4,091,821 | ) | | | 20,009 | | | | 385,654 | | |
International Value Fund | |
Class I | | | 43,585 | | | | 478,285 | | | | 3,302 | | | | 37,541 | | | | (4,179 | ) | | | (44,722 | ) | | | 42,708 | | | | 471,104 | | |
Total net increase
(decrease) | | | 43,585 | | | | 478,285 | | | | 3,302 | | | | 37,541 | | | | (4,179 | ) | | | (44,722 | ) | | | 42,708 | | | | 471,104 | | |
International Small Cap Diversified Value Fund | |
Class I | | | — | | | | — | | | | 105,769 | | | | 1,250,186 | | | | — | | | | — | | | | 105,769 | | | | 1,250,186 | | |
Total net
increase | | | — | | | | — | | | | 105,769 | | | | 1,250,186 | | | | — | | | | — | | | | 105,769 | | | | 1,250,186 | | |
Value Opportunities Fund | |
Class I | | | 3,575,584 | | | | 128,311,658 | | | | 780,362 | | | | 27,125,388 | | | | (3,557,601 | ) | | | (123,386,823 | ) | | | 798,345 | | | | 32,050,223 | | |
Class A | | | 844,282 | | | | 31,659,953 | | | | 230,848 | | | | 8,035,833 | | | | (880,861 | ) | | | (31,444,575 | ) | | | 194,269 | | | | 8,251,211 | | |
Class C | | | 77,124 | | | | 2,503,437 | | | | 85,298 | | | | 2,702,238 | | | | (209,615 | ) | | | (7,021,658 | ) | | | (47,193 | ) | | | (1,815,983 | ) | |
Class Z | | | 57,348 | | | | 2,174,312 | | | | 168,511 | | | | 5,855,755 | | | | (3,466 | ) | | | (119,596 | ) | | | 222,393 | | | | 7,910,471 | | |
Total net increase
(decrease) | | | 4,554,338 | | | | 164,649,360 | | | | 1,265,019 | | | | 43,719,214 | | | | (4,651,543 | ) | | | (161,972,652 | ) | | | 1,167,814 | | | | 46,395,922 | | |
High Yield Fund | |
Class I | | | 19,594,772 | | | | 219,369,723 | | | | 2,740,407 | | | | 30,472,864 | | | | (31,042,395 | ) | | | (341,709,942 | ) | | | (8,707,216 | ) | | | (91,867,355 | ) | |
Class A | | | 997,235 | | | | 11,111,506 | | | | 118,868 | | | | 1,309,300 | | | | (1,559,228 | ) | | | (17,292,289 | ) | | | (443,125 | ) | | | (4,871,483 | ) | |
Class C | | | 8,155 | | | | 87,190 | | | | 3,410 | | | | 37,999 | | | | (54,796 | ) | | | (617,636 | ) | | | (43,231 | ) | | | (492,447 | ) | |
Class Z | | | 1,177,285 | | | | 13,354,141 | | | | 460,163 | | | | 5,101,501 | | | | (6,459,093 | ) | | | (73,909,868 | )1 | | | (4,821,645 | ) | | | (55,454,226 | ) | |
Total net increase
(decrease) | | | 21,777,447 | | | | 243,922,560 | | | | 3,322,848 | | | | 36,921,664 | | | | (39,115,512 | ) | | | (433,529,735 | ) | | | (14,015,217 | ) | | | (152,685,511 | ) | |
76
| | | Sales | | Reinvestment of
dividends
and distributions | | Redemptions | | Net increase (decrease) | |
| | | Shares | | Amount | | Shares | | Amount | | Shares | | Amount | | Shares | | Amount | |
Year Ended June 30, 2021 | |
Diversified Value Fund | |
Class I | | | 388,515 | | | $ | 9,134,799 | | | | 47,787 | | | $ | 945,231 | | | | (919,488 | ) | | $ | (18,376,345 | ) | | | (483,186 | ) | | $ | (8,296,315 | ) | |
Class A | | | 309,619 | | | | 7,601,562 | | | | 10,034 | | | | 199,372 | | | | (209,895 | ) | | | (4,296,478 | ) | | | 109,758 | | | | 3,504,456 | | |
Class C | | | 4,993 | | | | 113,057 | | | | 395 | | | | 7,851 | | | | (30,013 | ) | | | (617,450 | ) | | | (24,625 | ) | | | (496,542 | ) | |
Total net increase
(decrease) | | | 703,127 | | | | 16,849,418 | | | | 58,216 | | | | 1,152,454 | | | | (1,159,396 | ) | | | (23,290,273 | ) | | | (398,053 | ) | | | (5,288,401 | ) | |
Large Cap Value Fund | |
Class I | | | 1,630,439 | | | | 58,814,186 | | | | 108,040 | | | | 3,746,815 | | | | (4,570,468 | ) | | | (153,030,901 | ) | | | (2,831,989 | ) | | | (90,469,900 | ) | |
Class A | | | 547,262 | | | | 17,191,830 | | | | 26,192 | | | | 904,152 | | | | (1,365,291 | ) | | | (46,254,599 | ) | | | (791,837 | ) | | | (28,158,617 | ) | |
Class C | | | 30,782 | | | | 1,239,736 | | | | 429 | | | | 14,725 | | | | (220,060 | ) | | | (6,389,890 | ) | | | (188,849 | ) | | | (5,135,429 | ) | |
Class Z | | | 145,638 | | | | 5,398,783 | | | | 4,508 | | | | 156,287 | | | | (109,767 | ) | | | (3,637,239 | ) | | | 40,379 | | | | 1,917,831 | | |
Total net increase
(decrease) | | | 2,354,121 | | | | 82,644,535 | | | | 139,169 | | | | 4,821,979 | | | | (6,265,586 | ) | | | (209,312,629 | ) | | | (3,772,296 | ) | | | (121,846,115 | ) | |
Mid-Cap Value Fund | |
Class I | | | 2,034,241 | | | | 74,003,540 | | | | 150,488 | | | | 4,765,946 | | | | (4,130,991 | ) | | | (126,048,480 | ) | | | (1,946,262 | ) | | | (47,278,994 | ) | |
Class A | | | 512,685 | | | | 18,014,959 | | | | 34,687 | | | | 1,081,182 | | | | (961,777 | ) | | | (30,369,369 | ) | | | (414,405 | ) | | | (11,273,228 | ) | |
Class C | | | 41,054 | | | | 1,310,259 | | | | 5,405 | | | | 145,947 | | | | (258,433 | ) | | | (6,510,643 | ) | | | (211,974 | ) | | | (5,054,437 | ) | |
Class Z | | | 188,321 | | | | 5,245,488 | | | | 13,604 | | | | 430,698 | | | | (377,921 | ) | | | (11,518,930 | ) | | | (175,996 | ) | | | (5,842,744 | ) | |
Total net increase
(decrease) | | | 2,776,301 | | | | 98,574,246 | | | | 204,184 | | | | 6,423,773 | | | | (5,729,122 | ) | | | (174,447,422 | ) | | | (2,748,637 | ) | | | (69,449,403 | ) | |
Small Cap Value Fund | |
Class I | | | 2,213,459 | | | | 122,660,692 | | | | 24,995 | | | | 1,324,472 | | | | (3,534,703 | ) | | | (185,550,995 | ) | | | (1,296,249 | ) | | | (61,565,831 | ) | |
Class A | | | 115,015 | | | | 5,964,674 | | | | 2,421 | | | | 127,797 | | | | (288,290 | ) | | | (15,111,244 | ) | | | (170,854 | ) | | | (9,018,773 | ) | |
Class C | | | 4,424 | | | | 205,247 | | | | 121 | | | | 5,147 | | | | (83,097 | ) | | | (3,308,200 | ) | | | (78,552 | ) | | | (3,097,806 | ) | |
Class Z | | | 51,443 | | | | 2,367,616 | | | | 1,634 | | | | 86,524 | | | | (74,867 | ) | | | (3,718,701 | ) | | | (21,790 | ) | | | (1,264,561 | ) | |
Total net increase
(decrease) | | | 2,384,341 | | | | 131,198,229 | | | | 29,171 | | | | 1,543,940 | | | | (3,980,957 | ) | | | (207,689,140 | ) | | | (1,567,445 | ) | | | (74,946,971 | ) | |
Small Cap Diversified Value Fund | |
Class I | | | 17,925,513 | | | | 207,063,514 | | | | 215,613 | | | | 2,313,526 | | | | (5,783,195 | ) | | | (68,151,190 | ) | | | 12,357,931 | | | | 141,225,850 | | |
Class A | | | 1,276,079 | | | | 16,656,640 | | | | 1,757 | | | | 18,763 | | | | (850,723 | ) | | | (10,840,534 | ) | | | 427,113 | | | | 5,834,869 | | |
Class Z | | | 82,187 | | | | 796,426 | | | | 632 | | | | 6,779 | | | | (3,048 | ) | | | (37,947 | ) | | | 79,771 | | | | 765,258 | | |
Total net increase
(decrease) | | | 19,283,779 | | | | 224,516,580 | | | | 218,002 | | | | 2,339,068 | | | | (6,636,966 | ) | | | (79,029,671 | ) | | | 12,864,815 | | | | 147,825,977 | | |
Global Value Fund | |
Class I | | | 115,647 | | | | 1,428,513 | | | | 35,157 | | | | 415,199 | | | | (461,494 | ) | | | (4,924,372 | ) | | | (310,690 | ) | | | (3,080,660 | ) | |
Class A | | | 99,368 | | | | 1,276,822 | | | | 230 | | | | 2,722 | | | | (15,454 | ) | | | (213,257 | ) | | | 84,144 | | | | 1,066,287 | | |
Total net increase
(decrease) | | | 215,015 | | | | 2,705,335 | | | | 35,387 | | | | 417,921 | | | | (476,948 | ) | | | (5,137,629 | ) | | | (226,546 | ) | | | (2,014,373 | ) | |
International Value Fund | |
Class I | | | — | | | | — | | | | 3,029 | | | | 30,073 | | | | (31,047 | ) | | | (380,637 | ) | | | (28,018 | ) | | | (350,564 | ) | |
Total net increase
(decrease) | | | — | | | | — | | | | 3,029 | | | | 30,073 | | | | (31,047 | ) | | | (380,637 | ) | | | (28,018 | ) | | | (350,564 | ) | |
International Small Cap Diversified Value Fund | |
Class I | | | 439,500 | | | | 4,395,000 | | | | 9,711 | | | | 120,245 | | | | — | | | | — | | | | 449,211 | | | | 4,515,245 | | |
Total net
increase | | | 439,500 | | | | 4,395,000 | | | | 9,711 | | | | 120,245 | | | | — | | | | — | | | | 449,211 | | | | 4,515,245 | | |
Value Opportunities Fund | |
Class I | | | 4,392,877 | | | | 136,803,581 | | | | 137,703 | | | | 4,054,081 | | | | (11,859,433 | ) | | | (304,077,970 | ) | | | (7,328,853 | ) | | | (163,220,308 | ) | |
Class A | | | 553,432 | | | | 16,561,166 | | | | 44,459 | | | | 1,311,078 | | | | (1,558,031 | ) | | | (47,688,345 | ) | | | (960,140 | ) | | | (29,816,101 | ) | |
Class C | | | 68,900 | | | | 2,124,274 | | | | 18,303 | | | | 496,749 | | | | (589,010 | ) | | | (15,299,430 | ) | | | (501,807 | ) | | | (12,678,407 | ) | |
Class Z | | | 482,089 | | | | 11,850,275 | | | | 31,409 | | | | 924,361 | | | | (57,415 | ) | | | (1,889,718 | ) | | | 456,083 | | | | 10,884,918 | | |
Total net increase
(decrease) | | | 5,497,298 | | | | 167,339,296 | | | | 231,874 | | | | 6,786,269 | | | | (14,063,889 | ) | | | (368,955,463 | ) | | | (8,334,717 | ) | | | (194,829,898 | ) | |
77
| | | Sales | | Reinvestment of
dividends
and distributions | | Redemptions | | Net increase (decrease) | |
| | | Shares | | Amount | | Shares | | Amount | | Shares | | Amount | | Shares | | Amount | |
Year Ended June 30, 2021 | |
High Yield Fund | |
Class I | | | 26,682,118 | | | $ | 295,880,004 | | | | 3,585,419 | | | $ | 39,484,060 | | | | (51,926,052 | ) | | $ | (568,277,147 | ) | | | (21,658,515 | ) | | $ | (232,913,083 | ) | |
Class A | | | 1,308,362 | | | | 14,322,042 | | | | 151,389 | | | | 1,652,147 | | | | (2,343,278 | ) | | | (25,304,609 | ) | | | (883,527 | ) | | | (9,330,420 | ) | |
Class C | | | 20,286 | | | | 221,602 | | | | 7,151 | | | | 78,592 | | | | (128,763 | ) | | | (1,418,010 | ) | | | (101,326 | ) | | | (1,117,816 | ) | |
Class Z | | | 4,297,840 | | | | 47,212,468 | | | | 994,609 | | | | 10,912,278 | | | | (38,336,219 | ) | | | (418,337,701 | )2 | | | (33,043,770 | ) | | | (360,212,955 | ) | |
Total net increase
(decrease) | | | 32,308,606 | | | | 357,636,116 | | | | 4,738,568 | | | | 52,127,077 | | | | (92,734,312 | ) | | | (1,013,337,467 | ) | | | (55,687,138 | ) | | | (603,574,274 | ) | |
1 Includes an in-kind redemption which resulted in a realized gain of $912,500.
2 Includes in-kind redemptions which resulted in a realized loss of $(11,634,796).
NOTE 6.
Investments in Affiliated Issuers. An issuer in which a Fund's holdings represent 5% or more of the outstanding voting securities of the issuer is an "affiliated" issuer as defined in the 1940 Act. A schedule of each Fund's investments in securities of affiliated issuers held during the year ended June 30, 2022, is set forth below:
Small Cap Value Fund
| Issuer Name | | Value at
June 30, 2021 | | Purchases | | Sales | | Net Realized
Gains (Losses) | | Net Change in
Unrealized
Appreciation/
Depreciation | | Value at
June 30, 2022 | | Dividends | | Shares
Held at
June 30, 2022 | |
Hudson Global,
Inc. | | $ | 3,375,577 | | | $ | — | | | $ | (682,486 | ) | | $ | (3,932,098 | ) | | $ | 6,563,191 | | | $ | 5,324,184 | | | $ | — | | | | 169,560 | | |
Noranda Aluminum
Holding Corp. | | | 40,015 | | | | — | | | | — | | | | — | | | | (40,015 | ) | | | 0 | | | | — | | | | 800,300 | | |
| | $ | 3,415,592 | | | $ | — | | | $ | (682,486 | ) | | $ | (3,932,098 | ) | | $ | 6,523,176 | | | $ | 5,324,184 | | | $ | — | | | | | | |
Value Opportunities Fund
| Issuer Name | | Value at
June 30, 2021 | | Purchases | | Sales | | Net Realized
Gains (Losses) | | Net Change in
Unrealized
Appreciation/
Depreciation | | Value at
June 30, 2022 | | Dividends | | Shares
Held at
June 30, 2022 | |
Iracore Investments
Holdings, Inc. | | $ | 12,061,957 | | | $ | — | | | $ | — | | | $ | — | | | $ | (2,458,561 | ) | | $ | 9,603,396 | | | $ | — | | | | 32,422 | | |
| | $ | 12,061,957 | | | $ | — | | | $ | — | | | $ | — | | | $ | (2,458,561 | ) | | $ | 9,603,396 | | | $ | — | | | | | | |
High Yield Fund
| Issuer Name | | Value at
June 30, 2021 | | Purchases | | Sales | | Net Realized
Gains (Losses) | | Net Change in
Unrealized
Appreciation/
Depreciation | | Value at
June 30, 2022 | | Dividends | | Shares
Held at
June 30, 2022 | |
Metals Recovery Holdings
LLC (formerly American
Zinc Recycling Corp.). | | $ | 33,125,311 | | | $ | — | | | $ | (10,813,948 | ) | | $ | 46 | | | $ | (3,803,040 | ) | | $ | 18,508,369 | | | $ | — | | | $ | 116,127 | | |
Iracore Investments
Holdings, Inc. | | | 8,318,963 | | | | — | | | | — | | | | — | | | | (1,695,635 | ) | | | 6,623,328 | | | | — | | | | 22,361 | | |
Lonestar Resources
US, Inc.+ | | | 5,554,537 | | | | — | | | | (1,127,165 | ) | | | — | | | | (4,427,372 | ) | | | — | | | | — | | | | — | | |
PetroQuest Energy, Inc. | | | 0 | | | | — | | | | — | | | | — | | | | 1,255,669 | | | | 1,255,669 | | | | — | | | | 8,969,064 | | |
RA Parent, Inc.+ | | | 12,802,524 | | | | — | | | | (8,406,385 | ) | | | (1,291,091 | ) | | | 6,053,952 | | | | 9,159,000 | | | | — | | | | 142 | | |
| | $ | 59,801,335 | | | $ | — | | | $ | (20,347,498 | ) | | $ | (1,291,045 | ) | | $ | (2,616,426 | ) | | $ | 35,546,366 | | | $ | — | | | | | | |
+ Issuer was not an affiliate as of June 30, 2022.
78
NOTE 7.
Securities Lending. Effective December 2007, the Funds entered into a securities lending arrangement with Brown Brothers Harriman & Co. (the "Custodian"). Under the securities lending agreement, the Custodian is authorized to loan securities on behalf of the Funds to approved brokers. In exchange, the Funds receive cash collateral in the amount of at least 102% of the value of the securities loaned plus accrued interest. The total market value of securities on loan for each Fund is disclosed on the Schedule of Investments. The cash collateral is invested in short-term instruments as noted on the Schedule of Investments. The contractual maturity of the cash collateral received under the securities lending agreement is classified as overnight and continuous. Income earned from these investments is included in "Securities on loan, net" on the Statements of Operations and is allocated to each Fund based on each Fund's proportion of the total cash collateral received. Securities lending involves counterparty risks, including the risk that the loaned securities may not be returned in a timely manner or at all. Subject to certain conditions, the Custodian has agreed to indemnify the Funds from losses resulting from a borrower's failure to return a loaned security. In addition, the Funds bear the risk of loss associated with the investment of cash collateral received.
A portion of the income generated by the investment of the collateral, net of any rebates paid by the Custodian to borrowers, is remitted to the Custodian as lending agent, and the remainder is paid to the applicable Fund.
NOTE 8.
Commitments and Contingencies. Under the Trust's organizational documents and indemnification agreements between each independent Trustee and the Trust, its officers and Trustees are indemnified against certain liability arising out of the performance of their duties to the Trust. In addition, in the normal course of business the Trust enters into contracts that contain a variety of representations and warranties, which provide general indemnifications. The Funds' maximum exposure under these arrangements is unknown, as this would involve future claims that may be made against the Funds.
Bridge loan commitments may obligate a Fund to furnish temporary financing to a borrower until permanent financing can be arranged. At June 30, 2022, the Funds did not have any outstanding bridge loan commitments.
Unfunded loan commitments are contractual obligations for funding to a borrower. At June 30, 2022, the Funds did not have any outstanding unfunded loan commitments..
NOTE 9.
Risk Factors. Investing in a Fund may involve certain risks including, but not limited to, those described below.
Lower rated debt securities generally have higher rates of interest and involve greater risk of default or price changes due to changes in the issuer's creditworthiness than higher rated debt securities. The market prices of these securities may fluctuate more than higher quality securities and may decline significantly in periods of general economic difficulty. There may be little trading in the secondary market for particular debt securities, which may make them more difficult to value or sell.
The prices of, and the income generated by, most debt securities held by a Fund may be affected by changing interest rates and by changes in the effective maturities and credit ratings of these securities. For example, the prices of debt securities in a Fund's portfolio generally will decline when interest rates rise and increase when interest rates fall. In addition, falling interest rates may cause an issuer to redeem, "call" or refinance a security before its stated maturity, which may result in the Fund having to reinvest the proceeds in lower yielding securities. Debt securities are also subject to credit risk, which is the possibility that the credit strength of an issuer will weaken and/or an issuer of a debt security will fail to make timely payments of principal or interest and the security will go into default. Longer maturity debt securities generally have higher rates of interest and may be subject to greater price fluctuations than shorter maturity debt securities.
The High Yield Fund has investments in securities or derivatives that utilize the London Interbank Offered Rate ("LIBOR") as the reference or benchmark rate for variable interest rate calculations. Regulators and financial industry working groups in several jurisdictions have worked over the past several years to identify alternative reference rates ("ARRs") to replace LIBOR and to assist with the transition to the new ARRs. In connection with the transition, on March 5, 2021 the UK Financial Conduct Authority (FCA), the regulator that oversees LIBOR, announced that the majority of LIBOR rates would cease to be published or would no longer be representative on January 1, 2022. Consequently, the publication of most LIBOR rates ceased at the end of 2021, but a selection of widely used USD LIBOR rates continues to be published until June 2023 to allow for an orderly transition away from these rates.
Although regulators have generally prohibited banking institutions from entering into new contracts that reference those USD LIBOR settings that continue to exist, there remains uncertainty and risks relating to certain "legacy" USD LIBOR instruments that were issued or entered into before December 31, 2021 and the process by which a replacement interest rate will be identified and implemented into these instruments when USD LIBOR is ultimately discontinued. The effects of such uncertainty and risks in "legacy" USD LIBOR instruments held by a Fund could result in losses to the Fund.
Certain Funds may invest in foreign (non-U.S.) securities and may experience more rapid and extreme changes in value than a fund that invests exclusively in securities of U.S. companies. The securities markets of many foreign countries are relatively small, with a limited number of companies representing a small number of industries. Additionally, reporting, accounting and auditing standards of foreign countries differ, in some cases significantly, from U.S. standards. Also, nationalization, expropriation or confiscatory taxation, currency blockage, political changes or diplomatic developments could adversely affect a Fund's investments in a foreign country.
The Funds are subject to management risk because each Fund is an actively managed investment portfolio. Consequently, the Funds are subject to the risks that the methods and analysis employed by the Advisor may not produce the desired results and result in losses to the Funds.
The prices of, and the income generated by, the common stocks and other equity securities held by a Fund may decline in response to certain events taking place around the world, including those directly involving the issuers whose securities are owned by the Fund; conditions affecting the general economy; overall market changes; local, regional or global political, social or economic instability; governmental or governmental agency responses to economic conditions; and currency, interest rate and commodity price fluctuations.
79
The impact of COVID-19, and other infectious illness outbreaks that may arise in the future, could adversely affect the economies of many nations or the entire global economy, individual issuers and capital markets in ways and with durations that cannot necessarily be foreseen. In addition, the impact of infectious illnesses in emerging market countries may be greater due to generally less established healthcare systems. Public health crises may exacerbate other pre-existing political, social and economic risks in certain countries or globally. The foregoing could impair the Funds' ability to maintain operational standards (such as with respect to satisfying redemption requests), disrupt the operations of the Funds' service providers, adversely affect the value and liquidity of the Funds' investments, and negatively impact the Funds' performance, and overall prevent the Funds from implementing their investment strategies and achieving their investment objectives.
Certain funds, accounts, individuals or affiliates may from time to time own (beneficially or of record) or control a significant percentage of a Fund's shares. Redemptions by these entities of their holdings in the Fund may impact the Fund's liquidity and net asset value ("NAV"). These redemptions may also force the Fund to sell securities.
NOTE 10.
New Accounting Pronouncements. In March 2020, FASB issued Accounting Standards Update ("ASU") No. 2020-04, Reference Rate Reform. The amendments in ASU No. 2020-04 provide optional expedients and exceptions for applying U.S. GAAP to contracts, hedging relationships, and other transactions affected by reference rate reform if certain criteria are met. In January 2021, the FASB issued ASU No. 2021-01, which clarifies that certain provisions in Topic 848, if elected by an entity, apply to derivative instruments that use an interest rate for margining, discounting, or contract price alignment that is modified as a result of reference rate reform. The ASUs are effective for all entities as of March 12, 2020 through December 31, 2022. Management is currently evaluating the impact of the optional guidance on the Funds' financial statements and disclosures. The Funds did not utilize the optional expedients and exceptions provided by ASU No. 2020-04 and ASU No. 2021-01 during the year ended June 30, 2022.
In June 2022, FASB issued ASU No. 2022-03, Fair Value Measurement (Topic 820): Fair Value Measurement of Equity Securities Subject to Contractual Sale Restrictions. The amendments in this update clarify the guidance in Topic 820 when measuring the fair value of an equity security subject to contractual sale restrictions and introduce new disclosure requirements related to such equity securities. The amendments are effective for fiscal years beginning after December 15, 2023, with early adoption permitted. Management is currently evaluating the impact of this guidance on the Funds' financial statements.
NOTE 11.
Subsequent Events. Management has evaluated subsequent events in the preparation of the Funds' financial statements and has determined that there are no events that require recognition or disclosure in the financial statements.
NOTE 12.(UNAUDITED)
Federal Tax Disclosure. The Funds designated as long-term capital gain dividends, pursuant to Internal Revenue Code Section 852(b)(3), the amount necessary to reduce the earnings and profits of the Funds related to net capital gains to zero for the tax year ended June 30, 2022.
For the year ended June 30, 2022, the following percentages of ordinary distributions paid qualify for the dividend received deduction available to corporate shareholders: Diversified Value Fund — 100.00%, Large Cap Value Fund — 100.00%, Mid-Cap Value Fund — 91.88%, Small Cap Value Fund — 100.00%, Small Cap Diversified Value Fund — 53.41%, Global Value Fund — 92.66%, International Value Fund — 1.05%, International Small Cap Diversified Value Fund — 0.00%, Value Opportunities Fund — 58.47%, High Yield Fund — 1.20%.
For the year ended June 30, 2022, the following percentages of ordinary distributions paid are designated as qualified dividend income under the Jobs and Growth Tax Relief Reconciliation Act of 2003: Diversified Value Fund — 100.00%, Large Cap Value Fund — 100.00%, Mid-Cap Value Fund — 100.00%, Small Cap Value Fund — 100.00%, Small Cap Diversified Value Fund — 55.24%, Global Value Fund — 100.00%, International Value Fund — 100.00%, International Small Cap Diversified Value Fund — 18.35%, Value Opportunities Fund — 85.20%, High Yield Fund — 1.20%. Shareholders should consult their tax advisors.
For the year ended June 30, 2022, the International Value Fund and International Small Cap Diversified Value Fund earned foreign source income of $96,566 and $222,591, respectively, and paid foreign taxes of $10,391 and $32,052, respectively, which each Fund intends to pass through to shareholders pursuant to Section 853 of the Internal Revenue Code.
Additional Information Applicable to Foreign Shareholders Only. For the year ended June 30, 2022, the Funds designate the following percentages of ordinary distributions paid as interest-related dividends under Internal Revenue Code Section 871(k)(1)(c): Diversified Value Fund — 0.00%, Large Cap Value Fund — 0.00%, Mid-Cap Value Fund — 0.00%, Small Cap Value Fund — 0.00%, Small Cap Diversified Value Fund — 0.00%, Global Value Fund — 0.10%, International Value Fund — 0.10%, International Small Cap Diversified Value Fund — 0.00%, Value Opportunities Fund — 14.51%, High Yield Fund — 94.81%.
For the year ended June 30, 2022, the following percentages of ordinary income distributions paid are designated as short-term capital gain distributions under Internal Revenue Code Section 871(k)(2)(c): Diversified Value Fund — 0.00%, Large Cap Value Fund — 0.00%, Mid-Cap Value Fund — 0.00%, Small Cap Value Fund — 0.00%, Small Cap Diversified Value Fund — 69.83%, Global Value Fund — 0.00%, International Value Fund — 0.00%, International Small Cap Diversified Value Fund — 84.90%, Value Opportunities Fund — 42.40%, High Yield Fund — 0.00%.
80
Report of Independent Registered Public Accounting Firm
To the Shareholders and Board of Trustees
of Hotchkis & Wiley Funds
Opinion on the Financial Statements and Financial Highlights
We have audited the accompanying statements of assets & liabilities of Hotchkis & Wiley Funds (the "Funds") comprising the Diversified Value Fund, Large Cap Value Fund, Mid-Cap Value Fund, Small Cap Value Fund, Small Cap Diversified Value Fund, Global Value Fund, International Value Fund, International Small Cap Diversified Value Fund, Value Opportunities Fund, and High Yield Fund, including the schedules of investments, as of June 30, 2022, the related statements of operations for the year then ended, the statements of changes in net assets for each of the two years in the period then ended (as to International Small Cap Diversified Value Fund, for the period from June 30, 2020 (commencement of operations) through June 30, 2021 and the year ended June 30, 2022), the financial highlights for each of the five years in the period then ended (as to International Small Cap Diversified Value Fund, for the period from June 30, 2020 (commencement of operations) through June 30, 2021, and the year ended June 30, 2022), and the related notes.
In our opinion, the financial statements and financial highlights present fairly, in all material respects, the financial position of each of the Funds constituting Hotchkis & Wiley Funds, except International Small Cap Diversified Value Fund, as of June 30, 2022, and the results of their operations for the year then ended, the changes in their net assets for each of the two years in the period then ended, and the financial highlights for each of the five years in the period then ended, in conformity with accounting principles generally accepted in the United States of America. Also, in our opinion, the financial statements and financial highlights present fairly, in all material respects, the financial position of International Small Cap Diversified Value Fund as of June 30, 2022; the results of its operations for the year then ended, and changes in net assets and financial highlights for the period from June 30, 2020 (commencement of operations) through June 30, 2021 and the year ended June 30, 2022, in conformity with accounting principles generally accepted in the United States of America.
Basis for Opinion
These financial statements and financial highlights are the responsibility of the Funds' management. Our responsibility is to express an opinion on the Funds' financial statements and financial highlights based on our audits. We are a public accounting firm registered with the Public Company Accounting Oversight Board (United States) (PCAOB) and are required to be independent with respect to the Funds in accordance with the U.S. federal securities laws and the applicable rules and regulations of the Securities and Exchange Commission and the PCAOB.
We conducted our audits in accordance with the standards of the PCAOB. Those standards require that we plan and perform the audit to obtain reasonable assurance about whether the financial statements and financial highlights are free of material misstatement, whether due to error or fraud. The Funds are not required to have, nor were we engaged to perform, an audit of their internal control over financial reporting. As part of our audits we are required to obtain an understanding of internal control over financial reporting but not for the purpose of expressing an opinion on the effectiveness of the Funds' internal control over financial reporting. Accordingly, we express no such opinion.
Our audits included performing procedures to assess the risks of material misstatement of the financial statements and financial highlights, whether due to error or fraud, and performing procedures that respond to those risks. Such procedures included examining, on a test basis, evidence regarding the amounts and disclosures in the financial statements and financial highlights. Our audits also included evaluating the accounting principles used and significant estimates made by management, as well as evaluating the overall presentation of the financial statements and financial highlights. Our procedures included confirmation of securities owned as of June 30, 2022, by correspondence with the custodian and brokers; when replies were not received from brokers, we performed other auditing procedures. We believe that our audits provide a reasonable basis for our opinion.
Los Angeles, California
August 22, 2022
We have served as the auditor of one or more Hotchkis & Wiley Funds investment companies since 2012.
81
Fund Expense Examples (Unaudited)
As a mutual fund shareholder, you incur two types of costs: (1) transaction costs such as initial sales charges (loads) on purchase payments and contingent deferred sales charges and redemption fees on redemptions and (2) ongoing costs, including management fees, distribution and service (12b-1) fees and other fund expenses. The following examples are intended to help you understand your ongoing costs (in dollars) of investing in the Funds and to compare these costs with the ongoing costs of investing in other mutual funds. The examples are based on an investment of $1,000 invested at the beginning of the most recent six-month period and held for the entire period (January 1, 2022 - June 30, 2022).
The table below illustrates the Funds' costs in two ways:
Based on actual fund returns. This section provides information about actual account values and actual expenses. You may use the information in this section, together with the amount you invested, to estimate the expenses that you paid over the period. Simply divide your account value by $1,000 (for example, an $8,600 account value divided by $1,000 = 8.6), then multiply the result by the number in the section under the heading entitled "Expenses Paid During Period" to estimate the expenses you paid on your account during this period.
Based on hypothetical 5% yearly returns. This section provides information about hypothetical account values and hypothetical expenses based on the Funds' actual expense ratios and an assumed rate of return of 5% per year before expenses, which is not the Funds' actual return. The hypothetical account values and expenses may not be used to estimate the actual ending account balance or expenses you paid for the period. You may use this information to compare the ongoing costs of investing in the Funds and other funds. To do so, compare this 5% hypothetical example with the 5% hypothetical examples that appear in the shareholder reports of the other funds.
Please note that the expenses shown in the table are meant to highlight your ongoing costs only and do not reflect any transactional costs, such as sales charges (loads). Therefore, the second section is useful in comparing ongoing costs only, and will not help you determine the relative total costs of owning different funds. In addition, if these transactional costs were included, your costs would have been higher.
The calculations assume no shares were bought or sold during the period. Your actual costs may have been higher or lower, depending on the amount of your investment and the timing of any purchases or redemptions.
| | Based on Actual Fund Returns | | Based on Hypothetical 5% Yearly Returns | | | |
| | Beginning
Account Value
1/1/22 | | Ending
Account Value
6/30/22 | | Expenses Paid
During Period*
1/1/22 - 6/30/22 | | Beginning
Account Value
1/1/22 | | Ending
Account Value
6/30/22 | | Expenses Paid
During Period*
1/1/22 - 6/30/22 | | Annualized
Expense Ratio | |
Diversified Value Fund | |
Class I | | $ | 1,000.00 | | | $ | 878.80 | | | $ | 3.73 | | | $ | 1,000.00 | | | $ | 1,020.83 | | | $ | 4.01 | | | | 0.80 | % | |
Class A | | | 1,000.00 | | | | 877.80 | | | | 4.89 | | | | 1,000.00 | | | | 1,019.59 | | | | 5.26 | | | | 1.05 | | |
Class C | | | 1,000.00 | | | | 874.20 | | | | 8.36 | | | | 1,000.00 | | | | 1,015.87 | | | | 9.00 | | | | 1.80 | | |
Large Cap Value Fund | |
Class I | | | 1,000.00 | | | | 877.00 | | | | 4.42 | | | | 1,000.00 | | | | 1,020.08 | | | | 4.76 | | | | 0.95 | | |
Class A | | | 1,000.00 | | | | 876.00 | | | | 5.49 | | | | 1,000.00 | | | | 1,018.94 | | | | 5.91 | | | | 1.18 | | |
Class C | | | 1,000.00 | | | | 872.90 | | | | 8.96 | | | | 1,000.00 | | | | 1,015.22 | | | | 9.64 | | | | 1.93 | | |
Class Z | | | 1,000.00 | | | | 877.40 | | | | 4.10 | | | | 1,000.00 | | | | 1,020.43 | | | | 4.41 | | | | 0.88 | | |
Mid-Cap Value Fund | |
Class I | | | 1,000.00 | | | | 919.60 | | | | 4.76 | | | | 1,000.00 | | | | 1,019.84 | | | | 5.01 | | | | 1.00 | | |
Class A | | | 1,000.00 | | | | 918.50 | | | | 5.71 | | | | 1,000.00 | | | | 1,018.84 | | | | 6.01 | | | | 1.20 | | |
Class C | | | 1,000.00 | | | | 914.90 | | | | 9.40 | | | | 1,000.00 | | | | 1,014.98 | | | | 9.89 | | | | 1.98 | | |
Class Z | | | 1,000.00 | | | | 920.20 | | | | 4.14 | | | | 1,000.00 | | | | 1,020.48 | | | | 4.36 | | | | 0.87 | | |
Small Cap Value Fund | |
Class I | | | 1,000.00 | | | | 915.10 | | | | 4.99 | | | | 1,000.00 | | | | 1,019.59 | | | | 5.26 | | | | 1.05 | | |
Class A | | | 1,000.00 | | | | 914.50 | | | | 5.70 | | | | 1,000.00 | | | | 1,018.84 | | | | 6.01 | | | | 1.20 | | |
Class C | | | 1,000.00 | | | | 911.20 | | | | 9.19 | | | | 1,000.00 | | | | 1,015.17 | | | | 9.69 | | | | 1.94 | | |
Class Z | | | 1,000.00 | | | | 916.10 | | | | 4.04 | | | | 1,000.00 | | | | 1,020.58 | | | | 4.26 | | | | 0.85 | | |
Small Cap Diversified Value Fund | |
Class I | | | 1,000.00 | | | | 868.10 | | | | 3.71 | | | | 1,000.00 | | | | 1,020.83 | | | | 4.01 | | | | 0.80 | | |
Class A | | | 1,000.00 | | | | 867.30 | | | | 4.86 | | | | 1,000.00 | | | | 1,019.59 | | | | 5.26 | | | | 1.05 | | |
Class Z | | | 1,000.00 | | | | 868.00 | | | | 3.57 | | | | 1,000.00 | | | | 1,020.98 | | | | 3.86 | | | | 0.77 | | |
Global Value Fund | |
Class I | | | 1,000.00 | | | | 844.40 | | | | 4.34 | | | | 1,000.00 | | | | 1,020.08 | | | | 4.76 | | | | 0.95 | | |
Class A | | | 1,000.00 | | | | 843.10 | | | | 5.48 | | | | 1,000.00 | | | | 1,018.84 | | | | 6.01 | | | | 1.20 | | |
82
Fund Expense Examples (Unaudited)
| | Based on Actual Fund Returns | | Based on Hypothetical 5% Yearly Returns | | | |
| | Beginning
Account Value
1/1/22 | | Ending
Account Value
6/30/22 | | Expenses Paid
During Period*
1/1/22 - 6/30/22 | | Beginning
Account Value
1/1/22 | | Ending
Account Value
6/30/22 | | Expenses Paid
During Period*
1/1/22 - 6/30/22 | | Annualized
Expense Ratio | |
International Value Fund | |
Class I | | | 1,000.00 | | | | 883.10 | | | | 4.44 | | | | 1,000.00 | | | | 1,020.08 | | | | 4.76 | | | | 0.95 | | |
International Small Cap Diversified Value Fund | |
Class I | | | 1,000.00 | | | | 848.30 | | | | 4.54 | | | | 1,000.00 | | | | 1,019.89 | | | | 4.96 | | | | 0.99 | | |
Value Opportunities Fund | |
Class I | | | 1,000.00 | | | | 827.60 | | | | 4.30 | | | | 1,000.00 | | | | 1,020.08 | | | | 4.76 | | | | 0.95 | | |
Class A | | | 1,000.00 | | | | 826.40 | | | | 5.39 | | | | 1,000.00 | | | | 1,018.89 | | | | 5.96 | | | | 1.19 | | |
Class C | | | 1,000.00 | | | | 823.50 | | | | 8.68 | | | | 1,000.00 | | | | 1,015.27 | | | | 9.59 | | | | 1.92 | | |
Class Z | | | 1,000.00 | | | | 828.10 | | | | 3.94 | | | | 1,000.00 | | | | 1,020.48 | | | | 4.36 | | | | 0.87 | | |
High Yield Fund | |
Class I | | | 1,000.00 | | | | 873.60 | | | | 3.25 | | | | 1,000.00 | | | | 1,021.32 | | | | 3.51 | | | | 0.70 | | |
Class A | | | 1,000.00 | | | | 873.10 | | | | 4.32 | | | | 1,000.00 | | | | 1,020.18 | | | | 4.66 | | | | 0.93 | | |
Class C | | | 1,000.00 | | | | 870.00 | | | | 7.88 | | | | 1,000.00 | | | | 1,016.36 | | | | 8.50 | | | | 1.70 | | |
Class Z | | | 1,000.00 | | | | 874.00 | | | | 2.79 | | | | 1,000.00 | | | | 1,021.82 | | | | 3.01 | | | | 0.60 | | |
* Expenses are equal to the Funds' annualized expense ratio by class multiplied by the average account value over the period, multiplied by the number of days in the most recent fiscal half-year (181), then divided by the number of days in the most recent fiscal year (365).
83
Board Considerations In Approving Continuation of Investment Advisory Agreements
Background and Approval Process. Hotchkis and Wiley Capital Management, LLC (the "Advisor") serves as investment adviser to the Hotchkis and Wiley Diversified Value Fund, the Hotchkis and Wiley Large Cap Value Fund, the Hotchkis and Wiley Mid-Cap Value Fund, the Hotchkis and Wiley Small Cap Value Fund, the Hotchkis and Wiley Small Cap Diversified Value Fund, the Hotchkis and Wiley Global Value Fund, the Hotchkis and Wiley International Value Fund, the Hotchkis and Wiley International Small Cap Diversified Value Fund, the Hotchkis and Wiley Value Opportunities Fund and the Hotchkis and Wiley High Yield Fund (each a "Fund" and collectively, the "Funds") pursuant to separate investment advisory agreements (the "Advisory Agreements") with the Hotchkis and Wiley Funds (the "Trust"). The Advisory Agreements were initially approved by the Board of Trustees at the inception of each Fund and continue thereafter if approved annually by the Board of Trustees of the Trust, including a majority of the Trustees who are not "interested persons" (as defined in the Investment Company Act of 1940, as amended (the "1940 Act")) (the "Independent Trustees"). The Advisory Agreements for each Fund were renewed by the Board at a meeting held in May 2022.
As part of the annual contract review process, the Independent Trustees, through their independent legal counsel, requested and received extensive materials, including information relating to: (i) the nature, extent and quality of services provided by the Advisor, along with compliance with legal requirements, (ii) short-term and longer-term total return of each Fund relative to its respective peer groups and benchmark indexes, (iii) the costs of the services provided and the Advisor's estimated profitability with respect to the management of each Fund, (iv) the extent to which the Advisor has in the past or is likely in the future to experience economies of scale in connection with the investment advisory services it provides to each Fund, (v) the expense ratios of each Fund as compared with the expense ratios of funds in its peer group, and (vi) fall-out benefits to the Advisor and its affiliates from its relationship with the Funds. The Independent Trustees also requested and received information related to the Advisor's processes for measuring, managing and monitoring risk. The Independent Trustees met with their independent legal counsel prior to the May 2022 Board meeting to review the materials provided by the Advisor and were advised regarding their fiduciary duties pertaining to renewal of investment advisory contracts and the factors they should consider in evaluating advisory agreements. The Independent Trustees, through their legal counsel, then provided follow-up questions to the Advisor which were addressed by the Advisor. The Independent Trustees noted that the information provided by the Advisor was thorough and responsive to their requests. The information provided in response to their requests was in addition to information received by the Board throughout the year, both in writing and during meetings, regarding the Funds, including Fund performance, expense ratios, portfolio composition and regulatory compliance.
At the May 2022 Board meeting, representatives of the Advisor discussed the Independent Trustees' requests and follow-up questions with the Board and responded to further questions. The Board determined that, given the totality of the information provided with respect to the Advisory Agreements, the Board had received sufficient information to renew each Advisory Agreement.
In deciding to approve the renewal of each Advisory Agreement, the Board did not identify any single factor or group of factors as all-important or controlling, and considered a variety of factors in its analysis including those discussed below. The Board did not allot a particular weight to any one factor or group of factors.
Nature, Extent and Quality of Services. As part of the Board's decision-making process, the Board noted that the Advisor and its predecessors have managed the Funds and their predecessors since their inception, and the Board believes that a long-term relationship with a capable, conscientious investment adviser is in the best interests of the Funds. The Board also considered that shareholders invest in a Fund specifically seeking the Advisor's investment expertise and style. The Board also noted that when shareholders invest in a Fund, they know the advisory fee that is paid by the Fund. In this connection, the Board considered, in particular, that each Fund is managed in accordance with its investment objective and policies as disclosed to shareholders.
The Board reviewed information regarding various services provided by the Advisor to the Funds, including an organizational chart and background information on personnel performing such services. The Board also reviewed each Fund's performance and information regarding the Advisor's investment approach, which is driven by team-oriented, in-depth, fundamental research. The Board considered the depth and quality of the Advisor's investment process, the low turnover rates of the Advisor's key personnel, the overall stability of the Advisor's organization, and the experience, capability and integrity of its senior management. The Board considered the portfolio managers' significant investments in the Funds. The Board reviewed the Trust's compliance program and the resultant compliance by the Funds and the Advisor with legal requirements.
The Board also considered other non-advisory services provided to the Funds, such as the services of Advisor employees as Trust officers and other personnel provided that are necessary for Fund operations. The Board noted that the Advisor organizes Board meetings and the preparation of Board meeting materials, and those Advisor employees serving as Trust officers oversee and manage the other Fund service providers.
Based on their review, the Board concluded that the nature, extent and quality of services provided to each Fund under its Advisory Agreement were satisfactory.
Investment Performance of the Funds and the Advisor. The Board noted that it reviews data on the short-term and longer-term total returns of the Funds in connection with each quarterly Board meeting. For the contract review meeting, the Board reviewed a report prepared by the Trust's administrator (the "Report") using information provided by Morningstar, Inc., an independent provider of mutual fund data, that compared the annualized total return of Class I shares of each Fund to the median annualized total returns of a group of funds that are similar, primarily in terms of investment style (each, a "Peer Group"), and to the annualized total returns of the Fund's primary and secondary (for Funds that have secondary benchmarks) benchmark indexes for the one-, three-, five- and ten-year periods, as applicable, ended December 31, 2021 and for the three- and six-month, one-, three-, five- and ten-year periods ended March 31, 2022. The Peer Groups were reviewed and selected by the Advisor based on its criteria to determine an appropriate group of competitor funds. In addition, data regarding performance of the Peer Group funds is provided at each quarterly Board meeting.
The Board noted all Funds outperformed the median returns of their respective Peer Groups and the returns of their respective primary and secondary (for Funds that have secondary benchmarks) benchmark indexes for the three- and six-month periods ended March 31, 2022. The Board considered that
84
all Funds outperformed the median returns of their respective Peer Groups and the returns of their respective primary and secondary (for Funds that have secondary benchmarks) benchmark indexes for the one-year period ended December 31, 2021, except that the International Small Cap Diversified Value Fund's performance was the same as the median return of its Peer Group. The Board also considered that the Value Opportunities Fund outperformed, and the Mid-Cap Value Fund, Small Cap Value Fund and High Yield Fund each underperformed, the median returns of their respective Peer Groups and the returns of their respective primary benchmark indexes for the three- and five-year periods ended December 31, 2021. The Board considered that the Global Value Fund and the International Value Fund outperformed the median returns of their respective Peer Groups and underperformed the returns of their respective primary benchmark indexes for the three-year period ended December 31, 2021, and the Funds underperformed the median returns of their respective Peer Groups and the returns of their respective primary benchmark indexes for the five-year period ended December 31, 2021. The Board considered that the Diversified Value Fund outperformed the median return of its Peer Group and the return of its primary benchmark index for the three-year period ended December 31, 2021, and the Fund underperformed the median return of its Peer Group and outperformed the return of its primary benchmark index for the five-year period ended December 31, 2021. The Board also considered that the Large Cap Value Fund and Small Cap Diversified Value Fund underperformed the median returns of their respective Peer Groups and outperformed the returns of their respective primary benchmark indexes for the three-year period ended December 31, 2021, the Large Cap Value Fund underperformed the median return of its Peer Group and the return of its primary benchmark index for the five-year period ended December 31, 2021, and the Small Cap Diversified Value Fund matched the median return of its Peer Group and outperformed the return of its primary benchmark index for the five-year period ended December 31, 2021. The Board also considered that the International Small Cap Diversified Value Fund commenced operation on June 30, 2020. The Board considered that the Advisor had been consistent in its approach to managing portfolios and that it anticipated the Funds' underperformance in markets where growth style investing outperforms value style investing.
Fees, Expenses and Profitability. The Board reviewed expense data using information provided by Morningstar, Inc., contained in the Report, including information regarding applicable expense limitations for the Funds' share classes. The Board reviewed data in the Report showing how the Funds' advisory fees and expense ratios compared to those in their respective Peer Groups. The Board also reviewed information provided by the Advisor on advisory fees charged by the Advisor for sub-advisory services it provides to other mutual funds and advisory fees it charges to its separate account clients with investment objectives and policies similar to those of the Funds. The Board considered a list of the many additional functions performed for the Funds that the Advisor does not perform for its separate account and sub-advisory clients and noted it is generally acknowledged that managing mutual funds subjects an investment adviser to more legal and regulatory risk than is the case with separate accounts.
With respect to the advisory fee for each Fund, the Board noted that the Report showed that the Diversified Value, Large Cap Value, International Value and High Yield Funds' advisory fees were higher than the median of their respective Peer Groups, that the Small Cap Value and International Small Cap Diversified Value Funds' advisory fees were lower than the median of their respective Peer Groups, and that the Mid-Cap Value, Small Cap Diversified Value, Global Value and Value Opportunities Funds' advisory fees were the same as the median of their respective Peer Groups. The Board noted that the Advisor uses a fundamental research-intensive process. The Board considered the expense caps put in place by the Advisor (as further described below). The Board noted the quality of the Advisor's investment process and concluded that the advisory fee and expense ratios were fair and reasonable for each Fund.
The Board reviewed information concerning the estimated profitability to the Advisor of the Advisory Agreements, including information regarding the methodology for allocating expenses. The Board reviewed data regarding the Advisor's variable expenses and fixed expenses. The Board considered that in 2021, as in recent prior years, the Advisor had absorbed costs above expense caps for certain of the Funds for which it would not be reimbursed. The Board also noted that the annualized expense ratio was above the expense cap for the Diversified Value, Large Cap Value, Small Cap Diversified Value, Global Value, International Value, International Small Cap Diversified Value and High Yield Funds in 2021. The Board noted that the Advisor has agreed to continue the expense caps for the share classes of each Fund through at least August 29, 2022 (subsequently extended to August 31, 2023). The Board also recognized that individual fund or product line profitability of other advisers is generally not publicly available, and that profitability may be affected by numerous factors, so that the comparability of profitability among advisory firms is limited. The Board noted the importance of the Advisor's profitability — which is derived solely from investment management fees — in maintaining its entrepreneurial environment in a private, primarily employee-owned structure. They noted that the Advisor's compensation/profit structure facilitates retention of its management and investment professionals. The Board concluded that the level of estimated profitability to the Advisor under the Advisory Agreements was not unreasonable.
Economies of Scale and Whether Fee Levels Reflect These Economies of Scale. The Board considered information regarding the investment, compliance and client service personnel who have been hired by the Advisor. The Board considered the amount of advisory fees that the Advisor waived and Fund operating expenses that the Advisor reimbursed in 2021 to the benefit of certain Funds and their shareholders. The Board considered that the breakpoints in the Diversified Value, Large Cap Value and Mid Cap Value Funds' advisory fee schedules can enable shareholders to share in economies of scale.
Indirect Benefits to the Advisor from its Relationship to the Funds. The Board considered information regarding any indirect benefits to the Advisor that could be identified from its relationship to the Funds. In particular, the Board considered that the Advisor has the ability to use commission sharing arrangements that allow the Advisor to pay for third-party research with the equity Funds' soft dollars. The Board considered that the bundled research services and the use of commission sharing arrangements provides valuable information or service to the investment research process, which benefits the Funds (as well as the Advisor who uses (or can use) the research for the benefit of the Advisor's other clients). The Board also considered that the Advisor indirectly benefits from the Funds' payment of sub-transfer agency expenses. The Board noted that the ability to use the Funds' soft dollars to obtain third-party research is a fallout benefit to the Advisor.
* * * *
Based on their review, including their consideration of each of the factors referred to above, the Board, including all of the Independent Trustees, concluded that the terms of each Advisory Agreement are fair and reasonable and that the renewal of each Fund's Advisory Agreement is in the best interests of the Fund.
85
Statement Regarding Liquidity Risk Management Program
Consistent with Rule 22e-4 under the Investment Company Act of 1940, the Funds have established a liquidity risk management program to govern their approach to managing liquidity risk, i.e., the risk that a Fund could not meet redemption requests without significant dilution of remaining investors' interests in the Fund (the "Program"). The Program is overseen by the Liquidity Risk Management Committee (the "Committee"), a committee comprised of representatives of Hotchkis & Wiley Capital Management, LLC, the Funds' investment adviser. The Funds' Board of Trustees ("Board") has approved the designation of the Committee to oversee the Program. The Program's principal objectives include supporting each Fund's compliance with limits on investments in illiquid assets and mitigating the risk that a Fund will be unable to meet its redemption obligations timely. The Program also includes a number of elements that support the management and assessment of liquidity risk, including an annual assessment of factors that influence a Fund's liquidity and the periodic classification and re-classification of a Fund's investments into groupings that reflect the Committee's assessment of their relative liquidity under current market conditions. At a meeting of the Board on May 17, 2022, the Committee provided a written report to the Board addressing the operation, adequacy, and effectiveness of implementation of the Program for the period of April 1, 2021 through March 31, 2022 (the "Review Period").
During the Review Period, there were no liquidity events that impacted the Funds or their respective ability to timely meet redemptions without dilution to existing shareholders, no Fund breached the 15% limit on illiquid investments, and no material changes were made to the Program. The report concluded that the process for classifying the Funds' portfolio investments is working effectively, each Fund primarily holds assets that are highly liquid, each Fund's liquidity risk is low and the liquidity of each Fund is sufficient to meet anticipated redemptions. The Committee determined, and reported to the Board, that the Program had been implemented and operated in an adequate and effective manner.
There can be no assurance that the Program will achieve its objectives in the future. Please refer to the Funds' Prospectus or Statement of Additional Information for more information regarding a Fund's exposure to liquidity risk and other principal risks to which an investment in a Fund may be subject.
86
INDEPENDENT TRUSTEES
Name and Year of Birth | | Position
Held with
the Trust | | Term of
Office* and
Length of
Time Served | | Principal Occupation(s) During
Past Five Years | | Number of
Portfolios in
Fund Complex
Overseen by
Trustee | | Other
Directorships
Held by Trustee
During Past
Five Years | |
Randall H. Breitenbach
(born 1960) | | Trustee
Chairman | | Since 2001
Since 2018 | | Founder, Chief Executive Officer and Chairman of Bridge Energy LLC (2017 — present); Chairman Emeritus of Stanford University PIC Endowment (1999 — present); Formerly, Founder, Chief Executive Officer and Chairman of Pacific Coast Energy Company, LP (1988 — 2019); Founder, Chief Executive Officer and Chairman of BreitBurn Energy Company (1988 — 2012). | | Ten | | BreitBurn Energy Partners, L.P.; Pacific Coast Energy Company, LP | |
Alejandra C. Edwards, Ph.D.
(born 1954) | | Trustee(a) | | Since 2007 | | President of Chilean Association of Pension Fund Administrators (2021 — present); Member of Queens Care's Investment Committee (2017 — present); Formerly, California State University — Long Beach: Professor of Economics (1994 – 2015). | | Ten | | None | |
Marcy Elkind, Ph.D.
(born 1947) | | Trustee
Vice Chair | | Since 2005
Since 2018 | | President, Elkind Economics, Inc. (1980 — present). | | Ten | | None | |
Robert Fitzgerald
(born 1952) | | Trustee(b) | | Since 2005 | | Retired. Formerly, Chief Financial Officer of National Retirement Partners, Inc. (2005 — 2007); Executive Vice President and Chief Financial Officer of PIMCO Advisors L.P. (1995 — 2001). | | Ten | | Independent Trustee, Brandes Investment Trust (8 portfolios) | |
H. Thomas Hicks
(born 1950) | | Trustee(c) | | Since 2017 | | Retired. Formerly, Chief Financial Officer, URS Corporation (2005 — 2015). | | Ten | | Aptim Corp. | |
* Each Independent Trustee serves until his or her successor is elected and qualified or until his or her death or resignation or removal as provided in the Trust's Agreement and Declaration of Trust.
(a) Chair of the Nominating and Governance Committee.
(b) Chair of the Audit Committee.
(c) Vice Chair of the Audit Committee.
INTERESTED TRUSTEE
Name and Year of Birth | | Position
Held with
the Trust | | Term of
Office** and
Length of
Time Served | | Principal Occupation(s) During
Past Five Years | | Number of
Portfolios in
Fund Complex
Overseen by
Trustee | | Other
Directorships
Held by Trustee
During Past
Five Years | |
George H. Davis, Jr.*
(born 1961) | | Trustee | | Since 2007 | | Executive Chairman (2021 — present) and Portfolio Manager (2001 — present) of Hotchkis & Wiley Capital Management, LLC (the "Advisor"). Formerly, Chief Executive Officer of the Advisor (2001 — 2021). | | Ten | | None | |
* Mr. Davis is considered an "interested person," as defined in the 1940 Act, of the Trust based on his positions with the Advisor.
** As Trustee, Mr. Davis serves until his successor is elected and qualified or until his death or resignation or removal as provided in the Trust's Agreement and Declaration of Trust.
OFFICERS
Name and Year of Birth | | Position
Held with
the Trust | | Term of
Office* and
Length of
Time Served | | Principal Occupation(s) During Past Five Years | |
Anna Marie Lopez
(born 1967) | | President | | Since 2007 | | Chief Operating Officer of the Advisor (2007 — present). | |
Mark McMahon
(born 1968) | | Vice President and Secretary | | Since 2006 | | Managing Director, Mutual Fund Operations of the Advisor (2006 — present). | |
James Menvielle
(born 1972) | | Vice President and Treasurer | | Since 2007 | | Chief Financial Officer of the Advisor (2006 — present). | |
Stacey Gillespie
(born 1974) | | Chief Compliance Officer | | Since 2021 | | Director and Chief Compliance Officer of ACA Foreside (2015 — present). | |
* Each officer is appointed by and serves at the pleasure of the Board of Trustees of the Trust.
The Statement of Additional Information includes additional information about the Trust's Trustees and officers, and is available without charge upon request by calling the transfer agent at 1-866-HW-FUNDS (1-866-493-8637). The address for all Trustees and officers of the Trust, except Stacey Gillespie, is c/o Hotchkis & Wiley Capital Management, LLC, 601 South Figueroa Street, 39th Floor, Los Angeles, CA 90017, attention: Trust Secretary. The address for Stacey Gillespie is c/o ACA Foreside 480 East Swedesford Road, Suite 220, Wayne, PA 19087.
87
Information about the Funds
ADVISOR
Hotchkis & Wiley Capital Management, LLC
601 South Figueroa Street, 39th Floor
Los Angeles, California 90017
LEGAL COUNSEL
Vedder Price P.C.
222 North LaSalle Street, Suite 2600
Chicago, Illinois 60601
INDEPENDENT REGISTERED PUBLIC ACCOUNTING FIRM
Deloitte & Touche LLP
555 West 5th Street, Suite 2700
Los Angeles, California 90013
DISTRIBUTOR
Quasar Distributors, LLC
111 East Kilbourn Avenue, Suite 2200
Milwaukee, Wisconsin 53202
ADMINISTRATOR AND TRANSFER AGENT
U.S. Bancorp Fund Services, LLC
615 East Michigan Street, 3rd Floor
Milwaukee, Wisconsin 53202
CUSTODIAN
Brown Brothers Harriman & Co.
50 Post Office Square
Boston, Massachusetts 02110
This report is for the information of shareholders of the Hotchkis & Wiley Funds, but may also be used as sales literature when preceded or accompanied by a current prospectus, which gives details about charges, expenses, investment objectives and operating policies of the Funds.
A description of the policies and procedures that the Funds use to determine how to vote proxies relating to portfolio securities is included in the Statement of Additional Information, which is available without charge, upon request, by calling 1-866-HW-FUNDS (1-866-493-8637) and on the Securities and Exchange Commission's ("SEC") website at http://www.sec.gov.
Information regarding how the Funds voted proxies relating to portfolio securities during the most recent 12-month period ended June 30 is available without charge on the Funds' website at www.hwcm.com and on the SEC's website at http://www.sec.gov.
Hotchkis & Wiley Funds files a complete schedule of portfolio holdings with the SEC for the first and third quarters of each fiscal year on Form N-PORT. The Funds' Forms N-PORT are available free of charge on the Funds' website at www.hwcm.com and on the SEC's website at http://www.sec.gov.
601 SOUTH FIGUEROA STREET, 39th Floor
LOS ANGELES, CALIFORNIA 90017-5704
www.hwcm.com
1.866.HW.FUNDS (1.866.493.8637)
Item 2. Code of Ethics.
The registrant has adopted a code of ethics that applies to the registrant’s principal executive officer and principal financial officer. The registrant has not made any substantive amendments to its code of ethics during the period covered by this report. The registrant has not granted any waivers from any provisions of the code of ethics during the period covered by this report. A copy of the code of ethics is available without charge, upon request, by calling toll-free at 1-800-796-5606.
Item 3. Audit Committee Financial Expert.
The registrant’s Board of Trustees (the “Board”) has determined that Robert Fitzgerald, a member of the registrant’s Audit Committee, is an “audit committee financial expert” and “independent,” as such terms are defined in this Item. This designation will not increase the designee’s duties, obligations or liability as compared to his duties, obligations and liability as a member of the Audit Committee and of the Board; nor will it reduce the responsibility of the other Audit Committee members. The Board believes each member of the Audit Committee contributes significantly to the effective oversight of the registrant’s financial statements and condition.
Item 4. Principal Accountant Fees and Services.
The registrant has engaged its principal accountant to perform audit services, audit-related services, tax services and other services during the past two fiscal years. “Audit services” refer to performing an audit of the registrant's annual financial statements or services that are normally provided by the accountant in connection with statutory and regulatory filings or engagements for those fiscal years. “Audit-related services” refer to the assurance and related services by the principal accountant that are reasonably related to the performance of the audit. “Tax services” refer to professional services rendered by the principal accountant for tax compliance, tax advice, and tax planning. The principal accountant did not provide any other services. The following table details the aggregate fees billed or expected to be billed for each of the last two fiscal years for audit fees, audit-related fees, tax fees and other fees by the principal accountant.
| | | FYE 6/30/2022 | | | FYE 6/30/2021 | |
| (a) Audit Fees | | $ | 209,500 | | | $ | 209,500 | |
| (b) Audit-Related Fees | | $ | 0 | | | $ | 0 | |
| (c) Tax Fees | | $ | 0 | | | $ | 0 | |
| (d) All Other Fees | | $ | 0 | | | $ | 0 | |
(e)(1) The registrant’s Audit Committee (the “Committee”) has adopted policies and procedures with regard to the pre-approval of services. The Committee shall pre-approve any engagements of the independent auditors to provide any non-prohibited services to the registrant, including the fees and other compensation to be paid to the independent auditors. The Chairman of the Committee may grant the pre-approval of services to the registrant for non-prohibited services for engagements of less than $5,000. The Committee shall also pre-approve any engagement of the independent auditors, including the fees and other compensation to be paid to the independent auditors, to provide any non-audit services to the registrant’s investment adviser, Hotchkis & Wiley Capital Management, LLC (the “Advisor”) (or any “control affiliate” of the Advisor providing ongoing services to the registrant), if the engagement relates directly to the operations and financial reporting of the registrant. The Chairman of the Committee may grant the pre-approval for non-prohibited services to the Advisor for engagements of less than $5,000. All such delegated pre-approvals shall be presented to the Committee no later than the next Committee meeting.
(e)(2) The percentage of fees billed by Deloitte & Touche LLP (“D&T”) applicable to non-audit services pursuant to waiver of pre-approval requirement were as follows:
| | | FYE 6/30/2022 | | | FYE 6/30/2021 | |
| Audit-Related Fees | | | 0 | % | | | 0 | % |
| Tax Fees | | | 0 | % | | | 0 | % |
| All Other Fees | | | 0 | % | | | 0 | % |
(f) All of the principal accountant’s hours spent on auditing the registrant’s financial statements were attributed to work performed by full-time permanent employees of the principal accountant.
(g) During the last two fiscal years, D&T has served as the auditor to the Advisor and/or affiliates of the Advisor, and has rendered non-audit services to the Advisor and/or affiliates of the Advisor. The non-audit services that D&T provided to the Advisor and/or affiliates of the Advisor in 2022 and 2021 consisted of preparing state and federal tax returns. D&T charged $180,014 and $162,000 for such non-audit services to the Advisor and/or affiliates of the Advisor for 2022 and 2021, respectively. None of the non-audit services provided by D&T to the Advisor and/or affiliates of the Advisor directly related to the operations or financial reporting of the registrant.
(h) The Committee has considered whether the provision of audit and non-audit services that were rendered to the Advisor and any entity controlling, controlled by or under common control with the Advisor is compatible with maintaining the principal accountant's independence and has concluded that the provision of such non-audit services by the accountant has not compromised the accountant’s independence.
(i) The registrant has not been identified by the U.S. Securities and Exchange Commission as having filed an annual report issued by a registered public accounting firm branch or office that is located in a foreign jurisdiction where the Public Company Accounting Oversight Board is unable to inspect or completely investigate because of a position taken by an authority in that jurisdiction.
(j) The registrant is not a foreign issuer.
Item 5. Audit Committee of Listed Registrants.
Not applicable to registrants who are not listed issuers (as defined in Rule 10A-3 under the Securities Exchange Act of 1934).
Item 6. Investments.
| (a) | Schedule of Investments is included as part of the report to shareholders filed under Item 1 of this Form. |
Item 7. Disclosure of Proxy Voting Policies and Procedures for Closed-End Management Investment Companies.
Not applicable to open-end investment companies.
Item 8. Portfolio Managers of Closed-End Management Investment Companies.
Not applicable to open-end investment companies.
Item 9. Purchases of Equity Securities by Closed-End Management Investment Company and Affiliated Purchasers.
Not applicable to open-end investment companies.
Item 10. Submission of Matters to a Vote of Security Holders.
The identification and recommendation of individuals for Board membership is the responsibility of the Nominating and Governance Committee. Shareholders may submit suggestions for candidates by forwarding their correspondence by U.S. mail or other courier service to the registrant’s Secretary for the attention of the Chair of the Nominating and Governance Committee, 601 South Figueroa Street, 39th Floor, Los Angeles, CA 90017-5704.
Item 11. Controls and Procedures.
| (a) | The registrant’s President / Principal Executive Officer and Treasurer / Principal Financial Officer have reviewed the registrant's disclosure controls and procedures (as defined in Rule 30a-3(c) under the Investment Company Act of 1940 (the “Act”)) as of a date within 90 days of the filing of this report, as required by Rule 30a-3(b) under the Act and Rules 13a-15(b) or 15d-15(b) under the Securities Exchange Act of 1934. Based on their review, such officers have concluded that the disclosure controls and procedures are effective in ensuring that information required to be disclosed in this report is appropriately recorded, processed, summarized and reported and made known to them by others within the registrant and by the registrant’s service provider. |
| (b) | There were no changes in the registrant's internal control over financial reporting (as defined in Rule 30a-3(d) under the Act) that occurred during the period covered by this report that have materially affected, or are reasonably likely to materially affect, the registrant's internal control over financial reporting. |
Item 12. Disclosure of Securities Lending Activities for Closed-End Management Investment Companies.
Not applicable to open-end investment companies.
Item 13. Exhibits.
| (a) | (1) Any code of ethics or amendment thereto, that is the subject of the disclosure required by Item 2, to the extent that the registrant intends to satisfy Item 2 requirements through filing an exhibit. Available without charge, upon request, by calling toll-free at 1-800-796-5606. |
(2) A separate certification for each principal executive officer and principal financial officer pursuant to Section 302 of the Sarbanes-Oxley Act of 2002. Filed herewith.
(3) Any written solicitation to purchase securities under Rule 23c-1 under the Act sent or given during the period covered by the report by or on behalf of the registrant to 10 or more persons. Not applicable to open-end investment companies.
(4) Change in the registrant’s independent public accountant. There was no change in the registrant’s independent public accountant for the period covered by this report.
(b) Certifications pursuant to Section 906 of the Sarbanes-Oxley Act of 2002. Furnished herewith.
SIGNATURES
Pursuant to the requirements of the Securities Exchange Act of 1934 and the Investment Company Act of 1940, the registrant has duly caused this report to be signed on its behalf by the undersigned, thereunto duly authorized.
| (Registrant) | Hotchkis & Wiley Funds | |
| By (Signature and Title) | /s/ Anna Marie Lopez | |
Anna Marie Lopez, President / Principal Executive Officer
Pursuant to the requirements of the Securities Exchange Act of 1934 and the Investment Company Act of 1940, this report has been signed below by the following persons on behalf of the registrant and in the capacities and on the dates indicated.
| By (Signature and Title) | /s/ Anna Marie Lopez | |
Anna Marie Lopez, President / Principal Executive Officer
| By (Signature and Title) | /s/ James Menvielle | |
James Menvielle, Treasurer / Principal Financial Officer