0001145022 tsr:bench2024082638364_801Member 2023-07-01 2024-06-30
UNITED STATES
SECURITIES AND EXCHANGE COMMISSION
Washington, D.C. 20549
FORM N-CSR
CERTIFIED SHAREHOLDER REPORT OF REGISTERED
MANAGEMENT INVESTMENT COMPANIES
Investment Company Act file number: 811-10487
Hotchkis & Wiley Funds
(Exact name of registrant as specified in charter)
601 South Figueroa Street, 39th Floor
Los Angeles, California 90017-5704
(Address of principal executive offices) (Zip code)
Anna Marie Lopez
Hotchkis & Wiley Capital Management, LLC
601 South Figueroa Street, 39th Floor
Los Angeles, California 90017-5704
(Name and address of agent for service)
Copies to:
Maureen A. Miller, Esq.
Joseph M. Mannon, Esq.
Vedder Price P.C.
222 North LaSalle Street, 26th Floor
Chicago, Illinois 60601
(Counsel for the registrant)
(213) 430-1000
Registrant’s telephone number, including area code
Date of fiscal year end: June 30, 2024
Date of reporting period: June 30, 2024
Item 1. Reports to Stockholders.
| | |
| Hotchkis & Wiley Diversified Value Fund | |
| Class A | HWCAX |
| Annual Shareholder Report | June 30, 2024 |
This annual shareholder report contains important information about the Hotchkis & Wiley Diversified Value Fund for the period of July 1, 2023, to June 30, 2024. You can find additional information about the Fund at https://www.hwcm.com/mutual-funds/resources/literature/. You can also request this information by contacting us at 866-HW-FUNDS (866-493-8637).
This report describes changes to the Fund that occurred during the reporting period.
WHAT WERE THE FUND COSTS FOR THE PAST YEAR? (based on a hypothetical $10,000 investment)
| | |
Class Name | Costs of a $10,000 investment | Costs paid as a percentage of a $10,000 investment |
| Class A | $115 | 1.05% |
HOW DID THE FUND PERFORM LAST YEAR? WHAT AFFECTED ITS PERFORMANCE?
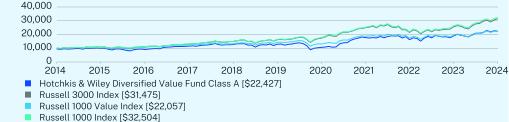
The Diversified Value Fund returned 18.48% for Class A shares at net asset value (NAV) for the 12 months ended June 30, 2024. The Fund underperformed the Russell 3000 Index, which returned 23.13%.
TOP DETRACTORS FROM PERFORMANCE
• Large cap stocks significantly outperformed their small cap counterparts. This performance disparity has widened the valuation gap between large cap and small cap stocks.
• Stock selection in communication services, information technology, and consumer discretionary was the largest relative detractor. An underweight in the strong performing information technology sector also detracted from performance.
TOP CONTRIBUTORS TO PERFORMANCE
• Stock selection and an overweight in financials helped relative performance.
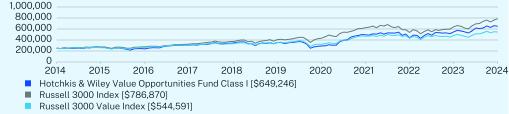
HOW DID THE FUND PERFORM OVER THE PAST 10 YEARS?*
The $10,000 chart reflects a hypothetical $10,000 investment in the class of shares noted and assumes the maximum sales charge. The chart uses total return NAV performance and assumes reinvestment of dividends and capital gains. Fund expenses, including 12b-1 fees, management fees and other expenses were deducted.
CUMULATIVE PERFORMANCE (Initial Investment of $10,000)
| Hotchkis & Wiley Diversified Value Fund | PAGE 1 | TSR_AR_44134R750 |
ANNUAL AVERAGE TOTAL RETURN (%)
| | | |
| | 1 Year | 5 Year | 10 Year |
Class A (without sales charge) | 18.48 | 11.65 | 9.00 |
Class A (with sales charge) | 12.26 | 10.45 | 8.41 |
Russell 3000 Index | 23.13 | 14.14 | 12.15 |
Russell 1000 Value Index | 13.06 | 9.01 | 8.23 |
Russell 1000 Index | 23.88 | 14.61 | 12.51 |
Visit https://www.hwcm.com/mutual-funds/resources/literature/ for more recent performance information.
| * | The Fund’s past performance is not a good predictor of how the Fund will perform in the future. The graph and table do not reflect the deduction of taxes that a shareholder would pay on Fund distributions or redemption of Fund shares. |
KEY FUND STATISTICS (as of June 30, 2024)
| |
Net Assets | $111,256,188 |
Number of Holdings | 77 |
Net Advisory Fee | $499,450 |
Portfolio Turnover | 34% |
Visit https://www.hwcm.com/mutual-funds/resources/literature/ for more recent performance information.
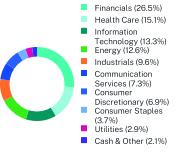
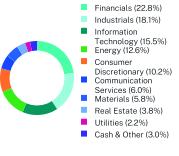
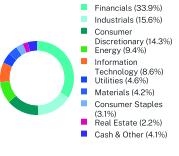
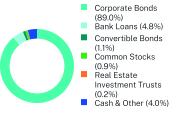
WHAT DID THE FUND INVEST IN? (as of June 30, 2024)
Sector Breakdown (% of net assets)
| |
Top 10 Holdings | (%) |
Citigroup, Inc. | 3.9% |
Wells Fargo & Co. | 3.6% |
Telefonaktiebolaget LM Ericsson | 3.5% |
Workday, Inc. | 3.2% |
APA Corp. | 3.2% |
General Motors Company | 3.0% |
F5, Inc. | 2.8% |
Elevance Health, Inc. | 2.8% |
Alphabet, Inc. | 2.3% |
Comcast Corp. | 2.3% |
Effective August 29, 2024, the Fund changed its name to Hotchkis & Wiley Large Cap Disciplined Value Fund.
Other Material Fund Changes
In connection with the Securities and Exchange Commission’s new Tailored Shareholder Report rule, the Fund’s primary benchmark index changed to the Russell 3000 Index. The Fund will continue to show index performance for the Russell 1000 Value Index and Russell 1000 Index, the Fund’s prior benchmark indexes.
For additional information about the Fund; including its prospectus, financial information, holdings and proxy information, scan the QR code or visit https://www.hwcm.com/mutual-funds/resources/literature/
The Fund is distributed by Quasar Distributors, LLC.
| Hotchkis & Wiley Diversified Value Fund | PAGE 2 | TSR_AR_44134R750 |
IMPORTANT INFORMATION
To reduce Fund expenses, only one copy of most shareholder documents may be mailed to shareholders with multiple accounts at the same address (Householding). If you would prefer that your Fund documents not be householded, please contact the Fund at 866-HW-FUNDS (866-493-8637), or contact your financial intermediary. Your instructions will typically be effective within 30 days of receipt by the Fund or your financial intermediary.
| Hotchkis & Wiley Diversified Value Fund | PAGE 3 | TSR_AR_44134R750 |
947599559076115911270012926106411774216236189292242710000107291095912987149071624617306249492149025563314751000010413107111237513212143311306418771174911950922057100001073711052130441494116438176672527721982262393250426.515.113.312.69.67.36.93.72.92.1
| | |
| Hotchkis & Wiley Diversified Value Fund | |
| Class I | HWCIX |
| Annual Shareholder Report | June 30, 2024 |
This annual shareholder report contains important information about the Hotchkis & Wiley Diversified Value Fund for the period of July 1, 2023, to June 30, 2024. You can find additional information about the Fund at https://www.hwcm.com/mutual-funds/resources/literature/. You can also request this information by contacting us at 866-HW-FUNDS (866-493-8637).
This report describes changes to the Fund that occurred during the reporting period.
WHAT WERE THE FUND COSTS FOR THE PAST YEAR? (based on a hypothetical $10,000 investment)
| | |
Class Name | Costs of a $10,000 investment | Costs paid as a percentage of a $10,000 investment |
| Class I | $88 | 0.80% |
HOW DID THE FUND PERFORM LAST YEAR? WHAT AFFECTED ITS PERFORMANCE?
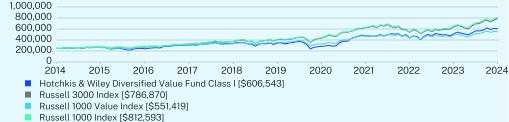
The Diversified Value Fund returned 18.81% for Class I shares at net asset value (NAV) for the 12 months ended June 30, 2024. The Fund underperformed the Russell 3000 Index, which returned 23.13%.
TOP DETRACTORS FROM PERFORMANCE
• Large cap stocks significantly outperformed their small cap counterparts. This performance disparity has widened the valuation gap between large cap and small cap stocks.
• Stock selection in communication services, information technology, and consumer discretionary was the largest relative detractor. An underweight in the strong performing information technology sector also detracted from performance.
TOP CONTRIBUTORS TO PERFORMANCE
• Stock selection and an overweight in financials helped relative performance.
HOW DID THE FUND PERFORM OVER THE PAST 10 YEARS?*
The $250,000 chart reflects a hypothetical $250,000 investment in the class of shares noted and assumes the maximum sales charge. The chart uses total return NAV performance and assumes reinvestment of dividends and capital gains. Fund expenses, including 12b-1 fees, management fees and other expenses were deducted.
CUMULATIVE PERFORMANCE (Initial Investment of $250,000)
| Hotchkis & Wiley Diversified Value Fund | PAGE 1 | TSR_AR_44134R768 |
ANNUAL AVERAGE TOTAL RETURN (%)
| | | |
| | 1 Year | 5 Year | 10 Year |
Class I | 18.81 | 11.92 | 9.27 |
Russell 3000 Index | 23.13 | 14.14 | 12.15 |
Russell 1000 Value Index | 13.06 | 9.01 | 8.23 |
Russell 1000 Index | 23.88 | 14.61 | 12.51 |
Visit https://www.hwcm.com/mutual-funds/resources/literature/ for more recent performance information.
| * | The Fund’s past performance is not a good predictor of how the Fund will perform in the future. The graph and table do not reflect the deduction of taxes that a shareholder would pay on Fund distributions or redemption of Fund shares. |
KEY FUND STATISTICS (as of June 30, 2024)
| |
Net Assets | $111,256,188 |
Number of Holdings | 77 |
Net Advisory Fee | $499,450 |
Portfolio Turnover | 34% |
Visit https://www.hwcm.com/mutual-funds/resources/literature/ for more recent performance information.
WHAT DID THE FUND INVEST IN? (as of June 30, 2024)
Sector Breakdown (% of net assets)
| |
Top 10 Holdings | (%) |
Citigroup, Inc. | 3.9% |
Wells Fargo & Co. | 3.6% |
Telefonaktiebolaget LM Ericsson | 3.5% |
Workday, Inc. | 3.2% |
APA Corp. | 3.2% |
General Motors Company | 3.0% |
F5, Inc. | 2.8% |
Elevance Health, Inc. | 2.8% |
Alphabet, Inc. | 2.3% |
Comcast Corp. | 2.3% |
Effective August 29, 2024, the Fund changed its name to Hotchkis & Wiley Large Cap Disciplined Value Fund.
Other Material Fund Changes
In connection with the Securities and Exchange Commission’s new Tailored Shareholder Report rule, the Fund’s primary benchmark index changed to the Russell 3000 Index. The Fund will continue to show index performance for the Russell 1000 Value Index and Russell 1000 Index, the Fund’s prior benchmark indexes.
For additional information about the Fund; including its prospectus, financial information, holdings and proxy information, scan the QR code or visit https://www.hwcm.com/mutual-funds/resources/literature/
The Fund is distributed by Quasar Distributors, LLC.
| Hotchkis & Wiley Diversified Value Fund | PAGE 2 | TSR_AR_44134R768 |
IMPORTANT INFORMATION
To reduce Fund expenses, only one copy of most shareholder documents may be mailed to shareholders with multiple accounts at the same address (Householding). If you would prefer that your Fund documents not be householded, please contact the Fund at 866-HW-FUNDS (866-493-8637), or contact your financial intermediary. Your instructions will typically be effective within 30 days of receipt by the Fund or your financial intermediary.
| Hotchkis & Wiley Diversified Value Fund | PAGE 3 | TSR_AR_44134R768 |
25000026324424062830811833833534536928490247618243677851051460654325000026823527397132468237266440613843265762373753725363908278687025000026033326777930936733031135826332660646927943727548773655141925000026841727629532611037351741094044168263192554955365596681259326.515.113.312.69.67.36.93.72.92.1
| | |
| Hotchkis & Wiley Large Cap Value Fund | |
| Class A | HWLAX |
| Annual Shareholder Report | June 30, 2024 |
This annual shareholder report contains important information about the Hotchkis & Wiley Large Cap Value Fund for the period of July 1, 2023, to June 30, 2024. You can find additional information about the Fund at https://www.hwcm.com/mutual-funds/resources/literature/. You can also request this information by contacting us at 866-HW-FUNDS (866-493-8637).
This report describes changes to the Fund that occurred during the reporting period.
WHAT WERE THE FUND COSTS FOR THE PAST YEAR? (based on a hypothetical $10,000 investment)
| | |
Class Name | Costs of a $10,000 investment | Costs paid as a percentage of a $10,000 investment |
| Class A | $131 | 1.20% |
HOW DID THE FUND PERFORM LAST YEAR? WHAT AFFECTED ITS PERFORMANCE?
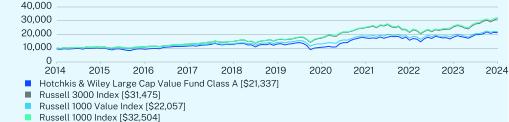
The Large Cap Value Fund returned 18.03% for Class A shares at net asset value (NAV) for the 12 months ended June 30, 2024. The Fund underperformed the Russell 3000 Index, which returned 23.13%.
TOP DETRACTORS FROM PERFORMANCE
• Stock selection and an underweight in information technology was the largest relative detractor, followed by stock selection in communication services.
TOP CONTRIBUTORS TO PERFORMANCE
• Stock selection in financials and industrials helped relative performance.
HOW DID THE FUND PERFORM OVER THE PAST 10 YEARS?*
The $10,000 chart reflects a hypothetical $10,000 investment in the class of shares noted and assumes the maximum sales charge. The chart uses total return NAV performance and assumes reinvestment of dividends and capital gains. Fund expenses, including 12b-1 fees, management fees and other expenses were deducted.
CUMULATIVE PERFORMANCE (Initial Investment of $10,000)
| Hotchkis & Wiley Large Cap Value Fund | PAGE 1 | TSR_AR_44134R107 |
ANNUAL AVERAGE TOTAL RETURN (%)
| | | |
| | 1 Year | 5 Year | 10 Year |
Class A (without sales charge) | 18.03 | 10.24 | 8.46 |
Class A (with sales charge) | 11.83 | 9.06 | 7.87 |
Russell 3000 Index | 23.13 | 14.14 | 12.15 |
Russell 1000 Value Index | 13.06 | 9.01 | 8.23 |
Russell 1000 Index | 23.88 | 14.61 | 12.51 |
Visit https://www.hwcm.com/mutual-funds/resources/literature/ for more recent performance information.
| * | The Fund’s past performance is not a good predictor of how the Fund will perform in the future. The graph and table do not reflect the deduction of taxes that a shareholder would pay on Fund distributions or redemption of Fund shares. |
KEY FUND STATISTICS (as of June 30, 2024)
| |
Net Assets | $355,456,530 |
Number of Holdings | 64 |
Net Advisory Fee | $2,507,165 |
Portfolio Turnover | 22% |
Visit https://www.hwcm.com/mutual-funds/resources/literature/ for more recent performance information.
WHAT DID THE FUND INVEST IN? (as of June 30, 2024)
Sector Breakdown (% of net assets)
| |
Top Holdings | (%) |
Citigroup, Inc. | 4.0% |
Wells Fargo & Co. | 3.7% |
Telefonaktiebolaget LM Ericsson | 3.7% |
F5, Inc. | 3.6% |
General Motors Co. | 3.4% |
APA Corp. | 3.4% |
Elevance Health, Inc. | 3.4% |
Hartford Financial Services Group, Inc. | 2.6% |
Comcast Corp. | 2.6% |
American International Group, Inc. | 2.5% |
Effective August 29, 2024, the Fund changed its name to Hotchkis & Wiley Large Cap Fundamental Value Fund.
Other Material Fund Changes
In connection with the Securities and Exchange Commission’s new Tailored Shareholder Report rule, the Fund’s primary benchmark index changed to the Russell 3000 Index. The Fund will continue to show index performance for the Russell 1000 Value Index and Russell 1000 Index, the Fund’s prior benchmark indexes.
For additional information about the Fund; including its prospectus, financial information, holdings and proxy information, scan the QR code or visit https://www.hwcm.com/mutual-funds/resources/literature/
The Fund is distributed by Quasar Distributors, LLC.
| Hotchkis & Wiley Large Cap Value Fund | PAGE 2 | TSR_AR_44134R107 |
IMPORTANT INFORMATION
To reduce Fund expenses, only one copy of most shareholder documents may be mailed to shareholders with multiple accounts at the same address (Householding). If you would prefer that your Fund documents not be householded, please contact the Fund at 866-HW-FUNDS (866-493-8637), or contact your financial intermediary. Your instructions will typically be effective within 30 days of receipt by the Fund or your financial intermediary.
| Hotchkis & Wiley Large Cap Value Fund | PAGE 3 | TSR_AR_44134R107 |
947599399281116831281813105106921751515846180782133710000107291095912987149071624617306249492149025563314751000010413107111237513212143311306418771174911950922057100001073711052130441494116438176672527721982262393250429.715.012.611.17.97.65.33.63.53.7
| | |
| Hotchkis & Wiley Large Cap Value Fund | |
| Class I | HWLIX |
| Annual Shareholder Report | June 30, 2024 |
This annual shareholder report contains important information about the Hotchkis & Wiley Large Cap Value Fund for the period of July 1, 2023, to June 30, 2024. You can find additional information about the Fund at https://www.hwcm.com/mutual-funds/resources/literature/. You can also request this information by contacting us at 866-HW-FUNDS (866-493-8637).
This report describes changes to the Fund that occurred during the reporting period.
WHAT WERE THE FUND COSTS FOR THE PAST YEAR? (based on a hypothetical $10,000 investment)
| | |
Class Name | Costs of a $10,000 investment | Costs paid as a percentage of a $10,000 investment |
| Class I | $104 | 0.95% |
HOW DID THE FUND PERFORM LAST YEAR? WHAT AFFECTED ITS PERFORMANCE?
The Large Cap Value Fund returned 18.30% for Class I shares at net asset value (NAV) for the 12 months ended June 30, 2024. The Fund underperformed the Russell 3000 Index, which returned 23.13%.
TOP DETRACTORS FROM PERFORMANCE
• Stock selection and an underweight in information technology was the largest relative detractor, followed by stock selection in communication services.
TOP CONTRIBUTORS TO PERFORMANCE
• Stock selection in financials and industrials helped relative performance.
HOW DID THE FUND PERFORM OVER THE PAST 10 YEARS?*
The $250,000 chart reflects a hypothetical $250,000 investment in the class of shares noted and assumes the maximum sales charge. The chart uses total return NAV performance and assumes reinvestment of dividends and capital gains. Fund expenses, including 12b-1 fees, management fees and other expenses were deducted.
CUMULATIVE PERFORMANCE (Initial Investment of $250,000)
| Hotchkis & Wiley Large Cap Value Fund | PAGE 1 | TSR_AR_44134R503 |
ANNUAL AVERAGE TOTAL RETURN (%)
| | | |
| | 1 Year | 5 Year | 10 Year |
Class I | 18.30 | 10.51 | 8.73 |
Russell 3000 Index | 23.13 | 14.14 | 12.15 |
Russell 1000 Value Index | 13.06 | 9.01 | 8.23 |
Russell 1000 Index | 23.88 | 14.61 | 12.51 |
Visit https://www.hwcm.com/mutual-funds/resources/literature/ for more recent performance information.
| * | The Fund’s past performance is not a good predictor of how the Fund will perform in the future. The graph and table do not reflect the deduction of taxes that a shareholder would pay on Fund distributions or redemption of Fund shares. |
KEY FUND STATISTICS (as of June 30, 2024)
| |
Net Assets | $355,456,530 |
Number of Holdings | 64 |
Net Advisory Fee | $2,507,165 |
Portfolio Turnover | 22% |
Visit https://www.hwcm.com/mutual-funds/resources/literature/ for more recent performance information.
WHAT DID THE FUND INVEST IN? (as of June 30, 2024)
Sector Breakdown (% of net assets)
| |
Top Holdings | (%) |
Citigroup, Inc. | 4.0% |
Wells Fargo & Co. | 3.7% |
Telefonaktiebolaget LM Ericsson | 3.7% |
F5, Inc. | 3.6% |
General Motors Co. | 3.4% |
APA Corp. | 3.4% |
Elevance Health, Inc. | 3.4% |
Hartford Financial Services Group, Inc. | 2.6% |
Comcast Corp. | 2.6% |
American International Group, Inc. | 2.5% |
Effective August 29, 2024, the Fund changed its name to Hotchkis & Wiley Large Cap Fundamental Value Fund.
Other Material Fund Changes
In connection with the Securities and Exchange Commission’s new Tailored Shareholder Report rule, the Fund’s primary benchmark index changed to the Russell 3000 Index. The Fund will continue to show index performance for the Russell 1000 Value Index and Russell 1000 Index, the Fund’s prior benchmark indexes.
For additional information about the Fund; including its prospectus, financial information, holdings and proxy information, scan the QR code or visit https://www.hwcm.com/mutual-funds/resources/literature/
The Fund is distributed by Quasar Distributors, LLC.
| Hotchkis & Wiley Large Cap Value Fund | PAGE 2 | TSR_AR_44134R503 |
IMPORTANT INFORMATION
To reduce Fund expenses, only one copy of most shareholder documents may be mailed to shareholders with multiple accounts at the same address (Householding). If you would prefer that your Fund documents not be householded, please contact the Fund at 866-HW-FUNDS (866-493-8637), or contact your financial intermediary. Your instructions will typically be effective within 30 days of receipt by the Fund or your financial intermediary.
| Hotchkis & Wiley Large Cap Value Fund | PAGE 3 | TSR_AR_44134R503 |
25000026293724605931056834164435021228654147050842670748795457724625000026823527397132468237266440613843265762373753725363908278687025000026033326777930936733031135826332660646927943727548773655141925000026841727629532611037351741094044168263192554955365596681259329.715.012.611.17.97.65.33.63.53.7
| | |
| Hotchkis & Wiley Large Cap Value Fund | |
| Class Z | HWLZX |
| Annual Shareholder Report | June 30, 2024 |
This annual shareholder report contains important information about the Hotchkis & Wiley Large Cap Value Fund for the period of July 1, 2023, to June 30, 2024. You can find additional information about the Fund at https://www.hwcm.com/mutual-funds/resources/literature/. You can also request this information by contacting us at 866-HW-FUNDS (866-493-8637).
This report describes changes to the Fund that occurred during the reporting period.
WHAT WERE THE FUND COSTS FOR THE PAST YEAR? (based on a hypothetical $10,000 investment)
| | |
Class Name | Costs of a $10,000 investment | Costs paid as a percentage of a $10,000 investment |
| Class Z | $93 | 0.85% |
HOW DID THE FUND PERFORM LAST YEAR? WHAT AFFECTED ITS PERFORMANCE?
The Large Cap Value Fund returned 18.42% for Class Z shares at net asset value (NAV) for the 12 months ended June 30, 2024. The Fund underperformed the Russell 3000 Index, which returned 23.13%.
TOP DETRACTORS FROM PERFORMANCE
• Stock selection and an underweight in information technology was the largest relative detractor, followed by stock selection in communication services.
TOP CONTRIBUTORS TO PERFORMANCE
• Stock selection in financials and industrials helped relative performance.
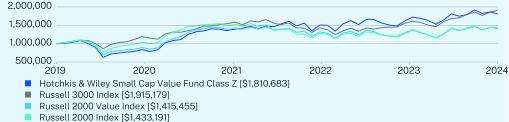
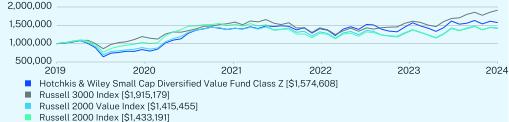
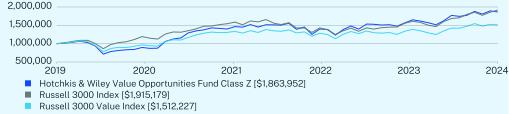
HOW DID THE FUND PERFORM SINCE INCEPTION?*
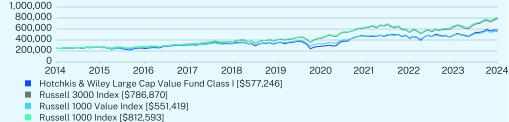
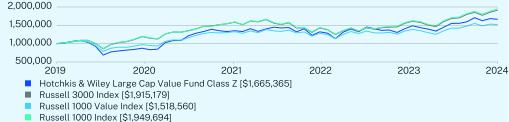
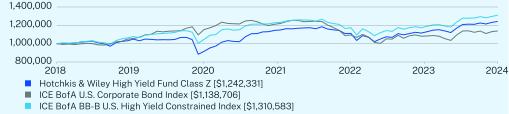
The $1,000,000 chart reflects a hypothetical $1,000,000 investment in the class of shares noted and assumes the maximum sales charge. The chart uses total return NAV performance and assumes reinvestment of dividends and capital gains. Fund expenses, including 12b-1 fees, management fees and other expenses were deducted.
CUMULATIVE PERFORMANCE (Initial Investment of $1,000,000)
| Hotchkis & Wiley Large Cap Value Fund | PAGE 1 | TSR_AR_44134R511 |
ANNUAL AVERAGE TOTAL RETURN (%)
| | |
| | 1 Year | Since Inception
(09/30/2019) |
Class Z | 18.42 | 11.33 |
Russell 3000 Index | 23.13 | 14.66 |
Russell 1000 Value Index | 13.06 | 9.19 |
Russell 1000 Index | 23.88 | 15.09 |
Visit https://www.hwcm.com/mutual-funds/resources/literature/ for more recent performance information.
| * | The Fund’s past performance is not a good predictor of how the Fund will perform in the future. The graph and table do not reflect the deduction of taxes that a shareholder would pay on Fund distributions or redemption of Fund shares. |
KEY FUND STATISTICS (as of June 30, 2024)
| |
Net Assets | $355,456,530 |
Number of Holdings | 64 |
Net Advisory Fee | $2,507,165 |
Portfolio Turnover | 22% |
Visit https://www.hwcm.com/mutual-funds/resources/literature/ for more recent performance information.
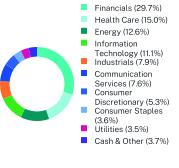
WHAT DID THE FUND INVEST IN? (as of June 30, 2024)
Sector Breakdown (% of net assets)
| |
Top Holdings | (%) |
Citigroup, Inc. | 4.0% |
Wells Fargo & Co. | 3.7% |
Telefonaktiebolaget LM Ericsson | 3.7% |
F5, Inc. | 3.6% |
General Motors Co. | 3.4% |
APA Corp. | 3.4% |
Elevance Health, Inc. | 3.4% |
Hartford Financial Services Group, Inc. | 2.6% |
Comcast Corp. | 2.6% |
American International Group, Inc. | 2.5% |
Effective August 29, 2024, the Fund changed its name to Hotchkis & Wiley Large Cap Fundamental Value Fund.
Other Material Fund Changes
In connection with the Securities and Exchange Commission’s new Tailored Shareholder Report rule, the Fund’s primary benchmark index changed to the Russell 3000 Index. The Fund will continue to show index performance for the Russell 1000 Value Index and Russell 1000 Index, the Fund’s prior benchmark indexes.
For additional information about the Fund; including its prospectus, financial information, holdings and proxy information, scan the QR code or visit https://www.hwcm.com/mutual-funds/resources/literature/
The Fund is distributed by Quasar Distributors, LLC.
| Hotchkis & Wiley Large Cap Value Fund | PAGE 2 | TSR_AR_44134R511 |
IMPORTANT INFORMATION
To reduce Fund expenses, only one copy of most shareholder documents may be mailed to shareholders with multiple accounts at the same address (Householding). If you would prefer that your Fund documents not be householded, please contact the Fund at 866-HW-FUNDS (866-493-8637), or contact your financial intermediary. Your instructions will typically be effective within 30 days of receipt by the Fund or your financial intermediary.
| Hotchkis & Wiley Large Cap Value Fund | PAGE 3 | TSR_AR_44134R511 |
82354413533791228598140629916653651053053151812813076311555475191517989944512923541204219134318415185601059748151620813185691573889194969429.715.012.611.17.97.65.33.63.53.7
| | |
| Hotchkis & Wiley Mid-Cap Value Fund | |
| Class A | HWMAX |
| Annual Shareholder Report | June 30, 2024 |
This annual shareholder report contains important information about the Hotchkis & Wiley Mid-Cap Value Fund for the period of July 1, 2023, to June 30, 2024. You can find additional information about the Fund at https://www.hwcm.com/mutual-funds/resources/literature/. You can also request this information by contacting us at 866-HW-FUNDS (866-493-8637).
This report describes changes to the Fund that occurred during the reporting period.
WHAT WERE THE FUND COSTS FOR THE PAST YEAR? (based on a hypothetical $10,000 investment)
| | |
Class Name | Costs of a $10,000 investment | Costs paid as a percentage of a $10,000 investment |
| Class A | $129 | 1.20% |
HOW DID THE FUND PERFORM LAST YEAR? WHAT AFFECTED ITS PERFORMANCE?
The Mid-Cap Value Fund returned 15.65% for Class A shares at net asset value (NAV) for the 12 months ended June 30, 2024. The Fund underperformed the Russell 3000 Index, which returned 23.13%.
TOP DETRACTORS FROM PERFORMANCE
• Stock selection and an underweight in information technology was the largest relative detractor, followed by stock selection in communication services and consumer discretionary.
TOP CONTRIBUTORS TO PERFORMANCE
• Stock selection in utilities, financials and industrials helped relative performance.
HOW DID THE FUND PERFORM OVER THE PAST 10 YEARS?*
The $10,000 chart reflects a hypothetical $10,000 investment in the class of shares noted and assumes the maximum sales charge. The chart uses total return NAV performance and assumes reinvestment of dividends and capital gains. Fund expenses, including 12b-1 fees, management fees and other expenses were deducted.
CUMULATIVE PERFORMANCE (Initial Investment of $10,000)
| Hotchkis & Wiley Mid-Cap Value Fund | PAGE 1 | TSR_AR_44134R206 |
ANNUAL AVERAGE TOTAL RETURN (%)
| | | |
| | 1 Year | 5 Year | 10 Year |
Class A (without sales charge) | 15.65 | 11.21 | 5.76 |
Class A (with sales charge) | 9.58 | 10.01 | 5.19 |
Russell 3000 Index | 23.13 | 14.14 | 12.15 |
Russell Midcap Value Index | 11.98 | 8.49 | 7.60 |
Russell Midcap Index Index | 12.88 | 9.46 | 9.04 |
Visit https://www.hwcm.com/mutual-funds/resources/literature/ for more recent performance information.
| * | The Fund’s past performance is not a good predictor of how the Fund will perform in the future. The graph and table do not reflect the deduction of taxes that a shareholder would pay on Fund distributions or redemption of Fund shares. |
KEY FUND STATISTICS (as of June 30, 2024)
| |
Net Assets | $432,171,338 |
Number of Holdings | 73 |
Net Advisory Fee | $3,497,573 |
Portfolio Turnover | 28% |
Visit https://www.hwcm.com/mutual-funds/resources/literature/ for more recent performance information.
WHAT DID THE FUND INVEST IN? (as of June 30, 2024)
Sector Breakdown (% of net assets)
| |
Top Holdings | (%) |
Kosmos Energy Ltd. | 4.9% |
APA Corp. | 4.8% |
Popular, Inc. | 4.4% |
Telefonaktiebolaget LM Ericsson | 4.4% |
Citizens Financial Group, Inc. | 4.2% |
Fluor Corp. | 3.6% |
F5, Inc. | 3.3% |
Adient PLC | 2.7% |
State Street Corp. | 2.7% |
CNO Financial Group, Inc. | 2.4% |
Other Material Fund Changes
In connection with the Securities and Exchange Commission’s new Tailored Shareholder Report rule, the Fund’s primary benchmark index changed to the Russell 3000 Index. The Fund will continue to show index performance for the Russell Midcap Value Index and Russell Midcap Index, the Fund’s prior benchmark indexes.
For additional information about the Fund; including its prospectus, financial information, holdings and proxy information, scan the QR code or visit https://www.hwcm.com/mutual-funds/resources/literature/
The Fund is distributed by Quasar Distributors, LLC.
| Hotchkis & Wiley Mid-Cap Value Fund | PAGE 2 | TSR_AR_44134R206 |
IMPORTANT INFORMATION
To reduce Fund expenses, only one copy of most shareholder documents may be mailed to shareholders with multiple accounts at the same address (Householding). If you would prefer that your Fund documents not be householded, please contact the Fund at 866-HW-FUNDS (866-493-8637), or contact your financial intermediary. Your instructions will typically be effective within 30 days of receipt by the Fund or your financial intermediary.
| Hotchkis & Wiley Mid-Cap Value Fund | PAGE 3 | TSR_AR_44134R206 |
947593878124999711401975066511287812551143381658210000107291095912987149071624617306249492149025563314751000010367107041240813351138421220718685168171858320809100001066310723124901403015128147892215418322210572376827.918.812.312.010.45.83.22.62.14.9
| | |
| Hotchkis & Wiley Mid-Cap Value Fund | |
| Class I | HWMIX |
| Annual Shareholder Report | June 30, 2024 |
This annual shareholder report contains important information about the Hotchkis & Wiley Mid-Cap Value Fund for the period of July 1, 2023, to June 30, 2024. You can find additional information about the Fund at https://www.hwcm.com/mutual-funds/resources/literature/. You can also request this information by contacting us at 866-HW-FUNDS (866-493-8637).
This report describes changes to the Fund that occurred during the reporting period.
WHAT WERE THE FUND COSTS FOR THE PAST YEAR? (based on a hypothetical $10,000 investment)
| | |
Class Name | Costs of a $10,000 investment | Costs paid as a percentage of a $10,000 investment |
| Class I | $108 | 1.00% |
HOW DID THE FUND PERFORM LAST YEAR? WHAT AFFECTED ITS PERFORMANCE?
The Mid-Cap Value Fund returned 15.88% for Class I shares at net asset value (NAV) for the 12 months ended June 30, 2024. The Fund underperformed the Russell 3000 Index, which returned 23.13%.
TOP DETRACTORS FROM PERFORMANCE
• Stock selection and an underweight in information technology was the largest relative detractor, followed by stock selection in communication services and consumer discretionary.
TOP CONTRIBUTORS TO PERFORMANCE
• Stock selection in utilities, financials and industrials helped relative performance.
HOW DID THE FUND PERFORM OVER THE PAST 10 YEARS?*
The $250,000 chart reflects a hypothetical $250,000 investment in the class of shares noted and assumes the maximum sales charge. The chart uses total return NAV performance and assumes reinvestment of dividends and capital gains. Fund expenses, including 12b-1 fees, management fees and other expenses were deducted.
CUMULATIVE PERFORMANCE (Initial Investment of $250,000)
| Hotchkis & Wiley Mid-Cap Value Fund | PAGE 1 | TSR_AR_44134R800 |
ANNUAL AVERAGE TOTAL RETURN (%)
| | | |
| | 1 Year | 5 Year | 10 Year |
Class I | 15.88 | 11.43 | 5.99 |
Russell 3000 Index | 23.13 | 14.14 | 12.15 |
Russell Midcap Value Index | 11.98 | 8.49 | 7.60 |
Russell Midcap Index | 12.88 | 9.46 | 9.04 |
Visit https://www.hwcm.com/mutual-funds/resources/literature/ for more recent performance information.
| * | The Fund’s past performance is not a good predictor of how the Fund will perform in the future. The graph and table do not reflect the deduction of taxes that a shareholder would pay on Fund distributions or redemption of Fund shares. |
KEY FUND STATISTICS (as of June 30, 2024)
| |
Net Assets | $432,171,338 |
Number of Holdings | 73 |
Net Advisory Fee | $3,497,573 |
Portfolio Turnover | 28% |
Visit https://www.hwcm.com/mutual-funds/resources/literature/ for more recent performance information.
WHAT DID THE FUND INVEST IN? (as of June 30, 2024)
Sector Breakdown (% of net assets)
| |
Top Holdings | (%) |
Kosmos Energy Ltd. | 4.9% |
APA Corp. | 4.8% |
Popular, Inc. | 4.4% |
Telefonaktiebolaget LM Ericsson | 4.4% |
Citizens Financial Group, Inc. | 4.2% |
Fluor Corp. | 3.6% |
F5, Inc. | 3.3% |
Adient PLC | 2.7% |
State Street Corp. | 2.7% |
CNO Financial Group, Inc. | 2.4% |
Other Material Fund Changes
In connection with the Securities and Exchange Commission’s new Tailored Shareholder Report rule, the Fund’s primary benchmark index changed to the Russell 3000 Index. The Fund will continue to show index performance for the Russell Midcap Value Index and Russell Midcap Index, the Fund’s prior benchmark indexes.
For additional information about the Fund; including its prospectus, financial information, holdings and proxy information, scan the QR code or visit https://www.hwcm.com/mutual-funds/resources/literature/
The Fund is distributed by Quasar Distributors, LLC.
IMPORTANT INFORMATION
To reduce Fund expenses, only one copy of most shareholder documents may be mailed to shareholders with multiple accounts at the same address (Householding). If you would prefer that your Fund documents not be householded, please contact the Fund at 866-HW-FUNDS (866-493-8637), or contact your financial intermediary. Your instructions will typically be effective within 30 days of receipt by the Fund or your financial intermediary.
| Hotchkis & Wiley Mid-Cap Value Fund | PAGE 2 | TSR_AR_44134R800 |
25000024826021542326576630383426041417806534538033729438609044740125000026823527397132468237266440613843265762373753725363908278687025000025917926759131020733376834605530517946712042042246457852022325000026658626807331226235075137819836972755384645805252641459419227.918.812.312.010.45.83.22.62.14.9
| | |
| Hotchkis & Wiley Mid-Cap Value Fund | |
| Class Z | HWMZX |
| Annual Shareholder Report | June 30, 2024 |
This annual shareholder report contains important information about the Hotchkis & Wiley Mid-Cap Value Fund for the period of July 1, 2023, to June 30, 2024. You can find additional information about the Fund at https://www.hwcm.com/mutual-funds/resources/literature/. You can also request this information by contacting us at 866-HW-FUNDS (866-493-8637).
This report describes changes to the Fund that occurred during the reporting period.
WHAT WERE THE FUND COSTS FOR THE PAST YEAR? (based on a hypothetical $10,000 investment)
| | |
Class Name | Costs of a $10,000 investment | Costs paid as a percentage of a $10,000 investment |
| Class Z | $95 | 0.88% |
HOW DID THE FUND PERFORM LAST YEAR? WHAT AFFECTED ITS PERFORMANCE?
The Mid-Cap Value Fund returned 16.05% for Class Z shares at net asset value (NAV) for the 12 months ended June 30, 2024. The Fund underperformed the Russell 3000 Index, which returned 23.13%.
TOP DETRACTORS FROM PERFORMANCE
• Stock selection and an underweight in information technology was the largest relative detractor, followed by stock selection in communication services and consumer discretionary.
TOP CONTRIBUTORS TO PERFORMANCE
• Stock selection in utilities, financials and industrials helped relative performance.
HOW DID THE FUND PERFORM SINCE INCEPTION?*
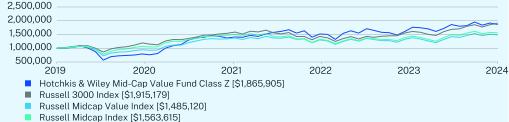
The $1,000,000 chart reflects a hypothetical $1,000,000 investment in the class of shares noted and assumes the maximum sales charge. The chart uses total return NAV performance and assumes reinvestment of dividends and capital gains. Fund expenses, including 12b-1 fees, management fees and other expenses were deducted.
CUMULATIVE PERFORMANCE (Initial Investment of $1,000,000)
| Hotchkis & Wiley Mid-Cap Value Fund | PAGE 1 | TSR_AR_44134R495 |
ANNUAL AVERAGE TOTAL RETURN (%)
| | |
| | 1 Year | Since Inception
(09/30/2019) |
Class Z | 16.05 | 14.03 |
Russell 3000 Index | 23.13 | 14.66 |
Russell Midcap Value Index | 11.98 | 8.68 |
Russell Midcap Index | 12.88 | 9.87 |
Visit https://www.hwcm.com/mutual-funds/resources/literature/ for more recent performance information.
| * | The Fund’s past performance is not a good predictor of how the Fund will perform in the future. The graph and table do not reflect the deduction of taxes that a shareholder would pay on Fund distributions or redemption of Fund shares. |
KEY FUND STATISTICS (as of June 30, 2024)
| |
Net Assets | $432,171,338 |
Number of Holdings | 73 |
Net Advisory Fee | $3,497,573 |
Portfolio Turnover | 28% |
Visit https://www.hwcm.com/mutual-funds/resources/literature/ for more recent performance information.
WHAT DID THE FUND INVEST IN? (as of June 30, 2024)
Sector Breakdown (% of net assets)
| |
Top Holdings | (%) |
Kosmos Energy Ltd. | 4.9% |
APA Corp. | 4.8% |
Popular, Inc. | 4.4% |
Telefonaktiebolaget LM Ericsson | 4.4% |
Citizens Financial Group, Inc. | 4.2% |
Fluor Corp. | 3.6% |
F5, Inc. | 3.3% |
Adient PLC | 2.7% |
State Street Corp. | 2.7% |
CNO Financial Group, Inc. | 2.4% |
Other Material Fund Changes
In connection with the Securities and Exchange Commission’s new Tailored Shareholder Report rule, the Fund’s primary benchmark index changed to the Russell 3000 Index. The Fund will continue to show index performance for the Russell Midcap Value Index and Russell Midcap Index, the Fund’s prior benchmark indexes.
For additional information about the Fund; including its prospectus, financial information, holdings and proxy information, scan the QR code or visit https://www.hwcm.com/mutual-funds/resources/literature/
The Fund is distributed by Quasar Distributors, LLC.
| Hotchkis & Wiley Mid-Cap Value Fund | PAGE 2 | TSR_AR_44134R495 |
IMPORTANT INFORMATION
To reduce Fund expenses, only one copy of most shareholder documents may be mailed to shareholders with multiple accounts at the same address (Householding). If you would prefer that your Fund documents not be householded, please contact the Fund at 866-HW-FUNDS (866-493-8637), or contact your financial intermediary. Your instructions will typically be effective within 30 days of receipt by the Fund or your financial intermediary.
| Hotchkis & Wiley Mid-Cap Value Fund | PAGE 3 | TSR_AR_44134R495 |
7383651434983140302116079031865905105305315181281307631155547519151798712181333523120021213262681485120972936145744612053631385257156361527.918.812.312.010.45.83.22.62.14.9
| | |
| Hotchkis & Wiley Small Cap Value Fund | |
| Class A | HWSAX |
| Annual Shareholder Report | June 30, 2024 |
This annual shareholder report contains important information about the Hotchkis & Wiley Small Cap Value Fund for the period of July 1, 2023, to June 30, 2024. You can find additional information about the Fund at https://www.hwcm.com/mutual-funds/resources/literature/. You can also request this information by contacting us at 866-HW-FUNDS (866-493-8637).
This report describes changes to the Fund that occurred during the reporting period.
WHAT WERE THE FUND COSTS FOR THE PAST YEAR? (based on a hypothetical $10,000 investment)
| | |
Class Name | Costs of a $10,000 investment | Costs paid as a percentage of a $10,000 investment |
| Class A | $127 | 1.20% |
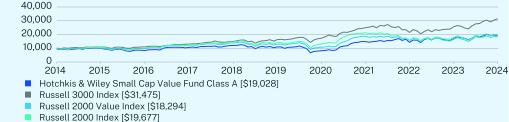
HOW DID THE FUND PERFORM LAST YEAR? WHAT AFFECTED ITS PERFORMANCE?
The Small Cap Value Fund returned 11.41% for Class A shares at net asset value (NAV) for the 12 months ended June 30, 2024. The Fund underperformed the Russell 3000 Index, which returned 23.13%.
TOP DETRACTORS FROM PERFORMANCE
• Large cap stocks significantly outperformed their small cap counterparts. This performance disparity has widened the valuation gap between large cap and small cap stocks.
• Stock selection and an underweight in information technology was the largest relative detractor, followed by stock selection in communication services, consumer discretionary and consumer staples.
TOP CONTRIBUTORS TO PERFORMANCE
• Underweight position in the health care sector and stock selection in financials and industrials helped relative performance.
HOW DID THE FUND PERFORM OVER THE PAST 10 YEARS?*
The $10,000 chart reflects a hypothetical $10,000 investment in the class of shares noted and assumes the maximum sales charge. The chart uses total return NAV performance and assumes reinvestment of dividends and capital gains. Fund expenses, including 12b-1 fees, management fees and other expenses were deducted.
CUMULATIVE PERFORMANCE (Initial Investment of $10,000)
| Hotchkis & Wiley Small Cap Value Fund | PAGE 1 | TSR_AR_44134R305 |
ANNUAL AVERAGE TOTAL RETURN (%)
| | | |
| | 1 Year | 5 Year | 10 Year |
Class A (without sales charge) | 11.41 | 11.74 | 7.22 |
Class A (with sales charge) | 5.56 | 10.54 | 6.64 |
Russell 3000 Index | 23.13 | 14.14 | 12.15 |
Russell 2000 Value Index | 10.90 | 7.07 | 6.23 |
Russell 2000 Index | 10.06 | 6.94 | 7.00 |
Visit https://www.hwcm.com/mutual-funds/resources/literature/ for more recent performance information.
| * | The Fund’s past performance is not a good predictor of how the Fund will perform in the future. The graph and table do not reflect the deduction of taxes that a shareholder would pay on Fund distributions or redemption of Fund shares. |
KEY FUND STATISTICS (as of June 30, 2024)
| |
Net Assets | $777,230,486 |
Number of Holdings | 66 |
Net Advisory Fee | $5,147,846 |
Portfolio Turnover | 45% |
Visit https://www.hwcm.com/mutual-funds/resources/literature/ for more recent performance information.
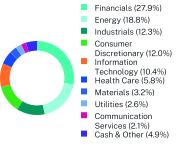
WHAT DID THE FUND INVEST IN? (as of June 30, 2024)
Sector Breakdown (% of net assets)
| |
Top Holdings | (%) |
F5, Inc. | 6.3% |
Stagwell, Inc. | 4.8% |
NOV, Inc. | 4.5% |
Arrow Electronics, Inc. | 4.4% |
Popular, Inc. | 3.6% |
Ecovyst, Inc. | 3.4% |
Enstar Group Ltd. | 3.3% |
Fluor Corp. | 3.2% |
Jones Lang LaSalle, Inc. | 2.9% |
First Hawaiian, Inc. | 2.9% |
Other Material Fund Changes
In connection with the Securities and Exchange Commission’s new Tailored Shareholder Report rule, the Fund’s primary benchmark index changed to the Russell 3000 Index. The Fund will continue to show index performance for the Russell 2000 Value Index and Russell 2000 Index, the Fund’s prior benchmark indexes.
For additional information about the Fund; including its prospectus, financial information, holdings and proxy information, scan the QR code or visit https://www.hwcm.com/mutual-funds/resources/literature/
The Fund is distributed by Quasar Distributors, LLC.
| Hotchkis & Wiley Small Cap Value Fund | PAGE 2 | TSR_AR_44134R305 |
IMPORTANT INFORMATION
To reduce Fund expenses, only one copy of most shareholder documents may be mailed to shareholders with multiple accounts at the same address (Householding). If you would prefer that your Fund documents not be householded, please contact the Fund at 866-HW-FUNDS (866-493-8637), or contact your financial intermediary. Your instructions will typically be effective within 30 days of receipt by the Fund or your financial intermediary.
| Hotchkis & Wiley Small Cap Value Fund | PAGE 3 | TSR_AR_44134R305 |
947598898324106411203010923820814821142941708019028100001072910959129871490716246173062494921490255633147510000100789817122581386312999107271858815562164971829410000106499932123751454914067131352128315920178791967722.818.115.512.610.26.05.83.82.23.0
| | |
| Hotchkis & Wiley Small Cap Value Fund | |
| Class C | HWSCX |
| Annual Shareholder Report | June 30, 2024 |
This annual shareholder report contains important information about the Hotchkis & Wiley Small Cap Value Fund for the period of July 1, 2023, to June 30, 2024. You can find additional information about the Fund at https://www.hwcm.com/mutual-funds/resources/literature/. You can also request this information by contacting us at 866-HW-FUNDS (866-493-8637).
This report describes changes to the Fund that occurred during the reporting period.
WHAT WERE THE FUND COSTS FOR THE PAST YEAR? (based on a hypothetical $10,000 investment)
| | |
Class Name | Costs of a $10,000 investment | Costs paid as a percentage of a $10,000 investment |
| Class C | $205 | 1.95% |
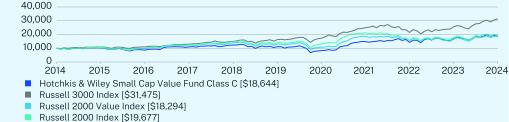
HOW DID THE FUND PERFORM LAST YEAR? WHAT AFFECTED ITS PERFORMANCE?
The Small Cap Value Fund returned 10.60% for Class C shares at net asset value (NAV) for the 12 months ended June 30, 2024. The Fund underperformed the Russell 3000 Index, which returned 23.13%.
TOP DETRACTORS FROM PERFORMANCE
• Large cap stocks significantly outperformed their small cap counterparts. This performance disparity has widened the valuation gap between large cap and small cap stocks.
• Stock selection and an underweight in information technology was the largest relative detractor, followed by stock selection in communication services, consumer discretionary and consumer staples.
TOP CONTRIBUTORS TO PERFORMANCE
• Underweight position in the health care sector and stock selection in financials and industrials helped relative performance.
HOW DID THE FUND PERFORM OVER THE PAST 10 YEARS?*
The $10,000 chart reflects a hypothetical $10,000 investment in the class of shares noted and assumes the maximum sales charge. The chart uses total return NAV performance and assumes reinvestment of dividends and capital gains. Fund expenses, including 12b-1 fees, management fees and other expenses were deducted.
CUMULATIVE PERFORMANCE (Initial Investment of $10,000)
| Hotchkis & Wiley Small Cap Value Fund | PAGE 1 | TSR_AR_44134R842 |
ANNUAL AVERAGE TOTAL RETURN (%)
| | | |
| | 1 Year | 5 Year | 10 Year |
Class C (without sales charge) | 10.60 | 10.92 | 6.43 |
Class C (with sales charge) | 9.60 | 10.92 | 6.43 |
Russell 3000 Index | 23.13 | 14.14 | 12.15 |
Russell 2000 Value Index | 10.90 | 7.07 | 6.23 |
Russell 2000 Index | 10.06 | 6.94 | 7.00 |
Visit https://www.hwcm.com/mutual-funds/resources/literature/ for more recent performance information.
| * | The Fund’s past performance is not a good predictor of how the Fund will perform in the future. The graph and table do not reflect the deduction of taxes that a shareholder would pay on Fund distributions or redemption of Fund shares. |
KEY FUND STATISTICS (as of June 30, 2024)
| |
Net Assets | $777,230,486 |
Number of Holdings | 66 |
Net Advisory Fee | $5,147,846 |
Portfolio Turnover | 45% |
Visit https://www.hwcm.com/mutual-funds/resources/literature/ for more recent performance information.
WHAT DID THE FUND INVEST IN? (as of June 30, 2024)
Sector Breakdown (% of net assets)
| |
Top Holdings | (%) |
F5, Inc. | 6.3% |
Stagwell, Inc. | 4.8% |
NOV, Inc. | 4.5% |
Arrow Electronics, Inc. | 4.4% |
Popular, Inc. | 3.6% |
Ecovyst, Inc. | 3.4% |
Enstar Group Ltd. | 3.3% |
Fluor Corp. | 3.2% |
Jones Lang LaSalle, Inc. | 2.9% |
First Hawaiian, Inc. | 2.9% |
Other Material Fund Changes
In connection with the Securities and Exchange Commission’s new Tailored Shareholder Report rule, the Fund’s primary benchmark index changed to the Russell 3000 Index. The Fund will continue to show index performance for the Russell 2000 Value Index and Russell 2000 Index, the Fund’s prior benchmark indexes.
For additional information about the Fund; including its prospectus, financial information, holdings and proxy information, scan the QR code or visit https://www.hwcm.com/mutual-funds/resources/literature/
The Fund is distributed by Quasar Distributors, LLC.
| Hotchkis & Wiley Small Cap Value Fund | PAGE 2 | TSR_AR_44134R842 |
IMPORTANT INFORMATION
To reduce Fund expenses, only one copy of most shareholder documents may be mailed to shareholders with multiple accounts at the same address (Householding). If you would prefer that your Fund documents not be householded, please contact the Fund at 866-HW-FUNDS (866-493-8637), or contact your financial intermediary. Your instructions will typically be effective within 30 days of receipt by the Fund or your financial intermediary.
| Hotchkis & Wiley Small Cap Value Fund | PAGE 3 | TSR_AR_44134R842 |
10000103608655109791232011104828414848142161686118644100001072910959129871490716246173062494921490255633147510000100789817122581386312999107271858815562164971829410000106499932123751454914067131352128315920178791967722.818.115.512.610.26.05.83.82.23.0
| | |
| Hotchkis & Wiley Small Cap Value Fund | |
| Class I | HWSIX |
| Annual Shareholder Report | June 30, 2024 |
This annual shareholder report contains important information about the Hotchkis & Wiley Small Cap Value Fund for the period of July 1, 2023, to June 30, 2024. You can find additional information about the Fund at https://www.hwcm.com/mutual-funds/resources/literature/. You can also request this information by contacting us at 866-HW-FUNDS (866-493-8637).
This report describes changes to the Fund that occurred during the reporting period.
WHAT WERE THE FUND COSTS FOR THE PAST YEAR? (based on a hypothetical $10,000 investment)
| | |
Class Name | Costs of a $10,000 investment | Costs paid as a percentage of a $10,000 investment |
| Class I | $103 | 0.97% |
HOW DID THE FUND PERFORM LAST YEAR? WHAT AFFECTED ITS PERFORMANCE?
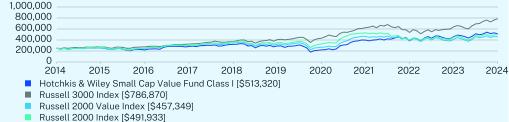
The Small Cap Value Fund returned 11.68% for Class I shares at net asset value (NAV) for the 12 months ended June 30, 2024. The Fund underperformed the Russell 3000 Index, which returned 23.13%.
TOP DETRACTORS FROM PERFORMANCE
• Large cap stocks significantly outperformed their small cap counterparts. This performance disparity has widened the valuation gap between large cap and small cap stocks.
• Stock selection and an underweight in information technology was the largest relative detractor, followed by stock selection in communication services, consumer discretionary and consumer staples.
TOP CONTRIBUTORS TO PERFORMANCE
• Underweight position in the health care sector and stock selection in financials and industrials helped relative performance.
HOW DID THE FUND PERFORM OVER THE PAST 10 YEARS?*
The $250,000 chart reflects a hypothetical $250,000 investment in the class of shares noted and assumes the maximum sales charge. The chart uses total return NAV performance and assumes reinvestment of dividends and capital gains. Fund expenses, including 12b-1 fees, management fees and other expenses were deducted.
CUMULATIVE PERFORMANCE (Initial Investment of $250,000)
| Hotchkis & Wiley Small Cap Value Fund | PAGE 1 | TSR_AR_44134R867 |
ANNUAL AVERAGE TOTAL RETURN (%)
| | | |
| | 1 Year | 5 Year | 10 Year |
Class I | 11.68 | 11.96 | 7.46 |
Russell 3000 Index | 23.13 | 14.14 | 12.15 |
Russell 2000 Value Index | 10.90 | 7.07 | 6.23 |
Russell 2000 Index | 10.06 | 6.94 | 7.00 |
Visit https://www.hwcm.com/mutual-funds/resources/literature/ for more recent performance information.
| * | The Fund’s past performance is not a good predictor of how the Fund will perform in the future. The graph and table do not reflect the deduction of taxes that a shareholder would pay on Fund distributions or redemption of Fund shares. |
KEY FUND STATISTICS (as of June 30, 2024)
| |
Net Assets | $777,230,486 |
Number of Holdings | 66 |
Net Advisory Fee | $5,147,846 |
Portfolio Turnover | 45% |
Visit https://www.hwcm.com/mutual-funds/resources/literature/ for more recent performance information.
WHAT DID THE FUND INVEST IN? (as of June 30, 2024)
Sector Breakdown (% of net assets)
| |
Top Holdings | (%) |
F5, Inc. | 6.3% |
Stagwell, Inc. | 4.8% |
NOV, Inc. | 4.5% |
Arrow Electronics, Inc. | 4.4% |
Popular, Inc. | 3.6% |
Ecovyst, Inc. | 3.4% |
Enstar Group Ltd. | 3.3% |
Fluor Corp. | 3.2% |
Jones Lang LaSalle, Inc. | 2.9% |
First Hawaiian, Inc. | 2.9% |
Other Material Fund Changes
In connection with the Securities and Exchange Commission’s new Tailored Shareholder Report rule, the Fund’s primary benchmark index changed to the Russell 3000 Index. The Fund will continue to show index performance for the Russell 2000 Value Index and Russell 2000 Index, the Fund’s prior benchmark indexes.
For additional information about the Fund; including its prospectus, financial information, holdings and proxy information, scan the QR code or visit https://www.hwcm.com/mutual-funds/resources/literature/
The Fund is distributed by Quasar Distributors, LLC.
IMPORTANT INFORMATION
To reduce Fund expenses, only one copy of most shareholder documents may be mailed to shareholders with multiple accounts at the same address (Householding). If you would prefer that your Fund documents not be householded, please contact the Fund at 866-HW-FUNDS (866-493-8637), or contact your financial intermediary. Your instructions will typically be effective within 30 days of receipt by the Fund or your financial intermediary.
| Hotchkis & Wiley Small Cap Value Fund | PAGE 2 | TSR_AR_44134R867 |
25000026161222073428286532057429182621973939745938388245962351332025000026823527397132468237266440613843265762373753725363908278687025000025193924543430644234658432497326817746469638904141241345734925000026621424829630937936372435168732838753207239800344698449193322.818.115.512.610.26.05.83.82.23.0
| | |
| Hotchkis & Wiley Small Cap Value Fund | |
| Class Z | HWSZX |
| Annual Shareholder Report | June 30, 2024 |
This annual shareholder report contains important information about the Hotchkis & Wiley Small Cap Value Fund for the period of July 1, 2023, to June 30, 2024. You can find additional information about the Fund at https://www.hwcm.com/mutual-funds/resources/literature/. You can also request this information by contacting us at 866-HW-FUNDS (866-493-8637).
This report describes changes to the Fund that occurred during the reporting period.
WHAT WERE THE FUND COSTS FOR THE PAST YEAR? (based on a hypothetical $10,000 investment)
| | |
Class Name | Costs of a $10,000 investment | Costs paid as a percentage of a $10,000 investment |
| Class Z | $91 | 0.86% |
HOW DID THE FUND PERFORM LAST YEAR? WHAT AFFECTED ITS PERFORMANCE?
The Small Cap Value Fund returned 11.80% for Class Z shares at net asset value (NAV) for the 12 months ended June 30, 2024. The Fund underperformed the Russell 3000 Index, which returned 23.13%.
TOP DETRACTORS FROM PERFORMANCE
• Large cap stocks significantly outperformed their small cap counterparts. This performance disparity has widened the valuation gap between large cap and small cap stocks.
• Stock selection and an underweight in information technology was the largest relative detractor, followed by stock selection in communication services, consumer discretionary and consumer staples.
TOP CONTRIBUTORS TO PERFORMANCE
• Underweight position in the health care sector and stock selection in financials and industrials helped relative performance.
HOW DID THE FUND PERFORM SINCE INCEPTION?*
The $1,000,000 chart reflects a hypothetical $1,000,000 investment in the class of shares noted and assumes the maximum sales charge. The chart uses total return NAV performance and assumes reinvestment of dividends and capital gains. Fund expenses, including 12b-1 fees, management fees and other expenses were deducted.
CUMULATIVE PERFORMANCE (Initial Investment of $1,000,000)
| Hotchkis & Wiley Small Cap Value Fund | PAGE 1 | TSR_AR_44134R487 |
ANNUAL AVERAGE TOTAL RETURN (%)
| | |
| | 1 Year | Since Inception
(09/30/2019) |
Class Z | 11.80 | 13.31 |
Russell 3000 Index | 23.13 | 14.66 |
Russell 2000 Value Index | 10.90 | 7.59 |
Russell 2000 Index | 10.06 | 7.87 |
Visit https://www.hwcm.com/mutual-funds/resources/literature/ for more recent performance information.
| * | The Fund’s past performance is not a good predictor of how the Fund will perform in the future. The graph and table do not reflect the deduction of taxes that a shareholder would pay on Fund distributions or redemption of Fund shares. |
KEY FUND STATISTICS (as of June 30, 2024)
| |
Net Assets | $777,230,486 |
Number of Holdings | 66 |
Net Advisory Fee | $5,147,846 |
Portfolio Turnover | 45% |
Visit https://www.hwcm.com/mutual-funds/resources/literature/ for more recent performance information.
WHAT DID THE FUND INVEST IN? (as of June 30, 2024)
Sector Breakdown (% of net assets)
| |
Top Holdings | (%) |
F5, Inc. | 6.3% |
Stagwell, Inc. | 4.8% |
NOV, Inc. | 4.5% |
Arrow Electronics, Inc. | 4.4% |
Popular, Inc. | 3.6% |
Ecovyst, Inc. | 3.4% |
Enstar Group Ltd. | 3.3% |
Fluor Corp. | 3.2% |
Jones Lang LaSalle, Inc. | 2.9% |
First Hawaiian, Inc. | 2.9% |
Other Material Fund Changes
In connection with the Securities and Exchange Commission’s new Tailored Shareholder Report rule, the Fund’s primary benchmark index changed to the Russell 3000 Index. The Fund will continue to show index performance for the Russell 2000 Value Index and Russell 2000 Index, the Fund’s prior benchmark indexes.
For additional information about the Fund; including its prospectus, financial information, holdings and proxy information, scan the QR code or visit https://www.hwcm.com/mutual-funds/resources/literature/
The Fund is distributed by Quasar Distributors, LLC.
| Hotchkis & Wiley Small Cap Value Fund | PAGE 2 | TSR_AR_44134R487 |
IMPORTANT INFORMATION
To reduce Fund expenses, only one copy of most shareholder documents may be mailed to shareholders with multiple accounts at the same address (Householding). If you would prefer that your Fund documents not be householded, please contact the Fund at 866-HW-FUNDS (866-493-8637), or contact your financial intermediary. Your instructions will typically be effective within 30 days of receipt by the Fund or your financial intermediary.
| Hotchkis & Wiley Small Cap Value Fund | PAGE 3 | TSR_AR_44134R487 |
7700931395663135077816195831810683105305315181281307631155547519151798299841438194120404912763831415455956718155012911595351302236143319122.818.115.512.610.26.05.83.82.23.0
| | |
| Hotchkis & Wiley Small Cap Diversified Value Fund | |
| Class A | HWVAX |
| Annual Shareholder Report | June 30, 2024 |
This annual shareholder report contains important information about the Hotchkis & Wiley Small Cap Diversified Value Fund for the period of July 1, 2023, to June 30, 2024. You can find additional information about the Fund at https://www.hwcm.com/mutual-funds/resources/literature/. You can also request this information by contacting us at 866-HW-FUNDS (866-493-8637).
This report describes changes to the Fund that occurred during the reporting period.
WHAT WERE THE FUND COSTS FOR THE PAST YEAR? (based on a hypothetical $10,000 investment)
| | |
Class Name | Costs of a $10,000 investment | Costs paid as a percentage of a $10,000 investment |
| Class A | $109 | 1.05% |
HOW DID THE FUND PERFORM LAST YEAR? WHAT AFFECTED ITS PERFORMANCE?
The Small Cap Diversified Value Fund returned 8.33% for Class A shares at net asset value (NAV) for the 12 months ended June 30, 2024. The Fund underperformed the Russell 3000 Index, which returned 23.13%.
TOP DETRACTORS FROM PERFORMANCE
• The overweight to small cap stocks with a market cap below $1 billion negatively impacted relative performance, as micro caps lagged.
• Stock selection in information technology, communication services, and health care detracted from relative performance.
TOP CONTRIBUTORS TO PERFORMANCE
• Underweight position in the health care sector and stock selection in energy helped relative performance.
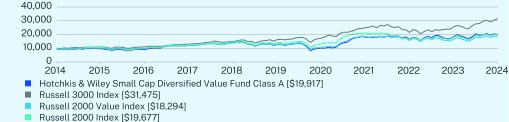
HOW DID THE FUND PERFORM OVER THE PAST 10 YEARS?*
The $10,000 chart reflects a hypothetical $10,000 investment in the class of shares noted and assumes the maximum sales charge. The chart uses total return NAV performance and assumes reinvestment of dividends and capital gains. Fund expenses, including 12b-1 fees, management fees and other expenses were deducted.
CUMULATIVE PERFORMANCE (Initial Investment of $10,000)
| Hotchkis & Wiley Small Cap Diversified Value Fund | PAGE 1 | TSR_AR_44134R644 |
ANNUAL AVERAGE TOTAL RETURN (%)
| | | |
| | 1 Year | 5 Year | 10 Year |
Class A (without sales charge) | 8.33 | 9.08 | 7.71 |
Class A (with sales charge) | 2.67 | 7.90 | 7.13 |
Russell 3000 Index | 23.13 | 14.14 | 12.15 |
Russell 2000 Value Index | 10.90 | 7.07 | 6.23 |
Russell 2000 Index | 10.06 | 6.94 | 7.00 |
Visit https://www.hwcm.com/mutual-funds/resources/literature/ for more recent performance information.
| * | The Fund’s past performance is not a good predictor of how the Fund will perform in the future. The graph and table do not reflect the deduction of taxes that a shareholder would pay on Fund distributions or redemption of Fund shares. |
KEY FUND STATISTICS (as of June 30, 2024)
| |
Net Assets | $788,569,923 |
Number of Holdings | 359 |
Net Advisory Fee | $4,539,446 |
Portfolio Turnover | 54% |
Visit https://www.hwcm.com/mutual-funds/resources/literature/ for more recent performance information.
WHAT DID THE FUND INVEST IN? (as of June 30, 2024)
Sector Breakdown (% of net assets)
| |
Top Holdings | (%) |
Sandy Spring Bancorp, Inc. | 0.5% |
National Energy Services Reunited Corp. | 0.5% |
ACI Worldwide, Inc. | 0.5% |
California Resources Corp. | 0.5% |
NMI Holdings, Inc. | 0.5% |
Vista Outdoor, Inc. | 0.5% |
Hanmi Financial Corp. | 0.5% |
Zions Bancorp NA | 0.4% |
Eagle Bancorp, Inc. | 0.4% |
Bread Financial Holdings, Inc. | 0.4% |
Other Material Fund Changes
In connection with the Securities and Exchange Commission’s new Tailored Shareholder Report rule, the Fund’s primary benchmark index changed to the Russell 3000 Index. The Fund will continue to show index performance for the Russell 2000 Value Index and Russell 2000 Index, the Fund’s prior benchmark indexes.
For additional information about the Fund; including its prospectus, financial information, holdings and proxy information, scan the QR code or visit https://www.hwcm.com/mutual-funds/resources/literature/
The Fund is distributed by Quasar Distributors, LLC.
| Hotchkis & Wiley Small Cap Diversified Value Fund | PAGE 2 | TSR_AR_44134R644 |
IMPORTANT INFORMATION
To reduce Fund expenses, only one copy of most shareholder documents may be mailed to shareholders with multiple accounts at the same address (Householding). If you would prefer that your Fund documents not be householded, please contact the Fund at 866-HW-FUNDS (866-493-8637), or contact your financial intermediary. Your instructions will typically be effective within 30 days of receipt by the Fund or your financial intermediary.
| Hotchkis & Wiley Small Cap Diversified Value Fund | PAGE 3 | TSR_AR_44134R644 |
9479973691391214114226128961012518133163981838519917100001072910959129871490716246173062494921490255633147510000100789817122581386312999107271858815562164971829410000106499932123751454914067131352128315920178791967733.915.614.39.48.64.64.23.12.24.1
| | |
| Hotchkis & Wiley Small Cap Diversified Value Fund | |
| Class I | HWVIX |
| Annual Shareholder Report | June 30, 2024 |
This annual shareholder report contains important information about the Hotchkis & Wiley Small Cap Diversified Value Fund for the period of July 1, 2023, to June 30, 2024. You can find additional information about the Fund at https://www.hwcm.com/mutual-funds/resources/literature/. You can also request this information by contacting us at 866-HW-FUNDS (866-493-8637).
This report describes changes to the Fund that occurred during the reporting period.
WHAT WERE THE FUND COSTS FOR THE PAST YEAR? (based on a hypothetical $10,000 investment)
| | |
Class Name | Costs of a $10,000 investment | Costs paid as a percentage of a $10,000 investment |
| Class I | $83 | 0.80% |
HOW DID THE FUND PERFORM LAST YEAR? WHAT AFFECTED ITS PERFORMANCE?
The Small Cap Diversified Value Fund returned 8.53% for Class I shares at net asset value (NAV) for the 12 months ended June 30, 2024. The Fund underperformed the Russell 3000 Index, which returned 23.13%.
TOP DETRACTORS FROM PERFORMANCE
• The overweight to small cap stocks with a market cap below $1 billion negatively impacted relative performance, as micro caps lagged.
• Stock selection in information technology, communication services, and health care detracted from relative performance.
TOP CONTRIBUTORS TO PERFORMANCE
• Underweight position in the health care sector and stock selection in energy helped relative performance.
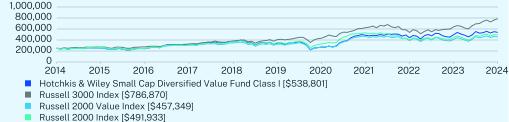
HOW DID THE FUND PERFORM OVER THE PAST 10 YEARS?*
The $250,000 chart reflects a hypothetical $250,000 investment in the class of shares noted and assumes the maximum sales charge. The chart uses total return NAV performance and assumes reinvestment of dividends and capital gains. Fund expenses, including 12b-1 fees, management fees and other expenses were deducted.
CUMULATIVE PERFORMANCE (Initial Investment of $250,000)
| Hotchkis & Wiley Small Cap Diversified Value Fund | PAGE 1 | TSR_AR_44134R651 |
ANNUAL AVERAGE TOTAL RETURN (%)
| | | |
| | 1 Year | 5 Year | 10 Year |
Class I | 8.53 | 9.36 | 7.98 |
Russell 3000 Index | 23.13 | 14.14 | 12.15 |
Russell 2000 Value Index | 10.90 | 7.07 | 6.23 |
Russell 2000 Index | 10.06 | 6.94 | 7.00 |
Visit https://www.hwcm.com/mutual-funds/resources/literature/ for more recent performance information.
| * | The Fund’s past performance is not a good predictor of how the Fund will perform in the future. The graph and table do not reflect the deduction of taxes that a shareholder would pay on Fund distributions or redemption of Fund shares. |
KEY FUND STATISTICS (as of June 30, 2024)
| |
Net Assets | $788,569,923 |
Number of Holdings | 359 |
Net Advisory Fee | $4,539,446 |
Portfolio Turnover | 54% |
Visit https://www.hwcm.com/mutual-funds/resources/literature/ for more recent performance information.
WHAT DID THE FUND INVEST IN? (as of June 30, 2024)
Sector Breakdown (% of net assets)
| |
Top Holdings | (%) |
Sandy Spring Bancorp, Inc. | 0.5% |
National Energy Services Reunited Corp. | 0.5% |
ACI Worldwide, Inc. | 0.5% |
California Resources Corp. | 0.5% |
NMI Holdings, Inc. | 0.5% |
Vista Outdoor, Inc. | 0.5% |
Hanmi Financial Corp. | 0.5% |
Zions Bancorp NA | 0.4% |
Eagle Bancorp, Inc. | 0.4% |
Bread Financial Holdings, Inc. | 0.4% |
Other Material Fund Changes
In connection with the Securities and Exchange Commission’s new Tailored Shareholder Report rule, the Fund’s primary benchmark index changed to the Russell 3000 Index. The Fund will continue to show index performance for the Russell 2000 Value Index and Russell 2000 Index, the Fund’s prior benchmark indexes.
For additional information about the Fund; including its prospectus, financial information, holdings and proxy information, scan the QR code or visit https://www.hwcm.com/mutual-funds/resources/literature/
The Fund is distributed by Quasar Distributors, LLC.
IMPORTANT INFORMATION
To reduce Fund expenses, only one copy of most shareholder documents may be mailed to shareholders with multiple accounts at the same address (Householding). If you would prefer that your Fund documents not be householded, please contact the Fund at 866-HW-FUNDS (866-493-8637), or contact your financial intermediary. Your instructions will typically be effective within 30 days of receipt by the Fund or your financial intermediary.
| Hotchkis & Wiley Small Cap Diversified Value Fund | PAGE 2 | TSR_AR_44134R651 |
25000025733124239932301537946734442427161848690144141349646453880125000026823527397132468237266440613843265762373753725363908278687025000025193924543430644234658432497326817746469638904141241345734925000026621424829630937936372435168732838753207239800344698449193333.915.614.39.48.64.64.23.12.24.1
| | |
| Hotchkis & Wiley Small Cap Diversified Value Fund | |
| Class Z | HWVZX |
| Annual Shareholder Report | June 30, 2024 |
This annual shareholder report contains important information about the Hotchkis & Wiley Small Cap Diversified Value Fund for the period of July 1, 2023, to June 30, 2024. You can find additional information about the Fund at https://www.hwcm.com/mutual-funds/resources/literature/. You can also request this information by contacting us at 866-HW-FUNDS (866-493-8637).
This report describes changes to the Fund that occurred during the reporting period.
WHAT WERE THE FUND COSTS FOR THE PAST YEAR? (based on a hypothetical $10,000 investment)
| | |
Class Name | Costs of a $10,000 investment | Costs paid as a percentage of a $10,000 investment |
| Class Z | $79 | 0.76% |
HOW DID THE FUND PERFORM LAST YEAR? WHAT AFFECTED ITS PERFORMANCE?
The Small Cap Diversified Value Fund returned 8.57% for Class Z shares at net asset value (NAV) for the 12 months ended June 30, 2024. The Fund underperformed the Russell 3000 Index, which returned 23.13%.
TOP DETRACTORS FROM PERFORMANCE
• The overweight to small cap stocks with a market cap below $1 billion negatively impacted relative performance, as micro caps lagged.
• Stock selection in information technology, communication services, and health care detracted from relative performance.
TOP CONTRIBUTORS TO PERFORMANCE
• Underweight position in the health care sector and stock selection in energy helped relative performance.
HOW DID THE FUND PERFORM SINCE INCEPTION?*
The $1,000,000 chart reflects a hypothetical $1,000,000 investment in the class of shares noted and assumes the maximum sales charge. The chart uses total return NAV performance and assumes reinvestment of dividends and capital gains. Fund expenses, including 12b-1 fees, management fees and other expenses were deducted.
CUMULATIVE PERFORMANCE (Initial Investment of $1,000,000)
| Hotchkis & Wiley Small Cap Diversified Value Fund | PAGE 1 | TSR_AR_44134R479 |
ANNUAL AVERAGE TOTAL RETURN (%)
| | |
| | 1 Year | Since Inception
(09/30/2019) |
Class Z | 8.57 | 10.03 |
Russell 3000 Index | 23.13 | 14.66 |
Russell 2000 Value Index | 10.90 | 7.59 |
Russell 2000 Index | 10.06 | 7.87 |
Visit https://www.hwcm.com/mutual-funds/resources/literature/ for more recent performance information.
| * | The Fund’s past performance is not a good predictor of how the Fund will perform in the future. The graph and table do not reflect the deduction of taxes that a shareholder would pay on Fund distributions or redemption of Fund shares. |
KEY FUND STATISTICS (as of June 30, 2024)
| |
Net Assets | $788,569,923 |
Number of Holdings | 359 |
Net Advisory Fee | $4,539,446 |
Portfolio Turnover | 54% |
Visit https://www.hwcm.com/mutual-funds/resources/literature/ for more recent performance information.
WHAT DID THE FUND INVEST IN? (as of June 30, 2024)
Sector Breakdown (% of net assets)
| |
Top Holdings | (%) |
Sandy Spring Bancorp, Inc. | 0.5% |
National Energy Services Reunited Corp. | 0.5% |
ACI Worldwide, Inc. | 0.5% |
California Resources Corp. | 0.5% |
NMI Holdings, Inc. | 0.5% |
Vista Outdoor, Inc. | 0.5% |
Hanmi Financial Corp. | 0.5% |
Zions Bancorp NA | 0.4% |
Eagle Bancorp, Inc. | 0.4% |
Bread Financial Holdings, Inc. | 0.4% |
Other Material Fund Changes
In connection with the Securities and Exchange Commission’s new Tailored Shareholder Report rule, the Fund’s primary benchmark index changed to the Russell 3000 Index. The Fund will continue to show index performance for the Russell 2000 Value Index and Russell 2000 Index, the Fund’s prior benchmark indexes.
For additional information about the Fund; including its prospectus, financial information, holdings and proxy information, scan the QR code or visit https://www.hwcm.com/mutual-funds/resources/literature/
The Fund is distributed by Quasar Distributors, LLC.
| Hotchkis & Wiley Small Cap Diversified Value Fund | PAGE 2 | TSR_AR_44134R479 |
IMPORTANT INFORMATION
To reduce Fund expenses, only one copy of most shareholder documents may be mailed to shareholders with multiple accounts at the same address (Householding). If you would prefer that your Fund documents not be householded, please contact the Fund at 866-HW-FUNDS (866-493-8637), or contact your financial intermediary. Your instructions will typically be effective within 30 days of receipt by the Fund or your financial intermediary.
| Hotchkis & Wiley Small Cap Diversified Value Fund | PAGE 3 | TSR_AR_44134R479 |
7924841422151128875814503171574608105305315181281307631155547519151798299841438194120404912763831415455956718155012911595351302236143319133.915.614.39.48.64.64.23.12.24.1
| | |
| Hotchkis & Wiley Global Value Fund | |
| Class A | HWGAX |
| Annual Shareholder Report | June 30, 2024 |
This annual shareholder report contains important information about the Hotchkis & Wiley Global Value Fund for the period of July 1, 2023, to June 30, 2024. You can find additional information about the Fund at https://www.hwcm.com/mutual-funds/resources/literature/. You can also request this information by contacting us at 866-HW-FUNDS (866-493-8637).
This report describes changes to the Fund that occurred during the reporting period.
WHAT WERE THE FUND COSTS FOR THE PAST YEAR? (based on a hypothetical $10,000 investment)
| | |
Class Name | Costs of a $10,000 investment | Costs paid as a percentage of a $10,000 investment |
| Class A | $133 | 1.20% |
HOW DID THE FUND PERFORM LAST YEAR? WHAT AFFECTED ITS PERFORMANCE?
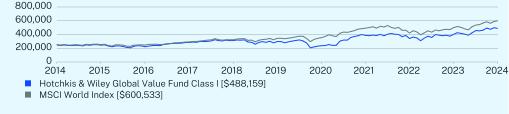
The Global Value Fund returned 21.33% for Class A shares at net asset value (NAV) for the 12 months ended June 30, 2024. The Fund outperformed the MSCI World Index, which returned 20.19%.
TOP DETRACTORS FROM PERFORMANCE
• Stock selection and an underweight in information technology was the largest relative detractor to performance. Stock selection in communication services also detracted.
TOP CONTRIBUTORS TO PERFORMANCE
• Stock selection and an overweight in financials were the primary contributors to relative performance, followed by stock selection in industrials.
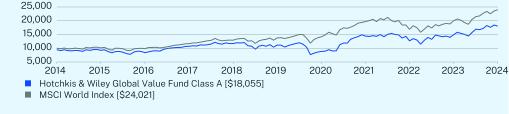
HOW DID THE FUND PERFORM OVER THE PAST 10 YEARS?*
The $10,000 chart reflects a hypothetical $10,000 investment in the class of shares noted and assumes the maximum sales charge. The chart uses total return NAV performance and assumes reinvestment of dividends and capital gains. Fund expenses, including 12b-1 fees, management fees and other expenses were deducted.
CUMULATIVE PERFORMANCE (Initial Investment of $10,000)
| Hotchkis & Wiley Global Value Fund | PAGE 1 | TSR_AR_44134R677 |
ANNUAL AVERAGE TOTAL RETURN (%)
| | | |
| | 1 Year | 5 Year | 10 Year |
Class A (without sales charge) | 21.33 | 10.14 | 6.66 |
Class A (with sales charge) | 14.98 | 8.96 | 6.09 |
MSCI World Index | 20.19 | 11.78 | 9.16 |
Visit https://www.hwcm.com/mutual-funds/resources/literature/ for more recent performance information.
| * | The Fund’s past performance is not a good predictor of how the Fund will perform in the future. The graph and table do not reflect the deduction of taxes that a shareholder would pay on Fund distributions or redemption of Fund shares. |
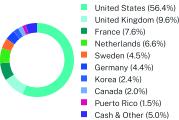
KEY FUND STATISTICS (as of June 30, 2024)
| |
Net Assets | $37,580,034 |
Number of Holdings | 61 |
Net Advisory Fee | $157,288 |
Portfolio Turnover | 48% |
Visit https://www.hwcm.com/mutual-funds/resources/literature/ for more recent performance information.
WHAT DID THE FUND INVEST IN? (as of June 30, 2024)
Geographic Breakdown (% of net assets)
| |
Top Holdings | (%) |
Telefonaktiebolaget LM Ericsson | 4.6% |
F5, Inc. | 3.8% |
Workday, Inc. | 3.8% |
Elevance Health, Inc. | 3.0% |
Alphabet, Inc. | 3.0% |
CVS Health Corp. | 2.6% |
Citigroup, Inc. | 2.5% |
Siemens AG | 2.5% |
Medtronic PLC | 2.4% |
Samsung Electronics Co. Ltd. | 2.4% |
For additional information about the Fund; including its prospectus, financial information, holdings and proxy information, scan the QR code or visit https://www.hwcm.com/mutual-funds/resources/literature/
The Fund is distributed by Quasar Distributors, LLC.
IMPORTANT INFORMATION
To reduce Fund expenses, only one copy of most shareholder documents may be mailed to shareholders with multiple accounts at the same address (Householding). If you would prefer that your Fund documents not be householded, please contact the Fund at 866-HW-FUNDS (866-493-8637), or contact your financial intermediary. Your instructions will typically be effective within 30 days of receipt by the Fund or your financial intermediary.
| Hotchkis & Wiley Global Value Fund | PAGE 2 | TSR_AR_44134R677 |
94739262838510706117081114088491442712685148801805510000101439861116551294813767141591968716864199862402156.49.67.66.64.54.42.42.01.55.0
| | |
| Hotchkis & Wiley Global Value Fund | |
| Class I | HWGIX |
| Annual Shareholder Report | June 30, 2024 |
This annual shareholder report contains important information about the Hotchkis & Wiley Global Value Fund for the period of July 1, 2023, to June 30, 2024. You can find additional information about the Fund at https://www.hwcm.com/mutual-funds/resources/literature/. You can also request this information by contacting us at 866-HW-FUNDS (866-493-8637).
This report describes changes to the Fund that occurred during the reporting period.
WHAT WERE THE FUND COSTS FOR THE PAST YEAR? (based on a hypothetical $10,000 investment)
| | |
Class Name | Costs of a $10,000 investment | Costs paid as a percentage of a $10,000 investment |
| Class I | $105 | 0.95% |
HOW DID THE FUND PERFORM LAST YEAR? WHAT AFFECTED ITS PERFORMANCE?
The Global Value Fund returned 21.57% for Class I shares at net asset value (NAV) for the 12 months ended June 30, 2024. The Fund outperformed the MSCI World Index, which returned 20.19%.
TOP DETRACTORS FROM PERFORMANCE
• Stock selection and an underweight in information technology was the largest relative detractor to performance. Stock selection in communication services also detracted.
TOP CONTRIBUTORS TO PERFORMANCE
• Stock selection and an overweight in financials were the primary contributors to relative performance, followed by stock selection in industrials.
HOW DID THE FUND PERFORM OVER THE PAST 10 YEARS?*
The $250,000 chart reflects a hypothetical $250,000 investment in the class of shares noted and assumes the maximum sales charge. The chart uses total return NAV performance and assumes reinvestment of dividends and capital gains. Fund expenses, including 12b-1 fees, management fees and other expenses were deducted.
CUMULATIVE PERFORMANCE (Initial Investment of $250,000)
| Hotchkis & Wiley Global Value Fund | PAGE 1 | TSR_AR_44134R685 |
ANNUAL AVERAGE TOTAL RETURN (%)
| | | |
| | 1 Year | 5 Year | 10 Year |
Class I | 21.57 | 10.41 | 6.92 |
MSCI World Index | 20.19 | 11.78 | 9.16 |
Visit https://www.hwcm.com/mutual-funds/resources/literature/ for more recent performance information.
| * | The Fund’s past performance is not a good predictor of how the Fund will perform in the future. The graph and table do not reflect the deduction of taxes that a shareholder would pay on Fund distributions or redemption of Fund shares. |
KEY FUND STATISTICS (as of June 30, 2024)
| |
Net Assets | $37,580,034 |
Number of Holdings | 61 |
Net Advisory Fee | $157,288 |
Portfolio Turnover | 48% |
Visit https://www.hwcm.com/mutual-funds/resources/literature/ for more recent performance information.
WHAT DID THE FUND INVEST IN? (as of June 30, 2024)
Geographic Breakdown (% of net assets)
| |
Top Holdings | (%) |
Telefonaktiebolaget LM Ericsson | 4.6% |
F5, Inc. | 3.8% |
Workday, Inc. | 3.8% |
Elevance Health, Inc. | 3.0% |
Alphabet, Inc. | 3.0% |
CVS Health Corp. | 2.6% |
Citigroup, Inc. | 2.5% |
Siemens AG | 2.5% |
Medtronic PLC | 2.4% |
Samsung Electronics Co. Ltd. | 2.4% |
For additional information about the Fund; including its prospectus, financial information, holdings and proxy information, scan the QR code or visit https://www.hwcm.com/mutual-funds/resources/literature/
The Fund is distributed by Quasar Distributors, LLC.
IMPORTANT INFORMATION
To reduce Fund expenses, only one copy of most shareholder documents may be mailed to shareholders with multiple accounts at the same address (Householding). If you would prefer that your Fund documents not be householded, please contact the Fund at 866-HW-FUNDS (866-493-8637), or contact your financial intermediary. Your instructions will typically be effective within 30 days of receipt by the Fund or your financial intermediary.
| Hotchkis & Wiley Global Value Fund | PAGE 2 | TSR_AR_44134R685 |
25000024505622238428450631180029754223678838734534142040155048815925000025357424652529138232368934418135396749217142160349964460053356.49.67.66.64.54.42.42.01.55.0
| | |
| Hotchkis & Wiley International Value Fund | |
| Class I | HWNIX |
| Annual Shareholder Report | June 30, 2024 |
This annual shareholder report contains important information about the Hotchkis & Wiley International Value Fund for the period of July 1, 2023, to June 30, 2024. You can find additional information about the Fund at https://www.hwcm.com/mutual-funds/resources/literature/. You can also request this information by contacting us at 866-HW-FUNDS (866-493-8637).
This report describes changes to the Fund that occurred during the reporting period.
WHAT WERE THE FUND COSTS FOR THE PAST YEAR? (based on a hypothetical $10,000 investment)
| | |
Class Name | Costs of a $10,000 investment | Costs paid as a percentage of a $10,000 investment |
| Class I | $102 | 0.95% |
HOW DID THE FUND PERFORM LAST YEAR? WHAT AFFECTED ITS PERFORMANCE?
The International Value Fund returned 14.18% for Class I shares at net asset value (NAV) for the 12 months ended June 30, 2024. The Fund underperformed the MSCI World Index, which returned 20.19%.
TOP DETRACTORS FROM PERFORMANCE
• Stock selection and an underweight in information technology were the largest relative detractors to performance, followed by stock selection in communication services, consumer discretionary, and materials.
TOP CONTRIBUTORS TO PERFORMANCE
• Stock selection and an overweight in financials helped relative performance.
HOW DID THE FUND PERFORM SINCE INCEPTION?*
The $250,000 chart reflects a hypothetical $250,000 investment in the class of shares noted and assumes the maximum sales charge. The chart uses total return NAV performance and assumes reinvestment of dividends and capital gains. Fund expenses, including 12b-1 fees, management fees and other expenses were deducted.
CUMULATIVE PERFORMANCE (Initial Investment of $250,000)
| Hotchkis & Wiley International Value Fund | PAGE 1 | TSR_AR_44134R636 |
ANNUAL AVERAGE TOTAL RETURN (%)
| | | |
| | 1 Year | 5 Year | Since Inception
(12/31/2015) |
Class I | 14.18 | 9.39 | 7.27 |
MSCI World Index | 20.19 | 11.78 | 11.13 |
MSCI World ex-USA Index | 11.22 | 6.55 | 6.64 |
Visit https://www.hwcm.com/mutual-funds/resources/literature/ for more recent performance information.
| * | The Fund’s past performance is not a good predictor of how the Fund will perform in the future. The graph and table do not reflect the deduction of taxes that a shareholder would pay on Fund distributions or redemption of Fund shares. |
KEY FUND STATISTICS (as of June 30, 2024)
| |
Net Assets | $3,646,979 |
Number of Holdings | 54 |
Net Advisory Fee | $0 |
Portfolio Turnover | 35% |
Visit https://www.hwcm.com/mutual-funds/resources/literature/ for more recent performance information.
WHAT DID THE FUND INVEST IN? (as of June 30, 2024)
Geographic Breakdown (% of net assets)
| |
Top Holdings | (%) |
Telefonaktiebolaget LM Ericsson | 5.2% |
Siemens AG | 4.1% |
Shell PLC | 3.7% |
Samsung Electronics Co. Ltd. | 3.5% |
Babcock International Group PLC | 3.5% |
Lloyds Banking Group PLC | 3.3% |
Henkel AG & Co. KGaA | 3.3% |
WPP PLC | 3.0% |
Heineken Holding NV | 3.0% |
Qantas Airways Ltd. | 2.8% |
Other Material Fund Changes
In connection with the Securities and Exchange Commission’s new Tailored Shareholder Report rule, the Fund’s primary benchmark index changed to the MSCI World Index. The Fund will continue to show index performance for the MSCI World ex-USA Index, the Fund’s prior benchmark index.
For additional information about the Fund; including its prospectus, financial information, holdings and proxy information, scan the QR code or visit https://www.hwcm.com/mutual-funds/resources/literature/
The Fund is distributed by Quasar Distributors, LLC.
IMPORTANT INFORMATION
To reduce Fund expenses, only one copy of most shareholder documents may be mailed to shareholders with multiple accounts at the same address (Householding). If you would prefer that your Fund documents not be householded, please contact the Fund at 866-HW-FUNDS (866-493-8637), or contact your financial intermediary. Your instructions will typically be effective within 30 days of receipt by the Fund or your financial intermediary.
| Hotchkis & Wiley International Value Fund | PAGE 2 | TSR_AR_44134R636 |
24400030778831855028975923279336169832618139753445389825163829742533040135131836130750237743034651000561298624254228980731021931421329717639703233049738805243160922.415.113.69.98.36.65.65.23.59.8
| | |
| Hotchkis & Wiley International Small Cap Diversified Value Fund | |
| Class I | HWTIX |
| Annual Shareholder Report | June 30, 2024 |
This annual shareholder report contains important information about the Hotchkis & Wiley International Small Cap Diversified Value Fund for the period of July 1, 2023, to June 30, 2024. You can find additional information about the Fund at https://www.hwcm.com/mutual-funds/resources/literature/. You can also request this information by contacting us at 866-HW-FUNDS (866-493-8637).
This report describes changes to the Fund that occurred during the reporting period.
WHAT WERE THE FUND COSTS FOR THE PAST YEAR? (based on a hypothetical $10,000 investment)
| | |
Class Name | Costs of a $10,000 investment | Costs paid as a percentage of a $10,000 investment |
| Class I | $107 | 0.99% |
HOW DID THE FUND PERFORM LAST YEAR? WHAT AFFECTED ITS PERFORMANCE?
The International Small Cap Diversified Value Fund returned 15.63% for Class I shares at net asset value (NAV) for the 12 months ended June 30, 2024. The Fund underperformed the MSCI World Index, which returned 20.19%.
TOP DETRACTORS FROM PERFORMANCE
• Stock selection in communication services and an underweight and stock selection in information technology were the largest relative detractors to performance.
TOP CONTRIBUTORS TO PERFORMANCE
• Stock selection in health care and consumer staples helped relative performance.
HOW DID THE FUND PERFORM SINCE INCEPTION?*
The $250,000 chart reflects a hypothetical $250,000 investment in the class of shares noted and assumes the maximum sales charge. The chart uses total return NAV performance and assumes reinvestment of dividends and capital gains. Fund expenses, including 12b-1 fees, management fees and other expenses were deducted.
CUMULATIVE PERFORMANCE (Initial Investment of $250,000)
| Hotchkis & Wiley International Small Cap Diversified Value Fund | PAGE 1 | TSR_AR_44134R453 |
ANNUAL AVERAGE TOTAL RETURN (%)
| | |
| | 1 Year | Since Inception
(06/30/2020) |
Class I | 15.63 | 15.16 |
MSCI World Index | 20.19 | 14.13 |
MSCI World ex-USA Small Cap Index | 7.80 | 6.77 |
Visit https://www.hwcm.com/mutual-funds/resources/literature/ for more recent performance information.
| * | The Fund’s past performance is not a good predictor of how the Fund will perform in the future. The graph and table do not reflect the deduction of taxes that a shareholder would pay on Fund distributions or redemption of Fund shares. |
KEY FUND STATISTICS (as of June 30, 2024)
| |
Net Assets | $8,063,379 |
Number of Holdings | 303 |
Net Advisory Fee | $0 |
Portfolio Turnover | 62% |
Visit https://www.hwcm.com/mutual-funds/resources/literature/ for more recent performance information.
WHAT DID THE FUND INVEST IN? (as of June 30, 2024)
Geographic Breakdown (% of net assets)
| |
Top Holdings | (%) |
Canadian Western Bank | 0.8% |
Kamei Corp. | 0.6% |
Fast Fitness Japan, Inc. | 0.6% |
Inter Action Corp. | 0.6% |
Cresco Ltd. | 0.6% |
Financial Partners Group Co. Ltd. | 0.6% |
Morita Holdings Corp. | 0.6% |
GLOBERIDE, Inc. | 0.6% |
Trancom Co. Ltd. | 0.6% |
Dai Nippon Toryo Co. Ltd. | 0.6% |
Other Material Fund Changes
In connection with the Securities and Exchange Commission’s new Tailored Shareholder Report rule, the Fund’s primary benchmark index changed to the MSCI World Index. The Fund will continue to show index performance for the MSCI World ex-USA Small Cap Index, the Fund’s prior benchmark index.
For additional information about the Fund; including its prospectus, financial information, holdings and proxy information, scan the QR code or visit https://www.hwcm.com/mutual-funds/resources/literature/
The Fund is distributed by Quasar Distributors, LLC.
IMPORTANT INFORMATION
To reduce Fund expenses, only one copy of most shareholder documents may be mailed to shareholders with multiple accounts at the same address (Householding). If you would prefer that your Fund documents not be householded, please contact the Fund at 866-HW-FUNDS (866-493-8637), or contact your financial intermediary. Your instructions will typically be effective within 30 days of receipt by the Fund or your financial intermediary.
| Hotchkis & Wiley International Small Cap Diversified Value Fund | PAGE 2 | TSR_AR_44134R453 |
25000037894232484338030143973025000034761129777035288942414525000035571127381330132432484032.413.89.96.15.34.23.43.12.819.0
| | |
| Hotchkis & Wiley Value Opportunities Fund | |
| Class A | HWAAX |
| Annual Shareholder Report | June 30, 2024 |
This annual shareholder report contains important information about the Hotchkis & Wiley Value Opportunities Fund for the period of July 1, 2023, to June 30, 2024. You can find additional information about the Fund at https://www.hwcm.com/mutual-funds/resources/literature/. You can also request this information by contacting us at 866-HW-FUNDS (866-493-8637).
This report describes changes to the Fund that occurred during the reporting period.
WHAT WERE THE FUND COSTS FOR THE PAST YEAR? (based on a hypothetical $10,000 investment)
| | |
Class Name | Costs of a $10,000 investment | Costs paid as a percentage of a $10,000 investment |
| Class A | $129 | 1.18% |
HOW DID THE FUND PERFORM LAST YEAR? WHAT AFFECTED ITS PERFORMANCE?
The Value Opportunities Fund returned 18.68% for Class A shares at net asset value (NAV) for the 12 months ended June 30, 2024. The Fund underperformed the Russell 3000 Index, which returned 23.13%.
TOP DETRACTORS FROM PERFORMANCE
• Large cap stocks significantly outperformed their small cap counterparts. This performance disparity has widened the valuation gap between large cap and small cap stocks.
• Stock selection in information technology and communication services was the largest relative detractor. An underweight in the strong performing information technology sector also detracted from performance.
TOP CONTRIBUTORS TO PERFORMANCE
• Stock selection in industrials and financials helped relative performance.
HOW DID THE FUND PERFORM OVER THE PAST 10 YEARS?*
The $10,000 chart reflects a hypothetical $10,000 investment in the class of shares noted and assumes the maximum sales charge. The chart uses total return NAV performance and assumes reinvestment of dividends and capital gains. Fund expenses, including 12b-1 fees, management fees and other expenses were deducted.
CUMULATIVE PERFORMANCE (Initial Investment of $10,000)
| Hotchkis & Wiley Value Opportunities Fund | PAGE 1 | TSR_AR_44134R792 |
ANNUAL AVERAGE TOTAL RETURN (%)
| | | |
| | 1 Year | 5 Year | 10 Year |
Class A (without sales charge) | 18.68 | 12.65 | 9.74 |
Class A (with sales charge) | 12.44 | 11.44 | 9.14 |
Russell 3000 Index | 23.13 | 14.14 | 12.15 |
Russell 3000 Value Index | 12.93 | 8.89 | 8.10 |
Visit https://www.hwcm.com/mutual-funds/resources/literature/ for more recent performance information.
| * | The Fund’s past performance is not a good predictor of how the Fund will perform in the future. The graph and table do not reflect the deduction of taxes that a shareholder would pay on Fund distributions or redemption of Fund shares. |
KEY FUND STATISTICS (as of June 30, 2024)
| |
Net Assets | $653,108,717 |
Number of Holdings | 69 |
Net Advisory Fee | $4,501,560 |
Portfolio Turnover | 71% |
Visit https://www.hwcm.com/mutual-funds/resources/literature/ for more recent performance information.
WHAT DID THE FUND INVEST IN? (as of June 30, 2024)
Sector Breakdown (% of net assets)
| |
Top Holdings | (%) |
F5, Inc. | 6.8% |
Telefonaktiebolaget LM Ericsson | 6.4% |
Workday, Inc. | 4.8% |
Arrow Electronics, Inc. | 3.5% |
Shell PLC | 3.3% |
Baker Hughes Co. | 3.2% |
Siemens AG | 3.1% |
General Motors Co. | 3.1% |
NOV, Inc. | 3.1% |
Stagwell, Inc. | 3.0% |
For additional information about the Fund; including its prospectus, financial information, holdings and proxy information, scan the QR code or visit https://www.hwcm.com/mutual-funds/resources/literature/
The Fund is distributed by Quasar Distributors, LLC.
IMPORTANT INFORMATION
To reduce Fund expenses, only one copy of most shareholder documents may be mailed to shareholders with multiple accounts at the same address (Householding). If you would prefer that your Fund documents not be householded, please contact the Fund at 866-HW-FUNDS (866-493-8637), or contact your financial intermediary. Your instructions will typically be effective within 30 days of receipt by the Fund or your financial intermediary.
| Hotchkis & Wiley Value Opportunities Fund | PAGE 2 | TSR_AR_44134R792 |
947410086900611570129411322310879184111625420214239901000010729109591298714907162461730624949214902556331475100001038610637123611325814231128901874217343192892178424.517.313.812.67.66.94.96.42.73.3
| | |
| Hotchkis & Wiley Value Opportunities Fund | |
| Class C | HWACX |
| Annual Shareholder Report | June 30, 2024 |
This annual shareholder report contains important information about the Hotchkis & Wiley Value Opportunities Fund for the period of July 1, 2023, to June 30, 2024. You can find additional information about the Fund at https://www.hwcm.com/mutual-funds/resources/literature/. You can also request this information by contacting us at 866-HW-FUNDS (866-493-8637).
This report describes changes to the Fund that occurred during the reporting period.
WHAT WERE THE FUND COSTS FOR THE PAST YEAR? (based on a hypothetical $10,000 investment)
| | |
Class Name | Costs of a $10,000 investment | Costs paid as a percentage of a $10,000 investment |
| Class C | $207 | 1.90% |
HOW DID THE FUND PERFORM LAST YEAR? WHAT AFFECTED ITS PERFORMANCE?
The Value Opportunities Fund returned 17.85% for Class C shares at net asset value (NAV) for the 12 months ended June 30, 2024. The Fund underperformed the Russell 3000 Index, which returned 23.13%.
TOP DETRACTORS FROM PERFORMANCE
• Large cap stocks significantly outperformed their small cap counterparts. This performance disparity has widened the valuation gap between large cap and small cap stocks.
• Stock selection in information technology and communication services was the largest relative detractor. An underweight in the strong performing information technology sector also detracted from performance.
TOP CONTRIBUTORS TO PERFORMANCE
• Stock selection in industrials and financials helped relative performance.
HOW DID THE FUND PERFORM OVER THE PAST 10 YEARS?*
The $10,000 chart reflects a hypothetical $10,000 investment in the class of shares noted and assumes the maximum sales charge. The chart uses total return NAV performance and assumes reinvestment of dividends and capital gains. Fund expenses, including 12b-1 fees, management fees and other expenses were deducted.
CUMULATIVE PERFORMANCE (Initial Investment of $10,000)
| Hotchkis & Wiley Value Opportunities Fund | PAGE 1 | TSR_AR_44134R826 |
ANNUAL AVERAGE TOTAL RETURN (%)
| | | |
| | 1 Year | 5 Year | 10 Year |
Class C (without sales charge) | 17.85 | 11.85 | 8.94 |
Class C (with sales charge) | 16.85 | 11.85 | 8.94 |
Russell 3000 Index | 23.13 | 14.14 | 12.15 |
Russell 3000 Value Index | 12.93 | 8.89 | 8.10 |
Visit https://www.hwcm.com/mutual-funds/resources/literature/ for more recent performance information.
| * | The Fund’s past performance is not a good predictor of how the Fund will perform in the future. The graph and table do not reflect the deduction of taxes that a shareholder would pay on Fund distributions or redemption of Fund shares. |
KEY FUND STATISTICS (as of June 30, 2024)
| |
Net Assets | $653,108,717 |
Number of Holdings | 69 |
Net Advisory Fee | $4,501,560 |
Portfolio Turnover | 71% |
Visit https://www.hwcm.com/mutual-funds/resources/literature/ for more recent performance information.
WHAT DID THE FUND INVEST IN? (as of June 30, 2024)
Sector Breakdown (% of net assets)
| |
Top Holdings | (%) |
F5, Inc. | 6.8% |
Telefonaktiebolaget LM Ericsson | 6.4% |
Workday, Inc. | 4.8% |
Arrow Electronics, Inc. | 3.5% |
Shell PLC | 3.3% |
Baker Hughes Co. | 3.2% |
Siemens AG | 3.1% |
General Motors Co. | 3.1% |
NOV, Inc. | 3.1% |
Stagwell, Inc. | 3.0% |
For additional information about the Fund; including its prospectus, financial information, holdings and proxy information, scan the QR code or visit https://www.hwcm.com/mutual-funds/resources/literature/
The Fund is distributed by Quasar Distributors, LLC.
IMPORTANT INFORMATION
To reduce Fund expenses, only one copy of most shareholder documents may be mailed to shareholders with multiple accounts at the same address (Householding). If you would prefer that your Fund documents not be householded, please contact the Fund at 866-HW-FUNDS (866-493-8637), or contact your financial intermediary. Your instructions will typically be effective within 30 days of receipt by the Fund or your financial intermediary.
| Hotchkis & Wiley Value Opportunities Fund | PAGE 2 | TSR_AR_44134R826 |
1000010565936411942132541344510982184551617819971235361000010729109591298714907162461730624949214902556331475100001038610637123611325814231128901874217343192892178424.517.313.812.67.66.94.96.42.73.3
| | |
| Hotchkis & Wiley Value Opportunities Fund | |
| Class I | HWAIX |
| Annual Shareholder Report | June 30, 2024 |
This annual shareholder report contains important information about the Hotchkis & Wiley Value Opportunities Fund for the period of July 1, 2023, to June 30, 2024. You can find additional information about the Fund at https://www.hwcm.com/mutual-funds/resources/literature/. You can also request this information by contacting us at 866-HW-FUNDS (866-493-8637).
This report describes changes to the Fund that occurred during the reporting period.
WHAT WERE THE FUND COSTS FOR THE PAST YEAR? (based on a hypothetical $10,000 investment)
| | |
Class Name | Costs of a $10,000 investment | Costs paid as a percentage of a $10,000 investment |
| Class I | $104 | 0.95% |
HOW DID THE FUND PERFORM LAST YEAR? WHAT AFFECTED ITS PERFORMANCE?
The Value Opportunities Fund returned 18.97% for Class I shares at net asset value (NAV) for the 12 months ended June 30, 2024. The Fund underperformed the Russell 3000 Index, which returned 23.13%.
TOP DETRACTORS FROM PERFORMANCE
• Large cap stocks significantly outperformed their small cap counterparts. This performance disparity has widened the valuation gap between large cap and small cap stocks.
• Stock selection in information technology and communication services was the largest relative detractor. An underweight in the strong performing information technology sector also detracted from performance.
TOP CONTRIBUTORS TO PERFORMANCE
• Stock selection in industrials and financials helped relative performance.
HOW DID THE FUND PERFORM OVER THE PAST 10 YEARS?*
The $250,000 chart reflects a hypothetical $250,000 investment in the class of shares noted and assumes the maximum sales charge. The chart uses total return NAV performance and assumes reinvestment of dividends and capital gains. Fund expenses, including 12b-1 fees, management fees and other expenses were deducted.
CUMULATIVE PERFORMANCE (Initial Investment of $250,000)
| Hotchkis & Wiley Value Opportunities Fund | PAGE 1 | TSR_AR_44134R834 |
ANNUAL AVERAGE TOTAL RETURN (%)
| | | |
| | 1 Year | 5 Year | 10 Year |
Class I | 18.97 | 12.94 | 10.01 |
Russell 3000 Index | 23.13 | 14.14 | 12.15 |
Russell 3000 Value Index | 12.93 | 8.89 | 8.10 |
Visit https://www.hwcm.com/mutual-funds/resources/literature/ for more recent performance information.
| * | The Fund’s past performance is not a good predictor of how the Fund will perform in the future. The graph and table do not reflect the deduction of taxes that a shareholder would pay on Fund distributions or redemption of Fund shares. |
KEY FUND STATISTICS (as of June 30, 2024)
| |
Net Assets | $653,108,717 |
Number of Holdings | 69 |
Net Advisory Fee | $4,501,560 |
Portfolio Turnover | 71% |
Visit https://www.hwcm.com/mutual-funds/resources/literature/ for more recent performance information.
WHAT DID THE FUND INVEST IN? (as of June 30, 2024)
Sector Breakdown (% of net assets)
| |
Top Holdings | (%) |
F5, Inc. | 6.8% |
Telefonaktiebolaget LM Ericsson | 6.4% |
Workday, Inc. | 4.8% |
Arrow Electronics, Inc. | 3.5% |
Shell PLC | 3.3% |
Baker Hughes Co. | 3.2% |
Siemens AG | 3.1% |
General Motors Co. | 3.1% |
NOV, Inc. | 3.1% |
Stagwell, Inc. | 3.0% |
For additional information about the Fund; including its prospectus, financial information, holdings and proxy information, scan the QR code or visit https://www.hwcm.com/mutual-funds/resources/literature/
The Fund is distributed by Quasar Distributors, LLC.
IMPORTANT INFORMATION
To reduce Fund expenses, only one copy of most shareholder documents may be mailed to shareholders with multiple accounts at the same address (Householding). If you would prefer that your Fund documents not be householded, please contact the Fund at 866-HW-FUNDS (866-493-8637), or contact your financial intermediary. Your instructions will typically be effective within 30 days of receipt by the Fund or your financial intermediary.
| Hotchkis & Wiley Value Opportunities Fund | PAGE 2 | TSR_AR_44134R834 |
25000026686723888630766134491335336829132849459943773154570864924625000026823527397132468237266440613843265762373753725363908278687025000025965526593230903433144335576532224946853843357748222254459124.517.313.812.67.66.94.96.42.73.3
| | |
| Hotchkis & Wiley Value Opportunities Fund | |
| Class Z | HWAZX |
| Annual Shareholder Report | June 30, 2024 |
This annual shareholder report contains important information about the Hotchkis & Wiley Value Opportunities Fund for the period of July 1, 2023, to June 30, 2024. You can find additional information about the Fund at https://www.hwcm.com/mutual-funds/resources/literature/. You can also request this information by contacting us at 866-HW-FUNDS (866-493-8637).
This report describes changes to the Fund that occurred during the reporting period.
WHAT WERE THE FUND COSTS FOR THE PAST YEAR? (based on a hypothetical $10,000 investment)
| | |
Class Name | Costs of a $10,000 investment | Costs paid as a percentage of a $10,000 investment |
| Class Z | $94 | 0.86% |
HOW DID THE FUND PERFORM LAST YEAR? WHAT AFFECTED ITS PERFORMANCE?
The Value Opportunities Fund returned 19.06% for Class Z shares at net asset value (NAV) for the 12 months ended June 30, 2024. The Fund underperformed the Russell 3000 Index, which returned 23.13%.
TOP DETRACTORS FROM PERFORMANCE
• Large cap stocks significantly outperformed their small cap counterparts. This performance disparity has widened the valuation gap between large cap and small cap stocks.
• Stock selection in information technology and communication services was the largest relative detractor. An underweight in the strong performing information technology sector also detracted from performance.
TOP CONTRIBUTORS TO PERFORMANCE
• Stock selection in industrials and financials helped relative performance.
HOW DID THE FUND PERFORM SINCE INCEPTION?*
The $1,000,000 chart reflects a hypothetical $1,000,000 investment in the class of shares noted and assumes the maximum sales charge. The chart uses total return NAV performance and assumes reinvestment of dividends and capital gains. Fund expenses, including 12b-1 fees, management fees and other expenses were deducted.
CUMULATIVE PERFORMANCE (Initial Investment of $1,000,000)
| Hotchkis & Wiley Value Opportunities Fund | PAGE 1 | TSR_AR_44134R461 |
ANNUAL AVERAGE TOTAL RETURN (%)
| | |
| | 1 Year | Since Inception
(09/30/2019) |
Class Z | 19.06 | 14.01 |
Russell 3000 Index | 23.13 | 14.66 |
Russell 3000 Value Index | 12.93 | 9.10 |
Visit https://www.hwcm.com/mutual-funds/resources/literature/ for more recent performance information.
| * | The Fund’s past performance is not a good predictor of how the Fund will perform in the future. The graph and table do not reflect the deduction of taxes that a shareholder would pay on Fund distributions or redemption of Fund shares. |
KEY FUND STATISTICS (as of June 30, 2024)
| |
Net Assets | $653,108,717 |
Number of Holdings | 69 |
Net Advisory Fee | $4,501,560 |
Portfolio Turnover | 71% |
Visit https://www.hwcm.com/mutual-funds/resources/literature/ for more recent performance information.
WHAT DID THE FUND INVEST IN? (as of June 30, 2024)
Sector Breakdown (% of net assets)
| |
Top Holdings | (%) |
F5, Inc. | 6.8% |
Telefonaktiebolaget LM Ericsson | 6.4% |
Workday, Inc. | 4.8% |
Arrow Electronics, Inc. | 3.5% |
Shell PLC | 3.3% |
Baker Hughes Co. | 3.2% |
Siemens AG | 3.1% |
General Motors Co. | 3.1% |
NOV, Inc. | 3.1% |
Stagwell, Inc. | 3.0% |
For additional information about the Fund; including its prospectus, financial information, holdings and proxy information, scan the QR code or visit https://www.hwcm.com/mutual-funds/resources/literature/
The Fund is distributed by Quasar Distributors, LLC.
IMPORTANT INFORMATION
To reduce Fund expenses, only one copy of most shareholder documents may be mailed to shareholders with multiple accounts at the same address (Householding). If you would prefer that your Fund documents not be householded, please contact the Fund at 866-HW-FUNDS (866-493-8637), or contact your financial intermediary. Your instructions will typically be effective within 30 days of receipt by the Fund or your financial intermediary.
| Hotchkis & Wiley Value Opportunities Fund | PAGE 2 | TSR_AR_44134R461 |
833887141647712550131565532186395210530531518128130763115554751915179894826130104312039621339041151222724.517.313.812.67.66.94.96.42.73.3
| | |
| Hotchkis & Wiley High Yield Fund | |
| Class A | HWHAX |
| Annual Shareholder Report | June 30, 2024 |
This annual shareholder report contains important information about the Hotchkis & Wiley High Yield Fund for the period of July 1, 2023, to June 30, 2024. You can find additional information about the Fund at https://www.hwcm.com/mutual-funds/resources/literature/. You can also request this information by contacting us at 866-HW-FUNDS (866-493-8637).
This report describes changes to the Fund that occurred during the reporting period.
WHAT WERE THE FUND COSTS FOR THE PAST YEAR? (based on a hypothetical $10,000 investment)
| | |
Class Name | Costs of a $10,000 investment | Costs paid as a percentage of a $10,000 investment |
| Class A | $96 | 0.92% |
HOW DID THE FUND PERFORM LAST YEAR? WHAT AFFECTED ITS PERFORMANCE?
The High Yield Fund returned 9.48% for Class A shares at net asset value (NAV) for the 12 months ended June 30, 2024. The Fund outperformed the ICE BofA U.S. Corporate Bond Index, which returned 5.04%.
TOP DETRACTORS FROM PERFORMANCE
• Credit selection within the retail, basic industry, and financial services sectors detracted from relative performance.
TOP CONTRIBUTORS TO PERFORMANCE
• From a sector perspective, credit selection within capital goods, energy, transportation, services, and leisure contributed to performance.
• From a ratings perspective, credit selection within the BB and B cohort were the primary contributors to relative performance.
HOW DID THE FUND PERFORM OVER THE PAST 10 YEARS?*
The $10,000 chart reflects a hypothetical $10,000 investment in the class of shares noted and assumes the maximum sales charge. The chart uses total return NAV performance and assumes reinvestment of dividends and capital gains. Fund expenses, including 12b-1 fees, management fees and other expenses were deducted.
CUMULATIVE PERFORMANCE (Initial Investment of $10,000)
| Hotchkis & Wiley High Yield Fund | PAGE 1 | TSR_AR_44134R727 |
ANNUAL AVERAGE TOTAL RETURN (%)
| | | |
| | 1 Year | 5 Year | 10 Year |
Class A (without sales charge) | 9.48 | 3.03 | 3.26 |
Class A (with sales charge) | 5.37 | 2.24 | 2.87 |
ICE BofA U.S. Corporate Bond Index | 5.04 | 0.78 | 2.39 |
ICE BofA BB-B U.S. High Yield Constrained Index | 10.15 | 3.69 | 4.25 |
Visit https://www.hwcm.com/mutual-funds/resources/literature/ for more recent performance information.
| * | The Fund’s past performance is not a good predictor of how the Fund will perform in the future. The graph and table do not reflect the deduction of taxes that a shareholder would pay on Fund distributions or redemption of Fund shares. |
KEY FUND STATISTICS (as of June 30, 2024)
| |
Net Assets | $897,796,524 |
Number of Holdings | 212 |
Net Advisory Fee | $4,451,409 |
Portfolio Turnover | 44% |
Visit https://www.hwcm.com/mutual-funds/resources/literature/ for more recent performance information.
WHAT DID THE FUND INVEST IN? (as of June 30, 2024)
Security Type Breakdown (% of net assets)
| |
Top 10 Issuers | (%) |
CCO Holdings LLC / CCO Holdings Capital Corp. | 2.0% |
Carnival Corp. | 1.7% |
TransDigm, Inc. | 1.1% |
Authentic Brands Group LLC | 1.1% |
Iracore Holdings Corp. | 1.0% |
TK Elevator Holdco GmbH | 1.0% |
WR Grace Holdings LLC | 0.9% |
Spirit AeroSystems, Inc. | 0.8% |
Mativ Holdings, Inc. | 0.8% |
EMRLD Borrower LP / Emerald Co.-Issuer, Inc. | 0.8% |
Other Material Fund Changes
In connection with the Securities and Exchange Commission’s new Tailored Shareholder Report rule, the Fund’s primary benchmark index changed to the ICE BofA U.S. Corporate Bond Index. The Fund will continue to show index performance for the ICE BofA BB-B U.S. High Yield Constrained Index, the Fund’s prior benchmark index.
For additional information about the Fund; including its prospectus, financial information, holdings and proxy information, scan the QR code or visit https://www.hwcm.com/mutual-funds/resources/literature/
The Fund is distributed by Quasar Distributors, LLC.
IMPORTANT INFORMATION
To reduce Fund expenses, only one copy of most shareholder documents may be mailed to shareholders with multiple accounts at the same address (Householding). If you would prefer that your Fund documents not be householded, please contact the Fund at 866-HW-FUNDS (866-493-8637), or contact your financial intermediary. Your instructions will typically be effective within 30 days of receipt by the Fund or your financial intermediary.
| Hotchkis & Wiley High Yield Fund | PAGE 2 | TSR_AR_44134R727 |
96239572944410711109981142910541125541113712118132661000010101108471110011022121861332013802118931206112669100001007010285114311164312647127131442212662137611515889.04.81.10.90.24.0
| | |
| Hotchkis & Wiley High Yield Fund | |
| Class I | HWHIX |
| Annual Shareholder Report | June 30, 2024 |
This annual shareholder report contains important information about the Hotchkis & Wiley High Yield Fund for the period of July 1, 2023, to June 30, 2024. You can find additional information about the Fund at https://www.hwcm.com/mutual-funds/resources/literature/. You can also request this information by contacting us at 866-HW-FUNDS (866-493-8637).
This report describes changes to the Fund that occurred during the reporting period.
WHAT WERE THE FUND COSTS FOR THE PAST YEAR? (based on a hypothetical $10,000 investment)
| | |
Class Name | Costs of a $10,000 investment | Costs paid as a percentage of a $10,000 investment |
| Class I | $73 | 0.70% |
HOW DID THE FUND PERFORM LAST YEAR? WHAT AFFECTED ITS PERFORMANCE?
The High Yield Fund returned 9.68% for Class I shares at net asset value (NAV) for the 12 months ended June 30, 2024. The Fund outperformed the ICE BofA U.S. Corporate Bond Index, which returned 5.04%.
TOP DETRACTORS FROM PERFORMANCE
• Credit selection within the retail, basic industry, and financial services sectors detracted from relative performance.
TOP CONTRIBUTORS TO PERFORMANCE
• From a sector perspective, credit selection within capital goods, energy, transportation, services, and leisure contributed to performance.
• From a ratings perspective, credit selection within the BB and B cohort were the primary contributors to relative performance.
HOW DID THE FUND PERFORM OVER THE PAST 10 YEARS?*
The $250,000 chart reflects a hypothetical $250,000 investment in the class of shares noted and assumes the maximum sales charge. The chart uses total return NAV performance and assumes reinvestment of dividends and capital gains. Fund expenses, including 12b-1 fees, management fees and other expenses were deducted.
CUMULATIVE PERFORMANCE (Initial Investment of $250,000)
| Hotchkis & Wiley High Yield Fund | PAGE 1 | TSR_AR_44134R735 |
ANNUAL AVERAGE TOTAL RETURN (%)
| | | |
| | 1 Year | 5 Year | 10 Year |
Class I | 9.68 | 3.34 | 3.55 |
ICE BofA U.S. Corporate Bond Index | 5.04 | 0.78 | 2.39 |
ICE BofA BB-B U.S. High Yield Constrained Index | 10.15 | 3.69 | 4.25 |
Visit https://www.hwcm.com/mutual-funds/resources/literature/ for more recent performance information.
| * | The Fund’s past performance is not a good predictor of how the Fund will perform in the future. The graph and table do not reflect the deduction of taxes that a shareholder would pay on Fund distributions or redemption of Fund shares. |
KEY FUND STATISTICS (as of June 30, 2024)
| |
Net Assets | $897,796,524 |
Number of Holdings | 212 |
Net Advisory Fee | $4,451,409 |
Portfolio Turnover | 44% |
Visit https://www.hwcm.com/mutual-funds/resources/literature/ for more recent performance information.
WHAT DID THE FUND INVEST IN? (as of June 30, 2024)
Security Type Breakdown (% of net assets)
| |
Top 10 Issuers | (%) |
CCO Holdings LLC / CCO Holdings Capital Corp. | 2.0% |
Carnival Corp. | 1.7% |
TransDigm, Inc. | 1.1% |
Authentic Brands Group LLC | 1.1% |
Iracore Holdings Corp. | 1.0% |
TK Elevator Holdco GmbH | 1.0% |
WR Grace Holdings LLC | 0.9% |
Spirit AeroSystems, Inc. | 0.8% |
Mativ Holdings, Inc. | 0.8% |
EMRLD Borrower LP / Emerald Co.-Issuer, Inc. | 0.8% |
Other Material Fund Changes
In connection with the Securities and Exchange Commission’s new Tailored Shareholder Report rule, the Fund’s primary benchmark index changed to the ICE BofA U.S. Corporate Bond Index. The Fund will continue to show index performance for the ICE BofA BB-B U.S. High Yield Constrained Index, the Fund’s prior benchmark index.
For additional information about the Fund; including its prospectus, financial information, holdings and proxy information, scan the QR code or visit https://www.hwcm.com/mutual-funds/resources/literature/
The Fund is distributed by Quasar Distributors, LLC.
IMPORTANT INFORMATION
To reduce Fund expenses, only one copy of most shareholder documents may be mailed to shareholders with multiple accounts at the same address (Householding). If you would prefer that your Fund documents not be householded, please contact the Fund at 866-HW-FUNDS (866-493-8637), or contact your financial intermediary. Your instructions will typically be effective within 30 days of receipt by the Fund or your financial intermediary.
| Hotchkis & Wiley High Yield Fund | PAGE 2 | TSR_AR_44134R735 |
25000024935924655628045528850230058727877333264129564032292535419025000025253727116427749127556130465433298834505829732930153031673525000025175325712228577929108031616131781336053531655734401837894589.04.81.10.90.24.0
| | |
| Hotchkis & Wiley High Yield Fund | |
| Class Z | HWHZX |
| Annual Shareholder Report | June 30, 2024 |
This annual shareholder report contains important information about the Hotchkis & Wiley High Yield Fund for the period of July 1, 2023, to June 30, 2024. You can find additional information about the Fund at https://www.hwcm.com/mutual-funds/resources/literature/. You can also request this information by contacting us at 866-HW-FUNDS (866-493-8637).
This report describes changes to the Fund that occurred during the reporting period.
WHAT WERE THE FUND COSTS FOR THE PAST YEAR? (based on a hypothetical $10,000 investment)
| | |
Class Name | Costs of a $10,000 investment | Costs paid as a percentage of a $10,000 investment |
| Class Z | $63 | 0.60% |
HOW DID THE FUND PERFORM LAST YEAR? WHAT AFFECTED ITS PERFORMANCE?
The High Yield Fund returned 9.90% for Class Z shares at net asset value (NAV) for the 12 months ended June 30, 2024. The Fund outperformed the ICE BofA U.S. Corporate Bond Index, which returned 5.04%.
TOP DETRACTORS FROM PERFORMANCE
• Credit selection within the retail, basic industry, and financial services sectors detracted from relative performance.
TOP CONTRIBUTORS TO PERFORMANCE
• From a sector perspective, credit selection within capital goods, energy, transportation, services, and leisure contributed to performance.
• From a ratings perspective, credit selection within the BB and B cohort were the primary contributors to relative performance.
HOW DID THE FUND PERFORM SINCE INCEPTION?*
The $1,000,000 chart reflects a hypothetical $1,000,000 investment in the class of shares noted and assumes the maximum sales charge. The chart uses total return NAV performance and assumes reinvestment of dividends and capital gains. Fund expenses, including 12b-1 fees, management fees and other expenses were deducted.
CUMULATIVE PERFORMANCE (Initial Investment of $1,000,000)
| Hotchkis & Wiley High Yield Fund | PAGE 1 | TSR_AR_44134R529 |
ANNUAL AVERAGE TOTAL RETURN (%)
| | | |
| | 1 Year | 5 Year | Since Inception
(03/29/2018) |
Class Z | 9.90 | 3.42 | 3.53 |
ICE BofA U.S. Corporate Bond Index | 5.04 | 0.78 | 2.10 |
ICE BofA BB-B U.S. High Yield Constrained Index | 10.15 | 3.69 | 4.42 |
Visit https://www.hwcm.com/mutual-funds/resources/literature/ for more recent performance information.
| * | The Fund’s past performance is not a good predictor of how the Fund will perform in the future. The graph and table do not reflect the deduction of taxes that a shareholder would pay on Fund distributions or redemption of Fund shares. |
KEY FUND STATISTICS (as of June 30, 2024)
| |
Net Assets | $897,796,524 |
Number of Holdings | 212 |
Net Advisory Fee | $4,451,409 |
Portfolio Turnover | 44% |
Visit https://www.hwcm.com/mutual-funds/resources/literature/ for more recent performance information.
WHAT DID THE FUND INVEST IN? (as of June 30, 2024)
Security Type Breakdown (% of net assets)
| |
Top 10 Issuers | (%) |
CCO Holdings LLC / CCO Holdings Capital Corp. | 2.0% |
Carnival Corp. | 1.7% |
TransDigm, Inc. | 1.1% |
Authentic Brands Group LLC | 1.1% |
Iracore Holdings Corp. | 1.0% |
TK Elevator Holdco GmbH | 1.0% |
WR Grace Holdings LLC | 0.9% |
Spirit AeroSystems, Inc. | 0.8% |
Mativ Holdings, Inc. | 0.8% |
EMRLD Borrower LP / Emerald Co.-Issuer, Inc. | 0.8% |
Other Material Fund Changes
In connection with the Securities and Exchange Commission’s new Tailored Shareholder Report rule, the Fund’s primary benchmark index changed to the ICE BofA U.S. Corporate Bond Index. The Fund will continue to show index performance for the ICE BofA BB-B U.S. High Yield Constrained Index, the Fund’s prior benchmark index.
For additional information about the Fund; including its prospectus, financial information, holdings and proxy information, scan the QR code or visit https://www.hwcm.com/mutual-funds/resources/literature/
The Fund is distributed by Quasar Distributors, LLC.
IMPORTANT INFORMATION
To reduce Fund expenses, only one copy of most shareholder documents may be mailed to shareholders with multiple accounts at the same address (Householding). If you would prefer that your Fund documents not be householded, please contact the Fund at 866-HW-FUNDS (866-493-8637), or contact your financial intermediary. Your instructions will typically be effective within 30 days of receipt by the Fund or your financial intermediary.
| Hotchkis & Wiley High Yield Fund | PAGE 2 | TSR_AR_44134R529 |
100585710499559739401163307103489311304221242331990679109527211971381240530106893910840421138706100670010934441099158124691210948131189787131058389.04.81.10.90.24.0
| | |
| HW Opportunities MP Fund | |
| HOMPX |
| Annual Shareholder Report | June 30, 2024 |
This annual shareholder report contains important information about the HW Opportunities MP Fund for the period of July 1, 2023, to June 30, 2024. You can find additional information about the Fund at www.hwcm.com/HOMPX. You can also request this information by contacting us at 866-HW-FUNDS (866-493-8637).
This report describes changes to the Fund that occurred during the reporting period.
WHAT WERE THE FUND COSTS FOR THE PAST YEAR? (based on a hypothetical $10,000 investment)
| | |
Fund Name | Costs of a $10,000 investment | Costs paid as a percentage of a $10,000 investment |
| HW Opportunities MP Fund | $0 | 0.00% |
HOW DID THE FUND PERFORM LAST YEAR? WHAT AFFECTED ITS PERFORMANCE?
The HW Opportunities MP Fund returned 20.57% at net asset value (NAV) for the 12 months ended June 30, 2024. The Fund underperformed the Russell 3000 Index, which returned 23.13%.
TOP DETRACTORS FROM PERFORMANCE
• Large cap stocks significantly outperformed their small cap counterparts. This performance disparity has widened the valuation gap between large cap and small cap stocks.
• Stock selection in information technology and communication services was the largest relative detractor. An underweight in the strong performing information technology sector also detracted from performance.
TOP CONTRIBUTORS TO PERFORMANCE
• Stock selection in industrials and financials helped relative performance.
HOW DID THE FUND PERFORM SINCE INCEPTION?*
The $10,000 chart reflects a hypothetical $10,000 investment in the class of shares noted and assumes the maximum sales charge. The chart uses total return NAV performance and assumes reinvestment of dividends and capital gains. Fund expenses, including 12b-1 fees, management fees and other expenses were deducted.
CUMULATIVE PERFORMANCE (Initial Investment of $10,000)
| HW Opportunities MP Fund | PAGE 1 | TSR_AR_44134R446 |
ANNUAL AVERAGE TOTAL RETURN (%)
| | |
| | 1 Year | Since Inception
(12/29/2020) |
Fund | 20.57 | 16.62 |
Russell 3000 Index | 23.13 | 11.48 |
Russell 3000 Value Index | 12.93 | 9.77 |
Visit www.hwcm.com/HOMPX for more recent performance information.
| * | The Fund’s past performance is not a good predictor of how the Fund will perform in the future. The graph and table do not reflect the deduction of taxes that a shareholder would pay on Fund distributions or redemption of Fund shares. |
KEY FUND STATISTICS (as of June 30, 2024)
| |
Net Assets | $64,347,023 |
Number of Holdings | 54 |
Net Advisory Fee | $0 |
Portfolio Turnover | 93% |
Visit www.hwcm.com/HOMPX for more recent performance information.
WHAT DID THE FUND INVEST IN? (as of June 30, 2024)
Sector Breakdown (% of net assets)
| |
Top Holdings | (%) |
Stagwell, Inc. | 6.9% |
Ecovyst, Inc. | 5.5% |
Siemens AG | 5.3% |
NOV, Inc. | 5.0% |
Randstad NV | 4.8% |
F5, Inc. | 4.6% |
Workday, Inc. | 4.1% |
U-Haul Holding Co. | 4.1% |
Olin Corp. | 4.0% |
Qantas Airways Ltd. | 3.9% |
Other Material Fund Changes
The Fund commenced operations following the completion of the reorganization of the HW Opportunities MP Fund, a series of Series Portfolio Trust (the “Predecessor Fund”), into the Fund, which occurred after close of business on December 15, 2023 (the “Reorganization”).
In connection with the Securities and Exchange Commission’s new Tailored Shareholder Report rule, the Fund’s primary benchmark index changed to the Russell 3000 Index. The Fund will continue to show index performance for the Russell 3000 Value Index, the Fund’s prior benchmark index.
CHANGES IN AND DISAGREEMENTS WITH ACCOUNTANTS
As a result of the Reorganization after the close of business on December 15, 2023, there was a change in accountants from Cohen & Company, Ltd., the Predecessor Fund’s independent registered public accounting firm, to Deloitte & Touche LLP, the independent registered public accounting firm that the Board selected for the Fund at a meeting held on August 15, 2023, upon the recommendation of the Trust’s Audit Committee.
| HW Opportunities MP Fund | PAGE 2 | TSR_AR_44134R446 |
For additional information about the Fund; including its prospectus, financial information, holdings and proxy information, scan the QR code or visit www.hwcm.com/HOMPX
The Fund is distributed by Quasar Distributors, LLC.
IMPORTANT INFORMATION
To reduce Fund expenses, only one copy of most shareholder documents may be mailed to shareholders with multiple accounts at the same address (Householding). If you would prefer that your Fund documents not be householded, please contact the Fund at 866-HW-FUNDS (866-493-8637), or contact your financial intermediary. Your instructions will typically be effective within 30 days of receipt by the Fund or your financial intermediary.
| HW Opportunities MP Fund | PAGE 3 | TSR_AR_44134R446 |
1290011109142111713411598999011884146321192211033122701385726.712.612.611.811.89.55.82.80.85.6
Item 2. Code of Ethics.
As of the end of the period covered by this report, the registrant has adopted a code of ethics that applies to the registrant’s principal executive officer and principal financial officer. The registrant has not made any substantive amendments to its code of ethics during the period covered by this report. The registrant has not granted any waivers from any provisions of the code of ethics during the period covered by this report. A copy of the code of ethics is available without charge, upon request, by calling toll-free at 1-800-796-5606.
Item 3. Audit Committee Financial Expert.
As of the end of the period covered by this report, the registrant’s Board of Trustees (the “Board”) has determined that Robert Fitzgerald, a member of the registrant’s Audit Committee, is an “audit committee financial expert” and “independent,” as such terms are defined in this Item.
Item 4. Principal Accountant Fees and Services.
The registrant has engaged its principal accountant to perform audit services, audit-related services, tax services and other services during the past two fiscal years. “Audit services” refer to professional services performed by the principal accountant for the audit of the registrant’s annual financial statements or services that are normally provided by the accountant in connection with statutory and regulatory filings or engagements for those fiscal years. “Audit-related services” refer to the assurance and related services by the principal accountant that are reasonably related to the performance of the audit or review of financial statements that are not reported under “Audit Fees”. “Tax services” refer to professional services rendered by the principal accountant for tax compliance, tax advice, and tax planning. The principal accountant did not provide any other services.
The following table details the aggregate fees billed or expected to be billed to the Funds for each of the last two fiscal years for audit fees, audit-related fees, tax fees and other fees by the principal accountant.
| | FYE 6/30/2024 | FYE 6/30/2023 |
| (a) Audit Fees | $250,800 | $224,200 |
| (b) Audit-Related Fees | $0 | $0 |
| (c) Tax Fees | $0 | $0 |
| (d) All Other Fees | $0 | $0 |
(e)(1) The registrant’s Audit Committee (the “Committee”) has adopted policies and procedures with regard to the pre-approval of services. The Committee shall pre approve any engagements of the independent auditors to provide any non-prohibited services to the registrant, including the fees and other compensation to be paid to the independent auditors. The Committee has delegated certain pre-approval responsibilities to its Char, who may grant the pre-approval of
services to the registrant for non-prohibited services for engagements of less than $5,000. The Committee shall also pre-approve any engagement of the independent auditors, including the fees and other compensation to be paid to the independent auditors, to provide any non-audit services to the registrant’s investment adviser, Hotchkis & Wiley Capital Management, LLC (the “Advisor”) (or any “control affiliate” of the Advisor providing ongoing services to the registrant), if the engagement relates directly to the operations and financial reporting of the registrant. The Chair of the Committee may grant the pre-approval for non-prohibited services to the Advisor for engagements of less than $5,000. All such delegated pre-approvals shall be presented to the Committee no later than the next Committee meeting.
(e)(2) The Committee approved in advance all audit services and non-audit services that Deloitte & Touche LLP (“D&T”) provided to the Funds, except for any non-audit services that were subject to the pre-approval exception under Rule 2-01 of Regulation S-X (the “pre-approval exception”). The percentage of fees billed by D&T applicable to non-audit services pursuant to the pre-approval exception were as follows:
| | FYE 6/30/2024 | FYE 6/30/2023 |
| Audit-Related Fees | 0% | 0% |
| Tax Fees | 0% | 0% |
| All Other Fees | 0% | 0% |
(f) Less than 50 percent of the hours expended on the principal accountant’s engagement to audit the registrant’s financial statements for the most recent fiscal year were attributed to work performed by persons other than the full time permanent employees of the principal accountant.
(g) During the last two fiscal years, D&T has served as the auditor to the Advisor and/or affiliates of the Advisor, and has rendered non-audit services to the Advisor and/or affiliates of the Advisor. The non-audit services that D&T provided to the Advisor and/or affiliates of the Advisor in 2024 and 2023 consisted of preparing state and federal tax returns. D&T charged $225,000 and $216,560 for such non-audit services to the Advisor and/or affiliates of the Advisor for 2024 and 2023, respectively. None of the non-audit services provided by D&T to the Advisor and/or affiliates of the Advisor directly related to the operations or financial reporting of the registrant.
(h) The Committee has considered whether the provision of audit and non-audit services that were rendered to the Advisor and any entity controlling, controlled by or under common control with the Advisor is compatible with maintaining the principal accountant’s independence and has concluded that the provision of such non-audit services by the accountant has not compromised the accountant’s independence.
Items 4(i) and 4(j) are not applicable to the registrant.
Item 5. Audit Committee of Listed Registrants.
Not applicable to this registrant.
Item 6. Investments.
| (a) | Schedule of Investments is included within the financial statements filed under Item 7 of this Form. |
Item 7. Financial Statements and Financial Highlights for Open-End Management Investment Companies.
Hotchkis & Wiley Funds
Annual Financial Statements
JUNE 30, 2024
DIVERSIFIED VALUE FUND
LARGE CAP VALUE FUND
MID-CAP VALUE FUND
SMALL CAP VALUE FUND
SMALL CAP DIVERSIFIED VALUE FUND
GLOBAL VALUE FUND
INTERNATIONAL VALUE FUND
INTERNATIONAL SMALL CAP DIVERSIFIED VALUE FUND
VALUE OPPORTUNITIES FUND
HIGH YIELD FUND
TABLE OF CONTENTS
Hotchkis & Wiley Diversified Value Fund
Schedule of Investments
as of June 30, 2024
| | | | | | | | | | |
COMMON STOCKS - 99.2%
|
Aerospace & Defense - 3.2%
|
Boeing Co.(a) | | | | | | 7,660 | | | $ 1,394,197 |
General Dynamics Corp. | | | | | | 2,100 | | | 609,294 |
RTX Corp. | | | | | | 15,300 | | | 1,535,967 |
| | | | | | | | | 3,539,458 |
Air Freight & Logistics - 2.2%
|
FedEx Corp. | | | | | | 8,020 | | | 2,404,717 |
Automobile Components - 3.3%
|
Adient PLC(a) | | | | | | 10,274 | | | 253,870 |
Aptiv PLC(a) | | | | | | 14,600 | | | 1,028,132 |
BorgWarner, Inc. | | | | | | 15,400 | | | 496,496 |
Magna International, Inc. | | | | | | 44,700 | | | 1,872,930 |
| | | | | | | | | 3,651,428 |
Automobiles - 3.0%
|
General Motors Co. | | | | | | 72,600 | | | 3,372,996 |
Banks - 13.9%
|
Bank of America Corp. | | | | | | 23,200 | | | 922,664 |
Citigroup, Inc. | | | | | | 67,774 | | | 4,300,938 |
Citizens Financial Group, Inc. | | | | | | 68,100 | | | 2,453,643 |
First Citizens BancShares, Inc./NC - Class A | | | | | | 352 | | | 592,631 |
Truist Financial Corp. | | | | | | 22,900 | | | 889,665 |
US Bancorp | | | | | | 58,500 | | | 2,322,450 |
Wells Fargo & Co. | | | | | | 67,034 | | | 3,981,149 |
| | | | | | | | | 15,463,140 |
Beverages - 0.7%
|
Anheuser-Busch InBev SA/NV - ADR | | | | | | 14,300 | | | 831,545 |
Capital Markets - 4.3%
|
Bank of New York Mellon Corp. | | | | | | 28,200 | | | 1,688,898 |
Goldman Sachs Group, Inc. | | | | | | 2,990 | | | 1,352,437 |
State Street Corp. | | | | | | 23,900 | | | 1,768,600 |
| | | | | | | | | 4,809,935 |
Chemicals - 1.3%
|
Olin Corp. | | | | | | 31,400 | | | 1,480,510 |
Communications Equipment - 6.3%
|
F5, Inc.(a) | | | | | | 18,500 | | | 3,186,255 |
Telefonaktiebolaget LM Ericsson - ADR(b) | | | | | | 625,800 | | | 3,861,186 |
| | | | | | | | | 7,047,441 |
Construction & Engineering - 0.4%
|
Fluor Corp.(a) | | | | | | 10,800 | | | 470,340 |
Consumer Finance - 1.2%
|
Capital One Financial Corp. | | | | | | 4,600 | | | 636,870 |
Discover Financial Services | | | | | | 5,500 | | | 719,455 |
| | | | | | | | | 1,356,325 |
Electric Utilities - 1.9%
|
PPL Corp. | | | | | | 75,900 | | | 2,098,635 |
Electronic Equipment, Instruments &
Components - 2.1%
|
Corning, Inc. | | | | | | 29,300 | | | 1,138,305 |
TE Connectivity Ltd. | | | | | | 7,900 | | | 1,188,397 |
| | | | | | | | | 2,326,702 |
| | | | | | | | | | |
| | | | | | | | | | |
Energy Equipment & Services - 3.9%
|
Baker Hughes Co. | | | | | | 34,500 | | | $1,213,365 |
Halliburton Co. | | | | | | 14,700 | | | 496,566 |
NOV, Inc. | | | | | | 108,400 | | | 2,060,684 |
Schlumberger NV | | | | | | 12,900 | | | 608,622 |
| | | | | | | | | 4,379,237 |
Entertainment - 0.5%
|
Warner Bros Discovery, Inc.(a) | | | | | | 78,600 | | | 584,784 |
Financial Services - 2.8%
|
Corebridge Financial, Inc. | | | | | | 40,700 | | | 1,185,184 |
Fidelity National Information Services, Inc. | | | | | | 25,500 | | | 1,921,680 |
| | | | | | | | | 3,106,864 |
Food Products - 0.8%
|
Conagra Brands, Inc. | | | | | | 29,600 | | | 841,232 |
Health Care Equipment &
Supplies - 4.7%
|
GE HealthCare Technologies, Inc. | | | | | | 27,012 | | | 2,104,775 |
Medtronic PLC | | | | | | 31,882 | | | 2,509,432 |
Zimmer Biomet Holdings, Inc. | | | | | | 5,340 | | | 579,550 |
| | | | | | | | | 5,193,757 |
Health Care Providers &
Services - 9.4%
|
Centene Corp.(a) | | | | | | 18,700 | | | 1,239,810 |
Cigna Group | | | | | | 3,300 | | | 1,090,881 |
CVS Health Corp. | | | | | | 40,400 | | | 2,386,024 |
Elevance Health, Inc. | | | | | | 5,800 | | | 3,142,788 |
HCA Healthcare, Inc. | | | | | | 3,260 | | | 1,047,373 |
Humana, Inc. | | | | | | 2,800 | | | 1,046,220 |
Labcorp Holdings, Inc. | | | | | | 2,700 | | | 549,477 |
| | | | | | | | | 10,502,573 |
Hotels, Restaurants & Leisure - 0.6%
|
Booking Holdings, Inc. | | | | | | 170 | | | 673,455 |
Insurance - 4.3%
|
American International Group, Inc. | | | | | | 34,300 | | | 2,546,432 |
Hartford Financial Services Group, Inc. | | | | | | 22,500 | | | 2,262,150 |
| | | | | | | | | 4,808,582 |
Interactive Media & Services - 2.3%
|
Alphabet, Inc. - Class A | | | | | | 14,200 | | | 2,586,530 |
IT Services - 0.5%
|
Cognizant Technology Solutions Corp. - Class A | | | | | | 7,400 | | | 503,200 |
Machinery - 3.8%
|
CNH Industrial NV | | | | | | 106,000 | | | 1,073,780 |
Cummins, Inc. | | | | | | 5,740 | | | 1,589,578 |
PACCAR, Inc. | | | | | | 9,300 | | | 957,342 |
Timken Co. | | | | | | 7,000 | | | 560,910 |
| | | | | | | | | 4,181,610 |
Media - 3.8%
|
Comcast Corp. - Class A | | | | | | 65,800 | | | 2,576,728 |
Omnicom Group, Inc. | | | | | | 6,400 | | | 574,080 |
Paramount Global - Class B | | | | | | 29,000 | | | 301,310 |
WPP PLC - ADR(b) | | | | | | 17,300 | | | 791,994 |
| | | | | | | | | 4,244,112 |
Multi-Utilities - 1.0%
|
Dominion Energy, Inc. | | | | | | 21,700 | | | 1,063,300 |
| | | | | | | | | | |
The accompanying notes are an integral part of these financial statements.
TABLE OF CONTENTS
Hotchkis & Wiley Diversified Value Fund
Schedule of Investments
as of June 30, 2024 (Continued)
| | | | | | | | | | |
COMMON STOCKS - (Continued)
|
Oil Gas & Consumable Fuels - 8.7%
|
APA Corp. | | | | | | 119,700 | | | $3,523,968 |
Cenovus Energy, Inc. | | | | | | 38,100 | | | 749,046 |
Marathon Oil Corp. | | | | | | 38,350 | | | 1,099,495 |
Murphy Oil Corp. | | | | | | 12,000 | | | 494,880 |
Ovintiv, Inc. | | | | | | 33,600 | | | 1,574,832 |
Shell PLC - ADR | | | | | | 30,762 | | | 2,220,401 |
| | | | | | | | | 9,662,622 |
Personal Care Products - 2.2%
|
Unilever PLC - ADR | | | | | | 43,800 | | | 2,408,562 |
Pharmaceuticals - 1.0%
|
GSK PLC - ADR | | | | | | 14,340 | | | 552,090 |
Sanofi SA - ADR | | | | | | 11,200 | | | 543,424 |
| | | | | | | | | 1,095,514 |
Semiconductors & Semiconductor
Equipment - 0.6%
|
Micron Technology, Inc. | | | | | | 5,500 | | | 723,415 |
Software - 3.8%
|
Oracle Corp. | | | | | | 4,650 | | | 656,580 |
Workday, Inc. - Class A(a) | | | | | | 15,900 | | | 3,554,604 |
| | | | | | | | | 4,211,184 |
Wireless Telecommunication
Services - 0.7%
|
Vodafone Group PLC - ADR | | | | | | 84,963 | | | 753,622 |
TOTAL COMMON STOCKS
(Cost $94,269,059) | | | | | | | | | 110,377,327 |
SHORT-TERM INVESTMENTS - 0.8%
|
Money Market Funds - 0.1%
|
Invesco Government & Agency Portfolio - Class Institutional, 5.23%(c) | | | | | | 97,007 | | | 97,007 |
|
| | | | | | Par | | | |
Time Deposits - 0.7%
|
Citigroup, Inc., 4.68%, 07/01/2024(d) | | | | | | 789,433 | | | 789,433 |
Citigroup, Inc., 2.59%, 07/01/2024(d) | | | EUR | | | 3 | | | 3 |
| | | | | | | | | 789,436 |
TOTAL SHORT-TERM
INVESTMENTS
| |
(Cost $886,443) | | | | | | | | | 886,443 |
TOTAL INVESTMENTS - 100.0%
| |
(Cost $95,155,502) | | | | | | | | | $111,263,770 |
Liabilities in Excess of Other
Assets - 0.0%(e) | | | | | | | | | (7,582) |
TOTAL NET
ASSETS - 100.0% | | | | | | | | | $111,256,188 |
| | | | | | | | | | |
Percentages are stated as a percent of net assets.
Par amount is in USD unless otherwise indicated.
The Global Industry Classification Standard (GICS®) was developed by MSCI, an independent provider of global indices and benchmark-related products and services, and Standard & Poor’s (S&P), an independent international financial data and investment services company. The GICS methodology has been widely accepted as an industry analysis framework for investment research, portfolio management and asset allocation. The GICS structure consists of 11 sectors, 25 industry groups, 74 industries and 163 sub-industries. Each stock that is classified will have a coding at all four of these levels.
ADR - American Depositary Receipt
EUR - Euro
NV - Naamloze Vennootschap
PLC - Public Limited Company
SA - Sociedad Anónima
SA/NV - Societe Anonime/Naamloze Vennootschap
(a)
| Non-income producing security. |
(b)
| All or a portion of this security is on loan as of June 30, 2024. The total market value of these securities was $95,077 which represented 0.1% of net assets. |
(c)
| The rate shown represents the 7-day effective yield as of June 30, 2024. |
(d)
| Invested through a cash management account administered by Brown Brothers Harriman & Co. |
(e)
| Represents less than 0.05% of net assets. |
The accompanying notes are an integral part of these financial statements.
TABLE OF CONTENTS
Hotchkis & Wiley Large Cap Value Fund
Schedule of Investments
as of June 30, 2024
| | | | | | | | | | |
COMMON STOCKS - 97.9%
|
Aerospace & Defense - 1.3%
|
General Dynamics Corp. | | | | | | 6,300 | | | $ 1,827,882 |
Huntington Ingalls Industries, Inc. | | | | | | 11,200 | | | 2,758,896 |
| | | | | | | | | 4,586,778 |
Air Freight & Logistics - 2.2%
|
FedEx Corp. | | | | | | 25,600 | | | 7,675,904 |
Automobile Components - 1.9%
|
Magna International, Inc. | | | | | | 163,700 | | | 6,859,030 |
Automobiles - 3.4%
| | | | | | | | | |
General Motors Co. | | | | | | 262,200 | | | 12,181,812 |
Banks - 13.8%
|
Bank of America Corp. | | | | | | 74,900 | | | 2,978,773 |
Citigroup, Inc. | | | | | | 226,688 | | | 14,385,620 |
Citizens Financial Group, Inc. | | | | | | 213,800 | | | 7,703,214 |
Truist Financial Corp. | | | | | | 73,400 | | | 2,851,590 |
US Bancorp | | | | | | 201,300 | | | 7,991,610 |
Wells Fargo & Co. | | | | | | 221,863 | | | 13,176,444 |
| | | | | | | | | 49,087,251 |
Capital Markets - 5.1%
|
Bank of New York Mellon Corp. | | | | | | 105,200 | | | 6,300,428 |
Goldman Sachs Group, Inc. | | | | | | 11,600 | | | 5,246,912 |
State Street Corp. | | | | | | 90,700 | | | 6,711,800 |
| | | | | | | | | 18,259,140 |
Chemicals - 1.6%
|
Olin Corp. | | | | | | 119,000 | | | 5,610,850 |
Communications Equipment - 7.3%
|
F5, Inc.(a) | | | | | | 74,700 | | | 12,865,581 |
Telefonaktiebolaget LM Ericsson - ADR(b) | | | | | | 2,096,400 | | | 12,934,788 |
| | | | | | | | | 25,800,369 |
Consumer Finance - 1.2%
|
Capital One Financial Corp. | | | | | | 13,100 | | | 1,813,695 |
Discover Financial Services | | | | | | 19,300 | | | 2,524,633 |
| | | | | | | | | 4,338,328 |
Electric Utilities - 2.0%
|
PPL Corp. | | | | | | 256,800 | | | 7,100,520 |
Electronic Equipment, Instruments &
Components - 2.4%
|
Corning, Inc. | | | | | | 101,200 | | | 3,931,620 |
TE Connectivity Ltd. | | | | | | 30,100 | | | 4,527,943 |
| | | | | | | | | 8,459,563 |
Energy Equipment & Services - 3.8%
|
Baker Hughes Co. | | | | | | 110,300 | | | 3,879,251 |
Halliburton Co. | | | | | | 57,900 | | | 1,955,862 |
NOV, Inc. | | | | | | 408,700 | | | 7,769,387 |
| | | | | | | | | 13,604,500 |
Entertainment - 0.8%
| |
Warner Bros Discovery, Inc.(a) | | | | | | 373,600 | | | 2,779,584 |
Financial Services - 4.5%
|
Corebridge Financial, Inc. | | | | | | 133,500 | | | 3,887,520 |
Euronet Worldwide, Inc.(a) | | | | | | 43,200 | | | 4,471,200 |
Fidelity National Information Services, Inc. | | | | | | 102,500 | | | 7,724,400 |
| | | | | | | | | 16,083,120 |
| | | | | | | | | | |
| | | | | | | | | | |
Food Products - 1.4%
|
Conagra Brands, Inc. | | | | | | 90,200 | | | $ 2,563,484 |
General Mills, Inc. | | | | | | 40,200 | | | 2,543,052 |
| | | | | | | | | 5,106,536 |
Health Care Equipment &
Supplies - 5.0%
|
GE HealthCare Technologies, Inc. | | | | | | 85,662 | | | 6,674,783 |
Medtronic PLC | | | | | | 109,600 | | | 8,626,616 |
Zimmer Biomet Holdings, Inc. | | | | | | 24,200 | | | 2,626,426 |
| | | | | | | | | 17,927,825 |
Health Care Providers & Services - 9.0%
|
Cigna Group | | | | | | 12,300 | | | 4,066,011 |
CVS Health Corp. | | | | | | 140,530 | | | 8,299,702 |
Elevance Health, Inc. | | | | | | 22,400 | | | 12,137,664 |
HCA Healthcare, Inc. | | | | | | 13,200 | | | 4,240,896 |
Humana, Inc. | | | | | | 8,500 | | | 3,176,025 |
| | | | | | | | | 31,920,298 |
Insurance - 5.1%
|
American International Group, Inc. | | | | | | 119,500 | | | 8,871,680 |
Hartford Financial Services Group, Inc. | | | | | | 92,600 | | | 9,310,004 |
| | | | | | | | | 18,181,684 |
Interactive Media & Services - 2.3%
|
Alphabet, Inc. - Class A | | | | | | 44,480 | | | 8,102,032 |
IT Services - 0.5%
|
Amdocs Ltd. | | | | | | 21,500 | | | 1,696,780 |
Machinery - 4.4%
|
CNH Industrial NV | | | | | | 339,200 | | | 3,436,096 |
Cummins, Inc. | | | | | | 24,100 | | | 6,674,013 |
PACCAR, Inc. | | | | | | 29,650 | | | 3,052,171 |
Stanley Black & Decker, Inc. | | | | | | 33,200 | | | 2,652,348 |
| | | | | | | | | 15,814,628 |
Media - 3.6%
|
Comcast Corp. - Class A | | | | | | 231,600 | | | 9,069,456 |
Paramount Global - Class B | | | | | | 105,200 | | | 1,093,028 |
WPP PLC - ADR(b) | | | | | | 55,000 | | | 2,517,900 |
| | | | | | | | | 12,680,384 |
Multi-Utilities - 1.5%
|
Dominion Energy, Inc. | | | | | | 106,300 | | | 5,208,700 |
Oil Gas & Consumable Fuels - 8.8%
|
APA Corp. | | | | | | 413,300 | | | 12,167,552 |
Marathon Oil Corp. | | | | | | 153,400 | | | 4,397,978 |
Murphy Oil Corp. | | | | | | 37,970 | | | 1,565,883 |
Ovintiv, Inc. | | | | | | 107,480 | | | 5,037,588 |
Shell PLC - ADR | | | | | | 110,872 | | | 8,002,741 |
| | | | | | | | | 31,171,742 |
Personal Care Products - 2.2%
|
Unilever PLC - ADR | | | | | | 141,900 | | | 7,803,081 |
Pharmaceuticals - 1.0%
|
GSK PLC - ADR | | | | | | 44,340 | | | 1,707,090 |
Sanofi SA - ADR | | | | | | 39,000 | | | 1,892,280 |
| | | | | | | | | 3,599,370 |
Software - 0.9%
|
Oracle Corp. | | | | | | 22,660 | | | 3,199,592 |
| | | | | | | | | | |
The accompanying notes are an integral part of these financial statements.
TABLE OF CONTENTS
Hotchkis & Wiley Large Cap Value Fund
Schedule of Investments
as of June 30, 2024 (Continued)
| | | | | | | | | | |
COMMON STOCKS - (Continued)
|
Wireless Telecommunication
Services - 0.9%
|
Vodafone Group PLC - ADR | | | | | | 347,444 | | | $3,081,828 |
TOTAL COMMON STOCKS
(Cost $288,594,305) | | | | | | | | | 347,921,229 |
SHORT-TERM INVESTMENTS - 2.7%
|
Money Market Funds - 0.6%
|
Invesco Government & Agency Portfolio - Class Institutional, 5.23%(c) | | | | | | 2,032,063 | | | 2,032,063 |
|
| | | | | | Par | | | |
Time Deposits - 2.1%
|
Citigroup, Inc., 2.59%, 07/01/2024(d) | | | EUR | | | 17 | | | 18 |
JPMorgan Chase & Company,
4.68%, 07/01/2024(d) | | | | | | 7,498,174 | | | 7,498,174 |
| | | | | | | | | 7,498,192 |
TOTAL SHORT-TERM
INVESTMENTS
(Cost $9,530,254) | | | | | | | | | 9,530,255 |
TOTAL INVESTMENTS - 100.6%
| | | |
(Cost $298,124,559) | | | | | | | | | $357,451,484 |
Liabilities in Excess of Other
Assets - (0.6)% | | | | | | | | | (1,994,954) |
TOTAL NET
ASSETS - 100.0% | | | | | | | | | $355,456,530 |
| | | | | | | | | | |
Percentages are stated as a percent of net assets.
Par amount is in USD unless otherwise indicated.
The Global Industry Classification Standard (GICS®) was developed by MSCI, an independent provider of global indices and benchmark-related products and services, and Standard & Poor’s (S&P), an independent international financial data and investment services company. The GICS methodology has been widely accepted as an industry analysis framework for investment research, portfolio management and asset allocation. The GICS structure consists of 11 sectors, 25 industry groups, 74 industries and 163 sub-industries. Each stock that is classified will have a coding at all four of these levels.
ADR - American Depositary Receipt
EUR - Euro
NV - Naamloze Vennootschap
PLC - Public Limited Company
SA - Sociedad Anónima
(a)
| Non-income producing security. |
(b)
| All or a portion of this security is on loan as of June 30, 2024. The total market value of these securities was $1,990,209 which represented 0.6% of net assets. |
(c)
| The rate shown represents the 7-day effective yield as of June 30, 2024. |
(d)
| Invested through a cash management account administered by Brown Brothers Harriman & Co. |
The accompanying notes are an integral part of these financial statements.
TABLE OF CONTENTS
Hotchkis & Wiley Mid-Cap Value Fund
Schedule of Investments
as of June 30, 2024
| | | | | | | | | | |
COMMON STOCKS - 97.7%
|
Air Freight & Logistics - 0.6%
|
FedEx Corp. | | | | | | 8,500 | | | $ 2,548,640 |
Automobile Components - 7.2%
|
Adient PLC(a) | | | | | | 472,500 | | | 11,675,475 |
BorgWarner, Inc. | | | | | | 146,500 | | | 4,723,160 |
Goodyear Tire & Rubber Co.(a) | | | | | | 190,100 | | | 2,157,635 |
Lear Corp. | | | | | | 34,400 | | | 3,928,824 |
Magna International, Inc. | | | | | | 204,100 | | | 8,551,790 |
| | | | | | | | | 31,036,884 |
Automobiles - 0.5%
|
Harley-Davidson, Inc. | | | | | | 59,700 | | | 2,002,338 |
Banks - 13.3%
|
Citizens Financial Group, Inc. | | | | | | 507,600 | | | 18,288,828 |
Comerica, Inc. | | | | | | 79,400 | | | 4,052,576 |
First Citizens BancShares, Inc./NC - Class A | | | | | | 2,587 | | | 4,355,499 |
First Horizon Corp. | | | | | | 290,300 | | | 4,578,031 |
KeyCorp | | | | | | 254,100 | | | 3,610,761 |
Popular, Inc. | | | | | | 214,300 | | | 18,950,549 |
Western Alliance Bancorp | | | | | | 57,100 | | | 3,587,022 |
| | | | | | | | | 57,423,266 |
Capital Markets - 3.7%
|
Lazard, Inc. | | | | | | 42,000 | | | 1,603,560 |
Northern Trust Corp. | | | | | | 33,000 | | | 2,771,340 |
State Street Corp. | | | | | | 157,700 | | | 11,669,800 |
| | | | | | | | | 16,044,700 |
Chemicals - 3.2%
|
Huntsman Corp. | | | | | | 182,800 | | | 4,162,356 |
Olin Corp. | | | | | | 204,400 | | | 9,637,460 |
| | | | | | | | | 13,799,816 |
Commercial Services & Supplies - 1.7%
| | | |
Brink’s Co. | | | | | | 73,800 | | | 7,557,120 |
Communications Equipment - 7.7%
|
F5, Inc.(a) | | | | | | 82,800 | | | 14,260,644 |
Telefonaktiebolaget LM Ericsson - ADR(b) | | | | | | 3,060,100 | | | 18,880,817 |
| | | | | | | | | 33,141,461 |
Construction & Engineering - 3.6%
|
Fluor Corp.(a) | | | | | | 360,200 | | | 15,686,710 |
Consumer Finance - 2.0%
|
Discover Financial Services | | | | | | 34,200 | | | 4,473,702 |
SLM Corp. | | | | | | 206,400 | | | 4,291,056 |
| | | | | | | | | 8,764,758 |
Electric Utilities - 1.6%
|
NRG Energy, Inc. | | | | | | 27,100 | | | 2,110,006 |
PPL Corp. | | | | | | 171,200 | | | 4,733,680 |
| | | | | | | | | 6,843,686 |
Electronic Equipment, Instruments &
Components - 1.9%
|
Arrow Electronics, Inc.(a) | | | | | | 68,800 | | | 8,308,288 |
Energy Equipment & Services - 2.7%
|
Expro Group Holdings NV(a) | | | | | | 128,483 | | | 2,944,830 |
Halliburton Co. | | | | | | 85,100 | | | 2,874,678 |
| | | | | | | | | | |
| | | | | | | | | | |
NOV, Inc. | | | | | | 302,100 | | | $5,742,921 |
| | | | | | | | | 11,562,429 |
Entertainment - 1.0%
|
Warner Bros Discovery, Inc.(a) | | | | | | 604,600 | | | 4,498,224 |
Financial Services - 1.9%
|
Euronet Worldwide, Inc.(a) | | | | | | 16,100 | | | 1,666,350 |
Fidelity National Information Services, Inc. | | | | | | 84,900 | | | 6,398,064 |
| | | | | | | | | 8,064,414 |
Food Products - 0.8%
|
Conagra Brands, Inc. | | | | | | 126,000 | | | 3,580,920 |
Ground Transportation - 1.0%
|
U-Haul Holding Co. | | | | | | 69,600 | | | 4,177,392 |
Health Care Providers & Services - 4.8%
|
Centene Corp.(a) | | | | | | 93,200 | | | 6,179,160 |
Humana, Inc. | | | | | | 9,500 | | | 3,549,675 |
Labcorp Holdings, Inc. | | | | | | 10,900 | | | 2,218,259 |
Universal Health Services, Inc. -
Class B | | | | | | 48,500 | | | 8,969,105 |
| | | | | | | | | 20,916,199 |
Hotels, Restaurants & Leisure - 0.8%
|
Marriott Vacations Worldwide Corp. | | | | | | 37,500 | | | 3,274,500 |
Household Durables - 1.2%
|
Whirlpool Corp. | | | | | | 51,800 | | | 5,293,960 |
Insurance - 7.0%
|
American International Group, Inc. | | | | | | 88,400 | | | 6,562,816 |
CNO Financial Group, Inc. | | | | | | 373,000 | | | 10,339,560 |
Enstar Group Ltd.(a) | | | | | | 27,400 | | | 8,376,180 |
Hartford Financial Services Group, Inc. | | | | | | 47,500 | | | 4,775,650 |
| | | | | | | | | 30,054,206 |
Machinery - 3.2%
|
Allison Transmission Holdings, Inc. | | | | | | 57,300 | | | 4,349,070 |
CNH Industrial NV | | | | | | 558,700 | | | 5,659,631 |
Stanley Black & Decker, Inc. | | | | | | 49,600 | | | 3,962,544 |
| | | | | | | | | 13,971,245 |
Media - 1.1%
|
Omnicom Group, Inc. | | | | | | 27,100 | | | 2,430,870 |
Paramount Global - Class B | | | | | | 236,800 | | | 2,460,352 |
| | | | | | | | | 4,891,222 |
Multi-Utilities - 1.0%
|
Dominion Energy, Inc. | | | | | | 87,700 | | | 4,297,300 |
Oil Gas & Consumable Fuels - 16.1%
|
APA Corp. | | | | | | 710,166 | | | 20,907,287 |
Baytex Energy Corp.(b) | | | | | | 2,449,500 | | | 8,524,260 |
California Resources Corp. | | | | | | 101,900 | | | 5,423,118 |
Cenovus Energy, Inc. | | | | | | 166,400 | | | 3,271,424 |
Crescent Energy Co. - Class A | | | | | | 18,600 | | | 220,410 |
Kosmos Energy Ltd.(a) | | | | | | 3,793,120 | | | 21,013,885 |
Ovintiv, Inc. | | | | | | 96,500 | | | 4,522,955 |
SilverBow Resources, Inc.(a) | | | | | | 147,900 | | | 5,595,057 |
| | | | | | | | | 69,478,396 |
Personal Care Products - 0.8%
|
Herbalife Ltd.(a) | | | | | | 315,200 | | | 3,274,928 |
| | | | | | | | | | |
The accompanying notes are an integral part of these financial statements.
TABLE OF CONTENTS
Hotchkis & Wiley Mid-Cap Value Fund
Schedule of Investments
as of June 30, 2024 (Continued)
| | | | | | | | | | |
COMMON STOCKS - (Continued)
|
Pharmaceuticals - 1.0%
|
Jazz Pharmaceuticals PLC(a) | | | | | | 41,400 | | | $4,418,622 |
Professional Services - 1.4%
|
ManpowerGroup, Inc. | | | | | | 89,700 | | | 6,261,060 |
Real Estate Management &
Development - 1.0%
|
Jones Lang LaSalle, Inc.(a) | | | | | | 20,900 | | | 4,290,352 |
Software - 0.8%
|
Workday, Inc. - Class A(a) | | | | | | 15,000 | | | 3,353,400 |
Specialty Retail - 1.8%
|
Lithia Motors, Inc. | | | | | | 8,700 | | | 2,196,315 |
ODP Corp.(a) | | | | | | 145,645 | | | 5,719,479 |
| | | | | | | | | 7,915,794 |
Textiles, Apparel & Luxury Goods - 0.5%
|
Capri Holdings Ltd.(a) | | | | | | 67,600 | | | 2,236,208 |
Trading Companies & Distributors - 0.8%
|
WESCO International, Inc. | | | | | | 20,900 | | | 3,313,068 |
TOTAL COMMON STOCKS
(Cost $364,987,917) | | | | | | | | | 422,281,506 |
REAL ESTATE INVESTMENT TRUSTS - 0.5%
|
Hotel & Resort Real Estate Investment
Trusts - 0.1%
|
Pebblebrook Hotel Trust | | | | | | 43,100 | | | 592,625 |
Office Real Estate Investment Trusts - 0.4%
|
Vornado Realty Trust | | | | | | 58,000 | | | 1,524,820 |
TOTAL REAL ESTATE INVESTMENT TRUSTS
| |
(Cost $3,154,657) | | | | | | | | | 2,117,445 |
SHORT-TERM INVESTMENTS - 2.8%
|
Money Market Funds - 1.0%
|
Invesco Government & Agency Portfolio - Class Institutional, 5.23%(c) | | | | | | 4,570,645 | | | 4,570,645 |
| | | | | | Par | | | |
Time Deposits - 1.8%
| | | | | | | | | |
Citigroup, Inc., 4.68%, 07/01/2024(d) | | | | | | 7,629,231 | | | 7,629,231 |
| | | | | | | | | 7,629,231 |
TOTAL SHORT-TERM
INVESTMENTS
| |
(Cost $12,199,876) | | | | | | | | | 12,199,876 |
TOTAL INVESTMENTS - 101.0%
| |
(Cost $380,342,450) | | | | | | | | | $436,598,827 |
Liabilities in Excess of Other
Assets - (1.0)% | | | | | | | | | (4,427,489) |
TOTAL NET
ASSETS - 100.0% | | | | | | | | | $432,171,338 |
| | | | | | | | | | |
Percentages are stated as a percent of net assets.
Par amount is in USD unless otherwise indicated.
The Global Industry Classification Standard (GICS®) was developed by MSCI, an independent provider of global indices and benchmark-related products and services, and Standard & Poor’s (S&P), an independent international financial data and investment services company. The GICS methodology has been widely accepted as an industry analysis framework for investment research, portfolio management and asset allocation. The GICS structure consists of 11 sectors, 25 industry groups, 74 industries and 163 sub-industries. Each stock that is classified will have a coding at all four of these levels.
ADR - American Depositary Receipt
NV - Naamloze Vennootschap
PLC - Public Limited Company
(a)
| Non-income producing security. |
(b)
| All or a portion of this security is on loan as of June 30, 2024. The total market value of these securities was $4,415,573 which represented 1.0% of net assets. |
(c)
| The rate shown represents the 7-day effective yield as of June 30, 2024. |
(d)
| Invested through a cash management account administered by Brown Brothers Harriman & Co. |
The accompanying notes are an integral part of these financial statements.
TABLE OF CONTENTS
Hotchkis & Wiley Small Cap Value Fund
Schedule of Investments
as of June 30, 2024
| | | | | | | |
COMMON STOCKS - 96.6%
|
Automobile Components - 2.5%
|
Adient PLC(a) | | | 796,600 | | | $19,683,986 |
Banks - 9.5%
| | | | | | |
Bank of NT Butterfield & Son Ltd. | | | 372,800 | | | 13,092,736 |
First Hawaiian, Inc. | | | 1,067,200 | | | 22,155,072 |
First Horizon Corp. | | | 444,400 | | | 7,008,188 |
Popular, Inc. | | | 314,300 | | | 27,793,549 |
Synovus Financial Corp. | | | 62,400 | | | 2,507,856 |
WaFd, Inc. | | | 39,498 | | | 1,128,853 |
| | | | | | 73,686,254 |
Capital Markets - 3.6%
| | | | | | |
Evercore, Inc. - Class A | | | 7,700 | | | 1,604,911 |
Perella Weinberg Partners | | | 283,700 | | | 4,610,125 |
Stifel Financial Corp. | | | 259,600 | | | 21,845,340 |
| | | | | | 28,060,376 |
Chemicals - 5.8%
| | | | | | |
Ecovyst, Inc.(a) | | | 2,959,500 | | | 26,546,715 |
Olin Corp. | | | 391,100 | | | 18,440,365 |
| | | | | | 44,987,080 |
Commercial Services & Supplies - 2.1%
|
Brink’s Co. | | | 120,100 | | | 12,298,240 |
MillerKnoll, Inc. | | | 80,800 | | | 2,140,392 |
Quad/Graphics, Inc. | | | 402,700 | | | 2,194,715 |
| | | | | | 16,633,347 |
Communications Equipment - 8.4%
|
F5, Inc.(a) | | | 285,100 | | | 49,102,773 |
Telefonaktiebolaget LM Ericsson - ADR(b) | | | 2,568,600 | | | 15,848,262 |
| | | | | | 64,951,035 |
Construction & Engineering - 3.2%
|
Fluor Corp.(a) | | | 565,000 | | | 24,605,750 |
Consumer Finance - 2.5%
| | | | | | |
SLM Corp. | | | 948,100 | | | 19,710,999 |
Electric Utilities - 0.8%
| | | | | | |
OGE Energy Corp. | | | 166,100 | | | 5,929,770 |
Electronic Equipment, Instruments &
Components - 7.1%
|
Arrow Electronics, Inc.(a) | | | 281,100 | | | 33,945,636 |
Belden, Inc. | | | 146,100 | | | 13,704,180 |
Plexus Corp.(a) | | | 71,600 | | | 7,387,688 |
| | | | | | 55,037,504 |
Energy Equipment & Services - 5.1%
|
Expro Group Holdings NV(a) | | | 209,382 | | | 4,799,035 |
NOV, Inc. | | | 1,819,300 | | | 34,584,893 |
| | | | | | 39,383,928 |
Financial Services - 1.3%
| | | | | | |
Euronet Worldwide, Inc.(a) | | | 38,600 | | | 3,995,100 |
WEX, Inc.(a) | | | 35,600 | | | 6,306,184 |
| | | | | | 10,301,284 |
Ground Transportation - 2.4%
|
U-Haul Holding Co. | | | 305,900 | | | 18,360,118 |
Hotels, Restaurants & Leisure - 3.4%
|
International Game Technology PLC | | | 234,600 | | | 4,799,916 |
Marriott Vacations Worldwide Corp. | | | 245,900 | | | 21,471,988 |
| | | | | | 26,271,904 |
| | | | | | | |
| | | | | | | |
Insurance - 5.9%
| | | | | | |
CNO Financial Group, Inc. | | | 121,900 | | | $3,379,068 |
Enstar Group Ltd.(a) | | | 83,919 | | | 25,654,038 |
Global Indemnity Group LLC - Class A | | | 316,036 | | | 9,824,169 |
Horace Mann Educators Corp. | | | 205,600 | | | 6,706,672 |
| | | | | | 45,563,947 |
Machinery - 5.1%
| | | | | | |
Allison Transmission Holdings, Inc. | | | 89,700 | | | 6,808,230 |
Atmus Filtration Technologies, Inc.(a) | | | 267,600 | | | 7,701,528 |
Greenbrier Cos., Inc. | | | 200,500 | | | 9,934,775 |
Miller Industries, Inc./TN | | | 95,800 | | | 5,270,916 |
Timken Co. | | | 125,400 | | | 10,048,302 |
| | | | | | 39,763,751 |
Media - 6.0%
| | | | | | |
National CineMedia, Inc.(a) | | | 2,046,800 | | | 8,985,452 |
Stagwell, Inc.(a) | | | 5,524,400 | | | 37,676,408 |
| | | | | | 46,661,860 |
Multi-Utilities - 1.4%
| | | | | | |
Avista Corp. | | | 322,500 | | | 11,161,725 |
Oil Gas & Consumable Fuels - 7.5%
|
APA Corp. | | | 136,408 | | | 4,015,851 |
Baytex Energy Corp. | | | 1,715,186 | | | 5,968,847 |
Berry Corp. | | | 1,814,800 | | | 11,723,608 |
Crescent Energy Co. - Class A | | | 153,200 | | | 1,815,420 |
Kinetik Holdings, Inc. | | | 31,390 | | | 1,300,802 |
Kosmos Energy Ltd.(a) | | | 3,598,300 | | | 19,934,582 |
Murphy Oil Corp. | | | 104,300 | | | 4,301,332 |
NextDecade Corp.(a) | | | 834,900 | | | 6,629,106 |
Range Resources Corp. | | | 83,500 | | | 2,799,755 |
| | | | | | 58,489,303 |
Personal Care Products - 0.2%
|
Herbalife Ltd.(a) | | | 142,900 | | | 1,484,731 |
Professional Services - 3.1%
| | | | | | |
ASGN, Inc.(a) | | | 61,800 | | | 5,448,907 |
Hudson Global, Inc.(a)(c) | | | 147,460 | | | 2,449,310 |
Korn Ferry | | | 39,600 | | | 2,658,744 |
ManpowerGroup, Inc. | | | 199,800 | | | 13,946,040 |
| | | | | | 24,503,001 |
Real Estate Management &
Development - 3.2%
|
Jones Lang LaSalle, Inc.(a) | | | 109,600 | | | 22,498,688 |
RMR Group, Inc. - Class A | | | 117,400 | | | 2,653,240 |
| | | | | | 25,151,928 |
Specialty Retail - 4.3%
| | | | | | |
Lithia Motors, Inc. | | | 22,700 | | | 5,730,615 |
ODP Corp.(a) | | | 357,380 | | | 14,034,313 |
Sonic Automotive, Inc. - Class A | | | 246,600 | | | 13,432,302 |
| | | | | | 33,197,230 |
Trading Companies &
Distributors - 2.2%
|
Rush Enterprises, Inc. - Class A | | | 135,200 | | | 5,660,824 |
WESCO International, Inc. | | | 70,900 | | | 11,239,068 |
| | | | | | 16,899,892 |
TOTAL COMMON STOCKS
(Cost $645,187,935) | | | | | | 750,480,703 |
| | | | | | | |
The accompanying notes are an integral part of these financial statements.
TABLE OF CONTENTS
Hotchkis & Wiley Small Cap Value Fund
Schedule of Investments
as of June 30, 2024 (Continued)
| | | | | | | |
REAL ESTATE INVESTMENT TRUSTS - 0.6%
|
Real Estate Management &
Development - 0.6%
|
Seritage Growth Properties -Class A(a) | | | 1,075,610 | | | $5,023,099 |
TOTAL REAL ESTATE INVESTMENT
TRUSTS
|
(Cost $16,974,776) | | | | | | 5,023,099 |
SHORT-TERM INVESTMENTS - 3.9%
|
Money Market Funds - 1.0%
| | | | | | |
Invesco Government & Agency Portfolio -
Class Institutional, 5.23%(d) | | | 8,062,567 | | | 8,062,567 |
| | | Par | | | |
Time Deposits - 2.9%
|
Citigroup, Inc., 4.68%, 07/01/2024(e) | | | 22,444,666 | | | 22,444,666 |
| | | | | | 22,444,666 |
TOTAL SHORT-TERM INVESTMENTS
|
(Cost $30,507,233) | | | | | | 30,507,233 |
TOTAL INVESTMENTS - 101.1%
|
(Cost $692,669,944) | | | | | | $786,011,035 |
Liabilities in Excess of Other
Assets - (1.1)% | | | | | | (8,780,549) |
TOTAL NET
ASSETS - 100.0% | | | | | | $777,230,486 |
| | | | | | | |
Percentages are stated as a percent of net assets.
Par amount is in USD unless otherwise indicated.
The Global Industry Classification Standard (GICS®) was developed by MSCI, an independent provider of global indices and benchmark-related products and services, and Standard & Poor’s (S&P), an independent international financial data and investment services company. The GICS methodology has been widely accepted as an industry analysis framework for investment research, portfolio management and asset allocation. The GICS structure consists of 11 sectors, 25 industry groups, 74 industries and 163 sub-industries. Each stock that is classified will have a coding at all four of these levels.
ADR - American Depositary Receipt
NV - Naamloze Vennootschap
PLC - Public Limited Company
(a)
| Non-income producing security. |
(b)
| All or a portion of this security is on loan as of June 30, 2024. The total market value of these securities was $7,895,134 which represented 1.0% of net assets. |
(c)
| Affiliated company as defined by the Investment Company Act of 1940. See Note 6. |
(d)
| The rate shown represents the 7-day effective yield as of June 30, 2024. |
(e)
| Invested through a cash management account administered by Brown Brothers Harriman & Co. |
The accompanying notes are an integral part of these financial statements.
TABLE OF CONTENTS
Hotchkis & Wiley Small Cap Diversified Value Fund
Schedule of Investments
as of June 30, 2024
| | | | | | | |
COMMON STOCKS - 95.6%
| | | | | | |
Aerospace & Defense - 1.0%
| | | | | | |
AerSale Corp.(a) | | | 351,800 | | | $2,434,456 |
Moog, Inc. - Class A | | | 11,200 | | | 1,873,760 |
National Presto Industries, Inc. | | | 20,414 | | | 1,533,704 |
V2X, Inc.(a) | | | 44,955 | | | 2,156,042 |
| | | | | | 7,997,962 |
Automobile Components - 1.2%
|
Adient PLC(a) | | | 117,605 | | | 2,906,020 |
Fox Factory Holding Corp.(a) | | | 18,900 | | | 910,791 |
Goodyear Tire & Rubber Co.(a) | | | 260,400 | | | 2,955,540 |
Phinia, Inc. | | | 72,700 | | | 2,861,472 |
| | | | | | 9,633,823 |
Banks - 20.6%
| | | | | | |
1st Source Corp. | | | 16,206 | | | 868,966 |
Arrow Financial Corp. | | | 30,200 | | | 786,710 |
Associated Banc-Corp. | | | 156,700 | | | 3,314,205 |
Banc of California, Inc. | | | 263,218 | | | 3,363,926 |
Bank of Marin Bancorp | | | 98,300 | | | 1,591,477 |
BankUnited, Inc. | | | 101,210 | | | 2,962,417 |
BayCom Corp. | | | 36,300 | | | 738,705 |
BCB Bancorp, Inc. | | | 53,500 | | | 568,705 |
Berkshire Hills Bancorp, Inc. | | | 77,100 | | | 1,757,880 |
BOK Financial Corp. | | | 19,200 | | | 1,759,488 |
Bridgewater Bancshares, Inc.(a) | | | 74,590 | | | 865,990 |
Brookline Bancorp, Inc. | | | 380,199 | | | 3,174,662 |
Cambridge Bancorp | | | 38,400 | | | 2,649,600 |
Camden National Corp. | | | 53,516 | | | 1,766,028 |
Capitol Federal Financial, Inc. | | | 302,300 | | | 1,659,627 |
Cathay General Bancorp | | | 45,932 | | | 1,732,555 |
Central Pacific Financial Corp. | | | 124,100 | | | 2,630,920 |
Civista Bancshares, Inc. | | | 39,000 | | | 604,110 |
CNB Financial Corp./PA | | | 36,800 | | | 751,088 |
Columbia Banking System, Inc. | | | 103,700 | | | 2,062,593 |
Community Trust Bancorp, Inc. | | | 39,710 | | | 1,733,739 |
ConnectOne Bancorp, Inc. | | | 170,900 | | | 3,228,301 |
CrossFirst Bankshares, Inc.(a) | | | 124,820 | | | 1,749,976 |
Dime Community Bancshares, Inc. | | | 127,200 | | | 2,594,880 |
Eagle Bancorp, Inc. | | | 186,530 | | | 3,525,417 |
Enterprise Financial Services Corp. | | | 42,700 | | | 1,746,857 |
FB Financial Corp. | | | 20,725 | | | 808,897 |
Financial Institutions, Inc. | | | 39,961 | | | 772,046 |
First Busey Corp. | | | 32,900 | | | 796,509 |
First Business Financial Services, Inc. | | | 21,665 | | | 801,388 |
First Financial Corp./IN | | | 67,763 | | | 2,499,099 |
First Foundation, Inc. | | | 286,000 | | | 1,873,300 |
First Hawaiian, Inc. | | | 160,440 | | | 3,330,734 |
First Internet Bancorp | | | 51,189 | | | 1,383,127 |
First Interstate BancSystem, Inc. - Class A | | | 27,500 | | | 763,675 |
First Merchants Corp. | | | 22,302 | | | 742,434 |
First Mid Bancshares, Inc. | | | 24,100 | | | 792,408 |
First of Long Island Corp. | | | 165,680 | | | 1,660,114 |
Flushing Financial Corp. | | | 216,018 | | | 2,840,637 |
FS Bancorp, Inc. | | | 21,380 | | | 779,301 |
Great Southern Bancorp, Inc. | | | 17,110 | | | 951,487 |
Hanmi Financial Corp. | | | 215,567 | | | 3,604,280 |
Heartland Financial USA, Inc. | | | 42,500 | | | 1,889,125 |
Heritage Commerce Corp. | | | 203,400 | | | 1,769,580 |
Heritage Financial Corp./WA | | | 93,200 | | | 1,680,396 |
| | | | | | | |
| | | | | | | |
Hilltop Holdings, Inc. | | | 81,800 | | | $ 2,558,704 |
Home Bancorp, Inc. | | | 19,700 | | | 788,197 |
Hope Bancorp, Inc. | | | 306,733 | | | 3,294,312 |
Horizon Bancorp, Inc./IN | | | 205,200 | | | 2,538,324 |
Independent Bank Corp./MI | | | 67,300 | | | 1,817,100 |
Independent Bank Group, Inc. | | | 19,800 | | | 901,296 |
Investar Holding Corp. | | | 56,000 | | | 862,400 |
Kearny Financial Corp./MD | | | 291,400 | | | 1,792,110 |
Live Oak Bancshares, Inc. | | | 52,700 | | | 1,847,662 |
Mercantile Bank Corp. | | | 19,400 | | | 787,058 |
MidWestOne Financial Group, Inc. | | | 30,794 | | | 692,557 |
Northeast Bank | | | 13,200 | | | 803,352 |
Northeast Community Bancorp, Inc. | | | 44,800 | | | 798,336 |
Northfield Bancorp, Inc. | | | 262,607 | | | 2,489,514 |
Northrim BanCorp, Inc. | | | 35,384 | | | 2,039,534 |
OceanFirst Financial Corp. | | | 214,310 | | | 3,405,386 |
Pacific Premier Bancorp, Inc. | | | 73,614 | | | 1,690,914 |
Parke Bancorp, Inc. | | | 33,600 | | | 584,640 |
PCB Bancorp | | | 45,100 | | | 734,228 |
Peapack-Gladstone Financial Corp. | | | 71,400 | | | 1,617,210 |
Popular, Inc. | | | 38,700 | | | 3,422,241 |
Preferred Bank/Los Angeles CA | | | 32,700 | | | 2,468,523 |
Premier Financial Corp. | | | 123,360 | | | 2,523,946 |
Primis Financial Corp. | | | 85,856 | | | 899,771 |
Provident Financial Services, Inc. | | | 227,648 | | | 3,266,749 |
RBB Bancorp | | | 53,432 | | | 1,005,056 |
Sandy Spring Bancorp, Inc. | | | 158,400 | | | 3,858,624 |
Shore Bancshares, Inc. | | | 64,512 | | | 738,662 |
Sierra Bancorp | | | 37,800 | | | 845,964 |
Simmons First National Corp. - Class A | | | 188,600 | | | 3,315,588 |
Southern First Bancshares, Inc.(a) | | | 25,177 | | | 736,175 |
Synovus Financial Corp. | | | 82,800 | | | 3,327,732 |
Territorial Bancorp, Inc. | | | 54,352 | | | 440,251 |
Texas Capital Bancshares, Inc.(a) | | | 12,690 | | | 775,867 |
Tompkins Financial Corp. | | | 36,600 | | | 1,789,740 |
Towne Bank/Portsmouth VA | | | 27,400 | | | 747,198 |
TrustCo Bank Corp. NY | | | 89,992 | | | 2,589,070 |
Univest Financial Corp. | | | 127,850 | | | 2,918,815 |
Valley National Bancorp | | | 351,200 | | | 2,451,376 |
Veritex Holdings, Inc. | | | 124,300 | | | 2,621,487 |
WaFd, Inc. | | | 118,234 | | | 3,379,128 |
Washington Trust Bancorp, Inc. | | | 93,930 | | | 2,574,621 |
Zions Bancorp NA | | | 81,600 | | | 3,538,992 |
| | | | | | 162,205,769 |
Beverages - 0.4%
| | | | | | |
Duckhorn Portfolio, Inc.(a) | | | 412,000 | | | 2,925,200 |
Building Products - 1.5%
| | | | | | |
Armstrong World Industries, Inc. | | | 21,600 | | | 2,445,984 |
AZZ, Inc. | | | 41,200 | | | 3,182,700 |
Insteel Industries, Inc. | | | 74,900 | | | 2,318,904 |
Janus International Group, Inc.(a) | | | 58,500 | | | 738,855 |
JELD-WEN Holding, Inc.(a) | | | 108,900 | | | 1,466,883 |
Resideo Technologies, Inc.(a) | | | 88,100 | | | 1,723,236 |
| | | | | | 11,876,562 |
Capital Markets - 2.3%
| | | | | | |
Diamond Hill Investment Group, Inc. | | | 10,900 | | | 1,534,175 |
Evercore, Inc. - Class A | | | 9,110 | | | 1,898,797 |
Federated Hermes, Inc. - Class B | | | 99,700 | | | 3,278,136 |
| | | | | | | |
The accompanying notes are an integral part of these financial statements.
TABLE OF CONTENTS
Hotchkis & Wiley Small Cap Diversified Value Fund
Schedule of Investments
as of June 30, 2024 (Continued)
| | | | | | | |
COMMON STOCKS - (Continued)
|
Capital Markets - (Continued)
|
Janus Henderson Group PLC | | | 100,400 | | | $3,384,484 |
Perella Weinberg Partners | | | 126,300 | | | 2,052,375 |
Virtu Financial, Inc. - Class A | | | 127,100 | | | 2,853,395 |
Virtus Investment Partners, Inc. | | | 14,400 | | | 3,252,240 |
| | | | | | 18,253,602 |
Chemicals - 2.2%
| | | | | | |
AdvanSix, Inc. | | | 90,500 | | | 2,074,260 |
Alto Ingredients, Inc.(a) | | | 942,400 | | | 1,361,768 |
Cabot Corp. | | | 16,070 | | | 1,476,672 |
Core Molding Technologies, Inc.(a) | | | 44,900 | | | 715,706 |
Ecovyst, Inc.(a) | | | 352,600 | | | 3,162,822 |
Ingevity Corp.(a) | | | 59,300 | | | 2,592,003 |
Innospec, Inc. | | | 20,700 | | | 2,558,313 |
Minerals Technologies, Inc. | | | 37,800 | | | 3,143,448 |
| | | | | | 17,084,992 |
Commercial Services & Supplies - 2.0%
|
ABM Industries, Inc. | | | 58,100 | | | 2,938,117 |
Brady Corp. - Class A | | | 40,100 | | | 2,647,402 |
Brink’s Co. | | | 20,500 | | | 2,099,200 |
Ennis, Inc. | | | 80,900 | | | 1,770,901 |
Healthcare Services Group, Inc.(a) | | | 228,500 | | | 2,417,530 |
Interface, Inc. | | | 153,000 | | | 2,246,040 |
Quad/Graphics, Inc. | | | 180,000 | | | 981,000 |
UniFirst Corp./MA | | | 4,800 | | | 823,344 |
| | | | | | 15,923,534 |
Communications Equipment - 0.1%
|
Aviat Networks, Inc.(a) | | | 26,900 | | | 771,761 |
Construction & Engineering - 0.4%
|
Primoris Services Corp. | | | 17,453 | | | 870,730 |
Tutor Perini Corp.(a) | | | 113,321 | | | 2,468,132 |
| | | | | | 3,338,862 |
Consumer Finance - 1.3%
| | | | | | |
Bread Financial Holdings, Inc. | | | 79,100 | | | 3,524,696 |
Navient Corp. | | | 215,220 | | | 3,133,603 |
SLM Corp. | | | 166,700 | | | 3,465,693 |
| | | | | | 10,123,992 |
Consumer Staples Distribution &
Retail - 0.3%
|
Andersons, Inc. | | | 47,200 | | | 2,341,120 |
Containers & Packaging - 0.7%
|
Myers Industries, Inc. | | | 106,500 | | | 1,424,970 |
Silgan Holdings, Inc. | | | 36,800 | | | 1,557,744 |
TriMas Corp. | | | 88,800 | | | 2,269,728 |
| | | | | | 5,252,442 |
Diversified Consumer Services - 0.6%
|
Adtalem Global Education, Inc.(a) | | | 49,700 | | | 3,390,037 |
Graham Holdings Co. - Class B | | | 2,500 | | | 1,748,875 |
| | | | | | 5,138,912 |
Electric Utilities - 1.7%
| | | | | | |
ALLETE, Inc. | | | 52,776 | | | 3,290,583 |
Otter Tail Corp. | | | 38,840 | | | 3,401,996 |
PNM Resources, Inc. | | | 88,802 | | | 3,282,122 |
Portland General Electric Co. | | | 79,100 | | | 3,420,284 |
| | | | | | 13,394,985 |
| | | | | | | |
| | | | | | | |
Electrical Equipment - 0.5%
| | | | | | |
Preformed Line Products Co. | | | 5,027 | | | $626,063 |
Thermon Group Holdings, Inc.(a) | | | 106,883 | | | 3,287,721 |
| | | | | | 3,913,784 |
Electronic Equipment, Instruments &
Components - 6.0%
|
Avnet, Inc. | | | 59,600 | | | 3,068,804 |
Belden, Inc. | | | 36,770 | | | 3,449,026 |
Benchmark Electronics, Inc. | | | 28,200 | | | 1,112,772 |
Coherent Corp.(a) | | | 20,300 | | | 1,470,938 |
Crane NXT Co. | | | 55,500 | | | 3,408,810 |
ePlus, Inc.(a) | | | 43,980 | | | 3,240,446 |
IPG Photonics Corp.(a) | | | 37,400 | | | 3,156,186 |
Itron, Inc.(a) | | | 30,100 | | | 2,978,696 |
Kimball Electronics, Inc.(a) | | | 110,400 | | | 2,426,592 |
Methode Electronics, Inc. | | | 274,900 | | | 2,845,215 |
OSI Systems, Inc.(a) | | | 12,400 | | | 1,705,248 |
Plexus Corp.(a) | | | 29,423 | | | 3,035,865 |
Sanmina Corp.(a) | | | 47,395 | | | 3,139,919 |
ScanSource, Inc.(a) | | | 45,233 | | | 2,004,274 |
TTM Technologies, Inc.(a) | | | 174,000 | | | 3,380,820 |
Vishay Intertechnology, Inc. | | | 150,226 | | | 3,350,040 |
Vontier Corp. | | | 83,200 | | | 3,178,240 |
| | | | | | 46,951,891 |
Energy Equipment & Services - 4.1%
|
Cactus, Inc. - Class A | | | 61,700 | | | 3,254,058 |
Core Laboratories, Inc. | | | 98,400 | | | 1,996,536 |
Dril-Quip, Inc.(a) | | | 126,600 | | | 2,354,760 |
Expro Group Holdings NV(a) | | | 149,903 | | | 3,435,777 |
Forum Energy Technologies, Inc.(a) | | | 40,944 | | | 690,316 |
Helix Energy Solutions Group, Inc.(a) | | | 161,700 | | | 1,930,698 |
Liberty Energy, Inc. | | | 113,400 | | | 2,368,926 |
National Energy Services Reunited Corp.(a) | | | 400,000 | | | 3,800,000 |
Newpark Resources, Inc.(a) | | | 210,400 | | | 1,748,424 |
Precision Drilling Corp.(a) | | | 48,700 | | | 3,425,558 |
ProFrac Holding Corp. - Class A(a) | | | 106,100 | | | 786,201 |
ProPetro Holding Corp.(a) | | | 296,350 | | | 2,569,354 |
Select Water Solutions, Inc. | | | 108,400 | | | 1,159,880 |
Solaris Oilfield Infrastructure, Inc. - Class A | | | 311,100 | | | 2,669,238 |
| | | | | | 32,189,726 |
Financial Services - 3.2%
| | | | | | |
Enact Holdings, Inc. | | | 95,700 | | | 2,934,162 |
Essent Group Ltd. | | | 59,300 | | | 3,332,067 |
Euronet Worldwide, Inc.(a) | | | 16,400 | | | 1,697,400 |
Merchants Bancorp/IN | | | 58,800 | | | 2,383,752 |
MGIC Investment Corp. | | | 161,600 | | | 3,482,480 |
Mr Cooper Group, Inc.(a) | | | 31,300 | | | 2,542,499 |
NCR Atleos Corp.(a) | | | 72,800 | | | 1,967,056 |
NMI Holdings, Inc. - Class A(a) | | | 107,600 | | | 3,662,704 |
Radian Group, Inc. | | | 92,700 | | | 2,882,970 |
| | | | | | 24,885,090 |
Food Products - 0.8%
| | | | | | |
B&G Foods, Inc. | | | 258,500 | | | 2,088,680 |
Cal-Maine Foods, Inc. | | | 16,500 | | | 1,008,315 |
Hain Celestial Group, Inc.(a) | | | 209,900 | | | 1,450,409 |
WK Kellogg Co. | | | 85,700 | | | 1,410,622 |
| | | | | | 5,958,026 |
| | | | | | | |
The accompanying notes are an integral part of these financial statements.
TABLE OF CONTENTS
Hotchkis & Wiley Small Cap Diversified Value Fund
Schedule of Investments
as of June 30, 2024 (Continued)
| | | | | | | |
COMMON STOCKS - (Continued)
|
Gas Utilities - 1.6%
| | | | | | |
Northwest Natural Holding Co. | | | 89,300 | | | $3,224,623 |
ONE Gas, Inc. | | | 53,300 | | | 3,403,205 |
Southwest Gas Holdings, Inc. | | | 43,300 | | | 3,047,454 |
Spire, Inc. | | | 54,873 | | | 3,332,437 |
| | | | | | 13,007,719 |
Ground Transportation - 0.6%
|
Heartland Express, Inc. | | | 224,000 | | | 2,761,920 |
Marten Transport Ltd. | | | 84,400 | | | 1,557,180 |
PAM Transportation Services, Inc.(a) | | | 34,517 | | | 599,560 |
| | | | | | 4,918,660 |
Health Care Equipment & Supplies - 0.7%
|
Inmode Ltd.(a) | | | 174,500 | | | 3,182,880 |
Utah Medical Products, Inc. | | | 9,900 | | | 661,419 |
Zynex, Inc.(a)(b) | | | 164,000 | | | 1,528,480 |
| | | | | | 5,372,779 |
Health Care Providers & Services - 0.3%
|
Select Medical Holdings Corp. | | | 72,000 | | | 2,524,320 |
Health Care Technology - 0.2%
|
TruBridge, Inc.(a)(b) | | | 177,900 | | | 1,779,000 |
Hotels, Restaurants & Leisure - 4.2%
|
Accel Entertainment, Inc.(a) | | | 238,400 | | | 2,445,984 |
Bloomin’ Brands, Inc. | | | 116,105 | | | 2,232,699 |
Brinker International, Inc.(a) | | | 34,970 | | | 2,531,478 |
Dave & Buster’s Entertainment,
Inc.(a) | | | 50,200 | | | 1,998,462 |
Denny’s Corp.(a) | | | 215,900 | | | 1,532,890 |
Dine Brands Global, Inc. | | | 64,500 | | | 2,334,900 |
El Pollo Loco Holdings, Inc.(a) | | | 173,100 | | | 1,957,761 |
Everi Holdings, Inc.(a) | | | 285,700 | | | 2,399,880 |
Hilton Grand Vacations, Inc.(a) | | | 57,300 | | | 2,316,639 |
Marriott Vacations Worldwide Corp. | | | 35,500 | | | 3,099,860 |
Monarch Casino & Resort, Inc. | | | 34,900 | | | 2,377,737 |
Six Flags Entertainment Corp. | | | 31,900 | | | 1,057,166 |
Travel + Leisure Co. | | | 75,080 | | | 3,377,099 |
United Parks & Resorts, Inc.(a) | | | 63,900 | | | 3,470,409 |
| | | | | | 33,132,964 |
Household Durables - 2.0%
| | | | | | |
Century Communities, Inc. | | | 27,996 | | | 2,286,153 |
Green Brick Partners, Inc.(a) | | | 32,750 | | | 1,874,610 |
KB Home | | | 30,800 | | | 2,161,544 |
La-Z-Boy, Inc. | | | 70,800 | | | 2,639,424 |
Leggett & Platt, Inc. | | | 139,100 | | | 1,594,086 |
M/I Homes, Inc.(a) | | | 20,423 | | | 2,494,465 |
Tri Pointe Homes, Inc.(a) | | | 50,687 | | | 1,888,091 |
Worthington Enterprises, Inc. | | | 14,350 | | | 679,186 |
| | | | | | 15,617,559 |
Household Products - 0.5%
| | | | | | |
Central Garden & Pet Co.(a) | | | 40,200 | | | 1,547,700 |
Energizer Holdings, Inc. | | | 82,100 | | | 2,425,234 |
| | | | | | 3,972,934 |
Insurance - 5.5%
| | | | | | |
Ambac Financial Group, Inc.(a) | | | 160,100 | | | 2,052,482 |
Assured Guaranty Ltd. | | | 40,500 | | | 3,124,575 |
Axis Capital Holdings Ltd. | | | 44,700 | | | 3,158,055 |
| | | | | | | |
| | | | | | | |
Brighthouse Financial, Inc.(a) | | | 56,000 | | | $2,427,040 |
CNO Financial Group, Inc. | | | 102,486 | | | 2,840,912 |
Employers Holdings, Inc. | | | 75,535 | | | 3,220,057 |
Enstar Group Ltd.(a) | | | 11,139 | | | 3,405,192 |
Hanover Insurance Group, Inc. | | | 18,400 | | | 2,308,096 |
Horace Mann Educators Corp. | | | 94,314 | | | 3,076,523 |
Kemper Corp. | | | 55,400 | | | 3,286,882 |
Lincoln National Corp. | | | 50,000 | | | 1,555,000 |
Mercury General Corp. | | | 31,400 | | | 1,668,596 |
ProAssurance Corp.(a) | | | 118,500 | | | 1,448,070 |
Safety Insurance Group, Inc. | | | 21,200 | | | 1,590,636 |
SiriusPoint Ltd.(a) | | | 129,978 | | | 1,585,732 |
Stewart Information Services Corp. | | | 52,300 | | | 3,246,784 |
White Mountains Insurance Group Ltd. | | | 1,900 | | | 3,453,155 |
| | | | | | 43,447,787 |
IT Services - 0.4%
| | | | | | |
DXC Technology Co.(a) | | | 161,200 | | | 3,077,308 |
Leisure Products - 0.8%
| | | | | | |
JAKKS Pacific, Inc.(a) | | | 91,767 | | | 1,643,547 |
Johnson Outdoors, Inc. - Class A | | | 39,200 | | | 1,371,216 |
Vista Outdoor, Inc.(a) | | | 96,500 | | | 3,633,225 |
| | | | | | 6,647,988 |
Machinery - 4.8%
| | | | | | |
Albany International Corp. - Class A | | | 17,000 | | | 1,435,650 |
Atmus Filtration Technologies, Inc.(a) | | | 107,400 | | | 3,090,972 |
Barnes Group, Inc. | | | 84,300 | | | 3,490,863 |
Blue Bird Corp.(a) | | | 9,500 | | | 511,575 |
Columbus McKinnon Corp./NY | | | 59,500 | | | 2,055,130 |
Douglas Dynamics, Inc. | | | 29,000 | | | 678,600 |
Enerpac Tool Group Corp. | | | 34,500 | | | 1,317,210 |
Flowserve Corp. | | | 60,200 | | | 2,895,620 |
Gates Industrial Corp. PLC(a) | | | 185,000 | | | 2,924,850 |
Greenbrier Cos., Inc. | | | 60,599 | | | 3,002,681 |
Hillenbrand, Inc. | | | 73,520 | | | 2,942,270 |
Kennametal, Inc. | | | 27,500 | | | 647,350 |
Lindsay Corp. | | | 14,000 | | | 1,720,320 |
Miller Industries, Inc./TN | | | 15,420 | | | 848,408 |
Mueller Industries, Inc. | | | 55,900 | | | 3,182,946 |
Mueller Water Products, Inc. - Class A | | | 132,800 | | | 2,379,776 |
REV Group, Inc. | | | 61,400 | | | 1,528,246 |
Tennant Co. | | | 8,900 | | | 876,116 |
Wabash National Corp. | | | 110,582 | | | 2,415,111 |
| | | | | | 37,943,694 |
Media - 0.9%
| | | | | | |
Emerald Holding, Inc.(a)(b) | | | 169,050 | | | 961,894 |
Stagwell, Inc.(a) | | | 466,300 | | | 3,180,166 |
TEGNA, Inc. | | | 222,867 | | | 3,106,766 |
| | | | | | 7,248,826 |
Metals & Mining - 0.9%
| | | | | | |
Compass Minerals International, Inc. | | | 185,700 | | | 1,918,281 |
Haynes International, Inc. | | | 14,900 | | | 874,630 |
Kaiser Aluminum Corp. | | | 35,267 | | | 3,099,969 |
Tredegar Corp. | | | 289,420 | | | 1,386,322 |
| | | | | | 7,279,202 |
Multi-Utilities - 1.3%
| | | | | | |
Avista Corp. | | | 95,861 | | | 3,317,749 |
Black Hills Corp. | | | 61,900 | | | 3,366,122 |
| | | | | | | |
The accompanying notes are an integral part of these financial statements.
TABLE OF CONTENTS
Hotchkis & Wiley Small Cap Diversified Value Fund
Schedule of Investments
as of June 30, 2024 (Continued)
| | | | | | | | |
COMMON STOCKS - (Continued)
| |
Multi-Utilities - (Continued)
| |
Northwestern Energy Group, Inc. | | | 65,700 | | | $3,290,256 | |
| | | | | | 9,974,127 | |
Oil Gas & Consumable Fuels - 5.3%
| |
Baytex Energy Corp. | | | 896,642 | | | 3,120,314 | |
Berry Corp. | | | 476,570 | | | 3,078,642 | |
California Resources Corp. | | | 69,000 | | | 3,672,180 | |
Crescent Energy Co. - Class A | | | 278,200 | | | 3,296,670 | |
Equitrans Midstream Corp. | | | 203,100 | | | 2,636,238 | |
Kinetik Holdings, Inc. | | | 39,540 | | | 1,638,538 | |
Kosmos Energy Ltd.(a) | | | 510,513 | | | 2,828,242 | |
Northern Oil & Gas, Inc. | | | 81,200 | | | 3,018,204 | |
Par Pacific Holdings, Inc.(a) | | | 92,700 | | | 2,340,675 | |
REX American Resources Corp.(a) | | | 20,934 | | | 954,381 | |
SilverBow Resources, Inc.(a) | | | 75,000 | | | 2,837,250 | |
Talos Energy, Inc.(a) | | | 283,000 | | | 3,438,450 | |
VAALCO Energy, Inc. | | | 388,100 | | | 2,433,387 | |
Vertex Energy, Inc.(a)(b) | | | 568,300 | | | 536,873 | |
Vital Energy, Inc.(a) | | | 68,100 | | | 3,052,242 | |
World Kinect Corp. | | | 127,524 | | | 3,290,119 | |
| | | | | | 42,172,405 | |
Paper & Forest Products - 0.4%
| | | | | | |
Mercer International, Inc. | | | 185,900 | | | 1,587,586 | |
Sylvamo Corp. | | | 18,700 | | | 1,282,820 | |
| | | | | | 2,870,406 | |
Passenger Airlines - 0.5%
| | | | | | | |
Alaska Air Group, Inc.(a) | | | 67,000 | | | 2,706,800 | |
JetBlue Airways Corp.(a) | | | 157,800 | | | 961,002 | |
| | | | | | 3,667,802 | |
Personal Care Products - 1.1%
| |
Edgewell Personal Care Co. | | | 67,100 | | | 2,696,749 | |
Herbalife Ltd.(a) | | | 249,900 | | | 2,596,461 | |
Medifast, Inc. | | | 89,500 | | | 1,952,890 | |
Nu Skin Enterprises, Inc. - Class A | | | 131,550 | | | 1,386,537 | |
| | | | | | 8,632,637 | |
Pharmaceuticals - 0.4%
| | | | | | | |
Phibro Animal Health Corp. - Class A | | | 92,300 | | | 1,547,871 | |
SIGA Technologies, Inc. | | | 218,693 | | | 1,659,880 | |
| | | | | | 3,207,751 | |
Professional Services - 3.3%
| | | | | | | |
Concentrix Corp. | | | 53,500 | | | 3,385,480 | |
Heidrick & Struggles International,
Inc. | | | 61,910 | | | 1,955,118 | |
Kforce, Inc. | | | 40,500 | | | 2,516,265 | |
Korn Ferry | | | 49,656 | | | 3,333,904 | |
ManpowerGroup, Inc. | | | 45,100 | | | 3,147,980 | |
Maximus, Inc. | | | 38,800 | | | 3,325,160 | |
Resources Connection, Inc. | | | 218,685 | | | 2,414,282 | |
TrueBlue, Inc.(a) | | | 300,600 | | | 3,096,180 | |
TTEC Holdings, Inc. | | | 119,800 | | | 704,424 | |
Verra Mobility Corp.(a) | | | 72,000 | | | 1,958,400 | |
| | | | | | 25,837,193 | |
Real Estate Management &
Development - 0.4%
| |
Cushman & Wakefield PLC(a) | | | 325,500 | | | 3,385,200 | |
| | | | | | | | |
| | | | | | | |
Semiconductors & Semiconductor
Equipment - 1.5%
|
Cirrus Logic, Inc.(a) | | | 21,300 | | | $2,719,158 |
Diodes, Inc.(a) | | | 45,849 | | | 3,297,919 |
NVE Corp. | | | 20,200 | | | 1,508,738 |
Photronics, Inc.(a) | | | 90,000 | | | 2,220,300 |
Semtech Corp.(a) | | | 69,100 | | | 2,064,708 |
| | | | | | 11,810,823 |
Software - 0.5%
| | | | | | |
ACI Worldwide, Inc.(a) | | | 93,300 | | | 3,693,747 |
Specialty Retail - 4.3%
| | | | | | |
Aaron’s Co., Inc. | | | 250,600 | | | 2,500,988 |
Advance Auto Parts, Inc. | | | 24,300 | | | 1,538,919 |
Asbury Automotive Group, Inc.(a) | | | 11,464 | | | 2,612,302 |
Designer Brands, Inc. - Class A | | | 185,600 | | | 1,267,648 |
Genesco, Inc.(a) | | | 61,030 | | | 1,578,236 |
Group 1 Automotive, Inc. | | | 10,528 | | | 3,129,764 |
Haverty Furniture Cos., Inc. | | | 85,800 | | | 2,169,882 |
Hibbett, Inc. | | | 31,473 | | | 2,744,760 |
Leslie’s, Inc.(a) | | | 430,500 | | | 1,803,795 |
MarineMax, Inc.(a) | | | 87,900 | | | 2,845,323 |
OneWater Marine, Inc. - Class A(a)(b) | | | 70,100 | | | 1,932,657 |
PetMed Express, Inc.(b) | | | 338,500 | | | 1,370,925 |
Revolve Group, Inc.(a) | | | 53,300 | | | 848,003 |
Signet Jewelers Ltd. | | | 24,300 | | | 2,176,794 |
Sonic Automotive, Inc. - Class A | | | 50,550 | | | 2,753,458 |
Upbound Group, Inc. | | | 47,700 | | | 1,464,390 |
Zumiez, Inc.(a) | | | 54,200 | | | 1,055,816 |
| | | | | | 33,793,660 |
Technology Hardware, Storage &
Peripherals - 0.1%
|
CPI Card Group, Inc.(a) | | | 43,300 | | | 1,179,925 |
Textiles, Apparel & Luxury Goods - 1.2%
|
Carter’s, Inc. | | | 22,200 | | | 1,375,734 |
G-III Apparel Group Ltd.(a) | | | 86,640 | | | 2,345,345 |
Hanesbrands, Inc.(a) | | | 344,600 | | | 1,698,878 |
Kontoor Brands, Inc. | | | 26,700 | | | 1,766,205 |
Oxford Industries, Inc. | | | 6,800 | | | 681,020 |
Steven Madden Ltd. | | | 46,200 | | | 1,954,260 |
| | | | | | 9,821,442 |
Trading Companies & Distributors - 1.0%
|
DNOW, Inc.(a) | | | 66,300 | | | 910,299 |
Global Industrial Co. | | | 23,957 | | | 751,291 |
MRC Global, Inc.(a) | | | 66,400 | | | 857,224 |
Rush Enterprises, Inc. - Class A | | | 72,670 | | | 3,042,693 |
Titan Machinery, Inc.(a) | | | 132,500 | | | 2,106,750 |
| | | | | | 7,668,257 |
TOTAL COMMON STOCKS
(Cost $705,264,294) | | | | | | 753,848,150 |
REAL ESTATE INVESTMENT TRUSTS - 2.8%
|
Diversified Real Estate Investment
Trusts - 0.4%
|
Empire State Realty Trust, Inc. -
Class A | | | 353,400 | | | 3,314,892 |
| | | | | | | |
The accompanying notes are an integral part of these financial statements.
TABLE OF CONTENTS
Hotchkis & Wiley Small Cap Diversified Value Fund
Schedule of Investments
as of June 30, 2024 (Continued)
| | | | | | | | |
REAL ESTATE INVESTMENT TRUSTS - (Coninued)
| |
Hotel & Resort Real Estate Investment
Trusts - 0.8%
| |
Park Hotels & Resorts, Inc. | | | 209,300 | | | $3,135,314 | |
Pebblebrook Hotel Trust | | | 233,400 | | | 3,209,250 | |
| | | | | | 6,344,564 | |
Mortgage Real Estate Investment
Trusts - 1.0%
| |
Apollo Commercial Real Estate Finance, Inc. | | | 148,500 | | | 1,453,815 | |
Ares Commercial Real Estate Corp. | | | 239,700 | | | 1,594,005 | |
BrightSpire Capital, Inc. | | | 253,800 | | | 1,446,660 | |
Granite Point Mortgage Trust, Inc. | | | 394,100 | | | 1,170,477 | |
Great Ajax Corp. | | | 203,734 | | | 727,331 | |
TPG RE Finance Trust, Inc. | | | 190,600 | | | 1,646,784 | |
| | | | | | 8,039,072 | |
Real Estate Management &
Development - 0.3%
| | | | | | |
Seritage Growth Properties - Class A(a) | | | 393,348 | | | 1,836,935 | |
Retail Real Estate Investment
Trusts - 0.3%
| |
Alexander’s, Inc. | | | 11,600 | | | 2,608,376 | |
TOTAL REAL ESTATE INVESTMENT TRUSTS
(Cost $25,735,965) | | | | | | 22,143,839 | |
SHORT-TERM INVESTMENTS - 1.7%
| |
Money Market Funds - 0.4%
| | | | | | | |
Invesco Government & Agency
Portfolio - Class Institutional, 5.23%(c) | | | 2,793,676 | | | 2,793,676 | |
| | | Par | | | | |
Time Deposits - 1.3%
| |
Citigroup, Inc., 4.68%, 07/01/2024(d) | | | 10,548,492 | | | 10,548,492 | |
TOTAL SHORT-TERM INVESTMENTS
(Cost $13,342,168) | | | | | | 13,342,168 | |
TOTAL INVESTMENTS - 100.1% (Cost $744,342,428) | | | | | | $789,334,157 | |
Liabilities in Excess of
Other Assets - (0.1)% | | | | | | (764,234) | |
TOTAL NET ASSETS - 100.0% | | | | | | $788,569,923 | |
| | | | | | | | |
Percentages are stated as a percent of net assets.
The Global Industry Classification Standard (GICS®) was developed by MSCI, an independent provider of global indices and benchmark-related products and services, and Standard & Poor’s (S&P), an independent international financial data and investment services company. The GICS methodology has been widely accepted as an industry analysis framework for investment research, portfolio management and asset allocation. The GICS structure consists of 11 sectors, 25 industry groups, 74 industries and 163 sub-industries. Each stock that is classified will have a coding at all four of these levels.
AMBAC American Municipal Bond Assurance Corporation
NV - Naamloze Vennootschap
PLC - Public Limited Company
(a)
| Non-income producing security.
|
(b)
| All or a portion of this security is on loan as of June 30, 2024. The total market value of these securities was $2,693,492 which represented 0.3% of net assets.
|
(c)
| The rate shown represents the 7-day effective yield as of June 30, 2024.
|
(d)
| Invested through a cash management account administered by Brown Brothers Harriman & Co. |
The accompanying notes are an integral part of these financial statements.
TABLE OF CONTENTS
Hotchkis & Wiley Global Value Fund
Schedule of Investments
as of June 30, 2024
| | | | | | | | | | |
COMMON STOCKS - 97.5%
|
Aerospace & Defense - 4.2%
|
Airbus SE | | | | | | 4,700 | | | $ 645,060 |
Babcock International Group PLC | | | | | | 103,400 | | | 683,146 |
BAE Systems PLC | | | | | | 16,059 | | | 267,488 |
| | | | | | | | | 1,595,694 |
Air Freight & Logistics - 1.9%
|
FedEx Corp. | | | | | | 2,360 | | | 707,622 |
Automobile Components - 1.6%
|
Magna International, Inc. | | | | | | 14,311 | | | 599,631 |
Automobiles - 1.9%
|
General Motors Co. | | | | | | 15,545 | | | 722,221 |
Banks - 14.5%
|
BNP Paribas SA | | | | | | 8,756 | | | 559,965 |
Citigroup, Inc. | | | | | | 14,704 | | | 933,116 |
Citizens Financial Group, Inc. | | | | | | 14,700 | | | 529,641 |
ING Groep NV | | | | | | 21,656 | | | 372,108 |
Lloyds Banking Group PLC | | | | | | 847,400 | | | 584,462 |
NatWest Group PLC | | | | | | 142,300 | | | 559,819 |
Popular, Inc. | | | | | | 6,300 | | | 557,109 |
Societe Generale SA | | | | | | 14,093 | | | 331,342 |
US Bancorp | | | | | | 7,500 | | | 297,750 |
Wells Fargo & Co. | | | | | | 12,130 | | | 720,401 |
| | | | | | | | | 5,445,713 |
Beverages - 1.8%
|
Heineken Holding NV | | | | | | 8,400 | | | 662,086 |
Capital Markets - 1.5%
|
Bank of New York Mellon Corp. | | | | | | 4,600 | | | 275,494 |
Goldman Sachs Group, Inc. | | | | | | 640 | | | 289,485 |
| | | | | | | | | 564,979 |
Chemicals - 2.4%
|
Akzo Nobel NV | | | | | | 6,100 | | | 371,791 |
Nippon Sanso Holdings Corp. | | | | | | 18,300 | | | 543,457 |
| | | | | | | | | 915,248 |
Communications Equipment - 8.4%
|
F5, Inc.(a) | | | | | | 8,300 | | | 1,429,509 |
Telefonaktiebolaget LM Ericsson - ADR | | | | | | 276,972 | | | 1,708,917 |
| | | | | | | | | 3,138,426 |
Electronic Equipment, Instruments &
Components - 1.0%
|
Arrow Electronics, Inc.(a) | | | | | | 3,000 | | | 362,280 |
Energy Equipment & Services - 3.1%
|
Baker Hughes Co. | | | | | | 17,500 | | | 615,475 |
NOV, Inc. | | | | | | 29,469 | | | 560,206 |
| | | | | | | | | 1,175,681 |
Financial Services - 4.4%
|
Euronet Worldwide, Inc.(a) | | | | | | 3,600 | | | 372,600 |
Fidelity National Information
Services, Inc. | | | | | | 10,600 | | | 798,816 |
Worldline SA/France(a)(b) | | | | | | 45,400 | | | 494,753 |
| | | | | | | | | 1,666,169 |
Ground Transportation - 0.9%
|
U-Haul Holding Co. | | | | | | 5,715 | | | 343,014 |
| | | | | | | | | | |
| | | | | | | | | | |
Health Care Equipment & Supplies - 5.4%
|
GE HealthCare Technologies, Inc. | | | | | | 9,578 | | | $ 746,318 |
Koninklijke Philips NV(a) | | | | | | 15,821 | | | 397,875 |
Medtronic PLC | | | | | | 11,300 | | | 889,423 |
| | | | | | | | | 2,033,616 |
Health Care Providers & Services - 6.4%
|
CVS Health Corp. | | | | | | 16,300 | | | 962,678 |
Elevance Health, Inc. | | | | | | 2,105 | | | 1,140,615 |
Humana, Inc. | | | | | | 800 | | | 298,920 |
| | | | | | | | | 2,402,213 |
Hotels, Restaurants & Leisure - 2.5%
|
Accor SA | | | | | | 20,500 | | | 838,840 |
Entain PLC | | | | | | 14,400 | | | 114,187 |
| | | | | | | | | 953,027 |
Household Products - 1.9%
|
Henkel AG & Co. KGaA | | | | | | 9,100 | | | 715,962 |
Industrial Conglomerates - 2.5%
|
Siemens AG | | | | | | 5,000 | | | 930,628 |
Insurance - 3.9%
|
American International Group, Inc. | | | | | | 10,969 | | | 814,339 |
Hartford Financial Services Group, Inc. | | | | | | 6,500 | | | 653,510 |
| | | | | | | | | 1,467,849 |
Interactive Media & Services - 3.0%
|
Alphabet, Inc. - Class A | | | | | | 6,100 | | | 1,111,115 |
Machinery - 2.8%
|
CNH Industrial NV | | | | | | 35,800 | | | 362,654 |
Cummins, Inc. | | | | | | 2,550 | | | 706,172 |
| | | | | | | | | 1,068,826 |
Media - 4.0%
|
Comcast Corp. - Class A | | | | | | 19,800 | | | 775,368 |
WPP PLC | | | | | | 80,300 | | | 735,278 |
| | | | | | | | | 1,510,646 |
Oil Gas & Consumable Fuels - 6.0%
|
APA Corp. | | | | | | 25,400 | | | 747,776 |
Baytex Energy Corp. | | | | | | 38,900 | | | 134,780 |
Kosmos Energy Ltd.(a) | | | | | | 72,300 | | | 400,542 |
Ovintiv, Inc. | | | | | | 3,800 | | | 178,106 |
Shell PLC - ADR | | | | | | 11,100 | | | 801,198 |
| | | | | | | | | 2,262,402 |
Passenger Airlines - 1.1%
|
Qantas Airways Ltd.(a) | | | | | | 106,500 | | | 414,468 |
Personal Care Products - 1.0%
|
Unilever PLC | | | | | | 7,100 | | | 389,699 |
Professional Services - 1.8%
|
Randstad NV | | | | | | 15,000 | | | 681,038 |
Semiconductors & Semiconductor
Equipment - 0.7%
|
Micron Technology, Inc. | | | | | | 1,900 | | | 249,907 |
Software - 3.8%
|
Workday, Inc. - Class A(a) | | | | | | 6,300 | | | 1,408,428 |
Technology Hardware, Storage &
Peripherals - 2.4%
|
Samsung Electronics Co. Ltd. | | | | | | 15,000 | | | 882,807 |
| | | | | | | | | | |
The accompanying notes are an integral part of these financial statements.
TABLE OF CONTENTS
Hotchkis & Wiley Global Value Fund
Schedule of Investments
as of June 30, 2024 (Continued)
| | | | | | | | | | |
COMMON STOCKS - (Continued)
|
Wireless Telecommunication Services - 0.7%
|
Vodafone Group PLC - ADR | | | | | | 30,372 | | | $269,400 |
TOTAL COMMON STOCKS
(Cost $31,406,968) | | | | | | | | | 36,650,795 |
| | | | | | Par | | | |
SHORT-TERM INVESTMENTS - 2.7%
|
Time Deposits - 2.7%
|
Citigroup, Inc., 2.59%, 07/01/2024(c) | | | EUR | | | 7 | | | 7 |
JPMorgan Chase & Company, 4.68%, 07/01/2024(c) | | | | | | 1,010,144 | | | 1,010,144 |
TOTAL SHORT-TERM
INVESTMENTS
(Cost $1,010,151) | | | | | | | | | 1,010,151 |
TOTAL INVESTMENTS - 100.2%
(Cost $32,417,119) | | | | | | | | | $37,660,946 |
Liabilities in Excess of Other
Assets - (0.2)% | | | | | | | | | (80,912) |
TOTAL NET
ASSETS - 100.0% | | | | | | | | | $37,580,034 |
| | | | | | | | | | |
Percentages are stated as a percent of net assets.
Par amount is in USD unless otherwise indicated.
The Global Industry Classification Standard (GICS®) was developed by MSCI, an independent provider of global indices and benchmark-related products and services, and Standard & Poor’s (S&P), an independent international financial data and investment services company. The GICS methodology has been widely accepted as an industry analysis framework for investment research, portfolio management and asset allocation. The GICS structure consists of 11 sectors, 25 industry groups, 74 industries and 163 sub-industries. Each stock that is classified will have a coding at all four of these levels.
ADR - American Depositary Receipt
AG - Aktiengesellschaft
EUR - Euro
NV - Naamloze Vennootschap
PLC - Public Limited Company
SA - Sociedad Anónima
(a)
| Non-income producing security. |
(b)
| Security is exempt from registration pursuant to Rule 144A under the Securities Act of 1933, as amended. These securities may only be resold in transactions exempt from registration to qualified institutional investors. As of June 30, 2024, the value of these securities total $494,753 or 1.3% of the Fund’s net assets. |
(c)
| Invested through a cash management account administered by Brown Brothers Harriman & Co. |
Allocation of Portfolio Holdings by Country as of June 30, 2024
| | | | |
United States | | | 56.4% |
United Kingdom | | | 9.6% |
France | | | 7.6% |
Netherlands | | | 6.6% |
Sweden | | | 4.5% |
Germany | | | 4.4% |
Korea | | | 2.4% |
Canada | | | 2.0% |
Puerto Rico | | | 1.5% |
Cash & Other | | | 5.0% |
| | | 100.0% |
| | | | |
The accompanying notes are an integral part of these financial statements.
TABLE OF CONTENTS
Hotchkis & Wiley International Value Fund
Schedule of Investments
as of June 30, 2024
| | | | | | | |
COMMON STOCKS - 97.9%
|
Aerospace & Defense - 7.2%
|
Airbus SE | | | 705 | | | $ 96,759 |
Babcock International Group PLC | | | 19,100 | | | 126,191 |
BAE Systems PLC | | | 2,290 | | | 38,143 |
| | | | | | 261,093 |
Automobile Components - 3.1%
|
Bayerische Motoren Werke AG | | | 376 | | | 33,201 |
Magna International, Inc. | | | 1,947 | | | 81,579 |
| | | | | | 114,780 |
Banks - 17.2%
| | | | | | |
ABN AMRO Bank NV(a) | | | 3,400 | | | 55,840 |
Barclays PLC | | | 22,417 | | | 59,235 |
BNP Paribas SA | | | 1,574 | | | 100,661 |
ING Groep NV | | | 5,907 | | | 101,498 |
Lloyds Banking Group PLC | | | 172,800 | | | 119,182 |
NatWest Group PLC | | | 18,814 | | | 74,016 |
Societe Generale SA | | | 3,341 | | | 78,551 |
UniCredit SpA | | | 1,005 | | | 37,191 |
| | | | | | 626,174 |
Beverages - 5.2%
| | | | | | |
Britvic PLC | | | 2,700 | | | 40,333 |
Coca-Cola Europacific Partners PLC | | | 550 | | | 40,079 |
Heineken Holding NV | | | 1,387 | | | 109,323 |
| | | | | | 189,735 |
Chemicals - 7.9%
| | | | | | |
Akzo Nobel NV | | | 1,510 | | | 92,034 |
Fuso Chemical Co. Ltd. | | | 3,900 | | | 99,866 |
Nippon Sanso Holdings Corp. | | | 3,300 | | | 98,000 |
| | | | | | 289,900 |
Communications Equipment - 5.7%
|
Nokia Oyj | | | 4,300 | | | 16,366 |
Telefonaktiebolaget LM Ericsson - Class B | | | 30,644 | | | 190,214 |
| | | | | | 206,580 |
Consumer Staples Distribution &
Retail - 0.6%
|
Tesco PLC | | | 5,738 | | | 22,164 |
Energy Equipment & Services - 1.1%
|
Subsea 7 SA | | | 2,200 | | | 41,286 |
Financial Services - 1.9%
|
Worldline SA/France(a)(b) | | | 6,200 | | | 67,565 |
Food Products - 0.7%
|
JDE Peet’s NV | | | 1,330 | | | 26,527 |
Health Care Equipment & Supplies - 4.3%
|
Koninklijke Philips NV(b) | | | 2,680 | | | 67,398 |
Medtronic PLC | | | 1,115 | | | 87,762 |
| | | | | | 155,160 |
Hotels, Restaurants & Leisure - 4.0%
|
Accor SA | | | 2,080 | | | 85,112 |
Entain PLC | | | 2,900 | | | 22,996 |
Lottomatica Group SpA | | | 3,000 | | | 36,209 |
| | | | | | 144,317 |
| | | | | | | |
| | | | | | | |
Household Products - 3.3%
|
Henkel AG & Co. KGaA | | | 1,510 | | | $118,802 |
Industrial Conglomerates - 5.1%
|
Siemens AG | | | 810 | | | 150,762 |
Smiths Group PLC | | | 1,700 | | | 36,578 |
| | | | | | 187,340 |
Insurance - 2.0%
|
Tokio Marine Holdings, Inc. | | | 1,100 | | | 41,337 |
Zurich Insurance Group AG | | | 59 | | | 31,429 |
| | | | | | 72,766 |
IT Services - 0.8%
|
Capgemini SE | | | 150 | | | 29,796 |
Machinery - 0.5%
| | | | | | |
CNH Industrial NV | | | 1,693 | | | 17,150 |
Media - 3.6%
| | | | | | |
RTL Group SA | | | 740 | | | 22,469 |
WPP PLC | | | 12,000 | | | 109,880 |
| | | | | | 132,349 |
Oil Gas & Consumable Fuels - 10.4%
|
Baytex Energy Corp. | | | 8,500 | | | 29,451 |
Cenovus Energy, Inc. | | | 1,670 | | | 32,825 |
Kosmos Energy Ltd.(b) | | | 15,618 | | | 86,524 |
Parkland Corp. | | | 510 | | | 14,296 |
Shell PLC | | | 3,787 | | | 136,470 |
Suncor Energy, Inc. | | | 1,200 | | | 45,744 |
TotalEnergies SE | | | 505 | | | 33,811 |
| | | | | | 379,121 |
Passenger Airlines - 2.8%
| | | | | | |
Qantas Airways Ltd.(b) | | | 26,700 | | | 103,909 |
Personal Care Products - 1.1%
| | | | | | |
Unilever PLC | | | 718 | | | 39,409 |
Pharmaceuticals - 0.9%
| | | | | | |
GSK PLC | | | 1,747 | | | 33,602 |
Professional Services - 2.7%
| | | | | | |
Randstad NV | | | 2,150 | | | 97,616 |
Semiconductors & Semiconductor
Equipment - 1.0%
|
Taiwan Semiconductor Manufacturing Co. Ltd. - ADR | | | 220 | | | 38,238 |
Technology Hardware, Storage &
Peripherals - 3.5%
|
Samsung Electronics Co. Ltd. | | | 2,180 | | | 128,301 |
Wireless Telecommunication
Services - 1.3%
|
Vodafone Group PLC | | | 52,546 | | | 46,495 |
TOTAL COMMON STOCKS
|
(Cost $3,138,081) | | | | | | 3,570,175 |
| | | | | | | |
The accompanying notes are an integral part of these financial statements.
TABLE OF CONTENTS
Hotchkis & Wiley International Value Fund
Schedule of Investments
as of June 30, 2024 (Continued)
| | | | | | | |
SHORT-TERM INVESTMENTS - 2.4%
|
Time Deposits - 2.4%
|
Citigroup, Inc., 4.68%, 07/01/2024(c) | | | 87,658 | | | $87,658 |
TOTAL SHORT-TERM INVESTMENTS
|
(Cost $87,658) | | | | | | 87,658 |
TOTAL INVESTMENTS - 100.3%
|
(Cost $3,225,739) | | | | | | $3,657,833 |
Liabilities in Excess of Other
Assets - (0.3)% | | | | | | (10,854) |
TOTAL NET ASSETS - 100.0% | | | | | | $3,646,979 |
| | | | | | | |
Percentages are stated as a percent of net assets.
The Global Industry Classification Standard (GICS®) was developed by MSCI, an independent provider of global indices and benchmark-related products and services, and Standard & Poor’s (S&P), an independent international financial data and investment services company. The GICS methodology has been widely accepted as an industry analysis framework for investment research, portfolio management and asset allocation. The GICS structure consists of 11 sectors, 25 industry groups, 74 industries and 163 sub-industries. Each stock that is classified will have a coding at all four of these levels.
ADR - American Depositary Receipt
AG - Aktiengesellschaft
NV - Naamloze Vennootschap
PLC - Public Limited Company
SA - Sociedad Anónima
(a)
| Security is exempt from registration pursuant to Rule 144A under the Securities Act of 1933, as amended. These securities may only be resold in transactions exempt from registration to qualified institutional investors. As of June 30, 2024, the value of these securities total $123,405 or 3.8% of the Fund’s net assets. |
(b)
| Non-income producing security. |
(c)
| Invested through a cash management account administered by Brown Brothers Harriman & Co. |
Allocation of Portfolio Holdings by Country as of June 30, 2024
| | | | |
United Kingdom | | | 22.4% |
Netherlands | | | 15.1% |
France | | | 13.6% |
United States | | | 9.9% |
Germany | | | 8.3% |
Japan | | | 6.6% |
Canada | | | 5.6% |
Sweden | | | 5.2% |
Korea | | | 3.5% |
Cash & Other | | | 9.8% |
| | | 100.0% |
| | | | |
The accompanying notes are an integral part of these financial statements.
TABLE OF CONTENTS
Hotchkis & Wiley International Small Cap Diversified Value Fund
Schedule of Investments
as of June 30, 2024
| | | | | | | | | | |
COMMON STOCKS - 95.8%
|
Aerospace & Defense - 1.2%
|
Austal Ltd. | | | | | | 10,300 | | | $17,081 |
Babcock International Group PLC | | | | | | 5,900 | | | 38,980 |
QinetiQ Group PLC | | | | | | 7,700 | | | 42,996 |
| | | | | | | | | 99,057 |
Air Freight & Logistics - 1.4%
| | | | | | | | | |
bpost SA | | | | | | 11,500 | | | 37,256 |
Hamakyorex Co. Ltd. | | | | | | 1,000 | | | 27,508 |
Trancom Co. Ltd. | | | | | | 1,100 | | | 44,764 |
| | | | | | | | | 109,528 |
Automobile Components - 2.3%
|
Exco Technologies Ltd. | | | | | | 2,800 | | | 16,272 |
Gestamp Automocion SA(a) | | | | | | 8,500 | | | 25,252 |
Linamar Corp. | | | | | | 470 | | | 22,843 |
Opmobility | | | | | | 1,600 | | | 15,571 |
Pacific Industrial Co. Ltd. | | | | | | 1,700 | | | 16,039 |
Toyota Boshoku Corp. | | | | | | 2,900 | | | 38,517 |
TS Tech Co. Ltd. | | | | | | 3,300 | | | 39,174 |
Valeo SE | | | | | | 1,300 | | | 13,901 |
| | | | | | | | | 187,569 |
Automobiles - 0.3%
| | | | | | | | | |
Kabe Group AB - Class B | | | | | | 600 | | | 20,606 |
Banks - 9.6%
| | | | | | | | | |
Aozora Bank Ltd. | | | | | | 2,600 | | | 42,593 |
Awa Bank Ltd. | | | | | | 2,400 | | | 42,435 |
Banca Sistema SpA(a) | | | | | | 14,300 | | | 21,931 |
Banco di Desio e della Brianza SpA | | | | | | 3,000 | | | 14,104 |
Bank Danamon Indonesia Tbk PT | | | | | | 152,300 | | | 23,984 |
Bank of East Asia Ltd. | | | | | | 30,578 | | | 38,776 |
Basellandschaftliche Kantonalbank | | | | | | 26 | | | 24,414 |
Caisse Regionale de Credit Agricole Mutuel Brie Picardie | | | | | | 700 | | | 12,819 |
Caisse Regionale de Credit Agricole Mutuel de Normandie-Seine | | | | | | 160 | | | 12,766 |
Caisse Regionale de Credit Agricole Mutuel de Paris et d’Ile-de-France | | | | | | 120 | | | 8,189 |
Caisse Regionale de Credit Agricole Mutuel Nord de France | | | | | | 800 | | | 10,626 |
Canadian Western Bank | | | | | | 2,100 | | | 66,590 |
Dah Sing Financial Holdings Ltd. | | | | | | 13,600 | | | 37,838 |
First Bank of Toyama Ltd. | | | | | | 2,300 | | | 18,340 |
Heartland Group Holdings Ltd. | | | | | | 40,500 | | | 24,432 |
Iyogin Holdings, Inc. | | | | | | 2,800 | | | 26,092 |
MyState Ltd. | | | | | | 6,800 | | | 16,924 |
Norion Bank AB(b) | | | | | | 6,200 | | | 25,633 |
Oma Saastopankki Oyj | | | | | | 1,000 | | | 15,395 |
Raiffeisen Bank International AG | | | | | | 2,200 | | | 38,008 |
Spar Nord Bank AS | | | | | | 1,300 | | | 25,029 |
SpareBank 1 Nord Norge | | | | | | 1,700 | | | 15,785 |
Sparebank 1 Oestlandet | | | | | | 2,000 | | | 25,403 |
SpareBank 1 SR-Bank ASA | | | | | | 1,300 | | | 15,922 |
Sparebanken More | | | | | | 2,100 | | | 16,558 |
Sparebanken Vest | | | | | | 3,400 | | | 39,818 |
Sparekassen Sjaelland-Fyn AS | | | | | | 500 | | | 16,165 |
Suruga Bank Ltd. | | | | | | 3,800 | | | 25,080 |
TOMONY Holdings, Inc. | | | | | | 9,900 | | | 26,055 |
Unicaja Banco SA(a) | | | | | | 17,500 | | | 24,060 |
| | | | | | | | | | |
| | | | | | | | | | |
Vestjysk Bank AS | | | | | | 37,700 | | | $24,243 |
| | | | | | | | | 776,007 |
Beverages - 0.6%
| | | | | | | | | |
AG Barr PLC | | | | | | 2,100 | | | 15,923 |
Britvic PLC | | | | | | 1,900 | | | 28,383 |
| | | | | | | | | 44,306 |
Building Products - 0.4%
| | | | | | | | | |
Sanko Metal Industrial Co. Ltd. | | | | | | 600 | | | 17,055 |
Schweiter Technologies AG | | | | | | 30 | | | 13,306 |
| | | | | | | | | 30,361 |
Capital Markets - 3.7%
| | | | | | | | | |
AGF Management Ltd. - Class B | | | | | | 3,900 | | | 24,089 |
Altshuler Shaham Finance Ltd. | | | | | | 12,700 | | | 16,294 |
AURELIUS Equity Opportunities SE & Co. KGaA | | | | | | 1,100 | | | 17,011 |
Azimut Holding SpA | | | | | | 913 | | | 21,518 |
CI Financial Corp. | | | | | | 2,400 | | | 25,262 |
HS Holdings Co. Ltd. | | | | | | 4,100 | | | 25,258 |
IG Group Holdings PLC | | | | | | 2,500 | | | 25,895 |
JAFCO Group Co. ltd | | | | | | 2,100 | | | 24,838 |
Jupiter Fund Management PLC | | | | | | 38,050 | | | 36,892 |
Man Group PLC/Jersey | | | | | | 12,500 | | | 38,193 |
Plus500 Ltd. | | | | | | 1,500 | | | 43,123 |
| | | | | | | | | 298,373 |
Chemicals - 2.5%
| | | | | | | | | |
C Uyemura & Co. Ltd. | | | | | | 400 | | | 27,785 |
Dai Nippon Toryo Co. Ltd. | | | | | | 5,400 | | | 44,452 |
Fuso Chemical Co. Ltd. | | | | | | 1,700 | | | 43,531 |
Soken Chemical & Engineering Co. Ltd. | | | | | | 1,400 | | | 23,761 |
Tessenderlo Group SA | | | | | | 917 | | | 23,235 |
Zeon Corp. | | | | | | 4,800 | | | 39,941 |
| | | | | | | | | 202,705 |
Commercial Services & Supplies - 1.6%
|
Aeon Delight Co. Ltd. | | | | | | 1,700 | | | 42,227 |
Dexterra Group, Inc. | | | | | | 4,100 | | | 16,034 |
DO & CO AG | | | | | | 150 | | | 26,702 |
Downer EDI Ltd. | | | | | | 10,300 | | | 31,593 |
ISS AS | | | | | | 900 | | | 15,453 |
| | | | | | | | | 132,009 |
Communications Equipment - 0.4%
|
Evertz Technologies Ltd. | | | | | | 1,500 | | | 13,596 |
Ituran Location and Control Ltd. | | | | | | 650 | | | 16,016 |
| | | | | | | | | 29,612 |
Construction & Engineering - 1.4%
|
Aecon Group, Inc. | | | | | | 1,500 | | | 18,618 |
Costain Group PLC | | | | | | 15,400 | | | 16,508 |
Fukuda Corp. | | | | | | 400 | | | 14,578 |
Hazama Ando Corp. | | | | | | 2,300 | | | 16,698 |
JGC Holdings Corp. | | | | | | 1,800 | | | 14,150 |
Novac Co. Ltd. | | | | | | 900 | | | 16,669 |
NRW Holdings Ltd. | | | | | | 8,000 | | | 16,400 |
| | | | | | | | | 113,621 |
Construction Materials - 1.0%
| | | | | | | | | |
Cementir Holding NV | | | | | | 1,500 | | | 14,974 |
Forterra PLC(a) | | | | | | 18,911 | | | 37,818 |
Shinagawa Refractories Co. Ltd. | | | | | | 1,900 | | | 23,565 |
| | | | | | | | | 76,357 |
| | | | | | | | | | |
The accompanying notes are an integral part of these financial statements.
TABLE OF CONTENTS
Hotchkis & Wiley International Small Cap Diversified Value Fund
Schedule of Investments
as of June 30, 2024 (Continued)
| | | | | | | | | | |
COMMON STOCKS - (Continued)
|
Consumer Finance - 1.2%
| | | | | | | | | |
Hoist Finance AB(a)(b) | | | | | | 4,900 | | | $24,780 |
International Personal Finance PLC | | | | | | 17,200 | | | 27,703 |
Resurs Holding AB(a) | | | | | | 14,800 | | | 31,977 |
Solvar Ltd. | | | | | | 19,100 | | | 14,537 |
| | | | | | | | | 98,997 |
Consumer Staples Distribution &
Retail - 0.6%
|
MARR SpA | | | | | | 2,000 | | | 26,039 |
Orsero SpA | | | | | | 1,800 | | | 24,188 |
| | | | | | | | | 50,227 |
Containers & Packaging - 1.1%
|
Fuji Seal International, Inc. | | | | | | 1,700 | | | 26,156 |
Mayr Melnhof Karton AG | | | | | | 200 | | | 24,126 |
Vetropack Holding AG | | | | | | 1,130 | | | 40,750 |
| | | | | | | | | 91,032 |
Distributors - 0.3%
| | | | | | | | | |
Inchcape PLC | | | | | | 2,400 | | | 22,553 |
Diversified Consumer Services - 0.3%
|
San Holdings, Inc. | | | | | | 3,300 | | | 24,258 |
Electric Utilities - 0.5%
| | | | | | | | | |
Elmera Group ASA(a) | | | | | | 13,500 | | | 40,840 |
Electrical Equipment - 0.9%
| | | | | | | | | |
Endo Lighting Corp. | | | | | | 4,000 | | | 38,343 |
Innovatec SpA(b) | | | | | | 35,500 | | | 37,702 |
| | | | | | | | | 76,045 |
Electronic Equipment, Instruments &
Components - 3.0%
|
Daitron Co. Ltd. | | | | | | 2,100 | | | 37,981 |
Esprinet SpA(b) | | | | | | 3,000 | | | 16,395 |
Horiba Ltd. | | | | | | 500 | | | 40,556 |
Nihon Dempa Kogyo Co. Ltd. | | | | | | 3,500 | | | 31,366 |
Sesa SpA | | | | | | 200 | | | 24,710 |
Shibaura Electronics Co. Ltd. | | | | | | 1,200 | | | 24,135 |
Shinko Shoji Co. Ltd. | | | | | | 4,100 | | | 24,087 |
Sun-Wa Technos Corp. | | | | | | 2,900 | | | 41,300 |
| | | | | | | | | 240,530 |
Energy Equipment & Services - 2.1%
|
Aker Solutions ASA | | | | | | 3,200 | | | 13,261 |
CES Energy Solutions Corp. | | | | | | 5,000 | | | 28,142 |
Enerflex Ltd. | | | | | | 3,000 | | | 16,184 |
Expro Group Holdings NV(b) | | | | | | 733 | | | 16,800 |
Pason Systems, Inc. | | | | | | 1,600 | | | 21,555 |
SBM Offshore NV | | | | | | 1,100 | | | 16,835 |
Schoeller-Bleckmann Oilfield Equipment AG | | | | | | 370 | | | 14,951 |
STEP Energy Services Ltd.(a)(b) | | | | | | 5,600 | | | 16,701 |
Technip Energies NV | | | | | | 1,000 | | | 22,466 |
| | | | | | | | | 166,895 |
Financial Services - 4.4%
| | | | | | | | | |
Australian Finance Group Ltd. | | | | | | 16,800 | | | 15,487 |
Banca IFIS SpA | | | | | | 2,000 | | | 41,534 |
Corp. Financiera Alba SA | | | | | | 300 | | | 16,386 |
Financial Partners Group Co. Ltd. | | | | | | 3,300 | | | 46,130 |
| | | | | | | | | | |
| | | | | | | | | | |
GRENKE AG | | | | | | 1,100 | | | $24,216 |
Kinnevik AB(b) | | | | | | 3,500 | | | 28,649 |
MCAN Mortgage Corp.
(Acquired 05/29/2024 – 05/29/2024,
Cost $24,434)(d) | | | | | | 2,100 | | | 24,714 |
OFX Group Ltd.(b) | | | | | | 30,200 | | | 44,376 |
OSB Group PLC | | | | | | 6,900 | | | 37,269 |
PayPoint PLC | | | | | | 2,400 | | | 19,424 |
Peugeot Invest SA | | | | | | 200 | | | 19,307 |
Worldline SA/France(a)(b) | | | | | | 3,100 | | | 33,783 |
| | | | | | | | | 351,275 |
Food Products - 2.6%
| | | | | | | | | |
Austevoll Seafood ASA | | | | | | 2,800 | | | 21,655 |
Cloetta AB - Class B | | | | | | 9,200 | | | 17,860 |
Elders Ltd. | | | | | | 4,600 | | | 24,950 |
Lassonde Industries, Inc. - Class A
(Acquired (05/11/2022 – 06/28/2023,
Cost $11,423)(d) | | | | | | 130 | | | 14,673 |
Nihon Shokuhin Kako Co. Ltd. | | | | | | 1,300 | | | 23,677 |
Origin Enterprises PLC | | | | | | 7,500 | | | 25,845 |
Premier Foods PLC | | | | | | 12,300 | | | 24,691 |
S Foods, Inc. | | | | | | 900 | | | 16,329 |
Savencia SA | | | | | | 230 | | | 12,563 |
Suedzucker AG | | | | | | 1,700 | | | 24,772 |
| | | | | | | | | 207,015 |
Gas Utilities - 0.5%
| | | | | | | | | |
Italgas SpA | | | | | | 7,900 | | | 39,013 |
Ground Transportation - 0.7%
|
Lindsay Australia Ltd. | | | | | | 41,117 | | | 24,119 |
Sakai Moving Service Co. Ltd. | | | | | | 1,100 | | | 17,461 |
Zigup PLC | | | | | | 3,000 | | | 15,961 |
| | | | | | | | | 57,541 |
Health Care Equipment & Supplies - 1.6%
|
El.En. SpA | | | | | | 2,200 | | | 22,089 |
Japan Lifeline Co. Ltd. | | | | | | 5,800 | | | 40,899 |
Paramount Bed Holdings Co. Ltd. | | | | | | 2,500 | | | 42,396 |
Riverstone Holdings Ltd. | | | | | | 36,900 | | | 26,333 |
| | | | | | | | | 131,717 |
Health Care Providers & Services - 0.9%
|
Charm Care Corp. KK | | | | | | 4,200 | | | 40,145 |
Oriola Oyj - Class B | | | | | | 16,200 | | | 15,715 |
Toho Holdings Co. Ltd. | | | | | | 700 | | | 18,359 |
| | | | | | | | | 74,219 |
Health Care Real Estate Investment
Trusts - 0.5%
|
NorthWest Healthcare Properties Real Estate Investment Trust | | | | | | 11,200 | | | 38,151 |
Health Care Technology - 0.4%
|
Software Service, Inc. | | | | | | 400 | | | 35,300 |
Hotels, Restaurants & Leisure - 0.6%
|
Fast Fitness Japan, Inc. | | | | | | 5,200 | | | 46,647 |
Household Durables - 0.5%
|
Kaufman & Broad SA | | | | | | 500 | | | 13,740 |
MJ Gleeson PLC | | | | | | 2,300 | | | 14,950 |
Redrow PLC | | | | | | 1,800 | | | 15,173 |
| | | | | | | | | 43,863 |
| | | | | | | | | | |
The accompanying notes are an integral part of these financial statements.
TABLE OF CONTENTS
Hotchkis & Wiley International Small Cap Diversified Value Fund
Schedule of Investments
as of June 30, 2024 (Continued)
| | | | | | | | | | |
COMMON STOCKS - (Continued)
|
Insurance - 7.1%
|
Beazley PLC | | | | | | 4,900 | | | $43,764 |
Brookfield Reinsurance Ltd. (b) | | | | | | 1,000 | | | 41,629 |
Chesnara PLC | | | | | | 5,200 | | | 16,236 |
Coface SA | | | | | | 2,700 | | | 37,589 |
Direct Line Insurance Group PLC | | | | | | 9,500 | | | 24,088 |
FBD Holdings PLC | | | | | | 1,700 | | | 23,213 |
Grupo Catalana Occidente SA | | | | | | 1,000 | | | 40,450 |
Harel Insurance Investments & Financial Services Ltd. | | | | | | 2,000 | | | 16,000 |
Hiscox Ltd. | | | | | | 1,700 | | | 24,676 |
IDI Insurance Co. Ltd. | | | | | | 600 | | | 15,462 |
Just Group PLC | | | | | | 20,000 | | | 26,547 |
Lancashire Holdings Ltd. | | | | | | 5,400 | | | 41,912 |
Menora Mivtachim Holdings Ltd. | | | | | | 600 | | | 14,376 |
Phoenix Holdings Ltd. | | | | | | 4,400 | | | 40,011 |
Protector Forsikring ASA | | | | | | 700 | | | 16,816 |
SCOR SE | | | | | | 1,400 | | | 35,488 |
Solid Forsakring AB | | | | | | 2,000 | | | 16,398 |
Steadfast Group Ltd. | | | | | | 6,700 | | | 27,498 |
Unipol Gruppo SpA | | | | | | 4,000 | | | 39,669 |
Vienna Insurance Group AG Wiener Versicherung Gruppe | | | | | | 460 | | | 14,996 |
Wuestenrot & Wuerttembergische AG | | | | | | 1,100 | | | 15,503 |
| | | | | | | | | 572,321 |
IT Services - 4.0%
| | | | | | | | | |
Argo Graphics, Inc. | | | | | | 600 | | | 17,919 |
Aubay | | | | | | 340 | | | 13,565 |
Computacenter PLC | | | | | | 700 | | | 25,294 |
Digital Hearts Holdings Co. Ltd. | | | | | | 2,400 | | | 15,534 |
Future Corp. | | | | | | 4,400 | | | 41,950 |
GFT Technologies SE | | | | | | 1,410 | | | 37,542 |
Indra Sistemas SA | | | | | | 1,100 | | | 22,588 |
Itfor, Inc. | | | | | | 2,800 | | | 25,155 |
KNOW IT AB | | | | | | 800 | | | 12,560 |
Mitsubishi Research Institute, Inc. | | | | | | 800 | | | 24,809 |
Pole To Win Holdings, Inc. | | | | | | 8,600 | | | 26,059 |
SB Technology Corp. | | | | | | 2,200 | | | 40,195 |
Sopra Steria Group | | | | | | 100 | | | 19,446 |
| | | | | | | | | 322,616 |
Leisure Products - 2.2%
|
Catana Group | | | | | | 7,100 | | | 32,674 |
Fountaine Pajot SA | | | | | | 100 | | | 10,870 |
Furyu Corp. | | | | | | 3,900 | | | 25,539 |
GLOBERIDE, Inc. | | | | | | 3,400 | | | 45,292 |
Kawai Musical Instruments Manufacturing Co. Ltd. | | | | | | 2,000 | | | 39,770 |
Spin Master Corp.(a) | | | | | | 1,200 | | | 24,727 |
| | | | | | | | | 178,872 |
Machinery - 9.0%
|
Bucher Industries AG | | | | | | 60 | | | 24,135 |
Danieli & C Officine Meccaniche SpA | | | | | | 900 | | | 25,601 |
Duerr AG | | | | | | 1,490 | | | 31,532 |
Hokuetsu Industries Co. Ltd. | | | | | | 1,900 | | | 28,357 |
Iveco Group NV | | | | | | 2,000 | | | 22,396 |
Komax Holding AG | | | | | | 140 | | | 20,270 |
Luxfer Holdings PLC | | | | | | 1,400 | | | 16,226 |
| | | | | | | | | | |
| | | | | | | | | | |
Morgan Advanced Materials PLC | | | | | | 4,300 | | | $16,724 |
Morita Holdings Corp. | | | | | | 3,900 | | | 45,529 |
NGK Insulators Ltd. | | | | | | 1,900 | | | 24,397 |
Norma Group SE | | | | | | 1,900 | | | 35,161 |
Obara Group, Inc. | | | | | | 900 | | | 23,384 |
Okamoto Machine Tool Works Ltd. | | | | | | 1,300 | | | 37,446 |
OKUMA Corp. | | | | | | 900 | | | 40,776 |
Pegasus Co. Ltd. | | | | | | 5,100 | | | 18,976 |
Rieter Holding AG | | | | | | 170 | | | 21,699 |
SFS Group AG | | | | | | 310 | | | 41,144 |
Stabilus SE | | | | | | 700 | | | 32,075 |
Stadler Rail AG | | | | | | 1,400 | | | 39,900 |
Takuma Co. Ltd. | | | | | | 3,900 | | | 40,273 |
Techno Smart Corp. | | | | | | 1,100 | | | 11,815 |
Tocalo Co. Ltd. | | | | | | 3,400 | | | 43,729 |
Tsugami Corp. | | | | | | 4,500 | | | 43,537 |
Vesuvius PLC | | | | | | 6,400 | | | 37,329 |
| | | | | | | | | 722,411 |
Media - 0.7%
| | | | | | | | | |
Atresmedia Corp. de Medios de Comunicacion SA | | | | | | 3,000 | | | 14,220 |
ReWorld Media SA(b) | | | | | | 5,100 | | | 11,591 |
RTL Group SA | | | | | | 500 | | | 15,182 |
Vector, Inc. | | | | | | 2,000 | | | 15,273 |
| | | | | | | | | 56,266 |
Metals & Mining - 1.2%
| | | | | | | | | |
Iluka Resources Ltd. | | | | | | 3,400 | | | 14,765 |
Maruichi Steel Tube Ltd. | | | | | | 600 | | | 13,945 |
Rana Gruber ASA | | | | | | 2,300 | | | 16,569 |
Stelco Holdings, Inc. | | | | | | 500 | | | 13,585 |
Vulcan Steel Ltd. | | | | | | 8,700 | | | 38,598 |
| | | | | | | | | 97,462 |
Multi-Utilities - 0.4%
| | | | | | | | | |
ACEA SpA | | | | | | 2,200 | | | 35,605 |
Oil Gas & Consumable Fuels - 4.5%
|
Ampol Ltd. | | | | | | 1,000 | | | 21,508 |
Baytex Energy Corp. | | | | | | 11,100 | | | 38,459 |
Birchcliff Energy Ltd. | | | | | | 5,600 | | | 24,602 |
Cardinal Energy Ltd.
(Acquired 05/04/2021 – 04/10/2024, Cost $34,579)(d) | | | | | | 8,200 | | | 40,159 |
EnQuest PLC(b) | | | | | | 74,700 | | | 12,823 |
Harbour Energy PLC | | | | | | 10,400 | | | 40,833 |
Kosmos Energy Ltd.(b) | | | | | | 6,900 | | | 38,226 |
NuVista Energy Ltd.
(Acquired 05/26/2023 – 05/26/2023, Cost $19,921)(b)(d) | | | | | | 2,400 | | | 24,947 |
Pantheon Resources PLC(b) | | | | | | 40,773 | | | 10,824 |
Tamarack Valley Energy Ltd. | | | | | | 14,200 | | | 38,716 |
Tullow Oil PLC(b) | | | | | | 88,149 | | | 35,702 |
Vermilion Energy, Inc. | | | | | | 3,400 | | | 37,429 |
| | | | | | | | | 364,228 |
Paper & Forest Products - 0.8%
|
Arctic Paper SA | | | | | | 2,800 | | | 16,979 |
Canfor Corp.(b) | | | | | | 1,500 | | | 15,910 |
Rottneros AB | | | | | | 12,000 | | | 13,291 |
Western Forest Products, Inc. | | | | | | 45,300 | | | 15,066 |
| | | | | | | | | 61,246 |
| | | | | | | | | | |
The accompanying notes are an integral part of these financial statements.
TABLE OF CONTENTS
Hotchkis & Wiley International Small Cap Diversified Value Fund
Schedule of Investments
as of June 30, 2024 (Continued)
| | | | | | | | | | |
COMMON STOCKS - (Continued)
|
Passenger Airlines - 0.3%
| | | | | | | | | |
Air Canada(b) | | | | | | 1,900 | | | $24,860 |
Personal Care Products - 0.4%
| | | | | | | | | |
PZ Cussons PLC | | | | | | 17,300 | | | 21,539 |
Shinnihonseiyaku Co. Ltd. | | | | | | 1,300 | | | 13,933 |
| | | | | | | | | 35,472 |
Pharmaceuticals - 0.3%
| | | | | | | | | |
Faes Farma SA | | | | | | 6,100 | | | 23,543 |
Professional Services - 6.6%
| | | | | | | | | |
AFRY AB | | | | | | 2,400 | | | 43,061 |
Altech Corp. | | | | | | 1,000 | | | 15,720 |
APM Human Services International Ltd | | | | | | 15,100 | | | 13,910 |
Bertrandt AG | | | | | | 410 | | | 12,865 |
Career Design Center Co. Ltd. | | | | | | 1,100 | | | 12,607 |
Creek & River Co. Ltd. | | | | | | 1,600 | | | 18,084 |
EJ Holdings, Inc. | | | | | | 2,200 | | | 26,179 |
FULLCAST Holdings Co. Ltd. | | | | | | 4,600 | | | 41,606 |
Hays PLC | | | | | | 30,900 | | | 36,812 |
Hito Communications Holdings, Inc. | | | | | | 4,200 | | | 24,876 |
McMillan Shakespeare Ltd. | | | | | | 1,500 | | | 17,548 |
Nisso Holdings Co. Ltd. | | | | | | 3,200 | | | 16,933 |
Openjobmetis SpA agenzia per il lavoro(b) | | | | | | 900 | | | 15,904 |
Pagegroup PLC | | | | | | 2,500 | | | 13,472 |
Pasco Corp. | | | | | | 1,900 | | | 21,402 |
Pasona Group, Inc. | | | | | | 1,200 | | | 15,785 |
PeopleIN Ltd. | | | | | | 30,800 | | | 16,659 |
Quick Co. Ltd. | | | | | | 1,200 | | | 16,528 |
RWS Holdings PLC | | | | | | 11,000 | | | 26,126 |
SmartGroup Corp. Ltd. | | | | | | 7,600 | | | 42,571 |
SThree PLC | | | | | | 3,000 | | | 15,558 |
Transcosmos, Inc. | | | | | | 2,000 | | | 43,264 |
Will Group, Inc. | | | | | | 4,100 | | | 25,257 |
| | | | | | | | | 532,727 |
Retail Real Estate Investment Trusts - 0.5%
|
SmartCentres Real Estate Investment Trust | | | | | | 2,600 | | | 41,792 |
Semiconductors & Semiconductor
Equipment - 1.9%
|
Inter Action Corp. | | | | | | 4,300 | | | 46,579 |
Melexis NV | | | | | | 250 | | | 21,443 |
Optorun Co. Ltd. | | | | | | 1,200 | | | 15,144 |
SK-Electronics Co. Ltd. | | | | | | 1,300 | | | 26,269 |
UMS Holdings Ltd. | | | | | | 46,225 | | | 40,075 |
| | | | | | | | | 149,510 |
Software - 1.5%
| | | | | | | | | |
Cresco Ltd. | | | | | | 5,600 | | | 46,484 |
F-Secure Oyj | | | | | | 7,300 | | | 15,140 |
Fukui Computer Holdings, Inc. | | | | | | 1,200 | | | 18,846 |
Silverlake Axis Ltd. | | | | | | 115,800 | | | 23,912 |
UNITED, Inc./Japan | | | | | | 3,400 | | | 17,043 |
| | | | | | | | | 121,425 |
Specialty Retail - 2.6%
| | | | | | | | | |
AutoCanada, Inc.(b) | | | | | | 2,800 | | | 39,358 |
Eagers Automotive Ltd. | | | | | | 3,600 | | | 25,076 |
Halfords Group PLC | | | | | | 14,000 | | | 24,759 |
MEKO AB | | | | | | 3,700 | | | 41,402 |
Shaver Shop Group Ltd. | | | | | | 16,500 | | | 12,878 |
| | | | | | | | | | |
| | | | | | | | | | |
Super Retail Group Ltd. | | | | | | 1,900 | | | $17,507 |
Vertu Motors PLC | | | | | | 24,700 | | | 22,449 |
Watches of Switzerland Group PLC(a)(b) | | | | | | 4,900 | | | 25,562 |
| | | | | | | | | 208,991 |
Textiles, Apparel & Luxury Goods - 0.7%
|
Dr Martens PLC | | | | | | 38,200 | | | 36,161 |
HUGO BOSS AG | | | | | | 500 | | | 22,481 |
| | | | | | | | | 58,642 |
Trading Companies & Distributors - 2.0%
|
Kamei Corp. | | | | | | 3,200 | | | 47,197 |
RS GROUP PLC | | | | | | 1,500 | | | 13,256 |
Wajax Corp. | | | | | | 900 | | | 16,848 |
Yamazen Corp. | | | | | | 4,700 | | | 41,629 |
Yuasa Trading Co. Ltd. | | | | | | 1,100 | | | 38,902 |
| | | | | | | | | 157,832 |
TOTAL COMMON STOCKS
|
(Cost $7,247,630) | | | | | | | | | 7,722,050 |
REAL ESTATE INVESTMENT TRUSTS - 1.9%
|
Health Care Real Estate Investment
Trusts - 1.9%
|
Aedifica SA | | | | | | 600 | | | 36,529 |
Assura PLC | | | | | | 81,000 | | | 41,058 |
HealthCo REIT | | | | | | 54,800 | | | 38,584 |
Primary Health Properties PLC | | | | | | 35,300 | | | 40,853 |
| | | | | | | | | 157,024 |
TOTAL REAL ESTATE INVESTMENT
TRUSTS
|
(Cost $163,464) | | | | | | | | | 157,024 |
| | | | | | Par | | | |
SHORT-TERM INVESTMENTS - 2.5%
|
Time Deposits - 2.5%
|
Citigroup, Inc., 4.68%, 07/01/2024(c) | | | | | | 202,563 | | | 202,563 |
Citigroup, Inc., 2.59%, 07/01/2024(c) | | | EUR | | | 20 | | | 21 |
TOTAL SHORT-TERM INVESTMENTS
|
(Cost $202,584) | | | | | | | | | 202,584 |
TOTAL INVESTMENTS - 100.2%
|
(Cost $7,613,678) | | | | | | | | | $8,081,658 |
Liabilities in Excess of Other
Assets - (0.2)% | | | | | | | | | (18,279) |
TOTAL NET ASSETS - 100.0% | | | | | | | | | $8,063,379 |
| | | | | | | | | | |
Percentages are stated as a percent of net assets.
Par amount is in USD unless otherwise indicated.
The Global Industry Classification Standard (GICS®) was developed by MSCI, an independent provider of global indices and benchmark-related products and services, and Standard & Poor’s (S&P), an independent international financial data and investment services company. The GICS methodology has been widely accepted as an industry analysis framework for investment research, portfolio management and asset allocation. The GICS structure consists of 11 sectors, 25 industry groups, 74 industries and 163 sub-industries. Each stock that is classified will have a coding at all four of these levels.
AG - Aktiengesellschaft
ASA - Advanced Subscription Agreement
EUR - Euro
NV - Naamloze Vennootschap
The accompanying notes are an integral part of these financial statements.
TABLE OF CONTENTS
Hotchkis & Wiley International Small Cap Diversified Value Fund
Schedule of Investments
as of June 30, 2024 (Continued)
PLC - Public Limited Company
SA - Sociedad Anónima
(a)
| Security is exempt from registration pursuant to Rule 144A under the Securities Act of 1933, as amended. These securities may only be resold in transactions exempt from registration to qualified institutional investors. As of June 30, 2024, the value of these securities total $307,431 or 3.8% of the Fund’s net assets. |
(b)
| Non-income producing security. |
(c)
| Invested through a cash management account administered by Brown Brothers Harriman & Co. |
(d)
| Restricted security. Purchased in a private placement transaction; resale to the public may require registration. As of June 30, 2024, the value of these securities total $104,493 or 1.3% of the Fund’s net assets. |
Allocation of Portfolio Holdings by Country as of June 30, 2024
| | | | |
Japan | | | 32.4% |
United Kingdom | | | 13.8% |
Canada | | | 9.9% |
Australia | | | 6.1% |
Italy | | | 5.3% |
France | | | 4.2% |
Sweden | | | 3.4% |
Germany | | | 3.1% |
Switzerland | | | 2.8% |
Cash & Other | | | 19.0% |
| | | 100.0% |
| | | | |
The accompanying notes are an integral part of these financial statements.
TABLE OF CONTENTS
Hotchkis & Wiley Value Opportunities Fund
Schedule of Investments
as of June 30, 2024
| | | | | | | |
COMMON STOCKS - 95.0%
|
Aerospace & Defense - 1.0%
|
Babcock International Group PLC | | | | | | 957,700 | | | $6,327,366 |
Automobiles - 3.1%
| |
General Motors Co. | | | | | | 435,200 | | | 20,219,392 |
Banks - 7.7%
| | | | | | | | | |
Citigroup, Inc. | | | | | | 146,900 | | | 9,322,274 |
Citizens Financial Group, Inc. | | | | | | 153,800 | | | 5,541,414 |
ING Groep NV - ADR | | | | | | 361,800 | | | 6,201,252 |
Popular, Inc. | | | | | | 164,600 | | | 14,555,578 |
Wells Fargo & Co. | | | | | | 245,960 | | | 14,607,564 |
| | | | | | | | | 50,228,082 |
Broadline Retail - 0.2%
| | | | | | | | | |
Articore Group Ltd.(a) | | | | | | 4,782,949 | | | 1,324,139 |
Capital Markets - 4.5%
| | | | | | | | | |
Bank of New York Mellon Corp. | | | | | | 85,500 | | | 5,120,595 |
Goldman Sachs Group, Inc. | | | | | | 32,200 | | | 14,564,704 |
Morgan Stanley | | | | | | 50,700 | | | 4,927,533 |
State Street Corp. | | | | | | 65,100 | | | 4,817,400 |
| | | | | | | | | 29,430,232 |
Chemicals - 6.0%
| | | | | | | | | |
Ecovyst, Inc.(a) | | | | | | 1,304,800 | | | 11,704,056 |
Iracore Investments Holdings, Inc. (Acquired 04/13/2017,
Cost $6,892,250)(b)(c)(j) | | | | | | 32,422 | | | 10,980,683 |
Olin Corp. | | | | | | 323,100 | | | 15,234,165 |
UTEX Industries, Inc. (Acquired 05/11/2021, Cost $757,278)(j) | | | | | | 24,058 | | | 1,503,625 |
| | | | | | | | | 39,422,529 |
Communications Equipment - 13.2%
|
F5, Inc.(a) | | | | | | 257,190 | | | 44,295,834 |
Telefonaktiebolaget LM Ericsson - ADR(d) | | | | | | 6,808,900 | | | 42,010,913 |
| | | | | | | | | 86,306,747 |
Construction & Engineering - 1.7%
|
Fluor Corp.(a) | | | | | | 251,700 | | | 10,961,535 |
Consumer Finance - 2.5%
|
Capital One Financial Corp. | | | | | | 28,200 | | | 3,904,290 |
Discover Financial Services | | | | | | 27,400 | | | 3,584,194 |
SLM Corp. | | | | | | 432,900 | | | 8,999,991 |
| | | | | | | | | 16,488,475 |
Electronic Equipment, Instruments &
Components - 3.5%
|
Arrow Electronics, Inc.(a) | | | | | | 189,200 | | | 22,847,792 |
Energy Equipment & Services - 6.3%
|
Baker Hughes Co. | | | | | | 585,300 | | | 20,585,001 |
Mcdermott International Ltd.(a) | | | | | | 832,402 | | | 241,397 |
NOV, Inc. | | | | | | 1,056,800 | | | 20,089,768 |
| | | | | | | | | 40,916,166 |
Ground Transportation - 1.8%
|
U-Haul Holding Co. | | | | | | 191,200 | | | 11,475,824 |
| | | | | | | | | | |
| | | | | | | |
Health Care Equipment & Supplies - 3.9%
|
GE HealthCare Technologies, Inc. | | | | | | 103,500 | | | $8,064,720 |
Medtronic PLC | | | | | | 220,800 | | | 17,379,168 |
| | | | | | | | | 25,443,888 |
Health Care Providers & Services - 3.7%
|
CVS Health Corp. | | | | | | 148,000 | | | 8,740,880 |
Elevance Health, Inc. | | | | | | 28,500 | | | 15,443,010 |
| | | | | | | | | 24,183,890 |
Hotels, Restaurants & Leisure - 1.5%
|
Lottomatica Group SpA | | | | | | 259,500 | | | 3,132,087 |
Marriott Vacations Worldwide Corp. | | | | | | 77,100 | | | 6,732,372 |
| | | | | | | | | 9,864,459 |
Industrial Conglomerates - 4.8%
|
Siemens AG | | | | | | 108,900 | | | 20,269,069 |
Siemens AG - ADR | | | | | | 117,300 | | | 10,938,225 |
| | | | | | | | | 31,207,294 |
Insurance - 1.5% | | | | | | | | | |
Enstar Group Ltd.(a) | | | | | | 21,200 | | | 6,480,840 |
Global Indemnity Group LLC - Class A | | | | | | 102,500 | | | 3,186,274 |
| | | | | | | | | 9,667,114 |
Interactive Media & Services - 1.7%
|
Alphabet, Inc. - Class A | | | | | | 60,100 | | | 10,947,215 |
Media - 5.2%
| | | | | | | | | |
Comcast Corp. - Class A | | | | | | 166,800 | | | 6,531,888 |
National CineMedia, Inc.(a)(d) | | | | | | 839,300 | | | 3,684,527 |
Stagwell, Inc.(a) | | | | | | 2,844,600 | | | 19,400,172 |
WPP PLC - ADR(d) | | | | | | 100,900 | | | 4,619,202 |
| | | | | | | | | 34,235,789 |
Metals & Mining - 0.0%(e)
| | | | | | | | | |
Metals Recovery Holdings LLC
(Acquired 07/24/2014 – 12/10/2019, Cost $6,965,758)(a)(b)(j) | | | | | | 7,042 | | | 4,225 |
Multi-Utilities - 0.3%
| | | | | | | | | |
Dominion Energy, Inc. | | | | | | 42,600 | | | 2,087,400 |
Oil Gas & Consumable Fuels - 6.1%
|
APA Corp. | | | | | | 227,800 | | | 6,706,432 |
Kosmos Energy Ltd.(a) | | | | | | 2,071,800 | | | 11,477,772 |
Shell PLC - ADR | | | | | | 298,600 | | | 21,552,948 |
| | | | | | | | | 39,737,152 |
Passenger Airlines - 1.8%
| | | | | | | |
Qantas Airways Ltd.(a) | | | | | | 2,934,820 | | | 11,421,484 |
Professional Services - 2.0%
| | | | | | | |
Randstad NV | | | | | | 290,600 | | | 13,193,986 |
Semiconductors & Semiconductor
Equipment - 0.8%
|
Micron Technology, Inc. | | | | | | 41,300 | | | 5,432,189 |
Software - 6.8%
| | | | | | | |
Microsoft Corp. | | | | | | 29,610 | | | 13,234,189 |
Workday, Inc. - Class A(a) | | | | | | 140,400 | | | 31,387,824 |
| | | | | | | | | 44,622,013 |
Tobacco - 2.7%
| | | | | | | |
Philip Morris International, Inc. | | | | | | 176,800 | | | 17,915,144 |
| | | | | | | | | | |
The accompanying notes are an integral part of these financial statements.
TABLE OF CONTENTS
Hotchkis & Wiley Value Opportunities Fund
Schedule of Investments
as of June 30, 2024 (Continued)
| | | | | | | |
COMMON STOCKS - (Continued)
|
Trading Companies & Distributors - 0.7%
|
WESCO International, Inc. | | | | | | 29,600 | | | $4,692,192 |
TOTAL COMMON STOCKS
(Cost $549,982,636) | | | | | | | | | 620,603,713 |
PREFERRED STOCKS - 0.9%
| | | | | | | | | |
Financial Services - 0.9%
| | | | | | | |
Federal Home Loan Mortgage Corp.
| | | | | | | | | |
Series K, Perpetual(a) | | | | | | 33,300 | | | 235,764 |
Series N, Perpetual(a) | | | | | | 116,400 | | | 813,636 |
Series S, Perpetual(a) | | | | | | 18,400 | | | 131,560 |
Series Z, Perpetual(a) | | | | | | 920,700 | | | 4,419,360 |
TOTAL PREFERRED STOCKS (Cost $2,429,497) | | | | | | | | | 5,600,320 |
| | | | | | Par | | | |
BANK LOANS - 0.6%
| | | | | | | |
Chemicals - 0.4%
| | | | |
Iracore International Holdings, Inc., 14.46%, (3 mo. Term SOFR + 9.00%), 04/12/2026 (Acquired 04/13/2017, Cost $2,649,013)(b)(j) | | | | | | 2,649,013 | | | 2,649,013 |
Energy Equipment & Services - 0.2%
|
Lealand Finance Co. BV-First Lien
| | | | | | | |
8.43% (1 mo. Term SOFR + 3.00%), 06/30/2024 (Acquired 06/30/2020, Cost $442,883)(j) | | | | | | 442,883 | | | 232,513 |
6.44% (1 mo. Term SOFR + 4.00%), 06/30/2025 (Acquired
06/30/2020 – 06/28/2024,
Cost $1,498,942)(j) | | | | | | 1,459,175 | | | 693,108 |
| | | | | | | | | 925,621 |
TOTAL BANK LOANS
(Cost $4,590,838) | | | | | | | | | 3,574,634 |
| | | | | | | | | | |
| | | | | | | | | | |
PURCHASED OPTIONS - 0.5%(f)(g)
|
Put Options - 0.5%
|
Asana, Inc., Expiration: 01/17/2025; Exercise Price: $30.00(a) | | | 979,300 | | | 700 | | | 1,158,500 |
iShares China Large-Cap ETF, Expiration: 01/17/2025; Exercise Price: $29.85(a) | | | 4,626,220 | | | 1,780 | | | 849,950 |
iShares U.S. Real Estate ETF, Expiration: 01/16/2026; Exercise Price: $70.00(a) | | | 17,548,000 | | | 2,000 | | | 600,000 |
Tesla, Inc., Expiration: 06/18/2026; Exercise Price: $200.00(a) | | | 3,700,356 | | | 187 | | | 914,430 |
Total Put Options | | | | | | | | | 3,522,880 |
TOTAL PURCHASED OPTIONS
| |
(Cost $3,971,843) | | | | | | | | | 3,522,880 |
| | | | | | | | | | |
| | | | | | | | | | |
SHORT-TERM INVESTMENTS - 6.1%
|
Money Market Funds - 3.0%
|
Invesco Government & Agency Portfolio - Class Institutional, 5.23%(h) | | | | | | 19,390,797 | | | 19,390,797 |
| | | | | | | | | | |
| | | | | | | | | | |
Time Deposits - 3.1%
|
Australia and New Zealand Banking Group Ltd., 4.68%, 07/01/2024(i) | | | | | | 20,488,293 | | | $20,488,293 |
Citigroup, Inc., 2.59%, 07/01/2024(i) | | | EUR | | | 140 | | | 150 |
Royal Bank of Canada,
4.16%, 07/01/2024(i) | | | GBP | | | 1 | | | 1 |
| | | | | | | | | 20,488,444 |
TOTAL SHORT-TERM INVESTMENTS
(Cost $39,879,243) | | | | | | | | | 39,879,241 |
TOTAL INVESTMENTS - 103.1%
|
(Cost $600,854,057) | | | | | | | | | $673,180,788 |
Liabilities in Excess of Other
Assets - (3.1)% | | | | | | | | | (20,072,071) |
TOTAL NET
ASSETS - 100.0% | | | | | | | | | $653,108,717 |
| | | | | | | | | | |
Percentages are stated as a percent of net assets.
Par amount is in USD unless otherwise indicated.
The Global Industry Classification Standard (GICS®) was developed by MSCI, an independent provider of global indices and benchmark-related products and services, and Standard & Poor’s (S&P), an independent international financial data and investment services company. The GICS methodology has been widely accepted as an industry analysis framework for investment research, portfolio management and asset allocation. The GICS structure consists of 11 sectors, 25 industry groups, 74 industries and 163 sub-industries. Each stock that is classified will have a coding at all four of these levels.
ADR - American Depositary Receipt
AG - Aktiengesellschaft
NV - Naamloze Vennootschap
EUR - Euro
GBP - British Pound
PLC - Public Limited Company
SOFR - Secured Overnight Financing Rate
(a)
| Non-income producing security.
|
(b)
| Fair value determined using significant unobservable inputs in accordance with procedures established by and under the supervision of the Adviser, acting as Valuation Designee. These securities represented $13,633,921 or 2.1% of net assets as of June 30, 2024.
|
(c)
| Affiliated company as defined by the Investment Company Act of 1940. See Note 6.
|
(d)
| All or a portion of this security is on loan as of June 30, 2024. The total market value of these securities was $18,990,598 which represented 2.9% of net assets.
|
(e)
| Represents less than 0.05% of net assets.
|
(g)
| 100 shares per contract.
|
(h)
| The rate shown represents the 7-day effective yield as of June 30, 2024.
|
(i)
| Invested through a cash management account administered by Brown Brothers Harriman & Co.
|
(j)
| Restricted security. Purchased in a private placement transaction; resale to the public may require registration. As of June 30, 2024, the value of these securities total $16,063,167 or 2.5% of the Fund’s net assets. |
The accompanying notes are an integral part of these financial statements.
TABLE OF CONTENTS
Hotchkis & Wiley High Yield Fund
Schedule of Investments
as of June 30, 2024
| | | | | | | |
CORPORATE BONDS - 89.0%
|
Advertising - 0.7%
|
Stagwell Global LLC,
5.63%, 08/15/2029(a) | | | $6,741,000 | | | $6,231,637 |
Aerospace/Defense - 2.5%
| | | | | | |
F-Brasile SpA / F-Brasile US LLC,
7.38%, 08/15/2026(a) | | | 4,657,000 | | | 4,616,810 |
Spirit AeroSystems, Inc.
| | | | | | |
9.38%, 11/30/2029(a) | | | 2,510,000 | | | 2,705,496 |
9.75%, 11/15/2030(a) | | | 4,458,000 | | | 4,923,264 |
TransDigm, Inc.
| | | | | | |
6.88%, 12/15/2030(a) | | | 2,365,000 | | | 2,416,309 |
7.13%, 12/01/2031(a) | | | 7,273,000 | | | 7,503,023 |
| | | | | | 22,164,902 |
Auto Parts & Equipment - 3.0%
|
Adient Global Holdings Ltd.,
8.25%, 04/15/2031(a) | | | 4,306,000 | | | 4,498,306 |
American Axle & Manufacturing, Inc.,
6.88%, 07/01/2028 | | | 5,342,000 | | | 5,336,645 |
Borgwarner Jersey Ltd.,
5.00%, 10/01/2025(a) | | | 1,596,000 | | | 1,542,606 |
Clarios Global LP / Clarios US Finance Co., 6.75%, 05/15/2028(a) | | | 4,389,000 | | | 4,445,807 |
Goodyear Tire & Rubber Co.,
5.25%, 07/15/2031 | | | 3,393,000 | | | 3,092,166 |
Phinia, Inc., 6.75%, 04/15/2029(a) | | | 3,051,000 | | | 3,100,093 |
ZF North America Capital, Inc.,
6.88%, 04/23/2032(a) | | | 4,565,000 | | | 4,722,401 |
| | | | | | 26,738,024 |
Banking - 1.1%
| | | | | | |
ING Groep NV, 6.50% to 04/16/2025 then 5 yr. Swap Rate USD + 4.45%, Perpetual(j) | | | 2,892,000 | | | 2,869,661 |
Popular, Inc., 7.25%, 03/13/2028 | | | 3,628,000 | | | 3,728,913 |
Texas Capital Bancshares, Inc.,
4.00% to 05/06/2026 then 5 yr. CMT Rate + 3.15%, 05/06/2031(j) | | | 3,400,000 | | | 3,082,684 |
| | | | | | 9,681,258 |
Brokerage - 0.6%
| | | | | | |
StoneX Group, Inc., 7.88%, 03/01/2031(a) | | | 5,265,000 | | | 5,434,491 |
Building & Construction - 2.6%
|
Adams Homes, Inc.,
9.25%, 10/15/2028(a) | | | 4,382,000 | | | 4,499,372 |
Brookfield Residential Properties, Inc. / Brookfield Residential US LLC,
4.88%, 02/15/2030(a) | | | 4,782,000 | | | 4,282,577 |
Great Lakes Dredge & Dock Corp.,
5.25%, 06/01/2029(a) | | | 5,476,000 | | | 4,892,740 |
Installed Building Products, Inc.,
5.75%, 02/01/2028(a) | | | 4,671,000 | | | 4,573,192 |
Weekley Homes LLC / Weekley Finance Corp., 4.88%, 09/15/2028(a) | | | 5,173,000 | | | 4,796,617 |
| | | | | | 23,044,498 |
Building Materials - 2.8%
| | | | | | |
Arcosa, Inc., 4.38%, 04/15/2029(a) | | | 4,947,000 | | | 4,598,555 |
BlueLinx Holdings, Inc.,
6.00%, 11/15/2029(a) | | | 6,181,000 | | | 5,753,576 |
Knife River Corp.,
7.75%, 05/01/2031(a) | | | 4,427,000 | | | 4,631,670 |
| | | | | | | |
| | | | | | | |
Masterbrand, Inc.,
7.00%, 07/15/2032(a) | | | $4,445,000 | | | $4,498,232 |
Standard Industries, Inc./NJ,
4.38%, 07/15/2030(a) | | | 6,710,000 | | | 6,068,202 |
| | | | | | 25,550,235 |
Cable & Satellite TV - 5.5%
| | | | | | |
Block Communications, Inc.,
4.88%, 03/01/2028(a) | | | 5,858,000 | | | 5,250,773 |
Cable One, Inc., 4.00%, 11/15/2030(a) | | | 5,983,000 | | | 4,470,375 |
CCO Holdings LLC / CCO Holdings
Capital Corp.
| | | | | | |
5.38%, 06/01/2029(a) | | | 9,877,000 | | | 8,994,880 |
4.75%, 02/01/2032(a) | | | 11,380,000 | | | 9,328,135 |
CSC Holdings LLC
| | | | | | |
11.75%, 01/31/2029(a) | | | 2,414,000 | | | 2,060,298 |
5.75%, 01/15/2030(a) | | | 11,102,000 | | | 4,199,638 |
Directv Financing LLC / Directv Financing Co.-Obligor, Inc.,
5.88%, 08/15/2027(a) | | | 3,006,000 | | | 2,829,913 |
DISH Network Corp.,
11.75%, 11/15/2027(a) | | | 2,145,000 | | | 2,105,198 |
Telenet Finance Luxembourg Notes Sarl, 5.50%, 03/01/2028(a) | | | 4,800,000 | | | 4,563,271 |
Ziggo BV, 4.88%, 01/15/2030(a) | | | 6,578,000 | | | 5,858,586 |
| | | | | | 49,661,067 |
Chemicals - 4.6%
| | | | | | |
Axalta Coating Systems Dutch Holding B BV, 7.25%, 02/15/2031(a) | | | 2,752,000 | | | 2,861,238 |
Illuminate Buyer LLC / Illuminate
Holdings IV, Inc., 9.00%, 07/01/2028(a) | | | 2,991,000 | | | 3,017,976 |
LSF11 A5 HoldCo LLC,
6.63%, 10/15/2029(a) | | | 5,388,000 | | | 5,105,642 |
NOVA Chemicals Corp.
| | | | | | |
8.50%, 11/15/2028(a) | | | 4,072,000 | | | 4,326,003 |
9.00%, 02/15/2030(a) | | | 2,211,000 | | | 2,335,517 |
Rain Carbon, Inc., 12.25%, 09/01/2029(a) | | | 3,538,000 | | | 3,812,312 |
SCIH Salt Holdings, Inc.,
4.88%, 05/01/2028(a) | | | 3,576,000 | | | 3,330,549 |
SCIL IV LLC / SCIL USA Holdings LLC,
5.38%, 11/01/2026(a) | | | 5,377,000 | | | 5,205,083 |
Trinseo Materials Operating SCA / Trinseo Materials Finance, Inc.,
5.13%, 04/01/2029(a) | | | 8,122,000 | | | 3,182,762 |
WR Grace Holdings LLC
| | | | | | |
5.63%, 08/15/2029(a) | | | 6,470,000 | | | 5,970,195 |
7.38%, 03/01/2031(a) | | | 1,995,000 | | | 2,024,195 |
| | | | | | 41,171,472 |
Consumer/Commercial/Lease
Financing - 2.6%
|
Burford Capital Global Finance LLC,
9.25%, 07/01/2031(a) | | | 6,398,000 | | | 6,741,835 |
Macquarie Airfinance Holdings Ltd.,
8.38%, 05/01/2028(a) | | | 4,405,000 | | | 4,647,478 |
Nationstar Mortgage Holdings, Inc.,
7.13%, 02/01/2032(a) | | | 4,652,000 | | | 4,684,415 |
PennyMac Financial Services, Inc.,
7.88%, 12/15/2029(a) | | | 4,541,000 | | | 4,686,098 |
Upbound Group, Inc.,
6.38%, 02/15/2029(a) | | | 3,031,000 | | | 2,910,248 |
| | | | | | 23,670,074 |
| | | | | | | |
The accompanying notes are an integral part of these financial statements.
TABLE OF CONTENTS
Hotchkis & Wiley High Yield Fund
Schedule of Investments
as of June 30, 2024 (Continued)
| | | | | | | |
CORPORATE BONDS - (Continued)
|
Consumer-Products - 0.8%
| | | | | | |
Acushnet Co., 7.38%, 10/15/2028(a) | | | $2,194,000 | | | $2,275,408 |
Winnebago Industries, Inc.,
6.25%, 07/15/2028(a) | | | 5,372,000 | | | 5,293,665 |
| | | | | | 7,569,073 |
Diversified Capital Goods - 2.9%
|
EMRLD Borrower LP / Emerald Co.-Issuer, Inc., 6.63%, 12/15/2030(a) | | | 7,346,000 | | | 7,412,496 |
Patrick Industries, Inc.,
4.75%, 05/01/2029(a) | | | 5,586,000 | | | 5,152,645 |
Railworks Holdings LP / Railworks Rally, Inc., 8.25%, 11/15/2028(a) | | | 4,383,000 | | | 4,464,677 |
TK Elevator Holdco GmbH,
7.63%, 07/15/2028(a) | | | 8,708,000 | | | 8,650,678 |
| | | | | | 25,680,496 |
Electric-Generation - 0.6%
| | | | | | |
Vistra Operations Co. LLC,
6.88%, 04/15/2032(a) | | | 5,695,000 | | | 5,785,761 |
Electric-Integrated - 0.3%
| | | | | | |
PG&E Corp., 5.25%, 07/01/2030 | | | 2,395,000 | | | 2,289,107 |
Electronics - 1.0%
| | | | | | |
Coherent Corp., 5.00%, 12/15/2029(a) | | | 4,415,000 | | | 4,182,836 |
Sensata Technologies, Inc.,
6.63%, 07/15/2032(a) | | | 4,531,000 | | | 4,566,537 |
| | | | | | 8,749,373 |
Energy - Exploration & Production - 3.5%
|
California Resources Corp.,
7.13%, 02/01/2026(a) | | | 3,649,000 | | | 3,660,246 |
Chesapeake Energy Corp.,
6.75%, 04/15/2029(a) | | | 4,574,000 | | | 4,586,725 |
Civitas Resources, Inc.
| | | | | | |
5.00%, 10/15/2026(a) | | | 2,777,000 | | | 2,705,987 |
8.75%, 07/01/2031(a) | | | 2,987,000 | | | 3,202,661 |
Hilcorp Energy I LP / Hilcorp Finance Co., 6.00%, 02/01/2031(a) | | | 4,713,000 | | | 4,515,924 |
Kosmos Energy Ltd.,
7.50%, 03/01/2028(a) | | | 2,320,000 | | | 2,215,315 |
Matador Resources Co.
| | | | | | |
6.88%, 04/15/2028(a) | | | 2,691,000 | | | 2,734,721 |
6.50%, 04/15/2032(a) | | | 918,000 | | | 918,752 |
Permian Resources Operating LLC,
8.00%, 04/15/2027(a) | | | 4,427,000 | | | 4,530,570 |
Talos Production, Inc.,
9.38%, 02/01/2031(a) | | | 2,140,000 | | | 2,260,867 |
| | | | | | 31,331,768 |
Food - Wholesale - 0.9%
| | | | | | |
Central Garden & Pet Co.,
4.13%, 04/30/2031(a) | | | 3,863,000 | | | 3,410,575 |
HLF Financing Sarl LLC / Herbalife International, Inc.,
4.88%, 06/01/2029(a) | | | 2,330,000 | | | 1,616,529 |
US Foods, Inc., 7.25%, 01/15/2032(a) | | | 3,267,000 | | | 3,394,550 |
| | | | | | 8,421,654 |
Forestry/Paper - 2.1%
| | | | | | |
Ahlstrom Holding 3 Oy,
4.88%, 02/04/2028(a) | | | 4,780,000 | | | 4,477,964 |
| | | | | | | |
| | | | | | | |
Mativ Holdings, Inc.,
6.88%, 10/01/2026(a) | | | $5,894,000 | | | $5,862,689 |
Mercer International, Inc.
| | | | | | |
12.88%, 10/01/2028(a) | | | 885,000 | | | 953,091 |
5.13%, 02/01/2029 | | | 5,791,000 | | | 5,102,458 |
Rayonier AM Products, Inc.,
7.63%, 01/15/2026(a) | | | 2,182,000 | | | 2,047,981 |
| | | | | | 18,444,183 |
Gaming - 3.9%
| | | | | | |
Allwyn Entertainment Financing UK PLC, 7.88%, 04/30/2029(a) | | | 4,457,000 | | | 4,607,936 |
Boyd Gaming Corp.,
4.75%, 06/15/2031(a) | | | 4,391,000 | | | 3,982,638 |
Everi Holdings, Inc.,
5.00%, 07/15/2029(a) | | | 6,570,000 | | | 6,467,449 |
Jacobs Entertainment, Inc.,
6.75%, 02/15/2029(a) | | | 5,408,000 | | | 5,019,733 |
MGM Resorts International,
6.50%, 04/15/2032 | | | 4,771,000 | | | 4,752,081 |
Penn Entertainment, Inc.,
5.63%, 01/15/2027(a) | | | 5,350,000 | | | 5,168,972 |
Scientific Games Holdings LP/Scientific Games US FinCo, Inc.,
6.63%, 03/01/2030(a) | | | 5,120,000 | | | 4,994,491 |
| | | | | | 34,993,300 |
Gas Distribution - 4.5%
| | | | | | |
Antero Midstream Partners LP / Antero Midstream Finance Corp.,
5.75%, 03/01/2027(a) | | | 5,209,000 | | | 5,170,182 |
CQP Holdco LP / BIP-V Chinook Holdco LLC, 7.50%, 12/15/2033(a) | | | 4,620,000 | | | 4,795,712 |
DT Midstream, Inc., 4.38%, 06/15/2031(a) | | | 5,297,000 | | | 4,828,155 |
EQM Midstream Partners LP,
7.50%, 06/01/2027(a) | | | 6,117,000 | | | 6,251,305 |
Harvest Midstream I LP,
7.50%, 09/01/2028(a) | | | 5,526,000 | | | 5,619,108 |
ITT Holdings LLC, 6.50%,
08/01/2029(a) | | | 2,538,000 | | | 2,301,410 |
Kinetik Holdings LP, 5.88%, 06/15/2030(a) | | | 4,297,000 | | | 4,236,995 |
Venture Global LNG, Inc.,
9.88%, 02/01/2032(a) | | | 6,428,000 | | | 7,000,413 |
| | | | | | 40,203,280 |
Health Facilities - 1.6%
| | | | | | |
Acadia Healthcare Co., Inc.,
5.50%, 07/01/2028(a) | | | 1,500,000 | | | 1,468,797 |
CHS/Community Health Systems, Inc.,
5.25%, 05/15/2030(a) | | | 5,987,000 | | | 4,941,742 |
Concentra Escrow Issuer Corp.,
6.88%, 07/15/2032(a) | | | 4,280,000 | | | 4,341,676 |
Tenet Healthcare Corp.,
6.13%, 06/15/2030 | | | 3,252,000 | | | 3,234,106 |
| | | | | | 13,986,321 |
Health Services - 1.0%
| | | | | | |
Fortrea Holdings, Inc.,
7.50%, 07/01/2030(a) | | | 4,441,000 | | | 4,418,070 |
ModivCare Escrow Issuer, Inc.,
5.00%, 10/01/2029(a) | | | 3,026,000 | | | 2,135,455 |
| | | | | | | |
The accompanying notes are an integral part of these financial statements.
TABLE OF CONTENTS
Hotchkis & Wiley High Yield Fund
Schedule of Investments
as of June 30, 2024 (Continued)
| | | | | | | |
CORPORATE BONDS - (Continued)
|
Health Services - (Continued)
|
Sotera Health Holdings LLC,
7.38%, 06/01/2031(a) | | | $2,255,000 | | | $2,261,167 |
| | | | | | 8,814,692 |
Hotels - 1.1%
| | | | | | |
Marriott Ownership Resorts, Inc.,
4.50%, 06/15/2029(a) | | | 5,638,000 | | | 5,185,272 |
Park Intermediate Holdings LLC / PK Domestic Property LLC / PK Finance Co.-Issuer, 4.88%, 05/15/2029(a) | | | 4,720,000 | | | 4,430,601 |
| | | | | | 9,615,873 |
Insurance Brokerage - 2.9%
| | | | | | |
Alliant Holdings Intermediate LLC / Alliant Holdings Co.-Issuer,
7.00%, 01/15/2031(a) | | | 4,670,000 | | | 4,721,577 |
AmWINS Group, Inc.,
4.88%, 06/30/2029(a) | | | 5,072,000 | | | 4,725,405 |
AssuredPartners, Inc.,
7.50%, 02/15/2032(a) | | | 4,826,000 | | | 4,849,054 |
Howden UK Refinance PLC / Howden UK Refinance 2 PLC / Howden US Refinance LLC, 8.13%, 02/15/2032(a) | | | 2,873,000 | | | 2,856,681 |
Ryan Specialty LLC,
4.38%, 02/01/2030(a) | | | 3,975,000 | | | 3,686,459 |
USI, Inc./NY, 7.50%, 01/15/2032(a) | | | 4,760,000 | | | 4,840,416 |
| | | | | | 25,679,592 |
Investments & Miscellaneous
Financial Services - 0.3%
|
Armor Holdco, Inc., 8.50%, 11/15/2029(a) | | | 2,602,000 | | | 2,481,758 |
Machinery - 2.0%
| | | | | | |
Chart Industries, Inc.,
7.50%, 01/01/2030(a) | | | 4,198,000 | | | 4,343,318 |
JB Poindexter & Co., Inc.,
8.75%, 12/15/2031(a) | | | 4,417,000 | | | 4,581,494 |
NESCO Holdings II, Inc.,
5.50%, 04/15/2029(a) | | | 5,285,000 | | | 4,901,004 |
Titan International, Inc.,
7.00%, 04/30/2028 | | | 4,670,000 | | | 4,495,594 |
| | | | | | 18,321,410 |
Media - Broadcast - 0.8%
| | | | | | |
CMG Media Corp., 8.88%, 12/15/2027(a) | | | 1,165,000 | | | 667,356 |
Gray Television, Inc.
| | | | | | |
10.50%, 07/15/2029(a) | | | 2,263,000 | | | 2,277,392 |
5.38%, 11/15/2031(a) | | | 6,976,000 | | | 3,960,247 |
| | | | | | 6,904,995 |
Media Content - 0.6%
| | | | | | |
News Corp., 5.13%, 02/15/2032(a) | | | 1,996,000 | | | 1,894,668 |
Townsquare Media, Inc.,
6.88%, 02/01/2026(a) | | | 3,839,000 | | | 3,783,581 |
| | | | | | 5,678,249 |
Medical Products - 1.8%
| | | | | | |
Grifols SA, 4.75%, 10/15/2028(a) | | | 5,356,000 | | | 4,627,234 |
Medline Borrower LP,
5.25%, 10/01/2029(a) | | | 3,481,000 | | | 3,324,709 |
Medline Borrower LP/Medline Co.-Issuer, Inc., 6.25%, 04/01/2029(a) | | | 3,434,000 | | | 3,477,158 |
| | | | | | | |
| | | | | | | |
Varex Imaging Corp.,
7.88%, 10/15/2027(a) | | | $5,053,000 | | | $5,147,648 |
| | | | | | 16,576,749 |
Metals/Mining Excluding Steel - 0.6%
|
Kaiser Aluminum Corp.,
4.50%, 06/01/2031(a) | | | 5,525,000 | | | 4,898,787 |
Rain CII Carbon LLC / CII Carbon Corp., 7.25%, 04/01/2025(a) | | | 131,000 | | | 128,535 |
| | | | | | 5,027,322 |
Oil Field Equipment & Services - 3.1%
|
Enerflex Ltd., 9.00%, 10/15/2027(a) | | | 3,548,000 | | | 3,605,020 |
Nabors Industries Ltd.,
7.50%, 01/15/2028(a) | | | 4,405,000 | | | 4,207,387 |
Noble Finance II LLC,
8.00%, 04/15/2030(a) | | | 4,449,000 | | | 4,633,576 |
Transocean Poseidon Ltd.,
6.88%, 02/01/2027(a) | | | 2,638,575 | | | 2,637,314 |
Transocean, Inc., 8.75%, 02/15/2030(a) | | | 1,894,500 | | | 1,990,528 |
Valaris Ltd., 8.38%, 04/30/2030(a) | | | 5,731,000 | | | 5,937,763 |
Weatherford International Ltd.,
8.63%, 04/30/2030(a) | | | 4,696,000 | | | 4,870,113 |
| | | | | | 27,881,701 |
Oil Refining & Marketing - 1.0%
|
Parkland Corp., 4.63%, 05/01/2030(a) | | | 5,527,000 | | | 5,045,012 |
PBF Holding Co. LLC / PBF Finance Corp., 6.00%, 02/15/2028 | | | 4,110,000 | | | 4,010,866 |
| | | | | | 9,055,878 |
Packaging - 1.0%
| | | | | | |
Sealed Air Corp./Sealed Air Corp. US,
7.25%, 02/15/2031(a) | | | 4,184,000 | | | 4,313,060 |
Verde Purchaser LLC,
10.50%, 11/30/2030(a) | | | 4,398,000 | | | 4,653,761 |
| | | | | | 8,966,821 |
Personal & Household Products - 1.7%
|
Edgewell Personal Care Co.,
5.50%, 06/01/2028(a) | | | 4,620,000 | | | 4,511,428 |
Energizer Holdings, Inc.,
4.38%, 03/31/2029(a) | | | 6,161,000 | | | 5,579,511 |
Scotts Miracle-Gro Co.,
4.38%, 02/01/2032 | | | 5,677,000 | | | 4,897,230 |
| | | | | | 14,988,169 |
Pharmaceuticals - 2.1%
| | | | | | |
Bausch + Lomb Corp.,
8.38%, 10/01/2028(a) | | | 4,556,000 | | | 4,669,900 |
Bausch Health Cos., Inc.
| | | | | | |
6.13%, 02/01/2027(a) | | | 2,901,000 | | | 2,418,346 |
11.00%, 09/30/2028(a) | | | 1,770,000 | | | 1,579,725 |
Jazz Securities DAC,
4.38%, 01/15/2029(a) | | | 3,449,000 | | | 3,204,927 |
Organon & Co. / Organon Foreign Debt
Co.-Issuer BV
| | | | | | |
5.13%, 04/30/2031(a) | | | 5,534,000 | | | 4,975,853 |
7.88%, 05/15/2034(a) | | | 1,779,000 | | | 1,830,152 |
| | | | | | 18,678,903 |
Real Estate Development &
Management - 1.5%
|
Cushman & Wakefield US Borrower LLC, 8.88%, 09/01/2031(a) | | | 5,364,000 | | | 5,648,480 |
| | | | | | | |
The accompanying notes are an integral part of these financial statements.
TABLE OF CONTENTS
Hotchkis & Wiley High Yield Fund
Schedule of Investments
as of June 30, 2024 (Continued)
| | | | | | | |
CORPORATE BONDS - (Continued)
|
Real Estate Development &
Management - (Continued)
|
Five Point Operating Co. LP / Five Point Capital Corp., 10.50%, 01/15/2028(a) | | | $2,841,070 | | | $2,915,193 |
Greystar Real Estate Partners LLC,
7.75%, 09/01/2030(a) | | | 4,518,000 | | | 4,761,421 |
| | | | | | 13,325,094 |
Recreation & Travel - 3.2%
|
Boyne USA, Inc., 4.75%, 05/15/2029(a) | | | 4,869,000 | | | 4,546,354 |
Carnival Corp.
| | | | | | |
6.00%, 05/01/2029(a) | | | 5,222,000 | | | 5,161,659 |
7.00%, 08/15/2029(a) | | | 2,241,000 | | | 2,324,406 |
10.50%, 06/01/2030(a) | | | 7,333,000 | | | 7,971,118 |
NCL Corp. Ltd., 8.13%, 01/15/2029(a) | | | 4,525,000 | | | 4,744,541 |
Royal Caribbean Cruises Ltd.,
7.25%, 01/15/2030(a) | | | 4,235,000 | | | 4,387,672 |
| | | | | | 29,135,750 |
Reinsurance - 1.0%
| | | | | | |
Enstar Finance LLC, 5.75% to 09/01/2025 then 5 yr. CMT Rate + 5.47%, 09/01/2040(j) | | | 3,131,000 | | | 3,069,722 |
Highlands Holdings Bond Issuer Ltd. / Highlands Holdings Bond Co.-Issuer, Inc., 7.63% Cash or 8.38% PIK, 10/15/2025(a)(k) | | | 6,252,983 | | | 6,285,286 |
| | | | | | 9,355,008 |
REITs - 0.5%
| | | | | | |
Service Properties Trust,
8.63%, 11/15/2031(a) | | | 4,568,000 | | | 4,765,720 |
Restaurants - 1.0%
| | | | | | |
Papa John’s International, Inc.,
3.88%, 09/15/2029(a) | | | 4,977,000 | | | 4,408,522 |
Raising Cane's Restaurants LLC,
9.38%, 05/01/2029(a) | | | 4,409,000 | | | 4,767,394 |
| | | | | | 9,175,916 |
Software/Services - 3.5%
| | | | | | |
Boost Newco Borrower LLC,
7.50%, 01/15/2031(a) | | | 4,595,000 | | | 4,794,433 |
Central Parent LLC / CDK Global II LLC / CDK Financing Co., Inc., 8.00%, 06/15/2029(a) | | | 4,493,000 | | | 4,565,629 |
Consensus Cloud Solutions, Inc.,
6.50%, 10/15/2028(a) | | | 5,145,000 | | | 4,808,248 |
Fortress Intermediate 3, Inc.,
7.50%, 06/01/2031(a) | | | 4,521,000 | | | 4,637,642 |
UKG, Inc., 6.88%, 02/01/2031(a) | | | 4,389,000 | | | 4,447,111 |
Virtusa Corp., 7.13%, 12/15/2028(a) | | | 3,418,000 | | | 3,148,780 |
VM Consolidated, Inc.,
5.50%, 04/15/2029(a) | | | 5,245,000 | | | 5,007,330 |
| | | | | | 31,409,173 |
Specialty Retail - 4.1%
| | | | | | |
Academy Ltd., 6.00%, 11/15/2027(a) | | | 5,313,000 | | | 5,236,603 |
Cougar JV Subsidiary LLC,
8.00%, 05/15/2032(a) | | | 2,268,000 | | | 2,347,101 |
Kontoor Brands, Inc., 4.13%, 11/15/2029(a) | | | 5,554,000 | | | 5,033,840 |
LCM Investments Holdings II LLC,
8.25%, 08/01/2031(a) | | | 4,556,000 | | | 4,758,191 |
Lithia Motors, Inc., 4.38%, 01/15/2031(a) | | | 5,010,000 | | | 4,465,841 |
| | | | | | | |
| | | | | | | |
PetSmart, Inc. / PetSmart Finance Corp., 4.75%, 02/15/2028(a) | | | $5,031,000 | | | $4,679,014 |
Sonic Automotive, Inc.,
4.88%, 11/15/2031(a) | | | 5,301,000 | | | 4,671,282 |
Wand NewCo 3, Inc.,
7.63%, 01/30/2032(a) | | | 4,750,000 | | | 4,909,776 |
| | | | | | 36,101,648 |
Steel Producers/Products - 1.4%
|
ATI, Inc., 5.88%, 12/01/2027 | | | 4,054,000 | | | 4,005,045 |
Calderys Financing LLC,
11.25%, 06/01/2028(a) | | | 3,912,000 | | | 4,143,019 |
Carpenter Technology Corp.,
7.63%, 03/15/2030 | | | 4,676,000 | | | 4,821,807 |
| | | | | | 12,969,871 |
Support-Services - 2.1%
| | | | | | |
Dun & Bradstreet Corp.,
5.00%, 12/15/2029(a) | | | 4,705,000 | | | 4,373,576 |
EquipmentShare.com, Inc.,
8.63%, 05/15/2032(a) | | | 4,725,000 | | | 4,905,363 |
Summer BC Bidco B LLC,
5.50%, 10/31/2026(a) | | | 4,752,000 | | | 4,644,555 |
ZipRecruiter, Inc.,
5.00%, 01/15/2030(a) | | | 6,091,000 | | | 5,297,644 |
| | | | | | 19,221,138 |
Technology Hardware & Equipment - 1.4%
|
CommScope, Inc., 6.00%, 03/01/2026(a) | | | 3,196,000 | | | 2,808,645 |
Seagate HDD Cayman, 8.50%, 07/15/2031 | | | 4,394,000 | | | 4,736,156 |
Xerox Holdings Corp.,
8.88%, 11/30/2029(a) | | | 5,374,000 | | | 5,130,370 |
| | | | | | 12,675,171 |
Telecom - Satellite - 0.3%
| | | | | | |
Telesat Canada / Telesat LLC,
5.63%, 12/06/2026(a) | | | 5,575,000 | | | 2,634,702 |
Telecom - Wireline Integrated &
Services - 0.4%
|
Frontier Communications Holdings LLC, 8.63%, 03/15/2031(a) | | | 3,700,000 | | | 3,815,410 |
Tobacco - 0.6%
|
Turning Point Brands, Inc.,
5.63%, 02/15/2026(a) | | | 5,007,000 | | | 4,980,025 |
TOTAL CORPORATE BONDS
(Cost $823,555,004) | | | | | | 799,038,712 |
CONVERTIBLE BONDS - 1.1%
|
Specialty Retail - 1.1%
|
Authentic Brands Group LLC, 5.00%, 09/01/2029 (Acquired 07/11/2013 – 04/01/2024, Cost $29,212,302)(c)(i) | | | 9,480,821 | | | 9,480,821 |
TOTAL CONVERTIBLE BONDS
(Cost $29,212,302)
|
| |
The accompanying notes are an integral part of these financial statements.
TABLE OF CONTENTS
Hotchkis & Wiley High Yield Fund
Schedule of Investments
as of June 30, 2024 (Continued)
| | | | | | | |
BANK LOANS - 4.8%
|
Advertising - 0.4%
|
AP Core Holdings II LLC, 10.94% (1 mo. Term SOFR + 5.50%), 09/01/2027 (Acquired 07/21/2021 – 02/10/2023,
Cost $4,482,444)(i)(j) | | | $4,525,604 | | | $3,982,531 |
Air Transportation - 0.9%
| | | | | | |
AAdvantage Loyalty IP Ltd. First Lien, 10.34% (3 mo. Term SOFR + 4.75%), 04/20/2028 (Acquired 06/24/2021 – 07/12/2022, Cost $4,346,659)(i)(j) | | | 4,268,000 | | | 4,414,713 |
United Airlines, Inc. First Lien, 8.07%
(1 mo. Term SOFR + 2.75%), 02/24/2031 (Acquired 02/15/2024,
Cost $3,285,216)(i)(j) | | | 3,301,725 | | | 3,314,106 |
| | | | | | 7,728,819 |
Building Materials - 0.3%
| | | | | | |
Foundation Building Materials, Inc. First Lien, 9.33% (1 mo. Term SOFR + 4.00%), 01/29/2031 (Acquired 01/25/2024 – 01/31/2024, Cost $2,814,530)(i)(j) | | | 2,826,915 | | | 2,819,070 |
Cable & Satellite TV - 0.1%
| | | | | | |
Directv Financing LLC First Lien, 10.44% (1 mo. Term SOFR + 5.00%), 08/02/2027 (Acquired 08/17/2022, Cost $952,105)(i)(j) | | | 967,077 | | | 970,220 |
Consumer/Commercial/Lease
Financing - 0.2%
|
Upbound Group, Inc. First Lien, 8.08%
(1 mo. Term SOFR + 3.25%), 02/17/2028 (Acquired 02/14/2023,
Cost $2,143,331)(i)(j) | | | 2,172,080 | | | 2,182,495 |
Forestry/Paper - 0.2%
|
Mativ Holdings, Inc., 9.19% (1 mo. Term SOFR + 3.75%), 04/20/2028
(Acquired 02/23/2021 - 02/13/2023,
Cost $1,612,368)(i)(j) | | | 1,627,750 | | | 1,625,716 |
Metals/Mining Excluding Steel - 0.4%
|
Arsenal AIC Parent LLC First Lien, 9.08%
(1 mo. Term SOFR + 3.75%), 08/19/2030 (Acquired 07/27/2023 - 02/21/2024,
Cost $3,819,620)(i)(j) | | | 3,813,785 | | | 3,841,435 |
Oil Field Equipment & Services - 0.2%
|
Iracore International Holdings, Inc., 14.46% (3 mo. Term SOFR + 9.00%), 04/12/2026 (Acquired 04/13/2017,
Cost $1,826,992)(c)(i)(j) | | | 1,826,992 | | | 1,826,992 |
Oil Refining & Marketing - 0.6%
|
Par Petroleum LLC First Lien, 9.05%
(1 mo. Term SOFR + 3.75%), 02/28/2030 (Acquired 02/14/2023,
Cost $4,874,820)(i)(j) | | | 4,931,672 | | | 4,957,859 |
Personal & Household Products - 0.5%
|
Journey Personal Care Corp., 9.68%
(1 mo. Term SOFR + 4.25%), 03/01/2028 (Acquired 02/19/2021,
Cost $4,890,865)(i)(j) | | | 4,915,442 | | | 4,908,069 |
| | | | | | | |
| | | | | | | | |
Restaurants - 0.5%
| | | | | | | |
Dave & Buster's, Inc. First Lien, 8.63%
(1 mo. Term SOFR + 3.25%), 06/29/2029 (Acquired 08/02/2022 - 06/30/2023,
Cost $4,455,919)(i)(j) | | | $4,497,513 | | | $4,507,520 | |
Software/Services - 0.5%
| | | | | | | |
Onbe, Inc., 11.94% (1 mo. Term
SOFR + 6.50%), 12/10/2027
(Acquired 12/31/2020 - 11/29/2023,
Cost $4,115,408)(i)(j) | | | 4,223,146 | | | 4,245,845 | |
TOTAL BANK LOANS
| |
(Cost $43,620,277) | | | | | | 43,596,571 | |
| | | Shares | | | | |
COMMON STOCKS - 0.9%
| |
Advertising - 0.1%
| |
National CineMedia, Inc.(d) | | | 207,497 | | | 910,912 | |
National CineMedia, Inc. (Acquired 08/17/2023, Cost $0)(c)(i) | | | 6,230,000 | | | 0 | |
| | | | | | 910,912 | |
Metals/Mining Excluding Steel - 0.0%(e)
| |
Metals Recovery Holdings LLC
(Acquired 07/19/2012 - 12/10/2019,
Cost $27,352,487)(c)(d)(f)(i) | | | 116,127 | | | 69,676 | |
Oil Field Equipment & Services - 0.8%
| |
Iracore Investments Holdings, Inc.
(Acquired 04/13/2017,
Cost $4,753,500)(c)(f)(i) | | | 22,361 | | | 7,573,224 | |
Oil Refining & Marketing - 0.0%(e)
| |
PetroQuest Energy, Inc.
(Acquired 02/14/2019 - 04/06/2023,
Cost $23,022,610)(c)(d)(f)(i) | | | 89,691 | | | 0 | |
TOTAL COMMON STOCKS
| |
(Cost $57,069,977) | | | | | | 8,553,812 | |
REAL ESTATE INVESTMENT TRUSTS - 0.2%
| |
Hotels - 0.2%
| |
Pebblebrook Hotel Trust, Series F,
6.30%, Perpetual | | | 87,646 | | | 1,750,290 | |
TOTAL REAL ESTATE INVESTMENT
TRUSTS
| |
(Cost $1,821,632) | | | | | | 1,750,290 | | | |
SHORT-TERM INVESTMENTS - 2.9%
| |
Money Market Funds - 2.5%
| |
JPMorgan US Government Money Market Fund - Class IM, 5.25%(g) | | | 22,106,680 | | | 22,106,680 | |
| | | Par | | | | |
Time Deposits - 0.4%
| |
Citigroup, Inc., 4.68%, 07/01/2024(h) | | | $13,752 | | | 13,752 | |
JPMorgan Chase & Company,
4.68%, 07/01/2024(h) | | | 3,680,877 | | | 3,680,877 | |
| | | | | | 3,694,629 | |
TOTAL SHORT-TERM INVESTMENTS
| |
(Cost $25,801,309) | | | | | | 25,801,309 | |
| | | | | | | | |
The accompanying notes are an integral part of these financial statements.
TABLE OF CONTENTS
Hotchkis & Wiley High Yield Fund
Schedule of Investments
as of June 30, 2024 (Continued)
| | | | | | | |
TOTAL INVESTMENTS - 98.9%
(Cost $981,080,501) | | | | | | $888,221,515 |
Other Assets in Excess of Liabilities - 1.1% | | | | | | 9,575,009 |
TOTAL NET ASSETS - 100.0% | | | | | | $897,796,524 |
| | | | | | | |
Percentages are stated as a percent of net assets.
Par amount is in USD unless otherwise indicated.
The Global Industry Classification Standard (GICS®) was developed by MSCI, an independent provider of global indices and benchmark-related products and services, and Standard & Poor's (S&P), an independent international financial data and investment services company. The GICS methodology has been widely accepted as an industry analysis framework for investment research, portfolio management and asset allocation. The GICS structure consists of 11 sectors, 25 industry groups, 74 industries and 163 sub-industries. Each stock that is classified will have a coding at all four of these levels.
CMT - Constant Maturity Treasury Rate
NV - Naamloze Vennootschap
PIK - Payment in Kind
PLC - Public Limited Company
REIT - Real Estate Investment Trust
SA - Sociedad Anónima
SOFR - Secured Overnight Financing Rate
USD - United States Dollar
(a)
| Security is exempt from registration pursuant to Rule 144A under the Securities Act of 1933, as amended. These securities may only be resold in transactions exempt from registration to qualified institutional investors. As of June 30, 2024, the value of these securities total $735,514,471 or 81.9% of the Fund’s net assets. |
(b)
| Step coupon bond. The rate disclosed is as of June 30, 2024. |
(c)
| Fair value determined using significant unobservable inputs in accordance with procedures established by and under the supervision of the Adviser, acting as Valuation Designee. These securities represented $18,950,713 or 2.1% of net assets as of June 30, 2024. |
(d)
| Non-income producing security. |
(e)
| Represents less than 0.05% of net assets. |
(f)
| Affiliated company as defined by the Investment Company Act of 1940. See Note 6. |
(g)
| The rate shown represents the 7-day effective yield as of June 30, 2024. |
(h)
| Invested through a cash management account administered by Brown Brothers Harriman & Co. |
(i)
| Restricted security. Purchased in a private placement transaction; resale to the public may require registration. As of June 30, 2024, the value of these securities total $60,720,292 or 6.7% of the Fund’s net assets. |
(j)
| The coupon rate shown on variable rate securities represents the rate at June 30, 2024. |
(k)
| Payment in-kind (PIK) security. |
The accompanying notes are an integral part of these financial statements.
TABLE OF CONTENTS
Statements of Assets & Liabilities
June 30, 2024
| | | | | | | | | | | | | | | | |
ASSETS:
| | | | | | | | | | | | | | | |
Long-term investments, at value*
| | | | | | | | | | | | | | | |
Unaffiliated issuers | | | $110,377,327 | | | $347,921,229 | | | $424,398,951 | | | $753,054,492 | | | $775,991,989 |
Affiliated issuers | | | — | | | — | | | — | | | 2,449,310 | | | — |
Collateral for securities on loan* | | | 97,007 | | | 2,032,063 | | | 4,570,645 | | | 8,062,567 | | | 2,793,676 |
Short-term investments* | | | 789,436 | | | 7,498,192 | | | 7,629,231 | | | 22,444,666 | | | 10,548,492 |
Cash | | | 1,421 | | | 20,018 | | | 55,115 | | | 61,219 | | | 28,619 |
Dividends and interest receivable | | | 188,545 | | | 646,172 | | | 465,130 | | | 386,288 | | | 989,417 |
Receivable for Fund shares sold | | | 115,747 | | | 204,555 | | | 396,679 | | | 1,084,995 | | | 1,892,395 |
Other assets | | | 6,528 | | | 21,877 | | | 28,177 | | | 38,722 | | | 26,150 |
Total assets | | | $111,576,011 | | | $358,344,106 | | | $437,543,928 | | | $787,582,259 | | | $792,270,738 |
Liabilities:
| | | | | | | | | | | | | | | |
Collateral upon return of securities on loan | | | $97,007 | | | $2,032,063 | | | $4,570,645 | | | $8,062,567 | | | $2,793,676 |
Payable for investments purchased | | | 58,903 | | | 139,895 | | | — | | | 707,441 | | | — |
Payable for Fund shares repurchased | | | 6,526 | | | 135,078 | | | 158,646 | | | 746,046 | | | 248,482 |
Payable to Advisor | | | 36,651 | | | 196,488 | | | 273,323 | | | 406,986 | | | 372,056 |
Accrued distribution and service fees | | | 48,729 | | | 184,419 | | | 178,426 | | | 84,880 | | | 19,625 |
Accrued expenses and other liabilities | | | 72,007 | | | 199,633 | | | 191,550 | | | 343,853 | | | 266,976 |
Total liabilities | | | 319,823 | | | 2,887,576 | | | 5,372,590 | | | 10,351,773 | | | 3,700,815 |
Commitments and contingencies (Note 8)
| | | | | | | | | | | | | | | |
Net assets | | | $111,256,188 | | | $355,456,530 | | | $432,171,338 | | | $777,230,486 | | | $788,569,923 |
Net Assets consist of:
| | | | | | | | | | | | | | | |
Paid-in capital | | | $107,401,411 | | | $268,067,775 | | | $576,410,865 | | | $654,991,531 | | | $735,481,021 |
Total accumulated distributable earnings (losses) | | | $3,854,777 | | | $87,388,755 | | | $(144,239,527) | | | $122,238,955 | | | $53,088,902 |
Net assets | | | $111,256,188 | | | $355,456,530 | | | $432,171,338 | | | $777,230,486 | | | $788,569,923 |
Calculation of Net Asset Value Per Share and Public Offering Price Per Share - Class I
| | | | | | | | | | | | | | | |
Net assets | | | $68,413,093 | | | $210,123,969 | | | $275,563,007 | | | $697,603,049 | | | $551,236,915 |
Shares outstanding (unlimited shares $0.001 par value authorized) | | | 2,224,960 | | | 4,835,782 | | | 5,143,918 | | | 9,143,406 | | | 45,257,828 |
Net asset value per share | | | $30.75 | | | $43.45 | | | $53.57 | | | $76.30 | | | $12.18 |
Calculation of Net Asset Value Per Share - Class A
| | | | | | | | | | | | | | | |
Net assets | | | $42,843,095 | | | $132,425,133 | | | $119,610,097 | | | $52,297,605 | | | $46,561,107 |
Shares outstanding (unlimited shares $0.001 par value authorized) | | | 1,387,187 | | | 3,068,249 | | | 2,273,020 | | | 690,828 | | | 3,857,914 |
Net asset value per share | | | $30.88 | | | $43.16 | | | $52.62 | | | $75.70 | | | $12.07 |
Public Offering Price Per Share - Class A
| | | | | | | | | | | | | | | |
(Net asset value per share divided by 0.9475) | | | $32.59 | | | $45.55 | | | $55.54 | | | $79.89 | | | $12.74 |
Calculation of Net Asset Value Per Share and Public Offering Price Per Share - Class C
| | | | | | | | | | | | | | | |
Net assets | | | | | | | | | | | | $3,441,051 | | | |
Shares outstanding (unlimited shares $0.001 par value authorized) | | | | | | | | | | | | 60,017 | | | |
Net asset value per share | | | | | | | | | | | | $57.33 | | | |
Calculation of Net Asset Value Per Share and Public Offering Price Per Share - Class Z
| | | | | | | | | | | | | | | |
Net assets | | | | | | $12,907,428 | | | $36,998,234 | | | $23,888,781 | | | $190,771,901 |
Shares outstanding (unlimited shares $0.001 par value authorized) | | | | | | 297,067 | | | 690,421 | | | 313,015 | | | 15,673,878 |
Net asset value per share | | | | | | $43.45 | | | $53.59 | | | $76.32 | | | $12.17 |
*Cost of long-term investments
| | | | | | | | | | | | | | | |
Unaffiliated issuers | | | $94,269,059 | | | $288,594,305 | | | $368,142,574 | | | $649,201,815 | | | $731,000,260 |
Affiliated issuers | | | — | | | — | | | — | | | 12,960,896 | | | — |
*Cost of collateral for securities on loan | | | 97,007 | | | 2,032,063 | | | 4,570,645 | | | 8,062,567 | | | 2,793,676 |
*Cost of short-term investments | | | 789,436 | | | 7,498,191 | | | 7,629,231 | | | 22,444,666 | | | 10,548,492 |
| | | | | | | | | | | | | | | | |
The accompanying notes are an integral part of these financial statements.
TABLE OF CONTENTS
Statements of Assets & Liabilities
June 30, 2024 (Continued)
| | | | | | | | | | | | | | | | |
ASSETS:
| | | | | | | | | | | | | | | |
Long-term investments, at value*
| | | | | | | | | | | | | | | |
Unaffiliated issuers | | | $36,650,795 | | | $3,570,175 | | | $7,879,074 | | | $622,320,864 | | | $854,777,306 |
Affiliated issuers | | | — | | | — | | | — | | | 10,980,683 | | | 7,642,900 |
Collateral for securities on loan* | | | — | | | — | | | — | | | 19,390,797 | | | — |
Short-term investments* | | | 1,010,151 | | | 87,658 | | | 202,584 | | | 20,488,444 | | | 25,801,309 |
Cash | | | 4,702 | | | 696 | | | 667 | | | 66,334 | | | 14,098 |
Cash denominated in foreign currencies# | | | — | | | 4 | | | — | | | — | | | — |
Dividends and interest receivable | | | 87,498 | | | 16,665 | | | 36,904 | | | 707,933 | | | 15,448,254 |
Receivable for investments sold | | | — | | | — | | | — | | | 706,729 | | | — |
Receivable for Fund shares sold | | | 125 | | | — | | | — | | | 1,000,068 | | | 2,418,115 |
Receivable from Advisor | | | — | | | 9,216 | | | — | | | — | | | — |
Other assets | | | 3,203 | | | 1,843 | | | 3,285 | | | 23,189 | | | 44,657 |
Total assets | | | $37,756,474 | | | $3,686,257 | | | $8,122,514 | | | $675,685,041 | | | $906,146,639 |
Liabilities:
| | | | | | | | | | | | | | | |
Collateral upon return of securities on loan | | | $— | | | $— | | | $— | | | $19,390,797 | | | $— |
Payable for investments purchased | | | 112,690 | | | — | | | — | | | 1,534,787 | | | 4,507,415 |
Payable for Fund shares repurchased | | | 3,192 | | | — | | | — | | | 955,325 | | | 1,527,007 |
Payable to Advisor | | | 14,243 | | | — | | | 448 | | | 399,855 | | | 352,378 |
Accrued distribution and service fees | | | 2,433 | | | — | | | — | | | 92,843 | | | 7,251 |
Distributions payable to shareholders | | | — | | | — | | | — | | | — | | | 1,605,763 |
Accrued expenses and other liabilities | | | 43,882 | | | 39,278 | | | 58,687 | | | 202,717 | | | 350,301 |
Total liabilities | | | 176,440 | | | 39,278 | | | 59,135 | | | 22,576,324 | | | 8,350,115 |
Commitments and contingencies (Note 8)
| | | | | | | | | | | | | | | |
Net assets | | | $37,580,034 | | | $3,646,979 | | | $8,063,379 | | | $653,108,717 | | | $897,796,524 |
Net Assets consist of:
| | | | | | | | | | | | | | | |
Paid-in capital | | | $28,806,443 | | | $2,890,867 | | | $6,911,416 | | | $533,528,955 | | | $1,358,253,903 |
Total accumulated distributable earnings (losses) | | | $8,773,591 | | | $756,112 | | | $1,151,963 | | | $119,579,762 | | | $(460,457,379) |
Net assets | | | $37,580,034 | | | $3,646,979 | | | $8,063,379 | | | $653,108,717 | | | $897,796,524 |
Calculation of Net Asset Value Per Share and Public Offering Price Per Share - Class I
| | | | | | | | | | | | | | | |
Net assets | | | $34,947,724 | | | $3,646,979 | | | $8,063,379 | | | $477,029,255 | | | $714,258,142 |
Shares outstanding (unlimited shares $0.001 par value authorized) | | | 2,243,077 | | | 284,587 | | | 653,299 | | | 12,354,851 | | | 68,331,933 |
Net asset value per share | | | $15.58 | | | $12.81 | | | $12.34 | | | $38.61 | | | $10.45 |
Calculation of Net Asset Value Per Share - Class A
| | | | | | | | | | | | | | | |
Net assets | | | $2,632,310 | | | | | | | | | $101,253,359 | | | $59,086,680 |
Shares outstanding (unlimited shares $0.001 par value authorized) | | | 168,780 | | | | | | | | | 2,625,811 | | | 5,707,839 |
Net asset value per share | | | $15.60 | | | | | | | | | $38.56 | | | $10.35 |
Public Offering Price Per Share - Class A
| | | | | | | | | | | | | | | |
(Net asset value per share divided by 0.9475) | | | $16.46 | | | | | | | | | $40.70 | | | |
(Net asset value per share divided by 0.9625) | | | | | | | | | | | | | | | $10.75 |
Calculation of Net Asset Value Per Share and Public Offering Price Per Share - Class C
| | | | | | | | | | | | | | | |
Net assets | | | | | | | | | | | | $12,237,423 | | | |
Shares outstanding (unlimited shares $0.001 par value authorized) | | | | | | | | | | | | 356,367 | | | |
Net asset value per share | | | | | | | | | | | | $34.34 | | | |
Calculation of Net Asset Value Per Share and Public Offering Price Per Share - Class Z
| | | | | | | | | | | | | | | |
Net assets | | | | | | | | | | | | $62,588,680 | | | $124,451,702 |
Shares outstanding (unlimited shares $0.001 par value authorized) | | | | | | | | | | | | 1,620,097 | | | 11,911,733 |
Net asset value per share | | | | | | | | | | | | $38.63 | | | $10.45 |
*Cost of long-term investments
| | | | | | | | | | | | | | | |
Unaffiliated issuers | | | $31,406,968 | | | $3,138,081 | | | $7,411,094 | | | $554,082,564 | | | $900,150,594 |
Affiliated issuers | | | — | | | — | | | — | | | 6,892,250 | | | 55,128,598 |
*Cost of collateral for securities on loan | | | — | | | — | | | — | | | 19,390,797 | | | — |
*Cost of short-term investments | | | 1,010,151 | | | 87,658 | | | 202,584 | | | 20,488,446 | | | 25,801,309 |
#Cost of cash denominated in foreign currencies | | | $— | | | $4 | | | $— | | | $— | | | $— |
| | | | | | | | | | | | | | | | |
The accompanying notes are an integral part of these financial statements.
TABLE OF CONTENTS
Statements of Operations
FOR THE YEAR ENDED JUNE 30, 2024
| | | | | | | | | | | | | | | | |
Investment income:
| | | | | | | | | | | | | | | |
Dividends*
| | | | | | | | | | | | | | | |
Unaffiliated issuers | | | $2,374,512 | | | $9,387,232 | | | $8,614,813 | | | $12,901,959 | | | $16,833,482 |
Interest | | | 100,865 | | | 109,549 | | | 680,019 | | | 980,325 | | | 694,942 |
Securities on loan, net | | | 8,000 | | | 46,833 | | | 44,697 | | | 621,143 | | | 614,759 |
Total income | | | 2,483,377 | | | 9,543,614 | | | 9,339,529 | | | 14,503,427 | | | 18,143,183 |
Expenses:
| | | | | | | | | | | | | | | |
Advisory fees | | | 702,426 | | | 2,584,729 | | | 3,497,573 | | | 5,692,047 | | | 4,927,099 |
Professional fees and expenses | | | 27,209 | | | 56,751 | | | 65,161 | | | 91,545 | | | 89,237 |
Custodian fees and expenses | | | 6,007 | | | 11,473 | | | 13,130 | | | 19,520 | | | 28,432 |
Transfer agent fees and expenses | | | 109,546 | | | 551,179 | | | 577,395 | | | 1,403,793 | | | 727,209 |
Accounting fees and expenses | | | 25,959 | | | 44,321 | | | 54,736 | | | 85,214 | | | 94,829 |
Administration fees and expenses | | | 46,190 | | | 129,999 | | | 159,805 | | | 251,220 | | | 254,711 |
Compliance fees and expenses | | | 2,178 | | | 8,650 | | | 10,653 | | | 16,694 | | | 16,272 |
Trustees’ fees and expenses | | | 10,754 | | | 41,712 | | | 52,201 | | | 83,247 | | | 81,911 |
Reports to shareholders | | | 9,291 | | | 19,485 | | | 26,518 | | | 81,264 | | | 45,333 |
Registration fees | | | 48,078 | | | 65,035 | | | 69,280 | | | 81,855 | | | 72,934 |
Distribution and service fees - Class A | | | 98,986 | | | 328,557 | | | 313,324 | | | 131,141 | | | 103,747 |
Distribution and service fees - Class C | | | 5,091 | | | 25,928 | | | 39,952 | | | 27,960 | | | – |
Other expenses | | | 14,306 | | | 39,805 | | | 47,729 | | | 68,392 | | | 64,369 |
Total expenses | | | 1,106,021 | | | 3,907,624 | | | 4,927,457 | | | 8,033,892 | | | 6,506,083 |
Fee waiver/expense reimbursement by Advisor (Note 2) | | | (202,976) | | | (77,564) | | | — | | | (544,201) | | | (387,653) |
Net expenses | | | 903,045 | | | 3,830,060 | | | 4,927,457 | | | 7,489,691 | | | 6,118,430 |
Net investment income | | | 1,580,332 | | | 5,713,554 | | | 4,412,072 | | | 7,013,736 | | | 12,024,753 |
Realized and Unrealized Gains (Losses):
| | | | | | | | | | | | | | | |
Net realized gains (losses) from:
| | | | | | | | | | | | | | | |
Sales of unaffiliated issuers | | | 11,554,657 | | | 42,903,297 | | | 50,986,660 | | | 26,851,340 | | | 45,188,966 |
Foreign currency transactions | | | — | | | — | | | (10,646) | | | — | | | — |
Net realized gains | | | 11,554,657 | | | 42,903,297 | | | 50,976,014 | | | 26,851,340 | | | 45,188,966 |
Net change in unrealized appreciation/
depreciation of:
| | | | | | | | | | | | | | | |
Securities of unaffiliated issuers and foreign currency translations | | | 4,763,619 | | | 13,771,670 | | | 12,864,828 | | | 50,520,650 | | | 8,534,153 |
Securities of affiliated issuers | | | — | | | — | | | — | | | (831,675) | | | — |
Net change in unrealized appreciation/depreciation | | | 4,763,619 | | | 13,771,670 | | | 12,864,828 | | | 49,688,975 | | | 8,534,153 |
Net gains | | | 16,318,276 | | | 56,674,967 | | | 63,840,842 | | | 76,540,315 | | | 53,723,119 |
Net Increase in Net Assets Resulting from Operations | | | $17,898,608 | | | $62,388,521 | | | $68,252,914 | | | $83,554,051 | | | $65,747,872 |
*Net of Foreign Taxes Withheld | | | $39,963 | | | $150,958 | | | $299,545 | | | $175,997 | | | $22,144 |
| | | | | | | | | | | | | | | | |
The accompanying notes are an integral part of these financial statements.
TABLE OF CONTENTS
Statements of Operations
FOR THE YEAR ENDED JUNE 30, 2024 (Continued)
| | | | | | | | | | | | | | | | |
Investment income:
| | | | | | | | | | | | | | | |
Dividends* | | | | | | | | | | | | | | | |
Unaffiliated issuers | | | $868,315 | | | $121,828 | | | $242,522 | | | $11,963,649 | | | $595,977 |
Affiliated issuers | | | — | | | — | | | — | | | 566,882 | | | 390,970 |
Interest | | | 41,646 | | | 4,880 | | | 5,380 | | | 1,109,092 | | | 63,165,223 |
Securities on loan, net | | | — | | | — | | | — | | | 136,787 | | | — |
Total income | | | 909,961 | | | 126,708 | | | 247,902 | | | 13,776,410 | | | 64,152,170 |
Expenses:
| | | | | | | | | | | | | | | |
Advisory fees | | | 260,714 | | | 28,054 | | | 57,131 | | | 4,501,560 | | | 5,076,419 |
Professional fees and expenses | | | 19,579 | | | 14,607 | | | 14,924 | | | 80,598 | | | 122,010 |
Custodian fees and expenses | | | 9,059 | | | 10,822 | | | 51,958 | | | 21,476 | | | 26,943 |
Transfer agent fees and expenses | | | 25,062 | | | 294 | | | 445 | | | 515,140 | | | 967,414 |
Accounting fees and expenses | | | 29,024 | | | 32,574 | | | 77,372 | | | 69,826 | | | 141,687 |
Administration fees and expenses | | | 40,232 | | | 40,294 | | | 46,972 | | | 201,100 | | | 303,466 |
Compliance fees and expenses | | | 782 | | | 77 | | | 155 | | | 13,154 | | | 21,002 |
Trustees’ fees and expenses | | | 3,826 | | | 384 | | | 767 | | | 65,091 | | | 103,585 |
Reports to shareholders | | | 3,261 | | | 2,412 | | | 2,600 | | | 19,373 | | | 22,983 |
Registration fees | | | 33,554 | | | 25,227 | | | 23,470 | | | 67,265 | | | 70,003 |
Distribution and service fees - Class A | | | 5,251 | | | — | | | — | | | 225,662 | | | 77,682 |
Distribution and service fees - Class C | | | — | | | — | | | — | | | 158,634 | | | 5,047 |
Other expenses | | | 8,892 | | | 5,410 | | | 6,428 | | | 56,091 | | | 79,473 |
Total expenses | | | 439,236 | | | 160,155 | | | 282,222 | | | 5,994,970 | | | 7,017,714 |
Fee waiver/expense reimbursement by Advisor (Note 2) | | | (103,426) | | | (126,839) | | | (211,407) | | | — | | | (625,010) |
Net expenses | | | 335,810 | | | 33,316 | | | 70,815 | | | 5,994,970 | | | 6,392,704 |
Net investment income | | | 574,151 | | | 93,392 | | | 177,087 | | | 7,781,440 | | | 57,759,466 |
Realized and Unrealized Gains (Losses):
| | | | | | | | | | | | | | | |
Net realized gains (losses) from:
| | | | | | | | | | | | | | | |
Sales of unaffiliated issuers | | | 4,611,310 | | | 337,190 | | | 621,179 | | | 43,884,960 | | | (15,961,774) |
Foreign currency transactions | | | (12,338) | | | (2,032) | | | (3,439) | | | (64,208) | | | — |
Net realized gains (losses) | | | 4,598,972 | | | 335,158 | | | 617,740 | | | 43,820,752 | | | (15,961,774) |
Net change in unrealized appreciation/depreciation of:
| | | | | | | | | | | | | | | |
Securities of unaffiliated issuers and foreign currency translations | | | 1,539,093 | | | 28,764 | | | 217,723 | | | 52,284,450 | | | 49,486,154 |
Securities of affiliated issuers | | | — | | | — | | | — | | | 802,444 | | | (5,831,304) |
Net change in unrealized appreciation/depreciation | | | 1,539,093 | | | 28,764 | | | 217,723 | | | 53,086,894 | | | 43,654,850 |
Net gains | | | 6,138,065 | | | 363,922 | | | 835,463 | | | 96,907,646 | | | 27,693,076 |
Net Increase in Net Assets Resulting from Operations | | | $6,712,216 | | | $457,314 | | | $1,012,550 | | | $104,689,086 | | | $85,452,542 |
*Net of Foreign Taxes Withheld | | | $67,683 | | | $15,027 | | | $36,271 | | | $648,445 | | | $— |
| | | | | | | | | | | | | | | | |
The accompanying notes are an integral part of these financial statements.
TABLE OF CONTENTS
Hotchkis & Wiley Funds
Statements of Changes in Net Assets
| | | | | | | |
Operations:
| | | | | | | | | | | | |
Net investment income | | | $1,580,332 | | | $1,036,821 | | | $5,713,554 | | | $5,017,659 |
Net realized gains | | | 11,554,657 | | | 4,512,893 | | | 42,903,297 | | | 25,867,543 |
Net change in unrealized appreciation/depreciation | | | 4,763,619 | | | 7,579,009 | | | 13,771,670 | | | 20,927,077 |
Net increase in net assets resulting from operations | | | 17,898,608 | | | 13,128,723 | | | 62,388,521 | | | 51,812,279 |
Dividends and Distributions to Shareholders:
| | | | | | | | | | | | |
Class I | | | (1,074,206) | | | (585,655) | | | (23,760,122) | | | (17,355,003) |
Class A | | | (515,324) | | | (281,890) | | | (13,655,912) | | | (10,564,284) |
Class C | | | (405) | | | — | | | (248,868) | | | (261,394) |
Class Z | | | — | | | — | | | (1,348,885) | | | (1,923,465) |
Net decrease in net assets resulting from dividends and distributions to shareholders | | | (1,589,935) | | | (867,545) | | | (39,013,787) | | | (30,104,146) |
Capital Share Transactions:
| | | | | | | | | | | | |
Net increase (decrease) in net assets resulting from capital share transactions | | | 12,687,157 | | | (13,969,071) | | | (38,608,130) | | | (55,742,028) |
Net Assets:
| | | | | | | | | | | | |
Total increase (decrease) in net assets | | | 28,995,830 | | | (1,707,893) | | | (15,233,396) | | | (34,033,895) |
Beginning of year | | | 82,260,358 | | | 83,968,251 | | | 370,689,926 | | | 404,723,821 |
End of year | | | $111,256,188 | | | $82,260,358 | | | $355,456,530 | | | $370,689,926 |
| | | | | | | | | | | | | |
The accompanying notes are an integral part of these financial statements.
TABLE OF CONTENTS
Hotchkis & Wiley Funds
Statements of Changes in Net Assets (Continued)
| | | | | | | |
Operations:
| | | | | | | | | | | | |
Net investment income | | | $4,412,072 | | | $5,302,966 | | | $7,013,736 | | | $6,957,284 |
Net realized gains | | | 50,976,014 | | | 41,358,154 | | | 26,851,340 | | | 42,433,539 |
Net change in unrealized appreciation/depreciation | | | 12,864,828 | | | 13,419,953 | | | 49,688,975 | | | 59,577,505 |
Net increase in net assets resulting from operations | | | 68,252,914 | | | 60,081,073 | | | 83,554,051 | | | 108,968,328 |
Dividends and Distributions to Shareholders:
| | | | | | | | | | | | |
Class I | | | (917,195) | | | (1,589,970) | | | (13,689,240) | | | (71,852,683) |
Class A | | | (139,180) | | | (359,388) | | | (968,833) | | | (5,572,007) |
Class C | | | — | | | — | | | (58,787) | | | (255,929) |
Class Z | | | (146,894) | | | (193,762) | | | (314,039) | | | (1,252,245) |
Net decrease in net assets resulting from dividends and distributions to shareholders | | | (1,203,269) | | | (2,143,120) | | | (15,030,899) | | | (78,932,864) |
Capital Share Transactions:
| | | | | | | | | | | | |
Net increase (decrease) in net assets resulting from capital share transactions | | | (79,982,709) | | | (46,841,778) | | | 17,633,230 | | | 106,692,623 |
Net Assets:
| | | | | | | | | | | | |
Total increase (decrease) in net assets | | | (12,933,064) | | | 11,096,175 | | | 86,156,382 | | | 136,728,087 |
Beginning of year | | | 445,104,402 | | | 434,008,227 | | | 691,074,104 | | | 554,346,017 |
End of year | | | $432,171,338 | | | $445,104,402 | | | $777,230,486 | | | $691,074,104 |
| | | | | | | | | | | | | |
The accompanying notes are an integral part of these financial statements.
TABLE OF CONTENTS
Hotchkis & Wiley Funds
Statements of Changes in Net Assets (Continued)
| | | | | | | |
Operations:
| | | | | | | | | | | | |
Net investment income | | | $12,024,753 | | | $10,033,278 | | | $574,151 | | | $403,039 |
Net realized gains | | | 45,188,966 | | | 27,938,262 | | | 4,598,972 | | | 1,774,570 |
Net change in unrealized appreciation/depreciation | | | 8,534,153 | | | 32,798,529 | | | 1,539,093 | | | 3,453,862 |
Net increase in net assets resulting from operations | | | 65,747,872 | | | 70,770,069 | | | 6,712,216 | | | 5,631,471 |
Dividends and Distributions to Shareholders:
| | | | | | | | | | | | |
Class I | | | (50,745,104) | | | (47,567,548) | | | (3,395,268) | | | (1,263,576) |
Class A | | | (3,594,905) | | | (679,077) | | | (186,356) | | | (46,949) |
Class Z | | | (10,165,739) | | | (3,202,080) | | | — | | | — |
Net decrease in net assets resulting from dividends and distributions to shareholders | | | (64,505,748) | | | (51,448,705) | | | (3,581,624) | | | (1,310,525) |
Capital Share Transactions:
| | | | | | | | | | | | |
Net increase (decrease) in net assets resulting from capital share transactions | | | 122,015,574 | | | 175,827,495 | | | 1,315,381 | | | (4,276,767) |
Net Assets:
| | | | | | | | | | | | |
Total increase in net assets | | | 123,257,698 | | | 195,148,859 | | | 4,445,973 | | | 44,179 |
Beginning of year | | | 665,312,225 | | | 470,163,366 | | | 33,134,061 | | | 33,089,882 |
End of year | | | $788,569,923 | | | $665,312,225 | | | $37,580,034 | | | $33,134,061 |
| | | | | | | | | | | | | |
The accompanying notes are an integral part of these financial statements.
TABLE OF CONTENTS
Hotchkis & Wiley Funds
Statements of Changes in Net Assets (Continued)
| | | | | | | |
Operations:
| | | | | | | | | | | | |
Net investment income | | | $93,392 | | | $69,452 | | | $177,087 | | | $166,661 |
Net realized gains | | | 335,158 | | | 112,337 | | | 617,740 | | | 202,313 |
Net change in unrealized appreciation/depreciation | | | 28,764 | | | 409,913 | | | 217,723 | | | 593,251 |
Net increase in net assets resulting from operations | | | 457,314 | | | 591,702 | | | 1,012,550 | | | 962,225 |
Dividends and Distributions to Shareholders:
| | | | | | | | | | | | |
Class I | | | (281,772) | | | (90,047) | | | (454,903) | | | (311,643) |
Net decrease in net assets resulting from dividends and distributions to shareholders | | | (281,772) | | | (90,047) | | | (454,903) | | | (311,643) |
Capital Share Transactions:
| | | | | | | | | | | | |
Net increase in net assets resulting from capital share transactions | | | 161,129 | | | 100,491 | | | 898,536 | | | 247,449 |
Net Assets:
| | | | | | | | | | | | |
Total increase in net assets | | | 336,671 | | | 602,146 | | | 1,456,183 | | | 898,031 |
Beginning of year | | | 3,310,308 | | | 2,708,162 | | | 6,607,196 | | | 5,709,165 |
End of year | | | $3,646,979 | | | $3,310,308 | | | $8,063,379 | | | $6,607,196 |
| | | | | | | | | | | | | |
The accompanying notes are an integral part of these financial statements.
TABLE OF CONTENTS
Hotchkis & Wiley Funds
Statements of Changes in Net Assets (Continued)
| | | | | | | |
Operations:
| | | | | | | | | | | | |
Net investment income | | | $7,781,440 | | | $4,869,986 | | | $57,759,466 | | | $47,373,024 |
Net realized gains (losses) | | | 43,820,752 | | | 49,542,843 | | | (15,961,774) | | | (20,192,003) |
Net change in unrealized appreciation/depreciation | | | 53,086,894 | | | 51,066,951 | | | 43,654,850 | | | 44,189,698 |
Net increase in net assets resulting from operations | | | 104,689,086 | | | 105,479,780 | | | 85,452,542 | | | 71,370,719 |
Dividends and Distributions to Shareholders:
| | | | | | | | | | | | |
Class I | | | (35,076,900) | | | (8,387,047) | | | (46,797,332) | | | (37,198,420) |
Class A | | | (6,909,438) | | | (1,761,422) | | | (1,881,831) | | | (1,606,085) |
Class C | | | (1,291,316) | | | (469,249) | | | (26,438) | | | (38,023) |
Class Z | | | (4,681,561) | | | (1,132,228) | | | (9,044,130) | | | (8,493,751) |
Net decrease in net assets resulting from dividends and distributions to shareholders | | | (47,959,215) | | | (11,749,946) | | | (57,749,731) | | | (47,336,279) |
Capital Share Transactions:
| | | | | | | | | | | | |
Net increase (decrease) in net assets resulting from capital share transactions | | | 61,089,801 | | | (15,507,217) | | | (31,820,606) | | | 72,955,373 |
Net Assets:
| | | | | | | | | | | | |
Total increase (decrease) in net assets | | | 117,819,672 | | | 78,222,617 | | | (4,117,795) | | | 96,989,813 |
Beginning of year | | | 535,289,045 | | | 457,066,428 | | | 901,914,319 | | | 804,924,506 |
End of year | | | $653,108,717 | | | $535,289,045 | | | $897,796,524 | | | $901,914,319 |
| | | | | | | | | | | | | |
The accompanying notes are an integral part of these financial statements.
TABLE OF CONTENTS
Financial Highlights
The following per share data and ratios have been derived from information provided in the financial statements.
| | | | | | | | | | | | | | | | | | | | | | |
Diversified Value Fund
|
Class I
|
Year ended 6/30/2024 | | | $26.31 | | | $0.48 | | | $4.41 | | | $4.89 | | | $(0.45) | | | $ — | | | $(0.45) | | | $30.75 | | | 18.81% | | | $68,413 | | | 0.80% | | | 1.01% | | | 1.67% |
Year ended 6/30/2023 | | | 22.76 | | | 0.33 | | | 3.49 | | | 3.82 | | | (0.27) | | | — | | | (0.27) | | | 26.31 | | | 16.88 | | | 46,907 | | | 0.80 | | | 1.04 | | | 1.33 |
Year ended 6/30/2022 | | | 25.09 | | | 0.25 | | | (2.30) | | | (2.05) | | | (0.28) | | | — | | | (0.28) | | | 22.76 | | | −8.27 | | | 50,757 | | | 0.80 | | | 1.01 | | | 0.98 |
Year ended 6/30/2021 | | | 15.31 | | | 0.25 | | | 9.92 | | | 10.17 | | | (0.39) | | | — | | | (0.39) | | | 25.09 | | | 67.14 | | | 63,906 | | | 0.80 | | | 1.03 | | | 1.24 |
Year ended 6/30/2020 | | | 18.90 | | | 0.32 | | | (3.54) | | | (3.22) | | | (0.37) | | | — | | | (0.37) | | | 15.31 | | | −17.51 | | | 46,372 | | | 0.80 | | | 1.04 | | | 1.83 |
Class A
|
Year ended 6/30/2024 | | | 26.41 | | | 0.41 | | | 4.42 | | | 4.83 | | | (0.36) | | | — | | | (0.36) | | | 30.88 | | | 18.48 | | | 42,843 | | | 1.05 | | | 1.23 | | | 1.44 |
Year ended 6/30/2023 | | | 22.84 | | | 0.27 | | | 3.50 | | | 3.77 | | | (0.20) | | | — | | | (0.20) | | | 26.41 | | | 16.58 | | | 34,785 | | | 1.05 | | | 1.25 | | | 1.10 |
Year ended 6/30/2022 | | | 25.18 | | | 0.19 | | | (2.30) | | | (2.11) | | | (0.23) | | | — | | | (0.23) | | | 22.84 | | | −8.49 | | | 32,489 | | | 1.05 | | | 1.22 | | | 0.72 |
Year ended 6/30/2021 | | | 15.36 | | | 0.20 | | | 9.96 | | | 10.16 | | | (0.34) | | | — | | | (0.34) | | | 25.18 | | | 66.74 | | | 43,719 | | | 1.05 | | | 1.24 | | | 1.00 |
Year ended 6/30/2020 | | | 18.95 | | | 0.28 | | | (3.56) | | | (3.28) | | | (0.31) | | | — | | | (0.31) | | | 15.36 | | | −17.68 | | | 24,972 | | | 1.05 | | | 1.25 | | | 1.57 |
| | | | | | | | | | | | | | | | | | | | | | | | | | | | | | | | | | | | | | | | |
| | | | | |
Portfolio turnover rate | | | 34% | | | 26% | | | 28% | | | 32% | | | 28% | |
| | | | | | | | | | | | | | | | | |
| | | | | | | | | | | | | | | | | | | | | | |
Large Cap Value Fund
|
Class I
|
Year ended 6/30/2024 | | | $41.06 | | | $0.68 | | | $6.21 | | | $6.89 | | | $(0.69) | | | $(3.81) | | | $(4.50) | | | $43.45 | | | 18.30% | | | $210,124 | | | 0.95% | | | 0.98% | | | 1.63% |
Year ended 6/30/2023 | | | 38.92 | | | 0.57 | | | 4.86 | | | 5.43 | | | (0.53) | | | (2.76) | | | (3.29) | | | 41.06 | | | 14.35 | | | 219,456 | | | 0.95 | | | 0.99 | | | 1.40 |
Year ended 6/30/2022 | | | 43.29 | | | 0.41 | | | (4.40) | | | (3.99) | | | (0.38) | | | — | | | (0.38) | | | 38.92 | | | −9.31 | | | 214,692 | | | 0.95 | | | 0.97 | | | 0.93 |
Year ended 6/30/2021 | | | 26.81 | | | 0.41 | | | 16.64 | | | 17.05 | | | (0.57) | | | — | | | (0.57) | | | 43.29 | | | 64.20 | | | 293,318 | | | 0.95 | | | 0.98 | | | 1.19 |
Year ended 6/30/2020 | | | 33.29 | | | 0.53 | | | (6.44) | | | (5.91) | | | (0.57) | | | — | | | (0.57) | | | 26.81 | | | −18.18 | | | 257,544 | | | 0.95 | | | 0.95 | | | 1.72 |
Class A
|
Year ended 6/30/2024 | | | 40.80 | | | 0.58 | | | 6.17 | | | 6.75 | | | (0.58) | | | (3.81) | | | (4.39) | | | 43.16 | | | 18.03 | | | 132,425 | | | 1.20 | | | 1.20 | | | 1.40 |
Year ended 6/30/2023 | | | 38.66 | | | 0.46 | | | 4.84 | | | 5.30 | | | (0.40) | | | (2.76) | | | (3.16) | | | 40.80 | | | 14.08 | | | 134,901 | | | 1.20 | | | 1.20 | | | 1.14 |
Year ended 6/30/2022 | | | 43.04 | | | 0.31 | | | (4.38) | | | (4.07) | | | (0.31) | | | — | | | (0.31) | | | 38.66 | | | −9.53 | | | 150,260 | | | 1.18 | | | 1.18 | | | 0.71 |
Year ended 6/30/2021 | | | 26.67 | | | 0.33 | | | 16.56 | | | 16.89 | | | (0.52) | | | — | | | (0.52) | | | 43.04 | | | 63.82 | | | 149,051 | | | 1.18 | | | 1.18 | | | 0.96 |
Year ended 6/30/2020 | | | 33.14 | | | 0.46 | | | (6.45) | | | (5.99) | | | (0.48) | | | — | | | (0.48) | | | 26.67 | | | −18.42 | | | 113,504 | | | 1.20 | | | 1.20 | | | 1.49 |
Class Z
|
Year ended 6/30/2024 | | | 41.06 | | | 0.72 | | | 6.21 | | | 6.93 | | | (0.73) | | | (3.81) | | | (4.54) | | | 43.45 | | | 18.42 | | | 12,907 | | | 0.85 | | | 0.85 | | | 1.74 |
Year ended 6/30/2023 | | | 38.92 | | | 0.54 | | | 4.93 | | | 5.47 | | | (0.57) | | | (2.76) | | | (3.33) | | | 41.06 | | | 14.46 | | | 13,023 | | | 0.87 | | | 0.87 | | | 1.34 |
Year ended 6/30/2022 | | | 43.30 | | | 0.46 | | | (4.40) | | | (3.94) | | | (0.44) | | | — | | | (0.44) | | | 38.92 | | | −9.22 | | | 35,081 | | | 0.86 | | | 0.86 | | | 1.07 |
Year ended 6/30/2021 | | | 26.82 | | | 0.47 | | | 16.63 | | | 17.10 | | | (0.62) | | | — | | | (0.62) | | | 43.30 | | | 64.34 | | | 12,958 | | | 0.84 | | | 0.84 | | | 1.32 |
Period from 9/30/20193 to 6/30/2020 | | | 33.12 | | | 0.49 | | | (6.19) | | | (5.70) | | | (0.60) | | | — | | | (0.60) | | | 26.82 | | | −17.65 | | | 6,943 | | | 0.834 | | | 0.834 | | | 2.374 |
| | | | | | | | | | | | | | | | | | | | | | | | | | | | | | | | | | | | | | | | |
| | | | | |
Portfolio turnover rate | | | 22% | | | 26% | | | 35% | | | 25% | | | 29% | |
| | | | | | | | | | | | | | | | | |
1
| Net investment income per share has been calculated based on average shares outstanding during the period. |
2
| Total returns exclude the effects of sales charges. The Fund’s investment advisor may have waived a portion of its advisory fee and/or reimbursed a portion of the Fund’s expenses. Without such waiver and/or reimbursement, the Fund’s performance would have been lower. Returns for periods less than one year are not annualized. |
3
| Commencement of operations. |
The accompanying notes are an integral part of these financial statements.
TABLE OF CONTENTS
Financial Highlights
The following per share data and ratios have been derived from information provided in the financial statements.
| | | | | | | | | | | | | | | | | | | | | | |
Mid-Cap Value Fund
|
Class I
|
Year ended 6/30/2024 | | | $46.37 | | | $0.51 | | | $6.84 | | | $7.35 | | | $(0.15) | | | $ — | | | $(0.15) | | | $53.57 | | | 15.88% | | | $275,563 | | | 1.00% | | | 1.00% | | | 1.00% |
Year ended 6/30/2023 | | | 40.71 | | | 0.53 | | | 5.35 | | | 5.88 | | | (0.22) | | | — | | | (0.22) | | | 46.37 | | | 14.47 | | | 289,249 | | | 1.00 | | | 1.00 | | | 1.18 |
Year ended 6/30/2022 | | | 42.23 | | | 0.22 | | | (1.18) | | | (0.96) | | | (0.56) | | | — | | | (0.56) | | | 40.71 | | | −2.34 | | | 286,887 | | | 1.01 | | | 1.01 | | | 0.51 |
Year ended 6/30/2021 | | | 22.27 | | | 0.48 | | | 20.20 | | | 20.68 | | | (0.72) | | | — | | | (0.72) | | | 42.23 | | | 93.96 | | | 302,584 | | | 1.04 | | | 1.04 | | | 1.50 |
Year ended 6/30/2020 | | | 33.10 | | | 0.51 | | | (10.82) | | | (10.31) | | | (0.52) | | | — | | | (0.52) | | | 22.27 | | | −31.62 | | | 202,902 | | | 1.04 | | | 1.04 | | | 1.73 |
Class A
|
Year ended 6/30/2024 | | | 45.55 | | | 0.40 | | | 6.73 | | | 7.13 | | | (0.06) | | | — | | | (0.06) | | | 52.62 | | | 15.65 | | | 119,610 | | | 1.20 | | | 1.20 | | | 0.80 |
Year ended 6/30/2023 | | | 39.99 | | | 0.43 | | | 5.26 | | | 5.69 | | | (0.13) | | | — | | | (0.13) | | | 45.55 | | | 14.24 | | | 120,783 | | | 1.21 | | | 1.21 | | | 0.97 |
Year ended 6/30/2022 | | | 41.52 | | | 0.13 | | | (1.15) | | | (1.02) | | | (0.51) | | | — | | | (0.51) | | | 39.99 | | | −2.54 | | | 111,771 | | | 1.21 | | | 1.21 | | | 0.31 |
Year ended 6/30/2021 | | | 21.93 | | | 0.43 | | | 19.87 | | | 20.30 | | | (0.71) | | | — | | | (0.71) | | | 41.52 | | | 93.63 | | | 118,947 | | | 1.23 | | | 1.23 | | | 1.35 |
Year ended 6/30/2020 | | | 32.53 | | | 0.43 | | | (10.65) | | | (10.22) | | | (0.38) | | | — | | | (0.38) | | | 21.93 | | | −31.78 | | | 71,919 | | | 1.22 | | | 1.22 | | | 1.56 |
Class Z
|
Year ended 6/30/2024 | | | 46.38 | | | 0.58 | | | 6.85 | | | 7.43 | | | (0.22) | | | — | | | (0.22) | | | 53.59 | | | 16.05 | | | 36,998 | | | 0.88 | | | 0.88 | | | 1.14 |
Year ended 6/30/2023 | | | 40.72 | | | 0.58 | | | 5.36 | | | 5.94 | | | (0.28) | | | — | | | (0.28) | | | 46.38 | | | 14.60 | | | 30,591 | | | 0.88 | | | 0.88 | | | 1.30 |
Year ended 6/30/2022 | | | 42.25 | | | 0.29 | | | (1.19) | | | (0.90) | | | (0.63) | | | — | | | (0.63) | | | 40.72 | | | −2.23 | | | 30,870 | | | 0.87 | | | 0.87 | | | 0.65 |
Year ended 6/30/2021 | | | 22.26 | | | 0.56 | | | 20.19 | | | 20.75 | | | (0.76) | | | — | | | (0.76) | | | 42.25 | | | 94.35 | | | 22,879 | | | 0.88 | | | 0.88 | | | 1.75 |
Period from 9/30/20193 to 6/30/2020 | | | 30.67 | | | 0.40 | | | (8.25) | | | (7.85) | | | (0.56) | | | — | | | (0.56) | | | 22.26 | | | −26.16 | | | 15,976 | | | 0.894 | | | 0.894 | | | 2.124 |
| | | | | | | | | | | | | | | | | | | | | | | | | | | | | | | | | | | | | | | | |
| | | | | |
Portfolio turnover rate | | | 28% | | | 35% | | | 41% | | | 37% | | | 27% | |
| | | | | | | | | | | | | | | | | |
| | | | | | | | | | | | | | | | | | | | | | |
Small Cap Value Fund
|
Class I
|
Year ended 6/30/2024 | | | $69.72 | | | $0.69 | | | $7.34 | | | $8.03 | | | $(0.46) | | | $(0.99) | | | $(1.45) | | | $76.30 | | | 11.68% | | | $697,603 | | | 0.97% | | | 1.05% | | | 0.94% |
Year ended 6/30/2023 | | | 66.00 | | | 0.74 | | | 11.79 | | | 12.53 | | | (0.42) | | | (8.39) | | | (8.81) | | | 69.72 | | | 19.73 | | | 627,132 | | | 1.01 | | | 1.06 | | | 1.07 |
Year ended 6/30/2022 | | | 68.58 | | | 0.27 | | | (2.59) | | | (2.32) | | | (0.26) | | | — | | | (0.26) | | | 66.00 | | | −3.42 | | | 510,545 | | | 1.06 | | | 1.06 | | | 0.38 |
Year ended 6/30/2021 | | | 38.22 | | | 0.23 | | | 30.56 | | | 30.79 | | | (0.43) | | | — | | | (0.43) | | | 68.58 | | | 80.88 | | | 512,396 | | | 1.07 | | | 1.07 | | | 0.44 |
Year ended 6/30/2020 | | | 53.27 | | | 0.45 | | | (12.86) | | | (12.41) | | | (0.48) | | | (2.16) | | | (2.64) | | | 38.22 | | | −24.70 | | | 335,080 | | | 1.05 | | | 1.05 | | | 0.94 |
Class A
|
Year ended 6/30/2024 | | | 69.26 | | | 0.52 | | | 7.28 | | | 7.80 | | | (0.37) | | | (0.99) | | | (1.36) | | | 75.70 | | | 11.41 | | | 52,298 | | | 1.20 | | | 1.20 | | | 0.70 |
Year ended 6/30/2023 | | | 65.67 | | | 0.60 | | | 11.72 | | | 12.32 | | | (0.34) | | | (8.39) | | | (8.73) | | | 69.26 | | | 19.49 | | | 50,327 | | | 1.21 | | | 1.21 | | | 0.86 |
Year ended 6/30/2022 | | | 68.24 | | | 0.16 | | | (2.58) | | | (2.42) | | | (0.15) | | | — | | | (0.15) | | | 65.67 | | | −3.56 | | | 33,250 | | | 1.21 | | | 1.21 | | | 0.23 |
Year ended 6/30/2021 | | | 38.03 | | | 0.14 | | | 30.41 | | | 30.55 | | | (0.34) | | | — | | | (0.34) | | | 68.24 | | | 80.58 | | | 35,039 | | | 1.25 | | | 1.25 | | | 0.27 |
Year ended 6/30/2020 | | | 52.98 | | | 0.36 | | | (12.83) | | | (12.47) | | | (0.32) | | | (2.16) | | | (2.48) | | | 38.03 | | | −24.86 | | | 26,028 | | | 1.25 | | | 1.25 | | | 0.76 |
Class C
|
Year ended 6/30/2024 | | | 53.05 | | | (0.01) | | | 5.53 | | | 5.52 | | | (0.25) | | | (0.99) | | | (1.24) | | | 57.33 | | | 10.60 | | | 3,441 | | | 1.95 | | | 1.95 | | | (0.02) |
Year ended 6/30/2023 | | | 52.23 | | | 0.08 | | | 9.21 | | | 9.29 | | | (0.08) | | | (8.39) | | | (8.47) | | | 53.05 | | | 18.60 | | | 2,181 | | | 1.96 | | | 1.96 | | | 0.15 |
Year ended 6/30/2022 | | | 54.55 | | | (0.27) | | | (2.05) | | | (2.32) | | | — | | | — | | | — | | | 52.23 | | | −4.25 | | | 1,157 | | | 1.94 | | | 1.94 | | | (0.48) |
Year ended 6/30/2021 | | | 30.49 | | | (0.19) | | | 24.33 | | | 24.14 | | | (0.08) | | | — | | | (0.08) | | | 54.55 | | | 79.25 | | | 2,026 | | | 1.99 | | | 1.99 | | | (0.46) |
Year ended 6/30/2020 | | | 42.94 | | | 0.02 | | | (10.31) | | | (10.29) | | | — | | | (2.16) | | | (2.16) | | | 30.49 | | | −25.40 | | | 3,528 | | | 1.95 | | | 1.95 | | | 0.05 |
Class Z
|
Year ended 6/30/2024 | | | 69.73 | | | 0.81 | | | 7.30 | | | 8.11 | | | (0.53) | | | (0.99) | | | (1.52) | | | 76.32 | | | 11.80 | | | 23,889 | | | 0.86 | | | 0.86 | | | 1.08 |
Year ended 6/30/2023 | | | 66.04 | | | 0.85 | | | 11.78 | | | 12.63 | | | (0.55) | | | (8.39) | | | (8.94) | | | 69.73 | | | 19.90 | | | 11,434 | | | 0.87 | | | 0.87 | | | 1.22 |
Year ended 6/30/2022 | | | 68.62 | | | 0.42 | | | (2.60) | | | (2.18) | | | (0.40) | | | — | | | (0.40) | | | 66.04 | | | −3.22 | | | 9,394 | | | 0.86 | | | 0.86 | | | 0.59 |
Year ended 6/30/2021 | | | 38.23 | | | 0.35 | | | 30.55 | | | 30.90 | | | (0.51) | | | — | | | (0.51) | | | 68.62 | | | 81.23 | | | 10,246 | | | 0.87 | | | 0.87 | | | 0.65 |
Period from 9/30/20193 to 6/30/2020 | | | 52.15 | | | 0.56 | | | (11.79) | | | (11.23) | | | (0.53) | | | (2.16) | | | (2.69) | | | 38.23 | | | −22.99 | | | 6,540 | | | 0.874 | | | 0.874 | | | 1.724 |
| | | | | | | | | | | | | | | | | | | | | | | | | | | | | | | | | | | | | | | | |
| | | | | |
Portfolio turnover rate | | | 45% | | | 42% | | | 49% | | | 36% | | | 34% | |
| | | | | | | | | | | | | | | | | |
1
| Net investment income (loss) per share has been calculated based on average shares outstanding during the period. |
2
| Total returns exclude the effects of sales charges. The Fund’s investment advisor may have waived a portion of its advisory fee and/or reimbursed a portion of the Fund’s expenses. Without such waiver and/or reimbursement, the Fund’s performance would have been lower. Returns for periods less than one year are not annualized. |
3
| Commencement of operations. |
The accompanying notes are an integral part of these financial statements.
TABLE OF CONTENTS
Financial Highlights
The following per share data and ratios have been derived from information provided in the financial statements.
| | | | | | | | | | | | | | | | | | | | | | |
Small Cap Diversified Value Fund
|
Class I
|
Year ended 6/30/2024 | | | $12.26 | | | $0.19 | | | $0.80 | | | $0.99 | | | $(0.20) | | | $(0.87) | | | $(1.07) | | | $12.18 | | | 8.53% | | | $551,237 | | | 0.80% | | | 0.86% | | | 1.59% |
Year ended 6/30/2023 | | | 11.91 | | | 0.21 | | | 1.24 | | | 1.45 | | | (0.19) | | | (0.91) | | | (1.10) | | | 12.26 | | | 12.47 | | | 551,324 | | | 0.80 | | | 0.87 | | | 1.69 |
Year ended 6/30/2022 | | | 13.99 | | | 0.17 | | | (1.38) | | | (1.21) | | | (0.14) | | | (0.73) | | | (0.87) | | | 11.91 | | | −9.34 | | | 461,866 | | | 0.80 | | | 0.87 | | | 1.26 |
Year ended 6/30/2021 | | | 7.88 | | | 0.14 | | | 6.07 | | | 6.21 | | | (0.10) | | | — | | | (0.10) | | | 13.99 | | | 79.26 | | | 427,708 | | | 0.80 | | | 0.87 | | | 1.21 |
Year ended 6/30/2020 | | | 10.08 | | | 0.12 | | | (2.23) | | | (2.11) | | | (0.09) | | | — | | | (0.09) | | | 7.88 | | | −21.14 | | | 143,415 | | | 0.82 | | | 0.92 | | | 1.37 |
Class A
|
Year ended 6/30/2024 | | | 12.16 | | | 0.16 | | | 0.80 | | | 0.96 | | | (0.18) | | | (0.87) | | | (1.05) | | | 12.07 | | | 8.33 | | | 46,561 | | | 1.05 | | | 1.12 | | | 1.34 |
Year ended 6/30/2023 | | | 11.83 | | | 0.18 | | | 1.22 | | | 1.40 | | | (0.16) | | | (0.91) | | | (1.07) | | | 12.16 | | | 12.12 | | | 36,173 | | | 1.05 | | | 1.14 | | | 1.54 |
Year ended 6/30/2022 | | | 13.91 | | | 0.13 | | | (1.36) | | | (1.23) | | | (0.12) | | | (0.73) | | | (0.85) | | | 11.83 | | | −9.57 | | | 5,839 | | | 1.05 | | | 1.15 | | | 0.98 |
Year ended 6/30/2021 | | | 7.83 | | | 0.11 | | | 6.06 | | | 6.17 | | | (0.09) | | | — | | | (0.09) | | | 13.91 | | | 79.09 | | | 8,668 | | | 1.05 | | | 1.14 | | | 0.96 |
Year ended 6/30/2020 | | | 10.03 | | | 0.10 | | | (2.24) | | | (2.14) | | | (0.06) | | | — | | | (0.06) | | | 7.83 | | | −21.48 | | | 1,535 | | | 1.07 | | | 1.18 | | | 1.06 |
Class Z
|
Year ended 6/30/2024 | | | 12.25 | | | 0.20 | | | 0.79 | | | 0.99 | | | (0.20) | | | (0.87) | | | (1.07) | | | 12.17 | | | 8.57 | | | 190,772 | | | 0.76 | | | 0.76 | | | 1.64 |
Year ended 6/30/2023 | | | 11.90 | | | 0.21 | | | 1.24 | | | 1.45 | | | (0.19) | | | (0.91) | | | (1.10) | | | 12.25 | | | 12.54 | | | 77,815 | | | 0.77 | | | 0.77 | | | 1.72 |
Year ended 6/30/2022 | | | 13.99 | | | 0.18 | | | (1.39) | | | (1.21) | | | (0.15) | | | (0.73) | | | (0.88) | | | 11.90 | | | −9.38 | | | 2,458 | | | 0.76 | | | 0.76 | | | 1.33 |
Year ended 6/30/2021 | | | 7.87 | | | 0.15 | | | 6.07 | | | 6.22 | | | (0.10) | | | — | | | (0.10) | | | 13.99 | | | 79.45 | | | 1,186 | | | 0.77 | | | 0.77 | | | 1.25 |
Period from 9/30/20193 to 6/30/2020 | | | 10.02 | | | 0.09 | | | (2.14) | | | (2.05) | | | (0.10) | | | — | | | (0.10) | | | 7.87 | | | −20.75 | | | 40 | | | 0.804 | | | 0.844 | | | 1.414 |
| | | | | | | | | | | | | | | | | | | | | | | | | | | | | | | | | | | | | | | | |
| | | | | |
Portfolio turnover rate | | | 54% | | | 52% | | | 38% | | | 42% | | | 53% | |
| | | | | | | | | | | | | | | | | |
| | | | | | | | | | | | | | | | | | | | | | |
Global Value Fund
|
Class I
|
Year ended 6/30/2024 | | | $14.31 | | | $0.25 | | | $2.62 | | | $2.87 | | | $(0.26) | | | $(1.34) | | | $(1.60) | | | $15.58 | | | 21.57% | | | $34,948 | | | 0.95% | | | 1.24% | | | 1.66% |
Year ended 6/30/2023 | | | 12.64 | | | 0.16 | | | 2.01 | | | 2.17 | | | (0.14) | | | (0.36) | | | (0.50) | | | 14.31 | | | 17.61 | | | 31,599 | | | 0.95 | | | 1.25 | | | 1.17 |
Year ended 6/30/2022 | | | 14.44 | | | 0.14 | | | (1.84) | | | (1.70) | | | (0.10) | | | — | | | (0.10) | | | 12.64 | | | −11.86 | | | 31,800 | | | 0.95 | | | 1.22 | | | 0.98 |
Year ended 6/30/2021 | | | 8.96 | | | 0.10 | | | 5.56 | | | 5.66 | | | (0.18) | | | — | | | (0.18) | | | 14.44 | | | 63.58 | | | 36,025 | | | 0.95 | | | 1.29 | | | 0.83 |
Year ended 6/30/2020 | | | 11.55 | | | 0.14 | | | (2.42) | | | (2.28) | | | (0.13) | | | (0.18) | | | (0.31) | | | 8.96 | | | −20.42 | | | 25,148 | | | 0.95 | | | 1.32 | | | 1.31 |
Class A
|
Year ended 6/30/2024 | | | 14.30 | | | 0.22 | | | 2.63 | | | 2.85 | | | (0.21) | | | (1.34) | | | (1.55) | | | 15.60 | | | 21.33 | | | 2,632 | | | 1.20 | | | 1.51 | | | 1.49 |
Year ended 6/30/2023 | | | 12.63 | | | 0.13 | | | 2.00 | | | 2.13 | | | (0.10) | | | (0.36) | | | (0.46) | | | 14.30 | | | 17.30 | | | 1,535 | | | 1.20 | | | 1.50 | | | 0.96 |
Year ended 6/30/2022 | | | 14.43 | | | 0.11 | | | (1.84) | | | (1.73) | | | (0.07) | | | — | | | (0.07) | | | 12.63 | | | −12.07 | | | 1,290 | | | 1.20 | | | 1.46 | | | 0.73 |
Year ended 6/30/2021 | | | 8.96 | | | 0.08 | | | 5.54 | | | 5.62 | | | (0.15) | | | — | | | (0.15) | | | 14.43 | | | 63.05 | | | 1,484 | | | 1.20 | | | 1.48 | | | 0.58 |
Year ended 6/30/2020 | | | 11.55 | | | 0.11 | | | (2.41) | | | (2.30) | | | (0.11) | | | (0.18) | | | (0.29) | | | 8.96 | | | −20.57 | | | 168 | | | 1.20 | | | 1.62 | | | 1.05 |
| | | | | | | | | | | | | | | | | | | | | | | | | | | | | | | | | | | | | | | | |
| | | | | |
Portfolio turnover rate | | | 48% | | | 39% | | | 38% | | | 39% | | | 36% | |
| | | | | | | | | | | | | | | | | |
1
| Net investment income per share has been calculated based on average shares outstanding during the period. |
2
| Total returns exclude the effects of sales charges. The Fund’s investment advisor may have waived a portion of its advisory fee and/or reimbursed a portion of the Fund’s expenses. Without such waiver and/or reimbursement, the Fund’s performance would have been lower. Returns for periods less than one year are not annualized. |
3
| Commencement of operations. |
The accompanying notes are an integral part of these financial statements.
TABLE OF CONTENTS
Financial Highlights
The following per share data and ratios have been derived from information provided in the financial statements.
| | | | | | | | | | | | | | | | | | | | | | |
International Value Fund
|
Class I
|
Year ended 6/30/2024 | | | $12.22 | | | $0.33 | | | $1.27 | | | $1.60 | | | $(0.31) | | | $(0.70) | | | $(1.01) | | | $12.81 | | | 14.18% | | | $3,647 | | | 0.95% | | | 4.57% | | | 2.66% |
Year ended 6/30/2023 | | | 10.35 | | | 0.26 | | | 1.96 | | | 2.22 | | | (0.23) | | | (0.12) | | | (0.35) | | | 12.22 | | | 21.88 | | | 3,310 | | | 0.95 | | | 5.08 | | | 2.37 |
Year ended 6/30/2022 | | | 11.66 | | | 0.27 | | | (1.41) | | | (1.14) | | | (0.17) | | | — | | | (0.17) | | | 10.35 | | | −9.82 | | | 2,708 | | | 0.95 | | | 4.87 | | | 2.35 |
Year ended 6/30/2021 | | | 7.59 | | | 0.15 | | | 4.04 | | | 4.19 | | | (0.12) | | | — | | | (0.12) | | | 11.66 | | | 55.37 | | | 2,554 | | | 0.95 | | | 5.13 | | | 1.56 |
Year ended 6/30/2020 | | | 9.77 | | | 0.13 | | | (1.96) | | | (1.83) | | | (0.19) | | | (0.16) | | | (0.35) | | | 7.59 | | | −19.66 | | | 1,874 | | | 0.95 | | | 6.10 | | | 1.39 |
| | | | | | | | | | | | | | | | | | | | | | | | | | | | | | | | | | | | | | | | |
| | | | | |
Portfolio turnover rate | | | 35% | | | 26% | | | 20% | | | 29% | | | 30% | |
| | | | | | | | | | | | | | | | | |
| | | | | | | | | | | | | | | | | | | | | | |
International Small Cap Diversified Value Fund
|
Class I
|
Year ended 6/30/2024 | | | $11.43 | | | $0.29 | | | $1.41 | | | $1.70 | | | $(0.51) | | | $(0.28) | | | $(0.79) | | | $12.34 | | | 15.63% | | | $8,063 | | | 0.99% | | | 3.95% | | | 2.48% |
Year ended 6/30/2023 | | | 10.29 | | | 0.29 | | | 1.41 | | | 1.70 | | | (0.20) | | | (0.36) | | | (0.56) | | | 11.43 | | | 17.07 | | | 6,607 | | | 0.99 | | | 4.59 | | | 2.72 |
Year ended 6/30/2022 | | | 14.83 | | | 0.25 | | | (2.01) | | | (1.76) | | | (0.39) | | | (2.39) | | | (2.78) | | | 10.29 | | | −14.28 | | | 5,709 | | | 0.99 | | | 4.23 | | | 1.92 |
Period from 6/30/20203 to 6/30/2021 | | | 10.00 | | | 0.24 | | | 4.87 | | | 5.11 | | | (0.08) | | | (0.20) | | | (0.28) | | | 14.83 | | | 51.58 | | | 6,661 | | | 0.99 | | | 4.27 | | | 1.91 |
| | | | | | | | | | | | | | | | | | | | | | | | | | | | | | | | | | | | | | | | |
| | | | | |
Portfolio turnover rate | | | 62% | | | 78% | | | 45% | | | 63% | |
| | | | | | | | | | | | | | |
1
| Net investment income per share has been calculated based on average shares outstanding during the period. |
2
| Total returns exclude the effects of sales charges. The Fund's investment advisor may have waived a portion of its advisory fee and/or reimbursed a portion of the Fund's expenses. Without such waiver and/or reimbursement, the Fund's performance would have been lower. Returns for periods less than one year are not annualized. |
3
| Commencement of operations. |
The accompanying notes are an integral part of these financial statements.
TABLE OF CONTENTS
Financial Highlights
The following per share data and ratios have been derived from information provided in the financial statements.
| | | | | | | | | | | | | | | | | | | | | | |
Value Opportunities Fund
|
Class I
|
Year ended 6/30/2024 | | | $35.38 | | | $0.50 | | | $5.81 | | | $6.31 | | | $(0.38) | | | $(2.70) | | | $(3.08) | | | $38.61 | | | 18.97% | | | $477,029 | | | 0.95% | | | 0.95% | | | 1.35% |
Year ended 6/30/2023 | | | 29.09 | | | 0.35 | | | 6.74 | | | 7.09 | | | (0.08) | | | (0.72) | | | (0.80) | | | 35.38 | | | 24.67 | | | 384,206 | | | 0.96 | | | 0.96 | | | 1.05 |
Year ended 6/30/2022 | | | 37.42 | | | 0.16 | | | (3.67) | | | (3.51) | | | (0.45) | | | (4.37) | | | (4.82) | | | 29.09 | | | −11.50 | | | 326,559 | | | 0.94 | | | 0.94 | | | 0.44 |
Year ended 6/30/2021 | | | 22.61 | | | 0.50 | | | 15.06 | | | 15.56 | | | (0.75) | | | — | | | (0.75) | | | 37.42 | | | 69.77 | | | 390,241 | | | 0.94 | | | 0.94 | | | 1.69 |
Year ended 6/30/2020 | | | 28.08 | | | 0.49 | | | (5.28) | | | (4.79) | | | (0.32) | | | (0.36) | | | (0.68) | | | 22.61 | | | −17.56 | | | 401,552 | | | 0.97 | | | 0.97 | | | 1.88 |
Class A
|
Year ended 6/30/2024 | | | $35.34 | | | 0.41 | | | 5.80 | | | 6.21 | | | (0.29) | | | (2.70) | | | (2.99) | | | 38.56 | | | 18.68 | | | 101,253 | | | 1.18 | | | 1.18 | | | 1.10 |
Year ended 6/30/2023 | | | 29.09 | | | 0.26 | | | 6.75 | | | 7.01 | | | (0.04) | | | (0.72) | | | (0.76) | | | 35.34 | | | 24.36 | | | 81,197 | | | 1.21 | | | 1.21 | | | 0.80 |
Year ended 6/30/2022 | | | 37.43 | | | 0.07 | | | (3.68) | | | (3.61) | | | (0.36) | | | (4.37) | | | (4.73) | | | 29.09 | | | −11.72 | | | 70,350 | | | 1.20 | | | 1.20 | | | 0.19 |
Year ended 6/30/2021 | | | 22.66 | | | 0.43 | | | 15.06 | | | 15.49 | | | (0.72) | | | — | | | (0.72) | | | 37.43 | | | 69.24 | | | 83,243 | | | 1.24 | | | 1.24 | | | 1.43 |
Year ended 6/30/2020 | | | 28.12 | | | 0.43 | | | (5.29) | | | (4.86) | | | (0.24) | | | (0.36) | | | (0.60) | | | 22.66 | | | −17.73 | | | 72,162 | | | 1.20 | | | 1.20 | | | 1.64 |
Class C
|
Year ended 6/30/2024 | | | 31.76 | | | 0.12 | | | 5.20 | | | 5.32 | | | (0.04) | | | (2.70) | | | (2.74) | | | 34.34 | | | 17.85 | | | 12,237 | | | 1.90 | | | 1.90 | | | 0.35 |
Year ended 6/30/2023 | | | 26.37 | | | 0.03 | | | 6.08 | | | 6.11 | | | — | | | (0.72) | | | (0.72) | | | 31.76 | | | 23.44 | | | 18,818 | | | 1.92 | | | 1.92 | | | 0.10 |
Year ended 6/30/2022 | | | 34.31 | | | (0.18) | | | (3.31) | | | (3.49) | | | (0.08) | | | (4.37) | | | (4.45) | | | 26.37 | | | −12.34 | | | 19,575 | | | 1.91 | | | 1.91 | | | (0.55) |
Year ended 6/30/2021 | | | 20.87 | | | 0.21 | | | 13.83 | | | 14.04 | | | (0.60) | | | — | | | (0.60) | | | 34.31 | | | 68.05 | | | 27,089 | | | 1.93 | | | 1.93 | | | 0.76 |
Year ended 6/30/2020 | | | 25.94 | | | 0.23 | | | (4.90) | | | (4.67) | | | (0.04) | | | (0.36) | | | (0.40) | | | 20.87 | | | −18.32 | | | 26,951 | | | 1.91 | | | 1.91 | | | 0.94 |
Class Z
|
Year ended 6/30/2024 | | | 35.40 | | | 0.53 | | | 5.81 | | | 6.34 | | | (0.41) | | | (2.70) | | | (3.11) | | | 38.63 | | | 19.06 | | | 62,589 | | | 0.86 | | | 0.86 | | | 1.43 |
Year ended 6/30/2023 | | | 29.09 | | | 0.38 | | | 6.74 | | | 7.12 | | | (0.09) | | | (0.72) | | | (0.81) | | | 35.40 | | | 24.74 | | | 51,068 | | | 0.87 | | | 0.87 | | | 1.14 |
Year ended 6/30/2022 | | | 37.43 | | | 0.19 | | | (3.68) | | | (3.49) | | | (0.48) | | | (4.37) | | | (4.85) | | | 29.09 | | | −11.40 | | | 40,582 | | | 0.86 | | | 0.86 | | | 0.52 |
Year ended 6/30/2021 | | | 22.62 | | | 0.55 | | | 15.04 | | | 15.59 | | | (0.78) | | | — | | | (0.78) | | | 37.43 | | | 69.86 | | | 43,886 | | | 0.87 | | | 0.87 | | | 1.81 |
Period from 9/30/20193 to 6/30/2020 | | | 27.79 | | | 0.37 | | | (4.84) | | | (4.47) | | | (0.34) | | | (0.36) | | | (0.70) | | | 22.62 | | | −16.61 | | | 16,207 | | | 0.85 4 | | | 0.85 4 | | | 1.95 4 |
| | | | | | | | | | | | | | | | | | | | | | | | | | | | | | | | | | | | | | | | |
| | | | | |
Portfolio turnover rate | | | 71% | | | 88% | | | 75% | | | 76% | | | 47% | |
| | | | | | | | | | | | | | | | | |
| | | | | | | | | | | | | | | | | | | | | | |
High Yield Fund
|
Class I
|
Year ended 6/30/2024 | | | $10.14 | | | $0.64 | | | $0.31 | | | $0.95 | | | $(0.64) | | | $ — | | | $(0.64) | | | $10.45 | | | 9.68% | | | $714,184 | | | 0.70% | | | 0.77% | | | 6.25% |
Year ended 6/30/2023 | | | 9.83 | | | 0.57 | | | 0.31 | | | 0.88 | | | (0.57) | | | — | | | (0.57) | | | 10.14 | | | 9.23 | | | 723,548 | | | 0.70 | | | 0.77 | | | 5.73 |
Year ended 6/30/2022 | | | 11.58 | | | 0.51 | | | (1.75) | | | (1.24) | | | (0.51) | | | — | | | (0.51) | | | 9.83 | | | −11.12 | | | 642,934 | | | 0.70 | | | 0.77 | | | 4.56 |
Year ended 6/30/2021 | | | 10.22 | | | 0.59 | | | 1.34 | | | 1.93 | | | (0.57) | | | — | | | (0.57) | | | 11.58 | | | 19.32 | | | 857,715 | | | 0.70 | | | 0.75 | | | 5.34 |
Year ended 6/30/2020 | | | 11.69 | | | 0.65 | | | (1.48)5 | | | (0.83) | | | (0.64) | | | — | | | (0.64) | | | 10.22 | | | −7.26 | | | 978,398 | | | 0.70 | | | 0.75 | | | 5.85 |
Class A
|
Year ended 6/30/2024 | | | 10.04 | | | 0.62 | | | 0.31 | | | 0.93 | | | (0.62) | | | — | | | (0.62) | | | 10.35 | | | 9.48 | | | 59,081 | | | 0.92 | | | 0.97 | | | 6.06 |
Year ended 6/30/2023 | | | 9.75 | | | 0.55 | | | 0.29 | | | 0.84 | | | (0.55) | | | — | | | (0.55) | | | 10.04 | | | 8.80 | | | 28,521 | | | 0.92 | | | 0.98 | | | 5.52 |
Year ended 6/30/2022 | | | 11.48 | | | 0.48 | | | (1.73) | | | (1.25) | | | (0.48) | | | — | | | (0.48) | | | 9.75 | | | −11.28 | | | 29,066 | | | 0.93 | | | 0.98 | | | 4.33 |
Year ended 6/30/2021 | | | 10.13 | | | 0.56 | | | 1.33 | | | 1.89 | | | (0.54) | | | — | | | (0.54) | | | 11.48 | | | 19.09 | | | 39,312 | | | 0.91 | | | 0.97 | | | 5.12 |
Year ended 6/30/2020 | | | 11.62 | | | 0.63 | | | (1.51)5 | | | (0.88) | | | (0.61) | | | — | | | (0.61) | | | 10.13 | | | −7.77 | | | 43,638 | | | 0.95 | | | 1.01 | | | 5.54 |
Class Z
|
Year ended 6/30/2024 | | | 10.14 | | | 0.65 | | | 0.31 | | | 0.96 | | | (0.65) | | | — | | | (0.65) | | | 10.45 | | | 9.90 | | | 124,439 | | | 0.60 | | | 0.65 | | | 6.34 |
Year ended 6/30/2023 | | | 9.83 | | | 0.58 | | | 0.31 | | | 0.89 | | | (0.58) | | | — | | | (0.58) | | | 10.14 | | | 9.23 | | | 149,231 | | | 0.60 | | | 0.66 | | | 5.84 |
Year ended 6/30/2022 | | | 11.58 | | | 0.52 | | | (1.75) | | | (1.23) | | | (0.52) | | | — | | | (0.52) | | | 9.83 | | | −11.04 | | | 131,847 | | | 0.60 | | | 0.65 | | | 4.66 |
Year ended 6/30/2021 | | | 10.22 | | | 0.61 | | | 1.33 | | | 1.94 | | | (0.58) | | | — | | | (0.58) | | | 11.58 | | | 19.44 | | | 211,034 | | | 0.60 | | | 0.65 | | | 5.56 |
Year ended 6/30/2020 | | | 11.70 | | | 0.64 | | | (1.46)5 | | | (0.82) | | | (0.66) | | | — | | | (0.66) | | | 10.22 | | | −7.24 | | | 523,848 | | | 0.60 | | | 0.65 | | | 6.02 |
| | | | | | | | | | | | | | | | | | | | | | | | | | | | | | | | | | | | | | | | |
| | | | | |
Portfolio turnover rate | | | 44% | | | 36% | | | 40% | | | 82% | | | 67% | |
| | | | | | | | | | | | | | | | | |
1
| Net investment income (loss) per share has been calculated based on average shares outstanding during the period. |
2
| Total returns exclude the effects of sales charges. The Fund's investment advisor may have waived a portion of its advisory fee and/or reimbursed a portion of the Fund's expenses. Without such waiver and/or reimbursement, the Fund's performance would have been lower. Returns for periods less than one year are not annualized. |
3
| Commencement of operations. |
5
| Redemption fees per share were less than $0.005. |
The accompanying notes are an integral part of these financial statements.
TABLE OF CONTENTS
Hotchkis & Wiley Funds
Notes to the Financial Statements
JUNE 30, 2024
NOTE 1. Organization.
Hotchkis & Wiley Funds (the “Trust”) is registered under the Investment Company Act of 1940, as amended (the “1940 Act”), as an open-end, management investment company. The Trust was organized as a Delaware statutory trust on July 23, 2001 and consists of eleven series. The Hotchkis & Wiley Diversified Value Fund, the Hotchkis & Wiley Large Cap Value Fund, the Hotchkis & Wiley Mid-Cap Value Fund, the Hotchkis & Wiley Small Cap Value Fund, the Hotchkis & Wiley Small Cap Diversified Value Fund, the Hotchkis & Wiley Global Value Fund, the Hotchkis & Wiley International Value Fund, the Hotchkis & Wiley International Small Cap Diversified Value Fund and the Hotchkis & Wiley High Yield Fund (collectively, the “H&W Funds”) are each a diversified series and the Hotchkis & Wiley Value Opportunities Fund (together with the H&W Funds, hereafter referred to as the “Funds”) is a non-diversified series of the Trust. The Trust was organized to acquire the assets and liabilities of the Mercury HW Large Cap Value Fund, the Mercury HW Mid-Cap Value Fund and the Mercury HW Small Cap Value Fund (the “Mercury HW Funds”). On February 4, 2002, the Mercury HW Funds were reorganized into the Trust through a non-taxable exchange. On August 28, 2009, the Hotchkis & Wiley Core Value Fund was renamed the Hotchkis & Wiley Diversified Value Fund and the Hotchkis & Wiley All Cap Value Fund was renamed the Hotchkis & Wiley Value Opportunities Fund. The other series of the Trust is included in a separate report.
The Diversified Value Fund, Large Cap Value Fund, Mid-Cap Value Fund, Small Cap Diversified Value Fund, Global Value Fund, International Value Fund, International Small Cap Diversified Value Fund and High Yield Fund have three authorized classes of shares: Class I, Class A and Class Z. The Small Cap Value Fund and Value Opportunities Fund have four authorized classes of shares: Class I, Class A, Class C and Class Z. Class A shares are sold with a front-end sales charge. Class C shares may be subject to a contingent deferred sales charge. Class C shares are automatically converted to Class A shares approximately eight years after purchase and will then be subject to lower distribution and service fees. All classes have identical voting, dividend, liquidation and other rights and the same terms and conditions, except that Class A and Class C shares bear certain expenses related to the distribution and servicing expenditures. Currently, the International Value Fund and International Small Cap Diversified Value Fund are not offering Class A shares to investors and the Diversified Value Fund, Global Value Fund, International Value Fund and International Small Cap Diversified Value Fund are not offering Class Z shares to investors. Effective May 31, 2024, Class C shares converted to Class A shares for the Diversified Value Fund, Large Cap Value Fund, Mid-Cap Value Fund and High Yield Fund.
Significant Accounting Policies. The Funds’ financial statements have been prepared in conformity with accounting principles generally accepted in the United States of America (“U.S. GAAP”), which may require the use of management accruals and estimates. Actual results could differ from those estimates and those differences could be significant. Each Fund is an investment company and accordingly follows the investment company accounting and reporting guidance of the Financial Accounting Standards Board (“FASB”) Accounting Standard Codification Topic 946 “Financial Services — Investment Companies”. The following is a summary of significant accounting policies followed by the Funds.
Security Valuation. Equity securities traded on a national stock exchange or Nasdaq Global Markets, Nasdaq Select Market and the Nasdaq Capital Markets (together, “Nasdaq”) are valued at the last reported sale price or Nasdaq Official Closing Price, as applicable, on that day, or, in the absence of recorded sales, at the average of the last bid and asked quotation on such exchange or Nasdaq. Over-the-counter securities not traded on Nasdaq are valued at the last sale price on the valuation day, or if the last sale price is unavailable, at the average of the quoted bid and asked prices in the over-the-counter market. Foreign equity securities (which are principally traded in markets other than the U.S.) are valued based upon the last reported sale price on the primary exchange or market on which they trade as of the close of business of such exchange or market immediately preceding the time of determining the Fund’s net asset value. Any Fund assets or liabilities initially valued in terms of non-U.S. dollar currencies are translated into U.S. dollars at the prevailing foreign currency exchange market rates as provided by an independent Pricing Service.
The Trust’s Board of Trustees (the “Board”) has designated Hotchkis & Wiley Capital Management, LLC (the “Advisor”) as the Funds’ “valuation designee” to perform all fair valuations of the Funds’ portfolio investments, subject to the Board’s oversight. The Advisor, as the Funds’ valuation designee, has established procedures for its fair valuation of the Funds’ portfolio investments, which address, among other things, determining when market quotations are not readily available or reliable and certain methodologies for the fair valuation of such portfolio investments, as well as the use and oversight of Pricing Services.
Fixed-income securities are generally valued at their evaluated mean prices provided by Pricing Services. Pricing Services generally provide an evaluated price that takes into account appropriate factors such as institutional-sized trading in similar groups of securities, yield, quality, coupon rate, maturity, type of issue, trading characteristics, and other market data, and may
TABLE OF CONTENTS
Hotchkis & Wiley Funds
Notes to the Financial Statements
JUNE 30, 2024 (Continued)
provide a price determined by a matrix pricing method or other analytical pricing models. If valuations from the Pricing Services are unavailable or deemed unreliable, the fixed-income security shall be priced according to the average of the bid and ask prices of broker quotes (or a single broker quote) for such security or the last sale price reported on FINRA’s Trade Reporting and Compliance Engine (“TRACE”) (excluding cross and retail trades).
For portfolio holdings which trade in markets that close prior to the close of trading on the New York Stock Exchange (which is generally 4:00 p.m. Eastern time), the Funds generally utilize a Pricing Service’s fair value price which is designed to capture events occurring after a foreign exchange closes that may affect the value of certain portfolio holdings traded on those foreign exchanges. When this fair value pricing is employed, the value of the portfolio holdings used to calculate the Funds’ net asset values may differ from quoted or official closing prices.
The Trust has performed an analysis of all existing investments to determine the significance and character of all inputs to their fair value determination. Various inputs are used in determining the value of each Fund’s investments. These inputs are summarized in the following three broad categories:
Level 1 –
| Quoted unadjusted prices for identical instruments in active markets to which the Trust has access at the date of measurement. |
Level 2 –
| Other significant observable inputs (including quoted prices for similar instruments, interest rates, current yields, credit quality, prepayment speeds for mortgage related securities, collateral for asset-backed securities, foreign security indices, foreign exchange rates, fair value estimates for foreign securities, and changes in benchmark securities indices). Level 2 inputs are those in markets for which there are few transactions, the prices are not current, little public information exists or instances where prices vary substantially over time or among brokered market makers. |
Level 3 –
| Significant unobservable inputs including model derived valuations in which one or more significant inputs or significant value drivers are unobservable. Unobservable inputs are those inputs that reflect assumptions that market participants would use to price the asset or liability based on the best available information. |
The following table presents the valuation levels of each Fund’s assets as of June 30, 2024:
Diversified Value
| | | | | | | | | | | | | |
Investments:
|
Common Stocks | | | $ 110,377,327 | | | $— | | | $— | | | $ 110,377,327 |
Money Market Funds | | | 97,007 | | | — | | | — | | | 97,007 |
Time Deposits | | | — | | | 789,436 | | | — | | | 789,436 |
Total Investments | | | $ 110,474,334 | | | $789,436 | | | $— | | | $111,263,770 |
| | | | | | | | | | | | | |
Large Cap Value
| | | | | | | | | | | | | |
Investments:
|
Common Stocks | | | $ 347,921,229 | | | $— | | | $— | | | $ 347,921,229 |
Money Market Funds | | | 2,032,063 | | | — | | | — | | | 2,032,063 |
Time Deposits | | | — | | | 7,498,192 | | | — | | | 7,498,192 |
Total Investments | | | $ 349,953,292 | | | $7,498,192 | | | $— | | | $ 357,451,484 |
| | | | | | | | | | | | | |
TABLE OF CONTENTS
Hotchkis & Wiley Funds
Notes to the Financial Statements
JUNE 30, 2024 (Continued)
Mid-Cap Value
| | | | | | | | | | | | | |
Investments:
| | | | | | | | | | | | |
Common Stocks | | | $ 422,281,506 | | | $— | | | $— | | | $ 422,281,506 |
Real Estate Investment Trusts | | | 2,117,445 | | | — | | | — | | | 2,117,445 |
Money Market Funds | | | 4,570,645 | | | — | | | — | | | 4,570,645 |
Time Deposits | | | — | | | 7,629,231 | | | — | | | 7,629,231 |
Total Investments | | | $428,969,596 | | | $7,629,231 | | | $— | | | $436,598,827 |
| | | | | | | | | | | | | |
Small Cap Value
| | | | | | | | | | | | | |
Investments:
| | | | | | | | | | | | |
Common Stocks | | | $ 750,480,703 | | | $— | | | $ — | | | $ 750,480,703 |
Real Estate Investment Trusts | | | 5,023,099 | | | — | | | — | | | 5,023,099 |
Money Market Funds | | | 8,062,567 | | | — | | | — | | | 8,062,567 |
Time Deposits | | | — | | | 22,444,666 | | | — | | | 22,444,666 |
Total Investments | | | $ 763,566,369 | | | $22,444,666 | | | $— | | | $786,011,035 |
| | | | | | | | | | | | | |
Small Cap Diversified Value
| | | | | | | | | | | | | |
Investments:
| | | | | | | | | | | | |
Common Stocks | | | $753,848,150 | | | $— | | | $ — | | | $753,848,150 |
Real Estate Investment Trusts | | | 22,143,839 | | | — | | | — | | | 22,143,839 |
Money Market Funds | | | 2,793,676 | | | — | | | — | | | 2,793,676 |
Time Deposits | | | — | | | 10,548,492 | | | — | | | 10,548,492 |
Total Investments | | | $778,785,665 | | | $10,548,492 | | | $— | | | $789,334,157 |
| | | | | | | | | | | | | |
Global Value
| | | | | | | | | | | | | |
Investments:
| | | | | | | | | | | | |
Common Stocks | | | $24,474,535 | | | $12,176,260 | | | $ — | | | $36,650,795 |
Time Deposits | | | — | | | 1,010,151 | | | — | | | 1,010,151 |
Total Investments | | | $24,474,535 | | | $13,186,411 | | | $— | | | $37,660,946 |
| | | | | | | | | | | | | |
International Value
| | | | | | | | | | | | | |
Investments:
| | | | | | | | | | | | |
Common Stocks | | | $473,648 | | | $3,096,527 | | | $ — | | | $3,570,175 |
Time Deposits | | | — | | | 87,658 | | | — | | | 87,658 |
Total Investments | | | $473,648 | | | $3,184,185 | | | $— | | | $3,657,833 |
| | | | | | | | | | | | | |
TABLE OF CONTENTS
Hotchkis & Wiley Funds
Notes to the Financial Statements
JUNE 30, 2024 (Continued)
International Small Cap Diversified Value
| | | | | | | | | | | | | |
Investments:
| | | | | | | | | | | | |
Common Stocks | | | $1,648,693 | | | $6,073,357 | | | $— | | | $7,722,050 |
Real Estate Investment Trusts | | | — | | | 157,024 | | | — | | | 157,024 |
Time Deposits | | | — | | | 202,584 | | | — | | | 202,584 |
Total Investments | | | $1,648,693 | | | $6,432,965 | | | $— | | | $8,081,658 |
| | | | | | | | | | | | | |
Value Opportunities
| | | | | | | | | | | | | |
Investments:
| | | | | | | | | | | | |
Common Stocks | | | $553,529,791 | | | $56,089,014 | | | $10,984,908 | | | $620,603,713 |
Preferred Stocks | | | 5,600,320 | | | — | | | — | | | 5,600,320 |
Bank Loans | | | — | | | 925,621 | | | 2,649,013 | | | 3,574,634 |
Purchased Options | | | 1,514,430 | | | 2,008,450 | | | — | | | 3,522,880 |
Money Market Funds | | | 19,390,797 | | | — | | | — | | | 19,390,797 |
Time Deposits | | | — | | | 20,488,444 | | | — | | | 20,488,444 |
Total Investments | | | $580,035,338 | | | $79,511,529 | | | $13,633,921 | | | $673,180,788 |
| | | | | | | | | | | | | |
High Yield
| | | | | | | | | | | | | |
Investments:
| | | | | | | | | | | | |
Corporate Bonds | | | $— | | | $799,038,712 | | | $9,480,821 | | | $808,519,533 |
Bank Loans | | | — | | | 41,769,579 | | | 1,826,992 | | | 43,596,571 |
Common Stocks | | | 910,912 | | | — | | | 7,642,900 | | | 8,553,812 |
Real Estate Investment Trusts | | | 1,750,290 | | | — | | | — | | | 1,750,290 |
Money Market Funds | | | 22,106,680 | | | — | | | — | | | 22,106,680 |
Time Deposits | | | — | | | 3,694,629 | | | — | | | 3,694,629 |
Total Investments | | | $24,767,882 | | | $844,502,920 | | | $18,950,713 | | | $888,221,515 |
| | | | | | | | | | | | | |
Please refer to the Schedule of Investments for additional information regarding the composition of the amounts listed above.
The following table provides information about the Level 3 values, as well as their inputs, as of June 30, 2024:
| | | | | | | | | | | | | | | | |
Value Opportunities
| | | | | | | | | | | | | | | |
Common Stocks | | | $4,225 | | | Estimated recovery value | | | Probability of asset recovery | | | $0.60 | | | Increase |
| | | 10,980,683 | | | Market comparable companies | | | EBIT multiple | | | 12.4x | | | Increase |
Total Common Stocks | | | 10,984,908 | | | | | | | | | | | | |
Bank Loans | | | 2,649,013 | | | Market comparable securities | | | N/A | | | $100.00 | | | Increase |
| | | $13,633,921 | | | | | | | | | | | | |
High Yield
| | | | | | | | | | | | | | | |
Common Stocks | | | $69,676 | | | Estimated recovery value | | | Probability of asset recovery | | | $0.00-$0.60 ($0.60) | | | Increase |
| | | 7,573,224 | | | Market comparable companies | | | EBIT multiple | | | 12.4x | | | Increase |
Total Common Stocks | | | 7,642,900 | | | | | | | | | | | | |
| | | | | | | | | | | | | | | | |
TABLE OF CONTENTS
Hotchkis & Wiley Funds
Notes to the Financial Statements
JUNE 30, 2024 (Continued)
| | | | | | | | | | | | | | | | |
Convertible Bonds | | | 9,480,821 | | | Estimated recovery value | | | Probability of asset recovery | | | $100.00 | | | Increase |
Bank Loans | | | 1,826,992 | | | Market comparable securities | | | N/A | | | $100.00 | | | Increase |
| | | $18,950,713 | | | | | | | | | | | | |
| | | | | | | | | | | | | | | | |
*
| Unobservable inputs were weighted by the fair value of the investments. |
The following is a reconciliation of Level 3 assets for which significant unobservable inputs were used to determine fair value:
| | | | |
Balance at June 30, 2023 | | | $10,640,354 | | | $2,649,013 | | | $13,289,367 |
Purchases | | | - | | | — | | | — |
Sales | | | (70,701) | | | — | | | (70,701) |
Accrued discounts (premiums) | | | — | | | — | | | — |
Realized gains (losses) | | | — | | | — | | | — |
Change in unrealized appreciation/depreciation | | | 415,255 | | | — | | | 415,255 |
Transfers into Level 3 | | | — | | | — | | | — |
Balance at June 30, 2024 | | | $10,984,908 | | | $2,649,013 | | | $13,633,921 |
Change in unrealized appreciation/depreciation for Level 3 assets held at June 30, 2024 | | | $415,255 | | | $— | | | $415,255 |
| | | | | | | | | | |
| | | | |
Balance at June 30, 2023 | | | $14,657,730 | | | $10,772,299 | | | $— | | | $9,356,564 | | | $34,786,593 |
Purchases | | | — | | | — | | | 29,212,302 | | | 60,226 | | | 29,272,528 |
Sales | | | (1,527,922) | | | (28,937,490) | | | — | | | (7,589,799) | | | (38,055,211) |
Accrued discounts (premiums) | | | — | | | — | | | — | | | 4,202 | | | 4,202 |
Realized gains (losses) | | | 199,140 | | | — | | | — | | | 15,045 | | | 214,185 |
Change in unrealized appreciation/
depreciation | | | (5,686,048) | | | 18,165,191 | | | (19,731,481) | | | (19,246) | | | (7,271,584) |
Transfers into Level 3 | | | — | | | — | | | — | | | — | | | — |
Balance at June 30, 2024 | | | $7,642,900 | | | $— | | | $9,480,821 | | | $1,826,992 | | | $18,950,713 |
Change in unrealized appreciation/depreciation for Level 3 assets held at June 30, 2024 | | | $(5,831,304) | | | $— | | | $(19,731,481) | | | $— | | | $(25,562,785) |
| | | | | | | | | | | | | | | | |
Income and Expense Allocation. Expenses incurred by or attributable to a specific Fund are allocated entirely to that Fund. Expenses incurred by the Trust which do not relate to a specific Fund or Funds are allocated among the Funds per capita. Alternatively, such expenses may be allocated based upon the Funds’ relative net assets as of a recent date or using another methodology based upon a determination by persons authorized by the Board, including either the President or Treasurer of the Trust, that the alternative allocation methodology is fair and equitable taking into consideration the nature and type of the expense.
For all Funds, except the High Yield Fund, net investment income, other than class-specific expenses, and realized and unrealized gains and losses are allocated daily to each class of shares based upon the relative net asset value of outstanding shares of each class at the beginning of the day (after adjusting for the current day’s capital share activity of the respective
TABLE OF CONTENTS
Hotchkis & Wiley Funds
Notes to the Financial Statements
JUNE 30, 2024 (Continued)
class). For the High Yield Fund, net investment income, other than class-specific expenses, and realized and unrealized gains and losses are allocated daily to each class of shares based upon the relative net asset value of settled shares of each class at the beginning of the day (after adjusting for the current day’s capital share activity of the respective class).
Dividends and Distributions to Shareholders. Dividends and distributions to shareholders are recorded on the ex-dividend date. Dividends from net investment income are declared daily and paid monthly for the High Yield Fund and declared and paid annually for the Diversified Value Fund, Large Cap Value Fund, Mid-Cap Value Fund, Small Cap Value Fund, Small Cap Diversified Value Fund, Global Value Fund, International Value Fund, International Small Cap Diversified Value Fund and Value Opportunities Fund. Distributions of net realized capital gains, if any, will be declared and paid at least annually.
Security Transactions and Investment Income. Security and shareholder transactions are recorded on trade date. Realized gains and losses on sales of investments are calculated on the specifically identified cost basis of the securities. Dividend income, less foreign taxes withheld, if any, is recorded on the ex-dividend date. Interest income is recognized on the accrual basis. Market discounts and original issue discounts on fixed-income securities are amortized daily over the expected life of the security using the effective yield method. Market premiums on fixed-income securities are amortized daily on the yield to the next call method. Return of capital distributions received from real estate investment trust (“REIT”) securities are recorded as an adjustment to the cost of the security and thus may impact unrealized gains or losses on the security.
Securities purchased or sold on a when-issued, delayed delivery or forward commitment basis may have extended settlement periods. The value of the security purchased is subject to market fluctuations during this period.
Foreign Currency Transactions. Securities and other assets and liabilities denominated in foreign currencies are translated into U.S. dollar amounts at the date of valuation. Purchases and sales of securities and income and expense items denominated in foreign currencies are translated into U.S. dollar amounts on the respective dates of such transactions. The Funds isolate the portion of realized gains or losses and do not isolate the portion of unrealized appreciation or depreciation resulting from changes in foreign exchange rates on securities from the fluctuations arising from changes in market prices of securities held. Reported net realized foreign exchange gains or losses arise from sales of securities, currency gains or losses realized between the trade and settlement dates on securities transactions and the difference between the amounts of dividends, interest and foreign withholding taxes recorded on the Funds’ books and the U.S. dollar equivalent of the amounts actually received or paid.
Payment In-Kind Securities. Certain Funds may invest in payment in-kind securities. Payment in-kind securities give the issuer the option at each interest payment date of making interest payments in either cash or additional debt securities. Those additional debt securities usually have the same terms, including maturity dates and interest rates, and associated risks as the original bonds. The daily market quotations of the original bonds may include the accrued interest (referred to as a dirty price) and may require a pro-rata adjustment to interest receivable from the unrealized appreciation or depreciation of securities on the Statements of Assets & Liabilities.
Restricted and Illiquid Securities. The Funds may invest in securities that are subject to legal or contractual restrictions on resale or are illiquid. Restricted securities generally may be resold in transactions exempt from registration. An illiquid security is an investment that a Fund reasonably expects cannot be sold or disposed of in current market conditions in seven calendar days or less without the sale or disposition significantly changing the market value of the investment. Disposal of these securities may involve time-consuming negotiations and expense, and prompt sale at the current valuation may be difficult.
Options. The Funds are subject to equity price risk in the normal course of pursuing their investment objectives. The Funds may purchase put options on securities to protect holdings in an underlying or related security against a substantial decline in market value. The Funds may purchase call options on securities and security indexes. A Fund may write a call or put option only if the option is “covered” by the Fund holding a position in the underlying securities or by other means which would permit immediate satisfaction of the Fund’s obligation as writer of the option. Prior to exercise or expiration, an option may be closed by an offsetting purchase or sale of an option of the same series. The purchase and writing of options involves certain risks. If a put or call option purchased by a Fund is not sold when it has remaining value, and if the market price of the underlying security, in the case of a put, remains equal to or greater than the exercise price or, in the case of a call, remains less than or equal to the exercise price, the Fund will lose its entire investment in the option. There can be no assurance that a liquid market
TABLE OF CONTENTS
Hotchkis & Wiley Funds
Notes to the Financial Statements
JUNE 30, 2024 (Continued)
will exist when a Fund seeks to close out an option position. Furthermore, if trading restrictions or suspensions are imposed on the options markets, the Fund may be unable to close out a position. With options, there is minimal counterparty risk to the Funds since options are exchange traded and the exchange’s clearinghouse, as counterparty to all exchange traded options, guarantees the options against default.
When a Fund purchases a put or call option, an amount equal to the premium paid is included on the Statements of Assets & Liabilities as an investment, and is subsequently adjusted to reflect the fair market value of the option. If an option expires on the stipulated expiration date or if the Fund enters into a closing sale transaction, a gain or loss is realized. If the Fund exercises a put option, a gain or loss is realized from the sale of the underlying security, and the proceeds from such sale are decreased by the premium originally paid for the put option. If the Fund exercises a call option, the cost of the security acquired is increased by the premium paid for the call option.
Futures Contracts. The Global Value Fund, International Value Fund, International Small Cap Diversified Value Fund, Value Opportunities Fund and High Yield Fund are subject to foreign currency exchange rate risk in the normal course of pursuing their investment objectives. A Fund may use futures contracts to gain exposure to, or hedge against, changes in the value of foreign currencies. A futures contract provides for the future sale by one party and purchase by another party of an asset at a specified price on a specified date. Upon entering into such contracts, the Fund is required to deposit with the broker, either in cash or securities, an initial margin deposit in an amount equal to a certain percentage of the contract amount. Subsequent payments (variation margin) are made or received by the Fund each day, depending on the daily fluctuations in the value of the contract, and are recorded for financial statement purposes as unrealized gains or losses by the Fund. Upon entering into such contracts, the Fund bears the risk of exchange rates moving unexpectedly, in which case the Fund may not achieve the anticipated benefits of the futures contracts and may realize a loss. When a contract is closed, the Fund records a realized gain or loss equal to the difference between the proceeds from (or cost of) the closing transaction and the Fund’s basis in the contract. With futures, there is minimal counterparty risk to the Fund since futures are exchange traded and the exchange’s clearinghouse, as counterparty to all exchange traded futures, guarantees the futures against default. The use of futures contracts involves the risk of imperfect correlation in movements in the price of the futures contracts, exchange rates and the underlying hedged assets. The Funds did not enter into any futures contracts during the year ended June 30, 2024.
Credit Default Swap Contracts. The Value Opportunities Fund and High Yield Fund may enter into credit default swap agreements for purposes of attempting to obtain a particular desired return at a lower cost to the Fund than if the Fund had invested directly in an instrument that yielded the desired return. The buyer in a credit default swap is obligated to pay the seller a periodic stream of payments over the term of the contract provided no event of default on an underlying reference obligation has occurred. In the event of default, the seller must pay the buyer a net settlement amount in the form of cash or securities equal to the notional amount of the swap less the recovery value of the referenced entity or underlying securities comprising the referenced index. Credit default swaps involve greater risks than if the Fund invested in the reference obligation directly. In addition to general market risks, credit default swaps are subject to illiquidity risk, counterparty risk and credit risk. The Fund’s maximum risk of loss from counterparty risk, either as the protection seller or as the protection buyer, is the fair value of the contract. This risk is mitigated by having a master netting arrangement between the Fund and the counterparty and by the posting of collateral by the counterparty to the Fund to cover the Fund’s exposure to the counterparty.
The Advisor, on behalf of the Value Opportunities Fund and High Yield Fund, is party to an International Swap Dealers Association, Inc. Master Agreement (“ISDA Master Agreement”) with each of Goldman Sachs International and JPMorgan Chase Bank, N.A. that governs transactions, such as over-the-counter swap contracts, entered into by the Funds and the counterparty. The ISDA Master Agreement contains provisions for general obligations, representations, agreements, collateral and events of default or termination. Events of termination include conditions that may entitle the counterparty to elect to terminate early and cause settlement of all outstanding transactions under the ISDA Master Agreement.
Upon entering into swap agreements, the Value Opportunities Fund and High Yield Fund will either receive or pay an upfront payment based upon the difference between the current principal amount and the notional amount of the swap and whether the Fund is buying or selling protection. Upfront payments that are received are recorded as liabilities while upfront payments paid are recorded as assets. These payments remain on the books until the swap contract is closed. When entering into credit default swaps, the Fund will either deliver collateral to the counterparty or the counterparty will deliver collateral to the Fund. The amount of this collateral is calculated based upon the notional value and the current price of the swap. In the event of default, the Fund has recourse against any collateral posted to it by the counterparty. When entering into swap
TABLE OF CONTENTS
Hotchkis & Wiley Funds
Notes to the Financial Statements
JUNE 30, 2024 (Continued)
agreements as a seller, the notional amounts would be partially offset by any recovery values of the respective reference obligations, upfront payments received upon entering into the agreement, or net amounts received from the settlement of buy protection credit default swap agreements entered into by the Fund for the same reference entity. Unrealized appreciation or depreciation is recorded daily as the difference between the prior day and current day closing price. The Funds did not enter into any credit default swap contracts during the year ended June 30, 2024.
Derivative Instruments. The Funds have adopted authoritative standards regarding disclosures about derivatives and how they affect the Funds’ Statements of Assets & Liabilities and Statements of Operations.
The following is a summary of the Funds’ derivative instrument holdings categorized by primary risk exposure as of June 30, 2024:
Asset Derivatives
| | | | | | | |
Equity Contracts:
| | | | | | |
Purchased Put Options | | | Long-term investments | | | $3,522,880 |
| | | | | | | |
The following is a summary of the Funds’ realized gains (losses) and change in unrealized appreciation/depreciation on derivative instruments recognized in the Statements of Operations categorized by primary risk exposure for the year ended June 30, 2024:
Realized Gains (Losses) on Derivatives
| | | | |
Equity Contracts:
| | | |
Purchased Put Options | | | $(5,554,911)* |
| | | | |
*
| Included with net realized gains (losses) from sales of unaffiliated issuers. |
Change in Unrealized Appreciation/Depreciation on Derivatives
| | | | |
Equity Contracts:
| | | |
Purchased Put Options | | | $1,296,931* |
| | | | |
*
| Included with net change in unrealized appreciation/depreciation of securities of unaffiliated issuers and foreign currency translations. |
The following is a summary of the Funds’ average quarterly balance of outstanding derivative instruments categorized by primary risk exposure for the year ended June 30, 2024:
Average Quarterly Balance of Outstanding Derivatives
| | | | |
Equity Contracts:
| | | |
Average Number of Contracts — Purchased Put Options | | | 5,179 |
Average Notional Amount — Purchased Put Options | | | $62,846,150 |
| | | | |
Offsetting Assets and Liabilities. The Funds are subject to various master netting arrangements, which govern the terms of certain transactions with counterparties. The arrangements allow the Funds to close out and net their total exposure to a counterparty in the event of a default with respect to all the transactions governed under a single agreement with a counterparty. For financial reporting purposes, the Funds do not offset financial assets and liabilities that are subject to master netting arrangements in the Statements of Assets & Liabilities.
TABLE OF CONTENTS
Hotchkis & Wiley Funds
Notes to the Financial Statements
JUNE 30, 2024 (Continued)
The following is a summary of the arrangements subject to offsetting as of June 30, 2024:
| | | | | | | |
Securities Lending:
| | | | | | | | | | | | |
Diversified Value | | | $95,077 | | | $ — | | | $(95,077) | | | $ — |
Large Cap Value | | | 1,990,209 | | | — | | | (1,990,209) | | | — |
Mid-Cap Value | | | 4,415,573 | | | — | | | (4,415,573) | | | — |
Small Cap Value | | | 7,895,134 | | | — | | | (7,895,134) | | | — |
Small Cap Diversified Value | | | 2,693,492 | | | — | | | (2,693,492) | | | — |
Value Opportunities | | | 18,990,598 | | | — | | | (18,990,598) | | | — |
| | | | | | | | | | | | | |
*
| Actual collateral received is greater than the amount shown due to overcollateralization. |
NOTE 2. Fees and Transactions with Affiliates.
The Trust has entered into Investment Advisory Agreements for each of the Funds with the Advisor, with which certain officers and a Trustee of the Trust are affiliated. The Advisor is a limited liability company, the primary members of which are HWCap Holdings, a limited liability company with members who are current and former employees of the Advisor, and Stephens - H&W, LLC, a limited liability company whose primary member is SF Holding Corp., which is a diversified holding company. The Advisor is responsible for the management of the Funds’ investments and provides the personnel, facilities, equipment and certain other services necessary to the operations of each Fund. The Advisor receives an Advisory fee, computed daily and payable monthly, at the annual rates presented below as applied to each Fund’s daily net assets. During the year ended June 30, 2024, the Advisor contractually agreed to waive its Advisory fees or reimburse regular Fund operating expenses so that a Fund’s annual operating expenses (excluding sales loads, taxes, leverage interest, brokerage commissions, acquired fund fees and expenses, expenses incurred in connection with any merger or reorganization and extraordinary expenses such as litigation) will be limited to the annual rates presented below as applied to such Fund’s and share class’s average daily net assets.
| | | | | | | | | | | | | | | | | | | | | | | | | | | | | | | |
Annual Advisory
Fee Rate | | | 0.70%1 | | | 0.70%2 | | | 0.75%3 | | | 0.75% | | | 0.65% | | | 0.75% | | | 0.80% | | | 0.80% | | | 0.75% | | | 0.55% |
Annual cap on expenses - Class I | | | 0.80% | | | 0.95% | | | 1.05% | | | 0.97% | | | 0.80% | | | 0.95% | | | 0.95% | | | 0.99% | | | 1.15% | | | 0.70% |
Annual cap on expenses - Class A | | | 1.05% | | | 1.20% | | | 1.30% | | | 1.22% | | | 1.05% | | | 1.20% | | | 1.20% | | | 1.24% | | | 1.40% | | | 0.95% |
Annual cap on expenses - Class C | | | n/a | | | n/a | | | n/a | | | 1.97% | | | n/a | | | n/a | | | n/a | | | n/a | | | 2.15% | | | n/a |
Annual cap on expenses - Class Z | | | 0.80% | | | 0.95% | | | 1.05% | | | 0.97% | | | 0.80% | | | 0.95% | | | 0.95% | | | 0.99% | | | 1.15% | | | 0.60% |
| | | | | | | | | | | | | | | | | | | | | | | | | | | | | | | |
1
| The Annual Advisory Fee Rate is 0.70% for the first $250 million in assets, 0.60% for the next $250 million in assets and 0.50% thereafter. |
2
| The Annual Advisory Fee Rate is 0.70% for the first $500 million in assets, 0.60% for the next $500 million in assets and 0.55% thereafter. |
3
| The Annual Advisory Fee Rate is 0.75% for the first $5 billion in assets, 0.65% for the next $5 billion in assets and 0.60% thereafter. |
TABLE OF CONTENTS
Hotchkis & Wiley Funds
Notes to the Financial Statements
JUNE 30, 2024 (Continued)
Quasar Distributors, LLC is the principal underwriter and distributor for the shares of the Funds (“Quasar” or the “Distributor”). Pursuant to the Distribution Plan adopted by the Trust in accordance with Rule 12b-1 under the 1940 Act, the Funds pay the Distributor ongoing distribution and service fees. The fees are accrued daily at the annual rates based upon the average daily net assets of the shares as follows:
| | | | |
Class A | | | 0.25% |
Class C | | | 1.00% |
| | | | |
Pursuant to separate agreements with the Distributor, selected dealers and other financial intermediaries also provide distribution services to the Funds. The ongoing distribution and service fee compensates the Distributor and selected dealers for providing distribution-related and shareholder services to Class A and Class C shareholders.
Certain selected dealers and other financial intermediaries charge a fee for shareholder accounting services and administrative services that they provide to the Funds on behalf of certain shareholders; the portion of this fee paid by the Funds is included within “Transfer agent fees and expenses” in the Statements of Operations. Class Z shares are not subject to these fees.
The Funds are permitted to purchase securities from or sell securities to another Fund or affiliated person under procedures adopted by the Board. During the year ended June 30, 2024, the Funds did not have any of these purchases and sales.
NOTE 3. Investments.
Purchases and sales of investment securities, excluding short-term investments, for the year ended June 30, 2024 were as follows:
| | | | | | | | | | | | | | | | | | | | | | | | | | | | | | | |
Purchases | | | $46,308,222 | | | $81,673,106 | | | $126,641,694 | | | $332,457,457 | | | $470,976,685 | | | $16,414,410 | | | $1,207,715 | | | $4,911,517 | | | $428,161,371 | | | $388,033,385 |
Sales | | | 33,702,776 | | | 158,258,908 | | | 209,659,519 | | | 340,855,927 | | | 403,549,571 | | | 18,233,892 | | | 1,264,447 | | | 4,409,438 | | | 415,256,481 | | | 404,114,531 |
| | | | | | | | | | | | | | | | | | | | | | | | | | | | | | | |
The Funds did not have any purchases or sales of U.S. Government securities for the year ended June 30, 2024.
NOTE 4. Federal Income Taxes
It is each Fund’s policy to comply with the requirements of the Internal Revenue Code applicable to regulated investment companies and each Fund intends to distribute substantially all of its investment company net taxable income and net capital gains to shareholders. Therefore, no federal income tax provision is required. Under the applicable foreign tax law, a withholding tax may be imposed on interest, dividends and capital gains at various rates.
Distributions paid to shareholders are based on net investment income and net realized gains determined on a tax basis, which may differ from net investment income and net realized gains for financial reporting purposes. The fiscal year in which amounts are distributed may differ from the year in which the net investment income and net realized gains are recorded by the Funds for financial reporting purposes. The Funds may utilize earnings and profits distributed to shareholders on redemptions of shares as part of the dividends paid deduction. Generally accepted accounting principles require that permanent financial reporting and tax differences be reclassified within the capital accounts.
TABLE OF CONTENTS
Hotchkis & Wiley Funds
Notes to the Financial Statements
JUNE 30, 2024 (Continued)
The following information is presented on an income tax basis as of June 30, 2024:
| | | | | | | | | | | | | | | | | | | | | | | | | | | | | | | |
Tax cost of investments | | | $95,724,752 | | | $295,352,729 | | | $375,350,704 | | | $666,394,742 | | | $734,319,907 | | | $31,655,434 | | | $3,140,426 | | | $7,445,271 | | | $562,744,070 | | | $955,579,508 |
Gross unrealized appreciation | | | 23,579,767 | | | 85,289,747 | | | 97,784,623 | | | 153,352,981 | | | 132,059,314 | | | 7,108,021 | | | 679,713 | | | 973,856 | | | 101,309,067 | | | 19,309,180 |
Gross unrealized depreciation | | | (8,927,192) | | | (32,721,247) | | | (48,736,376) | | | (64,243,921) | | | (90,387,232) | | | (2,113,798) | | | (250,237) | | | (540,811) | | | (30,751,990) | | | (112,468,482) |
Net unrealized appreciation/
depreciation | | | 14,652,575 | | | 52,568,500 | | | 49,048,247 | | | 89,109,060 | | | 41,672,082 | | | 4,994,223 | | | 429,476 | | | 433,045 | | | 70,557,077 | | | (93,159,302) |
Distributable ordinary income
(as of 6/30/24)* | | | 1,026,860 | | | 2,744,439 | | | 4,469,804 | | | 18,915,083 | | | 608,482 | | | 709,150 | | | 77,062 | | | 317,441 | | | 9,163,760 | | | 1,619,943 |
Distributable long-term gains (as of 6/30/24) | | | — | | | 32,075,815 | | | — | | | 14,238,410 | | | 10,808,338 | | | 3,070,218 | | | 249,574 | | | 401,477 | | | 39,863,170 | | | — |
Total distributable
earnings | | | 1,026,860 | | | 34,820,254 | | | 4,469,804 | | | 33,153,493 | | | 11,416,820 | | | 3,779,368 | | | 326,636 | | | 718,918 | | | 49,026,930 | | | 1,619,943 |
Other accumulated gains (losses) | | | (11,824,658) | | | 1 | | | (197,757,578) | | | (23,598) | | | — | | | — | | | — | | | — | | | (4,245) | | | (368,918,020) |
Total accumulated gains (losses) | | | $3,854,777 | | | $87,388,755 | | | $(144,239,527) | | | $122,238,955 | | | $53,088,902 | | | $8,773,591 | | | $756,112 | | | $1,151,963 | | | $119,579,762 | | | $(460,457,379) |
| | | | | | | | | | | | | | | | | | | | | | | | | | | | | | | |
*
| Includes distributable short-term gains of $12,297,697 for the Small Cap Value Fund, $328,673 for the Global Value Fund, $4,943 for the International Value Fund, $152,529 for the International Small Cap Diversified Value Fund and $3,491,393 for the Value Opportunities Fund. |
As of the close of business on December 31, 2012, in exchange for shares the Advisor transferred assets valued at $1,132,946 to the Global Value Fund. As a result of the tax-deferred transfers, the Global Value Fund acquired $50,230 of unrealized appreciation for tax purposes. As of June 30, 2024, the Global Value Fund held securities with $2,930 of net unrealized appreciation relating to the transfers.
As of the close of business on June 30, 2014, in exchange for shares Stephens Investment Holdings LLC transferred assets valued at $5,038,896 to the Small Cap Diversified Value Fund. As a result of the tax-deferred transfers, the Small Cap Diversified Value Fund acquired $592,438 of unrealized appreciation for tax purposes. As of June 30, 2024, the Small Cap Diversified Value Fund held securities with $8,905 of net unrealized appreciation relating to the transfers.
On the Statements of Assets & Liabilities, the following adjustments were made for permanent tax differences. These differences are due primarily to differing treatment for items such as equalization.
| | | | | | | |
Diversified Value | | | $— | | | $— |
Large Cap Value | | | 2,410,082 | | | (2,410,082) |
Mid-Cap Value | | | — | | | — |
Small Cap Value | | | 4,746,481 | | | (4,746,481) |
Small Cap Diversified Value | | | 3,377,407 | | | (3,377,407) |
Global Value | | | — | | | — |
International Value | | | — | | | — |
International Small Cap Diversified Value | | | — | | | — |
Value Opportunities | | | — | | | — |
High Yield | | | — | | | — |
| | | | | | | |
TABLE OF CONTENTS
Hotchkis & Wiley Funds
Notes to the Financial Statements
JUNE 30, 2024 (Continued)
The tax components of distributions paid during the fiscal years ended June 30, 2024 and 2023, capital loss carryovers as of June 30, 2024, and any tax basis late year losses as of June 30, 2024, which are not recognized for tax purposes until the first day of the following fiscal year, are:
| | | | | | | |
Diversified Value | | | $1,589,935 | | | $— | | | $666,644 | | | $11,158,014 | | | $11,659,237 | | | $867,545 | | | $— |
Large Cap Value | | | 5,693,697 | | | 33,320,090 | | | — | | | — | | | — | | | 4,455,115 | | | 25,649,031 |
Mid-Cap Value | | | 1,203,269 | | | — | | | 75,116,409 | | | 122,640,690 | | | 50,533,729 | | | 2,143,120 | | | — |
Small Cap Value | | | 7,137,121 | | | 7,893,778 | | | — | | | — | | | — | | | 10,322,241 | | | 68,610,623 |
Small Cap Diversified Value | | | 31,751,876 | | | 32,753,872 | | | — | | | — | | | — | | | 15,676,116 | | | 35,772,589 |
Global Value | | | 579,768 | | | 3,001,856 | | | — | | | — | | | — | | | 356,748 | | | 953,777 |
International Value | | | 109,301 | | | 172,471 | | | — | | | — | | | — | | | 59,717 | | | 30,330 |
International Small Cap Diversified Value | | | 454,903 | | | — | | | — | | | — | | | — | | | 111,448 | | | 200,195 |
Value Opportunities | | | 17,192,487 | | | 30,766,728 | | | — | | | — | | | — | | | 1,067,989 | | | 10,681,957 |
High Yield3 | | | 57,749,731 | | | — | | | 11,019,442 | | | 351,804,093 | | | — | | | 47,336,279 | | | — |
| | | | | | | | | | | | | | | | | | | | | | |
1
| Short-term with no expiration. |
2
| Long-term with no expiration. |
3
| The High Yield Fund inherited a short-term capital loss carryover of $922,717 and a long-term capital loss carryover of $3,566,005 as a result of the reorganization of the Hotchkis & Wiley Capital Income Fund into the High Yield Fund, which are included in the totals. These capital loss carryovers are further subject to an annual limitation of $171,228 pursuant to Internal Revenue Code Section 382. |
As of and during the year ended June 30, 2024, the Funds did not have a liability for any unrecognized tax benefits. The Funds recognize interest and penalties, if any, related to unrecognized tax benefits as income tax expense in the Statements of Operations. During the year ended June 30, 2024, the Funds did not incur any interest or penalties. The tax years ended June 30, 2021 through June 30, 2024 remain open and subject to examination by tax jurisdictions.
NOTE 5. Capital Share Transactions.
Transactions in capital shares for each class were as follows:
| | | | | | | | | | | | | |
Year Ended June 30, 2024
|
Diversified Value Fund
|
Class I | | | 868,645 | | | $23,905,326 | | | 37,795 | | | $1,024,253 | | | (464,149) | | | $(13,414,369) | | | 442,291 | | | $11,515,210 |
Class A (Note 10) | | | 178,257 | | | 4,964,393 | | | 8,485 | | | 231,304 | | | (116,676) | | | (3,361,175) | | | 70,066 | | | 1,834,522 |
Class C (Note 10) | | | 246 | | | 7,021 | | | 14 | | | 378 | | | (21,851) | | | (669,974) | | | (21,591) | | | (662,575) |
Total net increase (decrease) | | | 1,047,148 | | | 28,876,740 | | | 46,294 | | | 1,255,935 | | | (602,676) | | | (17,445,518) | | | 490,766 | | | 12,687,157 |
Large Cap Value Fund
|
Class I | | | 495,689 | | | 20,488,087 | | | 560,489 | | | 21,421,902 | | | (1,564,616) | | | (65,819,036) | | | (508,438) | | | (23,909,047) |
Class A (Note 10) | | | 297,593 | | | 12,354,535 | | | 164,990 | | | 6,271,287 | | | (700,337) | | | (28,817,685) | | | (237,754) | | | (10,191,863) |
Class C (Note 10) | | | 10,320 | | | 416,870 | | | 5,608 | | | 212,149 | | | (97,925) | | | (4,173,538) | | | (81,997) | | | (3,544,519) |
Class Z | | | 25,240 | | | 1,038,182 | | | 34,700 | | | 1,325,184 | | | (80,004) | | | (3,326,067) | | | (20,064) | | | (962,701) |
Total net increase (decrease) | | | 828,842 | | | 34,297,674 | | | 765,787 | | | 29,230,522 | | | (2,442,882) | | | (102,136,326) | | | (848,253) | | | (38,608,130) |
| | | | | | | | | | | | | | | | | | | | | | | | | |
TABLE OF CONTENTS
Hotchkis & Wiley Funds
Notes to the Financial Statements
JUNE 30, 2024 (Continued)
| | | | | | | | | | | | | |
Mid-Cap Value Fund
|
Class I | | | 910,020 | | | $46,767,268 | | | 16,857 | | | $841,345 | | | (2,021,150) | | | $(104,748,233) | | | (1,094,273) | | | $(57,139,620) |
Class A (Note 10) | | | 234,538 | | | 11,946,705 | | | 1,433 | | | 70,312 | | | (614,601) | | | (31,135,070) | | | (378,630) | | | (19,118,053) |
Class C (Note 10) | | | 7,176 | | | 302,017 | | | — | | | — | | | (121,397) | | | (5,503,934) | | | (114,221) | | | (5,201,917) |
Class Z | | | 162,880 | | | 8,339,702 | | | 2,808 | | | 140,115 | | | (134,809) | | | (7,002,936) | | | 30,879 | | | 1,476,881 |
Total net increase (decrease) | | | 1,314,614 | | | 67,355,692 | | | 21,098 | | | 1,051,772 | | | (2,891,957) | | | (148,390,173) | | | (1,556,245) | | | (79,982,709) |
Small Cap Value Fund
|
Class I | | | 2,781,820 | | | 203,513,689 | | | 74,524 | | | 5,273,317 | | | (2,707,515) | | | (200,441,122) | | | 148,829 | | | 8,345,884 |
Class A | | | 165,446 | | | 12,079,750 | | | 11,530 | | | 810,594 | | | (212,816) | | | (15,695,609) | | | (35,840) | | | (2,805,265) |
Class C | | | 24,732 | | | 1,418,105 | | | 844 | | | 45,139 | | | (6,673) | | | (375,691) | | | 18,903 | | | 1,087,553 |
Class Z | | | 194,945 | | | 14,439,630 | | | 3,796 | | | 268,509 | | | (49,699) | | | (3,703,081) | | | 149,042 | | | 11,005,058 |
Total net increase (decrease) | | | 3,166,943 | | | 231,451,174 | | | 90,694 | | | 6,397,559 | | | (2,976,703) | | | (220,215,503) | | | 280,934 | | | 17,633,230 |
Small Cap Diversified Value Fund
|
Class I | | | 21,438,459 | | | 259,865,010 | | | 4,365,396 | | | 50,376,673 | | | (25,532,554) | | | (310,597,822) | | | 271,301 | | | (356,139) |
Class A | | | 1,612,238 | | | 19,506,115 | | | 198,295 | | | 2,270,482 | | | (926,759) | | | (11,141,173) | | | 883,774 | | | 10,635,424 |
Class Z | | | 13,089,554 | | | 158,348,397 | | | 725,862 | | | 8,369,184 | | | (4,495,635) | | | (54,981,292) | | | 9,319,781 | | | 111,736,289 |
Total net increase (decrease) | | | 36,140,251 | | | 437,719,522 | | | 5,289,553 | | | 61,016,339 | | | (30,954,948) | | | (376,720,287) | | | 10,474,856 | | | 122,015,574 |
Global Value Fund
|
Class I | | | 149,916 | | | 2,201,670 | | | 246,518 | | | 3,394,554 | | | (361,825) | | | (5,149,439) | | | 34,609 | | | 446,785 |
Class A | | | 84,895 | | | 1,232,247 | | | 13,284 | | | 183,319 | | | (36,729) | | | (546,970) | | | 61,450 | | | 868,596 |
Total net increase (decrease) | | | 234,811 | | | 3,433,917 | | | 259,802 | | | 3,577,873 | | | (398,554) | | | (5,696,409) | | | 96,059 | | | 1,315,381 |
International Value Fund
|
Class I | | | 14,834 | | | 183,444 | | | 13,301 | | | 153,363 | | | (14,358) | | | (175,678) | | | 13,777 | | | 161,129 |
Total net increase (decrease) | | | 14,834 | | | 183,444 | | | 13,301 | | | 153,363 | | | (14,358) | | | (175,678) | | | 13,777 | | | 161,129 |
International Small Cap Diversified Value Fund
|
Class I | | | 52,106 | | | 644,280 | | | 23,125 | | | 256,223 | | | (178) | | | (1,967) | | | 75,053 | | | 898,536 |
Total net increase (decrease) | | | 52,106 | | | 644,280 | | | 23,125 | | | 256,223 | | | (178) | | | (1,967) | | | 75,053 | | | 898,536 |
Value Opportunities Fund
|
Class I | | | 3,936,507 | | | 143,022,217 | | | 540,954 | | | 18,468,178 | | | (2,981,991) | | | (110,212,686) | | | 1,495,470 | | | 51,277,709 |
Class A | | | 668,418 | | | 24,515,551 | | | 157,575 | | | 5,379,603 | | | (497,985) | | | (18,270,560) | | | 328,008 | | | 11,624,594 |
Class C | | | 62,553 | | | 2,030,425 | | | 36,822 | | | 1,124,178 | | | (335,448) | | | (11,021,597) | | | (236,073) | | | (7,866,994) |
Class Z | | | 107,042 | | | 3,893,477 | | | 137,088 | | | 4,681,561 | | | (66,756) | | | (2,520,546) | | | 177,374 | | | 6,054,492 |
Total net increase (decrease) | | | 4,774,520 | | | 173,461,670 | | | 872,439 | | | 29,653,520 | | | (3,882,180) | | | (142,025,389) | | | 1,764,779 | | | 61,089,801 |
High Yield Fund
|
Class I | | | 22,470,789 | | | 231,355,976 | | | 2,973,741 | | | 30,647,327 | | | (28,471,433) | | | (293,513,157) | | | (3,026,903) | | | (31,509,854) |
Class A (Note 10) | | | 3,330,853 | | | 34,357,084 | | | 141,833 | | | 1,447,611 | | | (605,464) | | | (6,154,737) | | | 2,867,222 | | | 29,649,958 |
Class C (Note 10) | | | 8,212 | | | 85,322 | | | 1,545 | | | 15,872 | | | (70,284) | | | (730,320) | | | (60,527) | | | (629,126) |
Class Z | | | 1,791,682 | | | 18,474,009 | | | 618,600 | | | 6,365,197 | | | (5,222,856) | | | (54,170,790) | | | (2,812,574) | | | (29,331,584) |
Total net increase (decrease) | | | 27,601,536 | | | 284,272,391 | | | 3,735,719 | | | 38,476,007 | | | (34,370,037) | | | (354,569,004) | | | (3,032,782) | | | (31,820,606) |
| | | | | | | | | | | | | | | | | | | | | | | | | |
TABLE OF CONTENTS
Hotchkis & Wiley Funds
Notes to the Financial Statements
JUNE 30, 2024 (Continued)
| | | | | | | | | | | | | |
Year Ended June 30, 2023
|
Diversified Value Fund
|
Class I | | | 58,373 | | | $ 1,442,777 | | | 22,386 | | | $553,836 | | | (527,785) | | | $(13,119,187) | | | (447,026) | | | $(11,122,574) |
Class A | | | 19,305 | | | 471,178 | | | 4,525 | | | 112,488 | | | (129,240) | | | (3,193,964) | | | (105,410) | | | (2,610,298) |
Class C | | | 127 | | | 3,200 | | | — | | | — | | | (10,291) | | | (239,399) | | | (10,164) | | | (236,199) |
Total net increase (decrease) | | | 77,805 | | | 1,917,155 | | | 26,911 | | | 666,324 | | | (667,316) | | | (16,552,550) | | | (562,600) | | | (13,969,071) |
Large Cap Value Fund
|
Class I | | | 868,592 | | | 34,725,285 | | | 392,981 | | | 15,385,213 | | | (1,433,743) | | | (57,215,795) | | | (172,170) | | | (7,105,297) |
Class A | | | 638,023 | | | 24,994,660 | | | 117,448 | | | 4,574,592 | | | (1,335,883) | | | (51,997,903) | | | (580,412) | | | (22,428,651) |
Class C | | | 10,301 | | | 405,916 | | | 5,718 | | | 221,324 | | | (56,704) | | | (2,248,415) | | | (40,685) | | | (1,621,175) |
Class Z | | | 135,866 | | | 5,324,833 | | | 48,783 | | | 1,908,879 | | | (768,849) | | | (31,820,617) | | | (584,200) | | | (24,586,905) |
Total net increase (decrease) | | | 1,652,782 | | | 65,450,694 | | | 564,930 | | | 22,090,008 | | | (3,595,179) | | | (143,282,730) | | | (1,377,467) | | | (55,742,028) |
Mid-Cap Value Fund
|
Class I | | | 1,725,400 | | | 77,370,139 | | | 32,858 | | | 1,467,432 | | | (2,567,562) | | | (114,030,214) | | | (809,304) | | | (35,192,643) |
Class A | | | 564,906 | | | 24,449,908 | | | 4,204 | | | 184,638 | | | (712,098) | | | (31,230,914) | | | (142,988) | | | (6,596,368) |
Class C | | | 21,783 | | | 848,036 | | | — | | | — | | | (37,003) | | | (1,420,249) | | | (15,220) | | | (572,213) |
Class Z | | | 84,939 | | | 3,698,022 | | | 4,128 | | | 184,263 | | | (187,604) | | | (8,362,839) | | | (98,537) | | | (4,480,554) |
Total net increase (decrease) | | | 2,397,028 | | | 106,366,105 | | | 41,190 | | | 1,836,333 | | | (3,504,267) | | | (155,044,216) | | | (1,066,049) | | | (46,841,778) |
Small Cap Value Fund
|
Class I | | | 4,208,260 | | | 293,018,122 | | | 477,717 | | | 31,538,893 | | | (3,426,632) | | | (235,852,642) | | | 1,259,345 | | | 88,704,373 |
Class A | | | 315,417 | | | 22,210,509 | | | 68,050 | | | 4,468,184 | | | (163,139) | | | (11,074,858) | | | 220,328 | | | 15,603,835 |
Class C | | | 24,116 | | | 1,330,153 | | | 4,339 | | | 219,175 | | | (9,498) | | | (507,303) | | | 18,957 | | | 1,042,025 |
Class Z | | | 82,971 | | | 5,750,091 | | | 17,769 | | | 1,172,550 | | | (79,005) | | | (5,580,251) | | | 21,735 | | | 1,342,390 |
Total net increase (decrease) | | | 4,630,764 | | | 322,308,875 | | | 567,875 | | | 37,398,802 | | | (3,678,274) | | | (253,015,054) | | | 1,520,365 | | | 106,692,623 |
Small Cap Diversified Value Fund
|
Class I | | | 21,662,855 | | | 259,315,580 | | | 3,947,789 | | | 47,018,170 | | | (19,399,756) | | | (235,044,070) | | | 6,210,888 | | | 71,289,680 |
Class A | | | 2,768,297 | | | 33,054,492 | | | 45,445 | | | 538,069 | | | (333,166) | | | (3,994,463) | | | 2,480,576 | | | 29,598,098 |
Class Z | | | 7,444,070 | | | 91,427,214 | | | 221,201 | | | 2,632,297 | | | (1,517,680) | | | (19,119,794) | | | 6,147,591 | | | 74,939,717 |
Total net increase (decrease) | | | 31,875,222 | | | 383,797,286 | | | 4,214,435 | | | 50,188,536 | | | (21,250,602) | | | (258,158,327) | | | 14,839,055 | | | 175,827,495 |
Global Value Fund
|
Class I | | | 209,647 | | | 2,736,541 | | | 98,305 | | | 1,263,214 | | | (615,344) | | | (8,347,201) | | | (307,392) | | | (4,347,446) |
Class A | | | 10,557 | | | 143,991 | | | 3,651 | | | 46,949 | | | (8,982) | | | (120,261) | | | 5,226 | | | 70,679 |
Total net increase (decrease) | | | 220,204 | | | 2,880,532 | | | 101,956 | | | 1,310,163 | | | (624,326) | | | (8,467,462) | | | (302,166) | | | (4,276,767) |
International Value Fund
|
Class I | | | 4,849 | | | 55,426 | | | 4,397 | | | 46,789 | | | (160) | | | (1,724) | | | 9,086 | | | 100,491 |
Total net increase (decrease) | | | 4,849 | | | 55,426 | | | 4,397 | | | 46,789 | | | (160) | | | (1,724) | | | 9,086 | | | 100,491 |
International Small Cap Diversified Value Fund
|
Class I | | | 6,948 | | | 78,233 | | | 16,426 | | | 170,335 | | | (108) | | | (1,119) | | | 23,266 | | | 247,449 |
Total net increase (decrease) | | | 6,948 | | | 78,233 | | | 16,426 | | | 170,335 | | | (108) | | | (1,119) | | | 23,266 | | | 247,449 |
| | | | | | | | | | | | | | | | | | | | | | | | | |
TABLE OF CONTENTS
Hotchkis & Wiley Funds
Notes to the Financial Statements
JUNE 30, 2024 (Continued)
| | | | | | | | | | | | | |
Value Opportunities Fund
|
Class I | | | 2,400,650 | | | $79,099,826 | | | 142,727 | | | $4,574,388 | | | (2,909,676) | | | $(92,580,977) | | | (366,299) | | | $(8,906,763) |
Class A | | | 278,221 | | | 9,199,549 | | | 42,933 | | | 1,375,990 | | | (441,687) | | | (14,375,081) | | | (120,533) | | | (3,799,542) |
Class C | | | 36,516 | | | 1,087,462 | | | 14,132 | | | 408,846 | | | (200,613) | | | (5,881,419) | | | (149,965) | | | (4,385,111) |
Class Z | | | 26,685 | | | 900,593 | | | 35,327 | | | 1,132,228 | | | (14,297) | | | (448,622) | | | 47,715 | | | 1,584,199 |
Total net increase (decrease) | | | 2,742,072 | | | 90,287,430 | | | 235,119 | | | 7,491,452 | | | (3,566,273) | | | (113,286,099) | | | (589,082) | | | (15,507,217) |
High Yield Fund
|
Class I | | | 35,060,777 | | | 351,940,326 | | | 2,717,597 | | | 27,222,670 | | | (31,792,242) | | | (317,555,463) | | | 5,986,132 | | | 61,607,533 |
Class A | | | 853,540 | | | 8,539,861 | | | 135,655 | | | 1,345,640 | | | (1,131,098) | | | (11,322,133) | | | (141,903) | | | (1,436,632) |
Class C | | | 10,269 | | | 104,755 | | | 2,470 | | | 24,709 | | | (61,878) | | | (612,288) | | | (49,139) | | | (482,824) |
Class Z | | | 2,867,417 | | | 28,835,960 | | | 628,414 | | | 6,294,770 | | | (2,177,730) | | | (21,863,434) | | | 1,318,101 | | | 13,267,296 |
Total net increase (decrease) | | | 38,792,003 | | | 389,420,902 | | | 3,484,136 | | | 34,887,789 | | | (35,162,948) | | | (351,353,318) | | | 7,113,191 | | | 72,955,373 |
| | | | | | | | | | | | | | | | | | | | | | | | | |
NOTE 6. Investments in Affiliated Issuers.
An issuer in which a Fund’s holdings represent 5% or more of the outstanding voting securities of the issuer is an “affiliated” issuer as defined in the 1940 Act. A schedule of each Fund’s investments in securities of affiliated issuers held during the year ended June 30, 2024, is set forth below:
Small Cap Value
| | | | | | | | | | | | | | | | | | | | | | | | | |
Hudson Global, Inc. | | | $ 3,280,985 | | | $ — | | | $ — | | | $ — | | | $ (831,675) | | | $ 2,449,310 | | | $ — | | | 147,460 |
| | | $3,280,985 | | | $— | | | $— | | | $— | | | $(831,675) | | | $2,449,310 | | | $— | | | |
| | | | | | | | | | | | | | | | | | | | | | | | | |
Value Opportunities Fund
| | | | | | | | | | | | | | | | | | | | | | | | | |
Iracore Investments Holdings, Inc. | | | $10,178,239 | | | $ — | | | $ — | | | $ — | | | $802,444 | | | $10,980,683 | | | $566,882 | | | 32,422 |
| | | $10,178,239 | | | $— | | | $— | | | $— | | | $ 802,444 | | | $10,980,683 | | | $566,882 | | | |
| | | | | | | | | | | | | | | | | | | | | | | | | |
TABLE OF CONTENTS
Hotchkis & Wiley Funds
Notes to the Financial Statements
JUNE 30, 2024 (Continued)
High Yield Fund
| | | | | | | | | | | | | | | | | | | | | | | | | |
Iracore Investments
Holdings, Inc. | | | $7,019,789 | | | $ — | | | $— | | | $ — | | | $553,435 | | | $ 7,573,224 | | | $390,970 | | | 22,361 |
Metals Recovery
Holdings LLC | | | 7,620,273 | | | — | | | (1,165,858)* | | | — | | | (6,384,739) | | | 69,676 | | | — | | | 116,127 |
PetroQuest Energy, Inc. | | | 0 | | | — | | | — | | | — | | | — | | | 0 | | | — | | | 89,691 |
| | | $14,640,062 | | | $— | | | $(1,165,858) | | | $— | | | $(5,831,304) | | | $7,642,900 | | | $390,970 | | | |
| | | | | | | | | | | | | | | | | | | | | | | | | |
*
| Reduction due to return of capital distributions. |
NOTE 7. Securities Lending.
The Trust, on behalf of the Funds, entered into a securities lending arrangement with Brown Brothers Harriman & Co. (the “Custodian”). Under the securities lending agreement, the Custodian is authorized to loan securities on behalf of the Funds to approved brokers. In exchange, the Funds receive cash collateral in the amount of at least 102% of the value of the securities loaned plus accrued interest. The total market value of securities on loan for each Fund is disclosed on the Schedule of Investments. The cash collateral is invested in short-term instruments as noted on the Schedule of Investments. The contractual maturity of the cash collateral received under the securities lending agreement is classified as overnight and continuous. Income earned from these investments is included in “Securities on loan, net” on the Statements of Operations and is allocated to each Fund based on each Fund’s proportion of the total cash collateral received. Securities lending involves counterparty risks, including the risk that the loaned securities may not be returned in a timely manner or at all. Subject to certain conditions, the Custodian has agreed to indemnify the Funds from losses resulting from a borrower’s failure to return a loaned security. In addition, the Funds bear the risk of loss associated with the investment of cash collateral received.
A portion of the income generated by the investment of the collateral, net of any rebates paid by the Custodian to borrowers, is remitted to the Custodian as lending agent, and the remainder is paid to the applicable Fund.
NOTE 8. Commitments and Contingencies.
Under the Trust’s organizational documents and indemnification agreements between each independent Trustee and the Trust, its officers and Trustees are indemnified against certain liabilities arising out of the performance of their duties to the Trust. In addition, in the normal course of business the Trust enters into contracts that contain a variety of representations and warranties, which provide general indemnifications. The Funds’ maximum exposure under these arrangements is unknown, as this would involve future claims that may be made against the Funds.
Bridge loan commitments may obligate a Fund to furnish temporary financing to a borrower until permanent financing can be arranged. At June 30, 2024, the Funds did not have any outstanding bridge loan commitments.
Unfunded loan commitments are contractual obligations for funding to a borrower. At June 30, 2024, the Funds did not have any outstanding unfunded loan commitments.
NOTE 9. Risk Factors.
Investing in a Fund may involve certain risks including, but not limited to, those described below. Lower rated debt securities generally have higher rates of interest and involve greater risk of default or price changes due to changes in the issuer’s creditworthiness than higher rated debt securities. The market prices of these securities may fluctuate more than higher quality securities and may decline significantly in periods of general economic difficulty. There may be little trading in the secondary market for particular debt securities, which may make them more difficult to value or sell.
The prices of, and the income generated by, most debt securities held by a Fund may be affected by changing interest rates and by changes in the effective maturities and credit ratings of these securities. For example, the prices of debt securities in a Fund’s portfolio generally will decline when interest rates rise and increase when interest rates fall. In addition, falling interest rates may cause an issuer to redeem, “call” or refinance a security before its stated maturity, which may result in the Fund
TABLE OF CONTENTS
Hotchkis & Wiley Funds
Notes to the Financial Statements
JUNE 30, 2024 (Continued)
having to reinvest the proceeds in lower yielding securities. Debt securities are also subject to credit risk, which is the possibility that the credit strength of an issuer will weaken and/or an issuer of a debt security will fail to make timely payments of principal or interest and the security will go into default. Longer maturity debt securities generally have higher rates of interest and may be subject to greater price fluctuations than shorter maturity debt securities.
Certain Funds may invest in foreign (non-U.S.) securities and may experience more rapid and extreme changes in value than a fund that invests exclusively in securities of U.S. companies. The securities markets of many foreign countries are relatively small, with a limited number of companies representing a small number of industries. Additionally, reporting, accounting and auditing standards of foreign countries differ, in some cases significantly, from U.S. standards. Also, nationalization, expropriation or confiscatory taxation, currency blockage, political changes or diplomatic developments could adversely affect a Fund’s investments in a foreign country.
Certain Funds invest a significant portion of their assets in companies in the financial sector, and therefore the performance of the Funds could be negatively impacted by events affecting this sector. This sector can be significantly affected by changes in interest rates, the rate of corporate and consumer debt defaults, the availability and cost of borrowing and raising capital, reduced credit market liquidity, regulatory changes, price competition, bank failures and other financial crises, and general economic and market conditions.
The Funds are subject to management risk because each Fund is an actively managed investment portfolio. Consequently, the Funds are subject to the risks that the methods and analysis employed by the Advisor may not produce the desired results and result in losses to the Funds.
The prices of, and the income generated by, securities held by a Fund may decline in response to certain events taking place around the world, including those directly involving the issuers whose securities are owned by the Fund. These events can include changes in economic, political or financial market conditions due to war, acts of terrorism, the spread of infectious illness or other public health issues, financial crises, and recessions, as well as investor sentiment regarding these issues.
Certain funds, accounts, individuals or affiliates may from time to time own (beneficially or of record) or control a significant percentage of a Fund’s shares. Redemptions by these entities of their holdings in the Fund may impact the Fund’s liquidity and net asset value (“NAV”). These redemptions may also force the Fund to sell securities.
NOTE 10. Class C Shares.
The Board approved closing the Class C shares of the Diversified Value Fund, Large Cap Value Fund, Mid-Cap Value Fund and High Yield Fund and converting Class C shares to Class A shares of each respective Fund effective on May 31, 2024 (the “Conversion”). The Conversion was accomplished by a tax-free exchange of Class C shares for Class A shares in the following amounts and at the following conversion ratios:
| | | | | | | | | | |
Diversified Value | | | $585,816 | | | 18,764 | | | 1.001636 | | | 18,795 |
Large Cap Value | | | 2,928,480 | | | 67,703 | | | 0.991691 | | | 67,140 |
Mid-Cap Value | | | 3,965,899 | | | 85,609 | | | 0.856339 | | | 73,310 |
High Yield | | | 474,575 | | | 45,557 | | | 1.009252 | | | 45,979 |
| | | | | | | | | | | | | |
NOTE 11. New Accounting Pronouncements.
In June 2022, FASB issued Accounting Standards Update (“ASU”) No. 2022-03, Fair Value Measurement (Topic 820): Fair Value Measurement of Equity Securities Subject to Contractual Sale Restrictions. The amendments in this update clarify the guidance in Topic 820 when measuring the fair value of an equity security subject to contractual sale restrictions and introduce new disclosure requirements related to such equity securities. The amendments are effective for fiscal years beginning after December 15, 2023, with early adoption permitted. Management is currently evaluating the impact of this guidance on the Funds’ financial statements.
TABLE OF CONTENTS
Hotchkis & Wiley Funds
Notes to the Financial Statements
JUNE 30, 2024 (Continued)
NOTE 12. Subsequent Events.
Effective August 29, 2024, the Board approved name changes as noted below:
| | | | |
Hotchkis & Wiley Diversified Value Fund | | | Hotchkis & Wiley Large Cap Disciplined Value Fund |
Hotchkis & Wiley Large Cap Value Fund | | | Hotchkis & Wiley Large Cap Fundamental Value Fund |
| | | | |
Management has evaluated subsequent events in the preparation of the Funds’ financial statements and has determined that there are no additional events that require recognition or disclosure in the financial statements.
NOTE 13. Federal Tax Disclosure. (UNAUDITED)
The Funds designated as long-term capital gain dividends, pursuant to Internal Revenue Code Section 852(b)(3), the amount necessary to reduce the earnings and profits of the Funds related to net capital gains to zero for the tax year ended June 30, 2024.
For the year ended June 30, 2024, the following percentages of ordinary distributions paid qualify for the dividend received deduction available to corporate shareholders: Diversified Value Fund — 100.00%, Large Cap Value Fund — 100.00%, Mid-Cap Value Fund — 100.00%, Small Cap Value Fund — 70.33%, Small Cap Diversified Value Fund — 59.66%, Global Value Fund — 62.71%, International Value Fund — 0.00%, International Small Cap Diversified Value Fund — 0.00%, Value Opportunities Fund — 39.94%, High Yield Fund — 0.08%.
For the year ended June 30, 2024, the following percentages of ordinary distributions paid are designated as qualified dividend income under the Jobs and Growth Tax Relief Reconciliation Act of 2003: Diversified Value Fund — 100.00%, Large Cap Value Fund — 100.00%, Mid-Cap Value Fund — 100.00%, Small Cap Value Fund — 71.14%, Small Cap Diversified Value Fund — 59.82%, Global Value Fund — 100.00%, International Value Fund — 100.00%, International Small Cap Diversified Value Fund — 89.15%, Value Opportunities Fund — 56.61%, High Yield Fund — 0.08%. Shareholders should consult their tax advisors.
For the year ended June 30, 2024, the International Value Fund and International Small Cap Diversified Value Fund earned foreign source income of $136,854 and $278,792, respectively, and paid foreign taxes of $15,027 and $35,395, respectively, which each Fund intends to pass through to shareholders pursuant to Section 853 of the Internal Revenue Code.
Additional Information Applicable to Foreign Shareholders Only. For the year ended June 30, 2024, the Funds designate the following percentages of ordinary distributions paid as interest-related dividends under Internal Revenue Code Section 871(k)(1)(c): Diversified Value Fund — 2.37%, Large Cap Value Fund — 1.17%, Mid-Cap Value Fund — 3.82%, Small Cap Value Fund — 3.00%, Small Cap Diversified Value Fund — 1.91%, Global Value Fund — 2.80%, International Value Fund — 2.12%, International Small Cap Diversified Value Fund — 0.76%, Value Opportunities Fund — 4.47%, High Yield Fund — 99.46%.
For the year ended June 30, 2024, the following percentages of ordinary income distributions paid are designated as short-term capital gain distributions under Internal Revenue Code Section 871(k)(2)(c): Diversified Value Fund — 0.00%, Large Cap Value Fund — 0.00%, Mid-Cap Value Fund — 0.00%, Small Cap Value Fund — 33.16%, Small Cap Diversified Value Fund — 62.44%, Global Value Fund — 0.00%, International Value Fund — 0.00%, International Small Cap Diversified Value Fund — 35.62%, Value Opportunities Fund — 67.42%, High Yield Fund — 0.00%.
TABLE OF CONTENTS
Hotchkis & Wiley Funds
Report of Independent Registered Public Accounting Firm
To the Shareholders and Board of Trustees
of Hotchkis & Wiley Funds
Opinion on the Financial Statements and Financial Highlights
We have audited the accompanying statements of assets & liabilities of Hotchkis & Wiley Funds (the “Funds”) comprising the Diversified Value Fund, Large Cap Value Fund, Mid-Cap Value Fund, Small Cap Value Fund, Small Cap Diversified Value Fund, Global Value Fund, International Value Fund, International Small Cap Diversified Value Fund, Value Opportunities Fund, and High Yield Fund, including the schedules of investments, as of June 30, 2024, the related statements of operations for the year then ended, the statements of changes in net assets for each of the two years in the period then ended, the financial highlights for each of the five years in the period then ended (as to International Small Cap Diversified Value Fund, the financial highlights for each of the three years in the period ended June 30, 2024, and for the period from June 30, 2020 (commencement of operations) through June 30, 2021), and the related notes.
In our opinion, the financial statements and financial highlights present fairly, in all material respects, the financial position of each of the Funds constituting Hotchkis & Wiley Funds, as of June 30, 2024, and the results of their operations for the year then ended, the changes in their net assets for each of the two years in the period then ended, and the financial highlights for each of the five years in the period then ended (as to International Small Cap Diversified Value Fund, the financial highlights for each of the three years in the period ended June 30, 2024, and for the period from June 30, 2020 (commencement of operations) through June 30, 2021), in conformity with accounting principles generally accepted in the United States of America.
Basis for Opinion
These financial statements and financial highlights are the responsibility of the Funds’ management. Our responsibility is to express an opinion on the Funds’ financial statements and financial highlights based on our audits. We are a public accounting firm registered with the Public Company Accounting Oversight Board (United States) (PCAOB) and are required to be independent with respect to the Funds in accordance with the U.S. federal securities laws and the applicable rules and regulations of the Securities and Exchange Commission and the PCAOB.
We conducted our audits in accordance with the standards of the PCAOB. Those standards require that we plan and perform the audit to obtain reasonable assurance about whether the financial statements and financial highlights are free of material misstatement, whether due to error or fraud. The Funds are not required to have, nor were we engaged to perform, an audit of their internal control over financial reporting. As part of our audits we are required to obtain an understanding of internal control over financial reporting but not for the purpose of expressing an opinion on the effectiveness of the Funds’ internal control over financial reporting. Accordingly, we express no such opinion.
Our audits included performing procedures to assess the risks of material misstatement of the financial statements and financial highlights, whether due to error or fraud, and performing procedures that respond to those risks. Such procedures included examining, on a test basis, evidence regarding the amounts and disclosures in the financial statements and financial highlights. Our audits also included evaluating the accounting principles used and significant estimates made by management, as well as evaluating the overall presentation of the financial statements and financial highlights. Our procedures included confirmation of securities owned as of June 30, 2024, by correspondence with the custodian and brokers; when replies were not received from brokers, we performed other auditing procedures. We believe that our audits provide a reasonable basis for our opinion.
Costa Mesa, California
August 22, 2024
We have served as the auditor of one or more Hotchkis & Wiley Funds investment companies since 2012.
TABLE OF CONTENTS
Hotchkis & Wiley Funds
Board Considerations In Approving Continuation of Investment Advisory Agreements
Background and Approval Process. Hotchkis and Wiley Capital Management, LLC (the “Advisor”) serves as investment adviser to the Hotchkis and Wiley Diversified Value Fund, the Hotchkis and Wiley Large Cap Value Fund, the Hotchkis and Wiley Mid-Cap Value Fund, the Hotchkis and Wiley Small Cap Value Fund, the Hotchkis and Wiley Small Cap Diversified Value Fund, the Hotchkis and Wiley Global Value Fund, the Hotchkis and Wiley International Value Fund, the Hotchkis and Wiley International Small Cap Diversified Value Fund, the Hotchkis and Wiley Value Opportunities Fund and the Hotchkis and Wiley High Yield Fund (each a “Fund” and collectively the “Funds”) pursuant to separate investment advisory agreements (the “Advisory Agreements”) with the Hotchkis and Wiley Funds (the “Trust”), of which each Fund is a series. The Advisory Agreements were initially approved by the Board of Trustees of the Trust at the inception of each Fund and continue thereafter if approved annually by the Board of Trustees of the Trust, including a majority of the Trustees who are not “interested persons” (as defined in the Investment Company Act of 1940, as amended (the “1940 Act”)) (the “Independent Trustees”). The Advisory Agreements for each Fund were renewed by the Board at a meeting held in May 2024.
As part of the annual contract review process, the Independent Trustees, through their independent legal counsel, requested and received extensive materials, including information relating to: (i) the nature, extent and quality of services provided by the Advisor, (ii) short-term and longer-term total return of each Fund relative to its respective peer group and benchmark index(es), (iii) the advisory fees and expense ratios of each Fund as compared to the advisory fees and expense ratios of funds in its peer group, (iv) the costs of the services provided and the Advisor’s estimated profitability with respect to the management of each Fund, (v) the extent to which the Advisor has in the past, or is likely in the future, to experience economies of scale in connection with the investment advisory services it provides to each Fund, and (vi) fall-out benefits to the Advisor from its relationship with the Funds.
The Independent Trustees met with their independent legal counsel prior to the May 2024 Board meeting to review the materials provided by the Advisor and were advised regarding their fiduciary duties pertaining to renewal of investment advisory contracts and the factors they should consider in evaluating advisory agreements. The Independent Trustees, through their legal counsel, then provided follow-up questions to the Advisor which were addressed by the Advisor. The Independent Trustees noted that the information provided by the Advisor was thorough and responsive to their requests. The information provided in response to their requests was in addition to information received by the Board throughout the year, both in writing and during meetings, regarding the Funds, including Fund performance, expense ratios, portfolio composition and regulatory compliance.
At the May 2024 Board meeting, representatives of the Advisor discussed the Independent Trustees’ requests and follow-up questions with the Board and responded to further questions. The Board determined that, given the totality of the information provided with respect to the Advisory Agreements, the Board had received sufficient information to renew each Advisory Agreement.
In deciding to approve the renewal of each Advisory Agreement, the Board did not identify any single factor or group of factors as all-important or controlling, and considered a variety of factors in its analysis including those discussed below. The Board did not allot a particular weight to any one factor or group of factors.
Nature, Extent and Quality of Services. As part of the Board’s decision-making process, the Board noted that the Advisor and its predecessors have managed the Funds and their predecessors since their inception, and the Board believes that a long-term relationship with a capable, conscientious investment adviser is in the best interests of the Funds. The Board also considered that shareholders invest in a Fund specifically seeking the Advisor’s investment expertise and style. The Board also noted that when shareholders invest in a Fund, they know the advisory fee that is paid by the Fund. In this connection, the Board considered, in particular, that each Fund is managed in accordance with its investment objective and policies as disclosed to shareholders.
The Board reviewed information regarding various services provided by the Advisor to the Funds, including an organizational chart and background information on personnel performing such services. The Board also reviewed each Fund’s performance and information regarding the Advisor’s investment approach, which is driven by team-oriented, in-depth, fundamental research. The Board considered the depth and quality of the Advisor’s investment process, the low turnover rates of the Advisor’s key personnel, the overall stability of the Advisor’s organization, and the experience, capability and integrity of its senior management. The Board also considered the portfolio managers’ significant investments in the Funds. The Board considered the Trust’s compliance program and the resultant compliance by the Funds and the Advisor with legal requirements.
TABLE OF CONTENTS
Hotchkis & Wiley Funds
Board Considerations In Approving Continuation of Investment Advisory Agreements (Continued)
The Board also considered other non-advisory services provided by the Advisor to the Funds, such as the services of Advisor employees as Trust officers and other personnel provided that are necessary for Fund operations. The Board noted that the Advisor organizes Board meetings and the preparation of Board meeting materials, and those Advisor employees serving as Trust officers oversee and manage the other Fund service providers.
Based on its review, the Board concluded that the nature, extent and quality of services provided to each Fund under its Advisory Agreement were satisfactory.
Investment Performance of the Funds and the Advisor. The Board noted that it reviews data on the short-term and longer-term total returns of the Funds in connection with each quarterly Board meeting. For the contract review meeting, the Board reviewed a report prepared by the Trust’s administrator (the “Report”) using information provided by Morningstar, Inc., an independent provider of mutual fund data, that compared the annualized total returns of Class I shares of each Fund to the median annualized total returns of a group of funds that are similar, primarily in terms of investment style (each a “Peer Group”), and to the annualized total returns of the Fund’s primary and secondary (for Funds that have secondary benchmarks) benchmark indexes for the one-, three-, five- and ten-year periods, as applicable, ended December 31, 2023 and for the three- and six-month, one-, three-, five- and ten-year periods, as applicable, ended March 31, 2024. The Board noted that the Peer Groups were reviewed and selected by the Advisor based on its criteria to determine an appropriate group of competitor funds. In addition, data regarding performance of the Peer Group is provided at each quarterly Board meeting.
The Board noted that all Funds outperformed the median returns of their respective primary benchmarks for the one-, three-, and five-year periods ended December 31, 2023, except that the Global Value Fund and the High Yield Fund underperformed their respective primary benchmarks for the five-year period. The Board also noted that all Funds outperformed the median returns of their respective Peer Groups for the one-, three- and five-year periods ended December 31, 2023, except that the High Yield Fund underperformed the median return of its Peer Group for the five-year period and the Small Cap Diversified Value Fund underperformed the median return of its Peer Group for the one-year period. The Board also considered that the International Small Cap Diversified Value Fund commenced operations on June 30, 2020 and did not have five years of performance history as of December 31, 2023. The Board considered that the Advisor had been consistent in its approach to managing the Funds. The Board concluded that the Advisor’s services in managing each Fund’s portfolio were satisfactory.
Fees, Expenses and Profitability. The Board reviewed advisory fee and expense data using information provided by Morningstar, Inc., contained in the Report, including information regarding applicable expense limitations for the Funds’ Class I shares. The Board reviewed data in the Report showing how each Fund’s advisory fee and Class I shares’ expense ratio compared to those of the funds in its Peer Group using similar share classes. The Board also reviewed information provided by the Advisor on management fees charged by the Advisor for sub-advisory services it provides to other mutual funds and management fees it charges to its separate account clients with investment objectives and policies similar to those of the Funds. The Board considered a list of the many additional functions that the Advisor performs for the Funds that the Advisor does not perform for its separate account and sub-advisory clients, and noted it is generally acknowledged that managing mutual funds subjects an investment adviser to more legal and regulatory risk than is the case with separate accounts.
With respect to the advisory fee for each Fund, the Board noted that the Report showed that the Diversified Value, Large Cap Value, Small Cap Diversified Value, and Value Opportunities Funds’ contractual advisory fees were higher than the median contractual advisory fees of their respective Peer Groups, that the Small Cap Value, Global Value, and International Small Cap Diversified Value Funds’ contractual advisory fees were lower than the median contractual advisory fees of their respective Peer Groups, and that the Mid-Cap Value, International Value, and High Yield Funds’ contractual advisory fees were the same as the median contractual advisory fees of their respective Peer Groups. The Board also noted that the net expense ratios, after implementation of the expense caps for the Class I shares of all the Funds except the Small Cap Diversified Value Fund, International Small Cap Diversified Value Fund and High Yield Fund were above the median net expense ratio of their Peer Group. The Board noted that the Advisor uses a fundamental research-intensive process. The Board considered the expense caps put in place by the Advisor for each Fund (as further described below). The Board concluded that the advisory fee was fair and reasonable for each Fund in light of the nature, extent and quality of services provided by the Advisor.
The Board reviewed information concerning the estimated profitability to the Advisor of the Advisory Agreements, including information regarding the methodology for allocating expenses. The Board reviewed data regarding the Advisor’s variable expenses and fixed expenses. The Board considered that in 2023, as in recent prior years, the Advisor had absorbed
TABLE OF CONTENTS
Hotchkis & Wiley Funds
Board Considerations In Approving Continuation of Investment Advisory Agreements (Continued)
costs above expense caps for which it would not be reimbursed for the Diversified Value, Large Cap Value, Small Cap Value, Small Cap Diversified Value, Global Value, International Value, International Small Cap Diversified Value and High Yield Funds. The Board considered that the Advisor has agreed to continue the expense caps for the share classes of each Fund through at least August 29, 2025. The Board also recognized that individual fund or product line profitability of other advisers is generally not publicly available, and that profitability may be affected by numerous factors, so that the comparability of profitability among advisory firms is limited. The Board noted the importance of the Advisor’s profitability—which is derived solely from investment management fees – in maintaining its entrepreneurial environment in a private, primarily employee-owned structure. The Board also noted that the Advisor’s compensation/profit structure facilitates retention of its management and investment professionals. The Board concluded that the level of estimated profitability to the Advisor under the Advisory Agreements was not unreasonable.
Economies of Scale and Whether Fee Levels Reflect These Economies of Scale. The Board reviewed the information provided by the Advisor as to the extent to which it has in the past or is likely in the future to realize economies of scale in connection with the investment advisory services it provides as each Fund grows. The Board noted the low level of assets under management in certain Funds. The Board considered that the breakpoints in the Diversified Value, Large Cap Value, and Mid-Cap Value Funds’ advisory fee schedules can enable shareholders to share in economies of scale. The Board considered the amount of advisory fees that the Advisor waived and Fund operating expenses that the Advisor reimbursed in 2023 to the benefit of certain Funds and their shareholders. The Board also considered information regarding the investment, compliance and client service personnel employed by the Advisor. The Board concluded that after taking into consideration the factors above, that each Fund’s fee was appropriate.
Fall-Out Benefits to the Advisor from its Relationship to the Funds. The Board considered information regarding any indirect benefits to the Advisor that could be identified from its relationship to the Funds. In particular, the Board considered that the Advisor has the ability to use commission sharing arrangements that allow the Advisor to pay for third-party research using soft dollars from the equity Funds’ commissions as well as other clients of the Advisor. The Board considered that the bundled research services and the use of commission sharing arrangements provides valuable information or service to the Advisor’s investment research process, which benefits the Funds (as well as the Advisor who uses (or can use) the research for the benefit of the Advisor’s other clients). The Board also considered that the Advisor indirectly benefits from the Funds’ payment of sub-transfer agency expenses.
* * * *
Based on its review, including its consideration of each of the factors referred to above, the Board, including all of the Independent Trustees, concluded that the terms of each Advisory Agreement are fair and reasonable and that the renewal of each Fund’s Advisory Agreement is in the best interests of the Fund.
HW Opportunities MP Fund
Annual Financial Statements
JUNE 30, 2024
TABLE OF CONTENTS
HW Opportunities MP Fund
Schedule of Investments
as of June 30, 2024
| | | | | | | | | | | | | |
COMMON STOCKS - 92.0%
|
Aerospace & Defense - 2.3%
|
Babcock International Group PLC | | | | | | | | | 222,070 | | | $1,467,180 |
Automobiles - 0.9%
|
General Motors Co. | | | | | | | | | 12,210 | | | 567,277 |
Banks - 3.6%
|
Citigroup, Inc. | | | | | | | | | 12,200 | | | 774,212 |
Citizens Financial Group,
Inc. | | | | | | | | | 13,830 | | | 498,295 |
Popular, Inc. | | | | | | | | | 11,420 | | | 1,009,871 |
| | | | | | | | | | | | 2,282,378 |
Broadline Retail - 0.4%
|
Articore Group Ltd.(a) | | | | | | | | | 884,900 | | | 244,981 |
Capital Markets - 1.8%
|
Bank of New York Mellon
Corp. | | | | | | | | | 4,000 | | | 239,560 |
Morgan Stanley | | | | | | | | | 6,200 | | | 602,578 |
State Street Corporation | | | | | | | | | 4,600 | | | 340,400 |
| | | | | | | | | | | | 1,182,538 |
Chemicals - 9.4%
|
Ecovyst, Inc.(a) | | | | | | | | | 387,600 | | | 3,476,771 |
Olin Corp. | | | | | | | | | 54,900 | | | 2,588,535 |
| | | | | | | | | | | | 6,065,306 |
Communications Equipment - 5.8%
|
F5, Inc.(a) | | | | | | | | | 17,200 | | | 2,962,356 |
Telefonaktiebolaget LM Ericsson - ADR | | | | | | | | | 120,100 | | | 741,017 |
| | | | | | | | | | | | 3,703,373 |
Construction & Engineering - 1.6%
|
Fluor Corp.(a) | | | | | | | | | 23,100 | | | 1,006,005 |
Consumer Finance - 2.3%
|
Discover Financial Services | | | | | | | | | 1,200 | | | 156,972 |
SLM Corp. | | | | | | | | | 64,608 | | | 1,343,200 |
| | | | | | | | | | | | 1,500,172 |
Electronic Equipment, Instruments & Components - 1.6%
|
Arrow Electronics, Inc.(a) | | | | | | | | | 8,550 | | | 1,032,498 |
Energy Equipment & Services - 7.0%
|
Baker Hughes Co. | | | | | | | | | 36,500 | | | 1,283,705 |
NOV, Inc. | | | | | | | | | 168,000 | | | 3,193,680 |
| | | | | | | | | | | | 4,477,385 |
Ground Transportation - 4.1%
|
U-Haul Holding Co. | | | | | | | | | 44,250 | | | 2,655,885 |
Health Care Equipment & Supplies - 2.2%
|
GE HealthCare Technologies, Inc. | | | | | | | | | 7,500 | | | 584,400 |
Medtronic PLC | | | | | | | | | 10,600 | | | 834,326 |
| | | | | | | | | | | | 1,418,726 |
Health Care Providers & Services - 0.6%
|
CVS Health Corp. | | | | | | | | | 7,000 | | | 413,420 |
Hotels, Restaurants & Leisure - 4.2%
|
Entain PLC | | | | | | | | | 56,700 | | | 449,612 |
Lottomatica Group SpA(a) | | | | | | | | | 57,000 | | | 687,973 |
| | | | | | | | | | | | | |
| | | | | | | | | | | | | |
Marriott Vacations Worldwide Corp. | | | | | | | | | 17,900 | | | $1,563,028 |
| | | | | | | | | | | | 2,700,613 |
Industrial Conglomerates - 8.4%
|
Siemens AG | | | | | | | | | 18,600 | | | 3,461,934 |
Siemens AG - ADR | | | | | | | | | 20,800 | | | 1,939,600 |
| | | | | | | | | | | | 5,401,534 |
Insurance - 3.1%
|
Enstar Group Ltd.(a) | | | | | | | | | 4,400 | | | 1,345,080 |
Global Indemnity Group LLC - Class A | | | | | | | | | 19,754 | | | 614,065 |
| | | | | | | | | | | | 1,959,145 |
Interactive Media & Services - 1.7%
|
Alphabet, Inc. - Class A | | | | | | | | | 6,180 | | | 1,125,687 |
Media - 10.1%
|
Comcast Corp. - Class A | | | | | | | | | 10,700 | | | 419,012 |
National CineMedia, Inc.(a) | | | | | | | | | 177,800 | | | 780,542 |
Stagwell, Inc.(a) | | | | | | | | | 657,680 | | | 4,485,377 |
WPP PLC - ADR | | | | | | | | | 18,500 | | | 846,930 |
| | | | | | | | | | | | 6,531,861 |
Multi-Utilities - 0.8%
|
Dominion Energy, Inc. | | | | | | | | | 10,100 | | | 494,900 |
Oil Gas & Consumable Fuels - 4.8%
|
APA Corp. | | | | | | | | | 40,300 | | | 1,186,432 |
Kosmos Energy Ltd.(a) | | | | | | | | | 342,900 | | | 1,899,666 |
| | | | | | | | | | | | 3,086,098 |
Passenger Airlines - 3.9%
|
Qantas Airways Ltd.(a) | | | | | | | | | 648,470 | | | 2,523,661 |
Professional Services - 4.8%
|
Hudson Global, Inc.(a) | | | | | | | | | 2,250 | | | 37,373 |
Randstad NV | | | | | | | | | 67,600 | | | 3,069,213 |
| | | | | | | | | | | | 3,106,586 |
Semiconductors & Semiconductor Equipment - 0.6%
|
Micron Technology, Inc. | | | | | | | | | 2,900 | | | 381,437 |
Software - 4.2%
|
Microsoft Corp. | | | | | | | | | 160 | | | 71,512 |
Workday, Inc. - Class A(a) | | | | | | | | | 11,900 | | | 2,660,364 |
| | | | | | | | | | | | 2,731,876 |
Tobacco - 0.1%
|
Philip Morris International,
Inc. | | | | | | | | | 400 | | | $40,532 |
Trading Companies & Distributors - 1.7%
|
WESCO International, Inc. | | | | | | | | | 7,000 | | | 1,109,640 |
TOTAL COMMON STOCKS
(Cost $56,066,556) | | | | | | $59,210,694 |
PREFERRED STOCKS - 1.4%
|
Financial Services - 1.4%
|
Federal Home Loan Mortgage Corp., Series Z, Perpetual(a) | | | | | | | | | 188,800 | | | 906,240 |
TOTAL PREFERRED STOCKS
(Cost $443,396) | | | | | | 906,240 |
| | | | | | | |
The accompanying notes are an integral part of these financial statements.
TABLE OF CONTENTS
HW Opportunities MP Fund
Schedule of Investments
as of June 30, 2024 (Continued)
| | | | | | | | | | | | | |
PURCHASED OPTIONS - 1.1%(b)(c)
|
Put Options - 1.1%
| | | | |
Asana, Inc.,
Expiration: 01/17/2025;
Exercise Price: $30.00(a) | | | 195,860 | | | | | | 140 | | | $231,700 |
iShares China Large-Cap ETF, Expiration: 01/17/2025; Exercise Price: $29.85(a) | | | 987,620 | | | | | | 380 | | | 181,450 |
iShares U.S. Real Estate ETF, Expiration: 01/16/2026; Exercise Price: $70.00(a) | | | 3,509,600 | | | | | | 400 | | | 120,000 |
Tesla, Inc.,
Expiration: 06/18/2026;
Exercise Price: $200.00(a) | | | 811,308 | | | | | | 41 | | | 200,490 |
Total Put Options | | | | | | | | | | | | 733,640 |
TOTAL PURCHASED OPTIONS
(Cost $817,495) | | | | | | | | | | | | 733,640 |
|
| | | | | | Par | | | |
SHORT-TERM INVESTMENTS - 5.2%
|
Time Deposits - 5.2%
|
Citigroup, Inc.,
4.68%, 07/01/2024(d) | | | | | | | | | 3,124,234 | | | 3,124,234 |
Citigroup, Inc.,
2.59%, 07/01/2024(d) | | | | | | EUR | | | 181,773 | | | 194,670 |
Royal Bank of Canada,
4.15%, 07/01/2024(d) | | | | | | GBP | | | 5,118 | | | 6,470 |
TOTAL SHORT-TERM INVESTMENTS
(Cost $3,326,728) | | | | | | | | | | | | 3,325,374 |
TOTAL
INVESTMENTS - 99.7%
(Cost $60,654,175) | | | | | | | | | | | | 64,175,948 |
Other Assets in Excess of Liabilities - 0.3% | | | | | | | | | | | | $ 171,075 |
TOTAL NET
ASSETS - 100.0% | | | | | | | | | | | | $64,347,023 |
| | | | | | | | | | | | | |
Percentages are stated as a percent of net assets.
Par amount is in USD unless otherwise indicated.
The Global Industry Classification Standard (GICS®) was developed by MSCI, an independent provider of global indices and benchmark-related products and services, and Standard & Poor's (S&P), an independent international financial data and investment services company. The GICS methodology has been widely accepted as an industry analysis framework for investment research, portfolio management and asset allocation. The GICS structure consists of 11 sectors, 25 industry groups, 74 industries and 163 sub-industries. Each stock that is classified will have a coding at all four of these levels.
ADR - American Depositary Receipt
AG - Aktiengesellschaft
EUR - Euro
GBP - British Pound
NV - Naamloze Vennootschap
PLC - Public Limited Company
(a)
| Non-income producing security. |
(c)
| 100 shares per contract. |
(d)
| Invested through a cash management account administered by Brown Brothers Harriman & Co. |
The accompanying notes are an integral part of these financial statements.
TABLE OF CONTENTS
HW Opportunities MP Fund
STATEMENT of Assets and Liabilities
JUNE 30, 2024
| | | | |
ASSETS:
| | | |
Long-term investments, at value*
| | | |
Unaffiliated issuers | | | $60,850,574 |
Short-term investments* | | | 3,325,374 |
Cash | | | 13,806 |
Cash denominated in foreign currencies# | | | 460 |
Dividends and interest receivable | | | 54,607 |
Receivable for investments sold | | | 167,383 |
Receivable for Fund shares sold | | | 116,970 |
Receivable from Advisor | | | 13,017 |
Other assets | | | 21,950 |
Total assets | | | $64,564,141 |
LIABILITIES:
| | | |
Payable for investments purchased | | | 173,863 |
Payable for Fund shares repurchased | | | 2,716 |
Accrued expenses and other liabilities | | | 40,539 |
Total liabilities | | | 217,118 |
Commitments and contingencies (Note 6) | | | |
Net assets | | | $64,347,023 |
Net Assets Consist of:
| | | |
Paid-in capital | | | $56,992,266 |
Total accumulated distributable earnings | | | $7,354,757 |
Net assets | | | $64,347,023 |
Calculation of Net Asset Value Per Share and Public Offering Price
Per Share
| | | |
Net assets | | | $64,347,023 |
Shares outstanding (unlimited shares $0.001 par value authorized) | | | 4,170,857 |
Net asset value per share | | | $15.43 |
*Cost of long-term investments
Unaffiliated issuers | | | $57,327,447 |
*Cost of short-term investments | | | 3,326,728 |
#Cost of cash denominated in foreign currencies | | | $460 |
| | | | |
The accompanying notes are an integral part of these financial statements.
TABLE OF CONTENTS
HW Opportunities MP Fund
Statement of Operations
FOR THE YEAR ENDED JUNE 30, 2024
| | | | |
Investment income:
| | | |
Dividends*
| | | |
Unaffiliated issuers | | | $1,055,520 |
Interest | | | 99,400 |
Total income | | | 1,154,920 |
Expenses:
| | | |
Professional fees and expenses | | | 29,260 |
Custodian fees and expenses | | | 9,495 |
Transfer agent fees and expenses | | | 11,227 |
Accounting fees and expenses | | | 24,834 |
Administration fees and expenses | | | 68,722 |
Compliance fees and expenses | | | 4,663 |
Trustees’ fees and expenses | | | 8,623 |
Reports to shareholders | | | 6,370 |
Registration fees | | | 26,663 |
Other expenses | | | 9,853 |
Total expenses | | | 199,710 |
Fee waiver/expense reimbursement by Advisor (Note 2) | | | (199,710) |
Net expenses | | | — |
Net investment income | | | 1,154,920 |
Realized and Unrealized Gains (Losses):
| | | |
Net realized gains (losses) from:
| | | |
Sales of unaffiliated issuers | | | 5,203,432 |
Foreign currency transactions | | | (16,830) |
Net realized gains | | | 5,186,602 |
Net change in unrealized appreciation/depreciation of: | | | |
Securities of unaffiliated issuers and foreign currency translations | | | 3,550,694 |
Net change in unrealized appreciation/depreciation | | | 3,550,694 |
Net gains | | | 8,737,296 |
Net Increase in Net Assets Resulting from Operations
| | | $ 9,892,216 |
*Net of Foreign Taxes Withheld | | | $65,065 |
| | | | |
The accompanying notes are an integral part of these financial statements.
TABLE OF CONTENTS
HW Opportunities MP Fund
Statements of Changes in Net Assets
| | | | |
Operations:
| | | | | | |
Net investment income | | | $1,154,920 | | | $854,128 |
Net realized gains | | | 5,186,602 | | | 1,234,566 |
Net change in unrealized appreciation/depreciation | | | 3,550,694 | | | 4,509,376 |
Net increase in net assets resulting from operations | | | 9,892,216 | | | 6,598,070 |
Dividends and Distributions to Shareholders:
| | | | | | |
Net decrease in net assets resulting from dividends and distributions to shareholders | | | (3,592,945) | | | (742,705) |
Capital Share Transactions:
| | | | | | |
Net increase in net assets resulting from capital share transactions | | | 11,986,453 | | | 10,763,374 |
Net Assets:
| | | | | | |
Total increase in net assets | | | 18,285,724 | | | 16,618,739 |
Beginning of year | | | 46,061,299 | | | 29,442,560 |
End of year | | | $ 64,347,023 | | | $ 46,061,299 |
| | | | | | | |
The accompanying notes are an integral part of these financial statements.
TABLE OF CONTENTS
HW Opportunities MP Fund
Financial Highlights
The following per share data and ratios have been derived from information provided in the financial statements.
| | | | | | | | | | | | | | | | | | | | | | |
Year ended 6/30/2024 | | | $13.75 | | | $0.31 | | | $2.38 | | | $2.69 | | | $(0.28) | | | $(0.73) | | | $(1.01) | | | $15.43 | | | 20.57% | | | $64,347 | | | 0.00% | | | 0.36% | | | 2.11% |
Year ended 6/30/2023 | | | 10.95 | | | 0.28 | | | 2.75 | | | 3.03 | | | (0.13) | | | (0.10) | | | (0.23) | | | 13.75 | | | 27.92 | | | 46,061 | | | 0.00 | | | 0.74 | | | 2.21 |
Year ended 6/30/2022 | | | 12.90 | | | 0.20 | | | (1.96) | | | (1.76) | | | (0.09) | | | (0.10) | | | (0.19) | | | 10.95 | | | −13.88 | | | 29,443 | | | 0.00 | | | 1.36 | | | 1.59 |
Period from 12/30/20204 to 6/30/2021 | | | 10.00 | | | 0.12 | | | 2.78 | | | 2.90 | | | — | | | — | | | — | | | 12.90 | | | 29.00 | | | 631 | | | 0.003 | | | 45.413 | | | 2.023 |
| | | | | | | | | | | | | | | | | | | | | | | | | | | | | | | | | | | | | | | | |
| | | | | | | | |
Portfolio turnover rate | | | 93% | | | 140% | | | 96% | | | 57% | |
| | | | | | | | | | | | | | |
1
| Net investment income per share has been calculated based on average shares outstanding during the period. |
2
| The Fund’s investment advisor contractually agreed to reimburse 100% of the Fund’s operating expenses (See Note 2). Without
|
such reimbursement, the Fund’s performance would have been lower. Returns for periods less than one year are not annualized.
4
| Commencement of operations. |
The accompanying notes are an integral part of these financial statements.
TABLE OF CONTENTS
HW Opportunities MP Fund
Notes to the Financial Statements
June 30, 2024
NOTE 1. Organization.
Hotchkis & Wiley Funds (the “Trust”) is registered under the Investment Company Act of 1940, as amended (the “1940 Act”), as an open-end, management investment company. The Trust was organized as a Delaware statutory trust on July 23, 2001 and consists of eleven series, including the HW Opportunities MP Fund (the “Fund”). The Fund is a non-diversified series of the Trust. Immediately prior to the Fund’s commencement of operations, the assets and liabilities of the HW Opportunities MP Fund, a series of Series Portfolios Trust (the “Predecessor Fund”), were acquired by the Fund in a tax-free reorganization as set forth in an agreement and plan of reorganization between the Trust, on behalf of the Fund, and Series Portfolios Trust, on behalf of the Predecessor Fund (the “Reorganization”). The Reorganization occurred after the close of business on December 15, 2023. As of December 15, 2023, the Predecessor Fund’s net assets were $50,954,652, shares outstanding were 3,570,165.790 and NAV was $14.27. As a result of the Reorganization, the performance and accounting history of the Predecessor Fund was assumed by the Fund. All Reorganization costs were borne by Hotchkis & Wiley Capital Management, LLC (the “Advisor”). The Predecessor Fund commenced operations on December 30, 2020. The other series of the Trust are included in a separate report.
Shareholders should be aware that the Fund pays no management fees or operating expenses under its investment advisory and expense reimbursement agreements with the Advisor. However, Fund shares are only offered to participants in separately managed account programs who pay fees to program sponsors for the costs and expenses of the programs, including fees for investment advice, custody and portfolio execution. When a program participant, alone or with his or her program sponsor, elects to allocate assets to an investment strategy managed or advised by the Advisor, the Advisor typically receives a fee from the program sponsor for providing such management or advisory services to the managed account, including with respect to assets that may be invested in the Fund. In certain cases, a program participant will pay a fee for investment advice directly to the advisor in its capacity as manager to the participant’s managed account.
Significant Accounting Policies. The Fund’s financial statements have been prepared in conformity with accounting principles generally accepted in the United States of America (“U.S. GAAP”), which may require the use of management accruals and estimates. Actual results could differ from those estimates and those differences could be significant. The Fund is an investment company and accordingly follows the investment company accounting and reporting guidance of the Financial Accounting Standards Board (“FASB”) Accounting Standard Codification Topic 946 “Financial Services – Investment Companies”. The following is a summary of significant accounting policies followed by the Fund.
Security Valuation. Equity securities traded on a national stock exchange or Nasdaq Global Markets, Nasdaq Select Market and the Nasdaq Capital Markets (together, “Nasdaq”) are valued at the last reported sale price or Nasdaq Official Closing Price, as applicable, on that day, or, in the absence of recorded sales, at the average of the last bid and asked quotation on such exchange or Nasdaq. Over-the-counter securities not traded on Nasdaq are valued at the last sale price on the valuation day, or if the last sale price is unavailable, at the average of the quoted bid and asked prices in the over-the-counter market. Foreign equity securities (which are principally traded in markets other than the U.S.) are valued based upon the last reported sale price on the primary exchange or market on which they trade as of the close of business of such exchange or market immediately preceding the time of determining the Fund’s net asset value. Any Fund assets or liabilities initially valued in terms of non-U.S. dollar currencies are translated into U.S. dollars at the prevailing foreign currency exchange market rates as provided by an independent Pricing Service.
The Trust’s Board of Trustees (the “Board”) has designated the Advisor as the Fund’s “valuation designee” to perform all fair valuations of the Fund’s portfolio investments, subject to the Board’s oversight. The Advisor, as the Fund’s valuation designee, has established procedures for its fair valuation of the Fund’s portfolio investments, which address, among other things, determining when market quotations are not readily available or reliable and certain methodologies for the fair valuation of such portfolio investments, as well as the use and oversight of Pricing Services.
Fixed-income securities are generally valued at their evaluated mean prices provided by Pricing Services. Pricing Services generally provide an evaluated price that takes into account appropriate factors such as institutional-sized trading in similar groups of securities, yield, quality, coupon rate, maturity, type of issue, trading characteristics, and other market data, and may provide a price determined by a matrix pricing method or other analytical pricing models. If valuations from the Pricing Services are unavailable or deemed unreliable, the fixed-income security shall be priced according to the average of the bid and ask prices of broker quotes (or a single broker quote) for such security or the last sale price reported on FINRA’s Trade Reporting and Compliance Engine (“TRACE”) (excluding cross and retail trades).
TABLE OF CONTENTS
HW Opportunities MP Fund
Notes to the Financial Statements
June 30, 2024 (Continued)
For portfolio holdings which trade in markets that close prior to the close of trading on the New York Stock Exchange (which is generally 4:00 p.m. Eastern time), the Fund generally utilizes a Pricing Service’s fair value price which is designed to capture events occurring after a foreign exchange closes that may affect the value of certain portfolio holdings traded on those foreign exchanges. When this fair value pricing is employed, the value of the portfolio holdings used to calculate the Fund’s net asset value may differ from quoted or official closing prices.
The Fund has performed an analysis of all existing investments to determine the significance and character of all inputs to their fair value determination. Various inputs are used in determining the value of the Fund’s investments. These inputs are summarized in the following three broad categories:
Level 1 –
Quoted unadjusted prices for identical instruments in active markets to which the Fund has access at the date of measurement.
Level 2 –
Other significant observable inputs (including quoted prices for similar instruments, interest rates, current yields, credit quality, prepayment speeds for mortgage related securities, collateral for asset-backed securities, foreign security indices, foreign exchange rates, fair value estimates for foreign securities, and changes in benchmark securities indices). Level 2 inputs are those in markets for which there are few transactions, the prices are not current, little public information exists or instances where prices vary substantially over time or among brokered market makers.
Level 3 –
Significant unobservable inputs including model derived valuations in which one or more significant inputs or significant value drivers are unobservable. Unobservable inputs are those inputs that reflect assumptions that market participants would use to price the asset or liability based on the best available information.
The following table presents the valuation levels of the Fund’s assets as of June 30, 2024:
| | | | | | | | | | | | | |
Common Stocks | | | $47,551,121 | | | $11,659,573 | | | $ — | | | $59,210,694 |
Preferred Stocks | | | 906,240 | | | — | | | — | | | 906,240 |
Purchased Options | | | 320,490 | | | 413,150 | | | — | | | 733,640 |
Time Deposits | | | — | | | 3,325,374 | | | — | | | 3,325,374 |
Total Investments | | | $48,777,851 | | | $15,398,097 | | | $— | | | $64,175,948 |
| | | | | | | | | | | | | |
Please refer to the Schedule of Investments for additional information regarding the composition of the amounts listed above.
Expense Allocation. Expenses incurred by or attributable to the Fund are allocated entirely to the Fund. Expenses incurred by the Trust which do not relate to a specific series of the Trust are allocated among the series of the Trust per capita. Alternatively, such expenses may be allocated based upon the series’ relative net assets as of a recent date or using another methodology based upon a determination by persons authorized by the Board, including either the President or Treasurer of the Trust, that the alternative allocation methodology is fair and equitable taking into consideration the nature and type of the expense.
Dividends and Distributions to Shareholders. Dividends and distributions to shareholders are recorded on the ex-dividend date. Dividends from net investment income are declared and paid annually for the Fund. Distributions of net realized capital gains, if any, will be declared and paid at least annually.
Security Transactions and Investment Income. Security and shareholder transactions are recorded on trade date. Realized gains and losses on sales of investments are calculated on the specifically identified cost basis of the securities. Dividend income, less foreign taxes withheld, if any, is recorded on the ex-dividend date. Interest income is recognized on the accrual basis. Market discounts and original issue discounts on fixed-income securities are amortized daily over the expected life of the security using the effective yield method. Market premiums on fixed-income securities are amortized daily on the yield to the next call method. Return of capital distributions received from real estate investment trust (“REIT”) securities are recorded as an adjustment to the cost of the security and thus may impact unrealized gains or losses on the security.
TABLE OF CONTENTS
HW Opportunities MP Fund
Notes to the Financial Statements
June 30, 2024 (Continued)
Securities purchased or sold on a when-issued, delayed delivery or forward commitment basis may have extended settlement periods. The value of the security purchased is subject to market fluctuations during this period.
Foreign Currency Transactions. Securities and other assets and liabilities denominated in foreign currencies are translated into U.S. dollar amounts at the date of valuation. Purchases and sales of securities and income and expense items denominated in foreign currencies are translated into U.S. dollar amounts on the respective dates of such transactions. The Fund isolates the portion of realized gains or losses and does not isolate the portion of unrealized appreciation or depreciation resulting from changes in foreign exchange rates on securities from the fluctuations arising from changes in market prices of securities held. Reported net realized foreign exchange gains or losses arise from sales of securities, currency gains or losses realized between the trade and settlement dates on securities transactions and the difference between the amounts of dividends, interest and foreign withholding taxes recorded on the Fund’s books and the U.S. dollar equivalent of the amounts actually received or paid.
Payment In-Kind Securities. The Fund may invest in payment in-kind securities. Payment in-kind securities give the issuer the option at each interest payment date of making interest payments in either cash or additional debt securities. Those additional debt securities usually have the same terms, including maturity dates and interest rates, and associated risks as the original bonds. The daily market quotations of the original bonds may include the accrued interest (referred to as a dirty price) and may require a pro-rata adjustment to interest receivable from the unrealized appreciation or depreciation of securities on the Statement of Assets & Liabilities.
Restricted and Illiquid Securities. The Fund may invest in securities that are subject to legal or contractual restrictions on resale or are illiquid. Restricted securities generally may be resold in transactions exempt from registration. An illiquid security is an investment that the Fund reasonably expects cannot be sold or disposed of in current market conditions in seven calendar days or less without the sale or disposition significantly changing the market value of the investment. Disposal of these securities may involve time-consuming negotiations and expense, and prompt sale at the current valuation may be difficult.
Options. The Fund is subject to equity price risk in the normal course of pursuing its investment objective. The Fund may purchase put options on securities to protect holdings in an underlying or related security against a substantial decline in market value. The Fund may purchase call options on securities and security indexes. The Fund may write a call or put option only if the option is “covered” by the Fund holding a position in the underlying securities or by other means which would permit immediate satisfaction of the Fund’s obligation as writer of the option. Prior to exercise or expiration, an option may be closed by an offsetting purchase or sale of an option of the same series. The purchase and writing of options involves certain risks. If a put or call option purchased by the Fund is not sold when it has remaining value, and if the market price of the underlying security, in the case of a put, remains equal to or greater than the exercise price or, in the case of a call, remains less than or equal to the exercise price, the Fund will lose its entire investment in the option. There can be no assurance that a liquid market will exist when the Fund seeks to close out an option position. Furthermore, if trading restrictions or suspensions are imposed on the options markets, the Fund may be unable to close out a position. With options, there is minimal counterparty risk to the Fund since options are exchange traded and the exchange’s clearinghouse, as counterparty to all exchange traded options, guarantees the options against default.
When the Fund purchases a put or call option, an amount equal to the premium paid is included on the Statement of Assets & Liabilities as an investment, and is subsequently adjusted to reflect the fair market value of the option. If an option expires on the stipulated expiration date or if the Fund enters into a closing sale transaction, a gain or loss is realized. If the Fund exercises a put option, a gain or loss is realized from the sale of the underlying security, and the proceeds from such sale are decreased by the premium originally paid for the put option. If the Fund exercises a call option, the cost of the security acquired is increased by the premium paid for the call option.
Futures Contracts. The Fund is subject to foreign currency exchange rate risk in the normal course of pursuing its investment objective. The Fund may use futures contracts to gain exposure to, or hedge against, changes in the value of foreign currencies. A futures contract provides for the future sale by one party and purchase by another party of an asset at a specified price on a specified date. Upon entering into such contracts, the Fund is required to deposit with the broker, either in cash or securities, an initial margin deposit in an amount equal to a certain percentage of the contract amount. Subsequent payments (variation margin) are made or received by the Fund each day, depending on the daily fluctuations in the value of the contract, and are recorded for financial statement purposes as unrealized gains or losses by the Fund. Upon entering into such contracts,
TABLE OF CONTENTS
HW Opportunities MP Fund
Notes to the Financial Statements
June 30, 2024 (Continued)
the Fund bears the risk of exchange rates moving unexpectedly, in which case the Fund may not achieve the anticipated benefits of the futures contracts and may realize a loss. When a contract is closed, the Fund records a realized gain or loss equal to the difference between the proceeds from (or cost of) the closing transaction and the Fund’s basis in the contract. With futures, there is minimal counterparty risk to the Fund since futures are exchange traded and the exchange’s clearinghouse, as counterparty to all exchange traded futures, guarantees the futures against default. The use of futures contracts involves the risk of imperfect correlation in movements in the price of the futures contracts, exchange rates and the underlying hedged assets. The Fund did not enter into any futures contracts during the year ended June 30, 2024.
Derivative Instruments. The Fund has adopted authoritative standards regarding disclosures about derivatives and how they affect the Fund’s Statement of Assets & Liabilities and Statement of Operations.
The following is a summary of the Fund’s derivative instrument holdings categorized by primary risk exposure as of June 30, 2024:
Asset Derivatives
| | | | | | | |
Equity Contracts:
| | | | | | |
Purchased Put Options | | | Long-term investments | | | $733,640 |
| | | | | | | |
The following is a summary of the Fund’s realized gains (losses) and change in unrealized appreciation/depreciation on derivative instruments recognized in the Statement of Operations categorized by primary risk exposure for the year ended June 30, 2024:
Realized Gains (Losses) on Derivatives
| | | | |
Equity Contracts:
| | | |
Purchased Put Options | | | $(1,106,280)* |
| | | | |
*
| Included with net realized gains (losses) from sales of unaffiliated issuers.
|
Change in Unrealized Appreciation/Depreciation on Derivatives
| | | | |
Equity Contracts:
| | | |
Purchased Put Options | | | $273,925* |
| | | | |
*
| Included with net change in unrealized appreciation/depreciation of securities of unaffiliated issuers and foreign currency translations. |
The following is a summary of the Funds’ average quarterly balance of outstanding derivative instruments categorized by primary risk exposure for the year ended June 30, 2024:
Average Quarterly Balance of Outstanding Derivatives
| | | | |
Equity Contracts:
| | | |
Average Number of Contracts – Purchased Put Options | | | 1,039 |
Average Notional Amount – Purchased Put Options | | | $12,698,693 |
| | | | |
Offsetting Assets and Liabilities. The Fund is subject to various master netting arrangements, which govern the terms of certain transactions with counterparties. The arrangements allow the Fund to close out and net its total exposure to a counterparty in the event of a default with respect to all the transactions governed under a single agreement with a counterparty. For financial reporting purposes, the Fund does not offset financial assets and liabilities that are subject to master netting arrangements in the Statement of Assets & Liabilities. The Fund was not subject to offsetting arrangements as of June 30, 2024.
TABLE OF CONTENTS
HW Opportunities MP Fund
Notes to the Financial Statements
June 30, 2024 (Continued)
NOTE 2. Fees and Transactions with Affiliates.
The Fund has entered into an Investment Advisory Agreement with the Advisor, with which certain officers and a Trustee of the Trust are affiliated. The Advisor is a limited liability company, the primary members of which are HWCap Holdings, a limited liability company with members who are current and former employees of the Advisor, and Stephens - H&W, LLC, a limited liability company whose primary member is SF Holding Corp., which is a diversified holding company. The Advisor is responsible for the management of the Fund’s investments and provides the personnel, facilities, equipment and certain other services necessary to the operations of the Fund. The Advisor does not charge a management fee for advisory services to the Fund. Shareholders should be aware, however, that the Fund is an integral part of separately managed account programs, and the Advisor and its affiliates are compensated directly or indirectly by separately managed account program sponsors or program participants for managed account advisory services. The Advisor has contractually agreed to reimburse 100% of the Fund’s operating expenses (other than any front-end or contingent deferred sales loads, taxes, leverage interest, brokerage commissions, acquired fund fees and expenses, expenses incurred in connection with any merger or reorganization, or extraordinary expenses such as litigation).
Quasar Distributors, LLC is the principal underwriter and distributor for the shares of the Fund (“Quasar” or the “Distributor”). The Fund does not have a Rule 12b-1 plan and therefore Quasar’s fees are paid by the Advisor.
The Fund is permitted to purchase securities from or sell securities to another fund in the Trust or affiliated person under procedures adopted by the Board. During the year ended June 30, 2024, the Fund did not have any of these purchases and sales.
NOTE 3. Investments.
Purchases and sales of investment securities, excluding short-term investments, for the year ended June 30, 2024 were $56,116,081 and $49,266,513, respectively. The Fund did not have any purchases or sales of U.S. Government securities for the year ended June 30, 2024.
NOTE 4. Federal Income Taxes.
It is the Fund’s policy to comply with the requirements of the Internal Revenue Code applicable to regulated investment companies and the Fund intends to distribute substantially all of its investment company net taxable income and net capital gains to shareholders. Therefore, no federal income tax provision is required. Under the applicable foreign tax law, a withholding tax may be imposed on interest, dividends and capital gains at various rates.
Distributions paid to shareholders are based on net investment income and net realized gains determined on a tax basis, which may differ from net investment income and net realized gains for financial reporting purposes. The fiscal year in which amounts are distributed may differ from the year in which the net investment income and net realized gains are recorded by the Fund for financial reporting purposes. The Fund may utilize earnings and profits distributed to shareholders on redemptions of shares as part of the dividends paid deduction. Generally accepted accounting principles require that permanent financial reporting and tax differences be reclassified within the capital accounts.
The following information is presented on an income tax basis as of June 30, 2024:
| | | | |
Tax cost of investments | | | $ 60,872,979 |
Gross unrealized appreciation | | | 6,834,232 |
Gross unrealized depreciation | | | (3,531,347) |
Net unrealized appreciation/depreciation | | | 3,302,885 |
Distributable ordinary income (as of 6/30/24)* | | | 2,285,021 |
Distributable long-term gains (as of 6/30/24) | | | 1,767,004 |
Total distributable earnings | | | 4,052,025 |
Other accumulated losses | | | (153) |
Total accumulated gains | | | $7,354,757 |
| | | | |
*
| Includes distributable short-term gains of $1,530,923. |
There were no adjustments made on the Statement of Assets & Liabilities for permanent tax differences.
TABLE OF CONTENTS
HW Opportunities MP Fund
Notes to the Financial Statements
June 30, 2024 (Continued)
The tax components of distributions paid during the fiscal years ended June 30, 2024 and 2023 are as follows:
| | | | |
$989,929
| | | $2,603,016 | | | $683,472 | | | $59,233 |
| | | | | | | | | | |
As of June 30, 2024, the Fund did not have any capital loss carryovers or tax basis late year losses, which are not recognized for tax purposes until the first day of the following fiscal year. As of and during the year ended June 30, 2024, the Fund did not have a liability for any unrecognized tax benefits. The Fund recognizes interest and penalties, if any, related to unrecognized tax benefits as income tax expense in the Statement of Operations. During the year ended June 30, 2024, the Fund did not incur any interest or penalties. The tax years from inception to June 30, 2021 through June 30, 2024 remain open and subject to examination by tax jurisdictions.
NOTE 5. Capital Share Transactions.
Transactions in capital shares were as follows:
| | | | | | | | | | |
Year Ended June 30, 2024
|
4,864,518
| | | $69,887,096 | | | — | | | $— | | | (4,043,023 ) | | | $(57,900,643 ) | | | 821,495 | | | $11,986,453 |
Year Ended June 30, 2023
|
2,346,014 | | | $30,160,367 | | | — | | | $— | | | (1,684,810 ) | | | $(19,396,993 ) | | | 661,204 | | | $10,763,374 |
| | | | | | | | | | | | | | | | | | | | | | |
NOTE 6. Commitments and Contingencies.
Under the Trust’s organizational documents and indemnification agreements between each independent Trustee and the Trust, its officers and Trustees are indemnified against certain liabilities arising out of the performance of their duties to the Trust. In addition, in the normal course of business the Trust enters into contracts that contain a variety of representations and warranties, which provide general indemnifications. The Fund’s maximum exposure under these arrangements is unknown, as this would involve future claims that may be made against the Fund.
NOTE 7. Risk Factors.
Investing in the Fund may involve certain risks including, but not limited to, those described below.
Lower rated debt securities generally have higher rates of interest and involve greater risk of default or price changes due to changes in the issuer’s creditworthiness than higher rated debt securities. The market prices of these securities may fluctuate more than higher quality securities and may decline significantly in periods of general economic difficulty. There may be little trading in the secondary market for particular debt securities, which may make them more difficult to value or sell.
The prices of, and the income generated by, most debt securities held by the Fund may be affected by changing interest rates and by changes in the effective maturities and credit ratings of these securities. For example, the prices of debt securities in the Fund’s portfolio generally will decline when interest rates rise and increase when interest rates fall. In addition, falling interest rates may cause an issuer to redeem, “call” or refinance a security before its stated maturity, which may result in the Fund having to reinvest the proceeds in lower yielding securities. Debt securities are also subject to credit risk, which is the possibility that the credit strength of an issuer will weaken and/or an issuer of a debt security will fail to make timely payments of principal or interest and the security will go into default. Longer maturity debt securities generally have higher rates of interest and may be subject to greater price fluctuations than shorter maturity debt securities.
The Fund may invest in foreign (non-U.S.) securities and may experience more rapid and extreme changes in value than a fund that invests exclusively in securities of U.S. companies. The securities markets of many foreign countries are relatively
TABLE OF CONTENTS
HW Opportunities MP Fund
Notes to the Financial Statements
June 30, 2024 (Continued)
small, with a limited number of companies representing a small number of industries. Additionally, reporting, accounting and auditing standards of foreign countries differ, in some cases significantly, from U.S. standards. Also, nationalization, expropriation or confiscatory taxation, currency blockage, political changes or diplomatic developments could adversely affect the Fund’s investments in a foreign country.
The Fund may invest a significant portion of its assets in companies in the financial sector, and therefore the performance of the Fund could be negatively impacted by events affecting this sector. This sector can be significantly affected by changes in interest rates, the rate of corporate and consumer debt defaults, the availability and cost of borrowing and raising capital, reduced credit market liquidity, regulatory changes, price competition, bank failures and other financial crises, and general economic and market conditions.
The Fund is subject to management risk because the Fund is an actively managed investment portfolio. Consequently, the Fund is subject to the risks that the methods and analysis employed by the Advisor may not produce the desired results and result in losses to the Fund.
The prices of, and the income generated by, securities held by the Fund may decline in response to certain events taking place around the world, including those directly involving the issuers whose securities are owned by the Fund. These events can include changes in economic, political or financial market conditions due to war, acts of terrorism, the spread of infectious illness or other public health issues, financial crises, and recessions, as well as investor sentiment regarding these issues.
Certain funds, accounts, individuals or affiliates may from time to time own (beneficially or of record) or control a significant percentage of the Fund’s shares. Redemptions by these entities of their holdings in the Fund may impact the Fund’s liquidity and net asset value (“NAV”). These redemptions may also force the Fund to sell securities.
NOTE 8. New Accounting Pronouncements.
In June 2022, FASB issued Accounting Standards Update (“ASU”) No. 2022-03, Fair Value Measurement (Topic 820): Fair Value Measurement of Equity Securities Subject to Contractual Sale Restrictions. The amendments in this update clarify the guidance in Topic 820 when measuring the fair value of an equity security subject to contractual sale restrictions and introduce new disclosure requirements related to such equity securities. The amendments are effective for fiscal years beginning after December 15, 2023, with early adoption permitted. Management is currently evaluating the impact of this guidance on the Fund’s financial statements.
NOTE 9. Report of the Special Meeting of Shareholders.
A special meeting of the shareholders (the “Special Meeting”) of the Predecessor Fund was held on December 8, 2023 to approve the proposed Agreement and Plan of Reorganization (the “Agreement”) providing for (a) the acquisition of all of the assets of the Predecessor Fund, a series of Series Portfolios Trust, by the Fund, a newly organized series of the Trust, in exchange for shares of the Fund and the assumption by the Fund of all liabilities of the Predecessor Fund and (b) the subsequent termination, and dissolution of the Predecessor Fund (together (a) and (b) are referred to as the “Reorganization”).
Shareholders of record of the Predecessor Fund as of the close of business on the record date of September 29, 2023 were entitled to vote at the Special Meeting. The number of outstanding shares of the Predecessor Fund on the record date were 3,384,211.790 shares.
Of the 3,238,922.790 shares of the Predecessor Fund present in person or by proxy at the Special Meeting on December 8, 2023, all shares voted in favor of the Reorganization (representing 95.706% of total shares outstanding). Accordingly, the Reorganization was approved.
NOTE 10. Change in Independent Registered Public Accounting Firm.
As a result of the Reorganization after the close of business on December 15, 2023, there was a change in accountants from Cohen & Company, Ltd., the Predecessor Fund’s independent registered public accounting firm, to Deloitte & Touche LLP, the independent registered public accounting firm that the Board selected for the Fund at a meeting held on August 15, 2023, upon the recommendation of the Trust’s Audit Committee.
TABLE OF CONTENTS
HW Opportunities MP Fund
Notes to the Financial Statements
June 30, 2024 (Continued)
During the fiscal year ended June 30, 2023 and the subsequent interim period through December 15, 2023, there were
no (1) disagreements with Cohen & Company, Ltd. on any matters of accounting principles or practices, financial statement disclosure, or auditing scope or procedures, which disagreements, if not resolved to their satisfaction, would have caused them to make reference in connection with their opinion to the subject matter of the disagreements, or (2) reportable events.
The audited reports by Cohen & Company, Ltd. on the financial statements of the Predecessor Fund as of and for the fiscal year ended June 30, 2023, did not contain an adverse opinion or disclaimer of opinion, nor were they qualified or modified as to uncertainty, audit scope, or accounting principles. The Predecessor Fund has provided Cohen & Company, Ltd. with a copy of the disclosures and has requested that Cohen & Company, Ltd. furnish a letter stating whether it agrees with the statements and, if not, stating the respects in which it does not agree.
During the fiscal year ended June 30, 2023 and the subsequent interim period through December 15, 2023, (i) the Predecessor Fund did not (a) consult with Deloitte & Touche LLP as to the application of accounting principles to a specified transaction, either completed or proposed, or the type of audit opinion that might be rendered on the financial statements or (b) receive a written report or oral advice that Deloitte & Touche LLP concluded was an important factor considered in reaching a decision as to such accounting, auditing, or financial reporting issue; and (ii) the Predecessor Fund did not consult Deloitte & Touche LLP on any matter that was either the subject of a “disagreement” (as that term is defined in Item 304(a)(1)(iv) of Regulation S-K and the related instructions) or a “reportable event” (as that term is defined in Item 304(a)(1)(v) of Regulation S-K).
NOTE 11. Subsequent Events.
Management has evaluated subsequent events in the preparation of the Fund’s financial statements and has determined that there are no events that require recognition or disclosure in the financial statements.
NOTE 12.Federal Tax Disclosure (UNAUDITED).
The Fund designated as long-term capital gain dividends, pursuant to Internal Revenue Code Section 852(b)(3), the amount necessary to reduce the earnings and profits of the Fund related to net capital gains to zero for the tax year ended June 30, 2024.
For the year ended June 30, 2024, the percentage of ordinary distributions paid that qualify for the dividend received deduction available to corporate shareholders was 18.05%.
For the year ended June 30, 2024, the percentage of ordinary distributions paid that are designated as qualified dividend income under the Jobs and Growth Tax Relief Reconciliation Act of 2003 was 24.79%. Shareholders should consult their tax advisors.
For the year ended June 30, 2024, the percentage of ordinary income distributions paid that are designated as short-term capital gain distributions under Internal Revenue Code Section 871(k)(2)(c) was 72.45%.
TABLE OF CONTENTS
HW Opportunities MP Fund
Report of Independent Registered Public Accounting Firm
To the Shareholders and Board of Trustees
of Hotchkis & Wiley Funds
Opinion on the Financial Statements and Financial Highlights
We have audited the accompanying statement of assets & liabilities, including the schedule of investments, of HW Opportunities MP Fund (the “Fund”), one of the funds constituting the Hotchkis & Wiley Funds (the “Trust”), as of June 30, 2024, the related statement of operations, the statements of changes in net assets, and the financial highlights for the year then ended, and the related notes.
In our opinion, the 2024 financial statements and financial highlights present fairly, in all material respects, the financial position of the Fund, as of June 30, 2024, and the results of its operations, the changes in its net assets, and the financial highlights for the year then ended, in conformity with accounting principles generally accepted in the United States of America.
The statement of changes in net assets for the year ended June 30, 2023 and financial highlights for the years ended June 30, 2023, June 30, 2022, and for the period from December 30, 2020 (commencement of operations) through June 30, 2021, were audited by other auditors whose report, dated August 25, 2023, expressed an unqualified opinion on those statements.
Basis for Opinion
These financial statements and financial highlights are the responsibility of the Fund’s management. Our responsibility is to express an opinion on the Fund’s financial statements and financial highlights based on our audits. We are a public accounting firm registered with the Public Company Accounting Oversight Board (United States) (PCAOB) and are required to be independent with respect to the Fund in accordance with the U.S. federal securities laws and the applicable rules and regulations of the Securities and Exchange Commission and the PCAOB.
We conducted our audits in accordance with the standards of the PCAOB. Those standards require that we plan and perform the audit to obtain reasonable assurance about whether the financial statements and financial highlights are free of material misstatement, whether due to error or fraud. The Fund is not required to have, nor were we engaged to perform, an audit of their internal control over financial reporting. As part of our audits we are required to obtain an understanding of internal control over financial reporting but not for the purpose of expressing an opinion on the effectiveness of the Fund’s internal control over financial reporting. Accordingly, we express no such opinion.
Our audits included performing procedures to assess the risks of material misstatement of the financial statements and financial highlights, whether due to error or fraud, and performing procedures that respond to those risks. Such procedures included examining, on a test basis, evidence regarding the amounts and disclosures in the financial statements and financial highlights. Our audits also included evaluating the accounting principles used and significant estimates made by management, as well as evaluating the overall presentation of the financial statements and financial highlights. Our procedures included confirmation of securities owned as of June 30, 2024, by correspondence with the custodian and brokers; when replies were not received from brokers, we performed other auditing procedures. We believe that our audits provide a reasonable basis for our opinion.
Costa Mesa, California
August 22, 2024
We have served as the auditor of one or more Hotchkis & Wiley Funds investment companies since 2012.
Item 8. Changes in and Disagreements with Accountants for Open-End Management Investment Companies.
As a result of the Reorganization of the HW Opportunities MP Fund (the “Fund”) after the close of business on December 15, 2023, there was a change in accountants from Cohen & Company, Ltd., the Predecessor Fund’s independent registered public accounting firm, to Deloitte & Touche LLP, the independent registered public accounting firm that the Board selected for the Fund at a meeting held on August 15, 2023, upon the recommendation of the Trust’s Audit Committee.
During the fiscal year ended June 30, 2023 and the subsequent interim period through December 15, 2023, there were no (1) disagreements with Cohen & Company, Ltd. on any matters of accounting principles or practices, financial statement disclosure, or auditing scope or procedures, which disagreements, if not resolved to their satisfaction, would have caused them to make reference in connection with their opinion to the subject matter of the disagreements, or (2) reportable events.
The audited reports by Cohen & Company, Ltd. on the financial statements of the Predecessor Fund as of and for the fiscal year ended June 30, 2023, did not contain an adverse opinion or disclaimer of opinion, nor were they qualified or modified as to uncertainty, audit scope, or accounting principles. The Predecessor Fund has provided Cohen & Company, Ltd. with a copy of the disclosures and has requested that Cohen & Company, Ltd. furnish a letter stating whether it agrees with the statements and, if not, stating the respects in which it does not agree.
During the fiscal year ended June 30, 2023 and the subsequent interim period through December 15, 2023, (i) the Predecessor Fund did not (a) consult with Deloitte & Touche LLP as to the application of accounting principles to a specified transaction, either completed or proposed, or the type of audit opinion that might be rendered on the financial statements or (b) receive a written report or oral advice that Deloitte & Touche LLP concluded was an important factor considered in reaching a decision as to such accounting, auditing, or financial reporting issue; and (ii) the Predecessor Fund did not consult Deloitte & Touche LLP on any matter that was either the subject of a “disagreement” (as that term is defined in Item 304(a)(1)(iv) of Regulation S-K and the related instructions) or a “reportable event” (as that term is defined in Item 304(a)(1)(v) of Regulation S-K).
Item 9. Proxy Disclosures for Open-End Management Investment Companies.
Not applicable.
Item 10. Remuneration Paid to Directors, Officers, and Others of Open-End Management Investment Companies.
Remuneration paid to directors, officers and others is included in the Statements of Operations under the line items “Compliance fees and expenses” and “Trustees’ fees and expenses” as part of the financial statements filed under Item 7 of this Form N-CSR.
Item 11. Statement Regarding Basis for Approval of Investment Advisory Contract.
Board Considerations In Approving Continuation of Investment Advisory Agreements
Background and Approval Process. Hotchkis and Wiley Capital Management, LLC (the “Advisor”) serves as investment adviser to the Hotchkis and Wiley Diversified Value Fund, the Hotchkis and Wiley Large Cap Value Fund, the Hotchkis and Wiley Mid-Cap Value Fund, the Hotchkis and Wiley Small Cap Value Fund, the Hotchkis and Wiley Small Cap Diversified Value Fund, the Hotchkis and Wiley Global Value Fund, the Hotchkis and Wiley International Value Fund, the Hotchkis and Wiley International Small Cap Diversified Value Fund, the Hotchkis and Wiley Value Opportunities Fund and the Hotchkis and Wiley High Yield Fund (each a “Fund” and collectively the “Funds”) pursuant to separate investment advisory agreements (the “Advisory Agreements”) with the Hotchkis and Wiley Funds (the “Trust”), of which each Fund is a series. The Advisory Agreements were initially approved by the Board of Trustees of the Trust at the inception of each Fund and continue thereafter if approved annually by the Board of Trustees of the Trust, including a majority of the Trustees who are not “interested persons” (as defined in the Investment Company Act of 1940, as amended (the “1940 Act”)) (the “Independent Trustees”). The Advisory Agreements for each Fund were renewed by the Board at a meeting held in May 2024.
As part of the annual contract review process, the Independent Trustees, through their independent legal counsel, requested and received extensive materials, including information relating to: (i) the nature, extent and quality of services provided by the Advisor, (ii) short-term and longer-term total return of each Fund relative to its respective peer group and benchmark index(es), (iii) the advisory fees and expense ratios of each Fund as compared to the advisory fees and expense ratios of funds in its peer group, (iv) the costs of the services provided and the Advisor’s estimated profitability with respect to the management of each Fund, (v) the extent to which the Advisor has in the past, or is likely in the future, to experience economies of scale in connection with the investment advisory services it provides to each Fund, and (vi) fall-out benefits to the Advisor from its relationship with the Funds.
The Independent Trustees met with their independent legal counsel prior to the May 2024 Board meeting to review the materials provided by the Advisor and were advised regarding their fiduciary duties pertaining to renewal of investment advisory contracts and the factors they should consider in evaluating advisory agreements. The Independent Trustees, through their legal counsel, then provided follow-up questions to the Advisor which were addressed by the Advisor. The Independent Trustees noted that the information provided by the Advisor was thorough and responsive to their requests. The information provided in response to their requests was in addition to information received by the Board throughout the year, both in writing and during meetings, regarding the Funds, including Fund performance, expense ratios, portfolio composition and regulatory compliance.
At the May 2024 Board meeting, representatives of the Advisor discussed the Independent Trustees’ requests and follow-up questions with the Board and responded to further questions. The Board determined that, given the totality of the information provided with respect to the Advisory Agreements, the Board had received sufficient information to renew each Advisory Agreement.
In deciding to approve the renewal of each Advisory Agreement, the Board did not identify any single factor or group of factors as all-important or controlling, and considered a variety of factors in its analysis including those discussed below. The Board did not allot a particular weight to any one factor or group of factors.
Nature, Extent and Quality of Services. As part of the Board’s decision-making process, the Board noted that the Advisor and its predecessors have managed the Funds and their predecessors since their inception, and the Board believes that a long-term relationship with a capable, conscientious investment adviser is in the best interests of the Funds. The Board also considered that shareholders invest in a Fund specifically seeking the Advisor’s investment expertise and style. The Board also noted that when shareholders invest in a Fund, they know the advisory fee that is paid by the Fund. In this connection, the Board considered, in particular, that each Fund is managed in accordance with its investment objective and policies as disclosed to shareholders.
The Board reviewed information regarding various services provided by the Advisor to the Funds, including an organizational chart and background information on personnel performing such services. The Board also reviewed each Fund’s performance and information regarding the Advisor’s investment approach, which is driven by team-oriented, in-depth, fundamental research. The Board considered the depth and quality of the Advisor’s investment process, the low turnover rates of the Advisor’s key personnel, the overall stability of the Advisor’s organization, and the experience, capability and integrity of its senior management. The Board also considered the portfolio managers’ significant investments in the Funds. The Board considered the Trust’s compliance program and the resultant compliance by the Funds and the Advisor with legal requirements.
The Board also considered other non-advisory services provided by the Advisor to the Funds, such as the services of Advisor employees as Trust officers and other personnel provided that are necessary for Fund operations. The Board noted that the Advisor organizes Board meetings and the preparation of Board meeting materials, and those Advisor employees serving as Trust officers oversee and manage the other Fund service providers.
Based on its review, the Board concluded that the nature, extent and quality of services provided to each Fund under its Advisory Agreement were satisfactory.
Investment Performance of the Funds and the Advisor. The Board noted that it reviews data on the short-term and longer-term total returns of the Funds in connection with each quarterly Board meeting. For the contract review meeting, the Board reviewed a report prepared by the Trust’s administrator (the “Report”) using information provided by Morningstar, Inc., an independent provider of mutual fund data, that compared the annualized total returns of Class I shares of each Fund to the median annualized total returns of a group of funds that are similar, primarily in terms of investment style (each a “Peer Group”), and to the annualized total returns of the Fund’s primary and secondary (for Funds that have secondary benchmarks) benchmark indexes for the one-, three-, five- and ten-year periods, as applicable, ended
December 31, 2023 and for the three- and six-month, one-, three-, five- and ten-year periods, as applicable, ended March 31, 2024. The Board noted that the Peer Groups were reviewed and selected by the Advisor based on its criteria to determine an appropriate group of competitor funds. In addition, data regarding performance of the Peer Group is provided at each quarterly Board meeting.
The Board noted that all Funds outperformed the median returns of their respective primary benchmarks for the one-, three-, and five-year periods ended December 31, 2023, except that the Global Value Fund and the High Yield Fund underperformed their respective primary benchmarks for the five-year period. The Board also noted that all Funds outperformed the median returns of their respective Peer Groups for the one-, three- and five-year periods ended December 31, 2023, except that the High Yield Fund underperformed the median return of its Peer Group for the five-year period and the Small Cap Diversified Value Fund underperformed the median return of its Peer Group for the one-year period. The Board also considered that the International Small Cap Diversified Value Fund commenced operations on June 30, 2020 and did not have five years of performance history as of December 31, 2023. The Board considered that the Advisor had been consistent in its approach to managing the Funds. The Board concluded that the Advisor’s services in managing each Fund’s portfolio were satisfactory.
Fees, Expenses and Profitability. The Board reviewed advisory fee and expense data using information provided by Morningstar, Inc., contained in the Report, including information regarding applicable expense limitations for the Funds’ Class I shares. The Board reviewed data in the Report showing how each Fund’s advisory fee and Class I shares’ expense ratio compared to those of the funds in its Peer Group using similar share classes. The Board also reviewed information provided by the Advisor on management fees charged by the Advisor for sub-advisory services it provides to other mutual funds and management fees it charges to its separate account clients with investment objectives and policies similar to those of the Funds. The Board considered a list of the many additional functions that the Advisor performs for the Funds that the Advisor does not perform for its separate account and sub-advisory clients, and noted it is generally acknowledged that managing mutual funds subjects an investment adviser to more legal and regulatory risk than is the case with separate accounts.
With respect to the advisory fee for each Fund, the Board noted that the Report showed that the Diversified Value, Large Cap Value, Small Cap Diversified Value, and Value Opportunities Funds’ contractual advisory fees were higher than the median contractual advisory fees of their respective Peer Groups, that the Small Cap Value, Global Value, and International Small Cap Diversified Value Funds’ contractual advisory fees were lower than the median contractual advisory fees of their respective Peer Groups, and that the Mid-Cap Value, International Value, and High Yield Funds’ contractual advisory fees were the same as the median contractual advisory fees of their respective Peer Groups. The Board also noted that the net expense ratios, after implementation of the expense caps for the Class I shares of all the Funds except the Small Cap Diversified Value Fund, International Small Cap Diversified Value Fund and High Yield Fund were above the median net expense ratio of their Peer Group. The Board noted that the Advisor uses a fundamental research-intensive process. The Board considered the expense caps put in place by the Advisor for each Fund (as further described below). The Board concluded that the advisory fee was fair and reasonable for each Fund in light of the nature, extent and quality of services provided by the Advisor.
The Board reviewed information concerning the estimated profitability to the Advisor of the Advisory Agreements, including information regarding the methodology for allocating expenses. The Board reviewed data regarding the Advisor’s variable expenses and fixed expenses. The Board considered that in 2023, as in recent prior years, the Advisor had absorbed costs above expense caps for which it would not be reimbursed for the Diversified Value, Large Cap Value, Small Cap Value, Small Cap Diversified Value, Global Value, International Value, International Small Cap Diversified Value and High Yield Funds. The Board considered that the Advisor has agreed to continue the expense caps for the share classes of each Fund through at least August 29, 2025. The Board also recognized that individual fund or product line profitability of other advisers is generally not publicly available, and that profitability may be affected by numerous factors, so that the comparability of profitability among advisory firms is limited. The Board noted the importance of the Advisor’s profitability—which is derived solely from investment management fees – in maintaining its entrepreneurial environment in a private, primarily employee-owned structure. The Board also noted that the Advisor’s compensation/profit structure facilitates retention of its management and investment professionals. The Board concluded that the level of estimated profitability to the Advisor under the Advisory Agreements was not unreasonable.
Economies of Scale and Whether Fee Levels Reflect These Economies of Scale. The Board reviewed the information provided by the Advisor as to the extent to which it has in the past or is likely in the future to realize economies of scale in connection with the investment advisory services it provides as each Fund grows. The Board noted the low level of assets under management in certain Funds. The Board considered that the breakpoints in the Diversified Value, Large Cap Value, and Mid-Cap Value Funds’ advisory fee schedules can enable shareholders to share in economies of scale. The Board considered the amount of advisory fees that the Advisor waived and Fund operating expenses that the Advisor reimbursed in 2023 to the benefit of certain Funds and their shareholders. The Board also considered information regarding the investment, compliance and client service personnel employed by the Advisor. The Board concluded that in the aggregate the Funds’ fee levels are appropriate.
Fall-Out Benefits to the Advisor from its Relationship to the Funds. The Board considered information regarding any indirect benefits to the Advisor that could be identified from its relationship to the Funds. In particular, the Board considered that the Advisor has the ability to use commission sharing arrangements that allow the Advisor to pay for third-party research using soft dollars from the equity Funds’ commissions as well as other clients of the Advisor. The Board considered that the bundled research services and the use of commission sharing arrangements provides valuable information or service to the Advisor’s investment research process, which benefits the Funds (as well as the Advisor who uses (or can use) the research for the benefit of the Advisor’s other clients). The Board also considered that the Advisor indirectly benefits from the Funds’ payment of sub-transfer agency expenses.
* * * *
Based on its review, including its consideration of each of the factors referred to above, the Board, including all of the Independent Trustees, concluded that the terms of each Advisory Agreement are fair and reasonable and that the renewal of each Fund’s Advisory Agreement is in the best interests of the Fund.
Item 12. Disclosure of Proxy Voting Policies and Procedures for Closed-End Management Investment Companies.
Not applicable to open-end investment companies.
Item 13. Portfolio Managers of Closed-End Management Investment Companies.
Not applicable to open-end investment companies.
Item 14. Purchases of Equity Securities by Closed-End Management Investment Company and Affiliated Purchasers.
Not applicable to open-end investment companies.
Item 15. Submission of Matters to a Vote of Security Holders.
There have been no material changes to the procedures by which shareholders may recommend nominees to the registrant’s Board implemented after the registrant last provided disclosure in response to this Item.
Item 16. Controls and Procedures.
| (a) | The registrant’s Principal Executive Officer and Principal Financial Officer have reviewed the registrant’s disclosure controls and procedures (as defined in Rule 30a-3(c) under the Investment Company Act of 1940, as amended (the “Act”)) as of a date within 90 days of the filing of this report, as required by Rule 30a-3(b) under the Act and Rules 13a-15(b) or 15d-15(b) under the Securities Exchange Act of 1934, as amended. Based on their review, such officers have concluded that the disclosure controls and procedures are effective. |
| (b) | There were no changes in the registrant’s internal control over financial reporting (as defined in Rule 30a-3(d) under the Act) that occurred during the period covered by this report that have materially affected, or are reasonably likely to materially affect, the registrant’s internal control over financial reporting. |
Item 17. Disclosure of Securities Lending Activities for Closed-End Management Investment Companies
Not applicable to open-end investment companies.
Item 18. Recovery of Erroneously Awarded Compensation.
Item 19. Exhibits.
| (a) | (1) Not applicable because the code of ethics is available without charge, upon request, by calling toll-free at 1-800-796-5606. |
(2) Certifications for each principal executive officer and principal financial officer pursuant to Rule 30a-2(a) under the Investment Company Act of 1940 and Section 302 of the Sarbanes-Oxley Act of 2002 are filed herewith.
SIGNATURES
Pursuant to the requirements of the Securities Exchange Act of 1934 and the Investment Company Act of 1940, the registrant has duly caused this report to be signed on its behalf by the undersigned, thereunto duly authorized.
| | (Registrant) | Hotchkis & Wiley Funds | |
| | | | |
| | By (Signature and Title) | /s/ Anna Marie Lopez | |
| | | Anna Marie Lopez, Principal Executive Officer | |
Pursuant to the requirements of the Securities Exchange Act of 1934 and the Investment Company Act of 1940, this report has been signed below by the following persons on behalf of the registrant and in the capacities and on the dates indicated.
| | By (Signature and Title) | /s/ Anna Marie Lopez | |
| | | Anna Marie Lopez, Principal Executive Officer | |
| | By (Signature and Title) | /s/ James Menvielle | |
| | | James Menvielle, Principal Financial Officer | |