UNITED STATES
SECURITIES AND EXCHANGE COMMISSION
Washington, D.C. 20549
FORM N-CSR
CERTIFIED SHAREHOLDER REPORT OF REGISTERED
MANAGEMENT INVESTMENT COMPANIES
Investment Company Act File Number 811-10467
Causeway Capital Management Trust
(Exact name of registrant as specified in charter)
11111 Santa Monica Boulevard, 15th Floor
Los Angeles, CA 90025
(Address of principal executive offices) (Zip code)
SEI Investments Global Funds Services
One Freedom Valley Drive
Oaks, PA 19456
(Name and address of agent for service)
Registrant’s telephone number, including area code: 1-866-947-7000
Date of fiscal year end: September 30, 2017
Date of reporting period: September 30, 2017
| Item 1. | Reports to Stockholders. |
TABLE OF CONTENTS
LETTER TO SHAREHOLDERS
For the fiscal year ended September 30, 2017, Causeway International Opportunities Fund’s (the “Fund’s”) Institutional Class returned 22.82% and Investor Class returned 22.54% compared to the MSCI ACWI ex US Index (Gross) (“Index”) return of 20.15%. Since the Fund’s inception on December 31, 2009, its average annual total returns are 6.88% for the Institutional Class and 6.61% for the Investor Class compared to the Index’s average annual total return of 5.69%. At fiscal year-end, the Fund had net assets of $138 million.
Performance Review
Developed equity markets rose during the fiscal year as rising employment and improving consumer confidence data indicated a healthy global economy. Citing a strengthening labor market and increased consumer spending, the U.S. Federal Reserve indicated that it will start a process of quantitative tightening to reduce the size of its balance sheet. In Europe, stronger sales have driven corporate margin expansion, boosting expectations that a reduction in quantitative easing by the European Central Bank will begin in 2018. Europe has emerged from a few years of fiscal discipline in fairly good shape. This suggests diminishing risks to Eurozone economic and corporate profit growth in the months ahead.
Improving economic growth, brightening earnings outlooks, and favorable valuations within the emerging markets asset class lured investors during the fiscal year and helped the asset class outpace developed equity markets.
The best performing markets in our investable universe included Austria, Poland, Italy, Hungary, and Chile. The biggest laggards included Pakistan, Egypt, Qatar, Israel, and New Zealand. The best performing sectors in the Index were information technology, financials, and materials, while telecommunication services, consumer staples, and health care were the worst performing Index sectors.
For the fiscal year, Fund holdings in the banks, energy, materials, pharmaceuticals & biotechnology, and technology hardware & equipment industry groups contributed the most to the Fund’s performance relative to the Index. Holdings in the telecommunication services, food beverage & tobacco, transportation, and utilities industry groups, along with an underweight position in the semiconductors & semiconductor equipment industry group, offset some of the outperformance. The largest contributor to absolute return was banking & financial services company, UniCredit S.p.A. (Italy). Additional top contributors included paints & coatings producer, Akzo Nobel NV (Netherlands), automobile manufacturer, Volkswagen AG (Germany), electrical & electronic equipment manufacturer, Hitachi Ltd. (Japan), and luxury goods manufacturer & retailer, Compagnie Financiere Richemont (Switzerland). The biggest detractor from absolute return was baked goods food producer, Aryzta AG (Switzerland). Other notable detractors included telecommunication services provider, KDDI Corp. (Japan), shopping mall operator, Westfield Corp. (Australia), print & publishing company, RELX NV (Netherlands), and electric utility, Korea Electric Power Corp. (South Korea).
For the emerging markets portion of the Fund’s portfolio, we use a combination of stock-specific factors and country, currency, sector, and macroeconomic analysis to rank the stocks in our investable universe. Of the factors we use to forecast alpha (performance in excess of the MSCI Emerging Markets Index), our bottom-up earnings growth factors demonstrated the strongest performance during the fiscal year. Our bottom-up valuation factors also were positive for
| | | | | | |
| 2 | | Causeway International Opportunities Fund | | | | |
the period. Our technical factors, which measure six- and twelve-month price momentum, were relatively flat. Our top-down country factors were positive, and our macroeconomic and currency factors were flat during the fiscal year. Of our top-down factors, only our sector factors delivered negative performance.
Significant Portfolio Changes
In the developed markets portion of the Fund, our disciplined purchase and sale process led the portfolio management team to reduce exposure to several holdings that approached fair value in our view. The largest sales during the fiscal year included paints & coatings producer, Akzo Nobel NV (Netherlands) and banking & financial services company, BNP Paribas (France), along with three full sales from the Fund: integrated oil & gas company, Total (France), pharmaceutical giant, Sanofi (France), and print & publishing company, RELX NV (Netherlands). Significant purchases included four new additions to the Fund: crude oil & natural gas company, BP Plc (United Kingdom), pharmaceutical company, AstraZeneca Plc (United Kingdom), banking & financial services company, UniCredit S.p.A. (Italy), rail operator, Canadian Pacific Railway (Canada), along with an increased weight to power & automation technology company, ABB Ltd. (Switzerland).
The emerging markets portion of the Fund’s active exposure to several sectors and countries changed during the fiscal year as a result of our quantitative security selection process. We increased active weightings (compared to MSCI Emerging Markets Index weightings) to the financials and industrials sectors, and reduced active weightings to the consumer staples and energy sectors. Notable changes in the emerging markets portion of the Fund’s active country weightings included increases to exposure in China, Malaysia, and Turkey. We reduced exposure to Mexico, South Korea, and Brazil. Significant net purchases over the fiscal year included increased exposures to financial services firm, Sberbank (Russia), products & services provider for the electronic components industry, SK hynix Inc. (South Korea), and bank, China Construction Bank Corp. (China). The largest sales included reduced exposure to oil exploration & production giant, Gazprom Neft PJSC (Russia), automobile manufacturer, Tata Motors Ltd. (India), and integrated circuit manufacturer, Taiwan Semiconductor Manufacturing Co., Ltd. (Taiwan).
Equity Allocation Model Update
A proprietary quantitative equity allocation model assists the portfolio managers in determining the weight of emerging versus developed markets in the Fund. In constructing the model, we identified five primary factors as most indicative of the ideal allocation target: valuation, quality, macroeconomic, earnings growth, and risk aversion. Currently, our allocation factor categories are mixed on emerging markets and we are modestly underweight relative to the Index. Our valuation factor is currently neutral. Our risk aversion factor, which assesses the emerging markets bond yield spread over U.S. Treasuries, the CBOE Volatility Index (VIX), and the CBOE Emerging Markets ETF Volatility Index (VXEEM), indicates investors’ appetite for risk is high, a negative indicator for our model. Our earnings growth factor is positive for emerging markets, indicating that the near-term earnings revisions profile of emerging markets is superior to that of developed markets. Our quality metrics, which include such measures as profit margins and return on equity, are positive for emerging markets. Our macroeconomic factor, which measures the slope of the global yield curve, is negative on emerging markets.
| | | | | | |
| | | Causeway International Opportunities Fund | | | 3 | |
Investment Outlook
Cyclical stocks, overall, have received increased investor interest, likely associated with stable global growth. Prolonged loose monetary policies globally have flattened economic cycles, postponing the downturn in our view. Fiscal intervention by the Chinese government has delayed a deceleration of the world’s second largest economy. This benign backdrop has inspired investment risk taking. Downtrodden developed markets oil and gas stocks, especially the exploration and production companies, began a “re-rating” in September. Barring a breakdown in OPEC discipline, we currently expect the improvement in returns from this segment of the energy sector to continue. In this late stage global bull market, both developed and emerging markets appear to favor the price momentum stocks in popular areas such as information technology, with a particular premium on internet-related companies. In contrast, sectors lacking excitement include telecommunications services, which remains an area of interest for Causeway in Asia. Areas of undervaluation in developed equity markets are scarce and tend to have a common theme of operational missteps. We believe some of the most promising stocks globally represent “self-help” situations where company management has embarked (or will embark) on an extensive internal restructuring of operating and business lines, often leading to shareholder value enhancing disposals, cost cutting, and revenue growth opportunities. For example, management of a Japanese multinational conglomerate in the portfolio, which combines innovative fast-growing businesses with some poor performing subsidiaries in need of restructuring, has responded to shareholders and pursued a credible plan in an effort to enhance returns. The share price has rebounded this year in response. This experience is not universal, but there are many companies in a similar situation that pass our value screens. As a result, despite the fully valued developed equity markets, we are encouraged by accountable managements willing to embark on a series of operational improvements that should benefit shareholders in the months and years ahead.
Despite less favorable monetary policy from the United States and signs of investor complacency, we believe emerging markets equities continue to offer an appealing combination of growth and value investment opportunities. With economic growth and improved profitability likely to continue to attract emerging markets investors, we are encouraged by the performance of our bottom-up earnings growth factors. If investors remain acutely focused on corporate profitability, we would expect these factors to continue to demonstrate predictive power. This year, emerging markets equity investors have demonstrated thematic preferences for growth over value, economically defensive characteristics over economically cyclical characteristics, and large market capitalizations over small capitalizations. The Fund’s emerging markets positioning, with exposures to value, cyclicality, and small capitalization stocks, reflects our expectations that these premiums will return to more normalized levels. Although we cannot predict the exact timing of any reversion, we remain confident that our multi-factor investment process can position the Fund to take advantage of pricing inefficiencies and temporary market distortions, generating competitive returns for shareholders over full market cycles.
| | | | | | |
| 4 | | Causeway International Opportunities Fund | | | | |
We thank you for your continued confidence in Causeway International Opportunities Fund.
September 30, 2017
| | | | |
 | |  | |  |
| | |
| Harry W. Hartford | | Sarah H. Ketterer | | James A. Doyle |
| Portfolio Manager | | Portfolio Manager | | Portfolio Manager |
| | | | |
 | |  | | |
| | |
| Jonathan P. Eng | | Conor Muldoon | | |
| Portfolio Manager | | Portfolio Manager | | |
| | | | |
 | |  | |  |
| | |
| Arjun Jayaraman | | MacDuff Kuhnert | | Foster Corwith |
| Portfolio Manager | | Portfolio Manager | | Portfolio Manager |
| | | | |
 | |  | |  |
| | |
| Alessandro Valentini | | Joseph Gubler | | Ellen Lee |
| Portfolio Manager | | Portfolio Manager | | Portfolio Manager |
The above commentary expresses the portfolio managers’ views as of the date shown and should not be relied upon by the reader as research or investment advice. These views are subject to change. There is no guarantee that any forecasts made will come to pass.
Investing involves risk including loss of principal. In addition to the normal risks associated with investing, international investments may involve risk of capital loss from unfavorable fluctuation in currency values, from differences in generally accepted accounting principles or from economic or political instability in other nations. Emerging markets involve heightened risks related to the same factors as well as increased volatility and lower trading volume. Diversification does not prevent all investment losses.
| | | | | | |
| | | Causeway International Opportunities Fund | | | 5 | |
Comparison of Change in the Value of a $10,000 Investment in Causeway International Opportunities Fund, Investor Class shares versus the MSCI All Country World Index ex US (Gross)
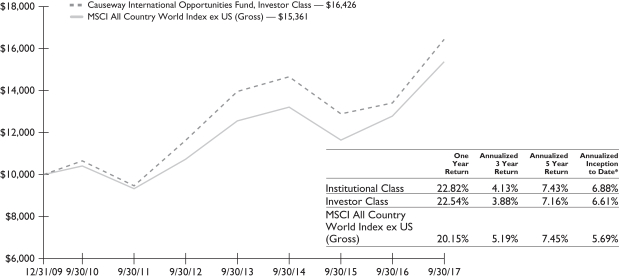
The performance in the above graph does not reflect the deduction of taxes the shareholder will pay on Fund distributions or redemptions of Fund shares.
* The inception date of Causeway International Opportunities Fund was December 31, 2009. The MSCI All Country World Index ex US (Gross) inception to date return is from December 31, 2009.
The performance data represents past performance and is not an indication of future results. Investment return and the principal value of an investment will fluctuate so that an investor’s shares, when redeemed, may be worth less than their original cost and current performance may be higher or lower than the performance quoted. For performance data current to the most recent month end, please call 1-866-947-7000 or visit www.causewayfunds.com. Investment performance reflects expense reimbursements in effect. In the absence of such expense reimbursements, total return would be reduced. The contractual expense limits are in effect until January 31, 2018. Total returns assume reinvestment of dividends and capital gains distributions at net asset value when paid. Investor Class shares pay a shareholder service fee of up to 0.25% per annum of average daily net assets. Institutional Class shares pay no shareholder service fee. Pursuant to the current January 26, 2017 prospectus, the Fund’s gross ratios of expenses in relation to average net assets were 1.12% and 1.37% for the Institutional Class and Investor Class, respectively and the Fund’s net ratios of expenses in relation to net assets were 1.07% and 1.32% for the Institutional Class and Investor Class, respectively. The Fund imposes a 2% redemption fee on the value of shares redeemed less than 60 days after purchase. If your account incurred a redemption fee, your performance will be lower than the performance shown here. For more information, please see the prospectus.
The MSCI All Country World Index ex US (Gross) is a free float-adjusted market capitalization weighted index, designed to measure the equity performance of developed and emerging markets excluding the U.S. market, consisting of 46 country indices. The Index is gross of withholding taxes, assumes reinvestment of dividends and capital gains, and does not reflect the payment of transaction costs, fees and expenses associated with an investment in the Fund. It is not possible to invest directly in an index. There are special risks in foreign investing (please see Note 5 in the Notes to Financial Statements).
MSCI has not approved, reviewed or produced this report, makes no express or implied warranties or representations, and is not liable whatsoever for any data in this report. You may not redistribute the MSCI data or use it as a basis for other indices or investment products.
| | | | | | |
| 6 | | Causeway International Opportunities Fund | | | | |
SCHEDULE OF INVESTMENTS (000)*
September 30, 2017
| | | | | | | | |
| Causeway International Opportunities Fund | | Number of Shares | | | Value | |
COMMON STOCK | | | | | | | | |
| Australia — 0.7% | | | | | | |
Westfield Corp.1 | | | 156,866 | | | $ | 965 | |
| | | | | | | | |
| Brazil — 0.6% | | | | | | |
Banco BTG Pactual S.A. | | | 15,597 | | | | 93 | |
Banco do Brasil SA | | | 22,700 | | | | 251 | |
JBS SA | | | 17,900 | | | | 48 | |
PPLA Participations Ltd.2 | | | 1,733 | | | | 1 | |
Qualicorp S.A. | | | 20,100 | | | | 238 | |
Smiles S.A. | | | 7,300 | | | | 184 | |
| | | | | | | | |
| | | | | | | 815 | |
| | | | | | | | |
| Canada — 6.2% | | | | | | |
Canadian Imperial Bank of Commerce | | | 1,047 | | | | 92 | |
Canadian Pacific Railway Ltd. | | | 14,147 | | | | 2,376 | |
Encana Corp. | | | 249,554 | | | | 2,938 | |
Gildan Activewear Inc. | | | 43,815 | | | | 1,369 | |
Manulife Financial Corp. | | | 87,100 | | | | 1,767 | |
| | | | | | | | |
| | | | | | | 8,542 | |
| | | | | | | | |
| China — 6.2% | | | | | | |
Alibaba Group Holding Ltd. ADR2 | | | 7,200 | | | | 1,244 | |
Baidu Inc. ADR2 | | | 700 | | | | 173 | |
Bank of China Ltd., Class H | | | 464,000 | | | | 229 | |
China Communications Construction Co. Ltd., Class H | | | 172,000 | | | | 215 | |
China Construction Bank Corp., Class H | | | 1,129,000 | | | | 936 | |
China Everbright Bank Co. Ltd., Class H | | | 142,000 | | | | 66 | |
China Everbright International Ltd. | | | 55,000 | | | | 69 | |
China Lodging Group Ltd. ADR2 | | | 2,000 | | | | 238 | |
China Lumena New Materials Corp.2,3,4 | | | 196,000 | | | | — | |
China Mobile Ltd. | | | 20,000 | | | | 203 | |
China Mobile Ltd. ADR | | | 6,900 | | | | 349 | |
China Petroleum & Chemical Corp., Class H | | | 658,000 | | | | 493 | |
China Railway Construction Corp. Ltd., Class H | | | 121,000 | | | | 153 | |
The accompanying notes are an integral part of the financial statements.
| | | | | | |
| | | Causeway International Opportunities Fund | | | 7 | |
SCHEDULE OF INVESTMENTS (000)* (continued)
September 30, 2017
| | | | | | | | |
| Causeway International Opportunities Fund | | Number of Shares | | | Value | |
| China — (continued) | | | | | | |
China Railway Group Ltd., Class H | | | 67,000 | | | $ | 55 | |
Dongfeng Motor Group Co. Ltd., Class H | | | 70,000 | | | | 92 | |
Fosun International Ltd. | | | 83,000 | | | | 175 | |
Guangzhou Automobile Group Co. Ltd., Class H | | | 114,000 | | | | 264 | |
Guangzhou R&F Properties Co. Ltd., Class H | | | 133,200 | | | | 309 | |
JD.com Inc. ADR2 | | | 4,200 | | | | 160 | |
JinkoSolar Holding Co. Ltd. ADR2 | | | 1,100 | | | | 27 | |
KWG Property Holding Ltd. | | | 93,000 | | | | 99 | |
NetEase Inc. ADR | | | 300 | | | | 79 | |
New Oriental Education & Technology Group ADR | | | 1,500 | | | | 132 | |
Ping An Insurance Group Co. of China Ltd., Class H | | | 37,500 | | | | 288 | |
Shanghai Pharmaceuticals Holding Co. Ltd., Class H | | | 44,400 | | | | 108 | |
Shenzhen Investment Ltd. | | | 182,000 | | | | 83 | |
Shimao Property Holdings Ltd. | | | 72,000 | | | | 156 | |
Sinopharm Group Co. Ltd., Class H | | | 4,000 | | | | 18 | |
Skyworth Digital Holdings Ltd. | | | 173,915 | | | | 89 | |
TAL Education Group ADR | | | 8,400 | | | | 283 | |
Tencent Holdings Ltd. | | | 29,100 | | | | 1,252 | |
Xinyi Glass Holdings Ltd.2 | | | 88,000 | | | | 87 | |
YY Inc. ADR2 | | | 3,400 | | | | 295 | |
Zhejiang Expressway Co. Ltd., Class H | | | 130,000 | | | | 162 | |
| | | | | | | | |
| | | | | | | 8,581 | |
| | | | | | | | |
| Czech Republic — 0.0% | | | | | | |
CEZ AS | | | 2,613 | | | | 52 | |
| | | | | | | | |
| France — 5.3% | | | | | | |
ArcelorMittal2 | | | 14,505 | | | | 374 | |
BNP Paribas SA | | | 15,098 | | | | 1,218 | |
Engie SA | | | 128,877 | | | | 2,189 | |
Schneider Electric SE2 | | | 46,306 | | | | 4,029 | |
| | | | | | | | |
| | | | | | | 7,810 | |
| | | | | | | | |
The accompanying notes are an integral part of the financial statements.
| | | | | | |
| 8 | | Causeway International Opportunities Fund | | | | |
SCHEDULE OF INVESTMENTS (000)* (continued)
September 30, 2017
| | | | | | | | |
| Causeway International Opportunities Fund | | Number of Shares | | | Value | |
| Germany — 5.5% | | | | | | |
BASF SE | | | 32,973 | | | $ | 3,509 | |
Linde AG | | | 10,629 | | | | 2,217 | |
SAP SE | | | 17,348 | | | | 1,900 | |
| | | | | | | | |
| | | | | | | 7,626 | |
| | | | | | | | |
| Hungary — 0.1% | | | | | | |
Richter Gedeon Nyrt | | | 3,680 | | | | 91 | |
| | | | | | | | |
| India — 2.0% | | | | | | |
Adani Ports & Special Economic Zone Ltd. | | | 39,739 | | | | 229 | |
Bank of Baroda | | | 12,709 | | | | 27 | |
Bharat Electronics Ltd. | | | 25,440 | | | | 63 | |
Biocon Ltd. | | | 3,388 | | | | 17 | |
Cipla Ltd. | | | 6,766 | | | | 61 | |
Dishman Carbogen Amcis Ltd.2 | | | 25,085 | | | | 130 | |
Dr Reddy’s Laboratories Ltd. | | | 2,843 | | | | 101 | |
Hindalco Industries Ltd. | | | 89,765 | | | | 331 | |
Hindustan Petroleum Corp. Ltd. | | | 46,443 | | | | 303 | |
Housing Development & Infrastructure Ltd.2 | | | 12,633 | | | | 11 | |
ICICI Bank Ltd. ADR | | | 34,540 | | | | 295 | |
Indian Oil Corp. Ltd. | | | 32,388 | | | | 199 | |
Oil & Natural Gas Corp. Ltd. | | | 14,311 | | | | 37 | |
Reliance Capital Ltd. | | | 10,313 | | | | 93 | |
Reliance Home Finance Ltd.2 | | | 10,313 | | | | 16 | |
Reliance Infrastructure Ltd. | | | 19,325 | | | | 138 | |
Rural Electrification Corp. Ltd. | | | 37,319 | | | | 87 | |
Sintex Industries Ltd. | | | 125,325 | | | | 51 | |
Sintex Plastics Technology Ltd.2 | | | 37,134 | | | | 52 | |
Tata Steel Ltd. | | | 26,907 | | | | 269 | |
UPL Ltd. | | | 8,292 | | | | 99 | |
Vedanta Ltd. | | | 23,786 | | | | 114 | |
| | | | | | | | |
| | | | | | | 2,723 | |
| | | | | | | | |
The accompanying notes are an integral part of the financial statements.
| | | | | | |
| | | Causeway International Opportunities Fund | | | 9 | |
SCHEDULE OF INVESTMENTS (000)* (continued)
September 30, 2017
| | | | | | | | |
| Causeway International Opportunities Fund | | Number of Shares | | | Value | |
| Indonesia — 0.2% | | | | | | |
Bank Negara Indonesia Persero Tbk PT | | | 115,400 | | | $ | 63 | |
Indofood Sukses Makmur Tbk PT | | | 224,800 | | | | 141 | |
Telekomunikasi Indonesia Persero Tbk PT | | | 79,600 | | | | 28 | |
| | | | | | | | |
| | | | | | | 232 | |
| | | | | | | | |
| Ireland — 0.1% | | | | | | |
Allied Irish Banks PLC | | | 34,218 | | | | 206 | |
| | | | | | | | |
| Italy — 1.8% | | | | | | |
UniCredit SpA2 | | | 118,117 | | | | 2,516 | |
| | | | | | | | |
| Japan — 10.7% | | | | | | |
East Japan Railway Co. | | | 27,400 | | | | 2,529 | |
Hitachi Ltd. | | | 283,000 | | | | 1,994 | |
Japan Airlines Co. Ltd. | | | 73,800 | | | | 2,497 | |
KDDI Corp. | | | 108,100 | | | | 2,850 | |
Komatsu Ltd. | | | 74,800 | | | | 2,128 | |
Sumitomo Mitsui Financial Group Inc. | | | 32,600 | | | | 1,252 | |
Takeda Pharmaceutical Co. Ltd. | | | 27,100 | | | | 1,497 | |
| | | | | | | | |
| | | | | | | 14,747 | |
| | | | | | | | |
| Malaysia — 0.5% | | | | | | |
AirAsia Bhd | | | 174,900 | | | | 143 | |
CIMB Group Holdings Bhd | | | 87,700 | | | | 131 | |
Malayan Banking Bhd | | | 115,700 | | | | 261 | |
Tenaga Nasional Bhd | | | 64,500 | | | | 219 | |
| | | | | | | | |
| | | | | | | 754 | |
| | | | | | | | |
| Mexico — 0.2% | | | | | | |
Alfa SAB de CV, Class A | | | 33,200 | | | | 42 | |
Arca Continental SAB de CV | | | 7,500 | | | | 51 | |
Gruma SAB de CV, Class B | | | 4,030 | | | | 59 | |
Kimberly-Clark de Mexico SAB de CV, Class A | | | 45,100 | | | | 92 | |
| | | | | | | | |
| | | | | | | 244 | |
| | | | | | | | |
The accompanying notes are an integral part of the financial statements.
| | | | | | |
| 10 | | Causeway International Opportunities Fund | | | | |
SCHEDULE OF INVESTMENTS (000)* (continued)
September 30, 2017
| | | | | | | | |
| Causeway International Opportunities Fund | | Number of Shares | | | Value | |
| Netherlands — 2.3% | | | | | | |
Akzo Nobel NV | | | 28,107 | | | $ | 2,595 | |
ING Groep NV | | | 31,765 | | | | 586 | |
| | | | | | | | |
| | | | | | | 3,181 | |
| | | | | | | | |
| Philippines — 0.0% | | | | | | |
Universal Robina Corp. | | | 13,470 | | | | 40 | |
| | | | | | | | |
| Poland — 0.3% | | | | | | |
PGE Polska Grupa Energetyczna SA2 | | | 31,779 | | | | 116 | |
Polski Koncern Naftowy Orlen SA | | | 2,167 | | | | 72 | |
Powszechny Zaklad Ubezpieczen SA | | | 15,051 | | | | 190 | |
| | | | | | | | |
| | | | | | | 378 | |
| | | | | | | | |
| Qatar — 0.1% | | | | | | |
Barwa Real Estate Co. | | | 11,676 | | | | 103 | |
| | | | | | | | |
| Russia — 1.2% | | | | | | |
Lukoil PJSC ADR | | | 5,731 | | | | 303 | |
Mobile Telesystems ADR | | | 13,700 | | | | 143 | |
PhosAgro OAO GDR | | | 5,579 | | | | 80 | |
Sberbank of Russia ADR | | | 55,087 | | | | 784 | |
Surgutneftegas OAO ADR | | | 19,672 | | | | 100 | |
Tatneft PAO ADR | | | 1,550 | | | | 66 | |
X5 Retail Group NV GDR2 | | | 2,903 | | | | 130 | |
| | | | | | | | |
| | | | | | | 1,606 | |
| | | | | | | | |
| South Africa — 0.6% | | | | | | |
Barloworld Ltd. | | | 14,809 | | | | 136 | |
FirstRand Ltd. | | | 6,339 | | | | 25 | |
Liberty Holdings Ltd. | | | 4,468 | | | | 35 | |
Mediclinic International PLC | | | 7,625 | | | | 66 | |
MMI Holdings Ltd. | | | 67,518 | | | | 86 | |
Naspers Ltd., Class N | | | 1,286 | | | | 278 | |
Nedbank Group Ltd. | | | 4,271 | | | | 64 | |
Novus Holdings Ltd. | | | 444 | | | | — | |
The accompanying notes are an integral part of the financial statements.
| | | | | | |
| | | Causeway International Opportunities Fund | | | 11 | |
SCHEDULE OF INVESTMENTS (000)* (continued)
September 30, 2017
| | | | | | | | |
| Causeway International Opportunities Fund | | Number of Shares | | | Value | |
| South Africa — (continued) | | | | | | |
Redefine Properties Ltd.1 | | | 85,105 | | | $ | 67 | |
Sibanye Gold Ltd. | | | 34,994 | | | | 39 | |
Vodacom Group Ltd. | | | 3,050 | | | | 36 | |
| | | | | | | | |
| | | | | | | 832 | |
| | | | | | | | |
| South Korea — 3.7% | | | | | | |
Amorepacific Corp. | | | 276 | | | | 63 | |
Dongbu Insurance Co. Ltd. | | | 1,275 | | | | 81 | |
Hana Financial Group Inc. | | | 8,553 | | | | 353 | |
Hanwha Corp. | | | 3,141 | | | | 121 | |
Hyundai Marine & Fire Insurance Co. Ltd. | | | 3,753 | | | | 149 | |
Hyundai Mobis | | | 394 | | | | 83 | |
KB Financial Group Inc. | | | 6,145 | | | | 301 | |
Kia Motors Corp. | | | 5,151 | | | | 142 | |
Korea Electric Power Corp. | | | 4,567 | | | | 155 | |
KT&G Corp. | | | 793 | | | | 73 | |
LG Corp. | | | 3,626 | | | | 255 | |
LG Display Co. Ltd. | | | 3,888 | | | | 104 | |
LG Household & Health Care Ltd. | | | 66 | | | | 54 | |
NongShim Co. Ltd. | | | 15 | | | | 4 | |
POSCO | | | 844 | | | | 234 | |
Samsung Electronics Co. Ltd. | | | 797 | | | | 1,784 | |
SK Hynix Inc. | | | 10,814 | | | | 783 | |
SK Innovation Co. Ltd. | | | 475 | | | | 82 | |
SK Telecom Co. Ltd. | | | 1,086 | | | | 242 | |
Woori Bank | | | 3,268 | | | | 51 | |
| | | | | | | | |
| | | | | | | 5,114 | |
| | | | | | | | |
| Spain — 0.6% | | | | | | |
CaixaBank SA | | | 174,018 | | | | 872 | |
| | | | | | | | |
| Sweden — 0.8% | | | | | | |
Alfa Laval AB | | | 47,267 | | | | 1,154 | |
| | | | | | | | |
The accompanying notes are an integral part of the financial statements.
| | | | | | |
| 12 | | Causeway International Opportunities Fund | | | | |
SCHEDULE OF INVESTMENTS (000)* (continued)
September 30, 2017
| | | | | | | | |
| Causeway International Opportunities Fund | | Number of Shares | | | Value | |
| Switzerland — 10.1% | | | | | | |
ABB Ltd. | | | 129,483 | | | $ | 3,201 | |
Aryzta AG2 | | | 29,280 | | | | 900 | |
Cie Financiere Richemont SA | | | 30,878 | | | | 2,822 | |
Novartis AG | | | 31,473 | | | | 2,694 | |
Roche Holding AG | | | 10,243 | | | | 2,615 | |
Zurich Insurance Group AG | | | 5,557 | | | | 1,695 | |
| | | | | | | | |
| | | | | | | 13,927 | |
| | | | | | | | |
| Taiwan — 2.4% | | | | | | |
Arcadyan Technology Corp. | | | 16,000 | | | | 26 | |
Catcher Technology Co. Ltd. | | | 21,000 | | | | 196 | |
Cathay Financial Holding Co. Ltd. | | | 137,000 | | | | 218 | |
Chicony Electronics Co. Ltd. | | | 418 | | | | 1 | |
Compal Electronics Inc. | | | 118,000 | | | | 84 | |
Compeq Manufacturing Co. Ltd. | | | 137,000 | | | | 149 | |
Coretronic Corp. | | | 48,800 | | | | 57 | |
CTBC Financial Holding Co. Ltd. | | | 229,000 | | | | 143 | |
FLEXium Interconnect Inc. | | | 36,732 | | | | 140 | |
Formosa Chemicals & Fibre Corp. | | | 10,000 | | | | 30 | |
Highwealth Construction Corp. | | | 26,000 | | | | 34 | |
HON HAI Precision Industry Co. Ltd. | | | 193,365 | | | | 670 | |
Inventec Corp. | | | 93,000 | | | | 69 | |
Lite-On Technology Corp. | | | 82,896 | | | | 118 | |
Micro-Star International Co. Ltd. | | | 18,000 | | | | 39 | |
Pegatron Corp. | | | 98,000 | | | | 254 | |
Powertech Technology Inc. | | | 86,000 | | | | 248 | |
President Chain Store Corp. | | | 6,000 | | | | 51 | |
Taiwan Semiconductor Manufacturing Co. Ltd. ADR | | | 16,000 | | | | 601 | |
TTY Biopharm Co. Ltd. | | | 5,000 | | | | 15 | |
WPG Holdings Ltd. | | | 74,000 | | | | 98 | |
Yuanta Financial Holding Co. Ltd. | | | 166,000 | | | | 71 | |
| | | | | | | | |
| | | | | | | 3,312 | |
| | | | | | | | |
The accompanying notes are an integral part of the financial statements.
| | | | | | |
| | | Causeway International Opportunities Fund | | | 13 | |
SCHEDULE OF INVESTMENTS (000)* (continued)
September 30, 2017
| | | | | | | | |
| Causeway International Opportunities Fund | | Number of Shares | | | Value | |
| Thailand — 1.0% | | | | | | |
Bangchak Corp. PCL | | | 81,300 | | | $ | 98 | |
Bangkok Dusit Medical Services PCL | | | 104,200 | | | | 64 | |
Bangkok Expressway & Metro PCL | | | 18 | | | | — | |
Charoen Pokphand Foods PCL | | | 178,000 | | | | 143 | |
Krung Thai Bank PCL | | | 277,300 | | | | 156 | |
PTT PCL | | | 44,300 | | | | 542 | |
Sansiri PCL | | | 964,600 | | | | 66 | |
Thai Oil PCL | | | 41,200 | | | | 114 | |
Thanachart Capital PCL | | | 99,200 | | | | 145 | |
| | | | | | | | |
| | | | | | | 1,328 | |
| | | | | | | | |
| Turkey — 0.5% | | | | | | |
Tekfen Holding AS | | | 37,354 | | | | 123 | |
Turk Traktor ve Ziraat Makineleri AS | | | 1,699 | | | | 37 | |
Turkcell Iletisim Hizmetleri AS | | | 84,980 | | | | 302 | |
Turkiye Is Bankasi, Class C | | | 136,128 | | | | 259 | |
| | | | | | | | |
| | | | | | | 721 | |
| | | | | | | | |
| United Arab Emirates — 0.2% | | | | | | |
DAMAC Properties Dubai Co. PJSC | | | 166,078 | | | | 172 | |
Dubai Islamic Bank PJSC | | | 49,735 | | | | 82 | |
First Abu Dhabi Bank PJSC | | | 16,767 | | | | 47 | |
| | | | | | | | |
| | | | | | | 301 | |
| | | | | | | | |
| United Kingdom — 25.7% | | | | | | |
AstraZeneca PLC | | | 44,103 | | | | 2,928 | |
Aviva PLC | | | 321,891 | | | | 2,219 | |
Balfour Beatty PLC | | | 263,955 | | | | 952 | |
Barclays PLC | | | 1,359,179 | | | | 3,521 | |
BHP Billiton PLC | | | 47,114 | | | | 830 | |
BP PLC | | | 498,661 | | | | 3,189 | |
British American Tobacco PLC | | | 63,583 | | | | 3,981 | |
Carnival PLC | | | 27,355 | | | | 1,739 | |
Cobham PLC2 | | | 694,779 | | | | 1,356 | |
The accompanying notes are an integral part of the financial statements.
| | | | | | |
| 14 | | Causeway International Opportunities Fund | | | | |
SCHEDULE OF INVESTMENTS (000)* (continued)
September 30, 2017
| | | | | | | | |
| Causeway International Opportunities Fund | | Number of Shares | | | Value | |
| United Kingdom — (continued) | | | | | | |
Diageo PLC | | | 36,010 | | | $ | 1,184 | |
GlaxoSmithKline PLC | | | 118,202 | | | | 2,358 | |
Lloyds Banking Group PLC | | | 1,687,524 | | | | 1,532 | |
Micro Focus International PLC | | | 18,305 | | | | 586 | |
Prudential PLC | | | 75,284 | | | | 1,802 | |
Royal Dutch Shell PLC, Class B | | | 129,640 | | | | 3,986 | |
SSE PLC | | | 80,922 | | | | 1,515 | |
Vodafone Group PLC | | | 652,801 | | | | 1,826 | |
| | | | | | | | |
| | | | | | | 35,504 | |
| | | | | | | | |
Total Common Stock | | | | | | | | |
(Cost $109,043) — 90.0% | | | | | | | 124,277 | |
| | | | | | | | |
PREFERRED STOCK | | | | | | | | |
| Germany — 3.7% | | | | | | |
Volkswagen AG | | | 31,261 | | | | 5,099 | |
| | | | | | | | |
Total Preferred Stock | | | | | | | | |
(Cost $4,228) — 3.7% | | | | | | | 5,099 | |
| | | | | | | | |
EXCHANGE TRADED FUND | | | | | | | | |
Vanguard FTSE Emerging Markets ETF | | | 54,000 | | | | 2,353 | |
| | | | | | | | |
Total Exchange Traded Fund | | | | | | | | |
(Cost $2,349) — 1.7% | | | | | | | 2,353 | |
| | | | | | | | |
PREFERENCE STOCK | | | | | | | | |
| Brazil — 0.8% | | | | | | |
Bradespar SA | | | 34,800 | | | | 265 | |
Braskem SA | | | 6,100 | | | | 82 | |
Cia Energetica de Sao Paulo | | | 100 | | | | — | |
Cia Paranaense de Energia | | | 11,100 | | | | 98 | |
Itausa — Investimentos Itau SA | | | 80,723 | | | | 282 | |
Petroleo Brasileiro SA, Class A ADR2 | | | 4,900 | | | | 47 | |
Suzano Papel e Celulose SA, Class A | | | 13,200 | | | | 76 | |
Vale SA, Class B ADR | | | 17,000 | | | | 159 | |
| | | | | | | | |
| | | | | | | 1,009 | |
| | | | | | | | |
The accompanying notes are an integral part of the financial statements.
| | | | | | |
| | | Causeway International Opportunities Fund | | | 15 | |
SCHEDULE OF INVESTMENTS (000)* (concluded)
September 30, 2017
| | | | | | | | |
| Causeway International Opportunities Fund | | Number of Shares | | | Value | |
| South Korea — 0.1% | | | | | | |
LG Chemical Ltd. | | | 531 | | | $ | 118 | |
| | | | | | | | |
Total Preference Stock | | | | | | | | |
(Cost $762) — 0.9% | | | | | | | 1,127 | |
| | | | | | | | |
SHORT-TERM INVESTMENT | | | | | | | | |
Invesco Short-Term Investments Trust: Government & Agency Portfolio, Institutional Class, 0.930%** | | | 3,899,950 | | | | 3,900 | |
| | | | | | | | |
Total Short-Term Investment | | | | | | | | |
(Cost $3,900) — 2.8% | | | | | | | 3,900 | |
| | | | | | | | |
Total Investments — 99.1% | | | | | | | | |
(Cost $120,282) | | | | | | | 136,756 | |
| | | | | | | | |
Other Assets in Excess of Liabilities — 0.9% | | | | | | | 1,275 | |
| | | | | | | | |
Net Assets — 100.0% | | | | | | $ | 138,031 | |
| | | | | | | | |
| ** | The rate reported is the 7-day effective yield as of September 30, 2017. |
| 1 | Real Estate Investment Trust. |
| 2 | Non-income producing security. |
| 3 | Securities considered illiquid. The total market value of such securities as of September 30, 2017 was $— and represented 0.0% of net assets. |
| 4 | Security is fair valued at zero due to company’s insolvency. Level 3 security in accordance with fair value hierarchy. |
| ADR | American Depositary Receipt |
| FTSE | Financial Times London Stock Exchange |
| GDR | Global Depositary Receipt |
Amounts designated as “—” are $0 or are rounded to $0.
The accompanying notes are an integral part of the financial statements.
| | | | | | |
| 16 | | Causeway International Opportunities Fund | | | | |
SECTOR DIVERSIFICATION
As of September 30, 2017, the sector diversification was as follows (Unaudited):
| | | | | | | | | | | | | | | | |
| Causeway International Opportunities Fund | | Common
Stock | | | Preferred
Stock | | | Preference
Stock | | | % of
Net Assets | |
| | | | |
Financials | | | 21.3% | | | | 0.0% | | | | 0.2% | | | | 21.5% | |
| | | | |
Industrials | | | 16.1 | | | | 0.0 | | | | 0.0 | | | | 16.1 | |
| | | | |
Energy | | | 11.6 | | | | 0.0 | | | | 0.0 | | | | 11.6 | |
| | | | |
Consumer Discretionary | | | 5.9 | | | | 3.7 | | | | 0.0 | | | | 9.6 | |
| | | | |
Health Care | | | 9.4 | | | | 0.0 | | | | 0.0 | | | | 9.4 | |
| | | | |
Information Technology | | | 9.4 | | | | 0.0 | | | | 0.0 | | | | 9.4 | |
| | | | |
Materials | | | 5.2 | | | | 0.0 | | | | 0.6 | | | | 5.8 | |
| | | | |
Telecommunication Services | | | 4.3 | | | | 0.0 | | | | 0.0 | | | | 4.3 | |
| | | | |
Utilities | | | 3.2 | | | | 0.0 | | | | 0.1 | | | | 3.3 | |
| | | | |
Consumer Staples | | | 2.1 | | | | 0.0 | | | | 0.0 | | | | 2.1 | |
| | | | |
Real Estate | | | 1.5 | | | | 0.0 | | | | 0.0 | | | | 1.5 | |
| | | | | | | | | | | | | | | | |
| Total | | | 90.0 | | | | 3.7 | | | | 0.9 | | | | 94.6 | |
| | | | |
| Exchange Traded Funds | | | | | | | | | | | | | | | 1.7 | |
| | | | | | | | | | | | | | | | |
| Short-Term Investment | | | | | | | | | | | | | | | 2.8 | |
| | | | | | | | | | | | | | | | |
| Other Assets in Excess of Liabilities | | | | | | | | | | | | | | | 0.9 | |
| | | | | | | | | | | | | | | | |
| Net Assets | | | | | | | | | | | | | | | 100.0% | |
| | | | | | | | | | | | | | | | |
The accompanying notes are an integral part of the financial statements.
| | | | | | |
| | | Causeway International Opportunities Fund | | | 17 | |
STATEMENT OF ASSETS AND LIABILITIES (000)*
| | | | |
| | | CAUSEWAY INTERNATIONAL
OPPORTUNITIES FUND | |
| |
| | | 9/30/17 | |
ASSETS: | | | | |
Investments at Value (Cost $120,282) | | $ | 136,756 | |
Cash | | | 3 | |
Foreign Currency (Cost $134) | | | 134 | |
Receivable for Fund Shares Sold | | | 1,123 | |
Receivable for Dividends | | | 269 | |
Receivable for Tax Reclaims | | | 246 | |
Receivable for Investment Securities Sold | | | 91 | |
Prepaid Expenses | | | 11 | |
| | | | |
Total Assets | | | 138,633 | |
| | | | |
LIABILITIES: | | | | |
Payable for Investment Securities Purchased | | | 355 | |
Payable Due to Adviser | | | 78 | |
Accrued Foreign Capital Gains Tax on Appreciated Securities | | | 27 | |
Payable for Fund Shares Redeemed | | | 20 | |
Payable for Shareholder Service Fees — Investor Class | | | 4 | |
Payable Due to Administrator | | | 3 | |
Payable for Trustees’ Fees | | | 1 | |
Other Accrued Expenses | | | 114 | |
| | | | |
Total Liabilities | | | 602 | |
| | | | |
Net Assets | | $ | 138,031 | |
| | | | |
NET ASSETS: | | | | |
Paid-in Capital (unlimited authorization — no par value) | | $ | 131,160 | |
Undistributed Net Investment Income | | | 1,660 | |
Accumulated Net Realized Loss on Investments and Foreign Currency Transactions | | | (11,244 | ) |
Net Unrealized Appreciation on Investments | | | 16,474 | |
Accrued Foreign Capital Gains Tax on Appreciated Securities | | | (27 | ) |
Net Unrealized Appreciation on Foreign Currencies and Translation of Other Assets and Liabilities Denominated in Foreign Currencies | | | 8 | |
| | | | |
Net Assets | | $ | 138,031 | |
| | | | |
Net Asset Value Per Share (based on net assets of
$130,356,890 ÷ 9,308,282 shares) — Institutional Class | | | $14.00 | |
| | | | |
Net Asset Value Per Share (based on net assets of
$7,674,421 ÷ 552,045 shares) — Investor Class | | | $13.90 | |
| | | | |
| * | Except for Net Asset Value Per Share data. |
The accompanying notes are an integral part of the financial statements.
| | | | | | |
| 18 | | Causeway International Opportunities Fund | | | | |
STATEMENT OF OPERATIONS (000)
| | | | |
| | | CAUSEWAY INTERNATIONAL
OPPORTUNITIES FUND | |
| |
| | | 10/01/16 to
9/30/17 | |
INVESTMENT INCOME: | | | | |
Dividend Income (net of foreign taxes withheld of $262) | | $ | 2,984 | |
| | | | |
Total Investment Income | | | 2,984 | |
| | | | |
EXPENSES: | | | | |
Investment Advisory Fees | | | 809 | |
Custodian Fees | | | 191 | |
Transfer Agent Fees | | | 60 | |
Professional Fees | | | 58 | |
Administration Fees | | | 30 | |
Registration Fees | | | 29 | |
Printing Fees | | | 27 | |
Pricing Fees | | | 19 | |
Line of Credit | | | 14 | |
Shareholder Service Fees — Investor Class | | | 12 | |
Trustees’ Fees | | | 4 | |
Other Fees | | | 4 | |
| | | | |
Total Expenses | | | 1,257 | |
| | | | |
Waiver of Investment Advisory Fees | | | (178 | ) |
| | | | |
Total Waiver and Reimbursement | | | (178 | ) |
| | | | |
| |
Net Expenses | | | 1,079 | |
| | | | |
Net Investment Income | | | 1,905 | |
| | | | |
Net Realized and Unrealized Gain (Loss) on Investments and Foreign Currency Transactions: | | | | |
Net Realized Gain on Investments | | | 835 | |
Net Realized Loss from Foreign Currency Transactions | | | (49 | ) |
Net Change in Unrealized Appreciation on Investments | | | 17,328 | |
Net Change in Accrued Foreign Capital Gains Tax on Appreciated Securities | | | (3 | ) |
Net Change in Unrealized Appreciation on Foreign Currency and Translation of Other Assets and Liabilities Denominated in Foreign Currency | | | 3 | |
| | | | |
Net Realized and Unrealized Gain on Investments and Foreign Currency Transactions | | | 18,114 | |
| | | | |
| Net Increase in Net Assets Resulting from Operations | | $ | 20,019 | |
| | | | |
The accompanying notes are an integral part of the financial statements.
| | | | | | |
| | | Causeway International Opportunities Fund | | | 19 | |
STATEMENTS OF CHANGES IN NET ASSETS (000)
| | | | | | | | |
| | | CAUSEWAY INTERNATIONAL
OPPORTUNITIES FUND | |
| | |
| | | 10/01/16 to
9/30/17 | | | 10/01/15 to
9/30/16 | |
OPERATIONS: | | | | | | | | |
Net Investment Income | | $ | 1,905 | | | $ | 2,790 | |
Net Realized Gain (Loss) on Investments | | | 835 | | | | (11,560 | ) |
Net Realized Loss from Foreign Currency Transactions | | | (49 | ) | | | (1 | ) |
Net Change in Unrealized Appreciation on Investments | | | 17,328 | | | | 11,047 | |
Net Change in Accrued Foreign Capital Gains Tax on Appreciated Securities | | | (3 | ) | | | (24 | ) |
Net Change in Unrealized Appreciation on Foreign Currency and Translation of Other Assets and Liabilities Denominated in Foreign Currency | | | 3 | | | | 8 | |
| | | | | | | | |
Net Increase in Net Assets Resulting From Operations | | | 20,019 | | | | 2,260 | |
| | | | | | | | |
DIVIDENDS AND DISTRIBUTIONS TO SHAREHOLDERS: | | | | | | | | |
Dividends from Net Investment Income: | | | | | | | | |
Institutional Class | | | (2,896 | ) | | | (1,697 | ) |
Investor Class | | | (115 | ) | | | (35 | ) |
| | | | | | | | |
Total Dividends from Net Investment Income | | | (3,011 | ) | | | (1,732 | ) |
| | | | | | | | |
Distributions from Net Capital Gains: | | | | | | | | |
Institutional Class | | | — | | | | (320 | ) |
Investor Class | | | — | | | | (8 | ) |
| | | | | | | | |
Total Distributions from Net Capital Gains | | | — | | | | (328 | ) |
| | | | | | | | |
Total Dividends and Distributions to Shareholders | | | (3,011 | ) | | | (2,060 | ) |
| | |
Net Increase (Decrease) in Net Assets Derived from Capital Share Transactions(1) | | | 14,736 | | | | (12,776 | ) |
Redemption Fees(2) | | | 6 | | | | 1 | |
| | | | | | | | |
Total Increase (Decrease) in Net Assets | | | 31,750 | | | | (12,575 | ) |
| | | | | | | | |
NET ASSETS: | | | | | | | | |
Beginning of Year | | | 106,281 | | | | 118,856 | |
| | | | | | | | |
End of Year | | $ | 138,031 | | | $ | 106,281 | |
| | | | | | | | |
Undistributed Net Investment Income | | $ | 1,660 | | | $ | 2,711 | |
| | | | | | | | |
| (1) | See Note 7 in Notes to Financial Statements. |
| (2) | See Note 2 in Notes to Financial Statements. |
Amounts designated as “—” are $0 or round to $0.
The accompanying notes are an integral part of the financial statements.
| | | | | | |
| 20 | | Causeway International Opportunities Fund | | | | |
This page intentionally left blank.
FINANCIAL HIGHLIGHTS
For the fiscal years ended September 30,
For a Share Outstanding Throughout the Fiscal Years
| | | | | | | | | | | | | | | | | | | | | | | | | | | | | | | | |
| | | Net Asset
Value,
Beginning
of Year ($) | | | Net
Investment
Income ($) | | |
Net Realized
and
Unrealized
Gain
(Loss) on
Investments ($) | | | Total
from
Operations ($) | | | Dividends
from Net
Investment
Income ($) | | | Distributions
from
Capital
Gains ($) | | | Total
Dividends
and
Distributions ($) | | | Redemption
Fees ($) | |
CAUSEWAY INTERNATIONAL OPPORTUNITIES FUND† | |
Institutional | |
2017 | | | 11.85 | | | | 0.24 | | | | 2.36 | | | | 2.60 | | | | (0.45 | ) | | | — | | | | (0.45 | ) | | | — | (1) |
2016 | | | 11.55 | | | | 0.24 | | | | 0.25 | (2) | | | 0.49 | | | | (0.16 | ) | | | (0.03 | ) | | | (0.19 | ) | | | — | (1) |
2015 | | | 13.61 | | | | 0.21 | | | | (1.78 | ) | | | (1.57 | ) | | | — | | | | (0.49 | ) | | | (0.49 | ) | | | — | (1) |
2014 | | | 13.11 | | | | 0.12 | | | | 0.58 | | | | 0.70 | | | | (0.13 | ) | | | (0.07 | ) | | | (0.20 | ) | | | — | |
2013 | | | 11.15 | | | | 0.24 | | | | 1.99 | | | | 2.23 | | | | (0.25 | ) | | | (0.02 | ) | | | (0.27 | ) | | | — | |
Investor | |
2017 | | | 11.77 | | | | 0.24 | | | | 2.31 | | | | 2.55 | | | | (0.42 | ) | | | — | | | | (0.42 | ) | | | — | (1) |
2016 | | | 11.47 | | | | 0.20 | | | | 0.27 | (2) | | | 0.47 | | | | (0.14 | ) | | | (0.03 | ) | | | (0.17 | ) | | | — | (1) |
2015 | | | 13.56 | | | | 0.20 | | | | (1.80 | ) | | | (1.60 | ) | | | — | | | | (0.49 | ) | | | (0.49 | ) | | | — | |
2014 | | | 13.07 | | | | 0.11 | | | | 0.55 | | | | 0.66 | | | | (0.10 | ) | | | (0.07 | ) | | | (0.17 | ) | | | — | |
2013 | | | 11.12 | | | | 0.08 | | | | 2.11 | | | | 2.19 | | | | (0.22 | ) | | | (0.02 | ) | | | (0.24 | ) | | | — | |
| † | Per share amounts calculated using average shares method. |
| (1) | Amount represents less than $0.01 per share (See Note 2 in the Notes to Financial Statements). |
| (2) | The amount shown for the year ended September 30, 2016, for a share outstanding throughout the year does not accord with the aggregate net gains on investments for that year because of the timing of the sales and repurchase of Fund shares in relation to fluctuating market value of the investments of the Fund. |
| (3) | In October 2014, the Fund converted from a fund of funds to direct investing in securities and, since that time, no longer invests in and is no longer subject to the fees and expenses of other Causeway Funds. At the same time, and following shareholder approval of a new investment advisory agreement, the Fund became subject to an investment advisory fee and entered into a new Expense Limit Agreement with the Adviser that limits expenses at a higher level than previously applicable to the Fund. |
| (4) | Portfolio turnover rate includes transactions related to the Fund’s conversion from a fund of funds investing in other Causeway Funds to direct investing in securities in October 2014. |
Amounts designated as “—” are $0 or round to $0.
The accompanying notes are an integral part of the financial statements.
| | | | | | |
| 22 | | Causeway International Opportunities Fund | | | | |
| | | | | | | | | | | | | | | | | | | | | | | | | | |
Net Asset
Value, End
of Year ($) | | | Total
Return (%) | | | Net Assets,
End of
Year
($000) | | | Ratio of
Expenses to
Average Net
Assets (%) | | | Ratio of
Expenses
to Average
Net Assets
(Excluding Waivers
and Reimburse-
ments) (%) | | | Ratio
of Net
Investment
Income
to Average
Net Assets (%) | | | Portfolio
Turnover
Rate (%) | |
| | | | | | | | | | | | | | | | | | | | | | | | | | |
| | | | | | | | | | | | | | | | | | | | | | | | | | |
| | 14.00 | | | | 22.82 | | | | 130,357 | | | | 1.05 | | | | 1.23 | | | | 1.88 | | | | 62 | |
| | 11.85 | | | | 4.27 | | | | 103,665 | | | | 1.05 | | | | 1.10 | | | | 2.10 | | | | 63 | |
| | 11.55 | | | | (11.83 | ) | | | 115,881 | | | | 1.02 | (3) | | | 1.17 | | | | 1.64 | | | | 37 | (4) |
| | 13.61 | | | | 5.39 | | | | 76,848 | | | | 0.11 | | | | 0.38 | | | | 0.88 | | | | 33 | |
| | 13.11 | | | | 20.22 | | | | 42,476 | | | | 0.11 | | | | 0.62 | | | | 2.00 | | | | 7 | |
| | | | | | | | | | | | | | | | | | | | | | | | | | |
| | 13.90 | | | | 22.54 | | | | 7,674 | | | | 1.30 | | | | 1.44 | | | | 1.86 | | | | 62 | |
| | 11.77 | | | | 4.07 | | | | 2,616 | | | | 1.30 | | | | 1.35 | | | | 1.72 | | | | 63 | |
| | 11.47 | | | | (12.11 | ) | | | 2,975 | | | | 1.28 | (3) | | | 1.44 | | | | 1.56 | | | | 37 | (4) |
| | 13.56 | | | | 5.08 | | | | 1,338 | | | | 0.36 | | | | 0.63 | | | | 0.80 | | | | 33 | |
| | 13.07 | | | | 19.95 | | | | 1,684 | | | | 0.36 | | | | 0.88 | | | | 0.65 | | | | 7 | |
The accompanying notes are an integral part of the financial statements.
| | | | | | |
| | | Causeway International Opportunities Fund | | | 23 | |
NOTES TO FINANCIAL STATEMENTS
Causeway International Opportunities Fund (the “Fund”) is a series of Causeway Capital Management Trust (the “Trust”). The Trust is an open-end management investment company registered under the Investment Company Act of 1940, as amended (the “1940 Act”) and is a Delaware statutory trust that was established on August 10, 2001. The Fund began operations on December 31, 2009. The Fund is authorized to offer two classes of shares, the Institutional Class and the Investor Class. The Declaration of Trust authorizes the issuance of an unlimited number of shares of beneficial interest of the Fund. The Fund is diversified. The Fund’s prospectus provides a description of the Fund’s investment objectives, policies and strategies. The Trust has five additional series, the financial statements of which are presented separately.
| 2. | | Significant Accounting Policies |
The following is a summary of the significant accounting policies consistently followed by the Fund.
Use of Estimates in the Preparation of Financial Statements – The Fund is an investment company that applies the accounting and reporting guidance issued in Topic 946 by the U.S. Financial Accounting Standards Board. The Fund’s financial statements have been prepared to comply with U.S. generally accepted accounting principles (“U.S. GAAP”). The preparation of financial statements in conformity with U.S. GAAP requires management to make estimates and assumptions that affect the reported amount of net assets and liabilities and disclosure of contingent assets and liabilities at the date of the financial statements and the reported amounts of increases and decreases in net assets from operations during the reporting period. Actual results could differ from those estimates.
Security Valuation – Except as described below, securities listed on a securities exchange (except the NASDAQ Stock Market (“NASDAQ”)) or Over-the-Counter (“OTC”) for which market quotations are available are valued at the last reported sale price as of the close of trading on each business day, or, if there is no such reported sale, at the last reported bid price for long positions. For securities traded on NASDAQ, the NASDAQ Official Closing Price is used. Securities listed on multiple exchanges or OTC markets are valued on the exchange or OTC market considered by the Fund to be the primary market. The prices for foreign securities are reported in local currency and converted to U.S. dollars using currency exchange rates. Prices for most securities held in the Fund are provided daily by recognized independent pricing agents. If a security price cannot be obtained from an independent pricing agent, the Fund seeks to obtain a bid price from at least one independent broker. Investments in money market funds are valued daily at the net asset value per share.
Securities for which market prices are not “readily available” are valued in accordance with fair value pricing procedures approved by the Fund’s Board of Trustees (the “Board”). The Fund’s fair value pricing procedures are implemented through a Fair Value Committee (the “Committee”) designated by the Board. Some of the more common reasons that may necessitate that a security be valued using fair value pricing procedures include: the security’s trading has been halted or suspended; the security has been delisted from a national exchange; the security’s primary trading market is temporarily closed at a time when under normal conditions it would be open; or the security’s primary pricing source is not able or willing to provide a price. When the Committee values a security in accordance with the fair value pricing procedures, the Committee
| | | | | | |
| 24 | | Causeway International Opportunities Fund | | | | |
NOTES TO FINANCIAL STATEMENTS
(continued)
will determine the value after taking into consideration relevant information reasonably available to the Committee.
The Fund uses a third party vendor to fair value certain non-U.S. securities if there is a movement in the U.S. market or a designated exchange-traded fund that trades in the U.S. that exceeds thresholds established by the Committee. The vendor provides fair values for foreign securities based on factors and methodologies involving, generally, tracking valuation correlations between the U.S. market and each non-U.S. security and such fair values are applied by the administrator if a pre-determined confidence level is reached for the security.
In accordance with the authoritative guidance on fair value measurements and disclosure under U.S. GAAP, the Fund discloses fair value of its investments in a hierarchy that prioritizes the inputs to valuation techniques used to measure the fair value. The objective of a fair value measurement is to determine the price that would be received to sell an asset or paid to transfer a liability in an orderly transaction between market participants at the measurement date (an exit price). Accordingly, the fair value hierarchy gives the highest priority to quoted prices (unadjusted) in active markets for identical assets or liabilities (Level 1) and the lowest priority to unobservable inputs (Level 3). The guidance establishes three levels of fair value hierarchy as follows:
| | • | | Level 1 — Unadjusted quoted prices in active markets for identical, unrestricted assets or liabilities that the Fund has the ability to access at the measurement date; |
| | • | | Level 2 — Quoted prices for similar asset or liability in active markets, quoted prices for identical or similar asset or liability in markets which are not active, or prices based on inputs that are observable (either directly or indirectly); and |
| | • | | Level 3 — Prices, inputs or exotic modeling techniques which are both significant to the fair value measurement and unobservable (supported by little or no market activity). |
Investments are classified within the level of the lowest significant input considered in determining fair value. Investments classified within Level 3 which fair value measurement considers several inputs may include Level 1 or Level 2 inputs as components of the overall fair value measurement.
The following table sets forth information about the levels within the fair value hierarchy at which the Fund’s investments are measured at September 30, 2017(000):
| | | | | | | | | | | | | | | | |
Investments in
Securities | | Level 1 | | | Level 2† | | | Level 3†† | | | Total | |
Common Stock | | | | | | | | | | | | | | | | |
Australia | | $ | 965 | | | $ | — | | | $ | — | | | $ | 965 | |
Brazil | | | 815 | | | | — | | | | — | | | | 815 | |
Canada | | | 8,542 | | | | — | | | | — | | | | 8,542 | |
China | | | 8,581 | | | | — | | | | — | * | | | 8,581 | |
Czech Republic | | | 52 | | | | — | | | | — | | | | 52 | |
France | | | 7,810 | | | | — | | | | — | | | | 7,810 | |
Germany | | | 7,626 | | | | — | | | | — | | | | 7,626 | |
Hungary | | | 91 | | | | — | | | | — | | | | 91 | |
India | | | 2,723 | | | | — | | | | — | | | | 2,723 | |
Indonesia | | | 232 | | | | — | | | | — | | | | 232 | |
Ireland | | | 206 | | | | — | | | | — | | | | 206 | |
Italy | | | 2,516 | | | | — | | | | — | | | | 2,516 | |
Japan | | | 14,747 | | | | — | | | | — | | | | 14,747 | |
Malaysia | | | 754 | | | | — | | | | — | | | | 754 | |
Mexico | | | 244 | | | | — | | | | — | | | | 244 | |
Netherlands | | | 3,181 | | | | — | | | | — | | | | 3,181 | |
Philippines | | | 40 | | | | — | | | | — | | | | 40 | |
Poland | | | 378 | | | | — | | | | — | | | | 378 | |
Qatar | | | — | | | | 103 | | | | — | | | | 103 | |
Russia | | | 1,606 | | | | — | | | | — | | | | 1,606 | |
South Africa | | | 832 | | | | — | | | | — | | | | 832 | |
South Korea | | | 5,114 | | | | — | | | | — | | | | 5,114 | |
Spain | | | 872 | | | | — | | | | — | | | | 872 | |
Sweden | | | 1,154 | | | | — | | | | — | | | | 1,154 | |
Switzerland | | | 13,927 | | | | — | | | | — | | | | 13,927 | |
Taiwan | | | 3,312 | | | | — | | | | — | | | | 3,312 | |
| | | | | | |
| | | Causeway International Opportunities Fund | | | 25 | |
NOTES TO FINANCIAL STATEMENTS
(continued)
| | | | | | | | | | | | | | | | |
Investments in
Securities | | Level 1 | | | Level 2† | | | Level 3†† | | | Total | |
Thailand | | $ | — | | | $ | 1,328 | | | $ | — | | | $ | 1,328 | |
Turkey | | | 721 | | | | — | | | | — | | | | 721 | |
United Arab Emirates | | | 47 | | | | 254 | | | | — | | | | 301 | |
United Kingdom | | | 35,504 | | | | — | | | | — | | | | 35,504 | |
| | | | |
Total Common Stock | | | 122,592 | | | | 1,685 | | | | — | | | | 124,277 | |
| | | | |
| | | | |
Preferred Stock | | | 5,099 | | | | — | | | | — | | | | 5,099 | |
| | | | |
| | | | |
Exchange Traded Fund | | | 2,353 | | | | — | | | | — | | | | 2,353 | |
| | | | |
| | | | |
Preference Stock | | | | | | | | | | | | | | | | |
Brazil | | | 1,009 | | | | — | | | | — | | | | 1,009 | |
South Korea | | | 118 | | | | — | | | | — | | | | 118 | |
| | | | |
Total Preference Stock | | | 1,127 | | | | — | | | | — | | | | 1,127 | |
| | | | |
| | | | |
Short-Term Investment | | | 3,900 | | | | — | | | | — | | | | 3,900 | |
| | | | |
Total Investments in Securities | | $ | 135,071 | | | $ | 1,685 | | | $ | — | | | $ | 136,756 | |
| | | | |
| † | Holdings represent securities trading outside the United States, the values of which were adjusted due to market closures and/or due to “foreign line” securities using “local line” prices. Securities with a value of $83,318 (000), which represented 60.4% of the net assets of the Fund, transferred from Level 2 to Level 1 at fiscal year end since the prior fiscal year end, primarily due to market movements following the close of local trading that triggered the fair valuation of certain securities at the beginning of the fiscal year but did not trigger fair valuation at the end of fiscal year. Securities with a value of $145 (000), which represented 0.1% of the net assets of the Fund, transferred from Level 1 to Level 2 at the fiscal year end since the prior fiscal year end, primarily due to market movements following the close of local trading that did not trigger the fair valuation of certain securities at the beginning of the fiscal year but triggered fair valuation at the end of the fiscal year. |
| †† | A reconciliation of Level 3 investments and disclosures of significant unobservable inputs are presented when the Fund has a significant amount of Level 3 investments at the beginning and/or end of the period in relation to net assets. Management has concluded that Level 3 investments are not material in relation to net assets. |
| * | Security is fair valued at zero due to company’s insolvency. Level 3 security in accordance with fair value hierarchy. |
Please refer to the Schedule of Investments for additional information regarding the composition of the amounts listed above.
Changes in valuation techniques may result in transfers in or out of an investment’s assigned level within the hierarchy during the reporting period. Changes in the classification between Levels 1 and 2 occur primarily when foreign equity securities are fair valued by the Fund’s third party vendor using other observable market-based inputs in place of closing exchange prices due to events occurring after foreign market closures and/or due to adjustments to security values due to “foreign line” securities using “local line” prices. Due to currency and ownership restrictions on foreign persons in certain countries, including without limitation Russia and Thailand, securities sometimes trade in a “foreign line” (designated for foreign ownership) and via a “local line” (shares traded locally and held by residents). Liquidity of shares held in the foreign line is often more limited than the local line. As the last traded price of a foreign line may not represent fair value, if the securities can readily be traded through a broker to access the local line, the securities may be priced using the last traded local line price.
For the fiscal year ended September 30, 2017, no securities transferred in or out of Level 3. Transfers between levels are recognized at period end.
For the fiscal year ended September 30, 2017, there were no changes to the Fund’s fair value methodologies.
Federal Income Taxes – It is the Fund’s intention to continue to qualify as a regulated investment company under Subchapter M of the Internal Revenue Code and to distribute substantially all of its taxable income. Accordingly, no provision for Federal income taxes has been made in the financial statements.
| | | | | | |
| 26 | | Causeway International Opportunities Fund | | | | |
NOTES TO FINANCIAL STATEMENTS
(continued)
The Fund evaluates tax positions taken or expected to be taken in the course of preparing the Fund’s tax returns to determine whether it is “more-likely-than not” (i.e., greater than 50-percent) that each tax position will be sustained upon examination by a taxing authority based on the technical merits of the position. Tax positions not deemed to meet the more likely-than-not threshold are recorded as a tax benefit or expense in the current year. The Fund did not record any tax provision in the current period. However, management’s conclusions regarding tax positions taken may be subject to review and adjustment at a later date based on factors including, but not limited to, examination by tax authorities (i.e., the last 3 tax year ends, as applicable), on-going analysis of and changes to tax laws, regulations and interpretations thereof.
As of and during the fiscal year ended September 30, 2017, the Fund did not have a liability for any unrecognized tax benefits. The Fund recognizes interest and penalties, if any, related to unrecognized tax benefits as income tax expense in the Statement of Operations. During the fiscal year, the Fund did not incur any significant interest or penalties.
Security Transactions and Related Income – Security transactions are accounted for on the date the security is purchased or sold (trade date). Dividend income is recognized on the ex-dividend date, and interest income is recognized using the accrual basis of accounting. Costs used in determining realized gains and losses on the sales of investment securities are those of the specific securities sold.
Foreign Currency Translation – The books and records of the Fund are maintained in U.S. dollars on the following basis:
(1) the market value or fair value of investment securities, assets and liabilities is converted at the current rate of exchange; and
(2) purchases and sales of investment securities, income and expenses are converted at the relevant rates of exchange prevailing on the respective dates of such transactions.
The Fund does not isolate that portion of gains and losses on investments in equity securities that is due to changes in the foreign exchange rates from that which is due to changes in market prices of equity securities.
Foreign Currency Exchange Contracts – When the Fund purchases or sells foreign securities, it enters into corresponding foreign currency exchange contracts to settle the securities transactions. Losses from these foreign exchange transactions may arise from changes in the value of the foreign currency or if the counterparties do not perform under the contract’s terms.
Expense/Classes – Expenses that are directly related to one Fund of the Trust are charged directly to that Fund. Other operating expenses of the Trust are prorated to the Fund and the other series of the Trust on the basis of relative daily net assets. Class specific expenses are borne by that class of shares. Income, realized and unrealized gains/losses and non-class specific expenses are allocated to the respective classes on the basis of relative daily net assets.
Dividends and Distributions – Dividends from net investment income, if any, are declared and paid on an annual basis. Any net realized capital gains on sales of securities are distributed to shareholders at least annually.
Redemption Fee – The Fund imposes a redemption fee of 2% on the value of capital shares redeemed by shareholders less than 60 days after purchase. The
| | | | | | |
| | | Causeway International Opportunities Fund | | | 27 | |
NOTES TO FINANCIAL STATEMENTS
(continued)
redemption fee also applies to exchanges from the Fund. The redemption fee is paid to the Fund. The redemption fee does not apply to shares purchased through reinvested distributions or shares redeemed through designated systematic withdrawal plans. The redemption fee does not normally apply to accounts designated as omnibus accounts with the transfer agent. These are arrangements through financial intermediaries where the purchase and sale orders of a number of persons are aggregated before being communicated to the Fund. However, the Fund may seek agreements with these intermediaries to impose the Fund’s redemption fee or a different redemption fee on their customers if feasible, or to impose other appropriate restrictions on excessive short-term trading. The officers of the Fund may waive the redemption fee for shareholders in asset allocation and similar investment programs believed not to be engaged in short-term market timing, including for holders of shares purchased by Causeway Capital Management LLC (the “Adviser”) for its clients to rebalance their portfolios. For the fiscal year ended September 30, 2017, the Institutional Class and Investor Class retained $6,055 and $1 in redemption fees, respectively.
Other – Brokerage commission recapture payments are credited to realized capital gains and are included in net realized gains from security transactions on the Statement of Operations. For the fiscal year ended September 30, 2017, the Fund received commission recapture payments of $2,083.
| 3. | | Investment Advisory, Administration, Shareholder Service and Distribution Agreements |
The Trust, on behalf of the Fund, has entered into an Investment Advisory Agreement (the “Advisory Agreement”) with the Adviser. Under the Advisory Agreement, the Adviser is entitled to a monthly fee
equal to an annual rate of 0.80% of the Fund’s average daily net assets. The Adviser has contractually agreed through January 31, 2018 to waive its fee and to the extent necessary, reimburse the Fund to the extent necessary to keep total annual fund operating expenses (excluding brokerage fees and commissions, interest, taxes, shareholder service fees, fees and expenses of other funds in which the Fund invests, and extraordinary expenses) from exceeding 1.05% of Institutional Class and Investor Class average daily net assets. For the fiscal year ended September 30, 2017, the Adviser waived fees of $177,897. The waived fees are not subject to recapture.
The Trust and SEI Investments Global Funds Services (the “Administrator”) have entered into an Administration Agreement. Under the terms of the Administration Agreement, the Administrator is entitled to an annual fee which is calculated daily and paid monthly based on the aggregate average daily net assets of the Trust subject to a minimum annual fee.
The Trust has adopted a Shareholder Service Plan and Agreement for Investor Class shares that allows the Trust to pay broker-dealers and other financial intermediaries a fee of up to 0.25% per annum of average daily net assets for services provided to Investor Class shareholders. For the fiscal year ended September 30, 2017, the Investor Class paid 0.25% of average daily net assets under this plan.
The Trust and SEI Investments Distribution Co. (the “Distributor”) have entered into a Distribution Agreement. The Distributor receives no fees from the Fund for its distribution services under this agreement.
The officers of the Trust are also officers or employees of the Administrator or Adviser. They receive no fees for serving as officers of the Trust.
| | | | | | |
| 28 | | Causeway International Opportunities Fund | | | | |
NOTES TO FINANCIAL STATEMENTS
(continued)
As of September 30, 2017, approximately $377 thousand of the net assets were held by investors affiliated with the Adviser.
| 4. | | Investment Transactions |
The cost of security purchases and the proceeds from the sale of securities, other than short-term investments, during the fiscal year ended September 30, 2017, for the Fund were as follows:
| | | | | | |
Purchases
(000) | | | Sales
(000) | |
| $ | 72,946 | | | $ | 62,551 | |
| 5. | | Risks of Foreign Investing |
Because the Fund invests most of its assets in foreign securities, the Fund is subject to further risks. For example, the value of the Fund’s securities may be affected by social, political and economic developments and U.S. and foreign laws relating to foreign investments. Further, because the Fund invests in securities denominated in foreign currencies, the Fund’s securities may go down in value depending on foreign exchange rates. Other risks include trading, settlement, custodial, and other operational risks; withholding or other taxes; and the less stringent investor protection and disclosure standards of some foreign markets. All of these factors can make foreign securities less liquid, more volatile and harder to value than U.S. securities. These risks are higher for emerging markets investments.
| 6. | | Federal Tax Information |
The Fund is classified as a separate taxable entity for Federal income tax purposes. The Fund intends to continue to qualify as a separate “regulated investment company” under Subchapter M of the Internal Revenue Code and make the requisite distributions to
shareholders that will be sufficient to relieve it from Federal income tax and Federal excise tax. Therefore, no Federal tax provision is required. To the extent that dividends from net investment income and distributions from net realized capital gains exceed amounts reported in the financial statements, such amounts are reported separately.
The Fund may be subject to taxes imposed by countries in which it invests in issuers existing or operating in such countries. Such taxes are generally based on income earned. The Fund accrues such taxes when the related income is earned. Dividend and interest income is recorded net of non-U.S. taxes paid. Gains realized by the Fund on the sale of securities in certain countries are subject to non-U.S. taxes. The Fund records a liability based on unrealized gains to provide for potential non-U.S. taxes payable upon the sale of these securities. For the fiscal year ended September 30, 2017, non-U.S. taxes paid on realized gains were $0 and non-U.S. taxes accrued on unrealized gains were $27,005.
The amounts of distributions from net investment income and net realized capital gains are determined in accordance with Federal income tax regulations, which may differ from those amounts determined under U.S. GAAP. These book/tax differences are either temporary or permanent in nature. The character of distributions made during the year from net investment income or net realized gains, and the timing of distributions made during the year may differ from the year that the income or realized gains (losses) were recorded by the Fund. To the extent these differences are permanent, adjustments are made to the appropriate equity accounts in the period that the differences arise.
Accordingly, the following permanent differences, which are primarily due to passive foreign investment
| | | | | | |
| | | Causeway International Opportunities Fund | | | 29 | |
NOTES TO FINANCIAL STATEMENTS
(continued)
companies and foreign currency transactions, were reclassified to/(from) the following accounts as of September 30, 2017 (000):
| | | | | | |
Undistributed
Net Investment Income | | | Accumulated
Net Realized
Gain | |
| $ | 55 | | | $ | (55 | ) |
The reclassifications had no impact on net assets or net asset value per share.
The tax character of dividends and distributions declared during the fiscal years ended September 30, 2017 and September 30, 2016 were as follows (000):
| | | | | | | | | | | | |
| | | Ordinary
Income | | | Long-Term
Capital Gain | | | Total | |
2017 | | $ | 3,011 | | | $ | — | | | $ | 3,011 | |
2016 | | | 1,847 | | | | 213 | | | | 2,060 | |
As of September 30, 2017, the components of distributable earnings on a tax basis were as follows (000):
| | | | |
Undistributed Ordinary Income | | $ | 1,906 | |
Capital Loss Carryforwards | | | (10,351 | ) |
Unrealized Appreciation | | | 15,316 | |
| | | | |
Total Distributable Earnings | | $ | 6,871 | |
| | | | |
Under the Regulated Investment Company Modernization Act of 2010, the Fund is permitted to carry forward capital losses incurred for an unlimited period. Capital losses that are carried forward will retain their character as either short-term or long-term capital losses. Losses carried forward are as follows:
| | | | | | | | |
Short-Term post-enactment Loss | | Long-Term post-enactment Loss | | | Total | |
| $2,625 | | $ | 7,726 | | | $ | 10,351 | |
At September 30, 2017, the total cost of investments for Federal income tax purposes and the aggregate gross unrealized appreciation and depreciation on investments for the Fund were as follows (000):
| | | | | | | | | | | | | | |
Federal
Tax Cost | | | Appreciated
Securities | | | Depreciated
Securities | | | Net
Unrealized
Appreciation | |
| $ | 121,421 | | | $ | 18,228 | | | $ | 2,885 | | | $ | 15,343 | |
| 7. | | Capital Shares Issued and Redeemed (000) |
| | | | | | | | | | | | | | | | |
| | | Fiscal Year Ended
September 30, 2017 | | | Fiscal Year Ended
September 30, 2016 | |
| | | Shares | | | Value | | | Shares | | | Value | |
Institutional Class | | | | | | | | | | | | | | | | |
Shares Sold | | | 3,412 | | | $ | 44,168 | | | | 3,927 | | | $ | 45,852 | |
Shares Issued in Reinvestment of
Dividends and Distributions | | | 253 | | | | 2,872 | | | | 171 | | | | 2,016 | |
Shares Redeemed | | | (3,105 | ) | | | (36,352 | ) | | | (5,385 | ) | | | (60,209 | ) |
| | | | | | | | | | | | | | | | |
Increase (Decrease) in Shares Outstanding
Derived from Institutional Class Transactions | | | 560 | | | | 10,688 | | | | (1,287 | ) | | | (12,341 | ) |
| | | | | | | | | | | | | | | | |
| | | | | | |
| 30 | | Causeway International Opportunities Fund | | | | |
NOTES TO FINANCIAL STATEMENTS
(continued)
| | | | | | | | | | | | | | | | |
| | | Fiscal Year Ended
September 30, 2017 | | | Fiscal Year Ended
September 30, 2016 | |
| | | Shares | | | Value | | | Shares | | | Value | |
Investor Class | | | | | | | | | | | | | | | | |
Shares Sold | | | 407 | | | $ | 5,015 | | | | 42 | | | $ | 469 | |
Shares Issued in Reinvestment of
Dividends and Distributions | �� | | 10 | | | | 115 | | | | 4 | | | | 43 | |
Shares Redeemed | | | (87 | ) | | | (1,082 | ) | | | (83 | ) | | | (947 | ) |
| | | | | | | | | | | | | | | | |
Increase (Decrease) in Shares Outstanding
Derived from Investor Class Transactions | | | 330 | | | | 4,048 | | | | (37 | ) | | | (435 | ) |
| | | | | | | | | | | | | | | | |
Net Increase (Decrease) in Shares Outstanding from Capital Share Transactions | | | 890 | | | $ | 14,736 | | | | (1,324 | ) | | $ | (12,776 | ) |
| | | | | | | | | | | | | | | | |
| 8. | | Significant Shareholder Concentration |
As of September 30, 2017, six of the Fund’s shareholders of record owned 91% of net assets in the Institutional Class. The Fund may be adversely affected when a shareholder purchases or redeems large amounts of shares, which may impact the Fund in the same manner as a high volume of redemption requests. Such large shareholders may include, but are not limited to, other funds, institutional investors, and asset allocators who make investment decisions on behalf of underlying clients. Significant shareholder purchases and redemptions may adversely impact the Fund’s portfolio management and may cause the Fund to make investment decisions at inopportune times or prices or miss attractive investment opportunities. Such transactions may also increase the Fund’s transaction costs, accelerate the realization of taxable income if sales of securities result in gains, or otherwise cause the Fund to perform differently than intended.
Under the Trust’s organizational documents, each Trustee, officer, employee or other agent of the Trust is indemnified against certain liabilities that may arise out of the performance of his or her duties to the Fund.
Additionally, in the normal course of business, the Fund enters into contracts, including the Fund’s servicing agreements, that contain a variety of indemnification clauses. The Fund’s maximum exposure under these arrangements is unknown as this would involve future claims that may be made against the Fund that have not yet occurred. The risk of material loss as a result of such indemnification claims is considered remote.
The Fund, along with certain other series of the Trust, entered into an agreement on February 24, 2015, as amended by Amendment No. 1, dated as of February 24, 2016, and Amendment No. 2, dated as of February 22, 2017, which enables it to participate in a $10 million secured committed revolving line of credit with The Bank of New York Mellon which expires February 21, 2018. The proceeds from the borrowings, if any, shall be used to finance the Fund’s short-term general working capital requirements, including the funding of shareholder redemptions. Interest, if any, is charged to the Fund based on its borrowings during the period at the applicable rate plus 1.5%. The Fund is also charged a portion of a commitment fee of 0.175% per annum. For the year ended September 30, 2017, the Fund had average borrowings of $10 million over a
| | | | | | |
| | | Causeway International Opportunities Fund | | | 31 | |
NOTES TO FINANCIAL STATEMENTS
(concluded)
period of four days at a weighted average interest rate of 2.04%. Interest accrued on the borrowing during the year was $2,827. As of September 30, 2017, there were no borrowings outstanding made under the line of credit.
The Fund has evaluated the need for disclosures and/or adjustments resulting from subsequent events through the date the financial statements were available to be issued. Based on this evaluation, no disclosures or adjustments were required to the financial statements.
| | | | | | |
| 32 | | Causeway International Opportunities Fund | | | | |
REPORT OF INDEPENDENT REGISTERED PUBLIC ACCOUNTING FIRM
To the Board of Trustees of Causeway Capital Management Trust and Shareholders of the
Causeway International Opportunities Fund
In our opinion, the accompanying statement of assets and liabilities, including the schedule of investments, and the related statements of operations and of changes in net assets and the financial highlights present fairly, in all material respects, the financial position of the Causeway International Opportunities Fund (constituting a portfolio of Causeway Capital Management Trust, hereafter referred to as the “Fund”) as of September 30, 2017, the results of its operations for the year then ended, the changes in its net assets for each of the two years in the period then ended and the financial highlights for each of the five years in the period then ended, in conformity with accounting principles generally accepted in the United States of America. These financial statements and financial highlights (hereafter referred to as “financial statements”) are the responsibility of the Fund’s management. Our responsibility is to express an opinion on these financial statements based on our audits. We conducted our audits of these financial statements in accordance with the standards of the Public Company Accounting Oversight Board (United States). Those standards require that we plan and perform the audit to obtain reasonable assurance about whether the financial statements are free of material misstatement. An audit includes examining, on a test basis, evidence supporting the amounts and disclosures in the financial statements, assessing the accounting principles used and significant estimates made by management, and evaluating the overall financial statement presentation. We believe that our audits, which included confirmation of securities as of September 30, 2017 by correspondence with the custodian and brokers, provide a reasonable basis for our opinion.
PricewaterhouseCoopers LLP
Los Angeles, California
November 28, 2017
| | | | | | |
| | | Causeway International Opportunities Fund | | | 33 | |
NOTICE TO SHAREHOLDERS (Unaudited)
The information set forth below is for the Fund’s fiscal year as required by federal laws. Shareholders, however, must report distributions on a calendar year basis for income tax purposes, which may include distributions for portions of two fiscal years of the Fund. Accordingly, the information needed by shareholders for income tax purposes will be sent to them in early 2018. Please consult your tax adviser for proper treatment of this information.
For the fiscal year ended September 30, 2017, the Fund is designating the following items with regard to distributions paid during the year:
| | | | | | | | | | | | | | | | | | |
| (A) | | | (B) | | | (C) | | | (D) | | | (E) | |
| | | | |
Long Term Capital Gains Distributions (Tax Basis) | | | Ordinary
Income
Distributions
(Tax Basis) | | | Tax Exempt
Distributions
(Tax Basis) | | | Total
Distributions
(Tax Basis) | | | Dividends(1)
for Corporate
Dividends Received
Deduction
(Tax Basis) | |
| | 0.00% | | | | 100.00% | | | | 0.00% | | | | 100.00% | | | | 1.77% | |
| | | | |
| (F) | | | (G) | | | (H) | | | | | | | |
| | | | |
Qualified Dividend Income | | | Interest
Related
Dividends | | | Qualified
Short-Term
Capital
Gain
Dividends | | | | | | | |
| | 100.00% | | | | 0.00% | | | | 0.00% | | | | | | | | | |
Foreign taxes accrued during the fiscal year ended September 30, 2017, amounted to $217,666 and are expected to be passed through to shareholders as foreign tax credits on Form 1099 – Dividend for the year ended September 30, 2017. In addition, for the fiscal year ended September 30, 2017, gross income derived from sources within foreign countries amounted to $3,218,067 for the Fund.
| (1) | Qualified Dividends represent dividends which qualify for the corporate dividends received deduction. |
Items (A), (B), (C) and (D) are based on a percentage of the Fund’s total distribution including pass-through as foreign tax credit.
Item (E) is based on a percentage of ordinary income distributions of the Fund.
Item (F) represents the amount of “Qualified Dividend Income” as defined in the Jobs and Growth Tax Relief Reconciliation Act of 2003 and is reflected as a percentage of “Ordinary Income Distributions.” It is the Fund’s intention to designate the maximum amount permitted by the law up to 100%.
Item (G) is the amount of “Interest Related Dividends” as created by the American Jobs Creation Act of 2004 and is reflected as a percentage of net investment income distributions that is exempt from U.S. withholding tax when paid to foreign investors.
Item (H) is the amount of “Qualified Short-Term Capital Gain Dividends” as created by the American Jobs Creation Act of 2004 and is reflected as a percentage of short-term capital gain distributions that is exempt from U.S. withholding tax when paid to foreign investors.
| | | | | | |
| 34 | | Causeway International Opportunities Fund | | | | |
TRUSTEES AND OFFICERS INFORMATION (Unaudited)
Information pertaining to the Trustees and Officers of the Trust is set forth below. Trustees who are not deemed to be “interested persons” of the Trust as defined in the 1940 Act are referred to as “Independent Trustees.” The Trust’s Statement of Additional Information (“SAI”) includes additional information about the Trustees and Officers. The SAI may be obtained without charge by calling 1-866-947-7000.
| | | | | | | | | | |
Name
Address,
Age1 | | Position(s)
Held with the
Company | | Term of
Office
and
Length of
Time
Served2 | | Principal
Occupation(s)
During Past
Five Years | | Number of
Portfolios
in Trust
Complex
Overseen by
Trustee3 | | Other
Directorships
Held by
Trustee4 |
INDEPENDENT TRUSTEES | | | | | | | | | | |
John R. Graham
Age: 56 | | Trustee; Chairman of the Audit Committee | | Trustee since 10/08; Audit Chairman since 4/13 | | Film Composer (since 2005); Senior Vice President, Corporate Financial Development and Communications, The Walt Disney Company (2004-2005); Senior Vice President, Mergers and Acquisitions, Lehman Brothers Inc. (2000-2004). | | 6 | | None |
| | | | | |
Lawry J. Meister
Age: 55 | | Trustee | | Since 10/08 | | President, Steaven Jones Development Company, Inc. (real estate firm) (since 1995); President, Creative Office Properties (real estate firm) (since 2012). | | 6 | | None |
| | | | | |
Victoria B. Rogers
Age: 56 | | Trustee | | Since 4/13 | | President, the Rose Hills Foundation (since 1996). | | 6 | | Independent Director, TCW Funds, Inc. and TCW Strategic Income Fund, Inc. |
| | | | | |
Eric H. Sussman
Age: 51 | | Trustee; Chairman of the Board | | Trustee since 9/01; Board Chairman since 4/13 | | Senior Lecturer (since July 2011) and Lecturer (1995-June 2011), Anderson Graduate School of Management, University of California, Los Angeles; President, Amber Capital, Inc. (real estate investment and financial planning firm) (since 1993). | | 6 | | None |
| | | | | | |
| | | Causeway International Opportunities Fund | | | 35 | |
TRUSTEES AND OFFICERS INFORMATION (Unaudited)
(continued)
| | | | | | | | | | |
Name
Address,
Age1 | | Position(s)
Held with the
Company | | Term of
Office
and
Length of
Time
Served2 | | Principal
Occupation(s)
During Past
Five Years | | Number of
Portfolios
in Trust
Complex
Overseen by
Trustee3 | | Other
Directorships
Held by
Trustee4 |
OFFICERS | | | | | | | | | | |
Turner Swan
11111 Santa Monica
Blvd.,
15th Floor
Los Angeles, CA 90025
Age: 55 | | President | | Since 8/01 | | General Counsel, Secretary, and Member of the Adviser or the Adviser’s Parent Holding Company (since 2001); Compliance Officer of the Adviser (since 2010). | | N/A | | N/A |
| | | | | |
Kurt J. Decko
11111 Santa Monica
Blvd.,
15th Floor
Los Angeles, CA 90025
Age: 42 | | Chief Compliance Officer and Assistant Secretary | | Since 1/15 | | Chief Compliance Officer/Senior Legal Counsel of the Adviser (since January 2015); Partner, K&L Gates LLP (2010-2014). | | N/A | | N/A |
| | | | | |
Eric Kleinschmidt5
One Freedom Valley
Drive
Oaks, PA 19456
Age: 49 | | Treasurer | | Since 8/14 | | Director of Fund Accounting, SEI Investments Company (since 2004). | | N/A | | N/A |
| | | | | |
Gretchen W. Corbell
11111 Santa Monica
Blvd.,
15th Floor
Los Angeles, CA 90025
Age: 46 | | Secretary | | Since 10/11 | | Attorney of the Adviser (since 2004). | | N/A | | N/A |
| | | | | |
Gracie V. Fermelia
11111 Santa Monica
Blvd.,
15th Floor
Los Angeles, CA 90025
Age: 56 | | Vice President and Assistant Secretary | | Vice President (since 1/15); Assistant Secretary (since 8/01) | | Chief Operating Officer and Member of the Adviser or the Adviser’s Parent Holding Company (since 2001); Chief Compliance Officer of the Adviser and the Trust (2005-2015). | | N/A | | N/A |
| | | | | |
Lisa Whittaker5
One Freedom
Valley Drive
Oaks, PA 19456
Age: 39 | | Vice President and Assistant Secretary | | Since 8/13 | | Corporate Counsel of the Administrator (since 2012); Associate Counsel and Compliance Officer, The Glendmede Trust Company, N.A. (2011-2012). | | N/A | | N/A |
| 1 | Each Trustee may be contacted by writing to the Trustee c/o Causeway Capital Management Trust, One Freedom Valley Drive, Oaks, PA 19456. |
| | | | | | |
| 36 | | Causeway International Opportunities Fund | | | | |
TRUSTEES AND OFFICERS INFORMATION (Unaudited)
(concluded)
| 2 | Each Trustee holds office during the lifetime of the Trust or until his or her sooner resignation, retirement, removal, death or incapacity in accordance with the Trust’s Declaration of Trust. The president, treasurer and secretary each holds office at the pleasure of the Board of Trustees or until he or she sooner resigns in accordance with the Trust’s Bylaws. |
| 3 | The “Trust Complex” consists of all registered investment companies for which Causeway Capital Management LLC serves as investment adviser. As of September 30, 2017, the Trust Complex consisted of one investment company with six portfolios — the International Value Fund, the Emerging Markets Fund, the Global Value Fund, the International Opportunities Fund, the Global Absolute Return Fund, and the International Small Cap Fund. |
| 4 | Directorships of companies required to report to the Securities and Exchange Commission under the Securities Exchange Act of 1934 (i.e., “public companies”) or other investment companies registered under the 1940 Act. |
| 5 | These officers of the Trust also serve as officers of one or more mutual funds for which SEI Investments Company or an affiliate acts as investment manager, administrator or distributor. |
| | | | | | |
| | | Causeway International Opportunities Fund | | | 37 | |
DISCLOSURE OF FUND EXPENSES (Unaudited)
As a shareholder of the Fund, you incur two types of costs: (1) transaction costs, including redemption fees, and (2) ongoing costs, including management fees, shareholder service fees, and other Fund expenses. It is important for you to understand the impact of these costs on your investment returns.
Ongoing operating expenses are deducted from a mutual fund’s gross income and directly reduce its final investment return. These expenses are expressed as a percentage of a mutual fund’s average net assets; this percentage is known as a mutual fund’s expense ratio.
The following examples use the expense ratio and are intended to help you understand the ongoing costs (in dollars) of investing in the Fund and to compare these costs with those of other mutual funds. The examples are based on an investment of $1,000 made at the beginning of the period shown and held for the entire period (April 1, 2017 to September 30, 2017).
The table on the next page illustrates the Fund’s costs in two ways:
Actual Fund Return. This section helps you to estimate the actual expenses after fee waivers that the Fund incurred over the period. The “Expenses Paid During Period” column shows the actual dollar expense cost incurred by a $1,000 investment in the Fund, and the “Ending Account Value” number is derived from deducting that expense cost from the Fund’s gross investment return.
You can use this information, together with the actual amount you invested in the Fund, to estimate the expenses you paid over that period. Simply divide your actual account value by $1,000 to arrive at a ratio (for example, an $8,600 account value divided by $1,000 = 8.6), then multiply that ratio by the number shown under “Expenses Paid During Period.”
Hypothetical 5% Return. This section helps you compare the Fund’s costs with those of other mutual funds. It assumes that the Fund had an annual 5% return before expenses during the year, but that the expense ratio (Column 3) for the period is unchanged. This example is useful in making comparisons because the Securities and Exchange Commission requires all mutual funds to make this 5% calculation. You can assess the Fund’s comparative cost by comparing the hypothetical result for the Fund in the “Expenses Paid During Period” column with those that appear in the same charts in the shareholder reports for other mutual funds.
NOTE: Because the return is set at 5% for comparison purposes — NOT the Fund’s actual return — the account values shown may not apply to your specific investment.
| | | | | | |
| 38 | | Causeway International Opportunities Fund | | | | |
DISCLOSURE OF FUND EXPENSES (Unaudited)
(concluded)
| | | | | | | | | | | | | | | | |
| | | Beginning
Account
Value
4/01/17 | | | Ending
Account
Value
9/30/17 | | | Annualized
Expense
Ratios | | | Expenses
Paid
During
Period* | |
Causeway International Opportunities Fund | | | | | | | | | | | | | | | | |
| | | | |
Actual Portfolio Return | | | | | | | | | | | | | | | | |
Institutional Class | | $ | 1,000.00 | | | $ | 1,127.10 | | | | 1.05 | % | | $ | 5.60 | |
| | | | |
Hypothetical 5% Return | | | | | | | | | | | | | | | | |
| Institutional Class | | $ | 1,000.00 | | | $ | 1,019.80 | | | | 1.05 | % | | $ | 5.32 | |
Causeway International Opportunities Fund | | | | | | | | | | | | | | | | |
| | | | |
Actual Portfolio Return | | | | | | | | | | | | | | | | |
Investor Class | | $ | 1,000.00 | | | $ | 1,124.60 | | | | 1.30 | % | | $ | 6.93 | |
| | | | |
Hypothetical 5% Return | | | | | | | | | | | | | | | | |
| Investor Class | | $ | 1,000.00 | | | $ | 1,018.54 | | | | 1.30 | % | | $ | 6.59 | |
| * | Expenses are equal to the Fund’s annualized expense ratio multiplied by the average account value over the period, multiplied by 183/365 (to reflect the one-half year period.) |
| | | | | | |
| | | Causeway International Opportunities Fund | | | 39 | |
STATEMENT REGARDING BASIS FOR RENEWAL OF INVESTMENT ADVISORY AGREEMENT (Unaudited)
At a meeting on August 7, 2017, the Trustees considered and approved the renewal of the investment advisory agreement (the “Advisory Agreement”) between Causeway Capital Management Trust (the “Trust”) and Causeway Capital Management LLC (the “Adviser”) with respect to Causeway International Opportunities Fund (the “Fund”) for a twelve-month period beginning September 20, 2017. Section 15(c) of the Investment Company Act of 1940, as amended (the “1940 Act”) requires the Board of Trustees (the “Board”) of the Trust annually to approve continuance of the Advisory Agreement. Continuance of the Advisory Agreement must be approved by a majority of the Trustees and a majority of the independent Trustees (i.e., Trustees who are not “interested persons” of the Trust as defined in the 1940 Act). The Board was comprised of four independent Trustees when the continuation of the Advisory Agreement was considered.
Information Received. At each regular quarterly meeting, the Board reviews a wide variety of materials relating to the nature, extent and quality of the Adviser’s services, including information concerning the Fund’s performance. In addition, at a special meeting on June 5, 2017, the Trustees received and reviewed extensive quantitative and qualitative materials prepared by the Adviser relating to the Advisory Agreement in response to information requested on the independent Trustees’ behalf by their independent legal counsel. At the June special meeting, the Trustees also received and reviewed information prepared by Morningstar, Inc. providing comparative expense and performance information about the Fund to assist with the annual review of the Advisory Agreement. Following that meeting, the Trustees received and reviewed additional materials prepared by the Adviser relating to their consideration of the renewal of the Advisory Agreement at the August 7, 2017 meeting.
Factors Considered. In reviewing the Advisory Agreement, the Trustees considered a number of factors including, but not limited to: (1) the nature, extent and quality of the services provided by the Adviser, (2) the investment performance of the Fund, (3) comparisons of the services rendered and the amounts paid under the Advisory Agreement with those of other funds and those of the Adviser under other investment advisory agreements with other types of clients, (4) the costs of the services provided and estimated profits realized by the Adviser and its affiliates from their relationship with the Fund, (5) the extent to which economies of scale would be realized as the Fund grows and whether fee levels reflect these economies of scale for the benefit of Fund investors, and (6) any other benefits derived by the Adviser from its relationship with the Fund.
First, regarding the nature, extent and quality of the services provided by the Adviser, the Trustees considered, among other things, the Adviser’s personnel, experience, track record, and compliance program. The Trustees considered the qualifications, backgrounds and responsibilities of the Adviser’s principal personnel who provide services to the Fund, as well as the level of attention those individuals provide to the Fund. The Trustees noted the Adviser’s commitment to devoting resources to staffing and technology in support of its investment management services. They also reviewed the Adviser’s investment philosophy and processes and its compliance program, and considered the scope of the Adviser’s services to the Fund. The Trustees concluded that the nature, extent and quality of the services provided by the Adviser continued to benefit the Fund and its shareholders and would do so during the next one-year contract renewal period.
| | | | | | |
| 40 | | Causeway International Opportunities Fund | | | | |
STATEMENT REGARDING BASIS FOR RENEWAL OF INVESTMENT ADVISORY AGREEMENT (Unaudited)
(continued)
Second, regarding the investment performance of the Fund, the Trustees reviewed the investment results of the Fund for various periods ended March 31, 2017, compared to the results of the MSCI All Country World Index ex U.S. (Gross), the median of the mutual funds included in the Morningstar Foreign Large Blend category, and the median of the funds in a peer group selected by Morningstar. They noted that, consistent with Morningstar’s practice, the Morningstar 15(c) Report focused on one class of shares — the Institutional Class — and that Investor Class shares are subject to a 25 basis point shareholder service fee, which increases expenses and reduces performance from that shown. They noted that the Institutional Class had outperformed its Morningstar peer group median for the prior one-year period, and had underperformed its peer group for the prior three-year and five-year periods. The Trustees concluded that the Adviser’s record in managing the Fund indicated that its continued management would benefit the Fund and its shareholders.
Third, regarding the Fund’s advisory fee and total expenses as a percentage of the Fund’s average daily net assets:
| | • | | The Trustees compared the Fund’s advisory fee and expenses with those of other similar mutual funds. They noted that the Fund’s advisory fee was 80 basis points per annum compared to a median of 80 basis points for its Morningstar peer group and a range of 58 – 110 basis points for the funds in its peer group. They noted that the Fund’s Institutional Class annual expense ratio, after application of the Adviser’s expense limit agreement, was 8 basis points above the median of the funds in its Morningstar peer group. |
| | • | | The Trustees compared the Fund’s advisory fee with the fees charged by the Adviser to other clients. The Trustees noted that, although the fees paid by the Adviser’s other accounts were lower than the fee paid by the Fund, the differences appropriately reflected the Adviser’s significantly greater responsibilities with respect to the Fund, which include the provision of many additional administrative and shareholder services (such as services related to the Fund’s disclosure documents, financial statements, 1940 Act compliance policies and procedures, preparation of Board and committee materials and meetings, annual Board reports and certifications, oversight of daily valuation, oversight of Fund service providers, negotiation of Fund intermediary agreements, coordination with Fund intermediaries providing shareholder recordkeeping services, shareholder communications, and due diligence for advisers, consultants and institutional investors). |
The Trustees concluded that the Fund’s advisory fee and expense ratio were reasonable and appropriate under the circumstances.
Fourth, the Trustees considered the Adviser’s costs of providing services to the Fund and estimated profits realized by the Adviser from its relationship with the Fund. They reviewed the Adviser’s estimated after-tax profit margin with respect to such services for the twelve months ended March 31, 2017 and the methodology used to generate that estimate, and noted that the cost allocation methodology presented to the Trustees was reasonable. They also observed that the Adviser’s estimated profitability was within the range cited as reasonable in various court decisions, and had declined from the prior year. After consideration of these matters, the Trustees concluded that the Adviser’s operating margin with respect to its relationship with the Fund was reasonable.
| | | | | | |
| | | Causeway International Opportunities Fund | | | 41 | |
STATEMENT REGARDING BASIS FOR RENEWAL OF INVESTMENT ADVISORY AGREEMENT (Unaudited)
(concluded)
Fifth, regarding economies of scale, the Trustees observed that, although the Fund’s advisory fee schedule does not contain fee breakpoints, it is difficult to determine the existence or extent of any economies of scale. They noted that the Adviser is sharing economies of scale through reasonable advisory fee levels, expense limit agreements, and devoting additional resources to staff and technology to focus on continued performance and service to the Fund’s shareholders. They also noted that, in the Fund’s prior years, the Adviser incurred losses in managing the Fund, and that the estimated profitability of the Fund had declined from the prior year. The Trustees concluded that under the circumstances the Adviser is sharing any economies of scale with the Fund appropriately.
Sixth, regarding any other benefits derived by the Adviser from its relationship with the Fund — often called “fall-out” benefits — the Trustees observed that the Adviser does not earn “fall-out” benefits such as affiliated custody fees, affiliated transfer agency fees, affiliated brokerage commissions, profits from rule 12b-1 fees, “contingent deferred sales commissions,” or “float” benefits on short-term cash. The Trustees concluded that the primary “fall-out” benefit received by the Adviser is research services provided by brokers used by the Fund and that this benefit is reasonable in relation to the value of the services that the Adviser provides to the Fund.
Approval. At the June 5, 2017 and August 7, 2017 meetings, the Trustees discussed the information and factors noted above with representatives of the Adviser and, at the August 7, 2017 meeting, the Trustees considered the approval of the Advisory Agreement. The independent Trustees also met in a private session at all meetings with independent counsel at which no representatives of the Adviser were present. In their deliberations, the independent Trustees did not identify any particular information or factor that was determinative or controlling, each Trustee did not necessarily attribute the same weight to each factor, and the foregoing summary does not detail all the matters considered. Based on their review, the Trustees (including the independent Trustees) unanimously concluded that the Advisory Agreement is fair and reasonable to the Fund and its shareholders, the Fund’s advisory fee is reasonable and renewal of the Advisory Agreement is in the best interests of the Fund and its shareholders, and the Board of Trustees unanimously approved renewal of the Advisory Agreement for a twelve-month period beginning September 20, 2017.
| | | | | | |
| 42 | | Causeway International Opportunities Fund | | | | |
INVESTMENT ADVISER:
Causeway Capital Management LLC
11111 Santa Monica Boulevard
15th Floor
Los Angeles, CA 90025
DISTRIBUTOR:
SEI Investments Distribution Co.
One Freedom Valley Drive
Oaks, PA 19456
TO OBTAIN MORE INFORMATION:
Call 1-866-947-7000 or visit us online at www.causewayfunds.com
This material must be preceded or accompanied by a current prospectus.
The Fund files its complete schedule of portfolio holdings with the Securities and Exchange Commission (“Commission”) for the first and third quarters of each fiscal year on Form N-Q within sixty days after the end of the period. The Fund’s Forms N-Q are available on the Commission’s website at http://www.sec.gov, and may be reviewed and copied at the Commission’s Public Reference Room in Washington, DC. Information on the operation of the Public Reference Room may be obtained by calling 1-800-SEC-0330.
A description of the policies and procedures that the Fund uses to determine how to vote proxies relating to portfolio securities, as well as information relating to how the Trust voted proxies relating to portfolio securities during the most recent 12-month period ended June 30, is available (i) without charge, upon request, by calling 1-866-947-7000; and (ii) on the Commission’s website at http://www. sec.gov.
CCM-AR-004-0800
The registrant has adopted a code of ethics that applies to the registrant’s principal executive officer, principal financial officer and principal accounting officer. During the fiscal year ended September 30, 2017, there were no material changes or waivers to the code of ethics.
| Item 3. | Audit Committee Financial Expert. |
(a)(1) The registrant’s board of trustees has determined that the registrant has at least one audit committee financial expert serving on the audit committee.
(a)(2) The audit committee financial experts are Eric Sussman, Lawry Meister, John Graham and Victoria B. Rogers. Each audit committee financial expert is independent as defined in Form N-CSR Item 3(a)(2).
| Item 4. | Principal Accountant Fees and Services. |
Aggregate fees billed to the registrant for professional services rendered by the registrant’s principal accountant for the fiscal years ended September 30, 2017 and 2016 were as follows:
| | | | |
| | | 2017 | | 2016 |
| (a) Audit Fees | | $235,010 | | $225,970 |
| (b) Audit-Related Fees | | None | | None |
| (c) Tax Fees(1) | | $53,280 | | $58,577 |
| (d) All Other Fees | | None | | None |
Note:
| | (1) | Tax fees include amounts related to tax return and excise tax calculation reviews and foreign tax reclaim services. |
(e)(1) The registrant’s audit committee has adopted a charter that requires it to pre-approve the engagement of auditors to (i) audit the registrant’s financial statements, (ii) provide other audit or non-audit services to the registrant, or (iii) provide non-audit services to the registrant’s investment adviser if the engagement relates directly to the operations and financial reporting of the registrant.
(e)(2) No services included in paragraphs (b) through (d) of this Item were approved by the audit committee pursuant to paragraph (c)(7)(i)(C) of Rule 2-01 of Regulation S-X.
(f) Not applicable.
(g) For the fiscal year ended September 30, 2017, the aggregate non-audit fees billed by the registrant’s accountant for services rendered to the registrant and the registrant’s investment adviser were $609,843. For the fiscal year ended September 30, 2015, the aggregate non-audit fees billed by the registrant’s accountant for services rendered to the registrant and the registrant’s investment adviser were $486,606.
(h) The audit committee considered whether the provision of non-audit services rendered to the registrant’s investment adviser by the registrant’s principal accountant that were not pre-approved pursuant to paragraph (c)(7)(ii) of Rule 2-01 of Regulation S-X was compatible with maintaining the principal accountant’s independence.
| Item 5. | Audit Committee of Listed Registrants. |
Not applicable to open-end management investment companies.
| Item 6. | Schedule of Investments |
See Item 1.
| Item 7. | Disclosure of Proxy Voting Policies and Procedures for Closed-End Management Investment Companies. |
Not applicable to open-end management investment companies.
| Item 8. | Portfolio Managers of Closed-End Management Investment Companies |
Not applicable to open-end management investment companies.
| Item 9. | Purchases of Equity Securities by Closed-End Management Investment Company and Affiliated Purchasers. |
Not applicable to open-end management investment companies.
| Item 10. | Submission of Matters to a Vote of Security Holders. |
There have been no material changes to the registrant’s procedures by which shareholders may recommend nominees to the registrant’s board of trustees since the registrant’s last filing on Form N-CSR.
| Item 11. | Controls and Procedures. |
(a) The certifying officers, whose certifications are included herewith, have evaluated the registrant’s disclosure controls and procedures within 90 days of the filing date of this report. In their opinion, based on their evaluation, the registrant’s disclosure controls and procedures are adequately designed, and are operating effectively to ensure, that information required to be disclosed by the registrant in the reports it files or submits under the Securities Exchange Act of 1934 is recorded, processed, summarized and reported within the time periods specified in the Securities and Exchange Commission’s rules and forms.
(b) There were no changes in the registrant’s internal control over financial reporting that occurred during the registrant’s second fiscal quarter of the period covered by this report that have materially affected, or are reasonably likely to materially affect, the registrant’s internal control over financial reporting.
(a)(1) Code of Ethics attached hereto.
(a)(2) Separate certifications for the principal executive officer and the principal financial officer of the registrant as required by Rule 30a-2(a) under the Investment Company Act of 1940 (17 CFR 270.30a-2(a)) are filed herewith.
(b) Officer certifications as required by Rule 30a-2(b) under the Investment Company Act of 1940 (17 CFR 270.30a-2(b)) also accompany this filing as an exhibit.
SIGNATURES
Pursuant to the requirements of the Securities Exchange Act of 1934 and the Investment Company Act of 1940, the registrant has duly caused this report to be signed on its behalf by the undersigned, thereunto duly authorized.
| | | | | | |
| (Registrant) | | | | | | Causeway Capital Management Trust |
| | | |
| By (Signature and Title)* | | | | | | /s/ Turner Swan |
| | | | | | Turner Swan, President |
Date: December 8, 2017
Pursuant to the requirements of the Securities Exchange Act of 1934 and the Investment Company Act of 1940, this report has been signed below by the following persons on behalf of the registrant and in the capacities and on the dates indicated.
| | | | | | |
| By (Signature and Title)* | | | | | | /s/ Turner Swan |
| | | | | | Turner Swan, President |
Date: December 8, 2017
| | | | | | |
| By (Signature and Title)* | | | | | | /s/ Eric Kleinschmidt |
| | | | | | Eric Kleinschmidt, Treasurer |
Date: December 8, 2017
| * | Print the name and title of each signing officer under his or her signature. |