Exhibit 99.1

WESTFIELD FINANCIAL INC. NASDAQ: WFD STERNE AGEE 2012 FINANCIAL INSTITUTIONS INVESTOR CONFERENCE FEBRUARY 12 - 14, 2012 1
FORWARD – LOOKING STATEMENTS Today’s presentation may contain “forward-looking statements” which may be identified by the use of such words as “believe,” “expect,” “anticipate,” “should,” “planned,” “estimated,” and “potential.” Examples of forward-looking statements include, but are not limited to, estimates with respect to our financial condition and results of operation and business that are subject to various factors which could cause actual results to differ materially from these estimates. These factors include, but are not limited to: general and local economic conditions; changes in interest rates, deposit flows, demand for mortgages and other loans, real estate values, and competition; changes in accounting principles, policies, or guidelines; changes in legislation or regulation; and other economic, competitive, governmental, regulatory, and technological factors affecting our operations, pricing, products, and services. Any or all of our forward-looking statements in today’s presentation or in any other public statements we make may turn out to be wrong. They can be affected by inaccurate assumptions we might make or known or unknown risks and uncertainties. Consequently, no forward-looking statements can be guaranteed. We disclaim any obligation to subsequently revise any forward-looking statements to reflect events or circumstances after the date of such statements, or to reflect the occurrence of anticipated or unanticipated events 2
OVERVIEW $1.3 billion asset BHC headquartered in Westfield, MA – 11 branch offices located throughout Hampden County #5 ranked deposit market share in Hampden County – ranked third of banks headquartered locally Growth in gross loans of 8.8% in 2011 over 2010, and EPS doubled from $0.11 per share in 2010 to $0.22 per share in 2011 Continued strong credit quality - NPLs/Loans of 0.53% Regulatory capital ratios extremely strong – Actively pursuing share repurchase and dividend strategies – Ratio of equity to assets down to 17.30% at December 31, 2011 from 29.03% five years earlier (12/31/06). 3

STRATEGY Focus on Commercial & Industrial (“C&I”) and Commercial Real Estate portfolios by targeting businesses in western Massachusetts and northern Connecticut. C&I relationships include transactional deposit account relationships. Growth in residential real estate portfolio to diversify risk and deepen customer relationships. – Maintain arrangement with a third-party mortgage company which underwrites and services residential loans, thereby reducing overhead cost for Westfield Bank. 4
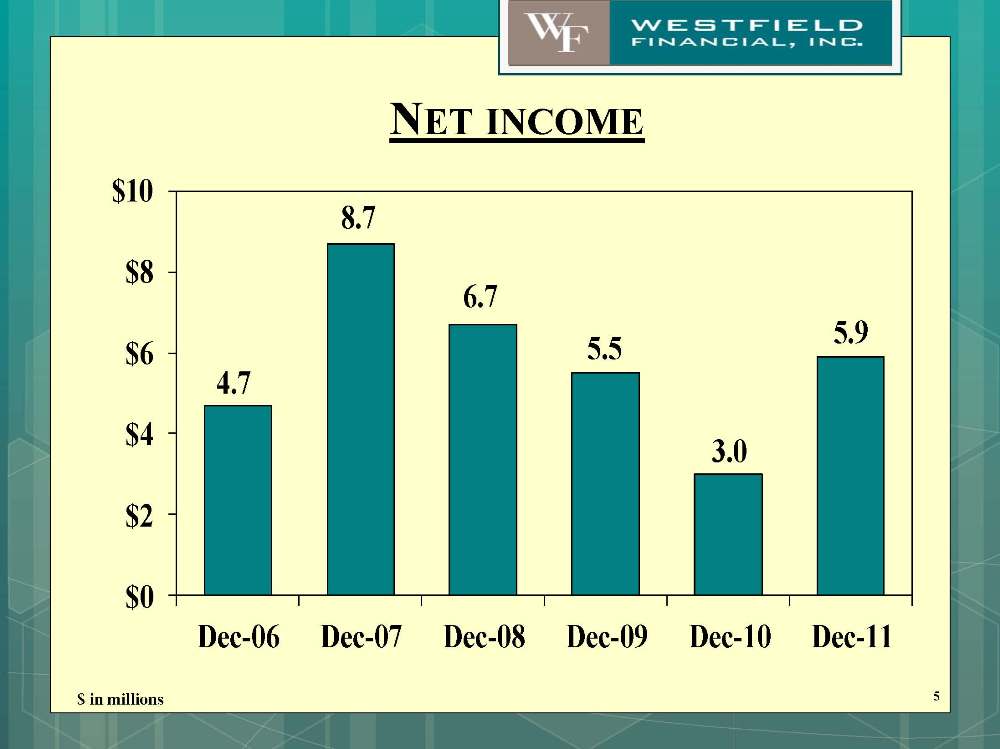
NET INCOME $ in millions $10 $8 $6 $4 $2 $0 4.7 8.7 6.7 5.5 3.0 5.9 Dec-06 Dec-07 Dec-08 Dec-09 Dec-10 Dec-11 5
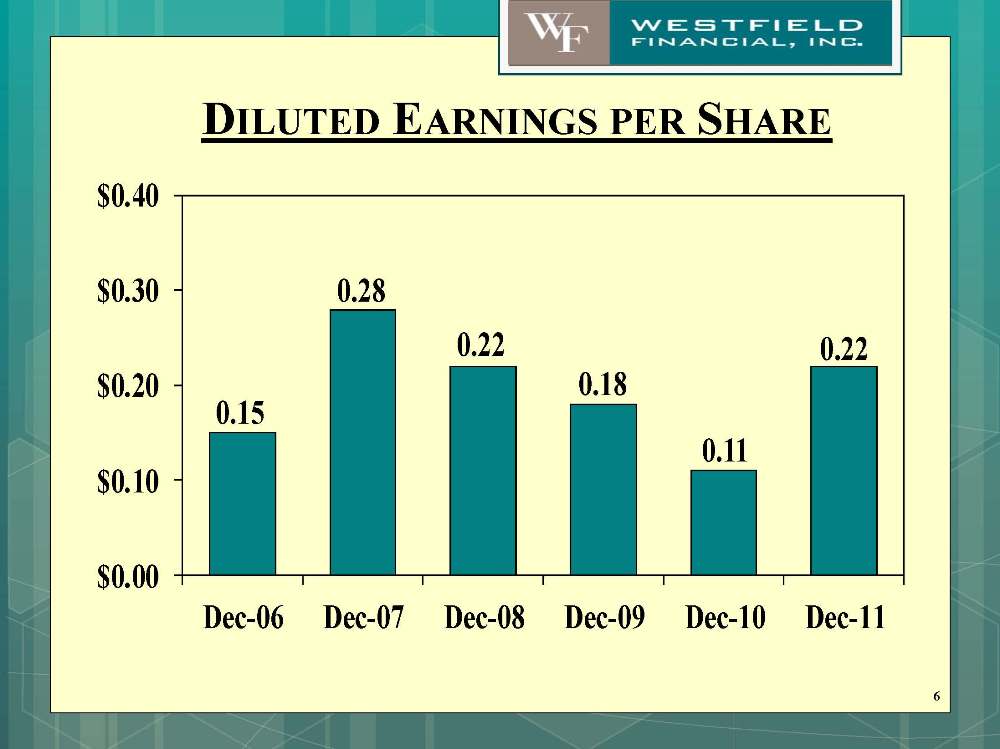
DILUTED EARNINGS PER SHARE $0.40 $0.30 $0.20 $0.10 $0.00 0.15 0.28 0.22 0.18 0.11 0.22 Dec-06 Dec-07 Dec-08 Dec-09 Dec-10 Dec-11 6
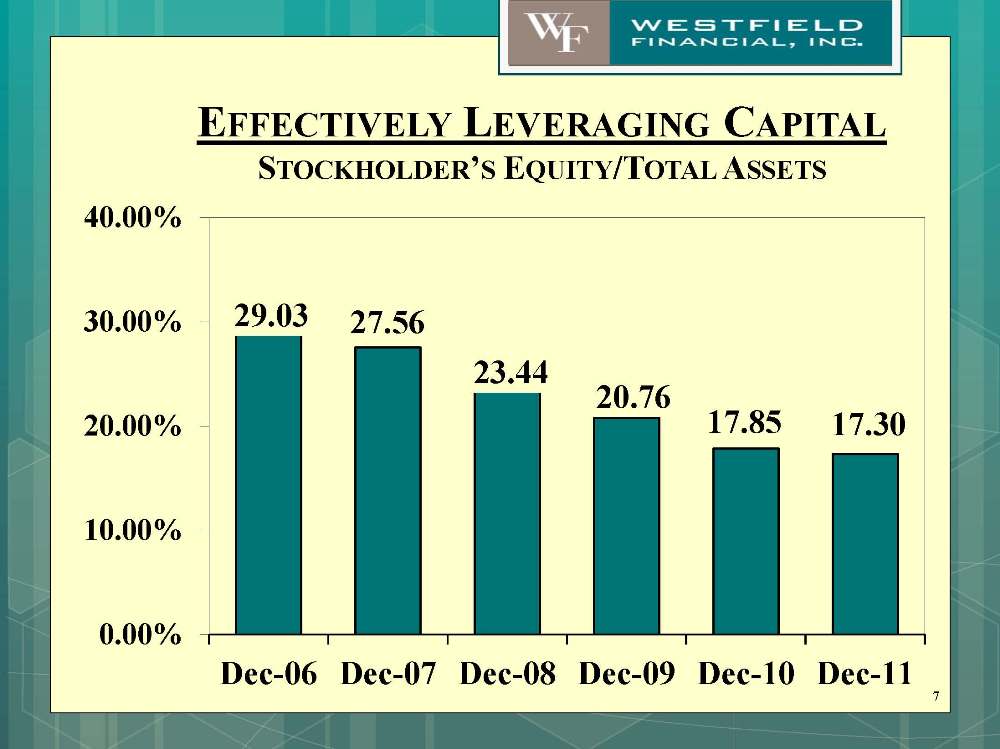
EFFECTIVELY LEVERAGING CAPITAL STOCKHOLDER’S EQUITY/TOTAL ASSETS 29.03 27.56 23.44 20.76 17.85 17.30 0.00% 10.00% 20.00% 30.00% 40.00% Dec-06 Dec-07 Dec-08 Dec-09 Dec-10 Dec-11 7
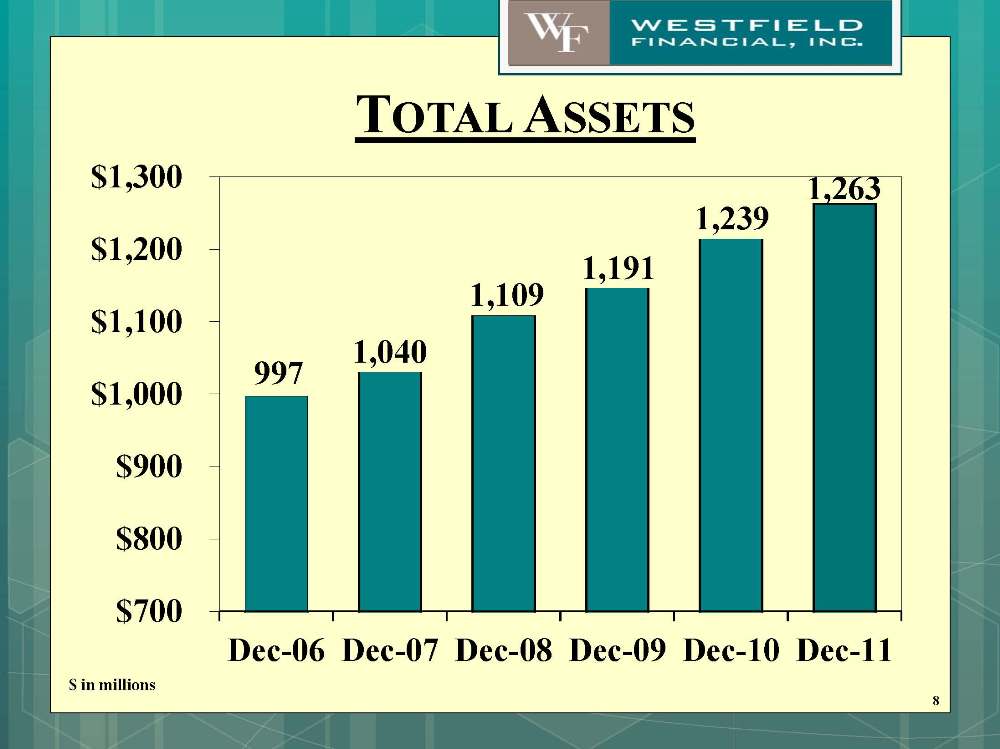
TOTAL ASSETS 997 1,040 1,109 1,191 1,239 1,263 $700 $800 $900 $1,000 $1,100 $1,200 $1,300 Dec-06 Dec-07 Dec-08 Dec-09 Dec-10 Dec-11 8 $ in millions
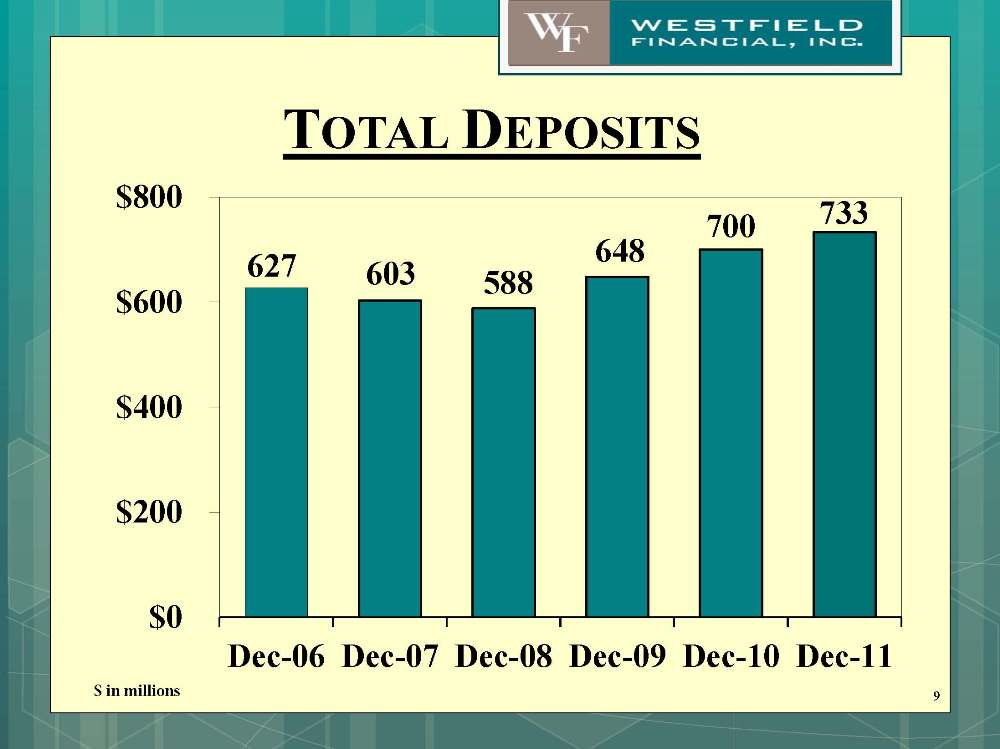
TOTAL DEPOSITS 9 627 603 588 648 700 733 $0 $200 $400 $600 $800 Dec-06 Dec-07 Dec-08 Dec-09 Dec-10 Dec-11 $ in millions
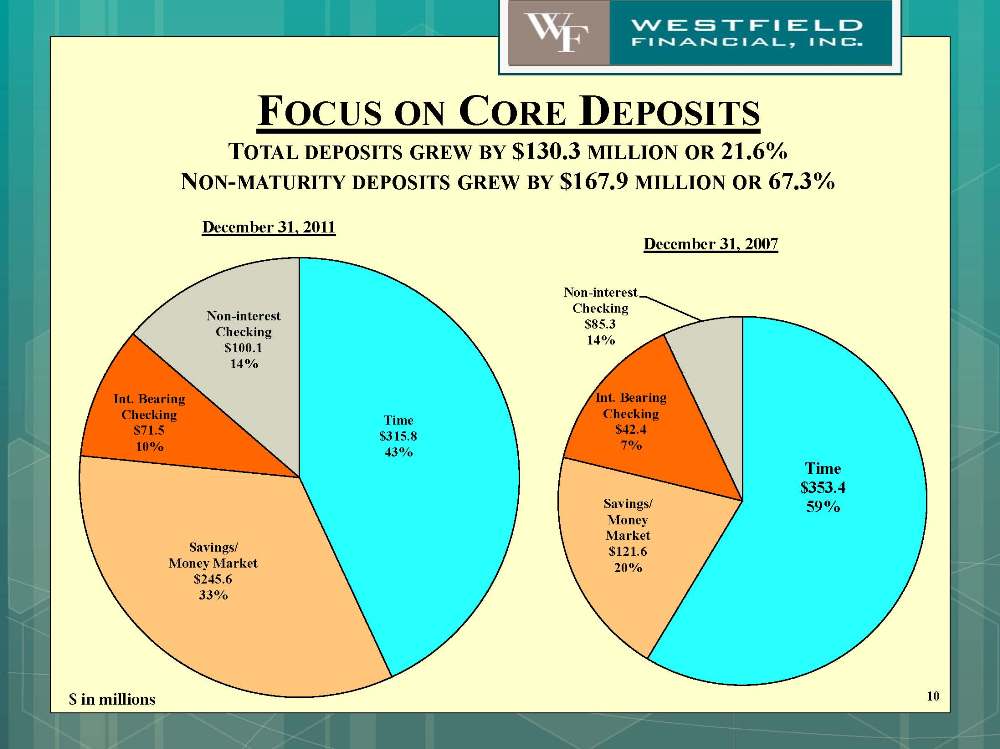
FOCUS ON CORE DEPOSITS TOTAL DEPOSITS GREW BY $130.3 MILLION OR 21.6% NON-MATURITY DEPOSITS GREW BY $167.9 MILLION OR 67.3% 10 Time $353.4 59% Savings/ Money Market $121.6 20% Int. Bearing Checking $42.4 7% Non-interest Checking $85.3 14% Time $315.8 43% Savings/ Money Market $245.6 33% Int. Bearing Checking $71.5 10% Non-interest Checking $100.1 14% December 31, 2011 December 31, 2007 $ in millions
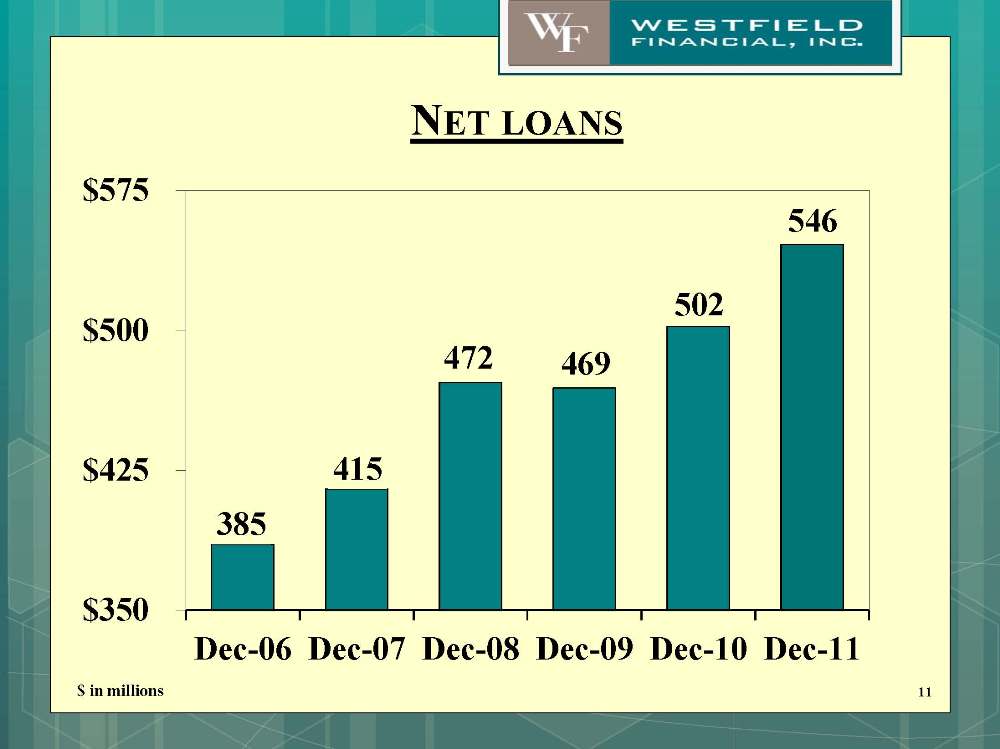
NET LOANS 385 415 472 469 502 546 $350 $425 $500 $575 Dec-06 Dec-07 Dec-08 Dec-09 Dec-10 Dec-11 11 $ in millions
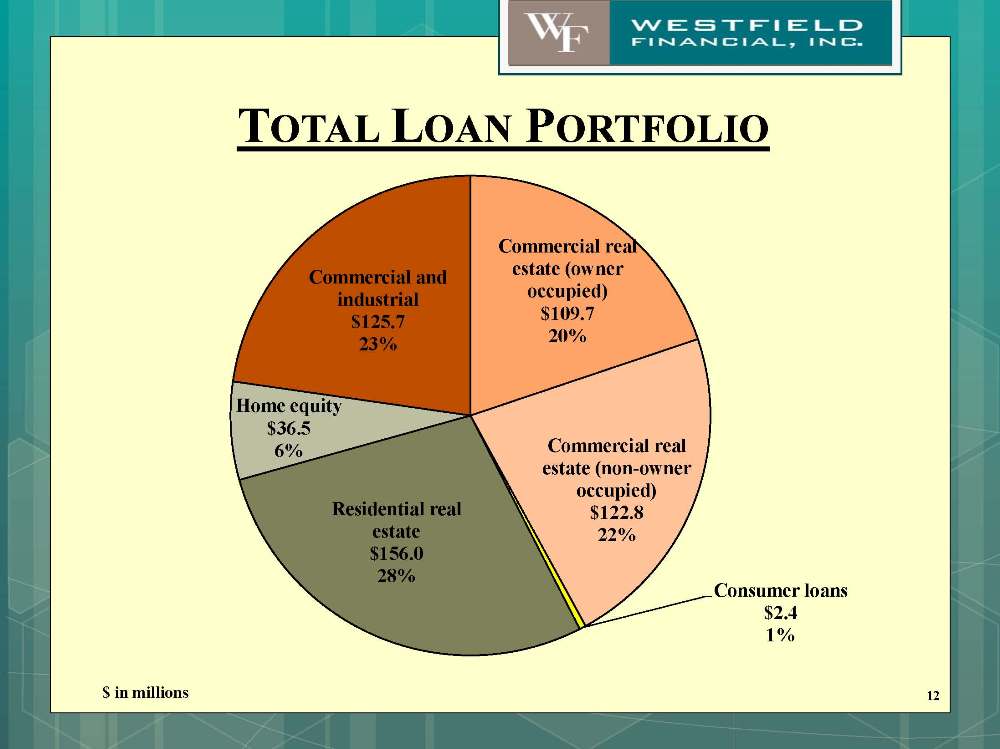
TOTAL LOAN PORTFOLIO Commercial real estate (owner occupied) $109.7 20% Commercial real estate (non-owner occupied) $122.8 22% Consumer loans $2.4 1% Residential real estate $156.0 28% Home equity $36.5 6% Commercial and industrial $125.7 23% 12 $ in millions
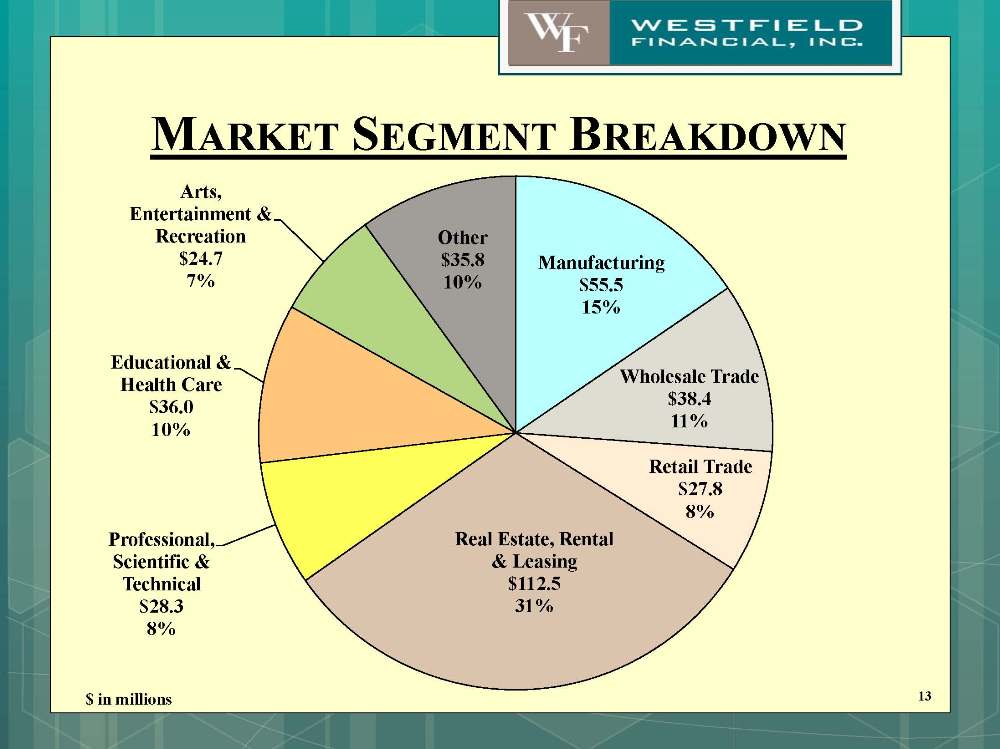
MARKET SEGMENT BREAKDOWN 13 Manufacturing $55.5 15% Wholesale Trade $38.4 11% Retail Trade $27.8 8% Real Estate, Rental & Leasing $112.5 31% Professional, Scientific & Technical $28.3 8% Educational & Health Care $36.0 10% Arts, Entertainment & Recreation $24.7 7% Other $35.8 10% $ in millions
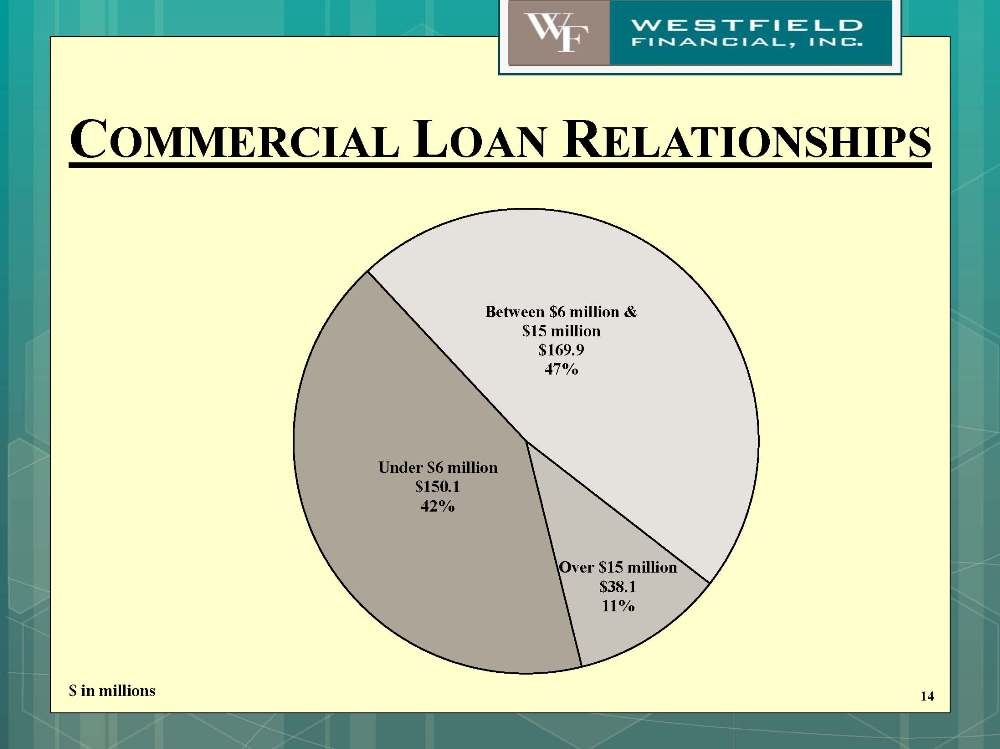
COMMERCIAL LOAN RELATIONSHIPS Between $6 million & $15 million $169.9 47% Over $15 million $38.1 11% Under $6 million $150.1 42% 14 $ in millions
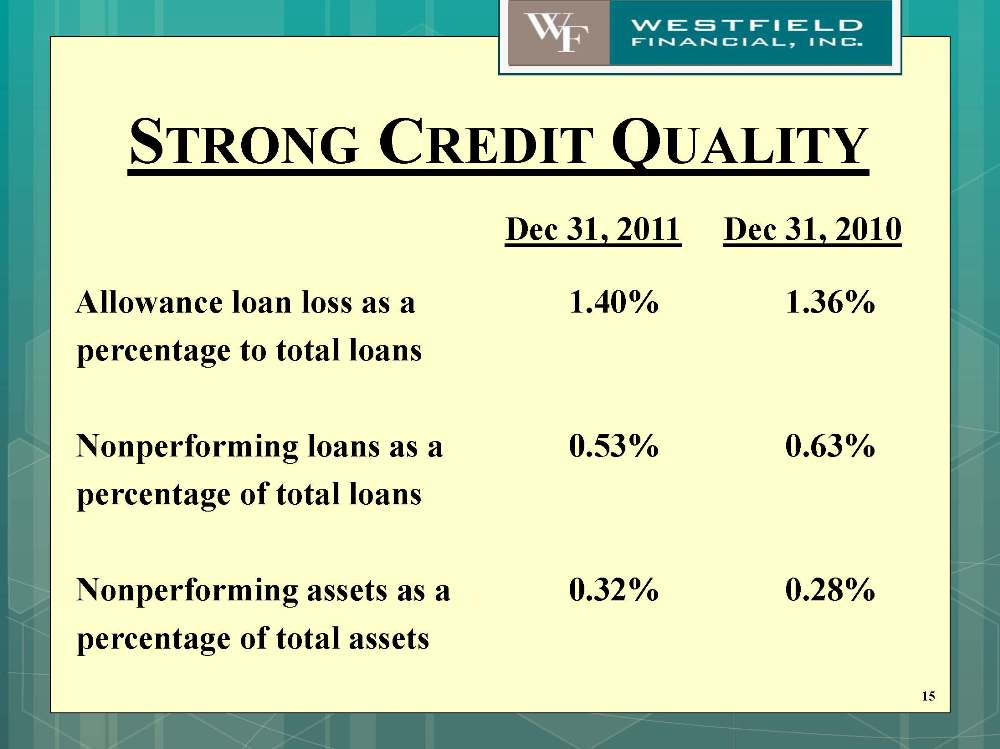
STRONG CREDIT QUALITY Dec 31, 2011 Dec 31, 2010 Allowance loan loss as a 1.40% 1.36% percentage to total loans Nonperforming loans as a 0.53% 0.63% percentage of total loans Nonperforming assets as a 0.32% 0.28% percentage of total assets 15
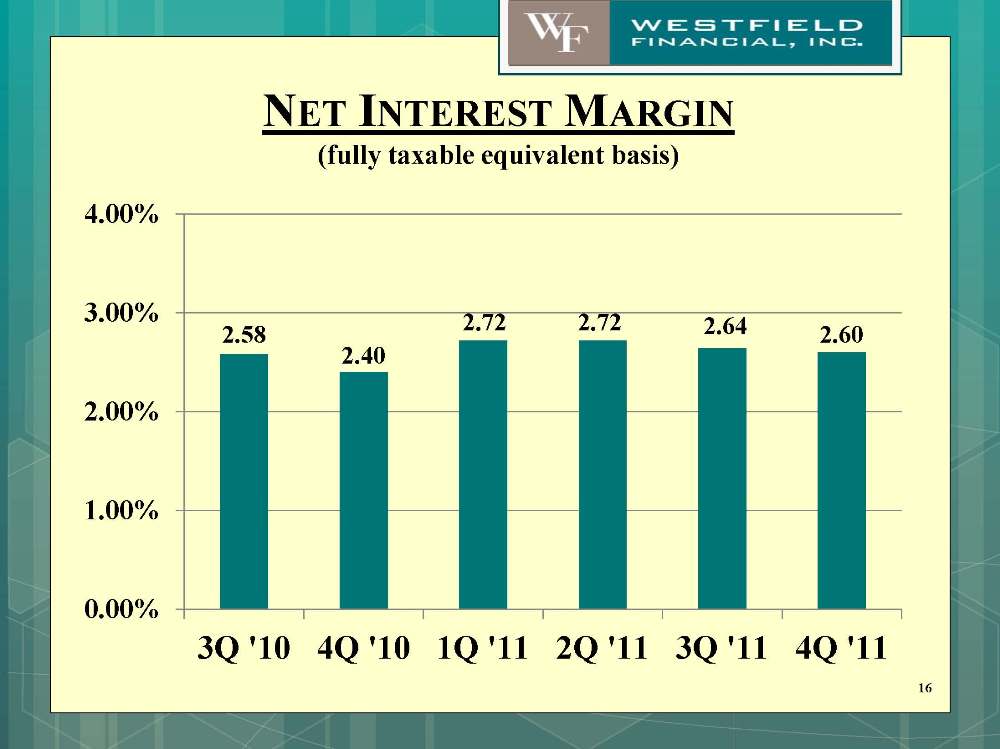
NET INTEREST MARGIN (fully taxable equivalent basis) 16 2.58 2.40 2.72 2.72 2.64 2.60 0.00% 1.00% 2.00% 3.00% 4.00% 3Q '10 4Q '10 1Q '11 2Q '11 3Q '11 4Q '11

CAPITAL MANAGEMENT Possible uses of capital: Fund organic growth. Finance acquisitions. Repurchase shares of our common stock. Pay dividends to shareholders. 17
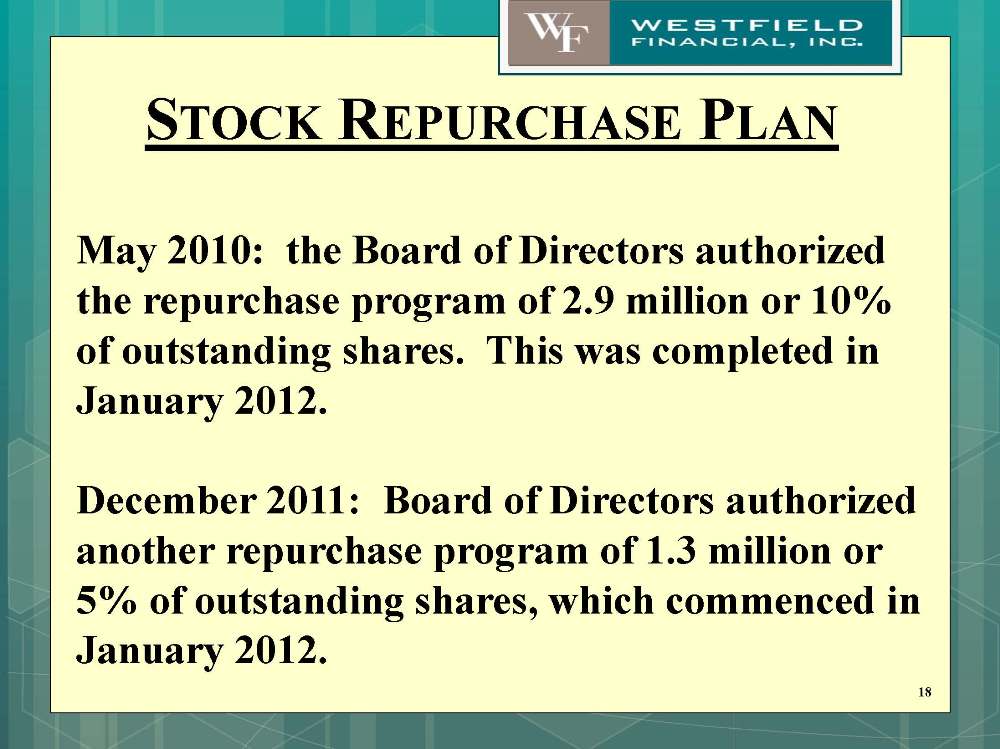
STOCK REPURCHASE PLAN May 2010: the Board of Directors authorized the repurchase program of 2.9 million or 10% of outstanding shares. This was completed in January 2012. December 2011: Board of Directors authorized another repurchase program of 1.3 million or 5% of outstanding shares, which commenced in January 2012. 18
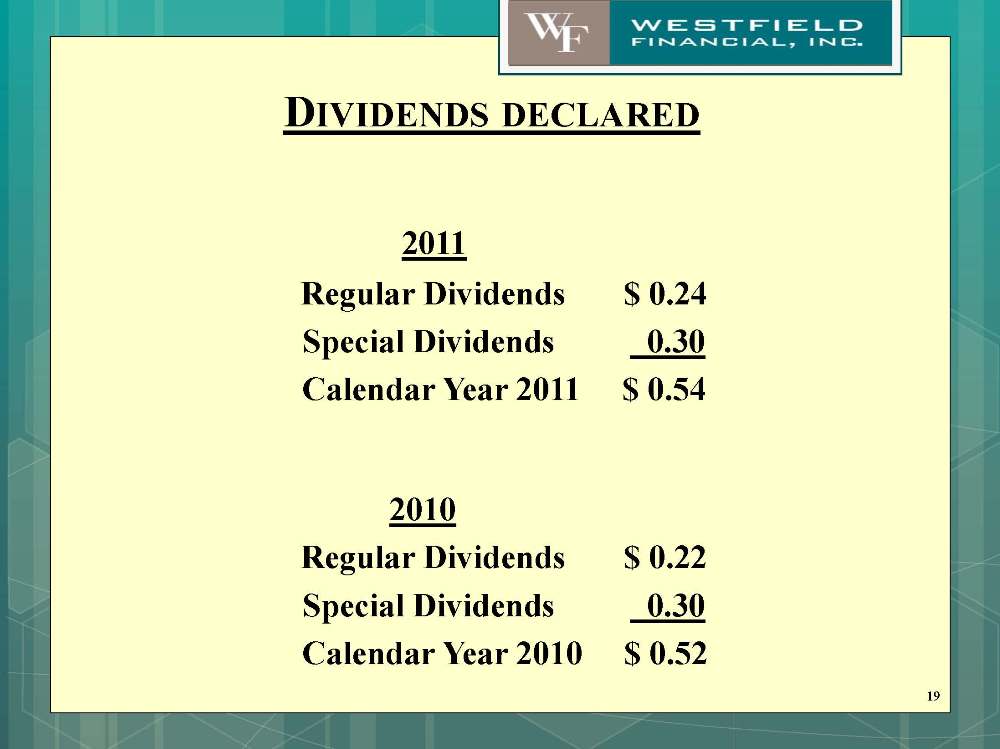
DIVIDENDS DECLARED 2011 Regular Dividends $ 0.24 Special Dividends 0.30 Calendar Year 2011 $ 0.54 2010 Regular Dividends $ 0.22 Special Dividends 0.30 Calendar Year 2010 $ 0.52 19
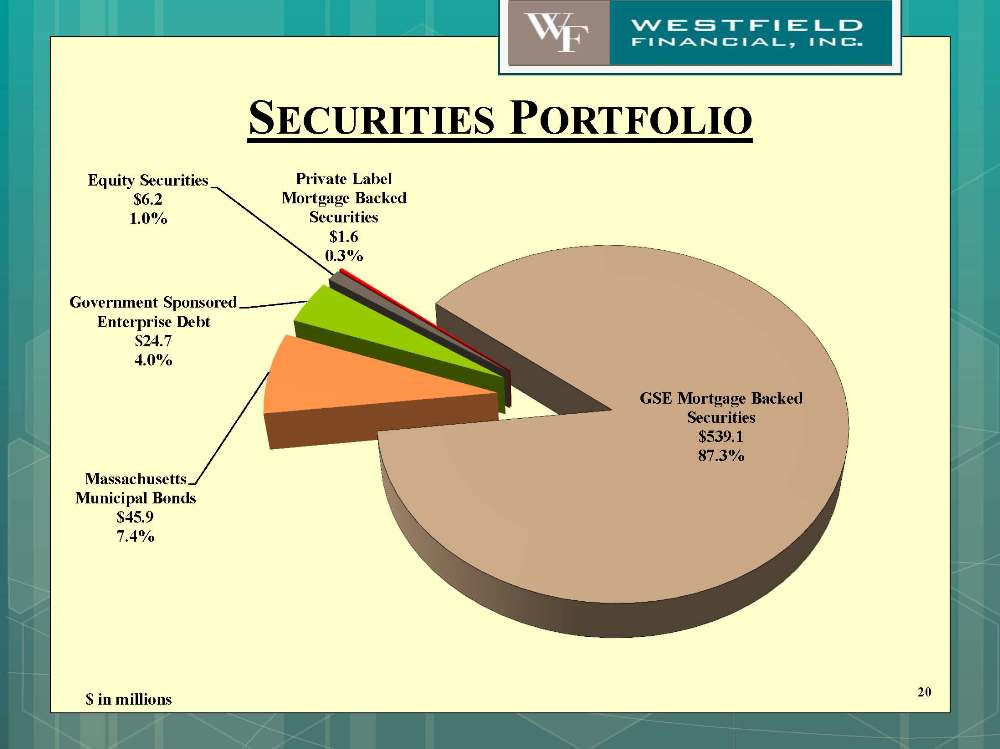
SECURITIES PORTFOLIO Government Sponsored Enterprise Debt $24.7 4.0% Equity Securities $6.2 1.0% Private Label Mortgage Backed Securities $1.6 0.3% GSE Mortgage Backed Securities $539.1 87.3% Massachusetts Municipal Bonds $45.9 7.4% 20 $ in millions
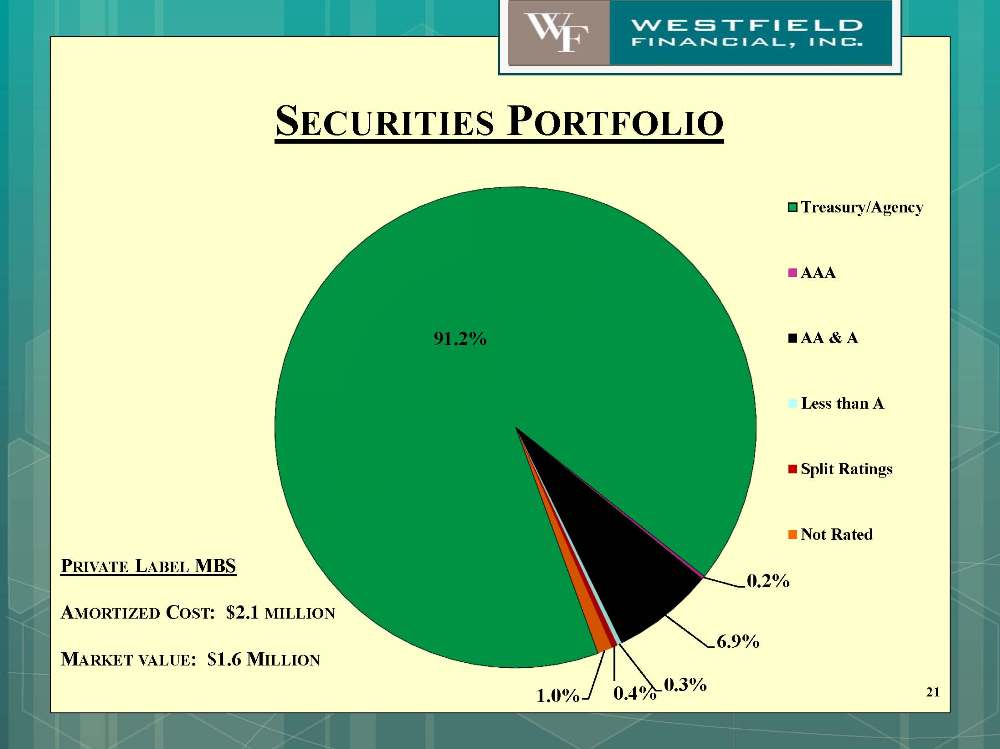
SECURITIES PORTFOLIO PRIVATE LABEL MBS AMORTIZED COST: $2.1 MILLION MARKET VALUE: $1.6 MILLION 21 91.2% 0.2% 6.9% 0.3% 0.4% 1.0% Treasury/Agency AAA AA & A Less than A Split Ratings Not Rated
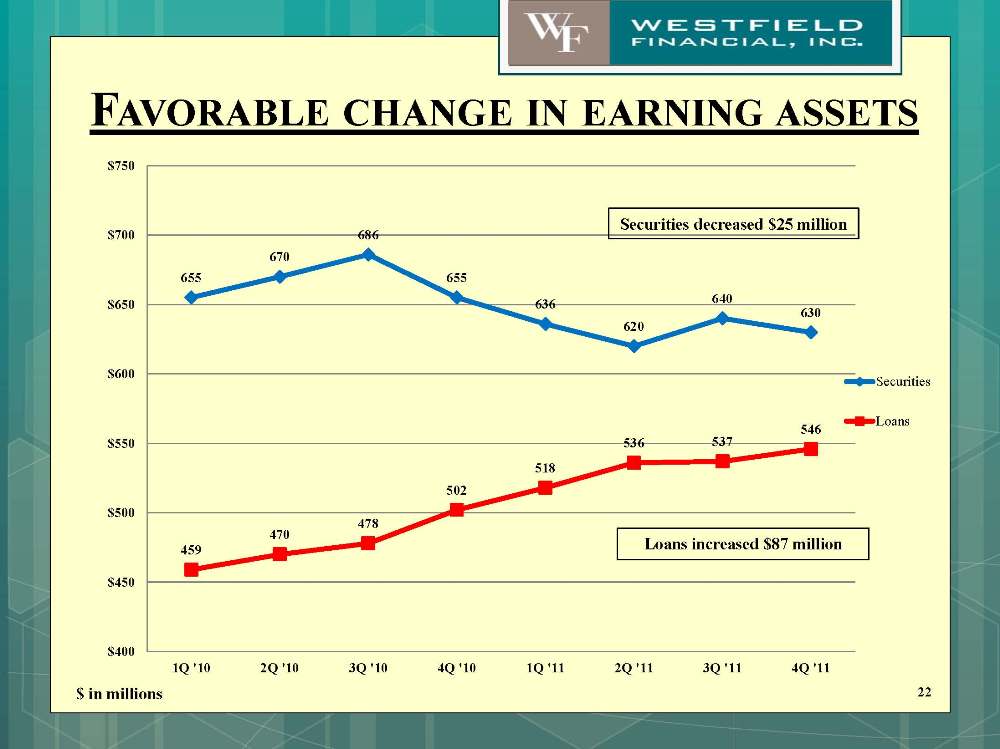
FAVORABLE CHANGE IN EARNING ASSETS 22 655 670 686 655 636 620 640 630 459 470 478 502 518 536 537 546 $400 $450 $500 $550 $600 $650 $700 $750 1Q '10 2Q '10 3Q '10 4Q '10 1Q '11 2Q '11 3Q '11 4Q '11 Securities Loans Loans increased $87 million Securities decreased $25 million $ in millions
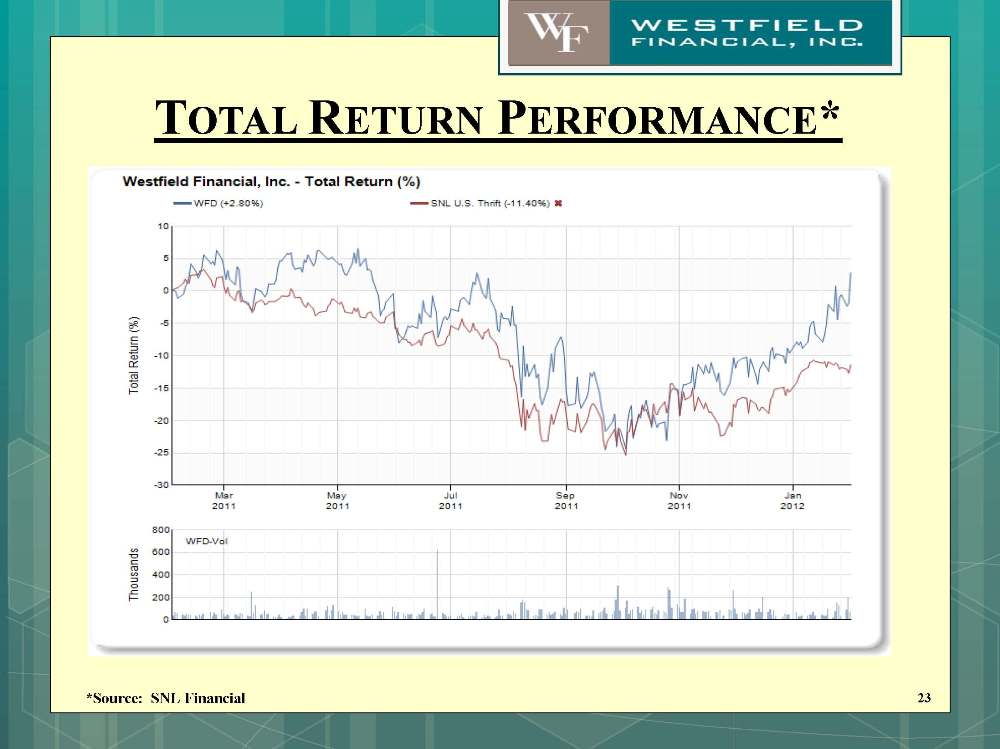
TOTAL RETURN PERFORMANCE* 23 *Source: SNL Financial

Thank You 24