UNITED STATES
SECURITIES AND EXCHANGE COMMISSION
100 F ST., N.E.
WASHINGTON, D.C. 20549
FORM 10-K
(Mark One)
S ANNUAL REPORT PURSUANT TO SECTION 13 OR 15(d) OF THE
SECURITIES EXCHANGE ACT OF 1934
FOR THE FISCAL YEAR ENDED DECEMBER 31, 2008,
OR
£ TRANSITION REPORT PURSUANT TO SECTION 13 OR 15(d) OF THE
SECURITIES EXCHANGE ACT OF 1934
FOR THE TRANSITION PERIOD FROM TO
| | | | |
Commission
File Number | | Registrants, State of Incorporation,
Address, and Telephone Number | | I.R.S. Employer
Identification No. |
001-09120 | | PUBLIC SERVICE ENTERPRISE GROUP INCORPORATED
(A New Jersey Corporation)
80 Park Plaza, P.O. Box 1171
Newark, New Jersey 07101-1171
973 430-7000
http://www.pseg.com | | 22-2625848 |
000-49614 | | PSEG POWER LLC
(A Delaware Limited Liability Company)
80 Park Plaza—T25
Newark, New Jersey 07102-4194
973 430-7000
http://www.pseg.com | | 22-3663480 |
001-00973 | | PUBLIC SERVICE ELECTRIC AND GAS COMPANY
(A New Jersey Corporation)
80 Park Plaza, P.O. Box 570
Newark, New Jersey 07101-0570
973 430-7000
http://www.pseg.com | | 22-1212800 |
Securities registered pursuant to Section 12(b) of the Act:
| | | | |
Registrant | | Title of Each Class | | Name of Each Exchange
On Which Registered |
Public Service Enterprise
Group Incorporated | | Common Stock without
par value | | New York Stock
Exchange |
| | | | | | | | | | |
Registrant | | Title of Each Class | | Title of Each Class | | Name of Each Exchange
On Which Registered |
Public Service Electric
and Gas Company | | Cumulative Preferred Stock
$100 par value Series: | | First and Refunding
Mortgage Bonds: | | |
| | | | | | Series | | Due | | |
| | 4.08% | | 91/4% | | CC | | 2021 | | |
| | 4.18% | | 63/4% | | VV | | 2016 | | New York Stock Exchange |
| | 4.30% | | 8% | | | | 2037 | | |
| | 5.05% | | 5% | | | | 2037 | | |
| | 5.28% | | | | | | | | |
(Cover continued on next page)
(Cover continued from previous page)
| | | | |
Registrant | | Title of Each Class | | Name of Each Exchange
On Which Registered |
PSEG Power LLC | | 85/8% Senior Notes, due 2031 | | New York Stock Exchange |
Securities registered pursuant to Section 12(g) of the Act:
| | |
Registrant | | Title of Class |
PSEG Power LLC | | Limited Liability Company Membership Interest |
| | |
Public Service Electric and Gas Company | | 6.92% Cumulative Preferred Stock $100 par value
Medium-Term Notes, Series A
Medium-Term Notes, Series B
Medium-Term Notes, Series C
Medium-Term Notes, Series D
Medium-Term Notes, Series E
Medium-Term Notes, Series F |
Indicate by check mark whether each registrant is a well-known seasoned issuer, as defined in Rule 405 of the Securities Act.
| | | | |
Public Service Enterprise Group Incorporated | | | | YesS | | | | | No£ | |
PSEG Power LLC | | | | Yes£ | | | | | NoS | |
Public Service Electric and Gas Company | | | | YesS | | | | | No£ | |
Indicate by check mark if each of the registrants is not required to file reports pursuant to Section 13 or 15(d) of the Securities Exchange Act of 1934. Yes£ NoS
Indicate by check mark whether each of the registrants (1) has filed all reports required to be filed by Section 13 or 15(d) of the Securities Exchange Act of 1934 during the preceding 12 months (or for such shorter period that the registrants were required to file such reports) and (2) has been subject to such filing requirements for the past 90 days. YesS No£
Indicate by check mark if disclosure of delinquent filers pursuant to Item 405 of Regulation S-K is not contained herein, and will not be contained, to the best of registrant’s knowledge, in definitive proxy or information statements incorporated by reference in Part III of this Form 10-K or any amendment to this Form 10-K.S
Indicate by check mark whether each registrant is a large accelerated filer, an accelerated filer, a non-accelerated filer or a smaller reporting company. See definitions of “large accelerated filer,” “accelerated filer” and “smaller reporting company” in Rule 12b-2 of the Exchange Act.
| | | | | | | | |
Public Service Enterprise Group Incorporated | | Large accelerated filerS | | Accelerated filer£ | | Non-accelerated filer£ | | Smaller reporting company£ |
PSEG Power LLC | | Large accelerated filer£ | | Accelerated filer£ | | Non-accelerated filerS | | Smaller reporting company£ |
Public Service Electric
and Gas Company | | Large accelerated filer£ | | Accelerated filer£ | | Non-accelerated filerS | | Smaller reporting company£ |
Indicate by check mark whether any of the registrants is a shell company (as defined in Rule 12b-2 of the Exchange Act). Yes£ NoS
The aggregate market value of the Common Stock of Public Service Enterprise Group Incorporated held by non-affiliates as of June 30, 2008 was $23,326,705,042 based upon the New York Stock Exchange Composite Transaction closing price.
The number of shares outstanding of Public Service Enterprise Group Incorporated’s sole class of Common Stock as of January 30, 2009 was 505,996,093.
PSEG Power LLC is a wholly owned subsidiary of Public Service Enterprise Group Incorporated and meets the conditions set forth in General Instruction I(1)(a) and (b) of Form 10-K and is filing its Annual Report on Form 10-K with the reduced disclosure format authorized by General Instruction I.
As of January 30, 2009, Public Service Electric and Gas Company had issued and outstanding 132,450,344 shares of Common Stock, without nominal or par value, all of which were privately held, beneficially and of record by Public Service Enterprise Group Incorporated.
DOCUMENTS INCORPORATED BY REFERENCE
| | |
Part of Form 10-K of
Public Service
Enterprise
Group Incorporated | | Documents Incorporated by Reference |
III | | Portions of the definitive Proxy Statement for the 2009 Annual Meeting of Stockholders of Public Service Enterprise Group Incorporated, which definitive Proxy Statement is expected to be filed with the Securities and Exchange Commission on or about March 9, 2009, as specified herein. |
TABLE OF CONTENTS
i
FORWARD-LOOKING STATEMENTS
Certain of the matters discussed in this report constitute “forward-looking statements” within the meaning of the Private Securities Litigation Reform Act of 1995. Such forward-looking statements are subject to risks and uncertainties, which could cause actual results to differ materially from those anticipated. Such statements are based on management’s beliefs as well as assumptions made by and information currently available to management. When used herein, the words “anticipate,” “intend,” “estimate,” “believe,” “expect,” “plan,” “hypothetical,” “potential,” “forecast,” “project,” variations of such words and similar expressions are intended to identify forward-looking statements. Factors that may cause actual results to differ are often presented with the forward-looking statements themselves. Other factors that could cause actual results to differ materially from those contemplated in any forward-looking statements made by us herein are discussed in Item 1A. Risk Factors, Item 7. Management’s Discussion and Analysis of Financial Condition and Results of Operations (MD&A), Item 8. Financial Statements and Supplementary Data—Note 11. Commitments and Contingent Liabilities and other factors discussed in filings we make with the United States Securities and Exchange Commission (SEC). These factors include, but are not limited to:
|
• | | | | Adverse changes in energy industry policies and regulation, including market structures and rules. |
|
• | | | | Any inability of our energy transmission and distribution businesses to obtain adequate and timely rate relief and regulatory approvals from federal and state regulators. |
|
• | | | | Changes in federal and state environmental regulations that could increase our costs or limit operations of our generating units. |
|
• | | | | Changes in nuclear regulation and/or developments in the nuclear power industry generally that could limit operations of our nuclear generating units. |
|
• | | | | Actions or activities at one of our nuclear units that might adversely affect our ability to continue to operate that unit or other units at the same site. |
|
• | | | | Any inability to balance our energy obligations, available supply and trading risks. |
|
• | | | | Any deterioration in our credit quality. |
|
• | | | | Availability of capital and credit at reasonable pricing terms and our ability to meet cash needs. |
|
• | | | | Any inability to realize anticipated tax benefits or retain tax credits. |
|
• | | | | Increases in the cost of, or interruption in the supply of, fuel and other commodities necessary to the operation of our generating units. |
|
• | | | | Delays or cost escalations in our construction and development activities. |
|
• | | | | Adverse investment performance of our decommissioning and defined benefit plan trust funds and changes in discount rates and funding requirements. |
|
• | | | | Changes in technology and increased customer conservation. |
Additional information concerning these factors are set forth under Item 1A. Risk Factors.
All of the forward-looking statements made in this report are qualified by these cautionary statements and we cannot assure you that the results or developments anticipated by management will be realized, or even if realized, will have the expected consequences to, or effects on, us or our business prospects, financial condition or results of operations. Readers are cautioned not to place undue reliance on these forward-looking statements in making any investment decision. Forward-looking statements made in this report only apply as of the date of this report. While we may elect to update forward-looking statements from time to time, we specifically disclaim any obligation to do so, even if internal estimates change, unless otherwise required by applicable securities laws.
The forward-looking statements contained in this report are intended to qualify for the safe harbor provisions of Section 27A of the Securities Act of 1933, as amended, and Section 21E of the Securities Exchange Act of 1934, as amended.
ii
FILING FORMAT AND GLOSSARY
This combined Annual Report on Form 10-K is separately filed by Public Service Enterprise Group Incorporated (PSEG), PSEG Power LLC (Power) and Public Service Electric and Gas Company (PSE&G). Information relating to any individual company is filed by such company on its own behalf. Power and PSE&G each is only responsible for information about itself and its subsidiaries.
Discussions throughout the document refer to PSEG and its principal operating subsidiaries, Power, PSE&G and PSEG Energy Holdings L.L.C. (Energy Holdings). Depending on the context of each section, references to “we,” “us,” and “our” relate to the specific company or companies being discussed. In addition, certain key acronyms and definitions are summarized in a glossary beginning on page 233.
WHERE TO FIND MORE INFORMATION
PSEG, Power and PSE&G file annual, quarterly and special reports, proxy statements and other information with the U.S. Securities and Exchange Commission (SEC). You may read and copy any document that we file at the Public Reference Room of the SEC at 100 F Street, N.E., Washington, D.C. 20549. Information on the operation of the Public Reference Room may be obtained by calling the SEC at 1-800-SEC-0330. You may also obtain our filed documents from commercial document retrieval services, the SEC’s internet website at www.sec.gov or our website at www.pseg.com. Information contained on our website should not be deemed incorporated into or as a part of this report. Our Common Stock is listed on the New York Stock Exchange under the ticker symbol PEG. You can obtain information about us at the offices of the New York Stock Exchange, 20 Broad Street, New York, New York 10005.
PART I
ITEM 1. BUSINESS
We were incorporated under the laws of the State of New Jersey in 1985 and our principal executive offices are located at 80 Park Plaza, Newark, New Jersey 07102. We conduct our business through three direct wholly owned subsidiaries, Power, PSE&G and Energy Holdings, each of which also has its principal executive offices at 80 Park Plaza, Newark, New Jersey 07102. PSEG Services Corporation (Services), our wholly owned subsidiary, provides us and these operating subsidiaries with certain management, administrative and general services at cost.
1
| | | | |
PSEG |
|
We are an energy company with a diversified business mix. Our operations are located primarily in the Northeastern and Mid Atlantic United States. Our business approach focuses on operational excellence, financial strength and disciplined investment. As a holding company, our profitability depends significantly on our subsidiaries’ operating capabilities. Below are descriptions of our principal operating subsidiaries. |
|
Power | | PSE&G | | Energy Holdings |
|
A Delaware limited liability company formed in 1999 that integrates its generating asset operations with its wholesale energy sales, fuel supply, energy trading and marketing and risk management functions.
Earns revenues from selling under contract or on the spot market a range of diverse products such as electricity, natural gas, capacity, emissions credits, congestion credits and a series of energy-related products used to optimize the operation of the energy grid.
Owns approximately 13,600 megawatts (MWs) of generation capacity located in the Northeast and Mid Atlantic regions of the U.S. in some of the country’s largest and most developed electricity markets. | | A New Jersey corporation, incorporated in 1924, which is a regulated public utility providing transmission and distribution of electric energy and natural gas in New Jersey. It is also the provider of last resort for gas and electric commodity service for end users in its service territory.
Earns revenue from its regulated rate tariffs under which it provides electric transmission and electric and gas distribution to residential, commercial and industrial customers in its service territory. It also offers appliance services and repairs to customers throughout its service territory.
Provides service to 2.1 million electric customers and 1.7 million gas customers in a service area that covers approximately 2,600 square miles running diagonally across New Jersey where approximately 5.5 million people, or about 70% of the State’s population, resides. Serves the most heavily populated, commercialized and industrialized territory in New Jersey, including its six largest cities and approximately 300 suburban and rural communities. | | A New Jersey limited liability company (formed as successor to a company which was incorporated in 1989) that invests and operates through its two primary subsidiaries.
Earns revenues from the operation of generation projects and passive energy-related investments.
Owns approximately 2,400 MW of generation capacity, mostly in Texas.
Also owns and manages a $2 billion diversified portfolio of passive investments, which consists mainly of energy-related leveraged leases. |
The majority of our earnings are derived from the operations of Power, which has contributed at least 70% of our Income from Continuing Operations over the past three years. While this part of the business has produced significant earnings over that period, its operations are subject to higher risks resulting from volatility in the energy markets. PSE&G has continued to produce stable earnings contributions for us. Earnings from Energy Holdings have declined in recent years as we have significantly reduced our investment in international projects. Energy Holdings’ earnings have also been impacted by gains and losses on its asset sales and other charges and impairments taken on its remaining investments.
2
| | | | | | |
|
Earnings (Losses) in millions | | 2008 | | 2007 | | 2006 |
|
Power | | | $ | | 1,050 | | | | $ | | 949 | | | | $ | | 515 | |
PSE&G | | | | 364 | | | | | 380 | | | | | 265 | |
Energy Holdings | | | | (403 | ) | | | | | 63 | | | | | (30 | ) | |
Other | | | | (28 | ) | | | | | (67 | ) | | | | | (77 | ) | |
| | | | | | |
PSEG Income from Continuing Operations | | | $ | | 983 | | | | $ | | 1,325 | | | | $ | | 673 | |
| | | | | | |
The following is a more detailed description of our business, including a discussion of our:
|
• | | | | Business Operations and Strategy |
|
• | | | | Competitive Environment |
|
• | | | | Employee Relations |
|
• | | | | Regulatory Issues |
|
• | | | | Environmental Matters |
BUSINESS OPERATIONS AND STRATEGY
Power
Through Power, we seek to produce low-cost energy by efficiently operating our nuclear, coal and gas-fired generation facilities, while balancing generation production, fuel requirements and supply obligations through energy portfolio management. We use commodity and financial instruments, combined with our owned generation, to cover our commitments for Basic Generation Service (BGS) in New Jersey and other bilateral contract agreements.
Products and Services
As a merchant generator, our profit is derived from selling a range of products and services under contract to power marketers and to load-serving entities, such as investor-owned and municipal utilities, and to aggregators who resell energy to retail consumers, or on the spot market. These products and services include:
|
• | | | | Energy—is the electrical output produced by generation plants that is ultimately delivered to customers for use in lighting, heating, air conditioning and operation of other electrical equipment. Energy is our principal product and is priced on a usage basis, typically in cents per kWh or dollars per MWh. |
|
• | | | | Capacity—a product distinct from energy, is a market commitment that a given unit will be available to an Independent System Operator (ISO) for dispatch if it is needed to meet system demand. Capacity is typically priced in dollars per MW for a given sale period. |
|
• | | | | Ancillary Services—are related activities supplied by generation unit owners to the wholesale market, required by the ISO to ensure the safe and reliable operation of the bulk power system. Owners of generation units may bid units into the ancillary services market in return for compensatory payments. Costs to pay generators for ancillary services are recovered through charges imposed on market participants. |
|
• | | | | Emissions Allowances and Congestion Credits—Emissions Allowances (or credits) represent the right to emit a specific amount of certain pollutants. Allowance trading is used to control air pollution by providing economic incentives for achieving reductions in the emissions of pollutants. Congestion credits (or Financial Transmission Rights) are financial instruments that entitle the holder |
3
| | | | to a stream of revenues (or charges) based on the hourly congestion price differences across a transmission path. |
Power also sells wholesale natural gas, primarily through a full requirements Basic Gas Supply Service (BGSS) contract with PSE&G to meet the gas supply requirements of PSE&G’s gas customers. The current BGSS contract runs through March 31, 2012.
About 42% of PSE&G’s peak daily gas requirements comes from our firm transportation, which is available every day of the year. We satisfy the remainder of PSE&G’s requirements from our field storage, liquefied natural gas, seasonal purchases, contract peaking supply, propane and refinery and landfill gas. Based upon availability, we also sell gas to others.
How Power Operates
We have ownership interests in five nuclear generating units: Salem Units 1 and 2, each owned 57.41% by us and 42.59% by Exelon Generation and which we operate; Hope Creek, 100% owned and operated by us; and Peach Bottom Units 2 and 3, each of which is operated by Exelon Generation and owned 50% by us and 50% by Exelon Generation. Salem 1 and 2 and Hope Creek are located at the same site. We also have ownership interests in fossil-fueled generating stations in the Northeast and Mid Atlantic U.S. These units use coal, natural gas and oil for electric generation.
The map below shows the locations of Power’s generation facilities. For additional information, see Item 2. Properties.
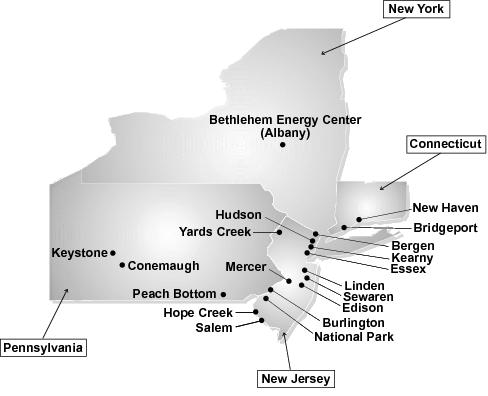
4
| | | Generation Capacity | Our installed capacity is comprised of a diverse mix of fuels: 45% gas, 27% nuclear, 17% coal, 9% oil and 2% pumped storage. This fuel diversity serves to mitigate risks associated with fuel price volatility and market demand cycles. Our total generating output in 2008 was approximately 55,300 GWh, which was the highest level of generating output achieved in a year by our facilities. We anticipate that our 2009 electric output will be approximately 58,000 GWh. The following table indicates the proportionate share of generating output by fuel type.
| | | | Generation by Fuel Type | | Actual 2008 | | Estimated 2009 (A) |
Nuclear: | | | | |
New Jersey facilities | | | | 36 | % | | | | | 35 | % | |
Pennsylvania facilities | | | | 17 | % | | | | | 16 | % | |
Fossil: | | | | |
Coal: | | | | |
New Jersey facilities | | | | 8 | % | | | | | 11 | % | |
Pennsylvania facilities | | | | 11 | % | | | | | 10 | % | |
Connecticut facilities | | | | 5 | % | | | | | 5 | % | |
Oil and Natural Gas: | | | | |
New Jersey facilities | | | | 18 | % | | | | | 17 | % | |
New York facilities | | | | 5 | % | | | | | 6 | % | |
| | | | |
Total | | | | 100 | % | | | | | 100 | % | |
| | | | |
|
(A) | | | | No assurances can be given that actual 2009 output by source will match estimates. |
| | | Generation Dispatch | Our generation units are typically characterized as serving one or more of the three general energy market segments: base load; load following; and peaking, based on their operating capability and performance. On a capacity basis, our portfolio of generation assets consists of 35% base load, 43% load following and 22% peaking. This diversity serves to reduce the risk associated with market demand cycles and allows us to participate in the market at each segment of the dispatch curve.
| | | Base Load Unitsare the largest and most efficient units that we operate. These units operate whenever they are available. These units generally derive revenues from energy and capacity sales. Operating costs are low due to the combination of high efficiency and the use of coal and nuclear fuels, which have generally been lower in cost relative to oil or natural gas. Performance is generally measured by the unit’s “capacity factor,” or the ratio of the actual output to the theoretical maximum output. During 2008, our base load coal unit average capacity factor was 86.2%. Our base load nuclear unit capacity factors were as follows: | | | Unit | | Capacity
Factor |
Salem Unit 1 | | | | 89.9 | % | |
Salem Unit 2 | | | | 81.2 | % | |
Hope Creek | | | | 100.8 | % | |
Peach Bottom Unit 2 | | | | 87.4 | % | |
Peach Bottom Unit 3 | | | | 98.2 | % | |
No assurances can be given that these capacity factors will be achieved in the future.
5
|
¡ | | | | Load Following Unitsare generally less efficient than base load units. These units generally operate between 20% and 80% of the time. The operating costs are generally higher per unit of output due to lower efficiency and/or the use of higher cost fuels such as oil and natural gas. They operate less frequently than base load units and generally derive revenues from energy, capacity and ancillary services. |
|
¡ | | | | Peaking Unitsare the least efficient units, run the least amount of time, and generally utilize higher-priced fuels. These units generally operate less than 20% of the time. Costs per unit of output tend to be much higher than that of base load units. The majority of a peaking unit’s revenues is from capacity and ancillary service sales. The characteristics of these units enable them to capture energy revenues during periods of high energy prices. |
|
| | | | In the energy markets in which we operate, owners of power plants generally specify to the ISO prices at which they are prepared to generate and sell energy based on the marginal cost of generating energy from each individual unit. The ISOs will generally dispatch in merit order, calling on the lowest variable cost units first and dispatching progressively higher-cost units until the point that the entire system demand for power (known as the system “load”) is satisfied. Base load units are generally dispatched first, with load following units next, followed by peaking units. The following illustrative chart depicts the order of dispatch of our units based on their dispatch cost: |
Our Generation Facilities Along Dispatch Curve
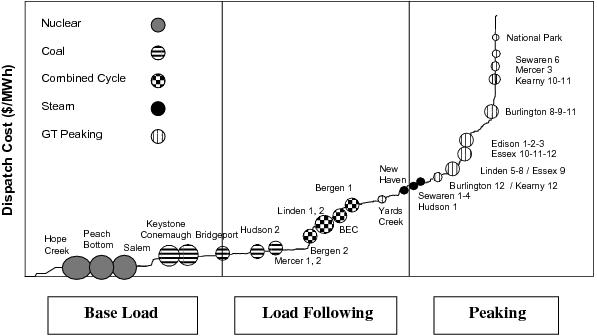
The bid price of the last unit dispatched by an ISO establishes the energy market-clearing price. In PJM, after considering the market-clearing price and the effect of transmission, congestion and other factors, the ISO calculates the locational marginal pricing (LMP) for every generation facility. The ISO pays all units that are dispatched their respective LMP for each MWh of energy produced, regardless of their specific bid prices. Since bids generally approximate the marginal cost of production, units with lower marginal costs generate higher operating profits than units with comparatively higher marginal costs.
During periods when one or more parts of the transmission grid are operating at full capability, resulting in a constraint on the transmission system, it may not be possible to dispatch units in merit order without violating transmission reliability standards. Under such circumstances, the ISO will dispatch higher-cost
6
generation out of merit order within the congested area and power suppliers will be paid an increased LMP in congested areas, reflecting the bid prices of those higher-cost generation units.
This method of determining supply and pricing creates an environment in the markets in which Power participates where natural gas prices have often had a major impact on the price that generators will receive for their output, especially in periods of relatively strong demand. As such, significant changes in the price of natural gas will often translate into significant changes in the price of electricity.
For example, the price of natural gas at the Henry Hub terminal increased from an average of about $3 per MMBtu in 2002 to about $9 per MMBtu on average in 2008. Similarly, the electricity spot price quoted at the PJM West market increased from an average of about $25 per MWh for 2002 to an average of about $70 per MWh in 2008. The prices at which transactions are entered into for future delivery of these products also are volatile, as evidenced by the market for forward contracts at points such as PJM West. The historical annual spot prices and forward calendar prices as averaged over a year are reflected in the graphs below.


7
The prices reflected in the tables above do not necessarily illustrate our contract prices, but they are representative of market prices at relatively liquid hubs, with nearer-term forward pricing generally resulting from more liquid markets than pricing for later years. In addition, the prices do not reflect locational differences resulting from congestion or other factors which can be considerable. While these prices provide some perspective on past and future prices, the forward prices are highly volatile and there is no assurance that such prices will remain in effect nor that we will be able to contract output at these forward prices.
Fuel Supply
|
• | | | | Nuclear Fuel Supply—To run our nuclear units we have long-term contracts for nuclear fuel. These contracts provide for: |
| | | purchase of uranium (concentrates and uranium hexafluoride); | |
¡ | | | | conversion of uranium concentrates to uranium hexafluoride; |
|
¡ | | | | enrichment of uranium hexafluoride; and |
|
¡ | | | | fabrication of nuclear fuel assemblies. |
|
• | | | | Coal Supply—Coal is the primary fuel for our Hudson, Mercer, Keystone, Conemaugh and Bridgeport stations. We have contracts with numerous suppliers. Coal is delivered to our units through a combination of rail, truck, barge or ocean shipments. |
|
| | | | In order to minimize emissions levels, our Bridgeport 3 and Hudson units use a specific type of coal obtained from Indonesia. If the supply from Indonesia or equivalent coal from other sources was not available for these facilities, their near-term operations would be adversely impacted. In the longer-term, additional material capital expenditures would be required to modify our Bridgeport 3 station to enable it to operate using a broader mix of coal sources. |
|
| | | | Recent volatility in the price of coal has prompted action by coal suppliers to attempt to renegotiate contracts. In particular, the Indonesian government requested that one of its domestic suppliers renegotiate its contracts with us to reflect more current market prices based on certain coal indexes. We reached an agreement with this supplier, which has resulted in an adjustment to the pricing, volumes and term of our contract. |
|
| | | | We are constructing pollution control equipment at Hudson and Mercer that is designed to provide more flexibility in the types of coal we can use at those stations. |
|
• | | | | Gas Supply—Natural gas is the primary fuel for the bulk of our load following and peaking fleet. We purchase gas directly from natural gas producers and marketers. These supplies are transported to New Jersey by four interstate pipelines with whom we have contracted. |
|
| | | | We have one billion cubic feet-per-day of firm transportation capacity under contract to meet the primary gas supply needs of our generation fleet and our obligations under the BGSS contract. We supplement that supply with a total storage capacity of 80 billion cubic feet. |
|
• | | | | Oil—Oil is used as the primary fuel for two load following steam units and nine combustion turbine peaking units and can be used as an alternate fuel by several load following and peaking units that have dual-fuel capability. Oil is purchased on the spot market and delivered by truck, barge, or pipeline. |
We expect to be able to meet the fuel supply demands of our customers and our own operations. However, the ability to maintain an adequate fuel supply could be affected by several factors not within our control, including changes in prices and demand, curtailments by suppliers, severe weather and the availability of feedstocks for the production of supplements to the natural gas supply. For additional information, see Item 7. MD&A—Overview of 2008 and Future Outlook and Note 11. Commitments and Contingent Liabilities.
8
Markets and Market Pricing
In the Northeast and Mid Atlantic U.S., there are three centralized, competitive electricity markets now being operated by ISO organizations:
|
• | | | | PJM Regional Transmission Organization—PJM conducts the largest centrally dispatched energy market in North America. It serves nearly 17% of the total U.S. population and has a peak demand of over 139,000 MW. The PJM Interconnection coordinates the movement of electricity through all or parts of Delaware, Illinois, Indiana, Kentucky, Maryland, Michigan, New Jersey, North Carolina, Ohio, Pennsylvania, Tennessee, Virginia, West Virginia and the District of Columbia. All of Power’s generating stations, except for the Bethlehem Energy Center (BEC) and the Bridgeport and New Haven stations, operate in PJM. |
|
• | | | | New York—The New York ISO is the market coordinator for New York State and is now responsible for managing the New York power pool and for administering its energy marketplace. This service area has a population of about 19 million and a peak demand of over 32,000 MW. Power’s BEC operates in New York. |
|
• | | | | New England—ISO New England is responsible for managing the New England Power Pool which covers Maine, New Hampshire, Vermont, Massachusetts, Connecticut and Rhode Island. This service area has a population of about 14 million and a peak demand of over 26,000 MW. Power’s Bridgeport and New Haven stations operate in Connecticut. |
The pricing of electricity varies by location in each of these markets. Depending upon our production and our obligations, these price differentials can serve to increase or decrease our profitability.
Commodity prices, such as electricity, gas, coal and emissions, as well as the availability of our diverse fleet of generation units to produce these products also have a considerable effect on our profitability. These commodity prices have been, and continue to be, highly volatile.
Since the majority of the power we generate is sourced from lower-cost nuclear and coal units, the rise in electric prices in recent years has yielded higher margins for us. Over a longer-term horizon, if these higher prices are sustained at the levels indicated by the current forward markets, we expect to have an attractive environment in which to contract for the sale of our anticipated output. However, higher prices also increase the cost of replacement power, thereby placing us at risk should any of our generating units fail to function effectively or otherwise become unavailable.
In addition to energy sales, we also earn revenue from capacity payments, through which we are compensated for committing that a portion of our capacity be available to the ISO for dispatch at its discretion. Capacity payments reflect the value to the ISO that at any time there is assurance that sufficient generating capacity is available to meet system reliability and energy requirements. Currently, there is sufficient capacity in the markets in which we operate. However, in certain areas of these markets there are transmission system constraints, raising concerns about reliability and creating a more acute need for capacity. Some generators, including us, announced the retirement of certain older generating facilities in these constrained areas due to insufficient revenues to support their continued operation. To enable the continued availability of these facilities, in separate instances, both PJM and the New England Power Pool (NEPOOL) agreed to enter into Reliability-Must-Run (RMR) contracts to compensate us for those units’ contribution to reliability. By providing for such a payment structure, the ISOs have acknowledged that these units provide a reliability service that is not otherwise compensated for in the existing markets.
Through the implementation of the Reliability Pricing Model (RPM) (the market design for capacity payments in PJM) and the Forward Capacity Market (FCM) (in NEPOOL), the markets in which we operate have changed to provide for a more structured, forward-looking, transparent pricing mechanism. This change is aimed at providing greater clarity regarding the value of capacity, resulting in an improved pricing signal to prospective investors in new generating facilities so as to encourage expansion of capacity to meet future market demands.
9
The prices to be received by generating units in PJM for capacity have been set through RPM base residual auctions based on the zone in which the generating unit is located. The majority of our PJM generating units are located in zones where the following prices have been set.
| | | | |
Delivery Year | | MW-day | | kW-yr |
June 2007 to May 2008 | | | $ | | 197.67 | | | | $ | | 72.15 | |
June 2008 to May 2009 | | | $ | | 148.80 | | | | $ | | 54.31 | |
June 2009 to May 2010 | | | $ | | 191.32 | | | | $ | | 69.83 | |
June 2010 to May 2011 | | | $ | | 174.29 | | | | $ | | 63.62 | |
June 2011 to May 2012 | | | $ | | 110.00 | | | | $ | | 40.16 | |
The zone in which our Keystone and Conemaugh units are located experienced fewer constraints on the system, resulting in prices lower than the prices for the rest of our generating assets in the first three auctions. This was not the case for the periods from June 2010 to May 2012 when identical prices were set for all zones.
The price that must be paid by an entity serving load in the various zones is also set through these auctions. These prices can be higher or lower than the prices noted in the table above due to import and export capability to and from lower-priced areas.
The majority of our generating capacity has experienced increases in value from the recent changes in market designs, resulting in significant additional revenue. We cannot determine the long-term sustainability of these market design changes.
On a prospective basis, many factors will affect the capacity pricing in PJM, including but not limited to:
|
• | | | | changes in load and demand; |
|
• | | | | changes in the available amounts of demand response resources; |
|
• | | | | changes in available generating capacity (including retirements, additions, derates, forced outage rates, etc.); |
|
• | | | | increases in transmission capability between zones; and |
|
• | | | | changes to the pricing mechanism, including increasing the potential number of zones to create more pricing sensitivity to changes in supply and demand, as well as other potential changes that PJM may propose over time. |
For additional information on our collection of RMR payments in PJM and NEPOOL and the RPM and FCM proposals, see Regulatory Issues—Federal Regulation.
Hedging Strategy
In an attempt to mitigate volatility in our results, we seek to contract in advance for a significant portion of our anticipated electric output, capacity and fuel needs. We seek to sell a portion of our anticipated lower-cost nuclear and coal-fired generation over a multi-year forward horizon, normally over a period of two to three years. We believe this hedging strategy increases stability of earnings.
Among the ways in which we hedge our output are: (1) sales at PJM West and (2) BGS contracts. The BGS-Fixed Price contract, a full requirements contract that includes energy and capacity, ancillary and other services, is awarded for three-year periods through an auction process managed by the New Jersey Board of Public Utilities (BPU). The volume of BGS contracts and the electric utilities our generation operations will serve vary from year to year. Pricing for the BGS contracts for recent and future periods by purchasing utility, including a capacity component, is as follows:
10
| | | | | | | | | | |
Load Zone ($/MWh) | | 2005-2008 | | 2006-2009 | | 2007-2010 | | 2008-2011 | | 2009-2012 |
PSE&G | | | $ | | 65.41 | | | | $ | | 102.51 | | | | $ | | 98.88 | | | | $ | | 111.50 | | | | $ | | 103.72 | |
Jersey Central Power and Light | | | $ | | 65.70 | | | | $ | | 100.44 | | | | $ | | 99.64 | | | | $ | | 114.09 | | | | $ | | 103.51 | |
Atlantic City Electric | | | $ | | 66.48 | | | | $ | | 103.99 | | | | $ | | 99.59 | | | | $ | | 116.50 | | | | $ | | 105.36 | |
Rockland Electric Company | | | $ | | 71.79 | | | | $ | | 111.14 | | | | $ | | 109.99 | | | | $ | | 120.49 | | | | $ | | 112.70 | |
A portion of our total generation capacity is allocated in the BGS contract through the BGS auctions. On average, tranches won in the BGS auctions require 100 MW to 120 MW of capacity on a daily basis. In addition, we hedged a portion of our generation capacity with forward capacity sales contracts.
The capacity prices we contracted for in the 2005-2008 BGS auctions and through some of the forward sales contracts were set prior to the implementation of RPM capacity auctions and therefore do not reflect the capacity prices determined more recently in the RPM capacity auctions. As a result, we were unable to fully realize such pricing for some of our generating capacity. As these older contracts expire, we expect revenues to increase as we realize the RPM auction pricing.
We have obtained price certainty for all of our PJM and New England capacity through May 2012 through these mechanisms.
To support our contracted sales of energy, we also entered into contracts for the future purchase and delivery of nuclear fuel and coal, which include some market-based pricing components. As of February 10, 2009, we had contracted for the following percentages of our nuclear and coal generation output and related fuel supplies for the next three years with modest amounts beyond 2011.
| | | | | | |
Nuclear and Coal Generation | | 2009 | | 2010 | | 2011 |
Generation Sales | | 100% | | 70%-80% | | 30%-50% |
Nuclear Fuel | | 100% | | 100% | | 100% |
Coal Supply and Transportation | | 90%-100% | | 15%-25% | | 0%-25% |
We take a more opportunistic approach in hedging our anticipated natural gas-fired generation. The generation from these units is less predictable, as these units are generally dispatched when aggregate market demand has exceeded the supply provided by lower-cost units. The natural gas-fired units have generally provided a lower contribution to our margin than either the nuclear or coal units. We purchase natural gas when gas-fired generation is required to supply forward sale commitments.
In a changing market environment, this hedging strategy may cause our realized prices to differ materially from current market prices. In a rising price environment, this strategy normally results in lower margins than would have been the case if little or no hedging activity had been conducted. Alternatively, in a falling price environment, this hedging strategy will tend to create margins higher than those implied by the then current market.
11
PSE&G
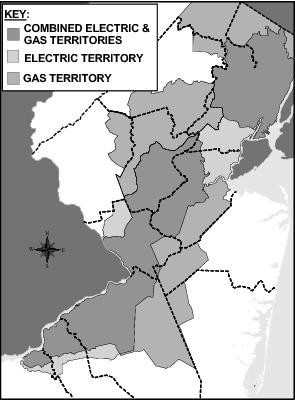
Our regulated public utility, PSE&G, distributes electric energy and gas to customers within a designated service territory running diagonally across New Jersey where approximately 5.5 million people, or about 70% of the State’s population, reside.
Products and Services
Our utility operations primarily earn margins through the transmission and distribution of electricity and the distribution of gas.
|
• | | | | Transmission—is the movement of electricity at high voltage from generating plants to substations and transformers, where it is then reduced to a lower voltage for distribution to homes, businesses and industrial customers. Our revenues for these services are based upon tariffs approved by the Federal Energy Regulatory Commission (FERC). |
|
• | | | | Distribution—is the delivery of electricity and gas to the retail customer’s home, business or industrial facility. Our revenues for these services are based upon tariffs approved by the BPU. |
We also earn margins through non-tariff competitive services, such as appliance repair services. The commodity supply portion of our utility business’ electric and gas sales are managed by BGS and BGSS suppliers. Pricing for those services are set by the BPU as a pass-through, resulting in no margin for our utility operations.
In addition to our current utility products and services, we have proposed several programs to improve efficiencies in customer energy use and increase the level of renewable generation to be constructed and owned by us including:
|
¡ | | | | a program approved in 2008 to help finance the installation of 30 MW of solar power systems throughout our electric service area, |
|
¡ | | | | a new proposal to develop 120 MW of solar power systems over five years, |
12
|
¡ | | | | a proposed energy efficiency stimulus initiative to encourage conservation and energy efficiency and to provide energy and money saving measures directly to businesses and families, and |
|
¡ | | | | a small scale carbon abatement program designed to promote energy efficiency. |
For additional information concerning these proposed programs and the components of our tariffs, see Regulatory Issues.
How PSE&G Operates
Transmission
In September 2008, we received FERC approval to use formula transmission rates, effective October 1, 2008, for our existing and future transmission investments. Formula-type rates provide a method of rate recovery where the transmission owner annually determines its revenue requirements through a fixed formula which considers Operations and Maintenance expenditures, Rate Base and capital investments and applies an approved return on equity (ROE). Currently, approved rates provide for a ROE of 11.68% on existing and new transmission investment. FERC has also approved incentive rate treatment for the Susquehanna-Roseland line, which when added to the approved base ROE, will yield a ROE of 12.93% for this particular project. We will also earn this ROE on Construction Work In Progress (CWIP) dollars spent on this project.
| | | | |
Transmission Statistics |
December 31, 2008 | | Historical Annual
Growth 2004-2008 |
Network Circuit Miles | | Billing Peak (MW) |
1,429 | | 10,654 | | 1.60% |
For more information on current transmission construction activities, see Regulatory Issues, Federal Regulation—Transmission Regulation.
Distribution
All electric and gas customers in New Jersey have the ability to choose their own electric energy and/or gas supplier. However, pursuant to BPU requirements, we serve as the supplier of last resort for electric and gas customers within our service territory who have no other supplier. As a practical matter, this means we are obligated to provide supply to a vast majority of residential customers and a smaller portion of commercial and industrial customers.
The percentage of customers we serve as compared to that served by third party suppliers has been reasonably stable over the past several years. As shown in the table below, we continue to provide the electric energy and gas supply for the majority of the customers in our service territory for the year ended December 31, 2008.
| | | | | | | | |
| | Electric | | Gas |
| | GWh | | % | | Million
Therms | | % |
PSE&G | | | | 33,702 | | | | | 77 | % | | | | | 2,139 | | | | | 62 | % | |
Third Party Suppliers | | | | 10,018 | | | | | 23 | % | | | | | 1,302 | | | | | 38 | % | |
| | | | | | | | |
Total Delivered | | | | 43,720 | | | | | 100 | % | | | | | 3,441 | | | | | 100 | % | |
| | | | | | | | |
13
Our load requirements were split during 2008 among residential, commercial and industrial customers, described below. We believe that we have all the non-exclusive franchise rights (including consents) necessary for our electric and gas distribution operations in the territory we serve.
| | | | |
Customer Type | | % of Sales |
| | Electric | | Gas |
Commercial | | | | 57 | % | | | | | 36 | % | |
Residential | | | | 31 | % | | | | | 60 | % | |
Industrial | | | | 12 | % | | | | | 4 | % | |
| | | | |
Total | | | | 100 | % | | | | | 100 | % | |
| | | | |
We procure the supply to meet our BGS obligations through two concurrent auctions authorized by the BPU for New Jersey’s total BGS requirement. These auctions take place annually in February. Results of these auctions determine which energy suppliers are authorized to supply BGS to New Jersey’s electric distribution companies (EDCs). Once validated by the BPU, electricity prices for BGS service are set.
BGSS is the mechanism approved by the BPU designed to recover all gas costs related to the supply for residential customers. BGSS filings are made annually by June 1 of each year, with an effective date of October 1. PSE&G has a full requirements contract through 2012 with Power to meet the supply requirements of our default service gas customers. Gas commodity costs under this contract are recovered from our customers. Any difference between rates charged under the BGSS contract and rates charged to our residential customers is deferred and collected or refunded through adjustments in future rates.
While our customer base has remained steady, electric load has been fairly flat and gas load has declined, as illustrated:
| | | | | | |
Electric and Gas Distribution Statistics |
| | | December 31, 2008 | | Historical Annual
Load Growth
2004-2008 |
| | Number of
Customers | | Electric Sales and Gas
Sold and Transported |
Electric | | | | 2.1 Million | | | 43,720 GWh | | | | 0.08 | % | |
Gas | | | | 1.7 Million | | | 3,441 Million Therms | | | | -3.50 | % | |
Markets and Market Pricing
There continues to be significant volatility in commodity prices. Such volatility can have a considerable impact on us since a rising commodity price environment results in higher delivered electric and gas rates for customers. This may result in decreased demand for both electricity and gas, increased regulatory pressures and greater working capital requirements as the collection of higher commodity costs may be deferred under our regulated rate structure. For additional information see Item 7. MD&A.
Energy Holdings
Through Energy Holdings, we own domestic generation outside of the Mid Atlantic region and own and manage passive energy-related investments. We are also pursuing an offshore wind project and a modest amount of solar and other renewable projects, primarily in our core markets.
Products and Services
We own 2,395 MW of domestic capacity in areas outside of the Mid Atlantic region, of which 2,000 MW comes from two 1,000 MW gas-fired, combined cycle generation facilities in Texas. The majority of our investments in international generation and distribution projects have been sold.
14
Our passive energy-related investments consist primarily of leveraged leases. As of December 31, 2008, the single largest lease investment represented 13% of total leveraged leases.
How Energy Holdings Operates
Approximately 37% of the expected output of our Texas facilities for 2009 has been sold via bilateral agreements. Additional bilateral sales for peak and off-peak services are expected to be signed as the year progresses. Any remaining uncommitted economic output will be offered in the Texas spot market. Included in these bilateral agreements is a 350 MW daily capacity call option at Odessa that expires on December 31, 2010.
In August 2008, we invested in a joint venture to further develop compressed air energy storage (CAES) technology. CAES technology stores energy in the form of compressed air by injection into underground caverns or above ground storage facilities which can then be released to generate electricity through specialized turbine equipment. This technology could be used to optimize an intermittent energy source, such as wind, by storing energy at night and releasing this stored energy during the day when customers need power. Our plan is to use the technology to develop CAES power plants and sell licenses to third parties to implement CAES technology.
In October 2008, the New Jersey Office of Clean Energy (OCE) awarded a $4 million grant to a joint venture owned equally by one of our subsidiaries and an unaffiliated private developer, to advance the development of a 350 MW wind farm to be located approximately 16 miles off the shore of southern New Jersey. An offshore wind farm has not yet been developed and constructed in the U.S. Numerous issues, including federal and state permitting, environmental impacts, power output sale arrangements, construction approach and expected maintenance costs, will need to be worked through in order to successfully develop such a project. If these issues are satisfactorily addressed and the joint venture decides to proceed, the wind farm could be fully operational in 2013.
Our leasing portfolio is designed to provide a fixed rate of return. Income on leveraged leases is recognized by a method which produces a constant rate of return on the outstanding investment in the lease, net of the related deferred tax liability, in the years in which the net investment is positive. Any gains or losses incurred as a result of a lease termination are recorded as Operating Revenues as these events occur in the ordinary course of business of managing the investment portfolio.
Leveraged lease investments involve three parties: an owner/lessor, a creditor and a lessee. In a typical leveraged lease financing, the lessor purchases an asset to be leased. The purchase price is typically financed 80% with debt provided by the creditor and the balance comes from equity funds provided by the lessor. The creditor provides long-term financing to the transaction secured by the property subject to the lease. Such long-term financing is non-recourse to the lessor and, with respect to our lease investments, is not presented in our Consolidated Balance Sheets.
The lessor acquires economic and tax ownership of the asset and then leases it to the lessee for a period of time no greater than 80% of its remaining useful life. As the owner, the lessor is entitled to depreciate the asset under applicable federal and state tax guidelines. The lessor receives income from lease payments made by the lessee during the term of the lease and from tax benefits associated with interest and depreciation deductions with respect to the leased property. The ability to realize these tax benefits is dependent on operating gains generated by our other operating subsidiaries and allocated pursuant to the consolidated tax sharing agreement between us and our operating subsidiaries. During 2008, we recorded after-tax charges of $490 million related to tax deductions previously claimed for certain of these leases that were recently disallowed by the Internal Revenue Service (IRS). See Note 11. Commitments and Contingent Liabilities for further discussion.
Lease rental payments are unconditional obligations of the lessee and are set at levels at least sufficient to service the non-recourse lease debt. The lessor is also entitled to any residual value associated with the leased asset at the end of the lease term. An evaluation of the after-tax cash flows to the lessor determines the return on the investment. Under GAAP, the lease investment is recorded net of non-recourse debt and income is recognized as a constant return on the net unrecovered investment.
15
For additional information on leases, including the credit, tax and accounting risks related to certain lessees, see Item 1A. Risk Factors, Item 7. MD&A—Results of Operations—Energy Holdings, Item 7A. Qualitative and Quantitative Disclosures About Market Risk—Credit Risk—Energy Holdings and Note 11. Commitments and Contingent Liabilities.
Markets and Market Pricing
Our generation business in Texas is a merchant generation business located in the Electric Reliability Council of Texas (ERCOT) market. In balancing energy and ancillary service markets, an ISO will generally dispatch the lowest bids first unless local transmission congestion requires units to be dispatched out of merit order. The price that all dispatched units receive is set by the last, or marginal bidder that is dispatched. Our Texas generation assets are combined cycle gas-fired generation units and generally have lower variable costs than less efficient single cycle gas and oil-fired generation units. As a result, during on-peak periods, the price of power in ERCOT is frequently set by generation units with higher variable costs than our Texas generation assets. Unlike the other markets in which we compete, ERCOT does not have a capacity market, and as a result, all generators are compensated solely through energy revenues and revenues for ancillary services, which are subject to substantial volatility as power prices fluctuate.
ERCOT has decided to delay a proposed transition from a zonal market to a nodal wholesale market until the fourth quarter of 2010 at the earliest. As proposed, the redesigned grid will consist of more than 4,000 nodes replacing the current four congestion management zones. The implementation of the new design is expected to deliver improved price signals, improved dispatch efficiencies and direct assignment of local congestion. We will continue to evaluate the potential impact this change will have on our Texas generation facilities once implemented.
COMPETITIVE ENVIRONMENT
Power
Various market participants compete with us and one another in buying and selling in wholesale power pools, entering into bilateral contracts and selling to aggregated retail customers. Our competitors include:
|
• | | | | merchant generators, |
|
• | | | | domestic and multi-national utility generators, |
|
• | | | | energy marketers, |
|
• | | | | banks, funds and other financial entities, |
|
• | | | | fuel supply companies, and |
|
• | | | | affiliates of other industrial companies. |
Our business is also under competitive pressure due to demand side management (DSM) and other efficiency efforts aimed at changing the quantity and patterns of usage by consumers which could result in a reduction in load requirements. A reduction in load requirements can also be caused by economic cycles and factors. It is also possible that advances in technology, such as distributed generation, will reduce the cost of alternative methods of producing electricity to a level that is competitive with that of most central station electric production. To the extent that additions to the transmission system relieve or reduce congestion in eastern PJM where most of our plants are located, our revenues could be adversely affected. In addition, pressures from renewable resources, such as wind and solar, could increase over time, especially if government incentive programs continue to grow.
We are also at risk if one or more states in which we operate should decide to turn away from competition and allow regulated utilities to continue to own or reacquire and operate generating stations in a regulated and potentially uneconomical manner, or to encourage rate-based generation for the construction of new base load units. This has occurred in certain states. The lack of consistent rules in energy markets can negatively impact the competitiveness of our plants. Also, regional inconsistencies in environmental regulations, particularly those related to emissions, have put some of our plants which are located in the
16
Northeast, where rules are more stringent, at an economic disadvantage compared to our competitors in certain Midwest states.
Also, environmental issues such as restrictions on carbon dioxide (CO2) emissions and other pollutants may have a competitive impact on us to the extent it is more expensive for our plants to remain compliant, thus affecting our ability to be a lower-cost provider compared to competitors without such restrictions.
PSE&G
The electric and gas transmission and distribution business has minimal risks from competitors. Our transmission and distribution business is minimally impacted when customers choose alternate electric or gas suppliers since we earn our return by providing transmission and distribution service, not by supplying the commodity. The demand for electric energy and gas by customers is affected by customer conservation, economic conditions, weather and other factors not within our control.
Energy Holdings
New additions of lower cost or more efficient generation capacity in Texas could make our plants in the region less economical in the future. A number of competitors have announced plans to build additional coal-fired and gas-fired generation capacity in ERCOT. Although it is not clear if this capacity will be built or, if so, what the economic impact will be, such additions could impact market prices and our competitiveness.
Over the past several years, substantial amounts of wind generation capacity have been constructed in ERCOT, particularly in western Texas, where our Odessa generation facility is located. At the end of 2008, ERCOT had approximately 8,000 MW of installed wind capacity. Given the favorable wind conditions in western Texas, these wind generation facilities are able to produce power during a substantial period of the year, resulting in an additional source of base load power in western Texas, especially during off-peak seasons.
While numerous competitors have announced plans to build substantial amounts of new wind generation capacity, an issue impacting the likelihood of these projects being built is the constrained amount of transmission capacity between western Texas, where wind generation units are typically sited but where power demand is relatively low, and the rest of Texas.
The Public Utility Commission of Texas (PUCT) has designated five Competitive Renewable Energy Zones in western Texas and the Texas Panhandle in an effort to address the constraint issue. The PUCT has requested that ERCOT develop transmission construction options within these zones that would allow for much greater levels of delivery of wind power from western Texas to customers throughout the ERCOT grid. Although it is not clear if these efforts at transmission expansion will be successful or, if so, what the economic impact will be, it is possible that substantial additional amounts of wind generation will be built in ERCOT as a result of such potential transmission expansion, which could impact market prices and our competitiveness.
EMPLOYEE RELATIONS
The following table provides summarized information about our employees as of December 31, 2008. We believe that we maintain satisfactory relationships with our employees.
| | | | | | | | |
Employees as of December 31, 2008 |
| | Power | | PSE&G | | Energy
Holdings | | Services |
Non-Union | | | | 1,126 | | | | | 1,231 | | | | | 112 | | | | | 1,032 | |
Union | | | | 1,412 | | | | | 4,838 | | | | | — | | | | | 98 | |
| | | | | | | | |
Total Employees | | | | 2,538 | | | | | 6,069 | | | | | 112 | | | | | 1,130 | |
| | | | | | | | |
Number of Union Groups | | | | 3 | | | | | 4 | | | | | n/a | | | | | 1 | |
Bargaining Agreement Expiration Year | | | | 2011 | | | | | 2011 | | | | | n/a | | | | | 2011 | |
17
REGULATORY ISSUES
Federal Regulation
FERC
The FERC is an independent federal agency that regulates the transmission of electric energy and gas in interstate commerce and the sale of electric energy and gas at wholesale pursuant to the Federal Power Act (FPA) and the Natural Gas Act. PSE&G and certain subsidiaries of Power and Energy Holdings are public utilities as defined by the FPA. By virtue of its regulation of (a) interstate electric and gas transmission and (b) wholesale sales of electricity and gas, the FERC has extensive oversight over “public utilities” as defined by the FPA. FERC approval is usually required when a “public utility” company seeks to: sell or acquire an asset that is regulated by the FERC (such as a transmission line or a generating station); collect costs from customers associated with a new transmission facility; charge a rate for wholesale sales under a contract or tariff; or engage in certain mergers and internal corporate reorganizations.
The FERC also regulates generating facilities known as qualifying facilities (QFs). QFs are cogeneration facilities that produce electricity and another form of useful thermal energy, or small power production facilities where the primary energy source is renewable, biomass, waste, or geothermal resources. QFs must meet certain ownership, operating and efficiency criteria established by the FERC. Through Energy Holdings, we own several QF plants. QFs are subject to many, but not all, of the same FERC requirements as public utilities.
For us, the major effects of FERC regulation fall into four general categories:
|
• | | | | Regulation of Wholesale Sales—Generation/Market Issues |
|
• | | | | Capacity Market Issues |
|
• | | | | Transmission Regulation |
|
• | | | | Compliance |
Regulation of Wholesale Sales—Generation/Market Issues
|
• | | | | Market Power—Under FERC regulations, public utilities must receive FERC authorization to sell power in interstate commerce. They can sell power at cost-based rates or apply to the FERC for authority to make market based rate (MBR) sales. For a requesting company to receive MBR authority, the FERC must first make a determination that the requesting company lacks market power in the relevant markets. The FERC requires that holders of MBR tariffs file an update every three years demonstrating that they continue to lack market power. |
|
| | | | PSE&G and certain subsidiaries of Power and Energy Holdings have received MBR authority from the FERC. Retention of MBR authority is critical to the maintenance of our generation business’ revenues. |
|
| | | | Under new MBR rules issued in 2007, the FERC may look at sub-markets to analyze whether a company possesses market power. Applying these new rules in October 2008, the FERC granted both PSE&G and PSEG Energy Resources & Trade LLC continued MBR authority and granted both PSEG Fossil LLC and PSEG Nuclear LLC initial MBR authority. |
|
• | | | | Cost-Based RMR Agreements—The FERC has permitted public utility generation owners to enter into RMR agreements that provide cost-based compensation to a generation owner when a unit proposed for retirement is asked to continue operating for reliability purposes. Our Hudson 1 generating station is currently operating under an RMR agreement which expires September 2010. However, pursuant to the request of PJM, we will be extending this agreement until September 2011. For additional information, see Note 11. Commitments and Contingent Liabilities. |
18
|
| | | | In NEPOOL, many owners of generation facilities have also filed for RMR treatment. We currently collect FERC-approved monthly payments for the Bridgeport Harbor Station Unit 2 and the New Haven Harbor Station. These agreements are scheduled to expire in June 2010. |
|
| | | | RMR treatment has enabled these units to continue to operate. Various parties have challenged the continuation of RMR payments in NEPOOL, and thus, there is risk that such payments may be terminated prior to the end of the contract terms. |
|
• | | | | Reactive Power—Reactive power encompasses certain ancillary services necessary to maintain voltage support and operate the system. In May 2008, we filed with FERC to increase our annual fixed revenues by $18 million to reflect our provision of reactive power support in PJM. In November 2008, FERC accepted our reactive power rate filing retroactive to May 2008. |
Capacity Market Issues
RPM is a locational installed capacity market design for the PJM region, including a forward auction for installed capacity. Under RPM, generators located in constrained areas within PJM are paid more for their capacity as an incentive to locate in areas where generation capacity is most needed. PJM’s RPM has been challenged in court.
In early 2006, certain interested market participants in New England agreed to a settlement that establishes the design of the region’s market for installed capacity and which is being implemented gradually over four years. Commencing in December 2006, all generators in New England began receiving fixed capacity payments that escalate gradually over the transition period. The market design consists of a forward-looking auction for installed capacity that is intended to recognize the locational value of generators on the system and contains incentive mechanisms to encourage generator availability during generation shortages. Capacity market rules in both PJM and in New England may change in the future.
Transmission Regulation
The FERC has exclusive jurisdiction to establish the rates and terms and conditions of service for interstate transmission. We currently have FERC-approved formula rates in effect to recover the costs of our transmission facilities. Under this formula, rates are put into effect in January of each year based upon our internal forecast of annual expenses and capital expenditures. Rates are then trued up the following year to reflect actual annual expenses/capital expenditures. Our allowed ROE is 11.68% for both existing and new transmission investments, and we have received incentive rates—affording a higher return on equity—for specific transmission investments.
|
• | | | | Transmission Expansion—In June 2007, PJM approved the construction of the Susquehanna-Roseland line, a new 500 kV transmission line intended to maintain the reliability of the electrical grid serving New Jersey customers. PJM assigned construction responsibility for the new line to us and PPL for the New Jersey and Pennsylvania portions of the project, respectively. The estimated cost of our portion of this construction project is approximately $750 million, and PJM has directed that the line be placed into service by June 2012. We have recently filed with the BPU to obtain authorization to construct the Susquehanna-Roseland line. For further discussion, see State Regulation—Energy Policy—Susquehanna-Roseland BPU Petition. |
|
| | | | Construction of the Susquehanna-Roseland line is contingent upon obtaining all necessary federal, state, municipal and landowner permits and approvals. The construction of the line has encountered local opposition. Should the line be cancelled for reasons beyond our control, we will be entitled to recover 100% of prudently-incurred abandonment costs. |
|
| | | | PJM has also approved the construction of a 500 kV transmission line running from Virginia through Maryland and Delaware and is still considering approval of the portion terminating in Salem Township, New Jersey. We will be responsible for constructing and operating a portion of this line, known as the Mid-Atlantic Pathway Project (MAPP), if approved. We have asked the FERC to approve a 150 basis point ROE adder for this project, 100% recovery of abandonment costs and the ability to transfer the project to an affiliate. Several state consumer advocates, including the New |
19
| | | | Jersey Division of Rate Counsel, have opposed the incentive rate filing and have requested that the FERC set the matter for hearing. This filing is pending at the FERC. |
|
| | | | In December 2008, PJM approved another transmission project, including two additional 500 kV transmission lines. The first would run from Branchburg to Roseland, and the second from Roseland to Hudson. These lines are still in the design phase. |
|
| | | | U.S. Department of Energy (DOE) Congestion Study—National Interest Electric Transmission Corridors and FERC Back-Stop Siting Authority—By virtue of the Energy Policy Act enacted by Congress in 2005, the DOE has the ability to designate transmission corridors in areas found to be critical congestion areas, which then gives the FERC the ability to site transmission projects within these corridors should certain events occur. |
|
| | | | In October 2007, the DOE acted to designate transmission corridors within these critical congestion areas. One of the designated corridors is the Mid-Atlantic Area National Corridor. Thus, entities seeking to build transmission within the Mid-Atlantic Area Corridor, which includes New Jersey, most of Pennsylvania and New York, may be able to use the FERC’s back-stop siting authority in the future under certain circumstances, if necessary, to site transmission, including with respect to the Susquehanna-Roseland line. On February 18, 2009, the United States Court of Appeals for the Fourth Circuit narrowed the scope of the FERC’s back-stop siting authority, which may lead to future legislative changes in this area. |
Compliance
|
• | | | | Reliability Standards—Congress has required the FERC to put in place, through the North American Electric Reliability Council (NERC), national and regional reliability standards to ensure the reliability of the U.S. electric transmission and generation system and to prevent major system blackouts. Many reliability standards have been developed and approved. Since these standards are mandatory and applicable to, among other entities, transmission owners and generation owners and operators, and thus several of our operating subsidiaries, we are obligated to comply with the standards and to ensure continuing compliance. In 2008, our Texas generation plants were audited for NERC Reliability Standards and were found to be in compliance. PSE&G was also audited for NERC Reliability Standards compliance in November 2008, and we are awaiting a final determination on the audit. |
|
• | | | | FERC Standards of Conduct—On October 16, 2008, FERC issued a revised rule governing the interaction between transmission provider employees and wholesale merchant employees, which revises FERC’s Standards of Conduct by abandoning the “corporate” separation approach to regulating these interactions and instead adopting an “employee function” approach, which focuses on an individual employee’s job functions in determining how the rules will apply. The effect of these rules will be to permit more affiliate communication with respect to corporate and strategic planning, to loosen restrictions on senior officers and directors and to permit necessary operational communications between those employees engaged in transmission system operations and planning and those employees engaged in generating plant operations. This rule became effective in November 2008, with full compliance required by the FERC during the first quarter of 2009. We expect to be able to comply with these new rules. |
Nuclear Regulatory Commission (NRC)
Our operation of nuclear generating facilities is subject to comprehensive regulation by the NRC, a federal agency established to regulate nuclear activities to ensure protection of public health and safety, as well as the security and protection of the environment. Such regulation involves testing, evaluation and modification of all aspects of plant operation in light of NRC safety and environmental requirements. Continuous demonstration to the NRC that plant operations meet requirements is also necessary. The NRC has the ultimate authority to determine whether any nuclear generating unit may operate. We anticipate filing for
20
extensions of operating licenses for the Salem and Hope Creek facilities in 2009. The current operating licenses of our nuclear facilities expire in the years shown below:
| | |
Unit | | Year |
Salem Unit 1 | | | | 2016 | |
Salem Unit 2 | | | | 2020 | |
Hope Creek | | | | 2026 | |
Peach Bottom Unit 2 | | | | 2033 | |
Peach Bottom Unit 3 | | | | 2034 | |
State Regulation
Since our operations are primarily located within New Jersey, our main state regulator is the BPU. The BPU is the regulatory authority that oversees electric and natural gas distribution companies in New Jersey. PSE&G is subject to comprehensive regulation by the BPU including, among other matters, regulation of retail electric and gas distribution rates and service and the issuance and sale of certain types of securities. BPU regulation can also have a direct or indirect impact on our power generation business as it relates to energy supply agreements and energy policy in New Jersey.
We are also subject to some state regulation in California, Connecticut, Hawaii, New Hampshire, New York, Pennsylvania and Texas due to our ownership of generation and transmission facilities in those states.
Rates
|
• | | | | Electric and Gas Base Rates—We must file electric and gas base rate cases with the BPU in order to change PSE&G’s base rates. The BPU also has authority to seek to adjust rates downward if it believes the rates are no longer just and reasonable. Under our current BPU Order, we may not seek new base rates to be effective prior to November 15, 2009. We also must file a joint electric and gas petition for any future base rate increases. We expect to file a joint electric and gas rate case by mid 2009 with a request that rates become effective in 2010. |
|
• | | | | Rate Adjustment Clauses—In addition to base rate determinations, we recover certain costs from customers pursuant to mechanisms, known as adjustment clauses. These permit, at set intervals, the flow-through of costs to customers related to specific programs, outside the context of base rate case proceedings. Recovery of these costs are subject to BPU approval. Costs associated with these programs are deferred when incurred and amortized to expense when recovered in revenues. Delays in the pass-through of costs under these clauses can result in significant changes in cash flow. Our SBC and NGC clauses are detailed in the following table: |
| | | | |
Rate Clause | | 2008 Revenue | | (Over) Under Recovered
Balance
as of December 31, 2008 |
| | | | Millions |
Energy Efficiency and Renewable Energy | | | $ | | 179 | | | | $ | | 9 | |
RAC | | | | 16 | | | | | 134 | |
USF | | | | 152 | | | | | 34 | |
Social Programs | | | | 33 | | | | | 32 | |
| | | | |
Total SBC | | | | 380 | | | | | 209 | |
NGC | | | | 59 | | | | | (9 | ) | |
| | | | |
Total | | | $ | | 439 | | | | $ | | 200 | |
| | | | |
|
| | | | Societal Benefits Charges (SBC)—The SBC is a mechanism designed to ensure recovery of costs associated with activities required to be accomplished to achieve specific government-mandated |
21
| | | | public policy determinations. The programs that are covered by the SBC (gas and electric) are energy efficiency and renewable energy programs, Manufactured Gas Plant RAC and the Universal Service Fund (USF). In addition, the electric SBC includes a Social Programs component. All components include interest on both over and under recoveries. |
|
| | | | Non-utility Generation Charge (NGC)—The NGC recovers the above market costs associated with the long-term power purchase contracts with non-utility generators approved by the BPU. |
|
| | | | Recent Rate Adjustments—USF/Lifeline—On October 21, 2008, we received an Order to reset rates for the USF and the Lifeline program to recover $85 million and $61 million for USF electric and gas, respectively and $28 million and $16 million for Lifeline electric and gas, respectively. The new rates were effective October 24, 2008. |
|
| | | | SBC/NGC—On December 8, 2008, the BPU issued its final order approving an electric SBC/NGC rate increase of $89.7 million on an annual basis and a gas SBC increase of $15.3 million. The new rates were effective December 9, 2008. As part of the order, we were required to write off $1.4 million of previously deferred SBC costs. |
|
| | | | On February 9, 2009, we filed a petition requesting a decrease in our electric SBC/NGC rates of $18.9 million and an increase in gas SBC rates of $3.7 million. This matter is expected to be transferred to the Office of Administrative Law (OAL) for potential evidentiary hearings. |
|
| | | | RAC—On October 3, 2008, the BPU issued an order approving a settlement and affirming recovery of our RAC 15 costs of $36 million incurred from August 1, 2006 through July 31, 2007. |
|
| | | | On December 1, 2008, we filed a RAC 16 petition with the BPU requesting an Order which would increase our current gas RAC rates by approximately $8.9 million on an annual basis and increase our current electric RAC rates by approximately $7.6 million on an annual basis. This matter has been transferred to the OAL for evidentiary hearings. |
Energy Supply
|
• | | | | BGS—New Jersey’s EDCs provide two types of BGS, the default electric supply service for customers who do not have a third party supplier. The first type, which represents about 80% of PSE&G’s load requirements, provides default supply service for smaller industrial and commercial customers and residential customers at seasonally-adjusted fixed prices for a three-year term (BGS-Fixed Price). These rates change annually on June 1, and are based on the average price obtained at auctions in the current year and two prior years. The second type provides default supply for larger customers. However, energy is priced at hourly PJM real-time market prices and the term of the contract is 12 months. |
|
| | | | All of New Jersey’s EDCs jointly procure the supply to meet their BGS obligations through two concurrent auctions authorized each year by the BPU for New Jersey’s total BGS requirement. These auctions take place annually in February. Results of these auctions determine which energy suppliers are authorized to supply BGS to New Jersey’s EDCs. PSE&G earns no margin on the provision of BGS. |
|
| | | | PSE&G’s total BGS-Fixed Price load is expected to be approximately 8,700 MW. Approximately one-third of this load is auctioned each year for a three-year term. Current pricing is as follows: |
| | | | | | | | |
| | 2006 | | 2007 | | 2008 | | 2009 |
36 Month Term Ending | | | | May 2009 | | | | | May 2010 | | | | | May 2011 | | | | | May 2012 | |
Load (MW) | | | | 2,882 | | | | | 2,758 | | | | | 2,840 | | | | | 2,840 | |
$ per kWh | | | $ | | 0.10251 | | | | $ | | 0.09888 | | | | $ | | 0.11150 | | | | $ | | 0.10372 | |
|
(a) | | | | Prices set in the February 2009 BGS Auction are effective on June 1, 2009 when the 36-month (May 2009) supply agreements expire. |
22
For additional information, see Note 5. Regulatory Assets and Liabilities and Note 11. Commitments and Contingent Liabilities.
| | | BGSS—BGSS is the mechanism approved by the BPU designed to recover all gas costs related to the supply for residential customers. BGSS filings are made annually by June 1 of each year, with an effective date of October 1. Revenues are matched with costs using deferral accounting, with the goal of achieving a zero cumulative balance by September 30 of each year. In addition, we have the ability to put in place two self-implementing BGSS increases on December 1 and February 1 of up to 5% and also may reduce the BGSS rate at any time. | |
| | | | PSE&G has a full requirements contract through 2012 with Power to meet the supply requirements of default service gas customers. Power charges PSE&G for gas commodity costs which PSE&G recovers from customers. Any difference between rates charged by Power under the BGSS contract and rates charged to PSE&G’s residential customers are deferred and collected or refunded through adjustments in future rates. PSE&G earns no margin on the provision of BGSS. |
|
| | | | In May 2008, PSE&G requested an increase in annual BGSS revenue of $376 million, excluding Sales and Use Tax, to be effective October 1, 2008. Since that time, due to the significant downward trend in wholesale natural gas prices, we filed two revisions to the BGSS increase, a revised Stipulation (increase of 14% or $267 million) and also a BGSS self-implementing decrease (5% or approximately $108 million). The increase in the BGSS-Residential Service Gas (RSG) rate became effective on October 3, 2008 and the decrease became effective on January 1, 2009. |
Energy Policy
|
• | | | | New Jersey Energy Master Plan (EMP)—New Jersey law requires that an EMP be developed every three years, the purpose of which is to ensure safe, secure and reasonably-priced energy supply, foster economic growth and development and protect the environment. The most recent EMP was finalized in October 2008. The plan identifies a number of the actions to improve energy efficiency, increase the use of renewable resources, ensure a reliable supply of energy and stimulate investment in clean energy technologies, including to: |
| | | maximize energy conservation and energy efficiency to reduce New Jersey’s projected energy use 20% by the year 2020; | |
¡ | | | | reduce prices by decreasing peak demand 5,700 MW by 2020; |
|
¡ | | | | strive to achieve 30% of the state’s electricity needs from renewable sources by 2020; |
|
¡ | | | | develop at least 3,000 MW of off-shore wind generation by 2020, |
|
¡ | | | | develop new low carbon-emitting, efficient power plants to help close the gap between the supply and demand of electricity; |
|
¡ | | | | invest in innovative clean energy technologies and businesses to stimulate the industry’s growth and green job development in New Jersey; |
|
¡ | | | | work with electric and gas utilities to develop individual utility master plans through 2020 to evaluate options to modernize the electrical grid; |
|
¡ | | | | establish a state energy council; and |
|
¡ | | | | conduct a complete review of the BGS auction process. |
Consistent with the EMP, we have proposed several programs in filings with the BPU addressing different components of the EMP goals, and have submitted a number of strategies designed to improve efficiencies in customer use and increase the level of renewable generation in the State.
|
• | | | | Solar Initiative—In 2007, we filed a plan with the BPU designed to spur investment in solar power in New Jersey and meet energy goals under the EMP. This program received final BPU approval and a written BPU order in April 2008. Under the plan, our utility business will invest |
23
| | | | approximately $105 million over two years in a pilot program to help finance the installation of 30 MW of solar systems throughout its electric service area by providing loans to customers for the installation of solar photovoltaic systems on their premises. The borrowers can repay the loans over a period of either 10 years (for residential customer loans) or 15 years by providing us with solar renewable energy certificates. Borrowers will also have the option to repay the loans with cash. The program is designed to fulfill approximately 50% of the BPU’s Renewal Portfolio Standard requirements in our utility service area in May 2009 and May 2010. |
|
| | | | In February 2009, we filed a new solar initiative with the BPU. This initiative is called the Solar 4 All Program. Through this program, we seek to invest approximately $773 million to develop 120 MW of solar photovoltaic (PV) systems over a five year horizon. The program consists of four segments: a centralized PV system (35MW); solar systems installed in distribution system poles (40MW), roof-mounted systems installed on local government buildings in our electric service territory (43MW) and roof-mounted solar systems installed in New Jersey Housing and Mortgage Finance Agency affordable housing communities (2MW). This program is under review by the BPU. |
|
• | | | | Carbon Abatement Program—In June 2008, we filed a petition for approval for a small scale carbon abatement program with the BPU, under which we propose to invest up to $46 million over four years in programs across specific customer segments. The program is designed to support EMP goals and promote energy efficiency. The BPU approved a settlement with new rates going into effect on January 1, 2009. |
|
• | | | | Demand Response (DR)—In July 2008, the BPU directed that DR programs be implemented by each of New Jersey’s electric utilities beginning in June 2009. In its order, the BPU established target goals to increase DR by 300 MW for the first year of the program and a total increase of 600 MW by the end of the third year and stated that 55% of the target would be our responsibility. In response, we filed our program proposal and identified $93.4 million of demand response investment over a period of four years, seeking full recovery of the program costs, including a return on our investment, through rates. |
|
| | | | In September 2008, the BPU voted to defer action on our program (and the proposed programs of the other New Jersey utilities) and to reconvene its working group which will focus on enrolling, with additional incentives, more New Jersey-based demand response in already-existing programs of PJM, in which our role would be limited. It is possible that the BPU may still act to approve all, or at least a portion, of our filing, but the outcome of this proceeding cannot be predicted. |
|
| | | | On December 10, 2008, the BPU issued an order directing each of the State’s electric utilities to implement a one-year demand response program in their respective service territories. The targeted amount of demand response for this program is 600 MW statewide, with a budget of $4.9 million, which represents an incentive in addition to PJM’s existing DR service programs. The utilities’ role is limited to collecting the program costs, plus administrative costs, through rates, and making the incentive payment to the DR service providers after PJM and the BPU direct the utilities to do so. |
|
• | | | | Energy Efficiency Economic Stimulus Program—On January 21, 2009, we filed for approval of an energy efficiency economic stimulus program, under which we proposed to spend $190 million to encourage conservation and create green jobs. This filing is in direct response to a call from New Jersey’s Governor to invigorate the economy as part of the State’s economic assistance and recovery plan. The Economic Energy Efficiency Stimulus Program filing was made under New Jersey’s Regional Greenhouse Gas Initiative (RGGI) legislation, which encourages utilities to invest in conservation and energy efficiency programs as part of their regulated business. |
|
| | | | The new expanded energy efficiency initiative offers programs for various targeted customer segments. Sub-programs for residential homes and small businesses in Urban Enterprise Zone municipalities, multi-family buildings, hospitals, data centers and governmental entities provide audits at no cost to identify energy efficiency measures. Customers could be eligible for incentives toward the installation of the energy efficiency measures. Other components include a program that provides |
24
| | | | funding for new technologies and demonstration projects, and a program to encourage non-residential customers to reduce energy use through improvements in the operation and maintenance of their facilities. |
|
• | | | | Capital Economic Stimulus Infrastructure Program—On January 21, 2009, we also filed for approval of a capital economic stimulus infrastructure investment program and an associated cost recovery mechanism. Under this initiative, we propose to undertake $698 million of capital infrastructure investments for electric and gas programs over a 24 month period. These investments would be subject to deferred accounting and recovered through a new Capital Adjustment Mechanism. The goal of these accelerated capital investments is to help improve the State’s economy through the creation of new employment opportunities. While this filing was made in response to the Governor of New Jersey’s proposal to help revive the economy through job growth and capital spending, the outcome of this filing cannot be predicted at this time. |
|
• | | | | Susquehanna-Roseland BPU Petition—In January 2009, we filed a Petition with the BPU seeking authorization from the BPU to construct the New Jersey portion of the Susquehanna-Roseland line. The New Jersey portion of the line spans approximately 45 miles and crosses through 16 municipalities. The Petition seeks a finding from the BPU that municipal land use and zoning ordinances of these municipalities do not apply to this line. In this Petition and accompanying testimony, we explain the need for the line—that it is required to address 23 PJM-identified reliability violations—and we address issues such as engineering and design, route selection, construction impacts, property rights, environmental impacts and public outreach. The first prehearing conference in this proceeding is scheduled for February 26, 2009, at which time a procedural schedule will be established. |
Compliance
The BPU has statutory authority to conduct periodic audits of our utility’s operations and its compliance with applicable affiliate rules and competition standards. The BPU has retained consultants to conduct periodic combined management/competitive service audits of New Jersey utilities and we could be subject to various audits in 2009.
|
• | | | | Gas Purchasing Strategies Audit—In 2007, the BPU engaged a contractor to perform an analysis of the gas purchasing practices and hedging strategies of the four New Jersey gas distribution companies (GDCs). The primary focus was to examine and compare the financial and physical hedging policies and practices of each company and to provide recommendations for improvements to these policies and practices. The audit included a detailed review of gas hedging practices, including discovery and management interviews. A report including findings and recommendations for all four GDCs and each GDC’s comments and suggestions was provided to Rate Counsel who also provided comments. On February 24, 2009, the BPU accepted the final audit report and recommended that the findings be used as a starting point for future changes to each GDC’s hedging program. |
|
• | | | | Deferral Audit—The BPU Energy and Audit Division conducts audits of deferred balances. A draft Deferral Audit—Phase II report relating to the 12-month period ended July 31, 2003 was released by the consultant to the BPU in April 2005. For additional information regarding PSE&G’s Deferral Audit, see Item 1A. Risk Factors and Note 11. Commitments and Contingent Liabilities. |
|
• | | | | RAC Audit—On February 4, 2008, the BPU’s Division of Audits commenced a review of the RAC program for the RAC 12, 13 and 14 periods encompassing August 1, 2003 through July 31, 2006. Total RAC costs associated with this period were $83 million. The BPU has not issued a final order or report. We cannot predict the final outcome of this audit. |
ENVIRONMENTAL MATTERS
Our operations are subject to environmental regulation by federal, regional, state and local authorities. These environmental laws and regulations impact the manner in which our operations currently are conducted as
25
well as impose costs on us to address the environmental impacts of historical operations that may have been in full compliance with the legal requirements in effect at the time those operations were conducted.
Areas of regulation may include, but are not limited to:
|
• | | | | air pollution control, |
|
• | | | | water pollution control, |
|
• | | | | hazardous substance liability, |
|
• | | | | fuel and waste disposal, and |
|
• | | | | climate change. |
To the extent that environmental requirements are more stringent and compliance more costly in certain states where we operate compared to other states that are part of the same market, such rules may impact our ability to compete within that market. Due to evolving environmental regulations, it is difficult to project expected costs of compliance and their impact on competition. For additional information related to environmental matters, including anticipated expenditures for installation of pollution control equipment, hazardous substance liabilities and fuel and waste disposal costs, see Item 1A. Risk Factors, Item 3. Legal Proceedings and Note 11. Commitments and Contingent Liabilities.
Air Pollution Control
The Clean Air Act and its regulations require controls of emissions from sources of air pollution and also impose record keeping, reporting and permit requirements. Facilities that we operate or in which we have an ownership interest are subject to these federal requirements, as well as requirements established under state and local air pollution laws applicable where those facilities are located. Capital costs of complying with air pollution control requirements through 2010 are included in our estimate of construction expenditures in Item 7. MD&A—Capital Requirements.
The New Jersey Air Pollution Control Act requires that certain sources of air emissions obtain operating permits issued by the New Jersey Department of Environmental Protection (NJDEP). All of our generating facilities in New Jersey are required to have such operating permits. Our generating facilities in New York, Connecticut, Pennsylvania and Texas are under jurisdiction of their respective state’s environmental agencies. The costs of compliance associated with any new requirements that may be imposed by these permits in the future are not known at this time and are not included in capital expenditures, but may be material.
|
• | | | | SO2, NOx and Particulate Matter Emissions—Since January 1, 2000 the Clean Air Act set a cap on SO2 emissions from affected units and allocates SO2 allowances to those units with the stated intent of reducing the impact of acid rain. Generation units with emissions greater than their allocations can obtain allowances from sources that have excess allowances. We do not expect to incur material expenditures to continue complying with the acid rain program. |
|
| | | | The U.S. Environmental Protection Agency (EPA) published the final Clean Air Interstate Rule (CAIR) that identified 28 states and the District of Columbia as contributing significantly to the levels of fine particulates and/or eight-hour ozone air quality in downwind states. New Jersey, New York, Pennsylvania, Texas and Connecticut were among the states the EPA listed in the CAIR. Based on state obligations to address interstate transport of pollutants under the Clean Air Act, the EPA had proposed a two-phased emission reduction program with Phase 1 beginning in 2009 for NOx and 2010 for SO2 and Phase 2 beginning in 2015. The EPA is recommending that the program be implemented through a cap-and-trade program, although states are not required to proceed in this manner. |
|
| | | | In December 2008, the U.S. Court of Appeals for the District of Columbia Circuit remanded CAIR back to the EPA to fix the flaws within CAIR. CAIR will remain in effect until the EPA issues new rules. |
26
|
| | | | The remand allows the NOxtrading program in CAIR to commence in 2009, with the annual NOxcap-and-trade program starting on January 1, 2009 (NJ, NY, PA, TX), and the Ozone season NOxcap-and-trade program starting May 1, 2009 (NJ, NY, CT, PA) in a separate and distinct cap- and-trade program. It is anticipated that, in aggregate, we will be net buyers of annual NOxallowances but will likely be allocated sufficient allowances to satisfy Ozone season NOxemissions. At recent market prices of annual NOx allowances, the cost of our estimated shortfall requirement of 3,000 allowances is approximately $10 million for 2009. The future direction of the market is unclear due to the recent court ruling and pending new administration leadership. The final cost of compliance is uncertain due to market instability. |
|
| | | | If the SO2 part of CAIR is initiated on January 1, 2010, the financial impact to us is anticipated to be minimal due to the surplus allowances banked from the acid rain program that can be used to satisfy CAIR obligations. |
Water Pollution Control
The Federal Water Pollution Control Act (FWPCA) prohibits the discharge of pollutants to waters of the U.S. from point sources, except pursuant to a National Pollutant Discharge Elimination System (NPDES) permit issued by the EPA or by a state under a federally authorized state program. The FWPCA authorizes the imposition of technology-based and water quality-based effluent limits to regulate the discharge of pollutants into surface waters and ground waters. The EPA has delegated authority to a number of state agencies, including those in New Jersey, New York, Connecticut and Texas, to administer the NPDES program through state acts. We also have ownership interests in facilities in other jurisdictions that have their own laws and implement regulations to control discharges to their surface waters and ground waters that directly govern our facilities in those jurisdictions.
The EPA promulgated regulations under FWPCA Section 316(b), which require that cooling water intake structures reflect the best technology available (BTA) for minimizing adverse environmental impact. The Phase II rule covering large existing power plants became effective in 2004. The Phase II regulations provided five alternative methods by which a facility can demonstrate that it complies with the requirement for best technology available for minimizing adverse environmental impacts associated with cooling water intake structures.
In January 2007, the U.S. Court of Appeals for the Second Circuit issued a decision that remanded major portions of the regulations and determined that Section 316(b) of the Clean Water Act does not support the use of restoration and the site-specific cost-benefit test. The court instructed the EPA to reconsider the definition of best technology available without comparing the costs of the best performing technology to its benefits. Prior to this decision, we had used restoration and/or a site-specific cost-benefit test in applications we had filed to renew the permits at our once-through cooled plants, including Salem, Hudson and Mercer. Although the rule applies to all of our electric generating units that use surface waters for once-through cooling purposes, the impact of the rule and the decision of the court cannot be determined at this time.
The U.S. Supreme Court granted the request of industry petitioners, including us, to review the question of whether Section 316(b) of the FWPCA allows the EPA to compare costs with benefits in determining the “best technology available” for minimizing adverse environmental impact at cooling water intake structures. It is anticipated that the U.S. Supreme Court will render a decision before the end of its 2008-2009 term.
The decision could have a material impact on our ability to renew NPDES permits at our larger once-through cooled plants, including Salem, Hudson, Mercer, Bridgeport and possibly Sewaren and New Haven, without making significant upgrades to our existing intake structures and cooling systems. The costs of those upgrades to one or more of our once-through cooled plants could be material and would require economic review to determine whether to continue operations.
Hazardous Substance Liability
Because of the nature of our businesses, including the production and delivery of electricity, the distribution of gas and, formerly, the manufacture of gas, various by-products and substances are or were produced or
27
handled that contain constituents classified by federal and state authorities as hazardous. Federal and state laws impose liability for damages to the environment from hazardous substances. This liability can include obligations to conduct an environmental remediation of discharged hazardous substances as well as monetary payments, regardless of the absence of fault and the absence of any prohibitions against the activity when it occurred, as compensation for injuries to natural resources.
|
• | | | | Site Remediation—The Federal Comprehensive Environmental Response, Compensation and Liability Act of 1980 (CERCLA) and the New Jersey Spill Compensation and Control Act (Spill Act) require the remediation of discharged hazardous substances and authorize the EPA, the NJDEP and private parties to commence lawsuits to compel clean-ups or reimbursement for clean-ups of discharged hazardous substances. The clean-ups of hazardous substances can be more complicated and the costs higher when the hazardous substances are in a body of water. |
|
• | | | | Natural Resource Damages—CERCLA and the Spill Act authorize federal and state trustees for natural resources to assess damages against persons who have discharged a hazardous substance, causing an injury to natural resources. Pursuant to the Spill Act, the NJDEP requires persons conducting remediation to characterize injuries to natural resources and to address those injuries through restoration or damages. The NJDEP adopted regulations concerning site investigation and remediation that require an ecological evaluation of potential damages to natural resources in connection with an environmental investigation of contaminated sites. The NJDEP also issued guidance to assist parties in calculating their natural resource damage liability for settlement purposes, but has stated that those calculations are applicable only for those parties that volunteer to settle a claim for natural resource damages before a claim is asserted by the NJDEP. We are currently unable to assess the magnitude of the potential financial impact of this regulatory change. |
Fuel and Waste Disposal
|
• | | | | Nuclear Fuel Disposal—The federal government has entered into contracts with the operators of nuclear power plants for transportation and ultimate disposal of spent nuclear fuel. To pay for this service, nuclear plant owners are required to contribute to a Nuclear Waste Fund. The DOE has announced that it does not expect a facility for such purpose to be available earlier than 2017. |
|
| | | | Spent nuclear fuel generated in any reactor can be stored in reactor facility storage pools or in Independent Spent Fuel Storage Installations located at reactors or away-from reactor sites for at least 30 years beyond the licensed life for the reactor. We have an on-site storage facility that is expected to satisfy Salem 1’s, Salem 2’s and Hope Creek’s storage needs through the end of their current licenses as well as storage needs over the units’ anticipated 20 year license extensions. Exelon Generation has advised us that it has an on-site storage facility that will satisfy Peach Bottom’s storage requirements until at least 2014. |
|
• | | | | Low Level Radioactive Waste—As a by-product of their operations, nuclear generation units produce low level radioactive waste. Such waste includes paper, plastics, protective clothing, water purification materials and other materials. These waste materials are accumulated on site and disposed of at licensed permanent disposal facilities. New Jersey, Connecticut and South Carolina have formed the Atlantic Compact, which gives New Jersey nuclear generators continued access to the Barnwell waste disposal facility which is owned by South Carolina. We believe that the Atlantic Compact will provide for adequate low level radioactive waste disposal for Salem and Hope Creek through the end of their current licenses including full decommissioning, although no assurances can be given. There are on-site storage facilities for Salem, Hope Creek and Peach Bottom, which we believe have the capacity for at least five years of temporary storage for each facility. |
Climate Change
In response to global climate change, many states, primarily in the Northeastern U.S., have developed state-specific and regional legislative initiatives to stimulate national climate legislation through CO2emission reductions in the electric power industry. Ten Northeastern states, including New Jersey, New York and Connecticut, have signed a memorandum of understanding establishing the RGGI intended to cap and reduce
28
CO2 emissionsin the region. A model rule to reflect the memorandum of understanding was established and, in general, states adopted the elements of the model rule into state-specific rules to enable the RGGI regulatory mandate in each state.
States’ rules require the creation of a CO2 allowance allocation and/or auction whereby generators would be expected to receive through allocation, or purchase through an auction, CO2 allowances corresponding to each facility’s emissions. The first two CO2 emissions allowance auctions under RGGI were held in September and December 2008, resulting in prices of $3.07 and $3.38 per allowance, respectively. We anticipate that our 2009 generation would require purchases of approximately 16 million allowances at a total estimated cost of approximately $60 million at recent market prices.
New Jersey adopted the Global Warming Response Act in 2007, which calls for stabilizing its greenhouse gas emissions to 1990 levels by 2020, followed by a further reduction of greenhouse emissions to 80% below 2006 levels by 2050. To reach this goal, the NJDEP, the BPU, other state agencies and stakeholders are required to evaluate methods to meet and exceed the emission reduction targets, taking into account their economic benefits and costs.
In January 2008, additional legislation was enacted authorizing the NJDEP to sell, exchange, retire, assign, allocate or auction allowances from greenhouse gas emission reductions and set forth the procedural requirements to be followed by the NJDEP if allowances are auctioned. Auction proceeds would be used to provide grants and other forms of assistance for the purpose of energy efficiency, renewable energy and new high efficiency generation to stimulate or reward investment in the development of innovative CO2 reduction or avoidance technologiesand stewardship of New Jersey’s forests and tidal marshes. The BPU allows an electric or gas public utility to offer programs for energy efficiency, conservation and Class I renewables and to recover associated costs, as well as a return on investment, in rates. The law further provides that the BPU shall adopt an emissions portfolio standard or other regulatory mechanism, to mitigate “leakage” by July 1, 2009, unless New Jersey’s Attorney General determines that this will unconstitutionally burden interstate commerce or would be preempted by federal law.
Absent the implementation of any mitigation mechanisms, the operations of plants within the RGGI region are likely to be reduced since the added costs to reduce CO2 emissions would increase operating costs making the less expensive facilities outside the RGGI region more likely to be dispatched.
On January 29, 2009, an owner of an electric generating unit in New York filed a complaint in New York state court challenging the legality of New York’s implementation of RGGI under both State and Federal law. The outcome of this litigation cannot be predicted, but could impact the continued implementation of RGGI in New York and potentially the RGGI region.
The new legislation also authorizes the BPU to require the disclosure on customer bills of the environmental characteristics of the delivered energy, to develop an interim renewable energy portfolio standard, a requirement for net metering and electric and gas energy efficiency portfolio standards.
A federal program that would impose uniform requirements on all sources of greenhouse gas emissions has not been implemented, thereby allowing for state and regional programs that may establish requirements that impose different costs in the markets where we compete.
In 2007, the U.S. Supreme Court issued a decision stating that the EPA has authority to regulate greenhouse gas emissions from new motor vehicles as air pollutants. This decision could have a future impact on us if the Supreme Court’s opinion or the section of the Clean Air Act relied upon by the Supreme Court in its decision is found to be supportive of regulating CO2 from other sources, including generation units, and it was applied by the EPA to existing regulatory programs under the Clean Air Act applicable to air emissions from our facilities.
The outcome of global climate change initiatives cannot be determined; however, adoption of stringent CO2 emissions reduction requirements in the Northeast, including the potential allocation of allowances to our facilities and the prices of allowances available through auction, could materially impact our operations. The financial impact of a requirement to purchase allowances for emissions of CO2 would be greatest on coal-
29
fired generating unitsbecause they typically have the highest CO2 emission rate and thereby the need to purchase the most allowances. Gas-fired units would require fewer allowances and nuclear units would not need any allowances. Further, any addition of CO2 limit requirements under a national program, either through existing authority under the Clean Air Act, or under other legislative authority, could impose an additional financial impact on our fossil generation activities beyond that imposed by state and regional programs, such as RGGI. It is premature to determine the positive or negative financial impact of a future federal climate change program because it is difficult to determine the effect of such program on the dispatch of our electric generation units compared to the dispatch of other power generating companies, particularly those which may have a larger carbon footprint.
SEGMENT INFORMATION
Financial information with respect to our business segments is set forth in Note 20. Financial Information by Business Segment.
ITEM 1A. RISK FACTORS
The following factors should be considered when reviewing our businesses. These factors could have an adverse impact on our financial position, results of operations or net cash flows and could cause results to differ materially from those expressed elsewhere in this document.
The factors discussed in Item 7. MD&A may also adversely affect our results of operations and cash flows and affect the market prices for our publicly traded securities. While we believe that we have identified and discussed the key risk factors affecting our business, there may be additional risks and uncertainties that are not presently known or that are not currently believed to be significant.
We are subject to comprehensive regulation by federal, state and local regulatory agencies that affects, or may affect, our business.
We are subject to regulation by federal, state and local authorities. Changes in regulation can cause significant delays in or materially affect business planning and transactions and can materially increase our costs. Regulation affects almost every aspect of our businesses, such as our ability to:
|
• | | | | Obtain fair and timely rate relief—Our utility’s base rates for electric and gas distribution are subject to regulation by the BPU and are effective until a new base rate case is filed and concluded. In addition, limited categories of costs such as fuel are recovered through adjustment clauses that are periodically reset to reflect current costs. Our transmission assets are regulated by the FERC and costs are recovered through rates set by the FERC. Inability to obtain a fair return on our investments or to recover material costs not included in rates would have a material adverse effect on our business. |
|
• | | | | Obtain required regulatory approvals—The majority of our businesses operate under MBR authority granted by FERC. FERC has determined that our subsidiaries do not have market power and MBR rules have been satisfied. Failure to maintain MBR eligibility, or the effects of any severe mitigation measures that may be required if market power was re-evaluated in the future, could have a material adverse effect on us. |
|
| | | | We may also require various other regulatory approvals to, among other things, buy or sell assets, engage in transactions between our public utility and our other subsidiaries, and, in some cases, enter into financing arrangements, issue securities and allow our subsidiaries to pay dividends. Failure to obtain these approvals could materially adversely affect our results of operations and cash flows. |
|
• | | | | Comply with regulatory requirements—There are standards in place to ensure the reliability of the U. S. electric transmission and generation system and to prevent major system black-outs. These standards apply to all transmission owners and generation owners and operators. We are periodically audited for compliance. FERC can impose penalties up to $1 million per day per violation. In |
30
| | | | addition, the FERC requires compliance with all of its rules and orders, including rules concerning Standards of Conduct, market behavior and anti-manipulation rules, interlocking directorate rules and cross-subsidization. |
|
| | | | The BPU conducts periodic combined management/competitive service audits of New Jersey utilities related to affiliate standard requirements, competitive services, cross-subsidization, cost allocation and other issues. We expect to be subject to management audits in 2009 and, while we believe that we are in compliance, we cannot predict the outcome of any audit. |
There are two pending issues at the BPU stemming from the restructuring of the utility industry in New Jersey several years ago.
|
• | | | | Treatment of previously approved stranded costs—Our utility securitized $2.525 billion of generation and generation-related costs pursuant to an irrevocable, non-bypassable BPU financing order. The authority of the BPU to issue its order was upheld by the New Jersey Supreme Court in 2001. An action seeking injunctive relief from our continued collection of the related charges, as well as recovery of amounts previously charged and collected, was filed in 2007 in the New Jersey Supreme Court. This action was summarily dismissed by that Court, and affirmed on appeal in February 2009. For additional information, see Legal Proceedings. We cannot predict the outcome of the court proceeding or of a related action pending at the BPU. |
|
• | | | | Market Transition Charge (MTC) collected during the four-year industry transition period—The BPU has raised certain questions with respect to the reconciliation method we employed in calculating the over-recovery of MTC and other charges during the four-year transition period from 1999 to 2003. The amount in dispute was $114 million, which if required to be refunded to customers with interest through December 2008, would be $140 million. In January 2009, the Administrative Law Judge (ALJ) issued a decision which upheld our central contention that the 2004 BPU order approving the Phase I settlement resolved the issues now raised by the Staff and Advocate, and that these issues should not be subject to re-litigation in respect of the first three years of the transition period. The ALJ’s decision states that the BPU could elect to convene a separate proceeding to address the fourth and final year reconciliation of MTC recoveries. The amount in dispute with respect to this Phase II period is approximately $50 million. |
|
| | | | Exceptions to the ALJ’s decision have been filed by the parties. The BPU may choose to accept, modify or reject the ALJ’s decision in reaching its final decision in the case. We do not expect a final BPU order before March 2009 and cannot predict the outcome of this proceeding. |
Certain of our leveraged lease transactions may be successfully challenged by the IRS, which would have a material adverse effect on our taxes, operating results and cash flows.
We have received Revenue Agent’s Reports from the IRS with respect to its audit of our federal corporate income tax returns for tax years 1997 through 2003, which disallowed all deductions associated with certain leveraged lease transactions. In addition, the IRS Reports proposed a 20% penalty for substantial understatement of tax liability.
As of December 31, 2008, $1.2 billion would become currently payable if we conceded all of the deductions taken through that date. We deposited a total of $180 million to defray potential interest costs associated with this disputed tax liability and may make additional deposits in 2009. As of December 31, 2008, penalties of $151 million could also become payable if the IRS is successful in its claims. If the IRS is successful in a litigated case consistent with the positions it has taken in a generic settlement offer recently proposed to us, an additional $130 million to $150 million of tax would be due for tax positions through December 31, 2008.
31
We are subject to numerous federal and state environmental laws and regulations that may significantly limit or affect our business, adversely impact our business plans or expose us to significant environmental fines and liabilities.
We are subject to extensive environmental regulation by federal, state and local authorities regarding air quality, water quality, site remediation, land use, waste disposal, aesthetics, impact on global climate, natural resources damages and other matters. These laws and regulations affect the manner in which we conduct our operations and make capital expenditures. Future changes may result in increased compliance costs.
Delay in obtaining, or failure to obtain and maintain any environmental permits or approvals, or delay or failure to satisfy any applicable environmental regulatory requirements, could:
|
• | | | | prevent construction of new facilities, |
|
• | | | | prevent continued operation of existing facilities, |
|
• | | | | prevent the sale of energy from these facilities, or |
|
• | | | | result in significant additional costs which could materially affect our business, results of operations and cash flows. |
In obtaining required approvals and maintaining compliance with laws and regulations, we focus on several key environmental issues, including:
|
• | | | | Concerns over global climate change could result in laws and regulations to limit CO2 emissions or other “greenhouse” gases produced by our fossil generation facilities—Federal and state legislation and regulation designed to address global climate change through the reduction of greenhouse gas emissions could materially impact our fossil generation facilities. Recent legislation enacted in New Jersey establishes aggressive goals for the reduction of CO2 emissions over a 40-year period. Therecould be material modifications at a significant cost required for continued operation of our fossil generation facilities, including the potential need to purchase CO2 emission allowances. Such expenditures could materially affect the continued economic viability of one or more such facilities. Multiple states, primarily in the Northeastern U.S., are developing or have developed state-specific or regional legislative initiatives to stimulate CO2 emissions reductions in the electric power industry. The RGGI began in 2009. Member states will control emissions of greenhouse gases by issuance of allowances to emit CO2 through an auction, allocation or a combination of the two methods. |
|
| | | | A significant portion of our fossil fuel-fired electric generation is located in states within the RGGI region and compete with electricity generators within PJM not located within a RGGI state. The costs or inability to purchase CO2 allowances for our fleet operating within a RGGI state could place us at an economic disadvantage compared to our competitors not located in a RGGI state. |
|
• | | | | Potential closed-cycle cooling requirements—Our Salem nuclear generating facility has a permit from the NJDEP allowing for its continued operation with its existing cooling water system. That permit expired in July 2006. Our application to renew the permit, filed in February 2006, estimated the costs associated with cooling towers for Salem to be approximately $1 billion, of which our share was approximately $575 million. |
|
| | | | If the NJDEP and the Connecticut Department of Environmental Protection were to require installation of closed-cycle cooling or its equivalent at our Mercer, Hudson, Bridgeport, Sewaren or New Haven generating stations, the related increased costs and impacts would be material to our financial position, results of operations and net cash flows and would require further economic review to determine whether to continue operations or decommission the stations. |
|
• | | | | Remediation of environmental contamination at current or formerly owned facilities—We are subject to liability under environmental laws for the costs of remediating environmental contamination of property now or formerly owned by us and of property contaminated by hazardous substances that we generated. Remediation activities associated with our former Manufactured Gas |
32
| | | | Plant (MGP) operations are one source of such costs. Also, we are currently involved in a number of proceedings relating to sites where other hazardous substances may have been deposited and may be subject to additional proceedings in the future, the related costs of which could have a material adverse effect on our financial condition, results of operations and cash flows. |
|
| | | | In June 2007, the State of New Jersey filed multiple lawsuits against parties, including us, who were alleged to be responsible for injuries to natural resources in New Jersey, including a site being remediated under our MGP program. We cannot predict what further actions, if any, or the costs or the timing thereof, that may be required with respect to these or other natural resource damages claims. For additional information, see Note 11. Commitments and Contingent Liabilities. |
|
| | | | More stringent air pollution control requirements in New Jersey—Most of our generating facilities are located in New Jersey where restrictions are generally considered to be more stringent in comparison to other states. Therefore, there may be instances where the facilities located in New Jersey are subject to more restrictive and, therefore, more costly pollution control requirements and liability for damage to natural resources, than competing facilities in other states. Most of New Jersey has been classified as “nonattainment” with national ambient air quality standards for one or more air contaminants. This requires New Jersey to develop programs to reduce air emissions. Such programs can impose additional costs on us by requiring that we offset any emissions increases from new electric generators we may want to build and by setting more stringent emission limits on our facilities that run during the hottest days of the year. |
|
• | | | | Coal Ash Management—A by-product of the combustion of coal is coal ash. Two types of coal ash are produced at our Hudson, Mercer and Bridgeport stations: bottom ash and fly ash. We currently have a program in which we beneficially re-use ash in other processes to avoid disposal. Coal ash is not currently regulated as a hazardous waste under federal and state law. Any future regulation of coal ash could result in additional costs which could be material. |
Our ownership and operation of nuclear power plants involve regulatory, financial, environmental, health and safety risks.
Over half of our total generation output each year is provided by our nuclear fleet, which comprises approximately one-fourth of our total owned generation capacity. For this reason, we are exposed to risks related to the continued successful operation of our nuclear facilities and issues that may adversely affect the nuclear generation industry. These include:
|
• | | | | Storage and Disposal of Spent Nuclear Fuel—We currently use on-site storage for spent nuclear fuel and incur costs to maintain this storage. Potential increased costs of storage, handling and disposal of nuclear materials, including the availability or unavailability of a permanent repository for spent nuclear fuel, could impact future operations of these stations. In addition, the availability of an off-site repository for spent nuclear fuel may affect our ability to fully decommission our nuclear units in the future. |
|
• | | | | Regulatory and Legal Risk—The NRC may modify, suspend or revoke licenses, or shut down a nuclear facility and impose substantial civil penalties for failure to comply with the Atomic Energy Act, related regulations or the terms and conditions of the licenses for nuclear generating facilities. As with all of our generation facilities, as discussed above, our nuclear facilities are also subject to comprehensive, evolving environmental regulation. |
|
| | | | Our nuclear generating facilities are currently operating under NRC licenses that expire in 2016, 2020, 2026, 2033 and 2034.While we have applied for extensions to these licenses for Peach Bottom II and III and expect to apply for extensions for Salem and Hope Creek, the extension process can be expected to take three to five years from commencement until completion of NRC review. We cannot be sure that we will receive the requested extensions or be able to operate the facilities for all or any portion of any extended license. |
33
|
• | | | | Operational Risk—Operations at any of our nuclear generating units could degrade to the point where the affected unit needs to be shut down or operated at less than full capacity. If this were to happen, identifying and correcting the causes may require significant time and expense. Since our nuclear fleet provides the majority of our generation output, any significant outage could result in reduced earnings as we would need to purchase or generate higher-priced energy to meet our contractual obligations. For additional information, see our discussion of operational performance for all of our generation facilities below. |
|
• | | | | Nuclear Incident or Accident Risk—Accidents and other unforeseen problems have occurred at nuclear stations both in the U.S. and elsewhere. The consequences of an accident can be severe and may include loss of life and property damage. All our nuclear units are located at one of two sites. It is possible that an accident or other incident at a nuclear generating unit could adversely affect our ability to continue to operate unaffected units located at the same site, which would further affect our financial condition, operating results and cash flows. An accident or incident at a nuclear unit not owned by us could also affect our ability to operate our units. Any resulting financial impact from a nuclear accident may exceed our resources, including insurance coverages. |
We may be adversely affected by changes in energy deregulation policies, including market design rules and developments affecting transmission.
The energy industry continues to experience significant change. Various rules have recently been implemented to respond to commodity pricing, reliability and other industry concerns. Our business has been impacted by established rules that create locational capacity markets in each of PJM, New England and New York. Under these rules, generators located in constrained areas are paid more for their capacity so there is an incentive to locate in those areas where generation capacity is most needed. Because much of our generation is located in constrained areas in PJM and New England, the existence of these rules has had a positive impact on our revenues. PJM’s locational capacity market design rules are currently being challenged in court, and FERC is currently considering changes to PJM’s rules for RPM. Any changes to these rules may have an adverse impact on our financial condition, results of operations and cash flows.
Many factors will affect the capacity pricing in PJM, including but not limited to:
|
• | | | | changes in load and demand, |
|
• | | | | changes in the available amounts of demand response resources, |
|
• | | | | changes in available generating capacity (including retirements, additions, derates, forced outage rates, etc., |
|
• | | | | increases in transmission capability between zones, and |
|
• | | | | changes to the pricing mechanism, including increasing the potential number of zones to create more pricing sensitivity to changes in supply and demand, as well as other potential changes that PJM may propose over time. |
We could also be impacted by a number of other events, including regulatory or legislative actions favoring non-competitive markets and energy efficiency initiatives. Further, some of the market-based mechanisms in which we participate, including BGS auctions, are at times the subject of review or discussion by some of the participants in the New Jersey and federal regulatory and political. We can provide no assurance that these mechanisms will continue to exist in their current form or not otherwise be modified by regulations.
To the extent that additions to the transmission system relieve or reduce congestion in eastern PJM where most of our plants are located, our revenues could be adversely affected. In addition, pressures from renewable resources such as wind and solar, could increase over time, especially if government incentive programs continue to grow.
We face competition in the merchant energy markets.
Our wholesale power and marketing businesses are subject to competition that may adversely affect our ability to make investments or sales on favorable terms and achieve our annual objectives. Increased
34
competition could contribute to a reduction in prices offered for power and could result in lower returns. Decreased competition could negatively impact results through a decline in market liquidity. Some of the competitors include:
• | | | | merchant generators, |
|
• | | | | domestic and multi-national utility generators, |
|
• | | | | energy marketers, |
|
• | | | | banks, funds and other financial entities, |
|
• | | | | fuel supply companies, and |
|
• | | | | affiliates of other industrial companies. |
Regulatory, environmental, industry and other operational issues will have a significant impact on our ability to compete in energy markets. Our ability to compete will also be impacted by:
|
• | | | | DSM and other efficiency efforts—DSM and other efficiency efforts aimed at changing the quantity and patterns of consumers’ usage could result in a reduction in load requirements. |
|
• | | | | Changes in technology and/or customer conservation—It is possible that advances in technology will reduce the cost of alternative methods of producing electricity, such as fuel cells, microturbines, windmills and photovoltaic (solar) cells, to a level that is competitive with that of most central station electric production. It is also possible that electric customers may significantly decrease their electric consumption due to demand-side energy conservation programs. Changes in technology could also alter the channels through which retail electric customers buy electricity, which could adversely affect financial results. |
If any of such issues was to occur, there could be a resultant erosion of our market share and an impairment in the value of our power plants.
We are exposed to commodity price volatility as a result of our participation in the wholesale energy markets.
The material risks associated with the wholesale energy markets known or currently anticipated that could adversely affect our operations include:
|
• | | | | Price fluctuations and collateral requirements—We expect to meet our supply obligations through a combination of generation and energy purchases. We also enter into derivative and other positions related to our generation assets and supply obligations. To the extent we hedge our costs, we will be subject to the risk of price fluctuations that could affect our future results and impact our liquidity needs. These include: |
| | | variability in costs, such as changes in the expected price of energy and capacity that we sell into the market; | |
¡ | | | | increases in the price of energy purchased to meet supply obligations or the amount of excess energy sold into the market; |
|
¡ | | | | the cost of fuel to generate electricity; and |
|
¡ | | | | the cost of emission credits and congestion credits that we use to transmit electricity. |
As market prices for energy and fuel fluctuate, our forward energy sale and forward fuel purchase contracts could require us to post substantial additional collateral, thus requiring us to obtain additional sources of liquidity during periods when our ability to do so may be limited. If Power were to lose its investment grade credit rating, it would be required under certain agreements to provide a significant amount of additional collateral in the form of letters of credit or cash, which would have a material adverse effect on our liquidity and cash flows. If Power had lost its investment grade credit rating as of December 31, 2008, it would have been required to provide approximately $1.1 billion in additional collateral.
35
|
• | | | | Our cost of coal and nuclear fuel may substantially increase—Our coal and nuclear units have a diversified portfolio of contracts and inventory that will provide a substantial portion of our fuel needs over the next several years. However, it will be necessary to enter into additional arrangements to acquire coal and nuclear fuel in the future. Market prices for coal and nuclear fuel have recently been volatile. Although our fuel contract portfolio provides a degree of hedging against these market risks, future increases in fuel costs cannot be predicted with certainty and could materially and adversely affect liquidity, financial condition and results of operations. |
|
• | | | | Third party credit risk—We sell generation output and buy fuel through the execution of bilateral contracts. These contracts are subject to credit risk, which relates to the ability of our counterparties to meet their contractual obligations to us. Any failure to perform by these counterparties could have a material adverse impact on our results of operations, cash flows and financial position. In the spot markets, we are exposed to the risks of whatever default mechanisms exist in those markets, some of which attempt to spread the risk across all participants, which may not be an effective way of lessening the severity of the risk and the amounts at stake. An increase in the duration and/or severity of the current economic recession may also increase such risk. |
Our inability to balance energy obligations with available supply could negatively impact results.
The revenues generated by the operation of the generating stations are subject to market risks that are beyond our control. Generation output will either be used to satisfy wholesale contract requirements, other bilateral contracts or be sold into competitive power markets. Participants in the competitive power markets are not guaranteed any specified rate of return on their capital investments. Generation revenues and results of operations are dependent upon prevailing market prices for energy, capacity, ancillary services and fuel supply in the markets served.
Our business frequently involves the establishment of forward sale positions in the wholesale energy markets on long-term and short-term bases. To the extent that we have produced or purchased energy in excess of our contracted obligations, a reduction in market prices could reduce profitability. Conversely, to the extent that we have contracted obligations in excess of energy we have produced or purchased, an increase in market prices could reduce profitability.
If the strategy we utilize to hedge our exposures to these various risks is not effective, we could incur significant losses. Our market positions can also be adversely affected by the level of volatility in the energy markets that, in turn, depends on various factors, including weather in various geographical areas, short-term supply and demand imbalances and pricing differentials at various geographic locations. These cannot be predicted with any certainty.
Increases in market prices also affect our ability to hedge generation output and fuel requirements as the obligation to post margin increases with increasing prices and could require the maintenance of liquidity resources that would be prohibitively expensive.
If we are unable to access sufficient capital at reasonable rates or maintain sufficient liquidity in the amounts and at the times needed, our ability to successfully implement our financial strategies may be adversely affected.
Capital for projects and investments has been provided by internally-generated cash flow, equity issuances and borrowings. Continued access to debt capital from outside sources is required in order to efficiently fund the cash flow needs of our businesses. The ability to arrange financing and the costs of capital depend on numerous factors including, among other things, general economic and market conditions, the availability of credit from banks and other financial institutions, investor confidence, the success of current projects and the quality of new projects.
The ability to have continued access to the credit and capital markets at a reasonable economic cost is dependent upon our current and future capital structure, financial performance, our credit ratings and the availability of capital under reasonable terms and conditions. As a result, no assurance can be given that we
36
will be successful in obtaining re-financing for maturing debt, financing for projects and investments or funding the equity commitments required for such projects and investments in the future.
Capital market performance directly affects the asset values of our nuclear decommissioning trust funds and defined benefit plan trust funds. Sustained decreases in asset value of trust assets could result in the need for significant additional funding.
The performance of the capital markets will affect the value of the assets that are held in trust to satisfy our future obligations under our pension and postretirement benefit plans and to decommission our nuclear generating plants. The decline in the market value of our pension assets experienced in the fourth quarter of 2008 has resulted in the need to make additional contributions in 2009 to maintain our funding at sufficient levels. Further significant declines in the market value of these assets may significantly increase our funding requirements for these obligations in the future.
An extended economic recession would likely have a material adverse effect on our businesses.
Our results of operations may be negatively affected by sustained downturns or sluggishness in the economy, including low levels in the market prices of commodities. Adverse conditions in the economy affect the markets in which we operate and can negatively impact our results. Declines in demand for energy will reduce overall sales and lessen cash flows, especially as customers reduce their consumption of electricity and gas. Although our utility business is subject to regulated allowable rates of return, overall declines in electricity and gas sold and/or increases in non-payment of customer bills would materially adversely affect our liquidity, financial condition and results of operations.
In the event of an accident or acts of war or terrorism, our insurance coverage may be insufficient if we are unable to obtain adequate coverage at commercially reasonable rates.
We have insurance for all-risk property damage including boiler and machinery coverage for our nuclear and non-nuclear generating units, replacement power and business interruption coverage for our nuclear generating units, general public liability and nuclear liability, in amounts and with deductibles that we consider appropriate.
We can give no assurance that this insurance coverage will be available in the future on commercially reasonable terms or that the insurance proceeds received for any loss of or any damage to any of our facilities will be sufficient.
Inability to successfully develop or construct generation, transmission and distribution projects within budget could adversely impact our businesses.
Our business plan calls for extensive investment in capital improvements and additions, including the installation of required environmental upgrades and retrofits, construction and/or acquisition of additional generation units and transmission facilities and modernizing existing infrastructure. Currently, we have several significant projects underway or being contemplated, including:
|
• | | | | the installation of pollution control equipment at our coal generating facilities; |
|
• | | | | the construction of the new Susquehanna-Roseland transmission line; |
|
• | | | | the investment in improving the electric and gas distribution infrastructure; |
|
• | | | | the implementation of a new customer service system; and |
|
• | | | | the solar initiative in New Jersey. |
Our success will depend, in part, on our ability to complete these projects within budgets, on commercially reasonable terms and conditions and, in our regulated businesses, our ability to recover the related costs. Any delays, cost escalations or otherwise unsuccessful construction and development could materially affect our financial position, results of operations and cash flows.
37
We may be unable to achieve, or continue to sustain, our expected levels of generating operating performance.
One of the key elements to achieving the results in our business plans is the ability to sustain generating operating performance and capacity factors at expected levels. This is especially important at our lower-cost nuclear and coal facilities. Operations at any of our plants could degrade to the point where the plant has to shut down or operate at less than full capacity. Some issues that could impact the operation of our facilities are:
|
• | | | | breakdown or failure of equipment, processes or management effectiveness; |
|
• | | | | disruptions in the transmission of electricity; |
|
• | | | | labor disputes; |
|
• | | | | fuel supply interruptions; |
|
• | | | | transportation constraints; |
|
• | | | | limitations which may be imposed by environmental or other regulatory requirements; |
|
• | | | | permit limitations; and |
|
• | | | | operator error or catastrophic events such as fires, earthquakes, explosions, floods, acts of terrorism or other similar occurrences. |
Identifying and correcting any of these issues may require significant time and expense. Depending on the materiality of the issue, we may choose to close a plant rather than incur the expense of restarting it or returning it to full capacity. In either event, to the extent that our operational targets are not met, we could have to operate higher-cost generation facilities or meet our obligations through higher-cost open market purchases.
ITEM 1B. UNRESOLVED STAFF COMMENTS
PSEG
None.
Power and PSE&G
Not Applicable.
38
ITEM 2. PROPERTIES
All of our physical property is owned by our subsidiaries. We believe that we and our subsidiaries maintain adequate insurance coverage against loss or damage to plants and properties, subject to certain exceptions, to the extent such property is usually insured and insurance is available at a reasonable cost.
Generation Facilities
As of December 31, 2008, Power’s share of summer installed generating capacity was 13,576 MW, as shown in the following table:
| | | | | | | | | | | | |
Name | | Location | | Total
Capacity
(MW) | | %
Owned | | Owned
Capacity
(MW) | | Principal
Fuels
Used | | Mission |
Steam: | | | | | | | | | | | | |
Hudson | | NJ | | | | 923 | | | | | 100 | % | | | | | 923 | | | Coal/Gas | | Load Following |
Mercer | | NJ | | | | 636 | | | | | 100 | % | | | | | 636 | | | Coal | | Load Following |
Sewaren | | NJ | | | | 453 | | | | | 100 | % | | | | | 453 | | | Gas | | Load Following |
Keystone(A) | | PA | | | | 1,712 | | | | | 23 | % | | | | | 391 | | | Coal | | Base Load |
Conemaugh(A) | | PA | | | | 1,711 | | | | | 23 | % | | | | | 385 | | | Coal | | Base Load |
Bridgeport Harbor | | CT | | | | 514 | | | | | 100 | % | | | | | 514 | | | Coal/Oil | | Base Load/Load Following |
New Haven Harbor | | CT | | | | 448 | | | | | 100 | % | | | | | 448 | | | Oil | | Load Following |
| | | | | | | | | | | | |
Total Steam | | | | | | 6,397 | | | | | | | 3,750 | | | | | |
| | | | | | | | | | | | |
Nuclear: | | | | | | | | | | | | |
Hope Creek | | NJ | | | | 1,211 | | | | | 100 | % | | | | | 1,211 | | | Nuclear | | Base Load |
Salem 1 & 2 | | NJ | | | | 2,345 | | | | | 57 | % | | | | | 1,346 | | | Nuclear | | Base Load |
Peach Bottom 2 & 3(B) | | PA | | | | 2,224 | | | | | 50 | % | | | | | 1,112 | | | Nuclear | | Base Load |
�� | | | | | | | | | | | | |
Total Nuclear | | | | | | 5,780 | | | | | | | 3,669 | | | | | |
| | | | | | | | | | | | |
Combined Cycle: | | | | | | | | | | | | |
Bergen | | NJ | | | | 1,225 | | | | | 100 | % | | | | | 1,225 | | | Gas | | Load Following |
Linden | | NJ | | | | 1,230 | | | | | 100 | % | | | | | 1,230 | | | Gas | | Load Following |
Bethlehem | | NY | | | | 747 | | | | | 100 | % | | | | | 747 | | | Gas | | Load Following |
| | | | | | | | | | | | |
Total Combined Cycle | | | | | | 3,202 | | | | | | | 3,202 | | | | | |
| | | | | | | | | | | | |
Combustion Turbine: | | | | | | | | | | | | |
Essex | | NJ | | | | 617 | | | | | 100 | % | | | | | 617 | | | Gas | | Peaking |
Edison | | NJ | | | | 504 | | | | | 100 | % | | | | | 504 | | | Gas | | Peaking |
Kearny | | NJ | | | | 446 | | | | | 100 | % | | | | | 446 | | | Gas | | Peaking |
Burlington | | NJ | | | | 553 | | | | | 100 | % | | | | | 553 | | | Oil | | Peaking |
Linden | | NJ | | | | 336 | | | | | 100 | % | | | | | 336 | | | Gas | | Peaking |
Mercer | | NJ | | | | 115 | | | | | 100 | % | | | | | 115 | | | Oil | | Peaking |
Sewaren | | NJ | | | | 105 | | | | | 100 | % | | | | | 105 | | | Oil | | Peaking |
Bergen. | | NJ | | | | 21 | | | | | 100 | % | | | | | 21 | | | Gas | | Peaking |
National Park | | NJ | | | | 21 | | | | | 100 | % | | | | | 21 | | | Oil | | Peaking |
Salem | | NJ | | | | 38 | | | | | 57 | % | | | | | 22 | | | Oil | | Peaking |
Bridgeport Harbor | | CT | | | | 15 | | | | | 100 | % | | | | | 15 | | | Oil | | Peaking |
| | | | | | | | | | | | |
Total Combustion Turbine | | | | | | 2,771 | | | | | | | 2,755 | | | | | |
| | | | | | | | | | | | |
Pumped Storage: | | | | | | | | | | | | |
Yards Creek(C) | | NJ | | | | 400 | | | | | 50 | % | | | | | 200 | | | | | Peaking |
| | | | | | | | | | | | |
Total Operating Generation Plants | | | | | | 18,550 | | | | | | | 13,576 | | | | | |
| | | | | | | | | | | | |
|
(A) | | | | Operated by Reliant Energy. |
|
(B) | | | | Operated by Exelon Generation. |
|
(C) | | | | Operated by JCP&L. |
39
Energy Holdings has investments in the following generation facilities as of December 31, 2008:
| | | | | | | | | | |
Name | | Location | | Total
Capacity
(MW) | | %
Owned | | Owned
Capacity
(MW) | | Principal
Fuels
Used |
United States | | | | | | | | | | |
PSEG Texas | | | | | | | | | | |
Guadalupe | | TX | | | | 1,000 | | | | | 100 | % | | | | | 1,000 | | | Natural gas |
Odessa | | TX | | | | 1,000 | | | | | 100 | % | | | | | 1,000 | | | Natural gas |
| | | | | | | | | | |
Total PSEG Texas | | | | | | 2,000 | | | | | | | 2,000 | | | |
Kalaeloa | | HI | | | | 208 | | | | | 50 | % | | | | | 104 | | | Oil |
GWF | | CA | | | | 105 | | | | | 50 | % | | | | | 53 | | | Petroleum coke |
Hanford L.P. (Hanford) | | CA | | | | 27 | | | | | 50 | % | | | | | 13 | | | Petroleum coke |
GWF Energy | | | | | | | | | | |
Hanford—Peaker Plant | | CA | | | | 95 | | | | | 60 | % | | | | | 57 | | | Natural gas |
Henrietta—Peaker Plant | | CA | | | | 97 | | | | | 60 | % | | | | | 58 | | | Natural gas |
Tracy—Peaker Plant | | CA | | | | 171 | | | | | 60 | % | | | | | 103 | | | Natural gas |
| | | | | | | | | | |
Total GWF Energy | | | | | | 363 | | | | | | | 218 | | | |
Bridgewater | | NH | | | | 16 | | | | | 40 | % | | | | | 6 | | | Biomass |
Conemaugh | | PA | | | | 15 | | | | | 4 | % | | | | | 1 | | | Hydro |
| | | | | | | | | | |
Total United States | | | | | | 2,734 | | | | | | | 2,395 | | | |
| | | | | | | | | | |
International(A) | | | | | | | | | | |
PPN Power Generating Company Limited (PPN) | | India | | | | 330 | | | | | 20 | % | | | | | 66 | | | Naphtha/Natural gas |
Turboven | | Venezuela | | | | 120 | | | | | 50 | % | | | | | 60 | | | Natural gas |
Turbogeneradores de Maracay (TGM) | | Venezuela | | | | 40 | | | | | 9 | % | | | | | 4 | | | Natural gas |
| | | | | | | | | | |
Total International | | | | | | 490 | | | | | | | 130 | | | |
| | | | | | | | | | |
Total Operating Power Plants | | | | | | 3,224 | | | | | | | 2,525 | | | |
| | | | | | | | | | |
|
(A) | | | | We are continuing to explore options for our equity investments in PPN, Turboven and TGM. |
Transmission and Distribution Facilities
As of December 31, 2008, PSE&G’s electric transmission and distribution system included 23,164 circuit miles, of which 7,795 circuit miles were underground, and 818,219 poles, of which 542,162 poles were jointly-owned. Approximately 99% of this property is located in New Jersey.
In addition, as of December 31, 2008, PSE&G owned four electric distribution headquarters and five subheadquarters in four operating divisions, all located in New Jersey.
As of December 31, 2008, the daily gas capacity of PSE&G’s 100%-owned peaking facilities (the maximum daily gas delivery available during the three peak winter months) consisted of liquid petroleum air gas and liquefied natural gas and aggregated 2,973,000 therms (288,640,800 cubic feet on an equivalent basis of 1,030 Btu/cubic foot) as shown in the following table:
40
| | | | Plant | | Location | | Daily Capacity
(Therms) |
Burlington LNG | | Burlington, NJ | | | | 773,000 | |
Camden LPG | | Camden, NJ | | | | 280,000 | |
Central LPG | | Edison Twp., NJ | | | | 960,000 | |
Harrison LPG | | Harrison, NJ | | | | 960,000 | |
| | | | |
Total | | | | | | 2,973,000 | |
| | | | |
As of December 31, 2008, PSE&G owned and operated 17,626 miles of gas mains, owned 12 gas distribution headquarters and two subheadquarters, all in three operating regions located in New Jersey and owned one meter shop in New Jersey serving all such areas. In addition, PSE&G operated 62 natural gas metering and regulating stations, all located in New Jersey, of which 26 were located on land owned by customers or natural gas pipeline suppliers and were operated under lease, easement or other similar arrangement. In some instances, the pipeline companies owned portions of the metering and regulating facilities.
PSE&G’s First and Refunding Mortgage, securing the bonds issued thereunder, constitutes a direct first mortgage lien on substantially all of PSE&G’s property.
PSE&G’s electric lines and gas mains are located over or under public highways, streets, alleys or lands, except where they are located over or under property owned by PSE&G or occupied by it under easements or other rights. PSE&G deems these easements and other rights to be adequate for the purposes for which they are being used.
Office Buildings and Other Facilities
Power leases a portion of the 25-story office tower at 80 Park Plaza, Newark, New Jersey for its corporate headquarters. Other leased properties include office, warehouse, classroom and storage space, primarily located in New Jersey. Power also owns the Central Maintenance Shop at Sewaren, New Jersey.
Power has a 57.41% ownership interest in approximately 13,000 acres in the Delaware River Estuary region to satisfy the condition of the New Jersey Pollutant Discharge Elimination System (NJPDES) permit issued for Salem. Power also owns several other facilities, including the on-site Nuclear Administration and Processing Center buildings.
Power has a 13.91% ownership interest in the 650-acre Merrill Creek Reservoir in Warren County, New Jersey and approximately 2,158 acres of land surrounding the reservoir. The reservoir was constructed to store water for release to the Delaware River during periods of low flow. Merrill Creek is jointly-owned by seven companies that have generation facilities along the Delaware River or its tributaries and use the river water in their operations.
PSE&G rents office space from Services as its headquarters in Newark, New Jersey. PSE&G also leases office space at various locations throughout New Jersey for district offices and offices for various corporate groups and services. PSE&G also owns various other sites for training, testing, parking, records storage, research, repair and maintenance, warehouse facilities and other purposes related to its business.
In addition to the facilities discussed above, as of December 31, 2008, PSE&G owned 42 switching stations in New Jersey with an aggregate installed capacity of 22,809 megavolt-amperes and 245 substations with an aggregate installed capacity of 8,007 megavolt-amperes. In addition, four substations in New Jersey having an aggregate installed capacity of 109 megavolt-amperes were operated on leased property.
Services leases the majority of a 25-story office tower for PSEG’s corporate headquarters at 80 Park Plaza, Newark, New Jersey, together with an adjoining three-story building. As of January 1, 2009, Services transferred ownership of the Maplewood Test Services Facility in Maplewood, New Jersey to Power.
41
We believe that our subsidiaries maintain adequate insurance coverage against loss or damage to their plants and properties, subject to certain exceptions, to the extent such property is usually insured and insurance is available at a reasonable cost. For a discussion of nuclear insurance, see Note 11. Commitments and Contingent Liabilities.
ITEM 3. LEGAL PROCEEDINGS
We are party to various lawsuits and regulatory matters in the ordinary course of business. For information regarding material legal proceedings, other than those discussed below, see Item 1. Business—Regulatory Issues and Environmental Matters and Item 8. Financial Statements and Supplementary Data—Note 11. Commitments and Contingent Liabilities.
Electric Discount and Energy Competition Act(Competition Act)
On April 23, 2007, PSE&G and PSE&G Transition Funding LLC (Transition Funding) were served with a copy of a purported class action complaint (Complaint) in the Superior Court of New Jersey, Law Division challenging the constitutional validity of certain provisions of New Jersey’s Competition Act, seeking injunctive relief against continued collection from PSE&G’s electric customers of the Transition Bond Charge (TBC) of Transition Funding, as well as recovery of TBC amounts previously collected. Notice of the filing of the Complaint was also provided to New Jersey’s Attorney General. Under New Jersey law, the Competition Act, enacted in 1999, is presumed constitutional. On July 9, 2007, the same plaintiff filed an amended Complaint to also seek injunctive relief from continued collection of related taxes, as well as recovery of such taxes previously collected, and also filed a petition with the BPU requesting review and adjustment to PSE&G’s recovery of the same charges. PSE&G and Transition Funding filed a motion to dismiss the amended Complaint (or in the alternative for summary judgment) on July 30, 2007 and PSE&G filed a motion with the BPU on September 30, 2007 to dismiss the petition. On October 10, 2007, PSE&G’s and Transition Funding’s motion to dismiss the amended Complaint was granted. The plaintiff subsequently appealed this dismissal and, on February 6, 2009, the Appellate Division of the New Jersey Superior Court unanimously affirmed the lower court decision. The plaintiff has sought reconsideration of the decision by the Appellate Division. PSE&G’s motion to dismiss the BPU petition remains pending.
Con Edison (Con Ed)
In November 2001, Con Ed filed a complaint with FERC against PSE&G, PJM and NYISO asserting a failure to comply with agreements between PSE&G and Con Ed covering 1,000 MW of transmission. These agreements are scheduled to expire in May 2012. However, PJM has filed contracts with FERC which would extend until 2017 the transmission service that is the subject of the disputed agreements. PSE&G protested PJM’s filing.
In August 2008, FERC issued an order setting for hearing and settlement procedures most of the issues raised by PSE&G in its protest. Following extensive discussions, on February 23, 2009, a settlement was filed at FERC resolving all issues in the proceedings, including all issues in the related proceedings at the D.C. Circuit Court of Appeals in connection with Con Ed’s November 2001 complaint. Although supported by PSE&G, Con Ed, PJM, the BPU and NYISO, one party failed to support the settlement. Comments on the settlement are scheduled to be filed in March 2009.
Regulatory Proceedings
RPM Auction
In May 2008, several state commissions, including the BPU and consumer advocate agencies, as well as customer groups and certain federal agencies filed a complaint with FERC against PJM with respect to RPM. The complaint challenged the results of the RPM capacity auctions held for the 2008/2009, 2009/2010 and 2010/2011 delivery years. They asserted that various RPM rules permitted suppliers to reduce the amount of capacity offered into the auctions, thereby increasing prices and requested that FERC find that the clearing prices produced are unlawful. The FERC issued an order dismissing the complaint in September 2008.
42
FERC’s dismissal of the complaint is still on rehearing before the FERC. If upheld on rehearing and on appeal, such dismissal eliminates the potential for the payment of refunds with respect to transitional auction payments made to generators in PJM, including Power.
RPM Model
|
• | | | | PJM FERC Filing to Prospectively Change Elements of RPM—After retaining an outside consultant to prepare a report evaluating the efficacy of the RPM model, PJM submitted a filing at FERC seeking to implement certain prospective changes to RPM. Issues in this proceeding included: the cost of new entry, the integration of transmission upgrades into RPM modeling, recognition of locational capacity value, participation in RPM by demand-side and energy efficiency resources, penalties for deficiencies and unavailability of capacity resources, and the calculation of avoided cost and long-term contracting to encourage new entry. On February 9, 2009, PJM filed an Offer of Settlement with the FERC on behalf of various settling parties. Several parties, including many state commissions, have indicated that they will not oppose the settlement. This Offer of Settlement proposes to, among other things, reduce cost of new entry values, eliminate the minimum offer price rule and develop seasonal capacity pricing. We filed comments in opposition to the settlement proposal on February 23, 2009. We cannot predict the outcome of this matter. |
|
• | | | | Judicial Appeals—There remain challenges to the original RPM design that are pending in the Court of Appeals. Specifically, we have filed briefs with the U.S. Court of Appeals for the District of Columbia Circuit due to concerns regarding the manner in which the cost of new entry is calculated. Other petitioners’ briefs, including the BPU, were also filed. We strongly support the RPM design but believe that certain components of the design should be modified. |
If the cost of new entry is set too low, generators in the PJM markets may not be adequately compensated for existing capacity and may not have sufficient incentives to construct new generating units.
Environmental Matters
The following items are environmental matters involving governmental authorities not discussed elsewhere in this Form 10-K. Power and PSE&G do not expect expenditures for any such site relating to the items listed below, individually or for all such current sites in the aggregate, to have a material effect on their respective financial condition, results of operations and net cash flows.
|
(1) | | | | Claim made in 1985 by the U.S. Department of the Interior under CERCLA with respect to the Pennsylvania Avenue and Fountain Avenue municipal landfills in Brooklyn, New York, for damages to natural resources. The U.S. Government alleges damages of approximately $200 million. To PSE&G’s knowledge there has been no action on this matter since 1988. |
|
(2) | | | | Duane Marine Salvage Corporation Superfund Site is in Perth Amboy, Middlesex County, New Jersey. The EPA had named PSE&G as one of several potentially responsible parties (PRPs) through a series of administrative orders between December 1984 and March 1985. Following work performed by the PRPs, the EPA declared on May 20, 1987 that all of its administrative orders had been satisfied. The NJDEP, however, named PSE&G as a PRP and issued its own directive dated October 21, 1987. Remediation is currently ongoing. |
|
(3) | | | | Various Spill Act directives were issued by the NJDEP to PRPs, including PSE&G with respect to the PJP Landfill in Jersey City, Hudson County, New Jersey, ordering payment of costs associated with operation and maintenance, interim remedial measures and a Remedial Investigation and Feasibility Study (RI/FS) in excess of $25 million. The directives also sought reimbursement of the NJDEP’s past and future oversight costs and the costs of any future remedial action. |
|
(4) | | | | Claim by the EPA, Region III, under CERCLA with respect to a Cottman Avenue Superfund Site, a former non-ferrous scrap reclamation facility located in Philadelphia, Pennsylvania, owned and formerly operated by Metal Bank of America, Inc. PSE&G, other utilities and other companies are alleged to be liable for contamination at the site and PSE&G has been named as a PRP. A Final |
43
| | | | Remedial Design Report was submitted to the EPA in September of 2002. This document presents the design details that will implement the EPA’s selected remediation remedy. PSE&G’s share of the remedy implementation costs is estimated at approximately $4 million. |
|
(5) | | | | The Klockner Road site is located in Hamilton Township, Mercer County, New Jersey, and occupies approximately two acres on PSE&G’s Trenton Switching Station property. PSE&G entered into a memorandum of agreement with the NJDEP for the Klockner Road site pursuant to which PSE&G conducted an RI/FS and remedial action at the site to address the presence of soil and groundwater contamination at the site. |
|
(6) | | | | The NJDEP assumed control of a former petroleum products blending and mixing operation and waste oil recycling facility in Elizabeth, Union County, New Jersey (Borne Chemical Co. site) and issued various directives to a number of entities, including PSE&G, requiring performance of various remedial actions. PSE&G’s nexus to the site is based upon the shipment of certain waste oils to the site for recycling. PSE&G and certain of the other entities named in the NJDEP directives are members of a PRP group that have been working together to satisfy NJDEP requirements including: funding of the site security program; containerized waste removal; and a site remedial investigation program. |
|
(7) | | | | Morton International, Inc., a subsidiary of Rohm and Haas Company, filed a lawsuit against the former customers of a former mercury refining operation located on the banks of Berry’s Creek in Wood Ridge, New Jersey. The lawsuit seeks to recover cleanup costs incurred and to be incurred in remediating the site. PSE&G was among the former customers sued based on allegations that mercury originating at its Kearny Generating Station was sent to the site for refining. |
|
(8) | | | | The EPA sent Power, PSE&G and approximately 157 other entities a notice that the EPA considered each of the entities to be a PRP with respect to contamination in Berry’s Creek in Bergen County, New Jersey and requesting that the PRPs perform a RI/FS on Berry’s Creek and the connected tributaries and wetlands. Berry’s Creek flows through approximately 6.5 miles of areas that have been used for a variety of industrial purposes and landfills. The EPA estimates that the study could be completed in approximately five years at a total cost of approximately $18 million. |
|
(9) | | | | In 2005, Exelon Generation advised us that it had signed an agreement for Peach Bottom regarding the DOE’s delay in accepting spent nuclear fuel for permanent storage. Under the agreement, Exelon Generation would be reimbursed for costs previously incurred, with future costs incurred resulting from the DOE delays in accepting spent fuel to be reimbursed annually until the DOE fulfills its obligation. In addition, Exelon Generation and Power are required to reimburse the DOE for the previously received credits from the Nuclear Waste Fund, plus lost earnings. We are currently in discussions with the DOE regarding our claims seeking damages for Salem and Hope Creek that were caused by the DOE’s delay in accepting spent nuclear fuel. |
ITEM 4. SUBMISSION OF MATTERS TO A VOTE OF SECURITY HOLDERS
None
44
PART II
ITEM 5. MARKET FOR REGISTRANT’S COMMON EQUITY, RELATED STOCKHOLDER MATTERS AND ISSUER PURCHASES OF EQUITY SECURITIES
Our common stock is listed on the New York Stock Exchange, Inc. As of December 31, 2008, there were 87,969 holders of record.
The graph below shows a comparison of the five-year cumulative return assuming $100 invested on December 31, 2003 in our common stock and the subsequent reinvestment of quarterly dividends, the S&P Composite Stock Price Index, the Dow Jones Utilities Index and the S&P Electric Utilities Index.
| | | | | | | | | | | | |
| | 2003 | | 2004 | | 2005 | | 2006 | | 2007 | | 2008 |
PSEG | | | $ | | 100.00 | | | | $ | | 124.09 | | | | $ | | 161.55 | | | | $ | | 170.98 | | | | $ | | 259.77 | | | | $ | | 159.88 | |
S&P 500 | | | $ | | 100.00 | | | | $ | | 110.84 | | | | $ | | 116.27 | | | | $ | | 134.60 | | | | $ | | 141.98 | | | | $ | | 89.53 | |
DJ Utilities | | | $ | | 100.00 | | | | $ | | 130.06 | | | | $ | | 162.51 | | | | $ | | 189.56 | | | | $ | | 227.59 | | | | $ | | 164.36 | |
S&P Electrics | | | $ | | 100.00 | | | | $ | | 126.40 | | | | $ | | 148.57 | | | | $ | | 182.96 | | | | $ | | 225.18 | | | | $ | | 167.09 | |
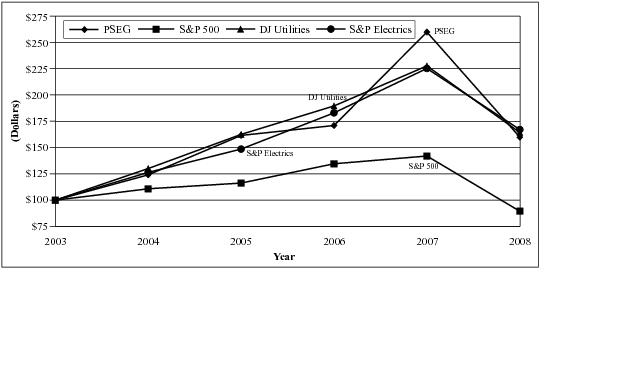
45
The following table indicates the high and low sale prices for our common stock and dividends paid for the periods indicated:
| | | | | | |
Common Stock | | High | | Low | | Dividend
per Share |
2008 | | | | | | |
First Quarter | | | $ | | 52.30 | | | | $ | | 39.08 | | | | $ | | 0.3225 | |
Second Quarter | | | $ | | 47.28 | | | | $ | | 40.18 | | | | $ | | 0.3225 | |
Third Quarter | | | $ | | 47.33 | | | | $ | | 31.56 | | | | $ | | 0.3225 | |
Fourth Quarter | | | $ | | 33.72 | | | | $ | | 22.09 | | | | $ | | 0.3225 | |
| | | | | | |
2007 | | | | | | |
First Quarter | | | $ | | 42.12 | | | | $ | | 32.16 | | | | $ | | 0.2925 | |
Second Quarter | | | $ | | 46.90 | | | | $ | | 41.02 | | | | $ | | 0.2925 | |
Third Quarter | | | $ | | 46.66 | | | | $ | | 38.66 | | | | $ | | 0.2925 | |
Fourth Quarter | | | $ | | 49.88 | | | | $ | | 43.48 | | | | $ | | 0.2925 | |
On January 15, 2008, our Board of Directors approved a two-for-one stock split of the outstanding shares of our common stock. The additional shares resulting from the stock split were distributed on February 4, 2008.
On February 17, 2009, our Board of Directors approved a $0.01 increase in the quarterly common stock dividend, from $0.3225 to $0.3325 per share for the first quarter of 2009. This reflects an indicated annual dividend rate of $1.33 per share. While we expect to continue to pay cash dividends on our common stock, the declaration and payment of future dividends to holders of common stock will be at the discretion of the Board of Directors and will depend upon many factors, including our financial condition, earnings, capital requirements of our business, alternate investment opportunities, legal requirements, regulatory constraints, industry practice and other factors that the Board of Directors deems relevant.
In July 2008, our Board of Directors authorized the repurchase of up to $750 million of our common stock to be executed over 18 months beginning August 1, 2008. We are not obligated to acquire any specific number of shares and may suspend or terminate our share repurchases at any time. As of December 31, 2008, 2,382,200 shares were repurchased at a total price of $92 million. The following table indicates our common share repurchases during the fourth quarter of 2008:
| | | | | | | | |
Fourth Quarter 2008 | | Total Number
of Shares
Purchased (A) | | Average
Price
Paid per
Share | | Total Number
of Shares
Purchased as
Part of Publicly
Announced Plan | | Approximate
Dollar Value
of Shares that
May Yet be
Purchased
Under the Plan |
| | | | | | | | Millions |
October 1-October 31 | | | | — | | | | $ | | — | | | | | — | | | | $ | | 658 | |
November 1-November 30 | | | | 4,000 | | | | $ | | 28.96 | | | | | — | | | | $ | | 658 | |
December 1-December 31 | | | | 22,945 | | | | $ | | 28.46 | | | | | — | | | | $ | | 658 | |
|
(A) | | | | Represents repurchases of shares in the open market to satisfy obligations under various compensation award programs. |
46
The following table indicates the securities authorized for issuance under equity compensation plans as of December 31, 2008:
| | | | | | Plan Category | | Number of Securities
to be Issued Upon
Exercise of
Outstanding Options
Warrants and Rights | | Weighted-Average
Exercise Price of
Outstanding
Options, Warrants
and Rights | | Number of Securities
Remaining Available
for Future Issuance
Under Equity
Compensation Plans |
Equity compensation plans approved by security holders | | | | 3,477,834 | | | | $ | | 31.36 | | | | | 20,904,141 | |
Equity compensation plans not approved by security holders | | | | 307,000 | | | | $ | | 22.78 | | | | | 4,189,032 | (A) | |
| | | | | | |
Total | | | | 3,784,834 | | | | $ | | 30.67 | | | | | 25,093,173 | |
| | | | | | | | | |
|
(A) | | | | Shares issuable under the PSEG Employee Stock Purchase Plan, Compensation Plan for Outside Directors and Stock Plan for outside Directors. |
For additional discussion of specific plans concerning equity-based compensation, see Note 16. Stock Based Compensation.
Power
We own all of Power’s outstanding limited liability company membership interests. For additional information regarding Power’s ability to pay dividends, see Item 7. MD&A—Overview of 2008 and Future Outlook.
PSE&G
We own all of the common stock of PSE&G. For additional information regarding PSE&G’s ability to continue to pay dividends, see Item 7. MD&A—Overview of 2008 and Future Outlook.
47
ITEM 6. SELECTED FINANCIAL DATA
The information presented below should be read in conjunction with the MD&A and the Consolidated Financial Statements and Notes to Consolidated Financial Statements (Notes). Information for Power is omitted pursuant to conditions set forth in General Instruction I of Form 10-K.
| | | | | | | | | | PSEG
| | 2008 | | 2007 | | 2006 | | 2005 | | 2004 |
For the Years Ended December 31: | | Millions, where applicable |
Operating Revenues | | | $ | | 13,322 | | | | $ | | 12,677 | | | | $ | | 11,735 | | | | $ | | 11,809 | | | | $ | | 10,280 | |
Income from Continuing Operations (A) | | | $ | | 983 | | | | $ | | 1,325 | | | | $ | | 673 | | | | $ | | 842 | | | | $ | | 747 | |
Net Income | | | $ | | 1,188 | | | | $ | | 1,335 | | | | $ | | 739 | | | | $ | | 661 | | | | $ | | 726 | |
Earnings per Share: | | | | | | | | | | |
Income from Continuing Operations: | | | | | | | | | | |
Basic (A) | | | $ | | 1.94 | | | | $ | | 2.61 | | | | $ | | 1.34 | | | | $ | | 1.75 | | | | $ | | 1.57 | |
Diluted (A) | | | $ | | 1.93 | | | | $ | | 2.60 | | | | $ | | 1.33 | | | | $ | | 1.72 | | | | $ | | 1.56 | |
Net Income: | | | | | | | | | | |
Basic | | | $ | | 2.34 | | | | $ | | 2.63 | | | | $ | | 1.47 | | | | $ | | 1.38 | | | | $ | | 1.53 | |
Diluted | | | $ | | 2.34 | | | | $ | | 2.62 | | | | $ | | 1.46 | | | | $ | | 1.35 | | | | $ | | 1.52 | |
Dividends Declared per Share | | | $ | | 1.29 | | | | $ | | 1.17 | | | | $ | | 1.14 | | | | $ | | 1.12 | | | | $ | | 1.10 | |
As of December 31: | | | | | | | | | | |
Total Assets | | | $ | | 29,049 | | | | $ | | 28,299 | | | | $ | | 28,508 | | | | $ | | 29,625 | | | | $ | | 29,238 | |
Long-Term Obligations (B) | | | $ | | 8,044 | | | | $ | | 8,709 | | | | $ | | 10,147 | | | | $ | | 11,035 | | | | $ | | 12,392 | |
|
(A) | | | | Income from Continuing Operations for 2006 includes an after-tax charge of $178 million, or $0.35 per share related to the sale of a third-tier subsidiary. |
|
(B) | | | | Includes capital lease obligations |
| | | | | | | | | | |
PSE&G
| | 2008 | | 2007 | | 2006 | | 2005 | | 2004 |
For the Years Ended December 31: | | Millions, where applicable |
Operating Revenues | | | $ | | 9,038 | | | | $ | | 8,493 | | | | $ | | 7,569 | | | | $ | | 7,514 | | | | $ | | 6,810 | |
Income from Continuing Operations | | | $ | | 364 | | | | $ | | 380 | | | | $ | | 265 | | | | $ | | 348 | | | | $ | | 346 | |
Net Income | | | $ | | 364 | | | | $ | | 380 | | | | $ | | 265 | | | | $ | | 348 | | | | $ | | 346 | |
As of December 31: | | | | | | | | | | |
Total Assets | | | $ | | 16,406 | | | | $ | | 14,637 | | | | $ | | 14,553 | | | | $ | | 14,297 | | | | $ | | 13,586 | |
Long-Term Obligations | | | $ | | 4,805 | | | | $ | | 4,632 | | | | $ | | 4,711 | | | | $ | | 4,745 | | | | $ | | 4,877 | |
48
ITEM 7. MANAGEMENT’S DISCUSSION AND ANALYSIS OF FINANCIAL CONDITION AND RESULTS OF OPERATIONS (MD&A)
This combined MD&A is separately filed by PSEG, Power and PSE&G. Information contained herein relating to any individual company is filed by such company on its own behalf. Power and PSE&G each make representations only as to itself and make no representations whatsoever as to any other company.
PSEG’s business consists of three reportable segments, which are:
|
• | | | | Power, our wholesale energy supply company that integrates its generating asset operations with its wholesale energy, fuel supply, energy trading and marketing and risk management activities primarily in the Northeast and Mid Atlantic U.S.; |
|
• | | | | PSE&G, our public utility company which provides transmission and distribution of electric energy and gas in New Jersey; and |
|
• | | | | Energy Holdings, which owns our other generation assets and holds other energy-related investments. |
OVERVIEW OF 2008 AND FUTURE OUTLOOK
Our business discussion in Item 1 provides a review of the regions and markets where we operate and compete, as well as our strategy for conducting our businesses within these markets, focusing on operational excellence, financial strength and making disciplined investments. The following discussion expands upon that discussion by describing significant events and business developments that have occurred during 2008 and key factors that will drive our future performance.
Operational Excellence
Market prices for electricity, fuels and other commodities related to our generation business are volatile, which can impact our business results positively or negatively, especially if sustained beyond our current contract periods.
Given this volatility in the market, a key factor in our success is our ability to operate our nuclear and fossil generating stations at sufficient capacity factors in order to limit the need to purchase higher-priced electricity to satisfy obligations under our sales contracts.
In 2008, we completed projects at Hope Creek and Salem stations, increasing our nominal generating capacity by a total of approximately 173 MW. This additional capacity, combined with an increase in the capacity factor at our nuclear facilities from 91% in 2007 to 93% in 2008 and the improved output from our fossil plants drove an increase in the total output from our Northeast/Mid Atlantic generating facilities from approximately 53,200 GWh in 2007 to 55,300 GWh in 2008.
Our estimated fuel needs are subject to change based upon the level of our operations as well as upon market demands for, and on the price of, coal. We have recently renegotiated our coal contract with a key supplier which will increase coal costs. For additional information, see Item 1. Business. We believe we can continue to manage our fuel sourcing needs in this dynamic market but changes in prices and demand could impact our future operations or financial results.
Over the long-term, our success also depends on the continuation of reasonable prices in the energy and capacity markets. We must also be able to effectively manage our construction projects and continue to economically operate our generation facilities under increasingly stringent environmental requirements, including legislation, regulation and voluntary restrictions that address:
|
• | | | | the control of carbon dioxide emissions to reduce the effects of global climate change and greenhouse gas; |
|
• | | | | other emissions such as nitrogen oxide, sulfur dioxide and mercury; and |
49
|
• | | | | the potential need for significant upgrades to existing intake structures and cooling systems at our larger once-through cooled plants, including Salem, Hudson, Mercer, Sewaren, New Haven and Bridgeport. |
Our operations could also be impacted by regulatory or legislative actions favoring non-competitive markets, energy efficiency initiatives, and regulatory policies favoring the construction of rate-based transmission that may result in increased imports of generation, which may be subject to less stringent environmental regulation, into areas served by our generation assets. Also, at times, some of the market-based mechanisms in which we participate, including BGS auctions and RPM capacity payments, are the subject of review or discussion in the regulatory and political arenas by participants including FERC, the BPU, and the PJM market monitor. Accordingly, we can provide no assurance that any or all of these mechanisms will continue to exist in their current form. For additional information, see Item 1. Business—Regulatory Issues.
Due to market volatility, strong competition, market complexity and constantly changing forward prices, there can be no assurance that we will be able to continue to contract our generation output at attractive prices. While higher forward prices may have a potentially significant beneficial impact on margins, they would also raise any replacement power costs that we may incur in the event of unanticipated outages, and could also further increase liquidity requirements as a result of contract obligations. For additional information on liquidity requirements, see Liquidity and Capital Resources.
Our operations focus on maintaining system reliability and safety levels. During 2008, we continued to attain top decile performance in our ability to limit service interruptions, outage restoration times and gas leaks per mile.
Our utility operation results depend on the treatment of the various rate and other issues by the BPU and FERC, as well as other state and federal regulatory agencies. Therefore, our success will depend on our ability to:
|
• | | | | continue cost containment initiatives; |
|
• | | | | attain an adequate return on the investments we plan to make in our electric and gas transmission and distribution system; and |
|
• | | | | continue recovery of the regulatory assets we have deferred. |
We expect to file a joint electric and gas rate case by mid 2009 with a request that rates become effective in 2010.
The FERC has recently approved our petition to implement formula rates for our existing and future transmission investments. This forward-looking formula rate mechanism allows us to update our transmission rates annually based on forecasted Operation and Maintenance Expense and capital expenditures for the coming year, with no lag of recovery, and will provide for a true-up to actual expenditures in the subsequent year.
Financial Strength
We continued to take steps to strengthen our financial position during 2008. We reduced our international investment exposure through the sale of the SAESA Group in Chile and our 85% ownership interest in Bioenergie in Italy and used the proceeds from these assets sales and other cash on hand to reduce outstanding debt. We repurchased 2,382,200 shares of our Common Stock under a program authorized by the Board of Directors in August and added capacity to our credit facilities during the year. We also reduced our financial risk by establishing a reserve for a significant percentage of our leveraged lease related tax exposure.
We believe that our strong operations and strong financial position will allow us to manage through the current weakening financial markets which has resulted in increased costs of borrowing as well as significant reductions in the value of both our pension trust and Nuclear Decommissioning Trust (NDT) funds. The reduction in value of the pension trust fund during the year is expected to result in an increase
50
to pension expense of $131 million in 2009 as compared to 2008. We will also likely make additional cash contributions of up to $275 million for pension funding in 2009.
Total pension costs were $37 million in 2008 and are projected to be approximately $215 million in 2009. Of the total amount of pension expense, the amounts recognized in 2008 and expected to be recognized in 2009 in the Consolidated Statements of Operations are as follows:
| | | | |
| | 2008 | | 2009
Expected |
| | Millions |
Power | | | $ | | 14 | | | | $ | | 77 | |
PSE&G | | | | 15 | | | | | 82 | |
Energy Holdings | | | | 2 | | | | | 3 | |
| | | | |
Total | | | $ | | 31 | | | | $ | | 162 | |
| | | | |
The amounts above include the portion of Services’ costs charged to each company. The difference between total cost and amounts recognized in the Consolidated Statements of Operations is due to amounts capitalized.
We have and will continue to review our other proposed spending in response to these market concerns. Going forward, we will continue to focus on reducing costs while maintaining our safety and reliability standards.
We expect that our cash from our operations, when combined with cash on hand, will be the primary source used to:
|
• | | | | support our projected capital expenditure program, |
|
• | | | | fund shareholder dividends, |
|
• | | | | fund contributions to the pension funds, and |
|
• | | | | provide for potential payments to address income tax claims related to our leveraged lease transactions, discussed in Note 11. Commitments and Contingent Liabilities. |
Any funds remaining after satisfying these obligations, when combined with potential additional financing capacity, would be discretionary cash that could be used to invest in the business, reduce debt and/or repurchase common stock.
Disciplined Investment
During 2008, we also continued to pursue investments focusing on areas that complement our existing businesses and provide prudent growth opportunities. These areas include responding to climate change and continuing to improve environmental performance, upgrading critical energy infrastructure and providing new energy supplies in a disciplined manner. Some examples of actions taken pursuant to this investment philosophy include:
|
• | | | | Construction of back end technology at Mercer, Hudson and Keystone stations to meet our environmental commitments. |
|
• | | | | Conducting engineering and design work in connection with the Susquehanna-Roseland 500 kV transmission project with construction expected to begin in early 2010 to meet a 2012 in-service date. Our share of this transmission project is expected to cost $750 million over the next four years. |
|
• | | | | Proposing stimulus programs to the BPU for us to invest approximately $888 million in capital infrastructure and energy efficiency programs over a two-year period beginning in April 2009. |
51
|
• | | | | Making funds available for approximately $105 million in a solar energy pilot program designed to spur investment in solar power in New Jersey to meet energy goals under the Energy Master Plan. |
|
• | | | | Filing a new solar initiative with the BPU seeking to invest approximately $773 million to develop 120 MW of solar power over a five-year horizon. |
|
• | | | | Pursuing construction of 130 MW of gas-fired peaking capacity in Connecticut for an estimated cost of $130 million to $140 million, with construction commencing in June 2011. |
|
• | | | | Pursuing the potential development of an offshore wind project, and a modest amount of solar and other renewable energy projects at Energy Holdings. |
There is no guarantee that these or future initiatives will be achieved since many issues need to be favorably resolved, such as system reliability concerns, regulatory approvals and construction or development costs.
RESULTS OF OPERATIONS
| | | | | | | | |
|
Earnings (Losses)In Millions | | Years Ended December 31, | | 2008 | | 2007 | | 2006 |
|
Power | | | $ | | 1,050 | | | | $ | | 949 | | | | $ | | 515 | |
PSE&G | | | | 364 | | | | | 380 | | | | | 265 | |
Energy Holdings (A) | | | | (403 | ) | | | | | 63 | | | | | (30 | ) | |
Other (B) | | | | (28 | ) | | | | | (67 | ) | | | | | (77 | ) | |
| | | | | | | | |
PSEG Income from Continuing Operations | | | | 983 | | | | | 1,325 | | | | | 673 | |
Income from Discontinued Operations, Including Gain on Disposal (C) | | | | 205 | | | | | 10 | | | | | 66 | |
| | | | | | | | |
PSEG Net Income | | | $ | | 1,188 | | | | $ | | 1,335 | | | | $ | | 739 | |
| | | | | | | | |
| | | | | | | | |
|
Earnings Per Share (Diluted) | | Years Ended December 31, | | 2008 | | 2007 | | 2006 |
|
PSEG Income from Continuing Operations | | | $ | | 1.93 | | | | $ | | 2.60 | | | | $ | | 1.33 | |
Income from Discontinued Operations, Including Gain on Disposal (C) | | | | 0.41 | | | | | 0.02 | | | | | 0.13 | |
| | | | | | | | |
PSEG Net Income | | | $ | | 2.34 | | | | $ | | 2.62 | | | | $ | | 1.46 | |
| | | | | | | | |
|
(A) | | | | Energy Holdings results include after-tax charges of $490 million taken in 2008 related to leveraged lease transactions, $23 million of after-tax loss resulting from the sale of Chilquinta and Luz del Sur (LDS) in 2007; and a $178 million after-tax loss on the sale of Rio Grande Energia S.A. in 2006. |
|
(B) | | | | Other includes parent company interest and financing costs, donations and certain administrative and general expenses. |
|
(C) | | | | See Note 3. Discontinued Operations, Dispositions and Impairments. |
Our results include the realized gains, losses and earnings on Power’s NDT Funds and other related activity. This includes the net realized gains and other-than-temporary impairments, as well as interest and dividend income and other costs related to the NDT Funds which are recorded in Other Income and Deductions. The total amounts recorded in Other Income and Deductions related to the NDT Funds, including the net realized gains (losses), were $(115) million, $48 million and $64 million for the years ended December 31, 2008, 2007 and 2006, respectively. The interest accretion expense on Power’s asset retirement obligation, which primarily relates to the decommissioning of the nuclear power plants for which the NDT Funds are maintained, is recorded in Operation and Maintenance Expense and was $25 million, $23 million and $33 million for the years ended December 31, 2008, 2007 and 2006, respectively. The combined after-tax impact on earnings of this activity for the years ended December 31, 2008, 2007 and 2006 was as follows:
52
| | | | |
NDT Fund Activity |
In Millions, after tax |
2008 | | 2007 | | 2006 |
|
$(71) | | $12 | | $11 |
|
Our results also include the following after-tax impacts of mark-to-market (MTM) activity.
| | | | | | |
Non-Trading Mark-to-Market |
| | In Millions, after tax |
| | 2008 | | 2007 | | 2006 |
|
Power | | | $ | | 14 | | | | $ | | (6 | ) | | | | $ | | (1 | ) | |
Energy Holdings | | | | 2 | | | | | 16 | | | | | 29 | |
|
Total | | | $ | | 16 | | | | $ | | 10 | | | | $ | | 28 | |
|
PSEG
Our results of operations are primarily comprised of the results of operations of our operating subsidiaries, Power, PSE&G and Energy Holdings, excluding changes related to intercompany transactions, which are eliminated in consolidation. We also include certain financing costs, donations and general and administrative costs at the parent company. For additional information on intercompany transactions, see Note 21. Related-Party Transactions.
| | | | | | | | | | | | | | |
| | For the Years Ended
December 31, | | Increase /
(Decrease) | | Increase /
(Decrease) |
| | 2008 | | 2007 | | 2006 | | 2008 vs 2007 | | 2007 vs 2006 |
| | Millions | | Millions | | % | | Millions | | % |
Operating Revenues | | | $ | | 13,322 | | | | $ | | 12,677 | | | | $ | | 11,735 | | | | $ | | 645 | | | | | 5 | | | | $ | | 942 | | | | | 8 | |
Energy Costs | | | | 7,295 | | | | | 6,512 | | | | | 6,544 | | | | | 783 | | | | | 12 | | | | | (32 | ) | | | | | (0 | ) | |
Operation and Maintenance | | | | 2,486 | | | | | 2,406 | | | | | 2,260 | | | | | 80 | | | | | 3 | | | | | 146 | | | | | 6 | |
Depreciation and Amortization | | | | 792 | | | | | 774 | | | | | 808 | | | | | 18 | | | | | 2 | | | | | (34 | ) | | | | | (4 | ) | |
Income from Equity Method Investments | | | | 37 | | | | | 115 | | | | | 115 | | | | | (78 | ) | | | | | (68 | ) | | | | | — | | | | | — | |
Gain (Loss) on Sale of and (Impairment) on Equity Method Investments | | | | (27 | ) | | | | | 137 | | | | | (272 | ) | | | | | (164 | ) | | | | | N/A | | | | | 409 | | | | | N/A | |
Other Income and Deductions | | | | (116 | ) | | | | | 22 | | | | | 89 | | | | | (138 | ) | | | | | N/A | | | | | | (67 | ) | | | | | (75 | ) | |
Interest Expense | | | | (594 | ) | | | | | (727 | ) | | | | | (788 | ) | | | | | (133 | ) | | | | | (18 | ) | | | | | (61 | ) | | | | | (8 | ) | |
Income Tax Expense | | | | (926 | ) | | | | | (1,064 | ) | | | | | (457 | ) | | | | | (138 | ) | | | | | (13 | ) | | | | | 607 | | | | | N/A | |
Income (Loss) from Discontinued Operations, net of tax | | | | 33 | | | | | (38 | ) | | | | | 47 | | | | | 71 | | | | | N/A | | | | | (85 | ) | | | | | N/A | |
Gain on Disposal of Discontinued Operations, net of tax | | | | 172 | | | | | 48 | | | | | 19 | | | | | 124 | | | | | N/A | | | | | 29 | | | | | N/A | |
The 2008 year-over-year decrease in our Income from Continuing Operations reflects the following:
|
¡ | | | | After-tax charges of $490 million were recorded in June 2008 associated with deductions taken for tax purposes on certain types of leveraged lease transactions at Energy Holdings that are being challenged by the IRS. See Note 11. Commitments and Contingent Liabilities for additional information. |
53
|
¡ | | | | Earnings were slightly lower at PSE&G due to lower gas delivery sales and higher Operations and Maintenance expense. |
|
¡ | | | | Earnings were higher at Power due to higher prices realized under sales contracts and higher sales volumes, partially offset by higher generation costs, losses in the NDT Funds and higher Operation and Maintenance Costs. |
|
¡ | | | | Excluding the lease transaction charges, Energy Holdings earnings were higher due to lower interest and bond premiums and improved operations at the Texas generation facilities, partially offset by lower income from assets sold. |
For a detailed explanation of the variances, see the discussions for Power, PSE&G and Energy Holdings below.
Power
| | | | | | | | | | | | For the Years Ended
December 31, | | Increase /
(Decrease) | | Increase /
(Decrease) |
| | 2008 | | 2007 | | 2006 | | 2008 vs 2007 | | 2007 vs 2006 |
| | Millions |
Income from Continuing Operations | | | $ | | 1,050 | | | | $ | | 949 | | | | $ | | 515 | | | | $ | | 101 | | | | $ | | 434 | |
Loss from Discontinued Operations, including Loss on Disposal, net of tax | | | | — | | | | | (8 | ) | | | | | (239 | ) | | | | | (8 | ) | | | | | (231 | ) | |
Net Income | | | $ | | 1,050 | | | | $ | | 941 | | | | $ | | 276 | | | | $ | | 93 | | | | $ | | 203 | |
For the year ended December 31, 2008, the primary reasons for the increase in Income from Continuing Operations were
|
• | | | | higher prices and sales volumes on BGS contracts and in the various power pools, partially offset by higher generation costs, and |
|
• | | | | higher prices on a reduced sales volume under the BGSS contract due to customer conservation and a milder winter heating season in 2008, |
|
• | | | | partially offset by net losses on investments in the NDT Funds. |
For the year ended December 31, 2007, the primary reasons for the increase in Income from Continuing Operations were
|
• | | | | higher prices realized from new contracts, including BGS contracts, combined with higher sales volumes and lower generation costs, and |
|
• | | | | improved margins and higher sales volumes under the BGSS contract due to a colder winter heating season and more favorable fuel pricing in 2007. |
54
The year-over-year detail for these variances for these periods are discussed below:
| | | | | | | | | | | | | | |
Power | | For the Years Ended
December 31, | | Increase /
(Decrease) | | Increase /
(Decrease) |
| | 2008 | | 2007 | | 2006 | | 2008 vs 2007 | | 2007 vs 2006 |
| | Millions | | Millions | | % | | Millions | | % |
Operating Revenues | | | $ | | 7,770 | | | | $ | | 6,796 | | | | $ | | 6,057 | | | | $ | | 974 | | | | | 14 | | | | $ | | 739 | | | | | N/A | |
Energy Costs | | | | 4,556 | | | | | 3,975 | | | | | 3,955 | | | | | 581 | | | | | 15 | | | | | 20 | | | | | 1 | |
Operation and Maintenance | | | | 1,054 | | | | | 1,001 | | | | | 1,002 | | | | | 53 | | | | | 5 | | | | | (1 | ) | | | | | — | |
Depreciation and Amortization | | | | 164 | | | | | 140 | | | | | 140 | | | | | 24 | | | | | 17 | | | | | — | | | | | — | |
Other Income and Deductions | | | | (121 | ) | | | | | 69 | | | | | 66 | | | | | (190 | ) | | | | | (275 | ) | | | | | 3 | | | | | 5 | |
Interest Expense | | | | (164 | ) | | | | | (159 | ) | | | | | (148 | ) | | | | | 5 | | | | | 3 | | | | | 11 | | | | | 7 | |
Income Tax Expense | | | | (661 | ) | | | | | (641 | ) | | | | | (363 | ) | | | | | 20 | | | | | 3 | | | | | 278 | | | | | 77 | |
Loss from Discontinued Operations, including Loss on Disposal, net of tax | | | $ | | — | | | | $ | | (8 | ) | | | | $ | | (239 | ) | | | | $ | | 8 | | | | | 100 | | | | $ | | (231 | ) | | | | | (97 | ) | |
For the year ended December 31, 2008 as compared to 2007
Operating Revenuesincreased $974 million due to:
|
• | | | | Generationrevenues increased $797 million due to |
| | | a net increase of $355 million from higher prices on a higher volume of BGS contracts modestly offset by the expiration of several contracts in May 2008, | |
¡ | | | | higher revenues of $331 million and $20 million resulting from a higher volume of generation being sold at higher prices into PJM and NEPOOL, respectively, |
|
¡ | | | | $33 million from higher prices on a lower volume of sales in the New York power pool, |
|
¡ | | | | $67 million from higher capacity prices resulting from the changes in the capacity markets in PJM, New York and Connecticut, and |
|
¡ | | | | $32 million for ancillary and other services as well as a damage claim awarded by the federal government for an oil spill in the Delaware River in 2004, |
|
¡ | | | | partially offset by $25 million of net losses on financial hedging transactions. |
|
• | | | | Gas Supplyrevenues increased $154 million |
| | | including $130 million resulting from sales under the BGSS contract, comprised of $208 million from higher prices partly offset by lower sales volumes of $78 million due to customer conservation and milder winter temperatures in 2008, and | |
¡ | | | | a net increase of $27 million due to higher prices on sales to third party customers on a reduced sales volume. |
|
• | | | | Tradingrevenues increased $23 million principally due to gains on electric-related contracts and contracts related to financial transmission rights. |
Operating Expenses
| | | Energy Costsrepresent the cost of generation, which includes fuel purchases for generation as well as purchased energy in the market, and gas purchases to meet Power’s obligation under its BGSS contract with PSE&G. Energy Costs increased by $581 million due to: | | | | Generation costsincreased by $410 million due to $445 million of higher fuel costs related to higher prices and higher volumes of natural gas and $17 million of higher costs of purchases reflecting higher prices, partly offset by net gains of $59 million from financial hedging transactions. | 55
|
¡ | | | | Gas costsincreased $171 million, reflecting net increases of $150 million and $34 million related to Power’s obligations under the BGSS contract and sales to third party customers, respectively, reflecting higher inventory costs partially offset by reduced volumes. These increases were partially offset by a reduction of $14 million in losses on financial hedging transactions in 2008 as compared to 2007. |
| | | Operation and Maintenanceincreased $53 million primarily due to | | | | a net increase of $47 million due to planned outages and higher maintenance costs at our fossil stations, primarily Hudson and Linden, and | |
¡ | | | | an increase of $10 million related to planned outages at the Peach Bottom and Salem stations. |
|
• | | | | Depreciation and Amortizationincreased $24 million due to |
| | | an increase of $14 million resulting from a larger depreciable nuclear and fossil asset base in 2008, and | |
¡ | | | | an increase of $9 million due to depreciation of pollution control equipment being placed into service at our Bridgeport generating facility. |
Other Income and Deductionsdecreased $190 million due to
|
• | | | | higher charges of $147 million ($219 million in 2008 versus $72 million in 2007) for other-than-temporary impairments related to the NDT Fund securities, |
|
• | | | | net unrealized losses of $24 million on the NDT Fund derivative instruments, |
|
• | | | | lower interest income of $13 million from short-term loans to our parent company, and |
|
• | | | | a $13 million charge for the purchase of net operating loss carryforwards under the State of New Jersey Tax Benefit Purchase Program, |
|
• | | | | partially offset by an increase of $5 million from net realized income related to the NDT Funds. |
Interest Expenseincreased $5 million primarily due to the issuance of $40 million of 5.75% Pollution Control Bonds due 2037 in November 2007 and $44 million of 4.00% Pollution Control Bonds due 2042 in December 2007.
Income Tax Expenseincreased $20 million in 2008 primarily due to
|
• | | | | an increase of $50 million due to higher pre-tax income, |
|
• | | | | partially offset by a reduction of $16 million due to lower earnings from the NDT Funds, and |
|
• | | | | a reduction of $9 million due to increased benefits from a manufacturing deduction under the American Jobs Creation Act of 2004. |
For the year ended December 31, 2007 as compared to 2006
Operating Revenuesincreased $739 million due to:
|
• | | | | Generationrevenues increased $416 million |
| | | due to higher revenues of $355 million from higher prices on BGS fixed-price contracts, and | |
¡ | | | | $149 million from higher capacity prices resulting from the changes in the capacity markets in PJM and Connecticut, which resulted in $47 million in reduced RMR revenues in these markets. |
|
¡ | | | | Power also had increased revenues resulting from more generation being sold into the various pools following the expiration of certain wholesale power contracts. The increased revenues from sales into the various pools offset the reduction in wholesale contract revenues. |
56
|
• | | | | Gas Supplyrevenues increased $349 million |
| | | including $248 million resulting from higher sales volumes under the BGSS contract, largely due to colder average temperatures in the 2007 winter heating season, | |
¡ | | | | recognition of gains of $69 million on financial hedging transactions, and |
|
¡ | | | | to a lesser degree, increases due to increased pricing and volumes sold to other gas distributors and increased revenues received for balancing and storage due to higher sales volumes and higher tariff rates that became effective in January 2007. |
|
• | | | | Tradingrevenues decreased $26 million mainly due to the absence of gains related to emissions credits that were realized in 2006. |
Operating Expenses
| | | Energy Costsincreased $20 million due to: | | | | Gas Costsincreased $247 million due to a $209 million net increase from a higher volume of gas sold at lower prices to satisfy Power’s BGSS obligations, an increase of $22 million from a higher volume of sales to third party customers and an increase of $16 million due to the recognition of losses in 2007 coupled with gains in 2006 related to financial hedging transactions. | |
¡ | | | | Generation Costsdecreased $227 million due to lower pool purchases of $240 million, resulting from reduced load obligations in Connecticut following the expiration of a wholesale power contract in 2006, combined with $124 million in lower congestion and transmission costs. These decreases were partially offset by an increase of $154 million due to higher volumes of fuel purchases, primarily natural gas, as these units ran more during 2007. |
|
• | | | | Operation and Maintenancedecreased $1 million due to |
| | | a write-down of $44 million in 2006 related to four turbines which were sold in April 2007. For additional information, see Note 3. Discontinued Operations, Dispositions and Impairments, | |
¡ | | | | mostly offset by an increase of $43 million due to costs incurred in 2007 related to various maintenance projects at certain fossil stations, mainly Hudson and Mercer. |
|
• | | | | Depreciation and Amortizationexperienced no material change |
Other Income and Deductionsincreased $3 million due to
| | | increased net realized income of $42 million related to the NDT Funds, | | | | the absence of $14 million of penalties that were recorded in 2006 related to negotiations concerning environmental concerns and an alternate pollution reduction plan for Hudson, and | |
• | | | | increased interest income of $13 million from short-term loans to our parent company, |
|
• | | | | partially offset by increased charges of $58 million recorded in 2007 for other-than-temporary impairments related to the NDT Fund securities, and |
|
• | | | | the absence of $6 million of expense reversals recorded in 2006 related to certain excess liability reserves. |
57
Interest Expenseincreased $11 million due to
• | | | �� | a $20 million increase due to the reclassification of Interest Expense to Discontinued Operations of the Lawrenceburg facility combined with a $23 million increase due to the absence of capitalized interest related to the Linden construction project since its completion in May 2006, |
|
• | | | | partially offset by a reduction of $15 million due to interest capitalized on a higher volume of construction projects in 2007, |
|
• | | | | the absence of $10 million of interest expense in 2007 due to the maturity of the 6.87% Senior Notes in April 2006, as well as |
|
• | | | | decreases in interest incurred on lower average short-term borrowings from our parent company and lower commitment and letter of credit fees. |
Income Tax Expenseincreased $278 million in 2007 primarily due to higher pre-tax income.
Loss from Discontinued Operations, including Loss on Disposal, net of tax
In connection with the sale of its Lawrenceburg generation facility, Power recorded an after-tax charge of $208 million which was reflected in Discontinued Operations in the fourth quarter of 2006. After-tax Losses from Discontinued Operations of Lawrenceburg, not including the Loss on Disposal, were $8 million and $31 million for the years ended December 31, 2007 and 2006, respectively. See Note 3. Discontinued Operations, Dispositions and Impairments for additional information.
PSE&G
| | | | | | | | | | |
| | For the Years Ended
December 31, | | Increase /
(Decrease) | | Increase /
(Decrease) |
| | 2008 | | 2007 | | 2006 | | 2008 vs 2007 | | 2007 vs 2006 |
| | Millions |
Income from Continuing Operations | | | $ | | 364 | | | | $ | | 380 | | | | $ | | 265 | | | | $ | | (16 | ) | | | | $ | | 115 | |
Net Income | | | $ | | 364 | | | | $ | | 380 | | | | $ | | 265 | | | | $ | | (16 | ) | | | | $ | | 115 | |
For the year ended December 31, 2008, the primary reasons for the decrease in Income from Continuing Operations were
|
• | | | | lower revenues due to lower customer demand resulting from current economic conditions, and |
|
• | | | | lower electric and gas sales volumes due to a milder winter heating season, |
|
• | | | | partially offset by FIN 48 tax adjustments related to an IRS refund and other tax items. |
For the year ended December 31, 2007, the primary reasons for the increase in Income from Continuing Operations were
|
• | | | | the full year effect of the electric and gas base rate increases which became effective in November 2006, and |
|
• | | | | the return to a normal heating load (degree days were 16% higher in 2007 compared to 2006) for gas and a 2% growth in electric sales. |
58
The year-over-year detail for these variances for these periods are discussed below:
| | | | | | | | | | | | | | |
PSE&G | | For the Years Ended
December 31, | | Increase /
(Decrease) | | Increase /
(Decrease) |
| | 2008 | | 2007 | | 2006 | | 2008 vs 2007 | | 2007 vs 2006 |
| | Millions | | Millions | | % | | Millions | | % |
Operating Revenues | | | $ | | 9,038 | | | | $ | | 8,493 | | | | $ | | 7,569 | | | | $ | | 545 | | | | | 6 | | | | $ | | 924 | | | | | 12 | |
Energy Costs | | | | 6,072 | | | | | 5,498 | | | | | 4,884 | | | | | 574 | | | | | 10 | | | | | 614 | | | | | 13 | |
Operation and Maintenance | | | | 1,338 | | | | | 1,308 | | | | | 1,160 | | | | | 30 | | | | | 2 | | | | | 148 | | | | | 13 | |
Depreciation and Amortization | | | | 583 | | | | | 591 | | | | | 620 | | | | | (8 | ) | | | | | (1 | ) | | | | | (29 | ) | | | | | (5 | ) | |
Other Income and Deductions | | | | 8 | | | | | 12 | | | | | 22 | | | | | (4 | ) | | | | | (33 | ) | | | | | (10 | ) | | | | | (45 | ) | |
Interest Expense | | | | (325 | ) | | | | | (332 | ) | | | | | (346 | ) | | | | | (7 | ) | | | | | (2 | ) | | | | | (14 | ) | | | | | (4 | ) | |
Income Tax Expense | | | | (228 | ) | | | | | (257 | ) | | | | | (183 | ) | | | | | (29 | ) | | | | | (11 | ) | | | | | 74 | | | | | 40 | |
For the year ended December 31, 2008 as compared to 2007
Operating Revenuesincreased $545 million primarily due to:
|
• | | | | Commodityrelated revenues increased $573 million due to |
| | | increased electric revenues of $432 million primarily due to $379 million in higher BGS revenues (higher auction prices of $491 million offset by decreased sales of $112 million) and $75 million in higher non-utility generation (NUG) prices, and | |
|
¡ | | | | increased gas revenues of $141 million due to $234 million in increased BGSS prices offset by $93 million in lower sales due to weather and economic conditions. |
| | | Deliveryrevenues decreased $23 million due to | | | | decreased gas revenues of $23 million due to $14 million of lower SBC revenues and $9 million of lower sales due to weather and economic conditions. The SBC revenues were 10% lower in 2008, and | |
¡ | | | | flat electric revenues including $49 million in decreased sales and demands due to weather and economic conditions and a lower transmission peak, offset by $49 million for SBC, securitization transition charge and transmission rate increases. PSE&G retains no margins from SBC or STC collections as the revenues are offset in operating expenses below. |
Operating Expenses
|
• | | | | Energy Costsincreased $574 million due to |
| | | increased electric costs of $432 million due to $556 million or 17% in higher prices for BGS and NUG purchases offset by $124 million or 4% in lower BGS volumes due to weather and economic conditions, and | |
¡ | | | | increased gas costs of $142 million due to $234 million or 11% in higher prices offset by $93 million or 4% in lower sales volumes due to weather and economic conditions. |
|
• | | | | Operation and Maintenanceincreased $30 million primarily due to |
| | | increases in Electric SBC expenses of $42 million, and | |
¡ | | | | $8 million of bad debt expense, |
|
¡ | | | | partially offset by lower injuries and damages of $8 million, |
|
¡ | | | | lower gas SBC expenses of $6 million which were offset in delivery revenues with no impact on net income, and |
59
|
¡ | | | | decreased payroll and fringes of $8 million. |
|
• | | | | Depreciation and Amortizationdecreased $8 million due to |
| | | decreases of $10 million for amortization of regulatory assets, | |
¡ | | | | $5 million in software amortization, and |
|
¡ | | | | $5 million in amortization of DOE enrichment facility decommissioning costs, |
|
¡ | | | | partially offset by increases of $12 million due to additional plant in service. |
Other Income and Deductionsdecreased $4 million due to
|
• | | | | $7 million in lower investment income due to current market conditions, |
|
• | | | | partially offset by a $3 million reduction in income tax gross-ups on contributions in aid of construction (CIAC). CIAC is taxable and PSE&G recognizes the gross-up as income when collected. |
Interest Expenseexperienced no material change.
Income Tax Expensedecreased $29 million primarily due to
|
• | | | | $18 million on lower pre-tax income, and |
|
• | | | | $17 million in FIN 48 adjustments related to an IRS refund. |
For the year ended December 31, 2007 as compared to 2006
Operating Revenuesincreased $924 million primarily due to:
|
• | | | | Commodityrelated revenues increased $613 million due to |
| | | increased electric revenues of $510 million due to | | | | $541 million in higher BGS revenues (higher auction prices of $484 million plus increased sales of $57 million), and | |
™ | | | | $44 million in higher NUG prices, |
|
™ | | | | offset by a $74 million decrease in the NGC revenues ($78 million in lower prices due to a March 2007 rate change offset by $4 million in higher volumes), |
|
¡ | | | | increased gas revenues of $103 million due to $240 million in increased sales due to weather offset by $137 million in lower BGSS prices. |
| | | Deliveryrevenues increased $301 million due to | | | | Electric revenues increased $169 million due to $83 million for increased SBC rates, $42 million due to increased base rates effective November 2006 and $44 million in increased sales and demands primarily due to weather. | |
¡ | | | | Gas revenues increased $132 million due to weather, $39 million due to the SBC rate increases in November 2006 and March 2007 and $31 million due to base rate increases effective November 2006. |
Operating Expenses
|
• | | | | Energy Costsincreased $614 million due to |
| | | increased electric costs of $512 million due to $453 million or 18% in higher prices for BGS and NUG purchases and $59 million or 2% in higher BGS volumes due to weather, and | |
¡ | | | | increased gas costs of $102 million due to a $239 million or 11% increase in sales volumes due to weather offset by $137 million in lower prices. |
60
|
• | | | | Operation and Maintenanceincreased $148 million primarily due to |
| | | increased SBC expenses of $132 million resulting from rate increases in November 2006 and March 2007, which were offset in delivery revenues with no impact on net income, | |
¡ | | | | increased payroll of $16 million, and |
|
¡ | | | | a higher reserve for injuries and damages of $10 million, |
|
¡ | | | | partially offset by $19 million in lower pension expenses. |
|
• | | | | Depreciation and Amortizationdecreased $29 million due to |
| | | decreases of $30 million due to revised plant depreciation rates and $11 million due to lower cost of removal rates, both resulting from the November 2006 rate case, and | |
¡ | | | | a decrease of $8 million for software fully amortized in 2006, |
|
¡ | | | | partially offset by increases of $11 million due to amortization of regulatory assets and $9 million due to additional plant in service. |
Other Income and Deductionsdecreased $10 million primarily due to a $7 million reduction in income tax gross-ups on CIAC.
Interest Expensedecreased $14 million due to
|
• | | | | lower interest expense of $12 million related to settlement of IRS audits in 2006, and |
|
• | | | | lower interest on regulatory clauses of $7 million, |
|
• | | | | partially offset by an increase of $5 million due to new debt issuances in December 2006 and May 2007. |
Income Tax Expenseincreased $74 million primarily due to higher pre-tax income.
Energy Holdings
| | | | | | | | | | |
| | For the Years Ended
December 31, | | Increase /
(Decrease) | | Increase /
(Decrease) |
| | 2008 | | 2007 | | 2006 | | 2008 vs 2007 | | 2007 vs 2006 |
| | Millions |
Income (Loss) from Continuing Operations | | | $ | | (403 | ) | | | | $ | | 63 | | | | $ | | (30 | ) | | | | $ | | (466 | ) | | | | $ | | 93 | |
Income from Discontinued Operations, including Gain on Disposal, net of tax | | | | 205 | | | | | 18 | | | | | 305 | | | | | 187 | | | | | (287 | ) | |
Net Income (Loss) | | | $ | | (198 | ) | | | | $ | | 81 | | | | $ | | 275 | | | | $ | | (279 | ) | | | | $ | | (194 | ) | |
For the year ended December 31, 2008, the primary reasons for the decrease in Income from Continuing Operations were
|
• | | | | the after-tax charge on leveraged leases recorded in the second quarter in 2008, and |
|
• | | | | the absence of income from Chilquinta and LDS which were sold in 2007, |
|
• | | | | partially offset by lower interest expense due to debt retirement and lower premium on bond redemption, and |
|
• | | | | FIN 48 tax adjustments related to an IRS refund. |
For the year ended December 31, 2007, the primary reasons for the increase in Income from Continuing Operations were
|
• | | | | the absence of the loss on the sale of RGE in 2006, |
61
| | | lower operational earnings at our Texas plants, driven by lower volume and lower unrealized MTM gains, partially offset by higher prices, | |
¡ | | | | the loss resulting from the sale of Chilquinta and LDS in 2007, |
|
¡ | | | | higher premium on bond redemption, and |
|
¡ | | | | lower leveraged lease income in 2007. |
The year-over-year detail for these variances for these periods are below:
| | | | | | | | | | | | | | |
Energy Holdings | | For the Years Ended
December 31, | | Increase /
(Decrease) | | Increase /
(Decrease) |
| | 2008 | | 2007 | | 2006 | | 2008 vs 2007 | | 2007 vs 2006 |
| | Millions | | Millions | | % | | Millions | | % |
Operating Revenues | | | $ | | 345 | | | | $ | | 793 | | | | $ | | 929 | | | | $ | | (448 | ) | | | | | (56 | ) | | | | $ | | (136 | ) | | | | | (15 | ) | |
Energy Costs | | | | 496 | | | | | 439 | | | | | 515 | | | | | 57 | | | | | 13 | | | | | (76 | ) | | | | | (15 | ) | |
Operation and Maintenance | | | | 128 | | | | | 126 | | | | | 127 | | | | | 2 | | | | | 2 | | | | | (1 | ) | | | | | (2 | ) | |
Depreciation and Amortization | | | | 29 | | | | | 30 | | | | | 28 | | | | | (1 | ) | | | | | (3 | ) | | | | | 2 | | | | | 7 | |
Income from Equity Method Investments | | | | 37 | | | | | 115 | | | | | 115 | | | | | (78 | ) | | | | | (68 | ) | | | | | — | | | | | — | |
Gain (Loss) on Sale of and (Impairment) on Equity Method Investments | | | | (27 | ) | | | | | 137 | | | | | (272 | ) | | | | | (164 | ) | | | | | N/A | | | | | 409 | | | | | N/A | |
Other Income and (Deductions) | | | | 25 | | | | | (25 | ) | | | | | 15 | | | | | 50 | | | | | N/A | | | | | (40 | ) | | | | | N/A | |
Interest Expense | | | | (83 | ) | | | | | (151 | ) | | | | | (183 | ) | | | | | (68 | ) | | | | | (45 | ) | | | | | (32 | ) | | | | | (17 | ) | |
Income Tax (Expense) Credit | | | | (47 | ) | | | | | (211 | ) | | | | | 36 | | | | | (164 | ) | | | | | (78 | ) | | | | | 247 | | | | | N/A | |
Income from Discontinued Operations, including Gain (Loss) on Disposal, net of tax | | | $ | | 205 | | | | $ | | 18 | | | | $ | | 305 | | | | $ | | 187 | | | | | N/A | | | | $ | | (287 | ) | | | | | (94 | ) | |
For the year ended December 31, 2008 as compared to 2007
Operating Revenuesdecreased $448 million primarily due to
|
• | | | | $485 million charge on leveraged leases in 2008, and |
|
• | | | | $38 million decrease in leveraged lease income, due to lease adjustments, |
|
• | | | | partially offset by $87 million in higher revenue from our Texas plants due to |
|
¡ | | | | $172 million increase in electricity prices, |
|
¡ | | | | partially offset by $31 million in higher unrealized MTM losses, and |
|
¡ | | | | a $54 million decrease in electricity sales. |
Operating Expenses
|
• | | | | Energy Costsincreased $57 million related to our Texas plants primarily due to |
| | | $103 million for higher fuel prices, | |
¡ | | | | partially offset by $41 million in lower fuel consumption, and |
|
¡ | | | | $9 million in higher unrealized MTM gains on gas purchases driven by strengthening of the forward market curve for 2008 and beyond. |
|
• | | | | Operation and Maintenanceincreased $2 million primarily due to higher scheduled maintenance at our Texas plants. |
|
• | | | | Depreciation and Amortizationexperienced no material change. |
62
Income from Equity Method Investmentsdecreased $78 million primarily due to
• | | | | the absence of earnings of $65 million from Chilquinta and LDS which were sold in 2007, and |
|
• | | | | $7 million in lower income from GWF, due to higher fuel costs and lower generation. |
Gain (Loss) on Sale of and Impairment on Equity Method Investmentsdecreased $164 million due to
|
• | | | | the absence of $153 million pre-tax gain on the sale of equity investments in 2007, and |
|
• | | | | $11 million in higher write-downs of investment in PPN and Turboven in 2008 as compared to 2007. |
Other Income and Deductionsincreased $50 million primarily due to
|
• | | | | $46 million of lower loss on the early retirement of debt resulting from the December 2007 redemption of Energy Holdings’ 10% Senior Notes due 2009, and |
|
• | | | | $6 million of higher interest and dividend income. |
Interest Expensedecreased $68 million primarily due to lower debt balances.
Income Tax Expensedecreased $164 million primarily due to
|
• | | | | the absence of $163 million of taxes recorded as a result of the sale of Chilquinta and LDS in 2007, and |
|
• | | | | $37 million of lower FIN 48 expense, |
|
• | | | | partially offset by $14 million in higher taxes on pre-tax income and $18 million of federal and state audit adjustments for prior years paid in 2008. |
Income from Discontinued Operations, including Gains on Disposal, net of tax
In October 2007, we sold our investment in Electroandes. Income from Discontinued Operations, including Gain on Disposal, related to Electroandes for the years ended December 31, 2007 and 2006 was $58 million and $16 million respectively.
| | | SAESA Group | In July 2008, we sold our investment in SAESA Group. Income from Discontinued Operations, including Gain on Disposal, related to SAESA for the years ended December 31, 2008, 2007, and 2006 was $217 million, $(34) million and $57 million, respectively.
| | | Bioenergie | In November 2008, we sold our ownership interest in Bioenergie. Income from Discontinued Operations, including Loss on Disposal, related to Bioenergie for the years ended December 31, 2008, 2007, and 2006 was $(12) million, $(6) million and $6 million respectively.
See Note 3. Discontinued Operations, Dispositions and Impairments for additional information.
For the year ended December 31, 2007 as compared to 2006
Operating Revenuesdecreased $136 million, primarily due to
| | | $114 million in lower generation revenues at our Texas plants, primarily due to | | | | $80 million of lower electricity sales, resulting from forced outages at both facilities, and | |
¡ | | | | $42 million in lower unrealized MTM gains on electricity, largely driven by strengthening of forward curves for 2007, |
|
¡ | | | | partially offset by an $8 million increase in electricity prices, and |
|
• | | | | $17 million in reduced leveraged lease revenue due primarily to the effect of adopting FIN 48 and FSP13-2. |
63
Operating Expenses
| | | Energy Costsdecreased $76 million primarily due to lower generation at our Texas plants | | ¡ | | | | including $42 million in lower fuel consumption, |
|
¡ | | | | $22 million in reduced MTM costs on gas purchases driven by improvement of future spark spreads for 2007 and beyond, and |
|
¡ | | | | an $8 million reduction in purchased power costs. |
|
• | | | | Operation and Maintenanceexperienced no material change. |
|
• | | | | Depreciation and Amortizationexperienced no material change. |
Gain (Loss) on Sale and Impairment of Equity Method Investmentsincreased $409 million primarily due to
|
• | | | | the absence of $263 million pre-tax loss on the sale of RGE in 2006, and |
| | | $153 million pre-tax gain on the sale of equity investments in 2007, | |
• | | | | partially offset by $9 million in higher write-down of investments in PPN and Turboven. |
Other Income and Deductionsdecreased $40 million primarily due to
|
• | | | | $35 million loss on the early retirement of debt resulting from the redemption of Energy Holdings’ Senior Notes in 2007, and |
|
• | | | | $9 million in lower interest income from our parent due to lower average intercompany debt balances. |
Interest Expensedecreased $32 million due to
|
• | | | | $22 million in lower interest expense on senior notes at Energy Holdings due to redemptions, and |
|
• | | | | lower interest expense due to lower non-recourse debt balances. |
Income Tax Expenseincreased $247 million due primarily to
|
• | | | | $163 million of taxes recorded in 2007 as a result of the sale of Chilquinta and LDS, and |
|
• | | | | the absence of the $93 million tax benefit obtained in 2006 on the impairment of RGE. |
LIQUIDITY AND CAPITAL RESOURCES
The following discussion of our liquidity and capital resources is on a consolidated basis, noting the uses and contributions, where material, of our three direct operating subsidiaries.
Financing Methodology
Our capital requirements are met through internally generated cash flows and external financings, consisting of short-term debt for liquidity purposes and long-term debt and equity for capital investments.
PSE&G’s sources of external liquidity include a $600 million multi-year syndicated credit facility as well as bilateral credit agreements. PSE&G’s commercial paper program, which is sized at $600 million, is the primary vehicle for meeting its short-term funding needs. This program provides liquidity to meet seasonal, intra-month and temporary working capital needs. PSE&G does not engage in any intercompany borrowing or lending with PSEG or any other affiliate. PSE&G’s dividend payments to PSEG are consistent with its capital structure objectives which have been established to achieve solid investment grade credit ratings. PSE&G’s long-term financing plan is designed to replace maturities, fund a portion of its capital program and manage short-term debt balances. Generally, PSE&G uses either secured medium-term notes or first mortgage bonds to raise long-term capital which it believes will provide the lowest cost of financing and most consistent access to capital markets.
64
PSEG, Power, Energy Holdings and Services participate in a corporate money pool, an aggregation of daily cash balances designed to efficiently manage their respective short term liquidity needs. Energy Holdings has historically lent to the money pool; its primary source of liquidity is its invested balance with PSEG and a $136 million credit facility. PSEG’s sources of external liquidity include a $1.0 billion multi-year syndicated credit facility as well as bilateral credit agreements. These facilities are available to back-stop PSEG’s $1.0 billion commercial paper program, issue letters of credit, and for general corporate purposes. These facilities may also be used to provide support to Power for the issuance of letters of credit. PSEG’s credit facilities and the $1 billion commercial paper program are available to support PSEG working capital needs or to temporarily fund growth opportunities in advance of obtaining permanent financing. From time to time, PSEG may make equity contributions or provide credit support to its subsidiaries.
Power’s sources of external liquidity include a $1.6 billion syndicated multi-year credit facility. Additionally, from time to time, Power maintains bilateral credit agreements designed to enhance its liquidity position. Credit capacity is primarily used to provide collateral in support of hedging activities and to meet potential collateral postings in the event of a credit rating downgrade below investment grade. Power’s dividends payments to the parent are also designed to be consistent with its capital structure objectives which have been established to achieve solid investment grade credit ratings and provide sufficient financial flexibility. Generally, Power issues either retail medium-term notes or senior unsecured debt to raise long-term capital.
Operating Cash Flows
Our operating cash flows combined with cash on hand and financing activities are expected to be sufficient to fund capital expenditures and shareholder dividend payments, with excess cash available to invest in the business, reduce debt and/or repurchase common stock.
For the year ended December 31, 2008, our operating cash flow increased by $424 million as compared to 2007. For the year ended December 31, 2007, our operating cash flow decreased by $5 million as compared to 2006. The net changes were due to net changes from our subsidiaries as discussed below.
Power
Power’s operating cash flow increased $481 million from $1,205million to $1,686million for the year ended December 31, 2008, as compared to 2007, primarily resulting from an increase of $400 million in net cash collateral receipts, an increase of $121million from net collections of counterparty receivables and an increase in net income of $109million, partially offset by a decrease of $197million due to higher gas and coal inventory prices and a buildup of coal inventory at the end of 2008.
Power’s operating cash flow increased $162 million for the year ended December 31, 2007 as compared to 2006, due principally to an increase in net income of $457 million, net of the Loss on Disposal of Lawrenceburg of $208 million, partially offset by an increase of $322 million in margin receivables related to higher collateral requirements.
PSE&G
PSE&G’s operating cash flow increased $235 million from $678 million to $913 million for the year ended December 31, 2008, as compared to 2007, primarily due to increases of $164 million in deferred income taxes due to bonus depreciation and increased planned 2009 pension contributions; $199 million in collections of customer receivables offset by decreases of $122 million in accounts payable due primarily to lower electric and gas payables; and $39 million in higher 2008 pension fund contributions.
The December 2008 accounts receivable balance was slightly higher than the previous year while December 2007 had increased dramatically in comparison to the prior year when there was unusually mild weather in December 2006. The impact was higher cash flow from receivables in 2008. PSE&G anticipates lower cash collections from customers resulting in higher accounts receivable balances in 2009 due to current economic conditions.
PSE&G’s operating cash flow decreased $128 million for the year ended December 31, 2007, as compared to 2006, primarily due to a decline in cash from working capital. The operating cash flow for the year 2006
65
was $806 million primarily due to very cold weather at the end of 2005 which resulted in increased cash flow during 2006. The return of more normal weather conditions in 2007 caused operating cash flow to decline to the 2005 level.
Energy Holdings
Energy Holdings’ operating cash flow decreased $381 million from $71 million to $(310) million for the year ended December 31, 2008, as compared to 2007. The decrease was mainly attributable to increased tax payments in 2008.
Energy Holdings’ operating cash flow decreased $83 million for the year ended December 31, 2007, as compared to 2006. The decrease was mainly due to a $100 million tax deposit made with the IRS in the fourth quarter of 2007 and the timing of tax payments related to the sales of Elcho, Skawina and RGE in 2006.
Short-Term Liquidity
We have been managing our liquidity to assure that we continue to have sufficient access to cash to operate our businesses in the event the capital markets do not allow for near term financing at reasonable terms. We are also closely monitoring the financial condition and concentration of lenders in our bank facilities. There is no provision in any of the credit facilities that would require other lenders in the facility to assume loan commitments of any financial institution that fails to meet its loan commitments. No single institution is committing more than 9% of the total.
We continually monitor our liquidity and seek to add capacity as needed to meet our liquidity requirements. During 2008, PSEG, Power and PSE&G added capacity of $147 million, $225 million and $28 million, respectively. Each of our credit facilities is restricted as to availability and use to the specific companies as listed below; however, if necessary, the PSEG facilities can also be used to support Power’s liquidity needs. Our total credit facilities and available liquidity as of December 31, 2008 were as follows:
| | | | | | |
Company/Facility | | Total
Facility | | As of
December 31, 2008 |
| | Usage | | Available
Liquidity |
| | Millions |
PSEG | | | $ | | 1,100 | | | | $ | | 13 | | | | $ | | 1,087 | |
Power | | | | 2,000 | | | | | 288 | | | | | 1,712 | |
PSE&G | | | | 600 | | | | | 20 | | | | | 580 | |
Energy Holdings | | | | 136 | | | | | 21 | | | | | 115 | |
| | | | | | |
Total | | | $ | | 3,836 | | | | $ | | 342 | | | | $ | | 3,494 | |
| | | | | | |
During 2009, $400 million of bilateral credit facilities at PSEG and Power are scheduled to expire. While we expect to request renewal of each of these facilities, no assurances can be given that such facilities will be renewed or renewed on reasonable terms.
For additional information on the specific credit facilities, see Note 12. Schedule of Consolidated Debt.
Long-Term Debt Financing
PSEG, Power and PSE&G have $249 million, $250 million and $60 million, respectively, of debt maturities upcoming in 2009, excluding securitized and non-recourse debt. These maturities will occur during the second quarter of 2009 for Power and PSE&G and during the third and fourth quarters for PSEG. In February 2009, Energy Holdings issued a par call notice for the early redemption of its remaining $280 million outstanding non-recourse project debt associated with its Texas assets. The debt, which is due on December 31, 2009, is expected to be redeemed by the end of February 2009. We believe that we will be
66
able to refinance or retire these obligations given our current financial position and demonstrated continued access to the capital markets.
For a discussion of our long-term debt transactions during 2008 and into 2009, see Note 12. Schedule of Consolidated Debt.
Debt Covenants
Our credit agreements may contain maximum debt to equity ratios, minimum cash flow tests and other restrictive covenants and conditions to borrowing. We are currently in compliance with all of our debt covenants. Continued compliance with applicable financial covenants will depend upon our future financial position, level of earnings and cash flows, as to which no assurances can be given.
In addition, under its First and Refunding Mortgage (Mortgage), PSE&G may issue new First and Refunding Mortgage Bonds against previous additions and improvements, provided that its ratio of earnings to fixed charges calculated in accordance with its Mortgage is at least 2 to 1, and/or against retired Mortgage Bonds. As of December 31, 2008, PSE&G’s Mortgage coverage ratio was 4.1 to 1 and the Mortgage would permit up to approximately $2.2 billion aggregate principal amount of new Mortgage Bonds to be issued against additions and improvements to its property.
Default Provisions
Our bank credit agreements and indentures contain various default provisions that could result in the potential acceleration of payment under the defaulting company’s agreement. We have not defaulted under these agreements.
PSEG’s bank credit agreement and note purchase agreements related to private placement of debt contain cross default provisions under which events at Power or PSE&G, including payment defaults, bankruptcy events, the failure to satisfy certain final judgments or other events of default under their financing agreements, would each constitute an event of default under PSEG’s agreements. Under the note purchase agreements, it is also an event of default if Power or PSE&G ceases to be wholly-owned by PSEG. Under the bank credit agreement, both Power and PSE&G would have to cease to be wholly-owned by PSEG before an event of default would occur.
There are no cross default provisions to affiliates in Power’s or PSE&G’s credit agreements or indentures.
Ratings Triggers
Our debt indentures and credit agreements do not contain any material ‘ratings triggers’ that would cause an acceleration of the required interest and principal payments in the event of a ratings downgrade. However, in the event of a downgrade, any one or more of the affected companies may be subject to increased interest costs on certain bank debt and certain collateral requirements.
Fluctuations in commodity prices or a deterioration of Power’s credit rating to below investment grade could increase Power’s required margin postings under various agreements entered into in the normal course of business. Power believes it has sufficient liquidity to meet the required posting of collateral which would likely result from a credit rating downgrade at today’s market prices. See Note 11. Commitments and Contingent Liabilities for further information.
In accordance with BPU requirements under the BGS contracts, PSE&G is required to maintain an investment grade credit rating. If PSE&G were to lose its investment grade rating, it would be required to file a plan to assure continued payment for the BGS requirements of its customers.
PSE&G is the servicer for the bonds issued by PSE&G Transition Funding LLC and PSE&G Transition Funding II LLC. If PSE&G were to lose its investment grade rating, PSE&G would be required to remit collected cash daily to the bond trustee. Currently, cash is remitted monthly.
67
Common Stock Dividends and Repurchases
Dividend payments on common stock for the year ended December 31, 2008 were $1.29 per share and totaled $655 million. Dividend payments on common stock for the year ended December 31, 2007 were $1.17 per share and totaled $594 million.
In July 2008, our Board of Directors authorized the repurchase of up to $750 million of our common stock to be executed over 18 months beginning August 1, 2008. We are not obligated to acquire any specific number of shares and may suspend or terminate share repurchases at any time. We repurchased 2,382,200 shares of our common stock for $92 million under this authorization through September 30, 2008. No repurchases have been made since that date.
On February 17, 2009, our Board of Directors also approved a $0.01 increase in our quarterly common stock dividend, from $0.3225 to $0.3325 per share for the first quarter of 2009. This reflects an indicated annual dividend rate of $1.33 per share. We expect to continue to pay cash dividends on our common stock; however, the declaration and payment of future dividends to holders of our common stock will be at the discretion of the Board of Directors and will depend upon many factors, including our financial condition, earnings, capital requirements of our business, alternate investment opportunities, legal requirements, regulatory constraints, industry practice and other factors that the Board of Directors deems relevant.
Credit Ratings
If the rating agencies lower or withdraw our credit ratings, such revisions may adversely affect the market price of our securities and serve to materially increase our cost of capital and limit access to capital. Outlooks assigned to ratings are as follows: stable, negative (Neg) or positive (Pos). There is no assurance that the ratings will continue for any given period of time or that they will not be revised by the rating agencies, if, in their respective judgments, circumstances warrant. Each rating given by an agency should be evaluated independently of the other agencies’ ratings. The ratings should not be construed as an indication to buy, hold or sell any security. In June 2008, Moody’s affirmed the rating of Energy Holdings and changed the ratings outlook to Stable from Negative. In July 2008, Moody’s affirmed the ratings of PSEG and PSE&G and changed the ratings outlook of both companies to Stable from Negative. The rating and outlook of Power remained unchanged.
| | | | | | |
| | Moody’s(A) | | S&P(B) | | Fitch(C) |
PSEG: | | | | | | |
Outlook | | Stable | | Stable | | Stable |
Commercial Paper | | P2 | | A2 | | F2 |
Power: | | | | | | |
Outlook | | Stable | | Stable | | Stable |
Senior Notes | | Baa1 | | BBB | | BBB+ |
PSE&G: | | | | | | |
Outlook | | Stable | | Stable | | Stable |
Mortgage Bonds | | A3 | | A– | | A |
Preferred Securities | | Baa3 | | BB+ | | BBB+ |
Commercial Paper | | P2 | | A2 | | F2 |
|
(A) | | | | Moody’s ratings range from Aaa (highest) to C (lowest) for long-term securities and P1 (highest) to NP (lowest) for short-term securities. |
|
(B) | | | | S&P ratings range from AAA (highest) to D (lowest) for long-term securities and A1 (highest) to D (lowest) for short-term securities. |
|
(C) | | | | Fitch ratings range from AAA (highest) to D (lowest) for long-term securities and F1 (highest) to D (lowest) for short-term securities. |
68
Other Comprehensive Income
For the year ended December 31, 2008, we had Other Comprehensive Income of $39 million on a consolidated basis. Other Comprehensive Income was primarily due to $429 million of unrealized gains on derivative contracts accounted for as hedges, substantially offset by $79 million of unrealized losses related to the NDT Funds, a $205 million increase in our consolidated liability for pension and postretirement benefits and $106 million of losses from foreign currency translation adjustments.
CAPITAL REQUIREMENTS
It is expected that the majority of our capital requirements over the next three years will come from internally generated funds. Projected construction and investment expenditures, excluding nuclear fuel purchases, for the next three years are presented in the table below. These amounts are subject to change, based on various factors.
| | | | | | |
| | 2009 | | 2010 | | 2011 |
| | Millions |
Power: | | | | | | |
Hudson Environmental | | | $ | | 305 | | | | $ | | 214 | | | | $ | | 5 | |
Mercer Environmental | | | | 101 | | | | | 11 | | | | | 1 | |
Other Environmental | | | | 67 | | | | | 32 | | | | | 13 | |
Exploration of New Nuclear Plant | | | | 11 | | | | | 14 | | | | | 9 | |
Other, including Growth Opportunities | | | | 209 | | | | | 334 | | | | | 341 | |
| | | | | | |
Total Power | | | $ | | 693 | | | | $ | | 605 | | | | $ | | 369 | |
| | | | | | |
|
PSE&G: | | | | | | |
Transmission | | | | | | |
Reliability Enhancements | | | $ | | 211 | | | | $ | | 391 | | | | $ | | 587 | |
Facility Replacement | | | | 81 | | | | | 95 | | | | | 117 | |
Environmental/Regulatory | | | | 4 | | | | | 5 | | | | | 1 | |
Support | | | | 1 | | | | | 1 | | | | | 1 | |
Distribution | | | | | | |
Support Facilities | | | | 39 | | | | | 59 | | | | | 56 | |
New Business | | | | 159 | | | | | 147 | | | | | 154 | |
Reliability Enhancements | | | | 78 | | | | | 153 | | | | | 109 | |
Facility Replacement | | | | 155 | | | | | 152 | | | | | 155 | |
Environmental/Regulatory | | | | 114 | | | | | 108 | | | | | 57 | |
| | | | | | |
Total PSE&G | | | $ | | 842 | | | | $ | | 1,111 | | | | $ | | 1,237 | |
| | | | | | |
Other | | | | 72 | | | | | 128 | | | | | 158 | |
| | | | | | |
Total PSEG | | | $ | | 1,607 | | | | $ | | 1,844 | | | | $ | | 1,764 | |
| | | | | | |
Power
Power’s projected expenditures for the various items listed above are primarily comprised of the following:
|
• | | | | Hudson Environmental—construction of pollution control equipment, including a selective catalytic reduction system, a scrubber, and a baghouse at our Hudson facility. |
|
• | | | | Mercer Environmental—construction of pollution control equipment, including scrubbers, at our Mercer facility. |
|
• | | | | Other Environmental—construction of other pollution control equipment, including scrubbers at our Keystone facility. |
69
|
• | | | | Exploration of New Nuclear Plant—costs associated with exploring the feasibility of, and the technologies involved with, building a new nuclear plant. |
|
• | | | | Other, including Growth Opportunities—costs associated with potential opportunities to build other new plants, such as peaking facilities, and various capital projects at existing facilities to either extend plants’ useful lives or increase operating output. |
In 2008, Power made $822 million of capital expenditures (excluding $150 million for nuclear fuel), primarily related to the Salem steam generator replacement, the Hope Creek uprate, upgrades at Hudson and the baghouse installation at Mercer.
PSE&G
PSE&G’s projections for future capital expenditures include additions and replacements to its transmission and distribution systems to meet expected growth and to manage reliability. As project scope and cost estimates develop, PSE&G will modify its current projections to include these required investments. PSE&G’s projected expenditures for the various items reported above are primarily comprised of the following:
|
• | | | | Support Facilities—ancillary equipment needed to support the business lines, such as computers, office furniture, and buildings and structures housing support personnel or equipment/inventory. |
|
• | | | | New Business—investments made in support of new business to PSE&G (e.g. add new customers). |
|
• | | | | Reliability Enhancements—investments made to improve the reliability and efficiency of the system or function. |
|
• | | | | Facility Replacement—investments made to replace systems or equipment in kind. |
|
• | | | | Environmental/Regulatory—investments made in response to regulatory or legal mandates where financial loss is imminent if not pursued. |
In 2008, PSE&G made $761 million of capital expenditures, primarily for transmission and distribution system reliability. This does not include $44 million spent on cost of removal.
Disclosures about Long-Term Maturities, Contractual and Commercial Obligations and Certain Investments
The following table reflects our contractual cash obligations and other commercial commitments in the respective periods in which they are due. See Note 11. Commitments and Contingent Liabilities for a discussion of contractual commitments for a variety of services for which annual amounts are not quantifiable. In addition, the table summarizes anticipated recourse and non-recourse debt maturities for the years shown. The table does not reflect debt maturities of Energy Holdings’ non-consolidated investments. If those obligations were not able to be refinanced by the project, Energy Holdings may elect to make additional contributions in these investments. For additional information, see Note 12. Schedule of Consolidated Debt. The table below does not reflect any anticipated cash payments for pension obligations due to uncertain timing of payments or liabilities under FIN 48 since we are unable to reasonably estimate the timing of FIN 48 liability payments in individual years beyond 12 months due to uncertainties in the timing of the effective settlement of tax positions. See Note 18. Income Taxes for additional information.
70
| | | | | | | | | | |
| | Total
Amount
Committed | | Less
Than
1 year | | 2-3
years | | 4-5
years | | Over
5 years |
| | Millions |
Contractual Cash Obligations | | | | | | | | | | |
Short-Term Debt Maturities | | | | | | | | | | |
PSEG | | | $ | | — | | | | $ | | — | | | | $ | | — | | | | $ | | — | | | | $ | | — | |
PSE&G | | | | 19 | | | | | 19 | | | | | — | | | | | — | | | | | — | |
Long-Term Recourse Debt Maturities | | | | | | | | | | |
PSEG | | | | 249 | | | | | 249 | | | | | — | | | | | — | | | | | — | |
Power | | | | 2,908 | | | | | 250 | | | | | 800 | | | | | 666 | | | | | 1,192 | |
PSE&G | | | | 3,531 | | | | | 60 | | | | | 300 | | | | | 1,025 | | | | | 2,146 | |
Transition Funding (PSE&G) | | | | 1,454 | | | | | 178 | | | | | 381 | | | | | 418 | | | | | 477 | |
Transition Funding II (PSE&G) | | | | 76 | | | | | 10 | | | | | 22 | | | | | 24 | | | | | 20 | |
Energy Holdings | | | | 505 | | | | | — | | | | | 505 | | | | | — | | | | | — | |
Long-Term Non-Recourse Project Financing | | | | | | | | | | |
Energy Holdings | | | | 328 | | | | | 286 | | | | | 26 | | | | | 7 | | | | | 9 | |
Interest on Recourse Debt | | | | | | | | | | |
PSEG | | | | 13 | | | | | 13 | | | | | — | | | | | — | | | | | — | |
Power | | | | 1,659 | | | | | 191 | | | | | 342 | | | | | 181 | | | | | 945 | |
PSE&G | | | | 2,494 | | | | | 190 | | | | | 360 | | | | | 339 | | | | | 1,605 | |
Transition Funding (PSE&G) | | | | 379 | | | | | 93 | | | | | 150 | | | | | 98 | | | | | 38 | |
Transition Funding II (PSE&G) | | | | 12 | | | | | 3 | | | | | 5 | | | | | 3 | | | | | 1 | |
Energy Holdings | | | | 107 | | | | | 43 | | | | | 64 | | | | | — | | | | | — | |
Interest on Non-Recourse Project Financing | | | | | | | | | | |
Energy Holdings | | | | 31 | | | | | 24 | | | | | 4 | | | | | 2 | | | | | 1 | |
Capital Lease Obligations | | | | | | | | | | |
PSEG | | | | 49 | | | | | 7 | | | | | 14 | | | | | 15 | | | | | 13 | |
Power | | | | 11 | | | | | 1 | | | | | 3 | | | | | 4 | | | | | 3 | |
Energy Holdings | | | | — | | | | | — | | | | | — | | | | | — | | | | | — | |
Operating Leases | | | | — | | | | | | | | | |
Power | | | | 39 | | | | | 39 | | | | | — | | | | | — | | | | | — | |
PSE&G | | | | 14 | | | | | 4 | | | | | 6 | | | | | 2 | | | | | 2 | |
Energy Holdings | | | | 2 | | | | | 1 | | | | | 1 | | | | | — | | | | | — | |
Energy-Related Purchase Commitments | | | | | | | | | | |
Power | | | | 3,173 | | | | | 972 | | | | | 1,292 | | | | | 536 | | | | | 373 | |
Energy Holdings | | | | 94 | | | | | 94 | | | | | — | | | | | — | | | | | — | |
| | | | | | | | | | |
Total Contractual Cash Obligations | | | $ | | 17,147 | | | | $ | | 2,727 | | | | $ | | 4,275 | | | | $ | | 3,320 | | | | $ | | 6,825 | |
| | | | | | | | | | |
Commercial Commitments | | | | | | | | | | |
Standby Letters of Credit |
Power | | | $ | | 302 | | | | $ | | 302 | | | | $ | | — | | | | $ | | — | | | | $ | | — | |
Energy Holdings | | | | 20 | | | | | 20 | | | | | — | | | | | — | | | | | — | |
Guarantees and Equity Commitments | | | | | | | | | | |
Energy Holdings | | | | 8 | | | | | 6 | | | | | 2 | | | | | — | | | | | — | |
| | | | | | | | | | |
Total Commercial Commitments | | | $ | | 330 | | | | $ | | 328 | | | | $ | | 2 | | | | $ | | — | | | | $ | | — | |
| | | | | | | | | | |
Liability Payments Under FIN 48 |
PSEG | | | $ | | 46 | | | | $ | | 46 | | | | $ | | — | | | | $ | | — | | | | $ | | — | |
Energy Holdings | | | | 21 | | | | | 21 | | | | | — | | | | | — | | | | | — | |
71
OFF-BALANCE SHEET ARRANGEMENTS
Power
Power issues guarantees in conjunction with certain of its energy contracts. See Note 11. Commitments and Contingent Liabilities for further discussion.
Energy Holdings
We have certain investments that are accounted for under the equity method in accordance with accounting principles generally accepted in the United States (GAAP). Accordingly, amounts recorded in the Consolidated Balance Sheets for such investments represent our equity investment, which is increased for our pro-rata share of earnings less any dividend distribution from such investments. The companies in which we invest that are accounted for under the equity method have an aggregate $154 million of debt on their combined, Consolidated Balance Sheets. Our pro-rata share of such debt is $81 million. This debt is non-recourse to us. We are generally not required to support the debt service obligations of these companies. However, default with respect to this non-recourse debt could result in a loss of invested equity.
Energy Holdings has investments in leveraged leases that are accounted for in accordance with SFAS No. 13, “Accounting for Leases.” Leveraged lease investments generally involve three parties: an owner/lessor, a creditor and a lessee. In a typical leveraged lease financing, the lessor purchases an asset to be leased. The purchase price is typically financed 80% with debt provided by the creditor and the balance comes from equity funds provided by the lessor. The creditor provides long-term financing to the transaction secured by the property subject to the lease. Such long-term financing is non-recourse to the lessor and is not presented on our Consolidated Balance Sheets. In the event of default, the leased asset, and in some cases the lessee, secure the loan. As a lessor, Energy Holdings has ownership rights to the property and rents the property to the lessees for use in their business operation. For additional information, see Note 6. Long-Term Investments.
In the event that collectibility of the minimum lease payments to be received by Energy Holdings is no longer reasonably assured, the accounting treatment for some of the leases may change. In such cases, Energy Holdings may deem that a lessee has a high probability of defaulting on the lease obligation, and would reclassify the lease from a leveraged lease to an operating lease and would consider the need to record an impairment of its investment. Should Energy Holdings ever directly assume a debt obligation, the fair value of the underlying asset and the associated debt would be recorded on the Consolidated Balance Sheets instead of the net equity investment in the lease.
CRITICAL ACCOUNTING ESTIMATES
Under GAAP, many accounting standards require the use of estimates, variable inputs and assumptions (collectively referred to as estimates) that are subjective in nature. Because of this, differences between the actual measure realized versus the estimate can have a material impact on results of operations, financial position and cash flows. We have determined that the following estimates are considered critical to the application of rules that relate to the respective businesses.
Accounting for Pensions
We account for pensions under SFAS No. 87, “Employers’ Accounting for Pensions” (SFAS 87). Pension costs under SFAS 87 are calculated using various economic and demographic assumptions. Economic assumptions include the discount rate and the long-term rate of return on trust assets. Demographic assumptions include projections of future mortality rates, pay increases and retirement patterns.
| | | | | | |
Assumption | | 2009 | | 2008 | | 2007 |
Discount Rate | | | | 6.80 | % | | | | | 6.50 | % | | | | | 6.00 | % | |
Rate of Return on Plan Assets | | | | 8.75 | % | | | | | 8.75 | % | | | | | 8.75 | % | |
72
Our discount rate assumption, which is determined annually, is based on the rates of return on high-quality fixed-income investments currently available and expected to be available during the period to maturity of the pension benefits. The discount rate used to calculate pension obligations is determined as of December 31 each year, our SFAS 87 measurement date. The discount rate used to determine year-end obligations is also used to develop the following year’s net periodic pension cost.
Our expected rate of return on plan assets reflects current asset allocations, historical long-term investment performance and an estimate of future long-term returns by asset class and long-term inflation assumptions.
Based on the above assumptions, we have estimated net periodic pension expense of approximately $162 million, net of amounts capitalized, and contributions of up to $275 million in 2009. As part of the business planning process, we have modeled future costs assuming an 8.75% rate of return and a 6.80% discount rate for 2010 and beyond. Actual future pension expense and funding levels will depend on future investment performance, changes in discount rates, market conditions, funding levels relative to our projected benefit obligation and accumulated benefit obligation and various other factors related to the populations participating in the pension plans.
The following chart reflects the sensitivities associated with a change in certain assumptions. The effects of the assumption changes shown below solely reflect the impact of that specific assumption.
| | | | | | | | |
| | | | | | As of 12/31/2008
Impact on Pension
Benefit Obligation | | Increase to
Pension Expense
in 2009 |
Assumption | | 2009 | | Change | | Millions |
Discount Rate | | | | 6.80 | % | | | | | -1 | % | | | | $ | | 444 | | | | $ | | 42 | |
Rate of Return on Plan Assets | | | | 8.75 | % | | | | | -1 | % | | | | $ | | — | | | | $ | | 25 | |
Accounting for Deferred Taxes
We provide for income taxes based on the liability method required by SFAS No. 109, “Accounting for Income Taxes” (SFAS 109). Under this method, deferred tax assets and liabilities are recognized for the future tax consequences attributable to differences between the financial statement carrying amounts of existing assets and liabilities and their respective tax basis, as well as net operating loss and credit carryforwards.
We evaluate the need for a valuation allowance against respective deferred tax assets based on the likelihood of expected future taxable income. We do not believe a valuation allowance is necessary; however, if the expected level of future taxable income changes or certain tax planning strategies become unavailable, we would record a valuation allowance through income tax expense in the period the valuation allowance is deemed necessary. Our subsidiaries’ ability to realize their deferred tax assets are dependent on other subsidiaries’ ability to generate ordinary income and capital gains.
Uncertain Tax Positions
We are required to make judgments regarding the potential tax effects of various financial transactions and results of operations in order to estimate our obligations to taxing authorities. Beginning January 1, 2007, we began accounting for uncertain income tax positions using a benefit recognition model with a two-step approach, a more-likely-than-not recognition criterion and a measurement attribute that measures the position as the largest amount of tax benefit that is greater than 50% likely of being realized upon ultimate settlement in accordance with FIN 48. If it is not more likely than not that the benefit will be sustained on its technical merits, no benefit will be recorded. Uncertain tax positions that relate only to timing of when an item is included on a tax return are considered to have met the recognition threshold. Prior to January 1, 2007, we estimated our uncertain income tax obligations in accordance with SFAS 109 and SFAS No. 5, “Accounting for Contingencies” (SFAS No. 5). We also have non-income tax obligations related to real estate, sales and use and employment-related taxes and ongoing appeals related to these tax matters that are outside the scope of FIN 48 and accounted for under SFAS No. 5.
73
Accounting for tax obligations requires judgments, including estimating reserves for potential adverse outcomes regarding tax positions that have been taken. We also assess our ability to utilize tax attributes, including those in the form of carryforwards, for which the benefits have already been reflected in the financial statements. We do not record valuation allowances for deferred tax assets related to capital losses that we believe will be realized in future periods. While we believe the resulting tax reserve balances as of December 31, 2008 are appropriately accounted for in accordance with FIN 48, SFAS No. 5 and SFAS No. 109, as applicable, the ultimate outcome of such matters could result in favorable or unfavorable adjustments to our consolidated financial statements and such adjustments could be material.
Hedge and MTM Accounting
SFAS No. 133, “Accounting for Derivative Instruments and Hedging Activities” (SFAS 133) requires an entity to recognize the fair value of derivative instruments held as assets or liabilities on the balance sheet. SFAS 133 applies to all derivative instruments that we hold. The fair value of most derivative instruments is determined by reference to quoted market prices, listed contracts, or quotations from brokers. Some of these derivative contracts are long-term and rely on forward price quotations over the entire duration of the derivative contracts.
In the absence of the pricing sources listed above, for a small number of contracts, we utilize mathematical models that rely on historical data to develop forward pricing information in the determination of fair value. Because the determination of fair value using such models is subject to significant assumptions and estimates, we developed reserve policies that are consistently applied to model-generated results to determine reasonable estimates of value to record in the financial statements.
We have entered into various derivative instruments to hedge exposure to commodity price risk and interest rate risk. Many such instruments have been designated as cash flow hedges. For a cash flow hedge, the change in the value of a derivative instrument is measured against the offsetting change in the value of the underlying contract, anticipated transaction or other business condition that the derivative instrument is intended to hedge. This is known as the measure of derivative effectiveness. In accordance with SFAS 133, the effective portion of the change in the fair value of a derivative instrument designated as a cash flow hedge is reported in Accumulated Other Comprehensive Loss, net of tax, or as a Regulatory Asset (Liability). Amounts in Accumulated Other Comprehensive Loss are ultimately recognized in earnings when the related hedged forecasted transaction occurs. During periods of extreme price volatility, there will be significant changes in the value recorded in Accumulated Other Comprehensive Loss. The changes in the fair value of the ineffective portions of derivative instruments designated as cash flow hedges are recorded in earnings.
For our wholesale energy business, many of the forward sale, forward purchase, option and other contracts are derivative instruments that hedge commodity price risk, but for which the business is not able to meet the hedge accounting requirements in SFAS 133. The changes in value of such derivative contracts are marked to market through earnings as the related commodity prices fluctuate. As a result, our earnings may experience significant fluctuations depending on the volatility of commodity prices.
For additional information regarding Derivative Financial Instruments, see Note 14. Financial Risk Management Activities.
NDT Funds
We account for the assets in the NDT Funds under SFAS No. 115, “Accounting for Certain Investments in Debt and Equity Securities” (SFAS 115). The assets in the NDT Funds are classified as available-for-sale securities and are marked to market with unrealized gains and losses recorded in Accumulated Other Comprehensive Loss unless securities with such unrealized losses are deemed to be other-than-temporarily-impaired. Realized gains, losses and dividend and interest income are recorded in our Statements of Operations as Other Income and Other Deductions. Unrealized losses that are deemed to be other-than-temporarily-impaired, as defined under SFAS 115, and related interpretive guidance, are charged against earnings rather than Accumulated Other Comprehensive Loss.
74
Unbilled Revenues
Electric and gas revenues are recorded based on services rendered to customers during each accounting period. We record unbilled revenues for the estimated amount customers will be billed for services rendered from the time meters were last read to the end of the respective accounting period. Unbilled usage is calculated in two steps. The initial step is to apply a base usage per day to the number of unbilled days in the period. The second step estimates seasonal loads based upon the time of year and the variance of actual degree-days and temperature-humidity-index hours of the unbilled period from expected norms. The resulting usage is priced at current rate levels and recorded as revenue. A calculation of the associated energy cost for the unbilled usage is recorded as well. Each month, the prior month’s unbilled amounts are reversed and the current month’s amounts are accrued. The resulting revenue and expense reflect the service rendered in the calendar month. Using benchmarks other than those used in this calculation could have a material effect on the amounts accrued in a reporting period.
SFAS 71
PSE&G prepares its Consolidated Financial Statements in accordance with the provisions of SFAS 71, which differs in certain respects from the application of GAAP by non-regulated businesses. In general, SFAS 71 recognizes that accounting for rate-regulated enterprises should reflect the economic effects of regulation. As a result, a regulated utility is required to defer the recognition of costs (a Regulatory Asset) or recognize obligations (a Regulatory Liability) if it is probable that, through the rate-making process, there will be a corresponding increase or decrease in future rates. Accordingly, PSE&G has deferred certain costs, which will be amortized over various future periods. To the extent that collection of such costs or payment of liabilities is no longer probable as a result of changes in regulation and/or PSE&G’s competitive position, the associated Regulatory Asset or Liability is charged or credited to income. See Note 5. Regulatory Assets and Liabilities for additional information related to these and other regulatory issues.
ITEM 7A. QUALITATIVE AND QUANTITATIVE DISCLOSURES ABOUT
MARKET RISK
The market risk inherent in our market-risk sensitive instruments and positions is the potential loss arising from adverse changes in commodity prices, equity security prices and interest rates as discussed in the Notes to Consolidated Financial Statements. It is our policy to use derivatives to manage risk consistent with business plans and prudent practices. We have a Risk Management Committee comprised of our executive officers who utilize a risk oversight function to ensure compliance with our corporate policies and risk management practices.
Additionally, we are exposed to counterparty credit losses in the event of non-performance or non-payment. We have a credit management process, which is used to assess, monitor and mitigate counterparty exposure. In the event of non-performance or non-payment by a major counterparty, there may be a material adverse impact on our financial condition, results of operations or net cash flows.
Commodity Contracts
The availability and price of energy-related commodities are subject to fluctuations from factors such as weather, environmental policies, changes in supply and demand, state and federal regulatory policies, market rules and other events. To reduce price risk caused by market fluctuations, we enter into supply contracts and derivative contracts, including forwards, futures, swaps and options with approved counterparties. These contracts, in conjunction with demand obligations, help reduce risk and optimize the value of owned electric generation capacity.
Value-at-Risk (VaR) Models
We use VaR models to assess the market risk of our commodity businesses. The portfolio VaR model includes our owned generation and physical contracts, as well as fixed price sales requirements, load requirements and financial derivative instruments. VaR represents the potential gains or losses, under normal
75
market conditions, for instruments or portfolios due to changes in market factors, for a specified time period and confidence level. We estimate VaR across our commodity businesses.
We manage our exposure at the portfolio level, which consists of owned generation, load-serving contracts (both gas and electric), fuel supply contracts and energy derivatives designed to manage the risk around generation and load. While we manage our risk at the portfolio level, we also monitor separately the risk of our trading activities and hedges. Non-trading mark-to-market (MTM) VaR consists of MTM derivatives that are economic hedges, some of which qualify for hedge accounting. The MTM derivatives that are not hedges are included in the trading VaR.
The VaR models used are variance/covariance models adjusted for the delta of positions with a 95% one-tailed confidence level and a one-day holding period for the MTM trading and non-trading activities and a 95% one-tailed confidence level with a one-week holding period for the portfolio VaR. The models assume no new positions throughout the holding periods, however, we actively manage our portfolio.
Increased trading activities during 2008 have led to a higher VaR as compared to December 31, 2007. As of December 31, 2008, VaR was $1 million. As of December 31, 2007, trading VaR was less than $1 million.
| | | | |
For the Year Ended December 31, 2008 | | Trading
VaR | | Non-Trading
MTM VaR |
| | Millions |
95% Confidence Level, One-Day Holding Period, One-Tailed: | | | | |
Period End | | | $ | | 1 | | | | $ | | 44 | |
Average for the Period | | | $ | | 1 | | | | $ | | 56 | |
High | | | $ | | 1 | | | | $ | | 71 | |
Low | | | $ | | — | * | | | | $ | | 43 | |
99% Confidence Level, One-Day Holding Period, Two-Tailed: | | | | |
Period End | | | $ | | 1 | | | | $ | | 69 | |
Average for the Period | | | $ | | 1 | | | | $ | | 88 | |
High | | | $ | | 2 | | | | $ | | 111 | |
Low | | | $ | | — | * | | | | $ | | 67 | |
* less than $1 million
Interest Rates
We are subject to the risk of fluctuating interest rates in the normal course of business. It is our policy to manage interest rate risk through the use of fixed and floating rate debt, interest rate swaps and interest rate lock agreements. We manage our respective interest rate exposures by maintaining a targeted ratio of fixed and floating rate debt.
As of December 31, 2008, a hypothetical 10% increase in market interest rates would result in
|
• | | | | $2 million of additional annual interest costs related to both the current and long-term portion of long-term debt, and |
|
• | | | | a $253 million decrease in the fair value of debt, including a $132 million decrease at PSE&G and a $92 million decrease at Power. |
Debt and Equity Securities
We have $2.4 billion invested in our pension plans. Although fluctuations in market prices of securities within this portfolio do not directly affect our earnings in the current period, changes in the value of these investments could affect
|
• | | | | our future contributions to these plans, |
76
|
• | | | | our financial position if our accumulated benefit obligation under our pension plans exceeds the fair value of the pension funds, and |
|
• | | | | future earnings, as we could be required to adjust pension expense and the assumed rate of return. |
The NDT Funds are comprised of both fixed income and equity securities totaling $970 million as of December 31, 2008. The fair value of equity securities is determined independently each month by the Trustee. As of December 31, 2008, the portfolio was comprised of $413 million of equity securities and $557 million in fixed income securities. The fair market value of the assets in the NDT Funds will fluctuate primarily depending upon the performance of equity markets. As of December 31, 2008, a hypothetical 10% change in the equity market would impact the value of the equity securities in the NDT Funds by approximately $41 million.
We use duration to measure the interest rate sensitivity of the fixed income portfolio. Duration is a summary statistic of the effective average maturity of the fixed income portfolio. The benchmark for the fixed income component of the NDT Funds currently has a duration of 3.71 years and a yield of 3.99%. The portfolio’s value will appreciate or depreciate by the duration with a 1% change in interest rates. As of December 31, 2008, a hypothetical 1% increase in interest rates would result in a decline in the market value for the fixed income portfolio of approximately $18 million.
Credit Risk
Credit risk relates to the risk of loss that we would incur as a result of non-performance by counterparties pursuant to the terms of their contractual obligations. We have established credit policies that we believe significantly minimize credit risk. These policies include an evaluation of potential counterparties’ financial condition (including credit rating), collateral requirements under certain circumstances and the use of standardized agreements, which may allow for the netting of positive and negative exposures associated with a single counterparty.
Counterparties expose Power’s operations to credit losses in the event of non-performance or non-payment. We have a credit management process, which is used to assess, monitor and mitigate counterparty exposure for Power and its subsidiaries. Power’s counterparty credit limits are based on a scoring model that considers a variety of factors, including leverage, liquidity, profitability, credit ratings and risk management capabilities. Power has entered into master agreements that allow for payment netting with the majority of its large counterparties, which reduce Power’s exposure to counterparty risk by providing the offset of amounts payable to the counterparty against amounts receivable from the counterparty. In the event of non-performance or non-payment by a major counterparty, there may be a material adverse impact on Power’s financial condition, results of operations or net cash flows. As of December 31, 2008, 81% of the credit exposure (MTM plus net receivables and payables, less cash collateral) for Power’s operations was with investment grade counterparties. The majority of the credit exposure with non-investment grade counterparties was with certain companies that supply fuel (primarily coal) to Power. This exposure relates to the risk of a counterparty performing under its obligations rather than payment risk.
The following table provides information on Power’s credit exposure, net of collateral, as of December 31, 2008. Credit exposure is defined as any positive results of netting accounts receivable/accounts payable and the forward value on open positions. It further delineates that exposure by the credit rating of the counterparties and provides guidance on the concentration of credit risk to individual counterparties and an indication of the maturity of a company’s credit risk by credit rating of the counterparties.
77
Schedule of Credit Risk Exposure on Energy Contracts Net
Assets As of December 31, 2008
| | | | | | | | | | Rating | | Current
Exposure | | Securities
Held
as Collateral | | Net
Exposure | | Number of
Counterparties
>10% | | Net Exposure
Counterparties
>10% |
| | | | Millions | | | | | | Millions |
Investment Grade—
External Rating | | | $ | | 1,028 | | | | $ | | 280 | | | | $ | | 996 | | | | | 1 | (A) | | | | $ | | 545 | |
Non-Investment Grade—
External Rating | | | | 235 | | | | | — | | | | | 235 | | | | | 1 | (B) | | | | | 231 | |
Investment Grade—
No External Rating | | | | 14 | | | | | — | | | | | 15 | | | | | — | | | | | — | |
Non-Investment Grade—No External Rating | | | | 12 | | | | | 1 | | | | | 11 | | | | | — | | | | | — | |
| | | | | | | | | | |
Total | | | $ | | 1,289 | | | | $ | | 281 | | | | $ | | 1,257 | | | | | 2 | | | | $ | | 776 | |
| | | | | | | | | | |
|
(A) | | | | PSE&G is a counterparty with net exposure of $545 million. |
|
(B) | | | | Credit exposure is with a non-investment grade counterparty that is a coal supplier to Power. Therefore, this exposure relates to the risk of the counterparty’s non-performance under its obligations rather than payment risk. |
The net exposure listed above, in some cases, will not be the difference between the current exposure and the collateral held. Counterparty may have posted more cash collateral than the outstanding exposure, in which case there would not be exposure. When letters of credit have been posted as collateral, the exposure amount is not reduced, but the exposure amount is transferred to the rating of the issuing bank. As of December 31, 2008, Power had 140 active counterparties.
BGS suppliers expose PSE&G to credit losses in the event of non-performance or non-payment upon a default of the BGS supplier. Credit requirements are governed under BPU approved BGS contracts.
Energy Holdings has credit risk with respect to its counterparties to power purchase agreements and other parties.
Energy Holdings also has credit risk related to its investments in leveraged leases, totaling $285 million, which is net of deferred taxes of $2 billion, as of December 31, 2008. These investments are largely concentrated in the energy industry. As of December 31, 2008, 58% of counterparties in the lease portfolio was rated investment grade by both S&P and Moody’s. As of December 31, 2008, the weighted average credit rating of the lessees in Holdings’ leasing portfolio was A–/A3 by S&P and Moody’s respectively. The credit exposure to the lessees is partially mitigated through various credit enhancement mechanisms within the lease transactions. These credit enhancement features vary from lease to lease. Some of the leasing transactions include covenants that restrict the flow of dividends from the lessee to its parent, over-collateralization of the lessee with non-leased assets, historical and forward cash flow coverage tests that prohibit discretionary capital expenditures and dividend payments to the parent/lessee if stated minimum coverages are not met and similar cash flow restrictions if ratings are not maintained at stated levels. These covenants are designed to maintain cash reserves in the transaction entity for the benefit of the non-recourse lenders and the lessor/equity participants in the event of a market downturn or degradation in operating performance of the leased assets.
In any lease transaction, in the event of a default, Energy Holdings would exercise its rights and attempt to seek recovery of its investment. The results of such efforts may not be known for a period of time. A bankruptcy of a lessee and failure to recover adequate value could lead to a foreclosure of the lease. Under a worst-case scenario, if a foreclosure were to occur, Energy Holdings would record a pre-tax write-off up to its gross investment, including deferred taxes, in these facilities. Also, in the event of a potential
78
foreclosure, the net tax benefits generated by Energy Holdings’ portfolio of investments could be materially reduced in the period in which gains associated with the potential forgiveness of debt at these projects occurs. The amount and timing of any potential reduction in net tax benefits is dependent upon a number of factors including, but not limited to, the time of a potential foreclosure, the amount of lease debt outstanding, any cash trapped at the projects and negotiations during such potential foreclosure process. The potential loss of earnings, impairment and/or tax payments could have a material impact to our financial position, results of operations and net cash flows.
ITEM 8. FINANCIAL STATEMENTS AND SUPPLEMENTARY DATA
This combined Form 10-K is separately filed by Public Service Enterprise Group Incorporated (PSEG), PSEG Power LLC (Power) and Public Service Electric and Gas Company (PSE&G). Information contained herein relating to any individual company is filed by such company on its own behalf. Power and PSE&G each make representations only as to itself and make no representations as to any other company.
79
REPORT OF INDEPENDENT REGISTERED PUBLIC ACCOUNTING FIRM
To the Stockholders and Board of Directors of
Public Service Enterprise Group Incorporated:
We have audited the accompanying consolidated balance sheets of Public Service Enterprise Group Incorporated and subsidiaries (the “Company”) as of December 31, 2008 and 2007, and the related consolidated statements of operations, common stockholders’ equity, and cash flows for each of the three years in the period ended December 31, 2008. Our audits also included the consolidated financial statement schedule listed in the Index at Item 15. These consolidated financial statements and consolidated financial statement schedule are the responsibility of the Company’s management. Our responsibility is to express an opinion on the consolidated financial statements and consolidated financial statement schedule based on our audits.
We conducted our audits in accordance with the standards of the Public Company Accounting Oversight Board (United States). Those standards require that we plan and perform the audits to obtain reasonable assurance about whether the financial statements are free of material misstatement. An audit includes examining, on a test basis, evidence supporting the amounts and disclosures in the financial statements. An audit also includes assessing the accounting principles used and significant estimates made by management, as well as evaluating the overall financial statement presentation. We believe that our audits provide a reasonable basis for our opinion.
In our opinion, such consolidated financial statements present fairly, in all material respects, the financial position of the Company as of December 31, 2008 and 2007, and the results of its operations and its cash flows for each of the three years in the period ended December 31, 2008, in conformity with accounting principles generally accepted in the United States of America. Also, in our opinion, such consolidated financial statement schedule, when considered in relation to the basic consolidated financial statements taken as a whole, presents fairly, in all material respects, the information set forth therein.
As discussed in Notes 2 and 18 to the consolidated financial statements, on January 1, 2008, the Company adopted Statement of Financial Accounting Standards No. 157,Fair Value Measurements,and on January 1, 2007, the Company adopted Financial Accounting Standards Board Interpretation No. 48,Accounting for Uncertainty in Income Taxes—an Interpretation of FASB Statement 109.
We have also audited, in accordance with the standards of the Public Company Accounting Oversight Board (United States), the Company’s internal control over financial reporting as of December 31, 2008, based on the criteria established inInternal Control—Integrated Frameworkissued by the Committee of Sponsoring Organizations of the Treadway Commission and our report dated February 25, 2009 expressed an unqualified opinion on the Company’s internal control over financial reporting.
DELOITTE& TOUCHE LLP
Parsippany, New Jersey
February 25, 2009
80
REPORT OF INDEPENDENT REGISTERED PUBLIC ACCOUNTING FIRM
To the Sole Member and Board of Directors of
PSEG POWER LLC:
We have audited the accompanying consolidated balance sheets of PSEG Power LLC and subsidiaries (the “Company”) as of December 31, 2008 and 2007, and the related consolidated statements of operations, member’s equity, and cash flows for each of the three years in the period ended December 31, 2008. Our audits also included the consolidated financial statement schedule listed in the Index at Item 15. These consolidated financial statements and consolidated financial statement schedule are the responsibility of the Company’s management. Our responsibility is to express an opinion on the consolidated financial statements and consolidated financial statement schedules based on our audits.
We conducted our audits in accordance with the standards of the Public Company Accounting Oversight Board (United States). Those standards require that we plan and perform the audits to obtain reasonable assurance about whether the financial statements are free of material misstatement. The Company is not required to have, nor were we engaged to perform, an audit of its internal control over financial reporting. Our audits included consideration of internal control over financial reporting as a basis for designing audit procedures that are appropriate in the circumstances, but not for the purpose of expressing an opinion on the effectiveness of the Company’s internal control over financial reporting. Accordingly, we express no opinion. An audit also includes examining, on a test basis, evidence supporting the amounts and disclosures in the financial statements. An audit also includes assessing the accounting principles used and significant estimates made by management, as well as evaluating the overall financial statement presentation. We believe that our audits provide a reasonable basis for our opinion.
In our opinion, such consolidated financial statements present fairly, in all material respects, the financial position of the Company as of December 31, 2008 and 2007, and the results of its operations and its cash flows for each of the three years in the period ended December 31, 2008, in conformity with accounting principles generally accepted in the United States of America. Also, in our opinion, such consolidated financial statement schedule, when considered in relation to the basic consolidated financial statements taken as a whole, present fairly, in all material respects, the information set forth therein.
As discussed in Notes 2 and 18 to the consolidated financial statements, on January 1, 2008, the Company adopted Statement of Financial Accounting Standards No. 157,Fair Value Measurements,and on January 1, 2007, the Company adopted Financial Accounting Standards Board Interpretation No. 48,Accounting for Uncertainty in Income Taxes—an Interpretation of FASB Statement 109.
DELOITTE& TOUCHE LLP
Parsippany, New Jersey
February 25, 2009
81
REPORT OF INDEPENDENT REGISTERED PUBLIC ACCOUNTING FIRM
To the Sole Stockholder and Board of Directors of
PUBLIC SERVICE ELECTRICAND GAS COMPANY:
We have audited the accompanying consolidated balance sheets of Public Service Electric and Gas Company and subsidiaries (the “Company”) as of December 31, 2008 and 2007, and the related consolidated statements of operations, common stockholder’s equity, and cash flows for each of the three years in the period ended December 31, 2008. Our audits also included the consolidated financial statement schedule listed in the Index at Item 15. These consolidated financial statements and consolidated financial statement schedule are the responsibility of the Company’s management. Our responsibility is to express an opinion on the consolidated financial statements and consolidated financial statement schedules based on our audits.
We conducted our audits in accordance with the standards of the Public Company Accounting Oversight Board (United States). Those standards require that we plan and perform the audits to obtain reasonable assurance about whether the financial statements are free of material misstatement. The Company is not required to have, nor were we engaged to perform, an audit of its internal control over financial reporting. Our audits included consideration of internal control over financial reporting as a basis for designing audit procedures that are appropriate in the circumstances, but not for the purpose of expressing an opinion on the effectiveness of the Company’s internal control over financial reporting. Accordingly, we express no opinion. An audit also includes examining, on a test basis, evidence supporting the amounts and disclosures in the financial statements. An audit also includes assessing the accounting principles used and significant estimates made by management, as well as evaluating the overall financial statement presentation. We believe that our audits provide a reasonable basis for our opinion.
In our opinion, such consolidated financial statements present fairly, in all material respects, the financial position of the Company as of December 31, 2008 and 2007, and the results of its operations and its cash flows for each of the three years in the period ended December 31, 2008, in conformity with accounting principles generally accepted in the United States of America. Also, in our opinion, such consolidated financial statement schedule, when considered in relation to the basic consolidated financial statements taken as a whole, present fairly, in all material respects, the information set forth therein.
As discussed in Notes 2 and 18 to the consolidated financial statements, on January 1, 2008, the Company adopted Statement of Financial Accounting Standards No. 157,Fair Value Measurements,and on January 1, 2007, the Company adopted Financial Accounting Standards Board Interpretation No. 48,Accounting for Uncertainty in Income Taxes—an Interpretation of FASB Statement 109.
DELOITTE& TOUCHE LLP
Parsippany, New Jersey
February 25, 2009
82
PUBLIC SERVICE ENTERPRISE GROUP INCORPORATED
CONSOLIDATED STATEMENTS OF OPERATIONS
Millions, except for share data
| | | | | | |
| | For The Years Ended December 31, |
| | 2008 | | 2007 | | 2006 |
OPERATING REVENUES | | | $ | | 13,322 | | | | $ | | 12,677 | | | | $ | | 11,735 | |
OPERATING EXPENSES | | | | | | |
Energy Costs | | | | 7,295 | | | | | 6,512 | | | | | 6,544 | |
Operation and Maintenance | | | | 2,486 | | | | | 2,406 | | | | | 2,260 | |
Depreciation and Amortization | | | | 792 | | | | | 774 | | | | | 808 | |
Taxes Other Than Income Taxes | | | | 136 | | | | | 139 | | | | | 133 | |
| | | | | | |
Total Operating Expenses | | | | 10,709 | | | | | 9,831 | | | | | 9,745 | |
| | | | | | |
OPERATING INCOME | | | | 2,613 | | | | | 2,846 | | | | | 1,990 | |
Income from Equity Method Investments | | | | 37 | | | | | 115 | | | | | 115 | |
Gain (Loss) on Sale of and (Impairment)
on Equity Method Investments | | | | (27 | ) | | | | | 137 | | | | | (272 | ) | |
Other Income | | | | 436 | | | | | 279 | | | | | 201 | |
Other Deductions | | | | (552 | ) | | | | | (257 | ) | | | | | (112 | ) | |
Interest Expense | | | | (594 | ) | | | | | (727 | ) | | | | | (788 | ) | |
Preferred Stock Dividends | | | | (4 | ) | | | | | (4 | ) | | | | | (4 | ) | |
| | | | | | |
INCOME FROM CONTINUING OPERATIONS
BEFORE INCOME TAXES | | | | 1,909 | | | | | 2,389 | | | | | 1,130 | |
Income Tax Expense | | | | (926 | ) | | | | | (1,064 | ) | | | | | (457 | ) | |
| | | | | | |
INCOME FROM CONTINUING OPERATIONS | | | | 983 | | | | | 1,325 | | | | | 673 | |
Income (Loss) from Discontinued Operations, net of tax (expense) benefit of ($8), ($85), and $25 for the years ended 2008, 2007 and 2006, respectively | | | | 33 | | | | | (38 | ) | | | | | 47 | |
Gain on Disposal of Discontinued Operations, net of tax (expense) benefit of ($163), ($72) and $2 for the years ended 2008, 2007 and 2006, respectively | | | | 172 | | | | | 48 | | | | | 19 | |
| | | | | | |
NET INCOME | | | $ | | 1,188 | | | | $ | | 1,335 | | | | $ | | 739 | |
| | | | | | |
WEIGHTED AVERAGE COMMON SHARES
OUTSTANDING (THOUSANDS): | | |
BASIC | | | | 507,693 | | | | | 507,560 | | | | | 503,356 | |
| | | | | | |
DILUTED | | | | 508,427 | | | | | 508,813 | | | | | 504,628 | |
| | | | | | |
EARNINGS PER SHARE |
BASIC | | | | | | |
INCOME FROM CONTINUING OPERATIONS | | | $ | | 1.94 | | | | $ | | 2.61 | | | | $ | | 1.34 | |
NET INCOME | | | $ | | 2.34 | | | | $ | | 2.63 | | | | $ | | 1.47 | |
| | | | | | |
DILUTED |
INCOME FROM CONTINUING OPERATIONS | | | $ | | 1.93 | | | | $ | | 2.60 | | | | $ | | 1.33 | |
NET INCOME | | | $ | | 2.34 | | | | $ | | 2.62 | | | | $ | | 1.46 | |
| | | | | | |
DIVIDENDS PAID PER SHARE OF COMMON STOCK | | | $ | | 1.29 | | | | $ | | 1.17 | | | | $ | | 1.14 | |
| | | | | | |
See Notes to Consolidated Financial Statements.
83
PUBLIC SERVICE ENTERPRISE GROUP INCORPORATED
CONSOLIDATED BALANCE SHEETS
Millions
| | | | |
| | December 31, |
| | 2008 | | 2007 |
ASSETS | | | | |
CURRENT ASSETS |
Cash and Cash Equivalents | | | $ | | 321 | | | | $ | | 380 | |
Accounts Receivable, net of allowances of $66 and $46 in 2008 and 2007, respectively | | | | 1,398 | | | | | 1,537 | |
Unbilled Revenues | | | | 454 | | | | | 353 | |
Fuel | | | | 938 | | | | | 791 | |
Materials and Supplies | | | | 317 | | | | | 293 | |
Prepayments | | | | 150 | | | | | 88 | |
Restricted Funds | | | | 118 | | | | | 114 | |
Derivative Contracts | | | | 237 | | | | | 65 | |
Assets of Discontinued Operations | | | | — | | | | | 1,323 | |
Other | | | | 66 | | | | | 30 | |
| | | | |
Total Current Assets | | | | 3,999 | | | | | 4,974 | |
| | | | |
PROPERTY, PLANT AND EQUIPMENT | | | | 20,818 | | | | | 19,190 | |
Less: Accumulated Depreciation and Amortization | | | | (6,385 | ) | | | | | (5,994 | ) | |
| | | | |
Net Property, Plant and Equipment | | | | 14,433 | | | | | 13,196 | |
| | | | |
NONCURRENT ASSETS | | | | |
Regulatory Assets | | | | 6,352 | | | | | 5,165 | |
Long-Term Investments | | | | 2,695 | | | | | 3,221 | |
Nuclear Decommissioning Trust (NDT) Funds | | | | 970 | | | | | 1,276 | |
Other Special Funds | | | | 133 | | | | | 164 | |
Goodwill and Other Intangibles | | | | 69 | | | | | 51 | |
Derivative Contracts | | | | 160 | | | | | 52 | |
Other | | | | 238 | | | | | 200 | |
| | | | |
Total Noncurrent Assets | | | | 10,617 | | | | | 10,129 | |
| | | | |
TOTAL ASSETS | | | $ | | 29,049 | | | | $ | | 28,299 | |
| | | | |
See Notes to Consolidated Financial Statements.
84
PUBLIC SERVICE ENTERPRISE GROUP INCORPORATED
CONSOLIDATED BALANCE SHEETS
Millions
| | | | |
| | December 31, |
| | 2008 | | 2007 |
LIABILITIES AND CAPITALIZATION | | | | |
CURRENT LIABILITIES |
Long-Term Debt Due Within One Year | | | $ | | 1,033 | | | | $ | | 1,123 | |
Commercial Paper and Loans | | | | 19 | | | | | 65 | |
Accounts Payable | | | | 1,227 | | | | | 1,080 | |
Derivative Contracts | | | | 356 | | | | | 324 | |
Accrued Interest | | | | 99 | | | | | 113 | |
Accrued Taxes | | | | 8 | | | | | 204 | |
Deferred Income Taxes | | | | — | | | | | 106 | |
Clean Energy Program | | | | 142 | | | | | 135 | |
Obligation to Return Cash Collateral | | | | 102 | | | | | 79 | |
Liabilities of Discontinued Operations | | | | — | | | | | 596 | |
Other | | | | 424 | | | | | 450 | |
| | | | |
Total Current Liabilities | | | | 3,410 | | | | | 4,275 | |
| | | | |
NONCURRENT LIABILITIES | | | | |
Deferred Income Taxes and Investment Tax Credits (ITC) | | | | 3,865 | | | | | 4,449 | |
Regulatory Liabilities | | | | 355 | | | | | 419 | |
Asset Retirement Obligations | | | | 576 | | | | | 542 | |
Other Postretirement Benefit (OPEB) Costs | | | | 975 | | | | | 1,003 | |
Accrued Pension Costs | | | | 1,196 | | | | | 203 | |
Clean Energy Program | | | | 532 | | | | | 14 | |
Environmental Costs | | | | 743 | | | | | 649 | |
Derivative Contracts | | | | 164 | | | | | 198 | |
Long-Term Accrued Taxes | | | | 1,241 | | | | | 423 | |
Other | | | | 136 | | | | | 87 | |
| | | | |
Total Noncurrent Liabilities | | | | 9,783 | | | | | 7,987 | |
| | | | |
COMMITMENTS AND CONTINGENT LIABILITIES (See Note 11) | | | | |
CAPITALIZATION
LONG-TERM DEBT |
Long-Term Debt | | | | 6,621 | | | | | 6,782 | |
Securitization Debt | | | | 1,342 | | | | | 1,530 | |
Project Level, Non-Recourse Debt | | | | 42 | | | | | 346 | |
| | | | |
Total Long-Term Debt | | | | 8,005 | | | | | 8,658 | |
| | | | |
SUBSIDIARY’S PREFERRED SECURITIES | | | | |
Preferred Stock Without Mandatory Redemption, $100 par value, 7,500,000 authorized; issued and outstanding, 2008 and 2007—795,234 shares | | | | 80 | | | | | 80 | |
| | | | |
COMMON STOCKHOLDERS’ EQUITY |
Common Stock, no par, authorized 1,000,000,000 shares; issued, 2008 and 2007—533,556,660 shares | | | | 4,756 | | | | | 4,732 | |
Treasury Stock, at cost, 2008—27,538,762 shares; 2007—25,033,656 shares | | | | (581 | ) | | | | | (478 | ) | |
Retained Earnings | | | | 3,773 | | | | | 3,261 | |
Accumulated Other Comprehensive Loss | | | | (177 | ) | | | | | (216 | ) | |
| | | | |
Total Common Stockholders’ Equity | | | | 7,771 | | | | | 7,299 | |
| | | | |
Total Capitalization | | | | 15,856 | | | | | 16,037 | |
| | | | |
TOTAL LIABILITIES AND CAPITALIZATION | | | $ | | 29,049 | | | | $ | | 28,299 | |
| | | | |
See Notes to Consolidated Financial Statements.
85
PUBLIC SERVICE ENTERPRISE GROUP INCORPORATED
CONSOLIDATED STATEMENTS OF CASH FLOWS
Millions
| | | | | | |
| | For the Years Ended December 31, |
| | 2008 | | 2007 | | 2006 |
CASH FLOWS FROM OPERATING ACTIVITIES | | | | | | |
Net Income | | | $ | | 1,188 | | | | $ | | 1,335 | | | | $ | | 739 | |
Adjustments to Reconcile Net Income to Net Cash Flows from Operating Activities: | | | | | | |
Gain on Disposal of Discontinued Operations | | | | (335 | ) | | | | | (120 | ) | | | | | (17 | ) | |
Write-down of Project Investments | | | | — | | | | | — | | | | | 44 | |
Depreciation and Amortization | | | | 793 | | | | | 802 | | | | | 850 | |
Amortization of Nuclear Fuel | | | | 101 | | | | | 95 | | | | | 97 | |
Provision for Deferred Income Taxes (Other than Leases) and ITC | | | | 71 | | | | | 241 | | | | | (255 | ) | |
Non-Cash Employee Benefit Plan Costs | | | | 167 | | | | | 185 | | | | | 240 | |
Lease Transaction Charges, net of tax | | | | 490 | | | | | — | | | | | — | |
Leveraged Lease Income, Adjusted for Rents Received and Deferred Taxes | | | | 51 | | | | | 70 | | | | | 64 | |
(Gain) Loss on Sale of and Impairment on Equity Method Investments | | | | 27 | | | | | (137 | ) | | | | | 272 | |
Gain on Sale of Investments | | | | (11 | ) | | | | | (20 | ) | | | | | (11 | ) | |
Undistributed Earnings from Affiliates | | | | (40 | ) | | | | | (10 | ) | | | | | (44 | ) | |
Realized and Unrealized (Gains) Losses on Energy Contracts and Other Derivatives | | | | (39 | ) | | | | | 22 | | | | | (30 | ) | |
Under Recovery of Electric Energy Costs (BGS and NTC) and Gas Costs | | | | (43 | ) | | | | | (71 | ) | | | | | 111 | |
Under Recovery of Societal Benefits Charge (SBC) | | | | (75 | ) | | | | | (53 | ) | | | | | (175 | ) | |
Cost of Removal | | | | (44 | ) | | | | | (37 | ) | | | | | (33 | ) | |
Net Realized (Gains) Losses and (Income) Expense from NDT Funds | | | | 115 | | | | | (48 | ) | | | | | (64 | ) | |
Net Change in Certain Current Assets and Liabilities | | | | 74 | | | | | (198 | ) | | | | | 305 | |
Employee Benefit Plan Funding and Related Payments | | | | (139 | ) | | | | | (96 | ) | | | | | (148 | ) | |
Other | | | | (6 | ) | | | | | (39 | ) | | | | | (19 | ) | |
| | | | | | |
Net Cash Provided By Operating Activities | | | | 2,345 | | | | | 1,921 | | | | | 1,926 | |
| | | | | | |
CASH FLOWS FROM INVESTING ACTIVITIES |
Additions to Property, Plant and Equipment | | | | (1,771 | ) | | | | | (1,348 | ) | | | | | (1,015 | ) | |
Proceeds from Sale of Discontinued Operations | | | | 925 | | | | | 600 | | | | | 494 | |
Proceeds from Sale of Property, Plant and Equipment | | | | 9 | | | | | 55 | | | | | 6 | |
Proceeds from Sale of Capital Leases and Investments | | | | 77 | | | | | 703 | | | | | 251 | |
Proceeds from NDT Funds Sales | | | | 3,060 | | | | | 1,672 | | | | | 1,405 | |
Investment in NDT Funds | | | | (3,093 | ) | | | | | (1,703 | ) | | | | | (1,427 | ) | |
Restricted Funds | | | | (11 | ) | | | | | (41 | ) | | | | | (6 | ) | |
NDT Funds Interest and Dividends | | | | 48 | | | | | 48 | | | | | 40 | |
Other | | | | (19 | ) | | | | | 23 | | | | | 9 | |
| | | | | | |
Net Cash Provided By (Used In) Investing Activities | | | | (775 | ) | | | | | 9 | | | | | (243 | ) | |
| | | | | | |
CASH FLOWS FROM FINANCING ACTIVITIES | | | | | | |
Net Change in Commercial Paper and Loans | | | | (46 | ) | | | | | (317 | ) | | | | | 281 | |
Issuance of Long-Term Debt | | | | 1,075 | | | | | 434 | | | | | 250 | |
Issuance of Non-Recourse Debt | | | | — | | | | | 163 | | | | | — | |
Issuance of Common Stock | | | | — | | | | | 83 | | | | | 83 | |
Purchase of Common Treasury Stock | | | | (92 | ) | | | | | — | | | | | — | |
Redemptions of Long-Term Debt | | | | (1,582 | ) | | | | | (551 | ) | | | | | (1,431 | ) | |
Repayment of Non-Recourse Debt | | | | (56 | ) | | | | | (57 | ) | | | | | (51 | ) | |
Redemption of Securitization Debt | | | | (179 | ) | | | | | (170 | ) | | | | | (163 | ) | |
Net Premium Paid on Early Extinguishment of Debt | | | | (79 | ) | | | | | — | | | | | — | |
Cash Dividends Paid on Common Stock | | | | (655 | ) | | | | | (594 | ) | | | | | (574 | ) | |
Redemption of Debt Underlying Trust Securities | | | | — | | | | | (660 | ) | | | | | (203 | ) | |
Other | | | | (15 | ) | | | | | 19 | | | | | (27 | ) | |
| | | | | | |
Net Cash Used In Financing Activities | | | | (1,629 | ) | | | | | (1,650 | ) | | | | | (1,835 | ) | |
| | | | | | |
Effect of Exchange Rate Change | | | | — | | | | | — | | | | | (1 | ) | |
| | | | | | |
Net Increase (Decrease) in Cash and Cash Equivalents | | | | (59 | ) | | | | | 280 | | | | | (153 | ) | |
Cash and Cash Equivalents at Beginning of Period | | | | 380 | | | | | 100 | | | | | 253 | |
| | | | | | |
Cash and Cash Equivalents at End of Period | | | $ | | 321 | | | | $ | | 380 | | | | $ | | 100 | |
| | | | | | |
Supplemental Disclosure of Cash Flow Information: | | | | | | |
Income Taxes Paid | | | $ | | 952 | | | | $ | | 678 | | | | $ | | 386 | |
Interest Paid, Net of Amounts Capitalized | | | $ | | 557 | | | | $ | | 715 | | | | $ | | 773 | |
See Notes to Consolidated Financial Statements.
86
PUBLIC SERVICE ENTERPRISE GROUP INCORPORATED
CONSOLIDATED STATEMENTS OF COMMON STOCKHOLDERS’ EQUITY
Millions
| | | | | | | | | | | | | | |
| | Common
Stock | | Treasury
Stock | | Retained
Earnings | | Accumulated
Other
Comprehensive
Loss | | Total |
| | Shs. | | Amount | | Shs. | | Amount |
Balance as of January 1, 2006 | | | | 530 | | | | $ | | 4,618 | | | | | (28 | ) | | | | $ | | (532 | ) | | | | $ | | 2,545 | | | | $ | | (609 | ) | | | | $ | | 6,022 | |
| | | | | | | | | | | | | | |
Net Income | | | | — | | | | | — | | | | | — | | | | | — | | | | | 739 | | | | | — | | | | | 739 | |
Other Comprehensive Income, net of tax: | | | | | | | | | | | | | | |
Currency Translation Adjustment, net of tax | | | | — | | | | | — | | | | | — | | | | | — | | | | | — | | | | | 154 | | | | | 154 | |
Available-for-Sale Securities, net of tax | | | | — | | | | | — | | | | | — | | | | | — | | | | | — | | | | | 37 | | | | | 37 | |
Change in Fair Value of Derivative Instruments, net of tax | | | | — | | | | | — | | | | | — | | | | | — | | | | | — | | | | | 343 | | | | | 343 | |
Reclassification Adjustments for net Amounts included in Net Income, net of tax | | | | — | | | | | — | | | | | — | | | | | — | | | | | — | | | | | 114 | | | | | 114 | |
Sale of Investments | | | | — | | | | | — | | | | | — | | | | | — | | | | | — | | | | | 55 | | | | | 55 | |
Pension/OPEB Adjustment, net of tax | | | | — | | | | | — | | | | | — | | | | | — | | | | | — | | | | | 3 | | | | | 3 | |
| | | | | | | | | | | | | | |
Other Comprehensive Income | | | | | | | | | | | | | | | | 706 | |
| | | | | | | | | | | | | | |
Comprehensive Income | | | | | | | | | | | | | | | | 1,445 | |
Adjustment to Initially Apply FASB Statement 158, net of tax | | | | — | | | | | — | | | | | — | | | | | — | | | | | — | | | | | (205 | ) | | | | | (205 | ) | |
Cash Dividends on Common Stock | | | | — | | | | | — | | | | | — | | | | | — | | | | | (574 | ) | | | | | — | | | | | (574 | ) | |
Issuance of Common Stock | | | | 2 | | | | | 68 | | | | | 1 | | | | | 15 | | | | | — | | | | | — | | | | | 83 | |
Other | | | | — | | | | | (25 | ) | | | | | — | | | | | 1 | | | | | — | | | | | — | | | | | (24 | ) | |
| | | | | | | | | | | | | | |
Balance as of December 31, 2006 | | | | 532 | | | | $ | | 4,661 | | | | | (27 | ) | | | | $ | | (516 | ) | | | | $ | | 2,710 | | | | $ | | (108 | ) | | | | $ | | 6,747 | |
| | | | | | | | | | | | | | |
Net Income | | | | — | | | | | — | | | | | — | | | | | — | | | | | 1,335 | | | | | — | | | | | 1,335 | |
Other Comprehensive Income (Loss), net of tax: | | | | | | | | | | | | | | |
Currency Translation Adjustment, net of tax | | | | — | | | | | — | | | | | — | | | | | — | | | | | — | | | | | (3 | ) | | | | | (3 | ) | |
Available-for-Sale Securities, net of tax | | | | — | | | | | — | | | | | — | | | | | — | | | | | — | | | | | (10 | ) | | | | | (10 | ) | |
Change in Fair Value of Derivative Instruments, net of tax | | | | — | | | | | — | | | | | — | | | | | — | | | | | — | | | | | (290 | ) | | | | | (290 | ) | |
Reclassification Adjustments for net Amounts included in Net Income, net of tax | | | | — | | | | | — | | | | | — | | | | | — | | | | | — | | | | | 144 | | | | | 144 | |
Sale of Investments | | | | — | | | | | — | | | | | — | | | | | — | | | | | — | | | | | 1 | | | | | 1 | |
Pension/OPEB Adjustment, net of tax | | | | — | | | | | — | | | | | — | | | | | — | | | | | — | | | | | 50 | | | | | 50 | |
| | | | | | | | | | | | | | |
Other Comprehensive Loss | | | | | | | | | | | | | | | | (108 | ) | |
| | | | | | | | | | | | | | |
Comprehensive Income | | | | | | | | | | | | | | | | 1,227 | |
Adjustment to Initially Apply FSP13-2, net of tax | | | | — | | | | | — | | | | | — | | | | | — | | | | | (67 | ) | | | | | — | | | | | (67 | ) | |
Adjustment to Initially Apply FIN 48, net of tax | | | | — | | | | | — | | | | | — | | | | | — | | | | | (123 | ) | | | | | — | | | | | (123 | ) | |
Cash Dividends on Common Stock | | | | — | | | | | — | | | | | — | | | | | — | | | | | (594 | ) | | | | | — | | | | | (594 | ) | |
Issuance of Common Stock | | | | 2 | | | | | 35 | | | | | 2 | | | | | 48 | | | | | — | | | | | — | | | | | 83 | |
Other | | | | — | | | | | 36 | | | | | — | | | | | (10 | ) | | | | | — | | | | | — | | | | | 26 | |
| | | | | | | | | | | | | | |
Balance as of December 31, 2007 | | | | 534 | | | | $ | | 4,732 | | | | | (25 | ) | | | | $ | | (478 | ) | | | | $ | | 3,261 | | | | $ | | (216 | ) | | | | $ | | 7,299 | |
| | | | | | | | | | | | | | |
Net Income | | | | — | | | | | — | | | | | — | | | | | — | | | | | 1,188 | | | | | — | | | | | 1,188 | |
Other Comprehensive Income (Loss), net of tax: | | | | | | | | | | | | | | |
Currency Translation Adjustment, net of tax | | | | — | | | | | — | | | | | — | | | | | — | | | | | — | | | | | (106 | ) | | | | | (106 | ) | |
Available-for-Sale Securities, net of tax | | | | — | | | | | — | | | | | — | | | | | — | | | | | — | | | | | (79 | ) | | | | | (79 | ) | |
Change in Fair Value of Derivative Instruments, net of tax | | | | — | | | | | — | | | | | — | | | | | — | | | | | — | | | | | 253 | | | | | 253 | |
Reclassification Adjustments for Net Amounts included in Net Income, net of tax | | | | — | | | | | — | | | | | — | | | | | — | | | | | — | | | | | 176 | | | | | 176 | |
Pension/OPEB Adjustment, net of tax | | | | — | | | | | — | | | | | — | | | | | — | | | | | — | | | | | (205 | ) | | | | | (205 | ) | |
| | | | | | | | | | | | | | |
Other Comprehensive Income | | | | | | | | | | | | | | | | 39 | |
| | | | | | | | | | | | | | |
Comprehensive Income | | | | | | | | | | | | | | | | 1,227 | |
Adjustment for Application of FASB Statement 157, net of tax | | | | — | | | | | — | | | | | — | | | | | — | | | | | (21 | ) | | | | | — | | | | | (21 | ) | |
Cash Dividends on Common Stock | | | | — | | | | | — | | | | | — | | | | | — | | | | | (655 | ) | | | | | — | | | | | (655 | ) | |
Repurchase of Common Stock | | | | — | | | | | — | | | | | (3 | ) | | | | | (92 | ) | | | | | — | | | | | — | | | | | (92 | ) | |
Other | | | | — | | | | | 24 | | | | | — | | | | | (11 | ) | | | | | — | | | | | — | | | | | 13 | |
| | | | | | | | | | | | | | |
Balance as of December 31, 2008 | | | | 534 | | | | $ | | 4,756 | | | | | (28 | ) | | | | $ | | (581 | ) | | | | $ | | 3,773 | | | | $ | | (177 | ) | | | | $ | | 7,771 | |
| | | | | | | | | | | | | | |
See Notes to Consolidated Financial Statements.
87
PSEG POWER LLC
CONSOLIDATED STATEMENTS OF OPERATIONS
Millions
| | | | | | |
| | | For The Years Ended December 31, |
| | 2008 | | 2007 | | 2006 |
OPERATING REVENUES | | | $ | | 7,770 | | | | $ | | 6,796 | | | | $ | | 6,057 | |
OPERATING EXPENSES | | | | | | |
Energy Costs | | | | 4,556 | | | | | 3,975 | | | | | 3,955 | |
Operation and Maintenance | | | | 1,054 | | | | | 1,001 | | | | | 1,002 | |
Depreciation and Amortization | | | | 164 | | | | | 140 | | | | | 140 | |
| | | | | | |
Total Operating Expenses | | | | 5,774 | | | | | 5,116 | | | | | 5,097 | |
| | | | | | |
OPERATING INCOME | | | | 1,996 | | | | | 1,680 | | | | | 960 | |
Other Income | | | | 414 | | | | | 239 | | | | | 157 | |
Other Deductions | | | | (535 | ) | | | | | (170 | ) | | | | | (91 | ) | |
Interest Expense | | | | (164 | ) | | | | | (159 | ) | | | | | (148 | ) | |
| | | | | | |
INCOME FROM CONTINUING OPERATIONS BEFORE INCOME TAXES | | | | 1,711 | | | | | 1,590 | | | | | 878 | |
Income Tax Expense | | | | (661 | ) | | | | | (641 | ) | | | | | (363 | ) | |
| | | | | | |
INCOME FROM CONTINUING OPERATIONS | | | | 1,050 | | | | | 949 | | | | | 515 | |
Loss from Discontinued Operations, net of tax benefit of $5 and $22 for the years ended 2007 and 2006, respectively | | | | — | | | | | (8 | ) | | | | | (31 | ) | |
Loss on Disposal of Discontinued Operations, net of tax benefit of $144 for the year ended 2006 | | | | — | | | | | — | | | | | (208 | ) | |
| | | | | | |
EARNINGS AVAILABLE TO PUBLIC SERVICE ENTERPRISE GROUP INCORPORATED | | | $ | | 1,050 | | | | $ | | 941 | | | | $ | | 276 | |
| | | | | | |
See disclosures regarding PSEG Power LLC included in the Notes to Consolidated Financial Statements.
88
PSEG POWER LLC
CONSOLIDATED BALANCE SHEETS
Millions
| | | | |
| | | December 31, |
| | 2008 | | 2007 |
ASSETS | | | | |
CURRENT ASSETS | | | | |
Cash and Cash Equivalents | | | $ | | 20 | | | | $ | | 11 | |
Accounts Receivable | | | | 472 | | | | | 533 | |
Accounts Receivable—Affiliated Companies, net | | | | 732 | | | | | 441 | |
Fuel | | | | 938 | | | | | 791 | |
Materials and Supplies | | | | 233 | | | | | 220 | |
Derivative Contracts | | | | 225 | | | | | 46 | |
Restricted Funds | | | | 21 | | | | | 50 | |
Prepayments | | | | 53 | | | | | 26 | |
Other | | | | 11 | | | | | 31 | |
| | | | |
Total Current Assets | | | | 2,705 | | | | | 2,149 | |
| | | | |
PROPERTY, PLANT AND EQUIPMENT | | | | 7,441 | | | | | 6,565 | |
Less: Accumulated Depreciation and Amortization | | | | (1,960 | ) | | | | | (1,814 | ) | |
| | | | |
Net Property, Plant and Equipment | | | | 5,481 | | | | | 4,751 | |
| | | | |
NONCURRENT ASSETS | | | | |
Nuclear Decommissioning Trust (NDT) Funds | | | | 970 | | | | | 1,276 | |
Goodwill | | | | 16 | | | | | 16 | |
Other Intangibles | | | | 43 | | | | | 35 | |
Other Special Funds | | | | 27 | | | | | 45 | |
Derivative Contracts | | | | 143 | | | | | 7 | |
Other | | | | 74 | | | | | 57 | |
| | | | |
Total Noncurrent Assets | | | | 1,273 | | | | | 1,436 | |
| | | | |
TOTAL ASSETS | | | $ | | 9,459 | | | | $ | | 8,336 | |
| | | | |
LIABILITIES AND MEMBER’S EQUITY | | | | |
CURRENT LIABILITIES | | | | |
Long-Term Debt Due Within One Year | | | $ | | 250 | | | | $ | | — | |
Accounts Payable | | | | 752 | | | | | 648 | |
Short-Term Loan from Affiliate | | | | 3 | | | | | 238 | |
Derivative Contracts | | | | 338 | | | | | 300 | |
Accrued Interest | | | | 35 | | | | | 34 | |
Other | | | | 155 | | | | | 118 | |
| | | | |
Total Current Liabilities | | | | 1,533 | | | | | 1,338 | |
| | | | |
NONCURRENT LIABILITIES | | | | |
Deferred Income Taxes and Investment Tax Credits (ITC) | | | | 335 | | | | | 176 | |
Asset Retirement Obligations | | | | 334 | | | | | 309 | |
Other Postretirement Benefit (OPEB) Costs | | | | 118 | | | | | 129 | |
Derivative Contracts | | | | 111 | | | | | 158 | |
Accrued Pension Costs | | | | 374 | | | | | 70 | |
Environmental Costs | | | | 54 | | | | | 55 | |
Long-Term Accrued Taxes | | | | 16 | | | | | 26 | |
Other | | | | 47 | | | | | 12 | |
| | | | |
Total Noncurrent Liabilities | | | | 1,389 | | | | | 935 | |
| | | | |
COMMITMENTS AND CONTINGENT LIABILITIES (See Note 11) | | | | |
LONG-TERM DEBT | | | | |
Total Long-Term Debt | | | | 2,653 | | | | | 2,902 | |
| | | | |
MEMBER’S EQUITY | | | | |
Contributed Capital | | | | 2,000 | | | | | 2,000 | |
Basis Adjustment | | | | (986 | ) | | | | | (986 | ) | |
Retained Earnings | | | | 2,988 | | | | | 2,438 | |
Accumulated Other Comprehensive Loss | | | | (118 | ) | | | | | (291 | ) | |
| | | | |
Total Member’s Equity | | | | 3,884 | | | | | 3,161 | |
| | | | |
TOTAL LIABILITIES AND MEMBER’S EQUITY | | | $ | | 9,459 | | | | $ | | 8,336 | |
| | | | |
See disclosures regarding PSEG Power LLC included in the Notes to Consolidated Financial Statements.
89
| | | | | | |
PSEG POWER LLC
CONSOLIDATED STATEMENTS OF CASH FLOWS
Millions |
| | For The Years Ended December 31, |
| | 2008 | | 2007 | | 2006 |
CASH FLOWS FROM OPERATING ACTIVITIES | | | | | | |
Net Income | | | $ | | 1,050 | | | | $ | | 941 | | | | $ | | 276 | |
Adjustments to Reconcile Net Income to Net Cash Flows from Operating Activities: | | | | | | |
Loss on Disposal of Discontinued Operations | | | | — | | | | | — | | | | | 352 | |
Write-down of Property, Plant and Equipment | | | | — | | | | | — | | | | | 44 | |
Depreciation and Amortization | | | | 164 | | | | | 140 | | | | | 157 | |
Amortization of Nuclear Fuel | | | | 101 | | | | | 95 | | | | | 97 | |
Interest Accretion on Asset Retirement Obligations | | | | 25 | | | | | 23 | | | | | 33 | |
Provision for Deferred Income Taxes and ITC | | | | 46 | | | | | 222 | | | | | (110 | ) | |
Net Realized and Unrealized (Gains) Losses on Energy Contracts and Other Derivatives | | | | (36 | ) | | | | | 33 | | | | | 5 | |
Non-Cash Employee Benefit Plan Costs | | | | 23 | | | | | 28 | | | | | 46 | |
Net Realized (Gains) Losses and (Income) Expense from NDT Funds | | | | 115 | | | | | (48 | ) | | | | | (64 | ) | |
Net Change in Certain Current Assets and Liabilities: | | | | | | |
Fuel, Materials and Supplies | | | | (160 | ) | | | | | 37 | | | | | (45 | ) | |
Margin Deposit Asset | | | | 242 | | | | | (79 | ) | | | | | 290 | |
Margin Deposit Liability | | | | 77 | | | | | (2 | ) | | | | | (49 | ) | |
Accounts Receivable | | | | 11 | | | | | (110 | ) | | | | | 142 | |
Accounts Payable | | | | 26 | | | | | 16 | | | | | (132 | ) | |
Accounts Receivable/Payable-Affiliated Companies, net | | | | (18 | ) | | | | | (65 | ) | | | | | 122 | |
Other Current Assets and Liabilities | | | | 47 | | | | | (17 | ) | | | | | (5 | ) | |
Employee Benefit Plan Funding and Related Payments | | | | (20 | ) | | | | | (15 | ) | | | | | (37 | ) | |
Other | | | | (7 | ) | | | | | 6 | | | | | (79 | ) | |
| | | | | | |
Net Cash Provided By Operating Activities | | | | 1,686 | | | | | 1,205 | | | | | 1,043 | |
| | | | | | |
CASH FLOWS FROM INVESTING ACTIVITIES | | | | | | |
Additions to Property, Plant and Equipment | | | | (973 | ) | | | | | (715 | ) | | | | | (418 | ) | |
Proceeds from Sale of Discontinued Operations | | | | — | | | | | 325 | | | | | — | |
Sales of Property, Plant and Equipment | | | | 2 | | | | | 40 | | | | | 1 | |
Proceeds from NDT Funds Sales | | | | 3,060 | | | | | 1,672 | | | | | 1,405 | |
NDT Funds Interest and Dividends | | | | 48 | | | | | 48 | | | | | 40 | |
Investment in NDT Funds | | | | (3,093 | ) | | | | | (1,703 | ) | | | | | (1,427 | ) | |
Restricted Funds | | | | 29 | | | | | (50 | ) | | | | | — | |
Other | | | | (15 | ) | | | | | (17 | ) | | | | | 9 | |
| | | | | | |
Net Cash Used In Investing Activities | | | | (942 | ) | | | | | (400 | ) | | | | | (390 | ) | |
| | | | | | |
CASH FLOWS FROM FINANCING ACTIVITIES | | | | | | |
Issuance of Long-Term Debt | | | | — | | | | | 84 | | | | | — | |
Cash Dividend Paid | | | | (500 | ) | | | | | (1,075 | ) | | | | | — | |
Redemption of Long-term Debt | | | | — | | | | | — | | | | | (500 | ) | |
Short-Term Loan—Affiliated Company, net | | | | (235 | ) | | | | | 184 | | | | | (148 | ) | |
| | | | | | |
Net Cash Used In Financing Activities | | | | (735 | ) | | | | | (807 | ) | | | | | (648 | ) | |
| | | | | | |
Net Increase (Decrease) in Cash and Cash Equivalents | | | | 9 | | | | | (2 | ) | | | | | 5 | |
Cash and Cash Equivalents at Beginning of Period | | | | 11 | | | | | 13 | | | | | 8 | |
| | | | | | |
Cash and Cash Equivalents at End of Period | | | $ | | 20 | | | | $ | | 11 | | | | $ | | 13 | |
| | | | | | |
Supplemental Disclosure of Cash Flow Information: | | |
Income Taxes Paid | | | $ | | 531 | | | | $ | | 345 | | | | $ | | 251 | |
Interest Paid, Net of Amounts Capitalized | | | $ | | 160 | | | | $ | | 169 | | | | $ | | 173 | |
See disclosures regarding PSEG Power LLC included in the Notes to Consolidated Financial Statements.
90
PSEG POWER LLC
CONSOLIDATED STATEMENTS OF MEMBER’S EQUITY
Millions
| | | | | | | | | | |
| | Contributed
Capital | | Basis
Adjustment | | Retained
Earnings | | Accumulated
Other
Comprehensive
Loss | | Total
Member’s
Equity |
Balance as of January 1, 2006 | | | $ | | 2,000 | | | | $ | | (986 | ) | | | | $ | | 2,310 | | | | $ | | (487 | ) | | | | $ | | 2,837 | |
| | | | | | | | | | |
Net Income | | | | — | | | | | — | | | | | 276 | | | | | — | | | | | 276 | |
Other Comprehensive Income (Loss), net of tax: | | | | | | | | | | |
Available-for-Sale Securities, net of tax | | | | — | | | | | — | | | | | — | | | | | 37 | | | | | 37 | |
Pension/OPEB Adjustment, net of tax | | | | — | | | | | — | | | | | — | | | | | (4 | ) | | | | | (4 | ) | |
Change in Fair Value of Derivative Instruments, net of tax | | | | — | | | | | — | | | | | — | | | | | 343 | | | | | 343 | |
Reclassification Adjustments for Net Amount included in Net Income, net of tax | | | | — | | | | | — | | | | | — | | | | | 107 | | | | | 107 | |
| | | | | | | | | | |
Other Comprehensive Income | | | | | | | | | | | | 483 | |
Comprehensive Income | | | | | | | | | | | | 759 | |
Adjustment to Initially Apply FASB Statement 158, net of tax | | | | — | | | | | — | | | | | — | | | | | (173 | ) | | | | | (173 | ) | |
| | | | | | | | | | |
Balance as of December 31, 2006 | | | $ | | 2,000 | | | | $ | | (986 | ) | | | | $ | | 2,586 | | | | $ | | (177 | ) | | | | $ | | 3,423 | |
| | | | | | | | | | |
Net Income | | | | — | | | | | — | | | | | 941 | | | | | — | | | | | 941 | |
Other Comprehensive Income (Loss), net of tax: | | | | | | | | | | |
Available for Sale Securities, net of tax | | | | — | | | | | — | | | | | — | | | | | (10 | ) | | | | | (10 | ) | |
Change in Fair Value of Derivative Instruments, net of tax | | | | — | | | | | — | | | | | — | | | | | (287 | ) | | | | | (287 | ) | |
Reclassification Adjustments for Net Amount included in Net Income, net of tax | | | | — | | | | | — | | | | | — | | | | | 145 | | | | | 145 | |
Pension/OPEB Adjustment, net of tax | | | | — | | | | | — | | | | | — | | | | | 38 | | | | | 38 | |
| | | | | | | | | | |
Other Comprehensive Loss | | | | | | | | | | | | (114 | ) | |
Comprehensive Income | | | | | | | | | | | | 789 | |
Adjustment to Initially Apply FIN 48, net of tax | | | | — | | | | | — | | | | | (14 | ) | | | | | — | | | | | (14 | ) | |
Cash Dividends Paid | | | | — | | | | | — | | | | | (1,075 | ) | | | | | — | | | | | (1,075 | ) | |
| | | | | | | | | | |
Balance as of December 31, 2007 | | | $ | | 2,000 | | | | $ | | (986 | ) | | | | $ | | 2,438 | | | | $ | | (291 | ) | | | | $ | | 3,161 | |
| | | | | | | | | | |
Net Income | | | | — | | | | | — | | | | | 1,050 | | | | | — | | | | | 1,050 | |
Other Comprehensive Income (Loss), net of tax: | | | | | | | | | | |
Available-for-Sale Securities, net of tax | | | | — | | | | | — | | | | | | | (79 | ) | | | | | (79 | ) | |
Pension/OPEB Adjustment, net of tax | | | | — | | | | | — | | | | | — | | | | | (173 | ) | | | | | (173 | ) | |
Change in Fair Value of Derivative Instruments, net of tax | | | | — | | | | | — | | | | | — | | | | | 254 | | | | | 254 | |
Reclassification Adjustments for Net Amount included in Net Income, net of tax | | | | — | | | | | — | | | | | — | | | | | 172 | | | | | 172 | |
| | | | | | | | | | |
Other Comprehensive Income | | | | | | | | | | | | 174 | |
Comprehensive Income | | | | | | | | | | | | 1,224 | |
Cash Dividends Paid | | | | — | | | | | — | | | | | (500 | ) | | | | | — | | | | | (500 | ) | |
| | | | | | | | | | |
Balance as of December 31, 2008 | | | $ | | 2,000 | | | | $ | | (986 | ) | | | | $ | | 2,988 | | | | $ | | (117 | ) | | | | $ | | 3,885 | |
| | | | | | | | | | |
See disclosures regarding PSEG Power LLC included in the Notes to Consolidated Financial Statements.
91
[THIS PAGE INTENTIONALLY LEFT BLANK]
92
PUBLIC SERVICE ELECTRIC AND GAS COMPANY
CONSOLIDATED STATEMENTS OF OPERATIONS
Millions
| | | | | | |
| | For The Years Ended December 31, |
| | 2008 | | 2007 | | 2006 |
OPERATING REVENUES | | | $ | | 9,038 | | | | $ | | 8,493 | | | | $ | | 7,569 | |
OPERATING EXPENSES | | | | | | |
Energy Costs | | | | 6,072 | | | | | 5,498 | | | | | 4,884 | |
Operation and Maintenance | | | | 1,338 | | | | | 1,308 | | | | | 1,160 | |
Depreciation and Amortization | | | | 583 | | | | | 591 | | | | | 620 | |
Taxes Other Than Income Taxes | | | | 136 | | | | | 139 | | | | | 133 | |
| | | | | | |
Total Operating Expenses | | | | 8,129 | | | | | 7,536 | | | | | 6,797 | |
| | | | | | |
OPERATING INCOME | | | | 909 | | | | | 957 | | | | | 772 | |
Other Income | | | | 12 | | | | | 16 | | | | | 25 | |
Other Deductions | | | | (4 | ) | | | | | (4 | ) | | | | | (3 | ) | |
Interest Expense | | | | (325 | ) | | | | | (332 | ) | | | | | (346 | ) | |
| | | | | | |
INCOME BEFORE INCOME TAXES | | | | 592 | | | | | 637 | | | | | 448 | |
Income Tax Expense | | | | (228 | ) | | | | | (257 | ) | | | | | (183 | ) | |
| | | | | | |
NET INCOME | | | | 364 | | | | | 380 | | | | | 265 | |
Preferred Stock Dividends | | | | (4 | ) | | | | | (4 | ) | | | | | (4 | ) | |
| | | | | | |
EARNINGS AVAILABLE TO PUBLIC
SERVICE ENTERPRISE GROUP INCORPORATED | | | $ | | 360 | | | | $ | | 376 | | | | $ | | 261 | |
| | | | | | |
See disclosures regarding Public Service Electric and Gas Company included in the Notes to Consolidated Financial Statements.
93
PUBLIC SERVICE ELECTRIC AND GAS COMPANY
CONSOLIDATED BALANCE SHEETS
Millions
| | | | |
| | December 31, |
| | 2008 | | 2007 |
ASSETS | | | | |
CURRENT ASSETS | | | | |
Cash and Cash Equivalents | | | $ | | 91 | | | | $ | | 32 | |
Accounts Receivable, net of allowances of $65 in 2008 and $45 in 2007 | | | | 909 | | | | | 995 | |
Unbilled Revenues | | | | 454 | | | | | 353 | |
Materials and Supplies | | | | 61 | | | | | 53 | |
Prepayments | | | | 45 | | | | | 57 | |
Restricted Funds | | | | 1 | | | | | 7 | |
Derivative Contracts | | | | — | | | | | 1 | |
Deferred Income Taxes | | | | 52 | | | | | 44 | |
| | | | |
Total Current Assets | | | | 1,613 | | | | | 1,542 | |
| | | | |
PROPERTY, PLANT AND EQUIPMENT | | | | 12,258 | | | | | 11,531 | |
Less: Accumulated Depreciation and Amortization | | | | (4,122 | ) | | | | | (3,920 | ) | |
| | | | |
Net Property, Plant and Equipment | | | | 8,136 | | | | | 7,611 | |
| | | | |
NONCURRENT ASSETS | | | | |
Regulatory Assets | | | | 6,352 | | | | | 5,165 | |
Long-Term Investments | | | | 158 | | | | | 153 | |
Other Special Funds | | | | 46 | | | | | 57 | |
Other | | | | 101 | | | | | 109 | |
| | | | |
Total Noncurrent Assets | | | | 6,657 | | | | | 5,484 | |
| | | | |
TOTAL ASSETS | | | $ | | 16,406 | | | | $ | | 14,637 | |
| | | | |
See disclosures regarding Public Service Electric and Gas Company included in the Notes to Consolidated Financial Statements.
94
PUBLIC SERVICE ELECTRIC AND GAS COMPANY
CONSOLIDATED BALANCE SHEETS
Millions
| | | | |
| | December 31, |
| | 2008 | | 2007 |
LIABILITIES AND CAPITALIZATION |
CURRENT LIABILITIES | | | | |
Long-Term Debt Due Within One Year | | | $ | | 248 | | | | $ | | 429 | |
Commercial Paper and Loans | | | | 19 | | | | | 65 | |
Accounts Payable | | | | 336 | | | | | 325 | |
Accounts Payable—Affiliated Companies, net | | | | 763 | | | | | 559 | |
Accrued Interest | | | | 58 | | | | | 56 | |
Accrued Taxes | | | | 3 | | | | | 29 | |
Clean Energy Program | | | | 142 | | | | | 135 | |
Derivative Contracts | | | | 14 | | | | | 20 | |
Obligation to Return Cash Collateral | | | | 102 | | | | | 79 | |
Other | | | | 227 | | | | | 239 | |
| | | | |
Total Current Liabilities | | | | 1,912 | | | | | 1,936 | |
| | | | |
NONCURRENT LIABILITIES | | | | |
Deferred Income Taxes and ITC | | | | 2,533 | | | | | 2,440 | |
Other Postretirement Benefit (OPEB) Costs | | | | 813 | | | | | 821 | |
Accrued Pension Costs | | | | 634 | | | | | 63 | |
Regulatory Liabilities | | | | 355 | | | | | 419 | |
Clean Energy Program | | | | 532 | | | | | 14 | |
Environmental Costs | | | | 689 | | | | | 594 | |
Asset Retirement Obligations | | | | 240 | | | | | 231 | |
Derivative Contracts | | | | 53 | | | | | 36 | |
Long-Term Accrued Taxes | | | | 82 | | | | | 75 | |
Other | | | | 31 | | | | | 9 | |
| | | | |
Total Noncurrent Liabilities | | | | 5,962 | | | | | 4,702 | |
| | | | |
COMMITMENTS AND CONTINGENT LIABILITIES (See Note 11) | | | | |
CAPITALIZATION | | | | |
LONG-TERM DEBT | | | | |
Long-Term Debt | | | | 3,463 | | | | | 3,102 | |
Securitization Debt | | | | 1,342 | | | | | 1,530 | |
| | | | |
Total Long-Term Debt | | | | 4,805 | | | | | 4,632 | |
| | | | |
PREFERRED SECURITIES | | | | |
Preferred Stock Without Mandatory Redemption, $100 par value, 7,500,000 authorized; issued and outstanding, 2008 and 2007—795,234 shares | | | | 80 | | | | | 80 | |
| | | | |
COMMON STOCKHOLDER’S EQUITY | | | | |
Common Stock; 150,000,000 shares authorized; issued and outstanding, 2008 and 2007—132,450,344 shares | | | | 892 | | | | | 892 | |
Contributed Capital | | | | 170 | | | | | 170 | |
Basis Adjustment | | | | 986 | | | | | 986 | |
Retained Earnings | | | | 1,597 | | | | | 1,237 | |
Accumulated Other Comprehensive Income | | | | 2 | | | | | 2 | |
| | | | |
Total Common Stockholder’s Equity | | | | 3,647 | | | | | 3,287 | |
| | | | |
Total Capitalization | | | | 8,532 | | | | | 7,999 | |
| | | | |
TOTAL LIABILITIES AND CAPITALIZATION | | | $ | | 16,406 | | | | $ | | 14,637 | |
| | | | |
See disclosures regarding Public Service Electric and Gas Company included in the Notes to Consolidated Financial Statements.
95
PUBLIC SERVICE ELECTRIC AND GAS COMPANY
CONSOLIDATED STATEMENTS OF CASH FLOWS
Millions
| | | | | | |
| | For The Years Ended
December 31, |
| | 2008 | | 2007 | | 2006 |
CASH FLOWS FROM OPERATING ACTIVITIES | | | | | | |
Net Income | | | $ | | 364 | | | | $ | | 380 | | | | $ | | 265 | |
Adjustments to Reconcile Net Income to Net Cash Flows from Operating Activities: | | | | | | |
Depreciation and Amortization | | | | 583 | | | | | 591 | | | | | 620 | |
Provision for Deferred Income Taxes and ITC | | | | 86 | | | | | (78 | ) | | | | | (112 | ) | |
Non-Cash Employee Benefit Plan Costs | | | | 129 | | | | | 140 | | | | | 170 | |
Gain on Sale of Property, Plant and Equipment | | | | (1 | ) | | | | | (3 | ) | | | | | (4 | ) | |
Non-Cash Interest Expense | | | | 15 | | | | | 12 | | | | | 18 | |
Cost of Removal | | | | (44 | ) | | | | | (37 | ) | | | | | (33 | ) | |
Employee Benefit Plan Funding and Related Payments | | | | (108 | ) | | | | | (69 | ) | | | | | (97 | ) | |
Over Recovery of Electric Energy Costs (BGS and NTC) | | | | 4 | | | | | (28 | ) | | | | | 24 | |
Under Recovery of Gas Costs | | | | (47 | ) | | | | | (43 | ) | | | | | 87 | |
Under Recovery of SBC | | | | (75 | ) | | | | | (53 | ) | | | | | (175 | ) | |
Other Non-Cash Charges | | | | (5 | ) | | | | | (4 | ) | | | | | (5 | ) | |
Net Changes in Certain Current Assets and Liabilities: | | | | | | |
Accounts Receivable and Unbilled Revenues | | | | (19 | ) | | | | | (218 | ) | | | | | 220 | |
Materials and Supplies | | | | (8 | ) | | | | | (3 | ) | | | | | (1 | ) | |
Prepayments | | | | 12 | | | | | (48 | ) | | | | | 29 | |
Accrued Taxes | | | | (26 | ) | | | | | 2 | | | | | (23 | ) | |
Accrued Interest | | | | 2 | | | | | 1 | | | | | (4 | ) | |
Accounts Payable | | | | 11 | | | | | 71 | | | | | (32 | ) | |
Accounts Receivable/Payable-Affiliated Companies, net | | | | (8 | ) | | | | | 54 | | | | | (72 | ) | |
Obligation to Return Cash Collateral | | | | 23 | | | | | 17 | | | | | (54 | ) | |
Other Current Assets and Liabilities | | | | 9 | | | | | (16 | ) | | | | | (3 | ) | |
Other | | | | 16 | | | | | 10 | | | | | (12 | ) | |
| | | | | | |
Net Cash Provided By Operating Activities | | | | 913 | | | | | 678 | | | | | 806 | |
| | | | | | |
CASH FLOWS FROM INVESTING ACTIVITIES | | | | | | |
Additions to Property, Plant and Equipment | | | | (761 | ) | | | | | (570 | ) | | | | | (528 | ) | |
Proceeds from the Sale of Property, Plant and Equipment | | | | 1 | | | | | 3 | | | | | 2 | |
Restricted Funds | | | | (1 | ) | | | | (1 | ) | | | | | (1 | ) | |
| | | | | | |
Net Cash Used In Investing Activities | | | | (761 | ) | | | | | (568 | ) | | | | | (527 | ) | |
| | | | | | |
CASH FLOWS FROM FINANCING ACTIVITIES | | | | | | |
Net Change in Short-Term Debt | | | | (46 | ) | | | | | 34 | | | | | 31 | |
Issuance of Long-Term Debt | | | | 1,075 | | | | | 350 | | | | | 250 | |
Redemption of Long-Term Debt | | | | (901 | ) | | | | | (113 | ) | | | | | (322 | ) | |
Redemption of Securitization Debt | | | | (179 | ) | | | | | (170 | ) | | | | | (163 | ) | |
Deferred Issuance Costs | | | | (6 | ) | | | | | (3 | ) | | | | | (2 | ) | |
Premium Paid on Early Retirement of Debt | | | | (32 | ) | | | | | — | | | | | — | |
Cash Dividends Paid on Common Stock | | | | — | | | | | (200 | ) | | | | | (200 | ) | |
Preferred Stock Dividends | | | | (4 | ) | | | | | (4 | ) | | | | | (4 | ) | |
| | | | | | |
Net Cash Used In Financing Activities | | | | (93 | ) | | | | | (106 | ) | | | | | (410 | ) | |
| | | | | | |
Net Increase (Decrease) In Cash and Cash Equivalents | | | | 59 | | | | | 4 | | | | | (131 | ) | |
Cash and Cash Equivalents at Beginning of Period | | | | 32 | | | | | 28 | | | | | 159 | |
| | | | | | |
Cash and Cash Equivalents at End of Period | | | $ | | 91 | | | | $ | | 32 | | | | $ | | 28 | |
| | | | | | |
Supplemental Disclosure of Cash Flow Information: | | | | | | |
Income Taxes Paid | | | $ | | 125 | | | | $ | | 336 | | | | $ | | 237 | |
Interest Paid, Net of Amounts Capitalized | | | $ | | 317 | | | | $ | | 314 | | | | $ | | 312 | |
See disclosures regarding Public Service Electric and Gas Company included in the Notes to Consolidated Financial Statements.
96
PUBLIC SERVICE ELECTRIC AND GAS COMPANY
CONSOLIDATED STATEMENTS OF COMMON STOCKHOLDERS’ EQUITY
Millions
| | | | | | | | | | | | |
| | Common
Stock | | Contributed
Capital | | Basis
Adjustment | | Retained
Earnings | | Accumulated
Other
Comprehensive
Income (Loss) | | Total |
Balance as of January 1, 2006 | | | $ | | 892 | | | | $ | | 170 | | | | $ | | 986 | | | | $ | | 1,000 | | | | $ | | (5 | ) | | | | $ | | 3,043 | |
| | | | | | | | | | | | |
Net Income | | | | — | | | | | — | | | | | — | | | | | 265 | | | | | — | | | | | 265 | |
Other Comprehensive Income, net of tax: | | | | | | | | | | | | |
Pension/OPEB Adjustment, net of tax | | | | — | | | | | — | | | | | — | | | | | — | | | | | 5 | | | | | 5 | |
| | | | | | | | | | | | |
Comprehensive Income | | | | | | | | | | | | | | 270 | |
Adjustment for Application of FASB Statement 158, net of tax | | | | — | | | | | — | | | | | — | | | | | — | | | | | 1 | | | | | 1 | |
Cash Dividends on Common Stock | | | | — | | | | | — | | | | | — | | | | | (200 | ) | | | | | — | | | | | (200 | ) | |
Cash Dividends on Preferred Stock | | | | — | | | | | — | | | | | — | | | | | (4 | ) | | | | | — | | | | | (4 | ) | |
| | | | | | | | | | | | |
Balance as of December 31, 2006 | | | $ | | 892 | | | | $ | | 170 | | | | $ | | 986 | | | | $ | | 1,061 | | | | $ | | 1 | | | | $ | | 3,110 | |
| | | | | | | | | | | | |
Net Income | | | | — | | | | | — | | | | | — | | | | | 380 | | | | | — | | | | | 380 | |
Other Comprehensive Income, net of tax: | | | | | | | | | | | | |
Pension/OPEB Adjustment, net of tax | | | | — | | | | | — | | | | | — | | | | | — | | | | | 1 | | | | | 1 | |
| | | | | | | | | | | | |
Comprehensive Income | | | | | | | | | | | | | | 381 | |
Cash Dividends on Common Stock | | | | — | | | | | — | | | | | — | | | | | (200 | ) | | | | | — | | | | | (200 | ) | |
Cash Dividends on Preferred Stock | | | | — | | | | | — | | | | | — | | | | | (4 | ) | | | | | — | | | | | (4 | ) | |
| | | | | | | | | | | | |
Balance as of December 31, 2007 | | | $ | | 892 | | | | $ | | 170 | | | | $ | | 986 | | | | $ | | 1,237 | | | | $ | | 2 | | | | $ | | 3,287 | |
| | | | | | | | | | | | |
Net Income | | | | — | | | | | — | | | | | — | | | | | 364 | | | | | — | | | | | 364 | |
| | | | | | | | | | | | |
Comprehensive Income | | | | | | | | | | | | | | 364 | |
Cash Dividends on Preferred Stock | | | | — | | | | | — | | | | | — | | | | | (4 | ) | | | | | — | | | | | (4 | ) | |
| | | | | | | | | | | | |
Balance as of December 31, 2008 | | | $ | | 892 | | | | $ | | 170 | | | | $ | | 986 | | | | $ | | 1,597 | | | | $ | | 2 | | | | $ | | 3,647 | |
| | | | | | | | | | | | |
See disclosures regarding Public Service Electric and Gas Company included in the Notes to Consolidated Financial Statements.
97
NOTES TO CONSOLIDATED FINANCIAL STATEMENTS
Note 1. Organization and Summary of Significant Accounting Policies
Organization
Public Service Enterprise Group Incorporated (PSEG)
PSEG is a holding company with a diversified business mix within the energy industry. Its operations are primarily in the Northeastern and Mid Atlantic United States and in other select markets. PSEG’s four principal direct wholly owned subsidiaries are:
|
• | | | | PSEG Power LLC (Power)—which is a multi-regional, wholesale energy supply company that integrates its generating asset operations and gas supply commitments with its wholesale energy, fuel supply, energy trading and marketing and risk management function through three principal direct wholly owned subsidiaries. Power’s subsidiaries are subject to regulation by the Federal Energy Regulatory Commission (FERC), the Nuclear Regulatory Commission (NRC) and the states in which it operates. |
|
• | | | | Public Service Electric and Gas Company (PSE&G)—which is an operating public utility engaged principally in the transmission of electric energy and distribution of electric energy and natural gas in certain areas of New Jersey. PSE&G is subject to regulation by the New Jersey Board of Public Utilities (BPU) and the FERC. |
|
• | | | | PSEG Energy Holdings L.L.C. (Energy Holdings)—which owns and operates primarily domestic projects engaged in the generation of energy and has invested in energy-related leveraged leases through its direct wholly owned subsidiaries. |
|
• | | | | PSEG Services Corporation (Services)—which provides management and administrative and general services to PSEG and its subsidiaries. |
Significant Accounting Policies
Principles of Consolidation
Each company consolidates those entities in which it has a controlling interest or is the primary beneficiary. Entities over which the companies exhibit significant influence, but do not have a controlling interest and/or are not the primary beneficiary are accounted for under the equity method of accounting. For investments in which significant influence does not exist and the investor is not the primary beneficiary, the cost method of accounting is applied. All intercompany accounts and transactions are eliminated in consolidation.
Power and PSE&G also have undivided interests in certain jointly-owned facilities, with each responsible for paying its respective ownership share of construction costs, fuel purchases and operating expenses. All revenues and expenses related to these facilities are consolidated at their respective pro-rata ownership share in the appropriate revenue and expense categories.
PSE&G has determined that PSE&G Transition Funding LLC (Transition Funding) and PSE&G Transition Funding II LLC (Transition Funding II) are variable interest entities (VIEs) for which it is the primary beneficiary as defined by FIN46(R) “Consolidation of Variable Interest Entities” (FIN 46R). Accordingly, PSE&G consolidates $1.6 billion of VIE assets and liabilities within its Consolidated Balance Sheet classified as Regulatory Assets and Long-term Debt, respectively.
Transition Funding and Transition Funding II were formed solely for the purpose of issuing transition bonds and purchasing bond transitional property of PSE&G, which is pledged as collateral to the trustee. PSE&G acts as the servicer for these entities to collect securitization transition charges authorized by the BPU. These funds are remitted to Transition Funding and Transition Funding II and are used for interest and principal payments on the transition bonds and related costs. PSE&G’s maximum exposure to loss is equal to its $15 million equity investment in these VIEs. The risk of actual loss to PSE&G is considered remote.
98
NOTES TO CONSOLIDATED FINANCIAL STATEMENTS
Energy Holdings has variable interests through its investments in two partnerships where it is also the primary beneficiary as defined by FIN46(R). As a result, Energy Holdings consolidates the assets and liabilities of these partnerships in amounts totaling $61 million and $17 million respectively, which are reflected in Property, Plant and Equipment ($46 million), Other Assets ($15 million), Long-Term Debt ($15 million) and Notes Payable ($2 million) as of December 31, 2008. In the unlikely event that the assets of these VIEs (commercial real estate and compressed air energy storage patented technology) become impaired or worthless, Energy Holdings’ maximum exposure to loss would be $43 million, the carrying amount of its investment. Energy Holdings is also committed to fund any operating losses on one of the partnerships up to $15 million through 2011.
Accounting for the Effects of Regulation
PSE&G prepares its financial statements in accordance with the provisions of Statement of Financial Accounting Standards (SFAS) No. 71, “Accounting for the Effects of Certain Types of Regulation” (SFAS 71). In general, SFAS 71 recognizes that accounting for rate-regulated enterprises should reflect the economic effects of regulation. As a result, a regulated utility is required to defer the recognition of costs (a regulatory asset) or record the recognition of obligations (a regulatory liability) if it is probable that, through the rate-making process, there will be a corresponding increase or decrease in future rates. Accordingly, PSE&G has deferred certain costs and recoveries, which are being amortized over various future periods. To the extent that collection of any such costs or payment of liabilities is no longer probable as a result of changes in regulation and/or competitive position, the associated regulatory asset or liability is charged or credited to income. Management believes that PSE&G’s transmission and distribution businesses continue to meet the requirements for application of SFAS 71. For additional information, see Note 5. Regulatory Assets and Liabilities.
Derivative Financial Instruments
Each company uses derivative financial instruments to manage risk from changes in interest rates, commodity prices, congestion costs and emission credit prices, pursuant to its business plans and prudent practices.
Derivative instruments, not designated as normal purchases or sales, are recognized on the balance sheet at their fair value. Changes in the fair value of a derivative that is highly effective as, and that is designated and qualifies as, a fair value hedge, along with changes of the fair value of the hedged asset or liability that are attributable to the hedged risk, are recorded in current-period earnings. Changes in the fair value of a derivative that is highly effective as, and that is designated and qualifies as, a cash flow hedge are recorded in Accumulated Other Comprehensive Income / Loss until earnings are affected by the variability of cash flows of the hedged transaction. Any hedge ineffectiveness is included in current-period earnings. For derivative contracts that do not qualify as hedges or are not designated as normal purchases or sales or as cash flow hedges, changes in fair value are recorded in current-period earnings.
Many non-trading contracts qualify for the normal purchases and normal sales exemption under SFAS No. 133, “Accounting for Derivative Instruments and Hedging Activities,” as amended and interpreted (SFAS 133) and are accounted for upon settlement.
For additional information regarding derivative financial instruments, see Note 14. Financial Risk Management Activities.
Revenue Recognition
The majority of Power’s revenues relate to bilateral contracts, which are accounted for on the accrual basis as the energy is delivered. Power’s revenue also includes changes in value of non trading energy derivative contracts that are not designated as normal purchases or sales or as hedges of other positions. Power records margins from energy trading on a net basis pursuant to accounting principles generally accepted in the United States (GAAP). See Note 14. Financial Risk Management Activities for further discussion.
99
NOTES TO CONSOLIDATED FINANCIAL STATEMENTS
PSE&G’s revenues are recorded based on services rendered to customers during each accounting period. PSE&G records unbilled revenues for the estimated amount customers will be billed for services rendered from the time meters were last read to the end of the respective accounting period. The unbilled revenue is estimated each month based on usage per day, the number of unbilled days in the period, estimated seasonal loads based upon the time of year and the variance of actual degree-days and temperature-humidity-index hours of the unbilled period from expected norms.
Energy Holdings’ revenues are earned pursuant to long-term power purchase agreements, shorter-term third party sales arrangements, or sales of energy through the spot market and from income relating to its investments in leveraged leases, which is recognized by a method which produces a constant after-tax rate of return on the outstanding investment in the lease, net of the related deferred tax liability, in the years in which the net investment is positive. Any gains or losses incurred as a result of a lease termination are recorded as Operating Revenue as these events occur in the ordinary course of business of managing the investment portfolio. See Note 6. Long-Term Investments for further discussion.
Depreciation and Amortization
Power calculates depreciation on generation-related assets under the straight-line method based on the assets’ estimated useful lives. The estimated useful lives are:
|
• | | | | general plant assets—three to 20 years |
|
• | | | | fossil production assets—18 years to 91 years |
|
• | | | | nuclear generation assets—53 years to 58 years |
|
• | | | | pumped storage facilities—76 years |
PSE&G calculates depreciation under the straight-line method based on estimated average remaining lives of the several classes of depreciable property. These estimates are reviewed on a periodic basis and necessary adjustments are made as approved by the BPU or the FERC. The depreciation rate stated as a percentage of original cost of depreciable property was 2.47% for 2008, 2.46% for 2007 and 2.84% for 2006.
Energy Holdings calculates depreciation under the straight-line method based on estimated average lives of several classes of depreciable property as follows:
|
• | | | | generation assets—40 years |
|
• | | | | leasehold improvements—10 years |
|
• | | | | furniture and equipment—three years to 12 years |
|
• | | | | intangible assets—19 years |
Taxes Other Than Income Taxes
Excise taxes, transitional energy facilities assessment (TEFA) and gross receipts tax (GRT) collected from PSE&G’s customers are presented in the financial statements on a gross basis. For the years ended December 31, 2008, 2007 and 2006, combined TEFA and GRT of $150 million, $154 million and $146 million, respectively, are reflected in Operating Revenues and $136 million, $140 million and $132 million, respectively, are included in Taxes Other Than Income Taxes on the Consolidated Statements of Operations.
Interest Capitalized During Construction (IDC) and Allowance for Funds Used During Construction (AFUDC)
IDC represents the cost of debt used to finance construction at Power. AFUDC represents the cost of debt and equity funds used to finance the construction of new utility assets at PSE&G under the guidance of SFAS 71. The amount of IDC or AFUDC capitalized as Property, Plant and Equipment is included as a reduction of interest charges or other income for the equity portion. The amounts and average rates used to calculate IDC or AFUDC for the years ended December 31, 2008, 2007 and 2006 are as follows:
100
NOTES TO CONSOLIDATED FINANCIAL STATEMENTS
| | | | | | | | | | | | |
| | IDC/AFUDC Capitalized |
| | 2008 | | 2007 | | 2006 |
| | Millions | | Avg Rate | | Millions | | Avg Rate | | Millions | | Avg Rate |
Power | | | $ | | 44 | | | | | 6.63 | % | | | | $ | | 33 | | | | | 6.81 | % | | | | $ | | 41 | | | | | 6.81 | % | |
PSE&G | | | $ | | 4 | | | | | 3.46 | % | | | | $ | | 3 | | | | | 5.44 | % | | | | $ | | 2 | | | | | 4.99 | % | |
Income Taxes
PSEG and its subsidiaries file a consolidated federal income tax return and income taxes are allocated to PSEG’s subsidiaries based on the taxable income or loss of each subsidiary. Investment tax credits deferred in prior years are being amortized over the useful lives of the related property.
We account for uncertain income tax positions using a benefit recognition model with a two-step approach, a more-likely-than-not recognition criterion and a measurement attribute that measures the position as the largest amount of tax benefit that is greater than 50% likely of being realized upon ultimate settlement in accordance with FIN 48, “Accounting for Uncertainty in Income Taxes—an interpretation of FASB Statement 109” (FIN 48). If it is not more likely than not that the benefit will be sustained on its technical merits, no benefit will be recorded. Uncertain tax positions that relate only to timing of when an item is included on a tax return are considered to have met the recognition threshold.
Cash and Cash Equivalents
Cash equivalents consist of short-term, highly liquid investments with original maturities of three months or less.
Materials and Supplies and Fuel
Materials and supplies and fuel for Power and Energy Holdings are valued at the lower of average cost or market. PSE&G’s materials and supplies are carried at average cost consistent with the rate-making process.
Restricted Funds
Power’s restricted funds represent restricted cash for qualifying expenditures for solid waste disposal technology related to pollution control notes issued by Power for two of its coal-fired generation stations. PSE&G’s restricted funds represent revenues collected from its retail electric customers that must be used to pay the principal, interest and other expenses associated with the securitization bonds of Transition Funding and Transition Funding II. Energy Holdings’ restricted funds represent cash accounts designated for maintenance costs, debt service reserves and other specific purposes as set forth in certain of the loan agreements of PSEG Texas, LP (PSEG Texas), a wholly owned indirect subsidiary of Energy Holdings.
Property, Plant and Equipment
Power capitalizes costs which increase the capacity or extend the life of an existing asset, represent a newly acquired or constructed asset or represent the replacement of a retired asset. The cost of maintenance, repair and replacement of minor items of property is charged to appropriate expense accounts as incurred. Environmental costs are capitalized if the costs mitigate or prevent future environmental contamination or if the costs improve existing assets’ environmental safety or efficiency. All other environmental expenditures are expensed as incurred.
PSE&G’s additions and replacements to property, plant and equipment that are either retirement units or property record units are capitalized at original cost. The cost of maintenance, repair and replacement of minor items of property is charged to expense as incurred. At the time units of depreciable property are retired or otherwise disposed of, the original cost, adjusted for net salvage value, is charged to accumulated depreciation.
101
NOTES TO CONSOLIDATED FINANCIAL STATEMENTS
Other Special Funds
Other Special Funds represents amounts deposited to fund the qualified pension plans and to fund a Rabbi Trust which was established to meet the obligations related to three non-qualified pension plans and a deferred compensation plan.
Nuclear Decommissioning Trust (NDT) Funds
Realized gains and losses on securities in the NDT Funds are recorded in earnings and unrealized gains and losses on such securities are recorded as a component of Accumulated Other Comprehensive Loss unless securities with such unrealized losses are deemed to be other-than-temporarily- impaired and are recorded in earnings.
Investments in Corporate Joint Ventures and Partnerships
Generally, PSEG’s interests in active joint ventures and partnerships are accounted for under the equity method of accounting when its respective ownership interests are 50% or less, it is not the primary beneficiary, as defined under FIN 46R, and significant influence over joint venture or partnership operating and management decisions exists. For investments in which significant influence does not exist and PSEG is not the primary beneficiary, the cost method of accounting is applied.
Pension and Other Postretirement Benefits (OPEB) Plan Assets
The market-related value of plan assets held for the qualified pension and OPEB plans is equal to the fair value of those assets as of year-end. Fair value is determined using quoted market prices and independent pricing services based upon the type of asset class as reported by the fund managers at the measurement dates for all plan assets. See Note 10. Pension, OPEB and Savings Plans for further discussion.
Basis Adjustment
Power and PSE&G have recorded a Basis Adjustment in their respective Consolidated Balance Sheets related to the generation assets that were transferred from PSE&G to Power in August 2000 at the price specified by the BPU. Because the transfer was between affiliates, the transaction was recorded at the net book value of the assets and liabilities rather than the transfer price. The difference between the total transfer price and the net book value of the generation-related assets and liabilities, $986 million, net of tax, was recorded as a Basis Adjustment on Power’s and PSE&G’s Consolidated Balance Sheets. The $986 million is a reduction of Power’s Member’s Equity and an addition to PSE&G’s Common Stockholder’s Equity. These amounts are eliminated on PSEG’s consolidated financial statements.
Stock Split
On January 15, 2008, PSEG’s Board of Directors approved a two-for-one stock split of PSEG’s outstanding shares of common stock. The stock split entitled each stockholder of record at the close of business on January 25, 2008 to receive one additional share for every outstanding share of common stock held. The additional shares resulting from the stock split were distributed on February 4, 2008. All share and per share amounts in the consolidated results of operations and financial position, as well as in the notes to the financial statements, retroactively reflect the effect of the stock split.
Use of Estimates
The process of preparing financial statements in conformity with GAAP requires the use of estimates and assumptions regarding certain types of assets, liabilities, revenues and expenses. Such estimates primarily relate to unsettled transactions and events as of the date of the financial statements. Accordingly, upon settlement, actual results may materially differ from estimated amounts.
Reclassifications
Certain reclassifications have been made to the prior period financial statements to conform to the 2008 presentation.
102
NOTES TO CONSOLIDATED FINANCIAL STATEMENTS
In accordance with a new policy established in the first quarter of 2008 resulting from the adoption of a new accounting standard, Power adjusted its Consolidated Balance Sheet as of December 31, 2007 to net the fair value of cash collateral receivables and payables with the corresponding net derivative balances. See Note 2. Recent Accounting Standards for additional information.
Operating results for Bioenergie S.p.A. (Bioenergie) were reclassified to Income (Loss) from Discontinued Operations in the Consolidated Statements of Operations of PSEG for the years ended December 31, 2007 and 2006. See Note 3. Discontinued Operations, Dispositions and Impairments.
In addition, Energy Holdings has significantly reduced its interests in equity method investments during the past three years. Since these equity method investments are no longer an integral part of the business, PSEG has reclassified Income from Equity Method Investments, as well as any impairments or gain/losses on the sale of equity method investments which were previously reflected in Operating Revenues and Operating Expenses, to below Operating Income in the Consolidated Statements of Operations of PSEG for the years ended December 31, 2007 and 2006. Equity income (loss) amounts reclassified in the years 2007 and 2006 totaled $252 million and $(157) million, respectively.
Note 2. Recent Accounting Standards
The following is a summary of new accounting guidance adopted in 2008 and guidance issued but not yet adopted that could impact our businesses. We do not anticipate that any of the guidance to be adopted in 2009 will have a material impact on our financial statements.
Accounting standards adopted in 2008
Statement of Financial Accounting Standards (SFAS) No. 157, “Fair Value Measurements” (SFAS 157)
|
• | | | | provides a single definition of fair value emphasizing that it is a market-based measurement, not an entity-specific measurement |
|
• | | | | establishes a framework for measuring fair value |
|
• | | | | expands disclosures about fair value measurements |
SFAS 157 provides a fair value hierarchy that distinguishes between assumptions based on market data obtained from independent sources (observable inputs) and those based on an entity’s own assumptions (unobservable inputs).
Effective January 1, 2008, we adopted SFAS 157, except for certain non-financial assets and liabilities, as stipulated in the FASB Staff Position (FSP) FAS 157-2. We recorded a cumulative effect adjustment of $21 million (after-tax) to January 1, 2008 Retained Earnings at Energy Holdings associated with the implementation of SFAS 157.
For additional information, see Note 15. Fair Value Measurements.
SFAS No. 159, “The Fair Value Option for Financial Assets and Financial Liabilities” (SFAS 159)
|
• | | | | permits entities to measure many financial instruments and certain other items at fair value that would not otherwise be required to be measured at fair value |
We adopted SFAS 159 effective January 1, 2008; however, to date, we have not elected to measure any of our assets or liabilities at fair value under this standard.
103
NOTES TO CONSOLIDATED FINANCIAL STATEMENTS
FSP FIN 39-1, “Amendment of FASB Interpretation No. 39” (FSP FIN 39-1)
| | | amends FIN 39, “Offsetting of Amounts Related to Certain Contracts,” to permit an entity to offset cash collateral paid or received against fair value amounts recognized for derivative instruments held with the same counterparty under the same master netting arrangement. | We adopted this FSP effective January 1, 2008, establishing a policy of netting fair value cash collateral receivables and payables with the corresponding net derivative balances. Accordingly, we included net cash collateral received of $112 million and net cash collateral paid of $86 million in the net derivative positions as of December 31, 2008 and December 31, 2007, respectively.
FSP FAS 140-4 and FIN 46(R)-8, “Disclosures by Public Entities (Enterprises) about Transfers of Financial Assets and Interests in Variable Interest Entities” (FSP FAS 140-4 and FIN 46(R)-8)
| | | requires additional disclosures about an entity’s involvement with variable interest entities and transfers of financial assets | We adopted this FSP effective for our year-end 2008 reporting and include the disclosures suggested in Note 1. Organization and Summary of Significant Accounting Policies.
Accounting standards to be adopted effective January 1, 2009
SFAS No. 141 (revised 2007), “Business Combinations” (SFAS 141(R))
| | | changes financial accounting and reporting of business combination transactions | |
• | | | | requires all assets acquired and liabilities assumed in a business combination to be measured at their acquisition date fair value, with limited exceptions |
|
• | | | | requires acquisition-related costs and certain restructuring costs to be recognized separately from the business combination |
|
• | | | | applies to all transactions and events in which an entity obtains control of one or more businesses of an acquiree |
SFAS No. 160, “Noncontrolling Interests in Consolidated Financial Statements—an amendment of Accounting Research Bulletin (ARB) No. 51” (SFAS 160)
|
• | | | | changes the financial reporting relationship between a parent and non-controlling interests (i.e. minority interests) |
|
• | | | | requires all entities to report minority interests in subsidiaries as a separate component of equity in the consolidated financial statements |
|
• | | | | requires net income attributable to the noncontrolling interest to be shown on the face of the income statement in addition to net income attributable to the controlling interest |
|
• | | | | applies prospectively, except for presentation and disclosure requirements, which are applied retrospectively. |
SFAS No. 161, “Disclosures about Derivative Instruments and Hedging Activities—an amendment of FASB Statement No. 133” (SFAS 161)
|
• | | | | requires an entity to disclose an understanding of: |
| | | how and why it uses derivatives; | |
¡ | | | | how derivatives and related hedged items are accounted for, and |
|
¡ | | | | the overall impact of derivatives on an entity’s financial statements. |
104
NOTES TO CONSOLIDATED FINANCIAL STATEMENTS
Accounting standard to be adopted for 2009 year-end reporting
FSP FAS 132(R)-1, “Employers’ Disclosures about Pensions and Other Postretirement Benefits” (FSP FAS 132(R)-1)
|
• | | | | requires additional disclosures about the fair value of plan assets of a defined benefit or other postretirement plan, including: |
| | | how investment allocation decisions are made by management; | |
¡ | | | | major categories of plan assets; |
|
¡ | | | | significant concentrations of risk within plan assets; and |
|
¡ | | | | inputs and valuation techniques used to measure the fair value of plan assets and effect of fair value measurements using significant unobservable inputs on changes in plan assets for the period. |
Note 3. Discontinued Operations, Dispositions and Impairments
Discontinued Operations
Power
In May 2007, Power completed the sale of Lawrenceburg Energy Center (Lawrenceburg), a 1,096-megawatt (MW), gas-fired combined cycle electric generating plant located in Lawrenceburg, Indiana, to AEP Generating Company. The sale price was $325 million. The transaction resulted in an after-tax loss to Power’s earnings of $208 million and was reflected as a charge to Discontinued Operations in the fourth quarter of 2006.
Lawrenceburg’s operating results for the years ended December 31, 2007 and 2006, which were reclassified to Discontinued Operations, are summarized below:
| | | | |
| | Years Ended December 31, |
| | 2007 | | 2006 |
| | Millions |
Operating Revenues | | | $ | | — | | | | $ | | 41 | |
Loss Before Income Taxes | | | $ | | (13 | ) | | | | $ | | (53 | ) | |
Net Loss | | | $ | | (8 | ) | | | | $ | | (31 | ) | |
Energy Holdings
Bioenergie
In November 2008, Energy Holdings sold its 85% ownership interest in Bioenergie for $40 million. Bioenergie owns three biomass generation plants in Italy. The sale resulted in an after-tax loss of $15 million recorded in 2008 in Discontinued Operations. Net cash proceeds, after realization of tax benefits, were approximately $70 million.
105
NOTES TO CONSOLIDATED FINANCIAL STATEMENTS
Bioenergie’s operating results for the years ended December 31, 2008, 2007 and 2006, which were reclassified to Discontinued Operations, are summarized below:
| | | | | | |
| | Years Ended December 31, |
| | 2008 | | 2007 | | 2006 |
| | Millions |
Operating Revenues | | | $ | | 40 | | | | $ | | 22 | | | | $ | | 24 | |
Income (Loss) Before Income Taxes | | | $ | | 5 | | | | $ | | (10 | ) | | | | $ | | 8 | |
Net Income (Loss) | | | $ | | 3 | | | | $ | | (6 | ) | | | | $ | | 6 | |
The carrying amounts of Bioenergie’s assets as of December 31, 2007 are summarized in the following table:
| | |
| | December 31,
2007 |
| | Millions |
Current Assets | | | $ | | 23 | |
Noncurrent Assets | | | | 138 | |
| | |
Total Assets of Discontinued Operations | | | $ | | 161 | |
| | |
| | |
Current Liabilities | | | $ | | 21 | |
Noncurrent Liabilities | | | | 55 | |
| | |
Total Liabilities of Discontinued Operations | | | $ | | 76 | |
| | |
SAESA Group
In July 2008, Energy Holdings sold its investment in the SAESA Group, which consists of four distribution companies, one transmission company and a generation facility located in Chile for a total purchase price of $1.3 billion, including the assumption of $413 million of the consolidated debt of the group. The sale resulted in an after-tax gain of $187 million, which is included in Discontinued Operations. Net cash proceeds, after Chilean and U.S. taxes of $269 million, were $612 million. A tax charge of $82 million was recognized in the fourth quarter of 2007 relating to the discontinuation of applying Accounting Principles Board No. 23, “Accounting for Income Taxes—Special Areas” (APB 23).
SAESA Group’s operating results for the years ended December 31, 2008, 2007 and 2006, which were reclassified to Discontinued Operations, are summarized below:
| | | | | | |
| | Years Ended December 31, |
| | 2008 | | 2007 | | 2006 |
| | Millions |
Operating Revenues | | | $ | | 379 | | | | $ | | 442 | | | | $ | | 341 | |
Income Before Income Taxes | | | $ | | 36 | | | | $ | | 55 | | | | $ | | 46 | |
Net Income (Loss) | | | $ | | 30 | | | | $ | | (34 | ) | | | | $ | | 57 | |
106
NOTES TO CONSOLIDATED FINANCIAL STATEMENTS
The carrying amounts of SAESA Group’s assets as of December 31, 2007 are summarized in the following table:
| | |
| | December 31,
2007 |
| | Millions |
Current Assets | | | $ | | 191 | |
Noncurrent Assets | | | | 971 | |
| | |
Total Assets of Discontinued Operations | | | $ | | 1,162 | |
| | |
Current Liabilities | | | $ | | 130 | |
Noncurrent Liabilities | | | | 390 | |
| | |
Total Liabilities of Discontinued Operations | | | $ | | 520 | |
| | |
Electroandes S.A. (Electroandes)
In October 2007, Energy Holdings sold its investment in Electroandes, a hydro-electric generation and transmission company in Peru, for a total purchase price of $390 million, including the assumption of approximately $108 million of debt. Net proceeds, after tax of $72 million and including dividends received prior to closing, were $220 million. Energy Holdings recorded an after-tax gain of $48 million recorded in the fourth quarter of 2007.
Energy Holdings recorded a $19 million income tax expense in the second quarter of 2007 related to the discontinuation of applying APB 23, as the income generated by Electroandes was no longer expected to be indefinitely reinvested.
Electroandes’ operating results for the years ended December 31, 2007 and 2006, which were reclassified to Discontinued Operations, are summarized below:
| | | | |
| | Years Ended
December 31, |
| | 2007 | | 2006 |
| | Millions |
Operating Revenues | | | $ | | 41 | | | | $ | | 61 | |
Income Before Income Taxes | | | $ | | 15 | | | | $ | | 22 | |
Net Income | | | $ | | 10 | | | | $ | | 16 | |
Elektrocieplownia Chorzow Sp. Z o.o. (Elcho)/Elektrownia Skawina SA (Skawina)
In May 2006, Energy Holdings completed the sale of its interest in two coal-fired plants in Poland, Elcho and Skawina. Proceeds, net of transaction costs, were $476 million, resulting in a gain of $227 million, net of tax expense of $142 million. This gain is included in Discontinued Operations.
Elcho’s and Skawina’s operating results for the year ended December 31, 2006 are summarized below:
| | | | |
| | Year Ended
December 31, 2006 |
| | Elcho | | Skawina |
| | Millions |
Operating Revenues | | | $ | | 39 | | | | $ | | 44 | |
Income (Loss) Before Income Taxes | | | $ | | (3 | ) | | | | $ | | 2 | |
Net Income (Loss) | | | $ | | (2 | ) | | | | $ | | 1 | |
107
NOTES TO CONSOLIDATED FINANCIAL STATEMENTS
Dispositions
Power
In December 2006, Power recorded a pre-tax impairment loss of $44 million to write down four turbines to their estimated realizable value. In April 2007, Power sold the four turbines to a third party and received proceeds of $40 million, which approximated the recorded book value.
Energy Holdings
Chilquinta Energia S.A. (Chilquinta) and Luz del Sur S.A.A. (LDS)
In December 2007, Energy Holdings closed on the sales of its 50% ownership interest in the Chilean electric distributor, Chilquinta and its affiliates and its 38% ownership interest in the Peruvian electric distributor, LDS and its affiliates, for $685 million. Net cash proceeds after taxes were approximately $480 million, which resulted in an after-tax loss of $23 million.
Rio Grande Energia S. A. (RGE)
In June 2006, Energy Holdings closed on the sale of its 32% ownership interest in RGE, a Brazilian electric distribution company, to Companhia Paulista de Force Luz for $185 million. The transaction resulted in an after-tax write-down of $178 million, primarily related to the devaluation of the Brazilian Real subsequent to Energy Holdings’ acquisition of its interests in RGE in 1997.
Dhofar Power Company S.A.O.C. (Dhofar Power)
In November 2006, Energy Holdings sold its remaining 46% interest in Dhofar Power to Oman Technical Partners Ltd. and received net proceeds after-tax of $31 million, the approximate book value of the investment.
Impairments
Energy Holdings
Based on its periodic review of the operation, political and the economic circumstances in Venezuela, Energy Holdings recorded after-tax impairment charges to its investments in Venezuela of $7 million, $7 million and $4 million for years ended December 31, 2008, 2007 and 2006, respectively.
Energy Holdings also recorded after-tax impairment losses of $9 million and $2 million for the years ended December 31, 2008 and 2007 related to its investment in India based on its estimated market valuation of the project.
As of December 31, 2008 Energy Holdings’ remaining international investments totaled $24 million, after the impairments.
108
NOTES TO CONSOLIDATED FINANCIAL STATEMENTS
Note 4. Property, Plant and Equipment and Jointly-Owned Facilities
Information related to Property, Plant and Equipment as of December 31, 2008 and 2007 is detailed below:
| | | | | | | | |
| | Power | | PSE&G | | Other | | PSEG
Consolidated |
| | Millions |
2008 | | | | | | | | |
Generation: | | | | | | | | |
Fossil Production | | | $ | | 5,056 | | | | $ | | — | | | | $ | | 625 | | | | $ | | 5,681 | |
Nuclear Production | | | | 988 | | | | | — | | | | | — | | | | | 988 | |
Nuclear Fuel in Service | | | | 549 | | | | | — | | | | | — | | | | | 549 | |
Construction Work in Progress | | | | 779 | | | | | — | | | | | — | | | | | 779 | |
| | | | | | | | |
Total Generation | | | | 7,372 | | | | | — | | | | | 625 | | | | | 7,997 | |
| | | | | | | | |
Transmission and Distribution: | | | | | | | | |
Electric Transmission | | | | — | | | | | 1,655 | | | | | — | | | | | 1,655 | |
Electric Distribution | | | | — | | | | | 5,567 | | | | | — | | | | | 5,567 | |
Gas Transmission | | | | — | | | | | 88 | | | | | — | | | | | 88 | |
Gas Distribution | | | | — | | | | | 4,228 | | | | | — | | | | | 4,228 | |
Construction Work in Progress | | | | — | | | | | 176 | | | | | — | | | | | 176 | |
Plant Held for Future Use | | | | — | | | | | 9 | | | | | — | | | | | 9 | |
Other | | | | — | | | | | 471 | | | | | — | | | | | 471 | |
| | | | | | | | |
Total Transmission and Distribution | | | | — | | | | | 12,194 | | | | | — | | | | | 12,194 | |
| | | | | | | | |
Other | | | | 69 | | | | | 64 | | | | | 494 | | | | | 627 | |
| | | | | | | | |
Total | | | $ | | 7,441 | | | | $ | | 12,258 | | | | $ | | 1,119 | | | | $ | | 20,818 | |
| | | | | | | | |
| | | | | | | | |
| | Power | | PSE&G | | Other | | PSEG
Consolidated |
| | Millions |
2007 | | | | | | | | |
Generation: | | | | | | | | |
Fossil Production | | | $ | | 4,463 | | | | $ | | — | | | | $ | | 620 | | | | $ | | 5,083 | |
Nuclear Production | | | | 724 | | | | | — | | | | | — | | | | | 724 | |
Nuclear Fuel in Service | | | | 550 | | | | | — | | | | | — | | | | | 550 | |
Construction Work in Progress | | | | 767 | | | | | — | | | | | — | | | | | 767 | |
| | | | | | | | |
Total Generation | | | | 6,504 | | | | | — | | | | | 620 | | | | | 7,124 | |
| | | | | | | | |
Transmission and Distribution: | | | | | | | | |
Electric Transmission | | | | — | | | | | 1,562 | | | | | — | | | | | 1,562 | |
Electric Distribution | | | | — | | | | | 5,295 | | | | | — | | | | | 5,295 | |
Gas Transmission | | | | — | | | | | 88 | | | | | — | | | | | 88 | |
Gas Distribution | | | | — | | | | | 4,033 | | | | | — | | | | | 4,033 | |
Construction Work in Progress | | | | — | | | | | 54 | | | | | — | | | | | 54 | |
Plant Held for Future Use | | | | — | | | | | 8 | | | | | — | | | | | 8 | |
Other | | | | — | | | | | 430 | | | | | — | | | | | 430 | |
| | | | | | | | |
Total Transmission and Distribution | | | | — | | | | | 11,470 | | | | | — | | | | | 11,470 | |
| | | | | | | | |
Other | | | | 61 | | | | | 61 | | | | | 474 | | | | | 596 | |
| | | | | | | | |
Total | | | $ | | 6,565 | | | | $ | | 11,531 | | | | $ | | 1,094 | | | | $ | | 19,190 | |
| | | | | | | | |
109
NOTES TO CONSOLIDATED FINANCIAL STATEMENTS
Power and PSE&G have ownership interests in and are responsible for providing their respective shares of the necessary financing for the following jointly-owned facilities. All amounts reflect the share of Power’s and PSE&G’s jointly-owned projects and the corresponding direct expenses are included in the Consolidated Statements of Operations as operating expenses.
| | | | | | |
December 31, 2008 | | Ownership
Interest | | Plant | | Accumulated
Depreciation |
| | Millions |
Power: | | | | | | |
Coal Generating | | | | | | |
Conemaugh | | | | 22.50 | % | | | | $ | | 228 | | | | $ | | 113 | |
Keystone | | | | 22.84 | % | | | | $ | | 306 | | | | $ | | 90 | |
Nuclear Generating | | | | | | |
Peach Bottom | | | | 50.00 | % | | | | $ | | 261 | | | | $ | | 128 | |
Salem | | | | 57.41 | % | | | | $ | | 732 | | | | $ | | 202 | |
Nuclear Support Facilities | | | | Various | | | | $ | | 132 | | | | $ | | 24 | |
Pumped Storage Facilities | | | | | | |
Yards Creek | | | | 50.00 | % | | | | $ | | 29 | | | | $ | | 22 | |
Merrill Creek Reservoir | | | | 13.91 | % | | | | $ | | 1 | | | | $ | | — | |
| | | | | | |
PSE&G: | | | | | | |
Transmission Facilities | | | | Various | | | | $ | | 142 | | | | $ | | 58 | |
Linden SNG Plant | | | | 90.00 | % | | | | $ | | 5 | | | | $ | | 6 | |
| | | | | | |
December 31, 2007 | | Ownership
Interest | | Plant | | Accumulated
Depreciation |
| | Millions |
Power: | | | | | | |
Coal Generating | | | | | | |
Conemaugh | | | | 22.50 | % | | | | $ | | 218 | | | | $ | | 109 | |
Keystone | | | | 22.84 | % | | | | $ | | 216 | | | | $ | | 87 | |
Nuclear Generating | | | | | | |
Peach Bottom | | | | 50.00 | % | | | | $ | | 234 | | | | $ | | 125 | |
Salem | | | | 57.41 | % | | | | $ | | 612 | | | | $ | | 191 | |
Nuclear Support Facilities | | | | Various | | | | $ | | 127 | | | | $ | | 20 | |
Pumped Storage Facilities | | | | | | |
Yards Creek | | | | 50.00 | % | | | | $ | | 29 | | | | $ | | 22 | |
Merrill Creek Reservoir | | | | 13.91 | % | | | | $ | | 1 | | | | $ | | — | |
| | | | | | |
PSE&G: | | | | | | |
Transmission Facilities | | | | Various | | | | $ | | 117 | | | | $ | | 56 | |
Linden SNG Plant | | | | 90.00 | % | | | | $ | | 5 | | | | $ | | 6 | |
110
NOTES TO CONSOLIDATED FINANCIAL STATEMENTS
Power holds undivided ownership interests in the jointly-owned facilities above, excluding related nuclear fuel and inventories. Power is entitled to shares of the generating capability and output of each unit equal to its respective ownership interests. Power also pays its ownership share of additional construction costs, fuel inventory purchases and operating expenses. Power’s share of expenses for the jointly-owned facilities is included in the appropriate expense category.
Power co-owns Salem and Peach Bottom with Exelon Generation. Power is the operator of Salem and Exelon Generation is the operator of Peach Bottom. A committee appointed by the co-owners reviews/approves major planning, financing and budgetary (capital and operating) decisions.
Reliant Energy, Inc. is a co-owner and the operator for Keystone Generating Station and Conemaugh Generating Station. A committee appointed by all co-owners makes all planning, financing and budgetary (capital and operating) decisions.
Power is a co-owner in the Yards Creek Pumped Storage Generation Facility. First Energy Corporation is also a co-owner and the operator of this facility. First Energy submits separate capital and Operations and Maintenance budgets, subject to the approval of Power.
Power is a minority owner in the Merrill Creek Reservoir and Environmental Preserve in Warren County, New Jersey. Merrill Creek Reservoir is the owner-operator of this facility. The operator submits separate capital and Operations and Maintenance budgets, subject to the approval of the non- operating owners.
All owners receive revenues, Operations and Maintenance and capital allocations based on their ownership percentages. Each owner is responsible for any financing with respect to its pro rata share of capital expenditures.
Note 5. Regulatory Assets and Liabilities
As discussed in Note 1, PSE&G prepares its financial statements in accordance with the provisions of SFAS 71. A regulated utility is required to defer the recognition of costs (a regulatory asset) or the recognition of obligations (a regulatory liability) if it is probable that, through the rate-making process, there will be a corresponding increase or decrease in future rates. Accordingly, PSE&G has deferred certain costs, which will be amortized over various future periods. These costs are deferred based on rate orders issued by the BPU or the FERC or PSE&G’s experience with prior rate cases. All of PSE&G’s regulatory assets and liabilities at December 31, 2008 and 2007 are supported by written rate orders, either explicitly or implicitly through the BPU’s treatment of various cost items.
Regulatory assets are subject to prudence reviews and can be disallowed in the future by regulatory authorities. PSE&G believes that all of its regulatory assets are probable of recovery. To the extent that collection of any regulatory assets or payments of regulatory liabilities is no longer probable, the amounts would be charged or credited to income.
111
NOTES TO CONSOLIDATED FINANCIAL STATEMENTS
PSE&G had the following regulatory assets and liabilities:
| | | | | | |
| | As of December 31, | | Recovery/Refund Period |
| | 2008 | | 2007 |
| | Millions | | |
Regulatory Assets | | | | | | |
Stranded Costs To Be Recovered | | | $ | | 2,479 | | | | $ | | 2,772 | | | Through December 2015 (1) (2) |
Manufactured Gas Plant (MGP) Remediation Costs | | | | 709 | | | | | 639 | | | Various (2) |
Pension and Other Postretirement | | | | 988 | | | | | 468 | | | Various |
Deferred Income Taxes | | | | 421 | | | | | 420 | | | Various |
Societal Benefits Charges (SBC) | | | | 209 | | | | | 151 | | | Various (2) |
New Jersey Clean Energy Program | | | | 674 | | | | | 149 | | | To be determined (2) |
Gas Contract Mark-to-Market (MTM) | | | | 384 | | | | | 105 | | | Various (1) |
Other Postretirement Benefits (OPEB) Costs | | | | 77 | | | | | 96 | | | Through December 2012 (2) |
Unamortized Loss on Reacquired Debt and Debt Expense | | | | 112 | | | | | 80 | | | Over remaining debt life (1) |
Conditional Asset Retirement Obligation | | | | 92 | | | | | 80 | | | Various |
Repair Allowance Taxes | | | | 45 | | | | | 54 | | | Through August 2013 (1) (2) |
Uncertain Tax Positions | | | | 39 | | | | | 38 | | | Various |
Regulatory Restructuring Costs | | | | 23 | | | | | 27 | | | Through August 2013 (1) (2) |
Gas Margin Adjustment Clause | | | | 34 | | | | | 25 | | | To be determined (2) |
Customer Accounting System | | | | 14 | | | | | — | | | To be determined |
Plant and Regulatory Study Costs | | | | 13 | | | | | 15 | | | Through December 2021v(2) |
Incurred But Not Reported Claim Reserve | | | | 12 | | | | | 14 | | | Various |
Asbestos Abatement | | | | 8 | | | | | 9 | | | Through 2020 (2) |
Non-Utility Generation Charge (NGC) | | | | — | | | | | 9 | | | Through July 2008 (2) |
Other | | | | 19 | | | | | 14 | | | Various |
| | | | | | |
Total Regulatory Assets | | | $ | | 6,352 | | | | $ | | 5,165 | | | |
| | | | | | |
| | | | | | |
| | As of December 31, | | Recovery/Refund Period |
| | 2008 | | 2007 |
| | Millions | | |
Regulatory Liabilities | | | | | | |
Cost of Removal | | | $ | | 269 | | | | $ | | 274 | | | Various |
Overrecovered Gas Costs | | | | 7 | | | | | 54 | | | Through October 2008 (1) (2) |
Excess Cost of Removal | | | | 38 | | | | | 51 | | | Through November 2011 (1) (2) |
Overrecovered Electric Costs | | | | 14 | | | | | 28 | | | To be determined (1) (2) |
NGC | | | | 9 | | | | | — | | | Through July 2009 (2) |
Other | | | | 18 | | | | | 12 | | | Various (1) |
| | | | | | |
Total Regulatory Liabilities | | | $ | | 355 | | | | $ | | 419 | | | |
| | | | | | |
|
(1) | | | | Recovered/Refunded with interest |
112
NOTES TO CONSOLIDATED FINANCIAL STATEMENTS
|
(2) | | | | Recoverable/Refundable per specific rate order |
All regulatory assets and liabilities are excluded from PSE&G’s rate base unless otherwise noted. The regulatory assets and liabilities in the table above are defined as follows:
| | | Stranded Costs To Be Recovered:This reflects deferred costs, which are being recovered through the securitization transition charges authorized by the BPU in irrevocable financing orders and being collected by PSE&G, as servicer on behalf of Transition Funding and Transition Funding II, respectively. Funds collected are remitted to Transition Funding and Transition Funding II and are used for interest and principal payments on the transition bonds and related costs and taxes. | |
| | | | Transition Funding and Transition Funding II are wholly owned, bankruptcy-remote subsidiaries of PSE&G that purchased certain transition property from PSE&G and issued transition bonds secured by such property. The transition property consists principally of the rights to receive electricity consumption-based per kilowatt-hour (kWh) charges from PSE&G electric distribution customers, which represent irrevocable rights to receive amounts sufficient to recover certain of PSE&G’s transition costs related to deregulation, as approved by the BPU. |
|
• | | | | Manufactured Gas Plant (MGP) Remediation Costs:Represents the low end of the range for the remaining environmental investigation and remediation program costs that are probable of recovery in future rates. Once these costs are incurred, they are recovered through the Remediation Adjustment Charge clause in the SBC. |
|
• | | | | Pension and Other Postretirement:Pursuant to the adoption of SFAS No. 158, “Employers’ Accounting for Defined Benefit Pension and Other Postretirement Plans” (SFAS 158), PSE&G recorded the unrecognized costs for defined benefit pension and other OPEB plans on the balance sheet as a Regulatory Asset. These costs represent actuarial gains or losses, prior service costs and transition obligations as a result of adoption, which have not been expensed. These costs will be amortized and recovered in future rates. |
|
• | | | | Deferred Income Taxes:This amount represents the portion of deferred income taxes that will be recovered through future rates, based upon established regulatory practices, which permit the recovery of current taxes. Accordingly, this Regulatory Asset is offset by a deferred tax liability and is expected to be recovered, without interest, over the period the underlying book-tax timing differences reverse and become current taxes. |
|
• | | | | Societal Benefits Charges (SBC):The SBC, as authorized by the BPU and the New Jersey Electric Discount and Energy Competition Act (Competition Act), includes costs related to PSE&G’s electric and gas business as follows: 1) the Universal Service Fund; 2) Energy Efficiency and Renewable Energy Programs. 3) Social Programs (electric only) which include electric bad debt expense; and 4) the Remediation Adjustment Clause for incurred MGP remediation expenditures. All components accrue interest on both over and underrecoveries. |
|
• | | | | New Jersey Clean Energy Program:The BPU approved future funding requirements for Energy Efficiency and Renewable Energy Programs for the period 2009-2012. |
|
• | | | | Gas Contract Mark-to-Market (MTM):The fair value of gas hedge contracts and gas cogeneration supply contracts. This asset is offset by a derivative liability and an intercompany payable in the Consolidated Balance Sheets. |
|
• | | | | OPEB Costs:Includes costs associated with the adoption of SFAS No. 106, “Employers’ Accounting for Benefits Other Than Pensions,” which were deferred in accordance with EITF Issue No. 92-12, “Accounting for OPEB Costs by Rate Regulated Enterprises.” |
|
• | | | | Unamortized Loss on Reacquired Debt and Debt Expense:Represents losses on reacquired long-term debt, which are recovered through rates over the remaining life of the debt. |
113
NOTES TO CONSOLIDATED FINANCIAL STATEMENTS
|
• | | | | Conditional Asset Retirement Obligation:These costs represent the differences between rate regulated cost of removal accounting and asset retirement accounting under GAAP. These costs will be recovered in future rates. |
|
• | | | | Repair Allowance Taxes:This represents tax, interest and carrying charges relating to disallowed tax deductions for repair allowance as authorized by the BPU with recovery over 10 years effective August 1, 2003. |
|
• | | | | Uncertain Tax Positions:The amount recorded for uncertain tax positions under FIN 48, which would have been expensed or charged to Retained Earnings upon adoption but will be recoverable in future rates. |
|
• | | | | Regulatory Restructuring Costs:These are costs related to the restructuring of the energy industry in New Jersey through the Competition Act and include such items as the system design work necessary to transition PSE&G to a transmission and distribution only company, as well as costs incurred to transfer and establish the generation function as a separate corporate entity with recovery over 10 years beginning August 1, 2003. |
|
• | | | | Gas Margin Adjustment Clause:PSE&G defers the margin differential received from Transportation Gas Service Non-Firm Customers versus bill credits provided to Basic Gas Supply Service (BGSS)-Firm customers. |
|
• | | | | Customer Accounting System:These are deferred costs associated with the replacement of the PSE&G’s legacy customer accounting system which is scheduled to go into service early in 2009. Recovery will be requested in the 2009 base rate case. |
|
• | | | | Plant and Regulatory Study Costs:These are costs incurred by PSE&G and required by the BPU which are related to current and future operations, including safety, planning, management and construction. |
|
• | | | | Incurred But Not Reported Claim Reserve:Represents reserves for worker’s compensation and injuries and damages that exceed the amounts recognized in rates on a settlement accounting basis. |
|
• | | | | Asbestos Abatement:Represents costs incurred to remove and dispose of asbestos insulation at PSE&G’s then-owned fossil generating stations. Per a December 1992 BPU order, these costs are treated as Cost of Removal for ratemaking purposes. |
|
• | | | | NGC:Represents the difference between the cost of non-utility generation and the amounts realized from selling that energy at market rates through PJM. The BPU instructed PSE&G to transfer the remaining $150 million debit balance for the Market Transition Charge (MTC) from the SBC to the NGC in March 2007. |
|
• | | | | Other Regulatory Assets:This includes the following: 1) Energy information control network program costs; 2) Transition Funding’s interest rate swap (offset by a derivative liability); and 3) an offset to a liability for future demand side management standard offer spending. |
|
• | | | | Cost of Removal:PSE&G accrues and collects for cost of removal in rates. Pursuant to the adoption of SFAS 143, “Accounting for Asset Retirement Obligations,” the liability for non-legally required cost of removal was reclassified as a regulatory liability. This liability is reduced as removal costs are incurred. Accumulated cost of removal is a reduction to the rate base. |
|
• | | | | Overrecovered Gas Costs:These costs represent the overrecovered amounts associated with BGSS, as approved by the BPU. |
|
• | | | | Excess Cost of Removal:The BPU directed PSE&G to refund $66 million of excess gas cost of removal accruals over a five year period ending November 2011. |
114
NOTES TO CONSOLIDATED FINANCIAL STATEMENTS
|
• | | | | Overrecovered Electric Energy Costs:These costs represent the overrecovered amounts associated with Basic Generation Service (BGS), as approved by the BPU. |
|
• | | | | Other Regulatory Liabilities:This includes the following: 1) a retail adder included in the BGS charges; 2) amounts collected from customers in order for Transition Funding to obtain a AAA rating on its transition bonds; 3) third party billing discounts related to the Competition Act; and 4) the system control charge program deferrals. |
Note 6. Long-Term Investments
Long-Term Investments as of December 31, 2008 and 2007 included the following:
| | | | |
| | As of December 31, |
| | 2008 | | 2007 |
| | Millions |
Power | | | | |
Partnerships and Corporate Joint Ventures | | | $ | | 23 | | | | $ | | 14 | |
Other Investments | | | | 12 | | | | | 1 | |
| | | | |
PSE&G | | | | |
Life Insurance and Supplemental Benefits (PSE&G) | | | $ | | 151 | | | | $ | | 146 | |
Other Investments | | | | 7 | | | | | 7 | |
| | | | |
Energy Holdings | | | | |
Leveraged Leases | | | $ | | 2,279 | | | | $ | | 2,826 | |
Partnerships and Corporate Joint Ventures | | | | 202 | | | | | 223 | |
Other Investments | | | | 21 | | | | | 4 | |
| | | | |
Total Long-Term Investments | | | $ | | 2,695 | | | | $ | | 3,221 | |
| | | | |
Leveraged Leases
The net investment in leveraged leases was comprised of the following:
| | | | |
| | As of December 31, |
| | 2008 | | 2007 |
| | Millions |
Lease rents receivable (net of non-recourse debt) | | | $ | | 2,749 | | | | $ | | 2,890 | |
Estimated residual value of leased assets | | | | 971 | | | | | 1,010 | |
| | | | |
| | | | 3,720 | | | | | 3,900 | |
Unearned and deferred income | | | | (1,441 | ) | | | | | (1,074 | ) | |
| | | | |
Total investments in leveraged leases | | | | 2,279 | | | | | 2,826 | |
Deferred tax liabilities | | | | (1,994 | ) | | | | | (2,045 | ) | |
| | | | |
Net investment in leveraged leases | | | $ | | 285 | | | | $ | | 781 | |
| | | | |
115
NOTES TO CONSOLIDATED FINANCIAL STATEMENTS
The pre-tax income and income tax effects related to investments in leveraged leases were as follows:
| | | | | | |
| | Years Ended December 31, |
| | 2008 | | 2007 | | 2006 |
| | Millions |
Pre-tax income of leveraged leases | | | $ | | (408 | ) | | | | $ | | 114 | | | | $ | | 134 | |
Income tax effect on pre-tax income of leveraged leases | | | $ | | 98 | | | | $ | | 36 | | | | $ | | 41 | |
Amortization of investment tax credits of leveraged leases | | | $ | | — | | | | $ | | (1 | ) | | | | $ | | (1 | ) | |
Investments in and Advances to Affiliates
Investments in net assets of affiliated companies accounted for under the equity method of accounting by Energy Holdings amounted to $180 million and $208 million as of December 31, 2008 and 2007, respectively. The decrease of $28 million between the December 31, 2008 and 2007 equity investment balances was primarily due to the impairment of our equity investment in Turboven and the sale of our equity investment in Biomasse as part of the sale of Bioenergie in 2008. During the three years ended December 31, 2008, 2007 and 2006, the amount of dividends from these investments was $25 million, $108 million and $74 million, respectively. Energy Holdings’ share of income and cash flow distribution percentages ranged from 40% to 60% as of December 31, 2008.
Power and Energy Holdings had the following equity method investments as of December 31, 2008:
| | | | |
Name | | Location | | %
Owned |
Power | | | | |
Keystone | | PA | | | | 23 | % | |
Conemaugh | | PA | | | | 23 | % | |
| | | | |
Energy Holdings | | | | |
Kalaeloa | | HI | | | | 50 | % | |
GWF | | CA | | | | 50 | % | |
Hanford L. P. | | CA | | | | 50 | % | |
GWF Energy | | CA | | | | 60 | % | |
Bridgewater | | NH | | | | 40 | % | |
Turboven | | Venezuela | | | | 50 | % | |
Energy Holdings also has investments in certain companies in which it does not have the ability to exercise significant influence. Such investments are accounted for under the cost method. As of December 31, 2008 and 2007, the carrying value of these investments aggregated $16 million and $31 million, respectively. Energy Holdings periodically reviews these cost method investments for impairment and adjust the values accordingly.
Note 7. Nuclear Decommissioning and Insurance
NDT Funds
In accordance with NRC regulations, entities owning an interest in nuclear generating facilities are required to determine the costs and funding methods necessary to decommission such facilities upon termination of
116
NOTES TO CONSOLIDATED FINANCIAL STATEMENTS
operation. As a general practice, each nuclear owner places funds in independent external trust accounts it maintains to provide for decommissioning.
Power maintains the external master nuclear decommissioning trust which contains two separate funds: a qualified fund and a non-qualified fund. Section 468A of the Internal Revenue Code limits the amount of money that can be contributed into a qualified fund. In the most recent study of the total cost of decommissioning, Power’s share related to its five nuclear units was estimated at approximately $2.1 billion, including contingencies.
Power classifies investments in the NDT Funds as available-for-sale under SFAS No. 115, “Accounting for Certain Investments in Debt and Equity Securities,” (SFAS 115). The following tables show the fair values and gross unrealized gains and losses for the securities held in the NDT Funds.
| | | | | | | | |
| | As of December 31, 2008 |
| | Cost | | Gross
Unrealized
Gains | | Gross
Unrealized
Losses | | Estimated
Fair Value |
| | Millions |
Equity Securities | | | $ | | 386 | | | | $ | | 32 | | | | $ | | (5 | ) | | | | $ | | 413 | |
Debt Securities | | | | | | | | |
Government Obligations | | | | 192 | | | | | 3 | | | | | — | | | | | 195 | |
Other Debt Securities | | | | 284 | | | | | 6 | | | | | — | | | | | 290 | |
| | | | | | | | |
Total Debt Securities | | | | 476 | | | | | 9 | | | | | — | | | | | 485 | |
| | | | | | | | |
Other Securities | | | | 72 | | | | | 1 | | | | | (1 | ) | | | | | 72 | |
| | | | | | | | |
Total Available-for-Sale Securities | | | $ | | 934 | | | | $ | | 42 | | | | $ | | (6 | ) | | | | $ | | 970 | |
| | | | | | | | |
| | | | | | | | |
| | As of December 31, 2007 |
| | Cost | | Gross
Unrealized
Gains | | Gross
Unrealized
Losses | | Estimated
Fair Value |
| | Millions |
Equity Securities | | | $ | | 573 | | | | $ | | 191 | | | | $ | | (5 | ) | | | | $ | | 759 | |
Debt Securities | | | | | | | | |
Government Obligations | | | | 213 | | | | | 8 | | | | | — | | | | | 221 | |
Other Debt Securities | | | | 253 | | | | | 4 | | | | | — | | | | | 257 | |
| | | | | | | | |
Total Debt Securities | | | | 466 | | | | | 12 | | | | | — | | | | | 478 | |
| | | | | | | | |
Other Securities | | | | 38 | | | | | 3 | | | | | (2 | ) | | | | | 39 | |
| | | | | | | | |
Total Available-for-Sale Securities | | | $ | | 1,077 | | | | $ | | 206 | | | | $ | | (7 | ) | | | | $ | | 1,276 | |
| | | | | | | | |
| | | | | | |
| | 2008 | | 2007 | | 2006 |
| | Millions |
Proceeds from Sales | | | $ | | 3,060 | | | | $ | | 1,672 | | | | $ | | 1,405 | |
Net Realized Gains (Losses): | | | | | | |
Gross Realized Gains | | | $ | | 354 | | | | $ | | 164 | | | | $ | | 98 | |
Gross Realized Losses | | | | (273 | ) | | | | | (88 | ) | | | | | (54 | ) | |
| | | | | | |
Net Realized Gains | | | $ | | 81 | | | | $ | | 76 | | | | $ | | 44 | |
| | | | | | |
117
NOTES TO CONSOLIDATED FINANCIAL STATEMENTS
Net realized gains of $81 million were recognized in Other Income and Other Deductions in Power’s Consolidated Statement of Operations for the year ended December 31, 2008. Net unrealized gains of $18 million (after-tax) were recognized in Accumulated Other Comprehensive Loss in Power’s Consolidated Balance Sheet as of December 31, 2008. The $6 million of gross 2008 unrealized losses has been in an unrealized loss position for less than twelve months. The available-for-sale debt securities held as of December 31, 2008, had the following maturities:
|
• | | | | $14 million less than one year, |
|
• | | | | $88 million after one through five years, |
|
• | | | | $123 million after five through 10 years, $69 million after 10 through 15 years, |
|
• | | | | $15 million after 15 through 20 years, and $176 million over 20 years. |
The cost of these securities was determined on the basis of specific identification.
The fair value of securities in an unrealized loss position as of December 31, 2008 was $85 million. If the fair market value of the securities falls below cost, the investments are considered to be other-than-temporarily impaired. The difference between the fair market value and cost is recorded as a charge to earnings since Power does not definitely have the ability and intent to hold the securities for a reasonable time to permit recovery. In 2008, other-than-temporary impairments of $219 million were recognized on securities in the NDT Funds. Any subsequent recoveries in the value of these securities are recognized in Other Comprehensive Income. The assessment of fair market value compared to cost is applied on a weighted average basis taking into account various purchase dates and initial cost detail of the securities.
Nuclear Insurance Coverages and Assessments
Power is a member of an industry mutual insurance company, Nuclear Electric Insurance Limited (NEIL), which provides the primary property and decontamination liability insurance at Salem, Hope Creek and Peach Bottom. NEIL also provides excess property insurance through its decontamination liability, decommissioning liability and excess property policy and replacement power coverage through its accidental outage policy. NEIL policies may make retrospective premium assessments in case of adverse loss experience. Power’s maximum potential liabilities under these assessments are included in the table and notes below. Certain provisions in the NEIL policies provide that the insurer may suspend coverage with respect to all nuclear units on a site without notice if the NRC suspends or revokes the operating license for any unit on that site, issues a shutdown order with respect to such unit, or issues a confirmatory order keeping such unit down.
The American Nuclear Insurers (ANI) and NEIL policies both include coverage for claims arising out of acts of terrorism. NEIL makes a distinction between certified and non-certified acts of terrorism, as defined under the Terrorism Risk Insurance Act (TRIA), and thus its policies respond accordingly. For non-certified acts of terrorism, NEIL policies are subject to an industry aggregate limit of $3.2 billion plus any amounts available through reinsurance or indemnity for non-certified acts of terrorism. For any act of terrorism, Power’s nuclear liability policies will respond similarly to other covered events. For certified acts, Power’s nuclear property NEIL policies will respond similarly to other covered events.
The Price-Anderson Act sets the “limit of liability” for claims that could arise from an incident involving any licensed nuclear facility in the U.S. The “limit of liability” is based on the number of licensed nuclear reactors and is adjusted at least every five years based on the Consumer Price Index. The current “limit of liability” is $12.5 billion. All owners of nuclear reactors, including Power, have provided for this exposure through a combination of private insurance and mandatory participation in a financial protection pool as established by the Price-Anderson Act. Under the Price- Anderson Act, each party with an ownership interest in a nuclear reactor can be assessed its share of $118 million per reactor per incident, payable at $18 million per reactor per incident per year. If the damages exceed the “limit of liability,” the President is to submit to Congress a plan for providing additional compensation to the injured parties. Congress could impose further revenue-raising measures on the nuclear industry to pay claims. Power’s maximum aggregate
118
NOTES TO CONSOLIDATED FINANCIAL STATEMENTS
assessment per incident is $370 million (based on Power’s ownership interests in Hope Creek, Peach Bottom and Salem) and its maximum aggregate annual assessment per incident is $55 million. Further, a decision by the U.S. Supreme Court, not involving Power, has held that the Price- Anderson Act did not preclude awards based on state law claims for punitive damages.
Power’s insurance coverages and maximum retrospective assessments for its nuclear operations are as follows:
| | | | |
Type and Source of Coverages | | Total Site
Coverage | | Retrospective
Assessments |
| | Millions |
Public and Nuclear Worker Liability (Primary Layer): | | | | |
ANI | | | $ | | 300 | (A) | | | | $ | | — | |
Nuclear Liability (Excess Layer): | | | | |
Price-Anderson Act | | | | 12,219 | (B) | | | | | 370 | |
| | | | |
Nuclear Liability Total | | | $ | | 12,519 | (C) | | | | $ | | 370 | |
| | | | |
Property Damage (Primary Layer): | | | | |
NEIL | | | | |
Primary (Salem/Hope Creek/Peach Bottom) | | | $ | | 500 | | | | $ | | 17 | |
| | | | |
Property Damage (Excess Layers): | | | | |
NEIL II (Salem/Hope Creek/Peach Bottom) | | | | 750 | | | | | 9 | |
NEIL Blanket Excess (Salem/Hope Creek/Peach Bottom) | | | | 850 | (D) | | | | | 5 | |
| | | | |
Property Damage Total (Per Site) | | | $ | | 2,100 | | | | $ | | 31 | |
| | | | |
| | | | |
Accidental Outage: | | | | |
NEIL I (Peach Bottom) | | | $ | | 245 | (E) | | | | $ | | 6 | |
NEIL I (Salem) | | | | 281 | (E) | | | | | 7 | |
NEIL I (Hope Creek) | | | | 490 | (E) | | | | | 6 | |
| | | | |
Replacement Power Total | | | $ | | 1,016 | | | | $ | | 19 | |
| | | | |
|
(A) | | | | The primary limit for Public Liability is a per site aggregate limit with no potential for assessment. The Nuclear Worker Liability represents the potential liability from workers claiming exposure to the hazard of nuclear radiation. This coverage is subject to an industry aggregate limit that is subject to reinstatement at ANI discretion. |
|
(B) | | | | Retrospective premium program under the Price-Anderson Act liability provisions of the Atomic Energy Act of 1954, as amended. Power is subject to retrospective assessment with respect to loss from an incident at any licensed nuclear reactor in the U.S. that produces greater than 100 MW of electrical power. This retrospective assessment can be adjusted for inflation every five years. The last adjustment was effective as of October 29, 2008. The next adjustment is due on or before October 29, 2013. This retrospective program is in excess of the Public and Nuclear Worker Liability primary layers. |
|
(C) | | | | Limit of liability under the Price-Anderson Act for each nuclear incident. |
|
(D) | | | | For property limits in excess of $1.25 billion, Power participates in a “blanket limit” excess policy where the $850 million limit is shared by Power with Amergen Energy Company, LLC (Amergen) and Exelon Generation among the Braidwood, Byron, Clinton, Dresden, La Salle, Limerick, Oyster Creek, Quad Cities, TMI-1 facilities owned by Amergen and Exelon Generation and the Peach Bottom, Salem and Hope Creek facilities. This limit is not subject to reinstatement in the event of a loss. Participation in this program materially reduces Power’s premium and the associated potential assessment. |
119
NOTES TO CONSOLIDATED FINANCIAL STATEMENTS
|
(E) | | | | Peach Bottom has an aggregate indemnity limit based on a weekly indemnity of $2.3 million for 52 weeks followed by 80% of the weekly indemnity for 68 weeks. Salem has an aggregate indemnity limit based on a weekly indemnity of $2.5 million for 52 weeks followed by 80% of the weekly indemnity for 75 weeks. Hope Creek has an aggregate indemnity limit based on a weekly indemnity of $4.5 million for 52 weeks followed by 80% of the weekly indemnity for 71 weeks. |
Note 8. Goodwill and Other Intangibles
As of each of December 31, 2008 and 2007, Power had goodwill of $16 million related to the Bethlehem Energy Center. Power conducted an annual review for goodwill impairment as of October 31, 2008 and concluded that goodwill was not impaired. No events occurred subsequent to that date which would require a further review of goodwill for impairment.
In addition to goodwill, as of December 31, 2008 and 2007, Power had intangible assets of $43 million and $35 million, respectively, related to emissions allowances. Emissions allowances, which are expensed as used or sold, amounted to $1 million, $2 million and $3 million for the years ended December 31, 2008, 2007 and 2006, respectively. Also as of December 31, 2008, Energy Holdings’ joint venture that develops compressed air energy storage had intangible assets of $9 million.
Note 9. Asset Retirement Obligations (AROs)
PSEG, Power and PSE&G have recorded various AROs under SFAS No. 143, “Accounting for Asset Retirement Obligations” (SFAS 143) and FIN 47, “Accounting for Conditional Asset Retirement Obligations” (FIN 47). AROs represent the legal obligation to remove or dispose of an asset or some component of an asset at retirement.
Power’s ARO liability primarily relates to the decommissioning of its nuclear power plants, an independent external trust that is intended to fund decommissioning of its nuclear facilities upon termination of operation. For additional information, see Note 7. Nuclear Decommissioning and Insurance. Power also identified conditional AROs under FIN 47, primarily related to Power’s fossil generation units, including liabilities for
|
• | | | | removal of asbestos, stored hazardous liquid material and underground storage tanks from industrial power sites, |
|
• | | | | restoration of leased office space to rentable condition upon lease termination, |
|
• | | | | permits and authorizations, |
|
• | | | | restoration of an area occupied by a reservoir when the reservoir is no longer needed, and |
|
• | | | | demolition of certain plants, and the restoration of the sites at which they reside when the plants are no longer in service. |
PSE&G has a conditional ARO for legal obligations identified under FIN 47 related to the removal of asbestos and underground storage tanks at certain industrial establishments, removal of wood poles, leases and licenses, and the requirement to seal natural gas pipelines at all sources of gas when the pipelines are no longer in service. PSE&G did not record an ARO for PSE&G’s protected steel and poly-based natural gas transmission lines, as management believes that these categories of transmission lines have an indeterminable life.
120
NOTES TO CONSOLIDATED FINANCIAL STATEMENTS
The changes to the ARO liabilities during 2008 are presented in the following table:
| | | | | | | | |
| | PSEG | | Power | | PSE&G | | Other |
| | Millions |
ARO Liability as of January 1, 2008 | | | $ | | 542 | | | | $ | | 309 | | | | $ | | 231 | | | | $ | | 2 | |
Liabilities Settled | | | | (5 | ) | | | | | — | | | | | (5 | ) | | | | | — | |
Accretion Expense | | | | 25 | | | | | 25 | | | | | — | | | | | — | |
Accretion Expense Deferred and Recovered in Rate Base (A) | | | | 14 | | | | | — | | | | | 14 | | | | | — | |
| | | | | | | | |
ARO Liability as of December 31, 2008 | | | $ | | 576 | | | | $ | | 334 | | | | $ | | 240 | | | | $ | | 2 | |
| | | | | | | | |
|
(A) | | | | Not reflected as expense in Consolidated Statements of Operations |
Note 10. Pension, OPEB and Savings Plans
PSEG sponsors several qualified and nonqualified pension plans and other postretirement benefit plans covering PSEG’s and its participating affiliates’ current and former employees who meet certain eligibility criteria. Eligible employees of Power, PSE&G, Energy Holdings and Services participate in non-contributory pension and OPEB plans sponsored by PSEG and administered by Services. In addition, represented and nonrepresented employees are eligible for participation in PSEG’s two defined contribution plans described below.
In accordance with SFAS 158, which became effective prospectively for periods ending after December 15, 2006, PSEG, Power and PSE&G were required to record the under or over funded positions of their defined benefit pension and OPEB plans on their respective balance sheets. Such funding positions were first measured as of December 31, 2006 in compliance with SFAS 158 and in accordance with customary practice of each PSEG company prior to the issuance of SFAS 158. For under funded plans, the liability is equal to the difference between the plan’s benefit obligation and the fair value of plan assets. For defined benefit pension plans, the benefit obligation is the projected benefit obligation. For OPEB plans, the benefit obligation is the accumulated postretirement benefit obligation. In addition, the statement requires that the total unrecognized costs for defined benefit pension and OPEB plans be recorded as an after-tax charge to Accumulated Other Comprehensive Loss, a separate component of Stockholder’s Equity. However, for PSE&G, because the amortization of the unrecognized costs is being collected from customers, the accumulated unrecognized costs are recorded as a Regulatory Asset. The unrecognized costs represent actuarial gains or losses, prior service costs and transition obligations arising from the adoption of the preceding pension and OPEB accounting standards, which have not been expensed.
Prior accounting guidance required that unrecognized costs be presented in a footnote to the financial statements as part of a reconciliation of a plan’s funded status to amounts recorded in the financial statements. The unrecognized costs were amortized as a component of net periodic pension or OPEB expense. Under the new standard, for Power, the charge to Other Comprehensive Income is amortized and recorded as net periodic pension cost in the Consolidated Statement of Operations. For PSE&G, the Regulatory Asset is amortized and recorded as net periodic pension cost in the Consolidated Statement of Operations.
The following table provides a roll-forward of the changes in the benefit obligation and the fair value of plan assets during each of the two years in the periods ended December 31, 2008 and 2007. It also provides
121
NOTES TO CONSOLIDATED FINANCIAL STATEMENTS
the funded status of the plans and the amounts recognized and amounts not recognized in the Statement of Financial Position at the end of both years.
| | | | | | | | | | | Pension Benefits | | Other Benefits |
| | 2008 | | 2007 | | 2008 | | 2007 |
| | Millions |
Change in Benefit Obligation: | | | | | | | | |
Benefit Obligation at Beginning of Year | | | $ | | 3,601 | | | | $ | | 3,723 | | | | $ | | 1,166 | | | | $ | | 1,242 | |
Service Cost | | | | 78 | | | | | 83 | | | | | 15 | | | | | 16 | |
Interest Cost | | | | 227 | | | | | 217 | | | | | 72 | | | | | 73 | |
Actuarial Gain | | | | (122 | ) | | | | | (209 | ) | | | | | (91 | ) | | | | | (100 | ) | |
Gross Benefits Paid | | | | (215 | ) | | | | | (213 | ) | | | | | (64 | ) | | | | | (70 | ) | |
Medicare Subsidy Receipts | | | | — | | | | | — | | | | | 6 | | | | | 5 | |
| | | | | | | | |
Benefit Obligation at End of Year | | | $ | | 3,569 | | | | $ | | 3,601 | | | | $ | | 1,104 | | | | $ | | 1,166 | |
| | | | | | | | |
Change in Plan Assets: | | | | | | | | |
Fair Value of Assets at Beginning of Year | | | $ | | 3,390 | | | | $ | | 3,390 | | | | $ | | 163 | | | | $ | | 154 | |
Actual Return on Plan Assets | | | | (883 | ) | | | | | 191 | | | | | (45 | ) | | | | | 9 | |
Employer Contributions | | | | 72 | | | | | 22 | | | | | 69 | | | | | 65 | |
Gross Benefits Paid | | | | (215 | ) | | | | | (213 | ) | | | | | (64 | ) | | | | | (70 | ) | |
Medicare Subsidy Receipts | | | | | | — | | | | | 6 | | | | | 5 | |
| | | | | | | | |
Fair Value of Assets at End of Year | | | $ | | 2,364 | | | | $ | | 3,390 | | | | $ | | 129 | | | | $ | | 163 | |
| | | | | | | | |
| | | | | | | | |
Funded Status: | | | | | | | | |
Funded Status (Plan Assets less Benefit Obligation) | | | $ | | (1,205 | ) | | | | $ | | (211 | ) | | | | $ | | (975 | ) | | | | $ | | (1,003 | ) | |
| | | | | | | | |
| | | | | | | | |
Additional Amounts Recognized in the Consolidated Balance Sheet: | | |
Current Accrued Benefit Cost | | | $ | | (9 | ) | | | | $ | | (8 | ) | | | | | — | | | | | — | |
Noncurrent Accrued Benefit Cost | | | | (1,196 | ) | | | | | (203 | ) | | | | | (975 | ) | | | | | (1,003 | ) | |
| | | | | | | | |
Amounts Recognized | | | $ | | (1,205 | ) | | | | $ | | (211 | ) | | | | $ | | (975 | ) | | | | $ | | (1,003 | ) | |
| | | | | | | | |
| | | | | | | | |
Additional Amounts Recognized in Accumulated Other Comprehensive Income, Regulated Assets and Deferred Assets: |
Net Transition Obligation | | | $ | | — | | | | $ | | — | | | | $ | | 85 | | | | $ | | 112 | |
Prior Service Cost | | | | 32 | | | | | 41 | | | | | 96 | | | | | 109 | |
Net Actuarial Loss | | | | 1,527 | | | | | 489 | | | | | 48 | | | | | 78 | |
| | | | | | | | |
Total | | | $ | | 1,559 | | | | $ | | 530 | | | | $ | | 229 | | | | $ | | 299 | |
| | | | | | | | |
The pension benefits table above provides information relating to the funded status of all qualified and nonqualified pension plans and other postretirement benefit plans on an aggregate basis. The nonqualified pension plans are partially funded with Rabbi Trusts. In accordance with SFAS 87, the plan assets in the table above do not include the assets held in the Rabbi Trusts. Including the $133 million of assets in the Rabbi Trusts as of December 31, 2008, PSEG has funded approximately 70% of its projected benefit obligation. The fair values of the Rabbi Trust assets are included in the Consolidated Balance Sheets. For additional information see Rabbi Trusts below.
122
NOTES TO CONSOLIDATED FINANCIAL STATEMENTS
Accumulated Benefit Obligation
The accumulated benefit obligation for all PSEG’s defined benefit pension plans was $3.2 billion as of December 31, 2008 and $3.1 billion as of December 31, 2007.
The following table provides the components of net periodic benefit cost for the years ended December 31, 2008, 2007 and 2006:
| | | | | | | | | | | | |
| | | Pension Benefits | | Other Benefits |
| | 2008 | | 2007 | | 2006 | | 2008 | | 2007 | | 2006 |
| | Millions |
Components of Net Periodic Benefit Cost: | | | | | | | | | | | | |
Service Cost | | | $ | | 78 | | | | $ | | 83 | | | | $ | | 86 | | | | $ | | 15 | | | | $ | | 16 | | | | $ | | 18 | |
Interest Cost | | | | 227 | | | | | 217 | | | | | 211 | | | | | 72 | | | | | 73 | | | | | 68 | |
Expected Return on Plan Assets | | | | (290 | ) | | | | | (289 | ) | | | | | (265 | ) | | | | | (15 | ) | | | | | (14 | ) | | | | | (11 | ) | |
Amortization of Net | | | | | | | | | | | | |
Transition Obligation | | | | — | | | | | — | | | | | — | | | | | 27 | | | | | 28 | | | | | 28 | |
Prior Service Cost | | | | 9 | | | | | 10 | | | | | 11 | | | | | 13 | | | | | 13 | | | | | 13 | |
Actuarial Loss | | | | 13 | | | | | 22 | | | | | 54 | | | | | (1 | ) | | | | | 7 | | | | | 8 | |
| | | | | | | | | | | | |
Net Periodic Benefit Cost | | | $ | | 37 | | | | $ | | 43 | | | | $ | | 97 | | | | $ | | 111 | | | | $ | | 123 | | | | $ | | 124 | |
| | | | | | | | | | | | |
| | | | | | | | | | | | |
Components of Total Benefit Expense: | | | | | | | | | | | | |
Net Periodic Benefit Cost | | | $ | | 37 | | | | $ | | 43 | | | | $ | | 97 | | | | $ | | 111 | | | | $ | | 123 | | | | $ | | 124 | |
Effect of Regulatory Asset | | | | — | | | | | — | | | | | — | | | | | 19 | | | | | 19 | | | | | 19 | |
| | | | | | | | | | | | |
Total Benefit Expense, Including Effect of Regulatory Asset | | | $ | | 37 | | | | $ | | 43 | | | | $ | | 97 | | | | $ | | 130 | | | | $ | | 142 | | | | $ | | 143 | |
| | | | | | | | | | | | |
Pension costs and OPEB costs for PSEG, Power and PSE&G are detailed as follows:
| | | | | | | | | | | | |
| | | Pension
Years Ended December 31, | | OPEB
Years Ended December 31, |
| | 2008 | | 2007 | | 2006 | | 2008 | | 2007 | | 2006 |
| | Millions |
Power | | | $ | | 10 | | | | $ | | 12 | | | | $ | | 30 | | | | $ | | 13 | | | | $ | | 16 | | | | $ | | 16 | |
PSE&G | | | | 16 | | | | | 19 | | | | | 49 | | | | | 113 | | | | | 121 | | | | | 121 | |
Other | | | | 11 | | | | | 12 | | | | | 18 | | | | | 4 | | | | | 5 | | | | | 6 | |
| | | | | | | | | | | | |
Total Benefit Expense | | | $ | | 37 | | | | $ | | 43 | | | | $ | | 97 | | | | $ | | 130 | | | | $ | | 142 | | | | $ | | 143 | |
| | | | | | | | | | | | |
123
NOTES TO CONSOLIDATED FINANCIAL STATEMENTS
The following table provides the pre-tax changes recognized in Other Comprehensive Income/Loss, Regulatory Assets and Deferred Assets:
| | | | | | | | |
| | | Pension | | OPEB |
| | 2008 | | 2007 | | 2008 | | 2007 |
| | Millions |
Net Actuarial (Gain) Loss in current period | | | $ | | 1,051 | | | | $ | | (111 | ) | | | | $ | | (31 | ) | | | | $ | | (95 | ) | |
Amortization of Net Actuarial Gain (Loss) | | | | (13 | ) | | | | | (22 | ) | | | | | 1 | | | | | (7 | ) | |
Amortization of Prior Service Cost | | | | (9 | ) | | | | | (10 | ) | | | | | (13 | ) | | | | | (13 | ) | |
Amortization of Transition Asset | | | | — | | | | | — | | | | | (27 | ) | | | | | (28 | ) | |
| | | | | | | | |
Total | | | $ | | 1,029 | | | | $ | | (143 | ) | | | | $ | | (70 | ) | | | | $ | | (143 | ) | |
| | | | | | | | |
Amounts that are expected to be amortized from Accumulated Other Comprehensive Income/Loss, Regulatory Assets and Deferred Assets into Net Periodic Benefit Cost in 2009 are as follows:
| | | | |
| | Pension Benefits
2009 | | Other Benefits
2009 |
| | Millions |
Actuarial (Gain) Loss | | | $ | | 113 | | | | $ | | (3 | ) | |
Prior Service Cost | | | $ | | 7 | | | | $ | | 13 | |
Transition Obligation | | | $ | | — | | | | $ | | 27 | |
124
NOTES TO CONSOLIDATED FINANCIAL STATEMENTS
The following assumptions were used to determine the benefit obligations and net periodic benefit costs:
| | | | | | | | | | | | |
| | | Pension Benefits | | Other Benefits |
| | 2008 | | 2007 | | 2006 | | 2008 | | 2007 | | 2006 |
| | | | | | | | | | | | |
Weighted-Average Assumptions Used to Determine Benefit Obligations as of December 31: |
Discount Rate | | | | 6.80 | % | | | | | 6.50 | % | | | | | 6.00 | % | | | | | 6.80 | % | | | | | 6.50 | % | | | | | 6.00 | % | |
Rate of Compensation Increase | | | | 4.61 | % | | | | | 4.69 | % | | | | | 4.69 | % | | | | | 4.61 | % | | | | | 4.69 | % | | | | | 4.69 | % | |
| | | | | | | | | | | | |
Weighted-Average Assumptions Used to Determine Net Periodic Benefit Cost for Years Ended December 31: |
Discount Rate | | | | 6.50 | % | | | | | 6.00 | % | | | | | 5.75 | % | | | | | 6.50 | % | | | | | 6.00 | % | | | | | 5.75 | % | |
Expected Return on Plan Assets | | | | 8.75 | % | | | | | 8.75 | % | | | | | 8.75 | % | | | | | 8.75 | % | | | | | 8.75 | % | | | | | 8.75 | % | |
Rate of Compensation Increase | | | | 4.69 | % | | | | | 4.69 | % | | | | | 4.69 | % | | | | | 4.69 | % | | | | | 4.69 | % | | | | | 4.69 | % | |
| | | | | | | | | | | | |
Assumed Health Care Cost Trend Rates as of December 31: |
Administrative Expense | | | | | | | | | | 5.00 | % | | | | | 5.00 | % | | | | | 5.00 | % | |
Dental Costs | | | | | | | | | | 6.00 | % | | | | | 6.00 | % | | | | | 6.00 | % | |
Pre-65 Medical Costs | | | | | | | | | | | | |
Immediate Rate | | | | | | | | | | 8.50 | % | | | | | 8.50 | % | | | | | 9.50 | % | |
Ultimate Rate | | | | | | | | | | 5.00 | % | | | | | 5.00 | % | | | | | 5.00 | % | |
Year Ultimate Rate Reached | | | | | | | | | | 2013 | | | | | 2012 | | | | | 2012 | |
Post-65 Medical Costs | | | | | | | | | | | | |
Immediate Rate | | | | | | | | | | 9.50 | % | | | | | 9.50 | % | | | | | 10.50 | % | |
Ultimate Rate | | | | | | | | | | 5.00 | % | | | | | 5.00 | % | | | | | 5.00 | % | |
Year Ultimate Rate Reached | | | | | | | | | | 2014 | | | | | 2013 | | | | | 2013 | |
| | | | | | | | | | | | |
Effect of a 1% Increase in the Assumed Rate of Increase in Health Care Benefit Costs: |
| | | | | | | | Millions |
| | | | | | | | | | | | |
Total of Service Cost and Interest Cost | | | | | | | | $10 | | $11 | | $11 |
Postretirement Benefit Obligation | | | | | | | | $111 | | $121 | | $134 |
| | | | | | | | | | | | |
Effect of a 1% Decrease in the Assumed Rate of Increase in Health Care Benefit Costs: |
Total of Service Cost and Interest Cost | | | | | | | | $(8) | | $(9) | | $(9) |
Postretirement Benefit Obligation | | | | | | | | $(93) | | $(101) | | $(111) |
Plan Assets
The market-related value of plan assets is equal to the fair value of those assets as of year-end. Fair value is determined using quoted market prices and independent pricing services based upon the type of asset class as reported by the fund managers at the measurement dates for all plan assets.
The following table provides the percentage of fair value of total plan assets for each major category of plan assets held for the qualified pension and OPEB plans as of the measurement date, December 31:
| | | | |
Investments | | As of December 31, |
| | 2008 | | 2007 |
Equity Securities | | | | 47 | % | | | | | 62 | % | |
Fixed Income Securities | | | | 43 | % | | | | | 31 | % | |
Real Estate Assets | | | | 8 | % | | | | | 6 | % | |
Other Investments | | | | 2 | % | | | | | 1 | % | |
| | | | |
Total Percentage | | | | 100 | % | | | | | 100 | % | |
| | | | |
125
NOTES TO CONSOLIDATED FINANCIAL STATEMENTS
PSEG utilizes forecasted returns, risk, and correlation of all asset classes in order to develop an optimal portfolio, which is designed to produce the maximum return opportunity per unit of risk. In 2007, PSEG completed its latest asset/liability study. The results from the study indicated that, in order to achieve the optimal risk/return portfolio, target allocations of 62% equity securities, 30% fixed income securities, 5% real estate investments, and 3% for other investments should be maintained. Derivative financial instruments are used by the plans’ investment managers primarily to rebalance the fixed income/equity allocation of the portfolio and hedge the currency risk component of foreign investments.
The expected long-term rate of return on plan assets was 8.75% as of December 31, 2008. For 2009, the expected long-term rate of return on plan assets will remain at 8.75%. This expected return was determined based on the study discussed above and considered the plans’ historical annualized rate of return since inception, which was an annualized return of 9.13%.
Plan Contributions
PSEG may contribute up to $275 million into its pension plans and $11 million into its postretirement healthcare plan for calendar year 2009.
Estimated Future Benefit Payments
The following pension benefit and postretirement benefit payments are expected to be paid to plan participants. Postretirement benefit payments are shown both gross and net of the federal subsidy expected for prescription drugs under the Medicare Prescription Drug Improvement and Modernization Act of 2003. The Act provides a nontaxable federal subsidy to employers that provide retiree prescription drug benefits that are equivalent to the benefits of Medicare Part D.
| | | | | | | | |
Year | | Pension
Benefits | | Other Benefits |
| | Gross
OPEB | | Medicare
Subsidy | | Net OPEB |
| | Millions |
2009 | | | $ | | 220 | | | | $ | | 76 | | | | $ | | (5 | ) | | | | $ | | 71 | |
2010 | | | | 226 | | | | | 79 | | | | | (5 | ) | | | | | 74 | |
2011 | | | | 233 | | | | | 82 | | | | | (6 | ) | | | | | 76 | |
2012 | | | | 241 | | | | | 83 | | | | | (6 | ) | | | | | 77 | |
2013 | | | | 250 | | | | | 84 | | | | | (7 | ) | | | | | 77 | |
2014-2018 | | | | 1,407 | | | | | 441 | | | | | (40 | ) | | | | | 401 | |
| | | | | | | | |
Total | | | $ | | 2,577 | | | | $ | | 845 | | | | $ | | (69 | ) | | | | $ | | 776 | |
| | | | | | | | |
Rabbi Trusts
PSEG maintains certain unfunded, nonqualified benefit plans for which certain assets have been set aside in grantor trusts commonly known as “Rabbi Trusts” to provide supplemental retirement and deferred compensation benefits to certain of its and its subsidiaries’ key employees.
126
NOTES TO CONSOLIDATED FINANCIAL STATEMENTS
PSEG classifies investments in the Rabbi Trusts as available-for-sale under SFAS 115. The following tables show the fair values, gross unrealized gains and losses and amortized cost bases for the securities held in the Rabbi Trusts:
| | | | | | | | |
| | December 31, 2008 |
| | Cost | | Gross
Unrealized
Gains | | Gross
Unrealized
Losses | | Estimated Fair
Value |
| | Millions |
Equity Securities | | | $ | | 11 | | | | $ | | — | | | | $ | | (2 | ) | | | | $ | | 9 | |
| | | | | | | | |
Debt Securities | | | | | | | | |
Government Obligations | | | | 72 | | | | | 9 | | | | | — | | | | | 81 | |
Other Debt Securities | | | | 30 | | | | | — | | | | | (1 | ) | | | | | 29 | |
| | | | | | | | |
Total Debt Securities | | | | 102 | | | | | 9 | | | | | (1 | ) | | | | | 110 | |
Other Securities | | | | 14 | | | | | — | | | | | — | | | | | 14 | |
| | | | | | | | |
Total Available-for-Sale Securities | | | $ | | 127 | | | | $ | | 9 | | | | $ | | (3 | ) | | | | $ | | 133 | |
| | | | | | | | |
| | | | | | | | |
| | December 31, 2007 |
| | Cost | | Gross
Unrealized
Gains | | Gross
Unrealized
Losses | | Estimated Fair
Value |
| | Millions |
Equity Securities | | | $ | | 12 | | | | $ | | 4 | | | | $ | | — | | | | $ | | 16 | |
| | | | | | | | |
Debt Securities | | | | | | | | |
Government Obligations | | | | 90 | | | | | 4 | | | | | — | | | | | 94 | |
Other Debt Securities | | | | 30 | | | | | 2 | | | | | — | | | | | 32 | |
| | | | | | | | |
Total Debt Securities | | | | 120 | | | | | 6 | | | | | — | | | | | 126 | |
Other Securities | | | | 16 | | | | | — | | | | | — | | | | | 16 | |
| | | | | | | | |
Total Available-for-Sale Securities | | | $ | | 148 | | | | $ | | 10 | | | | $ | | — | | | | $ | | 158 | |
| | | | | | | | |
In 2008 other-than-temporary impairments of $2 million were recognized on the debt securities investments of the Rabbi Trusts.
| | | | | | |
| | Years Ended December 31, |
| | 2008 | | 2007 | | 2006 |
| | Millions |
Proceeds from Sales | | | $ | | 23 | | | | $ | | 33 | | | | $ | | 35 | |
Gross Realized Gains | | | $ | | 2 | | | | $ | | 1 | | | | $ | | — | |
Gross Realized Losses | | | $ | | (2 | ) | | | | $ | | (2 | ) | | | | $ | | (1 | ) | |
The available-for-sale debt securities held as of December 31, 2008, had the following maturities:
|
• | | | | $5 million less than one year, |
|
• | | | | $26 million after one through five years, |
|
• | | | | $17 million after five through 10 years, $9 million after 10 through 15 years, |
|
• | | | | $3 million after 15 through 20 years, and $50 million over 20 years. |
127
NOTES TO CONSOLIDATED FINANCIAL STATEMENTS
The cost of these securities was determined on the basis of specific identification.
The estimated fair value of the Rabbi Trusts related to PSEG, Power and PSE&G are detailed as follows:
| | | | |
| | As of December 31, |
| | 2008 | | 2007 |
| | Millions |
Power | | | $ | | 27 | | | | $ | | 45 | |
PSE&G | | | | 46 | | | | | 57 | |
Other | | | | 60 | | | | | 56 | |
| | | | |
Total Available-for-Sale Securities | | | $ | | 133 | | | | $ | | 158 | |
| | | | |
401(k) Plans
PSEG sponsors two 401(k) plans, which are Employee Retirement Income Security Act defined contribution plans. Eligible represented employees of PSE&G, Power and Services participate in the PSEG Employee Savings Plan (Savings Plan), while eligible non-represented employees of PSE&G, Power, Energy Holdings and Services participate in the PSEG Thrift and Tax-Deferred Savings Plan (Thrift Plan). Eligible employees may contribute up to 50% of their compensation to these plans. Employee contributions up to 7% for Savings Plan participants and up to 8% for Thrift Plan participants are matched with employer contributions of cash equal to 50% of such employee contributions. The amount paid for employer matching contributions to the plans for PSEG, Power and PSE&G are detailed as follows:
| | | | | | |
| | Thrift Plan and Savings Plan
Years Ended December 31, |
| | 2008 | | 2007 | | 2006 |
| | Millions |
Power | | | $ | | 9 | | | | $ | | 9 | | | | $ | | 8 | |
PSE&G | | | | 17 | | | | | 15 | | | | | 15 | |
Other | | | | 5 | | | | | 4 | | | | | 4 | |
| | | | | | |
Total Employer Matching Contributions | | | $ | | 31 | | | | $ | | 28 | | | | $ | | 27 | |
| | | | | | |
Note 11. Commitments and Contingent Liabilities
Guaranteed Obligations
Power’s activities primarily involve the purchase and sale of energy and related products under transportation, physical, financial and forward contracts at fixed and variable prices. These transactions are with numerous counterparties and brokers that may require cash or cash-related instruments to be deposited for guarantees.
Power has unconditionally guaranteed payments by its subsidiaries in commodity-related transactions to support current exposure, interest and other costs on sums due and payable in the ordinary course of business. These guarantees are provided to counterparties in order to obtain credit. Under these agreements, guarantees cover lines of credit between entities and are often reciprocal in nature. The exposure between counterparties can move in either direction.
In order for Power to incur a liability for the face value of the outstanding guarantees, its subsidiaries would have to fully utilize the credit granted to them by every counterparty to whom Power has provided a
128
NOTES TO CONSOLIDATED FINANCIAL STATEMENTS
guarantee and all of the related contracts would have to be “out-of-the-money” (if the contracts are terminated, Power would owe money to the counterparties). The probability of this is highly unlikely due to offsetting positions within the portfolio. For this reason, the current exposure at any point in time is a more meaningful representation of the potential liability under these guarantees. This current exposure consists of the net of accounts receivable and accounts payable and the forward value on open positions, less any margins posted.
Power is subject to counterparty collateral calls related to commodity contracts and is subject to certain creditworthiness standards as guarantor under performance guarantees of its subsidiaries. Changes in commodity prices can have a material impact on margin requirements under such contracts, which are posted and received primarily in the form of letters of credit. Power also routinely enters into futures and options transactions for electricity and natural gas as part of its operations. These futures contracts usually require a cash margin deposit with brokers, which can change based on market movement and in accordance with exchange rules.
The face value of outstanding guarantees, current exposure and margin positions as of December 31, 2008 and 2007 are as follows:
| | | | |
| | As of December 31, |
| | 2008 | | 2007 |
| | Millions |
Face value of outstanding guarantees | | | $ | | 1,856 | | | | $ | | 1,533 | |
Exposure under current guarantees | | | $ | | 585 | | | | $ | | 521 | |
Letters of Credit Margin Posted | | | $ | | 201 | | | | $ | | 186 | |
Letters of Credit Margin Received | | | $ | | 250 | | | | $ | | 42 | |
Counterparty Cash Margin Deposited | | | $ | | 3 | | | | $ | | 1 | |
Counterparty Cash Margin (Received) | | | $ | | (81 | ) | | | | $ | | (2 | ) | |
Net Broker Balance (Received) Deposited | | | $ | | (74 | ) | | | | $ | | 167 | |
Power nets the fair value of cash collateral receivables and payables with the corresponding net energy contract balances. As a result, Power has included net cash received of $112 million and net cash paid of $86 million in its corresponding net derivative contract positions as of December 31, 2008 and 2007, respectively. The remaining balance of net cash (received) deposited shown above is primarily included in Accounts Payable in 2008 and in Accounts Receivable in 2007.
In the event of a deterioration of Power’s credit rating to below investment grade, which would represent a two level downgrade from its current ratings, many of these agreements allow the counterparty to demand further performance assurance. As of December 31, 2008, if Power were to lose its investment grade rating, additional collateral of approximately $1.1 billion could be required. As of December 31, 2008, there was $2.8 billion of available liquidity under PSEG and Power’s credit facilities that could be used to post collateral.
In addition to amounts discussed above, Power had posted $121 million and $39 million in letters of credit as of December 31, 2008 and 2007, respectively, to support various other contractual and environmental obligations.
Environmental Matters
Passaic River
Historic operations by PSEG companies along the Passaic and Hackensack rivers, and the operations of dozens of other companies, are alleged by Federal and State agencies to have discharged substantial contamination into the Passaic River/Newark Bay Complex. The U.S. Environmental Protection Agency (EPA) has determined that a six-mile stretch of the Passaic River in the area of Newark, New Jersey is a
129
NOTES TO CONSOLIDATED FINANCIAL STATEMENTS
“facility” within the meaning of that term under the Federal Comprehensive Environmental Response, Compensation and Liability Act of 1980 (CERCLA) and undertook a study of the river.
PSE&G and certain of its predecessors conducted industrial operations at properties adjacent to the Passaic River facility. The operations included one operating electric generating station (Essex Site), which was transferred to Power, one former generating station and four former MGP sites. Power assumed any environmental liabilities of the Essex Site when it was transferred to Power from PSE&G, and PSE&G obtained releases and indemnities for liabilities arising out of the former generating station when it was sold. PSE&G’s costs to clean up former MGP sites are recoverable from utility customers.
The EPA’s study will include the entire 17-mile tidal reach of the lower Passaic River. The EPA has indicated that it believed hazardous substances had been released from the Essex Site and one of PSE&G’s former MGP locations (Harrison Site), which also includes facilities for PSE&G’s ongoing gas operations. In 2006, the EPA notified the potentially responsible parties (PRPs) that the cost of its study will greatly exceed its original estimated cost of $20 million. 73 PRPs, including Power and PSE&G, have agreed to assume responsibility for the study and to divide the associated costs among themselves according to a mutually agreed-upon formula. The PRP group is presently executing the study. The percentage of costs allocable to Power and PSE&G has varied depending on the number of PRPs funding the study. It currently is 6.1% of the study costs, approximately 80% of which is attributable to PSE&G’s former MGP sites and approximately 20% to Power’s generating stations. Power has provided notice to insurers concerning this potential claim.
In June 2007, the EPA announced that it would release a draft focused feasibility study that proposes six options to address contamination cleanup in the lower eight miles of the Passaic River, with estimated costs ranging from $900 million to $2.3 billion, in addition to a “No Action” alternative. The work contemplated by the study is not subject to the cost sharing agreement discussed above. The draft focused feasibility study will not be released before late spring 2009.
In 2005, the New Jersey Department of Environmental Protection (NJDEP) filed suit against a PRP and related companies in New Jersey Superior Court seeking damages and reimbursement for costs expended by the State of New Jersey to address the effects on the Passaic River of the PRP’s former operations which resulted in the discharge of dioxin and other hazardous substances. In September 2008, the Court issued a case management order permitting the defendants to file third party complaints for contribution. On February 4,2009 third-party complaints were filed against some 320 third-party defendants, including Power and PSE&G. The defendants/third party plaintiffs claim that each of the third-party defendants is responsible for the clean-up costs for the hazardous substances it discharged into the Newark Bay Complex. They seek statutory contribution and contribution under the New Jersey Spill Compensation and Control Act (Spill Act) to recover past and future removal costs and damages. Power and PSE&G cannot predict the ultimate outcome of this litigation.
CERCLA and the Spill Act authorize federal and state trustees for natural resources to assess damages against persons who have discharged a hazardous substance which causes an injury to natural resources. Pursuant to the Spill Act, the NJDEP requires persons conducting remediation to characterize injuries to natural resources and to address those injuries through restoration or damages. The NJDEP has issued regulations concerning site investigation and remediation that require an ecological evaluation of potential damages to natural resources in connection with an environmental investigation of contaminated sites.
In 2003, the NJDEP directed PSEG, PSE&G and 56 other PRPs to arrange for a natural resource damage assessment and interim compensatory restoration of natural resource injuries along the lower Passaic River and its tributaries pursuant to the Spill Act. The NJDEP alleged that hazardous substances had been discharged from the Essex Site and the Harrison Site. The NJDEP estimated the cost of interim natural resource injury restoration activities along the lower Passaic River at approximately $950 million. In 2007, agencies of the United States Department of Commerce and the United States Department of the Interior sent a letter to PSE&G and other PRPs inviting participation in an assessment of injuries to natural
130
NOTES TO CONSOLIDATED FINANCIAL STATEMENTS
resources that the agencies intended to perform. The PRPs have not agreed to participate in either of these natural resource damage initiatives. However, in November 2008, PSEG and a number of other companies agreed in an interim cooperative assessment agreement to pay an aggregate of $1 million for past costs incurred by the Federal trustees and certain costs the trustees will incur going forward, and to work with the trustees for a 12-month period to explore whether some or all of the trustee’s claims can be resolved in a cooperative fashion.
In June 2008, an agreement was announced between the EPA and two PRPs for removal of a portion of the contaminated sediment in the Passaic River. The work will cost an estimated $80 million. The two PRPs have reserved their rights to seek contribution for the removal costs from the other Newark Bay Complex PRPs, including PSEG.
Newark Bay Study Area
The EPA established the Newark Bay Study Area, which it defined as Newark Bay and portions of the Hackensack River, the Arthur Kill and the Kill Van Kull. In August 2006, the EPA sent PSEG and 11 other entities notices that it considered each of the entities to be a PRP with respect to contamination in the Newark Bay Study Area. The notice letter requested that the PRPs participate and fund the EPA-approved study in the Newark Bay Study Area and encouraged the PRPs to contact Occidental Chemical Corporation (OCC) to discuss participating in the Remedial Investigation/Feasibility Study (RI/FS) that OCC is conducting in the Newark Bay Study Area. The EPA considers the Newark Bay Study Area, along with the Passaic River Study Area, to be part of the Diamond Alkali Superfund Site. The notice states the EPA’s belief that hazardous substances were released from sites owned by PSEG and located on the Hackensack River. Currently five of the entities, including PSEG, are participating and partially funding the RI/FS study. The PSEG sites include two operating electric generating stations (Hudson and Kearny sites) and one former MGP site.
PSEG, Power and PSE&G cannot predict what further actions, if any, or the costs or the timing thereof, that may be required with respect to the Passaic River, Newark Bay Study Area or other natural resource damages claims; however, such costs could be material.
MGP Remediation Program
PSE&G is working with the NJDEP under a program to assess, investigate and remediate environmental conditions at PSE&G’s former MGP sites (Remediation Program). To date, 38 sites have been identified as sites requiring some level of remedial action. In addition, the NJDEP has announced initiatives to accelerate the investigation and subsequent remediation of the riverbeds underlying surface water bodies that have been impacted by hazardous substances from adjoining sites. In 2005, the NJDEP initiated a program on the Delaware River aimed at identifying the 10 most significant sites for cleanup. One of the sites identified is PSE&G’s former Camden Coke facility. The Remediation Program is periodically reviewed, and the estimated costs are revised by PSE&G based on regulatory requirements, experience with the program and available remediation technologies.
During the fourth quarter of 2008, PSE&G determined that the cost to completion could range between $709 million and $820 million from December 31, 2008 through 2021. Since no amount within the range was considered to be most likely, PSE&G recorded a liability of $709 million as of December 31, 2008. Of this amount, $20 million was recorded in Other Current Liabilities and $689 million was reflected as Environmental Costs in Noncurrent Liabilities. The costs associated with the MGP Remediation Program have historically been recovered through the SBC charges to PSE&G ratepayers. As such, PSE&G has recorded a $709 million Regulatory Asset.
Prevention of Significant Deterioration (PSD)/New Source Review (NSR)
The PSD/NSR regulations, promulgated under the Clean Air Act, require major sources of certain air pollutants to obtain permits, install pollution control technology and obtain offsets, in some circumstances,
131
NOTES TO CONSOLIDATED FINANCIAL STATEMENTS
when those sources undergo a “major modification,” as defined in the regulations. The federal government may order companies that are not in compliance with the PSD/NSR regulations to install the best available control technology at the affected plants and to pay monetary penalties which, as implemented by EPA, range from $25,000 per day for each violation occurring on or before January 30, 1997, $27,500 per day of each violation for violations occurring after January 30, 1997, $32,500 per day of each violation for violations occurring after March 14, 2004, and $37,500 per day of each violation for violations occurring after January 12, 2009.
In November 2006, Power reached an agreement with the EPA and the NJDEP to achieve emissions reductions targets consistent with an earlier consent decree that resolved allegations of non-compliance with PSD/NSR programs at Power’s Mercer, Hudson and Bergen generating stations. Under this agreement and the consent decree, Power is required to undertake a number of technology projects, plant modifications and operating procedure changes at Hudson and Mercer designed to meet targeted reductions in emissions of sulfur dioxide (SO2), nitrogen oxide (NOx), particulate matter and mercury.
Pursuant to this program, Power has installed selective catalytic reduction equipment at Mercer at a cost of $122 million and baghouses were placed in service in December 2008 at a cost of $263 million. The cost of assets to be placed in service in order to implement the balance of the agreement is estimated at $200 million to $250 million for Mercer, to be completed by May 2010, and $700 million to $750 million for Hudson, of which $288 million has been spent through December 31, 2008, to be completed by the end of 2010. Power also purchased and retired emissions allowances by July 31, 2007, paid a $6 million civil penalty and has agreed to contribute $3 million for programs to reduce particulate emissions from diesel engines in New Jersey. Two particulate emissions reduction projects are in development to meet the agreement criteria.
On January 14, 2009, EPA issued a notice of violation to Power and other owners of the Keystone coal-fired plant in Pennsylvania, alleging, among other things, that various capital improvement projects were made at the plant which are considered modifications (or major modifications) causing significant net emission increases of PSD/NSR air pollutants, including NOx, SO2 and Particulate Matter, beginning in 1985 for Keystone Unit 1 and in 1984 for Keystone Unit 2. The notice of violation states that none of these modifications underwent the PSD/NSR permitting process prior to being put into service, which the EPA alleges was required under the Clean Air Act. Power owns approximately 23% of the plant. The co-owners are preparing a response to the notice of violation. Power cannot predict the outcome of this matter.
Mercury Regulation
In March 2005, the EPA established a New Source Performance Standard limit for nickel emissions from oil-fired electric generating units and a cap-and-trade program for mercury emissions from coal-fired electric generating units. In February 2008, the United States Court of Appeals for the District of Columbia Circuit issued a decision rejecting the EPA’s mercury emissions program and requiring the EPA to develop standards for mercury and nickel emissions that adhere to the Maximum Available Control Technology (MACT) provisions of the Clean Air Act. In October 2008, the EPA filed a petition with the U.S. Supreme Court to review the lower court’s decision. On February 6, 2009, the EPA withdrew its petition with the U.S. Supreme Court, and indicated that it intended to move forward with a rule-making process to develop MACT standards consistent with the Court’s ruling. On February 23, 2009, the Supreme Court denied the request of other industry litigants who had continued to pursue a review of the lower court’s decision. The full impact to PSEG of these developments is uncertain. It is expected that new MACT requirements will require more stringent control than the cap-and-trade program struck down by the D.C. Circuit Court; however, the costs of compliance with mercury MACT standards will have to be compared with the existing New Jersey and Connecticut mercury-control requirements.
Some uncertainty exists regarding the feasibility of achieving the reductions in mercury emissions required by the New Jersey regulations, discussed below. The estimated costs of technology believed to be capable of meeting these emissions limits at Power’s coal-fired units in New Jersey and Pennsylvania have been
132
NOTES TO CONSOLIDATED FINANCIAL STATEMENTS
incurred or are included in Power’s capital expenditure forecast. Total estimated costs for each project to be completed are between $150 million and $200 million.
New Jersey
New Jersey regulations required coal-fired electric generating units to meet certain emissions limits or reduce emissions by approximately 90% by December 15, 2007, unless a one-year extension was granted by the NJDEP. Companies that are parties to multi-pollutant reduction agreements are permitted to postpone such reductions on half of their coal-fired electric generating capacity until December 15, 2012.
Power’s New Jersey facilities expected to achieve the remaining December 15, 2007 requirements through the installation of carbon injection technology at both Mercer units. Although this work was completed in January 2007, due to some uncertainty as to whether the system could consistently achieve the required reductions, Power applied for and received from the NJDEP approval of a one-year extension through a facility-specific control plan that includes the installation of baghouses at the Mercer units in 2008. Installation was completed in December 2008 and the baghouses are operational. Power anticipates compliance with the reductions required by December 15, 2012 will be achieved through the installation of a baghouse at its Hudson plant by the end of 2010. The mercury-control technologies are part of Power’s multi-pollutant reduction agreement, which resulted from earlier agreements that resolved issues arising out of the PSD/NSR air pollution control programs discussed above.
Connecticut
Mercury emissions control standards were effective in July 2008 and require coal-fired power plants to achieve either an emissions limit or 90% mercury removal efficiency through technology installed to control mercury emissions. Power has demonstrated compliance at its Bridgeport Harbor Station resulting from the installation of a baghouse which was placed in service in January 2008.
Pennsylvania
In February 2007, Pennsylvania finalized its “state-specific” requirements to reduce mercury emissions from coal-fired electric generating units. On January 30, 2009, the Pennsylvania Environmental Appeals Board (PaEAB) struck down the rule, indicating that the rule violates Pennsylvania law because it is inconsistent with the Clean Air Act. It is unclear whether the PaEAB’s ruling will be further reviewed in the Pennsylvania courts. If the PaEAB’s decision were to be overturned, the Keystone and Conemaugh generating stations would be positioned by 2010 to meet Phase I of the Pennsylvania mercury rule by benefiting from reductions realized from the installation of planned or completed controls for compliance with SO2 and NOxreductions. Phase II of the mercury rule would be addressed after a full evaluation of the Phase I reductions.
Emission Fees
Section 185 of the Clean Air Act requires states (or in the absence of state action, the EPA) in severe and extreme non-attainment areas to adopt a penalty fee for major stationary sources if the area fails to attain the one-hour ozone National Ambient Air Quality Standard (NAAQS) set by the EPA. In June 2007, the U.S. Court of Appeals for the District of Columbia Circuit ruled against the EPA, which had sought to vacate imposition of fees for NOx emissions because the one hour standard was superseded by an eight-hour standard. Power operates electric generation stations, major stationary sources, in the New Jersey-Connecticut severe non-attainment area that did not meet the required NAAQS. Neither the EPA nor the states in the non-attainment areas in which Power operates have initiated the process for imposing fees in compliance with the court ruling; however, preliminary analysis suggests that penalty fees could be approximately $7 million annually. This analysis could change if the EPA or the states issue additional guidance addressing the imposition of fees, or if Power is able to reduce its emissions of NOx in the future.
133
NOTES TO CONSOLIDATED FINANCIAL STATEMENTS
On January 9, 2009, the NJDEP provided notice that they are in the process of assessing fees under Section 185 for 2008 emissions. These fees would be paid in 2010 after the NJDEP determines the need for statutory or regulatory changes.
NOx Reduction
In August 2008, the NJDEP proposed revisions to NOx emission control regulations that would impose new NOx emission reduction requirements and limits for New Jersey fossil fuel-fired electric generation units. Although this rule is proposed but not final, as written it would have significant impact on Power’s generation fleet, including the necessity to retire a significant portion of the peaking units by 2015 or 2016. If adopted as proposed, the rule could necessitate the retirement of up to 102 combustion turbines (approximately 2,000 MW) and five older New Jersey steam electric generating units (approximately 800 MW).
New Jersey Industrial Site Recovery Act (ISRA)
Potential environmental liabilities related to subsurface contamination at certain generating stations have been identified. In the second quarter of 1999, in anticipation of the transfer of PSE&G’s generation-related assets to Power, a study was conducted pursuant to ISRA, which applied to the sale of certain assets. Power had a $50 million liability as of each of December 31, 2008 and December 31, 2007 related to these obligations, which is included in Environmental Costs in Power’s and PSEG’s Condensed Consolidated Balance Sheets.
Permit Renewals
In June 2001, the NJDEP issued a renewed New Jersey Pollutant Discharge Elimination System (NJPDES) permit for Salem, expiring in July 2006, allowing for the continued operation of Salem with its existing cooling water intake system. In January 2006, a renewal application prepared in accordance with the Federal Water Pollution Control Act’s (FWPCA) Section 316(b) and the Phase II 316(b) rules was filed with the NJDEP. This allows Salem to continue operating under its existing NJPDES permit until a new permit is issued.
In January 2007, the U.S. Court of Appeals for the Second Circuit issued a decision in litigation of the Phase II 316(b) regulations brought by several environmental groups, the Attorneys General of six Northeastern states, including New Jersey, the Utility Water Act Group and several of its members, including Power. In its ruling, the Court:
|
• | | | | remanded major portions of the regulations and determined that Section 316(b) of the FWPCA does not support the use of restoration and the site-specific cost-benefit test. |
|
• | | | | instructed the EPA to reconsider the definition of “best technology available” without comparing the costs of the best performing technology to its benefits. |
Prior to this decision, Power had used restoration and/or a site-specific cost-benefit test in applications it had filed to renew the permits at its once-through cooled plants, including Salem, Hudson and Mercer.
In May 2007, Power and other industry petitioners filed a request for a rehearing with the Second Circuit Court, which was denied. The parties, including Power, requested U.S. Supreme Court review of the matter. In April 2008, the U.S. Supreme Court granted the request of industry petitioners, including Power, to review the question of whether Section 316(b) of the FWPCA allows the EPA to compare costs with benefits in determining the “best technology available” for minimizing adverse environmental impact at cooling water intake structures. An Oral argument occurred on December 2, 2008. It is anticipated that the U.S. Supreme Court will render a decision before the end of its 2008-2009 term.
Although the rule applies to all of Power’s electric generating units that use surface waters for once-through cooling purposes, the impact of the rule and the decision of the Second Circuit Court cannot be determined for all of Power’s facilities. Depending on the final decision of the U.S. Supreme Court, and subsequent
134
NOTES TO CONSOLIDATED FINANCIAL STATEMENTS
actions by the EPA to promulgate a revised rule, the Second Circuit’s decision could have a material impact on Power’s ability to renew permits at its larger once-through cooled plants in New Jersey and Connecticut, including Salem, Hudson, Mercer, Bridgeport and, possibly, Sewaren and New Haven, without making significant upgrades to their existing intake structures and cooling systems.
If the NJDEP and the Connecticut Department of Environmental Protection were to require installation of closed cycle cooling or its equivalent at these once-through cooled facilities, the related costs and impacts would be material to Power and would require economic review to determine whether to continue operations at these facilities.
For example, Power’s application to renew its Salem permit, filed with the NJDEP in February 2006, estimated the costs associated with adding cooling towers for Salem to be approximately $1 billion, of which Power’s share would be approximately $575 million. Potential costs associated with any closed cycle cooling requirements are not included in Power’s forecasted capital expenditures.
Stormwater
In October 2008, the NJDEP notified Power that it must apply for an individual stormwater discharge permit for its Hudson generating station. Hudson stores its coal in an open air pile and as a result it is exposed to precipitation. Discharge of stormwater from Hudson has been regulated pursuant to a Basic Industrial Stormwater General Permit, authorization of which has been previously approved by the NJDEP. The NJDEP has now determined that Hudson is no longer eligible to utilize this general permit, and must apply for an individual NJPDES permit for stormwater discharges. While it remains unclear what the full extent is of the requirements, which may derive from regulation of stormwater at Hudson pursuant to an individual NJPDES permit, to the extent Power is required to reduce or eliminate the exposure of coal to stormwater, or required to construct technologies preventing the discharge of stormwater to surface water or groundwater, those costs could be material.
New Generation and Development
Nuclear
Power has approved the expenditure of $192 million for steam path retrofit and related upgrades at Peach Bottom Units 2 and 3. Completion of these upgrades is expected to result in an increase of Power’s share of nominal capacity by 32 MW (14 MW at Unit 3 in 2011 and 18 MW at Unit 2 in 2012). Significant project expenditures will begin in 2009 and continue through 2012.
Connecticut
Power has been selected by the Connecticut Department of Public Utility Control in a regulatory process to build 130 MW of gas-fired peaking capacity. Final approval has been received and construction is expected to commence June 2011. The project is expected to be in-service by June 2012. Power estimates the cost of these generating units to be $130 million to $140 million. Total capitalized expenditures to date are $12 million which are included in Other Noncurrent Assets in Power’s and PSEG’s Consolidated Balance Sheets.
Basic Generation Service (BGS) and Basic Gas Supply Service (BGSS)
PSE&G obtains its electric supply requirements for customers who do not purchase electric supply from third-party suppliers through the annual New Jersey BGS auctions. Pursuant to applicable BPU rules, PSE&G enters into the Supplier Master Agreement (SMA) with the winners of these BGS auctions following the BPU’s approval of the auction results. PSE&G has entered into contracts with Power, as well as with other winning BGS suppliers, to purchase BGS for PSE&G’s load requirements. The winners of the auction are responsible for fulfilling all the requirements of a PJM Interconnection L.L.C. (PJM) Load Serving Entity including the provision of capacity, energy, ancillary services, transmission and any other services required by PJM. BGS suppliers assume all volume risk and customer migration risk and must satisfy New Jersey’s renewable portfolio standards.
135
NOTES TO CONSOLIDATED FINANCIAL STATEMENTS
Power seeks to mitigate volatility in its results by contracting in advance for the sale of most of its anticipated electric output as well as its anticipated fuel needs. As part of its objective, Power has entered into contracts to directly supply PSE&G and other New Jersey electric distribution companies (EDCs) with a portion of their respective BGS requirements through the New Jersey BGS auction process, described above. In addition to the BGS-related contracts, Power also enters into firm supply contracts with EDCs, as well as other firm sales and commitments.
PSE&G has contracted for its anticipated BGS-Fixed Price load, as follows:
| | | | | | | | |
| | Auction Year |
| | 2006 | | 2007 | | 2008 | | 2009 |
36-Month Terms Ending | | | | May 2009 | | | | | May 2010 | | | | | May 2011 | | | | | May 2012 | (a) | |
Load (MW) | | | | 2,882 | | | | | 2,758 | | | | | 2,840 | | | | | 2,840 | |
$ per kWh | | | | 0.10251 | | | | | 0.09888 | | | | | 0.11150 | | | | | 0.10372 | |
|
(a) | | | | Prices set in the February 2009 BGS Auction will become effective on June 1, 2009 when the 2006 Auction Year agreements expire. |
PSE&G has a full requirements contract with Power to meet the gas supply requirements of PSE&G’s gas customers. The contract extends through March 31, 2012, and year-to-year thereafter. Power has entered into hedges for a portion of these anticipated BGSS obligations, as permitted by the BPU. The BPU permits PSE&G to recover the cost of gas hedging up to 115 billion cubic feet or 80% of its residential gas supply annual requirements through the BGSS tariff. For additional information, see Note 21. Related-Party Transactions.
Minimum Fuel Purchase Requirements
Power has fuel purchase commitments for coal and oil for certain of its fossil generation stations through various long-term commitments for supply of nuclear fuel for the Salem and Hope Creek nuclear generating stations and for firm transportation and storage capacity for natural gas.
Power’s various multi-year contracts for firm transportation and storage capacity for natural gas are primarily to meet its gas supply obligations to PSE&G. These purchase obligations are consistent with Power’s strategy to enter into contracts for its fuel supply in comparable volumes to its sales contracts.
Power’s strategy is to maintain certain levels of uranium concentrates and uranium hexafluoride in inventory and to make periodic purchases to support such levels. As such, the commitments referred to below include estimated quantities to be purchased that are in excess of contractual minimum quantities.
Power’s nuclear fuel commitments cover approximately 100% of its estimated uranium, enrichment and fabrication requirements through 2011 and a portion for 2012 and 2013 at Salem, Hope Creek and Peach Bottom.
136
NOTES TO CONSOLIDATED FINANCIAL STATEMENTS
Power’s contracts for coal include a long-term contract with a market-indexed price with an Indonesian supplier. Estimated pricing for that contract has been included in the table below through 2011. As of December 31, 2008, the total minimum purchases, which include some market-based pricing components, are as follows:
| | | | Fuel Type | | Commitments
through 2013 | | Power’s share |
Nuclear Fuel | | Millions |
Uranium | | | $ | | 704 | | | | $ | | 441 | |
Enrichment | | | $ | | 508 | | | | $ | | 302 | |
Fabrication | | | $ | | 245 | | | | $ | | 149 | |
Natural Gas | | | $ | | 969 | | | | $ | | 969 | |
Coal/Oil | | | $ | | 939 | | | | $ | | 939 | |
The generation facilities of PSEG Texas have entered into gas supply agreements for the anticipated fuel requirements to satisfy obligations under their forward energy sales contracts. As of December 31, 2008, PSEG Texas’ fuel purchase commitments were $94 million which support its contracted energy sales.
Regulatory Proceedings
Competition Act
In April 2007, PSE&G and Transition Funding were served with a copy of a purported class action complaint (Complaint) in New Jersey Superior Court challenging the constitutional validity of certain stranded cost recovery provisions of the Competition Act, seeking injunctive relief against continued collection from PSE&G’s electric customers of the Transition Bond Charge (TBC) of Transition Funding, as well as recovery of TBC amounts previously collected. Under New Jersey law, the Competition Act, enacted in 1999, is presumed constitutional.
In July 2007, the plaintiff filed an amended Complaint to also seek injunctive relief from continued collection of related taxes as well as recovery of such taxes previously collected. In July 2007, PSE&G filed a motion to dismiss the amended Complaint, or, in the alternative, for summary judgment. In October 2007, PSE&G’s and Transition Funding’s motion to dismiss the Amended Complaint was granted. In November 2007, the plaintiff filed a notice of appeal with the Appellate Division of the New Jersey Superior Court. In February 2009, the Appellate Court affirmed the decision dismissing the case.
In July 2007, the same plaintiff also filed a petition with the BPU requesting review and adjustment to PSE&G’s recovery of the same stranded cost charges. In September 2007, PSE&G filed a motion with the BPU to dismiss the petition, which remains pending.
BPU Deferral Audit
The BPU Energy and Audit Division conducts audits of deferred balances under various adjustment clauses. A draft Deferral Audit—Phase II report relating to the 12-month period ended July 31, 2003 was released by the consultant to the BPU in April 2005.
That report, which addresses SBC, MTC and non-utility generation (NUG) deferred balances, found that, while the Phase II deferral balances complied in all material respects with applicable BPU Orders, it noted that the BPU Staff had raised certain questions with respect to the reconciliation method PSE&G had employed in calculating the overrecovery of its MTC and other charges during the Phase I and Phase II four-year transition period. The matter was referred to the Office of Administrative Law. The amount in dispute is $114 million, which if required to be refunded to customers with interest through December 2008, would be $140 million.
Hearings before an Administrative Law Judge (ALJ) were held in July 2008. In January 2009, the ALJ issued a decision which upheld PSE&G’s central contention that the 2004 BPU Order approving the Phase I settlement resolved the issues being raised by the Staff and Advocate, and that these issues should not be
137
NOTES TO CONSOLIDATED FINANCIAL STATEMENTS
subject to re-litigation in respect of the first three years of the transition period. The ALJ’s decision stated that the BPU could elect to convene a separate proceeding to address the fourth and final year reconciliation of MTC recoveries. The amount in dispute with respect to this Phase II period is approximately $50 million.
Exceptions to the ALJ’s decision were filed on February 9, 2009. The BPU may choose to accept, modify or reject the ALJ’s decision in reaching its final decision. We do not expect a final BPU order before March 2009 and cannot predict the final outcome of this proceeding.
New Jersey Clean Energy Program
In the third quarter of 2008, the BPU approved funding requirements for each New Jersey utility applicable to its Renewable Energy and Energy Efficiency programs for the years 2009 to 2012. The aggregate funding amount is $1.2 billion for all years. PSE&G’s share of the $1.2 billion program is $705 million, bringing the total liability through 2012 to $748 million. PSE&G has recorded a discounted liability of $674 million as of December 31, 2008. Of this amount, $142 million was recorded as a current liability and $532 million as a noncurrent liability. The liability has been recorded with an offsetting Regulatory Asset, since the costs associated with this program are expected to be recovered from PSE&G ratepayers through the SBC.
Leveraged Lease Investments
In November 2006, the IRS issued Revenue Agent’s Reports with respect to its audit of PSEG’s federal corporate income tax returns for tax years 1997 through 2000, which disallowed all deductions associated with certain lease transactions that are similar to a type that the IRS publicly announced its intention to challenge. In addition, the IRS Reports proposed a 20% penalty for substantial understatement of tax liability. In February 2007, PSEG filed a protest of these findings with the Office of Appeals of the IRS.
In April 2008, the IRS issued its Revenue Agent’s Report for tax years 2001 through 2003, which disallowed all deductions associated with lease transactions similar to those disallowed in its 1997 through 2000 Report. As in its prior report, the IRS proposed a 20% penalty. PSEG also filed a protest to this report with the Office of Appeals of the IRS.
As of December 31, 2008 and December 31, 2007, PSEG’s total gross investment in such transactions was $1 billion and $1.5 billion, respectively.
PSEG believes that its tax position related to these transactions was proper based on applicable statutes, regulations and case law in effect at the time that the deductions were taken. There are several tax cases involving other taxpayers with similar leveraged lease investments that are pending. To date, three cases have been decided at the trial court level, two of which were decided in favor of the government. An appeal of one of these decisions was affirmed. The third case involves a jury verdict that is currently being challenged by both parties on inconsistency grounds.
In August 2008, the IRS publicly announced that it was issuing letters to a number of taxpayers with these types of lease transactions containing a generic settlement offer. PSEG did not accept the IRS’ settlement offer and will likely proceed to litigation.
Earnings Impact
As a result of the recent court decisions regarding these types of leveraged lease transactions, PSEG evaluated its unrecognized tax benefits under FIN 48 and recorded an after-tax increase to the interest reserve of $158 million during 2008.
Assuming all rental payments are made pursuant to the original lease agreement, and there are no changes in tax legislation and rates, the total cash and income included in a leveraged lease transaction will not change over the lease term. However, the timing of the cash flow can change due to changes in the timing of tax deductions. Changes in the timing of cash flows affect the overall return, or yield, that is recorded as income at a constant rate throughout the lease term. If there is a change in cash flow timing, pursuant to FSP 13-2, “Accounting for a Change or Projected Change in the Timing of Cash Flows Relating to Income
138
NOTES TO CONSOLIDATED FINANCIAL STATEMENTS
Taxes Generated by a Leveraged Lease Transaction,” the lease must be recalculated from inception assuming the new lease yield. Differences between the current gross lease investment and the gross lease investment per the recalculated lease must be recognized immediately in income.
In the second quarter of 2008, PSEG recalculated its lease transactions, incorporating potential cash payments (discussed below) consistent with the FIN 48 reserve position, and recorded an after-tax charge of $355 million. This charge is reflected as a reduction in Operating Revenues of $485 million with a partially offsetting reduction in Income Tax Expense of $130 million in PSEG’s Condensed Consolidated Statement of Operations. The $355 million will be recognized as income over the remaining term of the affected leases. For the second half of 2008, the additional reduction of Operating Revenues was $20 million with a partially offsetting reduction in Income Tax Expense of $5 million, resulting in a net after-tax income reduction of $15 million.
This represents PSEG’s view of most of the financial statement exposure related to these lease transactions, although a total loss, consistent with the broad settlement offer recently proposed by the IRS, would result in an additional earnings charge of $110 million to $130 million.
Cash Impact
As of December 31, 2008, an aggregate $1.2 billion would become currently payable if PSEG conceded 100% of deductions taken through that date. Through December 2008, PSEG deposited $180 million with the IRS to defray potential interest costs associated with this disputed tax liability. In the event PSEG is successful in defense of its position, the deposit is fully refundable with interest. These deposits reduce the $1.2 billion cash exposure noted above to $1 billion. As of December 31, 2008, penalties of $151 million would also become payable if the IRS was successful in its deficiency claims against PSEG, and asserted and successfully litigated a case against PSEG regarding penalties. PSEG has not established a reserve for penalties because it believes it has strong defenses to the assertion of penalties under applicable law. Interest and penalty exposure grow at the rate of $15 million per quarter. Should PSEG lose its case in litigation, and the IRS is successful in a litigated case consistent with the positions it has taken in the generic settlement offer recently proposed, an additional $130 million to $150 million of tax would be due for tax positions through December 31, 2008.
Based on the status of discussions with the IRS, and considering developments in other cases, PSEG currently anticipates that it will pay between $230 million and $370 million in tax, interest and penalties for the tax years 1997-2000 during the second half of 2009 and subsequently commence litigation to recover these amounts. Further it is possible that an additional payment of between $270 million and $550 million could be required in late 2009 for tax years 2001-2003 followed by further litigation to recover those taxes. These amounts are in addition to tax deposits already made.
The actions described above concerning the leveraged lease investments are not expected to violate any covenant or result in a default under either Energy Holdings’ credit facility or Senior Notes indenture.
139
NOTES TO CONSOLIDATED FINANCIAL STATEMENTS
Minimum Lease Payments
PSEG and Power have entered into capital leases for administrative office space. The total future minimum payments and present value of these capital leases as of December 31, 2008 are:
| | | | |
| | Power | | Other |
| | Millions |
2009 | | | $ | | 1 | | | | $ | | 7 | |
2010 | | | | 1 | | | | | 7 | |
2011 | | | | 2 | | | | | 7 | |
2012 | | | | 2 | | | | | 7 | |
2013 | | | | 2 | | | | | 8 | |
Thereafter | | | | 3 | | | | | 13 | |
| | | | |
Total Minimum Lease Payments | | | | 11 | | | | | 49 | |
Less: Imputed Interest | | | | (2 | ) | | | | | (15 | ) | |
| | | | |
Present Value of Net Minimum Lease Payments | | | $ | | 9 | | | | $ | | 34 | |
| | | | |
Power has entered into a one year operating lease for plant output requiring minimum lease payments of $39 million through 2009.
PSE&G has leased administrative office space under various operating leases. Total future minimum lease payments as of December 31, 2008 are $14 million.
140
NOTES TO CONSOLIDATED FINANCIAL STATEMENTS
Note 12. Schedule of Consolidated Debt
Long-Term Debt
| | | | | | |
| | Maturity | | As of December 31, |
| | 2008 | | 2007 |
| | | | Millions |
PSEG (Parent) | | | | | | |
Senior Note—6.89% | | | | 2008–2009 | | | | $ | | 49 | | | | $ | | 98 | |
Senior Note—4.66% | | 2009 | | | | 200 | | | | | 200 | |
| | | | | | |
Principal Amount Outstanding | | | | | | 249 | | | | | 298 | |
Amounts Due Within One Year | | | | | | (249 | ) | | | | | (49 | ) | |
| | | | | | |
Total Long-Term Debt of PSEG (Parent) | | | | | $ | | — | | | | $ | | 249 | |
| | | | | | |
| | | | | | |
| | Maturity | | As of December 31, |
| | 2008 | | 2007 |
| | | | Millions |
Power | | | | | | |
Senior Notes: | | | | | | |
3.75% | | | | 2009 | | | | $ | | 250 | | | | $ | | 250 | |
7.75% | | | | 2011 | | | | | 800 | | | | | 800 | |
6.95% | | | | 2012 | | | | | 600 | | | | | 600 | |
5.00% | | | | 2014 | | | | | 250 | | | | | 250 | |
5.50% | | | | 2015 | | | | | 300 | | | | | 300 | |
8.63% | | | | 2031 | | | | | 500 | | | | | 500 | |
| | | | | | |
Total Senior Notes | | | | | | 2,700 | | | | | 2,700 | |
Pollution Control Notes: | | | | | | |
5.00% | | | | 2012 | | | | | 66 | | | | | 66 | |
5.50% | | | | 2020 | | | | | 14 | | | | | 14 | |
5.85% | | | | 2027 | | | | | 19 | | | | | 19 | |
5.75% | | | | 2031 | | | | | 25 | | | | | 25 | |
5.75% | | | | 2037 | | | | | 40 | | | | | 40 | |
4.00% | | | | 2042 | | | | | 44 | | | | | 44 | |
| | | | | | |
Total Pollution Control Notes | | | | | | 208 | | | | | 208 | |
Amounts Due Within One Year | | | | | | (250 | ) | | | | | — | |
Net Unamortized Discount | | | | | | (5 | ) | | | | | (6 | ) | |
| | | | | | |
Total Long-Term Debt of Power | | | | | $ | | 2,653 | | | | $ | | 2,902 | |
| | | | | | |
141
NOTES TO CONSOLIDATED FINANCIAL STATEMENTS
| | | | | | |
| | Maturity | | As of December 31, |
| | 2008 | | 2007 |
| | | | Millions |
PSE&G | | | | | | |
First and Refunding Mortgage Bonds: | | | | | | |
Libor + .875% | | | | 2010 | | | | | 300 | | | | | — | |
6.75% | | | | 2016 | | | | | 171 | | | | | 171 | |
6.45% | | | | 2019 | | | | | 5 | | | | | 5 | |
9.25% | | | | 2021 | | | | | 134 | | | | | 134 | |
6.38% | | | | 2023 | | | | | — | | | | | 157 | |
5.20% | | | | 2025 | | | | | 23 | | | | | 23 | |
Floating Rate (B) | | | | 2028–2033 | | | | | 100 | | | | | 494 | |
5.45% | | | | 2032 | | | | | 50 | | | | | 50 | |
6.40% | | | | 2032 | | | | | 100 | | | | | 100 | |
8.00% | | | | 2037 | | | | | 7 | | | | | 7 | |
5.00% | | | | 2037 | | | | | 8 | | | | | 8 | |
Medium-Term Notes: | | | | | | |
4.00% | | | | 2008 | | | | | — | | | | | 250 | |
8.16% | | | | 2009 | | | | | 16 | | | | | 16 | |
8.10% | | | | 2009 | | | | | 44 | | | | | 44 | |
5.13% | | | | 2012 | | | | | 300 | | | | | 300 | |
5.00% | | | | 2013 | | | | | 150 | | | | | 150 | |
5.38% | | | | 2013 | | | | | 300 | | | | | 300 | |
6.33% | | | | 2013 | | | | | 275 | | | | | — | |
5.00% | | | | 2014 | | | | | 250 | | | | | 250 | |
5.30% | | | | 2018 | | | | | 400 | | | | | — | |
7.04% | | | | 2020 | | | | | 9 | | | | | 9 | |
7.18% | | | | 2023 | | | | | 5 | | | | | 5 | |
7.15% | | | | 2023 | | | | | 34 | | | | | 34 | |
5.25% | | | | 2035 | | | | | 250 | | | | | 250 | |
5.70% | | | | 2036 | | | | | 250 | | | | | 250 | |
5.80% | | | | 2037 | | | | | 350 | | | | | 350 | |
| | | | | | |
Principal Amount Outstanding | | | | | | 3,531 | | | | | 3,357 | |
Amounts Due Within One Year | | | | | | (60 | ) | | | | | (250 | ) | |
Net Unamortized Discount | | | | | | (8 | ) | | | | | (5 | ) | |
| | | | | | |
Total Long-Term Debt of PSE&G (excluding Transition Funding and Transition Funding II) | | | | | | 3,463 | | | | | 3,102 | |
| | | | | | |
142
NOTES TO CONSOLIDATED FINANCIAL STATEMENTS
| | | | | | |
| | Maturity | | As of December 31, |
| | 2008 | | 2007 |
| | | | Millions |
Transition Funding (PSE&G) |
Securitization Bonds: | | | | | | |
Swap to 5.66% | | | | 2009 | | | | | 82 | | | | | 251 | |
6.45% | | | | 2011 | | | | | 328 | | | | | 328 | |
6.61% | | | | 2013 | | | | | 454 | | | | | 454 | |
6.75% | | | | 2014 | | | | | 220 | | | | | 220 | |
6.89% | | | | 2015 | | | | | 370 | | | | | 370 | |
| | | | | | |
Principal Amount Outstanding | | | | | | 1,454 | | | | | 1,623 | |
Amounts Due Within One Year | | | | | | (178 | ) | | | | | (169 | ) | |
| | | | | | |
Total Securitization Debt of Transition Funding | | | | | | 1,276 | | | | | 1,454 | |
| | | | | | |
Transition Funding II (PSE&G) |
Securitization Bonds: | | | | | | |
4.18% | | | | 2007–2008 | | | | | — | | | | | 8 | |
4.34% | | | | 2008–2012 | | | | | 33 | | | | | 35 | |
4.49% | | | | 2013 | | | | | 20 | | | | | 20 | |
4.57% | | | | 2015 | | | | | 23 | | | | | 23 | |
| | | | | | |
Principal Amount Outstanding | | | | | | 76 | | | | | 86 | |
Amounts Due Within One Year | | | | | | (10 | ) | | | | | (10 | ) | |
| | | | | | |
Total Securitization Debt of Transition Funding II | | | | | | 66 | | | | | 76 | |
| | | | | | |
Total Long-Term Debt of PSE&G | | | | | $ | | 4,805 | | | | $ | | 4,632 | |
| | | | | | |
| | | | | | |
| | Maturity | | As of December 31, |
| | 2008 | | 2007 |
| | | | Millions |
Energy Holdings | | | | | | |
Senior Notes: | | | | | | |
8.63% | | | | 2008 | | | | $ | | — | | | | $ | | 207 | |
10.00% | | | | 2009 | | | | | — | | | | | 400 | |
8.50% | | | | 2011 | | | | | 505 | | | | | 530 | |
| | | | | | |
Principal Amount Outstanding | | | | | | 505 | | | | | 1,137 | |
Amounts Due Within One Year | | | | | | — | | | | | (607 | ) | |
| | | | | | |
Total Senior Notes | | | | | | 505 | | | | | 530 | |
| | | | | | |
Non-Recourse Project Debt (A): |
Global—Floating Rate (C) | | | | 2008–2009 | | | | | 280 | | | | | 330 | |
Resources—4.75% to 8.75% | | | | 2008–2016 | | | | | 33 | | | | | 36 | |
EGDC—8.27% | | | | 2008–2013 | | | | | 15 | | | | | 17 | |
| | | | | | |
Principal Amount Outstanding | | | | | | 328 | | | | | 383 | |
Amounts Due Within One Year | | | | | | (286 | ) | | | | | (37 | ) | |
| | | | | | |
Total Non-Recourse Project Debt | | | | | | 42 | | | | | 346 | |
| | | | | | |
Total Long-Term Debt of Energy Holdings | | | | | $ | | 547 | | | | $ | | 876 | |
| | | | | | |
143
NOTES TO CONSOLIDATED FINANCIAL STATEMENTS
|
(A) | | | | Non-recourse financing transactions consist of loans from banks and other lenders that are typically secured by project assets and cash flows and generally impose no material obligation on the parent-level investor to repay any debt incurred by the project borrower. The consequences of permitting a project-level default include the potential for loss of any invested equity by the parent. However, in some cases, certain obligations relating to the investment being financed, including additional equity commitments, may be guaranteed by PSEG Global L.L.C. and/or Energy Holdings for their respective subsidiaries. PSEG does not provide guarantees or credit support to Energy Holdings or its subsidiaries. |
|
(B) | | | | The coupon rate ranges from 0.75% to 1.25% as of December 31, 2008. The coupon rate for $50 million resets on a weekly basis whereas the coupon rates for the remaining $50 million are in commercial paper mode and therefore change from time to time. |
|
(C) | | | | The floating rates consist of 3 month Libor plus 2.38% and 3 month Libor plus 3.25%. |
Long-Term Debt Maturities
The aggregate principal amounts of maturities for each of the five years following December 31, 2008 are as follows:
| | | | | | | | | | | | | | | | |
Year | | PSEG
(Parent) | | Power | | PSE&G | | Energy Holdings | | Total |
| | PSE&G | | Transition
Funding | | Transition
Funding II | | Senior
Notes | | Non-
Recourse
Debt |
| | Millions |
2009 | | | $ | | 249 | | | | $ | | 250 | | | | $ | | 60 | | | | $ | | 178 | | | | $ | | 10 | | | | $ | | — | | | | $ | | 286 | | | | $ | | 1,033 | |
2010 | | | | — | | | | | — | | | | | 300 | | | | | 186 | | | | | 11 | | | | | — | | | | | 23 | | | | | 520 | |
2011 | | | | — | | | | | 800 | | | | | — | | | | | 195 | | | | | 11 | | | | | 505 | | | | | 3 | | | | | 1,514 | |
2012 | | | | — | | | | | 666 | | | | | 300 | | | | | 204 | | | | | 12 | | | | | — | | | | | 4 | | | | | 1,186 | |
2013 | | | | — | | | | | — | | | | | 725 | | | | | 214 | | | | | 12 | | | | | — | | | | | 3 | | | | | 954 | |
Thereafter | | | | — | | | | | 1,192 | | | | | 2,146 | | | | | 477 | | | | | 20 | | | | | — | | | | | 9 | | | | | 3,844 | |
| | | | | | | | | | | | | | | | |
| | | $ | | 249 | | | | $ | | 2,908 | | | | $ | | 3,531 | | | | $ | | 1,454 | | | | $ | | 76 | | | | $ | | 505 | | | | $ | | 328 | | | | $ | | 9,051 | |
| | | | | | | | | | | | | | | | |
Long-Term Debt Financing Transactions
During 2008, PSEG and its subsidiaries had the following Long-Term Debt issuances, maturities and redemptions.
PSEG
|
• | | | | Paid $49 million of its 6.89% Senior Notes in October. |
PSE&G
| | | Issued $300 million of Floating Rate Bonds (Libor + 0.875%) due March 2010 in March. | |
• | | | | Paid $157 million of 6.375% Mortgage Bonds, Series YY due 2023 and $32 million premium to settle the related remarketing option in May. |
|
• | | | | Issued $400 million of 5.30% MTNs, Series E due May 2018 in April. |
|
• | | | | Paid $250 million of 4.00% MTNs at maturity in November. |
|
• | | | | Issued $275 million of 6.33% MTNs, Series F, due November 2013 in December. |
144
NOTES TO CONSOLIDATED FINANCIAL STATEMENTS
|
• | | | | Purchased $494 million of tax-exempt variable rate bonds of the Pollution Control Financing Authority of Salem County (Salem County Authority Bonds) from February through April. These bonds are serviced and secured by like principal amount of PSE&G’s pollution control Mortgage Bonds and were held by the broker/dealer or tendered by bondholders upon conversion of the bonds to a weekly interest rate mode, which were serviced and secured by $494 million of variable rate pollution control notes. |
|
• | | | | Remarketed $100 million of Salem County Authority Bonds as letter of credit-backed variable rate demand bonds in November. |
|
• | | | | Paid a total of $169 million of Transition Funding’s securitization debt. |
|
• | | | | Paid a total of $10 million of Transition Funding II’s securitization debt. |
Energy Holdings
|
• | | | | Repurchased a total of $25 million of the outstanding $530 million 8.50% Senior Notes due 2011. |
|
• | | | | Redeemed $207 million of 8.625% Senior Notes at maturity in February. |
|
• | | | | Redeemed $400 million of 10% Senior Notes due in 2009 in January. |
|
• | | | | Paid net premiums of $47 million related to the early redemption of its Senior Notes. |
|
• | | | | Paid a total of $56 million of non-recourse project debt, primarily related to its Texas facilities. |
In January 2009, Power converted its $44 million 4.00% Pollution Control Bonds to letter of credit backed variable rate demand bonds.
Power also established a program for the issuance of up to $500 million of unsecured medium-term notes (MTNs) to retail investors in January 2009. As of January 30, 2009, Power had issued $161 million of 6.5% MTNs due January 2014 (callable in one year) and $48 million of 6% MTNs due January 2013 (callable in one year).
In February 2009, Energy Holdings issued a par call notice for the early redemption of its remaining $280 million outstanding non-recourse project debt associated with its Texas assets. The debt, which is due on December 31, 2009, is expected to be redeemed by the end of February 2009.
145
NOTES TO CONSOLIDATED FINANCIAL STATEMENTS
Short-Term Liquidity
As of December 31, 2008, PSEG, Power and PSE&G had the following credit facilities. Each of the facilities is restricted as to availability and use to the specific companies as listed below. PSEG, Power and PSE&G each believes sufficient liquidity exists to fund its respective short-term cash requirements.
| | | | | | | | | | |
Company/Facility | | As of December 31, 2008 | | Primary Purpose |
| | Total
Facility | | Usage | | Available
Liquidity | | Expiration
Date |
Millions |
PSEG: | | | | | | | | | | |
5-year Credit Facility (A) | | | $ | | 1,000 | | | | $ | | 13 | (B) | | | | $ | | 987 | | | Dec 2012 | | CP Support/Funding/ Letters of Credit |
Bilateral Credit Facility | | | | 100 | | | | | — | | | | | 100 | | | June 2009 | | CP Support/Funding |
Uncommitted Bilateral Agreement | | | | N/A | | | | | — | | | | | N/A | | | N/A | | Funding |
| | | | | | | | | | |
Total PSEG | | | $ | | 1,100 | | | | $ | | 13 | | | | $ | | 1,087 | | | | | |
| | | | | | | | | | |
Power: | | | | | | | | | | |
5-year Credit Facility (A) | | | $ | | 1,600 | | | | $ | | 222 | (B) | | | | $ | | 1,378 | | | Dec 2012 | | Funding/Letters of Credit |
Bilateral Credit Facility | | | | 100 | | | | | — | (B) | | | | | 100 | | | June 2009 | | Funding/Letters of Credit |
Bilateral Credit Facility | | | | 150 | | | | | 52 | (B) | | | | | 98 | | | March 2009 | | Funding/Letters of Credit |
Bilateral Credit Facility | | | | 100 | | | | | 14 | (B) | | | | | 86 | | | March 2010 | | Funding/Letters of Credit |
Bilateral Credit Facility | | | | 50 | | | | | — | (B) | | | | | 50 | | | Sep 2009 | | Funding |
| | | | | | | | | | |
Total Power | | | $ | | 2,000 | | | | $ | | 288 | | | | $ | | 1,712 | | | | | |
| | | | | | | | | | |
PSE&G: | | | | | | | | | | |
5-year Credit Facility (A) | | | $ | | 600 | | | | $ | | 20 | | | | $ | | 580 | | | June 2012 | | CP Support/Funding/ Letters of Credit |
Uncommitted Bilateral Agreement | | | | N/A | | | | | — | | | | | N/A | | | N/A | | Funding |
| | | | | | | | | | |
Total PSE&G | | | $ | | 600 | | | | $ | | 20 | | | | $ | | 580 | | | | | |
| | | | | | | | | | |
Energy Holdings | | | | | | | | | | |
5-year Credit Facility | | | $ | | 136 | | | | $ | | 21 | (B) | | | | $ | | 115 | | | June 2010 | | Funding/Letters of Credit |
| | | | | | | | | | |
Total | | | $ | | 3,836 | | | | $ | | 342 | | | | $ | | 3,494 | | | | | |
| | | | | | | | | | |
|
(A) | | | | In 2012, facilities reduce by $47 million, $75 million, and $28 million for PSEG, Power and PSE&G, respectively. |
|
(B) | | | | These amounts relate to letters of credit outstanding. |
146
NOTES TO CONSOLIDATED FINANCIAL STATEMENTS
Fair Value of Debt
The estimated fair values were determined using the market quotations or values of instruments with similar terms, credit ratings, remaining maturities and redemptions as of December 31, 2008 and 2007.
| | | | | | | | |
| | December 31, 2008 | | December 31, 2007 |
| | Carrying
Amount | | Fair
Value | | Carrying
Amount | | Fair
Value |
| | Millions |
Long-Term Debt: | | | | | | | | |
PSEG (Parent) | | | $ | | 249 | | | | $ | | 250 | | | | $ | | 298 | | | | $ | | 299 | |
Power | | | | 2,903 | | | | | 2,800 | | | | | 2,902 | | | | | 3,106 | |
PSE&G | | | | 3,523 | | | | | 3,569 | | | | | 3,352 | | | | | 3,370 | |
Transition Funding (PSE&G) | | | | 1,454 | | | | | 1,658 | | | | | 1,623 | | | | | 1,792 | |
Transition Funding II (PSE&G) | | | | 76 | | | | | 80 | | | | | 86 | | | | | 87 | |
Energy Holdings: | | | | | | | | |
Senior Notes | | | | 505 | | | | | 474 | | | | | 1,137 | | | | | 1,204 | |
Project Level, Non-Recourse Debt | | | | 328 | | | | | 328 | | | | | 383 | | | | | 384 | |
| | | | | | | | |
| | | $ | | 9,038 | | | | $ | | 9,159 | | | | $ | | 9,781 | | | | $ | | 10,242 | |
| | | | | | | | |
Note 13. Schedule of Consolidated Capital Stock and Other Securities
| | | | | | | | |
| | Outstanding
Shares | | Redemption
Price
Per Share | | As of December 31, |
| | Book Value |
| | 2008 | | 2007 |
| | | | | | Millions |
PSEG Common Stock (no par value) (A) | | | | | | | | |
Authorized 1,000,000,000 shares; (outstanding as of December 31, 2007, 508,523,004 shares) | | | | 506,017,898 | | | | | | $ | | 4,175 | | | | $ | | 4,254 | |
| | | | | | | | |
PSE&G Cumulative Preferred Stock (B) without Mandatory Redemption (C) $100 par value series | | | | | | | | |
4.08% | | | | 146,221 | | | | $ | | 103.00 | | | | $ | | 15 | | | | $ | | 15 | |
4.18% | | | | 116,958 | | | | $ | | 103.00 | | | | | 12 | | | | | 12 | |
4.30% | | | | 149,478 | | | | $ | | 102.75 | | | | | 15 | | | | | 15 | |
5.05% | | | | 104,002 | | | | $ | | 103.00 | | | | | 10 | | | | | 10 | |
5.28% | | | | 117,864 | | | | $ | | 103.00 | | | | | 12 | | | | | 12 | |
6.92% | | | | 160,711 | | | | $ | | 102.08 | | | | | 16 | | | | | 16 | |
| | | | | | | | |
Total Preferred Stock without Mandatory Redemption | | | | 795,234 | | | | | | $ | | 80 | | | | $ | | 80 | |
| | | | | | | | |
|
(A) | | | | For the years ended December 31, 2007 and 2006, PSEG issued 0.8 million and 2.1 million of additional shares for $35 million and $67 million, respectively, under the Dividend Reinvestment and Stock Purchase Plan (DRASPP) and the Employee Stock Purchase Plan (ESPP). PSEG did not issue any new shares under these plans in 2008. Total authorized and unissued shares of common stock available for issuance through PSEG’s DRASPP, ESPP and various employee benefit plans amounted to 7.0 million shares as of December 31, 2008. |
147
NOTES TO CONSOLIDATED FINANCIAL STATEMENTS
|
(B) | | | | As of December 31, 2008, there was an aggregate of 6.7 million shares of $100 par value and 10 million shares of $25 par value Cumulative Preferred Stock, which were authorized and unissued and which, upon issuance, may or may not provide for mandatory sinking fund redemption. If dividends upon any shares of Preferred Stock are in arrears for four consecutive quarters, holders receive voting rights for the election of a majority of PSE&G’s Board of Directors. Such voting rights continue until all accumulated and unpaid dividends thereon have been paid, whereupon all such voting rights cease. There are no arrearages in cumulative preferred stock and no voting rights for preferred shares currently exist. No preferred stock agreement contains any liquidation preferences in excess of par values or any ‘deemed’ liquidation events. |
|
(C) | | | | As of each of December 31, 2008 and 2007, the annual dividend requirement and the embedded dividend rate for PSE&G’s Preferred Stock without Mandatory Redemption was $4 million and 5.03%, respectively. |
Fair Value of Preferred Securities
The estimated fair value of PSE&G’s Cumulative Preferred Stock was $66 million and $68 million as of December 31, 2008 and 2007, respectively. The estimated fair value was determined using market quotations.
Note 14. Financial Risk Management Activities
The operations of PSEG, Power and PSE&G are exposed to market risks from changes in commodity prices, interest rates and equity prices that could affect their results of operations and financial condition. Exposure to these risks is managed through normal operating and financing activities and, when appropriate, through hedging transactions. Hedging transactions use derivative instruments to create a relationship in which changes to the value of the assets, liabilities or anticipated transactions exposed to market risks are expected to be offset by changes in the value of these derivative instruments.
Commodity Prices
The availability and price of energy commodities are subject to fluctuations due to weather, environmental policies, changes in supply and demand, state and federal regulatory policies, market conditions, transmission availability and other events.
Power and Energy Holdings use physical and financial transactions in the wholesale energy markets to mitigate the effects of adverse movements in the fuel and electricity prices. Contracts that do not qualify for hedge accounting are marked to market in accordance with SFAS 133, with changes in fair value charged to the income statement. The fair value for the majority of these contracts is obtained from quoted market sources. Modeling techniques using assumptions reflective of current market rates, yield curves and forward prices are used to interpolate certain prices when no quoted market exists. The effect of using such modeling techniques is not material to Power’s or Energy Holdings’ financial statements.
Cash Flow Hedges
Power uses forward sale and purchase contracts, swaps, options and financial transmission right contracts to hedge:
| | | forecasted energy sales from its generation stations and the related load obligations; and | |
• | | | | the price of fuel to meet its fuel purchase requirements. |
Energy Holdings uses forward sale and purchase contracts and swaps to hedge:
|
• | | | | forecasted energy sales from one of its Texas generation stations; and |
|
• | | | | to hedge the price of fuel. |
148
NOTES TO CONSOLIDATED FINANCIAL STATEMENTS
These derivative transactions are designated and effective as cash flow hedges under SFAS 133. As of December 31, 2008 and 2007, the fair value and the impact on Accumulated Other Comprehensive Loss associated with these hedges was as follows:
| | | | |
| | December 31, |
| | 2008 | | 2007 |
Power | | Millions |
Fair Values of Cash Flow Hedges | | | $ | | 320 | | | | $ | | (427 | ) | |
Impact on Accumulated Other Comprehensive Loss (after tax) | | | $ | | 176 | | | | $ | | (250 | ) | |
|
Energy Holdings | | | | |
Fair Values of Cash Flow Hedges | | | $ | | 3 | | | | $ | | — | |
Impact on Accumulated Other Comprehensive Loss (after tax) | | | $ | | (2 | ) | | | | $ | | — | |
The expiration date of the longest-dated cash flow hedge at Power is in 2011. Power’s after-tax unrealized gains on these derivatives that are expected to be reclassified to earnings during 2009 and 2010 are $110 million and $66 million, respectively. Ineffectiveness associated with these hedges, as defined in SFAS 133, was $23 million at December 31, 2008.
The expiration date of the longest-dated cash flow hedge for Energy Holdings is in 2009. Therefore, substantially all of the after-tax unrealized gains on its commodity derivatives are expected to be reclassified to earnings during 2009. There was no ineffectiveness associated with these hedges.
Other Derivatives
Power and Energy Holdings enter into other contracts that are derivatives, but do not qualify for cash flow hedge accounting.
For Power, most of these contracts are used for fuel purchases for generation requirements and for electricity purchases for contractual sales obligations. A portion is also used in Power’s Nuclear Decommissioning Trust (NDT) Funds.
For Energy Holdings, these are electricity forward and capacity sale contracts entered into to sell a portion of the Texas facilities’ capacity and gas purchase contracts to support the electricity forward sales contracts.
Changes in fair market value of these contracts are recorded in earnings. The fair value of these contracts as of December 31, 2008 and 2007 was as follows:
| | | | |
| | December 31, |
| | 2008 | | 2007 |
| | Millions |
Net Fair Value of Other Derivatives Related to Energy Contracts | | | | |
Power | | | $ | | (9 | ) | | | | $ | | (10 | ) | |
Energy Holdings | | | $ | | 32 | | | | $ | | 63 | |
Interest Rates
PSEG, Power and PSE&G are subject to the risk of fluctuating interest rates in the normal course of business. Exposure to this risk is managed through the use of fixed and floating rate debt and interest rate derivatives.
149
NOTES TO CONSOLIDATED FINANCIAL STATEMENTS
Fair Value Hedges
PSEG uses an interest rate swap to convert Power’s $250 million of 3.75% Senior Notes due April 2009 into variable-rate debt. The interest rate swap is designated and effective as a fair value hedge. The fair value changes of the interest rate swap are fully offset by the fair value changes in the underlying debt.
Cash Flow Hedges
PSE&G and Energy Holdings use interest rate swaps and other derivatives, which are designated and effective as cash flow hedges to manage their exposure to the variability of cash flows, primarily related to variable-rate debt instruments. As of December 31, 2008, there was no hedge ineffectiveness associated with these hedges.
Other Derivatives
Energy Holdings uses interest rate swaps at PSEG Texas to manage exposure to variability of cash flows, primarily related to variable-rate debt instruments. The interest rate derivatives were previously effective as cash flow hedges; however, at September 30, 2008 they were de-designated due to a change in their underlying interest basis.
| | | | |
| | December 31, |
| | 2008 | | 2007 |
Fair Value of Interest Rate Derivatives | | Millions |
Fair Value Hedges—PSEG and Power | | | $ | | — | * | | | | $ | | (2 | ) | |
Cash Flow Hedges—PSE&G (A) | | | $ | | (1 | ) | | | | $ | | (4 | ) | |
Cash Flow Hedges—Energy Holdings | | | $ | | (1 | ) | | | | $ | | (7 | ) | |
Other Derivatives—Energy Holdings(B) | | | $ | | (4 | ) | | | | | N/A | |
|
* | | | | Less than $1 million |
|
(A) | | | | The $(1) and $(4) million as of December 31, 2008 and 2007 are deferred as Regulatory Assets and are expected to be recovered from PSE&G’s customers. |
|
(B) | | | | The fair value of these swaps recorded in Accumulated Other Comprehensive Loss was ($4) million as of December 31, 2008 and is being amortized to earnings over the remaining life of the underlying debt. As of October 1, 2008, the fair value changes of the swaps were being marked to market through earnings and totaled ($5) million through December 31, 2008. |
Note 15. Fair Value Measurements
SFAS 157 defines fair value, establishes a framework for measuring fair value and expands disclosures about fair value measurements. Fair value is the price that would be received to sell an asset or paid to transfer a liability in an orderly transaction between market participants at the measurement date. SFAS 157 emphasizes that fair value is a market-based measurement, not an entity-specific measurement, and establishes a fair value hierarchy that distinguishes between assumptions based on market data obtained from independent sources and those based on an entity’s own assumptions. The hierarchy prioritizes the inputs to fair value measurement into three levels:
Level 1—measurements utilize quoted prices (unadjusted) in active markets for identical assets or liabilities that PSEG has the ability to access. These consist primarily of listed equity securities, exchange traded derivatives and certain U.S. government treasury securities.
Level 2—measurements include quoted prices for similar assets and liabilities in active markets, quoted prices for identical or similar assets or liabilities in markets that are not active, and other observable inputs
150
NOTES TO CONSOLIDATED FINANCIAL STATEMENTS
such as interest rates and yield curves that are observable at commonly quoted intervals. These consist primarily of non-exchange traded derivatives such as forward contracts or options and most fixed income securities.
Level 3—measurements use unobservable inputs for assets or liabilities, are based on the best information available and might include an entity’s own data. In some valuations, the inputs used may fall into different levels of the hierarchy. In these cases, the financial instrument’s level within the fair value hierarchy is based on the lowest level of input that is significant to the fair value measurement. These consist mainly of various financial transmission rights, other longer-term capacity and transportation contracts and certain commingled securities.
In addition to establishing a measurement framework, SFAS 157 nullifies the guidance of EITF 02-3, “Issues Involved in Accounting for Derivative Contracts Held for Trading Purposes and Contracts Involved in Energy Trading and Risk Management Activities,” which did not allow an entity to recognize an unrealized gain or loss at the inception of a derivative instrument unless the fair value of that instrument was obtained from a quoted market price in an active market or was otherwise evidenced by comparison to other observable current market transactions or based on a valuation technique incorporating observable market data. Under EITF 02-3, PSEG Texas had a deferred inception loss of $34 million, pre-tax, as of December 31, 2007 related to a five-year capacity contract at its generation facilities, which was being amortized at $11 million per year through 2010. In accordance with the provisions of SFAS 157, PSEG Texas recorded a cumulative effect adjustment of $21 million after-tax to January 1, 2008 Retained Earnings in its Consolidated Balance Sheet associated with the implementation of SFAS 157.
151
NOTES TO CONSOLIDATED FINANCIAL STATEMENTS
The following table presents information about assets and (liabilities) measured at fair value on a recurring basis at December 31, 2008, including the fair value measurements and the levels of inputs used in determining those fair values. Amounts shown for PSEG include the amounts shown for Power and PSE&G.
| | | | | | | | | | |
| | Recurring Fair Value Measurements as of December 31, 2008 |
Description | | Total | | Cash
Collateral
Netting (F) | | Quoted Market
Prices of
Identical Assets
(Level 1) | | Significant
Other
Observable
Inputs
(Level 2) | | Significant
Unobservable
Inputs
(Level 3) |
| | Millions |
PSEG | | | | | | | | | | |
Assets: | | | | | | | | | | |
Derivative Contracts: | | | | | | | | | | |
Energy Contracts (A) | | | $ | | 356 | | | | $ | | (154 | ) | | | | $ | | — | | | | $ | | 427 | | | | $ | | 83 | |
Other Commodity
Contracts (B) | | | $ | | 43 | | | | $ | | — | | | | $ | | — | | | | $ | | — | | | | $ | | 43 | |
Interest Rate Swaps (C) | | | $ | | — | | | | $ | | — | | | | $ | | — | | | | $ | | — | | | | $ | | — | |
NDT Funds (D) | | | $ | | 1,019 | | | | $ | | — | | | | $ | | 413 | | | | $ | | 565 | | | | $ | | 41 | |
Rabbi Trusts (D) | | | $ | | 133 | | | | $ | | — | | | | $ | | 9 | | | | $ | | 110 | | | | $ | | 14 | |
Other Long-Term
Investments (E) | | | $ | | 1 | | | | $ | | — | | | | $ | | 1 | | | | $ | | — | | | | $ | | — | |
Liabilities: | | | | | | | | | | |
Derivative Contracts: | | | | | | | | | | |
Energy Contracts (A) | | | $ | | (439 | ) | | | | $ | | 42 | | | | $ | | — | | | | $ | | (437 | ) | | | | $ | | (44 | ) | |
Other Commodity
Contracts (B) | | | $ | | (71 | ) | | | | $ | | — | | | | $ | | — | | | | $ | | — | | | | $ | | (71 | ) | |
Interest Rate Swaps (C) | | | $ | | (10 | ) | | | | $ | | — | | | | $ | | — | | | | $ | | (10 | ) | | | | $ | | — | |
Power | | | | | | | | | | |
Assets: | | | | | | | | | | |
Derivative Contracts: | | | | | | | | | | |
Energy Contracts (A) | | | $ | | 368 | | | | $ | | (154 | ) | | | | $ | | — | | | | $ | | 439 | | | | $ | | 83 | |
NDT Funds (D) | | | $ | | 1,019 | | | | $ | | — | | | | $ | | 413 | | | | $ | | 565 | | | | $ | | 41 | |
Rabbi Trusts (D) | | | $ | | 27 | | | | $ | | — | | | | $ | | 2 | | | | $ | | 22 | | | | $ | | 3 | |
Liabilities: | | | | | | | | | | |
Derivative Contracts: | | | | | | | | | | |
Energy Contracts (A) | | | $ | | (449 | ) | | | | $ | | 42 | | | | $ | | — | | | | $ | | (447 | ) | | | | $ | | (44 | ) | |
PSE&G | | | | | | | | | | |
Assets: | | | | | | | | | | |
Derivative Contracts: | | | | | | | | | | |
Other Commodity
Contracts (B) | | | $ | | 2 | | | | $ | | — | | | | $ | | — | | | | $ | | — | | | | $ | | 2 | |
Rabbi Trusts (D) | | | $ | | 46 | | | | $ | | — | | | | $ | | 3 | | | | $ | | 38 | | | | $ | | 5 | |
Liabilities: | | | | | | | | | | |
Other Commodity
Contracts (B) | | | $ | | (66 | ) | | | | $ | | — | | | | $ | | — | | | | $ | | — | | | | $ | | (66 | ) | |
Interest Rate Swap (C) | | | $ | | (1 | ) | | | | $ | | — | | | | $ | | — | | | | $ | | (1 | ) | | | | $ | | — | |
|
(A) | | | | Whenever possible, fair values for energy contracts are obtained from quoted market sources in active markets. When this pricing is unavailable, contracts are valued using broker or dealer quotes or auction prices. For contracts where no observable market exists, modeling techniques are |
152
NOTES TO CONSOLIDATED FINANCIAL STATEMENTS
| | | | employed using assumptions reflective of current market rates, yield curves and forward prices, as applicable, to interpolate certain prices. |
|
(B) | | | | Other commodity contracts primarily include more complex agreements for which limited pricing information is available. These contracts are valued using modeling techniques and assumptions reflective of contractual terms, current market rates, forward price curves, discount rates and risk factors, as applicable. |
|
(C) | | | | Interest rate swaps are valued using quoted prices on commonly quoted intervals, which are interpolated for periods different than the quoted intervals, as inputs to a market valuation model. Market inputs can generally be verified and model selection does not involve significant management judgment. |
|
(D) | | | | The NDT Funds and the Rabbi Trusts maintain investments in various equity and fixed income securities classified as “available for sale” under SFAS 115. These securities are valued using quoted market prices, broker or dealer quotations, or alternative pricing sources with reasonable levels of price transparency. All fair value measurements for the fund securities are provided by the trustees of these funds. Management has obtained an adequate understanding of how these values are derived and the related processes and controls over the pricing methodologies. Most equity securities are priced utilizing the principal market close price or in some cases midpoint, bid or ask price (primarily Level 1). Fixed income securities are priced using an evaluated pricing approach or the most recent exchange or quoted bid (primarily Level 2). Short-term investments are valued based upon internal matrices using observable market prices or market parameters such as time-to-maturity, coupon rate, quality rating and current yield (primarily Level 2). Certain commingled cash equivalents included in temporary investment funds are measured with significant unobservable inputs and internal assumptions (primarily Level 3). The NDT Funds exclude net receivables/payables of $49 million related to pending security sales/purchases. |
|
(E) | | | | Other long-term investments consist of equity securities and are valued using a market based approach based on quoted market prices. |
|
(F) | | | | Cash collateral netting represents collateral amounts netted against derivative assets and liabilities as permitted under FIN 39-1. For further discussion, see Note 2. Recent Accounting Standards. |
153
NOTES TO CONSOLIDATED FINANCIAL STATEMENTS
A reconciliation of the beginning and ending balances of Level 3 derivative contracts and securities follows:
Changes in Level 3 Assets and (Liabilities) Measured at Fair Value on a Recurring Basis
for the Year Ending December 31, 2008
| | | | | | | | | | |
| | Balance as of
January 1,
2008 | | Total Gains (Losses)
Realized/Unrealized | | Purchases/
(Sales)
and Settlements | | Balance as of
December 31,
2008 |
| | Included in
Income (A) | | Included in
Regulatory
Assets/
Liabilities (B) |
| | Millions |
PSEG Net Derivative Assets (Liabilities) | | | $ | | (14 | ) | | | | $ | | 118 | | | | $ | | (15 | ) | | | | $ | | (78 | ) | | | | $ | | 11 | |
PSEG NDT Funds | | | $ | | 27 | | | | $ | | (4 | ) | | | | $ | | — | | | | $ | | 18 | | | | $ | | 41 | |
PSEG Rabbi Trust Funds | | | $ | | 16 | | | | $ | | — | | | | $ | | — | | | | $ | | (2 | ) | | | | $ | | 14 | |
Power Net Derivative Assets | | | $ | | 7 | | | | $ | | 110 | | | | $ | | — | | | | $ | | (78 | ) | | | | $ | | 39 | |
Power NDT Funds | | | $ | | 27 | | | | $ | | (4 | ) | | | | $ | | — | | | | $ | | 18 | | | | $ | | 41 | |
Power Rabbi Trust Funds | | | $ | | 3 | | | | $ | | — | | | | $ | | — | | | | $ | | — | | | | $ | | 3 | |
PSE&G Net Derivative (Liabilities) | | | $ | | (49 | ) | | | | $ | | — | | | | $ | | (15 | ) | | | | $ | | — | | | | $ | | (64 | ) | |
PSE&G Rabbi Trust Funds | | | $ | | 6 | | | | $ | | — | | | | $ | | — | | | | $ | | (1 | ) | | | | $ | | 5 | |
|
(A) | | | | PSEG’s gains and losses are mainly attributable to changes in net derivative assets and liabilities of which $132 million is included in Operating Revenues and $(14) million is included in Other Comprehensive Income. Of the $132 million in Operating Revenues, $5 million (unrealized) is at PSEG Texas, $12 million (unrealized) is at Power and $115 million (realized) is at Power. Of the $(14) million in Other Comprehensive Income, $3 million is at PSEG Texas and $(17) million is at Power. |
|
(B) | | | | Mainly includes losses on PSE&G’s derivative contracts that are not included in either earnings or Other Comprehensive Income, as they are deferred as a Regulatory Asset and are expected to be recovered from PSE&G’s customers. |
As of December 31, 2008, PSEG carried approximately $1 billion of net assets that are measured at fair value on a recurring basis, of which approximately $66 million were measured using unobservable inputs and classified as level 3 within the fair value hierarchy. These Level 3 net assets represent less than 1% of PSEG’s total assets and there were no significant transfers in or out of Level 3 during the year ending December 31, 2008.
Note 16. Stock Based Compensation
As approved at the Annual Meeting of Stockholders in 2004, PSEG’s 2004 Long-Term Incentive Plan (LTIP) replaced the prior 1989 LTIP and 2001 LTIP. The 2004 LTIP is a broad-based equity compensation program that provides for grants of various long-term incentive compensation awards, such as stock options, stock appreciation rights, performance share units, restricted stock, cash awards or any combination thereof. The types of long-term incentive awards that have been granted and remain outstanding under the LTIPs are non-qualified options to purchase shares of PSEG’s common stock, restricted stock awards, restricted stock unit awards and performance unit awards.
The 2004 LTIP currently provides for the issuance of equity awards with respect to approximately 26 million shares of common stock. As of December 31, 2008, there were approximately 21 million shares available for future awards under the 2004 LTIP.
154
NOTES TO CONSOLIDATED FINANCIAL STATEMENTS
Stock Options
Under the 2004 LTIP, non-qualified options to acquire shares of PSEG common stock may be granted to officers and other key employees of PSEG and its subsidiaries selected by the Organization and Compensation Committee of PSEG’s Board of Directors, the plan’s administrative committee (Committee). Option awards are granted with an exercise price equal to the market price of PSEG’s common stock at the grant date. The options generally vest based on three to five years of continuous service. Vesting schedules may be accelerated upon the occurrence of certain events, such as a change-in-control, retirement, death or disability. Options are exercisable over a period of time designated by the Committee (but not prior to one year or longer than 10 years from the date of grant) and are subject to such other terms and conditions as the Committee determines. Payment by option holders upon exercise of an option may be made in cash or, with the consent of the Committee, by delivering previously acquired shares of PSEG common stock.
Restricted Stock
Under the 2004 LTIP, PSEG has granted restricted stock awards to officers and other key employees. These shares are subject to risk of forfeiture until vested by continued employment. Restricted stock generally vests annually over three or four years, but is considered outstanding at the time of grant, as the recipients are entitled to dividends and voting rights. Vesting may be accelerated upon certain events, such as change-in-control (unless substituted with an equity award of equal value), retirement, death or disability.
Restricted Stock Units
Under the 2004 LTIP, PSEG has granted restricted stock unit awards to officers and certain other key employees. These awards, which are bookkeeping entries only, are subject to risk of forfeiture until vested by continued employment. Until vested, the units are credited with dividend equivalents proportionate to the dividends paid on PSEG common stock. The restricted stock units generally vest annually over four years and distributions are made in shares of common stock. Vesting may be accelerated upon certain events, such as change-in-control (unless substituted with an equity award of equal value), retirement, death or disability.
Performance Share Units
Under the 2004 LTIP, performance share units were granted to certain key executives, which provide for payment in shares of PSEG common stock based on achievement of certain financial goals over a three-year performance period. The payout varies from 0% to 200% of the number of performance share units granted depending on PSEG’s performance compared to the performance of other companies in multiple peer groups. The performance share units are credited with dividend equivalents in an amount equal to dividends paid on PSEG common stock up until the shares are distributed. Vesting may be accelerated upon certain events such as change-in-control, retirement, death or disability.
Stock-Based Compensation
Effective January 1, 2006, PSEG adopted SFAS No. 123R, “Stock-Based Payment, revised 2004” (SFAS 123R). As a result, all outstanding unvested stock options as of January 1, 2006 are being expensed based on their grant date fair values, which were determined using the Black-Scholes option-pricing model. Stock option awards are expensed on a tranche-specific basis over the requisite service period of the award. Ultimately, compensation expense for stock options is recognized for awards that vest.
Prior to the adoption of SFAS 123R, PSEG recognized compensation expense for restricted stock over the vesting period based on the grant date fair market value of the shares. PSEG will continue to recognize compensation expense over the vesting term.
Also prior to the adoption of SFAS 123R, PSEG recognized compensation expense for performance share units. The fair value of each performance unit was based on the grant date fair value of PSEG common stock. The accrual of compensation cost was based on the probable achievement of the performance conditions, which result in a payout from 0% to 200% of the initial grant. The current accrual is estimated
155
NOTES TO CONSOLIDATED FINANCIAL STATEMENTS
at 100% of the original grant. The accrual is adjusted for subsequent changes in the estimated or actual outcome.
| | | | | | |
| | 2008 | | 2007 | | 2006 |
| | Millions |
Compensation Cost included in Operation and Maintenance Expense (A) | | | $ | | 21 | | | | $ | | 22 | | | | $ | | 17 | |
Income Tax Benefit Recognized in Consolidated Statement of Operations | | | $ | | 8 | | | | $ | | 9 | | | | $ | | 7 | |
|
(A) | | | | Compensation cost capitalized as part of Property, Plant and Equipment was less than $1 million for each of the years ended December 31, 2008, 2007 and 2006. |
Of the total compensation cost for the years ended December 31, 2006, $2 million, after-tax, was primarily due to expensing stock options under SFAS 123R in 2007 and increased stock option activity. There was no impact on basic and diluted earnings per share from the implementation of SFAS 123R because there were a relatively small number of outstanding unvested stock options as of the implementation date.
Prior to the adoption of SFAS 123R, PSEG presented all tax benefits for deductions resulting from the exercise of share-based compensation as operating cash flows in the Consolidated Statement of Cash Flows. SFAS 123R requires the benefits of tax deductions in excess of the taxes expensed on recognized compensation cost to be reported as financing cash flows. There was $3 million, $18 million and $15 million of excess tax benefits included as a financing cash inflow in the Consolidated Statement of Cash Flow for the years ended December 31, 2008, 2007 and 2006, respectively. Total cash flow will remain unchanged from what would have been reported under prior accounting rules.
Prior to the adoption of SFAS 123R, PSEG recognized the compensation cost of stock based awards issued to retirement eligible employees that fully or partially vest upon an employee’s retirement over the nominal vesting period of performance, and recognized any remaining compensation cost at the date of retirement. In accordance with SFAS 123R, PSEG recognizes compensation cost of awards issued after January 1, 2006 over the shorter of the original vesting period or the period beginning on the date of grant and ending on the date an individual is eligible for retirement and the award vests.
156
NOTES TO CONSOLIDATED FINANCIAL STATEMENTS
Changes in stock options for 2008 are summarized as follows:
| | | | | | 2008 |
| | Options | | Weighted Average
Exercise Price |
Beginning of Year | | | | 2,691,236 | | | | $ | | 30.24 | |
Granted | | | | 1,344,200 | | | | | 30.67 | |
Exercised | | | | (203,368 | ) | | | | | 25.79 | |
Cancelled | | | | (47,234 | ) | | | | | 34.49 | |
| | | | |
End of Year | | | | 3,784,834 | | | | $ | | 30.67 | |
| | | | |
Exercisable at End of Year | | | | 1,479,709 | | | | $ | | 24.81 | |
| | | | |
Options | | Weighted Average
Remaining Years
Contractual Term | | Aggregate
Intrinsic Value |
Outstanding at December 31, 2008 | | | | 7.5 | | | | $ | | (5,669,920 | ) | |
Exercisable at December 31, 2008 | | | | 4.7 | | | | $ | | 6,455,135 | |
The fair value of each option grant is estimated on the date of grant using the Black-Scholes option-pricing model. The following weighted average assumptions were used for grants in 2004, 2007 and 2008:
| | | | | | | | |
| | 2004 | | 2007 | | 2008 |
| | January-June | | December |
Expected Volatility | | | | 26.74 | % | | | | | 24.87 | % | | | | | 24.60 | % | | | | | 29.30 | % | |
Risk-Free Interest Rate | | | | 3.09 | % | | | | | 4.72 | % | | | | | 3.78 | % | | | | | 1.72 | % | |
Expected Life (Years) | | | | 4 | | | | | 6.25 | | | | | 6.25 | | | | | 6.25 | |
Weighted Average Dividend Yield | | | | 5.00 | % | | | | | 3.46 | % | | | | | 2.40 | % | | | | | 4.30 | % | |
The risk-free rate assumption is based upon U.S. Treasury yields in effect at the time of grant. The expected volatility assumption is based on the historical volatility of daily stock prices. The expected life of all options is calculated using the simplified method which assumes options are exercised midway between the vesting date and the contractual term of the option. PSEG will continue to use the simplified method until there is adequate historical experience for option exercises.
The intrinsic value of options is the difference between the current market price and the exercise price. Activity for options exercised is shown below:
| | | | | | |
| | 2008 | | 2007 | | 2006 |
| | Millions |
Total Intrinsic Value of Options Exercised | | | $ | | 4 | | | | $ | | 43 | | | | $ | | 56 | |
Cash Received from Options Exercised | | | $ | | 5 | | | | $ | | 49 | | | | $ | | 86 | |
Tax Benefit Realized from Options Exercised | | | $ | | 3 | | | | $ | | 18 | | | | $ | | 15 | |
Approximately one million options vested during the years ended December 31, 2008, 2007 and 2006. The weighted average fair value per share for options vested during the years ended December 31, 2008, 2007 and 2006 was $35.40, $24.93 and $20.58, respectively.
157
NOTES TO CONSOLIDATED FINANCIAL STATEMENTS
As of December 31, 2008, there was approximately $14 million of unrecognized compensation cost related to stock options, which is expected to be recognized over a weighted average period of two years.
Restricted Stock Information
Changes in restricted stock for the year ended December 31, 2008 are summarized as follows:
| | | | | | | | |
| | Shares | | Weighted
Average Grant
Date Fair Value | | Weighted Average
Remaining Years
Contractual Term | | Aggregate
Intrinsic Value |
Outstanding at January 1, 2008 | | | | 559,784 | | | | $ | | 31.67 | | | | | |
Granted | | | | — | | | | | | | |
Vested | | | | (241,768 | ) | | | | | 24.70 | | | | | |
Canceled | | | | (9,732 | ) | | | | | 38.98 | | | | | |
| | | | | | | | |
Outstanding at December 31, 2008 | | | | 308,284 | | | | $ | | 36.89 | | | | | 2.0 | | | | $ | | 8,992,644 | |
| | | | | | | | |
There was no restricted stock granted in 2008. The weighted average grant date fair value per share was $37.18 and $32.94 for restricted stock awards granted during the years ended December 31, 2007 and 2006, respectively.
The total intrinsic value of restricted stock vested during the years ended December 31, 2008 and 2007 was $2 million and $4 million, respectively.
As of December 31, 2008, there was approximately $6 million of unrecognized compensation cost-related to restricted stock, which is expected to be recognized over a weighted average period of one year.
Restricted Stock Units
Changes in restricted stock units for the year ended December 31, 2008 are summarized as follows:
| | | | | | | | |
| | Shares | | Weighted
Average Grant
Date Fair Value | | Weighted Average
Remaining Years
Contractual Term | | Aggregate
IntrinsicValue |
Outstanding at January 1, 2008 | | | | 66,100 | | | | $ | | 48.21 | | | | | |
Granted | | | | 431,245 | | | | | 41.28 | | | | | |
Vested | | | | (58,409 | ) | | | | | 45.10 | | | | | |
Cancelled | | | | (10,025 | ) | | | | $ | | 44.16 | | | | | |
| | | | | | | | |
Outstanding at December 31, 2008 | | | | 428,911 | | | | $ | | 41.76 | | | | | 3.5 | | | | $ | | 12,511,334 | |
| | | | | | | | |
As of December 31, 2008, there was approximately $14 million of unrecognized compensation cost related to the restricted stock units, which is expected to be recognized over a weighted average period of two years. Approximately 9,000 dividend equivalents accrued on the restricted stock units during the year.
158
NOTES TO CONSOLIDATED FINANCIAL STATEMENTS
Performance Share Units Information
Performance Share Unit information for 2008 is detailed below:
| | | | | | | | |
| | Shares | | Weighted
Average Grant
Date Fair Value | | Weighted Average
Remaining
Contractual Term | | Aggregate
Intrinsic Value |
Outstanding at January 1, 2008 | | | | 478,290 | | | | $ | | 41.69 | | | | | |
Granted | | | | 333,500 | | | | | 30.81 | | | | | |
Vested | | | | (21,667 | ) | | | | 40.37 | | | | | |
Cancelled | | | | (21,503 | ) | | | | | 40.03 | | | | | |
| | | | | | | | |
Outstanding at December 31, 2008 | | | | 768,620 | | | | $ | | 37.05 | | | | | 2.8 | | | | $ | | 22,420,645 | |
| | | | | | | | |
As of December 31, 2008, there was approximately $9 million of unrecognized compensation cost related to the performance share units, which is expected to be recognized over a weighted average period of one year. Approximately 17,000 dividend equivalents accrued on the performance share units during the year.
Outside Directors
Through 2006, each director who was not an officer of PSEG or its subsidiaries and affiliates was paid an annual retainer of $50,000. Pursuant to the Compensation Plan for Outside Directors, 50% of the annual retainer was paid in PSEG common stock. PSEG also maintained a Stock Plan for Outside Directors (Stock Plan) pursuant to which Outside Directors received a restricted stock award, (2,000 shares in 2006). The restrictions on the stock granted under the Stock Plan provide that the shares are subject to forfeiture if the director leaves service at any time prior to the Annual Meeting of Stockholders following his or her 72nd birthday. This restriction would be deemed to have been satisfied if the director’s service was terminated after a “change-in-control” as defined in the Stock Plan or if the director was to die in office. PSEG also has the ability to waive this restriction for good cause shown. The fair value of these shares is recorded as compensation expense in the Consolidated Statements of Operations. Compensation expense for the Stock Plan for each of the years ended December 31, 2007 and 2006, respectively was $1 million.
Beginning in 2007, a Director Compensation plan was approved. Annually on May 1, each board member is awarded stock units based on amount of annual compensation to be paid and the May 1 closing price of PSEG common stock. Dividend equivalents are credited quarterly and distributions will commence upon the director leaving the board. Compensation expense for the Stock Plan for the year ended December 31, 2008 was approximately $1 million.
Employee Stock Purchase Plan
PSEG maintains an employee stock purchase plan for all eligible employees of PSEG and its subsidiaries. Under the plan, shares of PSEG common stock may be purchased at 95% of the fair market value through payroll deductions. In any year, employees may purchase shares having a value not exceeding 10% of their base pay. During the years ended December 31, 2008, 2007 and 2006, employees purchased 109,921, 88,656 and 120,702 shares at an average price of $38.35, $39.64 and $30.82 per share, respectively. As of December 31, 2008, 3.6 million shares were available for future issuance under this plan.
159
NOTES TO CONSOLIDATED FINANCIAL STATEMENTS
Note 17. Other Income and Deductions
| | | | | | | | |
Other Income | | Power | | PSE&G | | Other (A) | | Consolidated
Total |
| | Millions |
For the Year Ended December 31, 2008: | | | | | | | | |
NDT Fund Realized Gains | | | $ | | 354 | | | | $ | | — | | | | $ | | — | | | | $ | | 354 | |
NDT Interest, Dividend and Other Income | | | | 53 | | | | | — | | | | | — | | | | | 53 | |
Other Interest and Dividend Income | | | | 5 | | | | | 5 | | | | | 8 | | | | | 18 | |
Other | | | | 2 | | | | | 7 | | | | | 2 | | | | | 11 | |
| | | | | | | | |
Total Other Income | | | $ | | 414 | | | | $ | | 12 | | | | $ | | 10 | | | | $ | | 436 | |
| | | | | | | | |
For the Year Ended December 31, 2007: | | | | | | | | |
NDT Fund Realized Gains | | | $ | | 164 | | | | $ | | — | | | | $ | | — | | | | $ | | 164 | |
NDT Interest, Dividend and Other Income | | | | 50 | | | | | — | | | | | — | | | | | 50 | |
Other Interest and Dividend Income | | | | 21 | | | | | 10 | | | | | 5 | | | | | 36 | |
Arbitration Award (Konya-Ilgin) | | | | — | | | | | — | | | | | 9 | | | | | 9 | |
Other | | | | 4 | | | | | 6 | | | | | 10 | | | | | 20 | |
| | | | | | | | |
Total Other Income | | | $ | | 239 | | | | $ | | 16 | | | | $ | | 24 | | | | $ | | 279 | |
| | | | | | | | |
For the Year Ended December 31, 2006: | | | | | | | | |
NDT Fund Realized Gains | | | $ | | 98 | | | | $ | | — | | | | $ | | — | | | | $ | | 98 | |
NDT Interest, Dividend and Other Income | | | | 40 | | | | | — | | | | | — | | | | | 40 | |
Other Interest and Dividend Income | | | | 13 | | | | | 11 | | | | | 12 | | | | | 36 | |
Contributions in Aid of Construction | | | | — | | | | | 9 | | | | | — | | | | | 9 | |
Other | | | | 6 | | | | | 5 | | | | | 7 | | | | | 18 | |
| | | | | | | | |
Total Other Income | | | $ | | 157 | | | | $ | | 25 | | | | $ | | 19 | | | | $ | | 201 | |
| | | | | | | | |
| | | | | | | | |
Other Deductions | | Power | | PSE&G | | Other (A) | | Consolidated
Total |
| | Millions |
For the Year Ended December 31, 2008: | | | | | | | | |
NDT Fund Realized Losses and Expenses | | | $ | | 521 | | | | $ | | — | | | | $ | | — | | | | $ | | 521 | |
Donations | | | | — | | | | | 3 | | | | | 11 | | | | | 14 | |
Other | | | | 14 | | | | | 1 | | | | | 2 | | | | | 17 | |
| | | | | | | | |
Total Other Deductions | | | $ | | 535 | | | | $ | | 4 | | | | $ | | 13 | | | | $ | | 552 | |
| | | | | | | | |
For the Year Ended December 31, 2007: | | | | | | | | |
NDT Fund Realized Losses and Expenses | | | $ | | 166 | | | | $ | | — | | | | $ | | — | | | | $ | | 166 | |
Donations | | | | — | | | | | 3 | | | | | 22 | | | | | 25 | |
Loss on Early Retirement of Debt | | | | — | | | | | — | | | | | 47 | | | | | 47 | |
Other | | | | 4 | | | | | 1 | | | | | 14 | | | | | 19 | |
| | | | | | | | |
Total Other Deductions | | | $ | | 170 | | | | $ | | 4 | | | | $ | | 83 | | | | $ | | 257 | |
| | | | | | | | |
For the Year Ended December 31, 2006: | | | | | | | | |
NDT Fund Realized Losses and Expenses | | | $ | | 74 | | | | $ | | — | | | | $ | | — | | | | $ | | 74 | |
Environmental Reserves | | | | 15 | | | | | — | | | | | — | | | | | 15 | |
Loss on Early Retirement of Debt | | | | — | | | | | — | | | | | 12 | | | | | 12 | |
Other | | | | 2 | | | | | 3 | | | | | 6 | | | | | 11 | |
| | | | | | | | |
Total Other Deductions | | | $ | | 91 | | | | $ | | 3 | | | | $ | | 18 | | | | $ | | 112 | |
| | | | | | | | |
|
(A) | | | | Other primarily consists of activity at PSEG (parent company), Energy Holdings and Services and intercompany eliminations. |
160
NOTES TO CONSOLIDATED FINANCIAL STATEMENTS
Note 18. Income Taxes
A reconciliation of reported income tax expense for PSEG with the amount computed by multiplying pre-tax income by the statutory federal income tax rate of 35% is as follows:
| | | | | | | | 2008 | | 2007 | | 2006 |
| | Millions |
Net Income | | | $ | | 1,188 | | | | $ | | 1,335 | | | | $ | | 739 | |
Income from Discontinued Operations, including Gain on Disposal, net of tax benefit | | | | 205 | | | | | 10 | | | | | 66 | |
| | | | | | |
Income from Continuing Operations | | | | 983 | | | | | 1,325 | | | | | 673 | |
Preferred Dividends (net) | | | | (4 | ) | | | | | (4 | ) | | | | | (4 | ) | |
| | | | | | |
Income from Continuing Operations, excluding Preferred Dividends | | | $ | | 987 | | | | $ | | 1,329 | | | | $ | | 677 | |
| | | | | | |
Income Taxes: | | | | | | |
Operating Income: | | | | | | |
Current Expense: | | | | | | |
Federal | | | $ | | 1,430 | | | | $ | | 705 | | | | $ | | 331 | |
State | | | | 123 | | | | | 156 | | | | | 81 | |
| | | | | | |
Total Current | | | | 1,553 | | | | | 861 | | | | | 412 | |
| | | | | | |
Deferred Expense: | | | | | | |
Federal | | | | (768 | ) | | | | | 150 | | | | | 31 | |
State | | | | 144 | | | | | 57 | | | | | 10 | |
| | | | | | |
Total Deferred | | | | (624 | ) | | | | | 207 | | | | | 41 | |
| | | | | | |
Foreign | | | | — | | | | | — | | | | | 8 | |
Investment Tax Credit | | | | (3 | ) | | | | | (4 | ) | | | | | (4 | ) | |
| | | | | | |
Total Income Taxes | | | $ | | 926 | | | | $ | | 1,064 | | | | $ | | 457 | |
| | | | | | |
Pre-Tax Income | | | $ | | 1,913 | | | | $ | | 2,393 | | | | $ | | 1,134 | |
| | | | | | |
Tax Computed at Statutory Rate @ 35% | | | $ | | 669 | | | | $ | | 837 | | | | $ | | 397 | |
Increase (Decrease) Attributable to Flow-Through of Certain Tax Adjustments: | | | | | | |
State Income Taxes (net of federal income tax) | | | | 169 | | | | | 144 | | | | | 55 | |
Foreign Operations | | | | — | | | | | 82 | | | | | (12 | ) | |
Uncertain Tax Positions | | | | 135 | | | | | 29 | | | | | 16 | |
Nuclear Decommissioning Trust | | | | (10 | ) | | | | | 6 | | | | | 7 | |
Other | | | | (37 | ) | | | | | (34 | ) | | | | | (6 | ) | |
| | | | | | |
Sub-Total | | | | 257 | | | | | 227 | | | | | 60 | |
| | | | | | |
Total Income Tax Provision | | | $ | | 926 | | | | $ | | 1,064 | | | | $ | | 457 | |
| | | | | | |
Effective Income Tax Rate | | | | 48.4 | % | | | | | 44.5 | % | | | | | 40.3 | % | |
161
NOTES TO CONSOLIDATED FINANCIAL STATEMENTS
The following is an analysis of deferred income taxes for PSEG:
| | | | |
| | 2008 | | 2007 |
Deferred Income Taxes | | Millions |
Assets: | | | | |
Current (net) | | | $ | | 52 | | | | $ | | — | |
| | | | |
Non-Current: | | | | |
Unrecovered Investment Tax Credit | | | | 14 | | | | | 14 | |
OCI | | | | 50 | | | | | 313 | |
Cumulative Effect of a Change in Accounting Principle | | | | 11 | | | | | 11 | |
New Jersey Corporate Business Tax | | | | 81 | | | | | 166 | |
OPEB | | | | 242 | | | | | 188 | |
Cost of Removal | | | | 51 | | | | | 51 | |
Nuclear Decommissioning | | | | 17 | | | | | — | |
Related to Foreign Operations | | | | 11 | | | | | — | |
Development Fees | | | | 8 | | | | | 10 | |
Contractual Liabilities & Environmental Costs | | | | 35 | | | | | 35 | |
MTC | | | | 17 | | | | | 18 | |
Related to Uncertain Tax Positions | | | | 1,011 | | | | | 286 | |
Other | | | | 11 | | | | | 9 | |
| | | | |
Total Non-Current | | | | 1,559 | | | | | 1,101 | |
| | | | |
Total Assets | | | $ | | 1,611 | | | | $ | | 1,101 | |
| | | | |
Liabilities: | | | | |
Current (net) | | | $ | | — | | | | $ | | 106 | |
| | | | |
Non-Current: | | | | |
Plant-Related Items | | | | 1,878 | | | | | 1,627 | |
OCI | | | | 6 | | | | | 2 | |
Nuclear Decommissioning | | | | — | | | | | 132 | |
Securitization | | | | 888 | | | | | 1,001 | |
Leasing Activities | | | | 1,883 | | | | | 1,984 | |
Partnership Activity | | | | 88 | | | | | 86 | |
Repair Allowance Deferred Carrying Charge | | | | 16 | | | | | 19 | |
Conservation Costs | | | | 20 | | | | | 10 | |
Energy Clause Recoveries | | | | 37 | | | | | 34 | |
Pension Costs | | | | 74 | | | | | 119 | |
SFAS 143 | | | | 325 | | | | | 325 | |
Taxes Recoverable Through Future Rate (net) | | | | 164 | | | | | 167 | |
Other | | | | (3 | ) | | | | | (7 | ) | |
| | | | |
Total Non-Current Liabilities | | | | 5,376 | | | | | 5,499 | |
| | | | |
Total Liabilities | | | $ | | 5,376 | | | | $ | | 5,605 | |
| | | | |
Summary of Accumulated Deferred Income Taxes: | | | | |
Net Current Assets | | | $ | | 52 | | | | $ | | — | |
Net Current Liabilities | | | | — | | | | | 106 | |
Net Non-Current Liability | | | | 3,817 | | | | | 4,398 | |
| | | | |
| | | | 3,765 | | | | | 4,504 | |
| | | | |
ITC | | | | 48 | | | | | 51 | |
Current Portion of SFAS 109 Transferred | | | | 52 | | | | | 44 | |
Current Liabilities-APB 23/Foreign Translation Transferred | | | | — | | | | | (150 | ) | |
| | | | |
Total Deferred Income Taxes and ITC | | | $ | | 3,865 | | | | $ | | 4,449 | |
| | | | |
162
NOTES TO CONSOLIDATED FINANCIAL STATEMENTS
A reconciliation of reported income tax expense for Power with the amount computed by multiplying pre-tax income by the statutory federal income tax rate of 35% is as follows:
| | | | | | |
| | 2008 | | 2007 | | 2006 |
| | Millions |
Net Income | | | $ | | 1,050 | | | | $ | | 941 | | | | $ | | 276 | |
Loss from Discontinued Operations, including Loss on Disposal, net of tax benefit | | | | — | | | | | (8 | ) | | | | | (239 | ) | |
| | | | | | |
Income from Continuing Operations | | | $ | | 1,050 | | | | $ | | 949 | | | | $ | | 515 | |
| | | | | | |
Income Taxes: | | | | | | |
Operating Income: | | | | | | |
Current Expense: | | | | | | |
Federal | | | $ | | 465 | | | | $ | | 420 | | | | $ | | 263 | |
State | | | | 130 | | | | | 121 | | | | | 78 | |
| | | | | | |
Total Current | | | | 595 | | | | | 541 | | | | | 341 | |
| | | | | | |
Deferred Expense: | | | | | | |
Federal | | | | 50 | | | | | 78 | | | | | 20 | |
State | | | | 16 | | | | | 22 | | | | | 2 | |
| | | | | | |
Total Deferred | | | | 66 | | | | | 100 | | | | | 22 | |
| | | | | | |
Total Income Taxes | | | $ | | 661 | | | | $ | | 641 | | | | $ | | 363 | |
| | | | | | |
Pre-Tax Income | | | $ | | 1,711 | | | | $ | | 1,590 | | | | $ | | 878 | |
| | | | | | |
| | | | | | |
Tax Computed at Statutory Rate @ 35% | | | $ | | 599 | | | | $ | | 557 | | | | $ | | 307 | |
Increase (Decrease) Attributable to Flow-Through of Certain Tax Adjustments: | | | | | | |
State Income Taxes (net of federal income tax) | | | | 95 | | | | | 93 | | | | | 52 | |
Manufacturing Deduction | | | | (22 | ) | | | | | (13 | ) | | | | | (2 | ) | |
Nuclear Decommissioning Trust | | | | (10 | ) | | | | | 6 | | | | | 7 | |
Other | | | | (1 | ) | | | | | (2 | ) | | | | | (1 | ) | |
| | | | | | |
Sub-Total | | | | 62 | | | | | 84 | | | | | 56 | |
| | | | | | |
Total Income Tax Provision | | | $ | | 661 | | | | $ | | 641 | | | | $ | | 363 | |
| | | | | | |
Effective Income Tax rate | | | | 38.6 | % | | | | | 40.3 | % | | | | | 41.3 | % | |
163
NOTES TO CONSOLIDATED FINANCIAL STATEMENTS
The following is an analysis of deferred income taxes for Power:
| | | | |
| | 2008 | | 2007 |
Deferred Income Taxes | | Millions |
Assets: | | | | |
Current (net) | | | $ | | — | | | | $ | | — | |
| | | | |
Non-Current: | | | | |
OCI | | | | — | | | | | 290 | |
Cumulative Effect of a Change in Accounting Principle | | | | 11 | | | | | 11 | |
New Jersey Corporate Business Tax | | | | 76 | | | | | 76 | |
Pension Costs | | | | 63 | | | | | — | |
Cost of Removal | | | | 51 | | | | | 51 | |
Nuclear Decommissioning | | | | 17 | | | | | — | |
Contractual Liabilities & Environmental Costs | | | | 35 | | | | | 35 | |
Related to Uncertain Tax positions | | | | (4 | ) | | | | | 2 | |
| | | | |
Total Non-Current | | | | 249 | | | | | 465 | |
| | | | |
Total Assets | | | $ | | 249 | | | | $ | | 465 | |
| | | | |
Liabilities: | | | | |
Non-Current: | | | | |
Plant-Related Items | | | $ | | 292 | | | | $ | | 185 | |
OCI | | | | 5 | | | | | — | |
Nuclear Decommissioning | | | | — | | | | | 132 | |
Pension Costs | | | | — | | | | | 32 | |
SFAS 143 | | | | 325 | | | | | 325 | |
Other | | | | (43 | ) | | | | | (38 | ) | |
| | | | |
Total Non-Current | | | | 579 | | | | | 636 | |
| | | | |
Total Liabilities | | | $ | | 579 | | | | $ | | 636 | |
| | | | |
Summary of Accumulated Deferred Income Taxes: | | | | |
Net Current Assets | | | $ | | — | | | | $ | | — | |
Net Non-current Liability | | | | 330 | | | | | 171 | |
| | | | |
| | | | 330 | | | | | 171 | |
| | | | |
ITC | | | | 5 | | | | | 5 | |
| | | | |
Total Deferred Income Taxes and ITC | | | $ | | 335 | | | | $ | | 176 | |
| | | | |
164
NOTES TO CONSOLIDATED FINANCIAL STATEMENTS
A reconciliation of reported income tax expense for PSE&G with the amount computed by multiplying pre-tax income by the statutory federal income tax rate of 35% is as follows:
| | | | | | |
| | 2008 | | 2007 | | 2006 |
| | Millions |
Net Income | | | | 360 | | | | | 376 | | | | | 261 | |
Preferred Dividends (net) | | | | (4 | ) | | | | | (4 | ) | | | | | (4 | ) | |
| | | | | | |
Income from Continuing Operations, excluding Preferred Dividends | | | $ | | 364 | | | | $ | | 380 | | | | $ | | 265 | |
| | | | | | |
Income Taxes: | | | | | | |
Operating Income: | | | | | | |
Current Expense: | | | | | | |
Federal | | | $ | | 74 | | | | $ | | 214 | | | | $ | | 299 | |
State | | | | 38 | | | | | 67 | | | | | 49 | |
| | | | | | |
Total Current | | | | 112 | | | | | 281 | | | | | 348 | |
| | | | | | |
Deferred Expense: | | | | | | |
Federal | | | | 92 | | | | | (22 | ) | | | | | (161 | ) | |
State | | | | 26 | | | | | 1 | | | | | (1 | ) | |
| | | | | | |
Total Deferred | | | | 118 | | | | | (21 | ) | | | | | (162 | ) | |
| | | | | | |
Investment Tax Credit | | | | (2 | ) | | | | | (3 | ) | | | | | (3 | ) | |
| | | | | | |
Total Income Taxes | | | $ | | 228 | | | | $ | | 257 | | | | $ | | 183 | |
| | | | | | |
Pre-Tax Income | | | $ | | 592 | | | | $ | | 637 | | | | $ | | 448 | |
| | | | | | |
Tax Computed at Statutory Rate @ 35% | | | $ | | 207 | | | | $ | | 223 | | | | $ | | 157 | |
Increase (Decrease) Attributable to Flow-Through of Certain Tax Adjustments: | | | | |
State Income Taxes (net of federal income tax) | | | | 42 | | | | | 44 | | | | | 31 | |
Unrecognized Tax Benefits | | | | (18 | ) | | | | | (3 | ) | | | | | — | |
Other | | | | (3 | ) | | | | | (7 | ) | | | | | (5 | ) | |
| | | | | | |
Sub-Total | | | | 21 | | | | | 34 | | | | | 26 | |
| | | | | | |
Total Income Tax Provision | | | $ | | 228 | | | | $ | | 257 | | | | $ | | 183 | |
| | | | | | |
Effective Income Tax rate | | | | 38.5 | % | | | | | 40.3 | % | | | | | 40.8 | % | |
165
NOTES TO CONSOLIDATED FINANCIAL STATEMENTS
The following is an analysis of deferred income taxes for PSE&G:
| | | | |
| | 2008 | | 2007 |
| | Millions |
Deferred Income Taxes | | | | |
Assets: | | | | |
Current (net) | | | $ | | 52 | | | | $ | | 44 | |
| | | | |
Non-Current: | | | | |
Unrecovered ITC | | | | 14 | | | | | 14 | |
New Jersey Corporate Business Tax | | | | 98 | | | | | 131 | |
OPEB | | | | 237 | | | | | 185 | |
MTC | | | | 17 | | | | | 18 | |
Related to Uncertain Tax Positions | | | | — | | | | | 14 | |
Other | | | | — | | | | | 1 | |
| | | | |
Total Non-Current | | | $ | | 366 | | | | $ | | 363 | |
| | | | |
Total Assets | | | $ | | 418 | | | | | 407 | |
| | | | |
Liabilities: | | | | |
Non-Current: | | | | |
Plant-Related Items | | | $ | | 1,586 | | | | $ | | 1,445 | |
OCI | | | | 1 | | | | | 2 | |
Securitization | | | | 888 | | | | | 1,001 | |
Repair Allowance Deferred Carrying Charge | | | | 16 | | | | | 19 | |
Conservation Costs | | | | 20 | | | | | 10 | |
Energy Clause Recoveries | | | | 37 | | | | | 34 | |
Pension Costs | | | | 105 | | | | | 73 | |
Related to Uncertain Tax Positions | | | | 18 | | | | | — | |
Taxes Recoverable Through Future Rate(net) | | | | 164 | | | | | 167 | |
Other | | | | 25 | | | | | 11 | |
| | | | |
Total Non-Current Liabilities | | | | 2,860 | | | | | 2,762 | |
| | | | |
Total Liabilities | | | $ | | 2,860 | | | | $ | | 2,762 | |
| | | | |
Summary of Accumulated Deferred Income Taxes: | | | | |
Net Current Assets | | | $ | | 52 | | | | $ | | 44 | |
Net Non-Current Liability | | | | 2,494 | | | | | 2,399 | |
| | | | |
| | | $ | | 2,442 | | | | | 2,355 | |
| | | | |
ITC | | | | 39 | | | | | 41 | |
Current Portion of SFAS 109 Transferred | | | | 52 | | | | | 44 | |
| | | | |
Total Deferred Income Taxes and ITC | | | $ | | 2,533 | | | | $ | | 2,440 | |
| | | | |
Each of PSEG, Power and PSE&G provide deferred taxes at the enacted statutory tax rate for all temporary differences between the financial statement carrying amounts and the tax bases of existing assets and liabilities irrespective of the treatment for rate-making purposes. Management believes that it is probable that the accumulated tax benefits that previously have been treated as a flow-through item to PSE&G customers will be recovered from PSE&G’s customers in the future. Accordingly, an offsetting Regulatory Asset was established. As of December 31, 2008, PSE&G had a Regulatory Asset of $421 million, representing the tax costs expected to be recovered through rates based upon established regulatory practices, which permit recovery of current taxes payable. This amount was determined using the enacted federal income tax rate of 35% and state income tax rate of 9%.
166
NOTES TO CONSOLIDATED FINANCIAL STATEMENTS
PSEG and its subsidiaries adopted FIN 48 effective January 1, 2007, which prescribes a model for how a company should recognize, measure, present and disclose in its financial statements uncertain tax positions that it has taken or expects to take on a tax return. PSEG recorded the following amounts related to its uncertain tax positions, which was primarily comprised of amounts recorded for Power, PSE&G and Energy Holdings:
| | | | | | | | |
2007 | | PSEG | | Power | | PSE&G | | Energy
Holdings |
| | Millions |
Total Amount of Unrecognized Tax Benefits at January 1, 2007 | | | $ | | 485 | | | | $ | | 21 | | | | $ | | 55 | | | | $ | | 408 | |
Increases as a Result of Positions Taken in a Prior Period | | | | 81 | | | | | 3 | | | | | 14 | | | | | 64 | |
Decreases as a Result of Positions Taken in a Prior Period | | | | (35 | ) | | | | | (8 | ) | | | | | — | | | | | (27 | ) | |
Increases as a Result of Positions Taken during the Current Period | | | | 41 | | | | | 2 | | | | | 10 | | | | | 29 | |
Decreases as a Result of Positions Taken during the Current Period | | | | (16 | ) | | | | | — | | | | | (1 | ) | | | | | (12 | ) | |
Decreases as a Result of Settlements with Taxing Authorities | | | | — | | | | | — | | | | | — | | | | | — | |
Decreases due to Lapses of Applicable Statute of Limitations | | | | — | | | | | — | | | | | — | | | | | — | |
| | | | | | | | |
Total Amount of Unrecognized Tax Benefits at
December 31, 2007 | | | $ | | 556 | | | | $ | | 18 | | | | $ | | 78 | | | | $ | | 462 | |
| | | | | | | | |
Accumulated Deferred Income Taxes Associated with Unrecognized Tax Benefits | | | | (286 | ) | | | | | (2 | ) | | | | | (14 | ) | | | | | (272 | ) | |
Regulatory Asset-Unrecognized Tax Benefits | | | | (38 | ) | | | | | — | | | | | (38 | ) | | | | | — | |
| | | | | | | | |
Total Amount of Unrecognized Tax Benefits that if Recognized, Would Impact the Effective Tax Rate (including Interest and Penalties) | | | $ | | 232 | | | | $ | | 16 | | | | $ | | 26 | | | | $ | | 190 | |
| | | | | | | | |
| | | | | | | | |
2008 | | PSEG | | Power | | PSE&G | | Energy
Holdings |
| | Millions |
Total Amount of Unrecognized Tax Benefits at
December 31, 2007 | | | $ | | 556 | | | | $ | | 18 | | | | $ | | 78 | | | | $ | | 462 | |
Increases as a Result of Positions Taken in a Prior Period | | | | 903 | | | | | 5 | | | | | 3 | | | | | 869 | |
Decreases as a Result of Positions Taken in a Prior Period | | | | (124 | ) | | | | | (9 | ) | | | | | (63 | ) | | | | | (51 | ) | |
Increases as a Result of Positions Taken during the Current Period | | | | 90 | | | | | 2 | | | | | 10 | | | | | 78 | |
Decreases as a Result of Positions Taken during the Current Period | | | | (2 | ) | | | | | — | | | | | (1 | ) | | | | | (1 | ) | |
Decreases as a Result of Settlements with Taxing Authorities | | | | (20 | ) | | | | | — | | | | | — | | | | | (20 | ) | |
Decreases due to Lapses of Applicable Statute of Limitations | | | | — | | | | | — | | | | | — | | | | | — | |
| | | | | | | | |
Total Amount of Unrecognized Tax Benefits at
December 31, 2008 | | | $ | | 1,403 | | | | $ | | 16 | | | | $ | | 27 | | | | $ | | 1,337 | |
| | | | | | | | |
Accumulated Deferred Income Taxes Associated with Unrecognized Tax Benefits | | | | (1,017 | ) | | | | | 3 | | | | | 18 | | | | | (1,022 | ) | |
Regulatory Asset-Unrecognized Tax Benefits | | | | (39 | ) | | | | | — | | | | | (39 | ) | | | | | — | |
| | | | | | | | |
Total Amount of Unrecognized Tax Benefits that if Recognized, Would Impact the Effective Tax Rate (including Interest and Penalties) | | | $ | | 347 | | | | $ | | 19 | | | | $ | | 6 | | | | $ | | 315 | |
| | | | | | | | |
167
NOTES TO CONSOLIDATED FINANCIAL STATEMENTS
On December 17, 2007 and September 15, 2008, PSEG made tax deposits with the IRS in the amount of $100 million and $80 million, respectively, to defray interest costs associated with disputed tax assessments associated with certain lease investments (see Note 11. Commitments and Contingent Liabilities). The $180 million of deposits are fully refundable and are recorded as a reduction to the Unrecognized Tax Benefit liability in PSEG’s Consolidated Balance Sheets, but are not reflected in the amounts shown above.
PSEG and its subsidiaries include all accrued interest and penalties, required to be recorded under FIN 48, as income tax expense. PSEG’s interest and penalties on Unrecognized Tax Benefits as of December 31, 2008 was $349 million, including $6 million at Power, $(22) million at PSE&G and $358 million at Energy Holdings.
As a result of a change in accounting method for the capitalization of indirect costs, PSEG reduced the net amount of its unrecognized tax benefits (including interest) by $71 million, approximately $36 million of which related to PSE&G. While this accounting change is still being discussed with the IRS, is reasonably possible that PSE&G’s claim related to this matter will be settled with the IRS in the next 12 months, resulting in an increase in the unrecognized tax benefits.
It is reasonably possible that total unrecognized tax benefits at PSEG will decrease by $163 million within the next 12 months due to either agreement with various taxing authorities upon audit or the expiration of the Statute of Limitations. This amount includes a $13 million decrease for Power, a $7 million decrease for PSE&G, a $25 million decrease for Services, a $128 million decrease for Energy Holdings and a $5 million increase for PSEG parent.
It is reasonably possible that unrecognized tax benefits associated with the leasing tax issue discussed in Note 11. Commitments and Contingent Liabilities, will change significantly. This change could be triggered by a settlement with the IRS or developments in other litigated cases. Based upon these developments, unrecognized tax benefits could increase by as much as $355 million or decrease by as much as $1,182 million. It is not possible to predict the magnitude, timing or direction of any such change.
Description of income tax years that remain subject to examination by material jurisdictions, where an examination has not already concluded are:
| | | | | | |
| | PSEG | | Power | | PSE&G |
United States | | | | | | |
Federal | | | | 2001-2007 | | | 2001-2007 | | 2001-2007 |
New Jersey | | | | 2000-2007 | | | N/A | | 2000-2007 |
Pennsylvania | | | | 2004-2007 | | | N/A | | 2004-2007 |
Connecticut | | | | 2003-2006 | | | N/A | | N/A |
Texas | | | | 2006 | | | N/A | | N/A |
California | | | | 2003-2007 | | | N/A | | N/A |
Indiana | | | | 2003-2007 | | | N/A | | N/A |
Ohio | | | | 2004-2007 | | | N/A | | N/A |
New York | | | | 2004-2007 | | | 2004-2007 | | |
Foreign | | | | | | |
Chile | | | | 2004-2007 | | | N/A | | N/A |
Peru | | | | 2002-2007 | | | N/A | | N/A |
Note 19. Earnings Per Share (EPS)
Diluted EPS is calculated by dividing Net Income by the weighted average number of shares of common stock outstanding, including shares issuable upon exercise of stock options outstanding or vesting of restricted stock awards granted under PSEG’s stock compensation plans and upon payment of performance
168
NOTES TO CONSOLIDATED FINANCIAL STATEMENTS
share units or restricted stock units. The following table shows the effect of these stock options, restricted stock awards, performance share units and restricted stock units on the weighted average number of shares outstanding used in calculating diluted EPS:
| | | | | | | | | | | | |
| | For the Years Ended December 31, |
| | 2008 | | 2007 | | 2006 |
| | Basic | | Diluted | | Basic | | Diluted | | Basic | | Diluted |
EPS Numerator: |
Earnings (Millions) | | | | | | | | | | | | |
Continuing Operations | | | $ | | 983 | | | | $ | | 983 | | | | $ | | 1,325 | | | | $ | | 1,325 | | | | $ | | 673 | | | | $ | | 673 | |
Discontinued Operations | | | | 205 | | | | | 205 | | | | | 10 | | | | | 10 | | | | | 66 | | | | | 66 | |
| | | | | | | | | | | | |
Net Income | | | $ | | 1,188 | | | | $ | | 1,188 | | | | $ | | 1,335 | | | | $ | | 1,335 | | | | $ | | 739 | | | | $ | | 739 | |
| | | | | | | | | | | | |
EPS Denominator (Thousands): |
Weighted Average Common Shares Outstanding | | | | 507,693 | | | | | 507,693 | | | | | 507,560 | | | | | 507,560 | | | | | 503,356 | | | | | 503,356 | |
Effect of Stock Options | | | | — | | | | | 341 | | | | | — | | | | | 678 | | | | | — | | | | | 1,090 | |
Effect of Stock Performance Share Units | | | | — | | | | | 322 | | | | | — | | | | | 560 | | | | | — | | | | | 182 | |
Effect of Restricted Stock | | | | — | | | | | — | | | | | — | | | | | 12 | | | | | — | | | | | — | |
Effect of Restricted Stock Units | | | | — | | | | | 71 | | | | | — | | | | | 3 | | | | | — | | | | | — | |
| | | | | | | | | | | | |
Total Shares | | | | 507,693 | | | | | 508,427 | | | | | 507,560 | | | | | 508,813 | | | | | 503,356 | | | | | 504,628 | |
| | | | | | | | | | | | |
EPS: |
Continuing Operations | | | $ | | 1.94 | | | | $ | | 1.93 | | | | $ | | 2.61 | | | | $ | | 2.60 | | | | $ | | 1.34 | | | | $ | | 1.33 | |
Discontinued Operations | | | | 0.40 | | | | | 0.41 | | | | | 0.02 | | | | | 0.02 | | | | | 0.13 | | | | | 0.13 | |
| | | | | | | | | | | | |
Net Income | | | $ | | 2.34 | | | | $ | | 2.34 | | | | $ | | 2.63 | | | | $ | | 2.62 | | | | $ | | 1.47 | | | | $ | | 1.46 | |
| | | | | | | | | | | | |
There were approximately 0.7 million stock options excluded from the weighted average common shares used for diluted EPS due to their antidilutive effect for the year ended December 31, 2008. No other stock options or Participating Units had an antidilutive effect for the years ended December 31, 2008, 2007 or 2006.
Dividend payments on common stock for the year ended December 31, 2008 were $1.29 per share and totaled $655 million. Dividend payments on common stock for the year ended December 31, 2007 were $1.17 per share and totaled $594 million.
On February 17, 2009, PSEG’s Board of Directors approved a $0.01 increase in its quarterly common stock dividend, from $0.3225 to $0.3325 per share for the first quarter of 2009. This reflects an indicated annual dividend rate of $1.33 per share. PSEG expects to continue to pay cash dividends on its common stock, however, the declaration and payment of future dividends to holders of PSEG common stock will be at the discretion of the Board of Directors and will depend upon many factors, including PSEG’s financial condition, earnings, capital requirements of its business, alternate investment opportunities, legal requirements, regulatory constraints, industry practice and other factors that the Board of Directors deems relevant.
Note 20. Financial Information by Business Segment
Basis of Organization
During the fourth quarter of 2008, PSEG, Power and PSE&G re-evaluated their respective operating segments. Based on this evaluation, PSEG changed its operating segments to Power, PSE&G and Energy
169
NOTES TO CONSOLIDATED FINANCIAL STATEMENTS
Holdings. The operating segments were determined by management in accordance with SFAS No. 131, “Disclosures About Segments of an Enterprise and Related Information” (SFAS 131). These segments were determined based on how management measures performance based on segment Net Income, as illustrated in the following table, and how it allocates resources to each business. Prior period amounts have been reclassified to reflect the change in operating segments.
Power
Power earns revenues by selling energy, capacity and ancillary services on a wholesale basis under contract to power marketers and to load serving entities and by bidding energy, capacity and ancillary services into the markets for these products. Power also enters into trading contracts for energy, capacity, financial transmission rights, gas, emission allowances and other energy-related contracts to optimize the value of its portfolio of generating assets and its electric and gas supply obligations.
PSE&G
PSE&G earns revenues from its tariffs, under which it provides electric transmission and electric and gas distribution services to residential, commercial and industrial customers in New Jersey. The rates charged for electric transmission are regulated by the FERC while the rates charged for electric and gas distribution are regulated by the BPU. Revenues are also earned from several other activities such as sundry sales, the appliance service business, wholesale transmission services and other miscellaneous services.
Energy Holdings
Energy Holdings earns revenues from its generation projects in Texas and from its portfolio of passive investments primarily consisting of leveraged leases. The lease investments are domestic and international; however, revenues from all international investments are denominated in U.S. dollars. Gains and losses on sales of these investments are typically recognized in revenues. Energy Holdings also has equity method generation projects. Earnings from these projects are presented below Operating Income.
Other
Other activities include amounts applicable to PSEG (parent corporation), Services and intercompany eliminations, primarily relating to intercompany transactions between Power and PSE&G. No gains or losses are recorded on any intercompany transactions; rather, all intercompany transactions are at cost or, in the case of the BGS and BGSS contracts between Power and PSE&G, at rates prescribed by the BPU. For a further discussion of the intercompany transactions between Power and PSE&G, see Note 21. Related-Party Transactions. The net losses primarily relate to financing and certain administrative and general cost.
170
NOTES TO CONSOLIDATED FINANCIAL STATEMENTS
| | | | | | | | | | |
| | Power | | PSE&G | | Energy
Holdings | | Other | | Consolidated
Total |
| | (Millions) |
For the Year Ended December 31, 2008: | | | | | | | | | | |
Total Operating Revenues | | | $ | | 7,770 | | | | $ | | 9,038 | | | | $ | | 345 | | | | $ | | (3,831 | ) | | | | $ | | 13,322 | |
Depreciation and Amortization | | | | 164 | | | | | 583 | | | | | 29 | | | | | 16 | | | | | 792 | |
Operating Income (Loss) | | | | 1,996 | | | | | 909 | | | | | (308 | ) | | | | | 16 | | | | | 2,613 | |
Income from Equity Method Investments | | | | — | | | | | — | | | | | 37 | | | | | — | | | | | 37 | |
Interest Income | | | | 5 | | | | | 5 | | | | | 23 | | | | | (16 | ) | | | | | 17 | |
Interest Expense | | | | 164 | | | | | 325 | | | | | 83 | | | | | 22 | | | | | 594 | |
Income (Loss) before Income Taxes | | | | 1,711 | | | | | 592 | | | | | (356 | ) | | | | | (38 | ) | | | | | 1,909 | |
Income Tax Expense (Benefit) | | | | 661 | | | | | 228 | | | | | 47 | | | | | (10 | ) | | | | | 926 | |
Income (Loss) from Continuing Operations | | | | 1,050 | | | | | 364 | | | | | (403 | ) | | | | | (28 | ) | | | | | 983 | |
Income from Discontinued Operations, net of tax (including Gain on Disposal) | | | | — | | | | | — | | | | | 205 | | | | | — | | | | | 205 | |
Net Income (Loss) | | | | 1,050 | | | | | 364 | | | | | (198 | ) | | | | | (28 | ) | | | | | 1,188 | |
Segment Earnings (Loss) | | | | 1,050 | | | | | 360 | | | | | (198 | ) | | | | | (24 | ) | | | | | 1,188 | |
Gross Additions to Long-Lived Assets | | | $ | | 973 | | | | $ | | 761 | | | | $ | | 8 | | | | $ | | 29 | | | | $ | | 1,771 | |
As of December 31, 2008: | | | | — | | | | | | | | | |
Total Assets | | | $ | | 9,459 | | | | $ | | 16,406 | | | | $ | | 4,256 | | | | $ | | (1,072 | ) | | | | $ | | 29,049 | |
Investments in Equity Method Subsidiaries | | | $ | | 35 | | | | $ | | — | | | | $ | | 180 | | | | $ | | — | | | | $ | | 215 | |
171
NOTES TO CONSOLIDATED FINANCIAL STATEMENTS
| | | | | | | | | | |
| | Power | | PSE&G | | Energy
Holdings | | Other | | Consolidated
Total |
| | (Millions) |
For the Year Ended December 31, 2007: | | | | | | | | | | |
Total Operating Revenues | | | $ | | 6,796 | | | | $ | | 8,493 | | | | $ | | 793 | | | | $ | | (3,405 | ) | | | | $ | | 12,677 | |
Depreciation and Amortization | | | | 140 | | | | | 591 | | | | | 30 | | | | | 13 | | | | | 774 | |
Operating Income | | | | 1,680 | | | | | 957 | | | | | 198 | | | | | 11 | | | | | 2,846 | |
Income from Equity Method Investments | | | | — | | | | | — | | | | | 115 | | | | | — | | | | | 115 | |
Interest Income | | | | 21 | | | | | 10 | | | | | 17 | | | | | (12 | ) | | | | | 36 | |
Interest Expense | | | | 159 | | | | | 332 | | | | | 151 | | | | | 85 | | | | | 727 | |
Income (Loss) Before Income Taxes | | | | 1,590 | | | | | 637 | | | | | 274 | | | | | (112 | ) | | | | | 2,389 | |
Income Tax Expense (Benefit) | | | | 641 | | | | | 257 | | | | | 211 | | | | | (45 | ) | | | | | 1,064 | |
Income (Loss) From Continuing Operations | | | | 949 | | | | | 380 | | | | | 63 | | | | | (67 | ) | | | | | 1,325 | |
Income (Loss) from Discontinued Operations, net of tax (including (Loss) Gain on Disposal) | | | | (8 | ) | | | | | — | | | | | 18 | | | | | — | | | | | 10 | |
Net Income (Loss) | | | | 941 | | | | | 380 | | | | | 81 | | | | | (67 | ) | | | | | 1,335 | |
Segment Earnings (Loss) | | | | 941 | | | | | 376 | | | | | 81 | | | | | (63 | ) | | | | | 1,335 | |
Gross Additions to Long-Lived Assets | | | $ | | 715 | | | | $ | | 570 | | | | $ | | 38 | | | | $ | | 25 | | | | $ | | 1,348 | |
As of December 31, 2007: | | | | | | | | | | |
Total Assets | | | $ | | 8,336 | | | | $ | | 14,637 | | | | $ | | 6,169 | | | | $ | | (843 | ) | | | | $ | | 28,299 | |
Investments in Equity Method Subsidiaries | | | $ | | 14 | | | | $ | | — | | | | $ | | 208 | | | | $ | | — | | | | $ | | 222 | |
| | | | | | | | | | |
| | Power | | PSE&G | | Energy
Holdings | | Other | | Consolidated
Total |
| | (Millions) |
For the Year Ended December 31, 2006: | | | | | | | | | | |
Total Operating Revenues | | | $ | | 6,057 | | | | $ | | 7,569 | | | | $ | | 929 | | | | $ | | (2,820 | ) | | | | $ | | 11,735 | |
Depreciation and Amortization | | | | 140 | | | | | 620 | | | | | 28 | | | | | 20 | | | | | 808 | |
Operating Income (Loss) | | | | 960 | | | | | 772 | | | | | 259 | | | | | (1 | ) | | | | | 1,990 | |
Income from Equity Method Investments | | | | — | | | | | — | | | | | 115 | | | | | — | | | | | 115 | |
Interest Income | | | | 13 | | | | | 11 | | | | | 24 | | | | | (12 | ) | | | | | 36 | |
Interest Expense | | | | 148 | | | | | 346 | | | | | 183 | | | | | 111 | | | | | 788 | |
Income (Loss) Before Income Taxes | | | | 878 | | | | | 448 | | | | | (66 | ) | | | | | (130 | ) | | | | | 1,130 | |
Income Tax Expense (Benefit) | | | | 363 | | | | | 183 | | | | | (36 | ) | | | | | (53 | ) | | | | | 457 | |
Income (Loss) From Continuing Operations | | | | 515 | | | | | 265 | | | | | (30 | ) | | | | | (77 | ) | | | | | 673 | |
Income (Loss) from Discontinued Operations, net of tax (including Loss on Disposal) | | | | (239 | ) | | | | | — | | | | | 305 | | | | | — | | | | | 66 | |
Net Income (Loss) | | | | 276 | | | | | 265 | | | | | 275 | | | | | (77 | ) | | | | | 739 | |
Segment Earnings (Loss) | | | | 276 | | | | | 261 | | | | | 275 | | | | | (73 | ) | | | | | 739 | |
Gross Additions to Long-Lived Assets | | | $ | | 418 | | | | $ | | 528 | | | | $ | | 64 | | | | $ | | 5 | | | | $ | | 1,015 | |
Note 21. Related-Party Transactions
The majority of the following discussion relates to intercompany transactions, which are eliminated during the PSEG consolidation process in accordance with GAAP.
172
NOTES TO CONSOLIDATED FINANCIAL STATEMENTS
Power
The financials statements for Power include transactions with related parties presented as follows:
| | | | | | |
Related Party Transactions | | For the Years Ended December 31, |
| | 2008 | | 2007 | | 2006 |
| | Millions |
Revenue from Affiliates: | | | | | | |
Billings to PSE&G through BGS (D) | | | $ | | 1,453 | | | | $ | | 1,163 | | | | $ | | 793 | |
Billings to PSE&G through BGSS (D) | | | | 2,316 | | | | | 2,208 | | | | | 1,995 | |
| | | | | | |
Total Revenue from Affiliates | | | $ | | 3,769 | | | | $ | | 3,371 | | | | $ | | 2,788 | |
| | | | | | |
Expense Billings from Affiliates: | | | | | | |
Administrative Billings from Services (C) | | | $ | | (166 | ) | | | | $ | | (144 | ) | | | | $ | | (137 | ) | |
| | | | | | |
Total Expense Billings from Affiliates | | | $ | | (166 | ) | | | | $ | | (144 | ) | | | | $ | | (137 | ) | |
| | | | | | |
| | | | |
Related Party Transactions | | For the Years Ended December 31, |
| | 2008 | | 2007 |
| | Millions |
Receivables from PSE&G through BGS and BGSS Contracts | | | $ | | 475 | | | | $ | | 451 | |
Receivables from PSE&G Related to Gas Supply Hedges for BGSS | | | | 319 | | | | | 55 | |
Current Unrecognized Tax Receivable from PSEG (A) | | | | — | | | | | 8 | |
Administrative Billings Payable to Services | | | | | (26 | ) | | | | | | (24 | ) | |
Tax Sharing Payable to PSEG (A) | | | | (36 | ) | | | | | (43 | ) | |
Amounts Collected on PSEG’s Behalf | | | | — | | | | | (5 | ) | |
| | | | |
Accounts Receivable—Affiliated Companies, net | | | $ | | 732 | | | | $ | | 442 | |
| | | | |
Short-Term Loan from Affiliate (Demand Note Payable to PSEG) (B) | | | $ | | (3 | ) | | | | $ | | (238 | ) | |
| | | | |
Working Capital Advances to Services (E) | | | $ | | 17 | | | | $ | | 17 | |
| | | | |
Long-Term Accrued Taxes Payable (A) | | | $ | | (16 | ) | | | | $ | | (26 | ) | |
| | | | |
PSE&G
The financials statements for PSE&G include transactions with related parties presented as follows:
| | | | | | |
Related Party Transactions | | For the Years Ended
December 31, |
| | 2008 | | 2007 | | 2006 |
Expense Billings from affiliates: | | Millions |
Billings from Power through BGS (D) | | | $ | | (1,453 | ) | | | | $ | | (1,163 | ) | | | | $ | | (793 | ) | |
Billings from Power through BGSS (D) | | | | (2,316 | ) | | | | | (2,208 | ) | | | | | (1,995 | ) | |
Administrative Billings from Services (C) | | | | (264 | ) | | | | | (238 | ) | | | | | (215 | ) | |
| | | | | | |
Total Expense Billings from Affiliates | | | $ | | (4,033 | ) | | | | $ | | (3,609 | ) | | | | $ | | (3,003 | ) | |
| | | | | | |
173
NOTES TO CONSOLIDATED FINANCIAL STATEMENTS
| | | | |
| | For the Years Ended
December 31, |
| | 2008 | | 2007 |
| | Millions |
Related Party Transactions | | | | |
Amounts Collected by PSEG on Behalf of PSE&G | | | $ | | 9 | | | | $ | | 11 | |
Current Unrecognized Tax Receivable from (Payable to)
PSEG (A) | | | | 55 | | | | | (3 | ) | |
Payable to Power through BGS and BGSS Contracts | | | | (475 | ) | | | | | (451 | ) | |
Payable to Power Related to Gas Supply Hedges for BGSS | | | | (319 | ) | | | | | (55 | ) | |
Administrative Billings Payable to Services | | | | (54 | ) | | | | | (57 | ) | |
Tax Sharing Receivable from (Payable to) PSEG (A) | | | | 21 | | | | | (5 | ) | |
| | | | |
Accounts Payable – Affiliated Companies, net | | | $ | | (763 | ) | | | | $ | | (560 | ) | |
| | | | |
Working Capital Advances to Services (E) | | | $ | | 33 | | | | $ | | 33 | |
| | | | |
Long-Term Accrued Taxes Payable (A) | | | $ | | (82 | ) | | | | $ | | (75 | ) | |
| | | | |
|
(A) | | | | PSEG and its subsidiaries adopted FIN 48 effective January 1, 2007, which prescribes a model for how a company should recognize, measure, present and disclose in its financial statements uncertain tax positions that it has taken or expects to take on a tax return. |
|
(B) | | | | This was for short-term needs. Interest Income and Interest Expense relating to these short term funding activities was immaterial. |
|
(C) | | | | Services provides and bills administrative services to Power and PSE&G. In addition, Power and PSE&G have other payables to Services, including amounts related to certain common costs, such as pension and OPEB costs, which Services pays on behalf of each of the operating companies. Power and PSE&G believe that the costs of services provided by Services approximate market value for such services. |
|
(D) | | | | PSE&G has entered into a requirements contract with Power under which Power provides the gas supply services needed to meet PSE&G’s BGSS and other contractual requirements through March 31, 2012 and year-to-year thereafter. Power has also entered into contracts to supply energy, capacity and ancillary services to PSE&G through the BGS auction process. |
|
(E) | | | | Power and PSE&G have advanced working capital to Services. The amounts are included in Other Noncurrent Assets on Power’s and PSE&G’s Consolidated Balance Sheets. |
174
NOTES TO CONSOLIDATED FINANCIAL STATEMENTS
Note 22. Selected Quarterly Data (Unaudited)
The information shown in the following tables, in the opinion of PSEG, Power and PSE&G includes all adjustments, consisting only of normal recurring accruals, necessary to fairly present such amounts.
| | | | | | | | | | | | | | | | |
| | Calendar Quarter Ended |
| | March 31, | | June 30, | | September 30, | | December 31, |
| | 2008 | | 2007 | | 2008 | | 2007 | | 2008 | | 2007 | | 2008 | | 2007 |
| | Millions where applicable |
PSEG Consolidated: | | | | | | | | | | | | | | | | |
Operating Revenues | | | $ | | 3,792 | | | | $ | | 3,502 | | | | $ | | 2,550 | | | | $ | | 2,705 | | | | $ | | 3,718 | | | | $ | | 3,347 | | | | $ | | 3,262 | | | | $ | | 3,123 | |
Operating Income | | | | 811 | | | | | 699 | | | | | 178 | | | | | 592 | | | | | 965 | | | | | 960 | | | | | 659 | | | | | 595 | |
Income (Loss) from Continuing Operations | | | | 435 | | | | | 324 | | | | | (165 | ) | | | | | 292 | | | | | 476 | | | | | 490 | | | | | 237 | | | | | 219 | |
Income/(Loss) from Discontinued Operations, including Gain (Loss) on Disposal, net of tax | | | | 13 | | | | | 5 | | | | | 15 | | | | | (17 | ) | | | | | 180 | | | | | 16 | | | | | (3 | ) | | | | | 6 | |
Net Income (Loss) | | | | 448 | | | | | 329 | | | | | (150 | ) | | | | | 275 | | | | | 656 | | | | | 506 | | | | | 234 | | | | | 225 | |
Earnings Per Share: | | | | | | | | | | | | | | | | |
Basic: | | | | | | | | | | | | | | | | |
Income (Loss) from Continuing Operations | | | | 0.86 | | | | | 0.64 | | | | | (0.32 | ) | | | | | 0.58 | | | | | 0.94 | | | | | 0.96 | | | | | 0.47 | | | | | 0.43 | |
Net Income (Loss) | | | | 0.88 | | | | | 0.65 | | | | | (0.29 | ) | | | | | 0.54 | | | | | 1.29 | | | | | 0.99 | | | | | 0.46 | | | | | 0.44 | |
Diluted: | | | | | | | | | | | | | | | | |
Income (Loss) from Continuing Operations | | | | 0.85 | | | | | 0.64 | | | | | (0.32 | ) | | | | | 0.57 | | | | | 0.94 | | | | | 0.96 | | | | | 0.47 | | | | | 0.43 | |
Net Income (Loss) | | | | 0.88 | | | | | 0.65 | | | | | (0.29 | ) | | | | | 0.54 | | | | | 1.29 | | | | | 0.99 | | | | | 0.46 | | | | | 0.44 | |
Weighted Average Common Shares Outstanding: | | | | | | | | | | | | | | | | |
Basic | | | | 508 | | | | | 506 | | | | | 508 | | | | | 507 | | | | | 508 | | | | | 509 | | | | | 506 | | | | | 509 | |
Diluted | | | | 510 | | | | | 507 | | | | | 509 | | | | | 508 | | | | | 508 | | | | | 509 | | | | | 508 | | | | | 510 | |
| | | | | | | | | | | | | | | | |
| | Calendar Quarter Ended |
| | March 31, | | June 30, | | September 30, | | December 31, |
| | 2008 | | 2007 | | 2008 | | 2007 | | 2008 | | 2007 | | 2008 | | 2007 |
| | Millions |
Power: | | | | | | | | | | | | | | | | |
Operating Revenues | | | $ | | 2,375 | | | | $ | | 2,149 | | | | $ | | 1,623 | | | | $ | | 1,305 | | | | $ | | 1,833 | | | | $ | | 1,580 | | | | $ | | 1,939 | | | | $ | | 1,762 | |
Operating Income | | | | 509 | | | | | 389 | | | | | 440 | | | | | 336 | | | | | 605 | | | | | 600 | | | | | 442 | | | | | 355 | |
Income from Continuing Operations | | | | 275 | | | | | 219 | | | | | 240 | | | | | 187 | | | | | 328 | | | | | 338 | | | | | 207 | | | | | 205 | |
Income (Loss) from Discontinued Operations, including Loss on Disposal, net of tax | | | | — | | | | | (6 | ) | | | | | — | | | | | (3 | ) | | | | | — | | | | | 1 | | | | | — | | | | | — | |
Net Income (Loss) | | | | 275 | | | | | 213 | | | | | 240 | | | | | 184 | | | | | 328 | | | | | 339 | | | | | 207 | | | | | 205 | |
175
NOTES TO CONSOLIDATED FINANCIAL STATEMENTS
| | | | | | | | | | | | | | | | |
| | Calendar Quarter Ended |
| | March 31, | | June 30, | | September 30, | | December 31, |
| | 2008 | | 2007 | | 2008 | | 2007 | | 2008 | | 2007 | | 2008 | | 2007 |
| | Millions |
PSE&G: | | | | | | | | | | | | | | | | |
Operating Revenues | | | $ | | 2,618 | | | | $ | | 2,486 | | | | $ | | 1,858 | | | | $ | | 1,748 | | | | $ | | 2,274 | | | | $ | | 2,106 | | | | $ | | 2,288 | | | | $ | | 2,153 | |
Operating Income | | | | 279 | | | | | 308 | | | | | 159 | | | | | 184 | | | | | 248 | | | | | 265 | | | | | 223 | | | | | 200 | |
Income from Continuing Operations | | | | 137 | | | | | 132 | | | | | 52 | | | | | 63 | | | | | 98 | | | | | 107 | | | | | 77 | | | | | 78 | |
Net Income | | | | 137 | | | | | 132 | | | | | 52 | | | | | 63 | | | | | 98 | | | | | 107 | | | | | 77 | | | | | 78 | |
Earnings Available to PSEG | | | | 136 | | | | | 131 | | | | | 51 | | | | | 62 | | | | | 97 | | | | | 106 | | | | | 76 | | | | | 77 | |
Note 23. Guarantees of Debt
Power’s Senior Notes are fully and unconditionally and jointly and severally guaranteed by its subsidiaries, PSEG Fossil LLC, PSEG Nuclear LLC and PSEG Energy Resources & Trade LLC. The following table presents condensed financial information for the guarantor subsidiaries as well as Power’s non-guarantor subsidiaries as of December 31, 2008 and 2007 and for the years ended December 31, 2008, 2007 and 2006.
| | | | | | | | | | |
| | Power | | Guarantor
Subsidiaries | | Other
Subsidiaries | | Consolidating
Adjustments | | Total |
| | Millions |
For the Year Ended December 31, 2008: | | | | | | | | | | |
Revenues | | | $ | | — | | | | $ | | 8,887 | | | | $ | | 126 | | | | $ | | (1,243 | ) | | | | $ | | 7,770 | |
Operating Expenses | | | | — | | | | | 6,890 | | | | | 126 | | | | | (1,242 | ) | | | | | 5,774 | |
| | | | | | | | | | |
Operating Income | | | | — | | | | | 1,997 | | | | | — | | | | | (1 | ) | | | | | 1,996 | |
Equity Earnings (Losses) of Subsidiaries | | | | 1,055 | | | | | (41 | ) | | | | | — | | | | | (1,014 | ) | | | | | — | |
Other Income | | | | 162 | | | | | 501 | | | | | — | | | | | (249 | ) | | | | | 414 | |
Other Deductions | | | | (13 | ) | | | | | (521 | ) | | | | | — | | | | | (1 | ) | | | | | (535 | ) | |
Interest Expense | | | | (209 | ) | | | | | (147 | ) | | | | | (59 | ) | | | | | 251 | | | | | (164 | ) | |
Income Taxes | | | | 55 | | | | | (734 | ) | | | | | 18 | | | | | — | | | | | (661 | ) | |
| | | | | | | | | | |
Net Income (Loss) | | | $ | | 1,050 | | | | $ | | 1,055 | | | | $ | | (41 | ) | | | | $ | | (1,014 | ) | | | | $ | | 1,050 | |
| | | | | | | | | | |
As of December 31, 2008: | | | | | | | | | | |
Current Assets | | | | 2,395 | | | | | 5,507 | | | | | 439 | | | | | (5,636 | ) | | | | | 2,705 | |
Property, Plant and Equipment, net | | | | 44 | | | | | 4,513 | | | | | 924 | | | | | — | | | | | 5,481 | |
Investment in Subsidiaries | | | | 4,758 | | | | | 384 | | | | | — | | | | | (5,142 | ) | | | | | — | |
Noncurrent Assets | | | | 244 | | | | | 1,166 | | | | | 50 | | | | | (187 | ) | | | | | 1,273 | |
| | | | | | | | | | |
Total Assets | | | $ | | 7,441 | | | | $ | | 11,570 | | | | $ | | 1,413 | | | | $ | | (10,965 | ) | | | | $ | | 9,459 | |
| | | | | | | | | | |
Current Liabilities | | | $ | | 371 | | | | $ | | 5,880 | | | | $ | | 919 | | | | $ | | (5,637 | ) | | | | $ | | 1,533 | |
Noncurrent Liabilities | | | | 532 | | | | | 935 | | | | | 109 | | | | | (187 | ) | | | | | 1,389 | |
Long-Term Debt | | | | 2,653 | | | | | — | | | | | — | | | | | — | | | | | 2,653 | |
Member’s Equity | | | | 3,885 | | | | | 4,755 | | | | | 385 | | | | | (5,141 | ) | | | | | 3,884 | |
| | | | | | | | | | |
Total Liabilities and Member’s Equity | | | $ | | 7,441 | | | | $ | | 11,570 | | | | $ | | 1,413 | | | | $ | | (10,965 | ) | | | | $ | | 9,459 | |
| | | | | | | | | | |
| | | | | | | | | | |
176
NOTES TO CONSOLIDATED FINANCIAL STATEMENTS
| | | | | | | | | | |
| | Power | | Guarantor
Subsidiaries | | Other
Subsidiaries | | Consolidating
Adjustments | | Total |
| | Millions |
For the Year Ended December 31, 2008: | | | | | | | | | | |
Net Cash Provided By (Used In) Operating Activities | | | $ | | (416 | ) | | | | $ | | 2,306 | | | | $ | | (115 | ) | | | | $ | | (89 | ) | | | | $ | | 1,686 | |
Net Cash Provided By (Used In) Investing Activities | | | $ | | 918 | | | | $ | | (2,787 | ) | | | | $ | | (22 | ) | | | | $ | | 949 | | | | $ | | (942 | ) | |
Net Cash Provided By (Used In) Financing Activities | | | $ | | (500 | ) | | | | $ | | 490 | | | | $ | | 137 | | | | $ | | (862 | ) | | | | $ | | (735 | ) | |
For the Year Ended December 31, 2007: | | | | | | | | | | |
Revenues | | | $ | | — | | | | $ | | 7,836 | | | | $ | | 114 | | | | $ | | (1,154 | ) | | | | $ | | 6,796 | |
Operating Expenses | | | | 4 | | | | | 6,152 | | | | | 114 | | | | | (1,154 | ) | | | | | 5,116 | |
| | | | | | | | | | |
Operating Income (Loss) | | | | (4 | ) | | | | | 1,684 | | | | | — | | | | | — | | | | | 1,680 | |
Equity Earnings (Losses) of Subsidiaries | | | | 930 | | | | | (40 | ) | | | | | — | | | | | (890 | ) | | | | | — | |
Other Income | | | | 191 | | | | | 295 | | | | | — | | | | | (247 | ) | | | | | 239 | |
Other Deductions | | | | (1 | ) | | | | | (169 | ) | | | | | — | | | | | — | | | | | (170 | ) | |
Interest Expense | | | | (197 | ) | | | | | (161 | ) | | | | | (49 | ) | | | | | 248 | | | | | (159 | ) | |
Income Taxes | | | | 22 | | | | | (680 | ) | | | | | 17 | | | | | — | | | | | (641 | ) | |
Income (Loss) on Discontinued Operations, Including Loss on Disposal, net of tax benefit | | | | — | | | | | — | | | | | (8 | ) | | | | | — | | | | | (8 | ) | |
| | | | | | | | | | |
Net Income (Loss) | | | $ | | 941 | | | | $ | | 929 | | | | $ | | (40 | ) | | | | $ | | (889 | ) | | | | $ | | 941 | |
| | | | | | | | | | |
As of December 31, 2007: | | | | | | | | | | |
Current Assets | | | $ | | 2,553 | | | | $ | | 3,542 | | | | $ | | 360 | | | | $ | | (4,306 | ) | | | | $ | | 2,149 | |
Property, Plant and Equipment, net | | | | 149 | | | | | 3,669 | | | | | 934 | | | | | (1 | ) | | | | | 4,751 | |
Investment in Subsidiaries | | | | 3,538 | | | | | 168 | | | | | — | | | | | (3,706 | ) | | | | | — | |
Noncurrent Assets | | | | 156 | | | | | 1,505 | | | | | 30 | | | | | (255 | ) | | | | | 1,436 | |
| | | | | | | | | | |
Total Assets | | | $ | | 6,396 | | | | $ | | 8,884 | | | | $ | | 1,324 | | | | $ | | (8,268 | ) | | | | $ | | 8,336 | |
| | | | | | | | | | |
Current Liabilities | | | $ | | 99 | | | | $ | | 4,487 | | | | $ | | 1,057 | | | | $ | | (4,305 | ) | | | | $ | | 1,338 | |
Noncurrent Liabilities | | | | 234 | | | | | 859 | | | | | 98 | | | | | (256 | ) | | | | | 935 | |
Long-Term Debt | | | | 2,902 | | | | | — | | | | | — | | | | | — | | | | | 2,902 | |
Member’s Equity | | | | 3,161 | | | | | 3,538 | | | | | 169 | | | | | (3,707 | ) | | | | | 3,161 | |
| | | | | | | | | | |
Total Liabilities and Member’s Equity | | | $ | | 6,396 | | | | $ | | 8,884 | | | | $ | | 1,324 | | | | $ | | (8,268 | ) | | | | $ | | 8,336 | |
| | | | | | | | | | |
177
NOTES TO CONSOLIDATED FINANCIAL STATEMENTS
| | | | | | | | | | |
| | Power | | Guarantor
Subsidiaries | | Other
Subsidiaries | | Consolidating
Adjustments | | Total |
| | Millions |
For the Year Ended December 31, 2007: | | | | | | | | | | |
Net Cash Provided By (Used In) Operating Activities | | | $ | | 1,238 | | | | $ | | 1,595 | | | | $ | | (584 | ) | | | | $ | | (1,044 | ) | | | | $ | | 1,205 | |
Net Cash Provided By (Used In) Investing Activities | | | $ | | (232 | ) | | | | $ | | (596 | ) | | | | $ | | (103 | ) | | | | $ | | 531 | | | | $ | | (400 | ) | |
Net Cash Provided By (Used In) Financing Activities | | | $ | | (1,006 | ) | | | | $ | | (1,001 | ) | | | | $ | | 687 | | | | $ | | 513 | | | | $ | | (807 | ) | |
For the Year Ended December 31, 2006: | | | | | | | | | | |
Revenues | | | $ | | — | | | | $ | | 7,030 | | | | $ | | 139 | | | | $ | | (1,112 | ) | | | | $ | | 6,057 | |
Operating Expenses | | | | 1 | | | | | 6,103 | | | | | 107 | | | | | (1,114 | ) | | | | | 5,097 | |
| | | | | | | | | | |
Operating Income | | | | (1 | ) | | | | | 927 | | | | | 32 | | | | | 2 | | | | | 960 | |
Equity Earnings (Losses) of Subsidiaries | | | | 284 | | | | | (252 | ) | | | | | — | | | | | (32 | ) | | | | | — | |
Other Income | | | | 171 | | | | | 199 | | | | | 6 | | | | | (219 | ) | | | | | 157 | |
Other Deductions | | | | (2 | ) | | | | | (88 | ) | | | | | (1 | ) | | | | | — | | | | | (91 | ) | |
Interest Expense | | | | (188 | ) | | | | | (133 | ) | | | | | (44 | ) | | | | | 217 | | | | | (148 | ) | |
Income Taxes | | | | 12 | | | | | (377 | ) | | | | | 1 | | | | | 1 | | | | | (363 | ) | |
Income (Loss) on Discontinued Operations, Including Loss on Disposal, net of Tax Benefit | | | | — | | | | | 8 | | | | | (247 | ) | | | | | — | | | | | (239 | ) | |
| | | | | | | | | | |
Net Income (Loss) | | | $ | | 276 | | | | $ | | 284 | | | | $ | | (253 | ) | | | | $ | | (31 | ) | | | | $ | | 276 | |
| | | | | | | | | | |
For the Year Ended December 31, 2006: | | | | | | | | | | |
Net Cash Provided By (Used In) Operating Activities | | | $ | | 1,105 | | | | $ | | 1,076 | | | | $ | | 14 | | | | $ | | (1,152 | ) | | | | $ | | 1,043 | |
Net Cash Provided By (Used In) Investing Activities | | | $ | | (605 | ) | | | | $ | | (1,016 | ) | | | | $ | | 25 | | | | $ | | 1,206 | | | | $ | | (390 | ) | |
Net Cash Provided By (Used In) Financing Activities | | | $ | | (500 | ) | | | | $ | | (55 | ) | | | | $ | | (39 | ) | | | | $ | | (54 | ) | | | | $ | | (648 | ) | |
178
| |
ITEM 9. | CHANGES IN AND DISAGREEMENTS WITH ACCOUNTANTS ON ACCOUNTING AND FINANCIAL DISCLOSURE |
None.
ITEM 9A/9A(T). CONTROLS AND PROCEDURES
Disclosure Controls and Procedures
PSEG, Power and PSE&G have established and maintain disclosure controls and procedures as defined under Rule 13a-15(e) and 15d-15(e) promulgated under the Securities Exchange Act of 1934, as amended (the “Exchange Act”) that are designed to provide reasonable assurance that information required to be disclosed in the reports that are filed or submitted under the Exchange Act is recorded, processed, summarized and reported and is accumulated and communicated to the Chief Executive Officer and Chief Financial Officer of each respective company, as appropriate, by others within the entities to allow timely decisions regarding required disclosure. We have established a disclosure committee which includes several key management employees and which reports directly to the Chief Financial Officer and Chief Executive Officer of each respective company. The committee monitors and evaluates the effectiveness of these disclosure controls and procedures. The Chief Financial Officer and Chief Executive Officer of each company have evaluated the effectiveness of the disclosure controls and procedures and, based on this evaluation, have concluded that disclosure controls and procedures at each respective company were effective at a reasonable assurance level as of the end of the period covered by the report.
Internal Controls
PSEG, Power and PSE&G
We have conducted assessments of our internal control over financial reporting as of December 31, 2008, as required by Section 404 of the Sarbanes-Oxley Act, using the framework promulgated by the Committee of Sponsoring Organizations of the Treadway Commission, commonly referred to as “COSO”. Management’s reports on PSEG’s, Power’s and PSE&G’s internal control over financial reporting is included on pages 180, 181 and 182, respectively. The Independent Registered Public Accounting Firm’s report with respect to the effectiveness of PSEG’s internal control over financial reporting is included on page 183. This annual report does not include an attestation report of the Independent Registered Public Accounting Firm for Power or PSE&G regarding internal control over financial reporting. Management’s report for Power and PSE&G was not subject to attestation by the Independent Registered Public Accounting Firm pursuant to temporary rules of the Securities and Exchange Commission that permit Power and PSE&G to provide only management’s report in this annual report. Management has concluded that internal control over financial reporting is effective as of December 31, 2008.
We continually review our disclosure controls and procedures and make changes, as necessary, to ensure the quality of their financial reporting. There have been no changes in internal control over financial reporting that occurred during the fourth quarter of 2008 that have materially affected, or are reasonably likely to materially affect, each registrant’s internal control over financial reporting.
ITEM 9B. OTHER INFORMATION
None.
179
MANAGEMENT REPORT ON INTERNAL CONTROL OVER
FINANCIAL REPORTING—PSEG
Management of Public Service Enterprise Group (PSEG) is responsible for establishing and maintaining effective internal control over financial reporting and for the assessment of the effectiveness of internal control over financial reporting. As defined by the SEC in Rules 13a-15(f) and 15d-15(f) under the Securities Exchange Act of 1934, internal control over financial reporting is a process designed by, or under the supervision of, the company’s principal executive and principal financial officers, or persons performing similar functions, and implemented by the company’s management and other personnel, with oversight by the Audit Committee of the Board of Directors to provide reasonable assurance regarding the reliability of financial reporting and the preparation of financial statements for external purposes in accordance with accounting principles generally accepted in the United States of America (generally accepted accounting principles).
PSEG’s internal control over financial reporting includes those policies and procedures that (1) pertain to the maintenance of records that, in reasonable detail, accurately and fairly reflect the transactions and dispositions of PSEG’s assets; (2) provide reasonable assurance that transactions are recorded as necessary to permit preparation of financial statements in accordance with generally accepted accounting principles, and that receipts and expenditures of PSEG are being made only in accordance with authorizations of PSEG’s management and directors; and (3) provide reasonable assurance regarding prevention or timely detection of unauthorized acquisition, use or disposition of PSEG’s assets that could have a material effect on the financial statements.
In connection with the preparation of PSEG’s annual financial statements, management of PSEG has undertaken an assessment, which includes the design and operational effectiveness of PSEG’s internal control over financial reporting using the framework promulgated by the Committee of Sponsoring Organizations of the Treadway Commission, commonly referred to as “COSO”. The COSO framework is based upon five integrated components of control: control environment, risk assessment, control activities, information and communications and ongoing monitoring.
Because of its inherent limitations, internal control over financial reporting may not prevent or detect misstatements. Also, projection of any evaluation of effectiveness to future periods is subject to the risk that controls may become inadequate because of changes in conditions, or that the degree of compliance with the policies or procedures may deteriorate.
Based on the assessment performed, management has concluded that PSEG’s internal control over financial reporting is effective and provides reasonable assurance regarding the reliability of PSEG’s financial reporting and the preparation of its financial statements as of December 31, 2008 in accordance with generally accepted accounting principles. Further, management has not identified any material weaknesses in internal control over financial reporting as of December 31, 2008.
PSEG’s external auditors, Deloitte & Touche LLP, have audited PSEG’s financial statements for the year ended December 31, 2008 included in this annual report on Form 10-K and, as part of that audit, have issued a report on the effectiveness of PSEG’s internal control over financial reporting, a copy of which is included in this annual report on Form 10-K.
| | |
/s/ RALPH IZZO | | |
Chief Executive Officer | | |
| | | |
/s/ THOMAS M. O’FLYNN | | |
Chief Financial Officer | | |
February 26, 2009
180
MANAGEMENT REPORT ON INTERNAL CONTROL OVER
FINANCIAL REPORTING—Power
Management of PSEG Power LLC (Power) is responsible for establishing and maintaining effective internal control over financial reporting and for the assessment of the effectiveness of internal control over financial reporting. As defined by the SEC in Rules 13a-15(f) and 15d-15(f) under the Securities Exchange Act of 1934, internal control over financial reporting is a process designed by, or under the supervision of, the company’s principal executive and principal financial officers, or persons performing similar functions, and implemented by the company’s management and other personnel, with oversight by the Audit Committee of the Board of Directors of its parent, Public Service Enterprise Group Incorporated, to provide reasonable assurance regarding the reliability of financial reporting and the preparation of financial statements for external purposes in accordance with accounting principles generally accepted in the United States of America (generally accepted accounting principles).
Power’s internal control over financial reporting includes those policies and procedures that (1) pertain to the maintenance of records that, in reasonable detail, accurately and fairly reflect the transactions and dispositions of Power’s assets; (2) provide reasonable assurance that transactions are recorded as necessary to permit preparation of financial statements in accordance with generally accepted accounting principles, and that receipts and expenditures of Power are being made only in accordance with authorizations of Power’s management and directors; and (3) provide reasonable assurance regarding prevention or timely detection of unauthorized acquisition, use or disposition of Power’s assets that could have a material effect on the financial statements.
In connection with the preparation of Power’s annual financial statements, management of Power has undertaken an assessment, which includes the design and operational effectiveness of Power’s internal control over financial reporting using the framework promulgated by the Committee of Sponsoring Organizations of the Treadway Commission, commonly referred to as “COSO”. The COSO framework is based upon five integrated components of control: control environment, risk assessment, control activities, information and communications and ongoing monitoring.
Because of its inherent limitations, internal control over financial reporting may not prevent or detect misstatements. Also, projection of any evaluation of effectiveness to future periods is subject to the risk that controls may become inadequate because of changes in conditions, or that the degree of compliance with the policies or procedures may deteriorate.
Based on the assessment performed, management has concluded that Power’s internal control over financial reporting is effective and provides reasonable assurance regarding the reliability of Power’s financial reporting and the preparation of its financial statements as of December 31, 2008 in accordance with generally accepted accounting principles. Further, management has not identified any material weaknesses in internal control over financial reporting as of December 31, 2008.
This Annual Report on Form 10-K does not include an attestation report of Power’s Independent Registered Public Accounting Firm regarding internal control over financial reporting. Management’s report was not subject to attestation by our external auditors pursuant to temporary rules of the Securities and Exchange Commission that permit us to provide only management’s report in the Annual Report on Form 10-K.
| | |
/s/ RALPH IZZO | | |
Chief Executive Officer | | |
| | | |
/s/ THOMAS M. O’FLYNN | | |
Chief Financial Officer | | |
February 26, 2009
181
MANAGEMENT REPORT ON INTERNAL CONTROL OVER
FINANCIAL REPORTING—PSE&G
Management of Public Service Electric and Gas Company is responsible for establishing and maintaining effective internal control over financial reporting and for the assessment of the effectiveness of internal control over financial reporting. As defined by the SEC in Rules 13a-15(f) and 15d- 15(f) under the Securities Exchange Act of 1934, internal control over financial reporting is a process designed by, or under the supervision of, the company’s principal executive and principal financial officers, or persons performing similar functions, and implemented by the company’s management and other personnel, with oversight by the Audit Committee of the Board of Directors of its parent, Public Service Enterprise Group Incorporated, to provide reasonable assurance regarding the reliability of financial reporting and the preparation of financial statements for external purposes in accordance with accounting principles generally accepted in the United States of America (generally accepted accounting principles).
PSE&G’s internal control over financial reporting includes those policies and procedures that (1) pertain to the maintenance of records that, in reasonable detail, accurately and fairly reflect the transactions and dispositions of PSE&G’s assets; (2) provide reasonable assurance that transactions are recorded as necessary to permit preparation of financial statements in accordance with generally accepted accounting principles, and that receipts and expenditures of PSE&G are being made only in accordance with authorizations of PSE&G’s management and directors; and (3) provide reasonable assurance regarding prevention or timely detection of unauthorized acquisition, use or disposition of PSE&G’s assets that could have a material effect on the financial statements.
In connection with the preparation of PSE&G’s annual financial statements, management of PSE&G has undertaken an assessment, which includes the design and operational effectiveness of PSE&G’s internal control over financial reporting using the framework promulgated by the Committee of Sponsoring Organizations of the Treadway Commission, commonly referred to as “COSO”. The COSO framework is based upon five integrated components of control: control environment, risk assessment, control activities, information and communications and ongoing monitoring.
Because of its inherent limitations, internal control over financial reporting may not prevent or detect misstatements. Also, projection of any evaluation of effectiveness to future periods is subject to the risk that controls may become inadequate because of changes in conditions, or that the degree of compliance with the policies or procedures may deteriorate.
Based on the assessment performed, management has concluded that PSE&G’s internal control over financial reporting is effective and provides reasonable assurance regarding the reliability of PSE&G’s financial reporting and the preparation of its financial statements as of December 31, 2008 in accordance with generally accepted accounting principles. Further, management has not identified any material weaknesses in internal control over financial reporting as of December 31, 2008.
This Annual Report on Form 10-K does not include an attestation report of PSE&G’s Independent Registered Public Accounting Firm regarding internal control over financial reporting. Management’s report was not subject to attestation by our external auditors pursuant to temporary rules of the Securities and Exchange Commission that permit us to provide only management’s report in the Annual Report on Form 10-K.
| | |
/s/ RALPH IZZO | | |
Chief Executive Officer | | |
| | | |
/s/ THOMAS M. O’FLYNN | | |
Chief Financial Officer | | |
February 26, 2009
182
REPORT OF INDEPENDENT REGISTERED PUBLIC ACCOUNTING FIRM
To the Stockholders and Board of Directors of
Public Service Enterprise Group Incorporated:
We have audited the internal control over financial reporting of Public Service Enterprise Group Incorporated and subsidiaries (the “Company”) as of December 31, 2008, based on criteria established inInternal Control—Integrated Frameworkissued by the Committee of Sponsoring Organizations of the Treadway Commission. The Company’s management is responsible for maintaining effective internal control over financial reporting and for its assessment of the effectiveness of internal control over financial reporting, included in the accompanying Management Report on Internal Control Over Financial Reporting. Our responsibility is to express an opinion on the Company’s internal control over financial reporting based on our audit.
We conducted our audits in accordance with the standards of the Public Company Accounting Oversight Board (United States). Those standards require that we plan and perform the audits to obtain reasonable assurance about whether effective internal control over financial reporting was maintained in all material respects. Our audits include obtaining an understanding of internal control over financial reporting, assessing the risk that a material weakness exists, testing and evaluating the design and operating effectiveness of internal control based on the assessed risk, and performing such other procedures as we considered necessary in the circumstances. We believe that our audits provide a reasonable basis for our opinion.
A company’s internal control over financial reporting is a process designed by, or under the supervision of, the company’s principal executive and principal financial officers, or persons performing similar functions, and effected by the company’s board of directors, management, and other personnel to provide reasonable assurance regarding the reliability of financial reporting and the preparation of financial statements for external purposes in accordance with generally accepted accounting principles. A company’s internal control over financial reporting includes those policies and procedures that (1) pertain to the maintenance of records that, in reasonable detail, accurately and fairly reflect the transactions and dispositions of the assets of the company; (2) provide reasonable assurance that transactions are recorded as necessary to permit preparation of financial statements in accordance with generally accepted accounting principles, and that receipts and expenditures of the company are being made only in accordance with authorizations of management and directors of the company; and (3) provide reasonable assurance regarding prevention or timely detection of unauthorized acquisition, use, or disposition of the company’s assets that could have a material effect on the financial statements.
Because of the inherent limitations of internal control over financial reporting, including the possibility of collusion or improper management override of controls, material misstatements due to error or fraud may not be prevented or detected on a timely basis. Also, projections of any evaluation of the effectiveness of the internal control over financial reporting to future periods are subject to the risk that the controls may become inadequate because of changes in conditions, or that the degree of compliance with the policies or procedures may deteriorate.
In our opinion, the Company maintained, in all material respects, effective internal control over financial reporting as of December 31, 2008, based on the criteria established inInternal Control—Integrated Frameworkissued by the Committee of Sponsoring Organizations of the Treadway Commission.
We have also audited, in accordance with the standards of the Public Company Accounting Oversight Board (United States), the consolidated financial statements and financial statement schedule listed in the Index at Item 15 as of and for the year ended December 31, 2008 of the Company and our report dated February 25, 2009 expressed an unqualified opinion on those consolidated financial statements and consolidated financial statement schedule, and included an explanatory paragraph regarding the adoption of Statement of Financial Accounting Standards No. 157,Fair Value Measurements and Financial Accounting Standards Board Interpretation No. 48,Accounting for Uncertainty in Income Taxes—an Interpretation of FASB Statement 109.
DELOITTE& TOUCHE LLP
Parsippany, New Jersey
February 25, 2009
183
PART III
ITEM 10. DIRECTORS, EXECUTIVE OFFICERS AND CORPORATE GOVERNANCE
Executive Officers
The Executive Officers of each of Public Service Enterprise Group (PSEG), PSEG Power LLC (Power) and Public Service Electric and Gas Company (PSE&G), respectively, are set forth below, as indicated for each individual.
| | | | | | |
Name | | Age as of
December 31,
2008 | | Office | | Effective Date
First Elected to
Present Position |
Ralph Izzo (1)(2)(3) | | 51 | | Chairman of the Board, President and Chief Executive Officer (PSEG) | | April 2007
to present |
| | | | Chairman of the Board and Chief Executive Officer (Power) | | April 2007 to present |
| | | | Chairman of the Board and Chief Executive Officer (PSE&G) | | April 2007 to present |
| | | | Chairman of the Board and Chief Executive Officer (Energy Holdings) | | April 2007 to present |
| | | | Chairman of the Board and Chief Executive Officer (Services) | | April 2007 to present |
| | | | President and Chief Operating Officer (PSEG) | | October 2006 to March 2007 |
| | | | President and Chief Operating Officer (PSE&G) | | October 2003 to October 2006 |
Thomas M. O’Flynn (1)(2)(3) | | 48 | | Executive Vice President and Chief Financial Officer (PSEG) | | July 2001 to present |
| | | | Executive Vice President and Chief Financial Officer (Power) | | February 2002 to present |
| | | | Executive Vice President and Chief Financial Officer (PSE&G) | | January 2007 to present |
| | | | President and Chief Operating Officer (Energy Holdings) | | February 2007 to July 2008 |
| | | | Executive Vice President—Finance (Services) | | June 2001 to present |
| | | | Executive Vice President and Chief Financial Officer (Energy Holdings) | | August 2002 to present |
William Levis (1)(2) | | 52 | | President and Chief Operating Officer (Power) | | June 2007 to present |
184
| | | | | | |
Name | | Age as of
December 31,
2008 | | Office | | Effective Date
First Elected to
Present Position |
| | | | President and Chief Nuclear Officer (Nuclear) | | January 2007 to October 2008 |
| | | | Senior Vice President and Chief Nuclear Officer (Salem/Hope Creek) | | January 2005 to December 2006 |
| | | | Vice President—Mid-Atlantic Operations of Exelon Nuclear (Exelon Corporation) | | July 2003 to December 2004 |
Ralph LaRossa (1)(3) | | 45 | | President and Chief Operating Officer (PSE&G) | | October 2006 to present |
| | | | Vice President—Electric Delivery (PSE&G) | | August 2003 to October 2006 |
R. Edwin Selover (1)(2)(3) | | 63 | | Executive Vice President and General Counsel (PSEG) | | December 2006 to present |
| | | | Senior Vice President and General Counsel (PSEG) | | April 2002 to December 2006 |
| | | | Executive Vice President and General Counsel (PSE&G) | | December 2006 to present |
| | | | Senior Vice President and General Counsel (PSE&G) | | January 1988 to December 2006 |
| | | | Executive Vice President and General Counsel (Power) | | December 2006 to present |
| | | | Executive Vice President and General Counsel (Services) | | December 2006 to present |
| | | | Senior Vice President and General Counsel (Services) | | November 1999 to December 2006 |
Derek M. DiRisio (1)(2)(3) | | 44 | | Vice President and Controller
(PSEG) | | January 2007 to present |
| | | | Vice President and Controller (PSE&G) | | January 2007 to present |
| | | | Vice President and Controller
(Power) | | January 2007 to present |
| | | | Vice President and Controller
(Energy Holdings) | | January 2007 to present |
| | | | Vice President and Controller
(Services) | | January 2007 to present |
| | | | Assistant Controller Enterprise
(Services) | | July 2004 to January 2007 |
| | | | Vice President—Planning and Analysis (Energy Holdings) | | March 2004 to July 2004 |
| | | | Vice President and Controller
(Energy Holdings) | | June 1998 to March 2004 |
185
| | | | | | |
Name | | Age as of
December 31,
2008 | | Office | | Effective Date
First Elected to
Present Position |
| Elbert C. Simpson (1) | | 60 | | President and Chief Operating Officer (Services) | | January 2007 to present |
| | | | Senior Vice President—Information Technology (Services) | | May 2002 to January 2007 |
Randall E. Mehrberg (1) | | 53 | | Executive Vice President—Planning and Strategy (Services) | | September 2008 to present |
| | | | Executive Vice President of Exelon Corporation | | Spring 2002 to June 2008 |
Clarence J. Hopf, Jr. (2) | | 52 | | President (ER&T) | | June 2008 to present |
| | | | President/Senior Vice President of PPL Energy Plus LLC | | October 2005 to June 2008 |
| | | | Vice President of Goldman Sachs/JAron Company | | August 2003 to September 2005 |
Thomas P. Joyce (2) | | 56 | | President and Chief Nuclear Officer (Nuclear) | | October 2008 to present |
| | | | Senior Vice President— Operations (Nuclear) | | July 2007 to September 2008 |
| | | | Site Vice President—Salem Station (Nuclear) | | January 2005 to July 2007 |
| | | | Site Vice President—Braidwood Station of Exelon Corporation | | Spring 2003 to January 2005 |
Richard Lopriore (2) | | 59 | | President (Fossil) | | May 2007 to present |
| | | | Senior Vice President—Nuclear MidAtlantic of Exelon Corporation | | January 2005 to April 2007 |
| | | | Vice President—Midwest Boiling Water Reactor Operations of Exelon Corporation | | February 2004 to December 2004 |
| | | | Corporate Vice President—Operations Support—Nuclear of Exelon Corporation | | July 2003 to February 2004 |
Stephen C. Byrd (1) | | 36 | | President and Chief Operating Officer (Energy Holdings) | | July 2008 to present |
| | | | Senior Vice President—Finance
(Services) | | January 2007 to present |
| | | | Executive Director of Morgan Stanley | | August 1998 to January 2007 |
David P. Falck (1) | | 55 | | Senior Vice President—Law
(Services) | | March 2007 to present |
| | | | Partner—Pillsbury Winthrop Shaw Pittman LLP | | January 1987 to March 2007 |
186
|
(1) | | | | Executive Officer of PSEG |
|
(2) | | | | Executive Officer of Power |
|
(3) | | | | Executive Officer of PSE&G |
Directors
PSEG
The information required by Item 10 of Form 10-K with respect to (i) present directors of PSEG who are nominees for election as directors at PSEG’s 2008 Annual Meeting of Stockholders, and directors whose terms will continue beyond the meeting, and (ii) compliance with Section 16(a) of the Securities Exchange Act of 1934, as amended, is set forth under the headings ‘Election of Directors’ and Section 16(a) “Beneficial Ownership Reporting Compliance” in PSEG’s definitive Proxy Statement for such Annual Meeting of Stockholders, which definitive Proxy Statement is expected to be filed with the U.S. Securities and Exchange Commission (SEC) on or about March 9, 2009 and which information set forth under said heading is incorporated herein by this reference thereto.
PSE&G
CAROLINE DORSA has been a director since February 2003. Age 49. Has been Senior Vice President of Global Human Health, Strategy and Integration of Merck & Co., Inc. (Merck), Whitehouse Station, New Jersey, which discovers, develops, manufactures and markets human and animal health products, since January 2008. Was Senior Vice President and Chief Financial Officer of Gilead Sciences, Inc, from November 2007 to January 2008. Was Senior Vice President and Chief Financial Officer of Avaya, Inc., Basking Ridge, New Jersey, from February 2007 to November 2007. Was Vice President and Treasurer of Merck from December 1996 to January 2007.
ALBERT R. GAMPER, JR. has been a director since December 2000. Age 67. Until retirement, was Chairman of the Board of CIT Group, Inc., Livingston, New Jersey, a commercial finance company, from July 2004 until December 2004. Was Chairman of the Board and Chief Executive Officer of CIT Group, Inc. from September 2003 to July 2004, Chairman of the Board, President and Chief Executive Officer from June 2002 to September 2003 and President and Chief Executive Officer from February 2002 to June 2002. Was President and Chief Executive Officer of Tyco Capital Corporation from June 2001 to February 2002. Was Chairman of the Board, President and Chief Executive Officer of CIT Group, Inc., from January 2000 to June 2001 and President and Chief Executive Officer from December 1989 to December 1999. Trustee to the Fidelity Group of Funds.
CONRAD K. HARPER has been a director since May 1997. Age 68. Of counsel to the law firm of Simpson Thacher & Bartlett LLP, New York, New York since January 2003. Was a partner from October 1996 to December 2002 and from October 1974 to May 1993. Was Legal Adviser, U.S. Department of State from May 1993 to June 1996. Director of New York Life Insurance Company.
RALPH IZZO has been a director of PSE&G since October 2006. For additional information, see Executive Officers table above.
187
Power
STEPHEN C. BYRD has been a director of Power since February 2008. Age 36. For additional information, see Executive Officers table above.
CLARENCE J. HOPF, JR. has been a director of Power since July 2008. For additional information, see Executive Officers table above.
RALPH IZZO has been a director of Power since October 2006. For additional information, see Executive Officers table above.
THOMAS P. JOYCE has been a director of Power since October 2008. For additional information, see Executive Officers table above.
WILLIAM LEVIS has been a director of Power since April 2007. For additional information, see Executive Officers table above.
RICHARD P. LOPRIORE has been a director of Power since June 2007. For additional information, see Executive Officers table above.
RANDALL E. MEHRBERG has been a director of Power since September 2008. For additional information, see Executive Officers table above.
EILEEN A. MORAN has been a director of Power since April 2008. Age 54. Has been President of PSEG Resources L.L.C. since October 2002 and President of Enterprise Group Development Corporation since January 1997. Was Senior Vice President—Strategic Initiatives of Services from January 2008 to December 2008.
THOMAS M. O’FLYNN has been a director of Power since July 2001. For additional information, see Executive Officers table above.
R. EDWIN SELOVER has been a director of Power since June 1999. For additional information, see Executive Officers table above.
ELBERT C. SIMPSON has been a director of Power since April 2007. For additional information, see Executive Officers table above.
Code of Ethics
Our Standards of Integrity (Standards) is a code of ethics applicable to us and our subsidiaries. The Standards are an integral part of our business conduct compliance program and embody our commitment to conduct operations in accordance with the highest legal and ethical standards. The Standards apply to all of our directors, employees (including PSEG’s, Power’s and PSE&G’s principal executive officer, principal financial officer, principal accounting officer or Controller and persons performing similar functions) worldwide. Each such person is responsible for understanding and complying with the Standards. The Standards are posted on our website, www.pseg.com/investor/governance. We will send you a copy on request.
The Standards establish a set of common expectations for behavior to which each employee must adhere in dealings with investors, customers, fellow employees, competitors, vendors, government officials, the media and all others who may associate their words and actions with us. The Standards have been developed to provide reasonable assurance that, in conducting our business, employees behave ethically and in accordance with the law and do not take advantage of investors, regulators or customers through manipulation, abuse of confidential information or misrepresentation of material facts.
If we adopt any amendment (other than technical, administrative or non-substantive) to or a waiver from the Standards that applies to any director or principal executive officer, principal financial officer, principal accounting officer or Controller, or persons performing similar functions of PSEG, Power or PSE&G and that relates to any element enumerated by the SEC, we will post the amendment or waiver on our website, www.pseg.com/investor/governance.
188
ITEM 11. EXECUTIVE COMPENSATION
PSEG
The information required by Item 11 of Form 10-K is set forth under the heading “Executive Compensation” in PSEG’s definitive Proxy Statement for the 2009 Annual Meeting of Stockholders which definitive Proxy Statement is expected to be filed with the U.S. Securities and Exchange Commission (SEC) on or about March 9, 2009 and such information set forth under such heading is incorporated herein by this reference thereto.
Power
Omitted pursuant to conditions set forth in General Instruction I of Form 10-K.
PSE&G
COMPENSATION COMMITTEE REPORT
The Organization and Compensation Committee of the Board of Directors of PSEG, the parent of PSE&G, has reviewed and discussed the Compensation Discussion and Analysis included in this Form 10-K with management and with Mercer (US) Inc. (Mercer), the Committee’s compensation consultant. Based on such review and discussions, the Organization and Compensation Committee recommended to the Board of Directors of PSE&G that the Compensation Discussion and Analysis be included in this Form 10-K.
Members of the Organization and Compensation Committee:
Albert R. Gamper, Jr., Chair
William V. Hickey
Shirley Ann Jackson
Thomas A. Renyi
Richard J. Swift
February 16, 2009
189
COMPENSATION DISCUSSION AND ANALYSIS
Executive compensation is administered under the direction of the Organization and Compensation Committee (Committee) of PSEG. The Committee is made up of directors who are independent under NYSE rules and our requirements for independent directors.
Compensation Philosophy and Program
We have designed our Executive Compensation Program (Program) to attract, motivate and retain high-performing executives who are critical to our long-term success. We have structured the Program to link executive compensation to successful execution of our strategic business plans and meeting our financial, operational and other corporate goals. This design is intended to provide executives increased compensation when we do well as measured against our goals and to provide less compensation when we do not.
In setting compensation for a particular executive, our philosophy is to use the median of compensation of similar positions within an identified peer group of energy companies as a reference point, which we will then adjust based on the performance and experience of the individual, the individual’s ability to contribute to our long-term success and other factors, such as relative pay positioning among executives.
We review the philosophy and objectives of the Program at least annually and present any proposed changes to the Committee for its approval. Given the dynamics of the marketplace, we regularly evaluate the compensation philosophy, strategy and programs to ensure they accomplish the following objectives:
|
• | | | | Drive and reward performance; |
|
• | | | | Align with long-term shareholder value creation; |
|
• | | | | Allow us to attract and retain the talent needed to effectively execute our strategy; and |
|
• | | | | Provide a competitive total compensation opportunity. |
Compensation Consultant
The Committee has retained Mercer to provide information, analyses and advice regarding executive and director compensation, as described below. The Mercer consultant who performs these services reports directly to the Committee.
The Committee has established procedures that it considers adequate to ensure that Mercer’s advice to the Committee is objective and is not influenced by management. These procedures include: a direct reporting relationship of the Mercer consultant to the Committee; a provision in the Committee’s engagement letter with Mercer specifying the information, data and recommendations that can and cannot be shared with management; an annual report by Mercer to the Committee on Mercer’s financial relationship with us and our affiliates including a summary of the work performed during the preceding 12 months; and written assurances from Mercer that, within the Mercer organization, the Mercer consultant who performs services for the Committee has a reporting relationship and compensation determined separately from Mercer’s other lines of business. Mercer may not undertake services for us without prior approval of the Committee Chair.
At the Committee’s direction, Mercer provided it with the following services:
|
• | | | | Evaluated the competitive positioning of our named executive officers (NEOs) base salaries, annual incentive and long-term incentive compensation relative to our peers and compensation philosophy; |
|
• | | | | Advised the Committee on CEO and other NEO target award levels within the annual and long-term incentive programs and, as needed, on actual compensation actions and assisted in developing compensation terms for the CEO; |
|
• | | | | Reviewed our annual and long-term incentive programs to ensure they are aligned with our philosophy and drive performance; |
|
• | | | | Briefed the Committee on executive compensation trends among our peers and broader industry; |
190
|
• | | | | Advised the Committee, as requested, on the performance measures and performance targets for the annual and long-term incentive programs; |
|
• | | | | Evaluated the impact of the 2004 Long-Term Incentive Plan (LTIP) share usage and total dilution and advised the Committee on a recommended maximum share limit for use for 2008; |
|
• | | | | Conducted a competitive assessment of outside director compensation for the Corporate Governance Committee of PSEG; |
|
• | | | | Evaluated our share ownership guidelines relative to our peers and broader industry; and |
|
• | | | | Assisted with the preparation of this Compensation Discussion and Analysis. |
In the course of conducting its activities, Mercer attended five meetings of the Committee in 2008 and presented its findings and recommendations for discussion.
Prior to hiring Mercer as an executive compensation consultant, the Committee used the services of Cook. In 2008, Cook reviewed the annual incentive payouts for 2007 performance and reviewed the Compensation Discussion and Analysis filed as part of PSEG’s 2008 Proxy Statement.
Recent Committee Actions
During several meetings in 2008, the Committee considered recommendations from Mercer and management with regard to compensation design and effectiveness and reviewed competitive practices within our peer group. The Committee approved the following actions during 2008:
|
• | | | | Adopted a new annual cash incentive compensation program for certain officers, including Mr. DiRisio, and renamed the annual Management Incentive Compensation Program (MICP) for senior officers, including the NEOs other than Mr. DiRisio, as the Senior Management Incentive Compensation Program (SMICP) effective for 2009; |
|
• | | | | Revised performance measures for 2009 annual cash incentive compensation programs; |
|
• | | | | Extended the period during which retirees can exercise vested options from three to five years from the date of retirement, beginning with award grants made in December 2008; |
|
• | | | | Added provisions to awards made under the LTIP to require forfeiture of all unvested equity grants, including performance shares, in cases of termination without cause; |
|
• | | | | Revised performance measures for long-term performance units awards, beginning with the December 2008 grants, to continue the use of Total Shareholder Return and add a new measure, Return on Invested Capital; and |
|
• | | | | Revised the Key Executive Severance Plan to provide for severance payments with respect to terminations without cause in other than change-in-control situations. |
We anticipate a challenging economic environment for 2009. Performance-based compensation helps us manage through both good and bad economic times and recognizes that we need to maintain our focus on operational excellence, financial strength and disciplined investment while attracting and retaining top talent that is critical to accomplishing these objectives. We believe that our performance-based compensation programs will deliver the appropriate compensation based on our results relative to both our business plan and our peers.
The Committee has considered our compensation philosophy, total direct compensation, pay mix and the components of compensation for the CEO and other NEOs in regard to performance, business results and risk. The Committee believes that the current balance of base salary, annual cash incentive award and long-term incentives are appropriate to align the interests of executive officers with shareholders and reward superior performance and that our incentive compensation does not incentivize unnecessary and excessive risk-taking by management.
191
Overview of Current Executive Compensation Programs
The main components of our executive compensation program, including those for our NEOs, are set forth in the following table. A more detailed description is provided in the respective sections below.
| | | | | | | | | | |
Compensation Element | | Description | | Objective |
|
Base Salary | | — | | Fixed cash compensation | | — | | Provides reward for the executive to perform his/her basic job functions |
| | | | | | | | | — | | Assists with recruitment and retention |
|
Annual Cash Incentive | | — | | Paid in cash each year if warranted by performance | | — | | Intended to reward for driving strong operating results over a one-year timeframe |
| | — | | Executive has the opportunity to earn up to 150% of his/her target award, which is based on a percentage of base salary | | — | | Creates a direct strong connection between business success and financial reward |
| | — | | Metrics and goals are established at the beginning of each year and the payout is made based on performance relative to these goals and metrics | | | | |
| | — | | Key metrics for 2008 included: | | | | |
| | | | • | | Return on equity relative to peers | | | | |
| | | | • | | Specific financial, operational and strategic goals | | | | |
|
Long-Term Incentive | | — | | Performance Units | | — | | Rewards for strong operating and stock price performance |
| | | — | | Stock Options | | — | | Provides for strong alignment with shareholders |
| | | — | | Restricted Stock | | — | | Assists with retention |
| | | — | | Restricted Stock Units | | | | |
| | | (See Table under Long-Term Incentive Plan) | | | | |
|
Retirement Plans | | — | | Defined benefit pension plans | | — | | Provides retirement income for participants |
| | — | | Defined contribution plan 401(k) with a partial Company matching contribution | | — | | Assists with recruitment and retention |
|
Deferred Compensation Plan | | — | | Permits participants to defer receipt of a portion of compensation | | — | | Provides participants with the opportunity to more effectively manage their taxes |
| | | | | | | | | — | | Assists with retention |
|
Supplemental Executive Retirement Plan | | — | | Provides supplemental retirement benefits for certain employees beyond qualified plan benefits | | — | | Assists with recruitment and retention |
|
Post-employment Benefits | | — | | Severance and change-in-control benefits | | — | | Assures the continuing performance of executives in the face of a possible termination of employment without cause |
| | | | | | | | | — | | Assists with retention |
|
Other Benefits | | — | | Health care programs | | — | | To be competitive with companies in the energy industry |
| | — | | Limited perquisites | | | | |
192
Role of Chief Executive Officer
The CEO attends Committee meetings, other than executive sessions. Other executive officers and internal compensation professionals may attend portions of Committee meetings, as requested by the Committee. The CEO recommends changes to the salaries of his direct reports (who include the NEOs) within an overall base salary budget approved by the Committee and the Committee considers these recommendations in the context of the peer group. The CEO recommends incentive compensation targets (expressed as a percentage of base salary) for the MICP and LTIP grants for his direct reports as well as the associated goals, objectives and performance evaluations. The CEO participates in the Committee’s discussions of those recommendations.
The design and effectiveness of compensation policies and programs are reviewed by the CEO periodically in light of general industry trends and the peer group and recommendations for changes are made to the Committee as deemed advisable by the CEO. The CEO reviews such compensation matters with our internal compensation professionals and other consultants. The Committee believes that the role played by the CEO in this process is reasonable and appropriate because the CEO is uniquely suited to evaluate the performance of his direct reports.
Peer Group
We set executive compensation to be competitive with other large energy companies within an identified peer group. We consider Base Salary, Total Cash Compensation (base salary plus target annual incentive) and Total Direct Compensation (base salary plus target annual incentive plus target long-term incentive) as the elements of compensation within the peer group for purposes of benchmarking. In December 2007, working with management, the Committee approved a new peer group to more accurately reflect the market from which we recruit executive talent. This peer group is used as a reference point for setting competitive executive compensation and was developed to reflect similarly-sized energy companies with comparable businesses. The Committee targets the median (50th percentile) of this peer group for positions comparable to those of our officers for Total Cash Compensation. The peer group is also used for comparison in assessing our performance under our annual and long-term incentive plans.
The peer companies are as follows:
| | |
American Electric Power Company, Inc. | | FirstEnergy Corp. |
Consolidated Edison, Inc. | | FPL Group, Inc. |
Constellation Energy Group, Inc. | | PG&E Corporation |
Dominion Resources, Inc. | | PPL Corporation |
Duke Energy Corporation | | Progress Energy, Inc. |
Edison International | | Sempra Energy |
Entergy Corporation | | The Southern Company |
Exelon Corporation | | Xcel Energy Inc. |
The following table shows a comparison to our peer companies based on the most recently available financial data.
| | | | | | |
| | 2007 Revenue ($) | | 2007 Net Income ($) | | Market Cap at
12/31/07 ($) |
|
| | Millions |
Peer Group 75th Percentile | | | | 15,286 | | | | | 1,359 | | | | | 25,902 | |
Peer Group Median | | | | 13,117 | | | | | 1,154 | | | | | 19,006 | |
Peer Group 25th Percentile | | | | 11,473 | | | | | 990 | | | | | 15,946 | |
PSEG | | | | 12,853 | | | | | 1,339 | | | | | 24,984 | |
193
Target Total Direct Compensation
The Committee reviews target total cash compensation and target total direct compensation of each of the NEOs in comparison to the peer group. The data used for the comparisons below are from the most recent data available for the companies in the peer group as of the time each comparison was made. The Committee considers a range of 90% to 110% of the 50th percentile of comparable positions to be within the competitive median.
2008
For 2008, base salary, target Total Cash Compensation and target Total Direct Compensation of each of the NEOs included in this Form 10-K, as a percentage of the comparative benchmark levels of the 2007 peer group are as follows:
| | | | | | | | | | |
% of Comparative Benchmark Levels |
Name | | Izzo | | O’Flynn | | Selover | | LaRossa | | DiRisio |
|
Base Salary | | | | 77 | | | | | 106 | | | | | 111 | | | | | 87 | | | | | 95 | |
Total Cash Compensation | | | | 77 | | | | | 105 | | | | | 111 | | | | | 87 | | | | | 97 | |
Total Direct Compensation | | | | 81 | | | | | 94 | | | | | 97 | | | | | 91 | | | | | 98 | |
The 2007 peer group was the same as that shown above under Peer Group, except that it included AES, The Williams Company and TXU and did not include Constellation Energy Group, Inc., and PPL Corporation.
2009
For 2009, base salary, target Total Cash Compensation and target Total Direct Compensation of the NEOs, which includes the grant of long-term incentives made in December 2008, as a percentage of the comparative benchmark levels of the peer group are as follows:
| | | | | | | | | | |
% of Comparative Benchmark Levels |
Name | | Izzo | | O’Flynn | | Selover | | LaRossa | | DiRisio |
|
Base Salary | | | | 77 | | | | | 106 | | | | | 106 | | | | | 95 | | | | | 98 | |
Total Cash Compensation | | | | 89 | | | | | 100 | | | | | 106 | | | | | 92 | | | | | 98 | |
Total Direct Compensation | | | | 96 | | | | | 95 | | | | | 97 | | | | | 99 | | | | | 99 | |
Pay Mix
The Committee believes that Total Direct Compensation is a better measure for evaluating executive compensation than focusing on each of the elements individually and we do not set a formula to determine the mix of the various elements. The mix of base salary and annual cash incentive for each of the executive positions is surveyed from the peer group. The reported pay structure from the competitive analysis is used as a general guideline in determining the appropriate mix of compensation among base salary, annual and long-term incentive compensation opportunity. However, we also consider that the majority of a senior executive’s compensation should be performance-based and the more senior an executive is in the organization, the more his/her pay should be oriented toward long-term compensation.
194
For 2008 and 2009, the mix of base salary, target annual cash incentive and long-term incentive is presented below for the CEO as well as the average for the other NEOs:

CEO Compensation
Mr. Izzo had an employment contract from October 2003 which expired by its terms in October 2008, that detailed key employment terms. Instead of entering into a new employment contract, the Committee, working with Mercer, decided to provide him with a severance agreement incorporating certain of the severance provisions of his expiring employment agreement. The Committee also developed a compensation package for Mr. Izzo for 2009 and beyond. This allows the Committee added flexibility for the future as the terms of many of the programs are now governed by the Company-wide program and not the CEO’s specific contract.
The new arrangement went into effect in January 2009 and was designed to position Mr. Izzo’s total pay around the median of the market, recognizing that Mr. Izzo’s prior compensation tended to be below median. Mr. Izzo has demonstrated strong performance over his tenure as CEO and the Committee believes this new arrangement is appropriate. The changes to the key terms of Mr. Izzo’s compensation in 2009 are as follows:
|
• | | | | Base Salary: The Committee intended to position Mr. Izzo’s salary at $1.25 million, which is the median of the peer group. However, given the challenging economic environment, Mr. Izzo volunteered to forego a 2009 salary increase. The Committee agreed to postpone any increases to his base salary until 2010 and his 2009 salary will remain $950,000. |
|
• | | | | Annual Cash Incentive: The Committee intended to maintain the CEO’s annual incentive at 100% of salary ($950,000), but decided to use the originally-contemplated $1.25 million salary as the basis for the target incentive. This decision was made to position his target compensation closer to the median of the market while not increasing base salary. |
|
• | | | | Long-term Incentive: The Committee had proposed to establish the CEO’s long-term incentive target for 2009 at $5.25 million, which, when combined with the intended salary ($1.25 million) and the target annual incentive, would have positioned his targeted Total Direct Compensation around the market median. However, given the challenging economic environment, the Committee set the long-term target amount at $4.725 million (10% lower than initially proposed). |
|
• | | | | All other compensation and benefit levels were maintained at 2008 levels. |
The CEO’s new compensation level is reflected above in the competitive positioning detailed in Target Total Direct Compensation. A recommendation with respect to CEO compensation was included with data presented to the Committee by management. After meeting in executive session, without the CEO, the committee determined CEO compensation in consultation with all the independent directors of PSEG.
Compensation Components
Base Salary
As the reference point for competitive base salaries, the Committee considers the median of the base salaries provided to executives in the peer group who have duties and responsibilities similar to those of our executive officers. The Committee also considers the executive’s current salary and makes adjustments based
195
principally on individual performance and experience. Each NEO’s base salary level is reviewed annually by the Committee using a budget it establishes for merit increases and salary survey data provided by Towers Perrin, a compensation consulting firm, and reviewed by Mercer. The NEO’s individual performance and his/her business unit’s performance are considered in setting salaries.
The Committee considers base salaries and salary adjustments for individual NEOs, other than the CEO, based on the recommendations of the CEO, considering the NEO’s level of responsibilities, experience in position, sustained performance over time, results during the immediately preceding year and the pay in relation to the benchmark median. Performance metrics include achievement of financial targets, safety and operational results, customer satisfaction, regulatory outcomes and other factors. In addition, factors such as leadership ability, managerial skills and other personal aptitudes and attributes are considered. Base salaries for satisfactory performance are targeted at the median of the competitive benchmark data.
For 2008, the merit increase budget was set at 3.75% and base salaries for the NEOs as a group were increased by 5.6% over 2007 levels to reflect general market adjustments for comparable positions. The 5.6% average included a special market-based pay adjustment that the Committee determined was needed to reduce the gap between current salary and the competitive pay level reported for Mr. LaRossa’s position relative to the peer group. Mr. Izzo’s 2008 base salary was increased to $950,000, which is below the peer group median due to his relatively recent promotion to CEO.
For 2009, the Committee set the merit increase budget at 3.0% and, as mentioned above, held the base salary for Mr. Izzo at the 2008 level, or $950,000, which is below the median provided to CEOs of the peer group companies. The base salaries for the NEO group, with the exception of Mr. LaRossa and Mr. DiRisio, were also held to 2008 levels ($618,000 for Mr. O’Flynn and $520,000 for Mr. Selover). The Committee approved a salary adjustment of 10%, to $468,600, for Mr. LaRossa to provide a level of salary within the competitive range as reported by the 2008 peer group for Mr. LaRossa’s position. The CEO approved a salary adjustment of 3.5%, to $282,600, for Mr. DiRisio to provide a level of salary within the competitive range as reported by the 2008 peer group for Mr. DiRisio’s position. Mr. Izzo’s salary of $950,000 exceeds that of the other NEOs due to his greater level of duties and responsibilities as the principal executive officer to whom NEOs report, and to who the Board of Directors will look for the execution of corporate business plans.
Annual Cash Incentive Compensation
The MICP was approved by stockholders in 2004. It is an annual cash incentive compensation program for our most senior officers, including the NEOs. It has been renamed the SMICP for 2009 and a new plan (New MICP) was adopted for certain other officers including Mr. DiRisio. To support the performance-based objectives of our compensation program, corporate and business unit goals and measures are established each year based on factors deemed necessary to achieve our financial and non-financial business objectives. The goals and measures are established by the CEO for the NEOs reporting to him, and for each other participantby the individual to whom he or she reports.
The MICP sets a maximum award fund in any year of 2.5% of net income. The formula for calculating the maximum award fund for any plan year was determined at the time of plan adoption by reference to, among other things, similar award funds used by other companies and a review of executive compensation practices designed to address compliance with the requirements of Internal Revenue Code (IRC) Section 162(m), which, as explained below, limits the Federal income tax deduction for compensation in excess of certain amounts. If appropriate, the Committee will recommend for stockholder approval any material changes to the MICP required to align the plan with our compensation objectives.
The CEO’s maximum award cannot exceed 10% of the award fund. The maximum award for each other participant cannot exceed 90% of the award fund divided by the number of participants, other than the CEO, for that year. For 2008 performance under the MICP, these limits were $29,694,168 for the total award pool (of which $8,499,900 was awarded), $2,969,417 for the CEO’s maximum award and $477,228 for each other participant’s maximum award.
196
Subject to the overall maximums stated above, NEOs are eligible for annual incentive compensation based on a combination of the achievement of individual performance goals and business/employer performance goals, adjusted by overall corporate performance, as measured by the Corporate Factor. The Corporate Factor for 2008 was a comparison of our Return on Equity (ROE) against the median ROE of our peer group. ROE was used as the key metric as we are in a capital intensive business and believe it is important to drive bottom line results (i.e., earnings) and ensure we are delivering a sufficient return on our equity base.
A maximum MICP award is based on a comparative performance of 1.5 and is achieved if our annual ROE, as measured on September 30, exceeds by at least 5% the median ROE performance of the peer companies. (We use September 30, as opposed to year-end ROE, as information on peer performance is not released in time to pay our awards out in the early part of the year.) The minimum award threshold, based on a comparative performance factor of 0.5, is reached if our ROE is not more than 5% below the peer group median. If the ROE is less than 5% below the peer group median, the comparative performance factor is 0. This approach is summarized in the table below:
| | |
PSEG ROE vs. Peer group median | | Payout Factor |
|
More than 5% below median | | | | 0.0 | |
Not more than 5% below median | | | | 0.5 | x | |
At the median | | | | 1.0 | x | |
5% or more above median | | | | 1.5 | x | |
The actual incentive award factor (A) for each participant in the MICP is computed as follows: the sum of the participant’s Individual Performance Factor (B) (0.0 to 1.5) and Business/Employer Performance Factor (C) (0.0 to 1.5), is multiplied by the Corporate Factor (D) to arrive at the final goal result. This in turn is multiplied by the Individual Target Percent (E) to determine the Award Amount. A graphic representation of the plan is provided below:
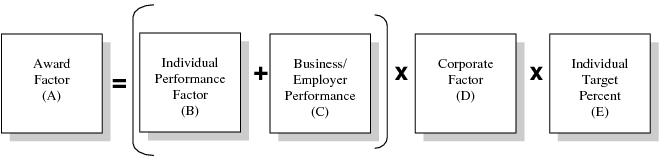
Performance goals and levels of achievement for the NEOs for 2008 are set forth below. The NEOs had no separate Business/Employer Performance goals for 2008. Each NEO position has a targeted incentive award established by the Committee at the beginning of each year ranging from 45% to 100% of base salary. Annual incentive awards are intended to provide a competitive level of compensation if we meet our financial goals and the NEO achieves his or her business unit and individual goals. Since MICP targets are set as a percentage of base salary, increases in salary affect target bonuses. Incentive award targets are established for each NEO position and reflect the median reported incentive target for similar positions within the peer group.
For the 2008 performance year, based on our ROE of 13.4%, as compared with the median ROE of the peer group of 13.6%, the Corporate Factor applied to MICP participants was 0.98. The following table shows the three-year comparison of our ROE with that of the peer group for 2008 and 2007 and the Dow Jones Utility Index (DJUI) for 2006 as the median return on equity performance (prior to 2007, the DJUI
197
was used as the reference). Since PSEG’s business mix has moved beyond that of a purely regulated utility we believe the peer group is a more appropriate comparison.
| | | | | | |
MICP Corporate Factor
Return On Equity |
|
Year | | PSEG% | | Peer Group/
DJUI Median% | | Corporate
Factor |
2008 | | | | 13.4 | | | | | 13.6 | | | | | 0.98 | |
2007 | | | | 19.0 | | | | | 14.5 | | | | | 1.45 | |
2006 | | | | 15.3 | | | | | 13.4 | | | | | 1.19 | |
The MICP awards of the NEOs for 2008 are shown below and in the Summary Compensation Table. The Committee made its determinations regarding MICP awards for the 2008 performance year in February 2009, for payment in March 2009. There were no instances in which the Committee awarded compensation absent achievement of relevant performance goals, or in which it waived or modified goals.
The following table sets forth the goals, measure and performance factors achieved for 2008. Individual Performance Factors achieved may range from a minimum of 0.0 to a maximum of 1.5. A result of 1.0 represents attainment of expected level of performance.
Under the provisions of the MICP, the Individual Performance Factor achieved by each NEO was multiplied by the Corporate Factor, with the resulting amount subject to a maximum of 1.5 times his/her Target Award amount.
| | | | | | | | | | | | | | | | | | | | | | |
2008 MICP Goals and Performance |
| | Individual
Performance
Target Award(1) | | Goals | | Overall Performance Result |
| | Financial | | Operational | | Strategic |
| | % of
Base
Salary | | Target
$ | | Weight | | Achievement
Factor | | Weight | | Achievement
Factor | | Weight | | Achievement
Factor | | Individual
Factor | | Total
Factor | | Award
$ |
| | | | | | | | | | |
Izzo (2) | | | | 100 | % | | | | | 950,000 | | | | | 25 | % | | | | | 1.100 | | | | | 25 | % | | | | | 1.100 | | | | | 50 | % | | | | | 1.050 | | | | | 1.075 | | | | | 1.054 | | | | | 1,000,000 | |
O’Flynn (3) | | | | 60 | % | | | | | 370,800 | | | | | 35 | % | | | | | 1.416 | | | | | 30 | % | | | | | 0.759 | | | | | 35 | % | | | | | 0.960 | | | | | 1.059 | | | | | 1.038 | | | | | 384,800 | |
Selover (4) | | | | 60 | % | | | | | 312,000 | | | | | 25 | % | | | | | 1.128 | | | | | 50 | % | | | | | 1.286 | | | | | 25 | % | | | | | 1.150 | | | | | 1.213 | | | | | 1.189 | | | | | 370,900 | |
LaRossa (5) | | | | 60 | % | | | | | 255,600 | | | | | 35 | % | | | | | 1.079 | | | | | 30 | % | | | | | 1.131 | | | | | 35 | % | | | | | 1.215 | | | | | 1.142 | | | | | 1.119 | | | | | 286,100 | |
DiRisio (6) | | | | 45 | % | | | | | 122,900 | | | | | 20 | % | | | | | 1.500 | | | | | 60 | % | | | | | 1.120 | | | | | 20 | % | | | | | 1.225 | | | | | 1.217 | | | | | 1.193 | | | | | 146,500 | |
|
(1) | | | | Percent of annual base salary. |
|
(2) | | | | Mr. Izzo’s primary goals were: |
|
• | | | | Financial goals included achieving earnings targets, improved credit ratings for PSEG and PSE&G and the effective deployment of capital (weighted @ 25%). The result was 1.100. |
|
• | | | | Operational goals addressed continuous improvement in operational performance through management and workforce development and assisting the PSEG Board in the recruitment of two additional PSEG Board members (weighted @ 25%). The result was 1.100. |
|
• | | | | Strategic goals included the development, communication and execution of a corporate strategy that attracts and rewards a total return oriented shareholder (weighted at 25%) and positioning the Company as a thought leader within the industry by increasing its discourse on issues of importance to stockholders, employees, customers and policymakers (weighted @ 25%). Results were 1.000 and 1.100, respectively. |
198
|
(3) | | | | Mr. O’Flynn’s primary goals were: |
| | | Financial goals addressed earnings and cash flow and capital structure for Energy Holdings as well as the capital structure for PSEG (weighted @ 35%). The result was 1.416. | |
• | | | | Operational goals were closings of asset sales to minimize post closing adjustments, reduction of Sarbanes Oxley control failures, improved earnings and cash forecasting accuracy (weighted @ 15%) and investor relations effectiveness (weighted @ 15%). The results were 1.022 and 0.495, respectively. |
|
• | | | | Strategic goals included building a renewables energy business and exploring growth opportunities (weighted @ 35%). The result was 0.960. |
|
(4) | | | | Mr. Selover’s primary goals were: |
| | | Financial goals addressed reducing costs at Services and the resolution of litigated cases (weighted @ 25%). The result was 1.128. | |
• | | | | Operational goals included improving the operations of PSEG’s public affairs, internal auditing and law function organizations (weighted @ 50%). The result was 1.286. |
|
• | | | | Strategic goals included supporting and implementing energy efficiency and renewable energy programs as they pertain to New Jersey’s Energy Master Plan and working with public policy officials to formulate programs that reduce greenhouse gases (weighted @ 25%). The result was 1.150. |
|
(5) | | | | Mr. LaRossa’s primary goals were: |
| | | Financial goals addressed total capital expenditures against business plan and productivity improvements from prior year expenditures (weighted @ 8.75%) and overall earnings against target projections (weighted @ 26.25%). The results were 0.931 and 1.129, respectively. | |
• | | | | Operational goals included employee training, development and availability (weighted @ 10%), customer service satisfaction measures (weighted @ 10%) and electric and gas reliability and safety measures (weighted @ 10%). The results were 1.203, 1.031 and 1.160, respectively. |
|
• | | | | Strategic goals included the implementation of a new customer service and billing system (weighted @ 5%), implementation of energy efficiency and renewable energy programs (weighted @ 15%) and the execution of the strategic plan for investment and expansion of the transmission system (weighted @ 15%). The results were 1.322, 1.042 and 1.352, respectively. |
|
(6) | | | | Mr. DiRisio’s primary goals were: |
| | | Financial goals included management of departmental costs to budget (weighted @ 10%) and management of audit fees as compared to the peer group (weighted @ 10%). The results were 1.500 and 1.500, respectively. | |
• | | | | Operational goals included timeliness and quality of accounting results (weighted @ 25%), timeliness and quality of results and controls in connection with Sarbanes-Oxley Act section 404 compliance (weighted @ 20%) and accuracy of earnings and cash forecasting results (weighted @ 15%). The results were 1.020, 1.500 and .787, respectively. |
|
• | | | | Strategic goals included staffing initiatives to reduce use of contracted associates (weighted @ 10%) and providing accounting support for business and development activities (weighted @ 10%). The results were 1.250 and 1.200, respectively. |
2009 Changes to the Annual Cash Incentive Program
For 2009, we have modified the structure of the SMICP and added the New MICP. Earnings per share (EPS) from continuing operations will be used as the corporate factor instead of ROE. We believe EPS over
199
one year creates greater connection between individual and company performance. While ROE remains critical to the business, we believe it is more appropriate for the annual incentive to reflect EPS, as the capital decision making in our business is inherently long-term, so that a measure that includes a debt component is more appropriate.
In addition, participants in the SMICP and New MICP, including the NEOs, will have a combination of business unit financial, operational and strategic metrics and goals. Each factor (corporate, business unit financial, business unit operational and business unit strategic) will be weighted based on an executive’s role, with the intention of balancing individual performance with corporate performance. The corporate factor will no longer be used as a multiplying factor as it is currently, instead, it will be weighted along with each of the other metrics.
The Incentive Target amount for Mr. Izzo for 2009 is described above in CEO Compensation. The target amounts for the other NEOs remain at 60% except for Mr. DiRisio who remains at 45% for 2009.
We will provide details on the specific 2009 metrics, goals, weightings and results for each of the NEOs in the 2009 Form 10-K. The Committee believes that the 2009 goals established for the NEOs are consistent in nature with their 2008 goals, and accordingly, the specifics of the 2009 goals are not necessary to an understanding of the NEOs’ 2008 goals and performance.
Long-Term Incentive Compensation
NEOs, other officers as determined by the Committee and other key employees, as selected by the CEO within guidelines established by the Committee, are eligible to participate in the LTIP. This plan is designed to attract and retain qualified personnel for positions of substantial responsibility, motivate participants toward goal achievement by means of appropriate incentives, achieve long-range corporate goals, provide incentive compensation opportunities that are competitive with those of other similar companies and align participants’ interests with those of stockholders. The LTIP was approved by stockholders at the 2004 Annual Meeting. To permit flexibility, the LTIP provides for different forms of equity awards including:
200
| | | | | | | | |
Compensation Element | | Description | | Objective |
|
Performance Units | | — | | Full value shares that are earned based upon Total Shareholder Return and Return on Equity (2008 measure) or Return on Invested Capital (2009 measure) relative to peers over a three-year performance period | | — | | Rewards for strong operating and stock price performance over a longer time frame than annual rewards |
| | | — | | Participants have the opportunity to earn up to 200% of their target award based on performance | | — | | Full value shares assist with retention |
| | | — | | Dividend equivalents are accrued as declared | | | | |
|
Stock Options | | — | | Granted with an exercise price equal to closing stock price on date of grant | | — | | Provide for strong alignment with shareholders as participant only realizes value if the stock price increases |
| | — | | 10 year term | | — | | Assists with retention |
| | — | | Vest proportionately over 4 years | | | | |
| | — | | No discounted options may be granted | | | | |
| | — | | No repricings may be done without shareholder approval | | | | |
|
Restricted Stock | | — | | Grant of full value shares | | — | | Strong retention device as recipient must remain with Company through vesting dates to earn award |
| | | — | | Vest proportionately over 4 years | | | | |
| | | — | | Full voting rights | | | | |
| | | — | | Entitled to all dividends as declared | | | | |
|
Restricted Stock Units | | — | | Right to receive shares of full value stock at vesting dates | | — | | Strong retention device as recipient must remain with Company through vesting dates to earn payout |
| | — | | Vest proportionately over 4 years | | | | |
| | — | | Dividend equivalents are accrued as declared | | | | |
For grants made in December 2008 for 2009, the Committee determined that senior officers, including the NEOs, would be granted a long-term award consisting of 50% performance units and 50% non-qualified stock options, except for Mr. DiRisio who was granted an award of 50% performance units and 50% restricted stock units. We believe this mix provides a strong performance orientation and alignment with shareholder’s interests.
Grant levels are determined by the Committee based upon several factors, including the value of long-term incentive awards made by firms in the peer group to executives in similar positions and whose cash compensation is similar to each NEO as well as the individual’s ability to contribute to our overall success. The level of grants is reviewed annually by the Committee. In general, when making LTIP grants, the Committee’s determinations are made independently from any consideration of the individual’s prior LTIP awards.
The CEO determines his recommendations for the size of long-term incentive awards for NEOs and each other participant in part by analyzing long-term incentive award values granted to executives for comparable positions as reported in the peer group. Median long-term incentive values for comparable levels of base salary for executive positions within the peer group are used as a further reference for determining the recommended grant size for NEOs and other officers. In making a recommendation for the size of a particular LTIP grant for each NEO, the CEO adjusts this average to reflect the individual’s performance and ability to contribute to our long-term value.
201
Performance units granted in December 2007 for 2008 are subject to the achievement of certain goals related to Total Shareholder Return (TSR) and ROE over a three-year performance period following the respective grant dates, with the weighting varied based on a matrix (see below). TSR relative to the peer group was selected as it provides strong alignment with our shareholders and provides the incentive to deliver a return to shareholders greater than that of our peers. ROE relative to peers is used to ensure we are effectively using our equity base. Based upon performance relative to the peer group on both TSR and ROE, executives can earn a stock award of up to 200% of their target performance unit grant for outstanding performance, although the entire award can be forfeited if we do not achieve a threshold level of performance relative to peers.
| | | | | | | | | | | | |
Stock Award as % of Performance Units Granted |
| | |
ROE
Performance
Relative to
16 Peer
Companies | | Above 2% | | 40% | | 120% | | 140% | | 180% | | 200% |
| |
| | Above 1% to 2% | | 20% | | 80% | | 120% | | 140% | | 180% |
| |
| | +/- 1% | | 0% | | 40% | | 100% | | 120% | | 140% |
| |
| | Below -1% to -2% | | 0% | | 20% | | 40% | | 80% | | 120% |
| |
| | Below -2% to -3% | | 0% | | 0% | | 0% | | 20% | | 40% |
| |
| | Below -3% | | 0% | | 0% | | 0% | | 0% | | 0% |
| |
| | Ranking | | 13-17 | | 10-12 | | 7-9 | | 4-6 | | 1-3 |
TSR RANKING (16 PEER COMPANIES & PSEG) |
For awards approved in December 2008, the performance units will be earned based upon TSR relative to peers (weighted 50%) and Average Return on Invested Capital (ROIC) vs. plan (weighted 50%) for a three-year performance period ending December 31, 2011. We believe this change enhances the performance orientation of the awards as ROIC captures our entire capital base and the use of an absolute target for this metric provides alignment with our business plan.
Retirement
We provide certain qualified retirement benefits to maintain practices that are competitive with companies in the energy services industry with which we compete for executive talent. In addition to the qualified plans, we maintain supplemental plans to provide competitive retirement benefits. Our supplemental executive retirement plans have been adopted to assist in the recruitment and retention of key employees.
|
• | | | | The Retirement Reinstatement Plan is an unfunded excess benefit plan that provides retirement benefits that would have been paid under our qualified retirement plans but for the compensation limitations of the IRC which caps the amount of an employee’s compensation that may be considered for qualified plan purposes. All employees who are affected by these limits are eligible to participate. |
|
• | | | | The Mid-Career Hire Supplemental Retirement Income Plan is an unfunded retirement benefit plan that is primarily used as a recruitment tool in that it provides retirement benefits based upon additional credited years of service for prior allied professional or industry experience. Participation is limited to employees selected by the CEO. |
|
• | | | | The Limited Supplemental Benefits Plan is an unfunded retirement benefit plan that provides supplemental retirement and death benefits to participants and that is primarily used as a recruitment and retention tool. Participation is limited to employees nominated by the CEO and approved by the Company’s Employee Benefits Policy Committee. |
202
Deferred Compensation Plan
We offer a deferred compensation plan to our executive officers so they can more effectively manage their personal tax obligations. Participants may elect to defer all or any portion of their compensation, and may choose from among several different rates of return based upon the choices available in the Company’s 401(k) Plan, as well as the prime rate plus1/2%.
Severance and Change-in-Control Benefits
We provide severance benefits in the event of certain employment terminations. These benefits are available to officers, including the NEOs, in order to be competitive with companies in the energy industry. The Committee compares the benefits made available to NEOs and officers in the event of a termination to that generally offered by other companies in our industry. The severance agreement of Mr. Izzo and the employment agreement of Mr. O’Flynn also provide for certain severance benefits.
We also provide severance benefits upon a change-in-control to officers, including the NEOs, and to certain executive level employees. A change-in-control is by its nature disruptive to an organization and to many executives. Such executives are frequently key players in the success of organizational change. To assure the continuing performance of such executives in the face of a possible termination of employment in the event of a change-in-control, we provide a competitive severance package. In addition, some executives, not key parties to such transaction, may have their employment terminated following its completion. A severance plan with benefits applicable upon a change-in-control is an important element for attracting and retaining key executives. Under our Key Executive Severance Plan, in the event an executive receives change-in-control benefits and the executive is subject to excise tax related to the change-in-control payment, the Company will gross up the executive’s payment to keep him/her whole. Mr. O’Flynn’s employment agreement provides a similar benefit.
Severance and change-in-control benefits are described under Potential Payment upon Termination of Employment or Change in Control.
Perquisites
We provide certain perquisites that we believe are reasonably within compensation practices of our peers or provide benefit to the Company. These include automobile use (and for the CEO, a driver), financial planning services (discontinued for 2009), annual physical examinations, spousal travel to accompany executive officers on business trips (discontinued for 2009), Company-purchased tickets to entertainment and sporting events, home security and home computer services. These perquisites are described in the Summary Compensation Table.
We do not provide a tax gross-up of personal benefit amounts deemed to be taxable income under federal or state income tax laws and regulations, except for certain relocation expenses, primarily in the case of newly-hired executives.
Clawbacks
In 2008, we adopted provisions that require a participant to forfeit any annual or long-term incentive grants and repay profits made on sales of LTIP shares if they are earned as a result of misconduct related to accounting restatements. LTIP grants and shares received on exercise of LTIP grants are also subject to clawback if the participant violates his/her non-compete, non-solicitation or confidentiality agreements.
Stock Ownership and Retention Policy
In 2007, in order to strengthen the alignment of the interests of management with those of stockholders, we established a Stock Ownership and Retention Policy (Policy). Each officer must acquire a prescribed amount of shares within five years of the adoption of the Policy or the date they are elected or promoted. The following shares owned by the officer are counted toward the ownership requirement: (i) shares held in trusts for the benefit of immediate family members where the officer is the trustee, (ii) shares granted to the officer in the form of restricted stock and restricted stock units, whether or not vested, and (iii) shares held by the officer in the 401(k) Plan. Stock options and performance units (as distinct from shares which are
203
actually issued as a result of exercise or vesting) are not counted. Shares subject to hedging or monetization transactions (such as zero-cost collars and forward sale contracts), which allow the officer to retain legal ownership without its full risks and rewards, are not counted for purposes of either the ownership or retention provisions of the Policy.
Each officer must retain at least 100%, after tax and costs of issuance, of all shares acquired through equity grants made subsequent to the adoption of the policy, including the vesting of restricted stock or restricted stock unit grants, payout of performance awards and exercise of option grants, until the ownership requirement is met. Once an officer attains his/her required level of stock ownership, he/she must retain 25%, after tax and costs of issuance, of shares until retirement or his or her employment otherwise ends.
In the event an officer is not in compliance with any provision of the Policy, the Committee may take such action as it deems appropriate, consistent with the provisions of our compensation plans and applicable law and regulations, to enable the officer to achieve compliance at the earliest practicable time or otherwise enforce the Policy. Such action may include establishing conditions with respect to all or part of any SMICP or LTIP award. The Committee may vary the application of the provisions of the Policy for good cause or exceptional circumstances.
The Policy was not a factor considered by the Committee in making 2009 grants under the LTIP.
The following table shows, for each NEO, the dollar amount of stock ownership required by the Policy and the dollar amount of actual holdings as of February 20, 2009. For each of the NEOs, compliance must be achieved by November 20, 2012.
| | | | | | |
Name | | Multiple Required | | Required Amount ($)(1) | | Amount Held ($)(2) |
|
Izzo | | | | 5 | | | | | 4,750,000 | | | | | 6,119,507 | |
O’Flynn | | | | 3 | | | | | 1,854,000 | | | | | 4,504,139 | |
Selover | | | | 3 | | | | | 1,560,000 | | | | | 1,856,938 | |
LaRossa | | | | 3 | | | | | 1,405,800 | | | | | 271,838 | |
DiRisio | | | | 1 | | | | | 282,600 | | | | | 722,079 | |
|
(1) | | | | Determined on basis of base salary on the effective date of the current salary of each of the NEOs which was January 1, 2008 for all NEOs, except Mr. LaRossa and Mr. DiRisio, for whom the date was January 1, 2009. |
|
(2) | | | | Based on average price of Common Stock for the twelve months preceding the effective date of the current base salary of each NEO ($39.54 for Mr. LaRossa and Mr. DiRisio; $42.65 for each other NEO). |
Employment Agreements
We have entered into an employment agreement with Mr. O’Flynn and a severance agreement with Mr. Izzo. These are discussed following the Grants of Plan-Based Award Table below.
Accounting and Tax Implications
The Committee has considered the effect of the adoption of Financial Accounting Standard (FAS) 123R (see Note 16. Stock Based Compensation) regarding the expensing of stock options in determining the nature of the grants under the LTIP. The Committee, with the assistance of its compensation consultant, reviews the competitiveness of the NEOs’ LTIP grants, as measured against the peer group, using reported FAS 123R grant values and approves grants to the NEOs accordingly as reported above in Long-Term Incentive Compensation.
The Committee considers the tax-deductibility of our compensation payments. IRC Section 162(m) generally denies a deduction for United States federal income tax purposes for compensation in excess of $1 million for persons named in the proxy statement, except for performance-based compensation pursuant to stockholder-approved plans. Stockholder approval of the LTIP and MICP was received at the 2004 Annual
204
Meeting of Stockholders. As a result, performance-based compensation under these plans is not now subject to the limitation on deductions contained in Section 162(m) of the IRC.
In 2008, Mr. Izzo had compensation (consisting of base salary and the taxable value of restricted stock that vested during the year) in excess of the amount deductible under Section 162(m) of the IRC. The Committee will continue to evaluate executive compensation in light of Section 162(m) of the IRC.
In light of Section 162(m), as well as certain NYSE rules, the Committee’s general policy is to present all incentive compensation plans in which executive officers participate to shareholders for approval prior to implementation.
SUMMARY COMPENSATION TABLE
| | | | | | | | | | | | | | | | | | |
Name and
Principal Position(1) | | Year | | Salary
($)(2) | | Bonus
($)(3) | | Stock
Awards
($)(4) | | Option
Awards
($)(5) | | Non-Equity
Incentive
Plan
Compensation
($)(6) | | Change in
Pension
Value and
Non-Qualified
Deferred
Compensation
Earnings
($)(7) | | All Other
Compensation
($)(8,9) | | Total
($) |
|
Ralph Izzo | | | | 2008 | | | | | 944,342 | | | | | — | | | | | 1,774,059 | | | | | 1,169,632 | | | | | 1,000,000 | | | | | 880,615 | | | | | 232,099 | | | | | 6,000,747 | |
Chairman of the Board, | | | | 2007 | | | | | 845,388 | | | | | 100,000 | | | | | 1,364,142 | | | | | 671,758 | | | | | 1,282,500 | | | | | 663,930 | | | | | 208,405 | | | | | 5,136,123 | |
President, and Chief | | | | 2006 | | | | | 559,920 | | | | | — | | | | | 778,585 | | | | | 272,836 | | | | | 437,600 | | | | | 620,394 | | | | | 41,212 | | | | | 2,710,547 | |
Executive Officer | | | | | | | | | | | | | | | | | | |
|
Thomas M. O’Flynn | | | | 2008 | | | | | 614,932 | | | | | — | | | | | 591,710 | | | | | 286,207 | | | | | 384,800 | | | | | 308,650 | | | | | 44,983 | | | | | 2,231,282 | |
Executive Vice President | | | | 2007 | | | | | 596,034 | | | | | 50,000 | | | | | 681,041 | | | | | 153,826 | | | | | 540,000 | | | | | 170,363 | | | | | 67,028 | | | | | 2,258,292 | |
and Chief Financial | | | | 2006 | | | | | 552,926 | | | | | — | | | | | 650,435 | | | | | 26,730 | | | | | 437,600 | | | | | 575,436 | | | | | 39,730 | | | | | 2,282,857 | |
Officer | | | | | | | | | | | | | | | | | | |
|
R. Edwin Selover | | | | 2008 | | | | | 517,425 | | | | | — | | | | | 270,297 | | | | | 382,159 | | | | | 370,900 | | | | | 188,333 | | | | | 41,738 | | | | | 1,770,852 | |
Executive Vice President | | | | 2007 | | | | | 501,963 | | | | | — | | | | | 696,875 | | | | | 366,816 | | | | | 454,500 | | | | | 54,787 | | | | | 40,113 | | | | | 2,115,054 | |
and General Counsel | | | | 2006 | | | | | 473,225 | | | | | — | | | | | 425,019 | | | | | 17,819 | | | | | 356,300 | | | | | 494,725 | | | | | 45,434 | | | | | 1,812,522 | |
|
Ralph LaRossa | | | | 2008 | | | | | 422,471 | | | | | — | | | | | 315,247 | | | | | 193,898 | | | | | 286,100 | | | | | 231,000 | | | | | 60,031 | | | | | 1,508,747 | |
President and Chief | | | | 2007 | | | | | 377,431 | | | | | — | | | | | 251,879 | | | | | 97,944 | | | | | 342,000 | | | | | 195,000 | | | | | 48,474 | | | | | 1,312,728 | |
Operating Officer | | | | 2006 | | | | | 238,720 | | | | | — | | | | | 155,230 | | | | | 4,536 | | | | | 176,400 | | | | | 135,000 | | | | | 35,633 | | | | | 745,519 | |
(PSE&G) | | | | | | | | | | | | | | | | | | |
|
Derek DiRisio | | | | 2008 | | | | | 276,108 | | | | | — | | | | | 153,816 | | | | | — | | | | | 146,500 | | | | | 72,000 | | | | | 21,720 | | | | | 670,144 | |
Vice President and | | | | 2007 | | | | | 252,208 | | | | | — | | | | | 135,095 | | | | | — | | | | | 172,100 | | | | | 45,000 | | | | | 20,350 | | | | | 624,753 | |
Controller | | | | 2006 | | | | | 214,196 | | | | | 58,800 | | | | | 97,893 | | | | | 4,536 | | | | | 112,900 | | | | | 101,000 | | | | | 20,353 | | | | | 609,678 | |
|
(1) | | | | Mr. Izzo was elected to his current position effective April 1, 2007. He was President and COO of PSEG from October 1, 2006 until March 31, 2007 and President and COO of PSE&G through September 30, 2006. |
|
| | | | Mr. LaRossa was elected to his current position effective October 1, 2006. Previously he was Vice President—Electric Delivery. |
|
(2) | | | | Mr. Selover’s 2008, 2007 and 2006 salary includes $52,000, $52,000 and $39,000, respectively, deferred under the Deferred Compensation Plan. |
|
(3) | | | | In 2007, Mr. Izzo and Mr. O’Flynn each received a special achievement award for smooth transition of the merger termination with Exelon and strong operating performance. In 2006, Mr. DiRisio received a bonus representing a key employee retention award. |
|
(4) | | | | The amounts shown reflect the expense included on PSEG’s financial statements for 2008, 2007 and 2006 related to restricted stock awards and performance units granted in current or prior years under the LTIP and still outstanding as determined under FAS 123R. The fair value at the grant date of the number of shares of equity awards granted in 2008 is shown in the Grants of Plan-Based Awards Table. Generally, restricted stock awards vest one-fourth annually. Awards made prior to 2007 vest one-third annually. Recipients of restricted stock awards receive dividends at the regular dividend rate and are paid on each regular dividend date. Under their terms, all unvested shares of restricted stock vest immediately upon retirement. |
|
| | | | Performance units are denominated in shares of Common Stock and are subject to achievement of certain performance goals over a three-year period and are payable as determined by the Company in shares of stock or cash. For a discussion of the assumptions made in valuation see Note 16. Stock Based Compensation. |
205
Under FAS 123R, the respective amounts attributable to restricted stock and performance units are as follows:
| | | | | | | | | | |
| | Izzo ($) | | O’Flynn ($) | | Selover ($) | | LaRossa ($) | | DiRisio ($) |
|
Restricted Stock (2008) | | | | 337,760 | | | | | 252,579 | | | | | 169,118 | | | | | 90,282 | | | | | 83,616 | (a) | |
Performance Units (2008) | | | | 1,436,299 | | | | | 339,131 | | | | | 101,179 | | | | | 224,965 | | | | | 70,200 | |
Restricted Stock (2007) | | | | 612,747 | | | | | 484,598 | | | | | 325,517 | | | | | 128,093 | | | | | 94,730 | (a) | |
Performance Units (2007) | | | | 751,395 | | | | | 196,443 | | | | | 371,358 | | | | | 123,786 | | | | | 40,365 | |
Restricted Stock (2006) | | | | 691,123 | | | | | 562,973 | | | | | 372,541 | | | | | 140,918 | | | | | 83,581 | |
Performance Units (2006) | | | | 87,462 | | | | | 87,462 | | | | | 52,478 | | | | | 14,312 | | | | | 14,312 | |
|
(a) | | | | Includes restricted stock and restricted stock units, which are valued equally. |
| | | The amounts shown reflect the expense included on PSEG’s financial statements for 2008, 2007 and 2006 related to options granted in current or prior years under the LTIP and still outstanding as determined under FAS 123R. The fair value at the grant date of the number of shares of equity awards granted in 2008 and 2007 is shown below in the Grants of Plan-Based Awards Table. For a discussion of the assumptions made in valuation see Note 16. Stock Based Compensation. | |
(6) | | | | Amounts awarded were earned under the MICP and determined and paid in the following year. Mr. Izzo elected to defer his entire 2008, 2007 and 2006 awards under the Deferred Compensation Plan. Mr. O’Flynn deferred his entire 2006 award under the Deferred Compensation Plan. |
|
(7) | | | | Includes change in actuarial present value of accumulated benefit under defined benefit pension plans and supplemental executive retirement plans between December 31, 2007 and December 31, 2008, December 31, 2006 and December 31, 2007 and between December 31, 2005 and December 31, 2006 determined by calculating the benefit under the applicable plan benefit formula for each of the plans, based on credited service and earnings in effect at the respective measurement dates. These changes are: |
| | | | | | | | | | |
| | Izzo ($) | | O’Flynn ($) | | Selover ($) | | LaRossa ($) | | DiRisio ($) |
|
2008 | | | | 862,000 | | | | | 305,000 | | | | | 174,000 | | | | | 231,000 | | | | | 72,000 | |
2007 | | | | 626,000 | | | | | 157,000 | | | | | 15,000 | | | | | 195,000 | | | | | 45,000 | |
2006 | | | | 601,000 | | | | | 571,000 | | | | | 469,000 | | | | | 135,000 | | | | | 101,000 | |
Includes interest earned under the Deferred Compensation Plan at the prime rate plus1/2%, to the extent that it exceeds 120% of the applicable long-term rate. These amounts are:
| | | | | | | | | | |
| | Izzo ($) | | O’Flynn ($) | | Selover ($) | | LaRossa ($) | | DiRisio ($) |
|
2008 | | | | 18,615 | | | | | 3,650 | | | | | 14,333 | | | | | — | | | | | — | |
2007 | | | | 37,930 | | | | | 13,363 | | | | | 39,787 | | | | | — | | | | | — | |
2006 | | | | 19,394 | | | | | 4,436 | | | | | 25,725 | | | | | — | | | | | — | |
|
(8) | | | | Depending on the individual, includes perquisites and personal benefits which include (a) automobile, gas, parking and maintenance, (b) financial planning services, (c) physical examinations and related transportation, (d) home computer and related services, (e) home security systems, (f) spousal travel, and (g) personal/family entertainment. For automobiles, the pro rata personal usage value of the vehicle lease cost was used; for parking, the amount charged back to the NEO’s business unit for the |
206
| | | | space was used; for the driver, actual compensation and benefit expense was used; for gasoline and maintenance, estimates were used based on the vehicle’s personal use mileage. For each NEO, each perquisite received in 2008 that exceeded the greater of $25,000 or 10% of his total perquisite and personal benefit amount is shown below: |
| | | | | | | | | | | | Izzo ($)(a) | | O’Flynn ($) | | Selover ($) | | LaRossa ($) | | DiRisio ($) |
Auto, Gas, Parking &
Maintenance | | | | 209,042 | | | | | 24,032 | | | | | 24,362 | | | | | 24,077 | | | | | 13,056 | |
|
(a) | | | | Mr. Izzo received the services of a driver for business, commuting and occasional personal use. |
Includes the following employer contributions in 2008 to the Company’s 401(k) plan in the same percentage match generally available to all employees:
| | | | | | | | | | | | Izzo ($) | | O’Flynn ($) | | Selover ($) | | LaRossa ($) | | DiRisio ($) |
Thrift and Tax-Deferred Savings Plan | | | | 9,200 | | | | | 9,200 | | | | | 9,200 | | | | | 9,200 | | | | | 8,058 | |
GRANTS OF PLAN-BASED AWARDS TABLE
| | | | | | | | | | | | | | | | | | | | | | |
Name | | Grant
Date (1) | | Estimated Possible
Payouts Under
Non-Equity Incentive
Plan Awards (2) | | Estimated Future
Payouts Under
Equity Incentive
Plan Awards (3) | | All Other
Stock
Awards;
Number
of Shares
of Stock
or Units
(#) | | All Other
Option
Awards;
Number of
Securities
Underlying
Options
(#) | | Exercise
or Base
Price of
Option
Awards
($/Sh) | | Grant
Date
Fair
Value
of Stock
and
Option
Awards
($)(4) |
| | Threshold
($) | | Target
($) | | Maximum
($) | | Threshold
(#) | | Target
(#) | | Maximum
(#) |
|
Ralph Izzo | | | | | | 475,000 | | | | | 950,000 | | | | | 1,425,000 | | | | | | | | | | | — | | | | | — | | | | | |
Performance Units | | | | 12/16/08 | | | | | | | | | | | 0 | | | | | 77,500 | | | | | 155,000 | | | | | | | | | | | 2,734,200 | |
Stock Options | | | | 12/16/08 | | | | | | | | | | | | | 473,400 | | | | | | | | | | | 30.03 | | | | | 2,537,424 | |
Thomas M. O’Flynn | | | | | | 185,400 | | | | | 370,800 | | | | | 556,200 | | | | | | | | | | | — | | | | | — | | | | | |
Performance Units | | | | 12/16/08 | | | | | | | | | | | 0 | | | | | 14,800 | | | | | 29,600 | | | | | | | | | | | 522,144 | |
Stock Options | | | | 12/16/08 | | | | | | | | | | | | | 90,200 | | | | | | | | | | | 30.03 | | | | | 483,472 | |
R. Edwin Selover | | | | | | 156,000 | | | | | 312,000 | | | | | 468,000 | | | | | | | | | | | — | | | | | — | | | | | |
Performance Units | | | | 12/16/08 | | | | | | | | | | | 0 | | | | | 13,100 | | | | | 26,200 | | | | | | | | | | | 462,168 | |
Stock Options | | | | 12/16/08 | | | | | | | | | | | | | 80,200 | | | | | | | | | | | 30.03 | | | | | 429,872 | |
Ralph LaRossa | | | | | | 127,800 | | | | | 255,600 | | | | | 383,400 | | | | | | | | | | | — | | | | | — | | | | | |
Performance Units | | | | 12/16/08 | | | | | | | | | | | 0 | | | | | 12,300 | | | | | 24,600 | | | | | | | | | | | 433,944 | |
Stock Options | | | | 12/16/08 | | | | | | | | | | | | | 75,200 | | | | | | | | | | | 30.03 | | | | | 403,072 | |
Derek DiRisio | | | | | | 61,500 | | | | | 122,900 | | | | | 184,400 | | | | | | | | | | | — | | | | | — | | | | | |
Performance Units | | | | 12/16/08 | | | | | | | | | | | 0 | | | | | 3,300 | | | | | 6,600 | | | | | | | | | | | 116,424 | |
Restricted Stock Units | | | | 12/16/08 | | | | | | | | | | | | | 3,550 | | | | | | | | | | | | | 106,607 | |
|
(1) | | | | Relates to equity awards. |
|
(2) | | | | Represents possible payouts under MICP for 2008 performance. The actual awards were determined in February 2009 and paid in March 2009 as reported in the Summary Compensation Table. |
|
(3) | | | | Represents LTIP awards described below. |
|
(4) | | | | Represents the fair value at the grant date of the equity awards granted in 2008. For a discussion of the assumptions made in valuation see Note 16. Stock Based Compensation. |
207
Material Factors Concerning Awards Shown in Summary Compensation Table, Grants of Plan-Based Awards Table and Employment Agreements
MICP
The Plan-based awards for annual cash incentive compensation included in the Summary Compensation Table were paid in 2009 with respect to 2008 performance under the terms of the MICP. The range of possible awards for each NEO in relation to his Target Award is set forth in the Grants of Plan-Based Awards Table above. An explanation of the MICP and each NEO’s individual performance goals, measures and performance factors achieved are described under 2008 MICP Goals and Performance in Compensation Discussion and Analysis.
The NEOs MICP awards for 2008 were as follows:
| | | | | | | | |
Izzo ($) | | O’Flynn ( $) | | Selover ($) | | LaRossa ($) | | DiRisio ($) |
|
1,000,000 | | 384,800 | | 370,900 | | 286,100 | | 146,500 |
LTIP
As discussed in the Compensation Discussion and Analysis and on the table shown above, LTIP awards were made to NEOs in 2008. The Committee, on December 16, 2008, approved the regularly scheduled grants in the form of stock options and performance units to Mr. Izzo and the other NEOs, except for Mr. DiRisio whose grant consisted of restricted stock units and performance units. The December 2008 grants are shown in the above table. One-fourth of the stock options and restricted stock units vest each December and January, respectively, over a four-year period. The three-year performance period for performance units ends on December 31, 2011.
Grants of performance units allow award recipients to receive 100% of their grant amount if, for the three-year performance period ending on December 31, 2011 (a) PSEG’s TSR places it at the 50th percentile of the peer group of companies selected by the Committee and (b) PSEG’s ROIC for the three year performance period is 10.9%. For performance above or below these levels, the final award could be increased to as much as 200% of the grant amount (TSR at the 75th percentile and ROIC at 13.1%) or decreased to zero. The minimum payout opportunity is 25% of the grant amount (TSR at the 35th percentile and ROIC at 8.7%). See Compensation Discussion and Analysis for additional information.
Employment Agreements
PSEG entered into an employment agreement with Mr. Izzo dated October 18, 2003 which expired on October 18, 2008, covering his employment as President and COO of PSE&G and in other executive positions to which he may be elected through October 18, 2008. The agreement provided that his base salary, target annual incentive bonus and long-term incentive bonus will be determined based on compensation practices of similar companies and that his annual salary will not be reduced during its term. The Agreement also awarded him options with respect to 500,000 shares of Common Stock, which have fully vested. Following expiration of his employment agreement, PSEG entered into a severance agreement with Mr. Izzo incorporating certain of the severance provisions of his expiring agreement.
PSEG entered into an employment agreement dated as of April 18, 2001, and amended as of December 21, 2001, with Mr. O’Flynn covering his employment as Executive Vice President and Chief Financial Officer. The term of the agreement continued until July 1, 2007, with an additional year added to the term annually unless a notice of non-renewal is given by Mr. O’Flynn or us at least 90 days in advance of such date. In the event of a change-in-control (as defined in such agreement), the term of Mr. O’Flynn’s employment is automatically continued until the second anniversary of the change-in-control. The agreement provides that Mr. O’Flynn’s base salary, target annual incentive bonus and long-term incentive bonus will be determined based on compensation practices of similar companies and that his annual salary will not be reduced during its term. The agreement also provided for an award to him of 200,000 shares of restricted Common Stock, which have fully vested. The agreement awarded Mr. O’Flynn options with respect to the purchase of
208
600,000 shares of Common Stock, which are fully vested. The agreement provided for the granting, upon the completion of five years of service, of 15 years of credit under the Mid-Career Plan for Mr. O’Flynn’s prior experience.
For additional information regarding severance benefit provisions applicable to Messrs. Izzo and O’Flynn, see Potential Payments upon Termination of Employment or Change-in-Control.
OUTSTANDING EQUITY AWARDS AT FISCAL YEAR-END (12/31/08) TABLE
| | | | | | | | | | | | | | | | | | |
Name | | Option Awards | | Stock Awards |
| | Number of
Securities
Underlying
Unexercised
Options
Exercisable
(#)(1) | | Number of
Securities
Underlying
Unexercised
Options
Unexercisable
(#)(1) | | Equity
Incentive
Plan Awards:
Number of
Securities
Underlying
Unexercised
Unearned
Options
(#) | | Option
Exercise
Price
($) | | Option
Expiration
Date | | Number of
Shares or
Units of
Stock
that have
Not Vested
(#)(13) | | Market
Value of
Shares or
Units of
Stock
that have
Not Vested
($)(14) | | Equity
Incentive
Plan
Awards:
Number of
Unearned
Shares,
Units or
Other Rights
that have
Not Vested
(#)(15) | | Equity
Incentive
Plan
Awards:
Market
or Payout
Value of
Unearned
Shares,
Units or
Other Rights
that have
Not Vested
($)(14) |
|
Ralph Izzo | | | | | | | | | | | | | | | | | | 183,249 | | | | | 5,345,373 | |
| | | | 400,000 | | | | | — | | | | | | | 20.39 | (6) | | | | | 10/18/2013 | | | | | | | | | |
| | | | 22,000 | | | | | — | | | | | | | 21.38 | (7) | | | | | 5/3/2014 | | | | | | | | | |
| | | | 35,000 | | | | | 105,000 | (2) | | | | | | | 32.93 | (8) | | | | | 1/16/2017 | | | | | | | | | |
| | | | 28,250 | | | | | 84,750 | (3) | | | | | | | 39.17 | (9) | | | | | 3/20/2017 | | | | | | | | | |
| | | | 49,950 | | | | | 149,850 | (4) | | | | | | | 48.21 | (10) | | | | | 12/18/2017 | | | | | | | | | |
| | | | — | | | | | 473,400 | (5) | | | | | | | 30.03 | (11) | | | | | 12/16/2018 | | | | | | | | | |
Thomas M. O’Flynn | | | | | | | | | | | | | | | | 41,816 | | | | | 1,219,773 | |
| | | | 354,000 | | | | | — | | | | | | | 22.93 | (12) | | | | | 7/1/2011 | | | | | | | | | |
| | | | 22,000 | | | | | — | | | | | | | 21.38 | (7) | | | | | 5/3/2014 | | | | | | | | | |
| | | | 20,500 | | | | | 61,500 | (2) | | | | | | | 32.93 | (8) | | | | | 1/16/2017 | | | | | | | | | |
| | | | 11,450 | | | | | 34,350 | (4) | | | | | | | 48.21 | (10) | | | | | 12/18/2017 | | | | | | | | | |
| | | | — | | | | | 90,200 | (5) | | | | | | | 30.03 | (11) | | | | | 12/16/2018 | | | | | | | | | |
R. Edwin Selover | | | | | | | | | | | | | | | | | | 31,030 | | | | | 905,145 | |
| | | | — | | | | | 39,000 | (2) | | | | | | | 32.93 | (8) | | | | | 1/16/2017 | | | | | | | | | |
| | | | 8,250 | | | | | 24,750 | (4) | | | | | | | 48.21 | (10) | | | | | 12/18/2017 | | | | | | | | | |
| | | | — | | | | | 80,200 | (5) | | | | | | | 30.03 | (11) | | | | | 12/16/2018 | | | | | | | | | |
Ralph LaRossa | | | | | | | | | | | | | | | | | | 30,230 | | | | | 881,809 | |
| | | | 13,000 | | | | | 39,000 | (2) | | | | | | | 32.93 | (8) | | | | | 1/16/2017 | | | | | | | | | |
| | | | 8,250 | | | | | 24,750 | (4) | | | | | | | 48.21 | (10) | | | | | 12/18/2017 | | | | | | | | | |
| | | | — | | | | | 75,200 | (5) | | | | | | | 30.03 | (11) | | | | | 12/16/2018 | | | | | | | | | |
Derek DiRisio | | | | | | | | | | | | | | 7,371 | | | | | 215,012 | | | | | 8,893 | | | | | 259,409 | |
|
(1) | | | | Grants of non-qualified options to purchase Common Stock. The date of grant is ten years prior to the option expiration date shown. |
|
(2) | | | | 25% of options vest on each January 16 of 2008, 2009, 2010 and 2011. |
|
(3) | | | | 25% of options vest on each March 20 of 2008, 2009, 2010 and 2011. |
|
(4) | | | | 25% of options vest on each December 18 of 2008, 2009, 2010 and 2011. |
|
(5) | | | | 25% of options vest on each December 16 of 2009, 2010, 2011 and 2012. |
|
(6) | | | | Closing price on NYSE on grant date of 10/18/2003. |
|
(7) | | | | Closing price on NYSE on grant date of 5/3/2004. |
|
(8) | | | | Closing price on NYSE on grant date of 1/16/2007. |
|
(9) | | | | Closing price on NYSE on grant date of 3/20/2007. |
209
|
(10) | | | | Closing price on NYSE on grant date of 12/18/2007. |
|
(11) | | | | Closing price on NYSE on grant date of 12/16/2008. |
|
(12) | | | | Closing price on NYSE on grant date of 7/1/2001. |
|
(13) | | | | Restricted stock and restricted stock units awarded to Mr. DiRisio under the LTIP vest as shown below. Dividends accrue at the regular dividend rate and are paid on each regular dividend payment date as declared by the PSEG Board of Directors. |
| | | | | | |
| | Vesting Date | | Grant Date | | (#) |
Restricted stock | | | | 1/1/2009 | | | | | 1/16/2007 | | | | | 700 | |
Restricted stock | | | | 1/1/2010 | | | | | 1/16/2007 | | | | | 700 | |
Restricted stock | | | | 1/1/2011 | | | | | 1/16/2007 | | | | | 700 | |
Restricted stock units | | | | 12/18/2009 | | | | | 12/18/2007 | | | | | 573 | |
Restricted stock units | | | | 12/18/2010 | | | | | 12/18/2007 | | | | | 574 | |
Restricted stock units | | | | 12/18/2011 | | | | | 12/18/2007 | | | | | 574 | |
Restricted stock units | | | | 1/1/2010 | | | | | 12/16/2008 | | | | | 887 | |
Restricted stock units | | | | 1/1/2011 | | | | | 12/16/2008 | | | | | 888 | |
Restricted stock units | | | | 1/1/2012 | | | | | 12/16/2008 | | | | | 887 | |
Restricted stock units | | | | 1/1/2013 | | | | | 12/16/2008 | | | | | 888 | |
|
(14) | | | | Value represents number of shares multiplied by the closing price on the NYSE on December 31, 2008 of $29.17. |
|
(15) | | | | Performance Units awarded under the LTIP for 2007 and 2008 are earned over a three-year period as shown below. For explanation of Performance Units, see LTIP section above, following the Grant of Plan-Based Awards Table. |
| | | | | | | | | | |
Performance End Date | | Izzo (#) | | O’Flynn (#) | | Selover (#) | | LaRossa (#) | | DiRisio (#) |
|
12/31/2009 | | | | 50,661 | | | | | 15,539 | | | | | 9,792 | | | | | 9,792 | | | | | 3,193 | |
12/31/2010 | | | | 55,088 | | | | | 11,477 | | | | | 8,138 | | | | | 8,138 | | | | | 2,400 | |
12/31/2011 | | | | 77,500 | | | | | 14,800 | | | | | 13,100 | | | | | 12,300 | | | | | 3,300 | |
210
OPTION EXERCISES AND STOCK VESTED DURING 2008 TABLE
| | | | | | | | |
Name | | Option Awards | | Stock Awards |
| | Number of
Shares
Acquired on
Exercise
(#) | | Value
Realized on
Exercise
($)(1) | | Number of
Shares
Acquired on
Vesting
(#)(2) | | Value
Realized on
Vesting
($)(3) |
Ralph Izzo | | | | — | | | | | — | | | | | 21,086 | | | | | 798,364 | |
Thomas M. O’Flynn | | | | — | | | | | — | | | | | 16,668 | | | | | 641,831 | |
R. Edwin Selover | | | | 13,000 | | | | | 161,724 | | | | | 11,202 | | | | | 431,721 | |
Ralph LaRossa | | | | — | | | | | — | | | | | 4,336 | | | | | 150,426 | |
Derek DiRisio | | | | — | | | | | — | | | | | 3,742 | | | | | 147,467 | |
|
(1) | | | | Reflects the difference between the exercise price and the market price on the date of exercise, multiplied by the number of shares acquired. |
|
(2) | | | | Represents the aggregate number of shares acquired from the vesting of restricted stock awards under the LTIP, as follows: |
| | | | | | | | | | |
| | Izzo (#) | | O’Flynn (#) | | Selover (#) | | LaRossa (#) | | DiRisio (#) |
Restricted stock-vesting dates | | | | | | | | | | |
1/2/2008 | | | | — | | | | | — | | | | | — | | | | | — | | | | | 700 | |
1/18/2008 | | | | 10,668 | | | | | 9,000 | | | | | 6,068 | | | | | 1,468 | | | | | 1,468 | |
12/18/2008 | | | | 10,418 | | | | | 7,668 | | | | | 5,134 | | | | | 2,868 | | | | | 1,000 | |
Restricted stock units-vesting date | | | | | | | | | | |
12/18/2008 | | | | — | | | | | — | | | | | — | | | | | — | | | | | 574 | |
|
(3) | | | | The value attributable to the vested restricted stock is based on the closing price of PSEG Common Stock on the respective vesting dates of 1/2/2008, 1/18/2008 and 12/18/2008 of $48.05, $47.22 and $28.28, respectively. These amounts are: |
| | | | | | | | | | | | Izzo ($) | | O’Flynn ($) | | Selover ($) | | LaRossa ($) | | DiRisio ($) |
Restricted stock-vesting dates | | | | | | | | | | |
1/2/2008 | | | | — | | | | | — | | | | | — | | | | | — | | | | | 33,635 | |
1/18/2008 | | | | 503,743 | | | | | 424,980 | | | | | 286,531 | | | | | 69,319 | | | | | 69,319 | |
12/18/2008 | | | | 294,621 | | | | | 216,851 | | | | | 145,190 | | | | | 81,107 | | | | | 28,280 | |
Restricted stock units-vesting date | | | | | | | | | | |
12/18/2008 | | | | — | | | | | — | | | | | — | | | | | — | | | | | 16,233 | |
211
PENSION BENEFITS TABLE
| | | | | | | | |
Name | | Plan Name | | Number of
Years Credited
Service
(#) | | Present
Value of
Accumulated
Benefit
($)(5) | | Payments
During Last
Fiscal
Year ($) |
|
Ralph Izzo | | Qualified Pension Plan(1) | | | | 16.70 | | | | | 970,000 | | | | | — | |
| | | Retirement Income Restatement Plan(2) | | | | 16.70 | | | | | 564,000 | | | | | — | |
| | | Mid-Career Hire Supplemental Retirement Income Plan(3) | | | | 3.27 | | | | | 738,000 | | | | | — | |
| | | Limited Supplemental Benefits Plan(4) | | | | 19.97 | | | | | 1,339,000 | | | | | — | |
| | | | | | | | | |
| | | | | | | | | 3,611,000 | | | |
| | | | | | | | | |
Thomas M. O’Flynn | | Qualified Pension Plan(1) | | | | 7.50 | | | | | 67,000 | | | | | — | |
| | Retirement Income Restatement Plan(2) | | | | 7.50 | | | | | 136,000 | | | | | — | |
| | Mid-Career Hire Supplemental Retirement Income Plan(3) | | | | 17.02 | | | | | 60,000 | | | | | — | |
| | Limited Supplemental Benefits Plan(4,6) | | | | 24.52 | | | | | 3,160,000 | | | | | — | |
| | | | | | | | |
| | | | | | | | 3,423,000 | | | |
| | | | | | | | |
R. Edwin Selover | | Qualified Pension Plan(1) | | | | 36.33 | | | | | 1,852,000 | | | | | — | |
| | | Retirement Income Restatement Plan(2) | | | | 36.33 | | | | | 2,142,000 | | | | | — | |
| | | Mid-Career Hire Supplemental Retirement Income Plan(3) | | | | 5.00 | | | | | 552,000 | | | | | — | |
| | | Limited Supplemental Benefits Plan(4) | | | | 41.33 | | | | | 435,000 | | | | | — | |
| | | | | | | | | |
| | | | | | | | | 4,981,000 | | | |
| | | | | | | | | |
Ralph LaRossa | | Qualified Pension Plan(1) | | | | 23.51 | | | | | 462,000 | | | | | — | |
| | Retirement Income Restatement Plan(2) | | | | 23.51 | | | | | 471,000 | | | | | — | |
| | Mid-Career Hire Supplemental Retirement Income Plan(3) | | | | — | | | | | — | | | | | — | |
| | Limited Supplemental Benefits Plan(4) | | | | — | | | | | — | | | | | — | |
| | | | | | | | |
| | | | | | | | 933,000 | | | |
| | | | | | | | |
Derek DiRisio | | Qualified Pension Plan(1) | | | | 17.31 | | | | | 324,000 | | | | | — | |
| | | Retirement Income Restatement Plan(2) | | | | 17.31 | | | | | 189,000 | | | | | — | |
| | | Mid-Career Hire Supplemental Retirement Income Plan(3) | | | | — | | | | | — | | | | | — | |
| | | Limited Supplemental Benefits Plan(4) | | | | — | | | | | — | | | | | — | |
| | | | | | | | | |
| | | | | | | | | 513,000 | | | |
| | | | | | | | | |
|
(1) | | | | All NEOs participate in either a traditional defined benefit pension plan (Pension Plan) or a cash balance pension plan (Cash Balance Plan), depending on date of hire, each of which is a qualified plan under the IRC. Such plans are available to all other employees under the same terms and conditions. Messrs. Izzo, Selover, LaRossa and DiRisio participate in the Pension Plan. Mr. O’Flynn participates in the Cash Balance Plan. Years shown reflect actual years of service. |
|
(2) | | | | Years shown reflect actual years of service. |
212
|
(3) | | | | Certain employees receive additional years of credited service for the purpose of retirement benefit calculations in recognition of prior work experience, including 15 years for Mr. O’Flynn. In addition, Messrs. Izzo, O’Flynn and Selover receive an additional 5 years which vest at age 60 as described below under Mid-Career Plan. The additional 5 years are prorated in the table for participants under age 60. |
|
(4) | | | | Years shown reflect the sum of actual years of service and years credited under the Mid-Career Plan. |
|
(5) | | | | Amounts shown represent actuarial present value of accumulated benefit computed as of the same pension plan measurement date used for PSEG’s financial statements for the year ended December 31, 2008, with two exceptions: (i) NEOs were assumed to retire at the earliest point at which the benefits were payable on an unreduced basis in the plan providing the largest target benefit and (ii) no pre-retirement termination, disability or death was assumed to occur. For a discussion of the valuation method and material assumptions applied in quantifying the present value, see Note 10. Pension, Other Postretirement Benefits (OPEB) and Savings Plan. |
|
(6) | | | | The actuarial present value of accumulated benefits based on actual years of service is $2,056,000 and the actuarial present value of accumulated benefits based on additional years of service is $1,104,000. |
Qualified Pension Plans
All of our employees are eligible to participate in either a Pension Plan or a Cash Balance Plan. The Pension Plan covers employees hired prior to January 1, 1996 and provides participants with a life annuity benefit at normal retirement (age 65) pursuant to a formula based upon (a) the participant’s number of years of service and (b) the average of the participant’s five highest years of compensation up to the limit imposed by the IRC.
The benefit formula is A + B + C:
A= 1.3% of the lesser of 5-year final average earnings not in excess of $24,600 times years of credited service not exceeding 35 years;
B= 1.5% of the amount by which 5-year final average earnings exceeds $24,600 times years of credited service not exceeding 35 years; and
C= 1.5% of 5-year final average earnings times years of credited service in excess of 35 years.
An additional benefit equal to $4.00 per month for each year of credited service is payable until the retiree reaches age 65.
Participants become fully vested in their Pension Plan benefit upon completion of five years of service. Benefits are payable on an unreduced basis (i) at age 65, (ii) at age 60, if the participant’s age, plus years of service, equals or exceeds 80 or (iii) at age 55, if the participant has 25 or more years of service. Participants whose age, plus years of service, equals or exceeds 80, but who are not yet age 55, may commence their Pension Plan benefits on a reduced basis.
The Cash Balance Plan covers employees hired or rehired on or after January 1, 1996 and provides each participant with a life annuity benefit at normal retirement (age 65) equal to the actuarial equivalent of a notational amount maintained for him/her. Participants are eligible for retirement under the Cash Balance Plan upon the attainment of age 55 with five or more years of service. Participants’ accounts are credited each year with a percentage of compensation, which is determined based on the participant’s age plus years of service measured at year-end.
213
| | |
Sum of Age
and Service | | Percentage of
Compensation
Credited % |
<30 | | | | 2.00 | |
30–39 | | | | 2.50 | |
40–49 | | | | 3.25 | |
50–59 | | | | 4.25 | |
60–69 | | | | 5.50 | |
70–79 | | | | 7.00 | |
80–89 | | | | 9.00 | |
90+ | | | | 12.00 | |
Each participant’s notional amount grows each year with interest credits based on a 6.0% annual rate of interest. Participants become immediately fully vested in their Cash Balance Plan benefit.
Reinstatement Plan
All employees are eligible to participate in a non-qualified excess benefit retirement plan, Reinstatement Plan, designed to replace earned pension benefits as determined by the qualified pension formula, but which are not eligible for payment from the qualified pension plans as a result of IRC mandated limits for qualified plans. The benefits payable under this plan mirror those of the qualified plans described above except that the compensation considered in computing the benefit (i) will not be limited by qualified plan limits, (ii) will include any amounts that the participant may have deferred under deferred compensation plans, (iii) will include amounts earned under MICP (which are not considered under the qualified pension plans), (iv) will be limited to 150% of average base salary for the applicable five years and (v) will be offset by any benefits received by the participant under the qualified plan.
Mid-Career Plan
Certain employees receive additional years of service for the purpose of retirement benefit calculations in recognition of prior work experience. Such benefits are paid from a non-qualified plan, the Mid-Career Plan. Under the Mid-Career Plan, certain participants receive an additional five years of credited service for the purpose of pension benefit calculations if they retire between ages 60 and 65. The credited years of service reduce by one year for each six-month period such participant works beyond age 65. This feature of the plan is designed to encourage retirement on or before age 65. Benefits payable under the Mid-Career Plan mirror those payable under the Reinstatement Plan, except that additional years of service are considered in calculating the amount of benefit. Any benefit payable under this plan is offset by benefits payable under the qualified plan and the Reinstatement Plan.
Limited Plan
Certain employees participate in a limited non-qualified supplemental retirement plan, the Limited Supplemental Benefits Plan for Certain Employees (Limited Plan). This plan seeks to provide a total target replacement income percentage equal to credited service for qualified pension calculation purposes and Mid-Career Plan calculation purposes, plus 30, to a maximum of 75%. Compensation covered for the Limited Plan is the same as for the Mid-Career Plan. The target replacement amount under the Limited Plan is reduced by any pension benefits accrued and vested from a previous employer at the time of hire, by the participant’s Social Security benefit at normal retirement age and by the pension benefits provided by each other PSEG retirement benefit plan (qualified plans and non-qualified plans). The Limited Plan also provides a death benefit equal to 150% of base compensation if death occurs while the participant is actively employed. Participants become entitled to a Limited Plan benefit only upon (a) retirement under the terms of the qualified plan in which they participate (Pension Plan or Cash Balance Plan) or (b) death.
214
NON-QUALIFIED DEFERRED COMPENSATION TABLE
| | | | | | | | | | |
Name | |
Executive
Contributions
in Last
Fiscal Year
(2008) $
| | Registrant
Contributions in
Last
Fiscal Year
(2008) $ | | Aggregate
Earnings in Last
Fiscal Year
(2008) $ | | Aggregate
Withdrawals/
Distributions
(2008) $ | | Aggregate
Balance at
Last Fiscal
Year End
(2008) $ |
Ralph Izzo (1) | | | | 1,282,500 | | | | | — | | | | | 150,030 | | | | | — | | | | | 2,808,553 | |
Thomas M. O’Flynn (2) | | | | — | | | | | — | | | | | (85,665 | ) | | | | | 695,170 | | | | | 799,702 | |
R. Edwin Selover (3) | | | | 52,000 | | | | | — | | | | | 98,325 | | | | | — | | | | | 1,670,429 | |
Ralph LaRossa | | | | — | | | | | — | | | | | — | | | | | — | | | | | — | |
Derek DiRisio | | | | — | | | | | — | | | | | — | | | | | — | | | | | — | |
|
(1) | | | | The amount shown under Executive Contributions in Last Fiscal Year (2008) was previously reported in our 2007 Form 10-K. $18,615 of the amount shown under Aggregate Earnings in Last Fiscal Year (2008) is reported in this Form 10-K in the Summary Compensation Table under Change in Pension Value and Non-Qualified Deferred Compensation as earnings in excess of 120% of the applicable long-term rate as discussed in footnote 7 of that Table. $2,479,594 of the amount shown under Aggregate Balance at Last Fiscal Year End (12/31/08) is reported in the Summary Compensation Table in this Form 10-K or in our Forms 10-K for previous years. |
|
(2) | | | | $3,650 of the net loss shown under Aggregate Earnings in Last Fiscal Year (2008) is reported in this Form 10-K in the Summary Compensation Table under Change in Pension Value and Non-Qualified Deferred Compensation as earnings in excess of 120% of the applicable long-term rate as discussed in footnote 7 of that Table. $772,056 of the amount shown under Aggregate Balance at Last Fiscal Year End (12/31/08) is reported in the Summary Compensation Table in this Form 10-K or in our Forms 10-K for previous years. |
|
(3) | | | | The amount shown under Executive Contributions in Last Fiscal Year (2008) is reported in this Form 10-K in the Summary Compensation Table. $14,333 of the amount shown under Aggregate Earnings in Last Fiscal Year (2008) is reported in this Form 10-K in the Summary Compensation Table under Change in Pension Value and Non-Qualified Deferred Compensation as earnings in excess of 120% of the applicable long-term rate as discussed in footnote 7 of that Table. $504,665 of the amount shown under Aggregate Balance at Last Fiscal Year End (12/31/ 08) is reported in the Summary Compensation Table in this Form 10-K or in our Forms 10-K for previous years. |
Deferred Compensation Plan
Under the PSEG Deferred Compensation Plan, participants, including the NEOs, may elect to defer any portion of their compensation by making appropriate elections in the calendar year prior to the year in which the services giving rise to the compensation being deferred is rendered. For performance-based compensation, elections may be made up to the date that is six months before the end of the related performance period, as long as (a) the performance period is at least 12 months in length, (b) the participant performed services continuously from the date the performance criteria were established through the date the deferral election is made and (c) at the time the deferral election is made, the performance-based compensation is not both (i) substantially certain to be paid and (ii) readily ascertainable. A participant may change an election to defer compensation not later than the date that is the last date that an election to defer may be made.
At the same time he/she elects to defer compensation, the participant must make an election as to the timing and the form of distribution from his/her Deferred Compensation Plan account. Distributions may commence (a) on the thirtieth day after the date he/she terminates employment or, in the alternative, (b) on January 15th of any calendar year following termination of employment elected by him/her, but in any event no later than the later of (i) the January of the year following the year of his/her 70th birthday or (ii)
215
the January following termination of employment. Notwithstanding the forgoing, however, for NEOs, distribution of his/her account may not occur earlier than six months following the date of his/her termination of service. Participants may elect to receive the distribution of their Deferred Compensation account in the form of (x) one lump-sum payment, (y) annual distributions over a five-year period or (z) annual distributions over a 10-year period.
Participants may make changes of distribution elections on a prospective basis. Participants may also make changes of distribution elections with respect to prior deferred compensation as long as (a) any such new distribution election is made at least one year prior to the date that the commencement of the distribution would otherwise have occurred and (b) the revised commencement date is at least five years later than the date that the commencement of the distribution would otherwise have occurred.
Amounts deferred under the Deferred Compensation Plan are credited with earnings based on (i) the performance of one or more of the pre-mixed lifestyle investment portfolio funds or the S&P 500 Fund available to employees under the Company’s 401(k) Plans or (ii) at the rate of Prime plus 1/2%, in such percentages as selected by the participant. A participant who fails to provide a designation of investment funds will accrue earnings on his/her account at the rate of Prime plus 1/2%. For 2008 the rates of return for these funds were as follows:
| | |
Conservative Pre-Mixed Portfolio | | | | (15.49%) | |
Moderate Pre-Mixed Portfolio | | | | (24.01%) | |
Aggressive Pre-Mixed Portfolio | | | | (31.62%) | |
S&P 500 Fund | | | | (37.02%) | |
Prime Plus 1/2% | | | | 6.23% | |
A participant may change fund selection once a year.
POTENTIAL PAYMENTS UPON TERMINATION OF EMPLOYMENT
OR CHANGE-IN-CONTROL
The severance agreement of Mr. Izzo and the employment agreement of Mr. O’Flynn, discussed above, each provide for certain severance benefits.
Both of these agreements provide that if the individual is terminated without “cause” (a willful failure to perform his duties) or resigns for “good reason” (a reduction in pay, position or authority) during the term of such agreement, the vesting of equity awards will be accelerated, the individual will be paid a benefit of two times base salary and target bonus, and his welfare benefits will be continued for two years unless he is sooner employed.
Mr. O’Flynn’s employment agreement also provides that in the event such a termination occurs after a “change-in-control” (as defined below), his payment becomes three times the sum of salary and target bonus, continuation of welfare benefits for three years unless sooner reemployed, payment of the net present value of providing three years additional service under our retirement plans and a gross-up for excise taxes due under the IRC on any termination payments.
Each of the agreements provides that the individual is prohibited from competing with PSEG or its subsidiaries or affiliates, for certain periods after termination of employment. Violations of these provisions require a forfeiture of certain benefits.
PSEG’s Key Executive Severance Plan provides severance benefits to Messrs. Izzo, Selover, LaRossa and DiRisio and to certain of our key executive-level employees whose employment is terminated without cause.
Under the Key Executive Severance Plan, if any of Messrs. Izzo, Selover, LaRossa or DiRisio is terminated without cause or resigns his employment for good reason within two years after a change-in-control, he will receive (1) a pro rata bonus based on his target annual incentive compensation, (2) three times (two times
216
for Mr. DiRisio) the sum of his salary and target incentive bonus, (3) accelerated vesting of equity-based awards, (4) a lump sum payment equal to the actuarial equivalent of his benefits under all of our retirement plans in which he participates calculated as though he remained employed for three years (two years for Mr. DiRisio) beyond the date his employment terminates less the actuarial equivalent of such benefits on the date his employment terminates, (5) three years (two years for Mr. DiRisio) continued welfare benefits (the first 18 months of which will be provided through PSEG- paid COBRA continuation coverage), (6) one year of PSEG-paid outplacement services and (7) vesting of any compensation previously deferred.
Also under the Key Executive Severance Plan, Messrs. Selover, LaRossa and DiRisio would be entitled to certain severance benefits in the event that their employment was terminated without cause other than in a change-in-control situation. In such event they would be entitled to 1.0 times their annual base salary plus their target annual incentive amount, as well as a prorated payment of their target incentive award and certain outplacement services, educational assistance, health care and life insurance coverage.
If a termination without cause or a reduction in force or reorganization had occurred on December 31, 2008, each of the NEOs would have received the following benefits:
| | |
| | $ |
Izzo | | | | 6,294,554 | |
O’Flynn | | | | 2,837,278 | |
Selover | | | | 1,426,751 | |
LaRossa | | | | 1,232,757 | |
DiRisio | | | | 752,703 | |
If a termination without cause or with good reason had occurred on December 31, 2008 following a change-in-control, each of the NEOs would have received the following benefits:
| | |
| | $ |
Izzo | | | | 13,056,055 | |
O’Flynn | | | | 4,261,578 | |
Selover | | | | 3,189,799 | |
LaRossa | | | | 4,553,571 | |
DiRisio | | | | 1,304,387 | |
Change-in-Control provisions under Mr. O’Flynn’s employment agreement and the Key Executive Severance Plan generally mean the occurrence of any of the following events:
|
• | | | | Any person is or becomes the beneficial owner of our securities representing 25% or more of the combined voting power of PSEG’s then outstanding securities; or |
|
• | | | | A majority of PSEG’s Board of Directors is replaced without approval of the current Board; or |
|
• | | | | There is consummated a merger or consolidation of PSEG, other than a merger or consolidation which would result in PSEG’s voting securities outstanding immediately prior to such merger continuing to represent at least 75% of the combined voting power of the securities of PSEG or such surviving entity immediately after such merger or consolidation; or |
|
• | | | | PSEG’s shareholders approve a plan of complete liquidation or dissolution of PSEG or there is consummated an agreement for the sale or disposition by PSEG of all or substantially all of PSEG’s assets. |
217
DIRECTOR COMPENSATION TABLE
| | | | | | | | | | | | | | |
| | Fees
Earned or
Paid in
Cash
($)(1) | | Stock
Awards
($)(2) | | Option
Awards
($) | | Non-Equity
Incentive Plan
($) | | Change in
Pension
Value and
Nonqualified
Deferred
Compensation
Earnings
($) | | All Other
Compensation
($) | | Total
($) |
Caroline Dorsa | | | | 101,000 | | | | | 100,000 | | | | | — | | | | | — | | | | | — | | | | | — | | | | | 201,000 | |
Albert R. Gamper, Jr. | | | | 112,500 | | | | | 100,000 | | | | | — | | | | | — | | | | | — | | | | | — | | | | | 212,500 | |
Conrad K. Harper | | | | 93,500 | | | | | 100,000 | | | | | — | | | | | — | | | | | — | | | | | — | | | | | 193,500 | |
|
(1) | | | | Includes all meeting fees, chair/committee retainer fees and the annual retainer as described below. Albert R. Gamper, Jr. and Conrad K. Harper deferred 100% of Fees Earned or Paid in Cash in 2008. |
|
(2) | | | | Amount shown reflects the expense included on our Financial Statements for 2008 related to awards under the 2007 Equity Compensation Plan for Outside Directors (Directors’ Equity Plan) granted on May 1, 2008 and May 1, 2007 and still outstanding as determined under FAS 123R. For each outside director, the grant date fair value of the award was $100,000 on May 1, 2008, which equated to 2,268 stock units based on the then-current market price of the Common Stock. In addition, each outside director’s account is credited with additional stock units on the quarterly dividend dates at the then current dividend rate. For a discussion on the assumptions made in valuation, see Note 16. Stock Based Compensation. |
The following table shows outstanding stock units granted under the Director’s Equity Plan and restricted stock granted under the prior Stock Plan for Outside Directors, as of December 31, 2008. Shares granted under that prior plan are subject to forfeiture if a director leaves service prior to age 72, except after a change-in-control or if waived by the non-participating directors.
| | | | | | |
| | Dorsa (#) | | Gamper (#) | | Harper (#) |
Stock units | | | | 4,768 | | | | | 4,768 | | | | | 4,768 | |
Restricted stock | | | | 8,800 | | | | | 9,600 | | | | | 13,200 | |
Directors Fees
During 2008, each director who was not an employee of a PSEG company was paid an annual retainer of $45,000 and a fee of $1,500 for attendance at any Board or committee meeting, inspection trip, conference or other similar activity relating to PSEG. No additional retainer is paid for service as a director of PSE&G. Each Committee Chair received an additional annual retainer of $5,000, except for the Chair of the Audit Committee, who received $15,000 and the Chair of the Organization and Compensation Committee, who received $10,000. In addition, each member of the Audit Committee received an additional annual retainer of $5,000. The PSEG Presiding Director received an additional annual retainer of $15,000.
Directors Equity Plan
The Directors’ Equity Plan is a deferred compensation plan and, under its terms, each outside director is granted an award of “stock units” each May 1st (in an amount determined from time-to-time by the Board) which is recorded in a bookkeeping account in her/his name and accrues earning credits equivalent to the earnings on shares of PSEG Common Stock. If a director fails to remain a member of the Board (other than on account of disability or death) until the earlier of the succeeding April 30th or the next Annual Meeting of Stockholders, the award for that year will be prorated to reflect actual service. Distributions under the Directors’ Equity Plan are made in shares of PSEG Common Stock after the director terminates service on the Board in accordance with distribution elections made by her/him.
218
Directors’ Deferred Compensation Plan
Under the Directors’ Deferred Compensation Plan, directors who are not employees may elect to defer any portion of their retainer and meeting attendance fees by making appropriate elections in the calendar year prior to the year in which the services giving rise to the compensation being deferred is rendered. At the same time he/she elects to defer compensation, the participant must make an election as to the timing and the form of distribution from his/her Directors’ Deferred Compensation Plan account. Distributions are made in cash or at the election of the participant, in the case of amounts credited with earnings by reference to the performance of PSEG Common Stock, in shares of common Stock. Distributions may commence (a) on the thirtieth day after the date he/she terminates service as a director or, in the alternative, (b) on January 15th of any calendar year following termination of service elected by him/her, but in any event no later than the later of (i) the January of the year following the year of his/her 71st birthday or (ii) the January following termination of service. Participants may elect to receive the distribution of their Directors’ Deferred Compensation account in the form of (x) one lump-sum payment, or (y) annual distributions over a period selected by the participant, up to 10 years.
Participants may make changes of distribution elections on a prospective basis. Participants may also make changes of distribution elections with respect to prior deferred compensation as long as (A) any such new distribution election is made at least one year prior to the date that the commencement of the distribution would otherwise have occurred and (B) the revised commencement date is at least five years later than the date that the commencement of the distribution would otherwise have occurred.
Participants may choose to have amounts deferred under the Directors’ Deferred Compensation Plan credited with earnings based on (i) the performance of one or more of the pre-mixed lifestyle investment portfolio funds or the S&P 500 fund available to employees under the Company’s 401(k) Plans, (ii) the rate of Prime plus 1/2% or (iii) by reference to the performance of PSEG Common Stock, in such percentages designated by the participant. A participant who fails to provide a designation will accrue earnings on his/her account at the rate of Prime plus 1/2%.
For 2008, the rates of returns for these funds were as follows:
| | |
Conservative Pre-Mixed Portfolio | | | | (15.49%) | |
Moderate Pre-Mixed Portfolio | | | | (24.01%) | |
Aggressive Pre-Mixed Portfolio | | | | (31.62%) | |
S&P 500 Fund | | | | (37.02%) | |
Prime Plus 1/2% | | | | 6.23% | |
PSEG Common Stock | | | | (37.91%) | |
COMPENSATION COMMITTEE INTERLOCKS AND INSIDER PARTICIPATION
PSE&G does not have a compensation committee. Decisions regarding compensation of PSE&G’s executive officers are made by the Organization and Compensation Committee of PSEG. During 2008, each of the following individuals served as a member of the Organization and Compensation Committee: Albert R. Gamper, Jr., Chair, William V. Hickey, Shirley Ann Jackson, Thomas A. Renyi, and Richard J. Swift. During 2008, no member of the Organization and Compensation Committee was an officer or employee or a former officer or employee of any PSEG company. None of our officers served as a director of or on the compensation committee of any of the companies for which any of these individuals served as an officer. Other than as described below under Transactions with Related Persons, no member of the Organization and Compensation Committee had a direct or indirect material interest in any transaction with us.
219
ITEM 12. SECURITY OWNERSHIP OF CERTAIN BENEFICIAL OWNERS AND MANAGEMENT AND RELATED STOCKHOLDERS MATTERS
PSEG
The information required by Item 12 of Form 10-K with respect to directors, executive officers and certain beneficial owners is set forth under the heading “Security Ownership of Directors, Management and Certain Beneficial Owners” in PSEG’s definitive Proxy Statement for the 2009 Annual Meeting of Stockholders which definitive Proxy Statement is expected to be filed with the SEC on or about March 9, 2009, and such information set forth under such heading is incorporated herein by this reference thereto.
For information relating to securities authorized for issuance under equity compensation plans, see Item 5. Market for Registrant’s Common Equity, Related Stockholder Matters and Issuer Purchases of Equity Securities.
Power
Omitted pursuant to conditions set forth in General Instruction I of Form 10-K.
PSE&G
The following table sets forth, as of February 20, 2009, beneficial ownership of PSEG Common Stock by the directors and executive officers named in the Summary Compensation Table. The information presented includes stock options, stock units and phantom shares. None of these amounts exceeds 1% of the Common Stock outstanding.
| | | | | | | | | | | | |
Name | | Owned
Shares (1) | | Restricted
Stock (2) | | Stock Units/
Restricted
Stock Units (3) | | Phantom
Shares (4) | | Stock
Options (5) | | Total |
Derek DiRisio | | | | 11,591 | | | | | 1,400 | | | | | 5,271 | | | | | — | | | | | — | | | | | 18,262 | |
Caroline Dorsa | | | | 4,899 | | | | | 8,800 | | | | | 4,768 | | | | | — | | | | | — | | | | | 18,467 | |
Albert R. Gamper, Jr. | | | | 7,390 | | | | | 9,600 | | | | | 4,768 | | | | | 16,741 | | | | | — | | | | | 38,499 | |
Conrad K. Harper | | | | 9,054 | | | | | 13,200 | | | | | 4,768 | | | | | — | | | | | — | | | | | 27,022 | |
Ralph Izzo | | | | 143,482 | | | | | — | | | | | — | | | | | — | | | | | 598,450 | | | | | 741,932 | |
Ralph LaRossa | | | | 6,875 | | | | | — | | | | | — | | | | | — | | | | | 34,250 | | | | | 41,125 | |
Thomas M. O’Flynn | | | | 105,607 | | | | | — | | | | | — | | | | | — | | | | | 378,450 | | | | | 484,057 | |
R. Edwin Selover | | | | 43,539 | | | | | — | | | | | — | | | | | — | | | | | 21,250 | | | | | 64,789 | |
| | | | | | | | | | | | |
All directors and executive officers as a group (8 persons) | | | | 332,437 | | | | | 33,000 | | | | | 19,575 | | | | | 16,741 | | | | | 1,032,400 | | | | | 1,434,153 | |
|
(1) | | | | Includes all shares held directly, in brokerage accounts, under the 401(k) plan, shares jointly owned with a spouse and shares held in a trust or a custodial account. |
|
(2) | | | | Includes restricted stock granted to executive officers under the LTIP and restricted stock granted to directors under the former Stock Plan for Outside Directors. |
|
(3) | | | | Includes restricted stock units granted to executive officers under the LTIP and stock units granted to directors under the Equity Compensation Plan for Outside Directors. |
|
(4) | | | | Includes phantom shares granted under the Directors’ Deferred Compensation Plan. |
|
(5) | | | | Stock options granted under the LTIP and exercisable currently or within 60 days. Excludes stock options not exercisable within 60 days as follows: |
| | | | | | | | |
DiRisio | | Izzo | | LaRossa | | O’Flynn | | Selover |
— | | 749,750 | | 125,950 | | 165,550 | | 130,950 |
220
Certain Beneficial Owners
The following table sets forth, as of February 20, 2009, beneficial ownership in shares by any person or group known to us to be the beneficial owner of more than five percent of PSEG Common Stock. According to the Schedule 13G filed by the respective owners with the SEC, these securities were acquired and are held in the ordinary course of business and not for the purpose of changing or influencing the control of the Company.
| | | | |
Name and Address | | Amount and
Nature
of Beneficial
Ownership | | Percent |
Capital Research Global Investors
333 South Hope Street
Los Angeles, CA 90071 | | | | 31,145,600(1 | ) | | | | | 6.2 | |
Franklin Resources, Inc.
One Franklin Parkway
San Mateo, CA 94403-1906 | | | | 27,060,525(2 | ) | | | | | 5.3 | |
|
(1) | | | | As reported on Schedule 13G filed February 17, 2009 |
|
(2) | | | | As reported on Schedule 13G/A filed February 9, 2009 |
Section 16 Beneficial Ownership Reporting Compliance
During 2008, none of our directors or executive officers was late in filing a Form 3, 4 or 5 in accordance with the requirements of Section 16(a) of the Securities Exchange Act of 1934, as amended, with regard to transactions involving our Common Stock.
ITEM 13. CERTAIN RELATIONSHIPS AND RELATED TRANSACTIONS, AND DIRECTOR INDEPENDENCE
PSEG
The information required by Item 13 of Form 10-K is set forth under the heading “Transactions with Related Persons” in PSEG’s definitive Proxy Statement for the 2009 Annual Meeting of Stockholders which definitive Proxy Statement is expected to be filed with the SEC on or about March 9, 2009 and such information set forth under such heading is incorporated herein by this reference thereto.
Power
Omitted pursuant to conditions set forth in General Instruction I of Form 10K.
PSE&G
Transaction with Related Persons
Except as stated below, there were no transactions during 2008, and there are no transactions currently proposed, in which PSE&G was or is to be a participant and the amount involved exceeded $120,000 and in which any related person (director, nominee, executive officer, or their immediate family members) had or will have a direct or indirect material interest.
From January 2008 until July 2008, Thomas A. Renyi, a director of PSE&G, from January 2008 to April 2008, was Executive Chairman of the Board of the Bank of New York Mellon Corporation (BNY), a participant in one of our credit facilities. This facility and BNY’s participation, was made in the ordinary course of business, on substantially the same terms, including interest rate and collateral, as those prevailing at the time for comparable loans with BNY by persons not related to BNY, and did not involve more than the normal risk of collectability or present other unfavorable features.
221
Our policies and procedures with regard to transactions with related parties, including the review, approval or ratification of any such transactions, the standard applied and the responsibilities for application are set forth in PSEG’s Corporate Governance Principles, Standards of Integrity, and other of our internal written management practices. These are our only written policies and procedures regarding the review, approval or ratification of transactions with related persons.
|
• | | | | Under the Corporate Governance Principles, a director of PSE&G must notify the Chair of the PSEG Corporate Governance Committee if he or she encounters a conflict of interest or proposes to accept a position with an entity which may present a conflict of interest, so that the issue may be reviewed. Potential conflicts of interest include positions that directors or immediate family members hold as directors, officers or employees of other companies with which we do business or propose to do business and charitable and other tax-exempt organizations to which we contribute or propose to contribute. |
|
• | | | | The Standards of Integrity establish expectation for behavior for directors, officers, and employees regarding, among other things, corporate opportunity, conflict of interest and customer, supplier, competitor and governmental relations. The Standards of Integrity establish a procedure for seeking guidance, reporting concerns, investigation and discipline. |
|
• | | | | Our written management practices provide that any capital investment with a non-PSEG entity or its affiliate on which one of our directors or officers serves as a director or executive officer must be approved by PSEG’s Board of Directors. |
The PSEG Board has determined that all of the current directors are independent under the Corporate Governance Principles and the requirements of the NYSE, except Ralph Izzo, the Chairman of the Board, President and CEO, who is an employee of the Company. These determinations were based upon a review of the questionnaires submitted by each director, our relevant business records, publicly available information and the applicable SEC and NYSE requirements.
ITEM 14. PRINCIPAL ACCOUNTING FEES AND SERVICES
The information required by Item 14 of Form 10-K is set forth under the heading “Fees Billed to PSEG by Deloitte & Touche LLP for 2008 and 2007” in PSEG’s definitive Proxy Statement for the 2009 annual Meeting of Stockholders which definitive Proxy Statement is expected to be filed with the SEC on or about March 9, 2009. Such information set forth under such heading is incorporated herein by this reference hereto.
222
PART IV
ITEM 15. EXHIBITS AND FINANCIAL STATEMENT SCHEDULES
(A) The following Financial Statements are filed as a part of this report:
|
a. | | | | Public Service Enterprise Group Incorporated’s Consolidated Balance Sheets as of December 31, 2008 and 2007 and the related Consolidated Statements of Operations, Cash Flows and Common Stockholders’ Equity for the three years ended December 31, 2008 on pages 84, 85, 83, 86 and 87, respectively. |
|
b. | | | | PSEG Power LLC’s Consolidated Balance Sheets as of December 31, 2008 and 2007 and the related Consolidated Statements of Operations, Cash Flows and Capitalization and Member’s Equity for the three years ended December 31, 2008 on pages 89, 88, 90 and 91, respectively. |
|
c. | | | | Public Service Electric and Gas Company’s Consolidated Balance Sheets as of December 31, 2008 and 2007 and the related Consolidated Statements of Operations, Cash Flows and Common Stockholders’ Equity for the three years ended December 31, 2008 on pages 94, 95, 93, 96 and 97, respectively. |
(B) The following documents are filed as a part of this report:
|
a. | | | | PSEG’s Financial Statement Schedules: |
|
| | | | Schedule II—Valuation and Qualifying Accounts for each of the three years in the period ended December 31, 2007 (page 231). |
|
b. | | | | Power’s Financial Statement Schedules: |
|
| | | | Schedule II—Valuation and Qualifying Accounts for each of the three years in the period ended December 31, 2007 (page 232). |
|
c. | | | | PSE&G’s Financial Statement Schedules: |
|
| | | | Schedule II—Valuation and Qualifying Accounts for each of the three years in the period ended December 31, 2007 (page 232). |
Schedules other than those listed above are omitted for the reason that they are not required or are not applicable, or the required information is shown in the consolidated financial statements or notes thereto.
(C) The following documents are filed as part of this report:
LIST OF EXHIBITS:
| | |
a. | | PSEG: |
3a | | Certificate of Incorporation Public Service Enterprise Group Incorporated(1) |
3b | | By-Laws of Public Service Enterprise Group Incorporated as in effect April 20, 2007(2) |
3c | | Certificate of Amendment of Certificate of Incorporation of Public Service Enterprise Group Incorporated, effective April 23, 1987(3) |
3d | | Certificate of Amendment of Certificate of Incorporation of Public Service Enterprise Group Incorporated, effective April 20, 2007(4) |
4a(1) | | Indenture between Public Service Enterprise Group Incorporated and First Union National Bank (US Bank National Association, successor), as Trustee, dated January 1, 1998 providing for Deferrable Interest Subordinated Debentures in Series (relating to Quarterly Preferred Securities)(5) |
9 | | Inapplicable |
10a(1) | | Amended and Restated Limited Supplemental Benefits Plan for Certain Employees |
10a(2) | | Mid Career Hire Supplemental Retirement Income Plan |
10a(3) | | Retirement Income Reinstatement Plan for Non-Represented Employees |
10a(4) | | Employment Agreement with William Levis dated December 8, 2006(6) |
10a(5) | | 2007 Equity Compensation Plan for Outside Directors(7) |
| | |
223
| | |
10a(6) | | Employee Stock Purchase Plan(8) |
10a(7) | | Deferred Compensation Plan for Directors |
10a(8) | | Deferred Compensation Plan for Certain Employees |
10a(9) | | 1989 Long-Term Incentive Plan, as amended(9) |
10a(10) | | 2001 Long-Term Incentive Plan(10) |
10a(11) | | Senior Management Incentive Compensation Plan |
10a(12) | | Employment Agreement with Thomas M. O’Flynn dated April 18, 2001(11) |
10a(13) | | Amendment to Employment Agreement with Thomas M. O’Flynn dated December 21, 2001(12) |
10a(14) | | Key Executive Severance Plan |
10a(15) | | Severance Agreement with Ralph Izzo dated December 16, 2008(13) |
10a(16) | | Stock Plan for Outside Directors, as amended(14) |
10a(17) | | Compensation Plan for Outside Directors(15) |
10a(18) | | 2004 Long-Term Incentive Plan(16) |
10a(19) | | Form of Advancement of Expenses Agreement with Outside Directors(61) |
11 | | Inapplicable |
12 | | Computation of Ratios of Earnings to Fixed Charges |
13 | | Inapplicable |
16 | | Inapplicable |
18 | | Inapplicable |
21 | | Subsidiaries of the Registrant |
22 | | Inapplicable |
23 | | Consent of Independent Registered Public Accounting Firm |
24 | | Inapplicable |
31a | | Certification by Ralph Izzo, pursuant to Rules 13a-14 and 15d-14 of the Securities Exchange Act of 1934 (1934 Act) |
31b | | Certification by Thomas M. O’Flynn pursuant to Rules 13a-14 and 15d-14 of the 1934 Act |
32a | | Certification by Ralph Izzo, pursuant to Section 1350 of Chapter 63 of Title 18 of the US Code |
32b | | Certification by Thomas M. O’Flynn, pursuant to Section 1350 of Chapter 63 of Title 18 of the US Code |
b. | | Power: |
3a | | Certificate of Formation of PSEG Power LLC(17) |
3b | | PSEG Power LLC Limited Liability Company Agreement(18) |
3c | | Trust Agreement for PSEG Power Capital Trust I(19) |
3d | | Trust Agreement for PSEG Power Capital Trust II(20) |
3e | | Trust Agreement for PSEG Power Capital Trust III(21) |
3f | | Trust Agreement for PSEG Power Capital Trust IV(22) |
3g | | Trust Agreement for PSEG Power Capital Trust V(23) |
| | |
224
| | |
4a | | Indenture dated April 16, 2001 between and among PSEG Power, PSEG Fossil, PSEG Nuclear, PSEG Energy Resources & Trade and The Bank of New York Mellon and form of Subsidiary Guaranty included therein(24) |
4b | | First Supplemental Indenture, supplemental to Exhibit 4a, dated as of March 13, 2002(25) |
10a(1) | | Amended and Restated Limited Supplemental Benefits Plan for Certain Employees |
10a(2) | | Mid Career Hire Supplemental Retirement Income Plan |
10a(3) | | Retirement Income Reinstatement Plan for Non-Represented Employees |
10a(4) | | Employment Agreement with William Levis dated December 8, 2006(5) |
10a(6) | | Employee Stock Purchase Plan(7) |
10a(8) | | Deferred Compensation Plan for Certain Employees |
10a(9) | | 1989 Long-Term Incentive Plan, as amended(9) |
10a(10) | | 2001 Long-Term Incentive Plan(10) |
10a(11) | | Senior Management Incentive Compensation Plan |
10a(12) | | Employment Agreement with Thomas M. O’Flynn dated April 18, 2001(11) |
10a(13) | | Amendment to Employment Agreement with Thomas M. O’Flynn dated December 21, 2001(12) |
10a(14) | | Key Executive Severance Plan |
10a(15) | | Severance Agreement with Ralph Izzo dated December 16, 2008(13) |
10a(18) | | 2004 Long-Term Incentive Plan(16) |
11 | | Inapplicable |
12a | | Computation of Ratio of Earnings to Fixed Charges |
13 | | Inapplicable |
16 | | Inapplicable |
18 | | Inapplicable |
19 | | Inapplicable |
23 | | Consent of Independent Registered Public Accounting Firm |
24 | | Inapplicable |
31c | | Certification by Ralph Izzo, pursuant to Rules 13a-14 and 15d-14 of the 1934 Act |
31d | | Certification by Thomas M. O’Flynn pursuant to Rules 13a-14 and 15d-14 of the 1934 Act |
32c | | Certification by Ralph Izzo, pursuant to Section 1350 of Chapter 63 of Title 18 of the US Code |
32d | | Certification by Thomas M. O’Flynn, pursuant to Section 1350 of Chapter 63 of Title 18 of the US Code |
c. | | PSE&G |
3a(1) | | Restated Certificate of Incorporation of PSE&G(26) |
3a(2) | | Certificate of Amendment of Certificate of Restated Certificate of Incorporation of PSE&G filed February 18, 1987 with the State of New Jersey adopting limitations of liability provisions in accordance with an amendment to New Jersey Business Corporation Act(27) |
3a(3) | | Certificate of Amendment of Restated Certificate of Incorporation of PSE&G filed June 17, 1992 with the State of New Jersey, establishing the 7.44% Cumulative Preferred Stock ($100 Par) as a series of Preferred Stock(28) |
| | |
225
| | |
3a(4) | | Certificate of Amendment of Restated Certificate of Incorporation of PSE&G filed March 11, 1993 with the State of New Jersey, establishing the 5.97% Cumulative Preferred Stock ($100 Par) as a series of Preferred Stock(29) |
3a(5) | | Certificate of Amendment of Restated Certificate of Incorporation of PSE&G filed January 27, 1995 with the State of New Jersey, establishing the 6.92% Cumulative Preferred Stock ($100 Par) and the 6.75% Cumulative Preferred Stock—$25 Par as series of Preferred Stock(30) |
3b(1) | | By-Laws of PSE&G as in effect April 17, 2007(31) |
4a(1) | | Indenture between PSE&G and Fidelity Union Trust Company (now, Wachovia Bank, National Association), as Trustee, dated August 1, 1924, securing First and Refunding Mortgage Bond36 Indentures between PSE&G and First Fidelity Bank, National Association (US Bank National Association, successor), as Trustee, supplemental to Exhibit 4a(1), dated as follows: |
4a(2) | | April 1, 1927(32) |
4a(3) | | June 1, 1937(33) |
4a(4) | | July 1, 1937(34) |
4a(5) | | December 19, 1939(35) |
4a(6) | | March 1, 1942(36) |
4a(7) | | June 1, 1991 (No. 1)(37) |
4a(8) | | July 1, 1993(38) |
4a(9) | | September 1, 1993(39) |
4a(10) | | February 1, 1994(40) |
4a(11) | | March 1, 1994 (No. 2)(41) |
4a(12) | | May 1, 1994(42) |
4a(13) | | October 1, 1994 (No. 2)(43) |
4a(14) | | January 1, 1996 (No. 1)(44) |
4a(15) | | January 1, 1996 (No. 2)(45) |
4a(16) | | May 1, 1998(47) |
4a(17) | | September 1, 2002(48) |
4a(18) | | August 1, 2003(49) |
4a(19) | | December 1, 2003 (No. 1)(50) |
4a(20) | | December 1, 2003 (No. 2)(51) |
4a(21) | | December 1, 2003 (No. 3)(52) |
4a(22) | | December 1, 2003 (No. 4)(53) |
4a(23) | | June 1, 2004(54) |
4a(24) | | August 1, 2004 (No. 1)(55) |
4a(25) | | August 1, 2004 (No. 2)(56) |
4a(26) | | August 1, 2004 (No. 3)(57) |
4a(27) | | August 1, 2004 (No. 4)(58) |
4a(28) | | April 1, 2007 |
4b | | Indenture of Trust between PSE&G and Chase Manhattan Bank (National Association) (The Bank of New York Mellon, successor), as Trustee, providing for Secured Medium-Term Notes dated July 1, 1993(59) |
| | |
226
| | |
4c | | Indenture dated as of December 1, 2000 between Public Service Electric and Gas Company and First Union National Bank (US Bank National Association, successor), as Trustee, providing for Senior Debt Securities(60) |
10a(1) | | Amended and Restated Limited Supplemental Benefits Plan for Certain Employees |
10a(2) | | Mid Career Hire Supplemental Retirement Income Plan |
10a(3) | | Retirement Income Reinstatement Plan for Non-Represented Employees |
10a(5) | | 2007 Equity Compensation Plan for Outside Directors(6) |
10a(6) | | Employee Stock Purchase Plan(8) |
10a(7) | | Deferred Compensation Plan for Directors |
10a(8) | | Deferred Compensation Plan for Certain Employees |
10a(9) | | 1989 Long-Term Incentive Plan, as amended(9) |
10a(10) | | 2001 Long-Term Incentive Plan(10) |
10a(11) | | Senior Management Incentive Compensation Plan |
10a(12) | | Employment Agreement with Thomas M. O’Flynn dated April 18, 2001(11) |
10a(13) | | Amendment to Employment Agreement with Thomas M. O’Flynn dated December 21, 2001(12) |
10a(14) | | Key Executive Severance Plan |
10a(15) | | Severance Agreement with Ralph Izzo dated December 16, 2008(13) |
10a(16) | | Stock Plan for Outside Directors, as amended(14) |
10a(17) | | Compensation Plan for Outside Directors(15) |
10a(18) | | 2004 Long-Term Incentive Plan(16) |
10a(19) | | Form of Advancement of Expenses Agreement with Outside Directors(62) |
10a(20) | | Management Incentive Compensation Plan |
11 | | Inapplicable |
12b | | Computation of Ratios of Earnings to Fixed Charges |
12c | | Computation of Ratios of Earnings to Fixed Charges Plus Preferred Stock Dividend Requirements |
13 | | Inapplicable |
16 | | Inapplicable |
18 | | Inapplicable |
19 | | Inapplicable |
21 | | Inapplicable |
23a | | Consent of Independent Registered Public Accounting Firm |
24 | | Inapplicable |
31e | | Certification by Ralph Izzo, pursuant to Rules 13a-14 and 15d-14 of the 1934 Act |
31f | | Certification by Thomas M. O’Flynn pursuant to Rules 13a-14 and 15d-14 of the 1934 Act |
32e | | Certification by Ralph Izzo, pursuant to Section 1350 of Chapter 63 of Title 18 of the US Code |
32f | | Certification by Thomas M. O’Flynn, pursuant to Section 1350 of Chapter 63 of Title 18 of the US Code |
|
(1) | | | | Filed as Exhibit 3.1a with Quarterly Report on Form 10-Q for the quarter ended March 31, 2007, File No. 001-09120 on May 4, 2007 and incorporated herein by this reference. |
227
|
(2) | | | | Filed as Exhibit 3.2 with Quarterly Report on Form 10-Q for the quarter ended March 31, 2007, File No. 001-09120 on May 4, 2007 and incorporated herein by this reference. |
|
(3) | | | | Filed as Exhibit 3.1b with Quarterly Report on Form 10-Q for the quarter ended March 31, 2007, File No. 001-09120 on May 4, 2007 and incorporated herein by this reference. |
|
(4) | | | | Filed as Exhibit 3.1c with Quarterly Report on Form 10-Q for the quarter ended March 31, 2007, File No. 001-09120 on May 4, 2007 and incorporated herein by this reference. |
|
(5) | | | | Filed as Exhibit 4(f) with Quarterly Report on Form 10-Q for the quarter ended March 31, 1998, File No. 001-09120 on May 13, 1998 and incorporated herein by this reference. |
|
(6) | | | | Filed as Exhibit 10a(4) with Annual Report on Form 10-K for the year ended December 31, 2007, File Nos. 001-09120 and 000-49614, and incorporated herein by reference. |
|
(7) | | | | Filed as Exhibit 10a(5) with Annual Report on Form 10-K for the year ended December 31, 2007, File Nos. 001-09120 and 001-00973, and incorporated herein by reference. |
|
(8) | | | | Filed with Registration Statement on Form S-8, File No. 333-106330 filed on June 20, 2003 and incorporated herein by this reference. |
|
(9) | | | | Filed as Exhibit 10 with Quarterly Report on Form 10-Q for the quarter ended September 30, 2002, File No. 001-09120, on November 2, 2002 and incorporated herein by this reference. |
|
(10) | | | | Filed as Exhibit 10a(7) with Annual Report on Form 10-K for the year ended December 31, 2000, File No. 001-09120, on March 6, 2001 and incorporated herein by this reference. |
|
(11) | | | | Filed as Exhibit 10a(24) with Quarterly Report on Form 10-Q for the quarter ended June 30, 2001, File No. 001-09120, on August 9, 2001 and incorporated herein by this reference. |
|
(12) | | | | Filed as Exhibit 10a(12) with Annual Report on Form 10-K for the year ended December 31, 2001, File No. 001-09120, on March 1, 2002 and incorporated herein by this reference. |
|
(13) | | | | Filed as Exhibit 99 with Current Report on Form 8-K, File Nos. 001-09120, 000-49614 and 001-00973 on December 22, 2008 and incorporated herein by this reference. |
|
(14) | | | | Filed as Exhibit 10a(17) with Annual Report on Form 10-K for the year ended December 31, 2002, File No. 001-09120, on February 26, 2003 and incorporated herein by this reference. |
|
(15) | | | | Filed as Exhibit 10a(20) with Annual Report on Form 10-K for the year ended December 31, 2002, File No. 001-09120, on February 26, 2003 and incorporated herein by this reference. |
|
(16) | | | | Filed as Exhibit 10a(21) with Annual Report on Form 10-K for the year ended December 31, 2003, File No. 001-09120, on February 25, 2004 and incorporated herein by this reference. |
|
(17) | | | | Filed as Exhibit 3.1 to Registration Statement on Form S-4, No. 333-69228 filed on October 5, 2001 and incorporated herein by this reference. |
|
(18) | | | | Filed as Exhibit 3.2 to Registration Statement on Form S-4, No. 333-69228 filed on October 5, 2001 and incorporated herein by this reference. |
|
(19) | | | | Filed as Exhibit 3.6 to Registration Statement on Form S-3, No. 333-105704 filed on May 30, 2003 and incorporated herein by this reference. |
|
(20) | | | | Filed as Exhibit 3.7 to Registration Statement on Form S-3, No. 333-105704 filed on May 30, 2003 and incorporated herein by this reference. |
|
(21) | | | | Filed as Exhibit 3.8 to Registration Statement on Form S-3, No. 333-105704 filed on May 30, 2003 and incorporated herein by this reference. |
|
(22) | | | | Filed as Exhibit 3.9 to Registration Statement on Form S-3, No. 333-105704 filed on May 30, 2003 and incorporated herein by this reference. |
|
(23) | | | | Filed as Exhibit 3.10 to Registration Statement on Form S-3, No. 333-105704 filed on May 30, 2003 and incorporated herein by this reference. |
|
(24) | | | | Filed as Exhibit 4.1 to Registration Statement on Form S-4, No. 333-69228 filed on October 5, 2001 and incorporated herein by this reference. |
228
|
(25) | | | | Filed as Exhibit 4.7 with Quarterly Report on Form 10-Q for the quarter ended March 31, 2002, File No. 000-49614, on May 15, 2002 and incorporated herein by this reference. |
|
(26) | | | | Filed as Exhibit 3(a) with Quarterly Report on Form 10-Q for the quarter ended June 30, 1986, File No. 001-00973, on August 28, 1986 and incorporated herein by this reference. |
|
(27) | | | | Filed as Exhibit 3a(2) with Annual Report on Form 10-K for the year ended December 31, 1987, File No. 001-00973, on March 28, 1988 and incorporated herein by this reference. |
|
(28) | | | | Filed as Exhibit 3a(3) on Form 8-A, File No. 001-00973, on February 4, 1994 and incorporated herein by this reference. |
|
(29) | | | | Filed as Exhibit 3a(4) on Form 8-A, File No. 001-00973, on February 4, 1994 and incorporated herein by this reference. |
|
(30) | | | | Filed as Exhibit 3a(5) on Form 8-A, File No. 001-00973, on February 4, 1994 and incorporated herein by this reference. |
|
(31) | | | | Filed as Exhibit 3.3 with Quarterly Report on Form 10-Q for the quarter ended March 31, 2007, File No. 001-00973 on May 4, 2007 and incorporated herein by this reference. |
|
(32) | | | | Filed as Exhibit 4b(1) with Annual Report on Form 10-K for the year ended December 31, 1980, File No. 001-00973 on February 18, 1981 and incorporated herein by this reference. |
|
(33) | | | | Filed as Exhibit 4b(2) with Annual Report on Form 10-K for the year ended December 31, 1980, File No. 001-00973 on February 18, 1981 and incorporated herein by this reference. |
|
(34) | | | | Filed as Exhibit 4b(3) with Annual Report on Form 10-K for the year ended December 31, 1980, File No. 001-00973 on February 18, 1981 and incorporated herein by this reference. |
|
(35) | | | | Filed as Exhibit 4b(4) with Annual Report on Form 10-K for the year ended December 31, 1980, File No. 001-00973 on February 18, 1981 and incorporated herein by this reference. |
|
(36) | | | | Filed as Exhibit 4b(5) with Annual Report on Form 10-K for the year ended December 31, 1980, File No. 001-00973 on February 18, 1981 and incorporated herein by this reference. |
|
(37) | | | | Filed as Exhibit 4b(6) with Annual Report on Form 10-K for the year ended December 31, 1980, File No. 001-00973 on February 18, 1981 and incorporated herein by this reference. |
|
(38) | | | | Filed as Exhibit 4(i) on Form 8-A, File No. 001-00973 on July 1, 1991 and incorporated herein by this reference. |
|
(39) | | | | Filed as Exhibit 4(ii) on Form 8-A, File No. 001-00973 on May 25, 1993 and incorporated herein by this reference. |
|
(40) | | | | Filed as Exhibit 4(i) with Current Report on Form 8-K, File No. 001-00973 on December 1, 1993 and incorporated herein by this reference. |
|
(41) | | | | Filed as Exhibit 4 with Current Report on Form 8-K, File No. 001-00973 on December 1, 1993 and incorporated herein by this reference. |
|
(42) | | | | Filed as Exhibit 4 on Form 8-A, File No. 001-00973 on February 3, 1994 and incorporated herein by this reference. |
|
(43) | | | | Filed as Exhibit 4(i) on Form 8-A, File No. 001-00973 on March 15, 1994 and incorporated herein by this reference. |
|
(44) | | | | Filed as Exhibit 4a(91) with Quarterly Report on Form 10-Q for the quarter ended September 30, 1994, File No. 001-00973, on November 8, 1994 and incorporated herein by this reference. |
|
(45) | | | | Filed as Exhibit 4a(2) on Form 8-A, File No. 001-00973 on January 26, 1996 and incorporated herein by this reference. |
|
(46) | | | | Filed as Exhibit 4a(3) on Form 8-A, File No. 001-00973 on January 26, 1996 and incorporated herein by this reference. |
|
(47) | | | | Filed as Exhibit 4 on Form 8-A, File No. 001-00973 on May 15, 1998 and incorporated herein by this reference. |
229
|
(48) | | | | Filed as Exhibit 4a(97) with Annual Report on Form 10-K for the year ended December 31, 2002, File No. 001-00973 on February 25, 2003 and incorporated herein by this reference. |
|
(49) | | | | Filed as Exhibit 4a(98) with Annual Report on Form 10-K for the year ended December 31, 2003, File No. 001-00973 on February 25, 2004 and incorporated herein by this reference. |
|
(50) | | | | Filed as Exhibit 4a(99) with Annual Report on Form 10-K for the year ended December 31, 2003, File No. 001-00973 on February 25, 2004 and incorporated herein by this reference. |
|
(51) | | | | Filed as Exhibit 4a(25) with Annual Report on Form 10-K for the year ended December 31, 2004, File No. 001-00973 on March 1, 2005 and incorporated herein by this reference. |
|
(52) | | | | Filed as Exhibit 4a(26) with Annual Report on Form 10-K for the year ended December 31, 2004, File No. 001-00973 on March 1, 2005 and incorporated herein by this reference. |
|
(53) | | | | Filed as Exhibit 4a(27) with Annual Report on Form 10-K for the year ended December 31, 2004, File No. 001-00973 on March 1, 2005 and incorporated herein by this reference. |
|
(54) | | | | Filed as Exhibit 4a(28) with Annual Report on Form 10-K for the year ended December 31, 2004, File No. 001-00973 on March 1, 2005 and incorporated herein by this reference. |
|
(55) | | | | Filed as Exhibit 4a(100) with Annual Report on Form 10-K for the year ended December 31, 2003, File No. 001-00973 on February 25, 2004 and incorporated herein by this reference. |
|
(56) | | | | Filed as Exhibit 4a(101) with Annual Report on Form 10-K for the year ended December 31, 2003, File No. 001-00973 on February 25, 2004 and incorporated herein by this reference. |
|
(57) | | | | Filed as Exhibit 4a(102) with Annual Report on Form 10-K for the year ended December 31, 2003, File No. 001-00973 on February 25, 2004 and incorporated herein by this reference. |
|
(58) | | | | Filed as Exhibit 4 with Quarterly Report on Form 10-Q for the quarter ended June 30, 2004, File No. 001-00973 on August 3, 2004 and incorporated herein by this reference. |
|
(59) | | | | Filed as Exhibit 4 with Current Report on Form 8-K, File No. 001-00973 on December 1, 1993 and incorporated herein by this reference. |
|
(60) | | | | Filed as Exhibit 4.6 to Registration Statement on Form S-3, No. 333-76020 filed on December 27, 2001 and incorporated herein by this reference. |
|
(61) | | | | Filed as Exhibit 10 with Current Report on Form 8-K, File No. 001-09120 on February 19, 2009 and incorporated herein by reference. |
|
(62) | | | | Filed as Exhibit 10.2 with Current Report on Form 8-K, File No. 001-00973 on February 19, 2009 and incorporated herein by reference. |
230
SCHEDULE II
PUBLIC SERVICE ENTERPRISE GROUP INCORPORATED
Schedule II—Valuation and Qualifying Accounts
Years Ended December 31, 2008—December 31, 2006
| | | | | | | | | | |
Column A | | Column B | | Column C | | Column D | | Column E |
Description | | Balance at
Beginning of
Period | | Additions | | Deductions—
describe | | Balance at
End of
Period |
| | Charged to
cost and
expenses | | Charged to
other
accounts—
describe |
| | Millions |
2008 | | | | | | | | | | |
Allowance for Doubtful Accounts | | | $ | | 46 | | | | $ | | 89 | | | | $ | | — | | | | $ | | 69 | (A) | | | | $ | | 66 | |
Materials and Supplies Valuation Reserve | | | | 6 | | | | | — | | | | | — | | | | | 1 | (B) | | | | | 5 | |
Other Valuation Allowances | | | | 8 | | | | | — | | | | | — | | | | | — | | | | | 8 | |
2007 | | | | | | | | | | |
Allowance for Doubtful Accounts | | | $ | | 47 | | | | $ | | 64 | | | | $ | | — | | | | $ | | 65 | (A) | | | | $ | | 46 | |
Materials and Supplies Valuation Reserve | | | | 8 | | | | | 2 | | | | | — | | | | | 4 | (B) | | | | | 6 | |
Other Valuation Allowances | | | | 8 | | | | | — | | | | | — | | | | | — | | | | | 8 | |
2006 | | | | | | | | | | |
Allowance for Doubtful Accounts | | | $ | | 42 | | | | $ | | 77 | | | | $ | | — | | | | $ | | 72 | (A) | | | | $ | | 47 | |
Materials and Supplies Valuation Reserve | | | | 6 | | | | | 7 | | | | | — | | | | | 5 | (B) | | | | | 8 | |
Other Reserves | | | | 3 | | | | | — | | | | | — | | | | | 3 | (C) | | | | | — | |
Other Valuation Allowances | | | | 8 | | | | | — | | | | | — | | | | | — | | | | | 8 | |
|
(A) | | | | Accounts Receivable/Investments written off. |
|
(B) | | | | Reduced reserve to appropriate level and to remove obsolete inventory. |
|
(C) | | | | Includes various liquidity, credit and bad debt reserves. |
231
PSEG POWER LLC
Schedule II—Valuation and Qualifying Accounts
Years Ended December 31, 2008—December 31, 2006
| | | | | | | | | | |
Column A | | Column B | | Column C | | Column D | | Column E |
Description | | Balance at
Beginning of
Period | | Additions | | Deductions—
describe | | Balance at
End of
Period |
| | Charged to
cost and
expenses | | Charged to
other
accounts—
describe |
| | Millions |
2008 | | | | | | | | | | |
Materials and Supplies
Valuation Reserve | | | $ | | 6 | | | | $ | | — | | | | $ | | — | | | | $ | | 1 | (A) | | | | $ | | 5 | |
2007 | | | | | | | | | | |
Materials and Supplies
Valuation Reserve | | | $ | | 8 | | | | $ | | 2 | | | | $ | | — | | | | $ | | 4 | (A) | | | | $ | | 6 | |
2006 | | | | | | | | | | |
Materials and Supplies
Valuation Reserve | | | $ | | 6 | | | | $ | | 7 | | | | $ | | — | | | | $ | | 5 | (A) | | | | $ | | 8 | |
Other Reserves | | | $ | | 3 | | | | $ | | — | | | | $ | | — | | | | $ | | 3 | (B) | | | | $ | | — | |
|
(A) | | | | Reduced reserve to appropriate level and to remove obsolete inventory. |
|
(B) | | | | Includes various liquidity, credit and bad debt reserves. |
PUBLIC SERVICE ELECTRIC AND GAS COMPANY
Schedule II—Valuation and Qualifying Accounts
Years Ended December 31, 2008—December 31, 2006
| | | | | | | | | | |
Column A | | Column B | | Column C | | Column D | | Column E |
Description | | Balance at
Beginning of
Period | | Additions | | Deductions—
describe | | Balance at
End of
Period |
| | Charged to
cost and
expenses | | Charged to
other
accounts—
describe |
| | Millions |
2008 | | | | | | | | | | |
Allowance for Doubtful
Accounts | | | $ | | 45 | | | | $ | | 89 | | | | $ | | — | | | | $ | | 69 | (A) | | | | $ | | 65 | |
2007 | | | | | | | | | | |
Allowance for Doubtful
Accounts | | | $ | | 46 | | | | $ | | 64 | | | | $ | | — | | | | $ | | 65 | (A) | | | | $ | | 45 | |
2006 | | | | | | | | | | |
Allowance for Doubtful
Accounts | | | $ | | 41 | | | | $ | | 77 | | | | $ | | — | | | | $ | | 72 | (A) | | | | $ | | 46 | |
|
(A) | | | | Accounts Receivable/Investments written off. |
232
GLOSSARY OF TERMS
When the following terms and abbreviations appear in the text of this report, they have the meanings indicated below:
| | |
Term | | Phrase/Description |
|
Base load | | Minimum amount of electric power delivered or required over a given period of time at a constant rate, this is the level of demand that is seen as a minimum during a 24-hour day |
|
BGS | | Basic Generation Service |
|
| | PSE&G is required to provide BGS for all customers in New Jersey who are not supplied by a TPS. |
|
BGS-Fixed Price | | Basic Generation Service-Fixed Price |
|
| | Seasonally adjusted fixed prices charged for a three-year term for electric supply service to smaller industrial and commercial customers and residential customers who are not supplied by a TPS |
|
BGSS | | Basic Gas Supply Service |
|
| | Mechanism approved by the BPU for NJ utilities to recover all its commodity costs related to supplying gas to residential customers |
|
BPU | | New Jersey Board of Public Utilities |
|
| | Agency responsible for regulating pubic utilities doing business in New Jersey |
|
Capacity | | Amount of electricity that can be produced by a specific generating facility |
|
Combined Cycle | | A method of generation whereby electricity and process steam are produced from otherwise lost waste heat exiting from one or more combustion turbines. The exiting heat is routed to a conventional boiler or to a heat recovery steam generator for use by a steam turbine in the production of electricity |
|
Competition Act | | Electric Discount and Energy Competition Act |
|
| | New Jersey’s 1999 Electric Utility Restructuring Legislation |
|
Congestion | | Condition when the available capacity of a transmission line is being closely approached (or exceeded) by the electric power trying to go through it; at such times, alternative power line pathways (or local generators near the load) must be used instead |
|
Deregulation | | In the energy industry, the process by which regulated markets become competitive, giving customers the opportunity to choose their energy supplier |
|
Distribution | | The delivery of electricity to the retail customer’s home, business or industrial facility through low voltage distribution lines |
|
EDC | | Electric Distribution Company |
|
| | A company that owns the power lines and equipment necessary to deliver purchased electricity to the customer |
|
EITF | | Emerging Issues Task Force |
|
| | U.S. organization formed by the FASB whose main purpose is to identify emerging accounting issues and resolve them with a uniform set of accounting practices before divergent methods arise and become widespread |
|
EMP | | New Jersey Energy Master Plan |
|
| | Plan mandated by New Jersey statute to be developed by the BPU and other New Jersey policy-making agencies to ensure safe, secure and reasonably-priced energy supply, foster economic growth and development and protect the environment |
|
Energy Holdings | | PSEG Energy Holdings L.L.C. |
|
EPA | | U.S. Environmental Protection Agency |
|
FASB | | Financial Accounting Standards Board |
|
| | A private, not-for-profit organization whose primary purpose, as designated by the SEC, is to develop accounting standards for public companies in the U.S. |
|
FERC | | Federal Energy Regulatory Commission |
| | |
233
| | |
Term | | Phrase/Description |
|
FIN | | FASB Interpretation Number |
|
Forward contracts | | A customized, non-exchange traded contract in which the buyer is obligated to deliver a specified amount of a commodity with a predetermined price formula on a specified future date, at which time payment is due in full |
|
FSP | | FASB Staff Position |
|
| | Guidance provided by the FASB for the future application of a FASB |
|
GAAP | | Generally Accepted Accounting Principles |
|
| | Standard framework of guidelines issued by the FASB for financial accounting used in the U.S. |
|
Greenhouse gas emissions | | Gases (including carbon dioxide, methane, nitrous oxide, ozone, and chlorofluorocarbon) that trap the heat of the sun in the earth’s atmosphere, increasing the mean global surface temperature of the earth |
|
Grid | | A system of interconnected power lines and generators that is managed so that the generators are dispatched as needed to meet the electricity requirements of the customers connected to the grid at various points |
|
Hedging | | Entering into a contract or transaction designed to reduce exposure to various risks, such as changes in market prices |
|
Hope Creek | | Hope Creek Nuclear Generating Station |
|
ISO | | Independent System Operator |
|
| | An independent, regulated entity established to manage a regional electric transmission system in a non-discriminatory manner and to help ensure the safety and reliability of the bulk of the power system |
|
ITC | | Investment Tax Credit |
|
| | A credit against income taxes, usually computed as a percent of the cost of investment in certain types of assets |
|
LDS | | Luz Del Sur |
|
| | A Peruvian electric distributor that in which we had a 38% ownership interest, which was sold in December 2007 |
|
Lifeline Program | | A New Jersey social program for utility assistance that offers $225 per year to persons who meet the eligibility requirements |
|
Load | | Amount of electric power delivered or required at any specific point or points on a system. The requirement originates at the energy-consuming equipment of consumers. |
|
MBR | | Market Based Rates |
|
| | Electric service prices determined in an open market system of supply and demand under which the price is set solely by agreement as to what a buyer will pay and a seller will accept |
|
MGP | | Manufactured Gas Plant |
|
MTM | | Mark-to-Market |
|
| | Valuation of a security, commodity or financial instrument to reflect current resale values |
|
NDT | | Nuclear Decommissioning Trust |
|
NEO | | Named Executive Officer |
|
| | A term under the SEC’s disclosure regulations designating a registrant’s Chief Executive Officer, Chief Financial Officer and three other highest paid decision making managers |
|
NEPOOL | | New England Power Pool |
|
| | An ISO comprised of an alliance of approximately 100 utility companies who manage and direct all major energy production and transmission in the New England states |
|
NJDEP | | New Jersey Department of Environmental Protection |
|
NRC | | Nuclear Regulatory Commission |
|
NUG | | Non-Utility Generation |
| | |
234
| | |
Term | | Phrase/Description |
|
| | Power produced by independent power producers, exempt wholesale generators and other companies that have been exempted from traditional utility regulation |
|
Off peak | | Periods of lower electrical demand |
|
OPEB | | Other Postretirement Benefits |
|
| | Benefits other than pensions payable to retirees |
|
Outage | | The period during which a generating unit, transmission line, or other facility is out of service due to scheduled (planned) or unscheduled maintenance |
|
Peach Bottom | | Peach Bottom Atomic Power Station |
|
Peak load | | A measure of the amount of electricity required to be delivered during periods of highest demand |
|
PJM | | PJM Interconnection, L.L.C. |
|
| | A regional transmission organization that coordinates the movement of wholesale electricity in all or parts of 13 northeastern states and the District of Columbia |
|
Power | | PSEG Power LLC |
|
Power Pool | | An association of two or more interconnected electric systems having an agreement to coordinate operations and planning for improved reliability and efficiencies |
|
PRP | | Potentially Responsible Parties |
|
PSE&G | | Public Service Electric and Gas Company |
|
PSEG | | Public Service Enterprise Group Incorporated |
|
Renewable Energy | | Energy derived from resources that are regenerative or that can not be depleted (i.e moving water (hydro, tidal and wave power), thermal gradients in ocean water, biomass, geothermal energy, solar energy, and wind energy) |
|
Regulatory Asset | | Costs deferred by a regulated utility company in accordance with SFAS 71 |
|
Regulatory Liability | | Costs recognized by a regulated utility company in accordance with SFAS 71 |
|
RGGI | | Regional Greenhouse Gas Initiative |
|
| | The first mandatory, market-based effort in the U. S. to reduce greenhouse gas emissions; states will sell emission allowances through auctions and invest proceeds in consumer benefits: energy efficiency, renewable energy, and other clean energy technologies |
|
RMR | | Reliability-Must-Run |
|
| | Designation of a power plant whose output is needed to maintain local reliability regardless of its operating cost or market price |
|
RPM | | Reliability Pricing Model |
|
| | A process for pricing generation capacity based on overall system reliability requirements; using multi-year forward auctions, participants could bid capacity in the form of generation, demand response, or transmission to meet reliability needs by location and/or an ISO market |
|
Salem | | Salem Nuclear Generating Station |
|
SBC | | Societal Benefits Charges |
|
SEC | | U.S. Securities and Exchange Commission |
|
Services | | PSEG Services Corporation |
|
SFAS | | Statement of Financial Accounting Standard |
|
| | A formal document issued by the Financial Accounting Standards Board, detailing accounting standards and guidance on selected accounting policies set out by the FASB; created to ensure a higher level of corporate transparency, these statements are to be adhered to by all publicly-traded companies |
|
Spill Act | | New Jersey Spill Compensation and Control Act |
235
SIGNATURES
Pursuant to the requirements of Section 13 or 15(d) of the Securities Exchange Act of 1934, the registrant has duly caused this report to be signed on its behalf by the undersigned, thereunto duly authorized. The signature of the undersigned company shall be deemed to relate only to matters having reference to such company and any subsidiaries thereof.
PUBLIC SERVICE ENTERPRISE GROUP INCORPORATED
By: | | /s/ RALPH IZZO
Ralph Izzo
Chairman of the Board, President and
Chief Executive Officer |
Date: February 26, 2009
Pursuant to the requirements of the Securities Exchange Act of 1934, this report has been signed below by the following persons on behalf of the registrant and in the capacities and on the dates indicated. The signatures of the undersigned shall be deemed to relate only to matters having reference to such company and any subsidiaries thereof.
Signature | | Title | | Date |
|
/s/ RALPH IZZO
Ralph Izzo | | Chairman of the Board, President, Chief Executive
Officer and Director (Principal Executive Officer) | | February 26, 2009 |
/s/ THOMAS M. O’FLYNN
Thomas M. O’Flynn | | Executive Vice President and Chief
Financial Officer (Principal Financial Officer) | | February 26, 2009 |
/s/ DEREK M. DIRISIO
Derek M. DiRisio | | Vice President and Controller
(Principal Accounting Officer) | | February 26, 2009 |
/s/ CAROLINE DORSA
Caroline Dorsa | | Director | | February 26, 2009 |
/s/ ALBERT R. GAMPER, JR.
Albert R. Gamper, Jr. | | Director | | February 26, 2009 |
/s/ CONRAD K. HARPER
Conrad K. Harper | | Director | | February 26, 2009 |
/s/ WILLIAM V. HICKEY
William V. Hickey | | Director | | February 26, 2009 |
/S/ SHIRLEY ANN JACKSON
Shirley Ann Jackson | | Director | | February 26, 2009 |
/S/ THOMAS A. RENYI
Thomas A. Renyi | | Director | | February 26, 2009 |
/S/ HAK CHEOL SHIN
Hak Cheol Shin | | Director | | February 26, 2009 |
/S/ RICHARD J. SWIFT
Richard J. Swift | | Director | | February 26, 2009 |
236
SIGNATURES
Pursuant to the requirements of Section 13 or 15(d) of the Securities Exchange Act of 1934, the registrant has duly caused this report to be signed on its behalf by the undersigned, thereunto duly authorized. The signature of the undersigned company shall be deemed to relate only to matters having reference to such company and any subsidiaries thereof.
PSEG POWER LLC
By: | | /s/ WILLIAM LEVIS
William Levis
President and
Chief Operating Officer |
Date: February 26, 2009
Pursuant to the requirements of the Securities Exchange Act of 1934, this report has been signed below by the following persons on behalf of the registrant and in the capacities and on the dates indicated. The signatures of the undersigned shall be deemed to relate only to matters having reference to such company and any subsidiaries thereof.
Signature | | Title | | Date |
|
/s/ RALPH IZZO
Ralph Izzo | | Chairman of the Board and Chief Executive
Officer and Director (Principal Executive Officer) | | February 26, 2009 |
/S/ THOMAS M. O’FLYNN
Thomas M. O’Flynn | | Executive Vice President and Chief Financial
Officer and Director (Principal Financial Officer) | | February 26, 2009 |
/S/ DEREK M. DIRISIO
Derek M. DiRisio | | Vice President and Controller
(Principal Accounting Officer) | | February 26, 2009 |
/S/ STEPHEN C. BYRD
Stephen C. Byrd | | Director | | February 26, 2009 |
/S/ CLARENCE J. HOPF, JR.
Clarence J. Hopf, Jr. | | Director | | February 26, 2009 |
/S/ THOMAS P. JOYCE
Thomas P. Joyce | | Director | | February 26, 2009 |
/S/ WILLIAM LEVIS
William Levis | | Director | | February 26, 2009 |
/S/ RICHARD P. LOPRIORE
Richard Lopriore | | Director | | February 26, 2009 |
/S/ RANDALL E. MEHRBERG
Randall E. Mehrberg | | Director | | February 26, 2009 |
/S/ EILEEN A. MORAN
Eileen A. Moran | | Director | | February 26, 2009 |
/S/ R. EDWIN SELOVER
R. Edwin Selover | | Director | | February 26, 2009 |
/S/ ELBERT C. SIMPSON
Elbert C. Simpson | | Director | | February 26, 2009 |
237
SIGNATURES
Pursuant to the requirements of Section 13 or 15(d) of the Securities Exchange Act of 1934, the registrant has duly caused this report to be signed on its behalf by the undersigned, thereunto duly authorized. The signature of the undersigned company shall be deemed to relate only to matters having reference to such company and any subsidiaries thereof.
PUBLIC SERVICE ELECTRICAND GAS COMPANY
By: | | /s/ RALPH LAROSSA
Ralph LaRossa
President and Chief Operating Officer |
Date: February 26, 2009
Pursuant to the requirements of the Securities Exchange Act of 1934, this report has been signed below by the following persons on behalf of the registrant and in the capacities and on the dates indicated. The signatures of the undersigned shall be deemed to relate only to matters having reference to such company and any subsidiaries thereof.
Signature | | Title | | Date |
|
/s/ RALPH IZZO
Ralph Izzo | | Chairman of the Board and Chief Executive
Officer and Director (Principal Executive Officer) | | February 26, 2009 |
/S/ THOMAS M. O’FLYNN
Thomas M. O’Flynn | | Executive Vice President and Chief
Financial Officer (Principal Financial Officer) | | February 26, 2009 |
/S/ DEREK M. DIRISIO
Derek M. DiRisio | | Vice President and Controller
(Principal Accounting Officer) | | February 26, 2009 |
/S/ CAROLINE DORSA
Caroline Dorsa | | Director | | February 26, 2009 |
/S/ ALBERT R. GAMPER, JR.
Albert R. Gamper, Jr. | | Director | | February 26, 2009 |
/S/ CONRAD K. HARPER
Conrad K. Harper | | Director | | February 26, 2009 |
238
EXHIBIT INDEX
The following documents are filed as a part of this report:
a. PSEG:
| | |
Exhibit 10a(1): | | Amended and Restated Limited Supplemental Benefits Plan for Certain Employees |
Exhibit 10a(2): | | Mid Career Hire Supplemental Retirement Income Plan |
Exhibit 10a(3): | | Retirement Income Reinstatement Plan for Non-Represented Employees |
Exhibit 10a(7): | | Deferred Compensation Plan for Directors |
Exhibit 10a(8): | | Deferred Compensation Plan for Certain Employees |
Exhibit 10a(11): | | Senior Management Incentive Compensation Plan |
Exhibit 10a(14): | | Key Executive Severance Plan |
Exhibit 12: | | Computation of Ratios of Earnings to Fixed Charges |
Exhibit 21: | | Subsidiaries of the Registrant |
Exhibit 23: | | Consent of Independent Registered Public Accounting Firm |
Exhibit 31: | | Certification by Ralph Izzo Pursuant to Rules 13a-14 and 15d-14 of the 1934 Act |
Exhibit 31a: | | Certification by Thomas M. O’Flynn Pursuant to Rules 13a-14 and 15d-14 of the
1934 Act |
Exhibit 32: | | Certification by Ralph Izzo Pursuant to Section 1350 of Chapter 63 of Title 18 of the
US Code |
Exhibit 32a: | | Certification by Thomas M. O’Flynn Pursuant to Section 1350 of Chapter 63 of Title 18 of the US Code |
b. Power:
| | |
Exhibit 10a(1): | | Amended and Restated Limited Supplemental Benefits Plan for Certain Employees |
Exhibit 10a(2): | | Mid Career Hire Supplemental Retirement Income Plan |
Exhibit 10a(3): | | Retirement Income Reinstatement Plan for Non-Represented Employees |
Exhibit 10a(8): | | Deferred Compensation Plan for Certain Employees |
Exhibit 10a(11): | | Senior Management Incentive Compensation Plan |
Exhibit 10a(14): | | Key Executive Severance Plan |
Exhibit 12a: | | Computation of Ratios of Earnings to Fixed Charges |
Exhibit 23a: | | Consent of Independent Registered Public Accounting Firm |
Exhibit 31b: | | Certification by Ralph Izzo Pursuant to Rules 13a-14 and 15d-14 of the 1934 Act |
Exhibit 31c: | | Certification by Thomas M. O’Flynn Pursuant to Rules 13a-14 and 15d-14 of the
1934 Act |
Exhibit 32b: | | Certification by Ralph Izzo Pursuant to Section 1350 of Chapter 63 of Title 18 of the
US Code |
Exhibit 32c: | | Certification by Thomas M. O’Flynn Pursuant to Section 1350 of Chapter 63 of Title 18 of the US Code |
c. PSE&G:
| | |
Exhibit 10a(1): | | Amended and Restated Limited Supplemental Benefits Plan for Certain Employees |
Exhibit 10a(2): | | Mid Career Hire Supplemental Retirement Income Plan |
Exhibit 10a(3): | | Retirement Income Reinstatement Plan for Non-Represented Employees |
Exhibit 10a(7): | | Deferred Compensation Plan for Directors |
Exhibit 10a(8): | | Deferred Compensation Plan for Certain Employees |
Exhibit 10a(11): | | Senior Management Incentive Compensation Plan |
Exhibit 10a(14): | | Key Executive Severance Plan |
Exhibit 10a(20): | | Management Incentive Compensation Plan |
Exhibit 12b: | | Computation of Ratios of Earnings to Fixed Charges |
Exhibit 12c: | | Computation of Ratios of Earnings to Fixed Charges Plus Preferred Stock
Dividend Requirements |
Exhibit 21a: | | Subsidiaries of Registrant |
Exhibit 23b: | | Consent of Independent Registered Public Accounting Firm |
Exhibit 31d: | | Certification by Ralph Izzo Pursuant to Rules 13a-14 and 15d-14 of the 1934 Act |
Exhibit 31e: | | Certification by Thomas M. O’Flynn Pursuant to Rules 13a-14 and 15d-14 of the
1934 Act |
Exhibit 32d: | | Certification by Ralph Izzo Pursuant to Section 1350 of Chapter 63 of Title 18 of the
US Code |
Exhibit 32e: | | Certification by Thomas M. O’Flynn Pursuant to Section 1350 of Chapter 63 of Title 18 of the US Code |
239